Attached files
Table of Contents
UNITED STATES
SECURITIES AND EXCHANGE COMMISSION
Washington, D.C. 20549
Form 10-K
(Mark One)
| x | ANNUAL REPORT PURSUANT TO SECTION 13 OR 15(d) OF THE SECURITIES EXCHANGE ACT OF 1934 |
For the fiscal year ended January 1, 2011
or
| ¨ | TRANSITION REPORT PURSUANT TO SECTION 13 OR 15(d) OF THE SECURITIES EXCHANGE ACT OF 1934 |
For the transition period from to
Commission file number 0-27975
eLoyalty Corporation
(Exact Name of Registrant as Specified in Its Charter)
| Delaware | 36-4304577 | |
| (State or other Jurisdiction of Incorporation or Organization) |
(I.R.S. Employer Identification No.) |
150 Field Drive, Suite 250
Lake Forest, Illinois 60045
(Address of Registrant’s Principal Executive Offices) (Zip Code)
Registrant’s telephone number, including area code: (847) 582-7000
Securities registered pursuant to Section 12(b) of the Act:
| Title of Each Class |
Name of Each Exchange on Which Registered | |
| Common Stock, par value $0.01 per share Preferred Stock Purchase Rights |
NASDAQ Global Market None |
Securities registered pursuant to Section 12(g) of the Act: None
Indicate by check mark if the registrant is a well-known seasoned issuer, as defined in Rule 405 of the Securities Act. Yes ¨ No x
Indicate by check mark if the registrant is not required to file reports pursuant to Section 13 or Section 15(d) of the Act. Yes ¨ No x
Indicate by check mark whether the registrant (1) has filed all reports required to be filed by Section 13 or Section 15(d) of the Securities Exchange Act of 1934 during the preceding 12 months (or for such shorter period that the registrant was required to file such reports), and (2) has been subject to such filing requirements for the past 90 days. Yes x No ¨
Indicate by check mark whether the registrant has submitted electronically and posted on its corporate Web site, if any, every Interactive Data File required to be submitted and posted pursuant to Rule 405 of Regulation S-T (Section 232.405 of this chapter) during the preceding 12 months (or for such shorter period that the registrant was required to submit and post such files). Yes ¨ No ¨
Indicate by check mark if disclosure of delinquent filers pursuant to Item 405 of Regulation S-K is not contained herein, and will not be contained, to the best of registrant’s knowledge, in definitive proxy or information statements incorporated by reference in Part III of this Form 10-K or any amendment to this Form 10-K. ¨
Indicate by check mark whether the registrant is a large accelerated filer, an accelerated filer, a non-accelerated filer, or a smaller reporting company. See the definitions of “large accelerated filer,” “accelerated filer” and “smaller reporting company” in Rule 12b-2 of the Exchange Act. (Check one):
| Large accelerated filer ¨
|
Accelerated filer x
|
Non-accelerated filer ¨
|
Smaller reporting company ¨
| |||
| (Do not check if a smaller reporting company) | ||||||
Indicate by check mark whether the registrant is a shell company (as defined in Rule 12b-2 of the Act). Yes ¨ No x
The aggregate market value of Common Stock held by non-affiliates of the registrant, based upon the closing price per share of registrant’s Common Stock on June 25, 2010, as reported by The NASDAQ Stock Market LLC, is approximately $89,439,562.
The number of shares of the registrant’s Common Stock outstanding as of March 10, 2011 was 15,613,247.
DOCUMENTS INCORPORATED BY REFERENCE
Portions of eLoyalty’s Proxy Statement for its 2011 Annual Meeting of Stockholders, to be filed within 120 days after the end of eLoyalty’s fiscal year, are incorporated herein by reference into Part III where indicated.
Table of Contents
PART I
| Item |
Page | |||||
| Item 1. |
2 | |||||
| Item 1A. |
6 | |||||
| Item 1B. |
12 | |||||
| Item 2. |
12 | |||||
| Item 3. |
12 | |||||
| Item 4. |
12 | |||||
| PART II | ||||||
| Item 5. |
12 | |||||
| Item 6. |
13 | |||||
| Item 7. |
Management’s Discussion and Analysis of Financial Condition and Results of Operations |
15 | ||||
| Item 7A. |
28 | |||||
| Item 8. |
29 | |||||
| Item 9. |
Changes in and Disagreements with Accountants on Accounting and Financial Disclosure |
58 | ||||
| Item 9A. |
58 | |||||
| Item 9B. |
58 | |||||
| PART III | ||||||
| Item 10. |
58 | |||||
| Item 11. |
59 | |||||
| Item 12. |
Security Ownership of Certain Beneficial Owners and Management and Related Stockholder Matters |
59 | ||||
| Item 13. |
Certain Relationships and Related Transactions, and Director Independence |
60 | ||||
| Item 14. |
60 | |||||
| PART IV | ||||||
| Item 15. |
61 | |||||
| 62 | ||||||
| I-1 | ||||||
Table of Contents
PART I
| Item 1. | Business. |
Overview
eLoyalty Corporation (together with its subsidiaries and predecessors, “eLoyalty,” “we,” “us,” or the “Company”) helps its clients achieve breakthrough results with revolutionary analytics and advanced technologies that drive continuous business improvement. With a long track record of delivering proven solutions for many Fortune 1000 companies, our offerings currently include the Behavioral Analytics™ Service, Integrated Contact Solutions, and Consulting Services, which are aligned to enable focused business transformation.
The Company has been focused on growing and developing its business through two primary Business Units: the Behavioral Analytics™ Service and Integrated Contact Solutions. Through its Business Units, the Company generates three types of revenue: (1) Managed services revenue, which is recurring, annuity revenue from long-term (generally one- to five-year) contracts; (2) Consulting services revenue, which is generally project-based and sold on a time-and-materials or fixed-fee basis; and (3) Product revenue, which is generated through the resale of third-party software and hardware. The chart below shows the relationship between these Business Units and the types of revenue generated from each.
| Business Unit | Managed Services Revenue |
Consulting Services Revenue |
Product Revenue | |||
| Behavioral Analytics™ Service |
Subscription and amortized deployment revenue; marketing application hosting and email fulfillment revenue |
Follow-on consulting revenue | None | |||
| Integrated Contact Solutions |
Contact center monitoring and support revenue; remote application support revenue |
System integration revenue for the Integrated Contact Solutions Service Line; consulting revenue for the traditional CRM Service Line |
Hardware and software resale revenue, primarily from products of Cisco Systems, Inc. (“Cisco”) |
On March 17, 2011, the Company entered into an Acquisition Agreement providing for the sale of all its assets used in the Integrated Contact Solutions Business Unit to a subsidiary of TeleTech Holdings, Inc. (“TeleTech”). Under the terms of the Acquisition Agreement, TeleTech will pay to the Company $40.85 million in cash at closing, subject to adjustment, and assume certain liabilities of the Integrated Contact Solutions Business Unit. The purchase price adjustments are related to working capital and prepaid managed services contracts.
The Company expects the sale of the Integrated Contact Solutions Business Unit to close in the second quarter of 2011. However, the closing of the transaction is subject to various conditions, including approval by our stockholders, the receipt of required third-party consents and approvals, and other closing conditions customary for transactions of this type. No assurances can be given that the transaction will be consummated on the terms contemplated or at all. If the transaction is consummated as proposed, then the Company will continue to operate its Behavioral Analytics™ Business Unit and will change its corporate name to Mattersight Corporation.
Set forth below is a description of the differentiated capabilities that the Company currently offers in its primary Business Units.
Behavioral Analytics™ Service Business Unit
Behavioral AnalyticsTM Service Line
eLoyalty pioneered this solution, which improves the reliability of call recording and applies human behavioral modeling to analyze and improve customer interactions and help optimize the performance of call center agents. Using the Behavioral Analytics™ Service, eLoyalty can help clients:
| • | Automatically measure customer satisfaction and agent performance on every call; |
| • | Identify and understand customer personality; |
| • | Improve rapport between agent and customer; |
| • | Reduce call handle times while improving customer satisfaction; |
2
Table of Contents
| • | Identify opportunities to improve self-service applications; |
| • | Improve cross-sell and up-sell success rates; |
| • | Improve the efficiency and effectiveness of collection efforts; |
| • | Identify customer experience issues and score calls for retention risk; |
| • | Measure and improve supervisor effectiveness and coaching; and |
| • | Improve agent effectiveness by analyzing key attributes of desktop usage. |
eLoyalty has designed a scalable application platform to enable the Company to implement and operate the Behavioral Analytics™ Service for its clients. The Behavioral Analytics™ Service is primarily hosted by eLoyalty and delivered as a managed subscription service. Managed services revenue consists of deployment and subscription services and Consulting services revenue consists of post-deployment follow-on services, which consist of coaching and training and custom data analysis.
Marketing Managed Services Line
Marketing Managed Services revenue is derived from marketing application hosting and email fulfillment services.
Integrated Contact Solutions Business Unit
Integrated Contact Solutions Service Line
The Company’s Integrated Contact Solutions Service Line focuses on helping clients improve customer service business performance through the implementation of the following solution offerings:
| • | Cisco VoIP (Voice over Internet Protocol) Solutions – clients realize the benefits of transitioning their contact centers, distributed branches/stores, and corporate telephony to a single VoIP network infrastructure from the traditional two-network (voice network and separate data network) model. These benefits include cost savings, remote worker enablement, centralized reporting, and application enhancements. The Company has developed a set of solutions, tools, and methodologies to help clients financially model, plan, configure, integrate, and support Converged Internet Protocol (“IP”) network solutions within their customer interaction and collaboration environments. |
| • | Managed Support Services – clients realize the benefits of proactive monitoring of their voice and data networks to avoid system degradation and downtime that can effect business operations. We also provide 24x7 maintenance services, operations, and applications services to help enhance, administer, and manage VoIP contact center and telephony platforms that include technology from Cisco Systems and other third-party vendors. |
| • | Business Application Services – clients realize the benefits of reduced average handle time, improved first call resolution, improved self-service automation, and email and chat integration within their contact centers and across their branch/store networks. |
Traditional CRM Service Line
The Company’s traditional CRM Service Line focuses on operational consulting to enhance customer service business performance through improved process efficiencies, redesign of workflows, and improved contact center operations and workforce management. We also generate Managed services revenue from this Service Line by providing remote application support to clients.
Types of Revenue
Managed services, Consulting services, and the resale of Product are frequently sold and delivered together. Consulting services engagements relating to the design and implementation of customer service or marketing solutions may lead to the sale of one of our Managed services, which may also include a long-term maintenance and support or hosting relationship and the sale of Product.
Managed Services
Growth in Managed services revenue is primarily driven by the sale of Behavioral Analytics™ Service and Integrated Contact Solutions engagements. These Managed services are described below:
| • | The Behavioral Analytics™ Service includes the deployment and ongoing operation of our proprietary Behavioral Analytics™ System. Based on each client’s business requirements, the Behavioral Analytics™ System is configured and integrated into the client’s environment and then deployed in either a remote-hosted or, in one case, an on-premise hosted environment. The Behavioral Analytics™ Service is provided on a subscription basis and the contract duration generally is three to five years. The fees and costs related to the initial deployment are deferred and amortized over the term of the contract. |
| • | Contact Center Managed Services include monitoring and support related to complex IP and traditional contact center voice architectures. These services include routine maintenance and technology upgrades and the resolution of highly complex issues that involve multiple technology components and vendors. Our support and monitoring services reduce the cost and impact of contact center downtime for our clients and anticipate problems before they occur. |
3
Table of Contents
In addition, we also generate Managed services revenue from two other sources. Marketing Managed Services revenue is generated from hosted customer and campaign data management and mass email fulfillment services. We also continue to provide remote call center application support and maintenance services to a small number of long-term clients. These two sources of Managed services revenue are likely to diminish over time as we focus on growth through our other service offerings.
Consulting Services
In addition to the Consulting services revenue generated by Behavioral Analytics™ Service and Integrated Contact Solutions engagements, we derive a portion of our revenue from a broad range of traditional CRM consulting work with long-standing accounts, as well as newer accounts more recently obtained through our Behavioral Analytics™ Service and Integrated Contact Solutions Service Lines. Our Consulting services are billed on a time-and-materials basis or on a fixed-fee basis and generally include a combination of the following:
| • | Evaluating our clients’ efficiency and effectiveness in handling customer interactions. We observe, measure, and analyze the critical aspects of each customer interaction, including the number of legacy systems used to handle the situation, interaction time, reason for interaction, and actions taken to resolve any customer issues. |
| • | Performing detailed financial analysis to calculate the expected return on investment for the implementation of various Customer Service / CRM solutions. This process helps our clients establish goals, alternatives, and priorities and assigns client accountability throughout resulting projects. |
| • | Implementing the operations, process, and human performance aspects of Customer Service / CRM solutions. |
Product
We also generate revenue from the resale of Product, which consists of software and hardware primarily sold through our Integrated Contact Solutions Service Line. The vast majority of this revenue relates to reselling products from Cisco.
Business Segments
Since 2008, the Company has operated in two business segments: the Behavioral Analytics™ Service Business Unit and the Integrated Contact Solutions Business Unit. These segments are consistent with the Company’s management of the business and reflect its internal financial reporting structure and operating focus.
The Behavioral Analytics™ Service Business Unit focuses on solutions that improve the reliability of call recording and applies human behavioral modeling to analyze and improve customer interactions and help optimize the performance of call center agents. The Behavioral Analytics™ Service is primarily a hosted solution and is delivered as a managed subscription service. Revenue generated from follow-on consulting services, deployments, and subscription services, as well as marketing application hosting, and email fulfillment services are included in this Business Unit’s financial results.
The Integrated Contact Solutions Business Unit focuses on helping clients realize the benefits of transitioning their contact centers to a single network infrastructure from the traditional two-network (voice network and separate data network) model. Revenue generated from Consulting services, Managed services, Product resale, remote application support services, and traditional CRM are included in this Business Unit’s financial results.
Management believes that Segment Operating Income/(Loss) Before Stock-Based Compensation, Severance and Related Costs, and Depreciation and Amortization is an appropriate measure of evaluating the operational performance of the Company’s segments. However, this measure should be considered in addition to, not as a substitute for, or superior to, income from operations or other measures of financial performance prepared in accordance with accounting principles generally accepted in the United States. The Company does not allocate severance and related costs, depreciation and amortization, or other items below the Operating Income/(Loss) level to its business segments. Also, the Company does not track or review asset information, other than capital investments, by reportable segments. See Note Sixteen “Segments” of the “Notes to Consolidated Financial Statements” included in Part II Item 8 of this Annual Report on Form 10-K (this “Form 10-K”) for the revenue and net (loss)/income of each of our business segments for the fiscal years ended 2010 and 2009. Prior to 2008, the Company operated in one business segment and did not record financial information for the two current business segments.
International Operations
The Company’s services are delivered to clients in North America (U.S. and Canada), Europe, and Australia. The Company’s long-lived assets are and have been predominately located in North America and consist of equipment, software, furniture and fixtures, and leasehold improvements (net of accumulated depreciation). Net revenue for the Company’s international operations (Europe and Australia) was $2.5 million, $3.1 million, and $2.5 million for the fiscal years ended 2010, 2009, and 2008, respectively.
4
Table of Contents
Methods of Distribution
A substantial majority of our Consulting services, Managed services, and Product are provided to our clients through direct contractual relationships. Approximately 14% of our revenue in 2010 was generated from ongoing relationships with other companies, with which we partner to make our services and third-party products available to the clients of such companies.
Intellectual Property Rights
We view as proprietary the intellectual property that we develop internally in order to improve and enhance the service offerings of our Business Units, as well as that associated with the work product resulting from our services for clients. We seek to protect our intellectual property rights by applying for patents, copyrights, and trademarks, as appropriate, as well as by enforcing applicable trade secret laws and contractual restrictions on disclosure, licensing, copying, reverse engineering, and assignment.
A majority of our clients require that we grant to them licenses in and to the intellectual property rights associated with the original work product resulting from our services, and in some cases our clients require assignment of ownership in the intellectual property rights to certain custom work product developed in the course of a consulting engagement. Absent an agreement to the contrary, each grant of proprietary and intellectual property rights would limit our ability to reuse work product components with other clients. As a result, it is our practice to retain the rights in the underlying core intellectual property on which such work product is based, including methodologies, workplans, and software. Further, it is our policy to obtain from our clients a license to permit us to market custom software and other original materials to other clients. These arrangements may be nonexclusive or exclusive, and licensors to us may retain the right to sell products and services that compete with those of the Company.
Seasonality
We typically experience declines in revenue and earnings in the fourth quarter of our fiscal year, as the total number of billable hours and days on Consulting services engagements are reduced due to holidays and vacations.
Clients
During fiscal year 2010, our five and 20 largest clients accounted for 31% and 67% of our total revenue, respectively. In fiscal year 2010, there were no clients that accounted for 10% or more of total revenue. For fiscal year 2010, 27 clients each accounted for over $1 million of total revenue. Our focus is on developing long-term relationships with our clients, but our activities with specific clients may fluctuate periodically, as individual Consulting services projects are initiated and progress through their lifecycle. As a result, the percentage of total revenue contributed by any particular client can be expected to vary, perhaps significantly, among periods. See Note Two “Summary of Significant Accounting Policies” of the “Notes to Consolidated Financial Statements” included in Part II Item 8 of this Form 10-K.
Competition
We operate in a highly competitive and rapidly changing market and compete with a variety of organizations that offer services similar to ours. The market includes a variety of participants that compete with us at various levels of our business, including strategic consulting firms, systems integrators, web-consulting firms, software vendors, voice recording and voice analytic service providers, online agencies, and firms that provide both consulting and systems integration services, including certain of our vendors. In our opinion, few competitors offer the full range and depth of services that we can provide, but they may compete with us on individual factors such as expertise, price, or capacity.
Many of our competitors have longer operating histories, more clients, longer relationships with their clients, greater brand or name recognition, and significantly greater financial, technical, marketing, and public relations resources than we do. As a result, our competitors may be in a better position to respond quickly to new or emerging technologies and changes in client requirements. They may also develop and promote their products and services more effectively than we do. New market entrants also pose a threat to our business. Existing or future competitors may develop or offer solutions that are comparable or superior to ours at a lower price.
Environmental Issues
There are no known material compliance issues with any federal, state, or local environmental regulations.
Employees
As of January 1, 2011, we employed 369 persons, none of whom is represented by a union.
Available Information and Other
Our principal internet address is www.eloyalty.com. Our Annual, Quarterly, and Current Reports on Forms 10-K, 10-Q, and 8-K, and any amendments thereto, as well as the Forms 3, 4, and 5 beneficial ownership reports filed with respect to our stock, are made available free of charge on our website as soon as reasonably practicable after such material has been filed with, or furnished to, the Securities and Exchange Commission (“SEC”). However, the information found on our website is not part of this or any other report filed by us with the SEC. These reports may also be obtained at the SEC’s public reference room at 100 F Street, N.E., Washington, D.C. 20549. The SEC also maintains a website at www.sec.gov that contains reports, proxy statements, and other information regarding SEC registrants, including eLoyalty.
5
Table of Contents
eLoyalty was incorporated in Delaware in May 1999. Our executive office is currently located at 150 Field Drive, Suite 250, Lake Forest, Illinois 60045 and our main telephone number is (847) 582-7000. Effective June 1, 2011, our executive office will be our location at 200 South Wacker Drive, Suite 820, Chicago, Illinois 60606 and our main telephone number will be (877) 356-9252.
| Item 1A. | Risk Factors. |
There are a number of risks and uncertainties that could adversely affect our business and our overall financial performance. In addition to the matters discussed elsewhere in this Form 10-K, we believe the more significant of such risks and uncertainties include the following:
RISK FACTORS RELATING TO THE PROPOSED SALE OF OUR INTEGRATED CONTACT SOLUTIONS BUSINESS UNIT
If we fail to complete the sale of the Integrated Contact Solutions Business Unit, our business may be harmed.
The completion of the sale of the Integrated Contact Solutions Business Unit is subject to the satisfaction of a number of conditions, and we cannot guarantee that the sale will be completed. We also cannot be sure that other circumstances, such as the occurrence of a material adverse effect, will not arise that would allow TeleTech to terminate the Acquisition Agreement prior to closing. If the sale of the Integrated Contact Solutions Business Unit is not approved or does not close, then our board of directors will be forced to evaluate other alternatives, which may be less favorable to us than the proposed sale of the Integrated Contact Solutions Business Unit.
As a result of our announcement of the sale of our Integrated Contact Solutions Business Unit on March 17, 2011, third parties may be unwilling to enter into material agreements with respect to our Integrated Contact Solutions Business Unit. New or existing customers and business partners may prefer to enter into agreements with our competitors who have not expressed an intention to sell their business, because customers and business partners may perceive that such new relationships are likely to be more stable. Employees working in the Integrated Contact Solutions Business Unit may become concerned about the future of the business and lose focus or seek other employment. If we fail to complete the sale of the Integrated Contact Solutions Business Unit, the failure to maintain existing business relationships or enter into new ones could adversely affect our business, results of operations and financial condition. In addition, if we fail to complete the proposed sale of the Integrated Contact Solutions Business Unit, we will retain and continue to operate the Integrated Contact Solutions Business Unit. The resultant potential for loss or disaffection of employees or Integrated Contact Solutions Business Unit customers could have a material, negative impact on the value of our Integrated Contact Solutions Business Unit.
In addition, if the sale of the Integrated Contact Solutions Business Unit is not consummated, our directors, executive officers, and other employees will have expended extensive time and effort and will have experienced significant distractions from their work during the pendency of the transaction and we will have incurred significant third-party transaction costs, in each case, without any commensurate benefit, which may have a material and adverse effect on our stock price and results of operations.
The holders of our Common Stock are unlikely to receive any of the proceeds from the sale of the Integrated Contact Solutions Business Unit.
The purchase price for the assets of the Integrated Contact Solutions Business Unit will be paid directly to the Company. Management could spend or invest the net proceeds from the sale of the Integrated Contact Solutions Business Unit in ways with which our stockholders may not agree. We intend to use a portion of the net proceeds from the sale to support the development of our Behavioral Analytics™ Service Business Unit and for general corporate purposes, including our continued investment in the personnel required to sell and manage complex, long-term relationships with the customers of our Behavioral Analytics™ Service, as well as investment in the resources required to develop, deliver, and support our Behavioral Analytics™ Service. The investment of these proceeds may not yield a favorable return.
In addition, under the terms of the certificate of designations governing our outstanding Series B convertible preferred stock (the “Series B Stock”), the completion of the proposed sale would create certain preference rights in favor of the holders of Series B Stock. In particular, we will be prohibited from paying dividends or making any other distributions (including through stock repurchases) to the holders of our Common Stock until the holders of Series B Stock have received payment of their full liquidation preference, which is currently approximately $19.4 million. As a result of the preference rights for the Series B Stock and our need for cash resources to operate the Behavioral Analytics™ Service Business Unit, we do not expect that any proceeds from the proposed sale of the Integrated Contact Solutions Business Unit will remain for distribution to the holders of our Common Stock.
The Acquisition Agreement may expose us to contingent liabilities.
Under the Acquisition Agreement, we agree to indemnify TeleTech for breaches or violations of any representation, warranty, covenant, or agreement made by us in the Acquisition Agreement, for pre-closing and other liabilities related to the Integrated Contact Solutions Business Unit, and for other matters, subject to certain limitations. Significant indemnification claims by TeleTech could have a material adverse effect on our financial condition. We will generally not be obligated to indemnify TeleTech for any breach of the representations and warranties made by us under the Acquisition Agreement until the aggregate amount of claims for indemnification for such breach exceeds $200,000. In the event that claims for indemnification for breach of the representations and warranties made by us under the Acquisition Agreement exceed the stated threshold, we may be obligated to indemnify TeleTech for any damages or loss resulting from such breach in an amount not to exceed $1.5 million. Claims for indemnification for breach of any covenant, agreement, or other matter made by us in the Acquisition Agreement, including claims with respect to excluded assets or retained liabilities, or claims for fraud or intentional misrepresentation, are not subject to the limits described above.
6
Table of Contents
Our Integrated Contact Solutions Business Unit has historically generated a substantial portion of our revenue. After its sale, we will be a much smaller company, and in order to succeed, we will need to achieve profitability of our Behavioral Analytics™ Business Unit.
Our Integrated Contact Solutions Business Unit has historically been the source of a substantial portion of our revenue. For the fiscal year ended January 1, 2011, our Integrated Contact Solutions Business Unit accounted for $60 million, or 68%, of our total revenues of $88 million, while our Behavioral Analytics™ Service Business Unit accounted for only $28 million of our total revenues. In addition, after the sale, our customer concentration will increase. The Company’s top five clients accounted for 31% of total revenue in fiscal year 2010, whereas the top five clients for the Behavioral Analytics™ Service Business Unit accounted for 70% of that Business Unit’s revenue in fiscal year 2010. Higher concentration of revenue with a single client or a limited group of clients creates increased revenue risk if one of these clients significantly reduces its demand for our Behavioral Analytics™ Service. Furthermore, we intend to invest a portion of the net proceeds of the sale of the Integrated Contact Solutions Business Unit to grow our Behavioral Analytics™ Business Unit. There is no guarantee that we will be able to achieve sustained growth or profitability in our Behavioral Analytics™ Business Unit or in new business opportunities we may pursue.
Our Behavioral Analytics™ Business Unit is generating losses and has uncertain future revenue and income potential.
We are currently experiencing losses in our Behavioral Analytics™ Business Unit and we expect to continue to use cash and incur operating expenses to support its growth, including costs associated with recruiting, training, and managing our sales force, costs to develop and acquire new technology, and promotional costs associated with reaching new customers. These investments, which typically are made in advance of revenue, may not yield increased revenue to offset these expenses. As a result of these factors, the future revenue and income potential of our Behavioral Analytics™ Business Unit is uncertain. Any evaluation of our Behavioral Analytics™ Business Unit and our prospects following the sale of the Integrated Contact Solutions Business Unit must be considered in light of these factors and the risks and uncertainties often encountered by companies in the early stage of development. Some of these risks and uncertainties relate to our ability to do the following:
| • | maintain our current relationships, and develop new relationships, with customers, service providers and business partners; |
| • | continue to grow our revenue and meet anticipated growth targets; |
| • | manage our expanding operations and implement and improve our operational, financial and management controls; |
| • | successfully introduce new, and upgrade our existing, products and services for consumers; |
| • | respond to government regulations relating to our Behavioral Analytics™ Service Business Unit; |
| • | respond effectively to competition; and |
| • | attract and retain qualified management and employees. |
If we are unable to address these risks, our business, results of operations, and prospects could suffer.
We will be a very small public company with a large cash balance.
Once the sale of the Integrated Contact Solutions Business Unit is completed, we will remain a publicly traded company and will continue to be subject to SEC and Nasdaq rules and regulations, including the Sarbanes-Oxley Act of 2002. While all public companies face the costs and burdens associated with being publicly traded, the costs and burden of being a public company will be a significant portion of our annual revenues after the sale of our Integrated Contact Solutions Business Unit is consummated. In addition, given our size and the fact that the sole focus of our business will be our Behavioral Analytics™ Business Unit, our management will have an even greater expectation from stockholders and industry analysts to produce improved quarterly financial results for our Behavioral Analytics™ Business Unit as compared to the periods prior to the sale of the Integrated Contact Solutions Business Unit, when the diversity of our revenue streams could enable one of our segments to offset weakness in the other. After giving effect to the sale of the Integrated Contact Solutions Business Unit, on a pro forma basis, we would have had approximately $50.9 million in cash, cash equivalents, and investments as of January 1, 2011. Having a large cash balance relative to our market capitalization could make us a takeover target in the future, which could cause distractions for our management and our board of directors and otherwise prevent us from executing on our strategy for the Behavioral Analytics™ Business Unit to build long-term stockholder value.
7
Table of Contents
RISK FACTORS RELATING TO THE COMPANY GENERALLY
We have not realized a profit in ten years and there is no guarantee that we will realize a profit in the foreseeable future.
As of January 1, 2011, we had an accumulated deficit of $204.1 million. We incurred net losses available to common stockholders of $14.6 million in 2010, $11.9 million in 2009, and $22.9 million in 2008, and may continue to incur net losses in the future.
Our financial results could be adversely affected by economic and political conditions and the effects of these conditions on our clients’ businesses and levels of business activity.
Global economic and political conditions affect our clients’ businesses and the markets they serve. A severe and/or prolonged economic downturn or a negative or uncertain political climate could adversely affect our clients’ financial conditions and the levels of business activity of our clients and the industries we serve. This may reduce demand for our services or depress pricing of those services and have a material adverse effect on our results of operations. Changes in global economic conditions could also shift demand to services for which we do not have competitive advantages, and this could negatively affect the amount of business that we are able to obtain. In addition, these economic conditions may cause our clients to delay payments for services we have provided to them, resulting in a negative impact to our cash flow. If we are unable to successfully anticipate changing economic and political conditions, then we may be unable to effectively plan for and respond to those changes, and our business could be negatively affected.
Our financial results are subject to significant fluctuations because of many factors, any of which could adversely affect our stock price.
It is possible that in some future periods our operating results may be below the expectations of public market analysts and investors. In this event, the price of our Common Stock may fall. Our revenue and operating results may vary significantly due to a number of factors, many of which are not in our control. We may incur an impairment of goodwill if our financial results are adversely impacted by these factors and we continue to incur financial losses or our stock price declines. These factors include:
| • | Unanticipated cancellations or deferrals of, or reductions in the scope of, major engagements; |
| • | Our ability to deliver complex projects and to provide scalable and reliable solutions hosting; |
| • | The number, size, and scope of our projects; |
| • | Our client retention and acquisition rate and satisfaction with our services and solutions; |
| • | The length of the sales cycle associated with our solutions; |
| • | The sale of product; |
| • | The efficiency with which we utilize our employees; |
| • | How we plan and manage our existing and new engagements; |
| • | Completion of the transactions contemplated by the Acquisition Agreement; |
| • | Our ability to manage future growth, particularly the growth of the Behavioral Analytics™ Service; |
| • | Changes in pricing policies by us or our competitors; |
| • | Number of billing days; and |
| • | Availability of qualified employees. |
We depend on a limited number of clients for a significant portion of our revenue, and the loss of a significant client or a substantial decline in the number or scope of projects that we do for a significant client, could have a material adverse effect on our businesses.
We derive, and expect to continue to derive for the foreseeable future, a significant portion of our total revenue from a limited number of clients. See “Business” and “Clients” in Part I Item 1 and “Year Ended January 1, 2011 Compared with the Year Ended December 26, 2009” included in “Management’s Discussion and Analysis of Financial Condition and Results of Operations” in Part II Item 7 of this Form 10-K. With the exception of our subscription clients for the Behavioral Analytics™ Service, the volume of services that we provide for a specific client is likely to vary from year to year, and a major client in one year might not use our services in a subsequent year. To the extent that any significant client uses less of our services or terminates its relationship with us, as may occur as clients respond to conditions affecting their own businesses, our total revenue could decline substantially and that could seriously harm our business.
8
Table of Contents
We depend on good relations with our major clients, and any harm to these good relations may materially and adversely affect our business and our ability to compete effectively.
To attract and retain clients, we depend to a large extent on our relationships with our clients and our reputation for high quality consulting services and managed services. We design, create, implement, host, maintain, and support applications and solutions that are often critical to our clients’ businesses. We believe that we generally enjoy good relations with our clients. However, if a client is not satisfied with our services, products, or solutions, including those of subcontractors or vendors that we may utilize, it may be damaging to our reputation and business. Any defects or errors in our services or solutions or failure to meet our clients’ expectations could result in:
| • | Delayed or lost revenue; |
| • | Obligations to provide additional services to a client at a reduced fee or at no charge; |
| • | Negative publicity, which could damage our reputation and adversely affect our ability to attract or retain clients; and |
| • | Claims for damages against us, regardless of our responsibility for such failure. |
If we fail to meet our contractual obligations with our clients, then we could be subject to legal liabilities or loss of clients. Although our contracts typically include provisions to limit our exposure to legal claims for the services and solutions we provide and the applications and systems we develop or integrate, these provisions may not protect us in all cases.
If we do not effectively manage the risks associated with increasingly complex client projects and new service offerings, our profit margins and our financial results may suffer.
We may fail to estimate accurately the time and resources necessary for the performance of our services. It can be difficult to judge the time and resources necessary to complete consulting services projects, to deploy, support, and operate hosted solutions, to support and maintain complex contact center architectures, and/or to anticipate the amount of product needed to complete a project. A number of different risks must be accounted for, including, but not limited to, the variability and predictability of the number, size, scope, cost, and duration of and revenue from client engagements, unanticipated cancellations or deferrals of client contracts or follow-on phases of engagements in process, collection of revenue, variable employee utilization rates, project personnel costs, and other engagement requirements. Accurate estimates as to the costs and timing of completion of engagements is particularly important for the contracts that are performed on a fixed-price or not-to-exceed basis. Our failure to estimate accurately these risks could reduce the profitability of, or result in a loss on, our engagements and could damage our client relationships and our reputation.
Our industry is very competitive and, if we fail to compete successfully, our market share and business will be adversely affected.
We operate in a highly competitive and rapidly changing market and compete with a variety of organizations that offer services similar to those we offer. The market includes a variety of participants that compete with us at various levels of our business, including strategic consulting firms, systems integrators, general information-technology services providers, web consulting firms, voice recording and voice analytic service providers, application service providers, and other firms that provide both consulting and systems integration services and solutions. New market entrants also pose a threat to our business.
Many of our competitors have longer operating histories, more clients and longer relationships with their clients, greater brand or name recognition, and significantly greater financial, technical, marketing, and public relations resources than we do. As a result, our competitors may have comparatively better abilities to compete for specific clients and market share generally, including through substantial economic incentives to clients to secure contracts. Existing or future competitors may develop or offer solutions that are comparable or superior to ours at a lower price. In addition, our competitors may be in a better position to respond quickly to new or emerging technologies and changes in client requirements or expectations. They may also develop and promote their products and services more effectively than we do and be better able to compete for skilled professionals by offering substantial compensation incentives.
We rely heavily on our senior management team for the success of our business.
Given the highly specialized nature of our services, senior management must have a thorough understanding of our service offerings as well as the skills and experience necessary to manage the organization. If one or more members of our senior management team leaves and we cannot replace them with a suitable candidate quickly, then we could experience difficulty in managing our business properly, and this could harm our business prospects, client relationships, employee morale, and results of operations.
Our ability to recruit talented professionals and retain our existing professionals is critical to the success of our business.
We believe that our success will depend substantially on our ability to attract, train, motivate, and retain highly skilled management, strategic, technical, product development, and other key professional employees. The information-technology services industry continues to be people-intensive and faces a shortage of qualified personnel, especially those with specialized skills or experience. We compete with other companies to recruit and hire from this limited pool. If we cannot hire and retain qualified personnel, or if a significant number of our current employees leave, then we may be unable to complete or retain existing engagements or bid for new engagements of similar scope and revenue.
9
Table of Contents
If one or more of our key personnel were unable or unwilling to continue in their present positions and we had difficulty replacing such persons, then we could potentially suffer the loss of client relationships or new business opportunities and our business could be seriously harmed. In addition, there is no guarantee that the employee and customer non-solicitation and non-competition agreements we have entered into with our senior professionals would deter them from departing us for our competitors or that such agreements would be upheld and enforced by a court or other arbiter across all jurisdictions where we engage in business.
We must keep pace with the rapid rate of technological innovation and change, as well as evolving industry standards, in order to build our business.
Our industry is characterized by rapid and continually changing technologies, the introduction of many new products and services, and evolving industry standards and client preferences. Our solutions must meet the requirements of, and achieve significant acceptance among our current and prospective clients within, this environment. Our future business will depend on our continuing ability to adapt to and incorporate changing technologies and emerging industry standards and to remain knowledgeable with respect to our core areas of expertise.
In addition, our future business depends upon continued growth in the acceptance and use of the Behavioral Analytics™ Service by our current and prospective clients. Their acceptance and usage in turn may depend upon factors such as: the actual or perceived benefits of adoption of the Behavioral Analytics™ Service and related methodologies and technologies, including the predictability of a meaningful return on investment, cost efficiencies, or other measurable economic benefits; the actual or perceived reliability, scalability, ease of use, and access to such new technologies and methodologies; and the willingness to adopt new business methods incorporating a customer-centric approach.
We cannot assure that we will be successful in anticipating or responding to these developments and challenges on a timely or competitive basis or at all, or that our ideas and solutions will be successful in the marketplace. In addition, new or disruptive technologies and methodologies by our competitors may make our service or solution offerings uncompetitive. Any of these circumstances could adversely affect our ability to obtain and successfully complete substantial new client engagements that are important to maintain and grow our business.
We depend on our ability to rapidly learn, use, and integrate software and other technology developed by third parties to successfully compete, and our ability to maintain and grow our business may be affected by our ability to maintain strong relationships with software providers and other alliance partners.
To provide certain of our solutions and services, we rely on third-party software, telephony, and other infrastructure and related services. If we are unable to integrate these components in a fully functional manner, we may experience difficulties that could delay or prevent the successful development, introduction, or marketing of new solutions. We could also incur substantial costs if we need to modify our services or infrastructure to adapt to changes in these third-party products and services.
We have invested time and resources in initiating and maintaining strong relationships with certain software and technology providers and we plan to make additional investments in this regard in the future. The benefits we anticipate from these relationships play an important role in our future growth strategies. We rely on these relationships with third-party vendors and alliance partners to allow us to learn rapidly about their existing and next-generation technologies, to develop appropriate methods to integrate their products and services into our solutions, and to obtain joint sponsorship of solution offerings. If we are unable to successfully initiate and/or maintain these relationships, then our ability to successfully create and deploy new solution offerings incorporating their technologies would be significantly reduced. In addition, we may be adversely affected by the failure of one or more of our vendors or alliance partners, which could lead to reduced marketing exposure, fewer sales leads or joint marketing opportunities, and a diminished ability to gain access to or develop leading-edge solutions. As our most important alliance relationships are non-exclusive, our alliance partners are also free to establish similar or preferred relationships with our competitors. These circumstances could adversely impact the success of our growth strategies that, in turn, could adversely affect our results of operations.
It may be difficult for us to access debt or equity markets to meet our financial needs.
In the event, for any reason, we need to raise additional funds in the future, through public or private debt or equity financings, such funds may not be available or may not be available on terms favorable to us.
We have a limited ability to protect our intellectual property rights, which are important to our success and competitive position.
Our ability to protect our software, methodologies, and other intellectual property is important to our success and our competitive position. We view as proprietary the intellectual property that we develop internally in order to improve and enhance the service offerings of our Business Units, as well as that associated with the work product resulting from our services for clients. We seek to protect our intellectual property rights by applying for patents, copyrights, and trademarks, as appropriate, as well as by enforcing applicable trade secret laws and contractual restrictions on disclosure, licensing, copying, reverse engineering, and assignment.
10
Table of Contents
Despite our efforts to protect our intellectual property rights from unauthorized use or disclosure, others may attempt to disclose, obtain, or use our rights. The steps we take may not be adequate to prevent or deter infringement or other misappropriation of our intellectual property rights. In addition, we may not detect unauthorized use of, or take timely and effective actions to enforce and protect, our intellectual property rights.
We may be required to obtain licenses from others to refine, develop, market, and deliver current and new services and solutions. There can be no assurance that we will be able to obtain any of these licenses on commercially reasonable terms or at all, or that rights granted by these licenses ultimately will be valid and enforceable.
Others could claim that our services, products, or solutions infringe upon their intellectual property rights or violate contractual protections.
We believe that our services, products, and solutions do not infringe upon the intellectual property rights of others. However, we or our clients may be subject to claims that our services, products, or solutions, or the products of our software providers or other alliance partners, infringe upon the intellectual property rights of others. Any such infringement claims may result in substantial costs, divert management attention and other resources, harm our reputation, and prevent us from offering some services, products, or solutions. A successful infringement claim against us could materially and adversely affect our business.
In our contracts, we generally agree to indemnify our clients for expenses and liabilities resulting from claimed infringement by our services, products, or solutions, excluding third-party components, of the intellectual property rights of others. In some instances, the amount of these indemnity obligations may be greater than the revenue we receive from the client under the applicable contract. In addition, our business includes the development of customized software modules in connection with specific client engagements, particularly in our systems integration business. We often assign to clients the copyright and, at times, other intellectual property rights in and to some aspects of the software and documentation developed for these clients in these engagements. Although our contracts with our clients generally provide that we also retain rights to our intellectual property, it is possible that clients may assert rights to, and seek to limit our ability to resell or reuse, this intellectual property.
Increasing government regulation could cause us to lose clients or impair our business.
We are subject not only to laws and regulations applicable to businesses generally, but we, and the solutions we offer to our clients, also may be subject to United States and foreign laws and regulations, specifically those applicable to data privacy and security, electronic commerce, and call recording. Laws and regulations recently enacted in the United States, both at the state and federal level, have imposed significant new requirements relating to the privacy and security of personal data, as well as the reporting of breaches with respect to personal data. Legislation that may be enacted in the future may add further requirements in these and other areas. In addition, we may be affected indirectly by legislation to the extent that it impacts our existing and prospective clients; for example, our clients in the health care industry are currently impacted by the uncertainty surrounding the health care reform effort. Any such laws and regulations therefore could affect our existing business relationships or prevent us from obtaining new clients.
The unauthorized disclosure of the confidential client data that we maintain could result in a significant loss of business to eLoyalty and subject us to substantial liability.
In the course of implementing our Behavioral Analytics™ Service, we record and analyze telephone calls between our clients’ customer service agents and customers. These calls contain numerous references to highly sensitive confidential or personally-identifiable data of the customers of our clients, and many of our clients are required to comply with federal and state laws concerning privacy and security. In addition, we have made certain contractual commitments to our clients regarding this confidential data.
We take extensive precautions to prevent the unauthorized disclosure or loss of such data and to protect the Company through technical and contractual means. Nonetheless, the disclosure or loss of such data could result in the considerable diminution of our business and prospects and could subject us to substantial liability.
In addition, the laws and regulations and industry standards governing these matters are changing rapidly. It is possible that the resources we devote to comply with such laws and regulations, industry standards, and our clients’ particular requirements could increase materially. In our contracts, we generally agree to indemnify our clients for expenses and liabilities resulting from unauthorized disclosure of confidential data. In some instances, the amount of these indemnity obligations may be greater than the revenue we receive from the client under the applicable contract.
We must maintain our reputation and expand our name recognition to remain competitive.
We believe that establishing and maintaining a good reputation and brand name is critical for attracting and expanding our targeted client base. If our reputation is damaged or if potential clients do not know what solutions we provide, then we may become less competitive or lose our market share. Promotion and enhancement of our name will depend largely on our success in providing high quality services, software, and solutions, which cannot be assured. If clients do not perceive our solutions to be effective or of higher quality than those available from our competitors, then our brand name and reputation could be materially and adversely affected.
Our clients use our solutions for critical applications. Any errors, defects, or other performance problems, including those in our proprietary software or products supplied by third-party vendors, could result in financial or other damages. In addition to any liability we might have, performance problems could also adversely affect our brand name and reputation.
11
Table of Contents
| Item 1B. | Unresolved Staff Comments. |
Not applicable.
| Item 2. | Properties. |
Our principal physical properties employed in our business consist of our leased office facilities in Chicago and Lake Forest, Illinois; Edina, Minnesota; and Austin, Texas. Both of our business segments use the Lake Forest, Illinois and Austin, Texas facilities in their operations. The Edina, Minnesota and Chicago, Illinois facilities are primarily used by our Behavioral Analytics™ Service segment. Our executive offices are located at the Lake Forest, Illinois facility. Effective June 1, 2011, our executive office will be our location at 200 South Wacker Drive, Suite 820, Chicago, Illinois 60606.
Our total employable space is approximately 51,000 square feet. We do not own any real estate and believe that our leased facilities are appropriate for our current business requirements.
| Item 3. | Legal Proceedings. |
The Company, from time to time, has been subject to legal claims arising in connection with its business. While the results of these claims cannot be predicted with certainty, there are no asserted claims against the Company that, in the opinion of management, if adversely decided, would have a material effect on the Company’s financial position, results of operations, or cash flows.
| Item 4. | [Removed and Reserved.] |
PART II.
| Item 5. | Market for Registrant’s Common Equity, Related Stockholder Matters, and Issuer Purchases of Equity Securities. |
Our Common Stock, par value $0.01 per share, is traded on the NASDAQ Global Market under the symbol ELOY. If the transaction with respect to the Integrated Contact Solutions Business Unit is consummated as proposed, the Company intends to trade under the ticker symbol “MATR”; an application to reserve this ticker symbol has been submitted to NASDAQ. The following table sets forth, for the periods indicated, the quarterly high and low sales prices of our Common Stock on the NASDAQ Global Market.
| High | Low | |||||||
| Fiscal Year 2010 |
||||||||
| Fourth Quarter |
$ | 7.50 | $ | 6.02 | ||||
| Third Quarter |
6.90 | 5.25 | ||||||
| Second Quarter |
7.61 | 5.14 | ||||||
| First Quarter |
7.28 | 4.90 | ||||||
| Fiscal Year 2009 |
||||||||
| Fourth Quarter |
$ | 8.58 | $ | 6.23 | ||||
| Third Quarter |
10.02 | 7.22 | ||||||
| Second Quarter |
10.46 | 4.20 | ||||||
| First Quarter |
5.00 | 2.45 | ||||||
There were approximately 92 owners of record of our Common Stock as of March 10, 2011. The last reported sale price of the Common Stock on the NASDAQ Global Market on March 10, 2011 was $6.99.
Stock Performance Graph
The following graph compares the cumulative total stockholder return on eLoyalty Common Stock with the cumulative total return of (i) a peer group of other publicly-traded information-technology consulting companies selected by the Company (the “Peer Group Index”), and (ii) the NASDAQ Global Market Index. Cumulative total stockholder return is based on the period from December 30, 2005 through the Company’s fiscal year end on Saturday, January 1, 2011. The comparison assumes that $100 was invested on December 30, 2005 in each of eLoyalty Common Stock, the Peer Group Index, and the NASDAQ Global Market Index, and that any and all dividends were reinvested.
12
Table of Contents
Comparative Cumulative Total Return
For eLoyalty Corporation,
Peer Group Index and NASDAQ Global Market Index
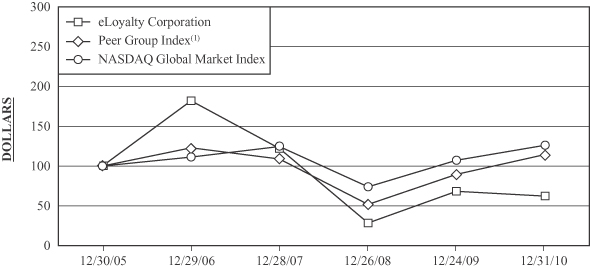
| 12/30/05 | 12/29/06 | 12/28/07 | 12/26/08 | 12/24/09 | 12/31/10 | |||||||||||||||||||
| eLoyalty Corporation |
$ | 100.00 | $ | 182.22 | $ | 122.25 | $ | 28.18 | $ | 68.03 | $ | 62.20 | ||||||||||||
| Peer Group Index(1) |
100.00 | 122.97 | 108.76 | 51.37 | 89.26 | 114.41 | ||||||||||||||||||
| NASDAQ Global Market Index |
100.00 | 111.16 | 124.64 | 73.80 | 107.07 | 125.99 | ||||||||||||||||||
| (1) | The Peer Group Index consists of The Hackett Group, Sapient Corporation, Convergys Corporation, Verint Systems, Inc., Ciber, Inc., and Nice Systems Limited. In fiscal year 2010, Nice Systems Limited was added to the Peer Group Index to replace Diamond Management & Technology Consultants, which was removed because its public information is no longer available. In fiscal year 2009, Ciber, Inc. was added to the Peer Group Index to replace Perot Systems Corporation, which was removed because its public information was no longer available. |
Repurchase of Equity Securities
The following table provides information relating to the Company’s purchase of shares of its Common Stock in the fourth quarter of 2010. All of these purchases reflect shares withheld upon vesting of restricted stock or installment stock to satisfy tax-withholding obligations.
| Period |
Total Number of Shares Purchased |
Average Price Paid Per Share |
||||||
| September 26, 2010 – October 25, 2010 |
— | $ | — | |||||
| October 26, 2010 – November 25, 2010 |
— | $ | — | |||||
| November 26, 2010 – January 01, 2011 |
34,205 | $ | 6.37 | |||||
| Total |
34,205 | $ | 6.37 | |||||
See “Security Ownership of Certain Beneficial Owners and Management and Related Stockholder Matters” included in Part III Item 12 of this Form 10-K for more information about securities authorized for issuance under our various compensation plans.
Dividends
Historically, we have not paid cash dividends on our Common Stock, and we do not expect to do so in the future. If the proposed sale of our Integrated Contact Solutions Business Unit is completed, then we will be prohibited from paying dividends on our Common Stock until the Company pays the full liquidation preference (currently approximately $19.4 million) on its outstanding Series B Stock.
The Series B Stock accrues dividends at the rate of 7% per year payable semi-annually in January and July if declared by the Board of Directors. The Company paid cash dividends of $0.6 million on January 4, 2010, July 1, 2010 and July 1, 2009. The Company’s Board of Directors did not declare dividends on the Series B Stock for the January 1, 2011 or January 1, 2009 dividend payment dates. Under the terms of the Series B Stock certificate of designations, unpaid dividends are cumulative and accrue at the rate of 7% per annum. Payment of future dividends on the Series B Stock will be determined by the Company’s Board of Directors based on the Company’s outlook and macro-economic conditions. The amount of each dividend accrual would decrease by any conversions of the Series B Stock into Common Stock, as Series B Stock conversions require us to pay accrued but unpaid dividends at the time of conversion. Conversions of Series B Stock became permissible at the option of the holder after June 19, 2002. For further discussion see Part II, Item 7, “Liquidity and Capital Resources”.
| Item 6. | Selected Financial Data. |
The following tables summarize our selected financial data. This information should be read in conjunction with Management’s Discussion and Analysis of Financial Condition and Results of Operations, and the Consolidated Financial Statements of the Company and notes thereto, which are included elsewhere in this Form 10-K. The statements of operations data for the fiscal years ended 2010, 2009, 2008, 2007, and 2006 and the balance sheet data as of January 1, 2011, December 26, 2009, December 27, 2008, December 29, 2007, and December 30, 2006, below, are derived from our audited financial statements.
13
Table of Contents
| Consolidated Statements of Operations Data (In thousands, except share and per share data) |
||||||||||||||||||||
| For the Fiscal Years Ended | ||||||||||||||||||||
| 2010 | 2009 | 2008 | 2007 | 2006 | ||||||||||||||||
| Revenue: |
||||||||||||||||||||
| Services |
$ | 71,808 | $ | 79,862 | $ | 77,796 | $ | 88,046 | $ | 71,980 | ||||||||||
| Product |
12,581 | 17,780 | 9,777 | 9,185 | 13,579 | |||||||||||||||
| Revenue before reimbursed expenses (net revenue) |
84,389 | 97,642 | 87,573 | 97,231 | 85,559 | |||||||||||||||
| Reimbursed expenses |
3,715 | 3,971 | 3,624 | 4,874 | 4,269 | |||||||||||||||
| Total revenue |
88,104 | 101,613 | 91,197 | 102,105 | 89,828 | |||||||||||||||
| Operating expenses: |
||||||||||||||||||||
| Cost of services(1)(2) |
43,326 | 52,442 | 53,586 | 58,496 | 58,604 | |||||||||||||||
| Cost of product |
10,360 | 14,814 | 7,945 | 6,993 | 10,183 | |||||||||||||||
| Cost of revenue before reimbursed expenses |
53,686 | 67,256 | 61,531 | 65,489 | 68,787 | |||||||||||||||
| Reimbursed expenses |
3,715 | 3,971 | 3,624 | 4,874 | 4,269 | |||||||||||||||
| Total cost of revenue, exclusive of depreciation and amortization shown below: |
57,401 | 71,227 | 65,155 | 70,363 | 73,056 | |||||||||||||||
| Selling, general and administrative(1)(2) |
38,273 | 35,163 | 41,182 | 47,075 | 25,328 | |||||||||||||||
| Severance and related costs(1) |
1,180 | 1,341 | 1,635 | 1,333 | 737 | |||||||||||||||
| Depreciation |
4,074 | 4,242 | 3,845 | 3,186 | 2,095 | |||||||||||||||
| Amortization of intangibles |
144 | 223 | 340 | 423 | 370 | |||||||||||||||
| Total operating expenses |
101,072 | 112,196 | 112,157 | 122,380 | 101,586 | |||||||||||||||
| Operating loss |
(12,968 | ) | (10,583 | ) | (20,960 | ) | (20,275 | ) | (11,758 | ) | ||||||||||
| Interest and other (expense) income, net |
(121 | ) | 53 | 70 | 1,484 | 681 | ||||||||||||||
| Loss from continuing operations before income taxes |
(13,089 | ) | (10,530 | ) | (20,890 | ) | (18,791 | ) | (11,077 | ) | ||||||||||
| Income tax (provision) benefit |
(93 | ) | (44 | ) | (15 | ) | 53 | (71 | ) | |||||||||||
| Loss from continuing operations |
(13,182 | ) | (10,574 | ) | (20,905 | ) | (18,738 | ) | (11,148 | ) | ||||||||||
| Loss on discontinued operations |
(136 | ) | (46 | ) | (748 | ) | — | — | ||||||||||||
| Net loss |
(13,318 | ) | (10,620 | ) | (21,653 | ) | (18,738 | ) | (11,148 | ) | ||||||||||
| Dividends related to Series B Stock |
(1,273 | ) | (1,292 | ) | (1,296 | ) | (1,405 | ) | (1,464 | ) | ||||||||||
| Net loss available to common stockholders |
$ | (14,591 | ) | $ | (11,912 | ) | $ | (22,949 | ) | $ | (20,143 | ) | $ | (12,612 | ) | |||||
| Per common share: |
||||||||||||||||||||
| Basic loss from continuing operations |
$ | (0.96 | ) | $ | (0.80 | ) | $ | (2.02 | ) | $ | (2.23 | ) | $ | (1.65 | ) | |||||
| Basic loss from discontinued operations |
$ | (0.01 | ) | $ | — | $ | (0.07 | ) | $ | — | $ | — | ||||||||
| Basic net loss available to common stockholders |
$ | (1.06 | ) | $ | (0.90 | ) | $ | (2.21 | ) | $ | (2.40 | ) | $ | (1.86 | ) | |||||
| Per common share: |
||||||||||||||||||||
| Diluted loss from continuing operations(3) |
$ | (0.96 | ) | $ | (0.80 | ) | $ | (2.02 | ) | $ | (2.23 | ) | $ | (1.65 | ) | |||||
| Diluted loss from discontinued operations(3) |
$ | (0.01 | ) | $ | — | $ | (0.07 | ) | $ | — | $ | — | ||||||||
| Diluted net loss available to common stockholders(3) |
$ | (1.06 | ) | $ | (0.90 | ) | $ | (2.21 | ) | $ | (2.40 | ) | $ | (1.86 | ) | |||||
| (In millions) | ||||||||||||||||||||
| Basic weighted average shares outstanding |
13.70 | 13.26 | 10.37 | 8.40 | 6.77 | |||||||||||||||
| Diluted weighted average shares outstanding(3) |
17.70 | 17.49 | 14.00 | 12.90 | 11.70 | |||||||||||||||
| (1) | Stock-based compensation, primarily restricted stock, is included in individual line items above: |
14
Table of Contents
| (In thousands) For the Fiscal Year Ended |
||||||||||||||||||||
| 2010 | 2009 | 2008 | 2007 | 2006 | ||||||||||||||||
| Cost of services |
$ | 99 | $ | 504 | $ | 3,345 | $ | 1,004 | $ | 1,632 | ||||||||||
| Selling, general and administrative |
5,102 | 5,793 | 11,335 | 9,444 | 2,386 | |||||||||||||||
| Severance and related costs |
76 | 248 | 103 | 196 | — | |||||||||||||||
| (2) | Beginning in fiscal year 2007, the Company classified certain expenses within Cost of services as Selling, general and administrative expense. Beginning in fiscal year 2008, certain data center expenses that had been previously reported as Selling, general and administrative have been reclassified as Cost of services within our Behavioral Analytics™ Service Business Unit. |
| (3) | In periods in which there is a loss, the dilutive effect of Common Stock equivalents is not included in the diluted loss per share calculation as they are antidilutive. |
| Consolidated Balance Sheet Data (In thousands) As of |
||||||||||||||||||||
| January 1, 2011 |
December 26, 2009 |
December 27, 2008 |
December 29, 2007 |
December 30, 2006 |
||||||||||||||||
| Total cash(1) |
$ | 23,332 | $ | 32,727 | $ | 30,719 | $ | 23,867 | $ | 31,928 | ||||||||||
| Short-term investments(2) |
$ | — | $ | — | $ | 108 | $ | 451 | $ | — | ||||||||||
| Working capital(3) |
$ | 11,857 | $ | 18,211 | $ | 24,688 | $ | 20,621 | $ | 32,640 | ||||||||||
| Total assets |
$ | 66,192 | $ | 70,603 | $ | 64,223 | $ | 60,051 | $ | 64,568 | ||||||||||
| Long-term obligations |
$ | 17,520 | $ | 11,231 | $ | 7,846 | $ | 9,041 | $ | 5,471 | ||||||||||
| Redeemable preferred stock |
$ | 18,100 | $ | 18,442 | $ | 18,460 | $ | 19,100 | $ | 20,902 | ||||||||||
| Stockholders’ (deficit) equity |
$ | (4,154 | ) | $ | 6,031 | $ | 12,847 | $ | 7,803 | $ | 18,614 | |||||||||
| Capital leases |
$ | 2,367 | $ | 2,657 | $ | 3,172 | $ | 1,491 | $ | — | ||||||||||
| (1) | Total cash consisted of cash and cash equivalents of $20.9 million, $29.0 million, $27.1 million, $21.4 million, and $31.6 million, and restricted cash of $2.5 million, $3.7 million, $3.7 million, $2.5 million, and $0.3 million, as of January 1, 2011, December 26, 2009, December 27, 2008, December 29, 2007, and December 30, 2006, respectively. |
| (2) | In 2008 and 2007, included in other current assets are $0.1 million and $0.5 million of investments, respectively, which represent the market value of equity securities in an unrelated publicly traded company. In 2009, these equity securities were sold for $0.3 million. |
| (3) | Represents total current assets less total current liabilities. |
| Item 7. | Management’s Discussion and Analysis of Financial Condition and Results of Operations. |
Critical Accounting Policies and Estimates
Our management’s discussion and analysis of financial condition and results of operations is based upon our consolidated financial statements, which have been prepared in accordance with accounting principles generally accepted in the United States. The preparation of these financial statements requires us to make estimates and judgments that affect the reported amounts of assets, liabilities, revenue, and expenses, and related disclosure of contingent assets and liabilities. On an ongoing basis, we evaluate our estimates, including those related to the costs and timing of completion of client projects, our ability to collect accounts receivable, the timing and amounts of expected payments associated with cost reduction activities, and the ability to realize our net deferred tax assets, contingencies, and litigation. We base our estimates on historical experience and on various other assumptions that we believe to be reasonable under the circumstances. Actual results may differ from these estimates under different assumptions or conditions.
We believe the following critical accounting policies affect the more significant judgments and estimates used in the preparation of our consolidated financial statements.
Revenue Recognition
Behavioral Analytics™ Service Business Unit
Behavioral Analytics™ Service Line
Managed services revenue included in the Behavioral Analytics™ Service Line consists of planning, deployment, training, and subscription fees. Planning, deployment, and training fees, which are considered to be installation fees related to long-term subscription contracts, are deferred until an installation is complete and are then recognized over the term of the applicable subscription contract. The terms of these subscription contracts generally range from three to five years. Installation costs incurred are deferred up to an amount not to exceed the amount of deferred installation revenue and additional amounts that are recoverable based on the contractual arrangement. These costs are included in Prepaid expenses and Other long-term assets. Such costs are amortized over the term of the subscription contract. Costs in excess of the foregoing revenue amount are expensed in the period incurred.
15
Table of Contents
The amount of revenue generated from Behavioral Analytics™ Service subscription fees is based on a number of factors, such as the number of agents accessing the Behavioral Analytics™ System and/or the number of hours of calls analyzed during the relevant month of the term of the subscription contract. This revenue is recognized as the service is performed for the client.
Consulting services revenue included in the Behavioral Analytics™ Service Line primarily consists of fees charged to our clients to provide post-deployment follow-on consulting services, which generally consist of custom data analysis, the implementation of enhancements, and training. These follow-on consulting services are generally performed for our clients on a fixed-fee basis. Revenue is recognized as the services are performed, with performance generally assessed on the ratio of actual hours incurred to date compared to the total estimated hours over the entire term of the contract.
Marketing Managed Services Line
Marketing Managed Services revenue is derived from marketing application hosting and email fulfillment. Revenue related to hosting services is generally in the form of fixed monthly fees received from our clients and is recognized as the services are performed for each client. Any related setup fee would be recognized over the contract period of the hosting arrangement. Revenue related to email fulfillment services is recognized as the services are provided to the client, based on the number of emails distributed for the client.
Integrated Contact Solutions Business Unit
Integrated Contact Solutions Service Line
Managed services revenue included in the Integrated Contact Solutions Service Line consists of fees generated from our contact center support and monitoring services. Support and monitoring services are generally contracted for a fixed fee, and the revenue is recognized ratably over the term of the contract. Support fees that are contracted on a time-and-materials basis are recognized as the services are performed for the client.
For fixed fee Managed services contracts, where the Company provides support for third-party software and hardware, revenue is recorded at the gross amount of the sale. If the contract does not meet the requirements for gross reporting, then Managed services revenue is recorded at the net amount of the sale.
Consulting services revenue included in the Integrated Contact Solutions Service Line consists of the modeling, planning, configuring, or integrating of an Internet Protocol (“IP”) network solution within our clients’ contact center environments. These services are provided to the client on a time-and-materials or fixed-fee basis. For the integration of a system, the Company recognizes revenue as the services are performed, with performance generally assessed on the ratio of hours incurred to date compared to the total estimated hours over the entire term of the contract. For all other consulting services, we recognize revenue as the services are performed for the client.
Revenue from the sale of Product, which is generated primarily from the resale of third-party software and hardware by the Company, is generally recorded at the gross amount of the sale.
Within the Integrated Contact Solutions Service Line, Consulting services, Managed services, and the resale of Product may be sold and delivered together. In arrangements that include the resale of software, vendor-specific objective evidence (“VSOE”) must be determined for each of the individual elements. If VSOE does not exist for the allocation of revenue to the various elements of the arrangement, then all revenue from the arrangement is deferred until all elements of the arrangement without VSOE have been delivered to the client. Upon the delivery of the element without VSOE, revenue is allocated to this element based on the total value of the arrangement less the VSOE amounts established for the other elements. If the remaining undelivered elements are post-contract support (“PCS”) or other deliverables with similar attribution periods, then the arrangement revenue is recognized ratably over the remaining service period.
Traditional CRM Service Line
Consulting services revenue included in the Company’s traditional CRM Service Line consists of fees generated from our operational consulting and systems integration services or from building systems for our clients. These services are provided to our clients on a time-and-materials or fixed-fee basis. For the integration or building of a system, the Company recognizes revenue as the services are performed, with performance generally assessed on the ratio of hours incurred to date compared to the total estimated hours over the entire term of the contract. For all other consulting services, we recognize revenue as the services are performed for the client.
Managed services revenue included in the traditional CRM Service Line consists of fees generated from our remote application support. Contracts for remote application support can be based on a fixed-fee or time-and-materials basis. For fixed-fee support, revenue is recognized ratably over the contract period. For time-and-material contracts, revenue is recognized as the services are provided to the client.
16
Table of Contents
Multiple-element arrangements are segmented into separate earning processes when the elements have objective and reliable evidence of fair value and have value to the customer on a stand-alone basis. Revenue related to contracts with multiple elements is allocated based on the fair value of the element and is recognized in accordance with our revenue recognition policy for each type of element, as described above. If the fair value for any undelivered element cannot be established, then revenue is deferred until all elements have been delivered to the client. If PCS or similar services are the only remaining activity without established fair value, then the revenue for the entire arrangement is recognized ratably over the service period.
Reimbursed expenses revenue includes billable costs related to travel and other out-of-pocket expenses incurred while performing services for our clients. The cost of third-party product and support may be included within this category if the transaction does not satisfy the requirements for gross reporting. An equivalent amount of reimbursable expenses is included in Cost of revenue.
Payments received for Managed services contracts in excess of the amount of revenue recognized for these contracts are recorded as unearned revenue until revenue recognition criteria are met.
If the Company’s estimates indicate that a contract loss will occur, then a loss provision is recorded in the period in which the loss first becomes probable and can be reasonably estimated.
The Company maintains allowances for doubtful accounts for estimated losses resulting from clients not paying for unpaid or disputed invoices for contractual services provided. Additional allowances may be required if the financial condition of our clients deteriorates.
Stock-Based Compensation
Stock-based compensation cost is measured at the grant date based on the fair value of the award and is recognized as expense over the vesting period. Determining fair value of stock-based awards at the grant date requires certain assumptions. The Company uses historical information as the primary basis for the selection of expected life, expected volatility, expected dividend yield assumptions, and anticipated forfeiture rates. The risk-free interest rate is selected based on the yields from U.S. Treasury Strips with a remaining term equal to the expected term of the options being valued.
Goodwill
Goodwill is tested annually for impairment using a two-step test approach. In the first step, the fair value of each reporting unit is compared with its carrying value. If the fair value exceeds the carrying value, then goodwill is not impaired and no further testing is performed. The second step is performed if the carrying value exceeds the fair value. In the second step, the implied fair value of the reporting unit’s goodwill must be determined and compared to the carrying value of the goodwill. If the carrying value of a reporting unit’s goodwill exceeds its implied fair value, then an impairment loss equal to the difference will be recorded.
A detailed determination of the fair value of a reporting unit may be carried forward from one year to the next if specific criteria have been met.
There has been no impairment identified as a result of the annual review of goodwill as of January 1, 2011 and the detailed determination of fair value as of December 26, 2009. The carrying value of goodwill was $2.6 million as of January 1, 2011 and December 26, 2009. We may incur an impairment of goodwill if our financial results are negatively impacted by current economic conditions and we continue to incur losses or our stock price declines.
Intangible Assets
Intangible assets reflect costs related to patent and trademark applications, Marketing Managed Services customer relationships acquired in 2004, and the purchase of a license for certain intellectual property in 2003. Patent and trademark applications are amortized over 120 months. The other intangible assets are fully amortized. The original cost of intangible assets as of January 1, 2011 and December 26, 2009 was $2.9 million and $2.8 million, respectively. Accumulated amortization of intangible assets as of January 1, 2011 and December 26, 2009 was $2.4 million and $2.3 million, respectively. Amortization expense of intangible assets was $0.1 million and $0.2 million for fiscal years 2010 and 2009, respectively.
17
Table of Contents
Severance and Related Costs
We recorded accruals for severance and related costs associated with our cost-reduction efforts undertaken during fiscal years 2006 through 2010. The portion of the accruals relating to employee severance represents contractual severance for identified employees and generally is not subject to a significant revision. The portion of the accruals that related to office space reductions, office closures, and associated contractual lease obligations are based in part on assumptions and estimates of the timing and amount of sublease rentals, which may be affected by overall economic and local market conditions. To the extent estimates of the success of our sublease efforts changed, adjustments increasing or decreasing the related accruals have been recognized. An adjustment related to sublease efforts was made in fiscal year 2010.
Income Taxes
We have recorded income tax valuation allowances on our net deferred tax assets to account for the unpredictability surrounding the timing of realization of our U.S. and non-U.S. net deferred tax assets due to uncertain economic conditions. The valuation allowances may be reversed at a point in time when management determines realization of these tax assets has become more likely than not, based on a return to predictable levels of profitability.
The Company uses an asset and liability approach for financial accounting and reporting of income taxes. Deferred income taxes are provided when tax laws and financial accounting standards differ with respect to the amount of income for the year, the basis of assets and liabilities and for tax loss carryforwards. The Company does not provide U.S. deferred income taxes on earnings of U.S. or foreign subsidiaries, which are expected to be indefinitely reinvested.
The Company may recognize the tax benefit from an uncertain tax position only if it is more likely than not that the tax position will be sustained on examination by the taxing authorities, based on the technical merits of the position. The tax benefits recognized in the financial statements from such a position should be measured based on the largest benefit that has a greater than 50% likelihood of being realized upon ultimate settlement. Significant judgment is used to determine the likelihood of the benefit. There is additional guidance on derecognition, classification, interest and penalties on income taxes, accounting in interim periods, and disclosure requirements.
Other Significant Accounting Policies
For a description of the Company’s other significant accounting policies, see Note Two “Summary of Significant Accounting Policies” of the “Notes to Consolidated Financial Statements” included in Part II Item 8 of this Form 10-K.
Forward-Looking Statements
This Form 10-K contains forward-looking statements – in other words, statements related to future, not past, events. These statements may be identified by words such as “believes,” “anticipates,” “estimates,” “expects,” “plans,” “intends,” “projects,” “future,” “should,” “could,” “seeks,” “target,” “may,” “will continue to,” “predicts,” “forecasts,” “potential,” “guidance,” “outlook,” and similar expressions, references to plans, strategies, objectives, and anticipated future performance, and other statements that are not strictly historical in nature. Such statements are based on the current expectations and certain assumptions of management as of the date they are made, and are, therefore, subject to certain risks and uncertainties that could cause actual results to differ materially from those expressed or implied by the forward-looking statements. Such risks, uncertainties, and other factors that might cause such a difference include, without limitation, those noted under “Risk Factors” included in Part I Item 1A of this Form 10-K, as well as the following:
| • | Uncertainties associated with the attraction of new clients, the continuation of existing and new engagements with existing clients, and the timing of related client commitments; |
| • | Reliance on a relatively small number of clients for a significant percentage of our revenue; |
| • | Risks involving the variability and predictability of the number, size, scope, cost, and duration of, and revenue from, client engagements; |
| • | Variances in sales of products in connection with client engagements; |
| • | Management of the other risks associated with increasingly complex client projects and new service offerings, including execution risk; |
| • | Management of growth and development and introduction of new service offerings, including those related to the Behavioral Analytics™ Service Line; |
| • | Challenges in attracting, training, motivating, and retaining highly-skilled management, strategic, technical, product development, and other professional employees in a competitive information-technology labor market; |
| • | Risks associated with our reliance on Cisco, a large primary product partner within our Integrated Contact Solutions Service Line, including our reliance on its product positioning, pricing, and discounting strategies; |
18
Table of Contents
| • | Reliance on major suppliers, including software providers and other alliance partners, and maintenance of good relations with key business partners; |
| • | Continuing intense competition in the information-technology services industry generally; |
| • | The rapid pace of technological innovation in the information-technology services industry; |
| • | Protection of our technology, proprietary information, and other intellectual property rights from challenges by others; |
| • | The ability to raise sufficient amounts of debt or equity capital to meet our future operating and financial needs; |
| • | Risks associated with compliance with international, federal, and state privacy and security laws and the protection of highly confidential information of clients and their customers; |
| • | Future legislative or regulatory actions relating to information technology or the information-technology service industry, including those relating to data privacy and security; |
| • | Changes by the FASB or the SEC of authoritative accounting principles generally accepted in the United States or policies or changes in the application or interpretation of those rules or regulations; |
| • | Risks associated with global operations, including those relating to the economic conditions in each country, potential currency exchange and credit volatility, compliance with a variety of foreign laws and regulations, and management of a geographically-dispersed organization; |
| • | Economic, business, and political conditions and the effects of these conditions on our clients’ businesses and levels of business activity; |
| • | Acts of war or terrorism, including, but not limited to, actions taken or to be taken by the United States and other governments as a result of acts or threats of terrorism, and the impact of these acts on economic, financial, and social conditions in the countries where we operate; and |
| • | The timing and occurrence (or non-occurrence) of transactions and events which may be subject to circumstances beyond our control. |
In addition, our agreement to sell the assets of our Integrated Contact Solutions Business Unit to a subsidiary of TeleTech is subject to various conditions, including approval by our stockholders at a special meeting, the receipt of required third-party consents and approvals, and other closing conditions customary for transactions of this type. No assurances can be given that the transaction will be consummated on the terms contemplated or at all.
Should one or more of these risks or uncertainties materialize, or should underlying assumptions prove incorrect, actual results may vary materially from those described in the relevant forward-looking statement. The Company neither intends to nor undertakes any obligation to publicly update or revise any forward-looking statements in this Form 10-K, whether as a result of new information, future events or circumstances, or otherwise.
Business Outlook
On March 17, 2011, the Company entered into an Acquisition Agreement providing for the sale of all its assets used in the Integrated Contact Solutions Business Unit to a subsidiary of TeleTech. The Company expects the sale of the Integrated Contact Solutions Business Unit to close in the second quarter of 2011. If the transaction is consummated as proposed, the Company will continue to operate its Behavioral Analytics™ Service Business Unit as a standalone business.
After giving effect to our payment of estimated transaction fees and expenses and before giving effect to purchase price adjustments set forth in the Acquisition Agreement, we estimate that the net cash proceeds from our sale of the Integrated Contact Solutions Business Unit will be approximately $38.9 million. The purchase price adjustments set forth in the Acquisition Agreement will cause the actual amount of net cash proceeds to vary from this estimate. The purchase price adjustments include certain net managed services prepaid amounts that we will contribute to the Integrated Contact Solutions Business Unit at closing, which amounts were equal to approximately $11.7 million as of January 1, 2011. We intend to use a portion of the net proceeds to support the development of our Behavioral Analytics™ Service Business Unit and for general corporate purposes. The uses of such proceeds will include our continued investment in the personnel required to sell and manage complex, long-term relationships with the customers of our Behavioral Analytics™ Service, as well as investment in the resources required to develop, deliver, and support our Behavioral Analytics™ Service. These investments may affect our cash resources and results of operations in 2011, but we believe they are required to build and maintain the Behavioral Analytics™ Service as a standalone business. Management will continue to assess all areas of the cost structure to identify opportunities to maximize cash resources and achieve profitability.
19
Table of Contents
Managed Services Backlog
As a result of the strategic and long-term nature of Managed services revenue, we believe it is appropriate to monitor the level of backlog associated with these agreements. The Managed services backlog was $130.3 million as of January 1, 2011, and $87.7 million as of December 26, 2009. This increase in backlog is primarily due to the signing of several Behavioral Analytics™ Service agreements and several Integrated Contact Solutions support agreements in fiscal year 2010. Of the $130.3 million backlog as of January 1, 2011, 65% is related to our Behavioral Analytics™ Service Business Unit and 35% is related to our Integrated Contact Solutions Business Unit. We expect the Behavioral Analytics™ Service Business Unit backlog to increase in 2011. This expectation is derived from the impact of anticipated renewals of existing agreements and anticipated contract signings with clients included in our current sales pipeline.
The Company uses the term “backlog” to reflect the estimated future amount of Managed services revenue related to its Managed services contracts. The value of these contracts is based on anticipated usage volumes over the anticipated term of the agreement. The anticipated term of the agreement is based on the contractually agreed fixed term of the contract, plus agreed upon, but optional extension periods. Anticipated volumes may be greater or less than anticipated. In addition, these contracts typically are cancellable without cause based on the customer making a substantial early termination payment or forfeiture of prepaid contract amounts. If the sale of the Integrated Contact Solutions Business Unit closes as proposed, we expect the reported backlog to be recognized as follows: $37.7 million in 2011; $26.6 million in 2012; $18.8 million in 2013; and $13.2 million in 2014 and thereafter.
Year Ended January 1, 2011 Compared with the Year Ended December 26, 2009
Net Revenue
| For the Fiscal Years Ended | ||||||||||||||||
| January 1, 2011 | December 26, 2009 | |||||||||||||||
| Dollars in Millions |
% of Net Revenue |
Dollars in Millions |
% of
Net Revenue |
|||||||||||||
| Revenue: |
||||||||||||||||
| Managed services |
$ | 54.1 | 64 | % | $ | 49.8 | 51 | % | ||||||||
| Consulting services |
17.7 | 21 | % | 30.0 | 31 | % | ||||||||||
| Services revenue |
71.8 | 85 | % | 79.8 | 82 | % | ||||||||||
| Product |
12.6 | 15 | % | 17.8 | 18 | % | ||||||||||
| Net revenue |
84.4 | 100 | % | 97.6 | 100 | % | ||||||||||
| Reimbursed expenses |
3.7 | 4.0 | ||||||||||||||
| Total revenue |
$ | 88.1 | $ | 101.6 | ||||||||||||
Net revenue is total revenue excluding reimbursable expenses that are billed to our clients. Our net revenue decreased 14% to $84.4 million in fiscal year 2010, a decrease of $13.2 million from $97.6 million in fiscal year 2009.
Revenue from Managed services was $54.1 million in fiscal year 2010, an increase of $4.3 million, or 9%, from $49.8 million in fiscal year 2009. The increase in revenue from Managed services resulted from substantially higher Behavioral Analytics™ Service revenue, reflecting the transition of deployments to the subscription phase, partially offset by a decrease in revenue from our Integrated Contact Solutions Service Line. This decrease in our Integrated Contact Solutions Service Line was driven by the cancellation of several existing support agreements at the end of 2009, partially offset by additional agreements signed with new and existing clients during fiscal year 2010.
Revenue from Consulting services decreased by $12.3 million in fiscal year 2010 to $17.7 million, from $30.0 million in fiscal year 2009, a decrease of 41%. The decrease in revenue was mainly due to the decline in our traditional CRM Service Line, driven by reduced spending by our largest clients that utilize these services, and a decline in revenue from our Integrated Contact Solutions Service Line, driven by the completion of several large projects that were in progress in fiscal year 2009. Spending by our clients that utilize our Consulting services may fluctuate between periods in all Service Lines due to the short-term nature of these engagements. Revenue from Consulting services is a product of billable hours and our average billable rate. Billable hours are largely a function of our billable headcount and utilization rates. Our average billable rate increased to $170 per hour in fiscal year 2010, from $164 per hour in fiscal year 2009. This increase was the result of a higher mix of Integrated Contact Solutions Service Line projects, which have higher average billing rates than our traditional CRM Service Line. Headcount associated with our Consulting services decreased in fiscal year 2010 compared to fiscal year 2009 because of staff reductions associated with the decline in our traditional CRM Service Line and our Integrated Contact Solutions Service Line. Utilization of billable consultants, defined as billed time as a percentage of total available time, decreased to 67% for fiscal year 2010 from 68% for fiscal year 2009. This decline was due to significantly lower utilization in the first quarter of 2010 due to delays in starting several new projects.
20
Table of Contents
Revenue from the sale of Product was $12.6 million in fiscal year 2010, a decrease of $5.2 million, or 29%, from $17.8 million in fiscal year 2009. This decrease is due to the impact of signing two large contracts in fiscal year 2009. There are significant variances in size among individual engagements within this Service Line, and the Company is not always selected as the Product supplier for its engagements. We resell Product to our clients to provide a complete solution when requested, but we do not focus our sales effort on driving Product revenue. As a result, annual and quarterly Product revenue may fluctuate significantly.
The Company’s top five clients accounted for 31% of total revenue in fiscal year 2010, compared to 41% in fiscal year 2009. The top 10 clients accounted for 45% of total revenue in fiscal year 2010, compared to 57% in fiscal year 2009. The top 20 clients accounted for 67% of total revenue in fiscal year 2010, compared to 76% of total revenue in fiscal year 2009. In fiscal year 2010, there were no clients that accounted for 10% or more of total revenue. One client, Sears Holdings Management Corporation, accounted for 15% of total revenue in fiscal year 2009. Higher concentration of revenue with a single client or a limited group of clients creates increased revenue risk if one of these clients significantly reduces its demand for our services.
Cost of Revenue Before Reimbursed Expenses, Exclusive of Depreciation and Amortization
Cost of revenue before reimbursed expenses includes Cost of services and Cost of product, each of which is discussed below.
Cost of Services
Cost of services primarily consists of labor costs, including salaries, fringe benefits, and incentive compensation of our delivery personnel and Selling, general, and administrative personnel working on direct, revenue generation activities and third-party pass through costs related to our Managed services. Cost of services also includes employee costs for travel expenses, training, laptop computer leases, and other expenses of a non-billable nature. Cost of services excludes depreciation and amortization.
Cost of services in fiscal year 2010 was $43.3 million, or 60% of Services revenue, compared to $52.4 million, or 66% of Services revenue, in fiscal year 2009. The decrease in cost was largely due to lower internal and external resource costs of $9.2 million, lower travel expenses of $0.7 million, and lower outside services expense of $0.6 million driven mainly by lower Consulting services revenue. Lower cost deferrals for the Behavioral Analytics™ Service, net of amortized implementation costs of $1.1 million partially offset this decrease. The Cost of services percentage decreased primarily due to the impact of lower costs of 5% and a higher average bill rate of 1%.
Cost of Product
Cost of product is the amount we pay our vendors for the third-party software and hardware that we resell, primarily through our Integrated Contact Solutions Service Line. Primary factors affecting Cost of product are Product revenue levels, the vendor–specific mix of the products we resell within a period and our ability to qualify for rebates from Cisco, our largest product vendor.
Rebates fluctuate with the volume of Cisco product sold, and are based on a percentage of our cost for the product. Eligibility for these rebates is determined by our ability to meet vendor-established performance criteria, some of which are outside of our control. We recognize these rebates as they are earned, because we have consistently met established criteria and can estimate the value of these rebates.
Cost of product in fiscal year 2010 was $10.4 million, or 82% of Product revenue, compared to $14.8 million, or 83% of Product revenue in fiscal year 2009. The cost decrease corresponds to the decrease in Product revenue. The percentage decrease was primarily due to the mix of vendor-specific products sold in fiscal year 2010.
21
Table of Contents
Selling, General and Administrative
Selling, general and administrative expenses consist primarily of salaries, incentive compensation, commissions, and employee benefits for business development, account management, solution development/support, marketing, and administrative personnel, as well as facilities costs, a provision for uncollectible amounts, and costs for our technology infrastructure and applications. The personnel costs included here are net of any labor costs directly related to the generation of revenue, which are represented in Cost of services.
Selling, general and administrative expenses increased $3.1 million, or 9%, to $38.3 million in fiscal year 2010 from $35.2 million in fiscal year 2009. This increase is primarily due to increased personnel costs to support the growth in our Behavioral Analytics™ Service Business Unit.
Severance and Related Costs
In 2010 and 2009, in response to the overall business environment, a number of cost reduction activities were undertaken, principally consisting of personnel reductions. Cash savings related to cost reduction actions taken in fiscal year 2010 are anticipated to be $7.3 million annually. The cost reduction actions taken in fiscal year 2009 resulted in annual cash savings of $4.5 million. All severance and related costs associated with cost reduction activities are to be paid out by the end of the first quarter of 2011, pursuant to agreements entered into with affected employees. Facility costs related to office space reductions and office closures in 2008 will be paid pursuant to contractual lease terms through fiscal year 2015.
Severance and related costs was $1.2 million in fiscal year 2010 and $1.3 million in fiscal year 2009, respectively. The $1.2 million of expense recorded in fiscal year 2010 primarily related to restructuring actions taken in 2010 for the elimination of sixty-three positions. In fiscal year 2009, the Company recorded $1.3 million of expense primarily related to the elimination of thirty-four positions and an adjustment to sublease recoveries.
Depreciation
Depreciation decreased $0.1 million, or 2%, to $4.1 million in fiscal year 2010 compared to $4.2 million in fiscal year 2009. The decrease in depreciation is primarily related to assets becoming fully amortized, partially offset by our continued investment in our Behavioral Analytics™ Service Line.
Amortization of Intangibles
Amortization of intangibles decreased $0.1 million, or 50%, to $0.1 million in fiscal year 2010 compared to $0.2 million in fiscal year 2009. The decrease in amortization is primarily due to the Marketing Managed Services customer contracts becoming fully amortized in 2009.
Operating Loss
Primarily as a result of the factors described above, we experienced an operating loss of $13.0 million for fiscal year 2010, compared to an operating loss of $10.6 million for fiscal year 2009.
Interest and Other (Expense) Income, Net
Non-operating interest and other (expense) income decreased by $0.2 million, to $0.1 million of expense in fiscal year 2010 from $0.1 million of income in fiscal year 2009. In fiscal year 2010, the $0.1 million of expense was primarily related to interest expense for our capital lease obligations. In fiscal year 2009, the $0.1 million of income was primarily due to a gain on the sale of equity securities in a publicly-traded company for $0.3 million, partially offset by $0.2 million of interest expense for our capital lease obligations and lower average yields on our investments.
Income Tax Provision
The income tax provision was $0.1 million in fiscal year 2010 and less than $0.1 million in fiscal year 2009, respectively. As of January 1, 2011, net deferred tax assets of $62.7 million were fully offset by a valuation allowance. The level of uncertainty in predicting when we will achieve profitability, sufficient to utilize our net U.S. and non-U.S. operating losses and realize our remaining deferred tax assets, requires that an income tax valuation allowance be recognized in the financial statements.
Loss on Discontinued Operations
The loss on discontinued operations was $0.1 million for fiscal year 2010, and less than $0.1 million for fiscal year 2009. The loss on discontinued operations for both fiscal years 2010 and 2009 was related to the sale of a subsidiary in Switzerland.
Net Loss Available to Common Stockholders
We reported a net loss available to common stockholders of $14.6 million in fiscal year 2010 compared to a net loss available to common stockholders of $11.9 million in fiscal year 2009. These losses include accrued dividends to preferred stockholders of $1.3 million in both fiscal years 2010 and 2009. The net loss was $1.06 per share on a basic and diluted basis in fiscal year 2010, compared to a net loss of $0.90 per share on a basic and diluted basis in fiscal year 2009.
22
Table of Contents
Year Ended December 26, 2009 Compared with the Year Ended December 27, 2008
Net Revenue
| For the Fiscal Years Ended | ||||||||||||||||
| December 26, 2009 | December 27, 2008 | |||||||||||||||
| Dollars in Millions |
% of Net Revenue |
Dollars in Millions |
% of Net Revenue |
|||||||||||||
| Revenue: |
||||||||||||||||
| Managed services |
$ | 49.8 | 51 | % | $ | 42.1 | 48 | % | ||||||||
| Consulting services |
30.0 | 31 | % | 35.7 | 41 | % | ||||||||||
| Services revenue |
79.8 | 82 | % | 77.8 | 89 | % | ||||||||||
| Product |
17.8 | 18 | % | 9.8 | 11 | % | ||||||||||
| Net revenue |
97.6 | 100 | % | 87.6 | 100 | % | ||||||||||
| Reimbursed expenses |
4.0 | 3.6 | ||||||||||||||
| Total revenue |
$ | 101.6 | $ | 91.2 | ||||||||||||
Net revenue is total revenue excluding reimbursable expenses that are billed to our clients. Our net revenue increased 11% to $97.6 million in fiscal year 2009, an increase of $10.0 million from $87.6 million in fiscal year 2008.
Revenue from Managed services was $49.8 million in fiscal year 2009, an increase of $7.7 million, or 18%, from $42.1 million in fiscal year 2008. The increase in revenue from Managed services resulted from substantially higher Behavioral Analytics™ Service revenue, reflecting the transition of deployments to the subscription phase and the continued growth of support and maintenance revenue from new and existing clients in our Integrated Contact Solutions Service Line.
Revenue from Consulting services decreased by $5.7 million in fiscal year 2009 to $30.0 million, from $35.7 million in fiscal year 2008, a decrease of 16%. The decrease in revenue was mainly due to a 44% decline in our traditional CRM Service Line, driven by reduced spending by our largest clients that utilize these services. Revenue from Consulting services from our Integrated Contact Solutions Service Line in fiscal year 2009 increased 21% compared to fiscal year 2008. This increase was primarily driven by the impact of several large contracts signed in the first half of 2009. Spending by our clients that utilize our Consulting services may fluctuate between periods in all Service Lines due to the short-term nature of these engagements. Revenue from Consulting services is a product of billable hours and our average billable rate. Billable hours are largely a function of our billable headcount and utilization rates. eLoyalty’s average billable rate increased to $164 in fiscal year 2009 from $157 in fiscal year 2008. This increase was the result of a higher mix of Integrated Contact Solutions Service Line projects, which have higher average bill rates than our traditional CRM Service Line. Headcount associated with our Consulting services decreased in fiscal year 2009 compared to fiscal year 2008 because of staff reductions associated with the decline in our traditional CRM Service Line. Utilization of billable consultants, defined as billed time as a percentage of total available time, decreased to 68% for fiscal year 2009 from 71% for fiscal year 2008.
Revenue from the sale of Product was $17.8 million in fiscal year 2009, an increase of $8.0 million from $9.8 million in fiscal year 2008. This increase was due to the signing of two large contracts in fiscal year 2009. There are significant variances in size among individual engagements within this Service Line, and the Company is not always selected as the Product supplier for the engagement. We resell Product to our clients to provide a complete solution when requested, but we do not focus our sales effort on driving Product revenue. As a result, annual and quarterly Product revenue may fluctuate significantly.
The Company’s top 5 clients accounted for 41% of total revenue in fiscal year 2009, compared to 37% in fiscal year 2008. The top 10 clients accounted for 57% of total revenue in fiscal year 2009, compared to 50% in fiscal year 2008. The top 20 clients accounted for 76% of total revenue in fiscal year 2009, compared to 70% of total revenue in fiscal year 2008. One client, Sears Holdings Management Corporation, accounted for 15% of total revenue in fiscal year 2009. United HealthCare Services, Inc. accounted for 17% of total revenue in fiscal year 2008. There were no other clients that accounted for 10% or more of total revenue in either period. Higher concentration of revenue with a single client or a limited group of clients creates increased revenue risk if one of these clients significantly reduces its demand for our services.
Cost of Revenue Before Reimbursed Expenses, Exclusive of Depreciation and Amortization
Cost of revenue before reimbursed expenses includes Cost of services and Cost of product, each of which is discussed below.
23
Table of Contents
Cost of Services
Cost of services primarily consists of labor costs, including salaries, fringe benefits, and incentive compensation of our delivery personnel and Selling, general, and administrative personnel working on direct, revenue generation activities and third-party pass through costs related to our Managed services. Cost of services also includes employee costs for travel expenses, training, laptop computer leases, and other expenses of a non-billable nature. Cost of services excludes depreciation and amortization.
Cost of services in fiscal year 2009 was $52.4 million, or 66% of Services revenue, compared to $53.6 million, or 69% of Services revenue, in fiscal year 2008. The decrease in cost was largely due to lower internal and external resource costs of $3.5 million, partially offset by decreased cost deferrals for the Behavioral Analytics™ Service, net of amortized implementation costs of $0.8 million, and an increase in third-party support costs that related to the increase in Integrated Contact Solutions Managed services revenue of $1.5 million. The Cost of services percentage decreased primarily due to the impact of lower costs of 3%, higher average bill rate of 1%, which was partially offset by lower utilization of our Consulting services resources of 1%.
Cost of Product
Cost of product is the amount we pay our vendors for the third-party software and hardware that we resell, primarily through our Integrated Contact Solutions Service Line. Primary factors affecting Cost of product are Product revenue levels, the vendor–specific mix of the products we resell within a period and our ability to qualify for rebates from Cisco, our largest product vendor.
Rebates fluctuate with the volume of Cisco product sold, and are based on a percentage of our cost for the product. Eligibility for these rebates is determined by our ability to meet vendor-established performance criteria, some of which are outside of our control. We recognize these rebates as they are earned as we have consistently met established criteria and can estimate the value of these rebates.
Cost of product in fiscal year 2009 was $14.8 million, or 83% of Product revenue, compared to $7.9 million, or 81% of Product revenue in fiscal year 2008. The cost increase corresponds to the increase in Product revenue. The percentage increase was primarily due to the mix of vendor-specific products sold in fiscal year 2009.
Selling, General and Administrative
Selling, general and administrative expenses consist primarily of salaries, incentive compensation, commissions, and employee benefits for business development, account management, solution development/support, marketing, and administrative personnel, as well as facilities costs, a provision for uncollectible amounts, and costs for our technology infrastructure and applications. The personnel costs included here are net of any labor costs directly related to the generation of revenue, which are represented in Cost of services.
Selling, general and administrative expenses decreased $6.0 million to $35.2 million in fiscal year 2009 from $41.2 million in fiscal year 2008. This decrease was primarily a factor of lower personnel costs of $4.3 million related to headcount and salary reductions and other restructuring actions, reduced outside services expense of $1.1 million, and reduced office space of $0.4 million.
Severance and Related Costs
In 2009, in response to the overall business environment, a number of cost reduction activities were undertaken, principally consisting of personnel reductions. In 2008 and prior periods, a number of cost reduction activities were undertaken, principally consisting of personnel reductions and reduced leased office space. Cash savings related to cost reduction actions taken in fiscal year 2009 resulted in annual cash savings of $4.5 million. The cost reduction actions taken in fiscal year 2008 resulted in annual cash savings of $4.0 million. Substantially all severance and related costs associated with cost reduction activities were paid out by the end of the first quarter of 2010, pursuant to agreements entered into with affected employees. Facility costs related to office space reductions and office closures in 2008 will be paid pursuant to contractual lease terms through fiscal year 2015. See Note Three “Severance and Related Costs” of the “Notes to Consolidated Financial Statements” included in Part II Item 8 of this Form 10-K.
Severance and related costs were $1.3 million in fiscal year 2009 compared to $1.6 million in fiscal year 2008. The $1.3 million of expense recorded in fiscal year 2009 primarily related to restructuring actions taken in 2009 for the elimination of thirty-four positions and an adjustment to sublease recoveries. In fiscal year 2008, the Company recorded $1.6 million of expense primarily related to restructuring actions of $1.1 million for the elimination of thirty positions and $0.5 million for the reduction of leased office space.
Depreciation
Depreciation increased $0.4 million, or 11%, to $4.2 million in fiscal year 2009 compared to $3.8 million in fiscal year 2008. The increase in depreciation was primarily related to an increased rate of investment in our Behavioral Analytics™ Service Line.
Amortization of Intangibles
Amortization of intangibles decreased $0.1 million, or 33%, to $0.2 million in fiscal year 2009 compared to $0.3 million in fiscal year 2008. The decrease in amortization was primarily due to the Marketing Managed Services customer contracts becoming fully amortized.
24
Table of Contents
Operating Loss
Primarily as a result of the factors described above, we experienced an operating loss of $10.6 million for fiscal year 2009, compared to an operating loss of $21.0 million for fiscal year 2008.
Interest and Other Income, Net
Non-operating interest and other income was $0.1 million in both fiscal years 2009 and 2008. In fiscal year 2009, the $0.1 million of income was primarily due to a gain on the sale of equity securities in a publicly-traded company for $0.3 million and interest income partially offset by interest expense for our capital lease obligations. In fiscal year 2008, the $0.1 million of income was primarily related to interest income of $0.5 million partially offset by interest expense for our capital lease obligations.
Income Tax Provision
The income tax provision was less than $0.1 million in both fiscal years 2009 and 2008. As of December 26, 2009, net deferred tax assets of $58.4 million were offset by a valuation allowance. The level of uncertainty in predicting when we will achieve profitability, sufficient to utilize our net U.S. and non-U.S. operating losses and realize our remaining deferred tax assets, requires that an income tax valuation allowance be recognized in the financial statements.
Loss on Discontinued Operations
The loss on discontinued operations was less than $0.1 million for fiscal year 2009 and related to the sale of a subsidiary in Switzerland. In fiscal year 2008, the loss on discontinued operations related to the closure of a subsidiary in France and was $0.7 million.
Net Loss Available to Common Stockholders
We reported a net loss available to common stockholders of $11.9 million in fiscal year 2009 compared to a net loss available to common stockholders of $22.9 million in fiscal year 2008. These losses included accrued dividends to preferred stockholders of $1.3 million in both fiscal years 2009 and 2008. The net loss was $0.90 per share on a basic and diluted basis in fiscal year 2009, compared to a net loss of $2.21 per share on a basic and diluted basis in fiscal year 2008.
Liquidity and Capital Resources
Introduction
Our principal capital requirements are to fund working capital needs, capital expenditures for our Behavioral Analytics™ Service Line and infrastructure requirements, and other revenue generation and growth investments. As of January 1, 2011, our principal capital resources consisted of (1) our cash and cash equivalents balance of $20.9 million, which includes $1.6 million in foreign bank accounts, (2) restricted cash of $2.5 million, and (3) the remaining $2.5 million under the Bank Facility, as defined below.
Our cash and cash equivalents position decreased $8.1 million, or 28%, as of January 1, 2011, from $29.0 million as of December 26, 2009. The decrease in cash in fiscal year 2010 was primarily the result of the net loss before depreciation, amortization and stock-based compensation, capital expenditures, cash dividend payments on Series B Stock, acquisition of treasury stock, and capital lease principal payments, partially offset by lower working capital requirements. Restricted cash decreased $1.2 million, to $2.5 million in fiscal year 2010, compared to $3.7 million for fiscal year 2009, and was primarily used as collateral for letters of credit issued in support of future capital lease obligations. See “Bank Facility” below for a description of the contractual requirements related to restricted cash.
Cash Flows from Operating Activities
The Company used $3.0 million of cash during fiscal year 2010 and generated $7.7 million of cash in operating activities during fiscal year 2009. During fiscal year 2010, cash outflows of $3.0 million from operating activities consisted primarily of the net loss before depreciation, amortization, and stock-based compensation, and an increase in prepaid costs of $6.3 million, which primarily consist of costs associated with unearned revenue, partially offset by unearned revenue of $10.2 million as a result of customer prepayments.
During fiscal year 2009, cash flows of $7.7 million from operating activities consisted primarily of higher unearned revenue of $13.1 million as a result of customer prepayments, partially offset by higher prepaid costs of $6.4 million which primarily consist of costs associated with the increase in unearned revenue.
Days Sales Outstanding (“DSO”) was 34 days at January 1, 2011 compared to 35 days at December 26, 2009, an improvement of one day. We do not expect any significant collection issues with our clients; see “Accounts Receivable Customer Concentration” for additional information on cash collections. As of January 1, 2011, there remained $0.3 million of unpaid severance and related costs. See Note Three “Severance and Related Costs” of the “Notes to Consolidated Financial Statements” included in Part II Item 8 to this Form 10-K.
25
Table of Contents
Cash Flows from Investing Activities
The Company used $2.4 million and $3.0 million of cash in investing activities during fiscal year 2010 and 2009, respectively. Capital expenditures of $2.8 million were primarily used to purchase computer hardware and software during fiscal year 2010. During 2010, proceeds from the sale/leaseback of assets were $0.4 million. Capital expenditures of $3.3 million were primarily used to purchase computer hardware and software during fiscal year 2009, offset by the sale of $0.3 million of short-term investments in 2009. We currently expect our capital investments to be between $4.0 million and $5.0 million for fiscal year 2011 and plan on funding approximately 85% of these purchases with capital leases.
Cash Flows from Financing Activities
The Company used $2.7 million and $2.8 million of cash in financing activities during fiscal year 2010 and 2009, respectively. Net cash outflows of $2.7 million during fiscal year 2010 were primarily attributable to $1.7 million of principal payments under our capital lease obligations, $1.3 million for cash dividend payments on Series B Stock, and $1.2 million of cash used to acquire treasury stock, offset by a decrease in restricted cash of $1.3 million. Net cash outflows of $2.8 million during fiscal year 2009 were primarily attributable to $1.4 million of principal payments under our capital lease obligations, $0.8 million of cash used to acquire treasury stock, and $0.6 million for cash dividend payments on Series B Stock. The treasury stock acquired in each year reflects shares that were obtained to meet employee tax obligations associated with stock award vestings.
During the first half of 2010, the Company’s Board of Directors declared a cash dividend of $0.1785 per share on the Series B Stock, which was paid on July 1, 2010. The dividend payments for the periods July 1, 2010 through December 31, 2010 and July 1, 2008 through December 31, 2008, payable on January 3, 2011 and January 1, 2009, respectively, were suspended to conserve cash. The amount of the semiannual dividend due at each time was $0.6 million and remains unpaid. Under the terms of the Preferred Stock agreement, unpaid dividends are cumulative and accrue at the rate of 7% per annum. Payment of future dividends on the Series B Stock will be determined by the Company’s Board of Directors based on the Company’s outlook and macroeconomic conditions. The amount of each dividend accrual will be decreased by any conversions of the Series B Stock into Common Stock, as such conversions require us to pay accrued but unpaid dividends at the time of conversion. The Company expects to continue to acquire treasury stock between $0.3 million and $0.4 million during the first quarter of 2011 to meet employee tax obligations associated with the various stock-based compensation programs.
Liquidity
Our near-term capital resources consist of our current cash balance, together with anticipated future cash flows and financing from capital leases. Our balance of cash and cash equivalents was $20.9 million as of January 1, 2011. In addition, our restricted cash of $2.5 million with Bank of America (the “Bank”) at January 1, 2011 is available to support letters of credit issued under our credit facility (as described below) and collateral requirements for our capital lease agreements.
We anticipate that our current unrestricted cash resources, together with operating revenue and capital lease financing, should be sufficient to satisfy our short-term working capital and capital expenditure needs for the next twelve months. Management will continue to assess opportunities to maximize cash resources by actively managing our cost structure and closely monitoring the collection of our accounts receivable. If, however, our operating activities, capital expenditure requirements, or net cash needs differ materially from current expectations due to uncertainties surrounding the current capital market, credit and general economic conditions, competition, or the suspension or cancellation of a large project, then there is no assurance that we would have access to additional external capital resources on acceptable terms.
After giving effect to our payment of estimated transaction fees and expenses and before giving effect to purchase price adjustments set forth in the Acquisition Agreement, we estimate that the net cash proceeds from our sale of the Integrated Contact Solutions Business Unit will be approximately $38.9 million. The purchase price adjustments set forth in the Acquisition Agreement will cause the actual amount of net cash proceeds to vary from this estimate. The purchase price adjustments include certain net managed services prepaid amounts that we will contribute to the Integrated Contact Solutions Business Unit at closing, which amounts were equal to approximately $11.7 million as of January 1, 2011. We intend to use a portion of the net proceeds to support the development of our Behavioral Analytics™ Service Business Unit, which will be our only remaining business, and for general corporate purposes. If the sale is consummated, we anticipate that the net proceeds, together with our current unrestricted cash resources, should be sufficient to satisfy our short-term working capital and capital expenditure needs for the Behavioral Analytics™ Service Business Unit over the next twelve months.
Bank Facility
The Company is a party to a loan agreement with the Bank, which expires on December 31, 2011. The maximum principal amount of the secured line of credit under the agreement (the “Facility”) is $5.0 million as of January 1, 2011. The Facility requires the Company to maintain a minimum cash and cash equivalent balance within a secured account at the Bank. The Facility provides that the balance in the secured account cannot be less than the outstanding balance drawn on the Facility and letter of credit obligations under the Facility. Available credit under the Facility has been reduced by $2.5 million due to letters of credit issued under the Facility to support our capital lease obligations. As a result, $2.5 million remains available under the Facility at January 1, 2011. Loans under the Facility bear interest at the Bank’s prime rate or, at the Company’s election, an alternate rate of LIBOR (London InterBank Offering Rate) plus 0.75%. We did not have any borrowings or interest expense under the Facility during fiscal year 2010 or 2009. See Note Eleven “Line of Credit” of the “Notes to Consolidated Financial Statements” included in Part II Item 8 of this Form 10-K.
26
Table of Contents
Accounts Receivable Customer Concentration
As of January 1, 2011, one client, Los Angeles Department of Water and Power, accounted for 13%, of total gross accounts receivable. Of that amount, we have collected 59% from Los Angeles Department of Water and Power through March 11, 2011. Of the total January 1, 2011 gross accounts receivable, we have collected 75% as of March 11, 2011. Because we have a high percentage of our revenue dependent on a relatively small number of clients, delayed payments by a few of our larger clients could result in a reduction of our available cash.
Capital Lease Obligations
Capital lease obligations as of January 1, 2011 and December 26, 2009 were $2.4 million and $2.7 million, respectively. We are a party to a capital lease agreement with a lease company to lease hardware and software. In 2009 and prior years, the Company was required to issue an irrevocable letter of credit for a portion of the lease amount as additional consideration for the duration of the executed lease agreement. In 2010, newly executed leases do not require an irrevocable letter of credit. We expect capital lease obligations to increase between $3.5 million to $4.5 million for fiscal year 2011 as we continue to expand our investment in the infrastructure for the Behavioral Analytics™ Service.
Contractual Obligations
Cash will also be required for operating leases and non-cancelable purchase obligations as well as various commitments reflected as liabilities on our balance sheet as of January 1, 2011. These commitments are as follows:
| (In millions) Contractual Obligations |
Total | Less Than 1 Year |
1 – 3 Years |
3 – 5 Years |
More Than 5 Years |
|||||||||||||||
| Letters of credit |
$ | 2.5 | $ | 2.2 | $ | 0.3 | $ | — | $ | — | ||||||||||
| Operating leases |
2.2 | 1.3 | 0.6 | 0.3 | — | |||||||||||||||
| Capital leases |
2.7 | 1.6 | 1.1 | — | — | |||||||||||||||
| Severance and related costs |
0.4 | 0.1 | 0.2 | 0.1 | — | |||||||||||||||
| Purchase obligations |
4.7 | 4.7 | — | — | — | |||||||||||||||
| Total |
$ | 12.5 | $ | 9.9 | $ | 2.2 | $ | 0.4 | $ | — | ||||||||||
Due to the existence of the Company’s net operating loss carryforward as described in Note Seven “Income Taxes” of the “Notes to Consolidated Financial Statements” included in Part II Item 8 of this Form 10-K, no net tax contractual obligations exist as of January 1, 2011.
Letters of Credit
The amounts set forth in the chart above reflect standby letters of credit issued as collateral for capital leases. The terms of the Facility require us to deposit a like amount of cash into a restricted cash account at the Bank for the duration of the letter of credit commitment period. The amounts set forth in the chart above reflect the face amount of these letters of credit that expire in each period presented. To the extent these letters of credit expire without a claim being made, the cash deposited in the restricted cash account will be transferred back to an unrestricted cash account.
Leases
The amounts set forth in the chart above reflect future principal, interest, and executory costs of the leases entered into by the Company for technology and office equipment, as well as office and data center space. Liabilities for the principal portion of the capital lease obligations are reflected on our balance sheet as of January 1, 2011 and December 26, 2009.
Severance and Related Costs
Severance and related costs reflect payments the Company is required to make in future periods for severance and other related costs due to cost reduction activities in fiscal year 2010 and prior periods. Liabilities for these required payments are reflected on our balance sheet as of January 1, 2011 and December 26, 2009. The amounts listed have not been reduced by the estimated minimum sublease rentals of $0.1 million and $0.2 million included in the liabilities reflected on our balance sheet as of January 1, 2011 and December 26, 2009, respectively.
Purchase Obligations
Purchase obligations include $3.0 million of commitments reflected as liabilities on our balance sheet as of January 1, 2011, as well as $1.7 million of non-cancellable obligations to purchase goods or services in the future. Purchase obligations include $4.2 million of commitments reflected as liabilities on our balance sheet as of December 26, 2009, as well as $1.9 million of non-cancellable obligations to purchase goods or services in the future.
27
Table of Contents
Recent Accounting Pronouncements
In October 2009, the FASB issued Accounting Standards Updates (“ASU”) No. 2009-13, Revenue Recognition (ASC Topic 605) – Multiple-Deliverable Revenue Arrangements, a consensus of the FASB Emerging Issues Task Force. This guidance modifies the fair value requirements of ASC subtopic 605-25, Revenue Recognition-Multiple Element Arrangements, by allowing the use of the “best estimate of selling price” in addition to VSOE and vendor objective evidence (“VOE”) (now referred to as TPE, standing for third-party evidence) for determining the selling price of a deliverable. A vendor is now required to use its best estimate of the selling price when VSOE or TPE of the selling price cannot be determined. In addition, the residual method of allocating arrangement consideration is no longer permitted.
In October 2009, the FASB also issued ASU No. 2009-14, Software (ASC Topic 985) – Certain Revenue Arrangements That Include Software Elements, a consensus of the FASB Emerging Issues Task Force. This guidance modifies the scope of ASC subtopic 965-605, Software-Revenue Recognition, to exclude from its requirements (a) non-software components of tangible products and (b) software components of tangible products that are sold, licensed, or leased with tangible products when the software components and non-software components of the tangible product function together to deliver the tangible product’s essential functionality.
ASU No. 2009-13 and ASU No. 2009-14 also require expanded qualitative and quantitative disclosures and are effective for fiscal years beginning on or after June 15, 2010. We have elected to adopt these updates effective for our fiscal year beginning January 2, 2011 and we will apply them prospectively from that date for new or materially modified arrangements. We do not expect the adoption of this guidance to have a material impact on our consolidated financial statements.
In January 2010, the FASB issued ASU No. 2010-06, which provides new guidance related to the disclosures about transfers into and out of Levels 1 and 2 fair value classifications and separate disclosures about purchases, sales, issuances, and settlements relating to the Level 3 fair value classification. The Company’s financial assets and liabilities are typically measured using Level 1 inputs. The new guidance also clarifies existing fair value disclosures about the level of disaggregation and about inputs and valuation techniques used to measure the fair value. In addition, the new guidance amends guidance on employers’ disclosures about post-retirement benefit plan assets to require that disclosures be provided by classes of assets instead of by major categories of assets. The adoption of this guidance did not have an impact on our consolidated financial statements.
In February 2010, the FASB issued an amendment to the guidance on Subsequent Events, ASU No. 2010-09, which removed the requirement for an SEC registrant to disclose the date through which subsequent events are evaluated. It did not change the accounting for or disclosure of events that occur after the balance sheet date but before the financial statements are issued. This amendment was effective upon issuance. The adoption of ASU No. 2010-09 had no material effect on our consolidated financial statements.
In December 2010, the FASB issued ASU No. 2010-28, Intangibles—Goodwill and Other (ASC 350), When to Perform Step 2 of the Goodwill Impairment Test for Reporting Units with Zero or Negative Carrying Amounts ASU No. 2010-28, which modifies Step 1 of the goodwill impairment test for reporting units with zero or negative carrying amounts. For those reporting units, an entity is required to perform Step 2 of the goodwill impairment test if it is more likely than not that a goodwill impairment exists. In determining whether it is more likely than not that a goodwill impairment exists, an entity should consider whether there are any adverse qualitative factors indicating that an impairment may exist. ASU No. 2010-28 is effective for fiscal years, and interim periods within those years, beginning after December 15, 2010. We do not expect the adoption of ASU 2010-28 to have a material impact on our consolidated financial statements.
During 2010, the FASB issued several ASUs, ASU No. 2010-01 through ASU No. 2010-29, and during 2009, ASU No. 2009-02 through ASU No. 2009-17. Except for ASUs No. 2009-13, 2009-14, 2010-06, 2010-09 and 2010-28 the ASUs entail technical corrections to existing guidance or affect guidance related to specialized industries and therefore have minimal, if any, impact on the Company.
| Item 7A. | Quantitative and Qualitative Disclosures about Market Risk. |
We provide solutions to clients in a number of countries, including the United States, Australia, Canada, Germany, Ireland, and the United Kingdom. For the fiscal years ended January 1, 2011 and December 26, 2009, 4% and 5%, respectively, of our net revenue was denominated in foreign currencies. Historically, we have not experienced material fluctuations in our results of operations due to foreign currency exchange rate changes. We do not currently engage, nor is there any plan to engage, in hedging foreign currency risk.
We also have interest rate risk with respect to changes in variable interest rates on our revolving line of credit, and our cash and cash equivalents and restricted cash. Interest on the line of credit is currently based on either the Bank’s prime rate, or LIBOR, which varies in accordance with prevailing market conditions. A change in interest rate impacts the interest expense on the line of credit and cash flows. This interest rate risk will not have a material impact on our financial position or results of operations.
28
Table of Contents
| Item 8. | Financial Statements and Supplementary Data. |
INDEX TO CONSOLIDATED FINANCIAL STATEMENTS OF eLOYALTY CORPORATION
| Page | ||||
| Financial Statements: |
||||
| Report of Grant Thornton LLP Independent Registered Public Accounting Firm |
30 | |||
| Consolidated Balance Sheets — as of January 1, 2011 and December 26, 2009 |
31 | |||
| 32 | ||||
| 33 | ||||
| 34 | ||||
| 36 | ||||
| Financial Statement Schedule: |
||||
| 57 | ||||
29
Table of Contents
REPORT OF INDEPENDENT REGISTERED PUBLIC ACCOUNTING FIRM
Board of Directors and Shareholders
eLoyalty Corporation
We have audited the accompanying consolidated balance sheets of eLoyalty Corporation (a Delaware corporation) and Subsidiaries (the “Company”) as of January 1, 2011 and December 26, 2009, and the related consolidated statements of operations, changes in stockholders’ (deficit) equity and comprehensive loss, and cash flows for each of the three years in the period ended January 1, 2011. Our audits of the basic financial statements included the financial statement schedule listed in the index appearing under Schedule II- Valuation and Qualifying Accounts. We also have audited the Company’s internal control over financial reporting as of January 1, 2011 based on criteria established in Internal Control—Integrated Framework issued by the Committee of Sponsoring Organizations of the Treadway Commission (COSO). The Company’s management is responsible for these financial statements and financial statement schedule, for maintaining effective internal control over financial reporting, and for its assessment of the effectiveness of internal control over financial reporting, included in the accompanying Management’s Annual Report on Internal Control over Financial Reporting. Our responsibility is to express an opinion on these financial statements and financial statement schedule and an opinion on the Company’s internal control over financial reporting based on our audits.
We conducted our audits in accordance with the standards of the Public Company Accounting Oversight Board (United States). Those standards require that we plan and perform the audits to obtain reasonable assurance about whether the financial statements are free of material misstatement and whether effective internal control over financial reporting was maintained in all material respects. Our audits of the financial statements included examining, on a test basis, evidence supporting the amounts and disclosures in the financial statements, assessing the accounting principles used and significant estimates made by management, and evaluating the overall financial statement presentation. Our audit of internal control over financial reporting included obtaining an understanding of internal control over financial reporting, assessing the risk that a material weakness exists, and testing and evaluating the design and operating effectiveness of internal control based on the assessed risk. Our audits also included performing such other procedures as we considered necessary in the circumstances. We believe that our audits provide a reasonable basis for our opinions.
A company’s internal control over financial reporting is a process designed to provide reasonable assurance regarding the reliability of financial reporting and the preparation of financial statements for external purposes in accordance with generally accepted accounting principles. A company’s internal control over financial reporting includes those policies and procedures that (1) pertain to the maintenance of records that, in reasonable detail, accurately and fairly reflect the transactions and dispositions of the assets of the company; (2) provide reasonable assurance that transactions are recorded as necessary to permit preparation of financial statements in accordance with generally accepted accounting principles, and that receipts and expenditures of the company are being made only in accordance with authorizations of management and directors of the company; and (3) provide reasonable assurance regarding prevention or timely detection of unauthorized acquisition, use, or disposition of the company’s assets that could have a material effect on the financial statements.
Because of its inherent limitations, internal control over financial reporting may not prevent or detect misstatements. Also, projections of any evaluation of effectiveness to future periods are subject to the risk that controls may become inadequate because of changes in conditions, or that the degree of compliance with the policies or procedures may deteriorate.
In our opinion, the consolidated financial statements referred to above present fairly, in all material respects, the financial position of the Company as of January 1, 2011 and December 26, 2009, and the results of its operations and its cash flows for each of the three years in the period ended January 1, 2011 in conformity with accounting principles generally accepted in the United States of America. Also in our opinion, the related financial statement schedule, when considered in relation to the basic financial statements taken as a whole, present fairly, in all material respects, the information set forth therein.
In our opinion, the Company maintained, in all material respects, effective internal control over financial reporting as of January 1, 2011, based on criteria established in Internal Control—Integrated Framework issued by COSO.
/s/ GRANT THORNTON LLP
Chicago, Illinois
March 17, 2011
30
Table of Contents
CONSOLIDATED BALANCE SHEETS
(In thousands, except share and per share data)
| January 1, 2011 |
December 26, 2009 |
|||||||
| ASSETS: | ||||||||
| Current Assets: |
||||||||
| Cash and cash equivalents |
$ | 20,872 | $ | 28,982 | ||||
| Restricted cash |
2,460 | 3,745 | ||||||
| Receivables, net |
8,613 | 9,313 | ||||||
| Prepaid expenses |
13,746 | 10,126 | ||||||
| Other current assets |
892 | 944 | ||||||
| Total current assets |
46,583 | 53,110 | ||||||
| Equipment and leasehold improvements, net |
5,867 | 6,194 | ||||||
| Goodwill |
2,643 | 2,643 | ||||||
| Intangibles, net |
428 | 476 | ||||||
| Other long-term assets |
10,671 | 8,180 | ||||||
| Total assets |
$ | 66,192 | $ | 70,603 | ||||
| LIABILITIES AND STOCKHOLDERS’ (DEFICIT) EQUITY: | ||||||||
| Current Liabilities: |
||||||||
| Accounts payable |
$ | 2,498 | $ | 3,634 | ||||
| Accrued compensation and related costs |
3,033 | 5,762 | ||||||
| Unearned revenue |
24,212 | 20,436 | ||||||
| Other current liabilities |
4,983 | 5,067 | ||||||
| Total current liabilities |
34,726 | 34,899 | ||||||
| Long-term unearned revenue |
15,928 | 9,526 | ||||||
| Other long-term liabilities |
1,592 | 1,705 | ||||||
| Total liabilities |
52,246 | 46,130 | ||||||
| Redeemable Series B Stock, $0.01 par value; 5,000,000 shares authorized and designated; 3,549,078 and 3,616,169 shares issued and outstanding at January 1, 2011 and December 26, 2009, respectively, with a liquidation preference of $19,367 and $19,733 at January 1, 2011 and December 26, 2009, respectively |
18,100 | 18,442 | ||||||
| Stockholders’ (Deficit) Equity: |
||||||||
| Preferred stock, $0.01 par value; 35,000,000 shares authorized; none issued and outstanding |
— | — | ||||||
| Common stock, $0.01 par value; 50,000,000 shares authorized; 15,642,822 and 14,871,521 shares issued at January 1, 2011 and December 26, 2009, respectively; and 14,786,005 and 14,220,279 outstanding at January 1, 2011 and December 26, 2009, respectively |
156 | 149 | ||||||
| Additional paid-in capital |
207,985 | 203,627 | ||||||
| Accumulated deficit |
(204,139 | ) | (190,821 | ) | ||||
| Treasury stock, at cost, 856,817 and 651,242 shares at January 1, 2011 and December 26, 2009, respectively |
(4,468 | ) | (3,295 | ) | ||||
| Accumulated other comprehensive loss |
(3,688 | ) | (3,629 | ) | ||||
| Total stockholders’ (deficit) equity |
(4,154 | ) | 6,031 | |||||
| Total liabilities and stockholders’ (deficit) equity |
$ | 66,192 | $ | 70,603 | ||||
See accompanying notes to consolidated financial statements.
31
Table of Contents
CONSOLIDATED STATEMENTS OF OPERATIONS
(In thousands, except per share data)
| For the Fiscal Years Ended | ||||||||||||
| 2010 | 2009 | 2008 | ||||||||||
| Revenue: |
||||||||||||
| Services |
$ | 71,808 | $ | 79,862 | $ | 77,796 | ||||||
| Product |
12,581 | 17,780 | 9,777 | |||||||||
| Revenue before reimbursed expenses (net revenue) |
84,389 | 97,642 | 87,573 | |||||||||
| Reimbursed expenses |
3,715 | 3,971 | 3,624 | |||||||||
| Total revenue |
88,104 | 101,613 | 91,197 | |||||||||
| Operating expenses: |
||||||||||||
| Cost of services |
43,326 | 52,442 | 53,586 | |||||||||
| Cost of product |
10,360 | 14,814 | 7,945 | |||||||||
| Cost of revenue before reimbursed expenses |
53,686 | 67,256 | 61,531 | |||||||||
| Reimbursed expenses |
3,715 | 3,971 | 3,624 | |||||||||
| Total cost of revenue, exclusive of depreciation and amortization shown below: |
57,401 | 71,227 | 65,155 | |||||||||
| Selling, general and administrative |
38,273 | 35,163 | 41,182 | |||||||||
| Severance and related costs |
1,180 | 1,341 | 1,635 | |||||||||
| Depreciation |
4,074 | 4,242 | 3,845 | |||||||||
| Amortization of intangibles |
144 | 223 | 340 | |||||||||
| Total operating expenses |
101,072 | 112,196 | 112,157 | |||||||||
| Operating loss |
(12,968 | ) | (10,583 | ) | (20,960 | ) | ||||||
| Interest and other (expense) income, net |
(121 | ) | 53 | 70 | ||||||||
| Loss from continuing operations before income taxes |
(13,089 | ) | (10,530 | ) | (20,890 | ) | ||||||
| Income tax provision |
(93 | ) | (44 | ) | (15 | ) | ||||||
| Loss from continuing operations |
(13,182 | ) | (10,574 | ) | (20,905 | ) | ||||||
| Loss on discontinued operations |
(136 | ) | (46 | ) | (748 | ) | ||||||
| Net loss |
(13,318 | ) | (10,620 | ) | (21,653 | ) | ||||||
| Dividends related to Series B Stock |
(1,273 | ) | (1,292 | ) | (1,296 | ) | ||||||
| Net loss available to common stockholders |
$ | (14,591 | ) | $ | (11,912 | ) | $ | (22,949 | ) | |||
| Per common share: |
||||||||||||
| Basic loss from continuing operations |
$ | (0.96 | ) | $ | (0.80 | ) | $ | (2.02 | ) | |||
| Basic loss from discontinued operations |
$ | (0.01 | ) | $ | — | $ | (0.07 | ) | ||||
| Basic net loss available to common stockholders |
$ | (1.06 | ) | $ | (0.90 | ) | $ | (2.21 | ) | |||
| Diluted loss from continuing operations |
$ | (0.96 | ) | $ | (0.80 | ) | $ | (2.02 | ) | |||
| Diluted loss from discontinued operations |
$ | (0.01 | ) | $ | — | $ | (0.07 | ) | ||||
| Diluted net loss available to common stockholders |
$ | (1.06 | ) | $ | (0.90 | ) | $ | (2.21 | ) | |||
| Shares used to calculate basic net loss per share |
13,701 | 13,255 | 10,365 | |||||||||
| Shares used to calculate diluted net loss per share |
13,701 | 13,255 | 10,365 | |||||||||
| Stock-based compensation, primarily restricted stock, is included in individual line items above: |
||||||||||||
| Cost of services |
$ | 99 | $ | 504 | $ | 3,345 | ||||||
| Selling, general and administrative |
5,102 | 5,793 | 11,335 | |||||||||
| Severance and related costs |
76 | 248 | 103 | |||||||||
See accompanying notes to consolidated financial statements.
32
Table of Contents
CONSOLIDATED STATEMENTS OF CASH FLOWS
(In thousands)
| For the Fiscal Years Ended | ||||||||||||
| 2010 | 2009 | 2008 | ||||||||||
| Cash Flows from Operating Activities: |
||||||||||||
| Net loss |
$ | (13,318 | ) | $ | (10,620 | ) | $ | (21,653 | ) | |||
| Adjustments to reconcile net loss to net cash (used in) provided by operating activities: |
||||||||||||
| Depreciation and amortization |
4,218 | 4,465 | 4,185 | |||||||||
| Stock-based compensation |
5,201 | 6,297 | 14,680 | |||||||||
| Loss on discontinued operations |
136 | 46 | 748 | |||||||||
| (Reversal) provision for uncollectible amounts |
(78 | ) | 82 | 18 | ||||||||
| Severance and related costs |
94 | 270 | 293 | |||||||||
| Deferred income taxes |
1 | 7 | (2 | ) | ||||||||
| Changes in assets and liabilities: |
||||||||||||
| Receivables |
750 | 668 | 1,140 | |||||||||
| Prepaid expenses |
(6,311 | ) | (6,395 | ) | 1,305 | |||||||
| Other assets |
54 | (60 | ) | (523 | ) | |||||||
| Accounts payable |
(1,136 | ) | (273 | ) | 919 | |||||||
| Accrued compensation and related costs |
(2,728 | ) | 737 | (296 | ) | |||||||
| Unearned revenue |
10,200 | 13,145 | (2,362 | ) | ||||||||
| Other liabilities |
(94 | ) | (626 | ) | 112 | |||||||
| Net cash (used in) provided by operating activities |
(3,011 | ) | 7,743 | (1,436 | ) | |||||||
| Cash Flows from Investing Activities: |
||||||||||||
| Capital expenditures and other |
(2,812 | ) | (3,327 | ) | (698 | ) | ||||||
| Proceeds from sale/leaseback of assets |
423 | — | — | |||||||||
| Sale of short-term investments |
— | 337 | — | |||||||||
| Net cash used in investing activities |
(2,389 | ) | (2,990 | ) | (698 | ) | ||||||
| Cash Flows from Financing Activities: |
||||||||||||
| Principal payments under capital lease obligations |
(1,688 | ) | (1,384 | ) | (748 | ) | ||||||
| Payment of Series B Stock dividends |
(1,297 | ) | (649 | ) | (1,317 | ) | ||||||
| Acquisition of treasury stock |
(1,173 | ) | (838 | ) | (3,741 | ) | ||||||
| Decrease (increase) in restricted cash |
1,285 | (90 | ) | (1,200 | ) | |||||||
| Proceeds from stock compensation and employee stock purchase plans, net |
202 | 141 | 343 | |||||||||
| Proceeds from rights offering, net |
— | — | 14,845 | |||||||||
| Net cash (used in) provided by financing activities |
(2,671 | ) | (2,820 | ) | 8,182 | |||||||
| Effect of exchange rate changes on cash and cash equivalents |
(39 | ) | (15 | ) | (396 | ) | ||||||
| (Decrease) increase in cash and cash equivalents |
(8,110 | ) | 1,918 | 5,652 | ||||||||
| Cash and cash equivalents, beginning of period |
28,982 | 27,064 | 21,412 | |||||||||
| Cash and cash equivalents, end of period |
$ | 20,872 | $ | 28,982 | $ | 27,064 | ||||||
| Non-Cash Investing and Financing Transactions: |
||||||||||||
| Capital lease obligations incurred |
$ | 1,398 | $ | 869 | $ | 2,429 | ||||||
| Capital equipment purchased on credit |
1,398 | 869 | 2,429 | |||||||||
| Change in net unrealized security loss |
— | (108 | ) | (343 | ) | |||||||
| Supplemental Disclosures of Cash Flow Information: |
||||||||||||
| Interest paid |
$ | (157 | ) | $ | (356 | ) | $ | (536 | ) | |||
See accompanying notes to consolidated financial statements.
33
Table of Contents
CONSOLIDATED STATEMENTS OF CHANGES IN STOCKHOLDERS’ (DEFICIT) EQUITY
AND COMPREHENSIVE LOSS
(In thousands, except share data)
| Common Stock Issued | Additional Paid-in Capital |
(Accumulated Deficit) |
Treasury Stock |
Accumulated Other Compre- hensive Loss |
Total Stock- holders’ (Deficit) Equity |
|||||||||||||||||||||||
| Shares | Amount | |||||||||||||||||||||||||||
| Balance, December 29, 2007 |
9,885,458 | $ | 99 | $ | 172,483 | $ | (158,548 | ) | $ | (2,731 | ) | $ | (3,500 | ) | $ | 7,803 | ||||||||||||
| Net loss |
(21,653 | ) | (21,653 | ) | ||||||||||||||||||||||||
| Foreign currency translation |
353 | 353 | ||||||||||||||||||||||||||
| Unrealized (loss) on marketable securities |
(343 | ) | (343 | ) | ||||||||||||||||||||||||
| Comprehensive loss |
(21,643 | ) | ||||||||||||||||||||||||||
| Proceeds from rights offering, net |
2,645,395 | 26 | 14,819 | 14,845 | ||||||||||||||||||||||||
| Issuance of Common Stock related to employee stock programs |
1,941,885 | 19 | 7,897 | 7,916 | ||||||||||||||||||||||||
| Amortization/forfeitures of unearned compensation |
(296,600 | ) | (2 | ) | 8,325 | 8,323 | ||||||||||||||||||||||
| Purchase of treasury shares |
(3,741 | ) | (3,741 | ) | ||||||||||||||||||||||||
| Issuance of treasury shares |
(148,969 | ) | (1 | ) | (4,014 | ) | 4,015 | — | ||||||||||||||||||||
| Series B Stock conversions |
125,533 | 1 | 639 | 640 | ||||||||||||||||||||||||
| Series B Stock dividend |
(1,296 | ) | (1,296 | ) | ||||||||||||||||||||||||
| Balance, December 27, 2008 |
14,152,702 | $ | 142 | $ | 198,853 | $ | (180,201 | ) | $ | (2,457 | ) | $ | (3,490 | ) | $ | 12,847 | ||||||||||||
| Net loss |
(10,620 | ) | (10,620 | ) | ||||||||||||||||||||||||
| Foreign currency translation |
(31 | ) | (31 | ) | ||||||||||||||||||||||||
| Unrealized gain (loss) on marketable securities |
(108 | ) | (108 | ) | ||||||||||||||||||||||||
| Comprehensive loss |
(10,759 | ) | ||||||||||||||||||||||||||
| Issuance of Common Stock for option awards exercised |
1,000 | 3 | 3 | |||||||||||||||||||||||||
| Issuance of Common Stock related to employee stock programs |
736,482 | 7 | 461 | 468 | ||||||||||||||||||||||||
| Amortization/forfeitures of unearned compensation |
(22,031 | ) | 5,584 | 5,584 | ||||||||||||||||||||||||
| Purchase of treasury shares |
(838 | ) | (838 | ) | ||||||||||||||||||||||||
| Series B Stock conversions |
3,368 | 18 | 18 | |||||||||||||||||||||||||
| Series B Stock dividend |
(1,292 | ) | (1,292 | ) | ||||||||||||||||||||||||
| Balance, December 26, 2009 |
14,871,521 | $ | 149 | $ | 203,627 | $ | (190,821 | ) | $ | (3,295 | ) | $ | (3,629 | ) | $ | 6,031 | ||||||||||||
34
Table of Contents
eLOYALTY CORPORATION
CONSOLIDATED STATEMENTS OF CHANGES IN STOCKHOLDERS’ (DEFICIT) EQUITY
AND COMPREHENSIVE LOSS (CONTINUED)
(In thousands, except share data)
| Common Stock Issued | Additional Paid-in Capital |
(Accumulated Deficit) |
Treasury Stock |
Accumulated Other Compre- hensive Loss |
Total Stock- holders’ (Deficit) Equity |
|||||||||||||||||||||||
| Shares | Amount | |||||||||||||||||||||||||||
| Balance, December 26, 2009 |
14,871,521 | $ | 149 | $ | 203,627 | $ | (190,821 | ) | $ | (3,295 | ) | $ | (3,629 | ) | $ | 6,031 | ||||||||||||
| Net loss |
(13,318 | ) | (13,318 | ) | ||||||||||||||||||||||||
| Foreign currency translation |
(59 | ) | (59 | ) | ||||||||||||||||||||||||
| Comprehensive loss |
(13,377 | ) | ||||||||||||||||||||||||||
| Issuance of Common Stock for option awards exercised |
895 | 2 | 2 | |||||||||||||||||||||||||
| Issuance of Common Stock related to employee stock programs |
731,010 | 6 | 325 | 331 | ||||||||||||||||||||||||
| Amortization/forfeitures of unearned compensation |
(27,695 | ) | 4,963 | 4,963 | ||||||||||||||||||||||||
| Purchase of treasury shares |
(1,173 | ) | (1,173 | ) | ||||||||||||||||||||||||
| Series B Stock conversions |
67,091 | 1 | 341 | 342 | ||||||||||||||||||||||||
| Series B Stock dividend |
(1,273 | ) | (1,273 | ) | ||||||||||||||||||||||||
| Balance, January 1, 2011 |
15,642,822 | $ | 156 | $ | 207,985 | $ | (204,139 | ) | $ | (4,468 | ) | $ | (3,688 | ) | $ | (4,154 | ) | |||||||||||
See accompanying notes to consolidated financial statements.
35
Table of Contents
NOTES TO CONSOLIDATED FINANCIAL STATEMENTS
(Dollars in millions, except share and per share data)
Note One — Description of Business
eLoyalty helps its clients achieve breakthrough results with revolutionary analytics and advanced technologies that drive continuous business improvement. With a long track record of delivering proven solutions for many of the Fortune 1000 companies, the Company’s offerings include the Behavioral Analytics™ Service, Integrated Contact Solutions, and Consulting Services, aligned to enable focused business transformation.
The Company has been focused on growing and developing its business through two primary Business Units: the Behavioral Analytics™ Service and Integrated Contact Solutions. Through its Business Units, the Company generates three types of revenue: (1) Managed services revenue, which is recurring, annuity revenue from long-term (generally one- to five-year) contracts; (2) Consulting services revenue, which is generally project-based and sold on a time-and-materials or fixed-fee basis; and (3) Product revenue, which is generated through the resale of third-party software and hardware. The chart below shows the relationship between these Business Units and the types of revenue generated from each.
| Business Unit | Managed Services Revenue |
Consulting Services Revenue |
Product Revenue | |||
|
Behavioral Analytics™ Service |
Subscription and amortized deployment revenue; marketing application hosting and email fulfillment revenue |
Follow-on consulting revenue | None | |||
|
Integrated Contact Solutions |
Contact center monitoring and support revenue; remote application support revenue | System integration revenue for the Integrated Contact Solutions Service Line; consulting revenue for the traditional CRM Service Line | Hardware and software resale revenue, primarily from Cisco’s products |
On March 17, 2011, the Company entered into an Acquisition Agreement providing for the sale of all its assets used in the Integrated Contact Solutions Business Unit to a subsidiary of TeleTech Holdings, Inc. (“TeleTech”). Under the terms of the Acquisition Agreement, TeleTech will pay to the Company $40.85 million in cash at closing, subject to adjustment, and assume certain liabilities of the Integrated Contact Solutions Business Unit. The purchase price adjustments are related to working capital and prepaid managed services contracts.
The Company expects the sale of the Integrated Contact Solutions Business Unit to close in the second quarter of 2011. However, the closing of the transaction is subject to various conditions, including approval by the Company’s stockholders, the receipt of required third-party consents and approvals, and other closing conditions customary for transactions of this type. No assurances can be given that the transaction will be consummated on the terms contemplated or at all. If the transaction is consummated as proposed, then the Company will continue to operate its Behavioral Analytics™ Business Unit and will change its corporate name to Mattersight Corporation.
Note Two — Summary of Significant Accounting Policies
Fiscal Year-End
The fiscal year-end dates presented for fiscal years 2010, 2009, and 2008 are January 1, 2011, December 26, 2009, and December 27, 2008, respectively. Fiscal year 2010 consisted of fifty-three weeks instead of fifty-two weeks, which did not have a material impact on the Company’s financial position or results of operations.
Consolidation
The consolidated financial statements include the accounts of eLoyalty and all of its subsidiaries. All significant intercompany transactions have been eliminated.
Use of Estimates
The preparation of the financial statements in conformity with accounting principles generally accepted in the United States requires management to make estimates and assumptions that affect the reported amounts of assets and liabilities and disclosure of contingent assets and liabilities at the date of the financial statements and the reported amounts of revenue and expenses during the reporting period. Actual results could differ from those amounts.
36
Table of Contents
eLOYALTY CORPORATION
NOTES TO CONSOLIDATED FINANCIAL STATEMENTS — (Continued)
Reclassifications and Revisions
Certain data center expenses that have been previously reported as Selling, general and administrative have been reclassified as Cost of services within the Company’s Behavioral Analytics™ Service Business Unit. The Company believes this revised classification provided a clearer understanding of its key profit/loss drivers. As a result, the Company reclassified $2.1 million and $2.0 million for fiscal years 2009 and 2008, respectively, from Selling, general and administrative to Cost of services. These changes did not have an impact on net loss.
Revenue Recognition
Behavioral Analytics™ Service Business Unit
Behavioral Analytics™ Service Line
Managed services revenue included in the Behavioral Analytics™ Service Line consists of planning, deployment, training, and subscription fees. Planning, deployment, and training fees, which are considered to be installation fees related to long-term subscription contracts, are deferred until an installation is complete and are then recognized over the term of the applicable subscription contract. The terms of these subscription contracts generally range from three to five years. Installation costs incurred are deferred up to an amount not to exceed the amount of deferred installation revenue and additional amounts that are recoverable based on the contractual arrangement. These costs are included in Prepaid expenses and Other long-term assets. Such costs are amortized over the term of the subscription contract. Costs in excess of the foregoing revenue amount are expensed in the period incurred.
The amount of revenue generated from Behavioral Analytics™ Service subscription fees is based on a number of factors, such as the number of agents accessing the Behavioral Analytics™ System and/or the number of hours of calls analyzed during the relevant month of the term of the subscription contract. This revenue is recognized as the service is performed for the client.
Consulting services revenue included in the Behavioral Analytics™ Service Line primarily consists of fees charged to the Company’s clients to provide post-deployment follow-on consulting services, which generally consist of custom data analysis, the implementation of enhancements, and training. These follow-on consulting services are generally performed for the Company’s clients on a fixed-fee basis. Revenue is recognized as the services are performed, with performance generally assessed on the ratio of actual hours incurred to date compared to the total estimated hours over the entire term of the contract.
Marketing Managed Services Line
Marketing Managed Services revenue is derived from marketing application hosting and email fulfillment. Revenue related to hosting services is generally in the form of fixed monthly fees received from the Company’s clients and is recognized as the services are performed for each client. Any related setup fee would be recognized over the contract period of the hosting arrangement. Revenue related to email fulfillment services is recognized as the services are provided to the client, based on the number of emails distributed for the client.
Integrated Contact Solutions Business Unit
Integrated Contact Solutions Service Line
Managed services revenue included in the Integrated Contact Solutions Service Line consists of fees generated from the Company’s contact center support and monitoring services. Support and monitoring services are generally contracted for a fixed fee, and the revenue is recognized ratably over the term of the contract. Support fees that are contracted on a time-and-materials basis are recognized as the services are performed for the client.
For fixed fee Managed services contracts, where the Company provides support for third-party software and hardware, revenue is recorded at the gross amount of the sale. If the contract does not meet the requirements for gross reporting, then Managed services revenue is recorded at the net amount of the sale.
Consulting services revenue included in the Integrated Contact Solutions Service Line consists of the modeling, planning, configuring, or integrating of an Internet Protocol (“IP”) network solution within the Company’s clients’ contact center environments. These services are provided to the client on a time-and-materials or fixed-fee basis. For the integration of a system, the Company recognizes revenue as the services are performed, with performance generally assessed on the ratio of hours incurred to date compared to the total estimated hours over the entire term of the contract. For all other consulting services, the Company recognizes revenue as the services are performed for the client.
Revenue from the sale of Product, which is generated primarily from the resale of third-party software and hardware by the Company, is generally recorded at the gross amount of the sale.
37
Table of Contents
eLOYALTY CORPORATION
NOTES TO CONSOLIDATED FINANCIAL STATEMENTS — (Continued)
Within the Integrated Contact Solutions Service Line, Consulting services, Managed services, and the resale of Product may be sold and delivered together. In arrangements that include the resale of software, vendor-specific objective evidence (“VSOE”) must be determined for each of the individual elements. If VSOE does not exist for the allocation of revenue to the various elements of the arrangement, then all revenue from the arrangement is deferred until all elements of the arrangement without VSOE have been delivered to the client. Upon the delivery of the element without VSOE, revenue is allocated to this element based on the total value of the arrangement less the VSOE amounts established for the other elements. If the remaining undelivered elements are post-contract support (“PCS”) or other deliverables with similar attribution periods, then the arrangement revenue is recognized ratably over the remaining service period.
A large portion of our Integrated Contact Solutions Service Line is related to being a Cisco reseller. If we become unable to continue as a Cisco reseller, there could be a material impact to our financial results.
Traditional CRM Service Line
Consulting services revenue included in the Company’s traditional CRM Service Line consists of fees generated from the Company’s operational consulting and systems integration services or from building systems for the Company’s clients. These services are provided to the Company’s clients on a time-and-materials or fixed-fee basis. For the integration or building of a system, the Company recognizes revenue as the services are performed, with performance generally assessed on the ratio of hours incurred to date compared to the total estimated hours over the entire term of the contract. For all other consulting services, the Company recognizes revenue as the services are performed for the client.
Managed services revenue included in the traditional CRM Service Line consists of fees generated from the Company’s remote application support. Contracts for remote application support can be based on a fixed-fee or time-and-materials basis. For fixed-fee support, revenue is recognized ratably over the contract period. For time-and-material contracts, revenue is recognized as the services are provided to the client.
Multiple-element arrangements are segmented into separate earning processes when the elements have objective and reliable evidence of fair value and have value to the customer on a stand-alone basis. Revenue related to contracts with multiple elements is allocated based on the fair value of the element and is recognized in accordance with the Company’s revenue recognition policy for each type of element, as described above. If the fair value for any undelivered element cannot be established, then revenue is deferred until all elements have been delivered to the client. If PCS or similar services are the only remaining activity without established fair value, then the revenue for the entire arrangement is recognized ratably over the service period.
Reimbursed expenses revenue includes billable costs related to travel and other out-of-pocket expenses incurred while performing services for the Company’s clients. The cost of third-party product and support may be included within this category if the transaction does not satisfy the requirements for gross reporting. An equivalent amount of reimbursable expenses is included in Cost of revenue.
Payments received for Managed services contracts in excess of the amount of revenue recognized for these contracts are recorded as unearned revenue until revenue recognition criteria are met.
Cost of Revenue before Reimbursed Expenses, Exclusive of Depreciation and Amortization
Cost of services primarily consists of labor costs including salaries, fringe benefits, and incentive compensation of the Company’s delivery personnel and Selling, general and administrative personnel working on direct, revenue-generating activities and third-party pass-through costs related to the Company’s Managed services. Cost of services also includes employee costs for travel expenses, training, laptop computer leases, and other expenses of a non-billable nature. Cost of services excludes depreciation and amortization.
Selling, General and Administrative
Selling, general and administrative expenses consist primarily of salaries, incentive compensation, commissions, and employee benefits for business development, account management, solution development/support, marketing and administrative personnel, as well as facilities costs, a provision for uncollectible amounts, and costs for the Company’s technology infrastructure and applications. The personnel costs included here are net of any labor costs directly related to the generation of revenue, which are represented in Cost of services.
Loss Per Common Share
The Company calculates loss per common share in accordance with the guidance provided under Earnings per Share. The per common share basic net loss available to common stockholders has been computed by dividing the net loss available to common stockholders for each period presented by the weighted average shares outstanding. The per common share diluted loss available to common stockholders has been computed by dividing the net loss available to common stockholders by the weighted average shares outstanding plus the dilutive effect of common stock equivalents, which is primarily related to Series B Stock, using the “treasury stock” method. In periods in which there was a loss, the dilutive effect of common stock equivalents is not included in the diluted loss per share calculation as it was antidilutive.
38
Table of Contents
eLOYALTY CORPORATION
NOTES TO CONSOLIDATED FINANCIAL STATEMENTS — (Continued)
Fair Value of Financial Instruments
The carrying values of current assets and liabilities approximated their fair values as of January 1, 2011 and December 26, 2009. Fair value is an exit price and establishes a three-tier valuation hierarchy for ranking the quality and reliability of the information used to determine fair values. The first tier, Level 1, uses quoted market prices in active markets for identical assets or liabilities. Level 2 uses inputs, other than quoted market prices for identical assets or liabilities in active markets, which are observable either directly or indirectly. Level 3 uses unobservable inputs in which there are little or no market data, and requires the entity to develop its own assumptions. A financial asset or liability’s classification within the hierarchy is determined based on the lowest level input that is significant to the fair value measurement.
Cash and Cash Equivalents
The Company considers all highly liquid investments readily convertible into known amounts of cash (with original purchased maturities of three months or less) to be cash equivalents.
Restricted Cash
Restricted cash principally represents cash as security for the Company’s line of credit and letters of credit issued to support the Company’s capital lease obligations.
Concentration of Credit Risk
Financial instruments that potentially subject the Company to a concentration of credit risk consist of cash and cash equivalents, restricted cash, and receivables. Cash and cash equivalents and restricted cash consist of money market funds and deposits with high credit quality financial institutions. At times, such deposits may be in excess of the Federal Deposit Insurance Corporation insurance limit. The Company’s receivables are derived from revenue earned from clients located primarily in the U.S. and are denominated in U.S. dollars. For fiscal year 2010, there were no clients that accounted for 10% or more of total revenue. For fiscal year 2009, one client, Sears Holdings Management Corporation, accounted for 15% of total revenue. For fiscal year 2008, one client, United HealthCare Services, Inc., accounted for 17% of total revenue. As of January 1, 2011, one client, Los Angeles Department of Water and Power, accounted for 13%, of total gross accounts receivable. As of December 26, 2009, two clients accounted for 10% or more of total net receivables: United Rentals, Inc. accounted for 13% and Blue Shield of California accounted for 12%.
Equipment and Leasehold Improvements
Computers, software, furniture, and equipment are carried at cost and depreciated on a straight-line basis over their estimated useful lives. Leasehold improvements are amortized over the lesser of the useful life or the lease term. The useful life for computers and software is three years. For enterprise software applications where a longer useful life is deemed appropriate, five years is used. For furniture and equipment, a useful life of five years is used. Maintenance and repair costs are expensed as incurred. The cost and related accumulated depreciation of assets sold or disposed of are eliminated from the respective accounts and the resulting gain or loss is included in the statements of operations. The carrying value of equipment and leasehold improvements is periodically reviewed to assess recoverability based on future undiscounted cash flows. An impairment loss, if any, would be measured as the excess of the carrying value over the fair value.
The Company accounts for software developed for internal use in accordance with the guidance provided under ASC Topic 350, which addresses accounting for the costs of computer software developed or obtained for internal use. As such, costs incurred that relate to the planning and post-implementation phases of development are expensed. Costs incurred during the application development stage are capitalized and amortized over the asset’s estimated useful life, which is generally three to five years.
The Company leases certain equipment using both capital leases and operating leases. Assets leased under capital leases are recorded at the present value of future lease payments and depreciated on a straight line basis. All capital leases are for terms of either thirty or thirty-six months.
Goodwill
Goodwill is tested annually for impairment using a two-step test approach. In the first step, the fair value of each reporting unit is compared with its carrying value. If the fair value exceeds the carrying value, then goodwill is not impaired and no further testing is performed. The second step is performed if the carrying value exceeds the fair value. The implied fair value of the reporting unit’s goodwill must be determined and compared to the carrying value of the goodwill. If the carrying value of a reporting unit’s goodwill exceeds its implied fair value, then an impairment loss equal to the difference will be recorded.
A detailed determination of the fair value of a reporting unit may be carried forward from one year to the next if specific criteria have been met.
39
Table of Contents
eLOYALTY CORPORATION
NOTES TO CONSOLIDATED FINANCIAL STATEMENTS — (Continued)
There has been no impairment identified as a result of the annual review of goodwill as of January 1, 2011 and the detailed determination of fair value as of December 26, 2009. The carrying value of goodwill was $2.6 million as of January 1, 2011 and as of December 26, 2009. The Company may incur an impairment of goodwill if its financial results are negatively impacted by current economic conditions and the Company continues to incur losses or its stock price declines.
Intangible Assets
Intangible assets reflect costs related to patent and trademark applications, Marketing Managed Services customer relationships acquired in 2004, and the 2003 purchase of a license for certain intellectual property. Patent and trademark applications are amortized over 120 months. The other intangible assets are fully amortized. The original cost of intangible assets as of January 1, 2011 and December 26, 2009 was $2.9 million and $2.8 million, respectively. Accumulated amortization of intangible assets as of January 1, 2011 and December 26, 2009 was $2.4 million and $2.3 million, respectively. Currently, amortization expense of intangible assets is expected to be $0.1 million for fiscal year 2011 and $0.1 million annually thereafter.
Other Long-Term Assets
Other long-term assets primarily consist of deferred costs related to the Company’s Behavioral Analytics™ Service-related Managed services and third-party support costs related to the Company’s Integrated Contact Solutions Managed services. These costs are recognized over the terms of the respective agreements, generally one to five years. Costs included in long-term assets will be recognized over the remaining term of the agreements beyond the first twelve months.
Income Taxes
The Company uses an asset and liability approach for financial accounting and reporting of income taxes. Deferred income taxes are provided when tax laws and financial accounting standards differ with respect to the amount of income for the year, the basis of assets and liabilities and for tax loss carryforwards. The Company does not provide U.S. deferred income taxes on earnings of U.S. or foreign subsidiaries, which are expected to be indefinitely reinvested.
The Company has recorded income tax valuation allowances on its net deferred tax assets to account for the unpredictability surrounding the timing of realization of the Company’s U.S. and non-U.S. net deferred tax assets due to uncertain economic conditions. The valuation allowances may be reversed at a point in time when management determines realization of these tax assets has become more likely than not, based on a return to predictable levels of profitability.
The Company may recognize the tax benefit from an uncertain tax position only if it is more likely than not that the tax position will be sustained on examination by the taxing authorities, based on the technical merits of the position. The tax benefits recognized in the financial statements from such a position should be measured based on the largest benefit that has a greater than 50% likelihood of being realized upon ultimate settlement. Significant judgment is used to determine the likelihood of the benefit. There is additional guidance on derecognition, classification, interest and penalties on income taxes, accounting in interim periods and disclosure requirements.
Stockholders’ (Deficit) Equity
Stockholders’ (deficit) equity includes common stock issued, additional paid-in capital, accumulated deficit, treasury stock, and accumulated other comprehensive loss. The 3.5 million shares of Series B Stock are not classified as permanent equity or a liability in the accompanying balance sheets. These shares of Series B Stock are conditionally redeemable and do not meet the definition of a mandatorily redeemable financial instrument. Holders of Series B Stock have the ability to initiate a redemption upon the occurrence of certain events that are considered outside the Company’s control.
Foreign Currency Translation
The functional currencies for the Company’s foreign subsidiaries are their local currencies. All assets and liabilities of foreign subsidiaries are translated to U.S. dollars at end of period exchange rates. The resulting translation adjustments are recorded as a component of stockholders’ (deficit) equity and comprehensive income (loss). Income and expense items are translated at average exchange rates prevailing during the period. Foreign currency net losses were $0.1 million for fiscal year 2010, $0 for fiscal year 2009, and $0.4 million for fiscal year 2008. These foreign currency transactions from subsidiaries are included in interest and other income within the consolidated statements of operations.
Stock-Based Compensation
Stock-based compensation cost is measured at the grant date based on the fair value of the award and is recognized as expense over the vesting period. Determining fair value of stock-based awards at the grant date requires certain assumptions. The Company uses historical information as the primary basis for the selection of expected life, expected volatility, expected dividend yield assumptions, and anticipated forfeiture rates. The risk-free interest rate is selected based on the yields from U.S. Treasury Strips with a remaining term equal to the expected term of the options being valued.
40
Table of Contents
eLOYALTY CORPORATION
NOTES TO CONSOLIDATED FINANCIAL STATEMENTS — (Continued)
Recent Accounting Pronouncements
In October 2009, the FASB issued Accounting Standards Update (“ASU”) No. 2009-13, Revenue Recognition (ASC Topic 605) – Multiple-Deliverable Revenue Arrangements, a consensus of the FASB Emerging Issues Task Force. This guidance modifies the fair value requirements of ASC subtopic 605-25, Revenue Recognition-Multiple Element Arrangements, by allowing the use of the “best estimate of selling price” in addition to VSOE and vendor objective evidence (now referred to as TPE, standing for third-party evidence) for determining the selling price of a deliverable. A vendor is now required to use its best estimate of the selling price when VSOE or TPE of the selling price cannot be determined. In addition, the residual method of allocating arrangement consideration is no longer permitted.
In October 2009, the FASB also issued ASU No. 2009-14, Software (ASC Topic 985) – Certain Revenue Arrangements That Include Software Elements, a consensus of the FASB Emerging Issues Task Force. This guidance modifies the scope of ASC subtopic 965-605, Software-Revenue Recognition, to exclude from its requirements (a) non-software components of tangible products and (b) software components of tangible products that are sold, licensed, or leased with tangible products when the software components and non-software components of the tangible product function together to deliver the tangible product’s essential functionality.
ASU No. 2009-13 and ASU No. 2009-14 also require expanded qualitative and quantitative disclosures and are effective for fiscal years beginning on or after June 15, 2010. The Company has elected to adopt these updates effective for its fiscal year beginning January 2, 2011 and apply them prospectively from that date for new or materially modified arrangements. The Company does not expect the adoption of this guidance to have a material impact on its consolidated financial statements.
In January 2010, the FASB issued ASU No. 2010-06, which provides new guidance related to the disclosures about transfers into and out of Levels 1 and 2 fair value classifications and separate disclosures about purchases, sales, issuances, and settlements relating to the Level 3 fair value classification. The Company’s financial assets and liabilities are typically measured using Level 1 inputs. The new guidance also clarifies existing fair value disclosures about the level of disaggregation and about inputs and valuation techniques used to measure the fair value. In addition, the new guidance amends guidance on employers’ disclosures about post-retirement benefit plan assets to require that disclosures be provided by classes of assets instead of by major categories of assets. The adoption of this guidance did not have an impact on the Company’s consolidated financial statements.
In February 2010, the FASB issued an amendment to the guidance on Subsequent Events, ASU No. 2010-09, which removed the requirement for an SEC registrant to disclose the date through which subsequent events are evaluated. It did not change the accounting for or disclosure of events that occur after the balance sheet date but before the financial statements are issued. This amendment was effective upon issuance. The adoption of ASU No. 2010-09 had no material effect on the Company’s consolidated financial statements.
In December 2010, the FASB issued ASU No. 2010-28, Intangibles—Goodwill and Other (ASC 350), When to Perform Step 2 of the Goodwill Impairment Test for Reporting Units with Zero or Negative Carrying Amounts ASU No. 2010-28, which modifies Step 1 of the goodwill impairment test for reporting units with zero or negative carrying amounts. For those reporting units, an entity is required to perform Step 2 of the goodwill impairment test if it is more likely than not that a goodwill impairment exists. In determining whether it is more likely than not that a goodwill impairment exists, an entity should consider whether there are any adverse qualitative factors indicating that an impairment may exist. ASU No. 2010-28 is effective for fiscal years, and interim periods within those years, beginning after December 15, 2010. The Company does not expect the adoption of ASU 2010-28 to have a material impact on its consolidated financial statements.
During 2010, the FASB issued several ASUs, ASU No. 2010-01 through ASU No. 2010-29, and during 2009, ASU No. 2009-02 through ASU No. 2009-17. Except for ASUs No. 2009-13, 2009-14, 2010-06, 2010-09 and 2010-28 the ASUs entail technical corrections to existing guidance or affect guidance related to specialized industries and therefore have minimal, if any, impact on the Company.
Note Three — Severance and Related Costs
Severance costs are comprised primarily of contractual salary and related fringe benefits over the severance payment period. Facility costs include losses on contractual lease commitments, net of estimated sublease recoveries, and impairment of leasehold improvements, and certain office assets.
During fiscal years 2010, 2009, and 2008, the Company recognized pre-tax charges (including adjustments) of $1.2 million, $1.3 million, and $1.6 million, respectively. For fiscal year 2010, the Company recorded $1.2 million of expense related to severance and related costs for the elimination of sixty-three positions. The $1.3 million of expense recorded in fiscal year 2009 was primarily due to $1.2 million of restructuring actions taken in 2009 for the elimination of thirty-four positions and $0.1 million for an adjustment to sublease recoveries. The $1.6 million of expense recorded in fiscal year 2008 was primarily due to $1.1 million of restructuring actions taken in 2008 for the elimination of thirty positions and $0.5 million for the reduction of leased office space.
During fiscal years 2010, 2009, and 2008, the Company made cash payments of $1.2 million, $1.5 million, and $1.9 million, respectively, related to cost-reduction actions. During fiscal years 2010, 2009, and 2008 cash payments were primarily related to severance and related costs, office space reductions, and office closures. The Company expects substantially all remaining severance payments to be paid out by the first quarter of 2011 pursuant to agreements entered into with affected employees.
41
Table of Contents
eLOYALTY CORPORATION
NOTES TO CONSOLIDATED FINANCIAL STATEMENTS — (Continued)
The severance and related costs and their utilization for the fiscal years ended 2008, and 2009, and 2010 are as follows:
| Employee Severance |
Facilities | Total | ||||||||||
| Balance, December 29, 2007 |
$ | 0.8 | $ | — | $ | 0.8 | ||||||
| Charges |
1.0 | 0.5 | 1.5 | |||||||||
| Adjustments |
0.1 | — | 0.1 | |||||||||
| Charged to severance and related costs |
1.1 | 0.5 | 1.6 | |||||||||
| Payments |
(1.8 | ) | (0.1 | ) | (1.9 | ) | ||||||
| Balance, December 27, 2008 |
0.1 | 0.4 | 0.5 | |||||||||
| Charges |
1.2 | — | 1.2 | |||||||||
| Adjustments |
— | 0.1 | 0.1 | |||||||||
| Charged to severance and related costs |
1.2 | 0.1 | 1.3 | |||||||||
| Payments |
(1.3 | ) | (0.2 | ) | (1.5 | ) | ||||||
| Balance, December 26, 2009 |
— | 0.3 | 0.3 | |||||||||
| Charges |
1.2 | — | 1.2 | |||||||||
| Adjustments |
— | — | — | |||||||||
| Charged to severance and related costs |
1.2 | — | 1.2 | |||||||||
| Payments |
(1.2 | ) | — | (1.2 | ) | |||||||
| Balance, January 1, 2011 |
$ | — | $ | 0.3 | $ | 0.3 | ||||||
As of January 1, 2011, the $0.3 million that remained reserved relates to severance payments and facility lease payments, net of estimated sublease recoveries, and these lease payments will be paid pursuant to contractual lease terms through February 2015. The $0.3 million balance is apportioned among “Accrued Compensation and Related Costs”, “Other current liabilities”, and “Other long-term liabilities.” As of December 26, 2009, the $0.3 million that remained reserved relates to facility lease payments, net of estimated sublease recoveries, and these lease payments will be paid pursuant to contractual lease terms through February 2015. The $0.3 million balance is apportioned between “Other current liabilities” and “Other long-term liabilities.”
Note Four — Receivables, Net
Receivables consist of the following:
| As of | ||||||||
| January 1, 2011 |
December 26, 2009 |
|||||||
| Amounts billed to clients |
$ | 7.4 | $ | 7.7 | ||||
| Unbilled revenue |
1.3 | 1.8 | ||||||
| 8.7 | 9.5 | |||||||
| Allowances for doubtful accounts |
(0.1 | ) | (0.2 | ) | ||||
| Receivables, net |
$ | 8.6 | $ | 9.3 | ||||
Amounts billed to clients represent fees and reimbursable project-related expenses. Unbilled revenue represents fees, project-related expenses, materials, and subcontractor costs performed in advance of billings in accordance with contract terms. Unbilled revenue at January 1, 2011 and December 26, 2009 consists of amounts due from clients and is anticipated to be collected within normal terms. The Company maintains allowances for doubtful accounts for estimated losses resulting from the inability of its clients to make required payments and clients indicating their intention to dispute their obligation to pay for contractual services provided by us. If the financial condition of our clients were to deteriorate, resulting in an impairment of their ability to make payments, additional allowances may be required.
42
Table of Contents
eLOYALTY CORPORATION
NOTES TO CONSOLIDATED FINANCIAL STATEMENTS — (Continued)
Note Five — Current Prepaid Expenses
Current prepaid expenses were $13.7 million and $10.1 million as of January 1, 2011 and December 26, 2009, respectively. Current prepaid expenses primarily consist of third-party support costs related to our Integrated Contact Solutions Managed services and deferred costs related to the Behavioral Analytics™ Service. These costs are recognized over the contract terms of the respective agreements, generally one to five years. Costs included in current prepaid expenses will be recognized within the next twelve months. Current prepaid expenses consisted of the following:
| As of | ||||||||
| January 1, 2011 |
December 26, 2009 |
|||||||
| Integrated Contact Solutions prepaid third-party support costs |
$ | 9.0 | $ | 4.7 | ||||
| Behavioral Analytics™ Service deferred costs |
1.8 | 2.6 | ||||||
| Prepaid commissions |
1.4 | 1.2 | ||||||
| Other |
1.5 | 1.6 | ||||||
| Total |
$ | 13.7 | $ | 10.1 | ||||
Note Six — Equipment and Leasehold Improvements
Equipment and leasehold improvements consist of the following:
| As of | ||||||||
| January 1, 2011 |
December 26, 2009 |
|||||||
| Computers and software |
$ | 36.6 | $ | 36.4 | ||||
| Furniture and equipment |
1.2 | 1.5 | ||||||
| Leasehold improvements |
1.6 | 1.5 | ||||||
| Equipment and leasehold improvements, gross |
39.4 | 39.4 | ||||||
| Accumulated depreciation and amortization |
(33.5 | ) | (33.2 | ) | ||||
| Equipment and leasehold improvements, net |
$ | 5.9 | $ | 6.2 | ||||
Depreciation expense was $4.1 million, $4.2 million, and $3.8 million, for fiscal years 2010, 2009, and 2008, respectively. Assets acquired under capital leases were $1.4 million, $0.9 million, and $2.4 million in fiscal years 2010, 2009, and 2008, respectively. Depreciation expense on capital lease assets was $1.6 million, $1.4 million, and $0.8 million in fiscal years 2010, 2009, and 2008, respectively.
Note Seven — Income Taxes
Income (loss) before income taxes consisted of the following:
| For the Fiscal Years Ended | ||||||||||||||||
| 2010 | 2009 | 2008 | ||||||||||||||
| United States |
$ | (13.3 | ) | $ | (11.3 | ) | $ | (21.1 | ) | |||||||
| Foreign |
0.1 | 0.7 | (0.6 | ) | ||||||||||||
| Total |
$ | (13.2 | ) | $ | (10.6 | ) | $ | (21.7 | ) | |||||||
The income tax (provision) benefit consists of the following:
| For the Fiscal Years Ended | ||||||||||||||||
| 2010 | 2009 | 2008 | ||||||||||||||
| Current: |
||||||||||||||||
| Federal |
$ | — | $ | — | $ | — | ||||||||||
| State |
(0.1 | ) | — | — | ||||||||||||
| Foreign |
— | — | — | |||||||||||||
| Total current |
(0.1 | ) | — | — | ||||||||||||
| Deferred: |
||||||||||||||||
| Federal |
— | — | — | |||||||||||||
| State |
— | — | — | |||||||||||||
| Foreign |
— | — | — | |||||||||||||
| Total deferred |
— | — | — | |||||||||||||
| Income tax (provision) benefit |
$ | (0.1 | ) | $ | — | $ | — | |||||||||
43
Table of Contents
eLOYALTY CORPORATION
NOTES TO CONSOLIDATED FINANCIAL STATEMENTS — (Continued)
Total income tax (provision) benefit differed from the amount computed by applying the federal statutory income tax rate due to the following:
| For the Fiscal Years Ended | ||||||||||||||||
| 2010 | 2009 | 2008 | ||||||||||||||
| Federal tax benefit, at statutory rate |
$ | 4.8 | $ | 3.7 | $ | 7.6 | ||||||||||
| State tax benefit, net of federal benefit |
— | — | — | |||||||||||||
| Foreign tax rate differences |
— | — | — | |||||||||||||
| Nondeductible expenses |
(0.6 | ) | (0.4 | ) | (0.6 | ) | ||||||||||
| Change in tax rates |
— | — | — | |||||||||||||
| Adjustment to net operating losses |
— | — | — | |||||||||||||
| Other |
— | 0.1 | (0.3 | ) | ||||||||||||
| Valuation allowance |
(4.3 | ) | (3.4 | ) | (6.7 | ) | ||||||||||
| Income tax (provision) benefit |
$ | (0.1 | ) | $ | — | $ | — | |||||||||
The Company may recognize the tax benefit from an uncertain tax position only if it is more likely than not that the tax position will be sustained on examination by the taxing authorities, based on the technical merits of the position. The tax benefits recognized in the financial statements from such a position should be measured based on the largest benefit that has a greater than 50% likelihood of being realized upon ultimate settlement. Significant judgment is used to determine the likelihood of the benefit. There is also guidance on derecognition, classification, interest, and penalties on income taxes, accounting in interim periods, and income tax disclosures.
A reconciliation of the gross amounts of unrecognized tax benefits at the beginning and end of the year are as follows:
| For the Fiscal Years Ended | ||||||||||||||||
| 2010 | 2009 | 2008 | ||||||||||||||
| Balance at beginning of year |
$ | 12.8 | $ | 12.8 | $ | 12.8 | ||||||||||
| Additions based on tax positions related to the current year |
— | — | — | |||||||||||||
| Additions for tax positions of prior years |
— | — | — | |||||||||||||
| Reductions for tax positions of prior years |
— | — | — | |||||||||||||
| Reductions for tax positions as a result of lapse of statute |
— | — | — | |||||||||||||
| Settlements |
— | — | — | |||||||||||||
| Balance at end of year |
$ | 12.8 | $ | 12.8 | $ | 12.8 | ||||||||||
Due to the Company’s worldwide net operating loss carryforward position, these unrecognized tax benefits will not impact the Company’s effective tax rate, if recognized. Any change in the amount of unrecognized tax benefits within the next twelve months is not expected to result in a significant impact on the results of operations or the financial position of the Company.
Due to the Company’s worldwide net operating loss carryforward position, accrued interest and penalties associated with uncertain tax positions as of January 1, 2011 are not material. Interest and penalties associated with uncertain tax positions are recorded as part of income tax expense.
The statutes of limitation for the Company’s income tax returns after 2001 remain open for examination by the Internal Revenue Service (“IRS”). In addition, the net operating loss carryforward can be examined by the IRS for a period of three years after filing the tax return for the year the loss is used. The Company is currently under audit by the IRS for fiscal years 2008 and 2009. While the Company cannot predict the timing or ultimate outcome of the audit, the Company’s management believes the ultimate disposition will not have a material effect on its consolidated financial position, cash flows, or results of operations.
Foreign and U.S. state jurisdictions have statutes of limitations generally ranging from 3 to 5 years. The state impact of any federal changes remains subject to examination by various states for a period of up to one year after formal notification to the states. The Company and its subsidiaries may have various state and foreign income tax returns for immaterial jurisdictions in the process of examination throughout the reporting period.
44
Table of Contents
eLOYALTY CORPORATION
NOTES TO CONSOLIDATED FINANCIAL STATEMENTS — (Continued)
Deferred tax assets and liabilities were comprised of the following:
| As of | ||||||||
| January 1, 2011 |
December 26, 2009 |
|||||||
| Deferred tax assets: |
||||||||
| Net operating loss carryforwards |
$ | 64.9 | $ | 58.9 | ||||
| Receivable allowances |
— | 0.1 | ||||||
| Other accruals |
3.5 | 2.8 | ||||||
| Depreciation and amortization, including goodwill |
2.1 | 1.9 | ||||||
| Non-deductible reserves |
— | 0.1 | ||||||
| Tax credit carryforward |
0.5 | 0.5 | ||||||
| Valuation allowance |
(62.7 | ) | (58.4 | ) | ||||
| Total deferred tax assets |
8.3 | 5.9 | ||||||
| Deferred tax liabilities: |
||||||||
| Prepaid expenses |
(8.3 | ) | (5.9 | ) | ||||
| Total deferred tax liabilities |
(8.3 | ) | (5.9 | ) | ||||
| Net deferred tax asset (liability) |
$ | — | $ | — | ||||
Deferred income taxes are not provided on certain undistributed earnings of foreign subsidiaries that are expected to be permanently reinvested in those companies. These earnings aggregated to an immaterial amount at each of January 1, 2011 and December 26, 2009.
During fiscal year 2002, the Company established a valuation allowance related to deferred tax assets for the U.S. This is in addition to the valuation allowance established in 2001 for non-U.S. deferred tax assets. The Company continues to provide a valuation allowance on significantly all domestic and foreign deferred tax assets as the Company has determined that it is more likely than not that the deferred tax assets in these jurisdictions will not be realized. As of January 1, 2011, net deferred tax assets of $62.7 million were fully offset by a valuation allowance. The Company’s U.S. Federal net operating losses (“NOLs”) of $214.3 million and U.S. State NOLs of $95.3 million expire beginning in 2022 and 2011, respectively. The Company’s non-U.S. NOLs of $1.4 million are subject to various expiration dates beginning in 2011. The Company also carries $0.5 million in Research and Development credit carryforwards that expire beginning in 2021.
The Company’s ability to utilize its NOLs could become subject to significant limitations under Section 382 of the Internal Revenue Code if the Company were to undergo an ownership change. An ownership change would occur if the stockholders who own or have owned, directly or indirectly, 5% or more of the Company’s Common Stock or are otherwise treated as 5% stockholders under Section 382 and the regulations promulgated thereunder increase their aggregate percentage ownership of the Company’s stock by more than 50 percentage points over the lowest percentage of the stock owned by these stockholders at any time during the testing period, which is generally the three-year period preceding the potential ownership change. In the event of an ownership change, Section 382 imposes an annual limitation on the amount of taxable income a corporation may offset with NOL carryforwards. Any unused annual limitation may be carried over to later years until the applicable expiration date for the respective NOL carryforwards. The Company has undergone a Section 382 analysis and does not believe there is a limitation on the use of NOL’s under Section 382. If a change in ownership is deemed to have occurred during the past three years, then it may be possible that the Company’s NOL carryforward could be subject to limitation under Section 382 for tax return purposes. However, since its NOL carryforward is fully reserved with a valuation allowance, there would be no impact for financial statement purposes from a Section 382 limitation.
The Company was spun off from TSC into a separate, publicly-traded company on February 15, 2000. Pursuant to the Tax Sharing and Disaffiliation Agreement between TSC and the Company, TSC was liable to the Company for any income tax benefits realized by TSC related to the exercise of the Company stock options by TSC employees. With respect to the realizability of these tax benefits, the Company was dependent on TSC’s ability to realize the benefits. No benefits were realized by TSC, and accordingly, the Company did not recognize any of these benefits. On May 1, 2009, TSC filed a Certificate of Dissolution with the Secretary of State of the State of Delaware and TSC stockholders approved the announced Plan of Complete Liquidation and Dissolution of TSC on April 27, 2009. Therefore, no tax benefits are expected to be realized in the future.
45
Table of Contents
eLOYALTY CORPORATION
NOTES TO CONSOLIDATED FINANCIAL STATEMENTS — (Continued)
Note Eight — Other Long-Term Assets
Other long-term assets were $10.7 million as of January 1, 2011 and $8.2 million as of December 26, 2009. Other long-term assets primarily consist of third-party support costs related to the Company’s Integrated Contact Solutions Managed services and deferred costs related to the Behavioral Analytics™ Service. These costs are recognized over the terms of the respective agreements, generally one to five years. Costs included in long-term assets will be recognized over the remaining term of the agreements beyond the first twelve months. Other long-term assets consisted of the following:
| As of | ||||||||
| January 1, 2011 |
December 26, 2009 |
|||||||
| Integrated Contact Solutions prepaid third-party support costs |
$ | 6.7 | $ | 4.1 | ||||
| Behavioral Analytics™ Service deferred costs |
2.1 | 2.5 | ||||||
| Prepaid commissions |
1.6 | 1.3 | ||||||
| Other |
0.3 | 0.3 | ||||||
| Total |
$ | 10.7 | $ | 8.2 | ||||
Note Nine — Current Unearned Revenue
Current unearned revenue was $24.2 million as of January 1, 2011 and $20.4 million as of December 26, 2009. Current unearned revenue reflects prepayment by the Company’s clients in advance of the Company’s recognition of this revenue. Payments are generally received in advance from clients that are utilizing the Company’s Behavioral Analytics™ Service and Integrated Contact Solutions Managed services. Current unearned revenue will be recognized within the next twelve months and consisted of the following:
| As of | ||||||||
| January 1, 2011 |
December 26, 2009 |
|||||||
| Integrated Contact Solutions Managed Services |
$ | 16.2 | $ | 9.8 | ||||
| Behavioral Analytics™ Service – Managed Services |
7.8 | 10.4 | ||||||
| Other |
0.2 | 0.2 | ||||||
| Total |
$ | 24.2 | $ | 20.4 | ||||
Note Ten — Long-Term Unearned Revenue
Long-term unearned revenue was $15.9 million as of January 1, 2011 and $9.5 million as of December 26, 2009. Long-term unearned revenue reflects prepayment by the Company’s clients in advance of the Company’s recognition of this revenue. Payments are generally received in advance from clients that are utilizing the Company’s Behavioral Analytics™ Service and Integrated Contact Solutions Managed services. Long-term unearned revenue reflects revenue that will be recognized beyond the next twelve months and consisted of the following:
| As of | ||||||||
| January 1, 2011 |
December 26, 2009 |
|||||||
| Integrated Contact Solutions Managed Services |
$ | 11.2 | $ | 5.7 | ||||
| Behavioral Analytics™ Service – Managed Services |
4.7 | 3.8 | ||||||
| Total |
$ | 15.9 | $ | 9.5 | ||||
Note Eleven — Line of Credit
The Company maintains a Loan Agreement with the Bank, which expires on December 31, 2011. The Facility, which is $5.0 million as of January 1, 2011, requires the Company to maintain a minimum cash and cash equivalent balance within a secured account at the Bank. The balance in the secured account cannot be less than the outstanding balance drawn on the Facility line of credit and letter of credit obligations under the Facility. Available credit under the Facility has been reduced by $2.5 million related to letters of credit issued under the Facility to support the Company’s capital lease obligations. As a result, $2.5 million remains available under the Facility as of January 1, 2011. Loans under the Facility bear interest at the Bank’s prime rate or, at the Company’s election, an alternate rate of LIBOR (London InterBank Offering Rate) plus 0.75%. The Company did not have any borrowings or interest expense under the Facility during fiscal years 2010 or 2009.
46
Table of Contents
eLOYALTY CORPORATION
NOTES TO CONSOLIDATED FINANCIAL STATEMENTS — (Continued)
Note Twelve — Employee Benefit Plans
The Company’s U.S. employees are eligible to participate in the eLoyalty Corporation 401(k) Plan (the “401(k) Plan”) on the first day of the month coinciding with or following their date of hire. The 401(k) Plan allows employees to contribute up to 30% of their eligible compensation and up to 100% of their bonus compensation, subject to IRS statutory limits. In order to conserve cash given the then-current macro-economic uncertainties, eLoyalty suspended the employer matching contributions for both U.S. and non-U.S. plans, fully for fiscal year 2010, and partially for fiscal years 2009 and 2008. For fiscal years ended 2009 and 2008, a partial year employer match contribution of $0.2 million and $0.7 million, respectively, was expensed. The Company funds non-U.S. contributory plans as required by statutory regulations. Amounts funded by the Company were immaterial for non-U.S. plans for the periods presented.
Note Thirteen — Redeemable Convertible Preferred Stock and Capital Stock
The Company’s authorized capital stock consists of (i) 50,000,000 shares of Common Stock, par value $0.01 per share, and (ii) 40,000,000 shares of preferred stock, par value $0.01 per share. The Company has designated 5,000,000 shares of its preferred stock as its redeemable Series B Stock, of which 3,549,078 and 3,616,169 shares were issued and outstanding as of January 1, 2011 and December 26, 2009, respectively.
On September 12, 2008, eLoyalty completed a Rights Offering, which raised $14.8 million, net of expenses. Under the terms of the Rights Offering, persons who owned shares of the Company’s Common Stock or Series B Stock as of the close of business on August 13, 2008 (the record date for the Rights Offering) received the right to purchase 0.19756 shares of the Company’s Common Stock. These subscription rights expired on September 12, 2008. Pursuant to the terms of the Rights Offering, the Company issued 2,645,395 shares of the Company Common Stock at $5.67 per share.
In December 2006, the Company completed an $18.0 million Rights Offering. Under terms of the Rights Offering, persons who owned shares of the Company’s Common Stock or Series B Stock as of the close of business on November 20, 2006 (the record date for the Rights Offering) received the right to purchase 0.0910 shares of the Company’s Common Stock. These subscription rights expired on December 15, 2006. Pursuant to the terms of the Rights Offering, the Company issued 1,001,342 shares of the Company Common Stock at $17.97 per share.
In December 2001, at the time of issuance of the Series B Stock, a beneficial conversion adjustment was calculated (since the fair market value of a share of Common Stock at the time exceeded the purchase price of a share of Series B Stock) aggregating $4.0 million. The Series B Stock was recorded at the date of issuance net of issuance costs and the beneficial conversion adjustment. The discount attributable to the issuance costs was fully accreted on the date of issuance by charging additional paid-in capital and increasing the recorded amount of Series B Stock. The Series B Stock was accreted to its full redemption value of $23.3 million on a straight line basis from the date of issuance to June 19, 2002 by charging additional paid-in capital $0.7 million per month and increasing the recorded amount of Series B Stock by a like amount.
The Series B Stock accrues dividends at a rate of 7% per annum, is entitled to a preference upon liquidation, and is convertible on a one-for-one basis into shares of the Company’s Common Stock, subject to adjustment for stock splits, stock dividends, and similar actions. The Series B Stock generally votes on a one-for-one basis with the Common Stock, subject to adjustment for certain actions and specified matters as to which the Series B Stock is entitled to a separate class vote.
On March 17, 2000, the Board of Directors adopted a Stockholder Rights Plan (the “Rights Plan”). The Rights Plan was intended to assure fair and equal treatment for all of the Company’s stockholders in the event of a hostile takeover attempt.
Under the terms of the Rights Plan, each share of the Company’s Common Stock had associated with it ten rights (“Rights”). Each Right entitled the registered holder to purchase from the Company one one-hundredth of a share of Series A junior participating preferred stock, without par value, at an exercise price of $160 (subject to adjustment). The Rights became exercisable under certain circumstances: 10 days after the first public announcement that any person (an “acquiring person”) acquired 15% or more of the Company’s Common Stock or the announcement that any person commenced a tender offer for 15% or more of the Company’s Common Stock. On September 24, 2001, the Company amended the Rights Plan in connection with the private placement described above. The amendment provided, among other things, that (i) Technology Crossover Ventures and certain related parties would not have become an “acquiring person” for purposes of the Rights Plan so long as they did not own more than 35% of the Company’s outstanding Common Stock (determined after giving effect to the conversion of the new Series B Stock), and (ii) Sutter Hill and certain related parties would not have become an “acquiring person” for purposes of the Rights Plan so long as they did not own more than 20% of the Company’s outstanding Common Stock (determined after giving effect to the conversion of the Series B Stock). On December 27, 2007, the Company amended the Rights Plan to provide that Tench Coxe and various related entities affiliated with Sutter Hill Ventures would not become an “acquiring person” for purposes of the Rights Plan so long as they did not own more than 25% of the Company’s outstanding Common Stock (determined after giving effect to the conversion of the held Series B Stock). On September 19, 2008, the Company entered into a third amendment to provide that Tench Coxe and various related entities affiliated with Sutter Hill Ventures would not become an “acquiring person” for purposes of the Rights Plan so long as they did not own more than 30% of the Company’s outstanding Common Stock, including shares of the Company’s Series B Stock.
47
Table of Contents
eLOYALTY CORPORATION
NOTES TO CONSOLIDATED FINANCIAL STATEMENTS — (Continued)
In general, the Company could have redeemed the Rights in whole, at a price of $0.01 per Right after any person acquired 15% or more of the Company’s Common Stock. The Company’s Board of Directors chose not to renew the Rights Plan and the Rights expired on March 17, 2010.
Note Fourteen — Stock-Based Compensation
The Company issues stock awards under two stock incentive plans: the eLoyalty Corporation 1999 Stock Incentive Plan (the “1999 Plan”) and the eLoyalty Corporation 2000 Stock Incentive Plan (the “2000 Plan”). Under the 1999 Plan and the 2000 Plan, awards of restricted stock or bonus (installment) stock, salary replacement, stock options, stock appreciation rights, and performance shares may be granted to directors, officers, employees, consultants, independent contractors, and agents of the Company and its subsidiaries. Awards granted under the 1999 Plan and 2000 Plan are made at the discretion of the Compensation Committee of the Company’s Board of Directors (the “Compensation Committee”). If shares or options awarded under the 1999 Plan and the 2000 Plan are not issued due to cancellation of unvested or unexercised options or shares, then those options or shares again become available for issuance under the plans. Under the 1999 Plan, on the first day of each fiscal year, the aggregate number of shares available for issuance under the 1999 Plan is automatically increased by an amount equal to 5% of the total number of shares of Common Stock that are outstanding. Under the 2000 Plan, the Company originally reserved 280,000 shares of the Company Common Stock for issuance. At the 2008 Annual Meeting of Stockholders, stockholders approved the amendment and restatement of the 1999 Plan to increase the number of shares available for issuance under the 1999 Plan by 1,500,000. As of January 1, 2011, there were a total of 1,073,834 shares available for future grants under the 1999 Plan, the 2000 Plan, and from treasury stock.
Stock-based compensation expense was $5.3 million, $6.5 million, and $14.8 million for fiscal years ended 2010, 2009, and 2008, respectively. The Company recognizes stock compensation expense on a straight-line basis over the vesting period. The Company has established its forfeiture rate based on historical experience. The Company does not recognize the windfall tax benefit related to the excess tax deduction because the Company currently does not anticipate realizing the tax savings associated with this deduction. The amount of this excess tax deduction was $0 for each of fiscal years ended January 1, 2011 and December 26, 2009.
Restricted Stock
Restricted stock awards are shares of eLoyalty Common Stock granted to an individual. During the restriction period, the holder of granted restricted stock receives all of the benefits of ownership (right to dividends, voting rights, etc.), other than the right to sell or otherwise transfer any interest in the stock. Installment stock awards are grants to an individual of a contractual right to receive future shares of eLoyalty Common Stock in specified amounts on specified vesting dates, subject to the individual remaining an eLoyalty employee on the specified vesting dates.
Restricted and installment stock award activity was as follows for the years ended December 27, 2008, December 26, 2009, and January 1, 2011:
| Shares | Weighted Average Price |
|||||||
| Nonvested balance at December 29, 2007 |
992,503 | $ | 12.80 | |||||
| Granted |
1,082,536 | $ | 8.96 | |||||
| Vested |
(826,439 | ) | $ | 8.99 | ||||
| Forfeited |
(344,456 | ) | $ | 12.89 | ||||
| Nonvested balance at December 27, 2008 |
904,144 | $ | 11.63 | |||||
| Granted |
600,000 | $ | 3.45 | |||||
| Vested |
(489,247 | ) | $ | 10.76 | ||||
| Forfeited |
(29,689 | ) | $ | 9.80 | ||||
| Nonvested balance at December 26, 2009 |
985,208 | $ | 7.14 | |||||
| Granted |
570,100 | $ | 6.03 | |||||
| Vested |
(624,073 | ) | $ | 7.43 | ||||
| Forfeited |
(28,195 | ) | $ | 10.89 | ||||
| Nonvested balance at January 1, 2011 |
903,040 | $ | 6.12 | |||||
| For the Fiscal Year Ended | ||||||||||||
| 2010 | 2009 | 2008 | ||||||||||
| Total fair value of restricted and installment stock awards vested |
$ | 3.6 | $ | 2.7 | $ | 5.9 | ||||||
As of January 1, 2011, there remains $4.4 million of unrecognized compensation expense related to restricted and installment stock awards. These costs are expected to be recognized over a weighted average period of 1.5 years.
48
Table of Contents
eLOYALTY CORPORATION
NOTES TO CONSOLIDATED FINANCIAL STATEMENTS — (Continued)
Stock Options
Stock option awards may be in the form of incentive or non-qualified options. Stock options are granted with an exercise price per share equal to the fair market value of a share of the Company Common Stock on the date of grant, and have a maximum term of 10 years. The stock option terms are set by the Compensation Committee and generally become exercisable over a period of four years. The vesting can begin in equal monthly or quarterly increments over the vesting period. The Company recognized compensation expense related to option awards of $1.2 million, $1.2 million, and $1.0 million for the fiscal years ended 2010, 2009, and 2008, respectively.
In addition, the 1999 Plan provides that each non-employee director, upon commencing service, shall receive a non-qualified stock option to purchase 50,000 shares of the Company Common Stock that vest ratably over a period of 48 months. The day after the annual stockholders’ meeting, each non-employee director is granted an additional non-qualified stock option to purchase 5,000 shares of the Company Common Stock. Stock options granted to non-employee directors have an exercise price per share equal to the fair market value of a share of the Company Common Stock on the grant date, and are exercisable for up to 10 years.
During fiscal year 2010, a total of 30,000 options were granted to non-employee directors. Each of the six non-employee directors received an option to purchase 5,000 shares of Common Stock that will vest 25% on May 31, 2011; the balance will vest quarterly over the following three years, with a maximum term of 10 years. The exercise price per share was $6.34, the closing price of a share of Common Stock on the grant date.
During fiscal year 2009, options to purchase a total of 326,000 shares of Common Stock were granted to non-employee directors. On February 18, 2009, each of the five non-employee directors received options to purchase 50,000 shares of Common Stock, vesting in 16 equal quarterly installments, with a maximum term of 10 years. The exercise price per share was $4.25, the closing price of a share of Common Stock on February 18, 2009. Then on March 2, 2009, the Board of Directors resolved to increase the size of the Board by adding an additional non-employee member, appointing David B. Mullen. In connection with his Board appointment, Mr. Mullen received an option to purchase 50,000 shares of Common Stock, vesting ratably over 48 months, with a maximum term of 10 years. The exercise price per share was $4.88, the closing price of a share of Common Stock on March 2, 2009. Lastly on May 15, 2009, the following options were granted to non-employee directors: Each of the six non-employee directors, with the exception of Mr. Mullen, received an option to purchase 5,000 shares of Common Stock that vested 25% on May 31, 2010; the balance will vest quarterly over the following three years, with a maximum term of 10 years. Based on his Board appointment date, Mr. Mullen received an option to purchase 1,000 shares of Common Stock. The exercise price per share for all of these May 31, 2010 options was $6.90, the closing price of a share of Common Stock on the grant date.
During fiscal year 2008, options to purchase a total of 220,000 shares of Common Stock were granted. On February 19, 2008, options to purchase 195,000 shares of Common Stock were granted to five of the Company’s management members, vesting 25% after a one year period with the balance of the shares vesting in 12 equal quarterly installments, with a maximum term of 10 years. The exercise price per share was $10.54, the closing price of a share of Common Stock on the grant date. Then on May 16, 2008, options to purchase a total of 25,000 shares of Common Stock were granted to non-employee directors. Each of the five non-employee directors received an option to purchase 5,000 shares of Common Stock that vested 25% on February 28, 2009; the balance will vest quarterly over the following three years, with a maximum term of 10 years. The exercise price per share was $6.60, the closing price of a share of Common Stock on the grant date.
Option activity was as follows for the fiscal years ended 2008, 2009, and 2010:
| Options | Weighted Average Exercise Price |
Weighted Average Remaining Contractual Life (Years) |
Weighted Average Fair Value of Option Grants |
|||||||||||||
| Outstanding as of December 29, 2007 |
744,163 | $ | 22.45 | 6.2 | ||||||||||||
| Exercisable as of December 29, 2007 |
534,788 | $ | 23.33 | |||||||||||||
| Granted |
220,000 | $ | 10.09 | $ | 5.67 | |||||||||||
| Exercised |
— | $ | — | |||||||||||||
| Forfeited |
(29,761 | ) | $ | 88.16 | ||||||||||||
| Outstanding as of December 27, 2008 |
934,402 | $ | 17.45 | 6.1 | ||||||||||||
| Exercisable as of December 27, 2008 |
587,527 | $ | 19.52 | |||||||||||||
| Outstanding intrinsic value at December 27, 2008 |
$ | — | ||||||||||||||
| Exercisable intrinsic value at December 27, 2008 |
$ | — | ||||||||||||||
| Granted |
326,000 | $ | 4.56 | $ | 2.78 | |||||||||||
| Exercised |
(1,000 | ) | $ | 3.25 | ||||||||||||
49
Table of Contents
eLOYALTY CORPORATION
NOTES TO CONSOLIDATED FINANCIAL STATEMENTS — (Continued)
| Options | Weighted Average Exercise Price |
Weighted Average Remaining Contractual Life (Years) |
Weighted Average Fair Value of Option Grants |
|||||||||||||
| Forfeited |
(28,197 | ) | $ | 38.07 | ||||||||||||
| Outstanding as of December 26, 2009 |
1,231,205 | $ | 13.57 | 6.4 | ||||||||||||
| Exercisable as of December 26, 2009 |
783,542 | $ | 16.47 | |||||||||||||
| Outstanding intrinsic value at December 26, 2009 |
$ | 1.4 | ||||||||||||||
| Exercisable intrinsic value at December 26, 2009 |
$ | 0.8 | ||||||||||||||
| Granted |
30,000 | $ | 6.34 | $ | 3.92 | |||||||||||
| Exercised |
(895 | ) | $ | 2.73 | ||||||||||||
| Forfeited |
(7,918 | ) | $ | 176.96 | ||||||||||||
| Outstanding as of January 1, 2011 |
1,252,392 | $ | 12.37 | 5.5 | ||||||||||||
| Exercisable as of January 1, 2011 |
976,562 | $ | 14.05 | |||||||||||||
| Outstanding intrinsic value at January 1, 2011 |
$ | 1.1 | ||||||||||||||
| Exercisable intrinsic value at January 1, 2011 |
$ | 0.8 | ||||||||||||||
| For the Fiscal Years Ended | ||||||||||||||||
| 2010 | 2009 | 2008 | ||||||||||||||
| Total fair value of stock options vested |
$ | 1.2 | $ | 1.4 | $ | 0.8 | ||||||||||
| Intrinsic value of stock options exercised |
— | — | — | |||||||||||||
| Proceeds received from option exercises |
— | — | — | |||||||||||||
| As of January 1, 2011, there remains $1.0 million of unrecognized compensation expense related to stock options. These costs are expected to be recognized over a weighted average period of 1.4 years.
The fair value for options granted during fiscal years 2010, 2009, and 2008, was estimated on the date of grant using a Black Scholes option-pricing model. The Company used the following assumptions: |
| |||||||||||||||
| For the Fiscal Years Ended | ||||||||||||||||
| 2010 | 2009 | 2008 | ||||||||||||||
| Risk-free interest rates |
1.8 | % | 1.8 | % | 2.6 | % | ||||||||||
| Expected dividend yield |
— | — | — | |||||||||||||
| Expected volatility |
68 | % | 67 | % | 59 | % | ||||||||||
| Expected lives |
6.0 years | 6.0 years | 6.0 years | |||||||||||||
Historical Company information is the primary basis for the selection of expected life, expected volatility, and expected dividend yield assumptions. The risk-free interest rate is selected based on the yields from U.S. Treasury Strips with a remaining term equal to the expected term of the options being valued.
Salary Replacement Program
On January 8, 2009, eLoyalty approved the termination of the Salary Replacement Program. Effective February 1, 2009, the Company’s executive officers and other affected employees received their full salaries in cash. The Company no longer reduces cash salaries for periodic grants of unrestricted eLoyalty Common Stock.
The Salary Replacement Program was approved by the Board of Directors in November 2006. Under the program, executives and Vice Presidents exchanged a percentage of their salary for grants of shares of the Company’s Common Stock. The program had an effective date of December 1, 2006 and initially was authorized by the Board of Directors through December 31, 2007. In October 2007, the Board of Directors approved a modification and extended the plan through December 31, 2008. In addition, the program was expanded to include employees at the Senior Principal and Director levels who were based in North America. The salary reduction percentages ranged from 10% to 30%, dependent on salary levels of the impacted executives, Vice Presidents, Senior Principals, and Directors. The percentage of salary paid in stock increased for some of the more highly compensated executives and Vice Presidents. In February 2008, the Board of Directors modified the program and further reduced cash salaries at the executive and Vice President level by 7.5% of gross salary in exchange for an additional 12.5% of salary in the form of additional shares. The salary reduction percentages ranged from 10% to 37.5%, depending on salary levels of the affected executives, Vice Presidents, Senior Principals, and Directors. Subject to quarterly Compensation Committee approval, the Company would issue common stock at fair market value commensurate with the terms of the program. Under the Salary Replacement Program, a total of 736,481 and 131,143 shares were granted during fiscal years 2008 and 2007, respectively.
50
Table of Contents
eLOYALTY CORPORATION
NOTES TO CONSOLIDATED FINANCIAL STATEMENTS — (Continued)
Other Stock Compensation
ICS Performance Unit Awards
On November 3, 2009, the Compensation Committee approved the grant of 65,000 performance unit awards to certain employees of the Integrated Contact Solutions Business Unit and on May 5, 2010, the grant of an additional 22,000 performance unit awards was approved. The performance period for the awards began on October 1, 2009 and ends on December 29, 2012. On the last day of the performance period, the performance units granted will become fully vested. Certain events, such as the sale of the Integrated Contact Solutions Business Unit, accelerate the vesting of the performance units. The amount earned, if any, for each vested performance unit will vary based on (1) the ultimate value of the Integrated Contact Solutions Business Unit relative to the baseline value and (2) the number of participants receiving performance units (because a fraction of the total increase in Integrated Contact Solutions Business Unit value will fund an incentive pool that is divided among all participants based on the relative number of the performance units held by each participant at the end of the performance period). If the sale of the Integrated Contact Solutions Business Unit closes as proposed, the Company estimates that the amount of the incentive pool under this program would be approximately $0.4 million due to the calculation of the value of the Integrated Contact Solutions Business Unit under the terms of the program relative to a baseline value. The actual amount of the incentive pool will be determined by the Compensation Committee, under the terms of the program, following completion of the sale. Any distribution approved by the Compensation Committee will be settled in shares of eLoyalty Common Stock with the number of shares being determined by dividing the ultimate value of the incentive pool, if any by the 10-day average share price of eLoyalty Common Stock as of the distribution date.
During fiscal years 2010 and 2009, the Company expensed $0.2 million and $0.2 million, respectively, for this program. As of January 1, 2011, there is not any unrecognized compensation expense related to the ICS performance units. There are an estimated 66,943 shares of eLoyalty Common Stock potentially issuable with this program as of January 1, 2011.
Director Fees, Commissions, and Bonuses
During fiscal year 2008, the Company granted 394,200 shares to pay director fees, commissions, and bonuses with stock. Beginning in 2009, the Company paid director fees, commissions, and bonuses in cash.
Employee Stock Purchase Plan
The Employee Stock Purchase Plan (the “Plan”) is intended to qualify as an “employee stock purchase plan” under section 423 of the Internal Revenue Code. Under the Plan, eligible employees are permitted to purchase shares of eLoyalty Common Stock at below-market prices. The purchase period opens on the first day and ends on the last business day of each calendar quarter. eLoyalty had previously frozen the Plan effective March 31, 2002. During the first half of fiscal year 2007, eLoyalty’s Board of Directors and stockholders approved a proposal to increase the number of shares available under the Plan to 500,000 and subsequently reinstated the Plan effective July 1, 2007.
A total of 39,048 shares and 45,259 shares were issued under the Plan during fiscal years 2010 and 2009, respectively. The Company recorded $0.1 million of expense for the Plan during each of fiscal years 2010, 2009, and 2008.
Note Fifteen — Loss Per Share
The following table sets forth the computation of the loss and shares used in the calculation of basic and diluted loss per common share:
| For the Fiscal Years Ended | ||||||||||||
| 2010 | 2009 | 2008 | ||||||||||
| Net loss |
$ | (13.3 | ) | $ | (10.6 | ) | $ | (21.6 | ) | |||
| Series B Stock dividends |
(1.3 | ) | (1.3 | ) | (1.3 | ) | ||||||
| Net loss available to common stockholders |
$ | (14.6 | ) | $ | (11.9 | ) | $ | (22.9 | ) | |||
| Per common share |
||||||||||||
| Basic loss before Series B Stock dividends |
$ | (0.97 | ) | $ | (0.80 | ) | $ | (2.09 | ) | |||
| Basic net loss available to common stockholders |
$ | (1.06 | ) | $ | (0.90 | ) | $ | (2.21 | ) | |||
51
Table of Contents
eLOYALTY CORPORATION
NOTES TO CONSOLIDATED FINANCIAL STATEMENTS — (Continued)
| For the Fiscal Years Ended | ||||||||||||
| 2010 | 2009 | 2008 | ||||||||||
| Weighted average shares outstanding (basic and diluted) (in millions) |
13.70 | 13.26 | 10.37 | |||||||||
| Currently anti-dilutive common stock equivalents(1) (in millions) |
4.00 | 4.23 | 3.64 | |||||||||
| (1) | In periods in which there was a loss, the dilutive effect of common stock equivalents, which is primarily related to the Series B Stock, was not included in the diluted loss per share calculation as they were antidilutive. |
Note Sixteen — Segments
Since 2008, the Company has operated in two business segments, the Behavioral Analytics™ Service Business Unit and Integrated Contact Solutions Business Unit. These segments are consistent with the Company’s management of the business and reflect its internal financial reporting structure and operating focus.
The Behavioral Analytics™ Service Business Unit focuses on solutions that improve the reliability of call recording and applies human behavioral modeling to analyze and improve customer interactions and help optimize the performance of call center agents. The Behavioral Analytics™ Service is primarily a managed hosted solution and is delivered as a subscription service. Revenue from follow-on consulting services, deployments, and subscription services as well as marketing application hosting, and email fulfillment services are included in this Business Unit.
The Integrated Contact Solutions Business Unit focuses on helping clients realize the benefits of transitioning their contact centers to a single network infrastructure from the traditional two-network (voice network and separate data network) model. Revenue from Consulting services, Managed services, Product resale, traditional CRM consulting services, and remote application support services are included in this Business Unit.
Management believes that Segment Operating Income/(Loss) Before Stock-Based Compensation, Severance and Related Costs, and Depreciation and Amortization is an appropriate measure of evaluating the operational performance of the Company’s segments. However, this measure should be considered in addition to, not as a substitute for, or superior to, income from operations or other measures of financial performance prepared in accordance with General Accepted Accounting Principles. The Company does not allocate severance and related costs, depreciation and amortization or other items below the Operating Income/(Loss) level to its business segments. Also, the Company does not track or review asset information, other than capital investments, by reportable segments.
The following table presents summarized information by business segment, along with a reconciliation to operating income (loss):
| Year to Date Segment Reporting at January 1, 2011 |
||||||||||||||||
| Behavioral Analytics™ Service Business Unit |
Integrated Contact Solutions Business Unit |
Corporate | Total | |||||||||||||
| Revenue |
||||||||||||||||
| Services |
$ | 27.3 | $ | 44.5 | $ | — | $ | 71.8 | ||||||||
| Product |
— | 12.6 | — | 12.6 | ||||||||||||
| Net revenue |
27.3 | 57.1 | — | 84.4 | ||||||||||||
| Reimbursed expenses |
0.5 | 3.2 | — | 3.7 | ||||||||||||
| Total revenue |
27.8 | 60.3 | — | 88.1 | ||||||||||||
| Segment operating (loss)/income before stock-based compensation, severance and related costs and depreciation and amortization |
(2.5 | ) | 8.7 | (8.6 | ) | (2.4 | ) | |||||||||
| Stock-based compensation |
3.3 | 0.8 | 1.1 | 5.2 | ||||||||||||
| Severance and related costs |
— | — | 1.2 | 1.2 | ||||||||||||
| Depreciation and amortization |
— | — | 4.2 | 4.2 | ||||||||||||
| Operating (loss)/income |
(5.8 | ) | 7.9 | (15.1 | ) | (13.0 | ) | |||||||||
| Interest and other (expense) income, net |
— | — | (0.1 | ) | (0.1 | ) | ||||||||||
| Income taxes |
— | — | (0.1 | ) | (0.1 | ) | ||||||||||
| Loss on discontinued operations |
— | — | (0.1 | ) | (0.1 | ) | ||||||||||
| Net (loss)/income |
$ | (5.8 | ) | $ | 7.9 | $ | (15.4 | ) | $ | (13.3 | ) | |||||
| Capital investments |
$ | 2.2 | $ | 1.5 | $ | 0.5 | $ | 4.2 | ||||||||
52
Table of Contents
eLOYALTY CORPORATION
NOTES TO CONSOLIDATED FINANCIAL STATEMENTS — (Continued)
| Year to Date Segment Reporting at December 26, 2009 |
||||||||||||||||
| Behavioral Analytics™ Service Business Unit |
Integrated Contact Solutions Business Unit |
Corporate | Total | |||||||||||||
| Revenue |
||||||||||||||||
| Services |
$ | 22.0 | $ | 57.8 | $ | — | $ | 79.8 | ||||||||
| Product |
— | 17.8 | — | 17.8 | ||||||||||||
| Net revenue |
22.0 | 75.6 | — | 97.6 | ||||||||||||
| Reimbursed expenses |
0.3 | 3.7 | — | 4.0 | ||||||||||||
| Total revenue |
22.3 | 79.3 | — | 101.6 | ||||||||||||
| Segment operating (loss)/income before stock-based compensation, severance and related costs and depreciation and amortization |
(3.5 | ) | 13.6 | (8.6 | ) | 1.5 | ||||||||||
| Stock-based compensation |
3.6 | 1.6 | 1.1 | 6.3 | ||||||||||||
| Severance and related costs |
— | — | 1.3 | 1.3 | ||||||||||||
| Depreciation and amortization |
— | — | 4.5 | 4.5 | ||||||||||||
| Operating (loss)/income |
(7.1 | ) | 12.0 | (15.5 | ) | (10.6 | ) | |||||||||
| Interest and other income, net |
— | — | 0.1 | 0.1 | ||||||||||||
| Income taxes |
— | — | — | — | ||||||||||||
| Loss on discontinued operations |
— | — | (0.1 | ) | (0.1 | ) | ||||||||||
| Net (loss)/income |
$ | (7.1 | ) | $ | 12.0 | $ | (15.5 | ) | $ | (10.6 | ) | |||||
| Capital investments |
$ | 3.2 | $ | 0.4 | $ | 0.5 | $ | 4.1 | ||||||||
| Year to Date Segment Reporting at December 27, 2008 |
||||||||||||||||
| Behavioral Analytics™ Service Business Unit |
Integrated Contact Solutions Business Unit |
Corporate | Total | |||||||||||||
| Revenue |
||||||||||||||||
| Services |
$ | 18.0 | $ | 59.8 | $ | — | $ | 77.8 | ||||||||
| Product |
— | 9.8 | — | 9.8 | ||||||||||||
| Net revenue |
18.0 | 69.6 | — | 87.6 | ||||||||||||
| Reimbursed expenses |
0.4 | 3.2 | — | 3.6 | ||||||||||||
| Total revenue |
18.4 | 72.8 | — | 91.2 | ||||||||||||
| Segment operating (loss)/income before stock-based compensation, severance and related costs and depreciation and amortization |
(4.7 | ) | 15.3 | (11.1 | ) | (0.5 | ) | |||||||||
| Stock-based compensation |
6.1 | 6.3 | 2.3 | 14.7 | ||||||||||||
| Severance and related costs |
— | — | 1.6 | 1.6 | ||||||||||||
| Depreciation and amortization |
— | — | 4.2 | 4.2 | ||||||||||||
| Operating (loss)/income |
(10.8 | ) | 9.0 | (19.2 | ) | (21.0 | ) | |||||||||
| Interest and other income, net |
— | — | 0.1 | 0.1 | ||||||||||||
| Income taxes |
— | — | — | — | ||||||||||||
| Loss on discontinued operations |
— | — | (0.8 | ) | (0.8 | ) | ||||||||||
| Net (loss)/income |
$ | (10.8 | ) | $ | 9.0 | $ | (19.9 | ) | $ | (21.7 | ) | |||||
| Capital investments |
$ | 2.3 | $ | 0.3 | $ | 0.4 | $ | 3.0 | ||||||||
53
Table of Contents
eLOYALTY CORPORATION
NOTES TO CONSOLIDATED FINANCIAL STATEMENTS — (Continued)
Note Seventeen – Fair Value Measurements
The Company reports certain assets and liabilities at fair value. Fair value is an exit price and establishes a three-tier valuation hierarchy for ranking the quality and reliability of the information used to determine fair values. The first tier, Level 1, uses quoted market prices in active markets for identical assets or liabilities. Level 2 uses inputs, other than quoted market prices for identical assets or liabilities in active markets, which are observable either directly or indirectly. Level 3 uses unobservable inputs in which there are little or no market data, and requires the entity to develop its own assumptions. A financial asset or liability’s classification within the hierarchy is determined based on the lowest level input that is significant to the fair value measurement.
The following table provides the assets and liabilities carried at fair value measured on a recurring basis as of January 1, 2011 and December 26, 2009:
| Fair Value Measurements at January 1, 2011 Using | ||||||||||||||||
| Total carrying value at January 1, 2011 |
Quoted Prices in Active Markets (Level 1) |
Other Observable (Level 2) |
Significant Unobservable (Level 3) |
|||||||||||||
| Money market fund |
$ | 15.8 | $ | 15.8 | $ | — | $ | — | ||||||||
| Fair Value Measurements at December 26, 2009 Using | ||||||||||||||||
| Total carrying value at December 26, 2009 |
Quoted Prices in Active Markets (Level 1) |
Other Observable (Level 2) |
Significant Unobservable (Level 3) |
|||||||||||||
| Money market fund |
$ | 23.5 | $ | 23.5 | $ | — | $ | — | ||||||||
During fiscal year 2009, the Company sold its equity securities in a publicly-traded company for $0.3 million. These marketable securities were classified as available for sale and were included in Other current assets on the Company’s balance sheet. Unrealized holding gains and losses were excluded from earnings and reported in other comprehensive income until realized.
Note Eighteen – Fair Value of Financial Instruments
The carrying values of current assets and liabilities approximated their fair values as of January 1, 2011 and December 26, 2009. The Company considers all highly liquid investments readily convertible into known amounts of cash (with purchased maturities of three months or less) to be cash equivalents.
Note Nineteen — Leases
Capital Leases
The Company acquired $1.4 million and $0.9 million of computer equipment and leasehold improvements using capital leases during fiscal years 2010 and 2009, respectively. These assets were related primarily to investments in the Company’s Behavioral AnalyticsTM Service Line. In 2009 and prior years, the Company was required to issue an irrevocable letter of credit for a portion of the lease amount as additional consideration for the duration of the executed lease agreement. In 2010, newly executed leases do not require an irrevocable letter of credit. There was $1.6 million and $1.4 million of depreciation on capital leases during 2010 and 2009, respectively. All capital leases are for a term of either thirty or thirty-six months. The Company expects capital lease investments to increase between $3.5 million to $4.5 million for fiscal year 2011.
The following is a schedule, by year, of future minimum lease payments under capital leases, together with the present value of the net minimum lease payments as of January 1, 2011:
| Year |
Amount | |||
| 2011 |
$ | 1.6 | ||
| 2012 |
0.9 | |||
| 2013 |
0.2 | |||
| Thereafter |
— | |||
| Total minimum lease payments |
$ | 2.7 | ||
| Less: estimated executory costs |
(0.2 | ) | ||
| Net minimum lease payments |
$ | 2.5 | ||
| Less: amount representing interest |
(0.1 | ) | ||
| Present value of minimum lease payments |
$ | 2.4 | ||
54
Table of Contents
eLOYALTY CORPORATION
NOTES TO CONSOLIDATED FINANCIAL STATEMENTS — (Continued)
Capital leases included in equipment and leasehold improvements (see Note Six):
| As of | ||||||||
| January 1, 2011 |
December 26, 2009 |
|||||||
| Computers and software |
$ | 5.3 | $ | 4.8 | ||||
| Accumulated depreciation and amortization |
(2.9 | ) | (2.2 | ) | ||||
| Computers and software, net |
$ | 2.4 | $ | 2.6 | ||||
Operating Leases
The Company leases various office facilities under leases expiring at various dates through February 28, 2015. Additionally, the Company leases various property and office equipment under operating leases, generally under 3 year terms, expiring at various dates. Rental expense for all operating leases approximated $1.6 million, $1.6 million, and $1.9 million, for fiscal years ended 2010, 2009, and 2008, respectively. These amounts exclude rental payments related to office space reductions, which were $0.1 million, $0.1 million, and $0.1 million in fiscal years 2010, 2009, and 2008 respectively.
Future minimum rental commitments under non-cancelable operating leases with terms in excess of one year are as follows:
| Year |
Amount | |||
| 2011 |
$ | 1.3 | ||
| 2012 |
0.3 | |||
| 2013 |
0.3 | |||
| 2014 |
0.3 | |||
| 2015 |
— | |||
| Thereafter |
— | |||
| Total minimum payments required |
$ | 2.2 | ||
Note Twenty — Litigation and Other Contingencies
The Company, from time to time, has been subject to legal claims arising in connection with its business. While the results of these claims cannot be predicted with certainty, there are no asserted claims against the Company that, in the opinion of management, if adversely decided, would have a material effect on the Company’s financial position, results of operations, or cash flows.
The Company is a party to various agreements, including substantially all major services agreements and intellectual property licensing agreements, under which it may be obligated to indemnify the other party with respect to certain matters, including, but not limited to, indemnification against third-party claims of infringement of intellectual property rights with respect to software and other deliverables provided by the Company in the course of the Company’s engagements. These obligations may be subject to various limitations on the remedies available to the other party, including, without limitation, limits on the amounts recoverable and the time during which claims may be made and may be supported by indemnities given to the Company by applicable third parties. Payment by the Company under these indemnification clauses is generally subject to the other party making a claim that is subject to challenge by the Company and dispute resolution procedures specified in the particular agreement. Historically, the Company has not been obligated to pay any claim for indemnification under its agreements and management is not aware of future indemnification payments that it would be obligated to make.
Under its By-Laws, subject to certain exceptions, the Company has agreed to indemnify its officers and directors for certain events or occurrences while the officer or director is, or was, serving at its request in such capacity or in certain related capacities. The Company has separate indemnification agreements with each of its directors and officers that requires it, subject to certain exceptions, to indemnify them to the fullest extent authorized or permitted by its By-Laws and the Delaware General Corporation Law. The maximum potential amount of future payments the Company could be required to make under these indemnification agreements is unlimited; however, the Company has a director and officer liability insurance policy that limits its exposure and enables it to recover a portion of any future amounts paid. As a result of its insurance policy coverage, the Company believes the estimated fair value of these indemnification agreements is minimal. The Company has no liabilities recorded for these agreements as of January 1, 2011.
55
Table of Contents
eLOYALTY CORPORATION
NOTES TO CONSOLIDATED FINANCIAL STATEMENTS — (Continued)
Note Twenty-One — Quarterly Data (Unaudited)
| For the Fiscal Year Ended 2010 | ||||||||||||||||||||
| 1st | 2nd | 3rd | 4th | Year | ||||||||||||||||
| Total revenue |
$ | 20.0 | $ | 22.0 | $ | 23.3 | $ | 22.8 | $ | 88.1 | ||||||||||
| Gross margin |
$ | 6.4 | $ | 7.4 | $ | 8.1 | $ | 8.8 | $ | 30.7 | ||||||||||
| Operating loss |
$ | (5.0 | )(1) | $ | (3.6 | )(1) | $ | (2.7 | )(1) | $ | (1.7 | )(1) | $ | (13.0 | )(1) | |||||
| Loss from continuing operations |
$ | (4.9 | )(1) | $ | (3.7 | )(1) | $ | (2.8 | )(1) | $ | (1.8 | )(1) | $ | (13.2 | )(1) | |||||
| Loss on discontinued operations |
$ | (0.1 | )(2) | $ | — | $ | — | $ | — | $ | (0.1 | )(2) | ||||||||
| Net loss |
$ | (5.1 | )(1) | $ | (3.7 | )(1) | $ | (2.8 | )(1) | $ | (1.8 | )(1) | $ | (13.3 | )(1) | |||||
| Net loss available to common stockholders |
$ | (5.4 | )(1) | $ | (4.0 | )(1) | $ | (3.1 | )(1) | $ | (2.1 | )(1) | $ | (14.6 | )(1) | |||||
| Basic loss from continuing operations per share |
$ | (0.37 | ) | $ | (0.27 | ) | $ | (0.20 | ) | $ | (0.13 | ) | $ | (0.96 | ) | |||||
| Basic loss from discontinued operations per share |
$ | (0.01 | ) | $ | — | $ | — | $ | — | $ | (0.01 | ) | ||||||||
| Basic net loss per share available to common stockholders |
$ | (0.40 | ) | $ | (0.30 | ) | $ | (0.22 | ) | $ | (0.15 | ) | $ | (1.06 | ) | |||||
| Diluted loss from continuing operations per share |
$ | (0.37 | ) | $ | (0.27 | ) | $ | (0.20 | ) | $ | (0.13 | ) | $ | (0.96 | ) | |||||
| Diluted loss from discontinued operations per share |
$ | (0.01 | ) | $ | — | $ | — | $ | — | $ | (0.01 | ) | ||||||||
| Diluted net loss per share available to common stockholders |
$ | (0.40 | ) | $ | (0.30 | ) | $ | (0.22 | ) | $ | (0.15 | ) | $ | (1.06 | ) | |||||
| Shares used to calculate basic and diluted net loss per share (in millions) |
13.46 | 13.69 | 13.78 | 13.87 | 13.70 | |||||||||||||||
| For the Fiscal Year Ended 2009 | ||||||||||||||||||||
| 1st | 2nd | 3rd | 4th | Year | ||||||||||||||||
| Total revenue |
$ | 31.8 | $ | 23.1 | $ | 22.7 | $ | 24.0 | $ | 101.6 | ||||||||||
| Gross margin |
$ | 7.2 | $ | 8.1 | $ | 7.3 | $ | 7.7 | $ | 30.3 | ||||||||||
| Operating loss |
$ | (3.6 | )(3) | $ | (1.8 | )(3) | $ | (2.5 | )(3) | $ | (2.7 | )(3) | $ | (10.6 | )(3) | |||||
| Loss from continuing operations |
$ | (3.8 | )(3) | $ | (1.9 | )(3) | $ | (2.1 | )(3) | $ | (2.8 | )(3) | $ | (10.6 | )(3) | |||||
| Loss on discontinued operations |
$ | — | $ | — | $ | — | $ | — | (2) | $ | — | (2) | ||||||||
| Net loss |
$ | (3.8 | )(3) | $ | (1.9 | )(3) | $ | (2.1 | )(3) | $ | (2.8 | )(3) | $ | (10.6 | )(3) | |||||
| Net loss available to common stockholders |
$ | (4.1 | )(3) | $ | (2.2 | )(3) | $ | (2.5 | )(3) | $ | (3.1 | )(3) | $ | (11.9 | )(3) | |||||
| Basic loss from continuing operations per share |
$ | (0.29 | ) | $ | (0.14 | ) | $ | (0.16 | ) | $ | (0.21 | ) | $ | (0.80 | ) | |||||
| Basic loss from discontinued operations per share |
$ | — | $ | — | $ | — | $ | — | $ | — | ||||||||||
| Basic net loss per share available to common stockholders |
$ | (0.32 | ) | $ | (0.17 | ) | $ | (0.19 | ) | $ | (0.23 | ) | $ | (0.90 | ) | |||||
| Diluted loss from continuing operations per share |
$ | (0.29 | ) | $ | (0.14 | ) | $ | (0.16 | ) | $ | (0.21 | ) | $ | (0.80 | ) | |||||
| Diluted loss from discontinued operations per share |
$ | — | $ | — | $ | — | $ | — | $ | — | ||||||||||
| Diluted net loss per share available to common stockholders |
$ | (0.32 | ) | $ | (0.17 | ) | $ | (0.19 | ) | $ | (0.23 | ) | $ | (0.90 | ) | |||||
| Shares used to calculate basic and diluted net loss per share (in millions) |
13.09 | 13.25 | 13.32 | 13.37 | 13.26 | |||||||||||||||
| (1) | Includes $0.4 million, $0.5 million, $0.1 million, $0.2 million and $1.2 million related to severance and related costs for the first, second, third and fourth quarters of fiscal year 2010 and fiscal year 2010, respectively associated with cost reduction plans. |
| (2) | Includes $0.1 million and less than $0.1 million for fiscal years 2010 and 2009, respectively related to the sale of a subsidiary in Switzerland. |
| (3) | Includes $0.6 million, $0.1 million, $0.3 million, $0.3 million and $1.3 million related to severance and related costs for the first, second, third and fourth quarters of fiscal year 2009 and fiscal year 2009, respectively associated with cost reduction plans. |
Note Twenty-Two – Subsequent Events
On March 17, 2011, the Company entered into an Acquisition Agreement providing for the sale of all its assets used in the Integrated Contact Solutions Business Unit to a subsidiary of TeleTech Holdings, Inc. (“TeleTech”). Under the terms of the Acquisition Agreement, TeleTech will pay to the Company $40.85 million in cash at closing, subject to adjustment, and assume certain liabilities of the Integrated Contact Solutions Business Unit. The purchase price adjustments are related to working capital and prepaid managed services contracts.
The closing of the transaction is subject to various conditions, including approval by our stockholders, the receipt of required third-party consents and approvals, and other closing conditions customary for transactions of this type. No assurances can be given that the transaction will be consummated on the terms contemplated or at all.
56
Table of Contents
SCHEDULE II — VALUATION AND QUALIFYING ACCOUNTS
(In millions)
| Description of Allowance and Reserves |
Balance at Beginning of Period |
Additions Charged to Costs and Expenses |
Additions Charged to Other Accounts |
Deductions | Balance at End of Period |
|||||||||||||||
| Valuation allowance for doubtful accounts: |
||||||||||||||||||||
| Fiscal year ended January 1, 2011 |
$ | 0.2 | (0.1 | ) | — | — | $ | 0.1 | ||||||||||||
| Fiscal year ended December 26, 2009 |
$ | 0.1 | 0.1 | — | — | $ | 0.2 | |||||||||||||
| Fiscal year ended December 27, 2008 |
$ | 0.1 | — | — | — | $ | 0.1 | |||||||||||||
| Valuation allowance for deferred tax assets: |
||||||||||||||||||||
| Fiscal year ended January 1, 2011 |
$ | 58.4 | 4.3 | — | — | $ | 62.7 | |||||||||||||
| Fiscal year ended December 26, 2009 |
$ | 56.8 | 1.6 | — | — | $ | 58.4 | |||||||||||||
| Fiscal year ended December 27, 2008 |
$ | 48.8 | 8.0 | — | — | $ | 56.8 | |||||||||||||
57
Table of Contents
| Item 9. | Changes in and Disagreements with Accountants on Accounting and Financial Disclosure. |
Not applicable.
| Item 9A. | Controls and Procedures. |
(a) Evaluation of Disclosure Controls and Procedures
Based on their evaluation for the period covered by this Form 10-K, eLoyalty’s Chief Executive Officer and Chief Financial Officer have concluded that, as of January 1, 2011, the Company’s disclosure controls and procedures (as defined in Rule 13a-15(e) under the Securities Exchange Act of 1934, as amended) are effective.
(b) Management’s Annual Report on Internal Control over Financial Reporting
eLoyalty’s management is responsible for establishing and maintaining adequate internal control over financial reporting to provide reasonable assurance regarding the reliability of our financial reporting and the preparation of financial statements for external purposes in accordance with General Accepted Accounting Principles.
Due to its inherent limitations, internal control over financial reporting may not prevent or detect misstatements. Also, projections of any evaluation of effectiveness to future periods are subject to the risk that controls may become inadequate due to changes in conditions, or that the degree of compliance with the policies or procedures may deteriorate.
The Company conducted its evaluation of the effectiveness of internal control over financial reporting using the criteria set forth by the Committee of Sponsoring Organizations of the Treadway Commission (COSO) in Internal Control – Integrated Framework. Based on its evaluation, our management concluded that our internal control over financial reporting was effective as of the end of the period covered by this Form 10-K.
(c) Attestation Report of the Registered Public Accounting Firm
Grant Thornton LLP, an independent registered public accounting firm, has audited the Consolidated Financial Statements included in this Form 10-K and, as part of their audit, has issued its report, included herein, on the effectiveness of our internal control over financial reporting. See “Report of Grant Thornton LLP Independent Registered Public Accounting Firm” on page 30, which is incorporated herein by reference.
(d) Changes in Internal Control over Financial Reporting
There has been no change in eLoyalty’s internal control over financial reporting that occurred during the fourth quarter of fiscal year 2010 that has materially affected, or is reasonably likely to materially affect, eLoyalty’s internal control over financial reporting.
| Item 9B. | Other Information. |
Not applicable.
PART III
| Item 10. | Directors, Executive Officers and Corporate Governance. |
For information about our corporate Directors and the committees of our Board of Directors, see the captions “Election of Directors” and “Security Ownership of Certain Beneficial Owners and Management” in the Proxy Statement to be filed by eLoyalty for its 2011 Annual Meeting of Stockholders, which is incorporated herein by reference in response to this item.
The following table includes the name, age (as of March 17, 2011), current position, and term of office of each of our executive officers.
| Name |
Age | Current Position |
Executive Officer Since | |||
| Kelly D. Conway* |
54 | President and Chief Executive Officer | 1999 | |||
| William B. Noon |
46 | Vice President and Chief Financial Officer | 2009 | |||
| Steven C. Pollema |
51 | Vice President, Integrated Contact Solutions Business Unit |
2001 | |||
| Christine R. Carsen |
40 | Vice President, Associate General Counsel, Corporate Secretary, and Chief Privacy Officer | 2009 | |||
| * | Member of the Board of Directors |
58
Table of Contents
Except as required by individual employment agreements between executive officers and the Company, there exists no arrangement or understanding between any executive officer and any other person pursuant to which such executive officer was elected. Each executive officer serves until his or her successor is elected and qualified or until his or her earlier removal or resignation.
The principal business experience of the executive officers for at least the last five years is as follows:
Kelly D. Conway has been the President and Chief Executive Officer and a Director of eLoyalty, which was spun out of Technology Solutions Company (“TSC”) in 2000, since its incorporation in May 1999. Mr. Conway joined TSC in November 1993 as Senior Vice President, assumed the position of Executive Vice President in July 1995, and became Group President in October 1998. Prior to joining TSC, Mr. Conway served as a Partner in the management consulting firm of Spencer, Shenk and Capers and also held various positions, including President and Chief Executive Officer, with Telcom Technologies, a manufacturer of automatic call distribution equipment.
William B. Noon has been Vice President and Chief Financial Officer of eLoyalty since February 2009. Mr. Noon held the position of Vice President and Controller of eLoyalty from 2004 until his appointment as Chief Financial Officer in February 2009. Prior to that time, he was Corporate Controller of eLoyalty from 2003 to 2004 and Director, Financial Planning and Treasury, from 2000 to 2003.
Steven C. Pollema has been Vice President, Integrated Contact Solutions Business Unit, since December 2007. Previously, he served as Vice President, Operations and Chief Financial Officer of eLoyalty since December 2004. Prior to that, Mr. Pollema served as Vice President, Delivery and Operations of eLoyalty since August 2001, after joining eLoyalty in June 2001 as Senior Vice President, Operations. Prior to joining eLoyalty, Mr. Pollema had been with MarchFirst, Inc. and its predecessor, Whittman-Hart, Inc., since June 1997, most recently as its President from March 2001 to May 2001. Prior to assuming the office of President, Mr. Pollema was Executive Vice President-Global Operations of MarchFirst from October 2000 through March 2001 and Managing Executive — Chicago Office/Region from October 1998 to October 2000.
Christine R. Carsen has been Vice President, Associate General Counsel, Corporate Secretary, and Chief Privacy Officer of eLoyalty since February 2009. Ms. Carsen held the position of Vice President, Associate General Counsel, and Chief Privacy Officer from September 2007, when she joined the Company, until her appointment as Corporate Secretary in February 2009. Prior to joining eLoyalty, Ms. Carsen was a Partner at Winston & Strawn LLP from 2005 to 2007, having joined the firm as an associate in 2001. During her time at Winston & Strawn, Ms. Carsen focused on information-technology transactions, privacy matters, and general corporate and commercial transactions.
eLoyalty Corporation maintains a code of conduct, business principles, and ethical behavior (the “Code of Conduct”) applicable to all of our directors, officers, and other employees, including our Chief Executive Officer and Senior Financial Management. This Code of Conduct addresses ethical conduct, SEC disclosure, legal compliance, and other matters as contemplated by Section 406 of the Sarbanes-Oxley Act of 2002. A copy of the Code of Conduct was filed as Exhibit 14.1 to the 2003 Annual Report on Form 10-K and the Code of Conduct is available on our internet website at www.eLoyalty.com. We will make a copy of it available to any person, without charge, upon written request to eLoyalty Corporation, 150 Field Drive, Suite 250, Lake Forest, Illinois 60045, Attn: Corporate Secretary. To the extent permitted by applicable rules of the NASDAQ Global Market, we intend to satisfy the disclosure requirement under Item 5.05 of Form 8-K regarding amendments to or waivers of the Code of Conduct for the Chief Executive Officer or Senior Financial Management by posting this information on our internet website
| Item 11. | Executive Compensation. |
The information under “Compensation Discussion and Analysis,” “Executive Compensation,” and “Director Compensation” in the Proxy Statement to be filed by the Company for its 2011 Annual Meeting of Stockholders is incorporated herein by reference in response to this item.
| Item 12. | Security Ownership of Certain Beneficial Owners and Management and Related Stockholder Matters. |
The information under the heading “Security Ownership of Certain Beneficial Owners and Management — Beneficial Ownership Information” in the Proxy Statement to be filed by the Company for its 2011 Annual Meeting of Stockholders is incorporated herein by reference in response to this item.
59
Table of Contents
The following table shows, as of January 1, 2011, information regarding outstanding awards under all compensation plans of the Company (including individual compensation arrangements) under which equity securities of the Company may be delivered:
| Plan Category |
Number
of Securities to be Issued Upon Exercise of Outstanding Options, Warrants and Rights(1) |
Weighted Average Exercise Price of Outstanding Options, Warrants and Rights |
Number
of Securities Remaining Available for Future Issuance(1) (2) |
|||||||||
| Equity compensation plans approved by security holders |
1,248,482 | $ | 12.35 | 992,468 | (3) | |||||||
| Equity compensation plans not approved by security holders |
3,910 | $ | 21.17 | 81,366 | ||||||||
| Total |
1,252,392 | $ | 12.37 | 1,073,834 | (4) | |||||||
| (1) | Reflects number of shares of the Company’s Common Stock. |
| (2) | All of the securities available for future issuance listed herein may be issued other than upon the exercise of an option, warrant, or similar right. All of these shares are available for award in the form of restricted stock, bonus stock, performance units, or similar awards under the Company’s applicable equity compensation plans. |
| (3) | The Company’s plan that has been approved by its stockholders is the 1999 Plan, which includes an “automatic increase” feature whereby, as of the first day of each fiscal year, the number of shares of Common Stock available for awards, other than incentive stock options, automatically increases by an amount equal to five percent (5%) of the number of shares of Common Stock then outstanding. |
| (4) | Does not include (i) shares of restricted Common Stock held by employees, of which 865,911 shares were issued and outstanding as of January 1, 2011, which are included in the amount of issued and outstanding shares or (ii) 37,129 shares of Common Stock issuable pursuant to installment stock awards granted to employees, which (subject to specified conditions) will be issued in the future in consideration of the employees’ services to the Company. Includes approximately 66,943 shares of Common Stock reserved for payment on vesting of Performance Unit Awards to certain employees of the ICS Business Unit (actual number of shares may be greater or less than this amount, based on actual performance of the ICS Business Unit at the time of vesting). |
The plan described above as not having been approved by the Company’s stockholders is the 2000 Plan. This is a broadly based plan under which non-statutory stock options, restricted stock, and bonus stock awards may be granted to officers, employees, and certain consultants and independent contractors of the Company and its subsidiaries. The 2000 Plan may be administered by one or more committees of the Board of Directors that the Board has designated to carry out actions under the 2000 Plan on its behalf, which is currently the Compensation Committee. All awards made under the 2000 Plan are discretionary. The Compensation Committee or, if applicable, the Board, determines which eligible persons will receive awards and also determines all terms and conditions (including form, amount and timing) of each award. The 2000 Plan terminates September 23, 2011, which is ten years after the effective date of the last amendment and restatement of the 2000 Plan, unless terminated earlier by the Board. Termination of the 2000 Plan will not affect the terms or conditions of any award granted prior to termination.
| Item 13. | Certain Relationships and Related Transactions, and Director Independence. |
The information under the heading “Transactions with Related Persons” in the Proxy Statement to be filed by eLoyalty for its 2011 Annual Meeting of Stockholders is incorporated herein by reference in response to this item.
| Item 14. | Principal Accounting Fees and Services. |
The information under the caption “Ratification of Selection of Independent Public Accountants—Principal Accounting Fees and Services” in the Proxy Statement to be filed by the Company for its 2011 Annual Meeting of Stockholders is incorporated herein by reference in response to this item.
60
Table of Contents
PART IV
| Item 15. | Exhibits and Financial Statement Schedules. |
| (a) | Documents filed as part of this report: |
| (1) | Financial Statements. |
The consolidated financial statements filed as part of this report are listed and indexed under Item 8 of this Form 10-K and such list is incorporated herein by reference.
| (2) | Financial Statement Schedule. |
The financial statement schedule filed as part of this report is listed and indexed under Item 8 of this Form 10-K and is incorporated herein by reference. We have omitted financial statement schedules other than that listed under Item 8 because such schedules are not required or applicable.
| (3) | Exhibits. |
The list of exhibits filed with or incorporated by reference into this report is contained in the Exhibit Index to this report on Page I-1, which is incorporated herein by reference.
61
Table of Contents
Pursuant to the requirements of Section 13 or 15(d) of the Securities Exchange Act of 1934, the registrant has duly caused this Annual Report on Form 10-K to be signed on its behalf by the undersigned, thereunto duly authorized, on March 17, 2011.
| eLOYALTY CORPORATION | ||
| By |
/s/ KELLY D. CONWAY | |
| Kelly D. Conway | ||
| President and Chief Executive Officer | ||
Pursuant to the requirements of the Securities Exchange Act of 1934, this Annual Report on Form 10-K has been signed below by the following persons on behalf of the registrant in the capacities indicated on March 17, 2011.
| Name |
Capacity | |
| /s/ KELLY D. CONWAY Kelly D. Conway |
Director, President and Chief Executive Officer (Principal Executive Officer) | |
| * Tench Coxe |
Chairman of the Board and Director | |
| * Henry J. Feinberg |
Director | |
| * John T. Kohler |
Director | |
| * David B. Mullen |
Director | |
| * Michael J. Murray |
Director | |
| * John C. Staley |
Director | |
| /s/ WILLIAM B. NOON William B. Noon |
Vice President and Chief Financial Officer (Principal Financial and Accounting Officer) | |
| *By: | /s/ WILLIAM B. NOON | |
| William B. Noon, Attorney-in-Fact | ||
62
Table of Contents
We are including as exhibits to this Annual Report on Form 10-K certain documents that we have previously filed with the SEC as exhibits, and we are incorporating such documents as exhibits herein by reference from the respective filings identified in parentheses below. The management contracts and compensatory plans or arrangements required to be filed as exhibits to this Annual Report on Form 10-K pursuant to Item 14(c) are those listed below as Exhibits and noted by an asterisk.
| Exhibit No. |
Description of Exhibit | |
| 3(i).1 | Certificate of Incorporation of eLoyalty, as amended (filed as Exhibit 3.1 to eLoyalty’s Registration Statement on Form S-1 (Registration No. 333-94293) (the “S-1”)). | |
| 3(i).2 | Certificate of Amendment to eLoyalty’s Certificate of Incorporation December 19, 2001 (filed as Exhibit 3.3 to eLoyalty’s Annual Report on Form 10-K for the year ended December 29, 2001). | |
| 3(i).3 | Certificate of Amendment to eLoyalty’s Certificate of Incorporation December 19, 2001 (filed as Exhibit 3.4 to eLoyalty’s Annual Report on Form 10-K for the year ended December 29, 2001). | |
| 3(ii).1 | By-Laws of eLoyalty (filed as Exhibit 3.2 to the S-1). | |
| 3(ii).2 | Amendment to By-Laws of eLoyalty Corporation, (filed on November 16, 2007 as Exhibit 3.1 to eLoyalty’s Current Report on Form 8-K). | |
| 4.1 | Certificate of Designation of Series A Junior Participating Preferred Stock of the Company (included as Exhibit 4.2 to Amendment No.1 to eLoyalty’s Registration Statement on Form 8-A (File No. 0-27975) filed with the SEC on March 24, 2000 (the “8-A Amendment”)). | |
| 4.2 | Certificate of Increase of Series A Junior Participating Preferred Stock of eLoyalty, filed December 19, 2001 (filed as Exhibit 3.5 to eLoyalty’s Annual Report on Form 10-K for the year ended December 29, 2001). | |
| 4.3 | Certificate of Designation of 7% Series B Convertible Preferred Stock of eLoyalty, filed December 19, 2001 (filed as Exhibit 3.6 to eLoyalty’s Annual Report on Form 10-K for the year ended December 29, 2001). | |
| 4.4 | Certificate of Adjustment dated January 10, 2002 (filed as Exhibit 4.3 to eLoyalty’s Annual Report on Form 10-K for the year ended December 29, 2001). | |
| 10.1 | Form of Tax Sharing and Disaffiliation Agreement between Technology Solutions Company and eLoyalty Corporation (filed as Exhibit 10.6 to the S-1). | |
| 10.2 | Amended and Restated Investor Rights Agreement, dated as of December 19, 2001, by and among eLoyalty and the stockholders named therein (filed as Exhibit 10.3 to eLoyalty’s Annual Report on Form 10-K for the year ended December 29, 2001). | |
| 10.3* | eLoyalty Corporation 2000 Stock Incentive Plan (as Amended and Restated as of September 24, 2001) (filed as Exhibit (d)(2) to eLoyalty’s Tender Offer Statement on Schedule TO filed October 15, 2001). | |
| 10.4* | eLoyalty Corporation 1999 Stock Incentive Plan (as Amended and Restated as of May 16, 2002) (filed as Exhibit 10.3 to eLoyalty’s Quarterly Report on Form 10-Q for the quarter ended June 29, 2002). | |
| 10.5* | eLoyalty Corporation 1999 Stock Incentive Plan (as Amended and Restated as of May 15, 2008) (filed as an Exhibit to eLoyalty’s Definitive Proxy Statement on Schedule Def 14A). | |
| 10.6* | Form of Restricted Stock Award Agreement between applicable participant and eLoyalty (filed as Exhibit 10.23 to eLoyalty’s Annual Report on Form 10-K for the year ended January 1, 2005). | |
| 10.7* | Form of Installment Stock Award Agreement between applicable participant and eLoyalty (filed as Exhibit 10.24 to eLoyalty’s Annual Report on Form 10-K for the year ended January 1, 2005). | |
| 10.8* | Form of Option Award Agreement between applicable participant and eLoyalty (filed as Exhibit 10.8 to eLoyalty’s Annual Report on Form 10-K for the year ended December 30, 2006). | |
| 10.9* | Form of Performance Unit Award Agreement between applicable participant and eLoyalty Corporation. (filed as Exhibit 10.12 to eLoyalty’s Annual Report on Form 10-K for the year ended December 26, 2009). | |
I-1
Table of Contents
| 10.10 | Loan Agreement, dated as of December 17, 2001, between eLoyalty Corporation and LaSalle Bank National Association, together with Amendment No. 1 to Loan Agreement, dated as of February 27, 2002 (filed as Exhibit 10.27 to eLoyalty’s Annual Report on Form 10-K for the year ended December 29, 2001). | |
| 10.11 | Amendment No. 2 to Loan Agreement, dated as of March 18, 2002, between LaSalle Bank National Association and eLoyalty Corporation (filed as Exhibit 10.1 to eLoyalty’s Quarterly Report on Form 10-Q for the quarter ended March 30, 2002). | |
| 10.12 | Amendment No. 3 to Loan Agreement, dated as of May 13, 2002, between LaSalle Bank National Association and eLoyalty Corporation (filed as Exhibit 10.1 to eLoyalty’s Quarterly Report on Form 10-Q for the quarter ended June 29, 2002). | |
| 10.13 | Amendment No. 4 to Loan Agreement, dated as of December 9, 2002, between LaSalle Bank National Association and eLoyalty Corporation (filed as Exhibit 10.22 to eLoyalty’s Annual Report on Form 10-K for the year ended December 28, 2002). | |
| 10.14 | Amendment No. 5 to Loan Agreement, dated as of May 14, 2003, between LaSalle Bank National Association and eLoyalty Corporation (filed as Exhibit 10.1 to eLoyalty’s Quarterly Report on Form 10-Q for the quarter ended June 28, 2003). | |
| 10.15 | Amendment No. 6 to Loan Agreement, dated as of September 8, 2003, between LaSalle Bank National Association and eLoyalty Corporation (filed as Exhibit 10.1 to eLoyalty’s Quarterly Report on Form 10-Q for the quarter ended September 27, 2003). | |
| 10.16 | Amendment No. 7 to Loan Agreement, dated as of December 23, 2003, between LaSalle Bank National Association and eLoyalty Corporation (filed as Exhibit 10.19 to eLoyalty’s Annual Report on Form 10-K for the year ended December 27, 2003). | |
| 10.17 | Amendment No. 8 to Loan Agreement, dated as of December 21, 2004, between LaSalle Bank National Association and eLoyalty Corporation (filed as Exhibit 10.16 to eLoyalty’s Annual Report on Form 10-K for the year ended January 1, 2005). | |
| 10.18 | Amendment No. 9 to Loan Agreement, dated as of December 2, 2005, between LaSalle Bank National Association and eLoyalty Corporation (filed as Exhibit 10.16 to eLoyalty’s Annual Report on Form 10-K for the year ended December 31, 2005). | |
| 10.19 | Amendment No. 10 to Loan Agreement, dated as of December 22, 2005, between LaSalle Bank National Association and eLoyalty Corporation (filed as Exhibit 10.17 to eLoyalty’s Annual Report on Form 10-K for the year ended December 31, 2005). | |
| 10.20 | Amendment No. 11 to Loan Agreement, dated as of September 18, 2006, between LaSalle Bank National Association and eLoyalty Corporation (filed as Exhibit 10.1 to eLoyalty’s Quarterly Report on Form 10-Q for the quarter ended September 30, 2006). | |
| 10.21 | Amendment No. 12 to Loan Agreement, dated as of December 21, 2006, between LaSalle Bank National Association and eLoyalty Corporation (filed as Exhibit 10.20 to eLoyalty’s Annual Report on Form 10-K for the year ended December 30, 2006). | |
| 10.22 | Amendment No. 13 to Loan Agreement, dated as of December 6, 2007, between LaSalle Bank National Association and eLoyalty Corporation (filed as Exhibit 10.22 to eLoyalty’s Annual Report on Form 10-K for the year ended December 29, 2007). | |
| 10.23 | Amendment No. 14 to Loan Agreement, dated as of December 15, 2008, between Bank of America, N.A. (formerly LaSalle Bank National Association) and eLoyalty Corporation (filed as Exhibit 10.24 to eLoyalty’s Annual Report on Form 10-K for the year ended December 27, 2008). | |
| 10.24 | Amendment No. 15 to Loan Agreement, dated as of December 23, 2009, between Bank of America, N.A. (formerly LaSalle Bank National Association) and eLoyalty Corporation (filed as Exhibit 10.27 to eLoyalty’s Annual Report on Form 10-K for the year ended December 26, 2009). | |
| 10.25+ | Loan Agreement, dated as of December 24, 2010, between Bank of America, N.A. and eLoyalty Corporation. | |
| 10.26* | Form of Indemnification Agreement entered into between eLoyalty Corporation and participant (filed as Exhibit 10.25 to eLoyalty’s Annual Report on Form 10-K for the year ended December 27, 2008). | |
| 10.27* | Amended and Restated Employment Agreement, dated December 28, 2007, between Kelly D. Conway and eLoyalty Corporation (filed as Exhibit 10.25 to eLoyalty’s Annual Report on Form 10-K for the year ended December 29, 2007). | |
I-2
Table of Contents
| 10.28* | First Amendment to Amended and Restated Employment Agreement, dated February 26, 2008, between Kelly D. Conway and eLoyalty Corporation (filed as Exhibit 10.26 to eLoyalty’s Annual Report on Form 10-K for the year ended December 29, 2007). | |
| 10.29* | Second Amendment to Amended and Restated Employment Agreement, effective as of May 16, 2008 between Kelly D. Conway and eLoyalty Corporation (filed as Exhibit 10.4 to eLoyalty’s Quarterly Report on Form 10-Q for the quarter ended June 28, 2008). | |
| 10.30* | Amended and Restated Executive Employment Agreement, effective as of May 15, 2008 between Steven C. Pollema and eLoyalty Corporation (filed as Exhibit 10.2 to eLoyalty’s Quarterly Report on Form 10-Q for the quarter ended June 28, 2008). | |
| 10.31* | Employment Agreement, effective as of September 4, 2007 between Christine Carsen and eLoyalty Corporation (filed as Exhibit 10.33 to eLoyalty’s Annual Report on Form 10-K for the year ended December 26, 2009). | |
| 10.32* | Employment Agreement, effective as of April 4, 2005 between William B. Noon and eLoyalty Corporation (filed as Exhibit 10.34 to eLoyalty’s Annual Report on Form 10-K for the year ended December 26, 2009). | |
| 10.33* | First Amendment to Employment Agreement, effective as of August 15, 2007, between William B. Noon and eLoyalty Corporation (filed as Exhibit 10.35 to eLoyalty’s Annual Report on Form 10-K for the year ended December 26, 2009). | |
| 10.34*+ | Summary of Director Compensation. | |
| 10.35*+ | Summary of 2011 Executive Officer Compensation. | |
| 14.0 | Code of Ethics of eLoyalty Corporation (filed as Exhibit 14.1 to eLoyalty’s Annual Report on Form 10-K for the year ended December 27, 2003). | |
| 21.1+ | Subsidiaries of eLoyalty Corporation. | |
| 23.1+ | Consent of Grant Thornton LLP. | |
| 24.1+ | Power of Attorney from Tench Coxe, Director. | |
| 24.2+ | Power of Attorney from Henry J. Feinberg, Director. | |
| 24.3+ | Power of Attorney from John T. Kohler, Director. | |
| 24.4+ | Power of Attorney from Michael J. Murray, Director. | |
| 24.5+ | Power of Attorney from John C. Staley, Director. | |
| 24.6+ | Power of Attorney from David B. Mullen, Director. | |
| 31.1+ | Certification of Kelly D. Conway under Section 302 of the Sarbanes-Oxley Act of 2002. | |
| 31.2+ | Certification of William B. Noon under Section 302 of the Sarbanes-Oxley Act of 2002. | |
| 32.1+ | Certification of Kelly D. Conway and William B. Noon under Section 906 of the Sarbanes-Oxley Act of 2002. | |
| + | Filed herewith. |
| * | Represents a management contract or compensatory plan or arrangement. |
I-3