Attached files
| file | filename |
|---|---|
| EX-31.2 - CERTIFICATION CFO - AUTHENTEC INC | ex31-2.htm |
| EX-32.2 - CERTIFICATION CFO - AUTHENTEC INC | ex32-2.htm |
| EX-31.1 - CERTIFICATION CEO - AUTHENTEC INC | ex31-1.htm |
| EX-32.1 - CERTIFICATION CEO - AUTHENTEC INC | ex32-1.htm |
| EX-10.11 - FORM OF STOCK OPTION AWARD - AUTHENTEC INC | ex10-11.htm |
| EX-23.1 - CONSENT OF PRICEWATERHOUSECOOPERS LLP - AUTHENTEC INC | ex23-1.htm |
United States
SECURITIES AND EXCHANGE COMMISSION
Washington, D.C. 20549
FORM 10-K
(Mark One)
|
x
|
ANNUAL REPORT PURSUANT TO SECTION 13 OR 15(d) OF THE SECURITIES EXCHANGE ACT OF 1934
For the fiscal year ended December 31, 2010
|
OR
|
¨
|
TRANSITION REPORT PURSUANT TO SECTION 13 OR 15(d) OF THE SECURITIES EXCHANGE ACT OF 1934
For the transition period from _____________ to ______________.
|
Commission File Number 001-33552
AuthenTec, Inc.
(Exact name of Registrant as Specified in its Charter)
|
Delaware
|
59-3521332
|
|
(State or Other Jurisdiction of
Incorporation or Organization)
|
(I.R.S. Employer
Identification No.)
|
|
100 Rialto Place, Suite 100, Melbourne, Florida
|
32901
|
|
(Address of Principal Executive Offices)
|
(Zip Code)
|
Registrant’s Telephone Number, Including Area Code: (321) 308-1300
Securities Registered Pursuant to Section 12(b) of the Act:
|
Title of Each Class
|
Name of Exchange on Which Registered
|
|
|
Common Stock, $0.01 par value
|
Nasdaq Stock Market, LLC
|
Securities Registered Pursuant to Section 12(g) of the Act: None
Indicate by check mark whether the registrant is a well-known seasoned issuer, as defined in Rule 405 of the Securities Act. Yes ¨ No x
Indicate by check mark if the registrant is not required to file reports pursuant to Section 13 or 15(d) of the Exchange Act. Yes ¨ No x
Indicate by check mark whether the registrant (1) has filed all reports required to be filed by Section 13 or 15(d) of the Securities Exchange Act of 1934 during the preceding 12 months (or for such shorter period that the registrant was required to file such reports), and (2) has been subject to such filing requirements for the past 90 days. Yes x No ¨
Indicate by check mark whether the registrant has submitted electronically and posted on its corporate Web site, if any, every Interactive Data File required to be submitted and posted pursuant to Rule 405 of Regulation S-T (§ 232.405 of this chapter) during the preceding 12 months (or for such shorter period that the registrant was required to submit and post such files). Yes ¨ No ¨
Indicate by check mark if disclosure of delinquent filers pursuant to Item 405 of Regulation S-K (§ 229.405) is not contained herein, and will not be contained, to the best of registrant’s knowledge, in definitive proxy or information statements incorporated by reference in Part III of this Form 10-K or any amendment to this Form 10-K. ¨
Indicate by check mark whether the registrant is a large accelerated filer, an accelerated filer, a non-accelerated filer, or a smaller reporting company. See the definitions of “large accelerated filer,” “accelerated filer” and “smaller reporting company” in Rule 12b-2 of the Exchange Act. (Check one):
|
Large accelerated filer
|
¨
|
Accelerated filer
|
x
|
|
Non-accelerated filer
|
¨
|
Smaller reporting company
|
¨
|
Indicate by check mark whether the registrant is a shell company (as defined in Rule 12b-2 of the Act). Yes ¨ No x
The aggregate market value of the registrant’s common stock held by non-affiliates computed by reference to the NASDAQ Global Market closing price on July 2, 2010 (the last business day of the registrant’s most recently completed second fiscal quarter) was approximately $73,632,000. The number of shares of the registrant’s common stock outstanding as of March 16, 2011 was 43,640,631. Documents Incorporated By Reference: Certain sections of AuthenTec, Inc.’s definitive Proxy Statement for use in connection with its 2011 annual meeting of stockholders, to be filed subsequently, are incorporated by reference into Part III of this Annual Report where indicated.
AUTHENTEC, INC.
TABLE OF CONTENTS
|
Page No.
|
||
|
PART I
|
||
|
Item 1.
|
Business
|
1
|
|
Item 1A.
|
Risk Factors
|
14
|
|
Item 1B.
|
Unresolved Staff Comments
|
25
|
|
Item 2.
|
Properties
|
25
|
|
Item 3.
|
Legal Proceedings
|
25
|
|
Item 4.
|
Removed and Reserved
|
25
|
|
PART II
|
||
|
Item 5.
|
Market for Registrant’s Common Equity, Related Stockholder Matters and Issuer Purchases of Equity Securities
|
26
|
|
Item 6.
|
Selected Consolidated Financial Data
|
27
|
|
Item 7.
|
Management’s Discussion and Analysis of Financial Condition and Results of Operations
|
42
|
|
Item 8.
|
Consolidated Financial Statements and Supplementary Data
|
43
|
|
Item 9.
|
Changes in and Disagreements with Accountants on Accounting and Financial Disclosure
|
73
|
|
Item 9A.
|
Controls and Procedures
|
73
|
|
Item 9B.
|
Other Information
|
74
|
|
PART III
|
||
|
Item 10.
|
Directors, Executive Officers and Corporate Governance
|
74
|
|
Item 11.
|
Executive Compensation
|
74
|
|
Item 12.
|
Security Ownership of Certain Beneficial Owners and Management and Related Stockholder Matters
|
75
|
|
Item 13.
|
Certain Relationships and Related Transactions, and Director Independence
|
75
|
|
Item 14.
|
Principal Accountant Fees and Services
|
75
|
|
PART IV
|
||
|
Item 15.
|
Exhibits, Financial Statement Schedules
|
75
|
|
SIGNATURES
|
79
|
|
CAUTIONARY STATEMENT RELATING TO THE SAFE HARBOR PROVISIONS OF THE PRIVATE SECURITIES LITIGATION REFORM ACT OF 1995
This Annual Report on Form 10-K contains statements relating to expected future results and business trends that are based upon our current estimate, expectations, and projections about the industry, and upon our beliefs, and certain assumptions we have made that are “forward-looking statements” as defined in the Private Securities Litigation Reform Act of 1995. Words such as “anticipates,” “guidance,” “expects,” “intends,” “plans,” “believes,” “seeks,” “estimates,” “may,” “will,” “prospects,” “outlook,” “forecast,” and variations of these words or similar expressions are intended to identify “forward-looking statements.” In addition, any statements that refer to expectations, projections, or other characterizations of future events or circumstances, including any underlying assumptions, are “forward-looking statements.” Such statements are not guarantees of future performance and are subject to certain risks, uncertainties, and assumptions that are difficult to predict. Therefore, our actual results may differ materially and adversely from those expressed in any “forward-looking statement” as a result of various factors. These factors include, among others, those discussed under “Risk Factors” in Part I, Item 1A of this Annual Report and “Management’s Discussion and Analysis of Financial Condition and Results of Operations” in Part II, Item 7 of this Annual Report, and each of the following factors: the timely introduction of new products, demand for, and market acceptance of those products in our target markets, our ability to secure design-wins and these design-wins leading to future production, the adoption of our products in new applications, the rate at which we increase our activity and opportunities in the wireless market, the introduction of new software products and the ability to generate any revenues based on those new products, changes in product mix, the actions of existing or future competitors, our ability to successfully complete and integrate strategic acquisitions, the impact of litigation and the impact of the macroeconomic trends on our served markets as well as other risks detailed from time to time in our filings with the Securities and Exchange Commission. These “forward-looking statements” are made only as of the date hereof, and we undertake no obligation to update or revise the “forward-looking statements,” whether as a result of new information, future events or otherwise.
PART I
In this report, the words “AuthenTec,” “the Company,” “we,” “us” and “our” refer to AuthenTec, Inc. and our wholly owned subsidiaries.
|
Item 1.
|
Business
|
Company Overview
We are a leading provider of security and identity management technologies for consumer, enterprise and government applications. We provide a series of products including fingerprint sensors, identity management software and security hardware and software that provide security, convenience, personalization, and touch control features in PCs, cell phones, printers, network servers and many other end products.
Our revenues were $44.7 million in 2010 as compared to $34.1 million in 2009. The growth in revenue was mostly attributable to the incremental sales from our newly acquired entities and included not only sensor shipments but also licensing and royalty revenue from SafeNet, Inc’s (“SafeNet”) Embedded Security Solutions division.
In the last two years, we generated revenue from approximately 50 customers, including some of the world’s leading PC and wireless device manufacturers and their suppliers. These companies include Acer, Inc., ASUSTeK Computer, Inc., Dell Inc., Fujitsu Ltd., Hewlett-Packard Company, High Tech Computer Corp., Lenovo Group Limited, LG Electronics Inc., Samsung Electronics Co., Ltd., and Toshiba Corporation.
We continue to evolve from a mixed-signal semiconductor component supplier focused primarily on fingerprint authentication sensors to a provider of complete solutions focused on a wide array of security and identity management solutions. Our portfolio of products has significantly expanded during the past two years, and now includes smart fingerprint sensors, area sensors, fingerprint sensor chipsets and modules, USB fingerprint readers, identity management software and embedded hardware and software products and services. Our expansion has been driven by both internal product development efforts and strategic acquisitions.
In February 2010, we acquired SafeNet’s Embedded Security Solutions division, further enhancing our offering of security and identity management solutions. Our Embedded Security Solutions products are used in communication and network products to ensure data privacy and content protection for businesses and individuals. With the addition of the Embedded Security Solutions’ expertise in software development, network security and secure communication, we have the ability to offer secure end-to-end solutions, from the individual PC or cell phone all the way to the network server in the cloud.
1
In September 2010, we acquired privately-held UPEK Inc., a leading supplier of fingerprint solutions for consumer, business and government applications. We believe the combined company will benefit from our increased scale, a more diverse market and customer base, and expanded intellectual property portfolio that now includes nearly 200 filed and issued U.S. patents.
Over the past several years, fingerprint sensors have grown in features and functionality, and continue to be integrated into new computing and wireless communication devices. These devices store an increasing amount of sensitive and valuable personal and corporate data, yet are highly vulnerable to loss, theft, intrusion and fraud. In light of these vulnerabilities, the enhanced security features provided by our solutions have become increasingly important to consumers and our customers. Beyond security and identity management, our smart fingerprint sensors offer touch control functionality that enhances today’s smartphones and other devices. Through our advancements in sensor design and navigation software, our sensors can accurately translate movement of a finger across the sensor into touch control in cell phones, notebooks and other sensor-equipped products. Our customers continue to be interested in adding new features to enhance the functionality of their products including integrated and convenient security, identity management and touch control features.
Our research, development and marketing efforts are primarily focused on the following markets:
|
•
|
PCs: laptops, tablets, netbooks, desktops and PC peripheral products, such as memory keys, hard drives, keyboards, mice and other devices;
|
|
•
|
Wireless devices: cellular phones and other wireless communication devices, particularly smart phones and feature phones;
Access control: door locks, time and attendance systems, smart card readers, tokens and other devices that help secure logical or physical assets or prevent entrance from unauthorized personnel;
Networking: VPN gateways, host servers, routers and Ethernet bridges that are used in the enterprise, smart grids, femtocell and other wireless networks;
Content protection: high-value content including downloadable e-Books, video and multimedia, and music;
Semiconductor IP: system-on-a-chip (SoC) and application specific integrated circuits; and
Government and civil ID: door locks, handheld terminals, USB readers, keyboards, ID tokens and mobile ID handheld devices that enhance security for U.S. and international government and civil ID customers.
|
According to leading research firm Gartner, the PC market returned to double-digit growth during 2010, with worldwide PC shipments totaling 350.9 million units, a 13.8 percent increase from 2009. This growth rate was an improvement from 2009 when PC shipments increased only 5.5 percent from 2008. AuthenTec smart sensor products are primarily utilized in the fastest growing segment of the PC market, mobile PCs and tablets, where sensor size, cost and performance are key considerations. The Company expanded its smart sensor offering for the PC market with the introduction of the AES2660 during 2010. This 192-pixel wide sensor complements AuthenTec’s AES1660 128-wide pixel smart sensor, allowing PC original equipment manufacturers (OEM) to choose the appropriate sensor for the particular requirements of their PC or peripheral product.
The addition of the UPEK product portfolio significantly broadened AuthenTec’s offering for the PC market with new swipe and area sensors, and a family of USB fingerprint readers. These products include swipe sensors (also called smart sensors) TCS4K, a versatile, power efficient 192-pixel wide sensor standards-compatible fingerprint minutia matching, and TCS5D, a 144-pixel wide sensor that offers low power consumption and is ideally suited for USB-based products focused on maximizing battery life. UPEK also expanded the AuthenTec PC offering with the addition of area or touch sensors, called TouchChips, which consist of sensors, chipsets and modules. The TouchChip offering includes the large area TCS1, the only FIPS-201 certified silicon fingerprint sensor approved by the GSA and FBI for use in government applications. The TCS1offers breakthrough improvements in cost, size (12.8mm x 18mm surface) and power efficiency when compared to larger and typically more expensive fingerprint sensors based on optical technology. AuthenTec also added UPEK’s TCS2 TouchChip, a medium size area sensor (10.4mm x 14.4mm) surface to its portfolio during the year.
A companion chip for these four Smart Sensor and TouchChip products, the TCD50, handles fingerprint matching to provide such features as power-on authentication, one-time password options, to enhance security and to reduce processing delays common when matching is dependent on the host PC’s processor.
2
Also added from the UPEK portfolio is a family of USB fingerprint readers, the Eikon fingerprint reader portfolio for the PC market. The Eikon product family integrates TCS1, TCS2 and TSC4, TCS5 sensors into plug-and-play USB readers that quickly add fingerprint security to PCs that don’t already have a fingerprint sensor. AuthenTec plans to offer the family of Eikon readers and provide a bundled offering called the Eikon Digital Privacy Manager that includes AuthenTec’s TrueSuite identity management software during 2011. The Eikon family consists of six USB fingerprint reader models, and includes readers and software that are not only compatible with PCs but with Macs, as well.
Complementing our smart sensors for the PC market is our TrueSuite identity management software, which was offered directly to consumers as a downloadable application during 2010. TrueSuite is an identity management software application designed to be easy to use and convenient for the end user/consumer. TrueSuite is tailored for consumers and users who demand simplicity, improved usability, and one-touch access to their digital ID and social networks. TrueSuite is now shipping on notebook PCs from several of the world’s leading OEMs, giving consumers who use the application direct access to an online store in which they can order TrueSuite plug-ins, Eikon USB fingerprint readers and other security and identity management products offered by AuthenTec and third parties. In addition, AuthenTec will offer these software and hardware products directly to consumers through a new AuthenTec webstore that we plan to open in 2011.
All of the sensors we develop are based on our subsurface or live layer fingerprint imaging technology. Unlike most competing sensor technologies which read the skin’s surface layer, our live layer imaging technology, whether DC capacitive or based on radio frequencies (RF), is capable of obtaining high-density images from fingers under virtually any condition by reading the live layer below the skin’s surface. This technology, when combined with our matching algorithms, also allows us to build sensors that use less silicon than competing silicon-based technologies, making our solution well suited for our target markets where small form factor and cost are critical determinants. Our sensors are also capable of imaging fingerprints through thicker coatings. As a result, we believe our sensors are the most accurate, reliable, cost-effective, easy to use, smallest and most versatile products commercially available today.
Complementing our sensor offering is our TouchStone packaging technology for smart sensors which offers more durable and aesthetically pleasing packaging options for our customers and our SteelCoat sensor coating technology both of which enhances sensor surface hardness, durability and imperviousness to electrostatic discharge (ESD).
Rounding out our security offering is our high margin Embedded Security Solutions which helps enhance security for clients and service providers. We continue to invest in this business which is one of two reporting segments for the Company. Our two principal business segments are Smart Sensor Solutions - comprised of smart fingerprint sensors, area sensors (TouchChip sensors), identity management and electronic commerce (e-commerce) solutions – and Embedded Security Solutions.
Our headquarters is located in Melbourne, Florida, and we have major development centers in Melbourne, Florida, Vught, The Netherlands, Prague, The Czech Republic, and Shanghai, China. We also have sales and application engineering offices in several locations throughout the United States, Europe and Asia to service our global customer base. We had 242 full-time employees worldwide as of December 31, 2010, of which over 80% were in research and development, and selling and marketing.
Industry Overview
The Increasing Need for Authentication
The proliferation of portable computing and communications devices including laptop PCs and wireless devices has been driven by improvements in computing power, battery life, performance, communications infrastructure and decreases in cost and size. There has been a corresponding growth in the amount of electronic data accessed and exchanged due to the increasing number of applications that manage, manipulate, store, transmit and secure such information, as well as those that facilitate e-commerce and mobile commerce (m-commerce). Businesses and consumers increasingly use a variety of devices, including PCs and wireless devices, to store and transmit sensitive data electronically. These devices are often shipped with minimal authentication protection, if any, and can be easily manipulated by unauthorized users should the devices be lost or stolen.
Effective identification and authentication systems controlling access to sensitive information are critical to the safety and integrity of data, transactions and communications. Security breaches and fraud resulting from failures in authentication and identification systems can cause economic harm for individuals and corporations and have become chief concerns for businesses and consumers alike. Today, the primary method of protecting and securing electronic information is through the use of passwords. The average person must remember multiple passwords and regularly uses common identifiers such as maiden names and birthdays as passwords. These types of passwords are not foolproof and can be relatively easy to copy, lose, forget or have stolen. As a result of poor computer security and the proliferation of mobile electronic devices used to store large amounts of information, including databases of personal information, the potential for a corporate data breach that result in consumer identity theft is increasing.
3
In addition, growing concerns about personal privacy and information security in businesses have driven interest in and requirements for convenient identity management solutions. Business security concerns continue to increase, driven by compliance requirements for privacy such as the Health Insurance Portability and Accountability Act of 1996 (HIPAA), Sarbanes-Oxley, and the Financial Services Modernization Act of 1999, as well as growth in a workforce requiring access to company networks via mobile devices.
According to the Privacy Rights Clearinghouse, a non-profit consumer advocacy group, 559 data breaches in the U.S. led to the compromise of at least 11,430,405 records in 2010. In addition, the lost business of disconcerted customers, escalating legal and public relations expenses, and other costs associated with breaches are costing companies millions of dollars each year. According to its fifth annual survey, the Ponemon Institute, an independent research firm, reports that data breach incidents cost U.S. companies $204 per compromised customer record in 2009 with an average total per-incident cost of $6.75 million in 2009.
As a result of the foregoing, we believe there will be an increasing need for the authentication protection our products provide.
Our Target Markets
To respond to a more electronically oriented and mobile society, we expect that our customers will increasingly demand security and identity management that provide their end users with confidence that their sensitive personal and corporate information will not be compromised. We also believe our customers are looking for fingerprint sensor security, embedded security and identity management hardware and software to protect this sensitive information and enhance the user experience. Our target markets include:
|
•
|
PCs. The PC market, particularly laptops, currently represents one of the largest market segment for our fingerprint sensors and identity management software. Demand for our PC products is being driven by the need for increased security to protect personal and corporate data stored on the PC and the networks to which it connects, and by the convenience of replacing logins and passwords with the simple swipe of a finger. According to leading research firm Gartner, the PC market returned to double-digit growth during 2010, with worldwide PC shipments totaling 350.9 million units, a 13.8 percent increase from 2009. This growth rate was an improvement from 2009 when PC shipments increased 5.5 percent over 2008. To help further penetrate the PC market, we continue to expand our offering of smart fingerprint sensors and our offering of TrueSuite identity management software. Our TrueSuite software is now being integrated into millions of PCs that will be shipping throughout 2011, further expanding awareness of our fingerprint sensors and of the many features they bring to people who use them..
The addition of the UPEK portfolio of sensors, modules and USB fingerprint readers significantly expands our offering for the PC market and our opportunities in U.S. and international government/civil ID applications.
|
|
•
|
Wireless Devices. We believe the integration of fingerprint sensors into wireless smart phones, feature phones and tablets is in its early stages and will accelerate. According to research firm IDC, the mobile phone market grew 18.5% to 1.39 billion units shipped in 2010, up from the 1.17 billion units shipped in 2009. Also according to IDC, the mobile phone expansion in 2010 was driven primarily by the growth in smartphone shipments. IDC expects growth in the smartphone segment of the smartphone market, the segment with the highest attach rate of fingerprint sensors, to continue to grow 43.7% year over year in 2011. We believe the demand for our products will grow as mobile phone manufacturers and mobile phone users discover the multi-functional benefits of our fingerprint sensors, including convenient security, personalization and touch control. More mobile phone manufacturers are leveraging the personalization features of our sensors, which associate different phone functions and applications with different fingers, as well as the touch-powered navigation features offered by our products. We also believe that the proliferation of mobile commerce (m-commerce) whereby phones are used in conjunction with Near Field Communications (“NFC”) like a mobile wallet for making purchases will expand into markets outside of Japan where our fingerprint sensors have secure m-commerce transactions since 2004. Our acquisition of SafeNet’s Embedded Security Solutions business has significantly broadened our wireless device customer base and our product offering. We can now offer a more comprehensive security solution through security hardware products, security toolkits and digital rights management (DRM) software to protect high-value content.
Access control. The access control market can be divided into both, logical access control, or the provision of access to computing systems, and physical access control, or the provision of access to property, a building, a home, a room, gun safe, file cabinet or some other protected physical asset. AuthenTec products address both logical and physical access control. Our TouchChip and Smart Sensors products provide logical access control via PCs and peripherals, smart card readers, mobile phones, tokens, and also provide physical access control by way fingerprint-enabled door locks, smart card readers, time and attendance systems, and other devices. Because our fingerprint sensors are based in silicon, they are smaller, easier to integrate, offer increase power efficiency and typically cost less than optical fingerprint readers and other forms of biometric identification (iris and vein scanning, for example).
|
4
|
|
Networking. AuthenTec offers a host of embedded security solutions that provide enhanced levels of security in networks and networking systems. AuthenTec embedded security solutions are used by the world’s leading networking companies and network equipment manufacturers to help ensure end-to-end security from the client all the way to the server in the cloud. AuthenTec network solutions are ideally suited for security-intensive applications involving VPN gateways, host servers, routers and Ethernet bridges. Our networking solutions address Internet Protocol Security (IPsec) and Media Access Control Security (MACsec) and silicon-based security in Systems on a Chip (SoC) and application specific integrated circuits (ASICs). The Company also offers security processors and co-processor chips and boards, and focuses on security solutions that are compliant with industry networking standards for quick and easy deployment by customers.
Content protection. The ability to enable content access anytime, anywhere, and from any device is a crucial success factor for any digital content provider or service. High-value digital content includes streaming or downloadable video/multimedia, music and e-Books among others. To help protect and monetize this high-value content, AuthenTec offers a comprehensive portfolio of Digital Rights Management (DRM) solutions that ensures end-to-end security from the content provider to the client.
The Company supports multiple DRM technologies on both the client and server side, enabling the protection, distribution and monetization of digital content. AuthenTec’s DRM offering provides advanced levels of protection, reliability, and performance for content providers on the server side and consumers and businesses on the client side. We offer DRM solutions which can be embedded or added as a downloadable application by device manufacturers, semiconductor vendors or software providers for fast integration and deployment. AuthenTec’s DRM portfolio helps ensure that only clients who have been granted rights for high-value content are able to access it
|
Biometrics Background
Biometrics is the process of gathering and processing a certain set of physical or behavioral characteristics in order to identify an individual. Government and law enforcement agencies were the first to develop and adopt biometric technologies with a focus on fingerprint biometrics. In the United States, law enforcement agencies have long used both manual and electronic methods for collecting and comparing fingerprints. Other countries have similar systems which have been used for a variety of purposes from criminal background checks to voter registration. Today, there are several types of biometric alternatives including fingerprint, iris scan, voice authentication, retina scan, hand geometry, and facial scan. These alternatives provide varying levels of identification and authentication success. For example, iris scan and retina scan technologies have been adopted, but are generally expensive and require a significant amount of equipment to deploy a solution. As a result, these technologies are being used on a limited basis, and primarily in lower volume governmental, law enforcement or physical access control applications. Other biometric alternatives, such as facial recognition, have proven to be inexpensive but are reportedly vulnerable to spoofing.
Security
In the 1990s, electronic fingerprint scanners were developed to replace ink and paper-based systems and primarily used optical technologies to image the patterns on the surface of the finger and convert those patterns into images of the fingerprint. These technologies were sometimes not able to acquire useful data from people with imperfections in their finger skin such as dry, thickly callused or worn smooth fingerprints. The cost, size and performance issues associated with these early technologies gave rise to semiconductor-based (silicon) sensors as companies began to explore the commercial application of fingerprint authentication. In addition to our live layers technology, there are now several types of silicon fingerprint technologies in the market, such as DC and RF capacitive. While these technologies along with other biometric and non-biometric alternatives are capable of individual identification, we believe these other technologies are limited as compared to our technology at this time. Although generally lower in cost and smaller in size than the predecessor optical fingerprint scanners, these competitive silicon fingerprint sensor technologies often suffer some of the same performance issues.
Silicon fingerprint sensors are a segment of the global fingerprint biometrics industry, and this segment includes sensors based on various technologies of varying capabilities, size and cost. Over the past several years, the silicon fingerprint sensor segment has experienced growth driven by the proliferation of mobile computing and wireless communication devices. With the recent macroeconomic downturn, however, there has been a retraction in this business line. We believe that by offering the right hardware and software products, together with an improvement in the macroeconomic conditions, this segment will once again grow.
5
The silicon fingerprint sensor segment, the area in which we operate, comprises two different types of products: touch and swipe sensors. Touch, or area, sensors are generally larger and more costly than swipe sensors. Users of touch sensors place their finger on the sensor. They generally are only used in government applications and some access control markets presently. Swipe sensors are generally smaller and less costly and involve the user swiping their finger across the sensor. Swipe sensors have become the more dominant form of fingerprint sensor over the past few years and now represent a significant majority of sensors shipped. All fingerprint sensors, whether or not they are silicon-based, are alternatives to other potential biometric identification systems as well as a multitude of non-biometric identification procedures.
Identity Management
Growth in online social networks such as Facebook, MySpace, Twitter and LinkedIn, have increased the importance of convenient yet secure user control over their digital identity. We believe that AuthenTec is well positioned to benefit from growth in identity management for social networks and online services by way of our complete solutions, which includes our smart sensors, TrueSuite identity management software and applications from third parties that link the user with their online social networks and digital identity.
We believe that the fingerprint sensor can easily become the foundation to our digital identity, and that as digital identities become more important, more services will be aggregated and accessible through authentication and personalization events via the sensor. We foresee a day when a swipe of the sensor will replace login/password events with services like Google ID, Facebook Connect, OpenID, Twitter API, and Microsoft Live ID, and securely connect the user to their personal accounts with Google, Yahoo, Flickr and thousands of other websites.
Furthermore, we believe that the fingerprint sensor has the potential to become the foundation for digital identities used in cloud-based computing, which is the delivery of software, services and other computing tasks via the Internet rather than using on-premise computing resources. It is a style of computing where scalable IT-enabled capabilities are provided as a service to external customers by way of the Internet. Cloud computing is increasingly used for business processes, including advertising, e-commerce, human resources and payment processing. It is also used for delivering advertising content and media, providing infrastructure services and application services. According to research analyst firm Gartner, worldwide cloud services revenue is forecast to reach $68.3 billion in 2010, a 16.6 percent increase from 2009 revenue of $58.6 billion. The industry is poised for strong growth through 2014, when worldwide cloud services revenue is projected to reach $148.8 billion.
We believe that AuthenTec is well positioned to provide convenient yet secure identity management at the point of user entry (PC, smartphone, mobile device, etc.) for cloud-based computing via its smart sensors, software and solutions, and that demand for these solutions will grow as security concerns and interest in personalization in cloud computing increase. See “Part I. Item 1A – Risk Factors” of this Annual Report.
Our Competitive Strengths
We believe the following competitive strengths will enable us to succeed as a leading provider of solutions for security, identity management and touch control:
Patented and Proven Advanced Technology Platform. While other fingerprint technologies generally read only the surface layer of the skin, our patented live layers technology is able to read the live layer of skin below the skin’s outer surface. By reading the live layer, we are able to produce a high density and accurate image of the skin under virtually any condition regardless of changing environments and finger conditions. Our TrueMatch matching algorithms use these higher quality images to accurately and securely match the user, a process which we believe is one of the most accurate and secure matching capabilities available in the market today. Our proprietary technologies are protected by nearly 200 filed and pending U.S. patents for sensors and sensor packaging, software, and end user applications.
Complete Hardware and Software Solutions. We offer comprehensive solutions optimized for security, identity management and touch control in our target markets. Our solutions include the sensors, algorithms, software, reference designs, packaging and end-user applications which allow our customers to easily integrate our solutions into their products. By using our solutions, our customers benefit from improved time-to-market, reduced development costs and higher quality.
Low-Cost Advantage. As a result of our technologies, we are capable of offering the smaller sensors as compared to other commercially available semiconductor-based solutions. We believe this provides us with a cost advantage and ability to accommodate integration into a broader range of mobile devices over our competitors. We operate a fabless manufacturing model and utilize standard, high volume fabrication processes, allowing us to take full advantage of the cost reduction and yield enhancements associated with these processes.
Multiple Products Targeted for High Volume End Markets. As of the end of 2010, we have introduced (or acquired) 19 sensor products tailored specifically to our target markets since our founding in 1998. Our products include some of the smallest fingerprint sensors available in the market, a critical consideration for many of our customers. Complementing these products is our TrueSuite application software which simplifies and enhances the use of our sensors.
6
Strong Relationships with Leading Global PC and Wireless Device Manufacturers. We have developed collaborative relationships with leading manufacturers of PCs and wireless devices worldwide. These relationships enable us to work with our customers and tailor our solutions to fit into their research and development efforts. We have support offices in North America, Europe and Asia to provide our global customers with convenient local sales and technical support.
Increased Functionality. In addition to the convenient security aspects of our products, our sensor solutions also provide other features such as TrueNav. TrueNav allows the sensor to be used as a “touchpad” or “joystick” type device where the sensor tracks the motion of the finger. By controlling the cursor with the finger, the sensor can be used to augment, or replace, the directional pads, track pads, trackballs, optical mice and other mechanical switches found on cellphones and other wireless devices.
Financial and Operational Stability and Reputation. Founded in 1998, we have been a leading provider of identity, security and touch control technologies for PC, wireless device and other markets. With $28.5 million of cash and cash equivalents and short-term investments as of December 31, 2010, we believe we have a strong financial position compared to most of our competitors. We believe that our strong balance sheet and long operating history is attractive to our customers as a sign of financial stability. Furthermore, our strong balance sheet has allowed us to make strategic acquisitions and to continue making investments in new products which positions us well for new opportunities and to help drive the growth of our business.
Our Growth Strategy
We intend to maintain and extend our leadership in our target markets by pursuing the following strategies:
Increase Penetration of the Consumer PC Market. The global macroeconomic downturn has accelerated the growth in sales of lower-cost PCs and tablets.. The fingerprint sensor attach rate in consumer PCs is much lower relative to more expensive and feature rich models for businesses and enterprises. To increase penetration of the consumer PC market, which includes netbooks, we are bringing lower cost fingerprint sensors and client application software to market that are tailored for use in this growing portion of the PC market.
Increase Penetration of the Wireless Market. The adoption of fingerprint sensors in wireless products has been somewhat limited outside of Japan. We believe that market growth in smart phones, feature phones and tablets that are capable of storing more personal and business information are helping to drive increased global demand for more convenient security. Beyond security, we are expanding our multi-functional capabilities of our sensors and promoting other features such as personalization and navigation. Our TrueNav capabilities have drawn strong interest from customers as a possible replacement for current navigation technologies used on smart phones, in addition to the touch screen. Finally, we are focused on improving the durability and aesthetics of our sensors for wireless devices though continued development of our new TouchStone packaging.
Expand our Offering and Availability of Software and End-user Applications. We intend to expand our TrueSuite application software for the PC market and also offer a version of TrueSuite for use in mobile systems. We plan to expand the features and functions of TrueSuite, which will be shipping in new notebook models in 2011, and will offer an API (TrueAPI) to application developers in order to further expand the uses of our sensors in PCs and mobile systems. We also plan to make certain versions of TrueSuite available and applications developed by us and partners for purchase via a web store that we expect to introduce in 2011.
Continue to Enhance the Functionality of Our Products. Our current product offering provides our customers with an accurate, reliable, cost-effective, versatile and secure solution. Our products provide several security features including the protection of hardware and data and the replacement of passwords. Our products allow for personalization of a device such as the ability to use different fingerprints to launch different applications. In addition, our products can be used for navigation, in which the sensor can be used for cursor control. We believe our sensor technologies will increasingly be used to replace mechanical switches and other user input controls on wireless handsets and other small form factor devices. We plan to continue to provide solutions that offer enhanced security, innovation, convenience and navigation control for our customers as we believe this is critical to achieving increased market penetration.
Pursue Selective Acquisitions of Complementary Technologies or Companies. We intend to evaluate and potentially make acquisitions of companies, technologies and products that are complementary to our focus in security and identity management. We believe we are capable of integrating certain ancillary technologies into our solution in order to broaden our product portfolio functionality and accelerate growth and entry into new markets. In February 2010, we acquired the Embedded Security Division of SafeNet. We believe that this acquisition will help transform us into a more comprehensive supplier of security, identity management, and touch control solutions, and in September 2010 we acquired UPEK, which greatly expanded our customer base, product portfolio solutions and intellectual property portfolio.
7
Continue to Maintain Low–Cost Leadership. We believe we currently offer one of the smallest commercially available fingerprint sensors at the lowest cost in the industry. We believe this is a critical attribute for our current customers and will help enable further proliferation of our fingerprint sensors into products in other markets. Our management and engineering teams have significant experience reducing product costs. We intend to preserve our low-cost advantages by seeking to improve our design process and packaging techniques, enhancing our matching algorithms, integrating additional functionality into our existing solutions and leveraging our fabless manufacturing model as our shipments increase.
Products
Smart Sensors - We design, develop and sell mixed-signal fingerprint sensor semiconductors primarily used in the PC and wireless device markets. Because these swipe-type sensors expand functionality beyond fingerprint authentication to include touch control navigation and personalization, we refer to them as smart sensors. We offer a broad range of smart sensors that enable users to securely and easily access and control multiple functions on an electronic device by sliding their finger across the sensor. Our fingerprint sensors utilize unique information in fingerprints to verify both the identity of the individual as well as the unique, individual fingers on the same person. Our solutions capture an image of the fingerprint, extract unique information from it and save it as a template, a mathematical representation of the fingerprint image. Subsequently, the information is compared to that from a future template to determine if it is the same finger.
Because our smart sensors can accurately and consistently identify individual fingers, we can use our sensors in multiple applications related to security, password replacement, financial transaction authentication and personalization applications within our target markets. Our sensors also can track the relative location of one’s finger movement and thus can be used as a form of cursor control, functionality valued in a smaller form factor sensor where we can replace a four way mechanical switch, an optical trackpad or other navigation-only device. Through this expanded touch-based functionality, our customers can use our smart sensors to add a number of value-added features to their own products. In the PC, this may include network log on, password replacement, parental control, fast user switching, quick applications access, menu scrolling and other features that differentiate their products and improve the user experience. In the cell phone, in addition to the items noted for the PC, other added capabilities include using the sensor for cursor control which replaces a navigation-only device, M-commerce authentication and speed dial capabilities where each finger is associated with a different number.
Our smart sensors are used in a wide range of PC products and related peripherals including laptops, desktops, memory keys, hard drives, keyboards, mice and other devices. Our products have also been integrated into a number of wireless devices including mobile phones and personal navigation devices (PNDs).
We offer a complete client-level solution to our customers including the smart sensors, matching algorithms and device level software (device drivers, algorithms and applications programming interfaces) and PC and mobile client applications, along with a complete set of documentation and application support. In addition to internally developed software included in our products, we support third-party software vendors whose products interact with our sensor products.
We provided smart sensor products to two primary markets during 2010:
PCs – The AES2810, AES2550, AES1660, AES2660, TCS4K, TSC5D and TCD50 companion processor smart sensors are designed for integration into laptops, tablets, desktop PCs and PC peripherals. These devices enable security, personalization and touch control features and can be found in products sold into the enterprise, government and consumer markets.
Wireless Devices – The AES1711 and AES1750 smart sensors are designed for integration into mobile phones and other wireless communications devices such as tablets. These devices enable security, personalization and a host of touch control features used today worldwide in full featured mobile phones.
TouchChip™ Sensors – Through our acquisition of UPEK in 2010, we greatly expanded our offering of touch-based sensors, which are large area silicon fingerprint sensors we call TouchChips. We offer these products as standalone chips, modules or as USB readers. Our TouchChip products are designed to comply with government and industry standards and offer the ruggedness, strong security and ease of integration needed for quick and broad deployment. TouchChip fingerprint sensors dramatically lower the size, cost and power of fingerprint sensors versus optical-based fingerprint solutions. Our TouchChip portfolio includes the world’s only silicon-based FIPS-201 compliant fingerprint sensor for U.S. government applications. TouchChip sensors address a broad range of markets, from large scale government and international ID programs to mobile ID applications to enterprise security including physical and logical access control.
Our TouchChip family includes the TCS1 large touch sensor, TCS2 medium touch sensor and the AES3400 small touch sensor. Packaged as TouchChip modules we also offer the USB-compatible TCEF series and the TCES series for SPI and UART compatibility. Our TouchChips are also available as standalone USB fingerprint readers in our Eikon family of products.
8
Eikon™ USB Fingerprint Readers – AuthenTec offers both smart sensors and TouchChip sensors packaged as USB fingerprint readers which provide a plug and play solution for notebooks, desktops and other USB-equipped devices. Our award-winning Eikon family of USB fingerprint readers provide quick and reliable biometric authentication by leveraging AuthenTec's proven technology, from smart sensors found in millions of laptops to government certified TouchChip sensors.
Identity Management Software – We offer identity management software for PCs and mobile devices which is designed to make a fingerprint-enabled PCs and mobile phones more secure, while increasing user convenience and personalization. AuthenTec’s TrueSuite® software is tailored for consumers who demand simplicity, improved usability, and one-touch access to their digital ID and social networks. TrueSuite identity management software offers value-added features such as one-swipe windows or website log on, quick application or website launch, and file/folder lock. TrueSuite identity management software is available for download on AuthenTec’s website and is also currently being integrated into laptop models from several of the world’s leading PC OEMs, including HP. In 2011, we plan to offer our TrueSuite identity management software bundled with our Eikon USB fingerprint readers as well as applications which that are developed by us and our partners.
Embedded Security Products - we design, develop, and sell a range of embedded security solutions, encompassing chips, hardware Intellectual Property (IP), and software. The solutions are centered on the use of encryption algorithms and security blocks to protect data and ensure confidentiality, integrity and availability.
Because encryption protects the data itself rather than relying on the physical medium on which the data is stored, our products are suited to use in a wide variety of applications. They are used to implement Internet protocols such as IPsec, MACsec, and SSL/TLS for communications protection; to implement Digital Rights Management or DRM for multimedia content piracy prevention; and to implement functions including secure boot and hardware-based key protection for computing platform integrity.
We provide our embedded security solutions to two primary markets:
Mobile – we provide our secure platform products, our DRM products, and our communications security products to mobile device vendors, mobile semiconductor vendors, and mobile infrastructure vendors.
Networking – we provide our packet engine hardware IP and our communications security software toolkits to networking infrastructure vendors.
In addition to these primary markets, our embedded security solutions serve a variety of secondary markets, including the Ethernet security market, the Femtocell market, and the multi-function printer market.
Technology
AuthenTec's award-winning technology is built on a strong foundation of intellectual property. In fact, AuthenTec has more patents today than any peer company, with nearly 200 filed and issued U.S. patents. These patents include many of the foundational IP from the biometric fingerprint sensor industry and cover sensor and packaging design, software, end user applications and embedded security. Included below are just of a few of the technologies that have helped AuthenTec become a leader in security and identity management.
Live Layer Fingerprint Imaging
AuthenTec sensors are based on subsurface fingerprint imaging technology specifically and uniquely designed to read fingerprint patterns from everyone, under a wide variety of conditions. AuthenTec’s semiconductor-based sensors are based on both capacitive and radio frequency (RF) technology that detects an image of the fingerprint ridge and valley pattern beneath the surface of the skin, thus capturing sharp and clear fingerprint patterns from the live layer. This approach, which is in marked contrast with optical, thermal and other solutions that simply read the surface of the skin, gives AuthenTec sensors significant advantages in image quality and in the protective coatings that the sensor can image through.
TouchStone™
TouchStone is a highly durable waterproof packaging technology that combines smart sensor biometric performance and features with flexible aesthetic options for designers of today's ultra-thin mobile phones. TouchStone packaging was used in the world's first waterproof smartphone with a fingerprint sensor, and has been used in several waterproof models since.
SteelCoat™
SteelCoat is a unique protective coating for AuthenTec Smart Sensors and TouchChips that significantly enhances durability and enhances resistance to electrostatic discharge (ESD). SteelCoat is a hard epoxy protective coating for long, trouble-free sensor operation and is tested to withstand over 20 million swipes.
9
Fingerprint Matching
AuthenTec’s provides the most accurate fingerprint matching possible, allowing it to create sensors that are more secure, smaller, and lower cost than sensors using surface technologies. Captured digital fingerprint images are analyzed by a patented algorithm technology for extracting and matching unique information from a fingerprint. AuthenTec uses a combination of global and local features in the fingerprint image to maximize information density and incorporates patented compositing techniques to build a fingerprint template over time. This is essential for the convenient operation of a small sensor and also eliminates the need for the user to accurately position a finger in the same place each time.
Anti-Spoofing
AuthenTec's anti-spoofing technology dynamically measures the properties of finger skin placed on the sensor while the finger is being scanned. This patented technology ensures that only real fingerprints are read by converting the properties of the skin into digital data which are delivered to the host computer for analysis. AuthenTec anti-spoofing technology then compares the data with expected properties to ensure fingerprint authentication.
TrueNav™
As AuthenTec’s next generation solution for fluid on screen graphic and menu navigation with just the swipe of a finger, TrueNav utilizes the high quality image capabilities of TruePrint to track the motion of a finger placed on the sensor. Motion is tracked and processed to create two dimensional direction vectors, which are then used by the display system on the host to control the motion of an on screen cursor. Additionally, TrueNav relies on the combined strengths of silicon circuitry and software, as well as techniques to minimize the amount of power consumed by the silicon – critical for mobile applications where frequent use of cursor navigation would otherwise drain the battery.
Encryption
AuthenTec applies expertise encryption technologies to a wide variety of applications and Virtual Private Networks (“VPN’s”), while ensuring ease-of-use, performance, and scalability. Recent innovations in this area include the application of DRM to downloadable mobile applications, exploiting the rise of the “application store”; and enablement of install of IPsec functionality by non-root users.
Selling and Marketing
We sell our products worldwide through multiple channels, including our international direct sales force and our network of independent sales representatives and distributors. Each of these sales channels is supported by our customer service and marketing organizations. We have customer service personnel in Melbourne, Florida and Taipei, Taiwan. Our sales and application engineering offices are in the United States, Germany, Taiwan, China, South Korea and Japan. We will expand our sales and technical support capabilities in key regions as necessary.
Our sales organization engages directly with all major customers and is instrumental to the design process. Our direct sales force is supplemented with independent sales representatives and distributors, who have been selected based on their understanding of our target markets, technical knowledge and relationships with our target customers. Sales in conjunction with our sales representatives accounted for a significant portion of our revenue in 2010, 2009 and 2008.
Our sales cycle can vary widely and is dependent on the specific customer’s research and development cycle. The sales cycle requires a significant investment in time, resources and engineering support before realization of income from product sales, if at all.
Our marketing group is responsible for market analysis, market and customer development as well as product definition and is focused on capitalizing on market opportunities. This group works closely with our product research and development groups to align development programs and product launches with our customers’ schedules. Additionally, this group is responsible for the production and dissemination of sales and marketing materials, such as product announcements, press releases, brochures, magazine articles, advertisements and cover features in trade journals and other publications. We also participate in public relations and promotional events, including industry tradeshows and technical conferences.
As of December 31, 2010, we had 48 full time employees in our selling and marketing group.
10
Customers
Smart Sensor Solutions Segment
We principally sell our semiconductor products, either directly or through distributors, to OEMs, ODMs and contract manufacturers. ODMs and contract manufacturers typically design and manufacture products to sell to OEMs. The primary markets utilizing our products and services are PCs served by large PC OEMs, such as Acer, ASUSTek, Fujitsu, Dell, Hewlett-Packard, Lenovo and Toshiba, and wireless device OEMs such as Acer, Fujitsu, LG, Medion, Motorola and Samsung. We work with these and other OEMs to understand their requirements and provide them with solutions which they then qualify and, in some cases, specify for use within their systems. We sell our products with standard warranty provisions for defects in materials, workmanship and product performance. At our option, defective products may be returned for their purchase price or for replacement.
In any given year, our customer shipment mix will change based on new products, design wins, our customer’s success selling their end products and shifts in the ODM’s used by the OEM’s. In 2010, Fujitsu, Ltd., Lenovo Group, Ltd. and Edom Technology Co., Ltd. constituted 14%, 11% and 8% of our revenue, respectively. In 2009, they represented 19%, 17%, and 27% of our revenue, respectively, and in 2008, 13%, below 10%, and11% of our revenue, respectively. Edom Technology Co., Ltd. is a distributor that sells products to ODMs that manufacture products for OEMs. This distributor is an independent entity that assists us in identifying and servicing OEMs and generally purchases our products directly from us for resale to OEMs, ODMs or contract manufacturers. In general, distributors exclusively service a particular region or customer base, and purchase our products through purchase orders that may be cancelled or rescheduled. These distributors may also act as sales representatives and receive commissions on sales of our products.
Embedded Security Solutions Segment
We principally sell our products directly to OEMs, software application vendors, and service providers. The primary markets utilizing our products and services are wireless device OEMs such as LG, Motorola, NEC, and Samsung, and networking OEMs, such as Cisco and Juniper. We license our products to our customers so the customers can embed the product into their offerings. We sell our products with standard warranty provisions for defects in workmanship and product performance.
Manufacturing
We do not own or operate semiconductor fabrication, wafer bumping, assembly or test facilities. We depend on third-party subcontractors to fabricate, assemble and test our fingerprint sensor products. By outsourcing manufacturing, we are able to avoid the cost associated with owning and operating our own manufacturing facility. This allows us to focus our efforts on the design and marketing of our products.
Semiconductor Fabrication. We currently outsource most of our semiconductor wafer fabrication to three wafer foundries, Taiwan Semiconductor Manufacturing Company, Ltd., or TSMC, Global Foundries Singapore PTE. LTD., and ST Microelectronics. Our fingerprint sensors are currently fabricated in several advanced sub-micron manufacturing processes at wafer fabrication facilities located in many countries which allows for significant capacity along with geographic diversity. Because finer manufacturing processes lead to enhanced performance, smaller silicon chip size and lower power requirements, we continually evaluate the benefits and feasibility of migrating to smaller geometry process technologies in order to reduce cost and improve performance. Our engineers work closely with the wafer foundries to increase yields, lower manufacturing costs and improve quality. We may eventually qualify and retain additional foundries to manufacture our products in the future.
Wafer Bumping. Most of our products are shipped from the wafer foundry to a third-party wafer bumping facility. Bumping is the application of a thin layer of metal to hermetically seal the bond pads on the wafer and to add the drive ring on certain of our sensors. We outsource most of the wafer gold bumping of our products to Chipbond in Taiwan, which is one of the largest providers of such subcontract services in the world.
Assembly and Test. We presently outsource all assembly and testing of our products to subcontractors, Signetics in South Korea, ISA Micro Electronics is China and Hong Kong, and Amkor Technology in Korea and the Philippines. Our products are designed to use low cost packages and to be tested with widely available test equipment. We intend to qualify and retain additional assembly and test subcontractors in the future to meet our capacity and diversity requirements.
11
Quality Assurance. We are committed to maintaining the highest level of quality in our fingerprint sensors. We have designed and implemented a quality management system that we believe provides the framework for continual improvement of products, processes and customer service. We also rely on in-depth simulation studies, testing and practical application testing to validate and verify our semiconductors. To help ensure consistent product quality, reliability and yield, we work closely with our manufacturing logistics partners to monitor the production cycle by reviewing manufacturing process data from each wafer foundry and assembly subcontractor. In 2009, after an audit and certification process, we received ISO9001:2008 quality certification.
Research and Development
We devote substantial resources to the research and development of new products that enhance our competitive position and provide increased value. We continue to increase our product performance by driving improvements in all aspects of our technologies and products. Such improvements include the development of cost effective sensors that maintain strong biometric accuracy and incorporate security capabilities that support end-to-end system security; the development of associated software that facilitates easy integration, promotes end-user adoption and provides end-user touch points through ecommerce and support faculties; the compliance of our government and access control solutions with existing and emerging standards in biometric performance; and the extension of embedded security offering to target supplemental vertical markets. In 2010, 2009 and 2008, we had research and development expenses of $20.7 million, $14.5 million and $16.5 million, respectively. As of December 31, 2010, we had 151 employees in our research and development group.
Intellectual Property
We seek to protect our intellectual property rights with a combination of patents, trademarks, copyrights, trade secret laws and disclosure restrictions. We rely primarily on trade secrets, technical know-how and other unpatented proprietary information relating to our design and product development activities. We have 141 issued patents and 53 pending patents, including 57 issued and 16 pending patents purchased during the year ended December 31, 2010. We have also applied for patents for many of our key technologies in regions such as Asia and the European Union. The oldest patents owned by us were originally filed in the United States Patent Office in 1995 and will begin to expire in 2015.
The laws of other countries in which we market our products, such as some countries in the Asia/Pacific region, may offer little or no protection for our proprietary technologies. Reverse engineering, unauthorized copying or other misappropriation of our proprietary technologies could enable third parties to benefit from our technologies without paying us for doing so. We also enter into confidentiality and proprietary rights agreements with our employees, consultants, customers, subcontractors and other third parties and control access to our designs, documentation and other proprietary information. If a claim is asserted that we have infringed the intellectual property of a third-party, we may be required to seek licenses to that technology. In addition, we license third-party technologies that are incorporated into some elements of our products. Third-parties may infringe or misappropriate our proprietary rights. See “Risk Factors” in Part I, Item 1A of this Annual Report.
In addition to the proceedings described in “Legal Proceedings” in Part I, Item 3 of this Annual Report, we may be required to resort to additional litigation to enforce our intellectual property rights. We may also be subject to legal proceedings and claims relating to our intellectual property in the ordinary course of our business. Intellectual property litigation is expensive and time-consuming and could divert management’s attention away from running our business. If a claim is asserted that we infringe the intellectual property of a third-party, we may be required to pay substantial damages to the party claiming infringement, stop selling products or using technology that contains the allegedly infringing intellectual property, develop non-infringing technology or enter into royalty or license arrangements that may not be available on commercially reasonable terms and conditions.
Competition
The markets for our products are highly competitive and are characterized by rapid technological change, declining average selling price and continuously evolving customer requirements. We believe that the principal competitive factors in our markets include:
|
•
|
The ability to consistently deliver biometric performance across the widest user demographics;
|
|
•
|
The ability to provide solutions that meet evolving security requirements;
|
|
•
|
Providing complete solutions including the sensor and application software;
|
|
•
|
Low-cost;
|
|
•
|
The ability to add value by offering products with more functionally, such as navigation;
|
|
•
|
Small size, convenience and ease of use;
|
12
|
•
|
Aesthetics and ergonomic designs that complement the customers’ products;
|
|
•
|
The breadth and diversity of product offerings;
|
|
•
|
The ability to provide a reliable supply of products in sufficient quantities and in a timely manner;
|
|
•
|
The quality of customer service and technical support;
|
|
•
|
The ability to operate in harsh physical environments; and
|
|
•
|
Financial and operational stability and reputation.
|
We believe we currently compete favorably with respect to many of these factors in the aggregate, although some of our present or future competitors could have substantial competitive advantages including greater name recognition and deeper penetration of our target markets, broader and more diversified products and services, larger sales forces and budgets, more established relationships with customers, better sales channels and substantially greater financial, technical and/or other resources. We cannot assure that our products will continue to compete favorably or that we will be successful in the face of increasing competition from new products and enhancements introduced by existing competitors or new companies entering our market. Increased competition could harm our business, by, for example, increasing pressure on our profit margins or causing us to lose customers. In addition, delivery of products with defects or reliability, quality or compatibility problems may damage our reputation and competitive position.
We compete primarily with other suppliers of biometric fingerprint sensors used in consumer, enterprise and government applications as well as providers of embedded security. Our principal biometric competitors include private companies EgisTec Inc. and Validity Sensors, Inc, and our principal embedded security competitors include private companies Discretix, Ltd. and Mocana Corp. In the future, competition could intensify if new competitors enter our markets.
Employees
As of December 31, 2010, we had 242 full-time employees, including 151 in research and development, 12 in operations, 48 in sales and marketing and 31in general and administrative functions. We have never experienced a work stoppage and none of our employees is represented by a labor organization or under any collective bargaining arrangements. We believe we have good relations with our employees.
Facilities
Our main offices occupy approximately 38,000 square feet in Melbourne, Florida under a lease that expires in October 2014. We also lease properties in China, South Korea, Taiwan, Japan, Netherlands, Finland, Czech Republic and California. We do not own any manufacturing facilities and contract to third parties the production and distribution of our semiconductors. We believe that our existing facilities meet our current needs and that suitable additional or substitute space will be available as needed to accommodate expansion of our operations.
Reporting Segments
Historically we operated in one segment. The acquisition of SafeNet’s Embedded Security Solutions division has not only broadened our revenue range which results in differentiation of our product categories but also causes evaluation of disaggregated financial information separately by our chief operating decision maker. This acquisition resulted in a new segment in its entirety. Accordingly, we determined that we now operate in two reporting segments: Smart Sensor Solutions (“SSS”) and Embedded Security Solutions (“ESS”). The operating results from the UPEK acquisition are included in our Smart Sensor Solutions segment. A description of the types of products and services provided by each business segment is described above in “Products”.
For financial information regarding our two reporting segments as well as our geographic areas of operation, refer to Note 11 of Notes to “Consolidated Financial Statements and Supplementary Data,” in Part II, Item 8 of this Annual Report.
13
Trademarks and Service Marks
Our trademarks include AuthenTec®, TouchChip tm, TrueNav tm, , Eikon tm, TrueSuite®, TouchStone tm, SteelCoat tm, QuickSec tm, SafeXcel tm, DRM Fusion tm, SafeZone tm, and KeepSafe tm . All other trademarks or service marks appearing in this Annual Report on Form 10-K are trademarks or service marks of others.
Corporate Information
We were incorporated in Delaware in 1998. Our principal executive offices are located at 100 Rialto Place, Suite 100, Melbourne, Florida 32901, and our telephone number is (321) 308-1300. Our website address is www.authentec.com. The information on, or that can be accessed through, our website is not part of this Annual Report on Form 10-K.
Website Posting of SEC Filings
Our annual reports on Form 10-K, quarterly reports on Form 10-Q, current reports on Form 8-K and amendments to such reports are available, free of charge, on our website: http://investors.authentec.com/. Further, the public can read and copy any materials we file with the SEC, including a copy of this Annual Report on Form 10-K at the SEC’s Public Reference Room at 100 F Street, NE, Washington, D.C. 20549. Information on the operation of the Public Reference Room can be obtained by calling the SEC at 1-800-SEC-0330. The SEC maintains an internet site that contains reports, proxy and information statements and other information regarding our filings at www.sec.gov.
Item 1A. Risk Factors
This section highlights the material risks that we currently face. Please be aware that these risks may change over time and other risks may prove to be important in the future. New risks may emerge at any time, and we cannot predict such risks or estimate the extent to which they may affect our business, financial condition or results of operations or the trading price of our securities..
Risks Related to Our Business
If we are unable to become profitable and cash flow positive in the near future, our business and long-term prospects may be harmed.
We generated net operating losses of $31.8 million in 2010 and used cash of approximately $14.2 million in 2010. Our inability to produce future profitability or positive cash flow will negatively affect our capacity to implement our business strategy and may require us to take actions in the short-term that will impair the long-term prospects of our business. Our inability to produce future profitability or positive cash flow may also result in liquidity problems and impair our ability to finance our continuing business operations on terms that are acceptable to us.
Our acquisition of companies or technologies could prove difficult to integrate, disrupt our business, dilute stockholder value and adversely affect our operating results.
We have acquired and may acquire or make investments in the future in companies, assets or technologies that we believe are complementary or strategic. In connection with these acquisitions and investments, we face numerous risks, including:
|
·
|
difficulties in integrating operations, technologies, products and personnel;
|
|
·
|
diversion of financial and managerial resources from existing operations;
|
|
·
|
risk of overpaying for or misjudging the strategic fit of an acquired company, asset or technology;
|
|
·
|
problems or liabilities stemming from defects of an acquired product or intellectual property or other litigation that may result from offering the acquired product in our markets;
|
|
·
|
challenges in retaining employees key to realizing the value of the acquisition or investment;
|
|
·
|
inability to generate sufficient return on investment;
|
|
·
|
incurrence of significant one-time write-offs;
|
|
·
|
challenges and unexpected costs in carrying out restructuring and integration plans overseas, including workforce reductions and facility closures; and
|
|
·
|
delays in customer purchases due to uncertainty.
|
14
Acquisitions and investments may require us to use a considerable amount of our cash and investments, which may decrease our liquidity. We may also be required to finance a transaction through debt or equity securities offerings, which may dilute our stockholders and affect the market price of our common stock. As a result, if we fail to properly evaluate and execute acquisitions or investments, our business and prospects may be harmed.
On February 26, 2010, we acquired SafeNet, Inc.’s Embedded Security Solutions Division. Under terms of the transaction, we paid $8.5 million in cash and issued 1.2 million shares (valued at $2.8 million at the closing) of our common stock. The transaction also called for an earn-out of up to $2.5 million in cash based on the attainment of certain revenue goals in 2010 which were not achieved. There can be no guarantee that we will realize the anticipated benefits of this transaction.
As described above, we also acquired UPEK on September 7, 2010. Under the terms of the transaction, we acquired all of the outstanding shares of capital stock of UPEK in exchange for 5,956,540 shares of our common stock and a non-interest bearing promissory note in the principal amount of $21,557,559 which was settled on December 22, 2010 upon vote by our shareholders by issuing additional 7,984,281 shares of our common stock. We may encounter difficulties during the integration of these businesses. A substantial delay in the integration of UPEK or any future acquisition or investment could result in a delay or failure to achieve the anticipated synergies, which could adversely impact our results of operations.
Our quarterly operating results will likely fluctuate in the future.
We believe our quarterly operating results will be subject to fluctuation due to various factors, many of which are beyond our control. Factors that may affect quarterly operating results in the future include:
|
·
|
our ability to attract new customers, retain existing customers and increase revenue;
|
|
·
|
unpredictability of the timing and size of customer orders or customer cancellations of existing orders since most of our customers purchase our products on a purchase order basis rather than pursuant to a long-term contract;
|
|
·
|
unpredictability of royalty payments for our embedded security hardware intellectual property cores and software toolkits since these payments are based on the future sales of our customers products rather than a fixed royalty payment schedule;
|
|
·
|
general economic conditions in our geographic markets;
|
|
·
|
fluctuations in the capacities of and costs from our subcontractors in order to satisfy customer requirements;
|
|
·
|
variability of our margins based on changes in the mix of products shipped, production yields and other costs;
|
|
·
|
variability of operating expenses as a percentage of revenue;
|
|
·
|
our ability to introduce new and innovative fingerprint authentication solutions that appeal to our customers;
|
|
·
|
changes in our product pricing including those made in response to new product announcements and pricing changes of our competitors;
|
|
·
|
fluctuations based upon seasonality;
|
|
·
|
our rate of expansion, domestically and internationally;
|
|
·
|
the effectiveness of our sales force and the efforts of our distributors and sales representatives; and
|
|
·
|
the effect of mergers and acquisitions on our company, our competitors, our suppliers or our customers.
|
The fluctuation of our quarterly operating results may render period-to-period comparisons of our operating results less meaningful, and you should not rely upon them as an indication of future performance. Accordingly, it is difficult for us and others to accurately forecast our business and results of operations on a quarterly basis. If we fail to meet the estimates and expectations of investors or analysts, our stock price may fall rapidly and without notice.
Our future financial performance will depend on the widespread acceptance of biometric solutions.
In its short history, the biometrics market has been characterized by the frequent introduction of new technologies and products. Although the market has grown rapidly in the past, the overall market witnessed a material reduction in 2009 and 2010. There is no assurance that the market will see the growth it had in the past. Consumers and corporations may not find value in having biometric technologies integrated in the products they use such as PCs, wireless devices and access control systems. If end users do not value the product, then our customers may decide not to use our sensors in their future products. In addition, there are multiple variants of biometric technologies beyond fingerprint including face, hand, vein, voice, iris and others. Our customers, and their end users, may find these technologies of greater value and choose these technologies over our own.
15
The expansion of the biometric market also depends on the following factors:
|
·
|
public perception regarding the intrusiveness of our biometrics and the manner in which organizations use the biometric information collected;
|
|
·
|
legislation related to biometric information;
|
|
·
|
publicity regarding biometric solutions; and
|
|
·
|
security or use issues associated with our or competitive products that may reflect poorly on the biometrics market in general.
|
Even if biometric solutions gain wide market acceptance, our solutions may not adequately address market requirements and may not gain market acceptance.
If the market for e-security solutions does not continue to grow, then demand for our products and services may decrease.
The market for some of our e-security solutions is continuing to develop, and demand for our products and services depends on, among other things:
|
·
|
the perceived ability of our products and services to address real customer problems;
|
|
·
|
the perceived quality, price, ease-of-use and interoperability of our products and services as compared to those of our competitors;
|
|
·
|
the market’s perception of how easy or difficult it is to deploy our products, especially in complex, heterogeneous network environments;
|
|
·
|
the continued evolution of electronic commerce as a viable means of conducting business;
|
|
·
|
market acceptance and use of new technologies and standards;
|
|
·
|
the public’s perception of the need for secure electronic commerce and communications over both wired and wireless computer networks;
|
|
·
|
the pace of technological change and our ability to effectively adapt to with these changes; and
|
|
·
|
general economic conditions, which, among other things, influence how much money our customers and potential customers are willing to spend on information technology.
|
If we fail to achieve initial design-wins for our biometric security products, we may lose the opportunity to generate revenue for a lengthy period of time and be unable to recoup our investments in such products.
We expend considerable resources to achieve design-wins for our biometric security products, especially our new products and product enhancements. After a design-win has been awarded, customers may cancel, postpone, or significantly reduce production volume, which could adversely impact our future revenue. If we fail to achieve an initial design-win in a customer’s procurement process, we may lose the opportunity for significant sales to that customer for a number of its products and for a lengthy period of time. Once a customer designs a fingerprint sensor into a product, it is likely to continue to use the same sensor or enhanced versions of that sensor from the same supplier across a number of similar and successor products for a period of time due to the significant costs associated with qualifying a new supplier and potentially redesigning the product to incorporate a different fingerprint sensor. This may cause us to be unable to recoup our investments in our products, which would harm our business.
The markets in which we participate are highly competitive, and if we do not compete effectively, we may not be able to increase our market penetration, grow our revenue or improve our gross margins.
The fingerprint authentication market and the embedded security market are very competitive and changing rapidly. We expect increased challenges from existing as well as potentially new competitors. Some of our competitors have offered solutions at lower prices, which have resulted in pricing pressure on sales of our products. We expect further downward pricing pressure from our competitors and expect that we will have to price our products aggressively to maintain or increase our market share. If we are unable to reduce our costs, our operating results could be negatively impacted. Increased competition generally may also result in reduced revenue, lower margins or the failure of our products to achieve or maintain widespread market acceptance, any of which could have a material adverse effect on our business, results of operations and financial condition.
16
Some of our present or future competitors could enjoy one or more substantial competitive advantages, such as:
|
·
|
more established relationships with customers, contract manufacturers and suppliers;
|
|
·
|
greater name recognition and deeper penetration of our target markets;
|
|
·
|
a broader and more diversified array of products and services;
|
|
·
|
larger selling and marketing organizations, research and development teams and budgets;
|
|
·
|
better sales channels;
|
|
·
|
larger customer service and support organizations with greater geographic scope;
|
|
·
|
longer operating histories; and
|
|
·
|
greater financial, technical and other resources.
|
Our present competitors in the fingerprint sensor market include private companies such as EgisTec, Inc. and Validity Sensors, Inc. and in our embedded security business include Discretix and Mocana. In addition, certain of our customers offer competitive technologies which could displace our own. Our competitors may be able to respond more quickly and effectively than we can to new or changing opportunities, technologies, standards or customer requirements. The challenges we face from new and potentially larger competitors will become greater if consolidation or collaboration between or among our competitors occurs in our industry. For all of these reasons, we may not be able to compete successfully against our current or future competitors, and if we do not compete effectively, our ability to increase our revenue and become cash flow positive and profitable may be impaired.
We depend on a relatively small number of significant customers for a significant portion of our revenue.
A relatively small number of customers account for a significant portion of our revenue in any particular period. Our top five customers accounted for 47% of our revenue in fiscal 2010 and 79% of our revenue in fiscal 2009. Our customer concentration decreased significantly as compared to the last year as a result of our recent acquisitions and we anticipate that it will continue to decrease in 2011, but it is expected to remain high and attendant risk will continue in future periods. The loss of any significant end customer will limit our ability to sustain or grow our revenue and could significantly affect our ability to achieve profitability and become cash flow positive in the future.
We are in rapidly changing industries and must adapt quickly to succeed.
You must consider our business and prospects in light of the risks and difficulties we encountered over the past four years as a growing technology company in a very competitive market. These risks and difficulties include, but are not limited to the risks identified below and in particular the following factors:
|
·
|
the timing and success of new products and new technologies introduced by us and our competitors;
|
|
·
|
our ability to build brand awareness in a highly competitive market; and
|
|
·
|
our ability to increase production in a timely and on a cost-effective basis.
|
We may not be able to successfully address any of these risks or others. Failure to do so adequately could harm our business and cause our operating results to suffer.
Unless we keep up with the ongoing changes in e-security technology and standards, our products and services could become obsolete.
Our success depends in part upon our ability to enhance our existing products and to introduce new, competitively priced products and solutions with features that meet changing market requirements, all in a timely and cost-effective manner. A number of factors, including the following, could have a negative impact on the success of our products and services:
|
·
|
quality, reliability or security failures, which could result in product returns, delays in collecting accounts receivable, unexpected service or warranty expenses, reduced orders and a decline in our competitive position;
|
|
·
|
delays or difficulties in the development of our products and services;
|
17
|
·
|
our competitors’ introduction of new products or services ahead of our new products or services, or their introduction of superior or cheaper products or services;
|
|
·
|
the availability of free, unpatented implementations of encryption algorithms and security protocols;
|
|
·
|
the market’s failure to accept new technologies;
|
|
·
|
our failure to anticipate changes in customers’ requirements; and
|
|
·
|
the implementation of industry or government standards that are inconsistent with the technology embodied in our products and services.
|
If any of our products are found to have, or suspected to have, security vulnerabilities, then we could incur significant costs and damage to our reputation.
If any of our products are found to have significant security vulnerabilities, then we may need to dedicate engineering and other resources to eliminate the vulnerabilities and to repair or replace products already sold or licensed to our customers. In addition, our customers and potential customers could perceive our products as unreliable, making it more difficult for us to sell our products.
Our success depends on an increase in the demand for Embedded security product offering.
Our customers may defer the purchase of, stop using or not renew the subscription license for our embedded security products and services at any time and certain license agreements may be terminated by the customer at any time. We negotiate most of our customer contracts on a case-by-case basis, which makes our revenues difficult to predict. Our existing customer contracts typically provide for base license fees on a perpetual basis, technology access fees and/or royalties based on a per unit or per usage charge or a percentage of revenues from licensees’ products containing our technology. Additionally, a number of our large contracts provide that we will not earn additional royalty revenues from those contracts until these customers’ shipments exceed certain thresholds. As a result, a portion of our revenues is not recurring from period to period, which makes them more difficult to predict. Our expense levels are based, in part, on our expectations of future revenues and are largely fixed in the short term. We may not be able to adjust spending in a timely manner to compensate for any unexpected shortfall in revenues.
Ineffective customer support could harm our business.
It is imperative that we provide responsive quality customer support given our dependency on a relatively small number of customers. Our success may depend on how well we minimize our customer’s business exposure when a critical issue arises with our product. Inadequate response times, lack of qualified personnel, or untimely resolutions could result in damage to our reputation, lost revenues and the loss or delay in achieving market acceptance due to our inability to respond to critical customer issues.
Further, to provide products that are compliant with standards that have been adopted or will be adopted in the future, we may have to license patents owned by others. As a part of some standards processes, other companies have disclosed patents that they believe are required to implement those standards. We cannot assure you that we will be able to gain licenses to these patents, if needed, on terms acceptable to us. Such licensing requirements may materially adversely affect the value of our products, and, consequently, our business, financial condition, liquidity and operating results.
The semiconductor industry has historically experienced significant fluctuations with prolonged downturns, which could impact our operating results, financial condition and cash flows.
The semiconductor industry has historically exhibited cyclical behavior, which at various times has included significant downturns in customer demand. Because a significant portion of our expenses is fixed in the near term or is incurred in advance of anticipated revenue, we may not be able to decrease our expenses rapidly enough to offset any unanticipated shortfall in revenue. If this situation were to occur, it could adversely affect our operating results, cash flow and financial condition.
Furthermore, the semiconductor industry has experienced periods of increased demand and production constraints. If this happens in the future, we may not be able to produce sufficient quantities of our products to meet the increased demand. We may also have difficulty in obtaining sufficient wafer, assembly and test resources from our independent subcontractors. Any factor adversely affecting the semiconductor industry in general, or the particular segments of the industry that our products target, may adversely affect our ability to generate revenue and could negatively impact our operating results.
18
Resolution of claims that we have violated or may violate the intellectual property rights of others could materially harm our business and could require us to indemnify our customers, resellers or vendors, redesign our products, pay significant royalties to third parties or expend additional development resources to redesign our products.
The industries in which we operate are marked by a large number of patents, copyrights, trade secrets and trademarks and by frequent litigation based on allegations of infringement or other violation of intellectual property rights. At any time, a third-party may assert that our technology or products violates such party’s intellectual property rights. Successful intellectual property claims against us could result in significant financial liability or prevent us from operating our business or portions of our business as currently conducted. In addition, resolution of claims may require us to redesign our solutions, to obtain licenses to use intellectual property belonging to third parties, which we may not be able to obtain on reasonable terms, to cease using the technology covered by those rights and to indemnify our customers, resellers or vendors. Any claim, regardless of its merits, could be expensive and time consuming to defend against and divert the attention of our technical and management resources.
On July 19, 2009, Innovative Biometric Technology, LLC (“IBT”) sued Lenovo and Fujitsu for patent infringement. In February of 2010, IBT added ASUS, MSI Computers, Toshiba, and Sony to the case. Certain of these defendants are customers of ours and, in the ordinary course of our business, have requested that we defend and/or indemnify them in this litigation pursuant to the terms of our written supply agreements. In response to these requests, we decided to intervene in the litigation to assert all defenses and affirmative claims available to AuthenTec in this action. On November 8, 2010, we filed a motion to intervene in the action because IBT’s allegations relate in part to the use of biometric software or hardware supplied by us to certain of our customers that are named as defendants in this lawsuit. The motion to intervene was granted by the Court on November 9, 2010. The parties have taken positions on claim construction and claim construction hearing is expected to be set by the end of the first quarter of 2011. Discovery is scheduled to end by early June 2011, all pretrial motions and memoranda of law are due by July 1, 2011, and a trial date is set for December 5, 2011. IBT is seeking unspecified monetary damages from the defendants in this case. While we are of the opinion that IBT’s patent is invalid and not infringed, our involvement in this litigation and our potential indemnification obligations to our customers may result in material expense to us, including legal and other costs incurred to defend such claims, and such expenses may have a material adverse impact on our financial condition and results of operation.
Questions of infringement in our markets involve highly technical and subjective analyses. Litigation may be necessary in the future to enforce our patents and other intellectual property rights, to protect our trade secrets, to determine the validity and scope of the proprietary rights of others or to defend against claims of infringement or invalidity, and we may not prevail in any such future litigation. Litigation, whether or not determined in our favor or settled, is costly, could harm our reputation, could cause our customers to use our competitors’ products and could divert the efforts and attention of our management and technical personnel from normal business operations.
Any failure to protect our intellectual property rights, trade secrets, copyrights, trademarks and technical know-how could impair our competitiveness.
Our ability to prevent competitors from gaining access to our technology is essential to our success. If we fail to protect our intellectual property rights adequately, we may lose an important advantage in the markets in which we compete. Trademark, patent, copyright and trade secret laws in the United States and other jurisdictions as well as our internal confidentiality procedures and contractual provisions are the core of our efforts to protect our proprietary technology and our brand. Our patents and other intellectual property rights may be challenged by others or invalidated through administrative proceedings or litigation, and we may initiate claims or litigation against third parties for infringement of our proprietary rights. Such administrative proceedings and litigation are inherently uncertain and divert resources that could be put towards other business priorities. We may not be able to obtain a favorable outcome and may spend considerable resources in our efforts to defend and protect our intellectual property.
Furthermore, legal standards relating to the validity, enforceability and scope of protection of intellectual property rights are uncertain. We may be unable to obtain additional patent protection in the future or obtain patents with claims of scope necessary to cover our technology. Effective patent, trademark, copyright and trade secret protection may not be available to us in every country in which our products are available. The laws of some foreign countries may not be as protective of intellectual property rights as those in the United States, and mechanisms for enforcement of intellectual property rights may be inadequate.
Accordingly, despite our efforts, we may be unable to prevent third parties from infringing upon or misappropriating our intellectual property and using our technology for their competitive advantage. Any such infringement or misappropriation could have a material adverse effect on our business, results of operations and financial condition.
There can be no assurance that the patents of others will not have an effect on our ability to do business. In addition, we cannot assure you that our intellectual property rights will be adequate to prevent our competitors from copying or reverse-engineering our products, or that our competitors will not independently develop similar or competing technologies or methods or design around any patents that may be issued to us.
19
Our products must meet exacting specifications, and defects and failures may occur, which may cause customers to return or stop buying our products.
Our customers generally establish demanding specifications for quality, performance and reliability that our products must meet. However, our products are highly complex and may contain defects and failures when they are first introduced or as new versions are released. Our products are also subject to rough environments as they are integrated into our customer products for use by the end customers. If defects and failures occur in our products, we could experience lost revenue, increased costs, including warranty expense and costs associated with customer support, delays in or cancellations or rescheduling of orders or shipments, product returns or discounts, diversion of management resources or damage to our reputation and brand equity, and in some cases consequential damages, any of which would harm our operating results. In addition, delays in our ability to fill product orders as a result of quality control issues may negatively impact our relationship with our customers. We cannot assure you that we will have sufficient resources, including any available insurance, to satisfy any asserted claims.
We rely on a limited number of independent subcontractors for the manufacture, warehousing and shipping of our products, and the failure of any of these third-party vendors to deliver these products or otherwise perform as requested could damage our relationships with our customers, decrease our revenue and limit our growth.
We do not have our own wafer fabrication, assembly or test facilities and have a very limited in-house prototype testing operation. Therefore, we must rely on third-party subcontractors to manufacture the biometric security products we design and sell. We currently primarily rely on TSMC, Global Foundries and STMicro to fabricate our semiconductor products. We also rely on a limited number of other third-party vendors for additional manufacturing, technology, assembly and testing services. If these vendors do not provide us with high-quality manufacturing services, sufficient capacity and other services in a timely manner, or if one or more of these vendors terminates its relationship with us, we may be unable to obtain satisfactory replacements to fulfill customer orders on a timely basis, our relationships with our customers could suffer and our revenue could decrease. We may also be unable to find new vendors to provide needed supplies or other inputs for our products, which could materially impact our ability to introduce our products into the marketplace. We also rely on our close working relationships with these vendors to anticipate and deliver new products on a timely basis when new generation materials and technologies are made available. If we are not able to maintain our relationships with these vendors, our ability to quickly offer advanced technology and product innovations to our customers would be impaired.
The fabrication of integrated circuits is a complex and technically demanding process. Our subcontractors could, from time to time, experience manufacturing defects and reduced manufacturing yields. Changes in manufacturing processes or the inadvertent use of defective or contaminated materials could result in lower than anticipated manufacturing yields or unacceptable performance. Many of these problems are difficult to detect at an early stage of the manufacturing process and may be time consuming and expensive to correct. In addition, production yields for new products are generally lower at the initial production ramp. Product yields depend on our product design, the fabrication technology and the assembly process. Identifying yield problems can only occur in the production cycle when a product can be physically analyzed and tested in volume. Poor yields, integration issues or other performance problems in our products could cause us significant customer relations and business reputation problems, harm our financial results and result in financial or other damages to our customers. Our customers could also seek damages from us for their losses. A product liability claim brought against us, even if unsuccessful, would likely be time consuming and costly to defend.
Other potential risks associated with relying on third-party subcontractors include:
|
·
|
reduced control over product cost, delivery schedules and product quality;
|
|
·
|
potential price increases;
|
|
·
|
inability to achieve required production or test capacity and acceptable yields on a timely basis;
|
|
·
|
longer delivery times;
|
|
·
|
increased exposure to potential misappropriation of our intellectual property;
|
|
·
|
shortages of materials used to manufacture our products;
|
|
·
|
labor shortages or labor strikes;
|
|
·
|
quarantines or closures of manufacturing facilities due to the outbreak of viruses, such as SARS, the avian flu or any similar future outbreaks worldwide; and
|
|
·
|
political risks in countries we operate in.
|
20
We currently do not have long-term supply contracts with any of our subcontractors. Therefore, they are not obligated to perform services or supply products to us for any specific period, in any specific quantities or at any specific price, except as may be provided in a particular purchase order. Our subcontractors have not provided contractual assurances to us that adequate capacity will be available for us to meet future demand for our products. These third-party vendors may allocate capacity to the production of other companies’ products while reducing deliveries to us on short notice. In particular, other customers that are larger and better financed than we are or that have long-term agreements with our major suppliers and vendors may cause such suppliers and vendors to reallocate capacity to those customers, decreasing the capacity available to us.
Furthermore, a majority of our suppliers and vendors are located in the Pacific Rim region, where the risk of extreme weather and an earthquake is significant. The occurrence of earthquakes and other natural disasters could result in the disruption of operations and we may not be able to obtain alternate capacity on favorable terms, if at all, which could harm our operating results.
Our success will depend on the timely introduction of new biometric security products with increased functionality.
Our future financial performance will depend on our ability to meet customer specifications and requirements by enhancing our current fingerprint authentication solutions and developing products with new and better functionality. We devote significant resources to identifying new market trends and developing products to meet anticipated customer demand for fingerprint sensor solutions. Ultimately, however, customers may not purchase our solutions. Accordingly, we cannot assure you that demand for the type of solutions we offer and plan to offer will continue to develop as we anticipate, or at all. We must develop new products and enhance our existing products with improved technologies to meet rapidly evolving customer requirements. The success of new features depends on several factors, including their timely introduction and market acceptance. We may not be successful in developing enhancements or new solutions or bringing them to market in a timely manner. We could experience delays in completing the development and introduction of new products and product enhancements that may render our products, when introduced, obsolete and unmarketable. Customers may also defer purchases of our existing products pending the introduction of anticipated new products. If our new solutions are not competitive with solutions offered by other vendors, we may not be perceived as a technology leader and could miss market opportunities. If we are unable to enhance the functionality of our solutions or introduce new solutions which achieve widespread market acceptance, our reputation will be damaged, the value of our brand will diminish, and our business will suffer. In addition, uncertainties about the timing and nature of new features and products could result in increases in our research and development expenses with no assurance of future sales.
We manufacture our biometric security products based on our estimates of customer demand, and if our estimates are incorrect, our financial results could be negatively impacted.
Our revenue from our biometric security products is made on the basis of purchase orders rather than long-term purchase commitments. In addition, our customers may cancel purchase orders or defer the shipments of these products. We manufacture our biometric security products according to our estimates of customer demand. This process requires us to make multiple demands forecast assumptions, each of which may introduce error into our estimates. If we overestimate customer demand, we may manufacture products that we may not be able to sell. In addition, the rapid pace of innovation in our industry could render obsolete significant portions of such inventory. Excess or obsolete inventory levels for these or other reasons could result in unexpected expenses or increases in our reserves which would adversely affect our business and financial results. Conversely, if we underestimate customer demand or if sufficient manufacturing capacity were unavailable, we would forego revenue opportunities, lose market share and damage our customer relationships.
Our sales cycle is lengthy and expensive and could adversely affect the amount, timing and predictability of future revenue.
Our customers generally need three months to three years, if not longer, after initial contact to make a final purchase decision with respect to our products. As customers weigh their purchase options, we may expend significant resources in pursuit of a sale that may ultimately fail to close. We have little control over our customers’ budget cycles and approval processes, or the strength of competitors’ relationships with our potential customers, all of which could adversely affect our sales efforts. The introduction of new products and product enhancements may lengthen our sales cycle as customers defer a decision on purchasing existing products and evaluate our new products. If we are unsuccessful in closing sales after expending significant resources, our revenue, operating expenses, profitability and cash flow will be adversely affected.
If we lose any key employees or are unable to attract additional key employees, we may not be able to implement our business strategy in a timely manner.
Our future success depends in large part upon the continued service of our executive management team and other key employees. We are particularly dependent on the continued service of our existing research and development personnel because of the complexity of our products and technologies. Our employment arrangements with our executives and employees do not require them to provide services to us for any specific length of time, and they can terminate their employment with us at any time, with or without notice, without penalty. The loss of services of any of these executives or of one or more other key members of our team could seriously harm our business.
21
To execute our growth plan, we must continue to attract additional highly qualified personnel. We have experienced in the past, and may continue to experience, difficulty in hiring and retaining highly skilled employees with appropriate qualifications. If we are unable to attract and integrate additional key employees in a manner that enables us to scale our business and operations effectively, or if we do not maintain competitive compensation policies to retain our employees, our ability to operate effectively and efficiently could be limited.
Security breaches in systems which integrate our products could result in the disclosure of sensitive information that could result in the loss of customers and negative publicity.
Many of the sensors we sell protect private corporate or personal information. A security breach in one of these systems which integrate our products could cause serious harm to our business as a result of negative publicity and lost business. This risk is difficult to manage since our primary customer base, OEMs and ODMs, control the overall system design and security feature integration. In addition, most customers currently use third party software to interface with our fingerprint sensors. However, should a customer or end user lose important sensitive information, they may elect to pursue a legal claim against us for their perceived damage.
We work with distributors and sales representatives to sell our products, and if our relationships with one or more of those distributors or sales representatives were to terminate, our operating results may be impacted.
We rely in part upon third parties, including independent sales representatives and distributors, to promote our products, generate demand and sales leads, and obtain orders for our products. These distributors and sales representatives also provide technical sales support to our customers. The activities of these third parties are not within our direct control. Our failure to manage our relationships with these third parties effectively could impair the effectiveness of our sales, marketing and support activities. A reduction in the sales efforts, technical capabilities or financial viability of these parties, a misalignment of interest between us and them, or a termination of our relationship with a major sales representative or distributor could have a negative effect on our revenue, financial results and ability to support our customers. These parties are engaged under short-term contracts, which typically may be terminated by either party on 30 to 60 days notice. It generally takes approximately three months for a third-party such as a sales representative to become educated about our products and capable of providing quality sales and technical support to our customers. If we were to terminate our relationship with a distributor or one of the larger sales representatives, or if one of them decided to discontinue its relationship with us, sales to current and prospective customers could be disrupted or delayed, and we could experience a diversion of substantial time and resources as we seek to identify, contract with and train a replacement.
Our business depends on customers, suppliers and our own operations outside the United States, and as a result we are subject to regulatory, operational, financial and political risks, which could adversely affect our financial results.
The percentage of our revenue attributable to shipments to customers outside the United States was 84% in 2010, 95% in fiscal 2009 and 97% in fiscal 2008. We expect that revenue from customers outside the United States will continue to account for a significant percentage of our revenue. In addition, we maintain international sales and technical support offices in Asia and Europe, and we rely on a network of distributors and sales representatives to sell our products internationally. Moreover, we have in the past relied on, and expect to continue to rely on, subcontractors located in China, South Korea and Taiwan. Accordingly, we are subject to several risks and challenges, any of which could harm our business and financial results. These risks and challenges include:
|
·
|
difficulties and costs of staffing and managing international operations across different geographic areas and cultures;
|
|
·
|
compliance with a wide variety of domestic and foreign laws and regulations, including those relating to the import or export of semiconductor products;
|
|
·
|
legal uncertainties regarding employee issues, taxes, tariffs, quotas, export controls, export licenses and other trade barriers;
|
|
·
|
our ability to receive timely payment and collect our accounts receivables;
|
|
·
|
political, legal and economic instability, foreign conflicts, natural disasters and the impact of regional and global infectious diseases such as SARS, avian flu or swine flu in the countries in which we and our customers, suppliers and subcontractors are located; and
|
|
·
|
legal uncertainties regarding protection of intellectual property rights.
|
22
If we fail to comply with export control regulations we could be subject to substantial fines or other sanctions.
Certain of our products are subject to the Export Administration Regulations, administered by the Department of Commerce, Bureau of Industry Security, which require that we obtain an export license before we can export products or technology to specified countries. Additionally, some of our products are subject to the International Traffic in Arms Regulations, which restrict the export of information and material that may be used for military or intelligence applications by a foreign person. Failure to comply with these laws could result in sanctions by the government, including substantial monetary penalties, denial of export privileges and debarment from government contracts and could negatively impact our business, financial condition and results of operations.
Future transactions may limit our ability to use our net operating loss carry forwards.
As of December 31, 2010, we had U.S. federal tax net operating loss carry forwards of approximately $113.0 million and $58.6 million in foreign carry forwards. These net operating loss carry forwards may be used to offset future taxable income and thereby reduce our U.S. federal income taxes otherwise payable. Section 382 of the Internal Revenue Code of 1986, as amended, or the Code, imposes an annual limit on the ability of a corporation that undergoes an “ownership change” to use its net operating loss carry forwards to reduce its tax liability. Due in part to equity financings and acquisitions involving the issuance of our common stock, we experienced “ownership changes” as defined in Section 382 of the Code. Accordingly, our use of the net operating loss carry forwards and credit carry forwards is limited by the annual limitations described in Sections 382 and 383 of the Code. The limitation on the use of net operating loss carry forwards means that we may need to pay U.S. federal income taxes prior to utilizing these carry forwards in their entirety. It is impossible for us to ensure that we will not experience an ownership change in the future because changes in our stock ownership that may result from future equity financings or certain merger and acquisition activity, some of which are outside of our control, could result in an ownership change under Section 382 of the Code. Any such further changes in our stock ownership could further limit our ability to use our net operating loss carry forwards.
We rely on partners to enhance our product offerings, and our inability to continue to develop or maintain such relationships in the future would harm our ability to remain competitive.
We have developed relationships with third-party partners, which provide application software, hardware reference designs and other services designed for specific uses with our products. We believe these relationships enhance our customers’ ability to get their products to market quickly. If we are unable to continue to develop or maintain these relationships, we might not be able to enhance our customers’ ability to commercialize their products in a timely fashion and our ability to remain competitive would be harmed.
Adverse changes in general economic or political conditions in any of the major countries in which we do business could adversely affect our operating results.
The direction and relative strength of the global economy continues to be uncertain. As economic growth in the United States and other countries’ economies has slowed and, in some countries, turned negative, many customers delayed or reduced technology purchases or marketing spending. In addition, after growing rapidly, we believe fingerprint sensor attach rates in 2009 and 2010 have gone down as a result of the macroeconomic slowdown and a shift in PC sales to lower-cost laptops, which often do not include a fingerprint sensor, from the full-featured, higher-cost laptops with fingerprint sensors.
There could be a number of follow-on effects to our business from the overall economic downturn, including insolvency or financial distress of certain of our key suppliers, distributors, resellers, original equipment manufacturers (“OEMs”), retailers and systems integrators, which could impair our supply of products, distribution channels, the ability of customers, including our distributors, to obtain credit to finance purchases of our products. The failure of derivative counterparties and other financial institutions could negatively impact our treasury operations. Other income and expense could also vary from expectations depending on gains or losses realized on the sale or exchange of financial instruments, impairment charges related to investment securities as well as equity and other investments, interest rates, cash balances, and changes in fair value of derivative instruments. Any of these events would likely harm our business, results of operations and financial condition.
We may not be able to manage future growth effectively, and we may need to incur significant expenditures to address the additional operational and control requirements of our growth.
To manage growth successfully, we believe we must effectively:
|
·
|
hire, train, integrate and manage additional qualified engineers for research and development activities, as well as sales, marketing, financial and information technology personnel;
|
|
·
|
expand and upgrade our technological capabilities;
|
|
·
|
manage simultaneous relationships with our customers, distributors, sales representatives, subcontractors, suppliers and other third parties;
|
23
|
·
|
implement new customer service and production control systems; and
|
|
·
|
execute and successfully integrate strategic investments.
|
Our efforts may require substantial managerial and financial resources and may increase our operating costs even though these efforts may not be successful. If we are unable to manage any growth effectively, we may not be able to take advantage of market opportunities, develop new products, satisfy customer requirements, execute our business plan or respond to competitive pressures.
Risks Related To Our Common Stock
Securities analysts may not publish favorable research or reports about our business or may publish no information which could cause our stock price to decline.
The trading market for our common stock is influenced by the research and reports that industry or financial analysts publish about us or our business. We do not control these analysts. We are a small public company in an industry with very few public companies, which may make it less likely that we will receive widespread analyst coverage. The analysts who publish information about us and our stock may have relatively little experience with our industry, which could affect their ability to accurately forecast our results and make it more likely that we fail to meet their estimates. If an analyst who covers us changes his or her financial estimates or investment recommendation, the price of our stock could decline. Further, if an analyst ceases coverage of our company or fails to regularly publish reports covering us, we could lose visibility in the market, which could cause our stock price to decline.
As a public company, we may be the subject of unsolicited attempts to control our board of directors, which may require significant expense and attention from management.
The semiconductor industry as a whole is facing increasing pressures to consolidate. As a public company, we may be the subject of unsolicited bids for the control of our company, such as hostile proxy contests and tender offers that fail to deliver adequate value to our shareholders. In addition to the concern that certain parties employing these techniques may tailor their processes to deliver less than fair value, defending against any such advances that our board does not believe are in the best interests of our stockholders may require significant expense and may divert the attention of our management from operating our business.
Additional shares have recently become eligible for sale, and significant sales of our common stock in the public market could cause our stock price to fall.
The market price of our common stock could drop as a result of sales of large numbers of shares in the market, or the perception that such sales could occur. We issued shares of our common stock to certain of the former UPEK stockholders in connection with our acquisition of UPEK, and we agreed to register 13,737,746 of these shares with the SEC for resale without restriction. We have filed the registration statement to register these shares with the SEC and such registration statement has been declared effective by the SEC. As a result, these 13,737,746 shares are now freely tradable under the registration statement.. If the holders of significant amounts of our common stock, including certain of the former UPEK stockholders, desire to sell their shares, our stock price would be materially and, negatively affected. We may also sell additional shares of common stock in subsequent public or private offerings, which may also adversely affect market prices for our common stock.
Provisions of our certificate of incorporation and bylaws and Delaware law might discourage, delay or prevent a change of control of or changes in our management and, as a result, depress the trading price of our common stock.
Our certificate of incorporation and bylaws contain provisions that could discourage, delay or prevent a change in control or changes in our management that our stockholders may deem advantageous. These provisions:
|
·
|
require super-majority voting to amend some provisions in our certificate of incorporation and bylaws;
|
|
·
|
authorize the issuance of “blank check” preferred stock that our board could issue to increase the number of outstanding shares and to discourage a takeover attempt;
|
|
·
|
prohibit stockholder action by written consent, which requires all stockholder actions to be taken at a meeting of our stockholders;
|
|
·
|
provide that the board of directors is expressly authorized to make, alter or repeal our bylaws; and
|
|
·
|
establish advance notice requirements for nominations for election to our board or for proposing matters that can be acted upon by stockholders at stockholder meetings.
|
24
In addition, we are subject to Section 203 of the Delaware General Corporation Law, which, subject to some exceptions, prohibits “business combinations” between a Delaware corporation and an “interested stockholder,” which is generally defined as a stockholder who becomes a beneficial owner of 15% or more of a Delaware corporation’s voting stock for a three-year period following the date that the stockholder became an interested stockholder. Section 203 could have the effect of delaying, deferring or preventing a change in control that our stockholders might consider to be in their best interests.
These anti-takeover defenses could discourage, delay or prevent a transaction involving a change in control. These provisions could also discourage proxy contests and make it more difficult for you and other stockholders to elect directors of your choosing and cause us to take corporate actions other than those you desire.
We do not expect to pay any cash dividends for the foreseeable future.
We do not anticipate that we will pay any cash dividends to holders of our common stock in the foreseeable future. Accordingly, investors must rely on sales of their common stock after price appreciation, which may never occur, as the only way to realize any future gains on their investment. Investors seeking cash dividends in the foreseeable future should not purchase our common stock.
|
Item 1B.
|
Unresolved Staff Comments
|
As of the date of the filing of this Annual Report, there were no unresolved comments from the staff of the Securities and Exchange Commission.
|
Item 2.
|
Properties
|
Our main offices occupy approximately 38,000 square feet in Melbourne, Florida under a lease that expires in October 2014. We also lease properties in China, South Korea, Taiwan, Japan, Netherlands, Finland, Czech Republic and California. The Embedded Security Solutions segment make major use of our locations in Netherlands and Finland and the Smart Sensor Solutions segment make major use of our locations in the U.S, Czech Republic and Asia. We do not own any manufacturing facilities and contract to third parties the production and distribution of our semiconductors. We believe that our existing facilities meet our current needs and that suitable additional or substitute space will be available as needed to accommodate expansion of our operations.
|
Item 3.
|
Legal Proceedings
|
AuthenTec is an intervening party in federal patent infringement lawsuit brought by Innovative Biometric Technology, LLC (“IBT”), against Lenovo, Fujitsu, ASUS, Toshiba, and others. The case is captioned Innovative Biometric Technology, LLC v. Lenovo (United States), Inc., et al., Case No. 9:09-cv-81046-KLR, and was filed by IBT on July 19, 2009 in the U.S. District Court for the Southern District of Florida (the “Court”). IBT asserts that the use of certain of the defendant’s products shipped into the United States infringe U.S. Patent No. 7,134,016, which is entitled Software System with a Biometric Dongle and relates generally to a method of protecting software program access. AuthenTec intervened in the case, which the Court approved in November 2010, because IBT’s allegations relate, in part, to the use of biometric software or hardware supplied by us and UPEK to certain of the defendants that has been integrated into laptop computers by our and UPEK’s customers. The parties have taken positions on claim construction and a claim construction hearing is expected to be set by the end of the first quarter of 2011. Discovery is scheduled to end by early June 2011, all pretrial motions and memoranda of law are due by July 1, 2011, and a trial date is set for December 5, 2011. IBT is seeking unspecified monetary damages from the defendants in this case. We believe IBT’s patent is invalid and not infringed.
In addition to these legal actions, from time to time, we may be involved in various legal proceedings arising from the normal course of business activities. In our opinion, resolution of these matters is not expected to have a material adverse impact on our consolidated results of operations, cash flows or our financial position. However, depending on the amount, duration and timing, an unfavorable resolution of a matter could materially affect our future results of operations, cash flows or financial position in a particular period.
|
Item 4.
|
Removed and Reserved.
|
25
PART II
|
Item 5.
|
Market for the Registrant’s Common Equity, Related Stockholder Matters and Issuer Purchases of Equity Securities
|
Our common stock is listed and traded on the Nasdaq Global Market under the symbol “AUTH” and started trading on the Nasdaq Global Market on June 27, 2007. The following tables set forth, for the periods indicated, the high and low intra-day prices for our common stock as reported on the Nasdaq Global Market.
|
Year ended December 31, 2010
|
High
|
Low
|
||||||
|
First Quarter
|
$ | 2.76 | $ | 2.14 | ||||
|
Second Quarter
|
3.49 | 2.18 | ||||||
|
Third Quarter
|
2.51 | 1.48 | ||||||
|
Fourth Quarter
|
$ | 2.67 | $ | 1.69 | ||||
|
Year ended January 1, 2010
|
High
|
Low
|
||||||
|
First Quarter
|
$ | 2.40 | $ | 1.26 | ||||
|
Second Quarter
|
2.08 | 1.59 | ||||||
|
Third Quarter
|
3.45 | 1.63 | ||||||
|
Fourth Quarter
|
$ | 2.89 | $ | 2.13 | ||||
As of March 14, 2011 the number of stockholders of record of our common stock was 54. This figure does not include a substantially greater number of “street name” holders or beneficial holders of our common stock, whose shares are held of record by banks, brokers and other financial institutions.
Dividend Policy
We have never paid or declared any cash dividends on our common stock. We currently anticipate that we will retain all of our future earnings for use in developing our business and do not expect to pay any dividend in the foreseeable future.
Performance Graph
The following graph presents a comparison of the cumulative total stockholder return on our stock for the period commencing June 27, 2007 and ending December 31, 2010 with the cumulative total return of the Nasdaq Composite Index and the Philadelphia Semiconductor Index for the period commencing May 31, 2007 and ending December 31, 2010. The graph assumes that $100 was invested on June 27, 2007 in AuthenTec common stock and that $100 was invested on May 31, 2007 in each of the Nasdaq Composite Index and the Philadelphia Semiconductor Index, and that all dividends were reinvested in each case.
26
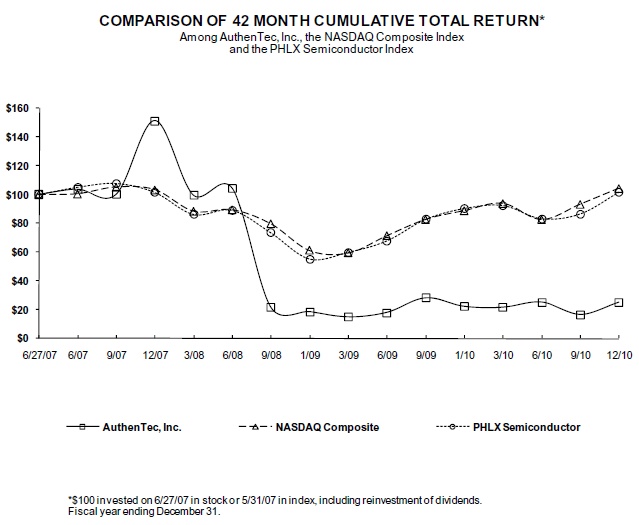
Above graph shows the performance of $100 invested (1) on June 27, 2007 (the date of our initial public offering) in our common stock through December 31, 2010 (end of fiscal year), and (2) on May 31, 2007 in the Nasdaq Composite Index and the Philadelphia Semiconductor Index, index-including reinvestment of dividends through December 31, 2010. The stock price performance on the graph is not necessary indicative of future stock price performance.
Unregistered Sales of Equity Securities
In connection with our acquisitions of UPEK and SafeNet’s Embedded Security Solutions division we issued unregistered shares of our common stock as partial payment for those businesses. Please refer to our Current Reports on Form 8-K filed with the SEC on February 26, 2010 and September 7, 2010 for a more detailed discussion of these unregistered issuances of our common stock.
Purchases of Equity Securities by the Issuer and Affiliated Purchasers
None.
Item 6. Selected Consolidated Financial Data
The following selected consolidated financial data should be read in conjunction with, and is qualified by reference to, our consolidated financial statements and related notes thereto contained in Part II, Item 8 of this Annual Report and “Management’s Discussion and Analysis of Financial Condition and Results of Operations” in Part II, Item 7 of this Annual Report on Form 10-K. The data as of December 31, 2010 and January 1, 2010, and for the fiscal years ended December 31, 2010, January 1, 2010 and January 2, 2009, are derived from our audited consolidated financial statements and related notes included elsewhere in this Annual Report on Form 10-K. The data as of January 2, 2009, December 28, 2007 and December 29, 2006, and for the fiscal years ended December 28, 2007 and December 29, 2006, are derived from our audited consolidated financial statements and related notes not included in this Annual Report on Form 10-K. Our historical results are not necessarily indicative of the results to be expected in any future period.
27
|
Fiscal year ended
|
||||||||||||||||||||
|
December 31,
|
January 1,
|
January 2,
|
December 28,
|
December 29,
|
||||||||||||||||
|
2010
|
2010
|
2009
|
2007
|
2006
|
||||||||||||||||
|
(In thousands, except per share data)
|
||||||||||||||||||||
|
Revenue
|
$ | 44,667 | $ | 34,066 | $ | 63,948 | $ | 52,344 | $ | 33,174 | ||||||||||
|
Cost of revenue (1)
|
22,683 | 18,369 | 33,397 | 27,554 | 19,264 | |||||||||||||||
|
Gross profit
|
21,984 | 15,697 | 30,551 | 24,790 | 13,910 | |||||||||||||||
|
Expenses
|
||||||||||||||||||||
|
Research and development (1)
|
20,703 | 14,491 | 16,459 | 12,876 | 9,631 | |||||||||||||||
|
Selling and marketing (1)
|
13,783 | 7,649 | 9,466 | 9,112 | 7,067 | |||||||||||||||
|
General and administrative (1) (2)
|
13,189 | 6,930 | 6,580 | 5,750 | 5,084 | |||||||||||||||
|
Litigation dismissal (3)
|
4,141 | 4,348 | — | — | — | |||||||||||||||
|
Restructuring charges (4)
|
1,983 | — | — | — | — | |||||||||||||||
|
Total expenses
|
53,799 | 33,418 | 32,505 | 27,738 | 21,782 | |||||||||||||||
|
Loss from operations
|
(31,815 | ) | (17,721 | ) | (1,954 | ) | (2,948 | ) | (7,872 | ) | ||||||||||
|
Other income (expense)
|
||||||||||||||||||||
|
Warrant expense (5)
|
— | — | — | (9,637 | ) | (2,195 | ) | |||||||||||||
|
Note settlement charge (6)
|
(7,073 | ) | — | — | — | — | ||||||||||||||
|
Interest and other expenses
|
(80 | ) | — | — | (110 | ) | — | |||||||||||||
|
Impairment on investments
|
— | (47 | ) | (266 | ) | — | — | |||||||||||||
|
Earnout adjustment
|
729 | |||||||||||||||||||
|
Interest income
|
152 | 365 | 2,265 | 1,798 | 285 | |||||||||||||||
|
Total other income (expense), net
|
(6,272 | ) | 318 | 1,999 | (7,949 | ) | (1,910 | ) | ||||||||||||
|
Income (loss) before income tax expense
|
(38,087 | ) | (17,403 | ) | 45 | (10,897 | ) | (9,782 | ) | |||||||||||
|
Income tax expense (benefit)
|
(247 | ) | — | — | — | — | ||||||||||||||
|
Net income (loss)
|
$ | (37,840 | ) | $ | (17,403 | ) | $ | 45 | $ | (10,897 | ) | $ | (9,782 | ) | ||||||
|
Net income (loss) per common share, basic
|
$ | (1.19 | ) | $ | (.61 | ) | $ | .00 | $ | (.80 | ) | $ | (15.18 | ) | ||||||
|
Shares used in computing basic net income (loss) per common share
|
31,813 | 28,663 | 28,339 | 13,681 | 644 | |||||||||||||||
|
Net income (loss) per common share, diluted
|
$ | (1.19 | ) | $ | (.61 | ) | $ | .00 | $ | (.80 | ) | $ | (15.18 | ) | ||||||
|
Shares used in computing diluted net income (loss) per common share
|
31,813 | 28,663 | 30,308 | 13,681 | 644 | |||||||||||||||
|
(1) Includes charges for stock-based compensation:
|
||||||||||||||||||||
|
Cost of revenue
|
$ | 250 | $ | 254 | $ | 109 | $ | 46 | $ | — | ||||||||||
|
Research and development
|
867 | 954 | 773 | 346 | 11 | |||||||||||||||
|
Selling and marketing
|
950 | 957 | 665 | 214 | 5 | |||||||||||||||
|
General and administrative
|
1,029 | 1,034 | 871 | 480 | 79 | |||||||||||||||
|
(2) 2010 includes legal and acquisition related costs of $3,864 and accrued future litigation related legal expenses of $1,915; 2009 includes legal and acquisition related
|
||||||||||
|
costs of $468 and 2006 includes accrued future litigation related legal expenses of $2,781.
|
||||||||||
|
(3) Reflects litigation dismissal charge in connection with the UPEK acquisition in 2010 and Atrua asset purchase in 2009.
|
||||||||||
|
(4) Represents costs associated with restructuring charges (See Note 14 for more information).
|
||||||||||
|
(5) Reflects changes in the fair value of our freestanding preferred stock warrants.
|
||||||||||
|
(6) Reflects the difference between the initial value of the promissory note issued in connection with the acquisition of UPEK
|
||||||||||
|
and the fair value of the 7,984,281 shares of our common stock issued in satisfaction of the note.
|
||||||||||
|
As Of
|
||||||||||||||||||||
|
December 31,
|
January 1,
|
January 2,
|
December 28,
|
December 29,
|
||||||||||||||||
|
2010
|
2010
|
2009
|
2007
|
2006
|
||||||||||||||||
|
(In thousands)
|
||||||||||||||||||||
|
Consolidated Balance Sheet data:
|
||||||||||||||||||||
|
Cash and cash equivalents
|
$ | 13,280 | $ | 27,482 | $ | 45,193 | $ | 15,703 | $ | 6,076 | ||||||||||
|
Short term investments
|
15,176 | 24,893 | 18,132 | 42,573 | — | |||||||||||||||
|
Working capital
|
24,558 | 53,113 | 64,942 | 59,692 | 6,130 | |||||||||||||||
|
Total assets
|
80,102 | 66,179 | 83,463 | 81,934 | 15,927 | |||||||||||||||
|
Long-term obligations, net of current portion
|
546 | 514 | 417 | — | 8,495 | |||||||||||||||
|
Total stockholders' equity (deficit)
|
$ | 58,527 | $ | 59,827 | $ | 74,069 | $ | 71,036 | $ | (63,539 | ) | |||||||||
28
Item 7. Management’s Discussion and Analysis of Financial Condition and Results of Operation
This section should be read in conjunction with “Cautionary Statements” and “Risk Factors” in Part I, Item 1A of this Annual Report on Form 10-K and “Consolidated Financial Statements and Supplementary Data,” in Part II, Item 8 of this Annual Report on Form 10-K. The following discussion contains forward-looking statements that involve risks and uncertainties. Our actual results could differ materially from those anticipated in these forward-looking statements as a result of various factors, including those discussed below and elsewhere in this Annual Report on Form 10-K.
Overview
We are a leading provider of security and identity management solutions for PC, wireless device and information technology (IT) markets. We provide a series of products including fingerprint sensors, software and security hardware and software that provide security, convenience, personalization and navigation features in PCs, cell phones, printers, network servers and many other end products.
We continue to evolve from a mixed-signal semiconductor component supplier focused primarily on fingerprint authentication sensor to a provider of complete solutions focused on a wide array of security and identity management solutions. Our product portfolio has significantly expanded during the past two years, and now includes smart fingerprint sensors, area sensors, fingerprint sensor chipsets and modules, USB fingerprint readers, identity management software and embedded security IP products and services. Our expansion has been driven by both internal product development efforts and strategic acquisitions.
In February 2010, we acquired SafeNet’s Embedded Security Solutions division, further enhancing our offering of security and identity management solutions. The Embedded Security Solutions products are used in communication and network products to ensure data privacy and content protection for businesses and individuals. With the addition of the Embedded Security Solutions’ expertise in software development, network security and secure communication, we have the ability to offer secure end-to-end solutions, from the individual PC or cell phone all the way to the network server in the cloud.
In September 2010, we acquired privately-held UPEK Inc., a leading supplier of fingerprint solutions for consumer, business and government applications. We believe the combined company will benefit from AuthenTec’s leadership position in the PC and wireless markets as well as in embedded security, and from UPEK’s software expertise, presence in the PC and wireless markets and leadership in silicon based biometrics for government and ID.
In 2010 we shipped 11.1 million sensor units as compared to 10.3 million sensor units shipped in 2009 as the weak economy negatively affected customer demand for certain end products that our sensors were incorporated into. Correspondingly, our sensor revenues decreased to $32.2 million in 2010 as compared to $34.1 million in 2009. Due to our acquisition of UPEK, we were able to reduce the negative impact on our sensor revenue and also recognize additional revenue of $12.5 million from licensing and royalties in 2010, as a result of the acquisition of SafeNet’s Embedded Security Solutions division.
We primarily sell our products to OEMs, ODMs, contract manufacturers, software application vendors, and service providers. Our customers’ products are complex and require significant time to define, design and ramp to volume production. Our sales cycle begins with our selling and marketing staff and application engineers engaging with our customers’ system designers and management, which is typically a multi-month, or even multi-year, process. If we are successful, a customer will decide to incorporate our solution in its product, which we refer to as a design-win. There is no assurance that a design-win will make it to full production as the product we are designed into could be cancelled for any number of reasons by the customer. Because the sales cycles for our products are long, we incur expenses to develop and sell our products, regardless of whether we achieve the design-win and well in advance of generating revenue, if any, from those expenditures. We do not have long-term purchase commitments from any of our customers, as sales of our products are generally made under individual purchase orders. However, once one of our products is incorporated into a customer’s design, it is likely to remain designed in for the life cycle of that specific product. We believe this to be the case because a redesign of a product already in production would generally be time consuming and expensive.
We do not own or operate our own semiconductor fabrication, wafer bumping, assembly or test facilities. We depend on independent vendors to manufacture, assemble and test our fingerprint sensor products. By outsourcing manufacturing, we are able to avoid the cost associated with owning and operating our own manufacturing facility and can take advantage of the scale of operations these third parties provide.
29
Challenges and Risks
Our future profitability and rate of growth, if any, will be directly affected by the continued acceptance of our products in the marketplace, as well as the timing and size of orders, product mix, average selling prices and costs of our products, timely introduction of new products, generation of IP license fees and royalties, as well as general economic conditions. Our ability to achieve profitability will also be affected by the extent to which we must incur additional expenses to expand our sales, marketing, development, and general and administrative capabilities to expand our business. The largest component of our operating expenses is personnel costs. Personnel costs consist of salaries, benefits and incentive compensation, including bonuses and stock-based compensation, for our employees. The following are material trends that are creating opportunities and risks to our business, and a discussion of how we are responding.
|
|
·
|
The global macroeconomic downturn accelerated the growth in sales of consumer PCs, including tablets. The fingerprint sensor attach rate in lower-cost PCs is lower relative to more expensive, feature rich models. To increase penetration of the lower-cost PC market, we are focusing development efforts on lower-cost fingerprint sensors and client application software tailored for use in this growing portion of the PC market. We introduced a small, lower-cost fingerprint sensor for the PC market, the AES1660 and our TrueSuite identity management software, in 2009. These new solutions are tailored for consumer PCs and the growing portion of the lower-cost laptop market.
|
Our revenue in the PC market declined in 2010 due to the effect of certain design losses in our Smart Sensor Solutions segment. We expect the incremental revenues from the UPEK acquisition to somewhat offset this decline in the future.
|
|
·
|
Outside of Japan, wireless network carriers are still evaluating the value proposition of integrating fingerprint sensors into wireless and other handheld devices sold for use on their networks. We expect eventual widespread integration of fingerprint sensors into wireless devices; however, the timing of adoption by wireless network carriers, if at all, will have a significant impact on our future revenues. In response, we are working with wireless device manufacturers to accelerate adoption of fingerprint sensors by highlighting features such as personalization and navigation as well as our application software. We are starting to see results of our efforts and we are focused on improving the durability and aesthetics of our sensors for wireless devices through continued development of our new TouchStone packaging technology. In February 2010, we introduced the AES1750, first smart sensor for the mobile systems market, which takes full advantage of AuthenTec’s new TouchStone packaging technology. In October 2010, we introduced our AES850, the smallest sensor we have developed to date, combining both advanced navigation with biometrically enabled touch based features, as a cost competitive alternative to navigation only devices in mobile phones.
|
|
|
·
|
Weak macroeconomic conditions continued impacting customer demand in 2010, resulting in a sequential decline in revenue and a net loss, as compared to fiscal 2009. We have and continue to take actions to reduce our expenses to minimize losses and, as a result of our acquisition of UPEK, we believe we will be able to achieve greater cost savings in the future.
|
Description of Our Revenue, Cost of Revenue and Expenses
Revenue. Our revenue is generated primarily from shipments of our smart fingerprint sensors, software and technology licenses, royalties, maintenance (post-contract customer support), and development arrangements and services. The price of our products is based upon market and competitive conditions. Therefore, the main factors that impact our revenue are unit volumes, IP license fees and average selling prices.
We supply our products to several end customers either directly or through their suppliers, which may be ODMs, contract manufacturers or distributors. Distributors are used primarily to support logistics, including credit management and importation outside the U.S. The majority of our revenue is denominated in U.S. dollar, however we do generate revenue that is denominated in other currencies, mostly Euro and Japanese Yen.
Cost of revenue and gross margin. We outsource all manufacturing activities associated with our fingerprint sensor products, which includes wafer fabrication, wafer bumping, assembly and test functions. A significant portion of our cost of revenue consists of the costs to manufacture our products. Cost of revenue also includes items such as technical support for licensed software and security hardware and software, equipment depreciation, royalty expense, production planning personnel and related expenses, warranty costs, inventory valuation write-downs, amortization of acquired intangible assets and stock-based compensation under ASC Topic 718, Compensation – Stock Compensation and ASC Subtopic 505-50, Equity-Based Payments to Non-Employees. The primary factors that impact our cost of revenue are the number of units sold, mix of products sold, wafer and other raw material costs, outsourced manufacturing costs and product yields. In the future, we believe cost of revenue could increase in absolute dollars from an expected increase in revenue or could decline in absolute dollars from a decrease in revenue. Cost of revenue as a percentage of total revenue in the Smart Sensor Solutions segment may increase over time if decreases in average selling prices are not offset by corresponding decreases in our product costs. Our cost of revenue in the Smart Sensor Solutions segment may increase as a result of amortization of acquired intangible assets which may increase our cost of revenue as a percentage of total revenue. Cost of revenue as a percentage of total revenue in the Embedded Solutions Segment is expected to be relatively low due to the nature of licensing products.
30
We use third-party foundries, bumping, assembly and test subcontractors, which are primarily located in Asia, to manufacture our semiconductor products. We purchase processed wafers from our fabrication suppliers, which are currently Taiwan Semiconductor Manufacturing Company Limited, Global Foundries Singapore PTE Ltd., and ST Microelectronics. We also outsource the bumping, assembly, test and other processing of our products to third-party subcontractors, primarily Chipbond Technology Corporation, Signetics Corporation, ISA Micro Electronics, and Amkor Technology. We do not have long-term agreements with any of our third-party subcontractors. A significant disruption in the operations of one or more of these subcontractors would impact the production of our products and could have a material adverse impact on our business, financial condition and results of operations.
Our gross margin has been and will continue to be affected by a variety of factors, including average selling prices of our products, product mix, and timing of cost reductions for outsourced manufacturing services, inventory write downs and the timing and changes in production yields. In addition, we tend to experience lower yields on the initial production release of a new product. Following the acquisition of SafeNet’s Embedded Security Solutions division, our margins will be subject to fluctuation due to the mix of revenue between our operating segments as a result of the substantially higher margin products in the Embedded Security Solutions segment. Our gross margins in the Smart Sensor Solutions segment may decrease as a result of the UPEK acquisition as they have historically experienced lower gross margins.
Research and development expenses. Research and development expenses primarily include personnel, the cost of fabrication masks, engineering development software, depreciation and amortization associated with capital equipment and intellectual property, third-party development support, allocated facilities expense, and stock-based compensation under ASC Topic 718, Compensation – Stock Compensation and ASC Subtopic 505-50, Equity-Based Payments to Non-Employees. All research and development costs are expensed as incurred. We believe that research and development expenses may increase in absolute dollars in fiscal 2011 as we obtained new engineering team in the Embedded Security Solutions segment as a result of the SafeNet acquisition and in the Smart Sensor Solutions segment as a result of the UPEK acquisition. Additionally, as a percentage of revenue, these costs fluctuate from one period to another.
Selling and marketing expenses. Selling and marketing expenses consist primarily of salaries and commissions for our sales and marketing personnel, independent sales representative commissions, travel, marketing communications, press releases, advertising, costs for tradeshows, marketing programs, allocated facilities expense, consultants and market studies, amortization of acquired intangible assets and stock-based compensation under ASC Topic 718, Compensation – Stock Compensation and ASC Subtopic 505-50, Equity-Based Payments to Non-Employees. As we align our operating expenses with current economic conditions, we expect selling and marketing expenses to increase in absolute dollars in fiscal 2011 as a result of the SafeNet and UPEK acquisitions.
General and administrative expenses. General and administrative expenses consist primarily of general corporate costs, including personnel expenses, financial reporting, corporate governance and compliance and outside legal, audit, tax compliance fees, allocated facilities expense, and stock-based compensation under ASC Topic 718, Compensation – Stock Compensation and ASC Subtopic 505-50, Equity-Based Payments to Non-Employees . Our general and administrative expenses fluctuate from one period to another due to costs associated with mergers and acquisitions as well as litigation related costs. We expect our general and administrative expenses to decrease in fiscal year 2011 as a result of decreases in legal and acquisition related costs.
Litigation dismissal. The litigation dismissal expenses reflect estimated effective settlement charges of the patent lawsuits with UPEK, Inc. and Atrua, LLC that would have been incurred if the claims were not dismissed as a result of our acquisitions of these two companies. We do not expect to incur this type of litigation charges on a continuous basis.
Restructuring and impairment related charges. Restructuring charges reflect costs incurred as a result of restructuring activities and consist primarily of one time employee termination benefits, accounted under ASC Topic 420, Exit or Disposal Cost Obligations, impairment of long-lived assets, accounted under ASC Topic 360, Property, Plant and Equipment, and other costs related to the restructuring activities such as legal and travel expenses.
Other income (expense) net. Other income (expense) net includes interest income earned on our short term and long term investments and cash and cash equivalents, realized and other-than-temporary unrealized losses on our available-for-sale investments, foreign currency related adjustments and the earn out adjustment arising from the change in contingent consideration associated with business acquisitions.
Provision for income taxes. As of December 31, 2010, we had federal net operating loss carry forwards of approximately $113.0 million. These federal net operating loss carry forwards will expire commencing in 2018. We also had $58.6 million in foreign net operating loss carry forwards which will begin to expire in the year 2012. Utilization of these net operating loss carry forwards may be subject to an annual limitation due to provisions of the Internal Revenue Code of 1986, as amended, that are applicable if we have experienced an “ownership change” in the past or if an ownership change occurs in the future aggregated with certain other sales of our stock after our initial public offering.
31
Critical Accounting Policies
Our discussion and analysis of our historical financial condition and results of operations are based upon our financial statements, which have been prepared in accordance with United States generally accepted accounting principles, or GAAP. These accounting principles require us to make certain estimates and judgments that can affect the reported amounts of assets and liabilities as of the dates of the consolidated financial statements, the disclosure of contingencies as of the dates of the consolidated financial statements, and the reported amount of revenue and expenses during the periods represented. Although we believe that our judgments and estimates are reasonable under the circumstances, actual results may differ from those estimates.
We believe the following are our most critical accounting policies because they are important to understanding our financial condition and results of operations and they require critical management judgment and estimates about matters that are uncertain:
|
•
|
Revenue recognition;
|
|
•
|
Inventory valuation;
|
|
•
|
Fair value measurements;
|
|
•
|
Goodwill and Intangible Assets;
|
|
•
|
Litigation related expenses;
|
|
•
|
Stock-based compensation;
|
|
•
|
Product warranty, and
|
|
•
|
Accounting for income taxes.
|
If actual results or events differ materially from those contemplated by us in making these estimates, our reported financial condition and results of operations for future periods could be materially affected. See “Risk Factors” in Part I, Item 1A of this Annual Report for certain matters that may affect our future financial condition or results of operations.
Revenue recognition. We derive revenue principally from products sales, software and technology licenses, royalties, maintenance (post-contract customer support), and development arrangements and services.
Software and technology licenses sales are accounted for in accordance with ASC 985-605 Revenue Recognition – Software. These sales typically contain multiple elements, including the license, maintenance and/or other services. For arrangements that include multiple elements, the fee is allocated to the various elements based on vendor specific objective evidence of fair value of each deliverable regardless of any separate prices stated within the contract for each element. VSOE of fair value for each element is established based on the sales price we charge when the same element is sold separately. If VSOE does not exist for all delivered elements, but VSOE exists for the undelivered elements, we apply the residual method, provided that: (i) all other applicable revenue recognition criteria are met; and (ii) the fair value of all of the undelivered elements is less than the arrangement fee. Under the residual method, the arrangement fee is recognized as follows: (i) the total fair value of the undelivered elements, as indicated by VSOE, is deferred, and (ii) the difference between the total arrangement fee and the amount deferred for the undelivered elements is recognized as revenue related to the delivered elements. Generally, in our software and software related arrangements, we have established VSOE for maintenance and therefore recognize revenue under these arrangements using the residual method when the only remaining undelivered element is maintenance. If VSOE of fair value cannot be established for the undelivered element of an arrangement, when the undelivered element is support, the entire amount of revenue from the arrangement is deferred and recognized ratably over the period that the support is delivered.
Revenues for support services are recognized on a straight-line basis over the service contract term, which is typically one year.
We recognize product revenue when all of the following criteria are met: (i) persuasive evidence of an arrangement exists, (ii) delivery has occurred, (iii) our price to the customer is fixed or determinable and (iv) collection of the resulting accounts receivable is reasonably assured.
32
These criteria are usually met at the time of product shipment. However, we do not recognize revenue when any significant obligations remain. Customer purchase orders and/or contracts are generally used to determine the existence of an arrangement. Shipping documents are used to verify product delivery. We assess whether a price is fixed or determinable based upon the payment terms associated with the transaction and whether the sales price is subject to refund or adjustment. We assess the collectability of our accounts receivable based primarily upon the creditworthiness of the customer as determined by credit checks and analysis, as well as the customer’s payment history.
In arrangements that include a combination of semiconductor products and software, where software is considered more-than-incidental and essential to the functionality of the product being sold, we account for the entire arrangement as a sale of software and software-related items and allocate the arrangement consideration based on VSOE.
For our royalty revenue we rely on data provided by the licensee. We earn royalties on such licensed products sold worldwide by our licensees at the time that the licensees’ sales occur. Our licensees, however, do not report and pay royalties owed for sales in any given quarter until after the conclusion of that quarter. We recognize royalty revenues based on royalties reported by licensees during the quarter and when other revenue recognition criteria are met.
Certain of our smart sensor sales are made to distributors under agreements providing for price protection and limited right of return on unsold merchandise. Revenue and cost relating to distributor sales are deferred until the product is sold by the distributor. Related revenue and costs are then reflected in income based on sales reported by distributors.
Inventory valuation. Inventory, consisting principally of outsourced semiconductor products, is valued at the lower of cost or market. We utilize a standard costing application which approximates the first-in, first-out method. We evaluate inventory for excess and obsolescence and write down units that are unlikely to be sold based upon a twelve month demand forecast. This evaluation takes into account various matters including expected demand, product obsolescence and other factors. If actual future demand for our products is less than currently forecasted, additional inventory adjustments may be required. Once a reserve is established, it is maintained until the product to which it relates is sold or scrapped. If a unit that has been written down or off is subsequently sold, the cost associated with the revenue from this unit is reduced to the extent of the write down, resulting in an increase in gross profit.
Fair Value Measurements. Effective December 29, 2007, we adopted ASC Topic 820, Fair Value Measurements and Disclosures, which defines fair value, provides a consistent framework for measuring fair value under accounting principles generally accepted in the United States and expands fair value financial statement disclosure requirements. ASC 820 does not require any new fair value measurements. It only applies to accounting pronouncements that already require or permit fair value measures, except for standards that relate to share-based payments (ASC 718, Compensation – Stock Compensation), ASC Topic 840, Leases, and other accounting pronouncements that address fair value measurements for purposes of lease classification or measurement under ASC 840.
We determine the fair value of our available for sale securities using the criteria of ASC 820. This accounting standard, among other things, defines fair value, establishes a consistent framework for measuring fair value and expands disclosure for each major asset and liability category measured at fair value on either a recurring or nonrecurring basis. ASC 820 clarifies that fair value is an exit price, representing the amount that would be received to sell an asset or paid to transfer a liability in an orderly transaction between market participants. As such, fair value is a market-based measurement that should be determined based on assumptions that market participants would use in pricing an asset or liability. As a basis for considering such assumptions, ASC 820 establishes a three-tier fair value hierarchy, which prioritizes the inputs used in measuring fair value as follows:
|
Level 1
|
—
|
Observable inputs such as quoted prices in active markets;
|
|
|
Level 2
|
—
|
Inputs, other than the quoted prices in active markets, that are observable either directly or indirectly; and
|
|
|
Level 3
|
—
|
Unobservable inputs in which there is little or no market data, which require the reporting entity to develop its own assumptions.
|
We estimate the fair value of our auction rate securities based on the following: (i) the underlying structure of each security; (ii) the present value of future principal and interest payments discounted at rates considered to reflect current market conditions; (iii) consideration of the probabilities of default, passing a future auction, or repurchase at par for each period; and (iv) estimates of the liquidity risk for each security. These estimated fair values could change significantly based on future market conditions.
33
We review declines in the fair value of our investments in marketable securities in accordance with ASC 820 to determine the classification of the impairment as temporary or other than temporary. A temporary impairment charge results in an unrealized loss being recorded in the other comprehensive income component of stockholders’ equity. Unrealized losses are recognized in our consolidated statement of operations when a decline in fair value is determined to be other than temporary. We review our investments on an ongoing basis for indications of possible impairment, and if impairment is identified, we determine whether the impairment is temporary or other than temporary. Determination of whether the impairment is temporary or other than temporary requires significant judgment. The primary factors that we consider in classifying the impairment include the extent and period of time the fair value of each investment has declined below its cost basis, the expected holding or recovery period for each investment, and our intent and ability to hold each investment until recovery.
Refer to “Liquidity and Capital Resources” in this section and Note 4 – Fair Value Measurements and Disclosures of “Notes to Consolidated Financial Statements” in Part II, Item 8 of this Report for further discussion of our investments in marketable securities.
Our long-lived assets (excluding goodwill) are reviewed for impairment when events or changes in circumstances indicate the carrying value of such assets may not be recoverable. We assess current usage, estimated remaining useful life, and consider other general factors impacting value of these assets. If an indication of impairment is present, we compare the estimated discounted future cash flows to be generated by the asset or the asset group to its carrying amount. If the discounted future cash flows are less than the carrying amount of the asset or the asset group, we record an impairment loss equal to the excess of the asset’s carrying amount over its fair value. Any write-downs are treated as permanent reductions in the carrying amount of the assets.
Goodwill and Purchased Intangible Assets. We categorize our intangible assets between goodwill and intangible assets. Goodwill is recorded as the difference, if any, between the aggregate considerations paid for an acquisition and the fair value of the acquired net tangible and intangible assets. The value of potential intangible assets separate from goodwill are evaluated and assigned to the respective categories. Certain estimates and assumptions are used in applying these methodologies including projected sales, which include incremental revenue to be generated from the product markets that we have not been previously exposed to, disclosed future contracts and adjustments for declines in existing core sales; ongoing market demand for the relevant products; and required returns on tangible and intangible assets. In the event that actual results or market conditions deviate from these estimates and assumptions used, the future fair value may be different than that determined by management and may result in an impairment loss.
Goodwill and other intangible assets that have an indefinite useful life are not amortized. Intangible assets that have a definite useful life are amortized over their estimated useful life. On an annual basis, or more frequently as needed upon certain indicators, we test goodwill and other indefinite lived intangible assets for impairment. To determine the fair value of these intangible assets, there are many assumptions and estimates used that directly impact the results of the testing. Determining whether impairment of indefinite lived intangibles has occurred requires an analysis of each identifiable asset. If estimates used in the valuation of each identifiable asset proved to be inaccurate based on future results, there could beimpairment charges in subsequent periods.
Product warranty. We offer a one-year product replacement warranty. In general, our standard policy is to either credit or replace the defective units. We accrue for estimated returns of defective products based on historical activity for the prior twelve months at the time revenue is recognized as well as for specific known product issues. The determination of these accruals requires us to make estimates of the frequency and extent of warranty activity and estimate future costs to replace the products under warranty. If the actual warranty activity and/or repair and replacement costs differ significantly from these estimates, adjustments to recognize additional cost of revenue may be required in future periods.
Litigation Related Expenses. We accrue litigation related legal expenses if these costs are reasonably estimable, regardless of whether a liability can be estimated for the loss contingency, itself. If actual and forecasted legal expenses differ from these estimates, adjustments to this account may be required in future periods.
Stock-based compensation. We measure compensation expense for all stock-based awards at fair value on the date of grant and recognize compensation expense over the service period for awards expected to vest. We determine the fair value of our stock options using the Black-Scholes valuation model. Restricted stock awards are measured based on the fair values of the underlying stock on the dates of grant and expensed over the corresponding vesting period.
The application of the Black-Scholes model to the valuation of options requires the use of input assumptions, including expected volatility, expected term, expected dividend yield and expected risk-free interest rate. Expected volatilities are based on those of similar publicly-traded companies as well as our own. The expected term represents the weighted-average period of time that options granted are expected to be outstanding giving consideration to vesting schedules. The dividend yield was zero based on our history of not paying dividends and the low resultant future expectation of dividend payments; and the risk-free interest rate is based on the U.S. Treasury yield curve in effect at the time of grant for periods corresponding with the expected term of the option.
34
Accounting for income taxes. We account for income taxes under the provisions of ASC Topic 740, Income Taxes. In applying ASC 740, we are required to estimate our current tax expense together with assessing temporary differences resulting from differing treatments of items for tax and accounting purposes. These differences result in deferred tax assets and liabilities. Significant management judgment is required to assess the likelihood that our deferred tax assets will be recovered from future taxable income. As of December 31, 2010, our total deferred tax assets were principally comprised of net operating loss carry forwards. We account for uncertain tax positions using a two-step process. The first step is to evaluate the tax position for recognition by determining if the weight of available evidence indicates that it is more likely than not that the position will be sustained on audit, including resolution of related appeals or litigation processes, based on the technical merits. The second step requires us to estimate and measure the tax benefit as the largest amount that is more than 50% likely to be realized upon ultimate settlement. It is inherently difficult and subjective to estimate such amounts, as we have to determine the probability of various possible outcomes. We reevaluate these uncertain tax positions on a quarterly basis. This evaluation is based on factors including, but not limited to, changes in facts or circumstances, changes in tax law, effectively settled issues under audit, and new audit activity. Such a change in recognition or measurement would result in the recognition of a tax benefit or an additional charge to the tax provision.
Recent Accounting Pronouncements
See Note 1 of “Notes to Consolidated Financial Statements” in Part II, Item 8 of this Report for recent accounting pronouncements that could have an effect on us.
Results of Operations
The following table sets forth selected statement of operations data for the periods indicated expressed as a percentage of revenue:
|
Fiscal year ended
|
||||||||||||
|
December 31,
|
January 1,
|
January 2,
|
||||||||||
|
2010
|
2010
|
2009
|
||||||||||
|
Revenue
|
100 | % | 100 | % | 100 | % | ||||||
|
Cost of revenue
|
51 | 54 | 52 | |||||||||
|
Gross profit
|
49 | 46 | 48 | |||||||||
|
Expenses
|
||||||||||||
|
Research and development
|
46 | 43 | 26 | |||||||||
|
Selling and marketing
|
31 | 22 | 15 | |||||||||
|
General and administrative
|
30 | 20 | 10 | |||||||||
|
Litigation dismissal
|
9 | 13 | — | |||||||||
|
Restructuring charges
|
4 | — | — | |||||||||
|
Total expenses
|
120 | 98 | 51 | |||||||||
|
Loss from operations
|
(71 | ) | (52 | ) | (3 | ) | ||||||
|
Other income (expense)
|
||||||||||||
|
Note settlement charge
|
(16 | ) | — | — | ||||||||
|
Interest and other expenses
|
— | — | — | |||||||||
|
Impairment on investments
|
— | — | — | |||||||||
|
Earnout adjustment
|
2 | — | — | |||||||||
|
Interest income
|
— | 1 | 3 | |||||||||
|
Total other income (expense), net
|
(14 | ) | 1 | 3 | ||||||||
|
Income (loss) before income tax expense
|
(85 | ) | — | — | ||||||||
|
Income tax expense
|
— | — | — | |||||||||
|
Net income (loss)
|
(85%) | (51%) | 0% | |||||||||
Fiscal 2010 Compared to Fiscal 2009
Revenue. Our consolidated revenue was $44.7 million in 2010 as compared to $34.1 million in 2009, an increase of $10.6 million, or 31%. The increase in revenue was primarily attributable to the $12.5 million in revenues from our Embedded Security Solutions segment as a result of the acquisition of SafeNet’s Embedded Security Solutions, or “ESS”, division, as well as $6.3 million of incremental revenues in our Smart Sensor Solutions segment due to the UPEK acquisition completed during the year. The incremental revenues from the aforementioned acquisitions were somewhat offset by the decline in shipments of our sensors to the PC market due to consumer demand for low end laptop models at lower prices that do not incorporate our fingerprint sensors. We are seeing growth in the wireless market which is being driven by the demand for smartphones, tablet computers and other emerging portable devices.
Our Embedded Security Solutions revenue consists primarily of technology licenses, royalty revenue, support and maintenance as well as shipments of integrated circuit chips. While Embedded Security Solutions added $12.5 million in revenue for the year ended December 31, 2010, our revenue in Smart Sensor Solutions segment declined by of $1.9 million, or 6% as compared to the last fiscal last year.
Following is an analysis of revenue by reportable segment:
|
Fiscal year ended
|
||||||||||||
|
December 31, 2010
|
January 1, 2010
|
January 2, 2009
|
||||||||||
|
(In thousands)
|
||||||||||||
|
Smart Sensor Solutions
|
$ | 32,161 | $ | 34,066 | $ | 63,948 | ||||||
|
Embedded Security Solutions
|
12,506 | - | - | |||||||||
|
Consolidated
|
$ | 44,667 | $ | 34,066 | $ | 63,948 | ||||||
35
Cost of revenue and gross margin. Our cost of revenue was $22.7 million for the year ended December31, 2010 as compared to $18.4 million for the year ended January 1, 2010, resulting in a gross profit of $22.0 million in 2010 as compared to $15.7 million in 2009, an increase of $6.3 million, or 40%. Consolidated gross margin was 49% in 2010 as compared to 46% in 2009. The increase in cost of revenue, gross profit and gross margin is primarily attributable to our acquisitions of SafeNet’s Embedded Security Solutions division and UPEK.
The Smart Sensor Solutions segment gross margin was 38% for the year ended December 31, 2010 as compared to 46% in the prior year. The decline in gross margin was primarily attributed to lower margin of UPEK products as well as additional costs recorded in the third quarter of 2010 associated with purchase accounting driven step up inventory costs and amortization of purchased intangible assets. The decline in gross margin was also driven by product mix and product variances. Overall average selling prices (“ASP's”) declined by five percent (5%) in contrast to the prior year.
Embedded Security Solutions segment gross margin was 79% for the year ended December 31, 2010. The higher profit margin in this segment is primarily due to revenue from software licensing fees and royalties that contain no or minimal product costs. Cost of goods in the Embedded Security Solutions segment is mostly comprised of the manufacturing costs associated with the integrated circuit chips, amortization expense as a result of acquired amortizable intangible assets and technical support costs. Depending on the revenue partition between hardware and software, profit margin may vary between periods.
Research and development expenses. Research and development expenses were $20.7 million in 2010 as compared to $14.5 million in 2009, an increase of $6.2 million, or 43%. Research and development expenses were 46% and 43% of revenue for 2010 and 2009, respectively. The increase in 2010 was primarily due to the increased research and development expenses as a result of the acquisition of the Embedded Security Solutions segment and UPEK. Research and development expenses in the Smart Sensor Solutions segment increased by $1.7 million mostly due to research and developments costs attributable to UPEK business that consisted mainly of labor related costs, amortization of purchased intangible assets and rent expense, and amounted to $2.1 million. This increase was partially offset by lower direct material costs of $0.4 million as a result of timing of wafer mask set purchases. Research and development expenses associated with Embedded Security Solutions segment were $4.5 million for the year 2010 and consisted predominantly of engineering labor and related personnel costs as well as depreciation of internally developed software acquired in that business.
Selling and marketing expenses. Selling and marketing expenses were $13.8 million in 2010 in contrast to $7.6 million in 2009, an increase of $6.1 million, or 80%. Selling and marketing expenses were 31% and 22% of revenue for years ended December 31, 2010 and January 1, 2010, respectively. The selling and marketing expenses for Smart Sensor Solutions segment increased by $2.2 million primarily due to an increase of incremental UPEK costs of $2.0 million related to the acquisition and consisted primarily of labor costs, amortization of purchased intangible assets, facilities costs and travel expenses. Unrelated to the UPEK acquisition, personnel related expenses increased by $0.2 million; offset by a decrease in commissions of $0.2 million as a result of lower Smart Sensor Solutions revenue. The selling and marketing expenses for the Embedded Security Solutions segment were $4.0 million and were mostly associated with labor and personnel related costs, travel as well as amortization of purchased intangible assets.
General and administrative expenses. General and administrative expenses were $13.2 million in 2010 as compared to $6.9 million in 2009, an increase of $6.3 million, or 90%. General and administrative expenses were 30% and 20% of revenue in 2010 and 2009, respectively. General and administrative expenses increased by $5.4 million in the Smart Sensor Solutions segment mainly due to increase in acquisition and other related costs of $2.5 million associated with the acquisitions of UPEK and SafeNet’s Embedded Security Division, accrual of estimated legal costs of $1.9 million associated with IBT litigation (see Part I, Item 3- Legal Proceedings of this Annual Report for more information), increase in personnel related costs increased of $1.5million which included severance charge of $1.1million a result of management transition and incremental UPEK headcount related costs. $0.5 million of general and administrative costs consisting primarily of finance and legal expenses were allocated to the Embedded Security Solutions segment. The general and administrative expenses for the Embedded Security Solutions segment, excluding allocations, were approximately $0.4 million in 2010 and were related to outside legal fees and bad debt allowance.
Litigation dismissal. Litigation dismissal expenses were $4.1 million in 2010 as compared to $4.3 million in 2009, a decrease of $0.2 million or 5%. Litigation dismissal expenses were 9% and 13% of revenue in 2010 and 2009, respectively. During the twelve months ended December 31, 2010 we recorded $4.1 million in estimated effective settlement charges as described above as a result of UPEK acquisition. During the twelve months ended January 1, 2010 we recorded $4.3 million in litigation dismissal charges which represented estimated effective settlement charges as a result of patent lawsuit dismissal in connection with Atrua asset purchase completed July 8, 2009.
Restructuring charges. Restructuring charges were $1.9 million in 2010 as compared to none in 2009. Restructuring charges were 4% and 0% of revenue in 2010 and 2009, respectively. As a result of restructuring activities, we recorded one time employment termination benefits of $1.4 million, impairment charges of long-lived assets of $0.2 million and legal fees of $0.3 million.
36
We expect the restructuring actions to have a positive effect on future earnings and cash flows. We anticipate annual savings of approximately $0.4 million in Cost of Goods Sold, $3.0 million in Research and Development, $1.0 million in Selling and Marketing, and $0.7 million in General Administrative spending resulting from reduced labor and approximately $0.7 million impacting various operating expenses from facility consolidation. We anticipate approximately $0.2 million in additional restructuring charges during the three months ending April 1, 2011. We have paid approximately $0.7 million in restructuring costs during the three months ended December 31, 2010 and anticipate additional payments of approximately $1.0 million during the three months ending April 1, 2011.
Other income (expense), net. Other income (expense), net decreased by $6.6 million to a net other expense of $6.3 million in 2010 as compared to net other income of $0.3 million in 2009. The decrease was primarily attributable to the note settlement charge of $7.1 million recorded in fiscal 2010, reflecting the difference between the initial value of the promissory note issued in connection with the acquisition of UPEK and the fair value of the 7,984,281 shares of our common stock issued in satisfaction of the note. Lower interest income of $0.2 million as a result of lower interest rates and maturity of investments as well as foreign currency adjustment also contributed to the decrease whish was slightly offset with the reversal of the earnout liability of $0.7 million associated with the contingent consideration related to the acquisition of SafeNet’s Embedded Security Solutions division.
Income tax expense (benefit). Income tax benefit increased to $0.2 million in 2010 from none in 2009 mainly due to $0.4 million reversal of federal AMT and accrued interest attributable to the 2006 tax year due to the expiration of the federal statute of limitations associated with the UPEK acquisition. This reversal was partially offset with the tax provision of $0.2 million related mostly to our European subsidiaries.
Fiscal 2009 Compared to Fiscal 2008
Prior to 2010, we operated in one reportable segment which is now classified as Smart Sensor Solutions segment. Results in the years prior to 2010 represent stand alone amounts which are now considered part of Smart Sensor Solutions segment.
Revenue. Our revenue was $34.1 million in 2009 as compared to $63.9 million in 2008, a decrease of $29.8 million, or 47%. The decline in revenue was mostly attributable to the overall global macroeconomic conditions which caused a dramatic drop in end user demand in the PC market for higher end laptops that incorporate our sensors. The reduction in shipments to our customers adversely impacted our revenue by $26.3 million for the fiscal year ended January 1, 2010 as compared to the same timeframe last year. We are also experiencing declining sales prices at the product level which is considered a typical trend within the semiconductor industry. Our average selling prices (“ASPs”), driven by market conditions and competition within the same, adversely impacted our revenue by $3.5 million for the year ended January 1, 2010, as compared to the year ended January 2, 2009.
Cost of revenue and gross profit. Our cost of revenue for 2009 was $18.4 million as compared to $33.4 million in 2008, resulting in a gross profit of $15.7 million in 2009 as compared to $30.6 million in 2008, a decrease of $14.9 million, or 49%. Our gross margin was 46% in 2009 as compared to 48% in 2008. Lower volume and decline in ASPs contributed to $12.6 million and $3.6 million of decreased gross profit, respectively. The decrease was somewhat offset by lower inventory provision of $0.9 million and product mix and manufacturing cost reductions of $0.4 million for the year ended January 1, 2010 as compared to the same time frames last year.
Research and development expenses. Research and development expenses were $14.5 million in 2009 as compared to $16.5 million in 2008, a decrease of $2.0 million, or 12%. Research and development expenses were 43% and 26% of revenue for 2009 and 2008, respectively. The dollar decrease in 2009 was primarily due to a decrease of $1.4 million in contract labor costs mostly related to the support of new design-wins and software improvement activities in 2008 as well as the purchase of software. Personnel and related costs decreased by $0.9 million and travel expenses decreased by $0.4 million due to cost savings initiatives taken during the year that included reduction in headcount, salaries and incentive compensation and more restrictive travel policy. These decreases were offset by the increase in direct materials of $0.7 million associated with the purchase of wafer masks for development programs.
Selling and marketing expenses. Selling and marketing expenses were $7.6 million in 2009 as compared to $9.5 million in 2008, a decrease of $1.9 million, or 20%. Selling and marketing expenses were 22% and 15% of revenue for 2009 and 2008, respectively. The decrease in absolute dollars in selling and marketing expenses was mainly attributed to the decrease in sales commissions of $0.6 million, as a result of lower revenue, a decrease in outside services and travel spending of $0.5 million and $0.4 million, respectively, due to tighter spending controls and a decrease in labor costs of $0.4 million driven by reduced headcount and salaries as well as incentive compensation.
37
General and administrative expenses. General and administrative expenses were $6.9 million in 2009 as compared to $6.6 million in 2008, an increase of $0.3 million, or 5%. General and administrative expenses were 20% and 10% of revenue for 2009 and 2008, respectively. The general and administrative expenses increased in absolute dollars in 2009 mostly as a result of higher outside legal services of $0.6 million; offset by a decrease in labor and related costs of $0.3 million due to salary reductions and cancellation of incentive compensation.
Litigation dismissal. Litigation dismissal expenses were $4.3 million in 2009 as compared to none in 2008. Litigation dismissal expenses were 13% and 0% of revenue in 2009 and 2008, respectively. During the twelve months ended January 1, 2010 we recorded $4.3 million in litigation dismissal charges which represented estimated legal fees as a result of patent lawsuit dismissal in connection with Atrua asset purchase completed July 8, 2009.
Other income (expense), net. Other income (expense), net decreased $1.7 million to a net income of $0.3 million in 2009 from a net income of $2.0 million in 2008. The decrease in other income (expense) was primarily due to lower yields on our short-term investments.
Selected Quarterly Financial Information
The following table sets forth our unaudited quarterly consolidated statements of operations for each of the eight most recent fiscal quarters ended December 31, 2010. We have prepared the unaudited quarterly financial information on a basis consistent with the audited consolidated financial statements included in this Annual Report on Form 10-K, and the financial information reflects all necessary adjustments, consisting only of normal recurring adjustments, necessary for a fair statement of our financial position and operating results for the quarters presented. The results of operations for any quarter are not necessarily indicative of the results of the operations for any future period.
|
For the three months ended
|
||||||||||||||||||||||||||||||||
|
December 31,
|
October 1,
|
July 2,
|
April 2,
|
January 1,
|
October 2,
|
July 3,
|
April 3,
|
|||||||||||||||||||||||||
|
2010
|
2010
|
2010
|
2010
|
2010
|
2009
|
2009
|
2009
|
|||||||||||||||||||||||||
| Unaudited | ||||||||||||||||||||||||||||||||
| (In thousands, except per share data) | ||||||||||||||||||||||||||||||||
|
Revenue
|
$ | 14,538 | $ | 10,232 | $ | 10,721 | $ | 9,176 | $ | 8,315 | $ | 10,267 | $ | 8,446 | $ | 7,038 | ||||||||||||||||
|
Cost of revenue (1)
|
7,679 | 5,068 | 5,210 | 4,726 | 4,533 | 5,616 | 4,557 | 3,663 | ||||||||||||||||||||||||
|
Gross profit
|
6,859 | 5,164 | 5,511 | 4,450 | 3,782 | 4,651 | 3,889 | 3,375 | ||||||||||||||||||||||||
|
Expenses
|
||||||||||||||||||||||||||||||||
|
Research and development (1)
|
6,661 | 5,314 | 4,742 | 3,986 | 3,400 | 3,644 | 3,642 | 3,805 | ||||||||||||||||||||||||
|
Selling and marketing (1)
|
4,887 | 3,324 | 3,306 | 2,266 | 1,815 | 2,028 | 1,786 | 2,020 | ||||||||||||||||||||||||
|
General and administrative (1)
|
4,124 | 4,039 | 2,073 | 2,953 | 1,570 | 1,439 | 1,702 | 2,219 | ||||||||||||||||||||||||
|
Litigation dismissal
|
- | 4,141 | - | - | - | 1,747 | 2,601 | - | ||||||||||||||||||||||||
|
Restructuring charges
|
1,983 | - | - | - | - | - | - | - | ||||||||||||||||||||||||
|
Total expenses
|
17,655 | 16,818 | 10,121 | 9,205 | 6,785 | 8,858 | 9,731 | 8,044 | ||||||||||||||||||||||||
|
Loss from operations
|
(10,796 | ) | (11,654 | ) | (4,610 | ) | (4,755 | ) | (3,003 | ) | (4,207 | ) | (5,842 | ) | (4,669 | ) | ||||||||||||||||
|
Other income (expense)
|
||||||||||||||||||||||||||||||||
|
Note settlement charge
|
(7,073 | ) | - | - | - | - | - | - | - | |||||||||||||||||||||||
|
Impairment on investments
|
- | - | - | - | (19 | ) | - | - | (28 | ) | ||||||||||||||||||||||
|
Earnout adjustment
|
- | - | 729 | - | - | - | - | - | ||||||||||||||||||||||||
|
Other income (expenses)
|
110 | (190 | ) | - | - | - | - | - | - | |||||||||||||||||||||||
|
Interest income
|
28 | 40 | 44 | 40 | 49 | 52 | 89 | 175 | ||||||||||||||||||||||||
|
Total other income (expense), net
|
(6,935 | ) | (150 | ) | 773 | 40 | 30 | 52 | 89 | 147 | ||||||||||||||||||||||
|
Loss before income tax expense (benefit)
|
(17,731 | ) | (11,804 | ) | (3,837 | ) | (4,715 | ) | (2,973 | ) | (4,155 | ) | (5,753 | ) | (4,522 | ) | ||||||||||||||||
|
Income tax expense (benefit)
|
(24 | ) | (286 | ) | 63 | - | - | - | - | - | ||||||||||||||||||||||
|
Net loss
|
$ | (17,707 | ) | $ | (11,518 | ) | $ | (3,900 | ) | $ | (4,715 | ) | $ | (2,973 | ) | $ | (4,155 | ) | $ | (5,753 | ) | $ | (4,522 | ) | ||||||||
|
Net loss per common share, basic
|
$ | (.48 | ) | $ | (.37 | ) | $ | (.13 | ) | $ | (.16 | ) | $ | (.10 | ) | $ | (.14 | ) | $ | (.20 | ) | $ | (.16 | ) | ||||||||
|
Net loss per common share, diluted
|
$ | (.48 | ) | $ | (.37 | ) | $ | (.13 | ) | $ | (.16 | ) | $ | (.10 | ) | $ | (.14 | ) | $ | (.20 | ) | $ | (.16 | ) | ||||||||
|
Shares used in computing basic
|
||||||||||||||||||||||||||||||||
|
net loss per common share
|
36,683 | 31,503 | 29,912 | 29,196 | 28,685 | 28,668 | 28,658 | 28,647 | ||||||||||||||||||||||||
|
Shares used in computing diluted
|
||||||||||||||||||||||||||||||||
|
net loss per common share
|
36,683 | 31,503 | 29,912 | 29,196 | 28,685 | 28,668 | 28,658 | 28,647 | ||||||||||||||||||||||||
|
(1) Includes charges for stock-based compensation:
|
||||||||||||||||||||||||||||||||
|
Cost of revenue
|
$ | 69 | $ | 67 | $ | 50 | $ | 64 | $ | 55 | $ | 68 | $ | 74 | $ | 58 | ||||||||||||||||
|
Research and development
|
219 | 246 | 173 | 229 | 254 | 231 | 267 | 201 | ||||||||||||||||||||||||
|
Selling and marketing
|
244 | 258 | 200 | 248 | 216 | 255 | 283 | 203 | ||||||||||||||||||||||||
|
General and administrative
|
61 | 521 | 202 | 245 | 209 | 261 | 325 | 239 | ||||||||||||||||||||||||
The following table sets forth our unaudited historical operating results on a quarterly basis as a percentage of revenue for the periods indicated above:
38
|
For the three months ended
|
||||||||||||||||||||||||||||||||
|
December 31,
|
October 1,
|
July 2,
|
April 2,
|
January 1,
|
October 2,
|
July 3,
|
April 3,
|
|||||||||||||||||||||||||
|
2010
|
2010
|
2010
|
2010
|
2010
|
2009
|
2009
|
2009
|
|||||||||||||||||||||||||
|
Revenue
|
100 | % | 100 | % | 100 | % | 100 | % | 100 | % | 100 | % | 100 | % | 100 | % | ||||||||||||||||
|
Cost of revenue
|
53 | 50 | 49 | 51 | 54 | 55 | 54 | 52 | ||||||||||||||||||||||||
|
Gross profit
|
47 | 50 | 51 | 49 | 46 | 45 | 46 | 48 | ||||||||||||||||||||||||
|
Expenses
|
||||||||||||||||||||||||||||||||
|
Research and development
|
46 | 52 | 44 | 43 | 41 | 35 | 43 | 54 | ||||||||||||||||||||||||
|
Selling and marketing
|
34 | 32 | 31 | 25 | 22 | 19 | 21 | 29 | ||||||||||||||||||||||||
|
General and administrative
|
28 | 39 | 19 | 32 | 19 | 13 | 20 | 32 | ||||||||||||||||||||||||
|
Litigation dismissal
|
- | 40 | - | - | - | 16 | 31 | - | ||||||||||||||||||||||||
|
Restructuring charges
|
14 | - | - | - | - | (1 | ) | - | - | |||||||||||||||||||||||
|
Total expenses
|
122 | 163 | 94 | 100 | 82 | 86 | 115 | 114 | ||||||||||||||||||||||||
|
Loss from operations
|
(75 | ) | (113 | ) | (43 | ) | (51 | ) | (36 | ) | (41 | ) | (69 | ) | (66 | ) | ||||||||||||||||
|
Other income (expense)
|
||||||||||||||||||||||||||||||||
|
Note settlement charge
|
(49 | ) | - | - | - | - | - | - | - | |||||||||||||||||||||||
|
Impairment on investments
|
- | - | - | - | - | - | - | - | ||||||||||||||||||||||||
|
Earnout adjustment
|
- | - | 7 | - | - | - | - | - | ||||||||||||||||||||||||
|
Other income (expenses)
|
1 | (1 | ) | - | - | - | - | - | - | |||||||||||||||||||||||
|
Interest income
|
0 | - | - | - | 1 | 1 | 1 | 3 | ||||||||||||||||||||||||
|
Total other income (expense), net
|
(48 | ) | (1 | ) | 7 | - | 1 | 1 | 1 | 3 | ||||||||||||||||||||||
|
Loss before income tax expense (benefit)
|
(123 | ) | (114 | ) | (36 | ) | (51 | ) | (35 | ) | (40 | ) | (68 | ) | (63 | ) | ||||||||||||||||
|
Income tax expense (benefit)
|
- | (3 | ) | - | - | - | - | - | - | |||||||||||||||||||||||
|
Net loss
|
(123 | ) | (111 | ) | (36 | ) | (51 | ) | (35 | ) | (40 | ) | (68 | ) | (63 | ) | ||||||||||||||||
Our revenue fluctuated from quarter to quarter for various reasons, including design losses and new design-wins reaching commercial production, customer demand due to overall economic climate as well as seasonality related and incremental revenues from our recent acquisitions, starting first quarter of 2010.
Our gross margins have fluctuated from quarter to quarter due to several factors, including changes in product mix and lower manufacturing costs, timing of new product introductions and manufacturing yields as well as overall decline in average selling prices. The addition of the Embedded Security Solutions segment improved our margins during the second and third quarters of 2010. Our margins decreased during the fourth quarter of 2010 mainly due to the impact of the UPEK acquisition and related amortization and product margins.
Our research and development costs remained relatively flat until the first quarter of 2010 which increased due to the acquisition of the Safenet’s Embedded Security Solutions Division and further increased as we acquired UPEK and added personnel.
Selling and marketing expenses increased sequentially beginning first quarter of 2010 due to the acquisition of the Safenet’s Embedded Security Solutions Division and further increased as we acquired UPEK and added personnel.
General and administrative expenses fluctuated from quarter to quarter mostly due to the acquisition related cost resulting from our acquisitions of UPEK and Safenet’s Embedded Security Solutions Division as well as incremental costs beginning second quarter of 2010 related to these acquisitions. Fourth quarter of 2010 also included estimated future legal costs associated with IBT litigation.
Other income (expenses) increased in the second quarter of 2010 due to reversal of contingent consideration in connection with the acquisition of SafeNet’s Embedded Security division. Other income (expenses) decreased in the fourth quarter of 2010 due to recording of note settlement charge in connection with the UPEK acquisition. Interest income decreased sequentially each quarter presented due to maturity of our investments and a drop in interest rates as well as a change in our investment strategy where proceeds from matured investments were reinvested into U.S. Treasury and U.S. government agency funds.
Liquidity and Capital Resources
Since our inception, we have financed our growth primarily with funds generated from the issuance and sale of our common stock, preferred stock and senior secured convertible debt. Our cash, cash equivalents and short term and long term investments were $31.8 million as of December 31, 2010, a decrease of $23.8 million from January 1, 2010. The decrease in our cash, cash equivalents and investments as of December 31, 2010 was primarily attributable to the loss from operations, the purchase of fixed assets, partial payment for our acquisition of SafeNet’s Embedded Security Solutions division, and other acquisition related costs and litigation expenses.
39
|
Fiscal year ended
|
||||||||||||
|
December 31, 2010
|
January 1, 2010
|
January 2, 2009
|
||||||||||
|
(In thousands)
|
||||||||||||
|
Consolidated statement of cash flows data:
|
||||||||||||
|
Purchase of property and equipment
|
$ | (858 | ) | $ | (736 | ) | $ | (1,921 | ) | |||
|
Business acquisitions
|
(7,619 | ) | — | — | ||||||||
|
Purchase of intellectual property - patents
|
— | (930 | ) | (120 | ) | |||||||
|
Cash flows from operating activities
|
(15,337 | ) | (11,156 | ) | 4,470 | |||||||
|
Cash flows from investing activities
|
1,058 | (6,583 | ) | 24,412 | ||||||||
|
Cash flows from financing activities
|
$ | 80 | $ | 28 | $ | 608 | ||||||
Operating activities. Net cash provided by (used in) operating activities was $(15.3), $(11.2) million, $4.5 million in fiscal years ended 2010, 2009, and 2008, respectively. Net cash used in operating activities in fiscal year 2010 was mostly attributable to operating net loss, after adjustments for non-cash items such as stock-based compensation, lawsuit dismissal, depreciation and amortization, note settlement charge; offset by increases in deferred compensation and accrued compensation. Our net operating loss for fiscal year 2010 included $4.1 million of litigation dismissal fees and $7.1 million of note settlement charges, both in connection with the UPEK acquisition. Our net operating loss for fiscal year 2009 included $4.3 million of litigation dismissal related fees, associated with Atrua asset purchase. Net cash provided by operating activities for fiscal year 2008 was primarily attributable to net income, before stock-based compensation and depreciation and amortization, decrease in accounts receivable due to collections, offset by increase in inventory due to new product builds and decrease in accrued litigation expenses due to payment of legal expenses associated with the Atmel lawsuit, which was settled in the third quarter of 2008.
Investing activities. Net cash provided by (used in) investing activities was $1.1 million, $(6.6) million and $24.4 million for fiscal years ended 2010, 2009 and 2008, respectively. Net cash provided from investing activities in fiscal year 2010 was primarily attributable to the net redemption of short term securities and cash received from the merger with UPEK of $0.9 million; offset by the cash of $8.5 million used in the purchase of SafeNet’s Embedded Security Solutions division and purchase of property and equipment for $0.9 million. Net cash used in investing activities in fiscal year 2009 was primarily attributable to the purchase of short-term investments in U.S. treasury and U.S. government agency funds, purchase of property, plant and equipment and the purchase of patents. Net cash provided by investing activities in 2008 was mostly due to redemption of investments (net of purchases) of $26.7 million that were reinvested in U.S. treasury and U.S. government agency funds due to market instability, offset by purchase of property and equipment of $1.9 million as well as purchase of research and development software of $0.3 million and purchase of intellectual property of $0.1 million.
We purchased property and equipment of $0.9 million, $0.7 million, and $1.9 million in fiscal years 2010, 2009 and 2008, respectively, primarily for equipment used by our third-party manufacturing subcontractors. Although we do not operate manufacturing facilities under our business model, we do provide certain custom assembly and test related equipment to our subcontractors for use in manufacturing our products. We anticipate that purchases of property and equipment may increase to the extent we invest in new products which require custom assembly and test related equipment.
We did not acquire any intellectual property in 2010 other than intangible assets included in business acquisitions. We purchased intellectual property of$0.9 million and $0.1 million in fiscal years 2009 and 2008, respectively. In the year 2009 we purchased patent portfolios from Veridicom and also Atrua, as part of the asset purchase completed in the second quarter of 2009. In the fiscal year 2008, we purchased patents from Atmel as an outcome of litigation settlement.
Financing Activities. Net cash provided by our financing activities was $80,000, $28,000 and $0.6 million for fiscal years 2010, 2009 and 2008, respectively. Net cash provided in 2010, 2009 and 2008 was attributable to cash received from the exercise of stock options.
Our investment policies are designed to provide liquidity, preserve capital and achieve an acceptable return on invested assets. As of December 31, 2010, our investment portfolio consisted primarily of U.S. treasury and U.S. government agency funds and fixed-income securities. The weighted average maturity is less than twelve months. We utilize investment vehicles such as treasuries, U.S. government agency funds and auction rate securities.
As of December 31, 2010, $3.3 million of our $18.5 million in short-term and long-term investments were comprised of preferred stock investments and a student loan backed security with an auction reset feature (“auction rate securities”). The preferred stock is issued by a closed-end mutual fund that invests primarily in common stock and fixed income securities. Our preferred stock investments carry AAA credit ratings. The student loan backed auction rate security is a state issued note with its underlying student loans being substantially insured by the U.S. government.
40
Liquidity for these auction rate securities is typically provided by an auction process which allows holders to sell their notes and resets the applicable interest rate at pre-determined intervals, usually every seven, 28 or 35 days. In the beginning of 2008 the auction rate securities markets became disrupted and we experienced auction failures for the first time. An auction failure means that the parties wishing to sell their securities could not be matched with an adequate volume of buyers. In the event that there is a failed auction, the indenture governing the security requires the issuer to pay interest at a contractually defined rate that is generally above market rates for other types of similar short-term instruments. The securities for which auctions have failed will continue to accrue interest at the contractual rate and be auctioned every seven, 28 or 35 days until the auction succeeds, the issuer calls the securities, or they mature. As a result, our ability to liquidate and fully recover the carrying value of our remaining auction rate securities in the near term may be limited. These developments resulted in the classification of these securities as long-term investments in our consolidated financial statements at December 31, 2010.
At December 31, 2010, the estimated fair value of our preferred stock ARS was $178,000 less than its cost. As we intend to hold on to this security until the sooner of a recovery in the ARS market or a call of the security by the issuer and it is more-likely-than-not that we will not be required to sell this ARS prior to recovery, we concluded the decline in the fair value was temporary and recorded the unrealized loss to accumulated other comprehensive income on the accompanying Consolidated Balance Sheet at December 31, 2010.
At December 31, 2010, the estimated fair value of our student loan ARS was $198,000 less than its cost. We recorded other-than-temporary impairment charge in the amount of $266,000 in our Consolidated Statement of Operations for the year ended January 2, 2009. We continue to believe that the impairment is other-than-temporary as this investment has been impaired for an extended period of time and we are not sure of the likelihood of the issuer being able to make payments in the future or our ability to hold this security until maturity. For the year ended December 31, 2010, we recorded a reduction in the other-than-temporary impairment in the amount of $79,000. We recorded additional other-than-temporary impairment in the amount of $47,000 in our Consolidated Statement of Operations for the year ended January 1, 2010.
We believe that, even if we hold all such securities for an indefinite period of time, our remaining cash and cash equivalents and short-term investments will be sufficient to support our projected operating requirements over the next twelve months. Our long-term future capital requirements will depend on many factors, including our level of revenue, the timing and extent of spending to support our research and development efforts, the expansion of selling and marketing activities, acquisitions, the timing of our introductions of new products, the costs to ensure access to adequate manufacturing capacity and the continuing market acceptance of our products. We could be required, or could elect, to seek additional funding through public or private equity or debt financing. These additional funds may not be available on terms acceptable to us or at all.
On February 26, 2010 we announced that we had acquired SafeNet, Inc.’s Embedded Security Solutions Division in a cash and stock transaction. Under terms of the transaction, we paid $8.5 million in cash and issued 1.2 million of our common stock.
In September 2010, we merged with privately-held UPEK Inc., a leading supplier of fingerprint solutions for consumer, business and government applications in a stock transaction. As part of the merger, UPEK added $0.9 million in cash to the combined companies.
Contractual Obligations
The following table describes our contractual obligations as of December 31, 2010:
|
Total
|
Less than
1 year
|
1-3 years
|
3-5 years
|
More than
5 years
|
||||||||||||||||
|
(In thousands)
|
||||||||||||||||||||
|
Operating Leases
|
$ | 5,342 | $ | 1,811 | $ | 2,571 | $ | 960 | — | |||||||||||
|
Inventory purchase commitments (1)
|
5,666 | 5,666 | — | — | — | |||||||||||||||
|
License fees
|
415 | 415 | — | — | — | |||||||||||||||
|
Total
|
$ | 11,423 | $ | 7,892 | $ | 2,571 | $ | 960 | $ | - | ||||||||||
|
(1) Open purchase obligations represent inventory commitments. These obligations are not recorded in the consolidated
|
||||||
|
financial statements until commitments are fulfilled and such obligations are subject to change based on negotiations
|
||||||
|
with manufacturers.
|
||||||
41
We adopted the accounting guidance on uncertainty in income taxes as of December 30, 2006. The total amount of gross unrecognized tax benefits for uncertain tax positions, including positions impacting only the timing of tax benefits, was $1.5 million at December 31, 2010. Due to the difficulty in determining the timing of settlements, these obligations are not included in the table above. We do not expect a significant tax payment related to these obligations within the next year.
Off-Balance Sheet Arrangements
We do not maintain any off-balance sheet arrangements, transactions, obligations or other relationships with unconsolidated entities that would be expected to have a material current or future effect upon our financial condition or results of operations.
|
Item 7A.
|
Qualitative and Quantitative Disclosure about Market Risks
|
Foreign currency risk. Majority of our revenue is denominated in U.S. dollar, however we do generate revenue that is denominated in other currencies, mostly Euro and Japanese Yen. We do have risk of our products being more expensive outside the United States if the value of the U.S. dollar increases as compared to the local currency of our customer. This could result in pricing pressure, lower revenue and lower gross margins. Our international sales and research and development operations incur expenses that are denominated in foreign currencies. These expenses increased in fiscal 2010 as a result of the acquisitions of SafeNet’s Embedded Security division and UPEK with main operations being located outside the United States. To the extent that we expand our operations into Europe and Asia, the effects of inflation and currency fluctuations could impact our financial condition and results of operations. A ten percent (10%) change in a currency exchange rate could cause an impact to our financial statements of approximately $1 million and we could suffer foreign exchange losses associated with such currency fluctuations.
Interest rate risk. We had cash, cash equivalents and investments of $31.8 million as of January 31, 2010, which were held for working capital and strategic purposes. The primary objectives of our investment activity are to preserve principal, provide liquidity and achieve an acceptable return without significantly increasing our risk. Some of the securities we invest in are subject to market risk. This means that a change in prevailing interest rates may cause the principal amount of the investment to fluctuate. To minimize this risk and reduce exposure, we maintain our portfolio of cash equivalents and short-term and long-term investments in investment grade securities that are primarily of a conservative nature. Since our results of operations are not dependent on investments, the risk associated with fluctuating interest rates is limited to our investment portfolio, and we believe that a 10% change in interest rates would not have a significant impact on our results from operations.
Market risk. Our short term and long term investments consist of U.S. Treasury and U.S. Government agency funds and auction rate securities that are exposed to certain risks. Although these various investments are managed to a standard designed to avoid principal loss, market forces can have an adverse effect on asset valuations, and it is possible for these investment grade securities to lose a portion of their principal. The ability to determine the risks presented by these investments is limited by, among other things, restrictions on the ability to know the holdings or the collateral backing of the securities.
At December 31, 2010, we held $3.3 million in auction rate securities and consider them inactively traded securities. The rate of interest paid on the auction rate securities is determined at auctions held at pre-determined intervals, usually every seven, 28 or 35 days. If sufficient clearing bids are not made in a particular auction, that can result in the inability to liquidate the asset-backed securities in the auction. All of our auction rate securities held as of December 31, 2010 had experienced failed auctions. There can be no assurance that auctions on the auction rate securities in our investment portfolio will succeed. If the issuers are unable to successfully close future auctions and their credit ratings deteriorate, the fair value of those auction rate securities may decline even further and we may record additional temporary or other than temporary impairment charges.
Credit ratings and the market for debt securities may continue to worsen which may also require us to record other than temporary impairment charges. A 10% change in interest rates would not have a material impact in the fair value of our investments. For more information on fair value assumptions please see Note 4, “Fair Value Measurements and Disclosures” to our Consolidated Financial Statements in Part II, Item 8 of this Annual Report.
42
|
Item 8.
|
Consolidated Financial Statements and Supplementary Data
|
Report of Independent Registered Certified Public Accounting Firm
To the Board of Directors and Stockholders of AuthenTec, Inc.:
In our opinion, the consolidated financial statements listed in the index appearing under Item 15(a)(1) present fairly, in all material respects, the financial position of AuthenTec, Inc and its subsidiaries (the Company) at December 31, 2010 and January 1, 2010, and the results of their operations and their cash flows for each of the three years in the period ended December 31, 2010 in conformity with accounting principles generally accepted in the United States of America. In addition, in our opinion, the financial statement schedule appearing under Item 15(a)(2) presents fairly, in all material respects, the information set forth therein when read in conjunction with the related consolidated financial statements. Also in our opinion, the Company maintained, in all material respects, effective internal control over financial reporting as of December 31, 2010, based on criteria established in Internal Control - Integrated Framework issued by the Committee of Sponsoring Organizations of the Treadway Commission (COSO). The Company's management is responsible for these financial statements and financial statement schedule, for maintaining effective internal control over financial reporting and for its assessment of the effectiveness of internal control over financial reporting, included in Management’s Annual Report on Internal Control over Financial Reporting appearing under Item 9A. Our responsibility is to express opinions on these financial statements, on the financial statement schedule, and on the Company's internal control over financial reporting based on our integrated audits. We conducted our audits in accordance with the standards of the Public Company Accounting Oversight Board (United States). Those standards require that we plan and perform the audits to obtain reasonable assurance about whether the financial statements are free of material misstatement and whether effective internal control over financial reporting was maintained in all material respects. Our audits of the financial statements included examining, on a test basis, evidence supporting the amounts and disclosures in the financial statements, assessing the accounting principles used and significant estimates made by management, and evaluating the overall financial statement presentation. Our audit of internal control over financial reporting included obtaining an understanding of internal control over financial reporting, assessing the risk that a material weakness exists, and testing and evaluating the design and operating effectiveness of internal control based on the assessed risk. Our audits also included performing such other procedures as we considered necessary in the circumstances. We believe that our audits provide a reasonable basis for our opinions.
A company’s internal control over financial reporting is a process designed to provide reasonable assurance regarding the reliability of financial reporting and the preparation of financial statements for external purposes in accordance with generally accepted accounting principles. A company’s internal control over financial reporting includes those policies and procedures that (i) pertain to the maintenance of records that, in reasonable detail, accurately and fairly reflect the transactions and dispositions of the assets of the company; (ii) provide reasonable assurance that transactions are recorded as necessary to permit preparation of financial statements in accordance with generally accepted accounting principles, and that receipts and expenditures of the company are being made only in accordance with authorizations of management and directors of the company; and (iii) provide reasonable assurance regarding prevention or timely detection of unauthorized acquisition, use, or disposition of the company’s assets that could have a material effect on the financial statements.
Because of its inherent limitations, internal control over financial reporting may not prevent or detect misstatements. Also, projections of any evaluation of effectiveness to future periods are subject to the risk that controls may become inadequate because of changes in conditions, or that the degree of compliance with the policies or procedures may deteriorate.
As described in Management's Annual Report on Internal Control over Financial Reporting, management has excluded UPEK, Inc. from its assessment of internal control over financial reporting as of December 31, 2010 because UPEK, Inc. was acquired by the Company in a purchase business combination in September 2010. We have also excluded UPEK, Inc. from our audit of internal control over financial reporting. UPEK, Inc. is a wholly-owned subsidiary whose total assets and total revenues represent 4% and 14%, respectively, of the related consolidated financial statement amounts as of and for the year ended December 31, 2010.
|
/s/ PricewaterhouseCoopers LLP
|
|
Orlando, Florida
|
|
March 16, 2011
|
43
AuthenTec, Inc. and Subsidiaries
Consolidated Balance Sheets
(In thousands, except per share data)
|
As of
|
||||||||
|
December 31,
|
January 1,
|
|||||||
|
2010
|
2010
|
|||||||
|
Assets
|
||||||||
|
Current assets
|
||||||||
|
Cash and cash equivalents
|
$ | 13,280 | $ | 27,482 | ||||
|
Short-term investments
|
15,176 | 24,893 | ||||||
|
Accounts receivable, net of allowances of $150 and $5, respectively
|
9,678 | 3,208 | ||||||
|
Inventory
|
5,460 | 2,245 | ||||||
|
Other current assets
|
1,993 | 1,123 | ||||||
|
Total current assets
|
45,587 | 58,951 | ||||||
|
Long-term investments
|
3,323 | 3,173 | ||||||
|
Purchased intangibles
|
24,033 | 998 | ||||||
|
Goodwill
|
2,729 | - | ||||||
|
Other long-term assets
|
- | 9 | ||||||
|
Property and equipment, net
|
4,430 | 3,048 | ||||||
|
Total assets
|
$ | 80,102 | $ | 66,179 | ||||
|
Liabilities and stockholders’ equity
|
||||||||
|
Current liabilities
|
||||||||
|
Accounts payable
|
$ | 6,907 | $ | 2,458 | ||||
|
Accrued compensation and benefits
|
3,640 | 920 | ||||||
|
Deferred revenue
|
4,678 | 42 | ||||||
|
Accrued litigation related legal fees
|
1,802 | - | ||||||
|
Other accrued liabilities
|
4,002 | 2,418 | ||||||
|
Total current liabilities
|
21,029 | 5,838 | ||||||
|
Deferred rent
|
546 | 514 | ||||||
|
Total liabilities
|
21,575 | 6,352 | ||||||
|
Commitments and contingencies (see note 5)
|
||||||||
|
Stockholders’ equity
|
||||||||
|
Common stock, $.01 par value; 100,000 shares authorized; 43,581 and 28,722 issued and outstanding at December 31, 2010 and January 1, 2010
|
436 | 287 | ||||||
|
Additional paid-in capital
|
189,205 | 153,063 | ||||||
|
Accumulated other comprehensive income (loss)
|
54 | (195 | ) | |||||
|
Accumulated deficit
|
(131,168 | ) | (93,328 | ) | ||||
|
Total stockholders’ equity
|
$ | 58,527 | $ | 59,827 | ||||
|
Total liabilities and stockholders’ equity
|
$ | 80,102 | $ | 66,179 | ||||
The accompanying notes are an integral part of these consolidated financial statements.
44
AuthenTec, Inc. and Subsidiaries
Consolidated Statements of Operations
(In thousands, except per share data)
|
Fiscal Year Ended
|
||||||||||||
|
December 31, 2010
|
January 1, 2010
|
January 2, 2009
|
||||||||||
|
Revenue
|
$ | 44,667 | $ | 34,066 | $ | 63,948 | ||||||
|
Cost of revenue
|
22,683 | 18,369 | 33,397 | |||||||||
|
Gross profit
|
21,984 | 15,697 | 30,551 | |||||||||
|
Operating expenses
|
||||||||||||
|
Research and development
|
20,703 | 14,491 | 16,459 | |||||||||
|
Selling and marketing
|
13,783 | 7,649 | 9,466 | |||||||||
|
General and administrative
|
13,189 | 6,930 | 6,580 | |||||||||
|
Litigation dismissal
|
4,141 | 4,348 | ||||||||||
|
Restructuring and impairment related charges
|
1,983 | - | - | |||||||||
|
Total operating expenses
|
53,799 | 33,418 | 32,505 | |||||||||
|
Loss from operations
|
(31,815 | ) | (17,721 | ) | (1,954 | ) | ||||||
|
Other income (expense):
|
||||||||||||
|
Note settlement charge
|
(7,073 | ) | — | — | ||||||||
|
Earnout adjustment
|
729 | — | — | |||||||||
|
Other income (expense)
|
(80 | ) | — | — | ||||||||
|
Impairment on investments
|
— | (47 | ) | (266 | ) | |||||||
|
Interest income
|
152 | 365 | 2,265 | |||||||||
|
Total other income (expense), net
|
(6,272 | ) | 318 | 1,999 | ||||||||
|
Income (loss) before income tax expense (benefit)
|
(38,087 | ) | (17,403 | ) | 45 | |||||||
|
Income tax benefit
|
(247 | ) | — | — | ||||||||
|
Net income (loss)
|
$ | (37,840 | ) | $ | (17,403 | ) | $ | 45 | ||||
|
Net income (loss) per common share, basic
|
$ | (1.19 | ) | $ | (0.61 | ) | $ | 0.00 | ||||
|
Net income (loss) per common share, diluted
|
$ | (1.19 | ) | $ | (0.61 | ) | $ | 0.00 | ||||
|
Shares used in computing basic net income (loss) per common share
|
31,813 | 28,663 | 28,339 | |||||||||
|
Shares used in computing diluted net income (loss) per common share
|
31,813 | 28,663 | 30,308 | |||||||||
The accompanying notes are an integral part of these consolidated financial statements
45
AuthenTec, Inc. and Subsidiaries
Consolidated Statements of Stockholders’ Equity
(In thousands)
| Accumulated | ||||||||||||||||||||||||
|
Common stock
|
Additional
|
other
|
||||||||||||||||||||||
|
Number
|
Par
|
paid-in
|
Accumulated
|
comprehensive
|
||||||||||||||||||||
|
of shares
|
value
|
capital
|
deficit
|
income (loss)
|
Total equity
|
|||||||||||||||||||
|
Balance, December 28, 2007
|
27,745 | 277 | 146,729 | (75,970 | ) | - | 71,036 | |||||||||||||||||
|
Exercise of stock options and issuance of restricted stock units
|
837 | 9 | 665 | - | - | 674 | ||||||||||||||||||
|
Exercise of warrants
|
44 | - | - | - | - | - | ||||||||||||||||||
|
Stock-based compensation
|
- | - | 2,418 | - | - | 2,418 | ||||||||||||||||||
|
Issuance of common stock
|
2 | - | 25 | - | - | 25 | ||||||||||||||||||
|
Unrealized loss on investments
|
- | - | - | - | (129 | ) | (129 | ) | ||||||||||||||||
|
Net income
|
- | - | - | 45 | - | 45 | ||||||||||||||||||
|
Balance, January 2, 2009
|
28,628 | 286 | 149,837 | (75,925 | ) | (129 | ) | 74,069 | ||||||||||||||||
|
Exercise of stock options and issuance of restricted stock units
|
94 | 1 | 27 | - | - | 28 | ||||||||||||||||||
|
Stock-based compensation
|
- | - | 3,199 | - | - | 3,199 | ||||||||||||||||||
|
Unrealized loss on investments
|
- | - | - | - | (66 | ) | (66 | ) | ||||||||||||||||
|
Net loss
|
- | - | - | (17,403 | ) | - | (17,403 | ) | ||||||||||||||||
|
Balance, January 1, 2010
|
28,722 | $ | 287 | $ | 153,063 | $ | (93,328 | ) | $ | (195 | ) | $ | 59,827 | |||||||||||
|
Exercise of stock options and issuance of restricted stock units
|
136 | 1 | 81 | - | - | 82 | ||||||||||||||||||
|
Adjustment related to outstanding shares
|
(43 | ) | - | - | - | |||||||||||||||||||
|
Stock-based compensation
|
- | - | 3,096 | - | - | 3,096 | ||||||||||||||||||
|
Issuance of common stock in connection with the SafeNet acquisition
|
1,211 | 12 | 2,787 | - | - | 2,799 | ||||||||||||||||||
|
Issuance of common stock in connection with the UPEK acquisition
|
5,957 | 60 | 10,483 | 10,543 | ||||||||||||||||||||
|
Issuance of common stock in connection with the UPEK Note Settlement
|
7,984 | 80 | 20,599 | 20,679 | ||||||||||||||||||||
|
Cancellation of common stock in connection with SafeNet acquisition related working capital
|
(386 | ) | (4 | ) | (904 | ) | (908 | ) | ||||||||||||||||
|
Net loss
|
- | - | - | (37,840 | ) | - | (37,840 | ) | ||||||||||||||||
|
Unrealized gain on investments
|
- | - | 139 | 139 | ||||||||||||||||||||
|
Currency translation adjustment
|
- | - | 110 | 110 | ||||||||||||||||||||
|
Balance, December 31, 2010
|
43,581 | $ | 436 | $ | 189,205 | $ | (131,168 | ) | $ | 54 | $ | 58,527 | ||||||||||||
The accompanying notes are an integral part of these consolidated financial statements.
46
AuthenTec Inc. and Subsidiaries
Consolidated Statements of Cash Flows
(In thousands)
|
Fiscal years ended
|
||||||||||||
|
December 31, 2010
|
January 1, 2010
|
January 2, 2009
|
||||||||||
|
Cash flows from operating activities
|
||||||||||||
|
Net income (loss)
|
(37,840 | ) | $ | (17,403 | ) | $ | 45 | |||||
|
Adjustments to reconcile net income (loss) to net cash provided by (used in) operating activities
|
||||||||||||
|
Depreciation and amortization
|
4,238 | 1,311 | 1,085 | |||||||||
|
Amortization of deferred Rent
|
86 | 88 | 3 | |||||||||
|
Increase (decrease) in bad debt provision
|
135 | (8 | ) | 18 | ||||||||
|
Increase in inventory provision
|
677 | 37 | 422 | |||||||||
|
Stock-based compensation expense
|
3,096 | 3,199 | 2,418 | |||||||||
|
Decrease in investment discounts/premiums
|
169 | 147 | 75 | |||||||||
|
Note settlement charge
|
7,073 | — | — | |||||||||
|
Impairment of long-lived assets
|
301 | — | — | |||||||||
|
Impairment on investments
|
— | 47 | 266 | |||||||||
|
Purchase of research and development software
|
— | — | 250 | |||||||||
|
Earnout adjustment
|
(729 | ) | — | — | ||||||||
|
Litigation dismissal
|
4,141 | — | — | |||||||||
|
Decrease (increase) in assets, net of effects of acquisitions:
|
||||||||||||
|
Accounts receivable
|
(1,111 | ) | 784 | 2,371 | ||||||||
|
Inventory
|
(1,501 | ) | 3,488 | (1,072 | ) | |||||||
|
Other assets
|
57 | 92 | 278 | |||||||||
|
Increase (decrease) in liabilities, net of effects of acquisitions:
|
||||||||||||
|
Accounts payable
|
(703 | ) | (1,486 | ) | (54 | ) | ||||||
|
Accrued compensation and benefits and other accrued liabilities
|
1,141 | (1,288 | ) | (2,262 | ) | |||||||
|
Accrued litigation related legal fees
|
1,802 | — | — | |||||||||
|
Deferred revenue
|
3,631 | (164 | ) | 127 | ||||||||
|
Lease incentive
|
- | - | 500 | |||||||||
|
Net cash provided by (used in) operating activities
|
(15,337 | ) | (11,156 | ) | 4,470 | |||||||
|
Cash flows from investing activities
|
||||||||||||
|
Purchase of property and equipment
|
(858 | ) | (736 | ) | (1,921 | ) | ||||||
|
Purchase of research and development software
|
— | — | (250 | ) | ||||||||
|
Purchase of intellectual property
|
— | (150 | ) | (120 | ) | |||||||
|
Acquisitions, net of cash acquired
|
(7,619 | ) | (837 | ) | — | |||||||
|
Purchase of available-for-sale investments
|
(15,165 | ) | (24,700 | ) | (7,008 | ) | ||||||
|
Redemption of available-for-sale investments
|
24,700 | 19,840 | 41,132 | |||||||||
|
Purchase of held-to-maturity investments
|
— | — | (16,940 | ) | ||||||||
|
Redemption of held-to-maturity investments
|
— | — | 9,519 | |||||||||
|
Net cash provided by (used in) investing activities
|
1,058 | (6,583 | ) | 24,412 | ||||||||
|
Cash flows from financing activities
|
||||||||||||
|
Deferred initial public offering costs
|
— | — | (66 | ) | ||||||||
|
Proceeds from exercise of stock options, net of tax withholdings
|
80 | 28 | 674 | |||||||||
|
Net cash provided by financing activities
|
80 | 28 | 608 | |||||||||
|
Effect of exchange rates on cash and cash equivalents
|
(3 | ) | — | — | ||||||||
|
Net increase (decrease) in cash and cash equivalents
|
(14,202 | ) | (17,711 | ) | 29,490 | |||||||
|
Cash and cash equivalents, beginning of period
|
27,482 | 45,193 | 15,703 | |||||||||
|
Cash and cash equivalents, end of period
|
$ | 13,280 | $ | 27,482 | $ | 45,193 | ||||||
|
Supplemental non-cash disclosures
|
||||||||||||
|
Accrued purchase of property and equipment
|
* | $ | 82 | $ | 273 | |||||||
|
Stock issuance in connection with SafeNet and UPEK acquisitions (see Note 12)
|
$ | 13,342 | ||||||||||
|
Stock cancellation for working capital adjustment in connection with the SafeNet
|
$ | (908 | ) | |||||||||
|
acquisition (see Note 12)
|
||||||||||||
|
Initial accrued earnout in connection with the SafeNet acquisition (see Note 12)
|
$ | 729 | ||||||||||
|
Fair value of the promissory note issued in connection with the UPEK
|
$ | 13,606 | ||||||||||
|
acquisition (see Note 12)
|
||||||||||||
|
Exercise of 54 common stock warrants
|
— | — | $ | 137 | ||||||||
|
Redemption of shares on exercise of 158,590 stock options
|
— | — | $ | 63 | ||||||||
|
Stock issuance
|
— | — | $ | 25 | ||||||||
|
* Less than $50,000
|
||||||||||||
The accompanying notes are an integral part of these consolidated financial statements.
47
AuthenTec, Inc. and Subsidiaries
Notes to Consolidated Financial Statements
1. Description of Business and Summary of Significant Accounting Policies
Organization
AuthenTec, Inc., a Delaware corporation, incorporated in 1998 for the purpose of developing and commercializing certain Harris Corporation technology. In 1998, we entered into an Assignment and Assumption Agreement with HVFM-V, L.P. (“HVFM”), a venture capital affiliate of Harris Corporation, for the rights, title and interests under a Technology Transfer Agreement between HVFM and Harris Corporation.
Nature of Business
We are a leading provider of identity, security and touch control technologies for PC, wireless device and other markets. AuthenTec brings a broad range of features including security, convenience, personalization and navigation to PCs, cell phones and many other products. AuthenTec continues to evolve from a mixed-signal semiconductor component supplier to the provider of complete solutions focused on security, identity management and touch control solutions, including smart fingerprint sensors, identity management software and IP products and services. Complementing our sensors is our TrueSuite® identity management software, providing PC and mobile users secure, one-touch access to their digital identity and online social networks. TrueSuite was introduced in 2009 and is currently integrated in AuthenTec-enabled notebook PCs being offered by the world’s PC OEMs. Our latest offering, TrueSuite Mobile®, was introduced in October 2010 and is targeted for AuthenTec enabled mobile phones. We primarily sell our products to original equipment manufacturers, or OEMs, original design manufacturers, or ODMs or contract manufacturers, software application vendors, and service providers. We operate a fabless manufacturing model, whereby manufacturing requirements are outsourced to third parties.
Initial Public Offering
On July 2, 2007, we completed our initial public offering, selling 5,625,000 shares of our common stock and yielding approximately $56,000 common stock and $55,887,000 additional paid in capital proceeds to us, net of offering costs of approximately $1,600,000. At that time, all shares of our outstanding convertible preferred stock were converted into approximately 18,796,000 shares of common stock, resulting in an increase in common stock of approximately 188,000 and an increase in additional paid in capital of approximately $70,822,000. In addition, the preferred stock warrant liability with a carrying value of approximately $9,199,000 was reclassified to additional paid in capital upon conversion of these preferred stock warrants into warrants to purchase the aforementioned common stock. Our outstanding senior secured convertible notes and the associated accrued interest were converted into approximately 1,260,000 shares of our common stock at the rate of $6.00 per share, increasing common stock by approximately $13,000 and additional paid in capital by approximately $7,504,000.
Principles of Consolidation
The consolidated financial statements include accounts of AuthenTec, Inc. and our wholly owned subsidiaries: AuthenTec K.K., AuthenTec (Shanghai) Co., Ltd, Authentec BV, Authentec Finland, Authentec Amsterdam, Authentec Taiwan, UPEK Singapore, UPEK Prague, UPEK Japan, UPEK China, UPEK Taiwan, and UPEK California. All significant intercompany accounts and transactions have been eliminated.
Our fiscal year ends on the Friday closest to December 31. Fiscal year 2010 began January 2, 2010 and ended December 31, 2010. Fiscal years 2010 and 2009 contained 52 weeks and fiscal year 2008 contained 53 weeks.
Use of Estimates
The preparation of financial statements in conformity with generally accepted accounting principles requires management to make estimates and assumptions that affect the reported amounts of assets and liabilities and disclosure of contingent assets and liabilities at the date of the financial statements and reported amounts of revenue and expenses during the reporting period. Actual results may differ from those estimates.
Reclassifications
Certain amounts in the prior periods’ financial statements have been reclassified to conform to the current period presentation.
Comprehensive Income (Loss)
Comprehensive income (loss) is defined as a change in equity resulting from non-owner sources. The components of our comprehensive loss are as follows:
48
|
Fiscal years ended
|
||||||||||||
|
December 31,
|
January 1,
|
January 2,
|
||||||||||
|
2010
|
2010
|
2009
|
||||||||||
|
(In thousands)
|
||||||||||||
|
Net loss
|
$ | (37,840 | ) | (17,403 | ) | 45 | ||||||
|
Unrealized loss on AFS investments
|
139 | (66 | ) | (129 | ) | |||||||
|
Currency translation adjustment
|
110 | — | — | |||||||||
|
Comprehensive loss
|
$ | (37,591 | ) | $ | (17,469 | ) | $ | (84 | ) | |||
Revenue recognition.
Software and technology licenses sales are accounted for in accordance with ASC 985-605 Revenue Recognition – Software. These sales typically contain multiple elements, including the license, maintenance and/or other services. For arrangements that include multiple elements, the fee is allocated to the various elements based on vendor specific objective evidence of fair value of each deliverable regardless of any separate prices stated within the contract for each element. VSOE of fair value for each element is established based on the sales price we charge when the same element is sold separately. If VSOE does not exist for all delivered elements, but VSOE exists for the undelivered elements, we apply the residual method, provided that: (i) all other applicable revenue recognition criteria are met; and (ii) the fair value of all of the undelivered elements is less than the arrangement fee. Under the residual method, the arrangement fee is recognized as follows: (i) the total fair value of the undelivered elements, as indicated by VSOE, is deferred, and (ii) the difference between the total arrangement fee and the amount deferred for the undelivered elements is recognized as revenue related to the delivered elements. Generally, in our software and software related arrangements, we have established VSOE for maintenance and therefore recognize revenue under these arrangements using the residual method when the only remaining undelivered element is maintenance. If VSOE of fair value cannot be established for the undelivered element of an arrangement, when the undelivered element is support, the entire amount of revenue from the arrangement is deferred and recognized ratably over the period that the support is delivered.
Revenues for support services are recognized on a straight-line basis over the service contract term, which is typically one year.
We recognize product revenue when all of the following criteria are met: (i) persuasive evidence of an arrangement exists, (ii) delivery has occurred, (iii) our price to the customer is fixed or determinable and (iv) collection of the resulting accounts receivable is reasonably assured.
These criteria are usually met at the time of product shipment. However, we do not recognize revenue when any significant obligations remain. Customer purchase orders and/or contracts are generally used to determine the existence of an arrangement. Shipping documents are used to verify product delivery. We assess whether a price is fixed or determinable based upon the payment terms associated with the transaction and whether the sales price is subject to refund or adjustment. We assess the collectability of our accounts receivable based primarily upon the creditworthiness of the customer as determined by credit checks and analysis, as well as the customer’s payment history.
For our royalty revenue we rely on data provided by the licensee. We earn royalties on such licensed products sold worldwide by our licensees at the time that the licensees’ sales occur. Our licensees, however, do not report and pay royalties owed for sales in any given quarter until after the conclusion of that quarter. We recognize royalty revenues based on royalties reported by licensees during the quarter and when other revenue recognition criteria are met.
Certain of our smart sensor sales are made to distributors under agreements providing for price protection and limited right of return on unsold merchandise. Revenue and cost relating to distributor sales are deferred until the product is sold by the distributor. Related revenue and costs are then reflected in income based on sales reported by distributors.
Product Warranty
We typically offer a one-year product replacement warranty for our fingerprint sensors. We accrue for estimated returns of defective products based on historical return patterns and revenue growth as well as any specific known product issues at the time revenue is recognized. The determination of these accruals requires us to make estimates of the frequency and extent of warranty activity and estimated future costs to replace the products under warranty. If the actual warranty activity and/or repair and replacement costs differ significantly from these estimates, adjustments to recognize additional cost of revenue may be required in future periods.
49
We typically offer a ninety (90) to one hundred and eighty (180) day product replacement warranty for our licensed technology where we will, at our option, repair or replace the product and return it to licensee, or, if the licensed technology is computer software, we may direct licensee to return or destroy its copies of the software and will authorize either the electronic download of a substitute product or deliver to licensee a replacement copy.
The following table presents a reconciliation of our product warranty liability, which is included in other accrued liabilities in the consolidated balance sheets:
|
Fiscal year ended
|
||||||||||||
|
December 31,
|
January 1,
|
January 2,
|
||||||||||
|
2010
|
2010
|
2009
|
||||||||||
|
(In thousands)
|
||||||||||||
|
Balance — beginning of year
|
$ | 174 | $ | 215 | $ | 135 | ||||||
|
Assumed reserves (UPEK)
|
14 | — | — | |||||||||
|
Accruals/(reversals) of warranty liabilities
|
(59 | ) | (30 | ) | 205 | |||||||
|
Costs incurred
|
(100 | ) | (11 | ) | (125 | ) | ||||||
|
Balance — end of year
|
$ | 29 | $ | 174 | $ | 215 | ||||||
Cash, Cash Equivalents and Investments
Our investments are tailored to appropriately balance the trade-off between the preservation of capital and return. We consider all highly liquid investments with an original maturity of three months or less at the date of purchase to be cash equivalents. Our other investments that include U.S. treasury and U.S. government agency funds and auction rate securities, corporate and euro bonds, medium and short term notes and certificates of deposits are classified as investments and are accounted for under the provisions of Accounting Standards Codification (“ASC”) Topic 320, Investments – Debt and Equity Securities. We have classified our auction rate securities as available-for-sale (AFS) and reported at fair value, with unrealized gains and losses, if any, excluded from earnings and reported in accumulated other comprehensive income (loss), a separate component of stockholders’ equity.
Prior to our adoption of the ASC 320-10-65, Investments- Debt and Equity Securities – Transition and Open Effective Date Information (issued as FSP FAS 115-2, FAS 124-2, and EITF 99-20-2, Recognition and Presentation of Other-Than-Temporary Impairments), we recognized all other-than-temporary impairment amounts related to our debt securities in earnings as required under the previously effective guidance which required that management assert that it had the ability and intent to hold a debt security until maturity or until we recovered the cost of our investment. Under the new accounting standards, other-than-temporary impairment must be recognized through earnings if an investor has the intent to sell the debt security or if it is more likely than not that the investor will be required to sell the debt security before recovery of its amortized cost basis. However, even if an investor does not expect to sell a debt security, expected cash flows to be received must be evaluated to determine if a credit loss has occurred. In the event of a credit loss, only the amount associated with the credit loss is recognized in income. The amount of losses relating to other factors, including those resulting from changes in interest rates, are recorded in accumulated other comprehensive income.
The amortized cost, gross unrealized gains and losses, and fair value of investments, by type, were as follows:
|
As of
|
||||||||||||||||||||||||
|
Amortized cost
|
Unrealized gains/(losses)
|
Fair value
|
||||||||||||||||||||||
|
December 31,
|
January 1,
|
December 31,
|
January 1,
|
December 31,
|
January 1,
|
|||||||||||||||||||
|
2010
|
2010
|
2010
|
2010
|
2010
|
2010
|
|||||||||||||||||||
|
(In thousands)
|
||||||||||||||||||||||||
|
U.S. Government agency notes (AFS)
|
$ | 15,168 | $ | 24,873 | $ | 8 | $ | 20 | 15,176 | $ | 24,893 | |||||||||||||
|
Auction rate securities (AFS)
|
3,700 | 3,701 | (377 | ) | (528 | ) | 3,323 | 3,173 | ||||||||||||||||
|
Total
|
$ | 18,868 | $ | 28,574 | $ | (369 | ) | $ | (508 | ) | 18,499 | $ | 28,066 | |||||||||||
50
The amortized cost and fair value of available-for-sale investments as of December 31, 2010 and January 1, 2010, by contractual maturity, were as follows:
|
As of
|
||||||||||||||||||||||||
|
Amortized cost
|
Fair value
|
Unrealized gains/(losses)
|
||||||||||||||||||||||
|
December 31,
|
January 1,
|
December 31,
|
January 1,
|
December 31,
|
January 1,
|
|||||||||||||||||||
|
2010
|
2010
|
2010
|
2010
|
2010
|
2010
|
|||||||||||||||||||
|
(In thousands)
|
||||||||||||||||||||||||
|
Due in one year or less
|
$ | 15,168 | $ | 24,873 | $ | 15,176 | $ | 24,893 | $ | 8 | $ | 20 | ||||||||||||
|
Due after ten years
|
1,300 | 1,300 | 1,102 | 987 | (198 | ) | (313 | ) | ||||||||||||||||
|
Preferred stock auction rate securities
|
2,400 | 2,401 | 2,221 | 2,186 | (179 | ) | (215 | ) | ||||||||||||||||
|
Total
|
$ | 18,868 | $ | 28,574 | $ | 18,499 | $ | 28,066 | $ | (369 | ) | $ | (508 | ) | ||||||||||
The fair value of investments with gross unrealized losses by investment type and length of time that individual securities have been in a continuous loss position were as follows:
|
As of December 31, 2010
|
||||||||||||||||||||||||
|
Less than 12 months
|
12 months or greater
|
Total
|
||||||||||||||||||||||
|
Fair
|
Gross unrealized
|
Fair
|
Gross unrealized
|
Fair
|
Gross unrealized
|
|||||||||||||||||||
|
value
|
losses
|
value
|
losses
|
value
|
losses
|
|||||||||||||||||||
|
Available-for-sale investments
|
(In thousands)
|
|||||||||||||||||||||||
|
Auction rate securities - student loan
|
$ | — | $ | — | $ | 1,102 | $ | (198 | ) | $ | 1,102 | $ | (198 | ) | ||||||||||
|
Auction rate securities - preferred stock
|
— | — | 2,221 | (179 | ) | 2,221 | (179 | ) | ||||||||||||||||
|
Total
|
$ | - | $ | - | $ | 3,323 | $ | (377 | ) | $ | 3,323 | $ | (377 | ) | ||||||||||
As of December 31, 2010 and January 1, 2010, $3.3 million and $3.2 million, respectively, of our $18.5 million and $28.1 million in short-term and long-term investments, respectively, were comprised of municipal notes, preferred stock and student loan backed investments with an auction reset feature (“auction rate securities”). Our investments in auction rate securities were 15% and 6% of the total assets valued at fair value at December 31, 2010 and January 1, 2010, respectively.The municipal notes are issued by various state and local municipal entities for the purpose of public projects and other activities. The preferred stock is issued by various closed-end mutual funds that invest primarily in common stock and fixed income securities. The student loan backed auction rate security is a state issued note with its underlying student loans being substantially insured by the U.S. government.
Due to auction rate securities markets being disrupted, in the beginning of 2008, we experienced auction failures for the first time. An auction failure means that the parties wishing to sell their securities could not be matched with an adequate volume of buyers. In the event that there is a failed auction, the indenture governing the security requires the issuer to pay interest at a contractually defined rate that is generally above market rates for other types of similar short-term instruments and we continue to receive contractual payments. The securities for which auctions have failed will continue to accrue interest at the contractual rate and be auctioned every seven, 28 or 35 days until the auction succeeds, the issuer calls the securities, or they mature.
All of our auction rate securities held at December 31, 2010 had experienced failed auctions. As a result, our ability to liquidate and fully recover the carrying value of our remaining auction rate securities in the near term may be limited or not exist.
We estimated the fair value of our short-term and long-term investments based our own analysis. Our estimates were based on assumptions we believe market participants would use in pricing similar assets in a current transaction, which could change significantly over time based on market conditions. Please refer to Note 4 Fair Value Measurements and Disclosures for more information.
Inventory
Inventory, consisting principally of outsourced semiconductor chips and finished goods, is valued at the lower of cost or market. Cost is determined by standard costs which approximate the first-in, first-out method. We evaluate inventory for excess and obsolescence and write down units that are unlikely to be sold based upon a twelve months’ demand forecast. This evaluation takes into account various matters, which might include expected demand, product obsolescence and other factors. If actual future demand for our products is less than currently forecasted, additional inventory adjustments may be required. Once a reserve is established, it is maintained until the product to which it relates is sold or scrapped. If a unit that has been written down or off is subsequently sold, the cost associated with the revenue from this unit is reduced to the extent of the write down, resulting in an increase in gross profit.
51
Concentration of Credit Risk and Significant Customers and Suppliers
Financial instruments that potentially subject us to a concentration of credit risk consist of cash, cash equivalents, investments and accounts receivable. The majority of cash and cash equivalents are deposited with two credit worthy financial institutions and the federal government. We have not experienced any losses on deposits of cash and cash equivalents. We believe that the financial institutions are reputable and, accordingly, minimal credit risk exists. However, at times we have cash balances in these banks in excess of FDIC insurance limits.
We currently sell our products to a limited number of customers and maintain reserves for potential credit losses related to accounts receivable arising from sales of our products. We also perform credit evaluations of our customers and provide credit to certain customers in the normal course of business.
The following table illustrates the concentration of customer accounts receivable as a percent of total accounts receivable:
|
As of
|
||||
|
December 31,
|
January 1,
|
|||
|
2010
|
2010
|
|||
|
Lenovo (Singapore) Pte., Ltd.
|
21%
|
43%
|
||
|
Hakuto Co., Ltd
|
11
|
*
|
||
|
Richpower Electronic Devices Co.
|
*
|
10
|
||
|
Edom Technology Co., Ltd.
|
*
|
23
|
||
|
Bioscrypt, Inc.
|
*
|
11
|
||
|
* Less than 10%
|
||||
A change in or loss of one or more of our customers could adversely effect results of operations. The following table illustrates the concentration of customer revenue as a percent of total revenue:
|
Fiscal year ended
|
||||||
|
December 31,
|
January 1,
|
January 2,
|
||||
|
2010
|
2010
|
2009
|
||||
|
Fujitsu Ltd.
|
14%
|
19%
|
13%
|
|||
|
Lenovo (Singapore) Pte., Ltd.
|
11
|
17
|
*
|
|||
|
Edom Technology Co., Ltd.
|
*
|
27
|
11
|
|||
|
Richpower Electronic Devices Co.
|
*
|
15
|
15
|
|||
|
Inventec Corporation
|
*
|
*
|
18
|
|||
|
Compal Electronics, Inc.
|
*
|
*
|
14
|
|||
|
* Less than 10%
|
||||||
For the fiscal years ended December 31, 2010, January 1, 2010 and January 2, 2009, sales to international customers accounted for 84%, 95%, and 97% of revenue, respectively.
We depend upon a limited number of subcontractors for our production requirements. The failure of any of our subcontractors to fulfill our production requirements on a timely basis would adversely impact future results. Although there are other subcontractors that are capable of providing similar services, an unexpected change in our subcontractors could cause delays in our ability to meet our customer’s demands, resulting in loss of revenue.
Property and Equipment
Property and equipment are stated at cost, less accumulated depreciation. The cost of additions and improvements are capitalized, while maintenance and repairs are charged to expense when incurred. Depreciation is provided on the straight-line method over the shorter of the lease term or the estimated useful lives of the related assets (three to eight years). Depreciation of property, plant and equipment amounted to approximately $1,624,000, $1,261,000 and $1,083,000 for the years ended December 31, 2010, January 1, 2010 and January 2, 2009, respectively.
Goodwill and Purchased Intangible Assets. We categorize our intangible assets between goodwill and intangible assets. Goodwill is recorded as the difference, if any, between the aggregate considerations paid for an acquisition and the fair value of the acquired net tangible and intangible assets. The value of potential intangible assets separate from goodwill are evaluated and assigned to the respective categories. Certain estimates and assumptions are used in applying these methodologies including projected sales, which include incremental revenue to be generated from the product markets that we have not been previously exposed to, disclosed future contracts and adjustments for declines in existing core sales; ongoing market demand for the relevant products; and required returns on tangible and intangible assets. In the event that actual results or market conditions deviate from these estimates and assumptions used, the future fair value may be different than that determined by management and may result in an impairment loss.
52
Goodwill and Other Intangible Assets
Goodwill and other intangible assets that have an indefinite useful life are not amortized. Intangible assets that have a definite useful life are amortized over their estimated useful life. On an annual basis, or more frequently as needed upon certain indicators, we test goodwill and other indefinite lived intangible assets for impairment. To determine the fair value of these intangible assets, there are many assumptions and estimates used that directly impact the results of the testing. Determining whether impairment of indefinite lived intangibles has occurred requires an analysis of each identifiable asset. If estimates used in the valuation of each identifiable asset proved to be inaccurate based on future results, there could be additional impairment charges in subsequent periods.
Deferred Rent
One of our leases contains predetermined fixed increases in the base rental rate over the term of the lease. For this lease, we recognize the related rental expense on a straight-line basis over the lease term. Additionally, the lessor under this lease agreement provided an incentive to us in the form of funding for certain leasehold improvements made during the fiscal year 2008. We have recorded this lease incentive as deferred rent along with the difference between amounts charged to expenses and currently payable under the lease. The lease incentive is amortized as a reduction to lease expense over the lease term.
Research and Development
Development costs incurred in the research and development of products are expensed as incurred. ASC Topic 985-20-25, Costs of Software to Be Sold, Leased, or Marketed, requires certain software development costs to be capitalized upon the establishment of technological feasibility. The establishment of technological feasibility and the ongoing assessment of the recoverability of these costs requires considerable judgment by management with respect to certain external factors such as anticipated future revenue, estimated economic life, and changes in software and hardware technologies. Costs incurred beyond the establishment of technological feasibility have not been significant to date and accordingly no software development costs were capitalized during the years ended December 31, 2010, January 1, 2010 and January 2, 2009. Software development costs have been recorded as research and development expense.
Advertising Expense
We expense advertising costs as incurred. Advertising expense was approximately $147,000, $160,000 and $444,000 for the years ended December 31, 2010, January 1, 2010 and January 2, 2009, respectively.
Long-Lived Assets
ASC Topic 360-10-40, Property, Plant and Equipment – Derecognition, requires us to review long-lived assets for impairment whenever events or changes in circumstances indicate that the carrying amount of an asset may not be recoverable. Recoverability of assets to be held and used is measured by a comparison of the carrying amount of an asset to future net undiscounted cash flows expected to be generated by the asset. If such assets are considered to be impaired, the impairment to be recognized is measured by the amount by which the carrying amount of the assets exceeds the discounted cash flows.
We recorded approximately $301,000 in impairment losses for the year ended December 31, 2010, of which $218,000 was associated with writing off certain design tools and was part of restructuring activities, therefore recorded as restructuring charges in our statement of operations for the year ended December 31, 2010 (See Note 14 for more information). Approximately $83,000 of the impairment losses was associated with writing off assembly equipment at one of our manufacturing subcontractors. No impairment losses were recognized by us for the years ended January 1, 2010, January 2, 2009 and December 28, 2007.
Litigation Related Expenses
We accrue litigation related legal expenses if these costs are reasonably estimable, regardless of whether a liability can be estimated for the loss contingency, itself. If actual and forecasted legal expenses differ from these estimates, adjustments to the accrual account may be required in future periods. In fiscal year 2010 we accrued approximately $1.9 million in estimated costs associated with effective settlement in connection with IBT litigation (See Legal Proceedings for more information). We recorded the expense for the accrual of the legal fees in the General and Administrative caption of our Statement of Operations for the year ended December 31, 2010. There were no such amounts accrued or expensed for fiscal years 2009 and 2008.
53
Stock-Based Compensation
We measure compensation expense for all stock-based awards at fair value on the date of grant and recognize compensation expense over the service period for awards expected to vest. We determine the fair value of our stock options using the Black-Scholes valuation model. Restricted stock awards are measured based on the fair values of the underlying stock on the dates of grant and expensed over the corresponding vesting period.
The application of the Black-Scholes model to the valuation of options requires the use of input assumptions, including expected volatility, expected term, expected dividend yield and expected risk-free interest rate. Expected volatilities are based on those of similar publicly-traded companies as well as our own. The expected term represents the weighted-average period of time that options granted are expected to be outstanding giving consideration to vesting schedules. The dividend yield was zero based on our history of not paying dividends and the low resultant future expectation of dividend payments; and the risk-free interest rate is based on the U.S. Treasury yield curve in effect at the time of grant for periods corresponding with the expected term of the option.
Net Loss per Share
We calculate net income (loss) per share in accordance with ASC Topic 260, Earnings per Share. Under ASC 260, basic net income (loss) per common share is calculated by dividing net income (loss) by the weighted-average number of common shares outstanding during the reporting period. Diluted net income (loss) per common share reflects the effects of potentially dilutive securities, which consist of common stock options and warrants.
The following table sets forth the computation of basic and diluted income (loss) per common share:
|
Fiscal year ended
|
||||||||||||
|
December 31, 2010
|
January 1, 2010
|
January 2, 2009
|
||||||||||
|
(In thousands, except per share data)
|
||||||||||||
|
Numerator:
|
||||||||||||
|
Net income (loss)
|
$ | (37,840 | ) | $ | (17,403 | ) | $ | 45 | ||||
|
Denominator:
|
||||||||||||
|
Denominator for basic income (loss) per share -
|
||||||||||||
|
weighted average common shares outstanding
|
31,813 | 28,663 | 28,339 | |||||||||
|
Effect of dilutive securities:
|
||||||||||||
|
Stock options and non vested restricted stock units
|
— | 1,965 | ||||||||||
|
Warrants to purchase common stock
|
— | — | 4 | |||||||||
|
Denominator for diluted income (loss) per share -
|
||||||||||||
|
weighted average common shares and potential
|
||||||||||||
|
common shares outstanding
|
31,813 | 28,663 | 30,308 | |||||||||
|
Basic net income (loss) per share
|
$ | (1.19 | ) | $ | (0.61 | ) | $ | 0.00 | ||||
|
Diluted net income (loss) per share
|
$ | (1.19 | ) | $ | (0.61 | ) | $ | 0.00 | ||||
Basic net income (loss) per common share was the same as diluted net income (loss) per common share for the years ended December 31, 2010 and January 1, 2010 as the outstanding options and warrants were anti-dilutive due to losses during the respective periods. The following table presents the potentially dilutive securities outstanding that were excluded from the computation of diluted net income (loss) per common share for the periods presented because their inclusion would have had an anti-dilutive effect:
54
|
Fiscal year ended
|
||||||||||||
|
December 31, 2010
|
January 1, 2010
|
January 2, 2009
|
||||||||||
|
Options to purchase common stock and
|
||||||||||||
|
non vested restricted stock awards
|
6,219 | 4,689 | 2,237 | |||||||||
|
Warrants to purchase common or preferred stock
|
- | 25 | 25 | |||||||||
| 6,219 | 4,714 | 2,262 | ||||||||||
Accounting for Income Taxes
We account for income taxes under the provisions ASC Topic 740, Income Taxes. In applying ASC 740, we are required to estimate our current tax expense together with assessing temporary differences resulting from differing treatments of items for tax and accounting purposes. These differences result in deferred tax assets and liabilities. Significant management judgment is required to assess the likelihood that our deferred tax assets will be recovered from future taxable income. As of December 31, 2010, our total deferred tax assets were principally comprised of net operating loss carry forwards. As of December 31, 2010, based on the available objective evidence, we believe it is more likely than not that our deferred tax assets will not be realizable in the foreseeable future. We based this belief primarily on the fact that we have incurred cumulative pre-tax losses in all years since inception, except one. Accordingly, we provided a full valuation allowance against our net deferred tax assets as of December 31, 2010. Should sufficient positive, objectively verifiable evidence of the realization of our net deferred tax assets exist at a future date, we would reverse any remaining valuation allowance to the extent supported by estimates of future taxable income at that time.
Recent Accounting Pronouncements
In October 2009, the FASB issued Accounting Standards Update (“ASU”) No. 2009-13, which updates the guidance currently included under topic ASC 605-25, Multiple Element Arrangements. ASU 2009-13 relates to the final consensus reached by FASB on a new revenue recognition guidance regarding revenue arrangements with multiple deliverables. The new accounting guidance addresses how to determine whether an arrangement involving multiple deliverables contains more than one unit of accounting, and how the arrangement consideration should be allocated among the separate units of accounting. The new accounting guidance is effective for fiscal years beginning after June 15, 2010 and may be applied retrospectively or prospectively for new or materially modified arrangements. In addition, early adoption is permitted. We are currently evaluating the potential impact, if any, of the new accounting guidance on our consolidated financial statements.
In October 2009, FASB issued ASU No. 2009-14, Topic 985: Certain Revenue Arrangements That Include Software Elements (a Consensus of the FASB Emerging Issues Task Force Issue (EITF)). ASU No. 2009-14 modifies ASC 985-605, Software Revenue, to exclude tangible products that include software and non-software components that function together to deliver the product's functionality. This updated guidance will be applied on a prospective basis for revenue arrangements entered into or materially modified in fiscal years beginning on or after June 15, 2010, however early adoption is permitted. We are currently evaluating the potential impact, if any, of the new accounting guidance on our consolidated financial statements.
In January 2010, the FASB issued ASU No. 2010-06, Topic 820: Fair Value Measurements and Disclosures — Improving Disclosures about Fair Value Measurements, which updates the Codification to require new disclosures for assets and liabilities measured at fair value. The requirements include expanded disclosure of valuation methodologies for fair value measurements, transfers between levels of the fair value hierarchy, and gross rather than net presentation of certain changes in Level 3 fair value measurements. The updates to the Codification contained in ASU No. 2010-06 were effective for interim and annual periods beginning after Dec. 15, 2009, except for requirements related to gross presentation of certain changes in Level 3 fair value measurements, which are effective for interim and annual periods beginning after Dec. 15, 2010. We implemented the portions of the guidance required on January 2, 2010, and the implementation did not have a material impact on our consolidated financial statements.
In January 2010, the FASB issued ASU No.2010-09, Topic 855: Subsequent Events. As a result of ASU No. 2010-09, SEC registrants is no longer required to disclose the date through which management evaluated subsequent events in the financial statements, either in originally issued financial statements or reissued financial statements. The guidance in ASU No. 2010-09 is effective immediately. We adopted ASU 2010-09 and it did not have a material effect on our current financial statements.
In April 2010, the FASB issued ASU No. 2010-17, Topic 650: Revenue Recognition – Milestone Method. This update provides guidance on defining a milestone as well as the criteria that should be met for determining whether the milestone method of revenue recognition is appropriate. The amendments in this update are effective on a prospective basis for milestones achieved in fiscal years, and interim periods within those years, beginning on or after June 15, 2010. Early adoption of ASU 2010-17 is permitted. This standard will be effective for us on a prospective basis as of January 1, 2011. We do not anticipate that the adoption of ASU 2010-17 will have a material impact on our consolidated financial statements.
55
2. Inventory
|
As of
|
||||||||
|
December 31,
|
January 1,
|
|||||||
|
2010
|
2010
|
|||||||
|
(In thousands)
|
||||||||
|
Work-in-process
|
4,402 | $ | 2,077 | |||||
|
Finished goods
|
2,793 | 1,704 | ||||||
|
Valuation allowance
|
(1,735 | ) | (1,536 | ) | ||||
| $ | 5,460 | $ | 2,245 | |||||
3. Property and Equipment
|
As of
|
||||||||||||
|
Useful life
|
December 31,
|
January 1,
|
||||||||||
|
(years)
|
2010
|
2010
|
||||||||||
|
(In thousands)
|
||||||||||||
|
Production and lab equipment
|
3 - 8 | $ | 6,169 | $ | 4,660 | |||||||
|
Computer equipment
|
3 - 5 | 1,426 | 1,199 | |||||||||
|
Office furniture and fixtures
|
3 | 588 | 527 | |||||||||
|
Computer software
|
3 - 5 | 1,768 | 872 | |||||||||
|
Leasehold improvements
|
3 - 6 | 1,361 | 1,191 | |||||||||
| 11,312 | 8,449 | |||||||||||
|
Less: accumulated depreciation
|
(6,882 | ) | (5,401 | ) | ||||||||
| $ | 4,430 | $ | 3,048 | |||||||||
4. Fair Value Measurements and Disclosures
Effective December 29, 2007, we adopted ASC Topic 820, Fair Value Measurements and. ASC 718 defines fair value, provides a consistent framework for measuring fair value under accounting principles generally accepted in the United States and expands fair value financial statement disclosure requirements. ASC 718 does not require any new fair value measurements. It only applies to accounting pronouncements that already require or permit fair value measures, except for standards that relate to share-based payments (ASC Topic 718, Compensation – Stock Compensation).
Valuation techniques considered under ASC 820 are based on observable and unobservable inputs. The Standard classifies these inputs into the following hierarchy:
Level 1 inputs are observable inputs and use quoted prices in active markets for identical assets or liabilities that the reporting entity has the ability to access at the measurement date and are deemed to be most reliable measure of fair value.
Level 2 inputs are observable inputs and reflect assumptions that market participants would use in pricing the asset or liability developed based on market data obtained from sources independent of the reporting entity. Level 2 inputs includes 1) quoted prices for similar assets or liabilities in active markets, 2) quoted prices for identical or similar assets or liabilities in markets that are not active, 3) observable inputs such as interest rates and yield curves observable at commonly quoted intervals, volatilities, prepayment speeds, credits risks, default rates, and 4) market-corroborated inputs.
Level 3 inputs are unobservable inputs and reflect the reporting entity’s own assumptions about the assumptions market participants would use in pricing the asset or liability based on the best information available under the circumstances.
Recurring Fair Value Measurements
At December 31, 2010 we had $22.5 million in cash equivalents, short-term and long-term investments that were subject to fair value measurements in accordance to ASC 820.
56
The fair values of our cash equivalents and investments based on the level of inputs are summarized below:
|
Fair value measurements
|
||||||||||||||||||||||||||||||||||||||||
|
As of
|
||||||||||||||||||||||||||||||||||||||||
|
December 31, 2010
|
January 1, 2010
|
|||||||||||||||||||||||||||||||||||||||
|
Description
|
Fair value
total
|
Level 1
|
Level 2
|
Level 3
|
Gains
(losses)
|
Fair value
total
|
Level 1
|
Level 2
|
Level 3
|
Gains (losses)
|
||||||||||||||||||||||||||||||
|
(In thousands)
|
(In thousands)
|
|||||||||||||||||||||||||||||||||||||||
|
Money market and treasury funds
|
$ | 4,004 | $ | 4,004 | $ | — | $ | — | $ | — | $ | 24,031 | $ | 24,031 | $ | — | $ | — | $ | — | ||||||||||||||||||||
|
U.S. Government agency notes
|
15,176 | 15,176 | — | — | 8 | 24,893 | 24,893 | — | — | 20 | ||||||||||||||||||||||||||||||
|
Auction rate securities
|
3,323 | — | — | 3,323 | (377 | ) | 3,173 | — | — | 3,173 | (528 | ) | ||||||||||||||||||||||||||||
|
Total
|
$ | 22,503 | $ | 19,180 | $ | — | $ | 3,323 | $ | (369 | ) | $ | 52,097 | $ | 48,924 | $ | — | $ | 3,173 | $ | (508 | ) | ||||||||||||||||||
In measuring fair value where Level 1 inputs were available, we used a single valuation technique which valued our securities based on quoted market prices. At December 31, 2010 our Money market funds and U.S. Government agency funds were measured using Level 1 inputs and the fair value was based on daily observable trades.
In measuring fair value where Level 3 inputs were available, we used a single valuation technique which valued our securities based on a multiple discounted cash flow scenarios with various liquidation time horizons. We believe that this pricing model reflects the assumptions a marketplace participant would use in valuing similar assets, which could change significantly over time based on market conditions. Factors that may impact our valuation include changes to credit ratings of the securities as well as to the underlying assets supporting those securities, rates of default of the underlying assets, underlying collateral value, discount rates, credit risk and ongoing strength and quality of market credit and liquidity.
At December 31, 2010 our investments in auction rate securities were measured using unobservable inputs with a fair value of $3.3 million which represented approximately fifteen percent (15%) of total assets subject to fair value measurements on a recurring basis. Auction rate securities are classified as Level 3 securities, because the pricing vendor utilized by our investment broker no longer valued these investments and therefore some of the inputs to measure fair value are no longer observable. The student loan backed auction rate security with a fair value of $1.1 million and the preferred stock auction rate security with a fair value of $2.2 million remain in Level 3 at December 31, 2010 .
The table below provides a reconciliation of all assets measured at fair value on a recurring basis which use Level 3 or significant unobservable inputs for the twelve months ended December 31, 2010 and January 1, 2010:
|
Description
|
Total
|
Auction rate
securities
|
||||||
|
(In Thousands)
|
||||||||
|
Beginning balance January 2, 2009
|
$ | 1,134 | $ | 1,134 | ||||
|
Realized/unrealized gains and losses
|
||||||||
|
Included in earnings
|
(47 | ) | (47 | ) | ||||
|
Included in other comprehensive income (loss)
|
(215 | ) | (215 | ) | ||||
|
Purchases, issuances, and settlements
|
(100 | ) | (100 | ) | ||||
|
|
||||||||
|
Transfers in/(out) of Level 3
|
2,401 | 2,401 | ||||||
|
Ending balance January 1, 2010
|
$ | 3,173 | $ | 3,173 | ||||
|
Realized/unrealized gains and losses
|
||||||||
|
Included in earnings
|
- | - | ||||||
|
Included in other comprehensive income (loss)
|
150 | 150 | ||||||
|
Purchases, issuances, and settlements
|
- | - | ||||||
|
|
||||||||
|
Transfers in/(out) of Level 3
|
- | - | ||||||
|
Ending balance December 31, 2010
|
$ | 3,323 | $ | 3,323 | ||||
As of December 31, 2010, we classified $3.3 million of investments in ARS as long-term due to the fact that they had experienced failed auctions. The remaining securities with a value of $15.1 million have a maturity date of twelve months or less and therefore are classified as short-term investments on our Consolidated Balance Sheet.
At December 31, 2010, the estimated fair value of our investments in ARS was $377,000 less than its cost. As we intend to hold on to these securities until the sooner of a recovery in the ARS market or a call of the securities by the issuer and it is more-likely-than-not that we will not be required to sell this ARS prior to recovery, we did not record other-than-temporary impairment charges in the fiscal year ended December 31, 2010. In the fiscal years ended January 1, 2010 and January 2, 2009, we recorded other-than-temporary impairment charge on our student loan ARS in the amounts of $47,000and $266,000, respectively, in our Consolidated Statement of Operations.
57
During fiscal year ended December 31, 2010 we recorded $139,000 in unrealized gain on our available-for-sale investments which was recorded in accumulated other comprehensive income on the accompanying Consolidated Balance Sheet at December 31, 2010.
We will continue to monitor these securities and may be required to record temporary or other-than-temporary impairment charge in the future.
According to the terms of the acquisition of SafeNet’s Embedded Security Solutions division, the contingent payment might have been due by us if certain revenue targets were achieved by our Embedded Security Solutions segment during the earn out period. The revenue target calculation required accumulated Embedded Security Solutions annual revenue to reach $20 million, adjusted for certain deferred revenue items and pro-rated for the length of the earn out period. We estimated the initial fair value of the contingent payment using Level 3 inputs that were based on financial projections of the acquired business and estimated probabilities of achievement. We recorded $729,000 for contingent consideration as part of our preliminary valuation of the Business at February 26, 2010 which was reversed during the fiscal quarter ended July 2, 2010 based on revised projections. We recorded the reversal of the contingent consideration in our Statement of Operations.
We confirmed the valuation of the consideration to be zero at December 31, 2010 based on the actual results of Embedded Security Solutions segment which did not meet required revenue targets (please see Note 12, Business Acquisitions, for more information).
Non-recurring Fair Value Measurements
Pursuant to the Merger Agreement, we acquired all of the outstanding shares of capital stock of UPEK in exchange for 5,956,540 shares of our common stock and a non-interest bearing promissory note in the principal amount of $21,557,559 (the “Note”). Upon vote by our shareholders on December 17, 2010, the Note was settled by issuing 7,984,281 shares of our common stock. Settlement of the Note in shares was solely based on approval by our shareholders and neither we nor the Note holders had the ability to require settlement in shares.
We valued the Note at fair value including consideration of the alternative settlement feature. We calculated the fair value of the Note to be approximately $13,606,000 at September 7, 2010 and classified it as a liability on our Consolidated Balance Sheet, using the following assumptions which we consider to be Level 2 inputs in the fair value hierarchy as they are observable in the market place:
|
As of
September 7, 2010
|
||||
|
Dividend rate
|
0
|
%
|
||
|
Risk-free interest rate
|
0.19
|
%
|
||
|
Expected volatility
|
55
|
%
|
||
|
Expected life (in months)
|
6
|
|||
During the three months ended December 31, 2010 we recorded a note settlement charge of approximately $7,073,000 which represents the difference between the fair value of the Note as of the acquisition date and the fair value of the settlement shares ($2.59 closing price) of our stock at issuance on December 22, 2010.
All acquired assets and liabilities as a result of our acquisitions were measured at fair value on a non-recurring basis (please see Note 12, Business Acquisitions, for more information). In measuring assets acquired and liabilities assumed we used Level 3 inputs that included various budget cash flow models, customer attrition rates as well as factors such as general economic and industry outlook. Majority of the current assets and liabilities did not require an adjustment from their carrying book values. Long-lived assets were reviewed for future use, physical deterioration and technical and economical obsolescence. In order to arrive at our estimates of fair value for purchased intangible assets, we considered a variety of generally accepted valuation approaches and the final fair value was concluded from the reconciliation of the various valuation indications derived from each approach if multiple approaches were used in the analysis.
5. Contractual Commitments and Contingencies
Operating Leases
We lease our office space, equipment and certain design software under non-cancelable operating lease agreements. Future minimum lease payments under non-cancelable operating leases are approximately $1,811,000, $1,393,000, $1,178,000 and $960,000 for fiscal years 2011, 2012, 2013, and 2014 respectively.
58
Rental expense under the operating leases was approximately $1,781,000, $749,000 and $811,000 for the years ended December 31, 2010, January 1, 2010 and January 2, 2009, respectively.
Non-Cancelable Purchase Commitments
We enter into various inventory- related purchase commitments with the third-party contract manufacturers and suppliers. We had approximately $5,666,000 of non-cancelable purchase commitments with our contract manufacturers as of December 31, 2010. We expect to sell all products which we have committed to purchase.
License Agreements
We have entered into a software design license and maintenance agreement with a supplier. This agreement originally provided for quarterly payments of approximately $89,400, which were expensed as paid. During the fiscal year ended December 28, 2007, we prepaid for licenses to be used over the next three years ending December 31, 2010. During the fiscal year ended January 1, 2010, the agreement was again extended through February 28, 2012 with payments made quarterly. Expense under this agreement for the years ended December 31, 2010, January 1, 2010 and January 2, 2009, was approximately $547,000, $434,000, and $449,000 respectively.
In 2005, we entered into a license agreement for the use and modification of certain software technology for a term of 5 years in exchange for a non-recurring development fee of $175,000 and royalty payments of $.05 – $.12 per product sold with this technology based on the volume of products sold. We expensed the non-recurring development fee of $175,000 in 2005 and we recognized additional royalty related expense of approximately $83,000, $258,000 and $331,000 during fiscal years ending December 31, 2010, January 1, 2010 and January 2, 2009, respectively.
In 2007, we entered into a license agreement for the use of certain silicon technology for a term of five years, and renewable annually thereafter, in exchange for a non-recurring development fee of $70,000 and royalty payments of 2.5% – 3% of the cost of wafers manufactured with this technology. We expensed the non-recurring development fee of $70,000 in 2007 and we recognized additional royalty related expense of approximately $138,000, $57,000 and $113,000 during fiscal years ending December 31, 2010, January 1, 2010 and January 2, 2009, respectively.
During 2007, we entered into a license agreement under which we obtained a nonexclusive right to use certain software technology through the term of the licensor’s copyrights on such technology. In exchange, we are required to pay a fee no lower than $.15 per copy. Under this agreement, we recorded license fee expense of approximately $74,000 and $232,000 for the years ended January 1, 2010 and January 2, 2009, respectively. No fees were paid in the year ending December 31, 2010.
During 2007, we prepaid for licenses to be used over the next three years ending December 31, 2010. This cost was being amortized over the initial license term. During the fiscal year ended January 1, 2010, we extended the contract for the prepaid license fees until February 27, 2012 and contracted for additional licenses. Future minimum license fee payments under the agreement are approximately $415,000 for fiscal year 2011.
During 2009, we entered into a license agreement for the development and reproduction of certain silicon technology for a term of three years in exchange for a license fee of $110,500 and a royalty fee no lower than $.005 per chip. Under this agreement, we recorded license fee expense of approximately $33,500 in 2010 and $77,000 in 2009. No royalty fees were recorded during the fiscal years ending December 31, 2010 and January 1, 2010 respectively.
During 2009, we entered into a license agreement for certain hardware and software technology for a term of three years, in exchange for a license fee of $188,000 and a royalty fee no lower than $.01 per chip. Under this agreement, we recorded license fee expense of $188,000 in 2009. No royalty fees were recorded during the fiscal years ending December 31, 2010 and January 1, 2010 respectively.
Legal Proceedings
AuthenTec is an intervening party in federal patent infringement lawsuit brought by Innovative Biometric Technology, LLC (“IBT”), against Lenovo, Fujitsu, ASUS, Toshiba, and others. The case is captioned Innovative Biometric Technology, LLC v. Lenovo (United States), Inc., et al., Case No. 9:09-cv-81046-KLR, and is was filed on July 19, 2009 in the U.S. District Court for the Southern District of Florida (the “Court”). IBT asserts that the use of certain of the defendant’s products shipped into the United States infringe U.S. Patent No. 7,134,016, which is entitled Software System with a Biometric Dongle and relates generally to a method of protecting software program access. AuthenTec intervened in the case, which the Court approved in November 2010, because IBT’s allegations relate, in part, to the use of biometric software or hardware supplied by us and UPEK to certain of the defendants that has been integrated into laptop computers by our and UPEK’s customers. The parties have taken positions on claim construction and a claim construction hearing is expected to be set by the end of the first quarter of 2011. Discovery is scheduled to end by early June 2011, all pretrial motions and memoranda of law are due by July 1, 2011, and a trial date is set for December 5, 2011. IBT is seeking unspecified monetary damages from the defendants in this case. We believe IBT’s patent is invalid and not infringed.
59
In addition to these legal actions, from time to time, we may be involved in various legal proceedings arising from the normal course of business activities. In our opinion, resolution of these matters is not expected to have a material adverse impact on our consolidated results of operations, cash flows or our financial position. However, depending on the amount, duration and timing, an unfavorable resolution of a matter could materially affect our future results of operations, cash flows or financial position in a particular period.
6. Goodwill and Intangible Assets
The following table summarizes the activity related to the carrying value of our goodwill at December 31, 2010:
|
Reportable Segments
|
||||||||||||
|
Smart
Sensor
Solutions
|
Embedded
Security
Solutions
|
Consolidated
|
||||||||||
|
(In thousands)
|
||||||||||||
|
Goodwill at January 1, 2010
|
$ | - | $ | - | $ | - | ||||||
|
Goodwill resulting from acquisitions (Note 12)
|
- | 2,729 | 2,729 | |||||||||
|
Impairment
|
- | - | - | |||||||||
|
Goodwill at December 31, 2010
|
$ | - | $ | 2,729 | $ | 2,729 | ||||||
At December 31, 2010, purchased intangible assets consisted of the following:
|
As of
|
||||||||||||||||||||||||
|
December 31, 2010
|
January 1, 2010
|
|||||||||||||||||||||||
|
Gross
carrying
value
|
Accumulated amortization
|
Net book
value
|
Gross carrying value
|
Accumulated amortization
|
Net book
value
|
|||||||||||||||||||
|
(In thousands)
|
||||||||||||||||||||||||
|
Patents subject to amortization (6-19 years)
|
$ | 1,050 | 144 | $ | 906 | $ | 1,050 | $ | 52 | $ | 998 | |||||||||||||
|
Total Customer relationships
|
13,575 | 692 | 12,883 | - | - | - | ||||||||||||||||||
|
Total Developed Technology
|
8,692 | 876 | 7,816 | - | - | - | ||||||||||||||||||
|
Total IC Distribution Agreement
|
2,020 | 526 | 1,494 | - | - | - | ||||||||||||||||||
|
Total Non-Compete Agreement
|
533 | 97 | 436 | - | - | - | ||||||||||||||||||
|
Total Backlog
|
829 | 331 | 498 | - | - | - | ||||||||||||||||||
| $ | 26,699 | $ | 2,666 | $ | 24,033 | $ | 1,050 | $ | 52 | $ | 998 | |||||||||||||
At January 1, 2010, purchased intangible assets consisted of the following:
|
Gross carrying
value
|
Accumulated Amortization
|
Net Book Value
|
||||||||||
|
(In thousands)
|
||||||||||||
|
Patents subject to amortization (6-19 years)
|
$
|
1,050
|
$
|
52
|
$
|
998
|
||||||
Amortization expense for intangible assets amounted to approximately $2,614,000, $50,000 and $2,000 for the years ended December 31, 2010, January 1, 2010 and January 2, 2009, respectively. The weighted average amortization period is 6.7 years. The estimated aggregate amortization expense for all amortizable intangibles for each of the succeeding years ending January 1, 2016 is as follows:
60
|
Fiscal year
|
Amount
|
|||
|
(In thousands)
|
||||
|
2011
|
$ | 4,418 | ||
|
2012
|
3,921 | |||
|
2013
|
3,346 | |||
|
2014
|
3,211 | |||
|
2015
|
2,897 | |||
| $ | 17,793 | |||
ASC Topic 350, Intangibles – Goodwill and Other requires that intangible assets with estimable useful lives be amortized over their respective estimated useful lives and reviewed for impairment in accordance with ASC Topic 350, Intangibles – Goodwill and Other whenever events or changes in circumstances indicate that its carrying amount may not be recoverable.
7. Income Taxes
The components of the provision (benefit) for income taxes are as follows:
|
Fiscal year ended
|
||||||||||||
|
December 31,
|
January 1,
|
January 2,
|
||||||||||
|
2010
|
2010
|
2009
|
||||||||||
|
(In thousands)
|
||||||||||||
|
Current tax provision (benefit)
|
||||||||||||
|
Federal
|
$ | (4,226 | ) | $ | (3,601 | ) | $ | — | ||||
|
State
|
— | (219 | ) | — | ||||||||
|
Foreign
|
147 | (42 | ) | (22 | ) | |||||||
| (4,079 | ) | (3,862 | ) | (22 | ) | |||||||
|
Current tax provision (benefit)
|
||||||||||||
|
Federal
|
$ | 3,777 | $ | (1,523 | ) | $ | 430 | |||||
|
State
|
- | (93 | ) | 24 | ||||||||
|
Foreign
|
55 | (51 | ) | (68 | ) | |||||||
| 3,832 | (1,667 | ) | 386 | |||||||||
|
Total Tax Expense/(benefit)
|
(247 | ) | (5,529 | ) | 364 | |||||||
|
Valuation Allowance
|
— | 5,529 | (364 | ) | ||||||||
|
Total tax provision (benefit)
|
$ | (247 | ) | $ | — | $ | — | |||||
The reconciliation of income taxes at the U.S. federal statutory rate to the provision (benefit) for income taxes is as follows:
|
Fiscal year ended
|
||||||||||||
|
December 31,
|
January 1,
|
January 2,
|
||||||||||
|
2010
|
2010
|
2009
|
||||||||||
|
(In thousands)
|
||||||||||||
|
Income taxes at federal statutory rate
|
$ | (12,956 | ) | $ | (5,918 | ) | $ | 5 | ||||
|
State income taxes, net of federal benefit
|
(723 | ) | (233 | ) | — | |||||||
|
Non-deductible permanent items
|
632 | 538 | 281 | |||||||||
|
Foreign rate differential
|
1,941 | 84 | 78 | |||||||||
|
Effect of Rate Change
|
3 | — | — | |||||||||
|
Temporary Items
|
44 | — | — | |||||||||
|
Change in NOL - Federal
|
(3,331 | ) | — | — | ||||||||
|
Change in FIN 48
|
(4,221 | ) | — | — | ||||||||
|
Additional Tax
|
5 | — | — | |||||||||
|
Federal valuation allowances, net of reversals
|
17,903 | 5,436 | (454 | ) | ||||||||
|
Foreign valuation allowances, net of reversals
|
455 | 93 | 90 | |||||||||
|
Other
|
1 | — | — | |||||||||
|
Total
|
$ | (247 | ) | $ | — | $ | — | |||||
The components of the net deferred tax asset and the tax effects of the primary differences giving rise to our deferred tax asset are as follows:
61
|
Fiscal year ended
|
||||||||
|
December 31,
|
January 1,
|
|||||||
|
2010
|
2010
|
|||||||
|
(In thousands)
|
||||||||
|
Deferred tax assets:
|
||||||||
|
Intangible assets and property and equipment
|
$ | 439 | $ | 1,438 | ||||
|
Inventory reserve
|
1,460 | 543 | ||||||
|
R&D Credit
|
1,104 | - | ||||||
|
Unrealized loss on investment
|
322 | 111 | ||||||
|
Other accrued liabilities
|
2,450 | 1,645 | ||||||
|
Chinese capitalized expenses
|
237 | 175 | ||||||
|
Other
|
1,928 | 24 | ||||||
|
Foreign NOL
|
3,105 | 224 | ||||||
|
Federal and state NOLs
|
40,443 | 21,083 | ||||||
|
Total
|
51,488 | 25,243 | ||||||
|
Valuation allowance
|
(51,488 | ) | (25,243 | ) | ||||
|
Net deferred tax assets
|
$ | — | $ | — | ||||
At December 31, 2010, we have federal net operating loss carry forwards of approximately $113,045,000 available to reduce future taxable income, which will begin to expire in the year 2018.
At December 31, 2010, we have foreign net operating loss carry forwards of approximately $58,558,000 available to reduce future taxable income, which will begin to expire in the year 2012.
The entire balance of the deferred tax assets has been offset by a valuation allowance or uncertain tax provision since realization of any future benefit from deductible temporary differences and utilization of net operating loss carry forwards cannot be sufficiently assured at December 31, 2010.
Under the provisions of the Internal Revenue Code, certain substantial changes in our ownership may result in limitation on the amount of net operating loss carry forwards which can be used in future years.
Adoption of Accounting for Uncertainty in Income Taxes
In June 2006, the FASB issued Interpretation No. 48, “Accounting for Uncertainty in Income Taxes” (FIN 48, now codified as ASC 740-10), which clarifies the accounting for uncertainty in income taxes recognized in a company’s financial statements in accordance with FASB Statement No. 109, “Accounting for Income Taxes” (FAS 109, now codified as ASC 740.) This interpretation prescribes a recognition threshold and measurement attribute for the financial statement recognition and measurement of a tax position taken or expected to be taken in a tax return. ASC 740-10 also provides guidance on derecognition of tax benefits, classification on the balance sheet, interest and penalties, accounting in interim periods, disclosure, and transition. The Company adopted ASC 740-10 effective December 30, 2006.
The Company has analyzed filing positions in all of the federal, state and foreign jurisdictions where it is required to file income tax returns, as well as all open tax years in these jurisdictions. The Company has identified its federal tax return and its state tax returns in Florida and California as “major” tax jurisdictions, as defined. The periods subject to examination for the Company’s federal, Florida and California returns are the 2007 through 2010 tax years. The Company is not currently under audit by the Internal Revenue Service or the Florida Department of Revenue. As a result of the implementation of ASC 740-10, the Company recognized a $1,520,355 decrease in assets for unrecognized tax benefits associated with state net operating losses. The application of ASC 740-10 would have resulted in a decrease in retained earnings of $1,520,355, except that the decrease was fully offset by the application of a valuation allowance.
The Company acquired the stock of UPEK, Inc. (“UPEK”) on September 7, 2010, at which time UPEK had an ASC 740-10 liability for unrecognized tax benefits of $4,236,020. UPEK has identified its federal tax return and its state tax return in California as “major” tax jurisdictions, as defined. The periods subject to examination for the Company’s federal and California returns are the 2006 through 2010 tax years. UPEK is not currently under audit by the Internal Revenue Service or California Franchise Tax Board.
As of December 31, 2010, the Company had $1,520,355 of unrecognized tax benefits, a net increase of $96,279 from $1,424,076 as of January 2, 2010. This increase results primarily from the addition of UPEK’s unrecognized tax benefits. This increase has no impact on the Company’s effective tax rate in 2010 as it will be offset by the release of a valuation allowance of an equal amount. A reconciliation of the beginning and ending amount of unrecognized tax benefits is as follows:
62
|
(in thousands)
|
||||
|
Balance at December 28, 2007
|
1,424 | |||
|
Increase/(decrease) based on tax positions related to the current year
|
— | |||
|
Increase/(decrease) for tax positions of prior years
|
— | |||
|
Decrease related to settlements
|
— | |||
|
Decrease related to the lapse of the statute of limitations
|
— | |||
|
Balance at January 2, 2009
|
1,424 | |||
|
Increase/(decrease) based on tax positions related to the current year
|
— | |||
|
Increase/(decrease) for tax positions of prior years
|
— | |||
|
Decrease related to settlements
|
— | |||
|
Decrease related to the lapse of the statute of limitations
|
— | |||
|
Balance at January 1, 2010
|
$ | 1,424 | ||
|
Increase/(decrease) based on tax positions related to the current year
|
— | |||
|
Increase/(decrease) for tax positions of prior years
|
4,246 | |||
|
Decrease related to settlements
|
— | |||
|
Decrease related to the lapse of the statute of limitations
|
(4,150 | ) | ||
|
Balance at December 31, 2010
|
$ | 1,520 | ||
We recognize interest and penalties related to uncertain tax positions in income tax expense which were approximately $10,000 and none as of and for the years ended December 31, 2010 and January 1, 2010.
8. Warrants
During the year ended December 31, 2010, approximately 25,000 warrants to purchase shares of our common stock expired. These warrants were issued on September 25, 2000 and January 5, 2001 with an exercise price of $9.00 and expired on September 25, 2010. There were no warrants exercised during fiscal 2010 and there were no warrants outstanding as of December 31, 2010.
9. Stock-Based Compensation
In 1998, we adopted a stock option plan, which we later amended and restated into our 2004 Stock Incentive Plan, which authorized our Board of Directors to grant incentive stock options (“ISOs”) and non-qualified stock options (“NQSOs”), stock appreciation rights, stock and phantom stock awards, performance awards and other stock-based awards to employees, directors, officers, and consultants. As of December 31, 2010, the total number of shares authorized under our 2004 Stock Incentive Plan by the Board of Directors was approximately 4,720,000 and all the remaining shares available to grant were rolled into our 2010 Inventive Plan.
In June 2007, our “2007 Stock Incentive Plan” was approved by our Board of Directors and stockholders. This plan allows for the grant of incentive stock options (“ISOs”) and non-qualified stock options (“NQSOs”), stock appreciation rights, stock and phantom stock awards, performance awards and other stock-based awards to employees, officers, directors, and other individuals providing bona fide services to us or any of our affiliates. As of December 31, 2010, the total number of shares authorized under our 2007 Stock Incentive Plan by the Board of Directors was approximately 3,524,000 and all the remaining shares available to grant were rolled into our 2010 Inventive Plan.
In June 2010, our “2010 Stock Incentive Plan” was approved by our Board of Directors and stockholders. This plan allows for the grant of incentive stock options (“ISOs”) and non-qualified stock options (“NQSOs”), stock appreciation rights, stock and phantom stock awards, performance awards and other stock-based awards to employees, officers, directors, and other individuals providing bona fide services to us or any of our affiliates. As of December 31, 2010, the total number of shares authorized under our 2010 Stock Incentive Plan by the Board of Directors was 2,200,000. No further awards shall be granted under the Prior Plans and the Prior Plans shall remain in effect only so long as awards granted thereunder shall remain outstanding. The total number of shares available to grant at December 31, 2010 was approximately 1,006,000.
NQSOs may be granted to employees, officers, directors and consultants. ISOs may be granted only to employees. Under our 2010 Stock Incentive Plan (“the Plan”), ISOs are granted at a price that is not less than 100% of the fair market value, as is determined at the market close on the date of grant. If ISOs and NQSOs are granted to an employee who owns more than 10% of the total combined voting power of all classes of stock, the exercise price per share will be not less than 110% of the fair market value on the date of grant.
63
Options under the Plans may be granted for periods of up to ten years. Any option granted shall be exercisable at such times and under such conditions as determined by our Board and as permissible under the terms of the Plan. Options generally vest at the rate of 25% on the one year anniversary of the vesting commencement date and ratably over the next 36 months.
A summary of the stock option activity is presented below:
|
Weighted
|
||||||||
|
Number of
|
average
|
|||||||
|
shares
|
exercise
|
|||||||
|
(in thousands)
|
price
|
|||||||
|
Outstanding as of January 1, 2010
|
4,825 | $ | 4.00 | |||||
|
Granted
|
2,184 | 1.91 | ||||||
|
Forfeited
|
(720 | ) | 4.13 | |||||
|
Exercised
|
(122 | ) | 0.89 | |||||
|
Outstanding as of December 31, 2010
|
6,167 | $ | 3.31 | |||||
The total intrinsic value of options exercised during the years ended December 31, 2010, January 1, 2010 and January 2, 2009 was approximately $164,000, $173,000 and $8,188,000, respectively.
Restricted stock units granted under the 2010 Stock Incentive Plan are either incentive or performance based awards that will result in a payment to a participant in shares of our common stock. The incentive based awards vest as the service conditions are met while the performance based awards also have performance conditions as well as usual service conditions. The plan administrator will determine the number of shares and the conditions that must be satisfied, which typically are based on achievement of performance milestones and service conditions.
Restricted stock awards are measured at fair value based on the market price which is determined upon the closing price of our common stock on the NASDAQ Global Market on the date of the grant.
A summary of the restricted stock activity for the year ended December 31, 2010 is presented below:
|
Weighted
|
||||||||
|
Number of
|
average
|
|||||||
|
shares
|
grant-date
|
|||||||
|
(in thousands)
|
fair value
|
|||||||
|
Outstanding as of January 1, 2010
|
268 | $ | 4.22 | |||||
|
Granted
|
8 | 2.45 | ||||||
|
Forfeited
|
(126 | ) | 2.96 | |||||
|
Issued
|
(19 | ) | 12.67 | |||||
|
Outstanding as of December 31, 2010
|
131 | $ | 4.09 | |||||
The total intrinsic value of restricted stock units vested during the fiscal year ended December 31, 2010 was approximately $53,000.
We estimate expected forfeitures based on our historical experience and recognize compensation cost over a four-year vesting period on a straight-line basis. Any performance based awards are recognized in earnings over the requisite service period for each separately vesting portion of the award. We recognize expense over the attribution period beginning when it is determined that meeting the performance condition is probable.
The total unrecognized stock-based compensation for options and restricted stock awards granted accounted for under ASC 718 was approximately $4,167,000 as of December 31, 2010. These options had a remaining weighted-average period over which they are expected to be recognized of 2.5 years as of December 31, 2010.
The weighted average estimated values of stock option grants, as well as the weighted average assumptions used in calculating these values were based on estimates at the date of grant as follows:
64
|
Fiscal year ended
|
||||||||||||
|
December 31,
2010
|
January 1,
2010
|
January 2,
2009
|
||||||||||
|
Grant date fair value
|
$ | 1.13 | $ | 1.02 | $ | 5.73 | ||||||
|
Expected life (in years)
|
4.2 | 4.3 | 4.9 | |||||||||
|
Risk free rate
|
1 | % | 2 | % | 3 | % | ||||||
|
Volatility
|
78 | % | 74 | % | 55 | % | ||||||
|
Dividend yield
|
0 | % | 0 | % | 0 | % | ||||||
|
Estimated forfeiture rate
|
14 | % | 12 | % | 10 | % | ||||||
The following table contains information about outstanding stock options at December 31, 2010 (in thousands, except years and per share data):
|
Exercisable Options
|
|
|
Number of options
|
3,387
|
|
Average exercise price
|
$ 3.79
|
|
Aggregate intrinsic value
|
$ 3,297
|
|
Weighted average remaining contractual life
|
5.5 years
|
|
Outstanding Options
|
|
|
Number of options
|
6,167
|
|
Average exercise price
|
$ 3.31
|
|
Aggregate intrinsic value
|
$ 4,837
|
|
Weighted average remaining contractual life
|
7.2 years
|
10. Employee Benefit Plans
We maintain a 401(k) plan for our employees. The plan has provisions to allow for company matching. We have chosen not to exercise such provisions. To be eligible to participate, employees must be 21 years of age, and are expected to work a minimum of 1,000 hours during the year.
We have bonus plans, based on revenue and operating income goals, which provide incentive compensation for certain officers and employees. There were no amounts charged to expense for such incentive compensation in the fiscal years ended December 31, 2010 and January 1, 2010. In the year ended January 2, 2009, we recorded approximately $541,000 in incentive compensation.
11. Segment Information
Segment reporting, under the guidance of ASC 280, Segment Reporting, requires disclosures of certain information regarding reportable segments, products and services, geographic areas of operation and major customers. Segment reporting is based upon the “management approach,” which requires management to organize the Company’s reportable segments for which separate financial information is (i) available and (ii) evaluated regularly by the chief operating decision maker in deciding how to allocate resources and in assessing performance.
Historically we operated in one segment. Characteristics of our operations included the similarities in our products, the commonality of our customers across brands, our unified marketing strategy, and the nature of the financial information used by our Executive Officers.
The acquisition of SafeNet’s Embedded Security Solutions division has not only broadened our revenue range which results in differentiation of our product categories but also causes evaluation of disaggregated financial information separately by our chief operating decision maker. This acquisition resulted in a new segment in its entirety. Accordingly, we determined that we now operate in two reporting segments: Smart Sensor Solutions (“SSS”) and Embedded Security Solutions (“ESS”). The operating results from the UPEK acquisition are included in our Smart Sensor Solutions segment.
Our Chief Executive Officer, who is our chief operating decision maker, reviews financial information at the operating segment level. A description of the types of products and services provided by each business segment follows.
|
|
·
|
Smart Sensor Solutions include fingerprint sensors that are used in notebooks, netbooks, tablet PCs, peripherals, cell phones, mobile systems and a wide variety of access control devices. Our sensors offer touch-powered multi-functionality that includes combinations of user navigation, personalization, and convenient security. In addition to smart fingerprint sensors, SSS offers our new identity management software applications, TrueSuite® and TrueSuite Mobile®, which are designed to make fingerprint-enabled PC’s and mobile phones easier to use and more secure, while increasing user convenience and personalization. The TrueSuite family is tailored for consumers who demand simplicity, improved usability, and one-touch access to their digital identity and online social networks.
|
65
|
|
·
|
Embedded Security Solutions include complete, standards-based, server-side digital rights management (“DRM”) software and toolkits for mobile operators, service providers, platform integrators, as well as client-side DRM solutions for device manufacturers and semiconductors, software application and platform vendors. The Embedded Security Solutions portfolio also includes QuickSec IP security (IPsec) and MAC security (MACsec) toolkits as well as semiconductor intellectual property (IP) and security processors for enterprise and telecom grade security equipment. In addition, Embedded Security Solutions grants licenses, which include certain patent rights of our portfolio, and collects license fees and royalties in partial consideration for such licenses.
|
We evaluate the performance of our segments based on operating income (loss). Our Chief Executive Officer does not review any information regarding total assets on an operating segment basis. The accounting policies for segment reporting are the same as for AuthenTec as a whole. The table below presents revenues and operating loss for reportable segments:
|
Reportable segments
|
||||||||||||
|
Smart
Sensor
Solutions
|
Embedded
Security
Solutions
|
Consolidated
|
||||||||||
|
(In thousands)
|
||||||||||||
|
Year ended December 31, 2010
|
||||||||||||
|
Net revenue
|
$ | 32,161 | $ | 12,506 | $ | 44,667 | ||||||
|
Operating income (loss)
|
(32,316 | ) | 501 | (31,815 | ) | |||||||
|
Year ended January 1, 2010
|
||||||||||||
|
Net revenue
|
34,066 | - | 34,066 | |||||||||
|
Operating loss
|
(17,721 | ) | - | (17,721 | ) | |||||||
|
Year ended January 2, 2009
|
||||||||||||
|
Net revenue
|
63,948 | - | 63,948 | |||||||||
|
Operating loss
|
$ | (1,954 | ) | $ | - | $ | (1,954 | ) | ||||
The following table is based on the geographic location of OEMs, ODMs and the distributors which purchased our products. For shipments to ODMs, contract manufacturers or distributors, their geographic location may be different from the geographic locations of the ultimate end customers. For the fiscal years ended December 31, 2010, January 1, 2010 and January 2, 2009, revenue generated from international customers accounted for approximately 84%, 95% and 97% of total revenue, respectively.
The majority of our revenue is denominated in U.S. dollar, however we do generate revenue that is denominated in other currencies, mostly Euro and Japanese Yen.
|
Fiscal year ended
|
||||||||||||||||||||||||
|
December 31,
|
January 1,
|
January 2,
|
||||||||||||||||||||||
|
2010
|
2010
|
2009
|
||||||||||||||||||||||
|
Revenue $
|
% of total
|
Revenue $
|
% of total
|
Revenue $
|
% of total
|
|||||||||||||||||||
|
(In thousands)
|
||||||||||||||||||||||||
|
Asia/Pacific
|
$ | 18,467 | 41 | % | $ | 23,832 | 70 | % | $ | 48,709 | 76 | % | ||||||||||||
|
Japan
|
15,124 | 34 | % | 7,562 | 22 | 12,459 | 19 | |||||||||||||||||
|
United States
|
7,040 | 16 | % | 1,799 | 5 | 1,649 | 3 | |||||||||||||||||
|
Canada
|
1,057 | 2 | % | 830 | 3 | 1,021 | 2 | |||||||||||||||||
|
Europe
|
2,979 | 7 | % | 43 | --- | 110 | --- | |||||||||||||||||
| $ | 44,667 | 100 | % | $ | 34,066 | 100 | % | $ | 63,948 | 100 | % | |||||||||||||
|
% Int'l
|
84 | % | 95 | % | 97 | % | ||||||||||||||||||
The following table outlines the geographic location of our net long-lived assets:
66
|
As of
|
||||||||
|
December 31,
|
January 1,
|
|||||||
|
2010
|
2010
|
|||||||
|
(In thousands)
|
||||||||
|
Asia Pacific
|
$ | 2,118 | $ | 1,508 | ||||
|
Japan
|
4 | 23 | ||||||
|
United States
|
1,418 | 1,517 | ||||||
|
Europe
|
890 | - | ||||||
|
Total
|
$ | 4,430 | $ | 3,048 | ||||
12. Business Acquisitions
SafeNet’s Embedded Security Solutions Division
On February 26, 2010 (‘the acquisition date”), we entered into an Asset Purchase Agreement by and between us and SafeNet, Inc. (“SafeNet”) pursuant to which we acquired substantially all of the assets and certain liabilities related to SafeNet’s Embedded Security Solutions division (the “Business”) in exchange for approximately $8.5 million in cash, 1,211,482 shares of our common stock and an earn out payment of up to $2.5 million in cash based on levels of gross revenue attributable to the Business between March 1, 2010 and December 31, 2010 (“the earn out period”).
Our primary reason for the SafeNet’s Embedded Security Solutions division acquisition was to continue our transformation from a component supplier to a more comprehensive source of security, identity management and touch control solutions. In addition to the increased revenue from SafeNet’s products, their Embedded Security Solutions division significantly strengthens our offerings in our existing markets. By leveraging the expertise of their engineering team in software development, it will allow us to incorporate enhanced functionality into and complement our existing product offerings, augment our engineering workforce, and enhance our technological capabilities.
The total consideration paid by us for the Business is summarized below:
|
(In thousands)
|
||||
|
Cash
|
$ | 8,500 | ||
|
Common Stock (1)
|
2,799 | |||
|
Earn Out (2)
|
729 | |||
|
Working capital receivable (3) (4)
|
(908 | ) | ||
|
Total Consideration
|
$ | 11,120 | ||
|
(1)
|
Represents 1,211,482 shares issued at $2.31 price per share
|
|
(2)
|
Represents estimated earn out amount based on probability, at the time of acquisition
|
|
(3)
|
Represents final working capital adjustment. Consideration for the working capital agreement was provided through the return of a portion of the shares issued to the seller at a price of $2.35 per share, as specified in the Asset Purchase Agreement.
|
|
(4)
|
Working capital receivable has been adjusted by approximately ($265,000) from $1,173,000 which was reported as of October 1, 2010.
|
During the year ended December 31, 2010, we recorded a non-cash transaction in our Common Stock and Additional-Paid-In Capital accounts for the approximate amount of $2,799,000, to reflect issuance of 1,211,482 shares of our common stock in connection with our acquisition of SafeNet’s Embedded Security Solutions division, completed on February 26, 2010. The closing price of our common stock on the NASDAQ Global Market on the date of the acquisition was $2.31.
The shares of common stock issued was subject to increase or decrease based on meeting a closing date minimum working capital requirement of approximately $1.7 million as defined in the purchase agreement. Based on the closing working capital calculations, Safenet was required to surrender 385,982 previously issued common shares. As of April 2, 2010 we reflected a $775,000 working capital receivable as a reduction to Additional-Paid-In Capital in our Consolidated Statement of Stockholders’ Equity. This amount was increased by $168,000 during the three months ended July 2, 2010 and by $230,000 during the three months ended October 1, 2010 and then decreased by $265,000 during the three months ended December 31, 2010 to the final amount agreed upon with Safenet of $907,700.
The acquisition was accounted for under the acquisition method, in accordance with ASC 805, Business Combinations, with the assets and liabilities acquired recorded at their fair values at the date of acquisition. Identified intangible assets, goodwill and deferred revenue were recorded at their estimated fair values. The results of operations of the acquired business have been included in our operating results beginning as of the effective date of the acquisition. We allocated the purchase price of the acquisition to tangible assets, liabilities and identifiable intangible assets acquired based on their estimated fair values. The excess of the purchase price over the aggregate fair values was recorded as goodwill. The fair value assigned to identifiable intangible assets acquired was based on estimates and assumptions made by management. Intangible assets are amortized using a method that reflects the pattern in which the economic benefits of the intangible asset are consumed or otherwise used up or, if that pattern cannot be reliably determined, using a straight-line amortization method.
67
The principal factor that resulted in recognition of goodwill was that the purchase price for the acquisition was based in part on cash flow projections assuming the integration of any acquired technology and products with our products, which is of considerably greater value than utilizing each of the acquired company’s technology or products on a standalone basis. Our goodwill also includes value assigned to assembled workforce which cannot be recognized as an intangible asset.
The contingent payment could have been due by us if certain revenue targets were achieved by our Embedded Security Solutions segment during the earn out period. The revenue target calculation required accumulated Embedded Security Solutions annual revenue to reach $20 million, adjusted for certain deferred revenue items and pro-rated for the length of the earn out period. We estimated the fair value of the contingent payment based on financial projections of the acquired business and estimated probabilities of achievement. As of April 2, 2010, the fair value of the contingent consideration arrangement of $0.7 million was determined using the income approach with significant inputs that were not observable in the market. Key assumptions included discount rates consistent with the level of risk of achievement and probability-adjusted revenue amounts. At July 2, 2010 we reevaluated contingent consideration based on the actual results to date as well as updated financial projections. We determined that the minimum required revenue target could not be achieved during the earn out period and therefore no contingent consideration would be due. As a result of this determination, we reversed the earn out liability of $0.7 million and recorded the change in Other Income (Expense) caption of our Consolidated Statement of Operations. We did not make any further adjustment to the contingent consideration during the year ended December 31, 2010 as the actual results did not reach the required revenue target.
In addition to the purchase price, we incurred $0.7 million in acquisition related costs, which were expensed as incurred and recorded in the General and Administrative caption of our Consolidated Statement of Operations for the year ended December 31, 2010, in accordance with ASC 805, Business Combinations.
The following table summarizes the preliminary allocation of the purchase price as initially reported on our quarterly report on Form 10-Q for the fiscal quarter ended April 2, 2010, filed with the Securities and Exchange Commission on May 12, 2010, and the final allocation of the purchase price to the fair value of the assets acquired and liabilities assumed in connection with the SafeNet’s Embedded Security Solutions division acquisition:
|
Valuation at acquisition date 02/26/2010
|
||||||||||||
|
Preliminary
allocation
|
Adjustments
|
Final
allocation
|
||||||||||
|
(In thousands)
|
||||||||||||
|
Assets
|
||||||||||||
|
Accounts receivable, net *
|
$ | 1,960 | $ | (45 | ) | $ | 1,915 | |||||
|
Prepaid and other current assets *
|
354 | (14 | ) | 340 | ||||||||
|
Property and equipment, net **
|
689 | 242 | 931 | |||||||||
|
Goodwill **
|
3,095 | (366 | ) | 2,729 | ||||||||
|
Purchased intangible assets **
|
7,555 | (17 | ) | 7,538 | ||||||||
|
Total assets acquired
|
13,653 | (200 | ) | 13,453 | ||||||||
|
Liabilities
|
||||||||||||
|
Accounts payable*
|
(328 | ) | 57 | (271 | ) | |||||||
|
Accrued liabilities *
|
(988 | ) | 11 | (977 | ) | |||||||
|
Other liabilities
|
(80 | ) | - | (80 | ) | |||||||
|
Deferred revenue
|
(1,005 | ) | - | (1,005 | ) | |||||||
|
Total liabilities assumed
|
(2,401 | ) | 68 | (2,333 | ) | |||||||
|
Purchase price
|
$ | 11,252 | $ | (132 | ) | $ | 11,120 | |||||
|
* Adjustments related to the working capital
|
||||||||||||
|
** Adjustments related to changes in valuation assumptions related to allocation of revenue streams
|
||||||||||||
Intangible Assets
In our determination of the fair value of the intangible assets we considered, among other factors, the best use of acquired assets, analyses of historical financial performance and estimates of future performance of the products acquired with SafeNet’s Embedded Security Solutions Division and UPEK. The fair values of identified intangible assets were calculated considering market participant assumptions and using an income approach and estimates and assumptions provided by SafeNet’s and our management. The following table sets forth the components of initially identified intangible assets associated with the SafeNet’s Embedded Security Solutions division acquisition as reported on our quarterly report on Form 10-Q for the fiscal quarter ended April 2, 2010, filed with the Securities and Exchange Commission on May 12, 2010, and finalized fair value of identified intangible assets associated with the SafeNet’s Embedded Security Solutions division acquisition and their estimated weighted average useful lives:
68
|
Valuation at acquisition date February 26, 2010
|
||||||||||||||
|
(In thousands)
|
Weighted
Average Useful
Life
|
Preliminary fair
value
|
Adjustments
|
Final fair
value
|
||||||||||
|
Developed technology
|
5 years
|
$ | 5,131 | $ | (1,456 | ) | $ | 3,675 | ||||||
|
Customer relationships
|
7.1 years
|
1,090 | 220 | 1,310 | ||||||||||
|
Integrated circuit distribution agreement
|
5 years
|
672 | 1,348 | 2,020 | ||||||||||
|
Non-compete agreement
|
5 years
|
662 | (129 | ) | 533 | |||||||||
|
Total
|
$ | 7,555 | $ | (17 | ) | $ | 7,538 | |||||||
The changes from the amounts reported at April 2, 2010 were the result from the continuing refinement in the valuation.
Developed technology consists of the QuickSec Embedded Security toolkits, SafeXcel IP Cores and DRM Solutions. Developed technology represents the fundamental technology that survives multiple product iterations and has passed technological feasibility.
Customer relationships represent future projected revenue that will be derived from sales of future versions of existing products to existing customers of the acquired company. Embedded Security Solutions portfolio of software and hardware products is used in communication and network products to ensure data privacy for businesses and individuals. Products are typically embedded in the end user products of our customers.
Integrated circuit (“IC”) distribution agreement represents part of the transaction where AuthenTec was authorized as the exclusive supplier of SafeNet’s SafeXcel security processor ICs. In the original negotiations, SafeNet was to outsource the manufacturing of the ICs to a third party and AuthenTec would be responsible for sales, marketing, and distribution. After further negotiations, parties came to an agreement that AuthenTec will take over the manufacturing process completely and will operate the business using fabless semiconductor business model, outsourcing manufacturing to third parties. As of October 1, 2010, the agreement has not been finalized.
Non-compete agreement. In conjunction with the close of the acquisition, SafeNet signed a non–compete agreement. The value of the SafeNet business could be materially diminished without the non-compete agreement which prevents SafeNet from competing with the Business in restricted territories for a period of five years from the acquisition date.
Deferred Revenue
In connection with the allocation of consideration transferred, we estimated the fair value of the service obligations assumed from SafeNet as a consequence of the acquisition. The estimated fair value of the service obligations was determined using a cost build-up approach. The cost build-up approach determines fair value by estimating the costs relating to fulfilling the obligations plus a normal profit margin. The sum of the costs and operating profit approximates, in theory, the amount that we would be required to pay a third party to assume the service obligations. The estimated costs to fulfill the service obligations were based on the historical direct costs and indirect costs related to SafeNet’s service and maintenance agreements with its customers. Direct costs include personnel directly engaged in providing service and support activities, while indirect costs consist of estimated general and administrative expenses based on normalized levels as a percentage of revenue. The estimated research and development costs associated with support contracts have not been included in the fair value determination, as these costs were not deemed to represent a legal obligation at the time of acquisition. We recorded $1.0 million of deferred revenue to reflect the estimate of the fair value of SafeNet’s service obligations assumed.
UPEK, Inc.
On September 3, 2010, we entered into an Agreement and Plan of Merger (the “Merger Agreement”) by and among the Company, AU Merger, Inc., a wholly owned subsidiary of the Company (“Sub”), UPEK, and Sofinnova Capital IV FCPR, as the Stockholders Representative, pursuant to which Sub was merged with and into UPEK with UPEK surviving as a wholly-owned subsidiary of the Company (the “Merger”). The acquisition closed on September 7, 2010.
69
Pursuant to the Merger Agreement, we acquired all of the outstanding shares of capital stock of UPEK in exchange for 5,956,540 shares of our common stock and a non-interest bearing promissory note in the principal amount of $21,557,559 (the “Note”).
Our primary reason for UPEK’s acquisition was to create customer and market diversity in order to accelerate the achievement of our growth and profit objectives as well as attain profitability through synergistic cost reductions, gain depth and expertise as an expanded global team advancing our technology and product roadmaps, and add to an unmatched patent portfolio.
The total consideration paid by us for the business is summarized below:
|
(In thousands)
|
||||
|
Common Stock (1)
|
10,543 | |||
|
Fair value of promissory note (2)
|
13,606 | |||
|
Less: litigation dismissal (3)
|
(4,141 | ) | ||
|
Total consideration
|
$ | 20,008 | ||
|
(1) Represents 5,956,540 shares issued at $1.77 price per share
|
||||
|
(2) Represents fair value of the Note at the time of the acquisition
|
||||
|
(3) Represents estimated legal costs of dismissed patent lawsuit with UPEK
|
||||
During the three months ended October 1, 2010, we recorded a non-cash transaction in our Note Payable account for the fair value of the promissory note in the amount of approximately $13,606,000 and a non-cash transaction in our Common Stock and Additional-Paid-In Capital accounts for the approximate amount of $10,543,000, to reflect issuance of 5,956,540 shares of our common stock in connection with our acquisition of UPEK, completed on September 7, 2010. The closing price of our common stock on the NASDAQ Global Market on the date of the acquisition was $1.77.
AuthenTec convened a special meeting of its stockholders on December 17, 2010 (the “Special Meeting”) for the purpose of voting on the approval of the issuance of the Note Satisfaction Shares in full satisfaction of the Note. At the Special Meeting, the stockholders approved the issuance of the Note Satisfaction Shares. We issued 7,984,281 shares on December 22, 2011 in satisfaction of the Note. We recorded a Note settlement charge of $7.1 million in our Consolidated Statement of Operations during the three months ended December 31, 2010 as a result in the difference between the initial Note value and the fair value upon issuance of the Note Satisfaction Shares.
The acquisition was accounted for under the acquisition method, in accordance with ASC 805, Business Combinations, with the assets and liabilities acquired recorded at their fair values at the date of acquisition. Identified intangible assets, goodwill and deferred revenue are recorded at their estimated fair values as per the valuation which was finalized during the three months ended December 31, 2010. The results of operations of the acquired business have been included in our operating results beginning as of the effective date of the acquisition. We allocated the purchase price of the acquisition to tangible assets, liabilities and identifiable intangible assets acquired based on their estimated fair values. A portion of the excess of the purchase price over the aggregate fair values of the assets acquired and liabilities assumed was recorded as litigation dismissal expense. The fair value assigned to identifiable intangible assets acquired was based on estimates and assumptions made by management. Intangible assets are amortized using a method that reflects the pattern in which the economic benefits of the intangible asset are consumed or otherwise used up or, if that pattern cannot be reliably determined, using a straight-line amortization method.
The litigation dismissal expense was calculated based on the estimated legal costs of the patent lawsuit with UPEK that would have been incurred if the claims were not dismissed as a result of the acquisition.
The following table summarizes the preliminary allocation of the purchase price as initially reported on our quarterly report on Form 10-Q for the fiscal quarter ended October 1, 2010, filed with the Securities and Exchange Commission on November 15, 2010, and the final allocation of the purchase price to the fair value of the assets acquired and liabilities assumed in connection with the UPEK:
70
|
Valuation at acquisition date 09/07/2010
|
||||||||||||
|
Preliminary
allocation
|
Adjustments
|
Final
allocation
|
||||||||||
|
(In thousands)
|
||||||||||||
|
Assets acquired
|
||||||||||||
|
Cash
|
$ | 881 | $ | - | $ | 881 | ||||||
|
Accounts receivable, net *
|
3,757 | (191 | ) | 3,566 | ||||||||
|
Inventory, net
|
2,391 | - | 2,391 | |||||||||
|
Prepaid and other current assets *
|
179 | 250 | 429 | |||||||||
|
Property and equipment, net **
|
1,601 | (4 | ) | 1,597 | ||||||||
|
Other assets
|
140 | - | 140 | |||||||||
|
Deferred tax asset
|
3,872 | - | 3,872 | |||||||||
|
Goodwill **
|
530 | (530 | ) | - | ||||||||
|
Purchased intangible assets **
|
17,898 | 213 | 18,111 | |||||||||
|
Total assets acquired
|
31,249 | (262 | ) | 30,987 | ||||||||
|
Liabilities assumed
|
||||||||||||
|
Accounts payable
|
(4,871 | ) | - | (4,871 | ) | |||||||
|
Accrued liabilities *
|
(2,046 | ) | 262 | (1,784 | ) | |||||||
|
Deferred tax liability
|
(4,324 | ) | - | (4,324 | ) | |||||||
|
Total liabilities assumed
|
(11,241 | ) | 262 | (10,979 | ) | |||||||
|
Total consideration
|
$ | 20,008 | $ | - | $ | 20,008 | ||||||
|
* Adjustments related to the working capital
|
||||||||||||||||
|
** Adjustments related to changes in valuation assumptions
|
||||||||||||||||
Intangible Assets
In our determination of the fair value of the intangible assets we considered, among other factors, the best use of acquired assets, analyses of historical financial performance and estimates of future performance of UPEK’s products. The fair values of identified intangible assets were calculated considering market participant assumptions and using an income approach and estimates and assumptions provided by our management.
The following table sets forth the components of initially identified intangible assets associated with the UPEK acquisition as reported on our quarterly report on Form 10-Q for the fiscal quarter ended October 1, 2010, filed with the Securities and Exchange Commission on November 15, 2010, and finalized fair value of identified intangible assets associated with the UPEK acquisition and their estimated weighted average useful lives:
|
Weighted Average
Useful Life
|
Preliminary
allocation
|
Adjustments
|
Final
allocation
|
||||||||||
|
(In thousands)
|
|||||||||||||
|
Developed technology
|
7.3 years
|
$ | 5,003 | $ | 14 | $ | 5,017 | ||||||
|
Customer relationships
|
8.3 years
|
12,067 | 198 | 12,265 | |||||||||
|
Backlog
|
0.8 years
|
828 | 1 | 829 | |||||||||
|
Total
|
$ | 17,898 | $ | 213 | $ | 18,111 | |||||||
The changes from the amounts reported at October 1, 2010 were the result from the continuing refinement in the valuation.
Developed technology consists of fingerprinting authentication hardware and software IP, including 43 issued and 12 pending U.S. patents.
Customer relationships consist of established relationships with distributors, who sell through to end customers, and directly with end customers and OEMs, that serve the government biometrics, PC and wireless markets and represent future projected revenue that will be derived from those customers.
Customer backlog represents cumulative bookings which have not yet shipped relative to customer open purchase orders. Based on the projections we expect to recognize revenue related to the backlog through July of 2011.
71
In addition to the purchase price, we incurred $2.0 million in acquisition related costs which were expensed as incurred and recorded in the General and Administrative expenses caption of our Consolidated Statement of Operations during the twelve months ended December 31, 2010 in connection with the UPEK acquisition.
A portion of the purchase price for UPEK was allocated to deferred tax assets, related valuation allowance and accruals for uncertain tax positions. UPEK’s deferred tax asset as of September 7, 2010 was approximately $3.9 million, net of valuation allowances of $3.3 million. UPEK’s total amount of unrecognized tax benefits and related accrued interest as of September 7, 2010 was $4.3 million.
Supplemental Pro Forma Data (Unaudited)
The following unaudited pro-forma financial information for the years ended December 31, 2010 and January 1, 2010 represent the combined results of our operations as if the SafeNet Embedded Security Solutions’ Division and UPEK acquisitions had occurred on January 3, 2009. The unaudited pro forma results reflect certain adjustments related to the acquisition such as increased amortization expense on acquired intangible assets resulting from the fair valuation of assets acquired. The unaudited pro-forma financial information does not necessarily reflect the results of operations that would have occurred had we constituted a single entity during such period.
|
Year ended
|
||||||||
|
December 31,
2010
|
January 1,
2010
|
|||||||
|
(In thousands)
|
||||||||
|
Revenue
|
$ | 61,637 | $ | 71,347 | ||||
|
Net loss
|
(43,706 | ) | (42,533 | ) | ||||
|
Net loss per common share, basic and diluted
|
$ | (1.37 | ) | $ | (1.48 | ) | ||
13. Unaudited Quarterly Financial Data
Selected unaudited, quarterly financial data for the years ended December 31, 2010 and January 1, 2010 are presented below:
|
For the three months ended
|
||||||||||||||||||||||||||||||||
|
December 31,
|
October 1,
|
July 2,
|
April 2,
|
January 1,
|
October 2,
|
July 3,
|
April 3,
|
|||||||||||||||||||||||||
|
2010
|
2010
|
2010
|
2010
|
2010
|
2009
|
2009
|
2009
|
|||||||||||||||||||||||||
| Unaudited | ||||||||||||||||||||||||||||||||
|
(In thousands, except per share data)
|
||||||||||||||||||||||||||||||||
|
Revenue
|
$ | 14,538 | $ | 10,232 | $ | 10,721 | $ | 9,176 | $ | 8,315 | $ | 10,267 | $ | 8,446 | $ | 7,038 | ||||||||||||||||
|
Cost of revenue (1)
|
7,679 | 5,068 | 5,210 | 4,726 | 4,533 | 5,616 | 4,557 | 3,663 | ||||||||||||||||||||||||
|
Gross profit
|
6,859 | 5,164 | 5,511 | 4,450 | 3,782 | 4,651 | 3,889 | 3,375 | ||||||||||||||||||||||||
|
Expenses
|
||||||||||||||||||||||||||||||||
|
Research and development (1)
|
6,661 | 5,314 | 4,742 | 3,986 | 3,400 | 3,644 | 3,642 | 3,805 | ||||||||||||||||||||||||
|
Selling and marketing (1)
|
4,887 | 3,324 | 3,306 | 2,266 | 1,815 | 2,028 | 1,786 | 2,020 | ||||||||||||||||||||||||
|
General and administrative (1)
|
4,124 | 4,039 | 2,073 | 2,953 | 1,570 | 1,439 | 1,702 | 2,219 | ||||||||||||||||||||||||
|
Litigation dismissal
|
- | 4,141 | - | - | - | 1,747 | 2,601 | - | ||||||||||||||||||||||||
|
Restructuring charges
|
1,983 | - | - | - | - | - | - | - | ||||||||||||||||||||||||
|
Total expenses
|
17,655 | 16,818 | 10,121 | 9,205 | 6,785 | 8,858 | 9,731 | 8,044 | ||||||||||||||||||||||||
|
Loss from operations
|
(10,796 | ) | (11,654 | ) | (4,610 | ) | (4,755 | ) | (3,003 | ) | (4,207 | ) | (5,842 | ) | (4,669 | ) | ||||||||||||||||
|
Other income (expense)
|
||||||||||||||||||||||||||||||||
|
Note settlement charge
|
(7,073 | ) | - | - | - | - | - | - | - | |||||||||||||||||||||||
|
Impairment on investments
|
- | - | - | - | (19 | ) | - | - | (28 | ) | ||||||||||||||||||||||
|
Earnout adjustment
|
- | - | 729 | - | - | - | - | - | ||||||||||||||||||||||||
|
Other income (expenses)
|
110 | (190 | ) | - | - | - | - | - | - | |||||||||||||||||||||||
|
Interest income
|
28 | 40 | 44 | 40 | 49 | 52 | 89 | 175 | ||||||||||||||||||||||||
|
Total other income (expense), net
|
(6,935 | ) | (150 | ) | 773 | 40 | 30 | 52 | 89 | 147 | ||||||||||||||||||||||
|
Loss before income tax expense (benefit)
|
(17,731 | ) | (11,804 | ) | (3,837 | ) | (4,715 | ) | (2,973 | ) | (4,155 | ) | (5,753 | ) | (4,522 | ) | ||||||||||||||||
|
Income tax expense (benefit)
|
(24 | ) | (286 | ) | 63 | - | - | - | - | - | ||||||||||||||||||||||
|
Net loss
|
$ | (17,707 | ) | $ | (11,518 | ) | $ | (3,900 | ) | $ | (4,715 | ) | $ | (2,973 | ) | $ | (4,155 | ) | $ | (5,753 | ) | $ | (4,522 | ) | ||||||||
|
Net loss per common share, basic
|
$ | (.48 | ) | $ | (.37 | ) | $ | (.13 | ) | $ | (.16 | ) | $ | (.10 | ) | $ | (.14 | ) | $ | (.20 | ) | $ | (.16 | ) | ||||||||
|
Net loss per common share, diluted
|
$ | (.48 | ) | $ | (.37 | ) | $ | (.13 | ) | $ | (.16 | ) | $ | (.10 | ) | $ | (.14 | ) | $ | (.20 | ) | $ | (.16 | ) | ||||||||
|
Shares used in computing basic net loss
|
||||||||||||||||||||||||||||||||
|
per common share
|
36,683 | 31,503 | 29,912 | 29,196 | 28,685 | 28,668 | 28,658 | 28,647 | ||||||||||||||||||||||||
|
Shares used in computing diluted net loss
|
||||||||||||||||||||||||||||||||
|
per common share
|
36,683 | 31,503 | 29,912 | 29,196 | 28,685 | 28,668 | 28,658 | 28,647 | ||||||||||||||||||||||||
Earnings per share are computed separately for each quarter. Therefore, the sum of such quarterly per share amounts may differ from the total for the years.
72
14. Restructuring and Impairment Related Charges
On November 9, 2010, we announced a global restructuring plan related to our acquisition of UPEK, following an assessment of the combined organization’s operations, global functions, and human resources in view of the Company’s global strategy and cost reduction initiatives. The restructuring plan, which will continue through the first half of 2011, is intended to integrate and streamline operations across the integrated organization.
Action plans necessary to carry out the restructuring plan have been identified and the majority is expected to be implemented by the end of March 2011. These action plans include the closure of UPEK’s Singapore operations, which was substantially complete by the end of 2010.
Costs incurred with restructuring activities generally consist of voluntary and involuntary severance-related expenses, asset impairments and other costs to exit activities. We recognize involuntary severance-related expenses depending on whether the termination benefits are provided under an ongoing benefit arrangement or under a one-time benefit arrangement. We recognize involuntary severance-related expenses associated with an ongoing benefit arrangement once they are probable and the amounts are estimable. We recognize involuntary severance-related expenses associated with a one-time benefit arrangement once the benefits have been communicated to employees.
Restructuring activities have also resulted in asset impairments, which were included in restructuring expense and were recorded as an adjustment to the basis of the asset.
Below is a listing of the components of the restructuring and impairment related charges for the three months ending December 31, 2011:
|
(In thousands)
|
||||
|
Severance
|
$ | 1,394 | ||
|
Legal fees
|
259 | |||
|
Asset impairments
|
218 | |||
|
Other
|
112 | |||
| $ | 1,983 | |||
All of the restructuring charges were attributable to the Smart Sensor Solutions segment. The table below reflects the changes in accrued restructuring balances associated with these actions:
|
Severance and
Benefits
|
Legal and
Other
|
|||||||
|
(In thousands)
|
||||||||
|
Accrual at January 1, 2010
|
$ | - | $ | - | ||||
|
Restructuring expense
|
1,394 | 372 | ||||||
|
Payments
|
(677 | ) | (113 | ) | ||||
|
Accrual at December 31, 2010
|
$ | 717 | $ | 259 | ||||
The accrual balances above are components of Accrued compensation and benefits and Other accrued liabilities on our Consolidated Balance Sheets, depending on the expected timing of payment.
|
Item 9.
|
Changes in and Disagreements with Accountants on Accounting and Financial Disclosure
|
None.
|
Item 9A.
|
Controls and Procedures
|
Disclosure Controls and Procedures
The Company, under the supervision and with the participation of our Chief Executive Officer and Chief Financial Officer performed an evaluation of our disclosure controls and procedures (as defined in Rules 13a and15d-15e) of the Securities Exchange Act of 1934, as amended (“the Exchange Acts”), which have been designed to provide reasonable assurance that the information required to be disclosed by us in the reports we file or submit under the Exchange Act is (i) accumulated and communicated to our management, including our Chief Executive Officer and Chief Financial Officer, to allow timely decisions regarding required disclosure and (ii) recorded, processed, summarized and reported within the time periods specified in the rules and forms of the Securities and Exchange Commission. Based on that evaluation our Chief Executive Officer and Chief Financial Officer concluded that our disclosure controls and procedures were effective as of December 31, 2010 to provide reasonable assurance of the achievement of these objectives.
73
Management’s Annual Report on Internal Control over Financial Reporting
Our management is responsible for establishing and maintaining adequate internal control over financial reporting as defined in Rules 13a-15(f) and 15d-15(f) under the Exchange Act. Our internal control over financial reporting is a process designed to provide reasonable assurance regarding the reliability of financial reporting and the preparation of financial statements for external purposes in accordance with generally accepted accounting principles. Our internal control over financial reporting includes those policies and procedures that:
|
(i)
|
pertain to the maintenance of records that, in reasonable detail, accurately and fairly reflect the transactions and dispositions of the assets of the Company;
|
|
(ii)
|
Provide reasonable assurance that transactions are recorded as necessary to permit preparation of financial statements in accordance with generally accepted accounting principles, and that receipts and expenditures of the Company are being made only in accordance with authorizations of management and directors of the Company; and
|
|
(iii)
|
Provide reasonable assurance regarding prevention or timely detection of unauthorized acquisition, use or disposition of the Company’s assets that could have a material effect on the financial statements.
|
Because of its inherent limitation, internal control over financial reporting may not prevent or detect misstatements. Also, projections of any evaluation of effectiveness to future periods are subject to the risk that controls may become inadequate because of changes in conditions, or that the degree of compliance with the policies or procedures may deteriorate.
Our management assessed the effectiveness of the Company’s internal control over financial reporting as of December 31, 2010. In making this assessment, management used the criteria set forth by the Committee of Sponsoring Organizations of the Treadway Commission (COSO) in Internal Control-Integrated Framework.
Based upon our assessment and those criteria, management has concluded that the Company maintained effective internal control over financial reporting as of December 31, 2010.
The effectiveness of the Company’s internal control over financial reporting as of December 31, 2010 has been audited by PricewaterhouseCoopers LLP, our independent registered certified public accounting firm, who also audited our consolidated financial statements included in this Annual Report on Form 10-K, as stated in their report which appears under Item 8.
UPEK Acquisition
Management has excluded UPEK, Inc. business from its assessment of internal control over financial reporting as of December 31, 2010 because UPEK, Inc.was acquired in a purchase business combination in September 2010. UPEK, Inc. is a wholly owned subsidiary whose total assets and total revenues represent 4% and 14% , respectively, of the related consolidated financial statement amounts as of and for the year ended December 31, 2010.
Changes in Internal Controls over Financial Reporting.
There was no change in our internal control over financial reporting during the quarter ended December 31, 2010, that materially affected, or is reasonably likely to materially affect, our internal control over financial reporting.
|
Item 9B.
|
Other Information
|
None.
PART III
|
Item 10.
|
Directors, Executive Officers and Corporate Governance
|
The information required by this item is incorporated by reference to our Proxy Statement for our 2011 Annual Meeting of Stockholders to be filed with the SEC within 120 days after the end of the fiscal year ended December 31, 2010.
|
Item 11.
|
Executive Compensation
|
The information required by this item is incorporated by reference to our Proxy Statement for our 2011 Annual Meeting of Stockholders to be filed with the SEC within 120 days after the end of the fiscal year ended December 31, 2010.
74
|
Item 12.
|
Security Ownership of Certain Beneficial Owners and Management and Related Stockholder Matters
|
The information required by this item is incorporated by reference to our Proxy Statement for our 2011 Annual Meeting of Stockholders to be filed with the SEC within 120 days after the end of the fiscal year ended December 31, 2010.
|
Item 13.
|
Certain Relationships and Related Transactions, and Director Independence
|
The information required by this item is incorporated by reference to our Proxy Statement for our 2011 Annual Meeting of Stockholders to be filed with the SEC within 120 days after the end of the fiscal year ended December 31, 2010.
|
Item 14.
|
Principal Accountant Fees and Services
|
The information required by this item is incorporated by reference to our Proxy Statement for our 2011 Annual Meeting of Stockholders to be filed with the SEC within 120 days after the end of the fiscal year ended December 31, 2010.
PART IV
|
Item 15.
|
Exhibits and Financial Statement Schedules
|
(a)(1) Financial Statements
The following is a list of the Financial Statements included in Item 8 of Part II of this Report.
|
Page
|
|
|
Report of Independent Registered Certified Public Accounting Firm
|
44
|
|
Consolidated Balance Sheets as of December 31, 2010 and January 1, 2010
|
45
|
|
Consolidated Statements of Operations for the years ended December 31, 2010, January 1, 2010 and January 2, 2009
|
46
|
|
Consolidated Statements of Stockholders’ Equity for the period from December 28, 2007 through December 31, 2010
|
47
|
|
Consolidated Statements of Cash Flows for the years ended December 31, 2010, January 1, 2010 and January 2, 2009
|
48
|
|
Notes to Consolidated Financial Statements
|
49
|
(a)(2) Financial Statement Schedules
Schedules not included herein are omitted because they are inapplicable or not required or because the required information is given in the financial statements and notes thereto
75
SCHEDULE II
VALUATION AND QUALIFYING ACCOUNTS
|
Balance at
|
Charges to
|
Balance at
|
||||||||||||||
|
beginning
|
cost and
|
end of
|
||||||||||||||
|
of period
|
expenses
|
Deductions
|
period
|
|||||||||||||
|
(in thousands)
|
||||||||||||||||
|
Year ended December 31, 2010
|
||||||||||||||||
|
Bad debt allowance
|
$ | 5 | $ | 149 | $ | (4 | ) | $ | 150 | |||||||
|
Income tax valuation allowance
|
25,243 | 26,245 | - | 51,488 | ||||||||||||
|
Inventory valuation allowance
|
1,536 | 200 | - | 1,736 | ||||||||||||
|
Year ended January 1, 2010
|
||||||||||||||||
|
Bad debt allowance
|
41 | (8 | ) | (28 | ) | 5 | ||||||||||
|
Income tax valuation allowance
|
19,726 | 5,517 | - | 25,243 | ||||||||||||
|
Inventory valuation allowance
|
1,507 | 29 | - | 1,536 | ||||||||||||
|
Year ended January 2, 2009
|
||||||||||||||||
|
Bad debt allowance
|
23 | 18 | - | 41 | ||||||||||||
|
Income tax valuation allowance
|
20,220 | - | (494 | ) | 19,726 | |||||||||||
|
Inventory valuation allowance
|
1,110 | 422 | (25 | ) | 1,507 | |||||||||||
|
Year ended December 28, 2007
|
||||||||||||||||
|
Bad debt allowance
|
75 | - | (52 | ) | 23 | |||||||||||
|
Income tax valuation allowance
|
21,737 | - | (1,517 | ) | 20,220 | |||||||||||
|
Inventory valuation allowance
|
$ | 520 | $ | 590 | $ | - | $ | 1,110 | ||||||||
(a)(3) Exhibits
The exhibits required by this item and included in this report or incorporated herein by reference are as follows:
|
Exhibit
Number
|
Description of Document
|
|
*2.1
|
Asset Purchase Agreement dated February 26, 2010 by and between AuthenTec, Inc. and SafeNet, Inc. (Incorporated herein by reference to Exhibit 2.1 of AuthenTec’s Current Report on Form 8-K filed February 26, 2010)
|
||
|
*2.2
|
Agreement and Plan of Merger Agreement dated September 3, 2010 by and among AuthenTec, Inc., AU Merger, Inc., UPEK, Inc. and Sofinnova Capital IV FCPR (Incorporated herein by reference to Exhibit 2.1 of AuthenTec’s Current Report on Form 8-K filed September 7, 2010)
|
||
|
*3.1
|
Amended and restated certificate of incorporation of AuthenTec, Inc. (Incorporated herein by reference to Exhibit 3.1 of AuthenTec’s Current Report of Form 8-K filed February 18, 2010)
|
||
|
*3.2
|
Second amended and restated bylaws of AuthenTec, Inc. (Incorporated herein by reference to Exhibit 3.1 of AuthenTec’s Quarterly Report on Form 10-Q filed November 5, 2009)
|
||
|
*4.1
|
Specimen stock certificate for shares of common stock of AuthenTec, Inc. (Incorporated herein by reference to Exhibit 4.1 of AuthenTec’s Amendment No. 4 to Form S-1 filed June 20, 2007)
|
||
|
*4.2
|
Stockholders Agreement dated September 3, 2010 by and among AuthenTec, Inc. and certain of the former stockholders of UPEK, Inc. (Incorporated herein by reference to Exhibit 4.2 of AuthenTec’s Current Report on Form 8-K filed September 7, 2010)
|
||
|
*4.3
|
Registration Rights Agreement dated September 3, 2010 by and among AuthenTec, Inc. and certain of the former stockholders of UPEK, Inc. (Incorporated herein by reference to Exhibit 4.3 of AuthenTec’s Current Report on Form 8-K filed September 7, 2010)
|
||
|
*10.1
|
Commercial lease dated December 27, 2006 by and between AuthenTec, Inc. and Rialto, LLC. (Incorporated herein by reference to Exhibit 10.6 of AuthenTec’s Form S-1 filed March 16, 2007)
|
76
|
Exhibit
Number
|
Description of Document
|
|
*10.2
|
First Amendment to Lease dated March 3, 2008 by and between AuthenTec, Inc. and Rialto, LLC (Incorporated herein by reference to Exhibit 10.16 of AuthenTec’s Quarterly Report on Form 10-Q filed May 1, 2008)
|
||
|
*10.3
|
AuthenTec, Inc. 2004 Stock Incentive Plan, as amended (Incorporated herein by reference to Exhibit 10.1 of AuthenTec’s Amendment No. 3 to Form S-1 filed June 7, 2007)
|
||
|
*10.4
|
Form of Incentive Stock Option Agreement under 2004 Stock Incentive Plan (Incorporated herein by reference to Exhibit 10.2 of AuthenTec’s Form S-1 filed March 16, 2007)
|
||
|
*10.5
|
Form of Non statutory Stock Option Agreement under 2004 Stock Incentive Plan (Incorporated herein by reference to Exhibit 10.3 of AuthenTec’s Form S-1 filed March 16, 2007)
|
||
|
*10.6
|
AuthenTec, Inc. 2007 Stock Incentive Plan (Incorporated herein by reference to Exhibit 10.12 of AuthenTec’s Amendment No. 4 to Form S-1 filed June 20, 2007)
|
||
|
*10.7
|
Form of Incentive Stock Option Grant Agreement under 2007 Stock Incentive Plan (Incorporated herein by reference to Exhibit 10.13 of AuthenTec’s Amendment No. 4 to Form S-1 filed June 20, 2007)
|
||
|
*10.8
|
Form of Non statutory Stock Option Grant Agreement Plan under 2007 Stock Incentive Plan (Incorporated herein by reference to Exhibit 10.14 of AuthenTec’s Amendment No. 4 to Form S-1 filed June 20, 2007)
|
||
|
*10.9
|
Form of Restricted Stock Unit Agreement (Incorporated herein by reference to Exhibit 10.28 of AuthenTec’s Quarterly Report on Form 10-Q filed August 8, 2009)
|
||
|
*10.10
|
AuthenTec, Inc. 2010 Stock Incentive Plan (Incorporated herein by reference to Appendix B to AuthenTec’s Definitive Proxy Statement on Schedule 14A filed June 28, 2010)
|
||
|
10.11
|
Form of Stock Option Award
|
||
|
*10.13
|
First Amendment to Director Option Agreement (Incorporated herein by reference to Exhibit 10.27 of AuthenTec’s Quarterly Report on Form 10-Q filed August 8, 2009)
|
||
|
*10.14
|
Form of directors’ and officers’ Indemnity Agreement (Incorporated herein by reference to Exhibit 10.4 of AuthenTec’s Amendment No. 3 to Form S-1 filed June 7, 2007)
|
||
|
*10.15
|
Form of Change of Control Agreement (Incorporated herein by reference to Exhibit 10.11 of AuthenTec’s Amendment No. 3 to Form S-1 filed June 7, 2007)
|
||
|
*10.16
|
Amendment to Form of Change of Control Agreement (Exec) (Incorporated herein by reference to Exhibit 10.21 of AuthenTec’s Annual Report on Form 10-K filed March 18, 2009)
|
||
|
*10.17
|
Second Amendment to Form of Change of Control Agreement (Exec) (Incorporated herein by reference to Exhibit 10.26 of AuthenTec’s Quarterly Report on Form 10-Q filed August 8, 2009)
|
||
|
*10.18
|
Executive Employment Agreement dated October 18, 2010 between AuthenTec, Inc. and Larry Ciaccia (Incorporated herein by reference to Exhibit 3.1 of AuthenTec’s Quarterly Report on Form 10-Q filed November 15, 2010)
|
77
|
Exhibit
Number
|
Description of Document
|
|
*10.20
|
Employment Agreement dated November 13, 2006 between AuthenTec, Inc. and Frederick R. Jorgenson. (Incorporated herein by reference to Exhibit 10.9 of AuthenTec’s Form S-1 filed March 16, 2007)
|
||
|
*10.21
|
Third Amendment to Employment Agreement dated December 19, 2008 between AuthenTec, Inc. and Frederick R. Jorgenson (Incorporated herein by reference to Exhibit 10.19 of AuthenTec’s Annual Report on Form 10-K filed March 18, 2009)
|
||
|
*10.22
|
Fourth Amendment to Employment Agreement dated April 6, 2009 between AuthenTec, Inc. and Frederick R. Jorgenson (Incorporated herein by reference to Exhibit 10.24 of AuthenTec’s Quarterly Report on Form 10-Q filed August 8, 2009)
|
||
|
*10.23
|
Employment Agreement dated December 12, 2006 between AuthenTec, Inc. and Gary R. Larsen (Incorporated herein by reference to Exhibit 10.10 of AuthenTec’s Form S-1 filed March 16, 2007)
|
||
|
*10.24
|
First Amendment to Employment Agreement dated June 7, 2007 between AuthenTec, Inc. and Gary R. Larsen (Incorporated herein by reference to Exhibit 10.10.1 of AuthenTec’s Amendment No. 4 to Form S-1 filed June 20, 2007)
|
||
|
*10.25
|
Second Amendment to Employment Agreement dated December 19, 2008 between AuthenTec, Inc. and Gary R. Larsen (Incorporated herein by reference to Exhibit 10.20 of AuthenTec’s Annual Report on Form 10-K filed March 18, 2009)
|
||
|
*10.26
|
Third Amendment to Employment Agreement dated April 6, 2009 between AuthenTec, Inc. and Gary R. Larsen (Incorporated herein by reference to Exhibit 10.25 of AuthenTec’s Quarterly Report on Form 10-Q filed August 8, 2009)
|
||
|
*10.27
|
Executive Employment Agreement, dated June 7, 2007 between AuthenTec, Inc. and F. Scott Moody (Incorporated herein by reference to Exhibit 10.15 of AuthenTec’s Amendment No. 4 to Form S-1 filed June 20, 2007)
|
||
|
*10.28
|
First Amendment to Employment Agreement dated December 22, 2008 between AuthenTec, Inc. and F. Scott Moody (Incorporated herein by reference to Exhibit 10.17 of AuthenTec’s Annual Report on Form 10-K filed March 18, 2009)
|
||
|
*10.29
|
Separation and Transition Services Agreement dated September 10, 2010 by and between AuthenTec, Inc. and F. Scott Moody (Incorporated herein by reference to Exhibit 10.1 of AuthenTec’s Current Report on Form 8-K filed September 7, 2010)
|
||
|
*21.1
|
Subsidiaries of AuthenTec, Inc. (Incorporated herein by reference to Exhibit 21.1 of AuthenTec’s Form S-1 filed March 16, 2007)
|
||
|
23.1
|
Consent of PricewaterhouseCoopers LLP
|
||
|
24.1
|
Power of Attorney (included in signature pages)
|
||
|
31.1
|
Certification of the Chief Executive Officer Pursuant to Section 302 of the Sarbanes-Oxley Act of 2002
|
||
|
31.2
|
Certification of the Chief Financial Officer Pursuant to Section 302 of the Sarbanes-Oxley Act of 2002
|
||
|
32.1
|
Certification Pursuant to Section 906 of the Sarbanes-Oxley Act of 2002
|
||
|
32.2
|
Certification Pursuant to Section 906 of the Sarbanes-Oxley Act of 2002
|
|
*
|
Indicates exhibit incorporated by reference.
|
78
SIGNATURES
Pursuant to the requirements of Section 13 or 15(d) of the Securities Exchange Act of 1934, the registrant has duly caused this report to be signed on its behalf by the undersigned, thereunto duly authorized.
|
AUTHENTEC, INC.
|
|||
|
Date: March 16, 2011
|
By:
|
/s/ Lawrence Ciaccia
|
|
|
Lawrence Ciaccia
Chief Executive Officer
|
|||
POWER OF ATTORNEY
KNOW ALL PERSONS BY THESE PRESENTS, that each person whose signature appears below hereby constitutes and appoints Lawrence Ciaccia and Philip Calamia and each of them acting individually, as his or her attorney-in-fact and agents, each with full power of substitution, for him or her in his or her name, place and stead, in any and all capacities, to sign any and all amendments, to this Annual Report, and to file the same, with all exhibits thereto and all other documents in connection therewith, with the SEC, granting unto said attorneys-in-fact and agents, and each of them, full power and authority to do and perform each and every act and thing requisite and necessary to be done, as fully to all intents and purposes as he or she might or could do in person, hereby ratifying and confirming all that said attorneys-in-fact and agents or any of them, or his, her or their substitute or substitutes, may lawfully do or cause to be done or by virtue hereof.
Pursuant to the requirements of the Securities Exchange Act of 1934, this report has been signed by the following persons on behalf of the registrant and in the capacities and on the dates indicated:
|
Signature
|
Title
|
Date
|
||
|
/s/ Lawrence Ciaccia
|
Chief Executive Officer
|
|||
|
Lawrence Ciaccia
|
(Principal Executive Officer)
|
March 16, 2011
|
||
|
/s/ Philip Calamia
|
Chief Financial Officer
|
|||
|
Philip Calamia
|
(Principal Accounting and Financial Officer)
|
March 16, 2011
|
||
|
/s/ Chris Fedde
|
Director
|
|||
|
Chris Fedde
|
March 16, 2011
|
|||
|
/s/ F. Scott Moody
|
Director
|
|||
|
F. Scott Moody
|
March 16, 2011
|
|||
|
/s/ Ronald Black
|
Director | |||
|
Ronald Black
|
March 16, 2011
|
|||
|
/s/ Jean Schmitt
|
Director
|
|||
|
Jean Schmitt
|
March 16, 2011
|
|||
|
/s/ Gustav H. Koven III
|
Director
|
|||
|
Gustav H. Koven
|
March 16, 2011
|
|||
|
/s/ William Washecka
|
Chairman of the Board
|
|||
|
William Washecka
|
March 16, 2011
|
79