Attached files
|
UNITED STATES
SECURITIES AND EXCHANGE COMMISSION
Washington, D.C. 20549
FORM 10-K
|
||
|
[X] annual report pursuant to section 13 or 15(d) of the securities exchange act of 1934
For the fiscal year ended: December 31, 2010
|
||
|
[ ] transition report pursuant to section 13 or 15(d) of the securities exchange act of 1934
For the transition period from _______________________to ________________________________
|
||
|
Commission file number 1-31993
|
||
|
STERLING CONSTRUCTION COMPANY, INC.
(Exact name of registrant as specified in its charter)
|
||
|
Delaware
State or other jurisdiction of
incorporation or organization
|
25-1655321
(I.R.S. Employer
Identification No.)
|
|
|
20810 Fernbush Lane
Houston, Texas
(Address of principal executive offices)
|
77073
(Zip Code)
|
|
|
Registrant's telephone number, including area code (281) 821-9091
|
||
|
Securities registered pursuant to Section 12(b) of the Act:
Title of each class
Common Stock, $0.01 par value per share
(Title of Class)
|
Name of each exchange on which registered
The NASDAQ Stock Market LLC
|
|
|
Securities registered pursuant to section 12(g) of the Act:
None
|
||
|
Indicate by check mark if the registrant is a well-known seasoned issuer, as defined in Rule 405 of the Securities Act.
[ ] Yes [√] No
|
||
|
Indicate by check mark if the registrant is not required to file reports pursuant to Section 13 or Section 15(d) of the Act.
[ ] Yes [√] No
|
||
|
Indicate by check mark whether the registrant (1) has filed all reports required to be filed by Section 13 or 15(d) of the Securities Exchange Act of 1934 during the preceding 12 months (or for such shorter period that the registrant was required to file such reports), and (2) has been subject to such filing requirements for the past 90 days.
[√] Yes [ ] No
|
||
|
Indicate by check mark whether the registrant has submitted electronically and posted on its corporate Website, if any, every Interactive Data File required to be submitted and posted pursuant to Rule 405 of Regulation S-T during the preceding 12 months (or for such shorter prior that the registrant was required to submit and post such files).
[ ] Yes [ ] No
Indicate by check mark if disclosure of delinquent filers pursuant to Item 405 of Regulation S-K is not contained herein, and will not be contained, to the best of registrant’s knowledge, in definitive proxy or information statements incorporated by reference in Part III of this Form 10-K or any amendment to this Form 10-K [ ]
|
||
|
Indicate by check mark whether the registrant is a large accelerated filer, an accelerated filer, a non-accelerated filer, or a smaller reporting company. See definitions of "large accelerated filer," "accelerated filer" and "smaller reporting company" in Rule 12b-2 of the Exchange Act.
Large accelerated filer [ ] Accelerated filer [√]
Non-accelerated filer [ ] (Do not check if a smaller reporting company) Smaller reporting company [ ]
|
||
|
Indicate by check mark if the registrant is a shell company (as defined in Rule 12b-2 of the Act). [ ] Yes [√] No
|
||
|
Aggregate market value of the voting and non-voting common equity held by non-affiliates at June 30, 2010: $198,373,914.
|
||
|
At March 2, 2011, the registrant had 16,454,478 shares of common stock outstanding.
|
||

DOCUMENTS INCORPORATED BY REFERENCE
Portions of the Company's definitive Proxy Statement to be filed with the Securities and Exchange Commission and delivered to stockholders in connection with the Annual Meeting of Stockholders to be held on May 6, 2011 are incorporated by reference into Part III of this Form 10-K.
Annual Report on Form 10-K
Table of Contents
|
Part I
|
|
|
Cautionary Comment Regarding Forward-Looking Statements
|
3
|
|
Item 1. Business
|
4
|
|
Access to the Company's Filings
|
4
|
|
Overview of the Company's Business
|
4
|
|
Our Business Strategy
|
5
|
|
Our Markets
|
6
|
|
Our Customers
|
8
|
|
Competition
|
9
|
|
Backlog
|
10
|
|
Construction Delivery Methods
|
10
|
|
Contracts
|
11
|
|
Joint Ventures
|
12
|
|
Insurance and Bonding
|
12
|
|
Government and Environmental Regulations
|
13
|
|
Employees
|
13
|
|
Item 1A. Risk Factors
|
14
|
|
Risks Relating to Our Business
|
14
|
|
Risks Relating to Our Financial Results and Financing Plans
|
19
|
|
Item 1B. Unresolved Staff Comments
|
21
|
|
Item 2. Properties
|
21
|
|
Item 3. Legal Proceedings
|
21
|
|
Item 4. Reserved by Security and Exchange Commision
|
21
|
|
Part II
|
|
|
Item 5. Market for the Registrant’s Common Equity, Related Stockholder Matters and
|
|
|
Issuer Purchases of Equity Securities
|
22
|
|
Dividend Policy
|
22
|
|
Equity Compensation Plan Information
|
22
|
|
Performance Graph
|
22
|
|
Issuer Purchases of Equity Securities
|
23
|
|
Item 6. Selected Financial Data
|
24
|
|
Item 7. Management’s Discussion and Analysis of Financial Condition and Results of Operations
|
25
|
|
Overview
|
25
|
|
Critical Accounts Policies
|
25
|
|
Results of Operations
|
27
|
|
Historical Cash Flows
|
31
|
|
Liquidity
|
32
|
|
Sources of Capital
|
33
|
|
Contractual Obligations
|
34
|
|
Capital Expenditures
|
35
|
|
Inflation
|
35
|
|
Off-Balance Sheet Arrangements and Joint Ventures
|
35
|
|
New Accounting Pronouncements
|
35
|
|
Item 7A. Quantitative and Qualitative Disclosures About Market Risk
|
36
|
|
Item 8. Financial Statements and Supplementary Data
|
36
|
|
Item 9. Changes in and Disagreements with Accountants on Accounting and Financial Disclosure
|
36
|
|
Item 9A. Controls and Procedures
|
36
|
|
Evaluation of Disclosure Controls and Procedures
|
36
|
|
Management’s Report on Internal Control over Financial Reporting
|
36
|
|
Changes in Internal Control over Financial Reporting
|
36
|
|
Inherent Limitations on Effectiveness of Controls
|
37
|
|
Item 9B. Other Information
|
37
|
|
Part III
|
|
|
Item 10. Directors , Executive Officers and Corporate Governance
|
37
|
|
Item 11. Executive Compensation
|
37
|
|
Item 12. Security Ownership of Certain Beneficial Owners and Management and
|
|
|
Related Stockholder Matters
|
37
|
|
Item 13. Certain Relationships and Related Transactions, and Director Independence
|
37
|
|
Item 14. Principal Accountant and Fees and Services
|
37
|
|
Part IV
|
|
|
Item 15. Exhibits and Financial Statements, Schedules
|
38
|
|
Financial Statements
|
38
|
|
Exhibits
|
39
|
|
Signatures
|
40
|
PART I
Cautionary Comment Regarding Forward-Looking Statements
This Report includes statements that are, or may be considered to be, "forward-looking statements" within the meaning of Section 27A of the Securities Act of 1933, as amended, or the Securities Act and Section 21E of the Securities Exchange Act of 1934, as amended, or the Exchange Act. These forward-looking statements are included throughout this Report, including in the sections entitled "Business," "Risk Factors," and "Management's Discussion and Analysis of Financial Condition and Results of Operation" and relate to matters such as our industry, business strategy, goals and expectations concerning our market position, future operations, margins, profitability, capital expenditures, liquidity and capital resources and other financial and operating information. We have used the words "anticipate," "assume," "believe," "budget," "continue," "could," "estimate," "expect," "forecast," "future, " "intend," "may," "plan," "potential," "predict," "project," "should," "will," "would" and similar terms and phrases to identify forward-looking statements in this Report.
Forward-looking statements reflect our current expectations as of the date of this report regarding future events, results or outcomes. These expectations may or may not be realized. Some of these expectations may be based upon assumptions or judgments that prove to be incorrect. In addition, our business and operations involve numerous risks and uncertainties, many of which are beyond our control, that could result in our expectations not being realized or otherwise could materially affect our financial condition, results of operations and cash flows.
Actual events, results and outcomes may differ materially from our expectations due to a variety of factors. Although it is not possible to identify all of these factors, they include, among others, the following:
|
·
|
changes in general economic conditions, including recessions, reductions in federal, state and local government funding for infrastructure services and changes in those governments’ budgets, practices, laws and regulations;
|
|
·
|
delays or difficulties related to the completion of our projects, including additional costs, reductions in revenues or the payment of liquidated damages, or delays or difficulties related to obtaining required governmental permits and approvals;
|
|
·
|
actions of suppliers, subcontractors, design engineers, joint venture partners, customers, competitors, banks, surety companies and others which are beyond our control, including suppliers’, subcontractors, and joint venture partners’ failure to perform;
|
|
·
|
the effects of estimates inherent in our percentage-of-completion accounting policies, including onsite conditions that differ materially from those assumed in our original bid, contract modifications, mechanical problems with our machinery or equipment and effects of other risks discussed in this document;
|
|
·
|
design/build contracts which subject us to the risk of design errors and omissions;
|
|
·
|
cost escalations associated with our contracts, including changes in availability, proximity and cost of materials such as steel, cement, concrete, aggregates, oil, fuel and other construction materials, and cost escalations associated with subcontractors and labor;
|
|
·
|
our dependence on a few significant customers;
|
|
·
|
adverse weather conditions; although we prepare our budgets and bid contracts based on historical rain and snowfall patterns, the incidence of rain, snow, hurricanes, etc., may differ materially from these expectations;
|
|
·
|
the presence of competitors with greater financial resources or lower margin requirements than us, and the impact of competitive bidders on our ability to obtain new backlog at reasonable margins acceptable to us;
|
|
·
|
our ability to successfully identify, finance, complete and integrate acquisitions;
|
|
·
|
citations issued by any governmental authority, including the Occupational Safety and Health Administration;
|
|
·
|
federal, state and local environmental laws and regulations -- non-compliance can result in penalties and/or termination of contracts as well as civil and criminal liability;
|
|
·
|
the current instability of financial institutions, which could cause losses on our cash and cash equivalents and short-term investments;
|
|
·
|
adverse economic conditions in our markets in Texas, Utah and Nevada; and
|
|
·
|
the other factors discussed in more detail in Item 1A. —Risk Factors.
|
In reading this Report, you should consider these factors carefully in evaluating any forward-looking statements and you are cautioned not to place undue reliance on any forward-looking statements. Although we believe that our plans, intentions and expectations reflected in, or suggested by, the forward-looking statements that we make in this Report are reasonable, we can provide no assurance that they will be achieved.
The forward-looking statements included in this Report are made only as of the date of this Report, and we undertake no obligation to update any information contained in this Report or to publicly release the results of any revisions to any forward-looking statements to reflect events or circumstances that occur, or that we become aware of after the date of this Report, except as may be required by applicable securities laws.
Item 1. Business.
Access to the Company's Filings.
The Company's Website.
The Company maintains a website at www.sterlingconstructionco.com on which our latest Annual Report on Form 10-K, recent Quarterly Reports on Form 10-Q, recent Current Reports on Form 8-K, any amendments to those filings, and other filings may be accessed free of charge through a link to the Securities and Exchange Commission's website where those reports are filed. Our website also has recent press releases, the Company's Code of Business Conduct & Ethics and the charters of the Audit Committee, Compensation Committee, and Corporate Governance & Nominating Committee of the Board of Directors. Information is also provided on the Company’s “whistle-blower” procedures. Our website content is made available for information purposes only. It should not be relied upon for investment purposes, and none of the information on the website is incorporated into this Report by this reference to it.
The Securities and Exchange Commission (SEC).
The public may read and copy any materials filed by the Company with the SEC at the SEC's Public Reference Room at 100 F Street, NE, Room 1580, Washington, DC 20549. The public may obtain information on the operation of the Public Reference Room by calling the SEC at 1-800-SEC-0330 (1-800-732-0330). The SEC also maintains an Internet site at www.sec.gov on which you can obtain reports, proxy and information statements and other information regarding the Company and other issuers that file electronically with the SEC.
Overview of the Company's Business.
Sterling Construction Company, Inc. was founded in 1991 as a Delaware corporation. Our principal executive offices are located at 20810 Fernbush Lane, Houston, Texas 77073, and our telephone number at this address is (281) 821-9091. Our construction business was founded in 1955 by a predecessor company in Michigan and is now operated by our subsidiaries: Texas Sterling Construction Co., a Delaware corporation, or TSC; Road and Highway Builders, LLC, a Nevada limited liability company, or RHB; Road and Highway Builders Inc., a Nevada corporation, or RHB Inc.; Road and Highway Builders of California, Inc., a California corporation, or RHB Cal; Ralph L. Wadsworth Construction Company, LLC, a Utah limited liability company, or RLW; and Ralph L. Wadsworth Construction Co., LP, an inactive California limited partnership, or RLWLP. The terms "Company", "Sterling", and "we" refer to Sterling Construction Company, Inc. and its subsidiaries except when it is clear that those terms mean only the parent company.
Sterling is a leading heavy civil construction company that specializes in the building, reconstruction and repair of transportation and water infrastructure. Transportation infrastructure projects include highways, roads, bridges, light rail and commuter rail. Water infrastructure projects include water, wastewater and storm drainage systems. Sterling provides general contracting services, including excavating, concrete and asphalt paving, installation of large-diameter water and wastewater distribution systems, construction of bridges and similar large structures, construction of light and commuter rail infrastructure, concrete and asphalt batch plant operations, concrete crushing and aggregates operations. Sterling performs the majority of the work required by its contracts with its own crews and equipment.
Although we describe our business in this report in terms of the services we provide, our base of customers and the geographic areas in which we operate, we have concluded that our operations comprise one reportable segment and one reporting unit component, heavy civil infrastructure construction. In making this determination, we considered that each project has similar characteristics, includes similar services and similar types of customers and is subject to similar regulatory and economic environments. We organize, evaluate and manage our financial information around each project when making operating decisions and assessing our overall performance.
Sterling has a history of profitable growth, which we have achieved by expanding both our service profile and our market areas. This involves adding services, such as concrete operations, in order to capture a greater percentage of available work in current and potential markets. It also involves strategically expanding operations, either by establishing a branch office in a new market, often after having successfully bid on and completed a project in that market, or by acquiring a company that gives us an immediate entry into a market. Sterling extended both its service profile and its geographic market reach with the 2007 acquisition of RHB, a Nevada construction company, and the 2009 acquisition of RLW, a Utah construction company.
Sterling operates in Texas, Utah and Nevada, states that management believes benefit from both positive long-term demographic trends as well as an historical commitment to funding transportation and water infrastructure projects. The Company also has highway construction contracts in Hawaii, Idaho, Montana and Louisiana. From 2005 to 2010, the populations of Texas, Utah and Nevada grew 10.2%, 15.8% and 14.8%, respectively, compared to approximately 4.5% for the national average. The dollar value of highway and bridge construction projects to be bid (“lettings”) in 2011 are: approximately $4.8 billion by the Texas Department of Transportation, or TXDOT; approximately $1.1 billion by the Utah Department of Transportation, or UDOT, and between $300 and $400 million by the Nevada Department of Transportation, or NDOT. While the near-term funding available to these markets is currently restrained, management anticipates that long-term population growth and increased spending for infrastructure in these markets will positively affect business opportunities over the coming years.
On December 3, 2009, we completed the acquisition of privately-owned Ralph L. Wadsworth Construction Company, LLC, or RLW, which is headquartered in Draper, Utah, near Salt Lake City. RLW is a heavy civil construction business focused on the construction of bridges and other structures, roads and highways, and light and commuter rail projects, primarily in Utah, with licenses to do business in surrounding states. We paid approximately $63.9 million to acquire 80% of the equity interests in RLW, and, in 2013, we have the option to purchase, and the RLW sellers could require us to purchase, the remaining 20% of RLW.
RLW’s largest customer is UDOT, which is responsible for planning, constructing, operating and maintaining the more than 6,000 miles of highway and over 1,700 bridges that make up the Utah state highway system. RLW strives to provide efficient, timely and profitable execution of construction projects, with a particular emphasis on structures and innovative construction methods. RLW has significant experience in obtaining and profitably executing “design-build” and “CM/GC” (construction manager/general contractor) projects. We believe that design-build, CM/GC and other alternative project delivery methods are increasingly being used by public sector customers as alternatives to the traditional fixed unit price low bid process. Since its founding in 1975, RLW has experienced profitable growth, capitalizing on high-quality execution of projects and strong customer relationships.
We acquired RLW for a number of reasons, including opportunities to:
|
·
|
Expand on RLW’s significant experience in design-build, CM/GC and other project delivery methods.
|
|
·
|
Utilize RLW’s significant structural construction expertise.
|
|
·
|
Expand into an attractive market with good long-term growth dynamics.
|
|
·
|
Complement our existing market locations and advance our strategy of geographical diversification.
|
|
·
|
Partner with a strong and innovative management team with a similar corporate culture.
|
|
·
|
Benefit from RLW’s strong financial results and immediate accretion to our earnings per share.
|
Our Business Strategy.
Key features of our business strategy include:
|
·
|
Continue to Add Construction Capabilities - by adding capabilities that augment our core contracting and construction competencies, we are able to improve gross margin opportunities, and more effectively compete for contracts that might not otherwise be available to us.
|
|
·
|
Expand into New Markets and Selectively Pursue Opportunities and Strategic Acquisitions - we will continue to seek to identify attractive new markets and opportunities in select western, southwestern and southeastern U.S. areas. We will also continue to assess opportunities to extend our service capabilities and expand our markets through acquisitions.
|
|
·
|
Apply Core Competencies Across our Markets - we will seek to capitalize on opportunities to export our Texas experience constructing water infrastructure projects and our Nevada earthmoving, aggregates and asphalt paving experience into our Texas and Utah markets. Similarly, we believe that RLW’s experience with design-build, CM/GC and other alternative project delivery methods in Utah can enhance opportunities for us in our Texas and Nevada markets.
|
|
·
|
Increase our Market Leadership in our Core Markets - we have a strong presence in a number of markets in Texas, Utah and Nevada and intend to expand our presence in these states and other states where we believe contracting opportunities exist.
|
|
·
|
Position our Business for Future Infrastructure Spending - currently there are considerable uncertainties surrounding federal, state and local funding in our markets; however, we believe there is awareness of the need to build, reconstruct and repair our country’s infrastructure, including transportation infrastructure, such as bridges, highways, and mass transit systems and water infrastructure, such as water, wastewater and storm drainage systems. We will continue to build our expertise to capture this infrastructure spending.
|
|
·
|
Continue to Attract, Retain and Develop our Employees - we believe that our employees are key to the successful implementation of our business strategy, and we will continue allocating significant resources in order to attract and retain talented managers and supervisory and field personnel.
|
Our Markets.
We operate in the heavy civil construction segment, specializing in transportation and water infrastructure projects, which we pursue in Texas, Utah, Nevada and other states where we see contracting opportunities. Currently, we also have projects in Hawaii, Idaho, Louisiana and Montana. RLW has also completed construction projects in Wyoming and Arizona. We have also bid on construction projects in California and Oklahoma but have not been awarded any such projects in those states.
According to 2010 U.S. Census Bureau information, Texas is the second largest state in population in the U.S., with 25.1 million people and a population growth of 10.2% from 2005 to 2010, over twice the 4.5% growth rate for the U.S. as a whole over the same period. Three of the 10 largest cities in the U.S. are located in Texas, and we have offices serving the areas in which each of them is located. Utah, with a population of 2.8 million in 2010, was the fastest growing state from 2005 to 2010, with an increase of 15.8%. Nevada’s population expanded 14.8% from 2.4 million in 2005 to 2.7 million people in 2010. Texas, Utah and Nevada are projected by the U.S. Census Bureau to have populations of over 33 million, 3 million and 4 million, respectively, by 2030.
Demand for transportation and water infrastructure depends on a variety of factors, including overall population growth, economic expansion and the vitality of the market areas in which we operate, as well as unique local topographical, structural and environmental issues. In addition to these factors, demand for the replacement of infrastructure is driven by the general aging of infrastructure and the need for technical improvements to achieve more efficient or safer use of infrastructure and resources. Funding for this infrastructure depends on federal, state and local governmental resources, budgets and authorizations.
Various factors described in this report have adversely affected the levels of transportation and water infrastructure capital expenditures in our markets, reducing bidding opportunities to replace backlog and increasing competition for new projects. Assuming that these factors continue to affect infrastructure capital expenditures in our markets in the near term, and taking into account the amount of backlog we had at December 31, 2010 and the lower anticipated margin bid on some projects that we have recently been awarded and started work on in 2010 or expect to start work on in 2011, we currently anticipate that our net income and weighted average diluted earnings per common share of stock attributable to Sterling common stockholders for 2011 will be below the results we achieved for 2010.
While the bidding climate varies by locality, we continue to bid projects that fit our expertise and current criteria for potential revenues and gross margins after giving consideration to resource utilization, degree of difficulty in the projects, amount of subcontract and materials and project competition. We do expect that our markets will ultimately recover from the conditions described above and that our backlog, revenues and income will return to levels more consistent with historical levels; however, we cannot predict the timing of such a return to historical normalcy in our markets. We believe that the Company is in sound financial condition and has the resources and management experience to weather current market conditions and to continue to compete successfully for projects as they become available at acceptable profit margin levels.
State Highway Markets.
Our highway and related bridge work is generally funded through federal and state authorizations. The federal government enacted the SAFETEA-LU bill in 2005, which authorized $244 billion for transportation spending through 2009. The U.S. Department of Transportation (“U.S.DOT”) budgeted $40.2 billion under SAFETEA-LU for federal highway financial assistance to the states for 2009, had authority to spend $43.1 billion in 2010 and has requested authority to spend $42.8 billion in 2011 for highways and bridges. Such spending for 2011 is subject to appropriations by the federal government.
The SAFETEA-LU bill expired on September 30, 2009, and the federal government extended funding on a month-to-month basis, through February, 2010, at approximately 70% of the prior year SAFETEA-LU levels. On March 17, 2010, the HIRE Act was enacted by the federal government and extended funding for highway and bridges through December 31, 2010 at prior SAFETEA-LU levels, transferred $19.5 billion into the highway trust fund and restored certain amounts previously rescinded. In March 2011, the federal government enacted a continuing resolution extending funding to September 30, 2011. A long-term, multi-year bill with adequate funding still needs to be enacted to enable the states to know that funding will be available to award large, two to four-year highway and bridge construction contracts.
We had anticipated these matters would be resolved in late 2009 or 2010; however, they have not been resolved, and we are unable to predict when or on what terms the federal government might ultimately enact long-term legislation similar to the SAFETEA-LU bill.
In February 2009, the American Recovery and Reinvestment Act, or federal economic-stimulus legislation, was enacted by the federal government authorizing $27.5 billion for highway and bridge construction. A significant portion of these funds were to be used for ready-to-go, quick spending highway projects for which contracts could be awarded quickly. The highway funds apportioned to Texas, Utah and Nevada approximated $2.7 billion under the federal economic stimulus legislation, and the majority of such amount will be expended in 2009 through 2011.
In January 2009, the 2030 Committee, appointed by TXDOT at the request of the Governor of the State of Texas, submitted its draft report of the transportation needs of Texas which at that time had over 193,000 lane-miles and 50,000 bridges in its state highway system. The report stated that “With [the] population increase expected by 2030, transportation modes, costs and congestion are considered a possible roadblock to Texas’ projected growth and prosperity.” The report further indicated that Texas needs to spend approximately $315.0 billion (in 2008 dollars) for the period 2009 through 2030 to prevent worsening congestion and maintain economic competitiveness on its urban highways and roads, improve congestion/safety and partial connectivity on its rural highways, and to replace bridges.
In 2007, the voters of the State of Texas approved $5.0 billion for highway construction to be repaid out of the State's general funds and the budget for the biennium 2010-2011 includes $1.9 billion of proceeds from these bonds (“Prop 12 Bonds”).
The estimated 2011 TXDOT lettings (contract awards) for transportation construction projects are $4.8 billion, including stimulus funds and a portion of the Prop 12 Bonds discussed above versus approximately $4.2 billion of lettings in 2010 including stimulus funds and a portion of the Prop 12 Bonds. Due to uncertainty regarding federal funding and expected constraints of the Texas budget, TXDOT is forecasting lettings of only $2.7 billion for 2012 before any appropriations from the Prop 12 Bonds discussed above. TXDOT was instructed by the last session of the Texas legislature to move forward on projects with the expectation that additional Prop 12 Bonds would be enabled, which would increase the forecasted lettings for 2012.
Texas is also authorized to sell an additional $1.0 billion of the Prop 12 Bonds for a revolving fund to be loaned by TXDOT to cities, counties and other parties for the construction of highways and bridges. Upon the repayment or sale of these loans, TXDOT may loan the repayment/sales proceeds to similar parties for construction of additional highways and bridges.
In Texas, substantial funds for transportation infrastructure spending are also being provided by toll road and regional mobility authorities for construction of toll roads, which provide Sterling with additional construction contracting opportunities; however, such spending could be limited due to federal, state and local funding limitations.
Utah’s Long Range Transportation Plan for 2007-2030 projects spending for highway and bridge construction of $18.9 billion; the Utah Governor’s recommendation for such spending in 2010 was approximately $1.1 billion; and the Utah Office of the Legislative Fiscal Analyst Appropriations Report for fiscal year 2011 indicates appropriations for transportation capital projects total $900 million.
Based on press statements by officials of NDOT, and the Nevada legislative website, we estimate NDOT expenditures in 2010 and 2011 will be between $300 million and $400 million in each of those fiscal years, including economic-stimulus funds for highways and bridges.
Municipal Markets.
Our water and wastewater, underground utility, light and commuter rail and non-highway paving work is generally funded by municipalities and other local authorities. The size and growth rates of these markets are difficult to compute as a whole given the number of municipalities, the differences in funding sources and variations in local budgets. Two of the many municipalities that we perform work for are discussed below.
The City of Houston’s estimated expenditures for their fiscal year ended June 30, 2010 on storm drainage, street and traffic, waste water and water capital improvements were $406.8 million. Houston’s Capital Improvement Plan includes $664.7 million in the fiscal year ending June 30, 2011 for transportation and water infrastructure projects.
The City of San Antonio has adopted a six-year capital improvement plan for its fiscal years 2011 through 2016, which includes $322.5 million for streets and $165.6 million for drainage. The expenditures will be partially funded by the $550 million bond program that the voters of the City of San Antonio approved in May 2007. San Antonio’s budget for such projects was $290 million for its fiscal year 2010 and is $312.8 million for its fiscal year 2011.
We also do work for other cities, counties and business area redevelopment and regional water authorities in Texas and transit authorities in Texas and Utah, which have substantial water and transportation infrastructure spending budgets.
Expenditures by municipalities may also be limited due to federal, state and local funding limitations in the current economic environment.
Our Customers.
We are headquartered in Houston, and we serve the top markets in Texas, including Houston, San Antonio, Austin and Dallas/Fort Worth. Our Texas subsidiary is also currently performing work in the El Paso, Texas area and in Baton Rouge, Louisiana. We expanded our operations into Nevada in 2007 and into Utah in December 2009, in each case by acquiring a strong and profitable company with a well-established market presence and ties to customers in the state.
Although we occasionally undertake contracts for private customers, the vast majority of our revenues are attributable to work for public sector customers. For our Texas subsidiary, these customers include TXDOT, Texas and Louisiana county and municipal public works departments, the Metropolitan Transit Authority of Harris County, Texas (or Metro), the Harris County Toll Road Authority, North Texas Transit Authority (or NTTA), regional transit and water authorities, port authorities, school districts, municipal utility districts and the U.S. Corps of Engineers. In Utah, our public sector customers include UDOT. For our Nevada subsidiary, our primary public sector customer is NDOT; however, RHB is currently also performing a project for the Federal Highway Administration in Hawaii. State highway and related bridge work accounted for approximately 68% of our consolidated revenues in each of the years 2008, 2009 and 2010.
In 2010, contracts with TXDOT represented 20.7% of our revenues, contracts with NDOT represented 6.4% of our revenues, contracts with UDOT accounted for 26.2% of our revenues and contracts with NTTA accounted for 5.2% of our revenues. The majority of our services are provided to these customers pursuant to contracts awarded through competitive bidding processes.
Our municipal customers in 2010 included the City of Houston (3.0% of our 2010 revenues), the City of San Antonio (3.7% of our 2010 revenues) and Harris County (1.3% of our 2010 revenues) in Texas and the Utah Transit Authority (9.3% of our 2010 revenues) in Utah. In the past, we have also completed the construction of certain infrastructure for new light rail systems in Houston, Dallas and Galveston, and RLW has completed light and commuter rail infrastructure projects in Utah. We anticipate that expenditures in the Cities of Houston and San Antonio for road, rail and water infrastructure projects will continue to increase due to these metropolitan areas’ steady gain in population through migration of new residents, the annexation of surrounding communities and the continuing programs to expand storm water and flood control systems and deliver water to suburban communities. We believe that similar municipal civil construction opportunities are available in the Salt Lake City, Las Vegas and Reno areas. However, expenditures by municipalities may be limited due to federal, state and local funding limitations in the current economic environment. We provide services to our municipal customers exclusively pursuant to contracts awarded through competitive bidding processes.
Competition.
Our competitors include companies that we bid against for construction contracts and compete against for short listings, mandates and joint ventures. We have many competitors of different sizes in the Texas, Utah and Nevada markets that we primarily serve, and they include large national and regional construction companies as well as many smaller contractors. Historically, the construction business has not typically required large amounts of capital for smaller contracts, which can result in relative ease of market entry for companies possessing acceptable qualifications.
Factors influencing our competitiveness include price, our reputation for quality, our innovativeness, our equipment fleet, our financial strength, our bonding capacity and prequalification, our knowledge of local markets and conditions, our project management and estimating abilities, our customer relationships, our marketing abilities, our ability to enter into strategic relationships with other contractors and our ability to perform many aspects of each project. Although some of our competitors are larger than we are and may possess greater resources or provide more vertically-integrated services, we believe that we are well-positioned to compete in the markets in which we operate on the basis of the foregoing factors.
We are unable to determine the size of most of our competitors because they are privately owned, but we believe that we are one of the larger participants in our Texas and Utah markets and one of the largest contractors in Houston and San Antonio engaged in municipal heavy civil construction work. We believe that being a municipal civil market contractor provides us with several advantages in the Houston and San Antonio markets, including greater flexibility to manage our backlog in order to schedule and deploy our workforce and equipment resources more efficiently; more cost-effective purchasing of materials, insurance and bonds; the ability to provide a broader range of services than otherwise would be provided through subcontractors; and the availability of substantially more capital and resources to dedicate to each of our contracts. Because we own and maintain most of the equipment required for our contracts and have the experienced workforce to handle many types of municipal civil construction, we are able to bid competitively on many categories of contracts, especially complex, multi-task projects.
In Utah, RLW has been competitive, in part, because of successful marketing efforts, design-build and CM/GC capabilities and development of innovative methods for completing projects. Competition for design-build projects is not totally focused on cost factors but is also significantly dependent on successful marketing efforts, reputation, quality of designs and aesthetics. We believe that we were one of the first construction companies to utilize accelerated bridge construction technology to build bridges offsite, move them to their location, and complete their installation in a short period of time in order to minimize mobility disruptions. In Nevada, we believe that we are a leading asphalt paving contractor on suburban and rural highway projects.
In the state highway markets, most of our competitors are large national and regional contractors, and individual contracts tend to be larger and require more specialized skills than those in the municipal markets. Some of these competitors have the advantage of being more vertically-integrated, or they specialize in certain types of projects such as construction over water. However those competitors, particularly in Texas, often have the disadvantage of having to use a temporary, local workforce to complete each of their state highway contracts. In contrast, we have a permanent workforce that performs our state highway contracts in Texas; however, we do rely on a temporary, unionized workforce for performance of a portion of our state highway contracts in Nevada and Hawaii.
Since the last quarter of 2008, through the years 2009 and 2010, the bidding environment has been more competitive because of the following:
|
·
|
Recent reductions in miles driven in the U.S. and more fuel efficient vehicles are reducing federal and state gasoline taxes, tolls and other highway related taxes collected, which are the primary funding sources for construction of highways and bridges. Also, the federal and Texas highway gasoline tax rates per gallon have not increased since 1994 and 1991, respectively.
|
|
·
|
The federal government has not renewed the five-year SAFETEA-LU bill, which expired September 30, 2009 and currently the federal government has extended funding for transportation infrastructure projects to September 30, 2011, which has caused uncertainty over subsequent month’s and years’ federal funding to the states for budgeting of future transportation infrastructure lettings.
|
|
·
|
The nationwide decline in home values as a result of the decline in home sales, the increase in foreclosures and a prolonged recession has resulted in decreases in property taxes and some other local taxes, which are among the sources of funding for municipal road, bridge and water infrastructure construction.
|
|
·
|
While our business does not include residential and commercial infrastructure work, the severe fall-off in new project development in those markets has resulted in some residential and commercial infrastructure contractors bidding on smaller public sector transportation and water infrastructure projects, sometimes at bid levels below our break-even pricing, thus increasing competition and creating downward pressure on bid prices in our markets.
|
|
·
|
Traditional competitors on larger transportation and water infrastructure projects also appear to have been bidding at less than normal margins, and sometimes at bid levels below our break-even pricing, in order to replenish their reduced backlogs.
|
|
·
|
We have also seen some new competitors from out-of-state bidding on large transportation projects; thus, adding to the competitive environment.
|
These factors have limited our ability to replace backlog through successful bids for new projects and have compressed the profitability on the new projects where we submitted successful bids. During the 2008-2010 periods, we have been more aggressive in reducing the anticipated margins we use to bid on some projects; however, we have not bid at anticipated loss margins in order to obtain new backlog.
Backlog.
Backlog is our estimate of the revenues that we expect to earn in future periods on our construction projects. We generally add the anticipated revenue value of each new project to our backlog when management reasonably determines that we will be awarded the contract and there are no known impediments to being awarded the contract. We deduct from backlog the revenues earned on each project during the applicable fiscal period. As construction on our projects progresses, we also increase or decrease backlog to take into account our estimates of the effects of changes in estimated quantities, changed conditions, change orders and other variations from initially anticipated contract revenues, including completion penalties and incentives. At December 31, 2010, our backlog of $660 million included approximately $138 million of expected revenues for which the contracts had not yet been officially awarded, including a project for $91 million on which the customer has deferred executing and starting the contract pending the resolution of funding issues. In February 2011, a joint venture in which the Company has a 45% interest was selected as the best “value proposer” to design and build a section of a highway northeast of Austin, Texas, for a price of $207 million. The Company’s expected share (approximately $93 million) of this contract is not included in the amount of backlog outstanding at December 31, 2010.
Historically, subsequent non-awards of contracts or finalization of contract price have not materially affected our backlog, results of operations or financial condition.
Substantially all of the contracts in our contract backlog may be canceled at the election of the customer; however, we have not been materially adversely affected by contract cancellations or modifications in the past. See the section below entitled “— Contracts — Contract Management Process.”
Construction Delivery Methods.
Alternative construction delivery methods describe different contractual and responsibility relationships among the owner, the builder and the designer of a project. There are three primary construction delivery methods: design-bid-build, design-build and construction management.
The traditional method by which the majority of our projects have historically been completed is design-bid-build. Under this type of construction delivery, the owner hires a design engineer to design the project and then solicits bids from construction firms and typically awards the contract to build the pre-designed project to the lowest qualifying bidder. The contractor to whom the project is awarded becomes the general contractor and is responsible for completing the project in accordance with the owner’s designs using the contractor’s own employees or resources, or subcontractors. Projects under this method are typically fixed unit price contracts.
Design-build is increasingly being used by public entities as a method of project delivery. Unlike traditional projects where the owner first hires a design firm or designs a project itself and then puts the project out to bid for construction, design-build projects provide the owner with a single point of responsibility and a single contact for both final design and construction. The owner selects a builder who hires the design team as required and construction typically starts before the design is complete. This project delivery method is typically undertaken through either fixed unit price contracts or lump sum contracts.
Construction management is a newer method of delivering a project whereby a contractor agrees to manage a project for the owner for an agreed-upon fee, which may be fixed or may vary based upon negotiated factors. The owner of the project typically hires the contractor as a construction manager early in the design phase of the project. The construction manager works with the design team to help ensure that the design is something that can in fact be built within the owner’s desired cost and other parameters and that the ultimate construction contractor will be able to understand the design drawings and specifications. There are two basic types of construction management: construction manager as advisor and construction manager at risk. In the construction manager as advisor variation, the construction manager acts as a technical consultant to the owner of the project and has no legal responsibility for the performance of the actual construction work. In the construction manager at risk variation, the construction manager becomes the prime contractor during the construction phase and awards subcontracts for portions of the work to be performed or performs the work itself. We more typically are a construction manager at risk through a construction manager/general contractor (CM/GC) relationship. In either type of construction management process, portions of a project are often submitted for bid during the course of the construction manager relationship, with the construction manager bidding, and oftentimes having the first right to bid, on portions of the project.
Among other alternative project delivery methods, RLW’s expertise includes employing accelerated bridge construction methods, or “ABC”, an innovative technology being implemented by many of the departments of transportation in the U.S. today. The use of ABC methods dramatically decrease bridge installation durations by a factor of months, thereby significantly reducing traffic delays and commuter fuel costs. UDOT is working to adopt ABC as a standard for many future bridge reconstruction projects. RLW has performed approximately 28 ABC bridge installations since 2008.
Using ABC, bridge structures are completely prefabricated off-site on temporary abutments and then transported to the installation site via Self-Propelled Modular Transporters (SPMT’s). For example, in a typical ABC bridge installation, a three to six-million pound bridge is prefabricated completely off-site without any traffic delays. The SPMT’s pick up, rotate and transport at one mile per hour the new bridge from the staging area to the installation site and position it on top of new pre-fabricated bridge abutments with usually less than an inch tolerance on each side of the bridge. The old bridge demolition and new bridge installation is performed within 24-48 hours, generally over a week-end, so that freeway traffic can reopen for Monday morning rush-hour traffic.
Contracts.
Types of Contracts.
We provide our services primarily by using traditional general contracting arrangements, including fixed unit price contracts, lump sum contracts and cost plus contracts.
Fixed unit price contracts are generally used in competitively-bid public civil construction contracts. Contractors under fixed unit price contracts are generally committed to provide all of the resources required to complete the contract for a fixed price per unit. These contracts are generally subject to negotiated change orders, frequently due to differences in site conditions from those initially anticipated as asserted by the customer. Some fixed unit price contracts provide for penalties, if the contract is not completed on time, or incentives, if it is completed ahead of schedule.
Under a lump sum contract, the contractor typically agrees to deliver a completed project in accordance with the contract’s requirements for a specific price, and the customer agrees to pay the price according to a negotiated payment schedule. In developing a lump sum bid, the contractor estimates the costs of labor, subcontracts and materials and adds an amount for overhead and profit. The amount of the profit included in the bid is based on the builder’s assessment of risk and other factors such as availability of resources. If the actual costs of labor, subcontracts, materials and overhead are higher than the contractor’s estimate, the profit will be reduced or become a loss; if the actual costs are lower, the contractor gets more profit.
In a cost plus contract, the owner of a project generally agrees to pay the cost of all of the contractor’s labor, subcontracts and materials plus an amount for contractor overhead and profit (usually as a percentage of the labor, subcontracts and material cost). If actual costs are lower than the estimate, the owner benefits from the cost savings. If actual costs are higher than the estimate, the owner bears the economic burden of the additional costs.
Contract Management Process.
We identify potential contracts from a variety of sources, including through subscriber services that notify us of contracts out for bid; through advertisements by federal, state and local governmental entities; through our business development efforts; through contacts at government agencies; and through meetings with other participants in the construction industry. After determining which contracts are available, we decide which contracts to pursue based on such factors as the relevant skills required, the contract size and duration, the availability of our personnel and equipment, the size and makeup of our current backlog, our competitive advantages and disadvantages, prior experience, the contracting agency or customer, the source of contract funding, geographic location, likely competition, construction risks, gross margin opportunities, penalties or incentives and the type of contract.
As a condition to pursuing some contracts, we are required to complete a prequalification process with the applicable agency or customer. Some customers, such as TXDOT, NDOT and UDOT, require yearly prequalification, and other customers have experience requirements specific to the contract. The prequalification process generally limits bidders to those companies with the operational experience and financial capability to effectively complete the particular contract in accordance with the plans, specifications and construction schedule.
There are several factors that can create variability in contract performance and financial results compared to our bid assumptions on a contract. The most significant of these include the completeness and accuracy of our original bid analysis, recognition of costs associated with added scope changes, extended overhead due to customer and weather delays, subcontractor availability and performance issues, changes in productivity expectations, site conditions that differ from those assumed in the original bid, and changes in the availability and proximity of materials. In addition, our original bids for some contracts are based on the contract customer’s estimates of the quantities needed to complete a contract. If the quantities ultimately needed are different, our backlog and financial performance on the contract will change. All of these factors can lead to inefficiencies in contract performance, which can increase costs and lower profits. Conversely, if any of these or other factors is more positive than the assumptions in our bid, contract profitability can improve. Design-build projects carry additional risks such as design error risk and the risk associated with estimating quantities and prices before the project design is completed. Design errors may result in higher than anticipated construction costs and additional liability to the contract owner. Although we manage this additional risk by adding contingencies to our bid amounts, obtaining errors and omissions insurance and obtaining indemnifications from our design consultants where possible, there is no guarantee that these risk management strategies will always be successful. Generally, gross margins included in bids on design-build contracts are higher than for other types of contracts due to the higher risks involved.
The estimating process for our traditional fixed unit price competitive bid contracts typically involves three phases. Initially, we consider the level of anticipated competition and our available resources for the prospective project. If we then decide to continue considering a project, we undertake the second phase of the contract process and spend up to six weeks performing a detailed review of the plans and specifications, summarizing the various types of work involved and related estimated quantities, determining the contract duration and schedule and highlighting the unique and riskier aspects of the contract. Concurrent with this process, we estimate the cost and availability of labor, material, equipment, subcontractors and the project team required to complete the contract on time and in accordance with the plans and specifications. Substantially all of our estimates are made on a per-unit basis for each line item, with the typical contract containing 50 to 400 line items. The final phase consists of a detailed review of the estimate by management, including, among other things, assumptions regarding cost, approach, means and methods, productivity, risk and the estimated profit margin. This profit amount will vary according to management’s perception of the degree of difficulty of the contract, the current competitive climate and the size, availability of resources and makeup of our backlog. Our project managers are intimately involved throughout the estimating and construction process so that contract issues, and risks, can be understood and addressed on a timely basis.
Although the factors described above are relevant in determining the appropriate amount to bid, the contracting process is managed differently if the project is to be performed on a design-build basis or a CM/GC basis. For design-build projects, we assemble a team that may include project managers, engineers, quality managers and surveyors, to learn about a project that we have identified as one on which we may desire to bid. For some projects, pre-qualification for the project is required wherein we and the other contractors prepare a description of financial strengths, past experience on similar types of projects, safety record and the persons who will be on the project management and design team, after which, the customer will usually set forth a short list of three to five contractors to respond to a request for proposal, generally within three months. Utilizing the limited design specifications provided by the customer, we generally meet weekly over a two to three month period with design engineers to generate a bid containing quantities, prices, timing and a description of our approach for completing the project. The customer then reviews the bids and selects the one that has the best value to price, and considers factors such as contractor qualifications, the time estimated to complete the project and the price bid.
For our CM/GC projects, the customer typically sends out a request for proposal to general contractors for a project. The customer scores each contractor that submits a bid based on the unit prices submitted for five to twenty items that comprise approximately 10% to 20% of the project design, the profit margin proposed, the experience of the contractor for similar types of projects, the contractor’s approach to completing the specific project and whether the contractor understands the CM/GC process. A committee reviews each bid and determines the best value winner to be the general contractor. If we are the winning general contractor, we work with the customer and the engineer to design the project. As various phases of the project are designed, we usually submit bids to construct each phase of the project for which we are qualified. In some situations, we also solicit bids from other construction contractors. If we are the lower bidder, we are awarded a contract for that phase. In other situations, if our bid is within say 5% of the cost estimates determined by the customer and the engineer, then we will generally be awarded the contract for a particular phase; if there is say more than a 10% difference, then the customer negotiates with us on the appropriate contract price; and if those negotiations are not successful, then the customer can terminate our contract.
To manage risks of changes in material prices and subcontracting costs used in tendering bids for construction contracts, we generally obtain firm price quotations from our suppliers and subcontractors, except for fuel and trucking, before submitting a bid. For fixed unit price contracts, these quotations do not include any quantity guarantees, and we have no obligation for materials or subcontract services beyond those required to complete the respective contracts that we are awarded for which quotations have been provided. For design-build and CM/GC projects, lump sum subcontracts are often executed with subcontractors.
During the construction phase of a contract, we monitor our progress by comparing actual costs incurred and quantities completed to date with budgeted amounts and the contract schedule, and periodically prepare an updated estimate of total forecasted revenue, cost and expected profit for the contract.
During the normal course of most contracts, the customer, and sometimes the contractor, initiates modifications or changes to the original contract to reflect, among other things, changes in quantities, specifications or design, method or manner of performance, facilities, materials, site conditions and the period for completion of the work. In many cases, final contract quantities may differ from those specified by the customer. Generally, the scope and price of these modifications are documented in a “change order” to the original contract and reviewed, approved and paid in accordance with the normal change order provisions of the contract. We are often required to perform extra or change order work under our fixed unit price contracts as directed by the customer even if the customer has not agreed in advance on the scope or price of the work to be performed. This process may result in disputes over whether the work performed is beyond the scope of the work included in the original contract plans and specifications or, even if the customer agrees that the work performed qualifies as extra work, the price that the customer is willing to pay for the extra work. These disputes may not be settled to our satisfaction. Even when the customer agrees to pay for the extra work, we may be required to fund the cost of the work for a lengthy period of time until the change order is approved and funded by the customer. In addition, any delay caused by the extra work may adversely impact the timely scheduling of other work on the contract (or on other contracts) and our ability to meet contract milestone dates.
The process for resolving contract claims varies from one contract to another but, in general, we attempt to resolve claims at the project supervisory level through the normal change order process or, if necessary, with higher levels of management within our organization and the customer’s organization. Regardless of the process, when a potential claim arises on a contract, we typically have the contractual obligation to perform the work and must incur the related costs. We do not recoup the costs unless and until the claim is resolved, which could take a significant amount of time.
Most of our construction contracts provide for termination of the contract for the convenience of the customer, with provisions to pay us only for work performed through the date of termination. Our backlog and results of operations have not been materially adversely affected by these provisions in the past.
We act as the prime contractor on the majority of the construction contracts that we undertake. We generally complete the majority of the work on our contracts with our own resources, and we typically subcontract only specialized activities, such as traffic control, electrical systems, signage, trucking and, in Utah, earthmoving. As the prime contractor, we are responsible for the performance of the entire contract, including subcontract work. Thus, we are subject to increased costs associated with the failure of one or more subcontractors to perform as anticipated. We manage this risk by reviewing the size of the subcontract, the financial stability of and prior experience with the subcontractor and other factors. Although we generally do not require that our subcontractors furnish a bond or other type of security to guarantee their performance, we require performance and payment bonds on some specialized or large subcontract portions of our contracts. Disadvantaged business enterprise regulations require us to use our best efforts to subcontract a specified portion of contract work performed for governmental entities to certain types of subcontractors, including minority- and women-owned businesses. We have not experienced significant costs associated with subcontractor performance issues in the past.
Joint Ventures.
We participate in joint ventures with other large construction companies and other partners, typically for large, technically complex projects, including design-build projects, when it is desirable to share risk and resources in order to seek a competitive advantage or when the project is too large for us to obtain sufficient bonding. Joint venture partners typically provide independently prepared estimates, furnish employees and equipment, enhance bonding capacity and often also bring local knowledge and expertise. We select our joint venture partners based on our analysis of their construction and financial capabilities, expertise in the type of work to be performed and past working relationships with us, among other criteria.
Under a joint venture agreement, one partner is typically designated as the sponsor or manager. The sponsoring partner typically provides all administrative, accounting and most of the project management support for the project and generally receives a fee from the joint venture for these services. We have been designated as the sponsoring partner in certain of our current joint venture projects and are a non-sponsoring partner in others.
The joint venture’s contract with the project owner typically imposes joint and several liability on the joint venture partners. Although our agreements with our joint venture partners provide that each party will assume and pay its share of any losses resulting from a project, if one of our partners is unable to pay its share, we would be fully liable under our contract with the project owner. Circumstances that could lead to a loss under these guarantee arrangements include a partner’s inability to contribute additional funds to the venture in the event that the project incurs a loss or additional costs that we could incur should the partner fail to provide the services and resources toward project completion that had been committed to in the joint venture agreement.
Insurance and Bonding.
All of our buildings and equipment are covered by insurance, at levels which our management believes to be adequate. In addition, we maintain general liability and excess liability insurance, all in amounts consistent with our risk of loss and industry practice. Except for RLW, which has workers compensation insurance, we self-insure our workers’ compensation and health claims subject to stop-loss insurance coverage.
As a normal part of the construction business, we are generally required to provide various types of surety and payment bonds that provide an additional measure of security for our performance under the contract. Typically, a bidder for a contract must post a bid bond, generally for 5% to 10% of the amount bid, and on winning the bid, must post a performance and payment bond for 100% of the contract amount. Upon completion of a contract, before receiving final payment on the contract, a contractor must post a maintenance bond for generally 1% of the contract amount for one to two years. Our ability to obtain surety bonds depends upon our capitalization, working capital, aggregate contract size, past performance, management expertise and external factors, including the capacity of the overall surety market. Surety companies consider such factors in light of the amount of our backlog that we have currently bonded and their current underwriting standards, which may change from time to time. As is customary, we have agreed to indemnify our bonding company for all losses incurred by it in connection with bonds that are issued, and we have granted our bonding company a security interest in certain assets as collateral for such obligation.
Government and Environmental Regulations.
Our operations are subject to compliance with numerous regulatory requirements of federal, state and local agencies and authorities, including regulations concerning safety, wage and hour, and other labor issues, immigration controls, vehicle and equipment operations and other aspects of our business. For example, our construction operations are subject to the requirements of the Occupational Safety and Health Act, or OSHA, and comparable state laws directed toward the protection of employees. In addition, most of our construction contracts are entered into with public authorities, and these contracts frequently impose additional governmental requirements, including requirements regarding labor relations and subcontracting with designated classes of disadvantaged businesses.
All of our operations are also subject to federal, state and local laws and regulations relating to the environment, including those relating to discharges into air, water and land, climate change, the handling and disposal of solid and hazardous waste, the handling of underground storage tanks and the cleanup of properties affected by hazardous substances. For example, we must apply water or chemicals to reduce dust on road construction projects and to contain contaminants in storm run-off water at construction sites. In certain circumstances, we may also be required to hire subcontractors to dispose of hazardous wastes encountered on a project in accordance with a plan approved in advance by the customer. Certain environmental laws impose substantial penalties for non-compliance and others, such as the federal Comprehensive Environmental Response, Compensation and Liability Act, or CERCLA, impose strict and retroactive joint and several liability upon persons responsible for releases of hazardous substances.
CERCLA and comparable state laws impose liability, without regard to fault or the legality of the original conduct, on certain classes of persons that contributed to the release of a “hazardous substance” into the environment. These persons include the owner or operator of the site where the release occurred and companies that disposed or arranged for the disposal of the hazardous substances found at the site. Under CERCLA, these persons may be subject to joint and several liability for the costs of cleaning up the hazardous substances that have been released into the environment, for damages to natural resources and for the costs of certain health studies. CERCLA also authorizes the federal Environmental Protection Agency, or EPA, and, in some instances, third parties, to act in response to threats to the public health or the environment and to seek to recover from the responsible classes of persons the costs they incur.
Solid wastes, which may include hazardous wastes, are subject to the requirements of the Federal Solid Waste Disposal Act, the Federal Resource Conservation and Recovery Act, referred to as RCRA, and comparable state statutes. Although we do not generate solid waste, we occasionally dispose of solid waste on behalf of customers. From time to time, the EPA considers the adoption of stricter disposal standards for non-hazardous wastes. Moreover, it is possible that additional wastes will in the future be designated as “hazardous wastes.” Hazardous wastes are subject to more rigorous and costly disposal requirements than are non-hazardous wastes.
We continually evaluate whether we must take additional steps at our locations to ensure compliance with environmental laws. While compliance with applicable regulatory requirements has not materially adversely affected our operations in the past, there can be no assurance that these requirements will not change and that compliance will not adversely affect our operations in the future and that tighter regulation for the protection of the environment and other factors may make it more difficult to obtain new permits and renewal of existing permits may be subject to more restrictive conditions than currently exist.
Employees.
As of December 31, 2010, the Company had approximately 1,300 employees, including approximately 30 project managers and 65 superintendents. Of such employees, approximately 40 are headquarters’ personnel located in Houston, with most of the others being field personnel. Of our RHB employees, 28 were union members represented by three unions at December 31, 2010.
Our business is dependent upon a readily available supply of management, supervisory and field personnel. Substantially all of our employees who work on our contracts in Texas are a permanent part of our workforce, and we generally do not rely on temporary employees to complete these contracts. In contrast, many of our employees who work on our contracts in Nevada are seasonal employees. In the past, we have been able to attract sufficient numbers of personnel to support the growth of our operations.
We conduct extensive safety training programs, which have allowed us to maintain a high safety level at our worksites. All newly-hired employees undergo an initial safety orientation, and for certain types of projects, we conduct specific hazard training programs. Our project foremen and superintendents conduct weekly on-site safety meetings, and our full-time safety inspectors make random site safety inspections and perform assessments and training if infractions are discovered. In addition, all of our superintendents and project managers are required to complete an OSHA-approved safety course.
Item 1A. Risk Factors.
The risks described below are those we believe to be the material risks we face. Any of the risk factors described below could significantly and adversely affect our business, prospects, financial condition, results of operations and cash flows.
Risks Relating to Our Business.
If we are unable to accurately estimate the overall risks, requirements or costs when we bid on or negotiate a contract that is ultimately awarded to us, we may achieve a lower than anticipated profit or incur a loss on the contract.
The majority of our revenues and backlog are derived from fixed unit price contracts. Some of our revenues are derived from lump sum contracts. Fixed unit price contracts require us to provide materials and services at a fixed unit price based on approved quantities irrespective of our actual per unit costs. Lump sum contracts require that the total amount of work be performed for a single price irrespective of our actual per unit costs. We realize a profit on our contracts only if we successfully estimate our costs and then successfully control actual costs and avoid cost overruns, and our revenues exceed actual costs. If our cost estimates for a contract are inaccurate, or if we do not execute the contract within our cost estimates, then cost overruns may cause us to incur losses or cause the contract not to be as profitable as we expected. The final results under these types of contracts could negatively affect our cash flow, earnings and financial position.
The costs incurred and gross profit realized on our contracts can vary, sometimes substantially, from our original projections due to a variety of factors, including, but not limited to:
|
·
|
onsite conditions that differ from those assumed in the original bid or contract;
|
|
·
|
failure to include required materials or work in a bid, or the failure to estimate properly the quantities or costs needed to complete a lump sum contract;
|
|
·
|
delays caused by weather conditions;
|
|
·
|
contract or project modifications creating unanticipated costs not covered by change orders;
|
|
·
|
changes in availability, proximity and costs of materials, including steel, concrete, aggregates and other construction materials (such as stone, gravel, sand and oil for asphalt paving), as well as fuel and lubricants for our equipment;
|
|
·
|
inability to predict the costs of accessing and producing aggregates and purchasing oil required for asphalt paving projects;
|
|
·
|
availability and skill level of workers in the geographic location of a project;
|
|
·
|
failure by our suppliers, subcontractors, designers, engineers, joint venture partners or customers to perform their obligations;
|
|
·
|
fraud, theft or other improper activities by our suppliers, subcontractors, designers, engineers, joint venture partners or customers or our own personnel;
|
|
·
|
mechanical problems with our machinery or equipment;
|
|
·
|
citations issued by any governmental authority, including the Occupational Safety and Health Administration;
|
|
·
|
difficulties in obtaining required governmental permits or approvals;
|
|
·
|
changes in applicable laws and regulations; and
|
|
·
|
claims or demands from third parties for alleged damages arising from the design, construction or use and operation of a project of which our work is part.
|
Many of our contracts with public sector customers contain provisions that purport to shift some or all of the above risks from the customer to us, even in cases where the customer is partly at fault. Our experience has often been that public sector customers have been willing to negotiate equitable adjustments in the contract compensation or completion time provisions if unexpected circumstances arise. Public sector customers may seek to impose contractual risk-shifting provisions more aggressively, and we could face increased risks, which may adversely affect our cash flow, earnings and financial position.
We may be unable to sustain our historical revenue growth rate and maintain our profitability.
We may be unable to sustain our historical revenue growth rates for a variety of reasons, including decreased government funding for infrastructure projects, limits on additional growth in our current markets, reduced spending by our customers, an increased number of competitors, less success in competitive bidding for contracts, limitations on access to necessary working capital and investment capital to sustain growth, limitations on access to bonding to support increased contracts and operations, inability to hire and retain essential personnel and to acquire equipment to support growth, and inability to identify acquisition candidates and successfully acquire and integrate them into our business. Due to some of these factors, we currently anticipate that our net income and diluted earnings per share of stock attributable to Sterling common stockholders for 2011 will be below the results that we achieved in 2010. A substantial decline in our revenue could have a material adverse effect on our financial condition and results of operations if we are unable to also reduce our operating expenses.
Economic downturns or reductions in government funding of infrastructure projects could reduce our revenues and profits and have a material adverse effect on our results of operations.
Our business is highly dependent on the amount and timing of infrastructure work funded by various governmental entities, which, in turn, depends on the overall condition of the economy, the need for new or replacement infrastructure, the priorities placed on various projects funded by governmental entities and federal, state or local government spending levels. Spending on infrastructure could decline for numerous reasons, including decreased revenues received by state and local governments for spending on such projects, including federal funding. The nationwide decline in home sales, the increase in foreclosures and a prolonged recession have resulted in decreases in property taxes and some other local taxes, which are among the sources of funding for municipal road, bridge and water infrastructure construction. State spending on highway and other projects can be adversely affected by decreases or delays in, or uncertainties regarding, federal highway funding, which could adversely affect us. We are reliant upon contracts with TXDOT, UDOT and NDOT for a significant portion of our revenues.
Recent reductions in miles driven in the U.S. and more fuel efficient vehicles have reduced federal and state gasoline taxes and tolls collected. In addition, the federal government has not renewed the five-year $244 billion SAFETEA-LU bill, which provided states with substantial funding for transportation infrastructure projects. Since the SAFETEA-LU bill expired on September 30, 2009, the federal government has been extending financial assistance on an interim basis, most recently through September 30, 2011. Reductions in federal funding may negatively impact the states’ highway and bridge construction contract awards for 2011. We are unable to predict when or on what terms the federal government might renew the SAFETEA-LU bill or enact other similar legislation.
While our business includes only minimal residential and commercial infrastructure work, the severe fall-off in new projects in those markets has resulted in some residential and commercial infrastructure contractors bidding on some public sector transportation and water infrastructure projects, sometimes at bid levels below our break-even pricing. Traditional competitors on larger transportation and water infrastructure projects also appear to have been bidding at less than normal margins and, in some cases at bid levels below our break-even pricing, in order to replenish their reduced backlogs. These conditions have increased competition and created downward pressure on bid prices in our markets. These and other factors have limited our ability to maintain or increase our backlog through successful bids for new projects and have limited the profitability of new projects that we do obtain through successful bids. These adverse competitive trends may continue or worsen.
We operate in Texas, Utah, Nevada, and to a lesser extent in other states, and adverse changes to the economy and business environment in those states have had an adverse effect on, and could continue to adversely affect, our operations, which could lead to lower revenues and reduced profitability.
Because of this concentration in specific geographic locations, we are susceptible to fluctuations in our business caused by adverse economic or other conditions in these regions, including natural or other disasters. The stagnant or depressed economy, to varying degrees, in Texas, Utah and Nevada have adversely affected, and could continue to adversely effect, our business and results of operations.
The cancellation of significant contracts or our disqualification from bidding for new contracts could reduce our revenues and profits and have a material adverse effect on our results of operations.
Contracts that we enter into with governmental entities can usually be canceled at any time by them with payment only for the work already completed. In addition, we could be prohibited from bidding on certain governmental contracts if we fail to maintain qualifications required by those entities. A cancellation of an unfinished contract or our debarment from the bidding process could cause our equipment and work crews to be idled for a significant period of time until other comparable work becomes available, which could have a material adverse effect on our business and results of operations.
Our acquisition strategy involves a number of risks.
We intend to continue pursuing growth through the acquisition of companies or assets that may enable us to expand our project skill-sets and capabilities, enlarge our geographic markets, add experienced management and enhance our ability to bid on larger contracts. However, we may be unable to implement this growth strategy if we cannot reach agreements for potential acquisitions on acceptable terms or for other reasons. Moreover, our acquisition strategy involves certain risks, including:
|
·
|
difficulties in the integration of operations and systems;
|
|
·
|
difficulties applying our expertise in one market into another market;
|
|
·
|
regulatory requirements that impose restrictions on bidding for certain projects because of historical operations by Sterling or the acquired company;
|
|
·
|
the key personnel, customers and project partners of the acquired company may terminate or diminish their relationships with the acquired company;
|
|
·
|
we may experience additional financial and accounting challenges and complexities in areas such as tax planning and financial reporting;
|
|
·
|
we may assume or be held liable for risks and liabilities (including for environmental-related costs and liabilities) as a result of our acquisitions, some of which we may not discover during our due diligence;
|
|
·
|
we may not adequately anticipate competitive and other market factors applicable to the acquired company;
|
|
·
|
our ongoing business may be disrupted or receive insufficient management attention; and
|
|
·
|
we may not be able to realize cost savings or other financial benefits we anticipated or we may not realize the anticipated benefits in the time frame that we expected.
|
Future acquisitions may require us to obtain additional equity or debt financing, as well as additional surety bonding capacity, which may not be available on terms acceptable to us or at all. Moreover, to the extent that any acquisition results in additional goodwill, it will reduce our tangible net worth, which might have an adverse effect on our credit and bonding capacity.
Our industry is highly competitive, with a variety of companies competing against us, and our failure to compete effectively could reduce the number of new contracts awarded to us or adversely affect our margins on contracts awarded.
A majority of the contracts on which we bid are awarded through a competitive bid process, with awards generally being made to the lowest bidder, but sometimes recognizing other factors, such as shorter contract schedules or prior experience with the customer. For our design-build, CM/GC and other alternative methods of delivering projects, reputation, marketing efforts, quality of design and minimizing public inconvenience are also significant factors considered in awarding contracts, in addition to cost. Within our markets, we compete with many national, regional and local construction firms. Some of these competitors have achieved greater market penetration than we have in the markets in which we compete, and some may have greater financial and other resources than we do. In addition, there are a number of national companies in our industry that are larger than we are and that, if they so desire, could establish a presence in our markets and compete with us for contracts.
In some markets where residential and commercial projects have significantly diminished, the bidding environment in our markets has been much more competitive as construction companies that lack available work in those markets have begun bidding on projects in our markets, sometimes at bid levels below our break-even pricing. In addition, traditional competitors on larger transportation and water infrastructure projects also appear to have been bidding at less than normal margins, and in some cases at below our break-even pricing, in order to replenish their reduced backlogs. As a result, we may need to accept lower contract margins in order to compete against competitors that have the ability to accept awards at lower prices or have a pre-existing relationship with a customer.
In addition, if the use of design-build, CM/GC and other alternative project delivery methods continues to increase and we are not able to further develop our capabilities and reputation in connection with these alternative delivery methods, we will be at a competitive disadvantage, which may have a material adverse effect on our financial position, results of operations, cash flows and prospects. If we are unable to compete successfully in our markets, our relative market share and profits could also be reduced.
Our dependence on subcontractors and suppliers of materials (including petroleum-based products) could increase our costs and impair our ability to complete contracts on a timely basis or at all, which would adversely affect our profits and cash flow.
We rely on third-party subcontractors to perform some of the work on many of our contracts. We generally do not bid on contracts unless we have the necessary subcontractors committed for the anticipated scope of the contract and at prices that we have included in our bid, except for trucking arrangements needed for our Nevada operations. Therefore, to the extent that we cannot engage subcontractors, our ability to bid for contracts may be impaired. In addition, if a subcontractor is unable to deliver its services according to the negotiated terms for any reason, including the deterioration of its financial condition, we may suffer delays and be required to purchase the services from another source at a higher price or incur other unanticipated costs. This may reduce the profit to be realized, or result in a loss, on a contract.
We also rely on third-party suppliers to provide most of the materials (including aggregates, cement, asphalt, concrete, steel, pipe, oil and fuel) for our contracts, except in Nevada where we source and produce most of the aggregates we use. We do not own or operate any quarries in Texas or Utah. We normally do not bid on contracts unless we have commitments from suppliers for the materials and subcontractors for certain of the services required to complete the contract and at prices that we have included in our bid, except for some aggregates we use in our Nevada construction projects. Thus, to the extent that we cannot obtain commitments from our suppliers for materials and subcontractors for certain of the services, our ability to bid for contracts may be impaired. In addition, if a supplier or subcontractor is unable to deliver materials or services according to the negotiated terms of a supply/services agreement for any reason, including the deterioration of its financial condition, we may suffer delays and be required to purchase the materials/services from another source at a higher price or incur other unanticipated costs. This may reduce the profit to be realized, or result in a loss, on a contract.
Diesel fuel and other petroleum-based products are utilized to operate the plants and equipment on which we rely to perform our construction contracts. In addition, our asphalt plants and suppliers use oil in combination with aggregates to produce asphalt used in our road and highway construction projects. Decreased supplies of such products relative to demand, unavailability of petroleum supplies due to refinery turnarounds, higher prices charged for petroleum based products and other factors can increase the cost of such products. Future increases in the costs of fuel and other petroleum-based products used in our business, particularly if a bid has been submitted for a contract and the costs of such products have been estimated at amounts less than the actual costs thereof, could result in a lower profit, or a loss, on a contract.
We may not accurately assess the quality, and we may not accurately estimate the quality, quantity, availability and cost of aggregates we plan to produce, particularly for projects in rural areas of Nevada, which could have a material adverse effect on our results of operations.
Particularly for projects in rural areas of Nevada, we typically estimate the quality, quantity, availability and cost for anticipated aggregate sources that we have not previously used to produce aggregates, which increases the risk that our estimates may be inaccurate. Inaccuracies in our estimates regarding aggregates could result in significantly higher costs to supply aggregates needed for our projects, as well as potential delays and other inefficiencies. As a result, our failure to accurately assess the quality, quantity, availability and cost of aggregates could cause us to incur losses, which could materially adversely affect our results of operations.
We may not be able to fully realize the revenue anticipated by our reported backlog.
Backlog is our estimate of the revenues that we expect to earn in future periods on our construction projects. We generally add the anticipated revenue value of each new project to our backlog when management reasonably determines that we will be awarded the contract and there are no known impediments to being awarded the contract. We deduct from backlog the revenues earned on each project during the applicable fiscal period. As construction on our projects progresses, we also increase or decrease backlog to take into account our estimates of the effects of changes in estimated quantities, changed conditions, change orders and other variations from initially anticipated contract revenues, including completion penalties and bonuses. Actual results may differ from the expectations and estimates we rely upon in determining backlog.
Most of the contracts with our public sector customers can be terminated at their discretion. If a customer cancels, suspends, delays or reduces a contract, we may be reimbursed for certain costs but typically will not be able to bill the total amount that had been reflected in our backlog. Cancellation of one or more contracts that constitute a large percentage of our backlog, and our inability to find a substitute contract, would have a material adverse effect on our business, results of operations and financial condition.
If we are unable to attract and retain key personnel and skilled labor, or if we encounter labor difficulties, our ability to bid for and successfully complete contracts may be negatively impacted.
Our ability to attract and retain reliable, qualified personnel is a significant factor that enables us to successfully bid for and profitably complete our work. This includes members of our management, project managers, estimators, supervisors, foremen, equipment operators and laborers. The loss of the services of any of our management could have a material adverse effect on us. Our future success will also depend on our ability to hire and retain, or to attract when needed, highly-skilled personnel. If competition for these employees is intense, we could experience difficulty hiring and retaining the personnel necessary to support our business. If we do not succeed in retaining our current employees and attracting, developing and retaining new highly-skilled employees, our reputation may be harmed and our operations and future earnings may be negatively impacted.
We rely heavily on immigrant labor. We have taken steps that we believe are sufficient and appropriate to ensure compliance with immigration laws. However, we cannot provide assurance that we have identified, or will identify in the future, all illegal immigrants who work for us. Our failure to identify illegal immigrants who work for us may result in fines or other penalties being imposed upon us, which could have a material adverse effect on our operations, results of operations and financial condition.
In Nevada and Hawaii, a substantial number of our equipment operators and laborers are unionized. Any work stoppage or other labor dispute involving our unionized workforce would have a material adverse effect on our operations and operating results.
Our contracts may require us to perform extra or change order work, which can result in disputes and adversely affect our working capital, profits and cash flows.
Our contracts often require us to perform extra or change order work as directed by the customer even if the customer has not agreed in advance on the scope or price of the extra work to be performed. This process may result in disputes over whether the work performed is beyond the scope of the work included in the original project plans and specifications or, if the customer agrees that the work performed qualifies as extra work, the price that the customer is willing to pay for the extra work. These disputes may not be settled to our satisfaction. Even when the customer agrees to pay for the extra work, we may be required to fund the cost of such work for a lengthy period of time until the change order is approved by the customer and we are paid by the customer.
To the extent that actual recoveries with respect to change orders or amounts subject to contract disputes or claims are less than the estimates used in our financial statements, the amount of any shortfall will reduce our future revenues and profits, and this could have a material adverse effect on our reported working capital and results of operations. In addition, any delay caused by the extra work may adversely impact the timely scheduling of other project work and our ability to meet specified contract milestone dates.
Our failure to meet schedule or performance requirements of our contracts could adversely affect us.
In most cases, our contracts require completion by a scheduled acceptance date. Failure to meet any such schedule could result in additional costs, penalties or liquidated damages being assessed against us, and these could exceed projected profit margins on the contract. Performance problems on existing and future contracts could cause actual results of operations to differ materially from those anticipated by us and could cause us to suffer damage to our reputation within the industry and among our customers.
The design-build project delivery method subjects us to the risk of design errors and omissions.
In the event of a design error or omission causing damages with respect to one of our design-build projects, we could be liable. Although we pass design responsibility on to the engineering firms that we engage to perform design services on our behalf for these projects, in the event of a design error or omission causing damages, there is risk that the engineering firm, its professional liability insurance, and the errors and omissions insurance that they and we purchase will not fully protect us from costs or liabilities. Any liabilities resulting from an asserted design defect with respect to our construction projects may have a material adverse effect on our financial position, results of operations and cash flows.
Adverse weather conditions may cause delays, which could slow completion of our contracts and negatively affect our revenues and cash flow.
Because all of our construction projects are built outdoors, work on our contracts is subject to unpredictable weather conditions, which could become more frequent or severe if general climatic changes occur. For example, evacuations in Texas due to Hurricanes Rita and Ike resulted in our inability to perform work on all Houston-area contracts for several days. Lengthy periods of wet or cold winter weather will generally interrupt construction, and this can lead to under-utilization of crews and equipment, resulting in less efficient rates of overhead recovery. For example, during the first quarter of 2010, we experienced an above-average number of days of rainfall across our Texas markets, which impeded our ability to work on construction projects and reduced our revenues and gross profit. During the late fall to early spring months of each year, our work on construction projects in Nevada and Utah may also be curtailed because of snow and other work-limiting weather. While revenues can be recovered following a period of bad weather, it is generally impossible to recover the cost of inefficiencies, and significant periods of bad weather typically reduce profitability of affected contracts both in the current period and during the future life of affected contracts. Such reductions in contract profitability negatively affect our results of operations in current and future periods until the affected contracts are completed.
Timing of the award and performance of new contracts could have an adverse effect on our operating results and cash flow.
It is generally very difficult to predict whether and when new contracts will be offered for tender, as these contracts frequently involve a lengthy and complex design and bidding process, which is affected by a number of factors, such as market conditions, funding arrangements and governmental approvals. Because of these factors, our results of operations and cash flows may fluctuate from quarter to quarter and year to year, and the fluctuation may be substantial.
The uncertainty of the timing of contract awards may also present difficulties in matching the size of our equipment fleet and work crews with contract needs. In some cases, we may maintain and bear the cost of more equipment and ready work crews than are currently required, in anticipation of future needs for existing contracts or expected future contracts. If a contract is delayed or an expected contract award is not received, we would incur costs that could have a material adverse effect on our anticipated profit.
In addition, the timing of the revenues, earnings and cash flows from our contracts can be delayed by a number of factors, including adverse weather conditions, such as prolonged or intense periods of rain, snow, storms or flooding; delays in receiving material and equipment from suppliers and services from subcontractors; and changes in the scope of work to be performed. Such delays, if they occur, could have adverse effects on our operating results for current and future periods until the affected contracts are completed.
Our participation in construction joint ventures exposes us to liability and/or harm to our reputation for failures of our partners.
As part of our business, we are a party to joint venture arrangements, pursuant to which we typically jointly bid on and execute particular projects with other companies in the construction industry. Success on these joint projects depends upon managing the risks discussed in the various risks described in these “Risk Factors” and on whether our joint venture partners satisfy their contractual obligations.
We and our joint venture partners are generally jointly and severally liable for all liabilities and obligations of our joint ventures. If a joint venture partner fails to perform or is financially unable to bear its portion of required capital contributions or other obligations, including liabilities stemming from lawsuits, we could be required to make additional investments, provide additional services or pay more than our proportionate share of a liability to make up for our partner’s shortfall. Furthermore, if we are unable to adequately address our partner’s performance issues, the customer may terminate the project, which could result in legal liability to us, harm to our reputation and reduction to our profit on a project.
In connection with acquisitions certain counterparties to joint venture arrangements, which may include our historical direct competitors, may not desire to continue such arrangements with us and may terminate the joint venture arrangements or not enter into new arrangements. Any termination of a joint venture arrangement could cause us to reduce our backlog and could materially and adversely affect our business, results of operations and financial condition.
Our dependence on a limited number of customers could adversely affect our business and results of operations.
Due to the size and nature of our construction contracts, one or a few customers have in the past and may in the future represent a substantial portion of our consolidated revenues and gross profits in any one year or over a period of several consecutive years. For example, in 2010, approximately 20.7% of our revenue was generated from TXDOT, approximately 26.2% was generated by UDOT and approximately 6.4% of our revenue was generated from NDOT. Similarly, our backlog frequently reflects multiple contracts for individual customers; therefore, one customer may comprise a significant percentage of backlog at a certain point in time. Examples of this are TXDOT, which comprised 16.5% of our backlog, UDOT which comprised 25.3% of our backlog and NTTA which comprised 17.4% of our backlog at December 31, 2010. The loss of business from any one of such customers could have a material adverse effect on our business or results of operations. Also, a default or delay in payment on a significant scale by a customer could materially adversely affect our business, results of operations and financial condition.
We may incur higher costs to lease, acquire and maintain equipment necessary for our operations, and the market value of our owned equipment may decline.
We have traditionally owned most of the construction equipment used to build our projects. To the extent that we are unable to buy construction equipment necessary for our needs, either due to a lack of available funding or equipment shortages in the marketplace, we may be forced to rent equipment on a short-term basis, which could increase the costs of performing our contracts.
The equipment that we own or lease requires continuous maintenance, for which we maintain our own repair facilities. If we are unable to continue to maintain the equipment in our fleet, we may be forced to obtain third-party repair services, which could increase our costs. In addition, the market value of our equipment may unexpectedly decline at a faster rate than anticipated.
An inability to obtain bonding could limit the aggregate dollar amount of contracts that we are able to pursue.
As is customary in the construction business, we are required to provide surety bonds to our customers to secure our performance under construction contracts. Our ability to obtain surety bonds primarily depends upon our capitalization, working capital, past performance, management expertise and reputation and certain external factors, including the overall capacity of the surety market. Surety companies consider such factors in relationship to the amount of our backlog and their underwriting standards, which may change from time to time. Events that adversely affect the insurance and bonding markets generally may result in bonding becoming more difficult to obtain in the future, or being available only at a significantly greater cost. Our inability to obtain adequate bonding, and, as a result, to bid on new contracts, could have a material adverse effect on our future revenues and business prospects.
Our operations are subject to hazards that may cause personal injury or property damage, thereby subjecting us to liabilities and possible losses, which may not be covered by insurance.
Our workers are subject to the usual hazards associated with providing construction and related services on construction sites, plants and quarries. Operating hazards can cause personal injury and loss of life, damage to or destruction of property, plant and equipment and environmental damage. Except for RLW, which has workers compensation insurance, we self-insure our workers’ compensation and health claims, subject to stop-loss insurance coverage. We also maintain insurance coverage in amounts and against the risks that we believe are consistent with industry practice, but this insurance may not be adequate to cover all losses or liabilities that we may incur in our operations.
Insurance liabilities are difficult to assess and quantify due to unknown factors, including the severity of an injury, the determination of our liability in proportion to other parties, the number of incidents not reported and the effectiveness of our safety program. If we were to experience insurance claims or costs above our estimates, we might also be required to use working capital to satisfy these claims rather than to maintain or expand our operations. To the extent that we experience a material increase in the frequency or severity of accidents or workers’ compensation and health claims, or unfavorable developments on existing claims, our operating results and financial condition could be materially and adversely affected.
Environmental and other regulatory matters could adversely affect our ability to conduct our business and could require expenditures that could have a material adverse effect on our results of operations and financial condition.
Our operations are subject to various environmental laws and regulations relating to the management, disposal and remediation of hazardous substances, climate change and the emission and discharge of pollutants into the air and water. We could be held liable for such contamination created not only from our own activities but also from the historical activities of others on our project sites or on properties that we acquire or lease. Our operations are also subject to laws and regulations relating to workplace safety and worker health, which, among other things, regulate employee exposure to hazardous substances. Immigration laws require us to take certain steps intended to confirm the legal status of our immigrant labor force, but we may nonetheless unknowingly employ illegal immigrants. Violations of such laws and regulations could subject us to substantial fines and penalties, cleanup costs, third-party property damage or personal injury claims. In addition, these laws and regulations have become, and enforcement practices and compliance standards are becoming, increasingly stringent. Moreover, we cannot predict the nature, scope or effect of legislation or regulatory requirements that could be imposed, or how existing or future laws or regulations will be administered or interpreted, with respect to products or activities to which they have not been previously applied. Compliance with more stringent laws or regulations, as well as more vigorous enforcement policies of the regulatory agencies, could require us to make substantial expenditures for, among other things, pollution control systems and other equipment that we do not currently possess, or the acquisition or modification of permits applicable to our activities.
Our aggregate quarry lease in Nevada could subject us to costs and liabilities. As lessee and operator of the quarry, we could be held responsible for any contamination or regulatory violations resulting from activities or operations at the quarry. Any such costs and liabilities could be significant and could materially and adversely affect our business, operating results and financial condition.
Terrorist attacks have impacted, and could continue to negatively impact, the U.S. economy and the markets in which we operate.
Terrorist attacks, like those that occurred on September 11, 2001, have contributed to economic instability in the United States, and further acts of terrorism, violence or war could affect the markets in which we operate, our business and our expectations. Armed hostilities may increase, or terrorist attacks, or responses from the United States, may lead to further acts of terrorism and civil disturbances in the United States or elsewhere, which may further contribute to economic instability in the United States. These attacks or armed conflicts may affect our operations or those of our customers or suppliers and could impact our revenues, our production capability and our ability to complete contracts in a timely manner.
Risks Related to Our Financial Results and Financing Plans.
Actual results could differ from the estimates and assumptions that we use to prepare our financial statements.
To prepare financial statements in conformity with GAAP, management is required to make estimates and assumptions, as of the date of the financial statements, which affect the reported values of assets and liabilities, revenues and expenses, and disclosures of contingent assets and liabilities. Areas requiring significant estimates by our management include: contract costs and profits; application of percentage-of-completion accounting and revenue recognition of contract change order claims; provisions for uncollectible receivables and customer claims and recoveries of costs from subcontractors, suppliers and others; impairment of long-term assets; valuation of assets acquired and liabilities assumed in connection with business combinations; accruals for estimated liabilities, including litigation and insurance reserves; and stock-based compensation. Our actual results could differ from, and could require adjustments to, those estimates.
In particular, as is more fully discussed in “Management’s Discussion and Analysis of Financial Condition and Results of Operations — Critical Accounting Policies,” we recognize contract revenue using the percentage-of-completion method. Under this method, estimated contract revenue is recognized by applying the percentage of completion of the contract for the period (based on the ratio of costs incurred to total estimated costs of a contract) to the total estimated revenue for the contract. Estimated contract losses are recognized in full when determined. Contract revenue and total cost estimates are reviewed and revised on a continuous basis as the work progresses and as change orders are initiated or approved, and adjustments based upon the percentage of completion are reflected in contract revenue in the accounting period when these estimates are revised. To the extent that these adjustments result in an increase, a reduction or an elimination of previously reported contract profit, we recognize a credit or a charge against current earnings, which could be material.
We may need to raise additional capital in the future for working capital, capital expenditures and/or acquisitions, and we may not be able to do so on favorable terms or at all, which would impair our ability to operate our business or achieve our growth objectives.
Our ability to obtain additional financing in the future will depend in part upon prevailing credit and equity market conditions, as well as conditions in our business and our operating results; such factors may adversely affect our efforts to arrange additional financing on terms satisfactory to us. We have pledged the proceeds and other rights under our construction contracts to our bond surety, and we have pledged substantially all of our other assets as collateral in connection with our credit facility and mortgage debt. As a result, we may have difficulty in obtaining additional financing in the future if such financing requires us to pledge assets as collateral. In addition, under our credit facility, we must obtain the consent of our lenders to incur any amount of additional debt from other sources (subject to certain exceptions). If future financing is obtained by the issuance of additional shares of common stock, our stockholders may suffer dilution. If adequate funds are not available, or are not available on acceptable terms, we may not be able to make future investments, take advantage of acquisitions or other opportunities, or respond to competitive challenges.
We are subject to financial and other covenants under our credit facility that could limit our flexibility in managing our business.
We have a credit facility that restricts us from engaging in certain activities, including restrictions on our ability (subject to certain exceptions) to:
|
·
|
make distributions, pay dividends and buy back shares;
|
|
·
|
incur liens or encumbrances;
|
|
·
|
incur indebtedness;
|
|
·
|
guarantee obligations;
|
|
·
|
dispose of a material portion of assets or otherwise engage in a merger with a third party;
|
|
·
|
make acquisitions; and
|
|
·
|
incur losses for two consecutive quarters.
|
Our credit facility contains financial covenants that require us to maintain specified fixed charge coverage ratios, asset ratios and leverage ratios, and to maintain specified levels of tangible net worth. Our ability to borrow funds for any purpose will depend on our satisfying these tests. If we are unable to meet the terms of the financial covenants or fail to comply with any of the other restrictions contained in our credit facility, an event of default could occur. An event of default, if not waived by our lenders, could result in the acceleration of any outstanding indebtedness, causing such debt to become immediately due and payable. If such acceleration occurs, we may not be able to repay such indebtedness on a timely basis. Acceleration of our credit facility could result in foreclosure on and loss of our operating assets. In the event of such foreclosure, we would be unable to conduct our business and forced to discontinue operations.
If we were required to write down all or part of our goodwill, our net earnings and net worth could be materially and adversely affected.
We had approximately $114.7 million of goodwill recorded on our consolidated balance sheet at December 31, 2010. Goodwill represents the excess of cost over the fair value of net assets acquired in business combinations. A shortfall in our revenues or net income or changes in various other factors from that expected by securities analysis and investors could significantly reduce the market price of our common stock. If our market capitalization drops significantly below the amount of net equity recorded on our balance sheet, it might indicate a decline in our fair value and would require us to further evaluate whether our goodwill has been impaired. We perform an annual review of our goodwill and intangible assets to determine if they have become impaired, which would require us to write down the impaired portion of these assets. On an interim basis, we also review the factors that have or may affect our operations or market capitalization for events that may trigger impairment testing. If we were required to write down all or a significant part of our goodwill, our net earnings and net worth could be materially and adversely affected.
Item 1B. Unresolved Staff Comments.
None
Item 2. Properties.
We own our headquarters office building in Houston, Texas, which is located on a seven-acre parcel of land on which our Texas equipment repair center is also located. We also own land in San Antonio on which we plan to construct offices and repair facilities, and we own land in Dallas on which we can construct offices or repair facilities. Pending completion of these offices, we have leased office facilities in these locations.
Our Utah operations leases office space in Draper, Utah, near Salt Lake City, and equipment repair facilities in West Jordan City, Utah from entities owned by the noncontrolling interest owners of RLW – see Note 14 to the accompanying financial statements.
For our Nevada operations, we lease office space in Reno, Nevada, and own our office and repair facilities located on a forty-five acre parcel of land in Lovelock, Nevada. We also lease the right to mine stone and sand at a quarry in Carson City, Nevada. Unlike in Texas and Utah where we acquire aggregates from third-party suppliers, in Nevada, we generally source and produce our own aggregates, either from the Carson City leased quarry or from other sources near job sites where we enter into short-term leases to acquire the aggregates necessary for the job.
In order to complete most contracts, we also lease small parcels of real estate near the site of a contract job site to store materials, locate equipment, and provide offices for the contracting customer, its representatives and our employees.
Item 3. Legal Proceedings.
We are and may in the future be involved as a party to various legal proceedings that are incidental to the ordinary course of business. We regularly analyze current information about these proceedings and, as necessary, provide accruals for probable liabilities on the eventual disposition of these matters.
In the opinion of management, after consultation with legal counsel, there are currently no threatened or pending legal matters that would reasonably be expected in the future to have a material adverse impact on our consolidated results of operations, financial position or cash flows.
|
|
Item 4.
|
Reserved by the Securities and Exchange Commission.
|
Executive Officers of the Registrant
(At March 1, 2011)
The following is a list of the Company's seven executive officers, their ages, positions, offices and the year they became executive officers together with a brief description of their business experience.
|
Name
|
Age
|
Position/Offices
|
Executive Officer Since
|
|
|
Patrick T. Manning (1)
|
65
|
Chairman & Chief Executive Officer
|
2001
|
|
|
Joseph P. Harper, Sr. (1)
|
65
|
President & Chief Operating Officer, Treasurer
|
2001
|
|
|
James H. Allen, Jr.
|
70
|
Chief Financial Officer
|
2007
|
|
|
Anthony F. Colombo
|
50
|
Executive Vice President — Operations
|
2010
|
|
|
Joseph P. Harper, Jr.
|
39
|
Executive Vice President — Finance
|
2010
|
|
|
Brian R. Manning
|
44
|
Executive Vice President & Chief Business Development Officer
|
2010
|
|
|
Roger M. Barzun
|
69
|
Senior Vice President & General Counsel, Secretary
|
2006
|
|
|
(1) Member of the Board of Directors
|
||||
Each executive officer is elected by the Board of Directors and, subject to the terms of his employment agreement with the Company, holds office for such term as the Board of Directors may prescribe or until his death, disqualification, resignation or removal.
Messrs. Manning and Harper have been executive officers of the Company for more than the last five years and have been directors since 2001.
Mr. Allen spent approximately 30 years with Arthur Andersen & Co., including 19 years as an audit and business advisory partner and as head of the firm’s Houston office construction industry practice. After being retired for several years, he became chief financial officer of a process chemical manufacturer and served in that position for over three years prior to joining the Company. Mr. Allen is a certified public accountant.
Messrs. Anthony F. Colombo, Joseph P. Harper, Jr., and Brian R. Manning have been officers of the Company's Texas Sterling Construction Co. subsidiary for more than the last five years. Mr. Manning was elected Vice President Business Development of the Company in March 2006 and Mr. Harper was elected Vice President Finance of the Company in March 2008. Messrs. Colombo, Harper and Manning were elected to their current positions on September 1, 2010.
Mr. Barzun has been an officer of the Company for more than the last five years and also serves as general counsel to other corporations from time to time on a part-time basis. He is a member of the bar of New York and Massachusetts.
PART II
|
|
Item 5.
|
Market for the Registrant’s Common Equity, Related Stockholder Matters and Issuer Purchases of Equity Securities.
|
The Company's common stock is traded on the NASDAQ Global Select Market ("NGS"). The table below shows the market high and low closing sales prices of the common stock for 2009 and 2010 by quarter and for the period from January 1, 2011 through February 28, 2011.
|
High
|
Low
|
|||||||
|
Year Ended December 31, 2009
|
||||||||
|
First Quarter
|
$ | 19.69 | $ | 14.01 | ||||
|
Second Quarter
|
19.88 | 12.59 | ||||||
|
Third Quarter
|
18.25 | 14.48 | ||||||
|
Fourth Quarter
|
19.90 | 15.61 | ||||||
|
Year Ended December 31, 2010
|
||||||||
|
First Quarter
|
21.15 | 15.67 | ||||||
|
Second Quarter
|
17.94 | 12.94 | ||||||
|
Third Quarter
|
13.58 | 10.62 | ||||||
|
Fourth Quarter
|
14.08 | 11.92 | ||||||
|
January 1, 2011 through February 28, 2011
|
13.88 | 12.42 | ||||||
On February 28, 2011, there were 1,126 holders of record of our common stock.
Dividend Policy.
We have never paid any cash dividends on our common stock. For the foreseeable future, we intend to retain any earnings in our business, and we do not anticipate paying any cash dividends. Whether or not we declare any dividends will be at the discretion of the Board of Directors considering then-existing conditions, including the Company's financial condition and results of operations, capital requirements, bonding prospects, contractual restrictions (including those under the Company's Credit Facility) business prospects and other factors that our Board of Directors considers relevant.
Equity Compensation Plan Information.
Certain information about the Company's equity compensation plans is incorporated into Item 11. — Security Ownership of Certain Beneficial Owners and Management and Related Stockholder Matters from the Company's proxy statement for its 2011 Annual Meeting of Stockholders.
Performance Graph.
The following graph compares the percentage change in the Company's cumulative total stockholder return on its common stock for the last five years with the Dow Jones US Index, a broad market index, and the Dow Jones US Heavy Construction Index, a group of companies whose marketing strategy is focused on a limited product line, such as civil construction. Both indices are published in The Wall Street Journal.
The returns are calculated assuming that an investment with a value of $100 was made in the Company's common stock and in each index at the end of 2005 and that all dividends were reinvested in additional shares of common stock; however, the Company has paid no dividends during the periods shown. The graph lines merely connect the measuring dates and do not reflect fluctuations between those dates. The stock performance shown on the graph is not intended to be indicative of future stock performance.
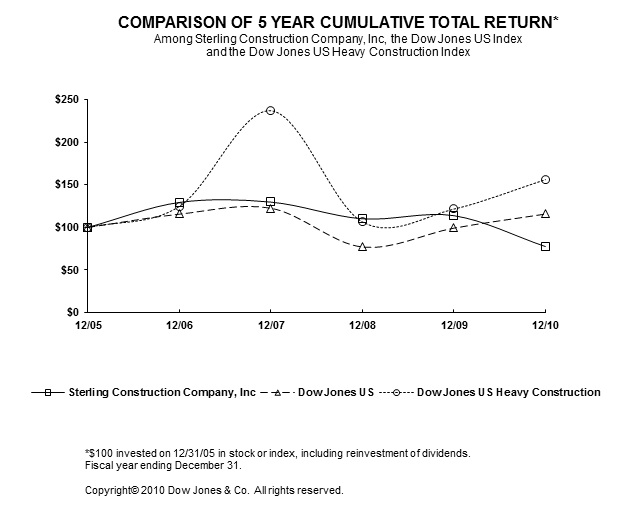
|
December 2005
($)
|
December 2006
($)
|
December 2007
($)
|
December 2008
($)
|
December 2009
($)
|
December 2010
($)
|
|
| Sterling Construction Company, Inc. |
100.00
|
129.29
|
129.65
|
110.10
|
113.73
|
77.48
|
| Dow Jones US |
100.00
|
115.57
|
122.51
|
76.98
|
99.15
|
115.66
|
| Dow Jones US Heavy Construction |
100.00
|
124.74
|
236.96
|
106.34
|
121.55
|
156.07
|
Issuer Purchases of Equity Securities.
During 2010, the Board of Directors authorized the repurchase of up to $10.0 million of the Company’s common stock based upon terms acceptable to management. The specific timing and amount of repurchase will vary based on market conditions, securities law limitations and other factors. No shares were repurchased in 2010.
Item 6. Selected Financial Data
The following table sets forth selected financial and other data of the Company and its subsidiaries and should be read in conjunction with both Item 7. —Management’s Discussion and Analysis of Financial Condition and Results of Operation, which follows, and Item 8. — Financial Statements and Supplementary Data.
|
Years Ended December 31,
|
||||||||||||||||||||
|
2010
|
2009
|
2008
|
2007
|
2006
|
||||||||||||||||
|
(Amount in thousands except per-share data)
|
||||||||||||||||||||
|
Operating Results:
|
||||||||||||||||||||
|
Revenues
|
$ | 459,893 | $ | 390,847 | $ | 415,074 | $ | 306,220 | $ | 249,348 | ||||||||||
|
Income from continuing operations before income taxes and earnings attributable to noncontrolling interests
|
$ | 36,494 | $ | 37,795 | $ | 28,999 | $ | 22,396 | $ | 19,204 | ||||||||||
|
Income tax expense
|
(10,270 | ) | (12,267 | ) | (10,025 | ) | (7,890 | ) | (6,566 | ) | ||||||||||
|
Income from continuing operations
|
26,224 | 25,528 | 18,974 | 14,506 | 12,638 | |||||||||||||||
|
Income from discontinued operations, including gain on sale in 2006
|
-- | -- | -- | -- | 682 | |||||||||||||||
|
Net income
|
26,224 | 25,528 | 18,974 | 14,506 | 13,320 | |||||||||||||||
|
Noncontrolling owners’ interests in earnings of subsidiaries
|
(7,137 | ) | (1,824 | ) | (908 | ) | (62 | ) | -- | |||||||||||
|
Net income attributable to Sterling common stockholders
|
$ | 19,087 | $ | 23,704 | $ | 18,066 | $ | 14,444 | $ | 13,320 | ||||||||||
|
Basic and diluted per share amounts attributable to Sterling common stockholders:
|
||||||||||||||||||||
|
Basic earnings per share from -
|
||||||||||||||||||||
|
Continuing operations
|
$ | 1.15 | $ | 1.77 | $ | 1.38 | $ | 1.31 | $ | 1.19 | ||||||||||
|
Discontinued operations
|
-- | -- | -- | -- | 0.06 | |||||||||||||||
|
Basic earnings per share
|
$ | 1.15 | $ | 1.77 | $ | 1.38 | $ | 1.31 | $ | 1.25 | ||||||||||
|
Basic weighted average shares
|
16,195 | 13,359 | 13,120 | 11,044 | 10,583 | |||||||||||||||
|
Diluted earnings per share from -
|
||||||||||||||||||||
|
Continuing operations
|
$ | 1.13 | $ | 1.71 | $ | 1.32 | $ | 1.22 | $ | 1.08 | ||||||||||
|
Discontinued operations
|
-- | -- | -- | -- | 0.06 | |||||||||||||||
|
Diluted earnings per share
|
$ | 1.13 | $ | 1.71 | $ | 1.32 | $ | 1.22 | $ | 1.14 | ||||||||||
|
Diluted weighted average shares outstanding
|
16,563 | 13,856 | 13,702 | 11,836 | 11,714 | |||||||||||||||
|
Cash dividends declared
|
$ | -- | $ | -- | $ | -- | $ | -- | $ | -- | ||||||||||
|
Balance Sheet:
|
||||||||||||||||||||
|
Total assets
|
$ | 367,131 | $ | 385,741 | $ | 289,615 | $ | 274,515 | $ | 167,772 | ||||||||||
|
Long-term debt
|
$ | 336 | $ | 40,409 | $ | 55,483 | $ | 65,556 | $ | 30,659 | ||||||||||
|
Equity attributable to Sterling common stockholders
|
$ | 250,429 | $ | 230,766 | $ | 159,116 | $ | 138,612 | $ | 90,991 | ||||||||||
|
Book value per share of outstanding common stock attributable to Sterling common stockholders
|
$ | 15.21 | $ | 14.35 | $ | 12.07 | $ | 10.66 | $ | 8.37 | ||||||||||
|
Shares outstanding
|
16,468 | 16,082 | 13,185 | 13,007 | 10,875 | |||||||||||||||
Item 7. Management’s Discussion and Analysis of Financial Condition and Results of Operation.
Overview.
We are a company that operates in one segment, heavy civil construction, through its subsidiaries, which specialize in the building, reconstruction and repair of transportation and water infrastructure primarily in large markets with long-term growth trends in Texas, Utah and Nevada. Transportation infrastructure projects include highways, roads, bridges and light and commuter rail. Water infrastructure projects include water, wastewater and storm drainage systems. Sterling provides general contracting services primarily to public sector clients, including excavating, concrete and asphalt paving, installation of large-diameter water and wastewater distribution systems, construction of bridges and similar large structures, construction of light and commuter rail infrastructure, concrete and asphalt batch plant operations, concrete crushing and aggregate operations. We perform the majority of the work required by our contracts with our own crews and equipment.
Our business was founded in 1955 and has a history of profitable growth, which we have achieved by expanding both our service profile and our market areas. This involves adding services, such as concrete operations, in order to capture a greater percentage of available work in current and potential markets. It also involves strategically expanding operations, either by establishing an office in a new market, often after having successfully bid on and completed a project in that market, or by acquiring a company that gives us an immediate entry into a market. On December 3, 2009, we acquired an 80% interest in Ralph L. Wadsworth Construction Company, LLC ("RLW") and on October 31, 2007, we acquired a 91.67% interest in Road and Highway Builders, LLC ("RHB"), which have primarily performed construction projects in Utah and Nevada, respectively.
Critical Accounting Policies.
Our significant accounting policies are described in Note 1 of Notes to Consolidated Financial Statements for the year ended December 31, 2010, included in this document, and conform to the FASB’s Accounting Standards Codification (or GAAP or ASC).
We operate in one segment and have only one reportable segment and one reporting unit component, heavy civil construction. In making this determination, we considered that each project has similar characteristics, includes similar services and similar types of customers and is subject to similar regulatory and economic environments. We organize, evaluate, and manage our financial information around each project when making operating decisions and assessing overall performance. Even if our local offices were to be considered separate components of our heavy civil construction operating segment, those components could be aggregated into a single reporting unit for purposes of testing goodwill for impairment under ASC 280 and EITF D-101 because our local offices all have similar economic characteristics and are similar in all of the following areas:
|
·
|
The nature of the products and services — each of our local offices perform similar construction projects: they build, reconstruct and repair roads, highways, bridges, light and commuter rail and water, waste water and storm drainage systems.
|
|
·
|
The nature of the production processes — our heavy civil construction services rendered in the construction production process for each of our construction projects performed by each local office is the same: they excavate dirt, remove existing pavement and pipe, lay aggregate or concrete pavement, pipe and rail and build bridges and similar large structures in order to complete our projects.
|
|
·
|
The type or class of customer for products and services — substantially all of our customers are federal and state departments of transportation, cities, counties, and regional water, rail and toll-road authorities. A substantial portion of the funding for the state departments of transportation to finance the projects we construct is furnished by the federal government.
|
|
·
|
The methods used to distribute products or provide services — the heavy civil construction services rendered on our projects are performed primarily with our own field work crews (laborers, equipment operators and supervisors) and equipment (backhoes, loaders, dozers, graders, cranes, pug mills, crushers, and concrete and asphalt plants).
|
|
·
|
The nature of the regulatory environment — we perform substantially all of our projects for federal, state and municipal governmental agencies, and all of the projects that we perform are subject to substantially similar regulation under U.S. and state department of transportation rules, including prevailing wage and hour laws; codes established by the federal government and municipalities regarding water and waste water systems installation; and laws and regulations relating to workplace safety and worker health of the U.S. Occupational Safety and Health Administration and to the employment of immigrants of the U.S. Department of Homeland Security.
|
The economic characteristics of our local offices are similar. While profit margin objectives included in contract bids have some variability from contract to contract, our profit margin objectives are not differentiated by our chief operating decision maker or our office management based on local office location. Instead, the projects undertaken by each local office are primarily competitively-bid, fixed-unit or negotiated lump-sum price contracts, all of which are bid based on achieving gross margin objectives that reflect the relevant skills required, the contract size and duration, the availability of our personnel and equipment, the makeup and level of our existing backlog, our competitive advantages and disadvantages, prior experience, the contracting agency or customer, the source of contract funding, anticipated start and completion dates, construction risks, penalties or incentives and general economic conditions.
Use of Estimates.
The preparation of financial statements in conformity with GAAP requires management to make estimates and assumptions that affect the reported amounts of assets and liabilities and disclosure of contingent assets and liabilities at the date of the financial statements and the reported amounts of revenues and expenses during the reporting period. Our business involves making significant estimates and assumptions in the normal course of business relating to our contracts due to, among other things, different project scopes and specifications, the long-term duration of our contract cycle and the type of contract utilized. Therefore, management believes that “Revenue Recognition” is the most important and critical accounting policy. The most significant estimates with regard to these financial statements relate to the estimating of total forecasted construction contract revenues, costs and profits for each project in accordance with accounting for long-term contracts. Actual results could differ from these estimates and such differences could be material.
Our estimates of contract revenue and cost are highly detailed. We believe, based on our experience, that our current systems of management and accounting controls allow management to produce reliable estimates of total contract revenue and cost for each project during any accounting period. However, many factors can and do change during a contract performance period, which can result in a change to contract profitability from one financial reporting period to another. Some of the factors that can adversely change the estimate of total contract revenue, cost and profit include differing site conditions (to the extent that contract remedies are unavailable), the failure of major material suppliers to deliver on time, the failure of subcontractors to perform as agreed, unusual weather conditions, our failure to achieve expected productivity and efficient use of labor and equipment and the inaccuracies of our original bid estimate. Because we have a large number of projects in process at any given time, these changes in estimates can sometimes offset each other without affecting overall profitability. However, significant changes in cost estimates, particularly on larger, more complex projects, can have a material impact on our financial statements and are reflected in our results of operations when they become known.
When recording revenue from change orders on contracts that have been approved as to scope but not price, we include in revenue an amount equal to the amount that we currently expect to recover from customers in relation to costs incurred by us for changes in contract specifications or designs, or other unanticipated additional costs. Revenue relating to change order claims is recognized only if it is probable that the revenue will be realized. When determining the likelihood of eventual recovery, we consider such factors as evaluation of entitlement, settlements reached to date and our experience with the customer. When new facts become known, an adjustment to the estimated recovery is made and reflected in the current period results.
Revenue Recognition.
The majority of our contracts with our customers are “fixed unit price.” Under such contracts, we are committed to providing materials or services required by a contract at fixed unit prices (for example, dollars per cubic yard of concrete poured or per cubic yard of earth excavated). To minimize increases in the material prices and subcontracting costs used in submitting bids, we obtain firm quotations from our suppliers and subcontractors. After we are advised that our bid is the winning bid, we enter into firm contracts with most of our materials suppliers and sub-contractors, thereby mitigating the risk of future price variations affecting those contract costs. Such quotations do not include any quantity guarantees, and we therefore have no obligation for materials or subcontract services beyond those required to complete the respective contracts that we are awarded for which quotations have been provided. As a result, we have rarely been exposed to material price or availability risk on contracts in our contract backlog. Assuming performance by our suppliers and subcontractors, the principal remaining risks under our fixed price contracts relate to labor and equipment costs and productivity levels. Most of our state and municipal contracts provide for termination of the contract for the convenience of the owner, with provisions to pay us only for work performed through the date of termination.
We use the percentage-of-completion accounting method for construction contracts. Revenue is recognized as costs are incurred in an amount equal to cost plus the related expected profit based on the percentage-of-completion method of accounting in the ratio of costs incurred to estimated final costs. Contract cost consists of direct costs on contracts, including labor, materials, amounts payable to subcontractors and equipment expense (primarily depreciation, fuel, maintenance and repairs). Depreciation is computed using the straight-line method for construction equipment. Contract cost is recorded as incurred, and revisions in contract revenue and cost estimates are reflected in the accounting period when known.
The accuracy of our revenue and profit recognition in a given period is dependent on the accuracy of our estimates of the revenues and costs to finish uncompleted contracts. Our estimates for all of our significant contracts use a highly detailed “bottom up” approach, and we believe our experience allows us to produce reliable estimates. However, our projects can be highly complex, and in almost every case, the profit margin estimates for a contract will either increase or decrease to some extent from the amount that was originally estimated at the time of bid. Because we have a large number of projects of varying levels of size and complexity in process at any given time, these changes in estimates can sometimes offset each other without materially impacting our overall profitability. However, large changes in revenue or cost estimates can have a significant effect on profitability.
There are a number of factors that can contribute to changes in estimates of contract cost and profitability. The most significant of these include the completeness and accuracy of the original bid, recognition of costs associated with scope changes, extended overhead due to customer-related and weather-related delays, subcontractor and supplier performance issues, site conditions that differ from those assumed in the original bid (to the extent contract remedies are unavailable), the availability and skill level of workers in the geographic location of the project and changes in the availability and proximity of materials. The foregoing factors, as well as the stage of completion of contracts in process and the mix of contracts at different margins, may cause fluctuations in gross profit between periods, and these fluctuations may be significant.
Valuation of Long-Lived Assets.
Long-lived assets, which include property, equipment and acquired intangible assets, including goodwill, are reviewed for impairment whenever events or changes in circumstances indicate that the carrying amount of an asset may not be recoverable. Impairment evaluations involve fair values and management estimates of useful asset lives and future cash flows. Actual useful lives and cash flows could be different from those estimated by management, and this could have a material effect on operating results and financial position. At December 31, 2010, we had goodwill with a carrying amount of approximately $114.7 million which must be reviewed for impairment at least annually. We completed our annual impairment review for historical goodwill during the fourth quarter of 2010, and it indicated that there was no impairment in goodwill.
Income Taxes.
Deferred tax assets and liabilities are recognized based on the differences between the financial statement carrying amounts and the tax bases of assets and liabilities. We regularly review our deferred tax assets for recoverability and, where necessary, establish a valuation allowance. We are subject to the alternative minimum tax, or AMT, and payments of AMT result in a reduction of our net deferred tax liability.
Our deferred tax assets related to prior year NOLs for financial statement purposes were fully utilized during 2007. In addition to the utilization of those NOLs, we had available to us the excess tax benefit resulting from exercise of a significant number of non-qualified in-the-money options, which we utilized in the preparation of our 2007 and 2008 federal income tax returns. Accordingly, because we will no longer have offsets provided by the NOLs, a comparison of our future cash flows to our historic cash flows may not be meaningful.
Results of Operations.
Backlog at December 31, 2010.
At December 31, 2010, our backlog of construction projects was $660 million, as compared to $647 million at December 31, 2009. Our Company was awarded or was the apparent low bidder on $473 million of new contracts in 2010, compared to $285 million of new contracts in 2009. Our contracts are typically completed in 12 to 36 months. At December 31, 2010, there was approximately $138 million of our consolidated backlog where we were the apparent low bidder, but had not yet been formally awarded the contract or the contract price had not been finalized. Included in the latter amount is $91 million related to a contract on which we were the low bidder where the customer has deferred award until April 2011 due to funding issues. In February 2011, a joint venture in which the Company has a 45% interest was selected as the best value proposer to design and build a section of highway northeast of Austin, Texas, for a price of $207 million. The Company’s share of this contract of approximately $93 million is not included in the amount of backlog outstanding at December 31, 2010. Historically, subsequent non-awards of low bids or finalization of contract prices have not materially affected our backlog or financial condition. Backlog includes our share of $138 million of estimated revenues related to joint ventures including $94 million where we are a noncontrolling venturer.
During the last quarter of 2008 and throughout the years 2009 and 2010, the bidding environment in our markets has been much more competitive because of the following:
|
·
|
While our business includes only minimal residential and commercial infrastructure work, the severe fall-off in new projects in those markets has resulted in some residential and commercial infrastructure contractors bidding on some public sector transportation and water infrastructure projects, sometimes at bid levels below our break-even pricing, thus increasing competition and creating downward pressure on bid prices in our markets.
|
|
·
|
Traditional competitors on larger transportation and water infrastructure projects also appear to have been bidding at less than normal margins, sometimes at bid levels below our break-even pricing, in order to replenish their reduced backlogs.
|
|
·
|
The entrance of new competitors from other states.
|
These factors have limited our ability to increase our backlog through successful bids for new projects and have compressed the profitability on the new projects where we submitted successful bids. While we have been more aggressive in reducing the anticipated margins we use to bid on some projects, we have not bid at anticipated loss margins in order to obtain new backlog.
Recent reductions in miles driven in the U.S. and more fuel efficient vehicles have reduced federal and state gasoline taxes and tolls collected. In addition, the federal government has not renewed the SAFETEA-LU bill, which provided states with substantial funding for transportation infrastructure projects. Since the SAFETEA-LU bill expired on September 30, 2009, the federal government has been extending financial assistance to the states on an interim basis, most recently through September 30, 2011. Continued deferral of new funding legislation or reductions in federal funding may negatively impact the states’ highway and bridge construction expenditures for their fiscal years 2011 and 2012 (most states’ fiscal years end in the summer). We had anticipated these matters would be resolved by now; however, they have not yet been resolved and we are unable to predict when or on what terms the federal government might renew the SAFETEA-LU bill or enact other similar legislation.
Further, the nationwide decline in home sales, the increase in foreclosures and a prolonged recession have resulted in decreases in property taxes and some other local taxes, which are among the sources of funding for municipal road, bridge and water infrastructure construction. Expenditures by municipalities may also be limited due to federal, state and local funding limitations in the current economic environment.
These and other factors have adversely affected the levels of transportation and water infrastructure capital expenditures in our markets, reducing bidding opportunities to replace backlog and increasing competition for new projects. Assuming that these factors continue to affect infrastructure capital expenditures in our markets in the near term, and taking into account the amount of backlog we had at December 31, 2010 and the lower anticipated margin bid on some projects the Company has recently been awarded and has started work on or expects to start work on in 2011, we currently anticipate that the Company’s net income and diluted earnings per common share of stock attributable to Sterling common stockholders for 2011 will be below the results we achieved for 2010.
We do, however, expect that our markets will ultimately recover from the conditions described above and that our backlog and revenues will grow and gross margins, net income and earnings per share will return to levels more consistent with historical rates of return. However, we cannot predict the timing of such a return to historical normalcy in our markets. We believe that the Company is in a sound financial condition and has the resources and management experience to weather current market conditions and to continue to compete successfully for projects as they become available at acceptable profit margin levels. See “Business — Markets and Customers — Our Markets” for a more detailed discussion of our markets and their funding sources.
Fiscal Year Ended December 31, 2010 Compared with Fiscal Year Ended December 31, 2009.
|
2010
|
2009
|
% Change
|
||||||||||
|
(Dollar amounts in thousands)
|
||||||||||||
|
Revenues
|
$ | 459,893 | $ | 390,847 | 17.7 | % | ||||||
|
Gross profit
|
62,705 | 54,369 | 15.3 | % | ||||||||
|
Gross margin
|
13.6 | % | 13.9 | % | ||||||||
|
General and administrative expenses
|
(24,895 | ) | (14,971 | ) | 66.3 | % | ||||||
|
Unusual items
|
-- | (2,211 | ) |
NM
|
||||||||
|
Other income (expense)
|
(1,900 | ) | (249 | ) | 663.1 | % | ||||||
|
Operating income
|
35,910 | 36,938 | (2.8 | %) | ||||||||
|
Operating margin
|
7.8 | % | 9.5 | % | ||||||||
|
Gain (loss) on the sale of short-term investments
|
(38 | ) | 519 | (107.3 | )% | |||||||
|
Interest income
|
1,809 | 572 | 216.3 | % | ||||||||
|
Interest expense
|
(1,187 | ) | (234 | ) | 407.3 | % | ||||||
|
Income before taxes
|
36,494 | 37,795 | (3.4 | %) | ||||||||
|
Income taxes
|
(10,270 | ) | (12,267 | ) | (16.3 | %) | ||||||
|
Net income
|
26,224 | 25,528 | 2.7 | % | ||||||||
|
Noncontrolling owners’ interests in earnings of subsidiaries and joint ventures
|
(7,137 | ) | (1,824 | ) | 291.3 | % | ||||||
|
Net income attributable to Sterling common stockholders
|
$ | 19,087 | $ | 23,704 | (19.5 | %) | ||||||
|
Contract backlog, end of year
|
$ | 660,000 | $ | 647,000 | 2.3 | % | ||||||
|
NM – not meaningful
|
||||||||||||
Revenues.
Revenues increased 17.7% or $69.0 million in fiscal year 2010 over fiscal year 2009, with most of that increase arising in the fourth quarter of 2010. The increase was due to the inclusion of our Utah operations in the consolidated results of operations for all of 2010, compared to one month in 2009 (these operations were acquired on December 03, 2009). Partially offsetting this increase for the fiscal year 2010 were decreases in revenues of our Texas and Nevada operations due to the market conditions that have continued since 2009 including increased competition and the consequent lower bid prices, lack of visibility on federal highway funding to states, and lower state gasoline and local sales and property taxes, which support infrastructure spending by state, counties and municipalities as more fully explained above under “Backlog at December 31, 2010.”
Gross Profit.
During 2010, we had as many as 80 contracts-in-progress. The nearer a contract progresses toward completion, the more visibility we have in refining our estimate of total revenues (including incentives, delay penalties and change orders), costs and gross profit. Thus gross profit as a percent of revenues can increase or decrease from comparable and sequential years and quarters due to variations among contracts and depending upon which contracts are just commencing or are at a more advanced stage of completion.
The increase in gross profit of $8.3 million for the year 2010 over the year 2009 was due primarily to the inclusion of the gross profit on revenues of our Utah operations and differences in the mix in the stage of completion and gross margins of contracts-in-progress at December 31, 2010 compared to December 31, 2009, including finalization of change orders and revision of total estimated gross profit due to better visibility of revenues and costs on certain projects. The increase in gross profit of our Utah operations was partially offset by lower gross profits of our Texas and Nevada operations as a result of lower revenues and approximately $3.8 million of under absorption of depreciation and other costs related to lower equipment utilization, both due to lower activity in those states. Management believes such equipment will be used when those markets return to a normalized level of activity and consequently believes there is no impairment in the value of such equipment.
Gross profit for the fourth quarter of 2010 of $28.7 million was $21.3 million greater than the comparable 2009 period because of the inclusion of our Utah operations in the consolidation for all three months in fourth quarter of 2010 compared with only one month in the fourth quarter of 2009; better weather in Texas in the fourth quarter of 2010 than 2009; and differences, as discussed above, in the mix in the stage of completion and gross margins of contracts-in-progress at December 31, 2010. See Note 16 to the consolidated financial statements for quarterly results of operations.
Operating Income.
Operating income decreased $1.0 million or 2.8% from 2009 to 2010 for the following reasons. Offsetting the $8.3 million increase in gross profit was an increase in general and administrative expenses and other operating expenses (“G&A”) of $9.4 million in 2010 over 2009. The primary reasons for the increase were: G&A incurred by our Utah operations consolidated for a full year in 2010 as compared to one month in 2009; professional fees associated with the appeal of a lawsuit and strategic and management planning activities; higher information technology expenses; and a write off of certain specialized equipment with a net book value of $1.5 million that we no longer believe will be used on future project awards. Also, during the fourth quarter of 2009, the Company incurred $1.2 million in direct cost of the acquisition of RLW which under GAAP, had to be charged to expense rather than capitalized as part of the acquisition cost. In addition, in January, 2010, a jury awarded $1.0 million to a subcontractor plaintiff against the Company which had been recorded as an expense at December 31, 2009. The Company has appealed the verdict – see Note 13 to the accompanying consolidated financial statements. As a percent of revenues, G&A increased to 5.4% in 2010 versus 4.5% in 2009 due to the reasons discussed above.
Income Taxes.
The decrease in the effective income tax rate to 28.1% in 2010 versus 32.5% in 2009 was due to higher net income attributable to noncontrolling interest owners which is taxed to those owners rather than Sterling and non-taxable interest income.
Net Income Attributable to Noncontrolling Interests.
The net income attributable to noncontrolling owners’ interests in earnings of subsidiaries and joint ventures increased because of increased earnings of those entities in 2010 versus 2009, primarily as a result of the acquisition of our Utah operations in December 2009.
Fiscal Year Ended December 31, 2009 Compared with Fiscal Year Ended December 31, 2008.
|
2009
|
2008
|
% Change
|
||||||||||
|
(Dollar amounts in thousands)
|
||||||||||||
|
Revenues
|
$ | 390,847 | $ | 415,074 | (5.8 | %) | ||||||
|
Gross profit
|
54,369 | 41,972 | 29.5 | % | ||||||||
|
Gross margin
|
13.9 | % | 10.1 | % | ||||||||
|
General and administrative expenses
|
(14,971 | ) | (13,763 | ) | 8.8 | % | ||||||
|
Unusual items
|
(2,211 | ) | -- |
NM
|
||||||||
|
Other income (expense)
|
(249 | ) | (81 | ) | 207.4 | % | ||||||
|
Operating income
|
36,938 | 28,128 | 33.2 | % | ||||||||
|
Operating margin
|
9.5 | % | 6.8 | % | ||||||||
|
Gain (loss) on the sale of short-term investments
|
519 | -- |
NM
|
|||||||||
|
Interest income
|
572 | 1,070 | (46.5 | %) | ||||||||
|
Interest expense
|
(234 | ) | (199 | ) | 17.6 | % | ||||||
|
Income before taxes
|
37,795 | 28,999 | 30.3 | % | ||||||||
|
Income taxes
|
(12,267 | ) | (10,025 | ) | 22.4 | % | ||||||
|
Net income
|
25,528 | 18,974 | 34.5 | % | ||||||||
|
Noncontrolling owners’ interests in earnings of subsidiaries and joint ventures
|
(1,824 | ) | (908 | ) | 100.9 | % | ||||||
|
Net income attributable to Sterling common stockholders
|
$ | 23,704 | $ | 18,066 | 31.2 | % | ||||||
|
Contract backlog, end of year
|
$ | 647,000 | $ | 448,000 | 44.4 | % | ||||||
|
NM – not meaningful
|
||||||||||||
Revenues.
Revenues decreased $24.2 million, or 5.8%, from 2008 to 2009. The decrease was due to the Company winning fewer contracts as a result of an increase in the number of competitors bidding at lower prices in our Texas and Nevada markets for new work bid during 2009 and more days of rain in Texas during the fourth quarter of 2009 than the comparable 2008 period. Further, some of our competitors in those markets appear to have bid at margins which were less than our break-even pricing apparently in order to replenish their backlogs. This trend has continued into 2010. The increase in competitors and consequent lower bid prices are due to the market conditions discussed above under Backlog at December 31, 2010.
Offsetting the decrease in revenues in our Texas and Nevada markets were December 2009 revenues of $10.2 million of our Utah operations which were acquired effective December 3, 2009.
During the last half of 2009, we began to reduce the number of our crews as a result of completing certain projects without replacement contracts in backlog. At December 31, 2009, our employees, excluding 198 people in our Utah operations, totaled 913 versus approximately 1,200 employees at December 31, 2008.
Contracts receivables increased $19.7 million at December 31, 2009 versus December 31, 2008, as a result of the acquisition of the Utah operations offset by the effect of the decrease in revenues in Texas. An increase occurred in accounts payable for the same reasons, but to a lesser extent.
Revenues in the fourth quarter of 2009 were $37.6 million less than those in the comparable quarter of 2008 because of increased competition and adverse weather in Texas and were the lowest revenues we have had in Texas since the first quarter of 2005. The decrease in fourth quarter 2009 revenues was after including revenues for the month of December 2009 of our Utah operations in consolidated revenues.
Gross Profit.
During 2009 and 2008, our Texas and Nevada operations had as many as 60 contracts-in-progress at any one time, of various sizes, of different expected profitability and in various stages of completion. The nearer a contract progresses toward completion, the more visibility we have in refining our estimate of total revenues (including incentives, delay penalties and change orders), costs and gross profit. Thus gross profit as a percent of revenues can increase or decrease from comparable and sequential years and quarters due to variations among contracts and depending upon which contracts are just commencing or are at a more advanced stage of completion. At December 31, 2009, our contracts were on average at a more advanced stage of completion than were those in progress at the comparable 2008 period end.
The increase in gross profit of $12.4 million for the year 2009 over the year 2008 was due primarily to better execution on contracts-in-progress, differences, as discussed above, in the mix in the stage of completion and profitability of contracts in progress at December 31, 2009 compared to December 31, 2008 and one month of gross profit of $2.1 million on the revenues earned by our newly acquired Utah operations.
Gross profit for the fourth quarter of 2009 of $7.4 million was $2.1 million less than the comparable 2008 period because of the lower quarterly revenues and adverse weather in Texas offset by our Utah operation's gross profit. See Note 16 to the Company's consolidated financial statements for unaudited quarterly financial information.
Operating Income.
Operating income increased $8.8 million or 33.2% in 2009 over 2008 as a result of the $12.4 million increase in gross profit which was partially offset by an increase of $3.6 million in general and administrative expenses and other operating expenses (“G&A”) in 2009 as compared to 2008. The primary reasons for the increase were the G&A incurred by our Utah operations for the month of December 2009; $1.2 million in direct cost of the acquisition of RLW which under GAAP, effective January 1, 2009, had to be charged to expense rather than capitalized as part of the acquisition cost; and in January, 2010, a jury awarded $1.0 million to a subcontractor plaintiff against the Company which was recorded as an expense at December 31, 2009. The Company has appealed the verdict – see Note 13 to the accompanying consolidated financial statements. As a percent of revenues, G&A was 4.5% in 2009 versus 3.3% in 2008. The higher level of G&A as a percent of revenues in 2009 vs. 2008 was due to the impact of the decrease in revenues in 2009 (as G&A does not vary directly with the volume of work performed on contracts), the acquisition cost and the provision for loss on the lawsuit.
Income Taxes.
The decrease in the effective income tax rate of 32.5% in 2009 versus 34.6% in 2008 was due to higher net income attributable to noncontrolling interest owners which are taxed to those owners rather than Sterling and higher domestic production activities deduction in 2009 than 2008.
Net Income Attributable to Noncontrolling Interests.
The net income attributable to noncontrolling interest owners increased because of increased earnings in 2009 in Nevada versus 2008 and the acquisition of our Utah operations in December 2009.
Historical Cash Flows.
The following table sets forth information about our cash flows for the years ended December 31, 2008, through 2010.
| Year ended December 31, | ||||||||||||
| 2010 | 2009 | 2008 | ||||||||||
| (Amounts in thousands) | ||||||||||||
|
Cash and cash equivalents (at end of period)
|
$ | 49,441 | $ | 54,406 | $ | 55,305 | ||||||
|
Net cash provided by (used in):
|
||||||||||||
|
Operating activities
|
47,073 | 47,346 | 26,721 | |||||||||
|
Investing activities
|
(8,856 | ) | (79,730 | ) | (42,719 | ) | ||||||
|
Financing activities
|
(43,182 | ) | 31,485 | (9,346 | ) | |||||||
|
Supplementary information:
|
||||||||||||
|
Capital expenditures
|
13,409 | 5,277 | 19,896 | |||||||||
|
Working capital (at end of period)
|
107,278 | 113,878 | 95,123 | |||||||||
Operating Activities.
Significant non-cash items included in operating activities are:
|
·
|
depreciation and amortization (which for 2010 totaled $15.8 million) increased $2.0 million from 2009 which had increased $0.6 million from 2008 as a result of capital expenditures of $13.4 million in 2010 and $5.3 million in 2009 and a full year's depreciation in 2010 on equipment purchased in the RLW acquisition in December 2009;
|
|
·
|
deferred tax expense was $3.9 million, $4.5 million and $8.9 million in 2010, 2009 and 2008, respectively, mainly attributable to accelerated depreciation methods used on equipment for tax purposes and amortization for tax return purposes of goodwill arising in the acquisition of RHB and RLW.
|
Besides net income of $26.2 million in 2010 and the non-cash items discussed above, other significant components of cash flows from operations were:
|
·
|
contracts receivable decreased by $10.0 million in the current year and $15.1 million in 2009 versus an increase of $6.2 million in 2008 due to the reductions in revenues in Texas and Nevada during 2010 and 2009 versus 2008;
|
|
·
|
the increase in cost and estimated earnings in excess of billings on uncompleted contracts of $4.1 million for 2010, versus a decrease of $3.8 million for 2009, was due to an increase in the volume of materials purchased for certain projects at December 31, 2010, but not billed to the customer until 2011 and the timing of other billings;
|
|
·
|
the increase in receivables from and the equity in construction joint ventures of $4.4 million for 2010 to $6.7 million at December 31, 2010 versus a balance of $2.3 million at December 31, 2009. This increase resulted from increased activity in 2010 by joint ventures of our Utah operations.
|
|
·
|
accounts payable increased by $2.3 million in 2010 as compared to a decrease of $11.2 million in 2009. The decrease in 2009 was due to lower project activity during the fourth quarter of 2009;
|
|
·
|
billings in excess of costs and estimated earnings on uncompleted contracts decreased by $13.3 million in 2010 as compared to a decrease of $3.6 million in 2009 due to a reduction in advance billings.
|
Investing Activities.
Expenditures for the replacement of certain equipment and to expand our construction fleet totaled $13.4 million in 2010 as compared to $5.3 million in 2009, and $19.9 million in 2008 respectively. Capital equipment is acquired as needed to support work crews required by increased backlog and to replace retiring equipment. The increase in 2010 was primarily due to purchases of additional equipment to perform our responsibilities on a large joint venture project in Utah. The decreases in capital expenditures in 2008 and 2009 were principally due to management's cautious view regarding certain of the Company's markets in 2009 and 2010, due to economic uncertainties. Management expects capital expenditures in 2011 to be higher than 2010 as a result of normal replacement of equipment, which replacement was deferred in 2009 and 2010; additional equipment required by the Utah joint venture project and a recent low bid on a large job in Texas; and shop and office facilities to be acquired by two of our offices in Texas.
During the twelve months ended December 31, 2010, 2009 and 2008, the Company had net sales of short-term securities of $2.9 million and net purchases of $14.0 million in 2009 and $24.3 million in 2008. The purchases were primarily due to cash generated by operations, after repayment of indebtedness, and invested in such securities. The reduction of short-term securities in 2010 was due to repayment of debt.
In December 2009, we purchased an 80.0% equity interest in RLW for a net cash purchase price of $60.5 million, net of cash acquired, in order to expand our construction operations to Utah.
Financing Activities.
Financing activities in 2010, 2009 and 2008 primarily reflect a reduction of $40.0 million, $15.0 million and $10.0 million, respectively, in borrowings under our $75.0 million Credit Facility. The amount of borrowings under the Credit Facility is based on the Company's expectations of working capital requirements.
Additionally, the Company sold 2.76 million shares of common stock in 2009 for net proceeds of $46.8 million.
Liquidity.
The level of working capital for our construction business varies due to fluctuations in:
|
·
|
customer receivables and contract retentions;
|
|
·
|
costs and estimated earnings in excess of billings;
|
|
·
|
billings in excess of costs and estimated earnings;
|
|
·
|
investments in our unconsolidated construction joint ventures;
|
|
·
|
the size and status of contract mobilization payments and progress billings; and
|
|
·
|
the amounts owed to suppliers and subcontractors.
|
Some of these fluctuations can be significant.
As of December 31, 2010, we had working capital of $107.3 million, a decrease of $6.6 million over December 31, 2009. The decrease in working capital was the result of the following (in thousands):
|
Net income
|
$ | 26,224 | ||
|
Depreciation and amortization
|
15,770 | |||
|
Deferred tax expense
|
3,860 | |||
|
Capital expenditures
|
(13,409 | ) | ||
|
Debt repayment, net of drawdowns
|
(40,000 | ) | ||
|
Dividends paid to noncontrolling interests owners
|
(4,160 | ) | ||
|
Other
|
5,115 | |||
|
Total decrease in working capital
|
$ | (6,600 | ) |
The Company believes that it has sufficient liquid financial resources, including availability under its Credit Facility of $73.3 million at December 31, 2010, to fund its requirements for the next twelve months of operations, including its bonding requirements, and the Company expects no material adverse change in its liquidity. Future developments or events, such as an increase in our level of purchases of equipment to support significantly higher backlog or an acquisition of another company could, however, affect our level of working capital.
Sources of Capital.
In addition to our available cash and cash equivalents, short term investments balances and cash provided by operations, we use borrowings under our Credit Facility with Comerica Bank to finance our capital expenditures and working capital needs.
We have a $75.0 million Credit Facility with a bank syndicate for which Comerica Bank is a participant and agent. The Credit Facility entered into on October 31, 2007, has a maturity date of October 31, 2012, and is secured by all assets of the Company, other than proceeds and other rights under our construction contracts which are pledged to our bond surety. Borrowings under the Credit Facility are used to finance working capital. At December 31, 2010, there were no borrowings outstanding under the Credit Facility; however, there was a letter of credit of $1.7 million outstanding under the Credit Facility, which reduces availability under the Credit Facility. Availability under the Credit Facility was, therefore, $73.3 million without violating any of the financial covenants discussed in the next paragraph.
Average month-end borrowings under the Credit Facility for the fiscal year 2010 were $4.6 million and the largest amount of end-of-month borrowings under the Credit Facility was $30 million on March 31, 2010.
The Credit Facility is subject to our compliance with certain covenants, including financial covenants at quarter-end relating to fixed charges, leverage, tangible net worth, asset coverage and consolidated net losses. The Credit Facility contains restrictions on our ability to:
|
·
|
Make distributions or pay dividends;
|
|
·
|
Incur liens and encumbrances;
|
|
·
|
Incur further indebtedness;
|
|
·
|
Guarantee obligations;
|
|
·
|
Dispose of a material portion of assets or merge with a third party;
|
|
·
|
Incur negative income for two consecutive quarters.
|
|
·
|
Make investments in securities.
|
To date the Company has not experienced any difficulty in borrowing under our credit agreement or any material change in its terms, and the Company was in compliance with all covenants under the Credit Facility as of December 31, 2010.
The financial markets have experienced substantial volatility as a result of disruptions in the credit markets and the recession. However, to date we have not experienced any difficulty in borrowing under our Credit Facility or any change in its terms.
Management believes that the Credit Facility will provide adequate funding for the Company’s working capital, debt service and capital expenditure requirements, including seasonal fluctuations at least through December 31, 2011.
The unpaid principal balance of each prime-based loan bears interest at a variable rate equal to Comerica’s prime rate plus an amount ranging from 0% to 0.50% depending on the “pricing leverage ratio” that we achieve. If we achieve a pricing leverage ratio of (a) less than 1.00 to 1.00; (b) equal to or greater than 1.00 to 1.00 but less than 1.75 to 1.00; or (c) greater than or equal to 1.75 to 1.00, then the applicable prime margins will be 0.0%, 0.25% or 0.50%, respectively. The interest rate on funds borrowed under this revolver during the year ended December 31, 2010 was 3.25% at all times that the Company had debt outstanding under this facility.
At our election, the loans under the new Credit Facility bear interest at either a LIBOR-based interest rate or a prime-based interest rate. The prime based interest rate option plus the applicable prime based margin can be no less than the Daily Adjusting Libor plus 1.00%, or Federal Funds Rate plus 1.00%. The unpaid principal balance of each LIBOR-based loan bears interest at a variable rate equal to LIBOR plus an amount ranging from 1.25% to 2.25% depending on the pricing leverage ratio that we achieve. The “pricing leverage ratio” is determined by the ratio of our average total debt, less cash and cash equivalents, to earnings before interest, taxes, depreciation and amortization ("EBITDA") that we achieve on a rolling four-quarter basis. The pricing leverage ratio is measured quarterly. If we achieve a pricing leverage ratio of (a) less than 1.00 to 1.00; (b) equal to or greater than 1.00 to 1.00 but less than 1.75 to 1.00; or (c) greater than or equal to 1.75 to 1.00, then the applicable LIBOR margins will be 1.25%, 1.75% or 2.25%, respectively, and the applicable prime based margins will be 0.00%, 0.25% and 0.50%, respectively. Interest on LIBOR-based loans is payable at the end of the relevant LIBOR interest period, which must be one, two, three or six months.
Mortgage.
In 2001 we completed the construction of a new headquarters building on land owned by us adjacent to our equipment repair facility in Houston. The building was financed principally through an additional mortgage of $1.1 million on the land and facilities at a floating interest rate which at December 31, 2010 was 3.5% per annum, repayable over 15 years.
Contractual Obligations.
The following table sets forth our fixed, non-cancelable obligations at December 31, 2010:
|
|
Payments due by Period
|
|||||||||||||||||||
|
Total
|
< 1 Year
|
1-3 Years
|
4-5 Years
|
> 5 Years
|
||||||||||||||||
|
(Amounts in thousands)
|
||||||||||||||||||||
|
Credit Facility
|
$ | -- | $ | -- | $ | -- | $ | -- | $ | -- | ||||||||||
|
Operating leases
|
6,525 | 1,048 | 1,457 | 908 | 3,112 | |||||||||||||||
|
Mortgage
|
409 | 73 | 219 | 117 | -- | |||||||||||||||
| $ | 6,934 | $ | 1,121 | $ | 1,676 | $ | 1,025 | $ | 3,112 | |||||||||||
Our obligations for interest are not included in the table above as these amounts vary according to the levels of debt outstanding at any time. Interest on our Credit Facility is paid monthly and fluctuates with the balances outstanding during the year, as well as with fluctuations in interest rates. In 2010 interest on the Credit Facility was approximately $8,000. The mortgages are expected to have future annual interest expense payments of approximately $16,000 in less than one year, $24,000 in one to three years, and $3,000 in four to five years.
In addition to the contractual obligations set forth above, the noncontrolling interest owners of two of our subsidiaries have the right to require the Company to buy their interest in those subsidiaries in 2011 and 2013. At December 31, 2010, the estimated put liability and undistributed 2010 earnings attributable to those noncontrolling interest owners was approximately $28.7 million. See Note 12 to the accompanying consolidated financial statements.
To manage risks of changes in the material prices and subcontracting costs used in submitting bids for construction contracts, we generally obtain firm quotations from our suppliers and subcontractors before submitting a bid. These quotations do not include any quantity guarantees, and we have no obligation for materials or subcontract services beyond those required to complete the contracts that we are awarded for which quotations have been provided.
As is customary in the construction business, we are required to provide surety bonds to secure our performance under construction contracts. Our ability to obtain surety bonds primarily depends upon our capitalization, working capital, past performance, management expertise and reputation and certain external factors, including the overall capacity of the surety market. Surety companies consider such factors in relationship to the amount of our backlog and their underwriting standards, which may change from time to time. We have pledged all proceeds and other rights under our construction contracts to our bond surety company. Events that affect the insurance and bonding markets may result in bonding becoming more difficult to obtain in the future, or being available only at a significantly greater cost. To date, we have not encountered difficulties or material cost increases in obtaining new surety bonds.
Capital Expenditures.
Our capital expenditures during 2010 were $13.4 million, and during 2009 were $5.3 million. The increase in 2010 from the 2009 level was due in part to purchases of additional equipment to perform our contracts, including a large joint venture in Utah. In 2011, we expect our capital additions to be higher than 2010 due to normal replacement of equipment which replacement was deferred in 2009 and 2010; additional equipment that will be required by the Utah operations to perform its responsibilities on the joint venture project and a recent low bid on a large job in Texas; and shop and office facilities to be acquired by two of our offices in Texas.
Inflation.
Until 2008, inflation had not had a material impact on our financial results; however, that year's increases in oil and fuel prices affected our cost of operations. While the prices we have paid for oil and fuel and, generally, for other materials have decreased, we have over the last several months seen the prices of oil and fuel rise once again and seen increases in steel prices. Anticipated cost increases and reductions are considered in our bids to customers on proposed new construction projects.
Where we are the successful bidder on a project, we execute purchase orders with material suppliers and contracts with subcontractors covering the prices of most materials and services, other than oil and fuel products, thereby mitigating future price increases and supply disruptions. These purchase orders and contracts do not contain quantity guarantees and we have no obligation for materials and services beyond those required to complete the contracts with our customers. There can be no assurance that oil and fuel used in our business will be adequately covered by the estimated escalation we have included in our bids or that all of our vendors will fulfill their pricing and supply commitments under their purchase orders and contracts with the Company. We adjust our total estimated costs on our projects when we believe it is probable that we will have cost increases which will not be recovered from customers, vendors or re-engineering.
Off-Balance Sheet Arrangements and Joint Ventures.
We participate in various construction joint venture partnerships in order to share expertise, risk and resources for certain highly complex projects. The venture's contract with the project owner typically requires joint and several liability among the joint venture partners. Although our agreements with our joint venture partners for construction joint ventures provide that each party will assume and fund its share of any losses resulting from a project, if one of our partners was unable to pay its share, we would be fully liable under our contract with the project owner. Circumstances that could lead to a loss under these guarantee arrangements include a partner's inability to contribute additional funds to the venture in the event that the project incurred a loss or additional costs that we could incur should the partner fail to provide the services and resources toward project completion that had been committed to in the joint venture agreement.
At December 31, 2010, there was approximately $750.4 million of construction work to be completed on unconsolidated construction joint venture contracts of which $94.0 million represented our proportionate share. Due to the joint and several liability under our joint venture arrangements, if one of our joint venture partners fails to perform, we and the remaining joint venture partners, would be responsible for completion of the outstanding work. As of December 31, 2010, we are not aware of situations that would require us to fulfill responsibilities of our joint venture partners pursuant to the joint and several liability under our contracts.
The only other off-balance sheet arrangements are related to the operating leases included in the table in "Contractual Obligations" above.
New Accounting Pronouncements.
In January 2010, the FASB issued “Fair Value Measurements and Disclosure (Topic 820)” regarding the disclosure requirements of existing U.S. GAAP related to fair value measurements. This standard requires additional disclosures about recurring and non-recurring fair value measurements. These disclosure requirements are effective for interim and annual reporting periods beginning after December 15, 2009, except for disclosures about purchases, sales, issuances and settlements in the roll forward of activity in Level 3 fair value measurements for which disclosure becomes effective for fiscal years beginning after December 15, 2010, and for interim periods within those fiscal years. This standard did not impact our financial position, results of operations and cash flows for the 2010 fiscal year.
|
Item 7A.
|
Quantitative and Qualitative Disclosures About Market Risk.
|
Changes in interest rates are one of our sources of market risk. Outstanding indebtedness under our Credit Facility bears interest at floating rates. Based on the average debt under our Credit Facility and Mortgage outstanding during 2010, we estimate that an increase of 1.0% in the interest rate would have resulted in an increase in our interest expense of approximately $2,000 in 2010.
To manage risks of changes in material prices and subcontracting costs used in tendering bids for construction contracts, we obtain firm price quotations from our suppliers, except for fuel, and subcontractors before submitting a bid. These quotations do not include any quantity guarantees, and we have no obligation for materials or subcontract services beyond those required to complete the respective contracts that we are awarded for which quotations have been provided.
During 2009, we commenced a strategy of investing in certain securities, the assets of which are a crude oil commodity pool. We believed that the gains and losses on these securities would tend to offset increases and decreases in the price we paid for diesel and gasoline fuel and reduce the volatility of such fuel costs in our operations. For the year ended December 31, 2010, the Company had a pre-tax realized loss of $264,000 on these securities and an unrealized pre-tax loss of $23,000. Subsequent to December 31, 2010, we sold our position in these securities resulting in a realized pre-tax loss of $236,000.
We are reviewing the use of financial futures contracts to further manage price risks of fuel. At this time, we have no such financial contracts in place.
|
Item 8.
|
Financial Statements and Supplementary Data.
|
Financial statements start on page 41.
|
Item 9.
|
Changes in and Disagreements with Accountants on Accounting and Financial Disclosure.
|
|
|
None
|
|
Item 9A.
|
Controls and Procedures.
|
Evaluation of Disclosure Controls and Procedures.
Disclosure controls and procedures include, without limitation, controls and procedures designed to ensure that information required to be disclosed by an issuer in the reports that it files or submits under the Securities Exchange Act of 1934 is accumulated and communicated to the issuer’s management, including the principal executive and principal financial officers, or persons performing similar functions, as appropriate to allow timely decisions regarding required disclosure.
The Company’s principal executive officer and principal financial officer reviewed and evaluated the Company’s disclosure controls and procedures (as defined in Rules 13a-15(e) and 15d-15(e) under the Securities Exchange Act of 1934). Based on that evaluation, the Company’s principal executive officer and principal financial officer concluded that the Company’s disclosure controls and procedures were effective at December 31, 2010 to ensure that the information required to be disclosed by the Company in this Annual Report on Form 10-K is recorded, processed, summarized and reported within the time periods specified in the Securities and Exchange Commission’s rules and forms and is accumulated and communicated to the Company's management including the principal executive and principal financial officers, as appropriate to allow timely decisions regarding required disclosure.
Management’s Report on Internal Control over Financial Reporting.
The Company’s management is responsible for establishing and maintaining adequate internal control over financial reporting (as defined in Rule 13a-15(f)) under the Securities Exchange Act of 1934). Under the supervision and with the participation of the Company’s management, including the principal executive officer and principal financial officer, the Company conducted an evaluation of the effectiveness of internal control over financial reporting at December 31, 2010. In making this assessment, management used the criteria set forth by the Committee of Sponsoring Organizations of the Treadway Commission (COSO) in Internal Control-Integrated Framework. The Company’s management has concluded that, at December 31, 2010, internal control over financial reporting is effective based on these criteria.
Grant Thornton LLP, the independent registered public accounting firm who audited the consolidated financial statements included in this Annual Report, has issued a report on our internal control over financial reporting dated March 16, 2011, also included in this Annual Report and expressed an unqualified opinion on the effectiveness of our internal control over financial reporting as of December 31, 2010.
Changes in Internal Control over Financial Reporting.
We maintain a system of internal control over financial reporting that is designed to provide reasonable assurance regarding the reliability of financial reporting and the preparation of financial statements for external purposes in accordance with accounting principles generally accepted in the United States. Based on the most recent evaluation, we have concluded that no significant changes in our internal control over financial reporting occurred during the last fiscal quarter that have materially affected or are reasonably likely to materially affect, our internal control over financial reporting.
Inherent Limitations on Effectiveness of Controls.
Internal control over financial reporting may not prevent or detect all errors and all fraud. Also, projections of any evaluation of effectiveness of internal control to future periods are subject to the risk that controls may become inadequate because of changes in conditions, or that the degree of compliance with the policies or procedures may deteriorate.
|
Item 9B.
|
Other Information.
|
None.
|
|
PART III
|
|
Item 10.
|
Directors, Executive Officers and Corporate Governance.
|
The information required in this item is contained in the Company’s proxy statement for its Annual Meeting of Stockholders to be held on May 6, 2011 and is incorporated herein by reference. The information can be found under the following headings in the proxy statement:
|
Item 10 Information
|
Location/Heading in the Proxy Statement
|
|
|
Directors
|
Election of Directors (Proposal 1)
|
|
|
Compliance With Section 16(a) of the Exchange Act
|
Stock Ownership Information
|
|
|
Code of Ethics
|
The Corporate Governance & Nominating Committee
|
|
|
Communication with the Board; nominations; Board and committee meetings; committees of the Board; Board leadership and risk oversight; and director compensation.
|
Board Operations
|
Information relating to the Company's executive officers is set forth at the end of Part I of this report under the caption "Executive Officers of the Registrant" and is incorporated herein by reference.
|
Item 11.
|
Executive Compensation
|
The information required in this item is contained in the Company's proxy statement for its Annual Meeting of Stockholders to be held on May 6, 2011 and is incorporated herein by reference. The information can be found under the heading Executive Compensation in the proxy statement.
|
Item 12.
|
Security Ownership of Certain Beneficial Owners and Management, and Related Stockholder Matters.
|
The information required in this item is contained in the Company's proxy statement for its Annual Meeting of Stockholders to be held on May 6, 2011 and is incorporated herein by reference.
Equity Compensation Plan Information can be found in the proxy statement under the heading Executive Compensation.
Information regarding the ownership of the Company's common stock can be found in the proxy statement under the heading Stock Ownership Information.
|
Item 13.
|
Certain Relationships and Related Transactions, and Director Independence.
|
The information required in this item is contained in the Company's proxy statement for its Annual Meeting of Stockholders to be held on May 6, 2011 and is incorporated herein by reference.
Information regarding any relationships between directors and officers and the Company can be found in the proxy statement under the heading Business Relationships with Directors and Officers.
Information about director independence can be found in the proxy statement under the heading Election of Directors (Proposal 1).
Item 14. Principal Accountant Fees and Services.
The information required in this item is contained in the Company's proxy statement for its Annual Meeting of Stockholders to be held on May 6, 2011 and is incorporated herein by reference. The information can be found in the proxy statement under the heading Information about Audit Fees and Audit Services.
37
PART IV
|
Item 15.
|
Exhibits and Financial Statement Schedules.
|
|
|
The following Financial Statements and Financial Statement Schedules are filed with this Report:
|
Financial Statements:
Reports of the Company's Independent Registered Public Accounting Firm
Consolidated Balance Sheets at December 31, 2010 and 2009
Consolidated Statements of Operations for the fiscal years ended December 31, 2010, 2009 and 2008
Consolidated Statements of Stockholders' Equity for the fiscal years ended December 31, 2010, 2009 and 2008
Consolidated Statements of Comprehensive Income for the fiscal years ended December 31, 2010, 2009 and
2008 Consolidated Statements of Cash Flows for the fiscal years ended December 31, 2010, 2009 and 2008
Financial Statement Schedules.
None.
Exhibits.
The following exhibits are filed with this Report:
Explanatory Note
Prior to changing its name to Sterling Construction Company, Inc. in November 2001, the Company had the following names during the following periods:
|
Hallwood Holdings Incorporated
|
May 1991 to July 1993
|
|
Oakhurst Capital, Inc.
|
July 1993 to April 1995
|
|
Oakhurst Company, Inc.
|
April 1995 to November 2001
|
References in the following exhibit list use the name of the Company in effect at the date of the exhibit.
|
Number
|
Exhibit Title
|
|
2.1
|
Purchase Agreement by and among Richard H. Buenting, Fisher Sand & Gravel Co., Thomas Fisher and Sterling Construction Company, Inc. dated as of October 31, 2007 (incorporated by reference to Exhibit number 2.1 to Sterling Construction Company, Inc.'s Current Report on Form 8-K, Amendment No. 1 filed on November 21, 2007 (SEC File No. 1-31993)).
|
|
2.2
|
Purchase Agreement, dated as of December 3, 2009, by and among Kip Wadsworth, Ty Wadsworth, Con Wadsworth, Tod Wadsworth and Sterling Construction Company, Inc. (incorporated by reference to Exhibit 2.1 to Sterling Construction Company, Inc.'s Current Report on Form 8 K, filed on December 3, 2009 (SEC File No. 1-31993))
|
|
3.1
|
Certificate of Incorporation of Sterling Construction Company, Inc. (incorporated by reference to Exhibit 3.0 to Sterling Construction Company, Inc.'s Quarterly Report on Form 10-Q, filed on August 10, 2009 (SEC File No. 1-31993)).
|
|
3.2
|
Bylaws of Sterling Construction Company, Inc. as amended through March 13, 2008 (incorporated by reference to Exhibit 3.1 to Sterling Construction Company, Inc.'s Current Report on Form 8-K, filed on March 19, 2008 (SEC File No. 1-31993)).
|
|
4.1
|
Form of Common Stock Certificate of Sterling Construction Company, Inc. (incorporated by reference to Exhibit 4.5 to its Form 8-A, filed on January 11, 2006 (SEC File No. 1-31993)).
|
|
10.1#
|
Oakhurst Company, Inc. 2001 Stock Incentive Plan (incorporated by reference to Exhibit 10.6 to Sterling Construction Company, Inc.'s Registration Statement on Form S-1, filed on November 17, 2005 (SEC File No. 333-129780)).
|
|
10.2#
|
Forms of Stock Option Agreement under the Oakhurst Company, Inc. 2001 Stock Incentive Plan (incorporated by reference to Exhibit 10.51 to Sterling Construction Company, Inc.'s Annual Report on Form 10-K for the year ended December 31, 2004, filed on March 29, 2005 (SEC File No. 1-31993)).
|
|
10.3#
|
Summary of the Compensation Plan for Non-Employee Directors of Sterling Construction Company, Inc. (incorporated by reference to Exhibit 10.1 to Sterling Construction Company, Inc.'s Quarterly Report on Form 10-Q, filed on August 11, 2008 (SEC File No. 1-31993)).
|
|
10.4
|
Credit Agreement by and among Sterling Construction Company, Inc., Texas Sterling Construction Co., Oakhurst Management Corporation and Comerica Bank and the other lenders from time to time party thereto, and Comerica Bank as administrative agent for the lenders, dated as of October 31, 2007 (incorporated by reference to Exhibit 10.1 to Sterling Construction Company, Inc.'s Current Report on Form 8-K, Amendment No. 1 filed on November 21, 2007 (SEC File No. 1-31993)).
|
|
10.5
|
Security Agreement by and among Sterling Construction Company, Inc., Texas Sterling Construction Co., Oakhurst Management Corporation and Comerica Bank as administrative agent for the lenders, dated as of October 31, 2007 (incorporated by reference to Exhibit 10.4 to Sterling Construction Company, Inc.'s Quarterly Report on Form 10-Q, filed on November 9, 2009 (SEC File No. 1-31993)).
|
|
10.6
|
Joinder Agreement by Road and Highway Builders, LLC and Road and Highway Builders Inc. dated as of October 31, 2007 (incorporated by reference to Exhibit 10.3 to Sterling Construction Company, Inc.'s Current Report on Form 8-K, Amendment No. 1 filed on November 21, 2007 (SEC File No. 1-31993)).
|
|
10.7#
|
Employment Agreement dated as of July 19, 2007 between Sterling Construction Company, Inc. and Patrick T. Manning (incorporated by reference to Exhibit 10.1 to Sterling Construction Company, Inc.'s Current Report on Form 8-K filed on January 17, 2008 (SEC File No. 1-31993))
|
|
10.8#
|
Employment Agreement dated as of July 19, 2007 between Sterling Construction Company, Inc. and Joseph P. Harper, Sr. (incorporated by reference to Exhibit 10.2 to Sterling Construction Company, Inc.'s Current Report on Form 8-K filed on January 17, 2008 (SEC File No. 1-31993))
|
|
10.09#
|
Employment Agreement dated as of July 16, 2007 between Sterling Construction Company, Inc. and James H. Allen, Jr. (incorporated by reference to Exhibit 10.3 to Sterling Construction Company, Inc.'s Current Report on Form 8-K filed on January 17, 2008 (SEC File No. 1-31993))
|
|
10.10#
|
Option Agreement dated August 7, 2007 between Sterling Construction Company, Inc. and James H. Allen, Jr. (incorporated by reference to Exhibit 10.4 to Sterling Construction Company, Inc.'s Current Report on Form 8-K filed on January 17, 2008 (SEC File No. 1-31993))
|
|
10.11#
|
Employment Agreement dated as of March 17, 2006 between Sterling Construction Company, Inc. and Roger M. Barzun (incorporated by reference to Exhibit 10.11 to Sterling Construction Company, Inc.'s Annual Report on Form 10-K for the year ended December 31, 2009, filed on March 15, 2010 (SEC File No. 1-31993)).
|
|
10.12#
|
Employment Agreement dated as of December 3, 2009 between Ralph L. Wadsworth and Kip L. Wadsworth Barzun (incorporated by reference to Exhibit 10.11 to Sterling Construction Company, Inc.'s Annual Report on Form 10-K for the year ended December 31, 2009, filed on March 15, 2010 (SEC File No. 1-31993)).
|
|
Employment Agreement dated as of July 19, 2007 between Sterling Construction Company, Inc. and Anthony F. Colombo.
|
|
|
Employment Agreement dated as of July 19, 2007 between Sterling Construction Company, Inc. and Joseph P. Harper, Jr.
|
|
|
Employment Agreement dated as of July 19, 2007 between Sterling Construction Company, Inc. and Brian R. Manning.
|
|
|
21
|
Subsidiaries of Sterling Construction Company, Inc.:
Name State of Incorporation or Organization
Texas Sterling Construction Co. Delaware
Road and Highway Builders, LLC Nevada
Road and Highway Builders Inc. Nevada
Road and Highway Builders of California, Inc. California
Ralph L. Wadsworth Construction Company, LLC Utah
Ralph L. Wadsworth Construction Co. LP California
|
|
Consent of Grant Thornton LLP
|
|
|
Certification of Patrick T. Manning, Chief Executive Officer of Sterling Construction Company, Inc.
|
|
|
Certification of James H. Allen, Jr., Chief Financial Officer of Sterling Construction Company, Inc.
|
|
|
Certification pursuant to Section 1350 of Chapter 63 of Title 18 of the United States Code (18 U.S.C. 1350) of Patrick T. Manning, Chief Executive Officer, and James H. Allen, Jr., Chief Financial Officer.
|
|
|
# Management contract or compensatory plan or arrangement.
|
* Filed herewith.
39
|
|
Signatures
|
Pursuant to the requirements of Section 13 or 15(d) of the Securities Exchange Act of 1934, the registrant has duly caused this report to be signed on its behalf by the undersigned, thereunto duly authorized.
Sterling Construction Company, Inc.
Date: March 16, 2011 By: /s/ Patrick T. Manning
Patrick T. Manning, Chief Executive Officer
(duly authorized officer)
Pursuant to the requirements of the Securities Exchange Act of 1934, this report has been signed below by the following persons on behalf of the registrant and in the capacities and on the dates indicated.
|
Signature
|
Title
|
Date
|
|
/s/ Patrick T. Manning
Patrick T. Manning
|
Chairman of the Board of Directors; Chief Executive Officer (principal executive officer)
|
March 16, 2011
|
|
/s/ Joseph P. Harper, Sr.
Joseph P. Harper, Sr.
|
President, Treasurer & Chief Operating Officer; Director
|
March 16, 2011
|
|
/s/James H. Allen, Jr.
James H. Allen, Jr.
|
Chief Financial Officer (principal financial officer and principal accounting officer)
|
March 16, 2011
|
|
/s/ John D. Abernathy
John D. Abernathy
|
Director
|
March 16, 2011
|
|
/s/ Robert A. Eckels
Robert A. Eckels
|
Director
|
March 16, 2011
|
|
/s/Maarten D. Hemsley
Maarten D. Hemsley
|
Director
|
March 16, 2011
|
|
/s/ Richard O. Schaum
Richard O. Schaum
|
Director
|
March 16, 2011
|
|
/s/ Milton L. Scott
Milton L. Scott
|
Director
|
March 16, 2011
|
|
/s/ David R. A. Steadman
David R. A. Steadman
|
Director
|
March 16, 2011
|
|
/s/ Kip L. Wadsworth
Kip L. Wadsworth
|
Director
|
March 16, 2011
|
REPORT OF INDEPENDENT REGISTERED PUBLIC ACCOUNTING FIRM
To the Board of Directors and Stockholders of
Sterling Construction Company, Inc.:
We have audited the accompanying consolidated balance sheets of Sterling Construction Company, Inc. (a Delaware corporation) and subsidiaries as of December 31, 2010 and 2009, and the related consolidated statements of operations, stockholders’ equity, comprehensive income and cash flows for each of the three years in the period ended December 31, 2010. These financial statements are the responsibility of the Company’s management. Our responsibility is to express an opinion on these financial statements based on our audits.
We conducted our audits in accordance with the standards of the Public Company Accounting Oversight Board (United States). Those standards require that we plan and perform the audit to obtain reasonable assurance about whether the financial statements are free of material misstatement. An audit includes examining, on a test basis, evidence supporting the amounts and disclosures in the financial statements. An audit also includes assessing the accounting principles used and significant estimates made by management, as well as evaluating the overall financial statement presentation. We believe that our audits provide a reasonable basis for our opinion.
In our opinion, the financial statements referred to above present fairly, in all material respects, the consolidated financial position of Sterling Construction Company, Inc. and subsidiaries as of December 31, 2010 and 2009, and the consolidated results of their operations and their cash flows for each of the three years in the period ended December 31, 2010 in conformity with accounting principles generally accepted in the United States of America.
We also have audited, in accordance with the standards of the Public Company Accounting Oversight Board (United States), Sterling Construction Company, Inc. and subsidiaries’ internal control over financial reporting as of December 31, 2010, based on criteria established in Internal Control—Integrated Framework issued by the Committee of Sponsoring Organizations of the Treadway Commission (COSO) and our report dated March 16, 2011 expressed an unqualified opinion that Sterling Construction Company, Inc. and subsidiaries maintained, in all material respects, effective internal control over financial reporting.
/s/ GRANT THORNTON LLP
Houston, Texas
March 16, 2011
REPORT OF INDEPENDENT REGISTERED PUBLIC ACCOUNTING FIRM
To the Board of Directors and Stockholders
Sterling Construction Company, Inc.:
We have audited Sterling Construction Company, Inc. (a Delaware corporation) and subsidiaries’ internal control over financial reporting as of December 31, 2010, based on criteria established in Internal Control—Integrated Framework issued by the Committee of Sponsoring Organizations of the Treadway Commission (COSO). Sterling Construction Company, Inc. and subsidiaries’ management is responsible for maintaining effective internal control over financial reporting and for its assessment of the effectiveness of internal control over financial reporting, included in the accompanying Management’s Report on Internal Control Over Financial Reporting appearing under Item 9A. Our responsibility is to express an opinion on Sterling Construction Company, Inc. and subsidiaries’ internal control over financial reporting based on our audit.
We conducted our audit in accordance with the standards of the Public Company Accounting Oversight Board (United States). Those standards require that we plan and perform the audit to obtain reasonable assurance about whether effective internal control over financial reporting was maintained in all material respects. Our audit included obtaining an understanding of internal control over financial reporting, assessing the risk that a material weakness exists, testing and evaluating the design and operating effectiveness of internal control based on the assessed risk, and performing such other procedures as we considered necessary in the circumstances. We believe that our audit provides a reasonable basis for our opinion.
A company’s internal control over financial reporting is a process designed to provide reasonable assurance regarding the reliability of financial reporting and the preparation of financial statements for external purposes in accordance with generally accepted accounting principles. A company’s internal control over financial reporting includes those policies and procedures that (1) pertain to the maintenance of records that, in reasonable detail, accurately and fairly reflect the transactions and dispositions of the assets of the company; (2) provide reasonable assurance that transactions are recorded as necessary to permit preparation of financial statements in accordance with generally accepted accounting principles, and that receipts and expenditures of the company are being made only in accordance with authorizations of management and directors of the company; and (3) provide reasonable assurance regarding prevention or timely detection of unauthorized acquisition, use, or disposition of the company’s assets that could have a material effect on the financial statements.
Because of its inherent limitations, internal control over financial reporting may not prevent or detect misstatements. Also, projections of any evaluation of effectiveness to future periods are subject to the risk that controls may become inadequate because of changes in conditions, or that the degree of compliance with the policies or procedures may deteriorate.
In our opinion, Sterling Construction Company, Inc. and subsidiaries maintained, in all material respects, effective internal control over financial reporting as of December 31, 2010, based on criteria established in Internal Control—Integrated Framework issued by COSO.
We also have audited, in accordance with the standards of the Public Company Accounting Oversight Board (United States), the consolidated balance sheets of Sterling Construction Company Inc. and subsidiaries as of December 31, 2010 and 2009 and the related consolidated statements of operations, stockholders’ equity, comprehensive income and cash flows for each of the three years in the period ended December 31, 2010 and our report dated March 16, 2011 expressed an unqualified opinion on those consolidated financial statements.
/s/ GRANT THORNTON LLP
Houston, Texas
March 16, 2011
STERLING CONSTRUCTION COMPANY, INC. & SUBSIDIARIES
CONSOLIDATED BALANCE SHEETS
As of December 31, 2010 and 2009
(Amounts in thousands, except share and per share data)
|
2010
|
2009
|
|||||||
|
ASSETS
|
||||||||
|
Current assets:
|
||||||||
|
Cash and cash equivalents
|
$ | 49,441 | $ | 54,406 | ||||
|
Short-term investments
|
35,752 | 39,319 | ||||||
|
Contracts receivable, including retainage
|
70,301 | 80,283 | ||||||
|
Costs and estimated earnings in excess of billings on uncompleted contracts
|
10,058 | 5,973 | ||||||
|
Inventories
|
1,479 | 1,229 | ||||||
|
Deferred tax asset, net
|
82 | 127 | ||||||
|
Receivables from and equity in construction joint ventures
|
6,744 | 2,341 | ||||||
|
Deposits and other current assets
|
2,472 | 5,510 | ||||||
|
Total current assets
|
176,329 | 189,188 | ||||||
|
Property and equipment, net
|
74,681 | 80,282 | ||||||
|
Goodwill
|
114,745 | 114,745 | ||||||
|
Other assets, net
|
1,376 | 1,526 | ||||||
|
Total assets
|
$ | 367,131 | $ | 385,741 | ||||
|
LIABILITIES AND STOCKHOLDERS’ EQUITY
|
||||||||
|
Current liabilities:
|
||||||||
|
Accounts payable
|
$ | 35,432 | $ | 32,619 | ||||
|
Billings in excess of costs and estimated earnings on uncompleted contracts
|
17,807 | 31,132 | ||||||
|
Current maturities of long-term debt
|
73 | 73 | ||||||
|
Income taxes payable
|
1,493 | 351 | ||||||
|
Accrued compensation
|
6,920 | 4,311 | ||||||
|
Other accrued expenses
|
7,326 | 6,824 | ||||||
|
Total current liabilities
|
69,051 | 75,310 | ||||||
|
Long-term liabilities:
|
||||||||
|
Long-term debt, net of current maturities
|
336 | 40,409 | ||||||
|
Deferred tax liability, net
|
18,591 | 15,369 | ||||||
|
Total long-term liabilities
|
18,927 | 55,778 | ||||||
|
Commitments and contingencies
|
||||||||
|
Noncontrolling owners' interests in subsidiaries and joint ventures
|
28,724 | 23,887 | ||||||
|
Stockholders’ equity:
|
||||||||
|
Preferred stock, par value $0.01 per share; authorized
|
||||||||
|
1,000,000 shares, none issued
|
-- | -- | ||||||
|
Common stock, par value $0.01 per share; authorized
|
||||||||
|
19,000,000 shares, 16,468,369 and 16,081,878 shares issued
|
164 | 160 | ||||||
|
Treasury stock, 3,147 shares of common stock at no cost
|
-- | -- | ||||||
|
Additional paid in capital
|
198,849 | 197,898 | ||||||
|
Retained earnings
|
51,553 | 32,466 | ||||||
|
Accumulated other comprehensive income (loss)
|
(137 | ) | 242 | |||||
|
Total Sterling common stockholders’ equity
|
250,429 | 230,766 | ||||||
|
Total liabilities and stockholders’ equity
|
$ | 367,131 | $ | 385,741 | ||||
The accompanying notes are an integral part of these consolidated financial statements.
STERLING CONSTRUCTION COMPANY, INC. & SUBSIDIARIES
CONSOLIDATED STATEMENTS OF OPERATIONS
For the years ended December 31, 2010, 2009 and 2008
(Amounts in thousands, except for share and per share data)
|
2010
|
2009
|
2008
|
||||||||||
|
Revenues
|
$ | 459,893 | $ | 390,847 | $ | 415,074 | ||||||
|
Cost of revenues
|
397,188 | 336,478 | 373,102 | |||||||||
|
Gross profit
|
62,705 | 54,369 | 41,972 | |||||||||
|
General and administrative expenses
|
(24,895 | ) | (14,971 | ) | (13,763 | ) | ||||||
|
Direct costs of acquisition
|
-- | (1,211 | ) | -- | ||||||||
|
Provision for loss on lawsuit
|
-- | (1,000 | ) | -- | ||||||||
|
Other income (expense)
|
(1,900 | ) | (249 | ) | (81 | ) | ||||||
|
Operating income
|
35,910 | 36,938 | 28,128 | |||||||||
|
Gain (loss) on sale of securities
|
(38 | ) | 519 | -- | ||||||||
|
Interest income
|
1,809 | 572 | 1,070 | |||||||||
|
Interest expense
|
(1,187 | ) | (234 | ) | (199 | ) | ||||||
|
Income before income taxes and earnings attributable to noncontrolling interests
|
36,494 | 37,795 | 28,999 | |||||||||
|
Income tax expense:
|
||||||||||||
|
Current
|
(6,410 | ) | (7,785 | ) | (1,087 | ) | ||||||
|
Deferred
|
(3,860 | ) | (4,482 | ) | (8,938 | ) | ||||||
|
Total income tax expense
|
(10,270 | ) | (12,267 | ) | (10,025 | ) | ||||||
|
Net income
|
26,224 | 25,528 | 18,974 | |||||||||
|
Noncontrolling owners’ interests in earnings of subsidiaries and joint ventures
|
(7,137 | ) | (1,824 | ) | (908 | ) | ||||||
|
Net income attributable to Sterling common stockholders
|
$ | 19,087 | $ | 23,704 | $ | 18,066 | ||||||
|
Net income per share attributable to Sterling common stockholders
|
||||||||||||
| Basic | $ | 1.15 | $ | 1.77 | $ | 1.38 | ||||||
|
Diluted
|
$ | 1.13 | $ | 1.71 | $ | 1.32 | ||||||
|
Weighted average number of common shares outstanding used in computing earnings per share amounts:
|
||||||||||||
|
Basic
|
16,194,708 | 13,358,903 | 13,119,987 | |||||||||
|
Diluted
|
16,563,169 | 13,855,709 | 13,702,488 | |||||||||
The accompanying notes are an integral part of these consolidated financial statements.
STERLING CONSTRUCTION COMPANY, INC. & SUBSIDIARIES
CONSOLIDATED STATEMENT OF STOCKHOLDERS' EQUITY
For the years ended December 31, 2010, 2009 and 2008
(Amounts in thousands)
| Common Stock | Treasury Stock |
Additional paid
in Capital
|
Retained earnings
(deficit)
|
Accumulated other comprehensive income (loss) | Total | |||||||||||||||||||||||||||
| Shares | Amount | Shares | Amount | |||||||||||||||||||||||||||||
|
Balance at December 31, 2007
|
13,007 | $ | 130 | -- | $ | -- | $ | 147,786 | $ | (9,304 | ) | $ | -- | $ | 138,612 | |||||||||||||||||
|
Net income attributable to Sterling common stockholders
|
18,066 | 18,066 | ||||||||||||||||||||||||||||||
|
Stock issued upon option and warrant exercises
|
154 | 1 | 237 | 238 | ||||||||||||||||||||||||||||
|
Stock based compensation expense
|
210 | 210 | ||||||||||||||||||||||||||||||
|
Issuance and amortization of restricted stock
|
24 | -- | 307 | 307 | ||||||||||||||||||||||||||||
|
Excess tax benefits from exercise of stock options
|
1,218 | 1,218 | ||||||||||||||||||||||||||||||
|
Revaluation of noncontrolling interest put/call liability
|
607 | 607 | ||||||||||||||||||||||||||||||
|
Expenditures related to equity offering
|
(142 | ) | (142 | ) | ||||||||||||||||||||||||||||
|
Balance at December 31, 2008
|
13,185 | 131 | -- | -- | 150,223 | 8,762 | -- | 159,116 | ||||||||||||||||||||||||
|
Net income attributable to Sterling common stockholders
|
23,704 | 23,704 | ||||||||||||||||||||||||||||||
|
Unrealized holding gain on available-for-sale securities, net of tax
|
242 | 242 | ||||||||||||||||||||||||||||||
|
Stock issued upon option and warrant exercises
|
109 | 1 | 307 | 308 | ||||||||||||||||||||||||||||
|
Stock based compensation expense
|
181 | 181 | ||||||||||||||||||||||||||||||
|
Issuance and amortization of restricted stock
|
28 | -- | 405 | 405 | ||||||||||||||||||||||||||||
|
Stock issued in equity offering, net of expenses
|
2,760 | 28 | 46,782 | 46,810 | ||||||||||||||||||||||||||||
|
Balance at December 31, 2009
|
16,082 | 160 | -- | -- | 197,898 | 32,466 | 242 | 230,766 | ||||||||||||||||||||||||
|
Net income attributable to Sterling common stockholders
|
19,087 | 19,087 | ||||||||||||||||||||||||||||||
|
Unrealized holding loss on available-for-sale securities, net of tax
|
(379 | ) | (379 | ) | ||||||||||||||||||||||||||||
|
Stock issued upon option and warrant exercises
|
350 | 3 | 1,048 | 1,051 | ||||||||||||||||||||||||||||
|
Stock based compensation expense
|
121 | 121 | ||||||||||||||||||||||||||||||
|
Issuance and amortization (surrender) of restricted stock
|
36 | 1 | (3 | ) | -- | 473 | 474 | |||||||||||||||||||||||||
|
Revaluation of noncontrolling interest put/call liability
|
(691 | ) | (691 | ) | ||||||||||||||||||||||||||||
|
Balance at December 31, 2010
|
16,468 | $ | 164 | (3 | ) | $ | -- | $ | 198,849 | $ | 51,553 | $ | (137 | ) | $ | 250,429 | ||||||||||||||||
The accompanying notes are an integral part of these consolidated financial statements.
STERLING CONSTRUCTION COMPANY, INC. & SUBSIDIARIES
CONSOLIDATED STATEMENTS OF COMPREHENSIVE INCOME
For the years ended December 31, 2010, 2009 and 2008
(Amounts in thousands)
|
For the year ended December 31,
|
||||||||||||
|
2010
|
2009
|
2008
|
||||||||||
|
Net income attributable to Sterling common stockholders
|
$ | 19,087 | $ | 23,704 | $ | 18,066 | ||||||
|
Add/deduct other comprehensive income, net of tax
|
||||||||||||
|
Realized (gain) loss from available-for-sale securities
|
25 | (337 | ) | -- | ||||||||
|
Net unrealized/realized holding gain (loss) on available-available-for-sale securities
|
(404 | ) | 579 | -- | ||||||||
|
Comprehensive net income attributable to Sterling common stockholders
|
$ | 18,708 | $ | 23,946 | $ | 18,066 | ||||||
The accompanying notes are an integral part of these consolidated financial statements.
STERLING CONSTRUCTION COMPANY, INC. & SUBSIDIARIES
CONSOLIDATED STATEMENTS OF CASH FLOWS
For the years ended December 31, 2010, 2009 and 2008
(Amounts in thousands)
|
2010
|
2009
|
2008
|
||||||||||
|
Net income attributable to Sterling common stockholders
|
$ | 19,087 | $ | 23,704 | $ | 18,066 | ||||||
|
Plus: Noncontrolling owners’ interests in earnings of subsidiaries and joint ventures
|
7,137 | 1,824 | 908 | |||||||||
|
Net income
|
26,224 | 25,528 | 18,974 | |||||||||
|
Adjustments to reconcile net income to net cash provided by operating activities:
|
||||||||||||
|
Depreciation and amortization
|
15,770 | 13,730 | 13,168 | |||||||||
|
(Gain) loss on disposal of property and equipment
|
1,900 | 249 | 81 | |||||||||
|
Deferred tax expense
|
3,860 | 4,482 | 8,938 | |||||||||
|
Stock based compensation expense
|
595 | 586 | 517 | |||||||||
|
Excess tax benefits from exercise of stock options
|
-- | -- | (1,218 | ) | ||||||||
|
Interest expense accreted on noncontrolling interest
|
1,169 | 206 | 199 | |||||||||
|
Loss (gain) on sale of securities
|
38 | (519 | ) | -- | ||||||||
|
Other changes in operating assets and liabilities:
|
||||||||||||
|
(Increase) decrease in contracts receivable
|
9,982 | 15,138 | (6,188 | ) | ||||||||
|
(Increase) decrease in costs and estimated earnings in excess of billings on uncompleted contracts
|
(4,085 | ) | 3,778 | (3,761 | ) | |||||||
|
(Increase) decrease in prepaid expenses and other assets
|
2,284 | (1,582 | ) | (1,945 | ) | |||||||
|
(Increase) decrease in receivables from and equity in construction joint ventures
|
(4,403 | ) | (13 | ) | -- | |||||||
|
Increase (decrease) in trade payables
|
2,316 | (11,185 | ) | (1,079 | ) | |||||||
|
Increase (decrease) in billings in excess of costs and estimated earnings on uncompleted contracts
|
(13,325 | ) | (3,571 | ) | (2,222 | ) | ||||||
|
Increase (decrease) in accrued compensation and other liabilities
|
4,748 | 519 | 1,257 | |||||||||
|
Net cash provided by operating activities
|
47,073 | 47,346 | 26,721 | |||||||||
|
Cash flows from investing activities:
|
||||||||||||
|
Cash paid for business combinations, net of cash acquired
|
-- | (60,490 | ) | -- | ||||||||
|
Additions to property and equipment
|
(13,409 | ) | (5,277 | ) | (19,896 | ) | ||||||
|
Proceeds from sale of property and equipment
|
1,607 | 435 | 1,298 | |||||||||
|
(Issuance) payments on note receivables
|
-- | (350 | ) | 204 | ||||||||
|
Purchases of short-term securities, available for sale
|
(137,547 | ) | (71,386 | ) | (24,325 | ) | ||||||
|
Sales of short-term securities, available for sale
|
140,493 | 57,338 | -- | |||||||||
|
Net cash used in investing activities
|
(8,856 | ) | (79,730 | ) | (42,719 | ) | ||||||
|
Cash flows from financing activities:
|
||||||||||||
|
Cumulative daily drawdowns – Credit Facility
|
57,700 | 188,000 | 235,000 | |||||||||
|
Cumulative daily repayments – Credit Facility
|
(97,700 | ) | (203,000 | ) | (245,000 | ) | ||||||
|
Repayments under long-term obligations
|
(73 | ) | (74 | ) | (98 | ) | ||||||
|
Increase in deferred loan costs
|
-- | (151 | ) | -- | ||||||||
|
Issuance of common stock pursuant to warrants and options exercised
|
1,051 | 308 | 238 | |||||||||
|
Utilization of excess tax benefits from exercise of stock options
|
-- | -- | 1,218 | |||||||||
|
Distributions to noncontrolling interest owners
|
(4,160 | ) | (408 | ) | (562 | ) | ||||||
|
Net proceeds from sale of common stock
|
-- | 46,810 | (142 | ) | ||||||||
|
Net cash provided by (used in) financing activities
|
(43,182 | ) | 31,485 | (9,346 | ) | |||||||
|
Net increase (decrease) in cash and cash equivalents
|
(4,965 | ) | (899 | ) | (25,344 | ) | ||||||
|
Cash and cash equivalents at beginning of period
|
54,406 | 55,305 | 80,649 | |||||||||
|
Cash and cash equivalents at end of period
|
$ | 49,441 | $ | 54,406 | $ | 55,305 | ||||||
|
Supplemental disclosures of cash flow information:
|
||||||||||||
|
Cash paid during the period for interest
|
$ | 44 | $ | 31 | $ | 167 | ||||||
|
Cash paid during the period for income taxes
|
$ | 3,740 | $ | 7,000 | $ | 3,000 | ||||||
The accompanying notes are an integral part of these consolidated financial statements.
STERLING CONSTRUCTION COMPANY, INC. & SUBSIDIARIES
NOTES TO CONSOLIDATED FINANCIAL STATEMENTS
1. Summary of Business and Significant Accounting Policies
Basis of Presentation
Sterling Construction Company, Inc. (“Sterling” or “the Company”) a Delaware Corporation, is a leading heavy civil construction company that specializes in the building, reconstruction and repair of transportation and water infrastructure in large and growing markets in Texas, Utah, Nevada and other states where we see contracting opportunities. Our transportation infrastructure projects include highways, roads, bridges and light and commuter rail, and our water infrastructure projects include water, wastewater and storm drainage systems. We provide general contracting services primarily to public sector clients utilizing our own employees and equipment for the majority of activities including excavating, concrete and asphalt paving, construction of bridges and similar large structures, pipe and rail installation, concrete and asphalt batch plant operations, concrete crushing and aggregates operations. We purchase the necessary materials for our contracts, and perform the majority of the work required by our contracts with our own crews.
Sterling owns six subsidiaries: Texas Sterling Construction Co. (“TSC”), a Delaware corporation; Road and Highway Builders, LLC (“RHB”), a Nevada limited liability company; Road and Highway Builders, Inc. ("RHB Inc"), a Nevada corporation; Road and Highway Builders of California, Inc., ("RHB Cal"), a California corporation; Ralph L. Wadsworth Construction Company, LLC ("RLW"), a Utah limited liability company and Ralph L. Wadsworth Construction Company, LP (“RLWLP”), an inactive California limited partnership. TSC, RHB, RHB Cal and RLW perform construction contracts, and RHB Inc produces aggregates from a leased quarry, primarily for use by RHB.
The accompanying consolidated financial statements include the accounts of subsidiaries in which the Company has a greater than 50% ownership interest and all significant intercompany accounts and transactions have been eliminated in consolidation. For all years presented, the Company had no subsidiaries with ownership interests of less than 50%.
Our Markets
Demand for transportation and water infrastructure depends on a variety of factors, including overall population growth, economic expansion and the vitality of the market areas in which we operate, as well as unique local topographical, structural and environmental issues. In addition to these factors, demand for the replacement of infrastructure is driven by the general aging of infrastructure and the need for technical improvements to achieve more efficient or safer use of infrastructure and resources. Funding for this infrastructure depends on federal, state and local governmental resources, budgets and authorizations.
During the last quarter of 2008 and throughout the years 2009 and 2010, the bidding environment in our markets has been much more competitive because of the following:
|
·
|
While our business includes only minimal residential and commercial infrastructure work, the severe fall-off in new projects in those markets has resulted in some residential and commercial infrastructure contractors bidding on smaller public sector transportation and water infrastructure projects, sometimes at bid levels below our break-even pricing, thus increasing competition and creating downward pressure on bid prices in our markets.
|
|
·
|
Traditional competitors on larger transportation and water infrastructure projects also appear to have been bidding at less than normal margins, sometimes at bid levels below our break-even pricing, in order to replenish their reduced backlogs.
|
These factors have limited our ability to increase our backlog through successful bids for new projects and have compressed the profitability on the new projects where we submitted successful bids. While we have been more aggressive in reducing the anticipated margins we use to bid on some projects, we have not bid at anticipated loss margins in order to obtain new backlog.
Assuming that these factors continue to affect infrastructure capital expenditures in our markets in the near term, and taking into account the amount of backlog we had at December 31, 2010 and the lower anticipated margin bid on some projects that we have recently been awarded and have started work on or expect to start work on in 2011, we currently anticipate that our net income and diluted earnings per common share of stock attributable to Sterling common stockholders for 2011 will be below the results we achieved for 2010.
We do, however, expect that our markets will ultimately recover from the conditions described above, that our backlog and revenues will grow and that our gross profit, net income and earnings per share will return to levels more consistent with historical rates of return. However, we cannot predict the timing of such a return to historical normalcy in our markets.
Critical Accounting Policies
Use of Estimates
The consolidated financial statements have been prepared in conformity with accounting principles generally accepted in the United States of America ("GAAP"), which require management to make estimates and assumptions that affect the reported amounts of assets and liabilities, and disclosure of contingent assets and liabilities at the date of the financial statements, and the reported amount of revenues and expenses during the reporting period.
Certain of the Company's accounting policies require higher degrees of judgment than others in their application. These include the recognition of revenue and earnings from construction contracts under the percentage-of-completion method, the valuation of long-term assets, and income taxes.
Management continually evaluates all of its estimates and judgments based on available information and experience; however, actual amounts could differ from those estimates.
Construction Revenue Recognition
The Company is a general contractor in the states of Texas, Utah and Nevada and other states where it sees opportunities. It engages in various types of heavy civil construction projects principally for public (government) owners. Credit risk is minimal with public owners since the Company ascertains that funds have been appropriated by the governmental project owner prior to commencing work on such projects. While most public contracts are subject to termination at the election of the government entity, in the event of termination the Company is entitled to receive the contract price for completed work and reimbursement of termination-related costs. Credit risk with private owners is minimized because of statutory mechanics liens, which give the Company high priority in the event of lien foreclosures following financial difficulties of private owners.
Revenues are recognized on the percentage-of-completion method, measured by the ratio of costs incurred up to a given date to estimated total costs for each contract. Our contracts generally take 12 to 36 months to complete.
Contract costs include all direct material, labor, subcontract and other costs and those indirect costs related to contract performance, such as indirect salaries and wages, equipment repairs and depreciation, insurance and payroll taxes. Administrative and general expenses are charged to expense as incurred. Provisions for estimated losses on uncompleted contracts are made in the period in which such losses are determined. Changes in job performance, job conditions and estimated profitability, including those changes arising from contract penalty provisions and final contract settlements may result in revisions to costs and income and are recognized in the period in which the revisions are determined. An amount attributable to contract claims is included in revenues when realization is probable and the amount can be reasonably estimated. Cost and estimated earnings in excess of billings included $1.7 million and $0.7 million at December 31, 2010 and 2009, respectively, for contract claims not approved by the customer (which includes out-of-scope work, potential or actual disputes, and claims). The Company generally provides a one to two-year warranty for workmanship under its contracts. Warranty claims historically have been insignificant.
The asset, “Costs and estimated earnings in excess of billings on uncompleted contracts” represents revenues recognized in excess of amounts billed on these contracts. The liability “Billings in excess of costs and estimated earnings on uncompleted contracts” represents billings in excess of revenues recognized on these contracts.
Financial Instruments
The fair value of financial instruments is the amount at which the instrument could be exchanged in a current transaction between willing parties. The Company’s financial instruments are cash and cash equivalents, short-term investments, contracts receivable, accounts payable, mortgage payable, the Credit Facility and the puts related to the noncontrolling owners’ interest in subsidiaries. The recorded values of cash and cash equivalents, short-term investments, contracts receivable and accounts payable approximate their fair values based on their short-term nature. The recorded value of long-term debt approximates its fair value, as interest approximates market rates. See Note 12 regarding the fair value of the puts. We had one mortgage outstanding at December 31, 2010 with a remaining balance of $409,000. The mortgage was accruing interest at 3.50% at both December 31, 2010 and 2009 and contains pre-payment penalties. To determine the fair value of the mortgage, the amount of future cash flows was discounted using the Company’s borrowing rate on its Credit Facility.
Cash and Cash Equivalents and Short-term Investments
The Company considers all highly liquid investments with original or remaining maturities of three months or less at the time of purchase to be cash equivalents. At December 31, 2010 approximately $1.6 million of cash and cash equivalents were fully insured by the FDIC under its standard maximum deposit insurance amount (SMDIA) guidelines. The Company classifies short-term investments, other than certificates of deposits with remaining maturity of 90 days or less at purchase, as securities available for sale. At December 31, 2010 and 2009 the Company had short-term investments as follows (in thousands):
|
December 31, 2010
|
||||||||||||||||
|
Total
|
Level 1
|
Gross Unrealized Gains (pre-tax)
|
Gross Unrealized Losses (pre-tax)
|
|||||||||||||
|
Fixed income mutual funds
|
$ | 31,992 | $ | 31,992 | $ | 2 | $ | 189 | ||||||||
|
Exchange traded funds
|
3,510 | 3,510 | 13 | 36 | ||||||||||||
|
Total securities available-for-sale
|
35,502 | $ | 35,502 | $ | 15 | $ | 225 | |||||||||
|
Certificates of deposit with original maturities between 90 and 365 days
|
250 | |||||||||||||||
|
Total short-term investments
|
$ | 35,752 | ||||||||||||||
|
December 31, 2009
|
||||||||||||||||
|
Total
|
Level 1
|
Gross Unrealized Gains (pre-tax)
|
Gross Unrealized Losses (pre-tax)
|
|||||||||||||
|
Fixed income mutual funds
|
$ | 35,055 | $ | 35,055 | $ | 55 | $ | 1 | ||||||||
|
Exchange traded funds
|
2,494 | 2,494 | 319 | -- | ||||||||||||
|
Total securities available-for-sale
|
37,549 | $ | 37,549 | $ | 374 | $ | 1 | |||||||||
|
Certificates of deposit with original maturities between 90 and 365 days
|
1,770 | |||||||||||||||
|
Total short-term investments
|
$ | 39,319 | ||||||||||||||
Descriptions of the inputs used to value the above securities are shown below:
Level 1 Inputs - Valuation based upon quoted prices for identical assets in active markets that the Company has the ability to access at the measurement date.
Level 2 Inputs – Based upon quoted prices (other than Level 1) in active markets for similar assets, quoted prices for identical or similar assets in markets that are not active, inputs other than quoted prices that are observable for the asset such as interest rates, yield curves, volatilities and default rates and inputs that are derived principally from or corroborated by observable market data.
Level 3 Inputs – Based on unobservable inputs reflecting the Company’s own assumptions about the assumptions that market participants would use in pricing the asset based on the best information available.
The Company had no short-term investments valued with Level 2 or Level 3 inputs at either balance sheet date.
Gains (losses) on sale of securities in the accompanying statements of operations are comprised entirely of gains and losses realized on short-term investment securities. Unrealized gains (losses) on short-term investments are included in accumulated other comprehensive income in stockholders' equity as the losses may be temporary. Upon sale of equity securities, the average cost basis is used to determine the gain or loss.
For the years ended December 31, 2010, 2009 and 2008, the Company recorded interest income of $1.8 million, $0.6 million and $1.1 million, respectively.
Contracts Receivable
Contracts receivable are generally based on amounts billed to the customer. At December 31, 2010 and 2009 contracts receivable included $22.9 million and $31.7 million of retainage, respectively, discussed below which is being withheld by customers until completion of the contracts and $388,000 and $3.7 million of unbilled receivables, respectively, on contracts completed or substantially complete at that date (the unbilled 2010 amount is expected to be billed in 2011). All other contracts receivable include only balances approved for payment by the customer.
Many of the contracts under which the Company performs work contain retainage provisions. Retainage refers to that portion of billings made by the Company but held for payment by the customer pending satisfactory completion of the project. Retainage on active contracts is classified as a current asset regardless of the term of the contract and is generally collected within one year of the completion of a contract.
Based upon a review of outstanding contracts receivable, historical collection information and existing economic conditions, management has determined that all contracts receivable at December 31, 2010 and 2009 are fully collectible, and, accordingly, no allowance for doubtful accounts against contracts receivable is necessary. Contracts receivable are written off based on individual credit evaluation and specific circumstances of the customer, when such treatment is warranted.
Inventories
The Company's inventories are stated at the lower of cost or market as determined by the average cost method. Inventories at December 31, 2010 and 2009 consist primarily of concrete and millings which are expected to be utilized on construction projects in the future. The cost of inventory includes labor, trucking and other equipment costs.
Property and Equipment
Property and equipment are stated at cost. Depreciation and amortization are computed using the straight-line method. The estimated useful lives used for computing depreciation and amortization are as follows:
|
Buildings
|
39 years
|
|
Construction equipment
|
5-15 years
|
|
Land improvements
|
5-15 years
|
|
Office furniture and fixtures
|
3-10 years
|
|
Transportation equipment
|
5 years
|
Depreciation expense was approximately $15.5 million, $13.5 million, and $12.9 million in 2010, 2009 and 2008, respectively.
Equipment under Capital Leases
The Company’s policy is to account for capital leases, which transfer substantially all the benefits and risks incident to the ownership of the leased property to the Company, as the acquisition of an asset and the incurrence of an obligation. Under this method of accounting, the recorded value of the leased asset is amortized principally using the straight-line method over its estimated useful life and the obligation, including interest thereon, is reduced through payments over the life of the lease. Depreciation expense on leased equipment and the related accumulated depreciation is included with that of owned equipment. The Company had no capital leases in 2010, 2009 or 2008.
Deferred Loan Costs
Deferred loan costs represent loan origination fees paid to the lender and related professional fees such as legal fees related to drafting of loan agreements. These fees are amortized over the term of the loan. In 2007, the Company entered into a new syndicated term Credit Facility (see Note 3) and incurred $1.2 million of loan costs, which are being amortized over the five-year term of the loan. Loan cost amortization expense for fiscal years 2010, 2009 and 2008 was $304,000, $258,000 and $254,000 respectively.
Goodwill and Intangibles
Goodwill represents the excess of the cost of companies acquired over the fair value of their net assets at the dates of acquisition.
U.S. generally accepted accounting principles ("GAAP") requires that: (1) goodwill and indefinite lived intangible assets not be amortized, (2) goodwill is to be tested for impairment at least annually at the reporting unit level, (3) the amortization period of intangible assets with finite lives is to be no longer limited to forty years, and (4) intangible assets deemed to have an indefinite life are to be tested for impairment at least annually by comparing the fair value of these assets with their recorded amounts.
Goodwill impairment is tested during the last quarter of each calendar year. The first step compares the calculated book value of the Company’s stock (stockholders’ equity) to the adjusted market value of those shares. We used two methods to determine the adjusted market value of our outstanding stock. The first method is based on the aggregate of the quoted market value of our outstanding stock as of October 1 as reported by NASDAQ, adjusted for a controlling interest premium. The second method, which is used by some of the analysts reporting on our Company, is based on the Company’s enterprise value (market capitalization plus net debt), adjusted for a controlling interest premium, divided by its EBITDA (earnings before interest, taxes, depreciation and amortization). If the adjusted market value of the Company’s stock is greater than the calculated book value of the Company’s stock, goodwill is deemed not to be impaired and no further testing is required. If the adjusted market value is less than the calculated book value, additional steps of determining fair value of assets must be taken to determine impairment. Testing under step one by these two methods in 2010 indicated the adjusted market value of the Company’s stock was in excess of its calculated book value by between 15% and 57%; therefore no further testing was required. Based on the results of such tests for impairment, the Company concluded that no impairment of goodwill existed as of December 31, 2010.
Intangible assets that have finite lives continue to be subject to amortization. In addition, the Company must evaluate the remaining useful life in each reporting period to determine whether events and circumstances warrant a revision of the remaining period of amortization. If the estimate of an intangible asset’s remaining life is changed, the remaining carrying amount of such asset is amortized prospectively over that revised remaining useful life.
Evaluating Impairment of Long-Lived Assets
When events or changes in circumstances indicate that long-lived assets other than goodwill may be impaired, an evaluation is performed based on estimated undiscounted cash flow associated with the assets as compared to the asset's carrying amount to determine if a write-down to fair value is required. As a result of the current economic cycle, the Company has idled some of its equipment. Management believes such equipment will be used when the market returns to a normalized level of activity, and consequently, there is no impairment in the carrying value of such equipment.
Segment reporting
We operate in one segment and have only one reportable segment and one reporting unit component, heavy civil construction. In making this determination, we considered that each project has similar characteristics, includes similar services, has similar types of customers and is subject to similar economic and regulatory environments. We organize, evaluate and manage our financial information around each project when making operating decisions and assessing our overall performance.
Even if our local offices were to be considered separate components of our heavy civil construction operating segment, those components could be aggregated into a single reporting unit for purposes of testing goodwill for impairment under Accounting Standards Codification 280 and EITF D-101 because our local offices all have similar economic characteristics and are similar in all of the following areas:
|
·
|
The nature of the products and services — each of our local offices perform similar construction projects — they build, reconstruct and repair roads, highways, bridges, light and commuter rail and water, waste water and storm drainage systems.
|
|
·
|
The nature of the production processes — our heavy civil construction services rendered in the construction production process for each of our construction projects performed by each local office is the same — they excavate dirt, remove existing pavement and pipe, lay aggregate or concrete pavement, pipe and rail and build bridges and similar large structures in order to complete our projects.
|
|
·
|
The type or class of customer for products and services — substantially all of our customers are federal and state departments of transportation, cities, counties, and regional water, rail and toll-road authorities. A substantial portion of the funding for the state departments of transportation to finance the projects we construct is furnished by the federal government.
|
|
·
|
The methods used to distribute products or provide services — the heavy civil construction services rendered on our projects are performed primarily with our own field work crews (laborers, equipment operators and supervisors) and equipment (backhoes, loaders, dozers, graders, cranes, pug mills, crushers, and concrete and asphalt plants).
|
|
·
|
The nature of the regulatory environment — we perform substantially all of our projects for federal, state and municipal governmental agencies, and all of the projects that we perform are subject to substantially similar regulation under U.S. and state department of transportation rules, including prevailing wage and hour laws; codes established by the federal government and municipalities regarding water and waste water systems installation; and laws and regulations relating to workplace safety and worker health of the U.S. Occupational Safety and Health Administration and to the employment of immigrants of the U.S. Department of Homeland Security.
|
While profit margin objectives included in contract bids have some variability from contract to contract, our profit margin objectives are not differentiated by our chief operating decision maker or our office management based on local office location. Instead, the projects undertaken by each local office are primarily competitively-bid, fixed unit or negotiated lump sum price contracts, all of which are bid based on achieving gross margin objectives that reflect the relevant skills required, the contract size and duration, the availability of our personnel and equipment, the makeup and level of our existing backlog, our competitive advantages and disadvantages, prior experience, the contracting agency or customer, the source of contract funding, anticipated start and completion dates, construction risks, penalties or incentives and general economic conditions.
Federal and State Income Taxes
We determine deferred income tax assets and liabilities using the balance sheet method. Under this method, the net deferred tax asset or liability is determined based on the tax effects of the temporary differences between the book and tax bases of the various balance sheet assets and liabilities and gives current recognition to changes in tax rates and laws. Valuation allowances are established when necessary to reduce deferred tax assets to the amount expected to be realized. We recognize the financial statement benefit of a tax position only after determining that the relevant tax authority would more likely than not sustain the position following an audit. For tax positions meeting the more-likely-than-not threshold, the amount recognized in the financial statements is the largest benefit that has a greater than 50 percent likelihood of being realized upon ultimate settlement with the relevant tax authority.
Construction Joint Ventures
We participate in various construction joint venture partnerships. Generally, each construction joint venture is formed to accomplish a specific project and is jointly controlled by the joint venture partners. The joint venture agreements typically provide that our interests in any profits and assets, and our respective share in any losses and liabilities that may result from the performance of the contract is limited to our stated percentage interest in the venture. We have no significant commitments beyond completion of the contract with the customer.
Our agreements with our joint venture partners provide that each venture partner will receive its share of net income and assume and pay its share of any losses resulting from a project. If one of our venture partners is unable to pay its share of losses, we would be fully liable for those losses under our contract with the project owner. Circumstances that could lead to a loss under our joint venture arrangements beyond our ownership interest include a venture partner's inability to contribute additional funds required by the venture or additional costs that we could incur should a venture partner fail to provide the services and resources toward project completion that it committed to in the joint venture agreement and the contract with the customer.
Under GAAP, the Company must determine whether each joint venture in which it participates is a variable interest entity. This determination focuses on identifying which joint venture partner, if any, has the power to direct the activities of the joint venture and the obligation to absorb losses of the joint venture or the right to receive benefits from the joint venture disproportionate to its interest in the joint venture, which could have the effect of requiring us to consolidate joint ventures in which we have a noncontrolling variable interest. At December 31, 2010 and 2009, we had no participation in a joint venture where we had a material noncontrolling variable interest.
If we have determined that we control the joint venture, we consolidate the joint venture in our consolidated financial statements and include the other venturers' interests in the equity and net income of the joint venture in the balance sheet line item: "Noncontrolling owners' interests in subsidiaries and joint ventures."
Where we are a noncontrolling venture partner, we account for our share of the operations of such construction joint ventures on a pro rata basis in the consolidated statements of operations and as a single line item ("Receivables from and equity in construction joint ventures") in the consolidated balance sheets. Condensed combined financial amounts of joint ventures in which the Company has a noncontrolling interest and the Company's share of such amounts which are included in the Company's consolidated financial statements as of and for the fiscal years ended December 31, 2010 and 2009 are shown below (in thousands):
|
2010
|
2009
|
|||||||
|
Total combined:
|
||||||||
|
Current assets
|
$ | 79,588 | $ | 10,328 | ||||
|
Less current liabilities
|
(61,629 | ) | (964 | ) | ||||
|
Net assets
|
$ | 17,959 | $ | 9,364 | ||||
|
Revenues
|
$ | 302,289 | $ | -- | ||||
|
Income before tax
|
$ | 24,573 | $ | -- | ||||
|
Backlog
|
$ | 750,398 | $ | 1,100,235 | ||||
|
Sterling's noncontrolling interest:
|
||||||||
|
Share of revenues
|
$ | 37,684 | $ | -- | ||||
|
Share of income before tax
|
$ | 3,018 | $ | -- | ||||
|
Backlog
|
$ | 93,931 | $ | 137,559 | ||||
|
Sterling's receivables from and equity in net assets of construction joint ventures
|
$ | 6,744 | $ | 2,341 | ||||
Stock-Based Compensation
The Company’s stock-based incentive plan is administered by the Compensation Committee of the Board of Directors. The Company’s policy is to use the closing price of the common stock on the date of the meeting at which a stock option award is approved for the option’s per-share exercise price. The term of the grants under the plans do not exceed 10 years. Stock options generally vest over a three to five year period, and the fair value of the stock option is recognized on a straight-line basis over the vesting period of the option. See Note 7 for further information regarding the stock-based incentive plans.
Net Income Per Share Attributable to Sterling Common Stockholders
Basic net income per share attributable to Sterling common stockholders is computed by dividing net income attributable to Sterling common stockholders by the weighted average number of common shares outstanding during the period. Diluted net income per common share attributable to Sterling common stockholders is the same as basic net income per share attributable to Sterling common stockholders but assumes the exercise of any convertible subordinated debt securities and includes dilutive stock options and warrants using the treasury stock method. The following table reconciles the numerators and denominators of the basic and diluted per common share computations for net income attributable to Sterling common stockholders for 2010, 2009 and 2008 (in thousands, except per share data):
|
Years Ended December 31,
|
||||||||||||
|
2010
|
2009
|
2008
|
||||||||||
|
Numerator:
|
||||||||||||
|
Net income attributable to Sterling common stockholders
|
$ | 19,087 | $ | 23,704 | $ | 18,066 | ||||||
|
Revaluation of noncontrolling interest put/call liability reflected in additional paid in capital, net of tax
|
(449 | ) | -- | -- | ||||||||
| $ | 18,638 | $ | 23,704 | $ | 18,066 | |||||||
|
Denominator:
|
||||||||||||
|
Weighted average common shares outstanding — basic
|
16,195 | 13,359 | 13,120 | |||||||||
|
Shares for dilutive stock options and warrants
|
368 | 497 | 582 | |||||||||
|
Weighted average common shares outstanding and
assumed conversions — diluted
|
16,563 | 13,856 | 13,702 | |||||||||
|
Basic net income per share attributable to Sterling common stockholders
|
$ | 1.15 | $ | 1.77 | $ | 1.38 | ||||||
|
Diluted net income per share attributable to Sterling common stockholders
|
$ | 1.13 | $ | 1.71 | $ | 1.32 | ||||||
There were 95,107 options in 2010, and 96,007 options for both 2009 and 2008 outstanding, but considered antidilutive as the option exercise price exceeded the average share market price.
Interest Costs
Approximately $6,000, $13,000 and $107,000 of interest related to the construction of maintenance facilities and an office building were capitalized as part of construction costs during 2010, 2009 and 2008.
Recent Accounting Pronouncements
Recent accounting pronouncements not adopted or not discussed below are not expected to materially affect the Company’s consolidated financial statements.
In June 2009, the FASB issued a standard to address the elimination of the concept of a qualifying special purpose entity. This standard replaced the quantitative-based risks and rewards calculation for determining which enterprise has a controlling financial interest in a variable interest entity with an approach focused on identifying which enterprise has the power to direct the activities of a variable interest entity and the obligation to absorb losses of the entity or the right to receive benefits from the entity. This standard became effective in the first quarter of 2010 and may have the effect of requiring us to consolidate variable interest joint ventures in which we do not have a controlling interest. At December 31, 2010, we had no investment in any variable interest joint venture entity.
In January 2010, the FASB issued “Fair Value Measurements and Disclosure (Topic 820)” regarding the disclosure requirements of existing U.S. GAAP related to fair value measurements. This standard requires additional disclosures about recurring and non-recurring fair value measurements. These disclosure requirements are effective for interim and annual reporting periods beginning after December 15, 2009, except for disclosures about purchases, sales, issuances and settlements in the roll forward of activity in Level 3 fair value measurements for which disclosure becomes effective for fiscal years beginning after December 15, 2010, and for interim periods within those fiscal years. This standard did not impact our financial position, results of operations or cash flows for the 2010 fiscal year.
Reclassifications
Certain immaterial balances included in the prior year balance sheet have been reclassified to conform to current year presentation.
2. Property and Equipment
Property and equipment are summarized as follows (in thousands):
|
As of December 31,
|
||||||||
|
2010
|
2009
|
|||||||
|
Construction equipment
|
$ | 109,432 | $ | 105,085 | ||||
|
Transportation equipment
|
14,915 | 13,472 | ||||||
|
Buildings
|
4,673 | 4,699 | ||||||
|
Office equipment
|
870 | 892 | ||||||
|
Construction in progress
|
870 | 471 | ||||||
|
Land
|
2,916 | 2,916 | ||||||
|
Water rights
|
200 | 200 | ||||||
| 133,876 | 127,735 | |||||||
|
Less accumulated depreciation
|
(59,195 | ) | (47,453 | ) | ||||
| $ | 74,681 | $ | 80,282 | |||||
At December 31, 2010, construction in progress consisted of expenditures for new maintenance shop facilities and offices at various locations in Texas.
3. Line of Credit and Long-Term Debt
Long-term debt consists of the following (in thousands):
|
As of December 31,
|
||||||||
|
2010
|
2009
|
|||||||
|
Credit Facility, due October 2012
|
$ | -- | $ | 40,000 | ||||
|
Mortgage due monthly through June 2016
|
409 | 482 | ||||||
| 409 | 40,482 | |||||||
|
Less current maturities of long-term debt
|
(73 | ) | (73 | ) | ||||
|
Total long-term debt
|
$ | 336 | $ | 40,409 | ||||
Line of Credit Facility
On October 31, 2007, the Company and its subsidiaries entered into a new credit facility (“Credit Facility”) with Comerica Bank, which replaced a prior Revolver, and will mature on October 31, 2012. The Credit Facility allows for borrowing of up to $75.0 million and is secured by all assets of the Company, other than proceeds and other rights under our construction contracts, which are pledged to our bond surety. The Credit Facility requires the payment of a quarterly commitment fee of 0.25% per annum of the unused portion of the Credit Facility. At December 31, 2010 and 2009, the aggregate borrowings outstanding under the Credit Facility were $0 and $40 million, respectively, and the aggregate amount of letters of credit outstanding under the Credit Facility was $1.7 million and $1.8 million, respectively, which reduces availability under the Credit Facility. Availability under the Credit Facility was, therefore, $73.3 million and $33.2 million at December 31, 2010 and 2009, respectively, without violating any of the covenants discussed in the next paragraph.
The Credit Facility is subject to our compliance with certain covenants, including financial covenants relating to fixed charges, leverage, tangible net worth, asset coverage and consolidated net losses. The Credit Facility contains restrictions on the Company’s ability to:
|
·
|
Make distributions and dividends;
|
|
·
|
Incur liens and encumbrances;
|
|
·
|
Incur further indebtedness;
|
|
·
|
Guarantee obligations;
|
|
·
|
Dispose of a material portion of assets or merge with a third party;
|
|
·
|
Make acquisitions;
|
|
·
|
Incur losses for two consecutive quarters;
|
|
·
|
Make investments in securities
|
The Company was in compliance with all covenants under the Credit Facility as of December 31, 2010.
The unpaid principal balance of each prime-based loan will bear interest at a variable rate equal to Comerica’s prime rate plus an amount ranging from 0% to 0.50% depending on the pricing leverage ratio that we achieve. If we achieve a pricing leverage ratio of (a) less than 1.00 to 1.00; (b) equal to or greater than 1.00 to 1.00 but less than 1.75 to 1.00; or (c) greater than or equal to 1.75 to 1.00, then the applicable prime margins will be 0.0%, 0.25% or 0.50%, respectively. The interest rate on funds borrowed under this revolver during the year ended December 31, 2010 was 3.25% at all times that the Company had debt outstanding under this facility.
At our election, the loans under the new Credit Facility bear interest at either a LIBOR-based interest rate or a prime-based interest rate. The prime based interest rate option plus the applicable prime based margin can be no less than the Daily Adjusting Libor plus 1.00%, or Federal Funds Rate plus 1.00%. The unpaid principal balance of each LIBOR-based loan bears interest at a variable rate equal to LIBOR plus an amount ranging from 1.25% to 2.25% depending on the pricing leverage ratio that we achieve. The “pricing leverage ratio” is determined by the ratio of our average total debt, less cash and cash equivalents, to earnings before interest, taxes, depreciation and amortization ("EBITDA") that we achieve on a rolling four-quarter basis. The pricing leverage ratio is measured quarterly. If we achieve a pricing leverage ratio of (a) less than 1.00 to 1.00; (b) equal to or greater than 1.00 to 1.00 but less than 1.75 to 1.00; or (c) greater than or equal to 1.75 to 1.00, then the applicable LIBOR margins will be 1.25%, 1.75% or 2.25%, respectively then the applicable prime based margins will be 0.00%, 0.25% and 0.50%, respectively. Interest on LIBOR-based loans is payable at the end of the relevant LIBOR interest period, which must be one, two, three or six months.
In December 2007, Comerica syndicated the Credit Facility with three other financial institutions under the same terms discussed above.
Management believes that the Credit Facility will provide adequate funding for the Company’s working capital, debt service and capital expenditure requirements, including seasonal fluctuations at least through December 31, 2011.
Mortgage
In 2001 TSC completed the construction of a headquarters building and financed it principally through a mortgage of $1.1 million on the land and facilities, at a floating interest rate, which at December 31, 2010 was 3.5% per annum, repayable over 15 years. The outstanding balance on this mortgage was $409,000 at December 31, 2010.
Maturities of Debt
The Company's long-term obligations mature in future years as follows (in thousands):
|
Years Ending December 31,:
|
||||
|
2011
|
$ | 73 | ||
|
2012
|
73 | |||
|
2013
|
73 | |||
|
2014
|
73 | |||
|
2015
|
73 | |||
|
Thereafter
|
44 | |||
| $ | 409 | |||
4. Financial Instruments
The fair value of financial instruments is the amount at which the instrument could be exchanged in a current transaction between willing parties.
The Company’s financial instruments are cash and cash equivalents, short-term investments, contracts receivable, accounts payable, mortgages payable, the Credit Facility and the puts. The recorded values of cash and cash equivalents, short-term investments, contracts receivable and accounts payable approximate their fair values based on their short-term nature. The recorded value of long-term debt approximates its fair value, as interest approximates market rates. See Note 12 regarding the fair values of the puts.
TSC had one mortgage outstanding at December 31, 2010 and 2009. This mortgage was accruing interest at 3.50% at those dates, respectively and contained pre-payment penalties. To determine the fair value of the mortgage, the amount of future cash flows was discounted using the Company’s borrowing rate on its Credit Facility. At December 31, 2010 and 2009 the carrying value of the mortgages was $409,000 and $482,000, respectively, and the fair value of the mortgage was approximately $412,000 and $431,000, respectively.
The Company does not have any off-balance sheet financial instruments other than operating leases (see Note 9).
5. Income Taxes and Deferred Tax Asset/Liability
The Company and its subsidiaries file federal and state income tax returns in the U.S. and various states. The Company’s U.S. federal income tax returns for 2007, 2008 and 2009 are currently being examined by the I.R.S.; however, management expects there will be no material change in our financial position or results of operations as a result of this examination. With few exceptions, the Company is no longer subject to federal and state tax examinations for years prior to 2007. The Company’s policy is to recognize interest related to any underpayment of taxes as interest expense, and penalties as administrative expenses. No interest or penalties have been accrued at December 31, 2010.
Current income tax expense represents federal tax, Texas state franchise tax and the Utah state income tax paid or expected to be payable for the years shown in the statements of operations.
Deferred tax assets and liabilities consist of the following (in thousands):
|
As of December 31,
|
||||||||||||||||
|
|
2010
|
2009
|
||||||||||||||
|
|
Current
|
Long Term
|
Current
|
Long Term
|
||||||||||||
|
Assets related to:
|
||||||||||||||||
|
Accrued compensation and other
|
$ | 82 | $ | -- | $ | 127 | $ | -- | ||||||||
|
Liabilities related to:
|
||||||||||||||||
|
Amortization of goodwill
|
-- | (4,473 | ) | -- | (2,361 | ) | ||||||||||
|
Depreciation of property and equipment
|
-- | (15,068 | ) | -- | (13,163 | ) | ||||||||||
|
Accreted interest on put
|
-- | 551 | 142 | |||||||||||||
|
Contingency loss on lawsuit
|
-- | 321 | 321 | |||||||||||||
|
Other
|
-- | 78 | --- | (308 | ) | |||||||||||
|
Net asset/liability
|
$ | 82 | $ | (18,591 | ) | $ | 127 | $ | (15,369 | ) | ||||||
The income tax provision differs from the amount using the statutory federal income tax rate of 35% for the following reasons (amounts in thousands):
|
Years Ended December 31,
|
||||||||||||||||||||||||
|
2010
|
2009
|
2008
|
||||||||||||||||||||||
|
Amount
|
%
|
Amount
|
%
|
Amount
|
%
|
|||||||||||||||||||
|
Tax expense at the U.S. federal statutory rate
|
$ | 12,773 | 35.0 | % | $ | 13,228 | 35.0 | % | $ | 10,149 | 35.0 | % | ||||||||||||
|
State franchise and income tax based on income, net of refunds and federal tax benefits
|
879 | 2.4 | 233 | 0.6 | 195 | 0.7 | ||||||||||||||||||
|
Taxes on subsidiaries’ and joint ventures’ earnings attributable to noncontrolling interests owners
|
(2,498 | ) | (6.8 | ) | (638 | ) | (1.7 | ) | (319 | ) | (1.1 | ) | ||||||||||||
|
Tax benefits of Domestic Production Activities Deduction
|
(500 | ) | (1.4 | ) | (563 | ) | (1.5 | ) | -- | -- | ||||||||||||||
|
Non-taxable interest income
|
(494 | ) | (1.4 | ) | (23 | ) | -- | (35 | ) | -- | ||||||||||||||
|
Other permanent differences
|
110 | 0.3 | 30 | 0.1 | 35 | -- | ||||||||||||||||||
|
Income tax expense
|
$ | 10, 270 | 28.1 | % | $ | 12,267 | 32.5 | % | $ | 10,025 | 34.6 | % | ||||||||||||
The Company utilized approximately $3.5 million of excess compensation carry-forwards from the exercise of stock options to offset taxable income in 2008. The utilization of these excess compensation benefits for tax purposes reduced taxes payable and increased additional paid-in capital for financial statement purposes by $1.2 million in 2008.
As a result of the Company’s detailed analysis, management has determined that the Company does not have any material uncertain tax positions.
6. Costs and Estimated Earnings and Billings on Uncompleted Contracts
Billing practices for our contracts are governed by the contract terms of each project based on progress towards completion approved by the owner, achievement of milestones or pre-agreed schedules. Billings do not necessarily correlate with revenue recognized under the percentage-of-completion method of accounting. The current liability, “Billings in excess of costs and estimated earnings on uncompleted contracts" represents billings in excess of revenues recognized. The current asset, “Costs and estimated earnings in excess of billings on uncompleted contracts” represents revenues recognized in excess of amounts billed to the customer, which are usually billed during normal billing processes following achievement of contractual requirements.
The two tables below set forth the costs incurred and earnings accrued on uncompleted contracts (revenues) versus the billings on those contracts through December 31, 2010 and 2009 and reconcile the net excess billings to the amounts included in the consolidated balance sheets at those dates.
|
As of December 31,
|
||||||||
|
2010
|
2009
|
|||||||
|
Costs incurred and estimated earnings on uncompleted contracts
|
$ | 855,611 | $ | 705,566 | ||||
|
Billings on uncompleted contracts
|
(863,360 | ) | (730,725 | ) | ||||
|
Excess of billings over costs incurred and
estimated earnings on uncompleted contracts
|
$ | (7,749 | ) | $ | (25,159 | ) | ||
Included in the accompanying balance sheets under the following captions:
|
As of December 31,
|
||||||||
|
2010
|
2009
|
|||||||
|
Costs and estimated earnings in excess of billings on uncompleted contracts
|
$ | 10,058 | $ | 5,973 | ||||
|
Billings in excess of costs and estimated earnings
on uncompleted contracts
|
(17,807 | ) | (31,132 | ) | ||||
|
Excess of billings over costs incurred and estimated earnings on uncompleted contracts
|
$ | (7,749 | ) | $ | (25,159 | ) | ||
Revenues recognized and billings on uncompleted contracts include cumulative amounts recognized as revenues and billings in prior years, including in 2009, amounts recognized and billed by RLW prior to its acquisition by Sterling.
7. Stock Options and Warrants
Stock Options and Grants
In 2001, the Board of Directors adopted and the shareholders approved the 2001 Stock Incentive Plan (the “2001 Plan”). The 2001 Plan provides for the issuance of stock awards for up to 1,000,000 shares of the Company's common stock. The plan is administered by the Compensation Committee of the Board of Directors. In general, the plan provides for all grants to be issued with a per-share exercise price equal to the fair market value of a share of common stock on the date of grant. The original terms of the grants typically do not exceed 10 years. Stock options generally vest over a three to five year period.
The Company's and its subsidiaries' directors, officers, employees, consultants and advisors are eligible to be granted awards under the 2001 plan.
At December 31, 2010 there were 335,454 shares of common stock available under the 2001 Plan for issuance pursuant to future stock option and share grants. No options are outstanding and no shares are or will be available for grant under the Company’s other option plans, all of which have been terminated.
The 2001 plan provides for restricted stock grants and in May 2010, 2009 and 2008 pursuant to nonemployee director compensation arrangements, non-employee directors of the Company were awarded restricted stock with one-year vesting as follows:
|
Years Ended December 31,
|
||||||||||||
|
2010
|
2009
|
2008
|
||||||||||
|
Shares awarded to each non-employee director
|
3,147 | 2,800 | 2,564 | |||||||||
|
Total shares awarded
|
25,176 | 19,600 | 17,948 | |||||||||
|
Grant-date market price per share
|
$ | 15.89 | $ | 17.86 | $ | 19.50 | ||||||
|
Total compensation cost attributable to shares awarded
|
$ | 400,000 | $ | 350,000 | $ | 350,000 | ||||||
|
Compensation cost recognized related to current and prior year awards
|
$ | 283,333 | $ | 233,000 | $ | 129,000 | ||||||
In 2010, 2009 and 2008, several key employees were granted an aggregated total of 10,714, 8,366 and 5,672 shares of restricted stock, respectively, with a market value of $15.89, $17.45 and $18.16 per share, respectively, resulting in compensation expense of $170,000, $146,000 and $103,000, respectively, to be recognized ratably over the five-year restriction periods.
The following tables summarize the stock option activity under the 2001 Plan and previously active plans:
|
2001 Plan
|
1994 Non-Employee Director Plan
|
1994 Omnibus Plan
|
||||||||||||||||||||||
|
Shares
|
Weighted Average Exercise Price
|
Shares
|
Weighted Average Exercise Price
|
Shares
|
Weighted Average Exercise Price
|
|||||||||||||||||||
|
Outstanding at January 1, 2008
|
457,140 | $ | 9.06 | 10,166 | $ | 0.93 | 76,190 | $ | 0.88 | |||||||||||||||
|
Exercised
|
(45,940 | ) | $ | 2.81 | (10,166 | ) | $ | 0.93 | (76,190 | ) | $ | 0.88 | ||||||||||||
|
Expired/forfeited
|
(200 | ) | $ | 25.21 | -- | -- | ||||||||||||||||||
|
Outstanding at December 31, 2008
|
411,000 | $ | 9.75 | -- | -- | |||||||||||||||||||
|
Exercised
|
(89,640 | ) | $ | 3.10 | -- | -- | ||||||||||||||||||
|
Expired/forfeited
|
(1,620 | ) | $ | 2.65 | -- | -- | ||||||||||||||||||
|
Outstanding at December 31, 2009
|
319,740 | $ | 11.65 | -- | -- | |||||||||||||||||||
|
Exercised
|
(111,620 | ) | $ | 6.21 | -- | -- | ||||||||||||||||||
|
Expired/forfeited
|
(41,580 | ) | $ | 13.41 | -- | -- | ||||||||||||||||||
|
Outstanding at December 31, 2010
|
166,540 | $ | 14.85 | -- | -- | |||||||||||||||||||
The following table summarizes information about stock options outstanding and exercisable at December 31, 2010:
| Options Outstanding | Options Excercisable | |||||||||||||
|
Range of Exercise Price Per Share
|
Number of Shares
|
Weighted Average Remaining Contractual Life (years)
|
Weighted Average
|
Number of Shares |
Weighted Average
|
|||||||||
| $ | 0.94-$1.50 | 10,200 | 0.56 | $ | 1.50 | 10,200 | $ | 1.50 | ||||||
| $ | 1.73-$2.00 | 13,200 | 1.56 | $ | 1.73 | 13,200 | $ | 1.73 | ||||||
| $ | 2.75-$3.38 | 48,033 | 3.25 | $ | 3.08 | 48,033 | $ | 3.09 | ||||||
| $ | 18.99 | 13,707 | 6.61 | $ | 18.99 | 13,707 | $ | 18.99 | ||||||
| $ | 21.60 | 2,800 | 1.55 | $ | 21.60 | 2,800 | $ | 21.60 | ||||||
| $ | 24.96 | 62,800 | 0.55 | $ | 24.96 | 62,800 | $ | 24.96 | ||||||
| $ | 25.21 | 15,800 | 0.69 | $ | 25.21 | 12,720 | $ | 25.21 | ||||||
| 166,540 | 1.94 | $ | 14.85 | 163,460 | $ | 14.65 | ||||||||
|
Number of Shares
|
Aggregate intrinsic value
|
|||||||
|
Total outstanding in-the-money options at December 31, 2010
|
71,433 | $ | 745,404 | |||||
|
Total vested in-the-money options at December 31, 2010
|
71,433 | $ | 745,404 | |||||
|
Total options exercised during 2010
|
111,620 | $ | 838,277 | |||||
For unexercised options, aggregate intrinsic value represents the total pretax intrinsic value (the difference between the Company’s closing stock price on December 31, 2010 and the exercise price, multiplied by the number of in-the-money option shares) that would have been received by the option holders had all option holders exercised their options and sold them on December 31, 2010. For options exercised during 2010, aggregate intrinsic value represents the total pretax intrinsic value based on the Company’s closing stock price on the day of exercise.
The risk-free interest rate is based upon interest rates that match the contractual terms of the stock option grants. The expected volatility is based on historical observation and recent price fluctuations. The expected life is based on evaluations of historical and expected future employee exercise behavior, which is not less than the vesting period of the options. The Company does not currently pay dividends.
Pre-tax deferred compensation expense for stock options and restricted stock grants was $594,000 ($386,000 after tax benefit of 35.0%), $405,000 ($263,000 after tax benefit of 35.0%), and $517,000 ($336,000 after tax benefit of 35.0%), in 2010, 2009 and 2008, respectively. Proceeds received by the Company from the exercise of options in 2010, 2009 and 2008 were $692,000, $277,000, and $205,000, respectively. At December 31, 2010, total unrecognized stock-based compensation expense related to unvested stock options was approximately $30,000, which is expected to be recognized over a weighted average period of approximately 0.6 years.
Warrants
Warrants attached to zero coupon notes (which notes were subsequently paid off) were issued to certain members of TSC management and to certain stockholders in 2001. These ten-year warrants to purchase shares of the Company's common stock at $1.50 per share became exercisable 54 months from the July 2001 issue date, except that one warrant covering 322,661 shares by amendment became exercisable 42 months from the issue date. The following table shows the warrant shares outstanding and the proceeds that have been received by the Company from exercises during the three years ended December 31, 2010.
|
Warrants Exercised
|
||||||||||||
|
Shares
|
Company’s Proceeds of Exercise
|
Year-End Warrant Share Balance
|
||||||||||
|
Warrants outstanding on January 1, 2008
|
-- | -- | 356,266 | |||||||||
|
Warrants exercised in 2008
|
22,220 | $ | 33,330 | 334,046 | ||||||||
|
Warrants exercised in 2009
|
19,634 | $ | 29,451 | 314,412 | ||||||||
|
Warrants exercised in 2010
|
238,981 | $ | 358,471 | 75,431 | ||||||||
8. Employee Benefit Plans
The Company and its subsidiaries maintain a defined contribution profit-sharing plan (401(k)) covering substantially all non-union persons employed by the Company and its subsidiaries, whereby employees may contribute a percentage of compensation, limited to maximum allowed amounts under the Internal Revenue Code. The Plan provides for discretionary employer contributions, the level of which, if any, may vary by subsidiary and is determined annually by each company's board of directors. The Company made aggregate matching contributions of $430,000, $341,000, and $322,000 for the years ended December 31, 2010, 2009 and 2008, respectively.
One of the Company’s subsidiaries is signature to three collective bargaining agreements and pays pension, health and post retirement contributions to multi-employer benefit plans of those unions. Contributions to those plans amounted to $1.5 million in 2010.
9. Operating Leases
The Company leases office space in Texas, Utah and Nevada.
In 2006 and 2007, the Company entered into several long-term operating leases for equipment with lease terms of approximately three to five years. Certain of these leases allow the Company to purchase the equipment on or before the end of the lease term. If the Company does not purchase the equipment, it is returned to the lessor. Two leases obligate the Company to pay a guaranteed residual not to exceed 35% of the original equipment cost. The Company is accruing the liability for both leases, which is not expected to exceed $190,000 in the aggregate.
Minimum annual rentals for all operating leases having initial non-cancelable lease terms in excess of one year are as follows (in thousands):
|
Years Ending December 31,
|
|
|||
|
2011
|
$ | 1,048 | ||
|
2012
|
511 | |||
|
2013
|
473 | |||
|
2014
|
473 | |||
|
2015
|
448 | |||
|
Thereafter
|
3,572 | |||
|
Total future minimum rental payments
|
$ | 6,525 | ||
Total rent expense for all operating leases amounted to approximately $1,229,000, $765,000, and $767,000 in fiscal years 2010, 2009 and 2008, respectively.
10. Customers
The following table shows contract revenues generated from the Company’s customers that accounted for more than 10% of revenues (dollars in thousands):
|
Years Ended December 31,
|
||||||||||||||||||||||||
|
2010
|
2009
|
2008
|
||||||||||||||||||||||
|
Contract Revenues
|
% of Revenues
|
Contract Revenues
|
% of Revenues
|
Contract Revenues
|
% of Revenues
|
|||||||||||||||||||
|
Texas Department of Transportation (“TXDOT”)
|
$ | 95,198 | 20.7 | % | $ | 81,599 | 20.9 | % | $ | 162,041 | 39.2 | % | ||||||||||||
|
Utah Department of Transportation (“UDOT”)
|
$ | 120,492 | 26.2 | % | ** | ** | N/A | * | N/A | * | ||||||||||||||
|
Nevada Department of Transportation (“NDOT”)
|
** | ** | 92,137 | 23.6 | % | 88,159 | 21.3 | % | ||||||||||||||||
|
North Texas TollRoad Authority (“NTTA”)
|
** | ** | 52,183 | 13.4 | % | ** | ** | |||||||||||||||||
|
*N/A related to RLW not acquired until December 03,2009
|
||||||||||||||||||||||||
|
**Represents less than 10% of revenues
|
||||||||||||||||||||||||
At December 31, 2010, TXDOT ($10.8 million), UDOT ($10.1 million) and the Utah Transit Authority ($9.6 million) each owed balances to the Company greater than 10% of contracts receivable. At December 31, 2009, TXDOT ($15.7 million) and UDOT ($15.3 million) each owed balances to the Company greater than 10% of contracts receivable.
11. Equity Offerings
In December 2009, the Company completed a public offering of 2.76 million shares of its common stock at $18.00 per share. The Company received proceeds of $46.8 million, net of underwriting discounts, commissions and direct offering expenses. The Company used the proceeds to replenish its cash and short-term investments used to acquire its interest in RLW.
12. Acquisition and noncontrolling interests
Ralph L. Wadsworth Construction Company, LLC (“RLW”)
On December 3, 2009, we completed the acquisition of privately-owned RLW, a Utah limited liability company which is headquartered in Draper, Utah, near Salt Lake City. RLW is a heavy civil construction business focused on the construction of bridges and other structures, roads and highways, and light and commuter rail projects, primarily in Utah, with licenses to do business in surrounding states. We paid approximately $63.9 million to acquire 80% of the equity interests in RLW. A portion ($4.5 million) of the cash purchase price was placed in escrow for eighteen months as security for any breach of representations and warranties made by the sellers. The purchase price was funded from the Company’s available cash and short-term investments.
RLW’s largest customer is UDOT, which is responsible for planning, constructing, operating and maintaining the 6,000 miles of highway and over 1,700 bridges that make up the Utah state highway system. RLW strives to provide efficient, timely and profitable execution of construction projects, with a particular emphasis on structures and innovative construction methods. RLW has significant experience in obtaining and profitably executing “design-build” and “CM/GC” (construction manager/general contractor) projects.
The noncontrolling interest owners of RLW, who are related and also its executive management, have the right to require the Company to buy their remaining 20.0% interest in RLW ("the Put") and, concurrently, the Company has the right to require those owners to sell their 20.0% interest to the Company ("the Call"), in 2013. The purchase price in each case is 20% of the product of the simple average of RLW’s EBITDA (income before interest, taxes, depreciation and amortization) for the calendar years 2010, 2011 and 2012 times a multiple of a minimum of 4 and a maximum of 4.5. The noncontrolling owners’ interests, including the Put, were recorded at their estimated fair value at the date of acquisition as "Noncontrolling owners’ interests in subsidiary” in the accompanying consolidated balance sheet.
Annual interest will be accredited for the Put of the noncontrolling owners’ interests based on the Company’s borrowing rate under its Credit Facility plus two percent. Such accretion, included in “Noncontrolling owners’ interests in subsidiaries” and “Interest expense” in the accompanying consolidated balance sheet and statement of operations, respectively, amounted to $0.8 million for the year ended December 31, 2010. Any other changes to the estimated fair value of the Put will be reported as income or expense in the consolidated statement of operations.
The purchase agreement restricts the sellers from competing against the business of the Company and its subsidiaries and from soliciting their employees for a period of four years after the closing of the purchase.
The following table summarizes the initial allocation of the purchase price for RLW (in thousands):
|
Assets acquired and liabilities assumed:
|
||||
|
Current assets, including cash of $3,370
|
$ | 43,053 | ||
|
Current liabilities
|
(31,953 | ) | ||
|
Working capital acquired
|
11,100 | |||
|
Property and equipment
|
11,212 | |||
|
Total tangible net assets acquired at fair value
|
22,312 | |||
|
Goodwill
|
57,513 | |||
|
Total consideration
|
79,825 | |||
|
Fair value of noncontrolling owners' interests in RLW, including Put
|
(15,965 | ) | ||
|
Cash paid
|
$ | 63,860 | ||
The purchase price allocation has been finalized, and our analysis of the assets acquired indicates that there are no material separately identifiable intangible assets. The goodwill attributable to the acquisition is deductible for tax purposes over 15 years.
The operations of RLW are included in the accompanying consolidated statements of operations and cash flows for the month of December 2009 and the year ended December 31, 2010. Supplemental information on an unaudited pro forma combined basis, for the Company as if the RLW acquisition had been consummated at the beginning of 2008, is as follow (in thousands, except per share amounts):
|
2009 (unaudited)
|
2008 (unaudited)
|
|||||||
|
Revenues
|
$ | 546,747 | $ | 541,196 | ||||
|
Net income attributable to Sterling common stockholders
|
$ | 43,475 | $ | 28,054 | ||||
|
Diluted net income per share attributable to Sterling common stockholders
|
$ | 3.14 | $ | 2.05 | ||||
For the eleven months ended November 30, 2009, RLW had unaudited revenues of approximately $155.9 million and unaudited income before taxes of approximately $37.9 million. The profitability of RLW for the eleven month period was higher than what was expected to continue due to some unusually high margin contracts in 2009.
Road and Highway Builders, LLC (“RHB”)
On October 31, 2007, the Company purchased a 91.67% interest in RHB and all of the outstanding capital stock of RHB Inc, then an inactive Nevada corporation. These entities were affiliated through common ownership and have been included in the Company's consolidated results since the date of acquisition.
The following table summarizes the allocation of the purchase price of $54.1 million, including related direct acquisition costs for RHB (in thousands):
|
Tangible assets acquired at estimated fair value, including approximately $10,000 of property, plant and equipment
|
$ | 19,334 | ||
|
Current liabilities assumed
|
(9,686 | ) | ||
|
Goodwill
|
44,496 | |||
|
Total
|
$ | 54,144 |
Ten percent of the cash purchase price was placed in escrow for eighteen months as security for any breach of representations and warranties made by the sellers. The escrow was released in full during 2009.
The noncontrolling interest owner of RHB has the right to put, or require the Company to buy, his remaining 8.33% interest in the subsidiary and, concurrently, the Company has the right to require that the owner sell his 8.33% interest to the Company, beginning in 2011. The purchase price in each case is 8.33% of the product of six times the simple average of the subsidiary's EBITDA (income before interest, taxes, depreciation and amortization) for the calendar years 2008, 2009 and 2010. The Company and the noncontrolling interest owner are in negotiations to extend the date of the put/call; however, the terms of any extension have not been finalized.
At the date of acquisition, the difference between the noncontrolling owner's interest in the historical basis of the subsidiary and the estimated fair value of that interest, including the Put, was recorded as Noncontrolling owner's interest in subsidiary and a reduction in additional paid-in-capital as required by GAAP then in effect. Annual interest expense ($362,000, $206,000 and $199,000 for the years ended December 31, 2010, 2009 and 2008, respectively) has been accreted on the Put and included in the noncontrolling owners’ interests in subsidiaries in the balance sheet based on the discount rate used to calculate the fair value. Any other changes to the estimated fair value of the Put related to this noncontrolling interest will be recorded as a corresponding change in additional paid-in-capital as this acquisition was made prior to a change in accounting for noncontrolling interests, which became effective January 1, 2009.
Based on RHB's operating results for 2008 and 2010, the Company revised its estimate of the fair value of the noncontrolling interest at December 31, 2008 and 2010 and recorded an increase (reduction) in the related liability of $(607,000) and $691,000 in 2008 and 2010, respectively, and contra amounts to paid-in-capital. Management determined that no revision to such fair value was required at December 31, 2009.
The purchase agreement restricts the sellers from competing against the business of RHB and from soliciting its employees for a period of four years after the closing of the purchase.
Changes in noncontrolling interests
The following table summarizes the changes in the noncontrolling owners’ interests in subsidiaries and consolidated joint ventures for the years ended December 31, 2008 through 2010 (in thousands):
|
Years Ended December 31,
|
||||||||||||
|
2010
|
2009
|
2008
|
||||||||||
|
Balance, beginning of period
|
$ | 23,887 | $ | 6,300 | $ | 6,362 | ||||||
|
Fair value of noncontrolling interest, including Put, related to purchase of RLW
|
-- | 15,965 | -- | |||||||||
|
Noncontrolling owners' interests in earnings of subsidiaries and joint ventures
|
7,137 | 1,824 | 908 | |||||||||
|
Accretion of interest on Puts
|
1,169 | 206 | 199 | |||||||||
|
Change in fair value of Put of RHB
|
691 | -- | (607 | ) | ||||||||
|
Distributions to noncontrolling interests owners
|
(4,160 | ) | (408 | ) | (562 | ) | ||||||
|
Balance, end of period
|
$ | 28,724 | $ | 23,887 | $ | 6,300 | ||||||
13. Commitments and Contingencies
Employment Agreements:
Certain officers of the Company, including the Chief Executive, Operating and Financial Officers, and officers of its subsidiaries had employment agreements which ran through December 31, 2010, and provided for payments of annual salary, deferred salary, incentive bonuses and certain benefits if their employment is terminated without cause. During the first quarter of 2011, certain of these contracts, which expired on December 31, 2010, are expected to be renewed through December 31, 2013, with the terms adjusted to take into consideration the recommendation of an executive compensation consultant to the Company.
Self-Insurance:
The Company is self-insured for employee health claims. Its policy is to accrue the estimated liability for known claims and for estimated claims that have been incurred but not reported as of each reporting date. The Company has obtained reinsurance coverage for the policy period as follows:
|
|
• Specific excess reinsurance coverage for medical and prescription drug claims per insured person in excess of $60,000 within a plan year with a maximum lifetime reimbursement of $2,000,000.
|
|
|
• Aggregate reinsurance coverage for medical and prescription drug claims within a plan year with a maximum of $1.0 million in excess of an aggregate deductible of $2.0 million.
|
For the twelve months ended December 31, 2010, 2009 and 2008, the Company incurred $1.1 million, $2.1 million, and $1.5 million, respectively, in expenses related to this plan.
The Company and its subsidiaries, other than RLW, are also self-insured for workers’ compensation claims up to $250,000 per occurrence, with a maximum aggregate liability of $2.7 million per year. The Company's policy is to accrue the estimated liability for known claims and for estimated claims that have been incurred but not reported as of each reporting date. At December 31, 2010 and 2009, the Company had recorded an estimated liability of $1,101,000 and $1,174,000, respectively, which it believes is adequate for such claims based on its claims history and an actuarial study. The Company has a safety and training program in place to help prevent accidents and injuries and works closely with its employees and the insurance company to monitor all claims. RLW has purchased insurance to cover its workers' compensation losses.
The Company obtains bonding on construction contracts through Travelers Casualty and Surety Company of America. As is customary in the construction industry, the Company indemnifies Travelers for any losses incurred by it in connection with bonds that are issued. The Company has granted Travelers a security interest in accounts receivable and contract rights for that obligation.
Guarantees:
The Company typically indemnifies contract owners for claims arising during the construction process and carries insurance coverage for such claims, which in the past have not been material.
The Company’s Certificate of Incorporation provides for indemnification of its officers and directors. The Company has a Director and Officer insurance policy that limits its exposure. At December 31, 2010, the likelihood of incurring a payment obligation in connection with this guarantee is believed to be remote.
Litigation:
In January 2010, a jury trial was held to resolve a dispute between a subsidiary of the Company and a subcontractor. The jury rendered a verdict of $1.0 million against the subsidiary, exclusive of interest, court costs and attorney's fees. While the Company has recorded this verdict as an expense in the accompanying consolidated financial statements, the Company has appealed this judgment as it believes, as a matter of law, that the jury erred in its decision. The Company has posted a bond of $1.3 million to cover the judgment and estimated court costs and attorney’s fees pending the results of the appeal, which may not be heard until 2013.
The Company is the subject of certain other claims and lawsuits occurring in the normal course of business. Management, after consultation with legal counsel, does not believe that the outcome of these other actions will have a material impact on the financial statements of the Company.
Purchase Commitments:
To manage the risk of changes in material prices and subcontracting costs used in tendering bids for construction contracts, most of the time, we obtain firm quotations from suppliers and subcontractors before submitting a bid. These quotations do not include any quantity guarantees. As soon as we are advised that our bid is the lowest, we enter into firm contracts with most of our materials suppliers and sub-contractors, thereby mitigating the risk of future price variations affecting the contract costs.
14. Related Party Transactions
RLW has historically performed construction contracts for its noncontrolling interest owners (who are also executive managers of RLW, including Mr. Kip Wadsworth who is also a member of the board of directors of the Company). Such noncontrolling interest owners are 18% owners of a privately-held renewable energy development company with which RLW has the first right to perform construction-management services for an estimated contract of between $5 million and $10 million. The proposed project, which will take approximately six to twelve months to complete, consists of the erection of 58 solar towers in California.
The noncontrolling interest owners are also 100% owners of a company with which RLW has a service agreement to provide monthly professional and other services (accounting, payroll, reimbursement, computer and postage) for approximately $40,000 per month. The Company leases its main office for its Utah operations from a second company which is 100% owned by these owners for $215,040 annually plus common area maintenance charges of approximately $80,000 per year. The office lease expires in 2022. Also, the Company leases its equipment maintenance shop for its Utah operations from a third company, which is also 100% owned by those owners, for $169,740 annually. The shop lease expires in 2022. The Company also leases field housing for its Utah operations from a company owned by the noncontrolling interest owners for $46,000 annually. This lease expires in 2014. The Company is performing certain construction contracts for an entity owned by the noncontrolling interest owners. Revenues on these contracts amounted to $1.3 million in 2010 with a remaining backlog of these contracts of $0.1 million at December 31, 2010. Management has reviewed each of these transactions and believes the prices being charged to or by RLW are competitive with what third parties would charge or pay.
During 2009, another of the Company's subsidiaries started purchasing materials for specific contracts of that subsidiary from a company owned by a member of management of that subsidiary. The purchases amounted to approximately $4.5 million in 2010 and $9.3 million in 2009. A deposit of $1.6 million made at December 31, 2009, was applied toward the $4.5 million of purchases of such material in 2010. A member of senior management of the Company reviewed all such purchases before they were transacted.
In 2008, the Company paid approximately $0.4 million to two companies (women-owned businesses) owned by the wife of the Company’s Chief Executive Officer for materials and services. In late 2008, the Company stopped making purchases from these companies.
15. Capital Structure
Holders of common stock are entitled to one vote for each share on all matters voted upon by the stockholders, including the election of directors, and do not have cumulative voting rights. Subject to the rights of holders of any then outstanding shares of preferred stock, common stockholders are entitled to receive ratably any dividends that may be declared by the Board of Directors out of funds legally available for that purpose. Holders of common stock are entitled to share ratably in net assets upon any dissolution or liquidation after payment of provision for all liabilities and any preferential liquidation rights of our preferred stock then outstanding. Common stock shares are not subject to any redemption provisions and are not convertible into any other shares of capital stock. The rights, preferences and privileges of holders of common stock are subject to those of the holders of any shares of preferred stock that may be issued in the future.
The Board of Directors may authorize the issuance of one or more classes or series of preferred stock without stockholder approval and may establish the voting powers, designations, preferences and rights and restrictions of such shares. No preferred shares have been issued.
During 2010, the Board of Directors authorized the repurchase of up to $10 million of the Company’s common stock based upon terms acceptable to management. The specific timing and amount of repurchase will vary based on market conditions, securities law limitations and other factors. No shares were repurchased in 2010.
During 2010, one of the members of the Company’s Board of Directors resigned and forfeited 3,147 shares of restricted common stock awarded to him in May 2010. Such stock, which was held as treasury stock at December 31, 2010, was cancelled from issued shares in 2011.
The total number of authorized shares of the Company’s common stock reserved as of December 31, 2010 for our stock-based compensation plans and warrants was 335,454.
16. Quarterly Financial Information (Unaudited)
|
2010 Quarters Ended (unaudited)
|
||||||||||||||||||||
|
March 31
|
June 30
|
September 30
|
December 31
|
Total
|
||||||||||||||||
|
(Dollar amounts in thousands, except per share data)
|
||||||||||||||||||||
|
Revenues
|
$ | 86,157 | $ | 116,865 | $ | 118,874 | $ | 137,997 | $ | 459,893 | ||||||||||
|
Gross profit
|
8,249 | 12,707 | 12,998 | 28,751 | 62,705 | |||||||||||||||
|
Income before income taxes and earnings attributable to noncontrolling interests
|
3,138 | 8,113 | 6,545 | 18,698 | 36,494 | |||||||||||||||
|
Net income attributable to Sterling common stockholders
|
1,552 | 4,667 | 3,496 | 9,372 | 19,087 | |||||||||||||||
|
Net income attributable to Sterling common stockholders per share:
Basic
|
$ | 0.10 | $ | 0.29 | $ | 0.21 | $ | 0.55 | $ | 1.15 | ||||||||||
|
Diluted
|
$ | 0.09 | $ | 0.29 | $ | 0.21 | $ | 0.54 | $ | 1.13 | ||||||||||
|
2009 Quarters Ended (unaudited)
|
||||||||||||||||||||
|
March 31
|
June 30
|
September 30
|
December 31
|
Total
|
||||||||||||||||
|
(Dollar amounts in thousands, except per share data)
|
||||||||||||||||||||
|
Revenues
|
$ | 94,866 | $ | 120,375 | $ | 103,929 | $ | 71,677 | $ | 390,847 | ||||||||||
|
Gross profit
|
11,811 | 18,579 | 16,542 | 7,437 | 54,369 | |||||||||||||||
|
Income before income taxes and earnings attributable to noncontrolling interests
|
8,785 | 14,791 | 13,041 | 1.178 | 37,795 | |||||||||||||||
|
Net income attributable to Sterling common stockholders
|
5,565 | 9,285 | 8,092 | 762 | 23,704 | |||||||||||||||
|
Net income attributable to Sterling common stockholders per share:
Basic
|
$ | 0.42 | $ | 0.70 | $ | 0.61 | $ | 0.04 | $ | 1.77 | ||||||||||
|
Diluted
|
$ | 0.41 | $ | 0.68 | $ | 0.59 | $ | 0.03 | $ | 1.71 | ||||||||||
Exhibit Index
|
Number
|
Exhibit Title
|
|
2.1
|
Purchase Agreement by and among Richard H. Buenting, Fisher Sand & Gravel Co., Thomas Fisher and Sterling Construction Company, Inc. dated as of October 31, 2007 (incorporated by reference to Exhibit number 2.1 to Sterling Construction Company, Inc.'s Current Report on Form 8-K, Amendment No. 1 filed on November 21, 2007 (SEC File No. 1-31993)).
|
|
2.2
|
Purchase Agreement, dated as of December 3, 2009, by and among Kip Wadsworth, Ty Wadsworth, Con Wadsworth, Tod Wadsworth and Sterling Construction Company, Inc. (incorporated by reference to Exhibit 2.1 to Sterling Construction Company, Inc.'s Current Report on Form 8 K, filed on December 3, 2009 (SEC File No. 1-31993))
|
|
3.1
|
Certificate of Incorporation of Sterling Construction Company, Inc. (incorporated by reference to Exhibit 3.0 to Sterling Construction Company, Inc.'s Quarterly Report on Form 10-Q, filed on August 10, 2009 (SEC File No. 1-31993)).
|
|
3.2
|
Bylaws of Sterling Construction Company, Inc. as amended through March 13, 2008 (incorporated by reference to Exhibit 3.1 to Sterling Construction Company, Inc.'s Current Report on Form 8-K, filed on March 19, 2008 (SEC File No. 1-31993)).
|
|
4.1
|
Form of Common Stock Certificate of Sterling Construction Company, Inc. (incorporated by reference to Exhibit 4.5 to its Form 8-A, filed on January 11, 2006 (SEC File No. 1-31993)).
|
|
10.1#
|
Oakhurst Company, Inc. 2001 Stock Incentive Plan (incorporated by reference to Exhibit 10.6 to Sterling Construction Company, Inc.'s Registration Statement on Form S-1, filed on November 17, 2005 (SEC File No. 333-129780)).
|
|
10.2#
|
Forms of Stock Option Agreement under the Oakhurst Company, Inc. 2001 Stock Incentive Plan (incorporated by reference to Exhibit 10.51 to Sterling Construction Company, Inc.'s Annual Report on Form 10-K for the year ended December 31, 2004, filed on March 29, 2005 (SEC File No. 1-31993)).
|
|
10.3#
|
Summary of the Compensation Plan for Non-Employee Directors of Sterling Construction Company, Inc. (incorporated by reference to Exhibit 10.1 to Sterling Construction Company, Inc.'s Quarterly Report on Form 10-Q, filed on August 11, 2008 (SEC File No. 1-31993)).
|
|
10.4
|
Credit Agreement by and among Sterling Construction Company, Inc., Texas Sterling Construction Co., Oakhurst Management Corporation and Comerica Bank and the other lenders from time to time party thereto, and Comerica Bank as administrative agent for the lenders, dated as of October 31, 2007 (incorporated by reference to Exhibit 10.1 to Sterling Construction Company, Inc.'s Current Report on Form 8-K, Amendment No. 1 filed on November 21, 2007 (SEC File No. 1-31993)).
|
|
10.5
|
Security Agreement by and among Sterling Construction Company, Inc., Texas Sterling Construction Co., Oakhurst Management Corporation and Comerica Bank as administrative agent for the lenders, dated as of October 31, 2007 (incorporated by reference to Exhibit 10.4 to Sterling Construction Company, Inc.'s Quarterly Report on Form 10-Q, filed on November 9, 2009 (SEC File No. 1-31993)).
|
|
10.6
|
Joinder Agreement by Road and Highway Builders, LLC and Road and Highway Builders Inc. dated as of October 31, 2007 (incorporated by reference to Exhibit 10.3 to Sterling Construction Company, Inc.'s Current Report on Form 8-K, Amendment No. 1 filed on November 21, 2007 (SEC File No. 1-31993)).
|
|
10.7#
|
Employment Agreement dated as of July 19, 2007 between Sterling Construction Company, Inc. and Patrick T. Manning (incorporated by reference to Exhibit 10.1 to Sterling Construction Company, Inc.'s Current Report on Form 8-K filed on January 17, 2008 (SEC File No. 1-31993))
|
|
10.8#
|
Employment Agreement dated as of July 19, 2007 between Sterling Construction Company, Inc. and Joseph P. Harper, Sr. (incorporated by reference to Exhibit 10.2 to Sterling Construction Company, Inc.'s Current Report on Form 8-K filed on January 17, 2008 (SEC File No. 1-31993))
|
|
10.09#
|
Employment Agreement dated as of July 16, 2007 between Sterling Construction Company, Inc. and James H. Allen, Jr. (incorporated by reference to Exhibit 10.3 to Sterling Construction Company, Inc.'s Current Report on Form 8-K filed on January 17, 2008 (SEC File No. 1-31993))
|
|
10.10#
|
Option Agreement dated August 7, 2007 between Sterling Construction Company, Inc. and James H. Allen, Jr. (incorporated by reference to Exhibit 10.4 to Sterling Construction Company, Inc.'s Current Report on Form 8-K filed on January 17, 2008 (SEC File No. 1-31993))
|
|
10.11#
|
Employment Agreement dated as of March 17, 2006 between Sterling Construction Company, Inc. and Roger M. Barzun (incorporated by reference to Exhibit 10.11 to Sterling Construction Company, Inc.'s Annual Report on Form 10-K for the year ended December 31, 2009, filed on March 15, 2010 (SEC File No. 1-31993)).
|
|
10.12#
|
Employment Agreement dated as of December 3, 2009 between Ralph L. Wadsworth and Kip L. Wadsworth Barzun (incorporated by reference to Exhibit 10.11 to Sterling Construction Company, Inc.'s Annual Report on Form 10-K for the year ended December 31, 2009, filed on March 15, 2010 (SEC File No. 1-31993)).
|
|
Employment Agreement dated as of July 19, 2007 between Sterling Construction Company, Inc. and Anthony F. Colombo.
|
|
|
Employment Agreement dated as of July 19, 2007 between Sterling Construction Company, Inc. and Joseph P. Harper, Jr.
|
|
|
Employment Agreement dated as of July 19, 2007 between Sterling Construction Company, Inc. and Brian R. Manning.
|
|
|
21
|
Subsidiaries of Sterling Construction Company, Inc.:
Name State of Incorporation or Organization
Texas Sterling Construction Co. Delaware
Road and Highway Builders, LLC Nevada
Road and Highway Builders Inc. Nevada
Road and Highway Builders of California, Inc. California
Ralph L. Wadsworth Construction Company, LLC Utah
Ralph L. Wadsworth Construction Co. LP California
|
|
Consent of Grant Thornton LLP
|
|
|
Certification of Patrick T. Manning, Chief Executive Officer of Sterling Construction Company, Inc.
|
|
|
Certification of James H. Allen, Jr., Chief Financial Officer of Sterling Construction Company, Inc.
|
|
|
Certification pursuant to Section 1350 of Chapter 63 of Title 18 of the United States Code (18 U.S.C. 1350) of Patrick T. Manning, Chief Executive Officer, and James H. Allen, Jr., Chief Financial Officer.
|
|
|
# Management contract or compensatory plan or arrangement.
|
* Filed herewith.
69