UNITED STATES
SECURITIES AND EXCHANGE COMMISSION
Washington, D.C. 20549
FORM 10-K
(Mark One)
| |
|
|
| þ |
|
ANNUAL REPORT PURSUANT TO SECTION 13 OR 15(d) OF THE SECURITIES EXCHANGE
ACT OF 1934 |
For the fiscal year ended December 31, 2010
OR
| |
|
|
| o |
|
TRANSITION REPORT PURSUANT TO SECTION 13 OR 15(d) OF THE SECURITIES
EXCHANGE ACT OF 1934 |
Commission File Number 001-34803
Qlik Technologies Inc.
(Exact name of registrant as specified in its charter)
| |
|
|
| Delaware
|
|
20-1643718 |
| (State or other jurisdiction of incorporation or organization)
|
|
(I.R.S. Employer Identification No.) |
| |
|
|
| 150 N. Radnor Chester Road, Suite E220 |
|
|
| Radnor, Pennsylvania
|
|
19087 |
| (Address of principal executive offices)
|
|
(Zip Code) |
(888) 828-9768
(Registrant’s telephone number, including area code)
Securities registered pursuant to Section 12(b) of the Act:
| |
|
|
| (Title of each class)
|
|
(Name of each exchange on which registered) |
| Common Stock, $0.0001 par value
|
|
The NASDAQ Stock Market LLC |
Securities registered pursuant to Section 12(g) of the Act:
None.
(Title of Class)
Indicate by check mark if the registrant is a well-known seasoned issuer, as defined in Rule
405 of the Securities Act. Yes o No þ
Indicate
by check mark if the registrant is not required to file reports pursuant to Section 13
or Section 15(d) of the Act. Yes o No þ
Indicate by check mark whether the registrant: (1) has filed all reports required to be filed
by Section 13 or 15(d) of the Securities Exchange Act of 1934 during the preceding 12 months (or
for such shorter period that the registrant was required to file such reports), and (2) has been
subject to such filing requirements for the past 90 days. Yes þ No o
Indicate by check mark whether the registrant has submitted electronically and posted on its
corporate Web site, if any, every Interactive Date File required to be submitted and posted
pursuant to Rule 405 of Regulation S-T (232.405 of this chapter) during the preceding 12 months (or
for such shorter period that the registrant was required to submit and post such files). Yes
o No o
Indicate by check mark if disclosure of delinquent filers pursuant to Rule 405 of Regulation
S-K is not contained herein, and will not be contained, to the best of registrant’s knowledge, in
definitive proxy or information statements incorporated by reference in Part III of this Form 10-K
or any amendment to this Form 10-K. o
Indicate by check mark whether the registrant is a large accelerated filer, an accelerated
filed, a non-accelerated filer, or a smaller reporting company. See the definitions of “large
accelerated filer,” “accelerated filer.” and “smaller reporting company” in Rule 12b-2 of the
Exchange Act. (Check one):
| |
|
|
|
|
|
|
| Large accelerated filer o
|
|
Accelerated filer o
|
|
Non-accelerated filer þ
|
|
Smaller reporting company o |
|
|
|
|
|
(Do not check if a smaller reporting company) |
|
|
Indicate by check mark whether the registrant is a shell company (as defined in Rule 12b-2 of
the Exchange Act). Yes o No þ
As
of March 11, 2011, there were 79,013,474 shares of the
registrant’s common stock issued and outstanding. As of June 30, 2010, the last business day of the registrant’s most recently completed second
fiscal quarter, the registrant’s common stock was not listed on any exchange or over-the-counter
market. The registrant’s common stock began trading on The NASDAQ Global Market on July 16, 2010.
As of December 31, 2010, the aggregate market value of shares of common stock held by
non-affiliates of the registrant was $1.0 billion based on the number of shares held by
non-affiliates as of December 31, 2010 and based on the last reported sale price of the
registrant’s common stock on December 31, 2010. For purposes of this disclosure, shares of common
stock held by persons who hold more than 5% of the outstanding shares of common stock and shares
held by executive officers and directors of the registrant have been excluded because such persons
may be deemed to be affiliates. This determination of executive officer or affiliate status is not
necessarily a conclusive determination for other purposes.
DOCUMENTS INCORPORATED BY REFERENCE
Certain portions of the definitive Proxy Statement to be used in connection with the
registrant’s 2011 Annual Meeting of Stockholders are incorporated by reference into Part III of
this Form 10-K to the extent stated. That Proxy Statement will be filed within 120 days of
registrant’s fiscal year ended December 31, 2010.
PART I
Special Note Regarding Forward-Looking Statements
This Annual Report on Form 10-K, except for historical financial information contained
herein, contains forward-looking statements, including, but not limited to, statements regarding
the value and effectiveness of our products, the introduction of product enhancements or additional
products and our growth, expansion and market leadership, that involve risks, uncertainties,
assumptions, and other factors which, if they do not materialize or prove correct, could cause our
results to differ materially from those expressed or implied by such forward-looking statements.
All statements, other than statements of historical fact, are statements that could be deemed
forward-looking statements, including statements containing the words “predicts,” “plan,”
“expects,” “anticipates,” “believes,” “goal,” “target,” “estimate,” “potential,” “may,” “will”,
“might,” “could,” “anticipate,” “momentum,” and similar words. We intend all such forward-looking
statements to be covered by the safe harbor provisions for forward-looking statements contained in
Section 21E of the Securities Exchange Act of 1934, as amended, or the Exchange Act, and the
Private Securities Litigation Reform Act of 1995. Actual results may differ materially from those
projected in such statements due to various factors, including but not limited to:
| |
• |
|
risk and uncertainties inherent in our business; |
| |
• |
|
our ability to attract new customers and retain existing customers; |
| |
• |
|
our ability to effectively sell, service and support our products; |
| |
• |
|
our ability to manage our international operations; |
| |
• |
|
our ability to compete effectively; |
| |
• |
|
our ability to develop and introduce new products and add-ons or enhancements to
existing products; |
| |
• |
|
our ability to continue to promote and maintain our brand in a cost-effective
manner; |
| |
• |
|
our ability to manage growth; |
| |
• |
|
our ability to attract and retain key personnel; |
| |
• |
|
the scope and validity of intellectual property rights applicable to our products; |
| |
• |
|
adverse economic conditions in general and adverse economic conditions
specifically affecting the markets in which we operate; and |
| |
• |
|
other risks discussed in the section titled “Risk Factors,” set forth in Part I,
Item 1A of this Annual Report on Form 10-K and elsewhere in this report. |
Past performance is not necessarily indicative of future results. There can be no assurance
that the actual results or developments anticipated by us will be realized or, even if
substantially realized, that they will have the expected consequences to, or effects on, us.
Therefore, no assurance can be given that the outcomes stated in such forward-looking statements
and estimates will be achieved.
The forward-looking statements in this Annual Report on Form 10-K represent our views as of
the date of this Annual Report on Form 10-K. We anticipate that subsequent events and developments
will cause our views to change. However, while we may elect to update these forward-looking
statements at some point in the future, we undertake no intention or obligation to update or revise
any forward-looking statements, whether as a result of new information, future events or otherwise.
You should, therefore, not rely on these forward-looking statements as representing our views as
of any date subsequent to the date of this Annual Report on Form 10-K.
1
Overview
Qlik Technologies Inc. (“We, QlikTech or the Company”) has pioneered a powerful, user-driven
business intelligence solution that enables our customers to make better and faster business
decisions. Our Business Discovery platform, QlikView, combines enterprise-class analytics and
search functionality with the simplicity and ease-of-use found in office productivity software
tools for a broad set of business users. QlikView is powered by our in-memory associative search
technology, which has utilized rapid advances in computing power to yield significant improvement
in flexibility and performance at a lower cost than traditional business intelligence solutions. We
have grown our customer base from over 4,000 active customers in 2006 to approximately 18,000
active customers as of December 31, 2010 and increased our revenue at a 50.4% compound annual growth rate during the same period.
We added an average of approximately 400 new customers per month during
fiscal year 2010. Our solution addresses the needs of a diverse range of customers from middle
market customers to large enterprises such as Autodesk, Campbell Soup Company, Colonial Life, The
Dannon Company, Inc., Heidelberger Druckmaschinen AG, ING, Kraft Foods, Lifetime Brands, Nasdaq
OMX, National Health Service (NHS), Qualcomm, Symantec and Volvo Car UK Limited. We have customers
in over 100 countries, and approximately 75% of our revenue for the year ended December 31, 2010
was derived internationally.
QlikView empowers business users to navigate data in a manner consistent with the fluid,
associative nature of human thought. Our technology platform enables users to consolidate large,
disparate data sets and discover relationships within data in real time when requested by the user.
QlikView visualizes data in a simple, intuitive user interface that enables users to interactively
explore and analyze information. The ease-of-use and flexibility of QlikView enables a broad set of
business users, such as sales, marketing, human resources and finance professionals; executive
management and other managers; operations, support and information technology (“IT”) staff; data
analysts and statisticians. Examples of QlikView users include:
| |
• |
|
Operations Planner — uses QlikView to prepare inventory forecasts for
a global food manufacturer resulting in significant improvement in
forecast accuracy and reduced transportation and workforce costs |
| |
• |
|
Pharmaceutical Sales Representative — uses QlikView to access current
industry sales trends and doctor prescription history while on a sales
call with a busy physician |
| |
• |
|
Chief Information Officer — uses QlikView to analyze IT spending and
budget information to identify opportunities for cost savings and
service level improvement |
| |
• |
|
Police Sergeant — uses QlikView to maintain a consolidated view of
crime levels and optimize staffing allocations to dispatch police into
high crime areas |
We have a differentiated business model designed to accelerate the adoption of our product by
reducing the time and cost to purchase and implement our software. Our low risk approach to product
sales provides a needed alternative to costly, all-or-nothing, traditional business intelligence
sales models. We initially focus on specific business users or departments within a prospective
customer’s organization and seek to solve a targeted business need. After demonstrating QlikView’s
benefits to initial adopters within an organization, we work to expand sales of our product to
other business units, geographies and use cases with the long-term goal of broad organizational
deployment. We have a diversified distribution model that consists of a direct sales force and a
partner network of resellers, original equipment manufacturers (“OEM”) relationships and systems
integrators. Additionally, our online QlikCommunity provides us with a loyal and growing network of
users who promote our software, provide support for other users and contribute valuable insights
and feedback for our product development efforts.
For the years ended December 31, 2010, 2009 and 2008, our revenue was $226.5 million, $157.4
million and $118.3 million, representing year-over-year growth of 44% in 2010 and 33% in 2009. In
addition, we generated operating income of $27.6 million, $13.2 million and $1.6 million for the
years ended December 31, 2010, 2009 and 2008. For the year ended December 31, 2010, software
license revenue and maintenance revenue comprised 90% of our total revenue and professional
services revenue comprised 10% of our total revenue.
The Company currently operates in one business segment, namely, the development,
commercialization and implementation of software products and related services. See Note 11 to our
consolidated financial statements, Business and Geographical Segment Information, for information
regarding our business and the geographies in which we operate.
2
Our Industry
Use of Business Intelligence and Data Analytics Tools
We believe that to succeed in today’s increasingly competitive markets, businesses must
accelerate the rate at which they identify and respond to changing business conditions. An
organization’s market agility and ultimate success in the global marketplace are dependent upon its
ability to enable business users across organizations to harness the power of increasing volumes of
information to make effective business decisions. In seeking to gain an information advantage, many
organizations have implemented a range of solutions, including business intelligence and data
analysis tools. We believe that traditional business intelligence tools often fail to provide
timely and critical insights to business professionals due to inflexible data architecture, lack of
broad usability and substantial implementation time and costs. As a result of the limitations of
traditional business intelligence tools, many business users have turned to spreadsheets to help
them perform data analysis. Business users have adopted spreadsheets for many applications due to
their wide availability; however, these general productivity tools were not specifically designed
to facilitate interactivity, collaboration, aggregation or analysis of data for decision making.
Trends Driving Adoption of Business Intelligence and Data Analytics Solutions
The use and importance of business intelligence and data analytics software within
organizations of all sizes has increased significantly for several reasons, including:
Exponential Growth in Data Available for Analysis. Over the last two decades, organizations
have made significant investments in automating business processes with software applications that
generate substantial amounts of data which must be manipulated, analyzed and made accessible to be
useful to decision makers. However, this data is often stored in different formats making it
challenging to efficiently analyze the data and gain insight from it without using powerful data
analytics solutions.
Disparate Data Sources. In today’s highly competitive marketplace, companies are expanding
operations through geographic diversification, acquisitions and partnerships. The frequency of
these strategic activities can result in a complex web of infrastructure and software systems
within an organization. In addition, companies are more closely integrating their systems with
those of their customers, partners and suppliers and adopting new software applications to improve
business efficiency. As a result, large amounts of data are stored in various repositories across
an extended network creating significant data aggregation challenges. Organizations often deploy a
number of tools, including sophisticated data integration software, purpose-built data warehouses
and business intelligence systems, to efficiently and reliably aggregate, synchronize and analyze
this disparate business data.
Decentralized Decision-Making. We believe that many organizations are shifting towards
decentralized decision-making in order to more efficiently respond to changing industry trends and
competitive threats. This shift has created the need for data analysis tools that support employees
at all levels of the organization as they assume more responsibility for making critical business
decisions. Additionally, we believe that increases in the power and performance of mobile networks
and devices will drive demand for mobile access to business data. The widespread use of simple yet
robust personal software applications has driven demand from business users for intuitive
analytical tools to make faster and better decisions.
The Empowered Consumer. Today’s business users are also consumers. At home they are able to
read books on an eReader, watch movies on a tablet, and chat and collaborate with friends via
social media sites. They are able to access the information they want, how they want it, when they
want it. But at work they find that web sites are blocked, their selection of devices is
restricted, and email clients groan under security overhead. As consumers, these users are
empowered, but in the corporate setting, they are not. We believe that this daily cognitive
dissonance is causing a fundamental shift in corporate computing as business users are demanding
more flexibility, and IT is evolving to become a supportive partner with these empowered users.
Traditional Software Tools are Inadequate
Although there has been increasing adoption of business intelligence and data analytics tools,
we believe that most of these traditional tools are inadequate to meet the needs of users and face
the following limitations:
Analysis Tools Don’t Serve Business Users. Most traditional business intelligence tools were
developed specifically for data analysts and other quantitative professionals and are driven and
deployed in a top-down approach. These systems require sophisticated programming skills to
construct or modify predefined, inflexible data sets, known as “data cubes.” These tools are used
to produce static reports which the business user cannot easily modify or explore in an interactive
manner. A typical business user does not possess the skills or authority needed to modify the
underlying data cube and therefore must engage their IT departments to reconfigure the analysis to
produce the requested information between each decision cycle. As a result, business users often do
not have access to critical data in a timely manner and may miss important insights and
opportunities.
Highly Inflexible Solutions are Difficult to Implement and Maintain. Traditional business
intelligence solutions require the integration of large volumes of data stored across an
organization and its partners and the development of a pre-defined summarization of the data (or
data warehouse) to support static query and reporting tools. These tasks can be time-consuming and
complex and often require significant professional services support to complete. In addition,
traditional business intelligence solutions can be difficult to update and require substantial
investments to refresh the underlying data.
Slow Time-to-Value. Traditional business intelligence solutions have become complex product
“stacks” weaving together multiple disparate products into a single “solution.” But due to the
inherent complexities and overhead of these complex stacks, we believe that the typical business
intelligence implementation takes twelve to eighteen months, or more, to implement. By that time
the business, and the business user requirements, may have evolved or changed, resulting in an
extensive queue of user requests to update and revise reports or dashboards. Even simple changes
can take weeks or months to implement, resulting in a solution which we believe is always a few
steps behind the business and never fully addresses the business user’s requirements.
3
Substantial Total-Cost-of-Ownership. Organizations incur significant hardware, software and
professional services costs to deploy and maintain traditional business intelligence solutions. We
estimate that the cost of development for business intelligence and data warehouse applications is
about three to five times the cost of the software. These initial and ongoing costs result in a
substantial total-cost-of-ownership for many traditional business intelligence applications. Most
providers of traditional business intelligence tools rely upon professional services revenue for a
large portion of their total revenue, and thus have little incentive to migrate to a more customer
friendly license-based model or to solutions that are simple to install and easy-to-use.
Spreadsheets Not Suited for Data Analysis and Lack Reliability. Spreadsheets have been
widely adopted by business users for data analysis because they are readily available. However,
spreadsheets are general purpose business productivity tools designed for data input and
calculation. The performance of spreadsheets declines when analyzing large data sets or performing
real-time, dynamic calculations. Spreadsheets are often shared and edited by numerous parties,
resulting in multiple versions of similar material. This lack of version control causes
inconsistencies in analysis, an inability to audit workflows and significant data reliability
challenges. Furthermore, spreadsheets lack sophisticated data security features and can cause a
number of data security challenges given they can be easily shared via email or detachable storage
drives.
Our Solution
QlikView is leading a shift in the business intelligence market towards user-driven solutions.
We call this solution Business Discovery, and we believe it is the next generation of business
intelligence, bridging the gap between traditional business intelligence solutions and standalone
office productivity solutions. The QlikView Business Discovery platform is designed to enable
business users across organizations of all sizes to make faster and better decisions. The key
differentiators of our solution include:
All Business Users. Instead of just a few people involved in insight creation, QlikView
empowers all business users with sophisticated analytic capabilities delivered through an
easy-to-use, intuitive user interface. Unlike traditional business intelligence tools, which
typically require advanced programming by IT professionals to create static data reports, QlikView
allows the business user to search associatively and define visual charts through simple
point-and-click technology. Our user interface extends insight creation to edges of the
organization user and drives QlikView usage and adoption.
Zero Wait Analysis. QlikView provides customers with the tools to make faster, better
decisions that help improve business performance. Our deployment time significantly shortens
time-to-value for our customers. In addition, after the initial installation the customer’s
analysis can be rapidly updated as underlying data evolves and analytic requirements change.
Furthermore, QlikView’s in-memory associative search technology makes calculations in real time
enabling business users to intuitively interrogate and analyze data, which reduces decision cycles.
Mobility. We were one of the first business intelligence vendors with a mobile offering, and
we aim to continue to be on the forefront of the mobile business intelligence market. Tablets and
other large-form-factor mobile devices are now driving significant growth in mobile business
intelligence, expanding the use cases and user communities. Unlike traditional business
intelligence solutions, QlikView provides an intuitive user-driven interface and an application
infrastructure that is tailor-made to take advantage of the opportunity of a truly mobile,
well-informed workforce.
Lower Total-Cost-of-Ownership Yields Higher ROI. We believe that QlikView has a lower total
cost of ownership than traditional business intelligence tools. These savings are driven by reduced
expenditures across hardware, software and services from implementation through ongoing maintenance
and support. Traditional business intelligence tools are typically comprised of a number of
disparate software components. QlikView is a single, cohesive product that facilitates many types
of analysis, whether dashboards, analytic applications or
reports, in a single user interface with a common look and feel. QlikView can be implemented
in a self-service manner and runs independently with limited IT support and without extensive
infrastructure.
Highly Scalable In-Memory Architecture Leverages Hardware Advances. QlikView’s in-memory
associative technology benefits from two important computer hardware trends: 64-bit computing,
which increases the amount of memory available on computers, and multi-core central processing
units, or CPUs, which allow for parallel processing of complex calculations. Because of these
capabilities, QlikView is able to store data in memory and perform real-time calculations on a
massive volume of data from disparate sources. It is our expectation that the amount of available
memory and number of CPU cores and processing speed will continue to increase in the future. These
expected improvements will drive QlikView’s future performance with minimal incremental investment
because we perform calculations in memory and on multiple cores in parallel. Our platform
integrates with nearly all data sources and can scale from a single user to enterprise deployments
without requiring significant additional infrastructure.
4
An App-Like Model. QlikView is designed to be the easiest and fastest business intelligence
platform on which business users can develop analytic applications. We provide a powerful,
easy-to-use business intelligence platform that does not include any purpose-specific applications
when installed out-of-the-box. We believe that each of our customers’ business challenges are
highly unique and change rapidly. Therefore, our customers are best positioned to create analytical
applications that meet their individual needs, and they require a flexible platform that empowers
them to address their challenges. Additionally, we license our platform to partners, such as
independent software vendors and systems integrators, to create a wide variety of applications. We
have aligned with partners who have domain specific knowledge and who will use such knowledge to
build and support purpose-specific analytic applications that they can license directly to a user.
Remixability and Reassembly. Traditional business intelligence solutions require IT or
specialized users to get involved whenever new questions arise. In contrast, QlikView makes it easy
for business users to remix and reassemble data in new views and create new visualizations for
deeper understanding.
Our Business Model
To complement QlikView, we have developed a differentiated business model that has the
following attributes:
Broad User Focus. We seek to market and sell directly to the business user by providing an
intuitive software platform that can be installed and used with minimal training. We believe that
the ease by which business users can evaluate and benefit from our platform substantially expands
our addressable market by allowing us to target a wide range of users, generate incremental
business from existing customers and expand our footprint within their organizations. Unlike most
existing business intelligence tools, QlikView is purpose-built for business users and does not
require substantial IT support to install, integrate and maintain.
Low Risk Rapid Product Adoption. To facilitate adoption of our platform, we offer a
downloadable, easy-to-install, full-featured version of QlikView for individual use free-of-charge.
We allow our customers to purchase licenses in the way that best meets their needs, including on an
individual, workgroup, departmental or enterprise wide basis. This provides the flexibility
organizations desire when evaluating software purchases. When a customer decides to make a
purchase, we offer a 30-day, money-back guarantee to further encourage rapid adoption of QlikView.
These measures significantly reduce customer trial risk and provide a needed alternative to costly,
all-or-nothing, enterprise-wide deployment requirements.
“Land and Expand” Customer Penetration. We seek to initially “land” within the organization
of a new customer by solving a business need of specific business users or departments. After
demonstrating the value of our solution to those initial adopters, we work to “expand” the use of
our solution across the organization by targeting other business units, geographies and use cases.
Our customer penetration strategy is focused on creating a loyal user base that promotes adoption
through tangible results and powerful, word-of-mouth marketing which facilitate incremental sales.
Globally Diversified Distribution Model. We seek to maximize the reach of the QlikView
platform by employing a multi-pronged sales approach that leverages a direct sales force and
partner network which includes resellers, OEM relationships and systems integrators. We typically
enter new markets through partnerships and reseller agreements to minimize cost and risk while we
assess demand in the new market. For example, we successfully grew our initial sales in France and
the United Kingdom without maintaining a local direct sales office and plan to use this strategy to
target additional international regions. As of December 31, 2010, we had distribution capabilities
in over 100 countries and a network of over 1,200 channel partners worldwide to help generate
demand for QlikView.
Community-Based Marketing and Support. We have established QlikCommunity, our user
community, to augment our development, marketing and support efforts. This community of over 43,000
registered users as of December 31, 2010 promotes the use of our software within their
organizations as well as to other organizations. We utilize the QlikCommunity extensively to
provide low-cost user and developer support and valuable insights used by our research and
development team for product development. This passionate, user-driven
culture and collaboration begins within our company and extends out to broader communities
within our customers’ organizations, further driving the QlikView brand and quality.
Our Growth Strategy
We intend to make QlikView the primary platform on which business users, in companies of all
sizes, make critical business decisions. The key elements of our growth strategy include:
Increase Our Global Market Penetration. We intend to expand our presence in targeted
geographies by growing our direct sales force and global partner network. We began our operations
in Sweden, have established a substantial foothold in Western Europe and continue to expand
globally. We intend to increase our presence in North America by expanding our direct sales force
and growing our indirect channel in the region. We also seek to enter new international markets by
establishing distribution partnerships to drive sales. We are leveraging our prior experience in
Europe with distribution partners and master resellers to further penetrate international regions,
such as the U.S., Japan, Australia, China, Russia and Brazil.
Further Penetrate Our Existing Customer Base. We intend to increase penetration of existing
customers by capitalizing on current users’ satisfaction to promote QlikView to other users and
departments within their organizations. Of our approximately 18,000 customers as of December 31,
2010, approximately 25% have been working with the QlikView platform for less than 12 months. We
believe a substantial opportunity exists to increase our sales to these customers. Historically, we
have migrated new customers from single project and departmental deployments to multi-department
deployments by building on the satisfaction and benefits that our customers experience using our
platform.
5
Extend Our Software Platform to Provide New Business Solutions. We plan to enhance our
current platform by adding new functionality that extends our analytics, visualization and search
capabilities to broader use cases. Today, business intelligence is primarily used to solve
internally focused decision-making by data analysts and other quantitative professionals. We
believe that due to our unique capabilities, QlikView can be extended to adjacent areas where
data-driven decisions are critical, including website navigation, content search and information
management, external data communication, product configuration and e-commerce applications. Over
time, we believe a variety of data-intensive functions within organizations could be enhanced and
made more efficient by utilizing QlikView.
Expand Our OEM Alliances and Strategic Relationships. We believe we have a significant
opportunity to expand the use of QlikView through our OEM relationships, which accounted for
approximately 8% of our sales in 2010, as well as through other distribution relationships. We have
an ongoing effort to increase our number of OEM alliances with other independent software vendors
that license our technology to embed within and enhance their solutions. In addition, we seek to
expand our strategic reseller agreements and relationships with systems integrators and consultants
and to use this channel to generate additional inbound customer prospects.
Enhance Adoption of QlikView through our Robust Mobile Offering. In addition to traditional
desktop usage, we enable customers’ use of QlikView from any location via a number of mobile
devices. In May 2009, we began offering a native iOS version of QlikView for
the Apple iPhone and in April 2010, we began offering the same for the iPad. In late 2010, we began
to develop a HTML5 based client that runs on webkit based mobile web browsers and supports full
touch-based interactivity. Our initial version, which supports Apple’s iPad shipped in March 2011,
and we believe this strategy will allow us to support all mobile devices that offer webkit based
mobile browser support. We believe the interactive capabilities of QlikView mobile client will help
establish us as a market leader in the emerging mobile business intelligence space and enhance
adoption of QlikView on the desktop as additional users experience the capabilities and benefits of
our solution.
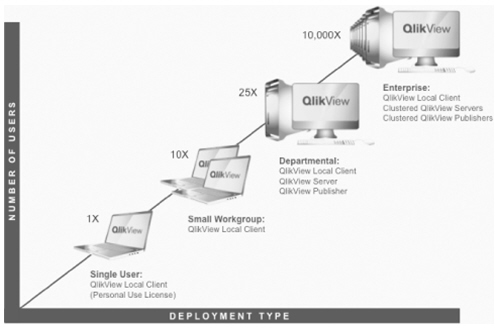
Our Products
Our QlikView product is designed to allow deployments to scale from the single user to
thousands of users. The following diagram shows the deployment progression for QlikView:
Single User Deployment
QlikView Local Client is designed to provide business users with a simple and efficient way to
build analytic applications to solve critical business challenges. QlikView Local Client is a
Windows application that is installed on the user’s computer. QlikView Local Client allows the user
to load disparate data sources such as databases, flat files or web services into memory. Users can
create a full array of user
interface objects such as charts, graphs, tables and listboxes and analyze and visualize the
data that is stored in memory. In addition, any user interface elements can be grouped together
into a static report suitable for printing or emailing. These analytic applications are valuable on
a standalone basis but gain their real value when shared with others in the organization.
We offer QlikView Local Client as a free download with full capabilities to develop analyses,
but with the restriction that users can only use analyses they have built themselves. This is
referred to as a Personal Use License and allows users to connect to any underlying data source,
load data, build user interfaces and conduct interactive analyses of their data. The Personal Use
License limits the use of the QlikView files to the person who created it. To share the analysis
with another user, each user must have a QlikView license, rather than a Personal Use License. The
Personal Use License provides a way for individuals to learn and gain value from QlikView and also
generates leads for our sales organization.
6
Small Workgroup Deployment
A small workgroup deployment involves the use of multiple QlikView Local Clients on standalone
client machines without a central server. In order to share QlikView data and analysis created by
others in the workgroup, each user must have an individual license. Because all data and analysis
is contained within a QlikView file, each licensed user may share, whether by email, on a portal or
on a shared drive, the QlikView file. This deployment approach is typically favored by
organizations with small user populations and/or poor network connectivity.
Departmental and Enterprise Deployments
Departmental and enterprise deployments utilize a server to provide a central repository for
all QlikView analysis. The QlikView Server component supports authentication and security models to
ensure appropriate user access and simultaneous access to analyses by large user groups. We
designed QlikView Server to maximize the use of the processing power of standard multi-core servers
by spreading calculations over all available CPU cores. The QlikView Server can be grouped across
more than one physical server into clusters to provide fault tolerance and additional scale.
Server based deployments scale from small user groups (less than 25) to enterprise-wide use
(tens of thousands of users). We offer the QlikView Server at two license levels: Small Business
Edition and Enterprise Edition. Small Business Edition is limited to 25 users and is suitable only
for small and midsize deployments. The Enterprise Edition has no user limits and includes
capabilities designed for larger and more technically complex implementations.
To manage large deployments of QlikView, we offer our QlikView Publisher component which is an
administrative interface for maintaining QlikView analyses. QlikView Publisher allows users to
reload data in a QlikView analysis on a periodic basis to ensure that the most current data is
available. QlikView Publisher also connects to directory servers within organizations and applies
user security rules to a QlikView analysis to ensure appropriate user access. Finally, QlikView
Publisher can alert end users to changes to a QlikView file and facilitate distribution via email
or a web based interface called AccessPoint. The QlikView Publisher can be deployed across one or
more physical servers to provide the scale needed for large QlikView deployments. QlikView
Publisher is licensed on a per server basis and includes a separately licensable option for PDF
report distribution capabilities. For large enterprise deployments, multiple QlikView Servers and
QlikView Publishers can be clustered to provide load balancing and fail over capabilities.
Access to the QlikView Server is governed by a Client Access License (“CAL”) licensing model.
The most common QlikView Server license type is a Named User CAL. In addition to access to the
QlikView Server there are separately licensable options for real-time data streaming capabilities
and test and development servers. QlikView also offers separately licensable options for a
connector to SAP and Salesforce.com.
Our Technology
QlikView’s primary architectural principles are to provide end user simplicity and rapid
deployment. In developing our solution, we endeavor to obscure the underlying technical complexity
from the user while providing powerful easy-to-use functionality.
Superior End User Experience
QlikView is designed to mirror the fluid, associative nature of human thought. We believe
people process information in non-hierarchical ways when making decisions. Faced with a decision,
each person uses a different path to reach a conclusion. We designed QlikView to support this type
of decision-making by allowing users to explore data according to their own thought processes,
seeing updated calculations and relationships with each QlikView interaction.
We call this flexible model of interaction “associative search.” Associative search is a
non-hierarchical model of interacting with interrelated data elements. It allows users to select
arbitrary groups of data elements and see how these selections affect the remaining data
elements. In QlikView, the user’s selections are shown in green, data elements related to
these selections are shown in white, and data elements not related to these selections are shown in
gray. The user’s current selections apply to all the data in QlikView and affect every calculated
value. Thus, with every interaction, users see the relationship between data and also the effect
their selection has on calculations that they are tracking. Importantly, information is never
hidden from the user. All data is always shown to the user, including information not related to
the user selection. This can lead a user to see unexpected insights from otherwise excluded data.
Finally, all user interactions and data calculations are performed in real time. Because of the
rapid response time and ease of use, users can click frequently through data and analysis. Users
take advantage of this speed to “surf” the data and identify relationships that they may otherwise
miss in competing products.
Traditional business intelligence query tools filter data that is not part of the current
query, hiding data from the user and potentially omitting valuable information which did not meet
the initial parameters of the question. Typically, the queries that underlie these tools take many
minutes or even hours to run. This creates a high cost of investigation and may cause users to
avoid running multiple queries. In addition, to improve performance, traditional tools often
require reports to be run in batches and thus be pre-defined ahead of time.
7
Fast Deployment
QlikView’s architecture reduces the cycle time between data collection and deployment of
analysis to the end user to a few weeks and sometimes to as little as a few days. By moving all
data in-memory, QlikView does not require the use of data warehouses for high performance analyses
which shortens the time to access data. QlikView does not require disk-based cubes since it
performs all calculations in real time as the user explores a data set. This approach allows the
user to interactively analyze a data set and easily modify the scope of an analysis. In addition,
in many cases, end users can build the required analyses themselves. The QlikView architecture
facilitates the development of all types of analysis, including dashboards, analytic applications
or reports, on a single platform with a common user interface. QlikView is often deployed with
limited IT intervention enabling IT staff to focus on data integration and data quality challenges
which is where they can be most valuable.
Traditional business intelligence tools typically require long and complicated deployments for
several reasons. In traditional deployments, large volumes of data used for decision-making must be
moved into query-only data repositories such as data warehouses to accommodate the heavy query
loads that traditional tools make on operational systems. Traditional tools store analyses on disk
in pre-calculated cubes to improve perceived metric calculation performance. These disk-based cubes
are difficult and time-consuming to build and maintain and require the scope of analysis to be
decided ahead of time. Thus, typical deployments of traditional business intelligence tools require
an extended requirements gathering phase during which IT staff work with business users in an
attempt to document and lock-down the scope of analysis in advance. Traditional business
intelligence tools have many end user tools for viewing analyses. Once the data is organized, there
is a long process of selecting and deploying the appropriate end user tool. Finally, due to product
complexity, traditional tools must be managed and governed by resource constrained IT departments,
rather than by business users. Most traditional deployments require over a year to implement fully,
with changes to the scope of a project extending the time to value.
Technology Foundations
Associative search has two key technological foundations: all data is held in computer memory
(RAM), and all calculations are performed in real time. Two important computing trends have
supported these architectural decisions. The first trend is the shift from 32-bit computing to
64-bit computing, which has exponentially raised the amount of available RAM per computer. It is
currently possible to purchase servers with as much as 512 gigabytes of RAM, whereas as recently as
2005, most servers had four gigabytes of RAM. This increase in available memory has made it
practical to move data storage from disk directly into RAM. The second trend is the increasing
pervasiveness of multi-core CPUs. In 2005, most servers had single-core CPUs. Today, commonly
available servers can have as many as 48 cores across eight CPUs. For applications that have been
designed to run calculations in parallel, this shift has provided a large increase in processing
power. These high capacity servers are readily available for purchase, even online via credit card,
for less than $50,000. Even quite recently this level of computing power would require a custom
built machine costing hundreds of thousands or even millions of dollars.
QlikView’s in-memory architecture allows it to manipulate large amounts of data, while giving
users a high level of interactivity. QlikView compresses data as it is brought into memory, and
this enables it to store data in-memory more efficiently than it would be stored on disk in a
traditional relational database. As data is brought into memory, QlikView also maps the linkages
between data elements to help facilitate visualization of data element associations. In more recent
versions of QlikView, data can be streamed directly into memory from source applications, providing
a mechanism for updating the data in-memory without reloading.
QlikView’s ability to perform real-time calculations allows it to handle the calculation of
complex measures and metrics quickly. QlikView is designed to spread the calculation load across
all available CPU cores and to manage this workload across many concurrent users. In addition, our
platform can cache results across users so that the most commonly used calculations are performed
the least number of times.
QlikCommunity
We have a loyal base of users on our online community website, QlikCommunity, which is
comprised of over 43,000 registered users as of December 31, 2010. Our QlikCommunity website was
relaunched in May 2009, and during the year ended December 31, 2010, we
averaged approximately 60 new user registrations each day. QlikCommunity provides our
registered users with a low-cost, user-friendly product support resource, which includes:
| |
• |
|
discussion forums to share their QlikView experiences and to find answers to
questions about the product and its features |
| |
• |
|
user groups based on location, industry and job function |
| |
• |
|
blogs written by our employees |
| |
• |
|
user-generated content, including best practices, how-to’s, documentation and
other material. |
In addition, QlikCommunity provides us with a loyal network of practitioners who promote the
usage of our software and provide support to users trying to solve technical problems.
QlikCommunity also serves as a valuable feedback loop through which our product development team
gains insights about new features and functionalities that help guide our future product
development. QlikCommunity users also provide us with their contact information when they register
as a member, and we effectively target these users as a pool of self-selecting, low-cost, qualified
sales leads.
8
Research and Development
Our research and development (“R&D”) organization is responsible for the design, development,
testing and support of our software. Our current research and development efforts are focused on
new releases of existing products as well as new products and modules.
As of December 31, 2010, we had 96 people in our R&D organization. Our entire R&D organization
is located in Lund, Sweden. The core members of our R&D team have been with our company since as
early as 1996. We believe that the tenure of our core development organization provide us with a
competitive advantage. We use an agile philosophy in our development process which encourages broad
participation in design and testing and rapid prototyping. Our development, testing and quality
assurance processes use automated testing extensively and are designed in alignment with Capability
Maturity Model Integration (“CMMI”), an industry R&D process improvement approach.
We aim to release major feature releases of QlikView every 12 to 18 months, with service
releases every two to four months between major releases. Some new product capabilities such as
mobile technologies and data connectors that can be developed independently are released more
frequently.
We work closely with our customers in developing our products and have designed a flexible
product development process that is responsive to customer feedback that we receive throughout the
process. Planning for each major release begins with a requirements gathering meeting called a
Reference Group which gathers input from our customer-facing implementation consultants in each of
our markets. As the product is developed, specific customers and partners are identified to provide
detailed feedback on product design. Then, a broad set of customers and partners are involved in
beta testing major releases of QlikView, which typically occurs for several months prior to general
availability. In addition to local requirements, we gather all direct customer input from
QlikCommunity, our community website. From the Reference Group we consolidate and prioritize all
customer requirements. These requirements form the input for the Design Group which comprises core
members from R&D and our Product Marketing team. The Design Group segments requirements into the
product release cycle and assesses the technical feasibility of all requests.
Within our operations, we are extensive users of our own product. We install, upgrade and use
our product internally in a pre-release and beta state before allowing it to be made generally
available. Consequently, this process allows us to identify and resolve many deployment issues
prior to making the product available to customers.
Innovation is a critical factor in the success of QlikView, and identifying and incubating
innovation is built into our R&D process. We have recently added a QlikView Labs department to
consolidate and manage innovative uses of QlikView and new core technologies. We invest time and
money in identifying and nurturing new product concepts with the intention of incorporating
successful ideas into the product as new product modules or as entirely new products.
Marketing and Sales
We market and sell our products and services through our direct sales force and an indirect
sales channel comprised of a global partner network. Our direct sales force consists of
professional sales people who typically have several years of experience selling enterprise
software. Our global partner network brings key technological and industry expertise that we
utilize to help us reach customer organizations around the world. These indirect sales channels
often aid us in shortening the sales cycles we typically face with prospective customers.
Our global partner network includes master resellers, elite resellers and resellers. These
partners are authorized to sell licenses and to implement and provide first line support for our
products. A master reseller is generally appointed to extend geographic sales into a territory
where we have no direct sales presence. Designation of elite reseller versus reseller is driven by
the amount of sales volume that they derive from the sale of our product. Additionally we work with
system integrators and other technological consulting firms who provide complementary skills and
expertise in a certain industry or region.
Our global partner network also includes OEM partners who use QlikView technology as a bundled
or add-on feature in their products and services. Typically OEM partners include software
companies, SaaS vendors and information providers. More broadly, this category applies to any
organization seeking to leverage QlikView to power the analytics in an existing or new product or
in a service offering.
We support our global partner network through a program that provides a structured framework
to effectively recruit, enable and support partners who sell and deliver complementary QlikView
solutions. Our team provides a complete lifecycle of support to partners, based on three
fundamental principles:
| |
• |
|
enable partners through technical support, education, training and certification |
| |
• |
|
market with and for partners through branding, awareness, customer marketing and
lead generation programs |
| |
• |
|
sell QlikView and “Powered by QlikView” products with effective sales tools and
sales support. |
9
As of December 31, 2010, our global partner network was comprised of more than 1,200 partners
in over 100 countries. No individual partner represented more than 3% of our revenues in the fiscal
years ended December 31, 2010, 2009 or 2008.
We focus our marketing efforts on increasing brand awareness, communicating product advantages
and generating qualified leads for our sales force and channel partners. We rely on a variety of
marketing vehicles, including trade shows, advertising, public relations, industry research, our
website and collaborative relationships with technology vendors. In addition, we work closely with
a number of our global partners on co-marketing and lead-generation activities in an effort to
broaden our marketing reach.
Maintenance and Services
Maintenance and Support. Our customers generally receive one year of software maintenance
and support as part of their initial purchase of our products and have the option annually to renew
their maintenance agreements. These annual maintenance agreements provide customers the right to
receive unspecified software updates, maintenance releases and patches, and unlimited access to our
support services. We engage third parties to provide first-line support for our product. We work
closely with these third parties to help ensure that they have the necessary skills and product
knowledge to assist our customers with installation, maintenance and other requirements. Our
internal support personnel are based in our offices in Lund, Sweden; Raleigh, North Carolina;
Dusseldorf, Germany; and Sydney, Australia; and they work with our third party partners to handle
support issues that may arise.
Services. Our revenue model is license driven with minimal professional services required to
install and configure our software. We believe that this enables our customers to achieve rapid
time-to-value. While the vast majority of implementation projects are conducted by our partners, we
have also established an expert services department to support customers and partners with more
in-depth technical know-how and best practices about our product including implementation,
scripting, user interface design, application development and security management. Training is
given either in-person or online. Typically, in-person training courses are billed on a per-person,
per-class basis. We have both standard packages as well as customized trainings. We also utilize
and promote QlikCommunity as a supplement support resource for our customers.
Customers
As of December 31, 2010, we had approximately 18,000 active customers in over 100 countries.
Our customers conduct their respective businesses in numerous industry verticals, including
consumer packaged goods, financial services, pharmaceuticals, retail, manufacturing, technology and
healthcare. We do not believe our business is substantially dependent on any particular customer as
no customer represented more than 2% of our revenue in 2010, 2009 or 2008. Our target markets are
not confined to certain industries and geographies as we are focused on providing a solution that
generally meets the needs of business users.
Brand and Intellectual Property
Our intellectual property is an essential element of our business. We own registered
trademarks for the “Qlik” and “QlikView” name. We rely on a combination of copyright, patent,
trademark, trade dress and trade secrecy laws, as well as confidentiality procedures and
contractual restrictions, to establish and protect our proprietary rights both domestically and
abroad. These laws, procedures and restrictions provide only limited protection. As of December 31,
2010, we had three issued U.S. patents and had a pending application for a fourth U.S. patent. In
addition, we had 19 issued and six pending foreign patents. Any future patents issued to us may
be challenged, invalidated or circumvented. Any patents that might be issued in the future, with
respect to pending or future patent applications, may not provide sufficiently broad protection or
may not prove to be enforceable in actions against alleged infringers. We endeavor to enter into
agreements with our employees and contractors and with parties with whom we do business in order to
limit access to and disclosure of our proprietary information.
We cannot be certain that the steps we have taken will prevent unauthorized use or reverse
engineering of our technology. Moreover, others may independently develop technologies that are
competitive with ours or that infringe our intellectual property. The enforcement of our
intellectual property rights also depends on any legal actions against these infringers being
successful, but these actions may not be successful, even when our rights have been infringed.
Furthermore, effective patent, trademark, trade dress, copyright and trade secret protection
may not be available in every country in which our products are offered. In addition, the legal
standards relating to the validity, enforceability and scope of protection of intellectual property
rights are uncertain and still evolving.
From time to time, we may encounter disputes over rights and obligations concerning
intellectual property. Although we believe that our product offerings do not infringe the
intellectual property rights of any third party, we cannot be certain that we will prevail in any
intellectual property dispute. If we do not prevail in these disputes, we may lose some or all of
our intellectual property protection, be enjoined from further sales of products determined to
infringe the rights of others and/or be forced to pay substantial royalties to a third party, any
of which could harm our business, financial condition and results of operations.
10
Competition
Our technology platform and differentiated business model help us to compete in the highly
competitive business intelligence market. We face competition from many companies that are
offering, or may soon offer, products that compete with our products.
To date, we have primarily faced competitors in several broad categories, including business
intelligence software, analytical processes, query tools, web-based reporting tools and report
delivery technology. Independent competitors that are primarily focused on business intelligence
products include, among others, MicroStrategy and the SAS Institute. We also compete with large
software corporations, including suppliers of enterprise resource planning software, that provide
one or more capabilities competitive with our products, such as IBM, Microsoft, Oracle and SAP AG.
We believe we generally compete favorably with respect to these competitors; however, some of our
competitors and potential competitors have advantages over us, such as:
| |
• |
|
longer operating histories |
| |
• |
|
significantly greater financial, technical, marketing or other resources |
| |
• |
|
stronger brand and business user recognition |
| |
• |
|
broader global distribution and presence. |
Current and future competitors may also have greater resources to make strategic acquisitions.
By doing so, these competitors may increase their ability to meet the needs of our potential
customers. Our current or prospective indirect channel partners may establish cooperative
relationships with our current or future competitors. These relationships may limit our ability to
sell our products through specific distribution channels. Accordingly, new competitors or alliances
among current and future competitors may emerge and rapidly gain significant market share. These
developments could limit our ability to obtain revenues from new customers and to maintain
technical support revenues from our installed customer base.
See Item 1A of this Annual Report on Form 10-K entitled “Risk Factors” for further discussion
regarding our competition.
Culture and Employees
As a global company, we have 780 employees as of December 31, 2010, of which 199 were employed
in the U.S. and 581 were employed outside the U.S. We believe that having a strong company culture
and set of values is critical to our success. Our corporate culture provides us with a competitive
advantage by supporting our ability to keep our market offering consistent despite a globally
diverse employee
base. To communicate and reinforce our culture, we have a set of corporate values which
provide a framework for guiding employees in implementation of our business model without direct
managerial control. Our values are:
| |
• |
|
challenge the conventional |
| |
• |
|
be thorough but keep it simple |
| |
• |
|
open and straightforward |
| |
• |
|
teamwork yields the best results. |
Our values are taught and reinforced from the moment new employees join our company. Shortly
after being hired, all employees attend QlikAcademy, a week-long training session in Lund, Sweden,
to learn about our product, our sales model and our cultural values. Our values form the fabric of
our work ethic, and we believe that they enable us to quickly recruit and properly manage our
highly talented employees. Our culture encourages the iteration of ideas to address complex
technical challenges. In addition, we embrace individual thinking and creativity. Despite our
growth, we constantly seek to maintain a small-company feel that promotes interaction and the
exchange of ideas among employees. We try to minimize company hierarchy to facilitate meaningful
communication among employees at all levels and across all departments. This openness extends to
our partners and customers, as well as allowing us to establish strong relationships that
contribute to our growth.
11
Every year since 2000 we have hosted an annual QlikTech summit where we bring together all our
employees in one location to build cross-border relationships and to facilitate communications.
During the summit we update employees on our progress, provide training around new initiatives,
host presentations by industry speakers and key customers and allow open interaction between
employees from around the world. Our summit is a critical mechanism for promoting consistent and
efficient execution of the year’s strategic plan. Having the summit at a single time and in a
single location provides our globally distributed organization with an opportunity to share ideas
and best practices. We believe that the summit is one of the key elements in maintaining a strong
company culture among our employees.
We consider our current relationship with our employees to be good. We are not a party to a
collective bargaining agreement with any of our employees.
Company Information and Website
We file annual, quarterly and current reports, proxy statements and other documents with the
Securities and Exchange Commission (“SEC”) under the Securities Exchange Act of 1934. The public
may read and copy any materials that we file with the SEC at the SEC’s Public Reference Room at
Station Place, 100 F Street, N.E., Washington, DC 20549. The public may obtain information on the
operation of the Public Reference Room by calling the SEC at 1-800-SEC-0330. Also, the SEC maintains an Internet
website that contains reports, proxy and information statements and other information regarding
issuers, including us, that file electronically with the SEC. The public can obtain any documents
that we file with the SEC at http://www.sec.gov.
In addition, our company website can be found on the internet at http://www.qlikview.com. The
website contains information about us and our operations. Copies of each of our filings with the
SEC on Form 10-K, Form 10-Q and Form 8-K and all amendments to those reports, can be viewed and
downloaded free of charge as soon as reasonably practicable after the reports and amendments are
electronically filed with or furnished to the SEC. To view the reports, access
http://investor.qlikview.com and click on “Financial Information.” References to our company
website address in this report are intended to be inactive textual references only, and none of the
information contained on our website is part of this report or incorporated in this report by
reference.
12
Our business is subject to numerous risks. You should carefully consider the risks described below
together with the other information set forth in this Annual Report on Form 10-K and other
documents we file with the SEC, which could materially affect our business, financial condition,
and future results. The risks described below are not the only risks facing our company. Risks and
uncertainties not currently known to us or that we currently deem to be immaterial also may
materially adversely affect our business, financial condition, and operating results.
We have limited experience in targeting a global marketplace and compete in a rapidly evolving
industry which makes our future operating results difficult to predict.
We have limited experience in targeting the global business intelligence marketplace. In
addition, we have a limited operating history in an industry characterized by rapid technological
innovation, changing customer needs, evolving industry standards and frequent introductions of new
products, enhancements and services. Any of these factors can render our existing software platform
and services obsolete or unmarketable. We believe that our future success will depend in large part
on our ability:
| |
• |
|
to support current and future releases of popular hardware, operating
systems, computer programming languages, databases and software applications |
| |
• |
|
to develop new products that achieve market acceptance in a timely manner |
| |
• |
|
to meet an expanding range of customer requirements. |
As we encounter increasing competitive pressures, we will likely be required to modify,
enhance, reposition or introduce new products and service offerings. We may not be successful in
doing so in a timely, cost-effective and appropriately responsive manner, or at all. All of these
factors make it difficult to predict our future operating results which may impair our ability to
manage our business.
We may experience quarterly fluctuations in our operating results due to a number of factors which
make our future results difficult to predict and could cause our operating results to fall below
expectations or our guidance.
Our operating results may fluctuate due to a variety of factors, many of which are outside of
our control. As a result, comparing our operating results on a period-to-period basis may not be
meaningful. Our past results should not be relied on as an indication of our future performance. If
our revenue or operating results fall below the expectations of investors or securities analysts or
below any guidance we may provide to the market, the price of our common stock could decline
substantially.
Our operating results have varied in the past. In addition to other risk factors listed in
this “Risk Factors” section, factors that may affect our quarterly operating results, business and
financial condition include the following:
| |
• |
|
demand for our software platform and services and the size and timing of orders |
| |
• |
|
market acceptance of our current and future products |
| |
• |
|
a slowdown in spending on information technology and software by our current and/or prospective customers |
| |
• |
|
sales cycles and performance of our indirect channel partners and original equipment manufacturers (known as OEMs) |
| |
• |
|
budgeting cycles of our customers |
| |
• |
|
the management, performance and expansion of our international operations |
| |
• |
|
the rate of renewals of our maintenance agreements |
| |
• |
|
changes in the competitive dynamics of our markets |
| |
• |
|
our ability to control costs, including our operating expenses |
| |
• |
|
customers delaying purchasing decisions in anticipation of new products or product enhancements by us or our competitors |
| |
• |
|
the outcome or publicity surrounding any pending or threatened lawsuits |
| |
• |
|
the timing of recognizing revenue in any given quarter as a result of revenue recognition rules |
13
| |
• |
|
an increase in the rate of product returns |
| |
• |
|
foreign currency exchange rate fluctuations |
| |
• |
|
failure to successfully manage any acquisitions |
| |
• |
|
general economic and political conditions in our domestic and international markets. |
In addition, we may in the future experience fluctuations in our gross and operating margins
due to changes in the mix of our direct and indirect sales, domestic and international revenues,
and license and professional services revenues.
We may implement changes to our license pricing structure for all of our products including
increased prices and modified licensing parameters. If these changes are not accepted by our
current or future customers, our business, operating results and financial condition could be
harmed.
Based upon all of the factors described above, we have a limited ability to forecast the
amount and mix of future revenues and expenses, and it is likely that at some time our operating
results will fall below our estimates or the expectations of public market analysts and investors.
We depend on revenue from a single product platform.
We are dependent on a single product platform, QlikView. Our business would be harmed by a
decline in demand for, or in the price of, our software platform as a result of, among other
factors:
| |
• |
|
any change in our pricing model |
| |
• |
|
support, research and development or other expenditures undertaken in
attempts, whether or not successful, to develop new products |
| |
• |
|
maturation in the markets for our products. |
Our financial results would suffer if the market for business intelligence software does not
continue to grow or if we are unable to further penetrate this market.
Nearly all of our revenues to date have come from sales of business intelligence software and
related maintenance services. We expect these sales to account for substantially all of our
revenues for the foreseeable future. Although demand for business intelligence software has grown
in recent years, the market for business intelligence software applications is still evolving. We
cannot be sure that this market will continue to grow or, even if it does grow, that customers will
purchase our software platform or services. We have spent, and intend to keep spending,
considerable resources to educate potential customers about business intelligence software in
general and our software platform in particular. However, we cannot be sure that these expenditures
will help our software platform achieve any additional market acceptance or enable us to attract
new customers or new users at existing customers. A reduction in the demand for our services and
software platform could be caused by, among other things, lack of customer acceptance, weakening
economic conditions, competing technologies and services or decreases in software spending. If the
market and our market share fail to grow or grow more slowly than we currently expect, our
business, operating results and financial condition would be harmed.
We use indirect channel partners and if we are unable to maintain successful relationships
with them, our business, operating results and financial condition could be harmed.
In addition to our direct sales force, we use strategic indirect channel partners, such as
distribution partners, value-added resellers, system integrators and OEMs to license and support
our software platform. For the year ended December 31, 2010, transactions by indirect channel
partners accounted for more than 50% of our total product licenses and first year maintenance
billings.
Our channel partners may offer customers the products of several different companies,
including products that compete with ours. Our channel partners generally do not have an exclusive
relationship with us; thus, we cannot be certain that they will prioritize or provide adequate
resources for selling our products. Divergence in strategy or contract defaults by any of these
channel partners may harm our ability to develop, market, sell or support our software platform. In
addition, establishing and retaining qualified indirect sales channel partners and training them in
our software platform and services require significant time and resources. In order to develop and
expand our distribution channel, we must continue to scale and improve our processes and procedures
that support our channel, including investment in systems and training. These processes and
procedures may become increasingly complex and difficult to manage as we grow our organization.
Our ability to achieve revenue growth in the future will depend in part on our success in
maintaining successful relationships with our channel partners. There can be no assurance that our
channel partners will continue to cooperate with us when our distribution agreements expire or are
up for renewal. If we are unable to maintain our relationships with these channel partners, our
business, operating results and financial condition could be harmed. Also, in a number of regions
we rely on a limited number of resellers, and our business may be harmed if any of these resellers
were to fail to effectively address their specified geographic territories.
14
In addition, we rely on our channel partners to operate in accordance with the terms of their
contractual agreements with us. For example, our agreements with our channel partners limit the
terms and conditions pursuant to which they are authorized to resell or distribute our software and
offer technical support and related services. We also typically require our channel partners to
provide us with the dates and details of product license transactions sold to end user customers.
If our channel partners do not comply with their contractual obligations to us, our business,
results of operations and financial condition may be harmed.
If we are unable to expand our direct sales capabilities, we may not be able to generate increased
revenues.
In order to succeed, we must expand our direct sales force to generate increased revenue from
new customers. We intend to increase our number of direct sales professionals. New hires will
require training and will take time to achieve full productivity. We cannot be certain that new
hires will become as productive as necessary or that we will be able to hire enough qualified
individuals in the future. Failure to hire qualified direct sales personnel will preclude us from
expanding our business and growing our revenue.
As we pursue new enterprise customers, additional OEM opportunities or more complicated
deployments, our sales cycle and deployment processes may become more unpredictable and require
greater time and expense.
Our sales cycle may lengthen as we pursue new enterprise customers. Enterprise customers may
undertake a significant evaluation process in regard to enterprise software which can last from
several months to a year or longer. If our sales cycle were to lengthen in this manner, events may
occur during this period that affect the size or timing of a purchase or even cause cancellations,
and this may lead to more unpredictability in our business and operating results. Additionally,
sales cycles for sales of our software platform to OEMs tend to be longer, ranging from three to 12
months or more, and may involve convincing a partner’s entire organization that our software
platform is the appropriate software for its applications. We may spend substantial time, effort
and money on our sales efforts without any assurance that our efforts will produce any sales.
In addition, we may face unexpected deployment challenges with enterprise customers or more
complicated installations of our software platform. It may be difficult to deploy our software
platform if the customer has unexpected database, hardware or software technology issues.
Additional deployment complexities may occur if a customer hires a third party to deploy our
software platform or if one of our indirect channel partners leads the implementation of our
solution. Any difficulties or delays in the initial implementation could cause customers to reject
our software or lead to the delay or non-receipt of future orders, in which case our business,
operating results and financial condition would be harmed.
Managing our international operations is complex and our failure to do so successfully could harm
our business, operating results and financial condition.
We receive a significant portion of our total revenues from international sales from foreign
direct and indirect operations. International revenues accounted for approximately 75% for the year
ended December 31, 2010 and 77% of our total revenues for each of the years ended December 31, 2009
and 2008. We have facilities located in Australia, Austria, Belgium, Canada, Denmark, Finland,
France, Germany, Hong Kong, India, Italy, Japan, the Netherlands, Norway, Portugal, Russia,
Singapore, Spain, Sweden, Switzerland, the United Arab Emirates and the United Kingdom. We expect
to continue to add personnel in additional countries. Our international operations require
significant management attention and financial resources.
There are certain risks inherent in our international business activities including, but not
limited to:
| |
• |
|
managing and staffing international offices and the increased costs associated with multiple international locations |
| |
• |
|
maintaining relationships with indirect channel partners outside the U.S., whose sales and lead generation activities are very
important to our international operations |
| |
• |
|
multiple legal systems and unexpected changes in legal requirements |
| |
• |
|
tariffs, export restrictions, trade barriers and other regulatory or contractual limitations on our ability to sell or develop
our products in certain foreign markets |
| |
• |
|
trade laws and business practices favoring local competition |
| |
• |
|
costs of localizing products and potential lack of acceptance of localized versions |
| |
• |
|
potential tax issues, including restrictions on repatriating earnings and multiple and conflicting tax laws and regulations |
| |
• |
|
employer payroll tax withholdings with respect to exercises by employees of options to purchase common stock |
| |
• |
|
weaker intellectual property protection in some countries |
| |
• |
|
difficulties in enforcing contracts and collecting accounts receivable, longer sales cycles and longer payment cycles,
especially in emerging markets |
15
| |
• |
|
the significant presence of some of our competitors in certain international markets |
| |
• |
|
our ability to adapt to sales practices and customer requirements in different cultures |
| |
• |
|
political and economic instability, including war and terrorism or the threat of war and terrorism. |
We believe that, over time, a significant portion of our revenues and costs will continue to
be denominated in foreign currencies. To the extent such denomination in foreign currencies does
occur, gains and losses on the conversion to the U.S. dollar of accounts receivable, accounts
payable and other monetary assets and liabilities arising from international operations may
contribute to fluctuations in our results of operations. Although we may in the future decide to
undertake foreign exchange hedging transactions to cover a portion of our foreign currency
transaction exposure, we currently do not hedge any foreign currency exposure. If we are not
effective in any future foreign exchange hedging transactions in which we engage, our business,
operating results and financial condition could be harmed.
In addition, compliance with foreign and U.S. laws and regulations that are applicable to our
international operations is complex and may increase our cost of doing business in international
jurisdictions, and our international operations could expose us to fines and penalties if we fail
to comply with these regulations. These laws and regulations include import and export
requirements, U.S. laws such as the Foreign Corrupt Practices Act, and local laws prohibiting
corrupt payments to governmental officials. Although we have implemented policies and procedures
designed to help ensure compliance with these laws, there can be no assurance that our employees,
partners and other persons with whom we do business will not take actions in violation of our
policies or these laws. Any violations of these laws could subject us to civil or criminal
penalties, including substantial fines or prohibitions on our ability to offer our products and
services to one or more countries, and could also materially damage our reputation, our brand and
our international expansion efforts.
Our failure to manage any of these risks successfully could harm our international operations
and reduce our international sales.
If new industry standards emerge or if we are unable to respond to rapid technological changes,
demand for our software platform may be adversely affected.
We believe that our future success will depend in large part on our ability:
| |
• |
|
to support current and future industry standards, including databases and operating systems |
| |
• |
|
to maintain technological competiveness and meet an expanding range of customer requirements |
| |
• |
|
to introduce new products and features for our customers. |
The emergence of new industry standards in related fields may adversely affect the demand for
our existing software platform. If new technologies emerged that were incompatible with customer deployments of our software
platform, our business and results of operations may be adversely affected.
We currently support Open Database Connectivity, or ODBC, and Object Linking and
Embedding Database, or OLEDB, standards in database access technology. If we are unable to adapt
our software platform on a timely basis to new standards in database access technology, the ability
of our software platform to access customer databases could be impaired. In addition, the emergence
of new server operating systems standards could adversely affect the demand for our existing
software platform. Our platform currently requires the Windows Server operating system when
deployed on a server, as used in most multi-user deployments. If customers are unwilling to use
Windows Server, we may not be able to achieve compatibility on a timely basis or without
substantial research and development and support expense. We currently support all generally
available client operating systems that run industry standard web browsers, but we cannot provide
assurance that we will be able to support future client operating systems and web browsers in a
timely and cost-effective manner, if at all.
The markets for our software platform and services are also characterized by rapid
technological and customer requirement changes. In particular, our technology is optimized for
servers utilizing the x86 and x64 families of microprocessors. If the speed and performance of
these microprocessor families do not continue to increase at the rates we anticipate, our software
may not attain the performance speed and capabilities that we expect. Also, if different
microprocessor architecture were to gain widespread acceptance in server applications, we may not
be able to achieve compatibility on a timely basis or without substantial research and development
and support expense. Difficulty by us in achieving compatibility with different microprocessor
architecture or other technological change or in satisfying changing customer requirements could
render our existing and future products obsolete and unmarketable. As a result, we may not be able
to accurately predict the lifecycle of our software platform and services, and they may become
obsolete before we receive the amount of revenues that we anticipate from them.
Business intelligence software is inherently complex. The development and testing of new
products and product enhancements can require significant research and development expenditures. As
a result, substantial delays in the general availability of such new releases or significant
problems in the installation or implementation of such new releases could harm our business,
operating results and financial condition. We may not successfully develop and market product
enhancements or new products that respond to technological change or new customer requirements.
Even if we introduce a new product, we may experience a decline in revenues of our existing
products that is not fully matched by the new product’s revenue. For example, customers may delay
making purchases of a new product to make a more thorough evaluation of the product, or until
industry and marketplace reviews become widely available. In addition, we may lose existing
customers who
choose a competitor’s product rather than migrate to our new product. This could result in a
temporary or permanent revenue shortfall and harm our business.
16
Our business depends on customers renewing their annual maintenance contracts and our ability to
collect renewal fees.
Any decline in maintenance renewals could harm our future operating results. We sell our
software platform pursuant to a perpetual license with a fixed upfront fee which ordinarily
includes one year of maintenance as part of the initial price. Our customers have no obligation to
renew their maintenance agreements after the expiration of this initial period, and they may not
renew these agreements. We may be unable to predict future customer renewal rates accurately. Our
customers’ renewal rates may decline or fluctuate as a result of a number of factors, including
their level of satisfaction with our software platform, the prices of our software platform, the
prices of products and services offered by our competitors or reductions in our customers’ spending
levels. If our customers do not renew their maintenance arrangements or if they renew them on less
favorable terms, our revenue may decline and our business will suffer. A substantial portion of our
quarterly maintenance revenue is attributable to maintenance agreements entered into during
previous quarters. As a result, if there is a decline in renewed maintenance agreements in any one
quarter, only a small portion of the decline will be reflected in our maintenance revenue
recognized in that quarter and the rest will be reflected in our maintenance revenue recognized in
the following four quarters or more. In addition, we may have difficulties collecting renewal fees
from our customers, especially in regards to customers located in emerging international markets.
If we are unable to collect renewal fees from customers, our business will be harmed.
Our software platform could contain undetected errors, or bugs, which could cause problems with
product performance and which could in turn reduce demand for our software platform, reduce our
revenue and lead to product liability claims against us.
Software products like ours, which consist of hundreds of thousands of lines of code and
incorporate licensed software from third parties, may contain errors and/or defects. Although we
test our software extensively, we have in the past discovered software errors in our products after
their introduction. Despite testing by us and by our current and potential customers, errors may be
found in new products or releases after deployment begins. This could result in lost revenue,
damage to our reputation or delays in market acceptance which could harm our business, operating
results and financial condition. We may also have to expend resources to correct these defects.
Our license agreements with customers typically contain provisions designed to limit our
exposure to product liability, warranty and other claims. It is possible, however, that these
provisions may not be effective as a result of existing or future laws of certain domestic or
international jurisdictions or unfavorable judicial decisions in such jurisdictions, and we may be
exposed to product liability, warranty and other claims. If these claims are made, our potential
exposure may be substantial given the use of our products in business-critical applications. A
successful product liability claim against us could harm our business, operating results and
financial condition.
We face intense competition which may lead to reduced revenue and loss of market share.
The markets for business intelligence software, analytical applications and information
management are intensely competitive and subject to rapidly changing technology and evolving
standards. In addition, many companies in these markets are offering, or may soon offer, products
and services that may compete with our software platform.
We face competitors in several broad categories, including business intelligence software,
analytical processes, query, search and reporting tools. We compete with large software
corporations, including suppliers of enterprise resource planning software that provide one or more
capabilities that are competitive with our products, such as IBM (which acquired Cognos in 2008),
Microsoft, Oracle (which acquired Hyperion Solutions in 2007) and SAP AG (which acquired Business
Objects in 2008), and with open source business intelligence vendors, including Pentaho and
JasperSoft. Open source software is software that is made widely available by its authors and is
licensed “as is” for a nominal fee or, in some cases, at no charge. As the use of open source
software becomes more widespread, certain open source technology could become competitive with our
proprietary technology, which could cause sales of our products to decline or force us to reduce
the fees we charge for our products. We also compete, or may increasingly in the future compete,
with various independent competitors that are primarily focused on business intelligence products,
such as Actuate, Information Builders, MicroStrategy, the SAS Institute and TIBCO. We expect
additional competition as other established and emerging companies or open source vendors enter the
business intelligence software market and new products and technologies are introduced.
Many of our competitors have longer operating histories, significantly greater financial,
technical, marketing or other resources and greater name recognition than we do. In addition, many
of our competitors have strong relationships with current and potential customers and extensive
knowledge of the business intelligence industry. As a result, they may be able to respond more
quickly to new or emerging technologies and changes in customer requirements or devote greater
resources to the development, promotion and sale of their products than us. Increased competition
may lead to price cuts, fewer customer orders, reduced gross margins, longer sales cycles and loss
of market share. We may not be able to compete successfully against current and future competitors,
and our business, operating results and financial condition will be harmed if we fail to meet these
competitive pressures.
Current and future competitors may also make strategic acquisitions or establish cooperative
relationships among themselves or with others. By doing so, these competitors may increase their
ability to meet the needs of our potential customers. Our current or prospective indirect channel
partners may establish cooperative relationships with our current or future competitors. These
relationships may limit our ability to sell our software platform through specific distribution
channels. Accordingly, new competitors or alliances among current and future competitors may emerge
and rapidly gain significant market share. These developments could limit our ability to obtain
revenues from new customers and to maintain technical support revenues from our installed customer
base. If we are unable to compete successfully against current and future competitors, our
business, operating results and financial condition would be harmed.
17
If customers demand business intelligence software to be provided via a “software as a service”
business model, our business could be harmed.
Software as a service, or SaaS, is a model of software deployment where a software provider
typically licenses an application to customers for use as a service on demand through web browser
technologies. A SaaS business model can require a vendor to undertake substantial capital
investments and related sales and support resources and personnel. If customers were to require
business intelligence software like QlikView to be provided via a SaaS deployment, we would need to
undertake these investments in order to implement this alternative business model. In addition, we
would be obligated to apply new revenue recognition policies. Even if we undertook these
investments, we may be unsuccessful in implementing a SaaS business model. These factors could harm
our business, operating results and financial condition.
If we fail to develop our brand cost-effectively, our business may be harmed.
We believe that developing and maintaining awareness and integrity of our brand in a cost
effective manner are important to achieving widespread acceptance of our existing and future
products and are important elements in attracting new customers. We believe that the importance of
brand recognition will increase as competition in our market further intensifies. Successful
promotion of our brand will depend on the effectiveness of our marketing efforts and on our ability
to provide reliable and useful products at competitive prices. Brand promotion activities may not
yield increased revenue, and even if they do, the increased revenue may not offset the expenses we
incur in building our brand. We also rely on our customer base and community of end-users in a
variety of ways, including to give us feedback on our products and to provide user-based support to
our other customers. If we fail to promote and maintain our brand successfully or to maintain
loyalty among our customers and QlikCommunity, our user community, or if we incur substantial
expenses in an unsuccessful attempt to promote and maintain our brand, we may fail to attract new
customers or retain our existing customers and our business may be harmed.
If we are unable to manage our growth effectively, our revenues and profits could be adversely
affected.
We have recently expanded our operations and employee headcount significantly, and we
anticipate that further significant expansion will be required. Our future operating results depend
to a large extent on our ability to manage this expansion and growth successfully. Sustaining our
growth will place significant demands on our management as well as on our administrative,
operational and financial resources. To manage our growth, we must continue to improve our
operational, financial and management information systems and expand, motivate and manage our
workforce. If we are unable to manage our growth successfully without compromising our quality of
service and our profit margins, or if new systems that we implement to assist in managing our
growth do not produce the expected benefits, our revenues and profits could be harmed. Risks that
we face in undertaking future expansion include:
| |
• |
|
training new personnel to become productive and generate revenue |
| |
• |
|
controlling expenses and investments in anticipation of expanded operations |
| |
• |
|
implementing and enhancing our administrative infrastructure, systems and processes |
| |
• |
|
expanding operations in the U.S. and new international regions. |
A failure to manage our growth effectively could harm our ability to market and sell our
software platform and maintenance services.
If we are unable to recruit or retain skilled personnel, or if we lose the services of any of our
key personnel, our business, operating results and financial condition could be harmed.
Our future success depends on our continuing ability to attract, train and retain highly
skilled personnel, and we face intense competition for these employees. We may not be able to
retain our current key employees or attract, train or retain other highly skilled personnel in the
future. If we lose the services of one or all of these individuals, or if we are unable to attract,
train and retain the highly skilled personnel we need, our business, operating results and
financial condition could be harmed.
In addition, we must successfully integrate new employees into our operations and generate
sufficient revenues to justify the costs associated with these employees. If we fail to
successfully integrate employees or to generate the revenue necessary to offset employee-related
expenses, our business and financial results could be adversely affected.
The success of our business is also heavily dependent on the leadership of our key management
personnel, including Lars Björk, Chief Executive Officer, and other members of our senior management
team. The loss of one or more key employees could adversely affect our continued operations.
Our future success depends in a large part upon the continued service of key members of our
senior management team. In particular, Lars Björk, our Chief Executive Officer, is critical to the
overall management of QlikTech, as well as the development of our technology, our culture, and our
strategic direction. The loss of any of our management or key personnel could seriously harm our
business.
18
Future product development is dependent on adequate research and development resources.
In order to remain competitive, we must continue to develop new products, applications and
enhancements to our existing software platform. This is particularly true as we further expand our
product capabilities. Maintaining adequate research and development resources, such as the
appropriate personnel, talent and development technology, to meet the demands of the market is
essential. Our research and development organization is located in Lund, Sweden, and we may have
difficulty hiring suitably skilled personnel in this region or expanding our research and
development organization to facilities located in other geographic locations. In addition, many of
our competitors expend a considerably greater amount of resources on their respective research and
development programs. Our failure to maintain adequate research and development resources or to
compete effectively with the research and development programs of our competitors would present an
advantage to such competitors.
If we fail to offer high quality customer support, our business would suffer.
Once our software platform and solutions are deployed to our customers, our customers rely on
our support services to resolve any related issues. High quality customer support is important for
the successful marketing and sale of our software platform and services and for the renewal of
existing customers. The importance of high quality customer support will increase as we expand our
business and pursue new enterprise customers. If we do not help our customers quickly resolve
post-deployment issues and provide effective ongoing support, our ability to sell our software
platform and professional services to existing customers would suffer and our reputation with
existing or potential customers would be harmed.
We currently utilize a combination of internal support personnel and third party support
organizations, and we cannot provide assurance that actions taken or not taken by our third party
support organization will not harm our reputation or business. As we expand our sales, we will be
required to engage and train additional support personnel and resources. Further, our support
organization will face additional challenges as we enter new international markets, including
challenges associated with delivering support, training and documentation in languages required by
new customers. If we fail to maintain high quality customer support or to grow our internal and
external support organization to match any future sales growth, our business will suffer.
If we do not meet our revenue forecasts, we may be unable to reduce our expenses to avoid or
minimize harm to our results of operations.
Our revenues are difficult to forecast and are likely to fluctuate significantly from period
to period. We base our operating expense budgets on expected revenue trends, and many of our
expenses, such as office and equipment leases and personnel costs, will be relatively fixed in the
short term and will increase over time as we make investments in our business. Our estimates of
sales trends may not correlate with actual revenues in a particular quarter or over a longer period
of time. Variations in the rate and timing of conversion of our sales prospects into actual
licensing revenues could cause us to plan or budget inaccurately and those variations could
adversely affect our financial results. In particular, delays, reductions in amount or cancellation
of customers’ purchases or an increase in the number of customers exercising our 30-day money back
guarantee on our software platform would adversely affect the overall level and timing of our
revenues, and our business, results of operations and financial condition could be harmed. Due to
the relatively fixed nature of many of our expenses, we may be unable to adjust spending quickly
enough to offset any unexpected revenue shortfall.
In the course of our sales to customers, we may encounter difficulty collecting accounts
receivable and could be exposed to risks associated with uncollectible accounts receivable. In the
event we are unable to collect on our accounts receivable, it could negatively affect our cash
flows, operating results and business.
Our methodologies and software solutions may infringe the intellectual property rights of third
parties or be found to contain unexpected open source software, and this may create liability for
us or otherwise harm our business.
Third parties may claim that our current or future products infringe their intellectual
property rights, and such claims may result in legal claims against our customers and us. These
claims may damage our reputation, harm our customer relationships and create liability for us. We
expect the number of such claims will increase as the number of products and the level of
competition in our industry segments grow, the functionality of products overlap and the volume of
issued software patents and patent applications continues to increase. We generally agree in our
customer contracts to indemnify customers for expenses or liabilities they incur as a result of
third party intellectual property infringement claims associated with our products or services. To
the extent that any claim arises as a result of third party technology we have licensed for use in
our product, we may be unable to recover from the appropriate third party any expenses or other
liabilities that we incur.
In addition, software products like ours that contain thousands of lines of software code at
times incorporate open source software code. The use of open source software code is typically
subject to varying forms of software licenses, called copyleft or open source licenses. These types
of licenses may require that any person who creates a software product that redistributes or
modifies open source software that was subject to an open source license must also make their own
software product subject to the same open source license. This can lead to a requirement that the
newly created software product be provided free of charge or be made available or distributed in
source code form. Although we do not believe our software includes any open source software that
would result in the imposition of any such requirement on portions of our software product, our
software could be found to contain this type of open source software.
19
Responding to any infringement claim, regardless of its validity, or discovering open source
software in our product could harm our business, operating results and financial condition, by,
among other things:
| |
• |
|
resulting in time-consuming and costly litigation |
| |
• |
|
diverting management’s time and attention from developing our business |
| |
• |
|
requiring us to pay monetary damages or enter into royalty and licensing agreements that we would not normally find acceptable |
| |
• |
|
causing product shipment or deployment delays |
| |
• |
|
requiring us to stop selling certain of our products |
| |
• |
|
requiring us to redesign certain of our products using alternative non-infringing or non-open source technology or practices,
which could require significant effort and expense |
| |
• |
|
requiring us to disclose our software source code, the detailed program commands for our software program |
| |
• |
|
requiring us to satisfy indemnification obligations to our customers. |
Our intellectual property rights are valuable, and any inability to protect them could reduce the
value of our software platform, services and brand.
As of December 31, 2010, we had three issued U.S. patents and one pending U.S. patent expiring
at various times ranging from 2015 to 2029 and 19 issued and six pending foreign patents expiring
at various times ranging from 2015 to 2029. We rely on a combination of copyright, trademark,
patent, trade secrets, confidentiality procedures and contractual commitments to protect our
proprietary information. For example, we license our software pursuant to click-wrap or signed
license agreements that impose certain restrictions on a licensee’s ability to utilize the
software. We also seek to avoid disclosure of our intellectual property, including by requiring
those persons with access to our proprietary information to execute confidentiality agreements with
us and by restricting access to our source code.
Despite our efforts, these measures can only provide limited protection. Unauthorized third
parties may try to copy or reverse engineer portions of our software platform or may otherwise
obtain and use our intellectual property. Any patents owned by us may be invalidated, circumvented
or challenged. Any of our pending or future patent applications, whether or not being currently
challenged, may not be issued with the scope of the claims we seek, if at all. Legal standards
relating to the validity, enforceability and scope of protection of intellectual property rights in
other countries are uncertain and may afford little or no effective protection for our services,
software, methodology and other proprietary rights. Consequently, we may be unable to prevent our
intellectual property rights from being exploited abroad, which could require costly efforts to
protect them. Policing the unauthorized use of our proprietary rights is expensive, difficult and,
in some cases, impossible. Litigation may be necessary in the future to enforce or defend our
intellectual property rights, to protect our trade secrets or to determine the validity and scope
of the proprietary rights of others. Such litigation could result in substantial costs and
diversion of management resources, either of which could harm our business. Accordingly, despite
our efforts, we may not be able to prevent third parties from infringing upon or misappropriating
our intellectual property. If we cannot protect our proprietary technology against unauthorized
copying or use, we may not remain competitive.
Furthermore, many of our current and potential competitors have the ability to dedicate
substantially greater resources to developing and protecting their technology or intellectual
property rights than we do. In addition, our attempts to protect our proprietary technology and
intellectual property rights may be further limited as our employees may be recruited by our
current or future competitors and may take with them significant knowledge of our proprietary
information. Consequently, others may develop services and methodologies that are similar or
superior to our services and methodologies or may design around our intellectual property.
Computer “hackers” may damage our systems, services and products, and breaches of data protection
could impact our business.
Computer programmers and hackers may be able to penetrate our network security and
misappropriate our confidential information or that of third parties, create system disruptions or
cause interruptions or shutdowns of our internal systems and services. If successful, any of these
events could damage our computer systems or those of our customers and could disrupt or prevent us
from providing timely maintenance and support for our software platform. Computer programmers and
hackers also may be able to develop and deploy viruses, worms and other malicious software programs
that attack our products or otherwise exploit any security vulnerabilities of our products. The
costs to us to eliminate or alleviate security problems, bugs, viruses, worms, malicious software
programs and security vulnerabilities could be significant, and the efforts to address these
problems could result in interruptions, delays, cessation of service and loss of existing or
potential customers and may impede our sales and other critical functions.
In the course of our regular business operations and providing maintenance and support
services to our customers, we process and transmit proprietary information and sensitive or
confidential data, including personal information of employees, customers and others. Breaches in
security could expose us, our customers or the individuals affected to a risk of loss or misuse of
this information, which could result in potential regulatory actions, litigation and potential
liability for us, as well as the loss of existing or potential customers and damage to our brand
and reputation.
Our business could be harmed as a result of the risks associated with our acquisitions.
As part of our business strategy, we may from time to time seek to acquire businesses that
provide us with additional intellectual property, customer relationships and geographic coverage.
We can provide no assurances that we will be able to find and identify desirable acquisition
targets or that we will be successful in entering into a definitive agreement with any one target.
In addition, even if we reach a definitive agreement with a target, there is no assurance that we
will complete any future acquisition.
20
Any acquisitions we undertake will likely be accompanied by business risks which may include,
among other things:
| |
• |
|
the effect of the acquisition on our financial and strategic position and reputation |
| |
• |
|
the failure of an acquisition to result in expected benefits, which may include benefits relating to enhanced revenues,
technology, human resources, costs savings, operating efficiencies, goodwill and other synergies |
| |
• |
|
the difficulty, cost and management effort required to integrate the acquired businesses, including costs and delays in
implementing common systems and procedures and costs and delays caused by communication difficulties |
| |
• |
|
the assumption of certain known or unknown liabilities of the acquired business, including litigation-related liabilities |
| |
• |
|
the reduction of our cash available for operations and other uses, the increase in amortization expense related to
identifiable assets acquired, potentially dilutive issuances of equity securities or the incurrence of debt |
| |
• |
|
a lack of experience in new markets, new business culture, products or technologies or an initial dependence on unfamiliar
distribution partners |
| |
• |
|
the possibility that we will pay more than the value we derive from the acquisition |
| |
• |
|
the impairment of relationships with customers, partners or suppliers of the acquired business or our customers |
| |
• |
|
the potential loss of key employees of the acquired company. |
These factors could harm our business, results of operations or financial condition.
In addition to the risks commonly encountered in the acquisition of a business as described
above, we may also experience risks relating to the challenges and costs of closing a transaction.
The risks described above may be exacerbated as a result of managing multiple acquisitions at once.
Business disruptions could affect our operating results.
A significant portion of our research and development activities and certain other critical
business operations are concentrated at a single facility in Sweden. We are also a highly automated
business and a disruption or failure of our systems could cause delays in completing sales and
providing services. A major natural disaster, fire, act of terrorism or other catastrophic event
that results in the destruction or disruption of any of our critical business operations or
information technology systems could severely affect our ability to conduct normal business
operations and, as a result, our future operating results could be harmed.
Future litigation could harm our results of operation and financial condition.
In addition to intellectual property litigation, from time to time, we may be subject to other
litigation. We record a related liability when we can make a reasonable estimate of the liability
relating to pending litigation and determine that it is probable. As additional information becomes
available, we assess the potential liability and revise estimates as appropriate. However, because
of uncertainties relating to litigation, the amount of our estimates could be wrong. In addition to
the related cost and use of cash, pending or future litigation could cause the diversion of
management’s attention and resources.
We are incurring significant increased costs and demands upon management as a result of complying
with the laws and regulations affecting public companies, which could harm our operating results.
As a public company, we are incurring significant legal, accounting and other expenses that we
did not incur as a private company. In addition, the Sarbanes-Oxley Act of 2002, as well as rules
subsequently implemented by the SEC and the Nasdaq Global Market (“Nasdaq”) impose various
requirements on public companies, including requirements with respect to corporate governance
practices. Our management and other personnel devote a substantial amount of time to these
compliance initiatives. Moreover, we expect these rules and regulations to substantially increase
our legal and financial compliance costs and to make some activities more time-consuming and
costly. We also expect these rules and regulations to make it more difficult and more expensive for
us to obtain director and officer liability insurance, and we may be required to accept reduced
policy limits and coverage or incur substantial costs to maintain the same or similar coverage.
These rules and regulations could also make it more difficult for us to attract and retain
qualified persons to serve on our board of directors, our board committees or as executive
officers.
We may need additional capital in the future and it may not be available on acceptable terms, if at
all.
We have historically relied on outside financing and cash flow from operations to fund our
operations, capital expenditures and expansion. However, we may require additional capital in the
future to fund our operations and acquisitions, finance investments in equipment or personnel or
respond to competitive pressures. We cannot provide assurance that additional financing will be
available on terms acceptable to us. In addition, the terms of available financing may place limits
on our financial and operational flexibility. If we are unable to obtain sufficient capital in the
future, we may not be able to continue to meet customer demand for service quality, availability
and competitive
pricing. We also may be forced to reduce our operations or may not be able to expand or
acquire complementary businesses, develop new services or otherwise respond to changing business
conditions or competitive pressures.
21
Prolonged economic uncertainties or downturns could materially harm our business.
Current or future economic downturns could harm our business and results of operations.
Negative trends in the general economy both in the U.S. and abroad, including trends resulting from
actual or threatened military action by the U.S., terrorist attacks on the U.S., Europe or
elsewhere, and financial and credit market fluctuations, could cause a decrease in corporate
spending on business intelligence software in general and negatively affect the rate of growth of
our business.
General worldwide economic conditions have experienced a significant downturn. These
conditions make it extremely difficult for our customers and us to accurately forecast and plan
future business activities, and they could cause our customers to slow spending on our products and
services, which would delay and lengthen sales cycles. Furthermore, during challenging economic
times our customers may face issues in gaining timely access to sufficient credit, which could
result in an impairment of their ability to make timely payments to us. If that were to occur, we
may be required to increase our allowance for doubtful accounts and our results would be harmed.
We maintain operating bank accounts at financial institutions in the U.S., Sweden and other
regions. In particular, a significant amount of our cash balances in the U.S. and Sweden are in
excess of the insurance limits of the U.S. government’s Federal Deposit Insurance Corporation, or
FDIC and Swedish government’s Swedish Deposit Insurance Scheme, or Insättningsgarantin. The FDIC
insures deposits in most banks and savings associations located in the U.S. and protects depositors
against the loss of their deposits if an FDIC-insured bank or savings association fails, subject to
specified monetary ceilings. Similarly, the Swedish Deposit Insurance Scheme is a state-provided
guarantee of deposits in accounts at Swedish banks, subject to specified monetary ceilings. We
could incur substantial losses if the underlying financial institutions in these or other regions
fail or are otherwise unable to return our deposits.
We have a significant number of customers in the consumer products and services, manufacturing
and financial services industries. A substantial downturn in these industries may cause firms to
react to worsening conditions by reducing their capital expenditures in general or by specifically
reducing their spending on information technology. Customers in these industries may delay or
cancel information technology projects or seek to lower their costs by renegotiating vendor
contracts. Also, customers with excess information technology resources may choose to develop
in-house software solutions rather than obtain those solutions from us. Moreover, competitors may
respond to market conditions by lowering prices and attempting to lure away our customers. In
addition, the increased pace of consolidation in certain industries may result in reduced overall
spending on our products.
We cannot predict the timing, strength or duration of any economic slowdown or recovery,
generally or in the consumer products and services, manufacturing and financial services
industries. If the economic conditions of the general economy or markets in which we operate worsen
from present levels, our business, financial condition and results of operations could be harmed.
If we fail to establish and maintain proper and effective internal control over financial
reporting, our operating results and our ability to operate our business could be harmed.
The Sarbanes-Oxley Act requires, among other things, that we establish and maintain effective
internal control over financial reporting and disclosure controls and procedures. Under the SEC’s
current rules, beginning with the year ending December 31, 2011, we will be required to perform
system and process evaluation and testing of our internal control over financial reporting to allow
management to report on the effectiveness of our internal control over financial reporting, as
required by Section 404 of the Sarbanes-Oxley Act. Our independent registered public accounting
firm will also be required to report on our internal control over financial reporting. Our testing
and our independent registered public accounting firm’s testing may reveal deficiencies in our
internal control over financial reporting that are deemed to be material weaknesses and render our
internal control over financial reporting ineffective. Due to the extent of our international
operations, our financial reporting requires substantial international activities, resources and
reporting consolidation. We expect to incur substantial accounting and auditing expense and to
expend significant management time in complying with the requirements of Section 404. If we are not
able to comply with the requirements of Section 404 in a timely manner, or if we or our independent
registered public accounting firm identify deficiencies in our internal control over financial
reporting that are deemed to be material weaknesses, the market price of our stock could decline
and we could be subject to investigations or sanctions by the SEC, the Financial Industry
Regulatory Authority, Inc., known as FINRA, or other regulatory authorities. In addition, we could
be required to expend significant management time and financial resources to correct any material
weaknesses that may be identified or to respond to any regulatory investigations or proceedings.
We have previously identified material weaknesses in our internal control over financial reporting,
and if we are unable to achieve and maintain effective internal control over financial reporting,
this could have a material adverse effect on our business and common stock price.
We produce our consolidated financial statements in accordance with the requirements of United
States generally accepted accounting principles (“U.S. GAAP”), but our internal accounting controls
may not currently meet all standards applicable to companies with publicly traded securities.
Effective internal controls are necessary for us to provide reliable financial reports to help
mitigate the risk of fraud and to operate successfully as a publicly traded company.
22
In connection with the preparation of our consolidated financial statements for the year ended
December 31, 2009, we identified a material weakness in the design and operation of our internal
controls over financial reporting relating to the accounting for expenses in one of our European
operating subsidiaries. A material weakness is defined as a deficiency, or a combination of
deficiencies, in internal control over financial reporting, such that there is a reasonable
possibility that a material misstatement of a company’s annual or interim financial statements will
not be prevented or detected on a timely basis by the company’s internal controls. Specifically, we
determined that we had insufficient reconciliation and oversight of our accounting for accrued and
prepaid expenses in one of our European operating subsidiaries during our
financial statement close process which would have resulted in the overstatement of our assets
and liabilities in the consolidated balance sheet and an overstatement of operating expenses and
understatement of net income. During 2010, we have implemented procedures and controls designed to
improve communication and overview of financial reporting by our geographic territories, including
the affected operating subsidiary noted above, during our reporting consolidation processes. These
procedures and controls include a monthly review of each of our territory’s financial results by
financial controllers outside of the respective territory; increased communications, including
monthly videoconferences among all regional financial controllers to address any material topics;
and a quarterly requirement for all reporting territories to provide detailed commentary and
analysis of material balance sheet positions and operating results for internal review purposes. We
believe we have remediated this material weakness. In connection with the preparation of our
consolidated financial statements for the year ended December 31, 2008, we identified a material
weakness in our formal financial statement closing process. We remediated this material weakness
during 2009 by implementing additional controls, including increasing our corporate accounting
staff, implementing additional system controls and establishing a formalized closing calendar.
Although we believe we have addressed the internal control deficiencies that led to the
material weaknesses, the measures we have taken may not be effective given our global operations
and distribution capabilities, and we may not be able to implement and maintain effective internal
control over financial reporting in the future. If we have these or other material weaknesses in
the future, it could affect the financial results that we report or create a perception that those
financial results do not fairly state our financial condition or results of operations. Either of
those events could have an adverse effect on the value of our common stock.
Our results of operations may be adversely affected by changes in or interpretations of accounting
standards.
We prepare our consolidated financial statements in conformity with U.S. GAAP. These principles
are subject to interpretation by the SEC and various bodies formed to interpret and create
appropriate accounting standards. It is possible that future requirements, including the recently
proposed implementation of International Financial Reporting Standards (“IFRS”), could change our
current application of U.S. GAAP, resulting in a material adverse impact on our financial position
or results of operations. Our accounting policies that recently have been or may be affected by
changes in the accounting rules are as follows:
| |
• |
|
software revenue recognition |
| |
• |
|
accounting for income taxes |
| |
• |
|
accounting for business combinations and related goodwill |
| |
• |
|
accounting for stock issued to employees |
| |
• |
|
assessing fair value of financial and non-financial
assets |
| |
• |
|
application, if any, of IFRS. |
We continuously review our compliance with all new and existing revenue recognition accounting
pronouncements. Depending upon the outcome of these ongoing reviews and the potential issuance of
further accounting pronouncements, implementation guidelines and interpretations, we may be
required to modify our reported results, revenue recognition policies or business practices which
could harm our results of operations.
We may have exposure to additional tax liabilities.
We are subject to taxes in the U.S. and numerous foreign jurisdictions. All of these
jurisdictions have in the past and may in the future make changes to their corporate income tax
rates and other income tax laws which could increase our future income tax provision.
Our future income tax obligations could be affected by earnings that are lower than
anticipated in jurisdictions where we have lower statutory rates and by earnings that are higher
than anticipated in jurisdictions where we have higher statutory rates, by changes in the valuation
of our deferred tax assets and liabilities, changes in the amount of unrecognized tax benefits or
by changes in tax laws, regulations, accounting principles or interpretations thereof.
Our determination of our tax liability is subject to review by
applicable U.S. federal, state and local and foreign tax
authorities. Any adverse outcome of such a review could harm our operating results and financial
condition. The determination of our worldwide provision for income taxes and other tax liabilities
requires significant judgment and, in the ordinary course of business, there are many transactions
and calculations where the ultimate tax determination is uncertain. Moreover, as a multinational
business, we have subsidiaries that engage in many intercompany transactions in a variety of tax
jurisdictions where the ultimate tax determination is uncertain.
We are also subject to non-income taxes, such as payroll, sales, use, value-added, net worth,
property and goods and services taxes in the United States and various foreign jurisdictions. We
are regularly under audit by tax authorities with respect to these non-income taxes and may have
exposure to additional non-income tax liabilities which could have an adverse effect on our results
of operations and financial condition. In addition, our future effective tax rates could be
favorably or unfavorably affected by changes in tax rates, changes in the valuation of our
deferred tax assets or liabilities, or changes in tax laws or their interpretation. Such
changes could have a material adverse impact on our financial results.
23
As a result of these and other factors, the ultimate amount of tax obligations owed may differ
from the amounts recorded in our financial statements and any such difference may harm our
financial results in future periods in which we change our estimates of our tax obligations or in
which the ultimate tax outcome is determined.
If securities or industry analysts do not publish research or reports or publish unfavorable
research or reports about our business, our stock price and trading volume could decline.
The trading market for our common stock will be influenced by the research and reports that
securities or industry analysts may publish about us, our business, our market or our competitors.
If any of the analysts who may cover us adversely change their recommendation regarding our stock,
or provide more favorable relative recommendations about our competitors, our stock price would
likely decline. If any analyst who may cover us were to cease coverage of our company or fail to
regularly publish reports on us, interest in our stock could decrease, which could cause our stock
price or trading volume to decline.
The price of our common stock may be volatile and fluctuate substantially.
The market price of our common stock could be highly volatile and may fluctuate substantially
due to the following factors (in addition to the other risk factors described in this section):
| |
• |
|
quarterly variations in our results of operations or those of our competitors |
| |
• |
|
announcements by us or our competitors of acquisitions, new products, significant contracts or commercial relationships |
| |
• |
|
our ability to respond to changing industry standards, technological developments or customer requirements on a timely basis |
| |
• |
|
commencement of, or our involvement in, litigation |
| |
• |
|
any major change in our board of directors or management |
| |
• |
|
recommendations by securities analysts or changes in earnings estimates |
| |
• |
|
announcements about our earnings that are not in line with analyst expectations |
| |
• |
|
announcements by our competitors of their earnings that are not in line with analyst expectations |
| |
• |
|
the volume of shares of our common stock available for public sale |
| |
• |
|
sales of stock by us or by our stockholders |
| |
• |
|
short sales, hedging and other derivative transactions involving shares of our common stock |
| |
• |
|
adoption of new accounting standards |
| |
• |
|
general economic conditions in the U.S. and abroad and slow or negative growth of related markets |
| |
• |
|
general political conditions in the U.S. and abroad, including terrorist attacks, war or threat of terrorist attacks or war. |
In addition, the stock market in general, Nasdaq and the market for technology companies in
particular, have experienced extreme price and volume fluctuations that have often been unrelated
or disproportionate to the operating performance of the particular companies affected. These broad
market and industry factors may materially harm the market price irrespective of our operating
performance. As a result of these factors, an investor might be unable to resell their shares at or
above the price paid. In addition, in the past, following periods of volatility in the overall
market and the market price of a company’s securities, securities class action litigation has often
been instituted against the affected company. This type of litigation, if instituted against us,
could result in substantial costs and a diversion of our management’s attention and resources.
24
Future sales of our common stock in the public market, including sales by our stockholders with
significant holdings, may depress our stock price.
The market price of our common stock could drop due to sales of a large number of shares or
the perception that such sales could occur, including sales or perceived sales by our directors,
officers or large stockholders. These sales could also make it more difficult or impossible for us
to sell equity securities in the future at a time and price that we deem appropriate to raise funds
through future offerings of common stock.
Our management will have broad discretion over the use of our cash reserves, if any, and might not
apply this cash in ways that increase the value of an investment.
Our management will have broad discretion to use our cash reserves, if any, and you will be
relying on the judgment of our management regarding the application of this cash. They might not
apply our cash in ways that increase the value of an investment. We expect to use our cash reserves
for general corporate purposes, including working capital, capital expenditures, acquisitions and
further development of our services and solutions. We have not allocated this cash for any specific
purposes. Our management might not be able to yield any return on the investment and use of this
cash.
We currently do not intend to pay dividends on our common stock, and consequently, your only
opportunity to achieve a return on investment is if the price of our common stock appreciates and
you sell your shares at a price above your cost.
We currently do not intend to declare or pay dividends on shares of our common stock in the
foreseeable future. See “Dividend Policy” for more information. Consequently, your only opportunity
to achieve a return on your investment in our company will be if the market price of our common
stock appreciates and you sell your shares at a price above your cost. There is no guarantee that
the price of our common stock will ever exceed the price that you pay. Investors seeking cash
dividends should not purchase our common stock.
Anti-takeover provisions in our certificate of incorporation and bylaws and in Delaware law could
prevent or delay a change in control of our company.
We are a Delaware corporation, and the anti-takeover provisions of the Delaware General
Corporation Law may discourage, delay or prevent a change in control by prohibiting us from
engaging in a business combination with an interested stockholder for a period of three years after
the person becomes an interested stockholder even if a change of control would be beneficial to our
existing stockholders. In addition, our restated certificate of incorporation and amended and
restated bylaws may discourage, delay or prevent a change in our management or control over us that
stockholders may consider favorable. Our restated certificate of incorporation and amended and
restated bylaws:
| |
• |
|
authorize the issuance of “blank check” preferred stock that could be issued by our board of directors to thwart a takeover
attempt |
| |
• |
|
do not provide for cumulative voting in the election of directors which would allow holders of less than a majority of the stock
to elect some directors |
| |
• |
|
establish a classified board of directors, as a result of which the successors to the directors whose terms have expired will be
elected to serve from the time of election and qualification until the third annual meeting following their election |
| |
• |
|
require that directors only be removed from office for cause |
| |
• |
|
provide that vacancies on the board of directors, including newly-created directorships, may be filled only by a majority vote of
directors then in office |
| |
• |
|
limit who may call special meetings of stockholders |
| |
• |
|
prohibit stockholder action by written consent, requiring all actions to be taken at a meeting of the stockholders |
| |
• |
|
establish advance notice requirements for nominating candidates for election to the board of directors or for proposing matters
that can be acted upon by stockholders at stockholder meetings. |
|
|
|
| ITEM 1B. |
|
UNRESOLVED STAFF COMMENTS |
None.
25
Our global corporate headquarters and principal executive offices are located in Radnor,
Pennsylvania. In November 2010, we entered into an amendment to the lease for our global corporate
headquarters and principal executive offices which increased the aggregate rentable square footage
to 39,200 square feet. Our development offices are located in Lund, Sweden. In December 2010, we
entered into a transfer
agreement with a third party to lease an aggregate rentable square footage in Lund, Sweden
of 11,253 square feet. See “Management’s Discussion and Analysis of Financial Condition and Results
of Operations — Contractual Obligations and Commitments & Off-Balance Sheet Arrangements.”
| |
|
|
|
|
|
|
|
|
|
|
| Location |
|
Type of Facility |
|
Size (in sq. ft) |
|
|
Ownership Status |
|
Lease Expiration Date |
|
|
|
|
|
|
|
|
|
Radnor, Pennsylvania |
|
Headquarters |
|
|
17,330 |
|
|
Leased |
|
September 30, 2011 |
Lund, Sweden |
|
Corporate and Research & Development |
|
|
11,253 |
|
|
Leased |
|
October 31, 2016 |
We maintain other leased locations in the U.S. and throughout the world. In the U.S., we lease
additional office space in Boston, Massachusetts, Chicago, Illinois, Dallas, Texas, Raleigh, North
Carolina, and San Mateo, California. Throughout the world, we lease offices in Australia, Austria,
Belgium, Canada, Denmark, Finland, France, Germany, Hong Kong, India, Italy, Japan, the
Netherlands, Norway, Portugal, Russia, Singapore, Spain, Sweden, Switzerland, the United Arab
Emirates and the United Kingdom. We believe our current facilities and planned expansion facilities
will be adequate for the foreseeable future; however, we will continue to seek additional space as
needed to satisfy any growth.
|
|
|
| ITEM 3. |
|
LEGAL PROCEEDINGS |
From time to time, we may become involved in routine legal proceedings in the ordinary
course of our business. We are not presently a party to any legal proceedings that, if determined
adversely to us, would individually or in the aggregate have a material adverse effect on our
business, operating results, financial condition or cash flows.
|
|
|
| ITEM 4. |
|
REMOVED AND RESERVED |
26
PART II
|
|
|
| ITEM 5. |
|
MARKET FOR REGISTRANT’S COMMON EQUITY, RELATED STOCKHOLDER MATTERS AND ISSUER PURCHASES OF
EQUITY SECURITIES |
Market Information
Our common stock is quoted on Nasdaq under the symbol “QLIK.” The following table sets forth,
for the period indicated, the high and low sales prices of our common stock as reported by Nasdaq.
| |
|
|
|
|
|
|
|
|
| |
|
High |
|
|
Low |
|
|
|
|
|
|
|
|
|
|
Year ended December 31, 2009: |
|
|
|
|
|
|
|
|
First quarter |
|
$ |
— |
|
|
$ |
— |
|
Second quarter |
|
$ |
— |
|
|
$ |
— |
|
Third quarter |
|
$ |
— |
|
|
$ |
— |
|
Fourth quarter |
|
$ |
— |
|
|
$ |
— |
|
|
|
|
|
|
|
|
|
|
Year ended December 31, 2010: |
|
|
|
|
|
|
|
|
First quarter |
|
$ |
— |
|
|
$ |
— |
|
Second quarter |
|
$ |
— |
|
|
$ |
— |
|
Third quarter |
|
$ |
27.70 |
|
|
$ |
12.00 |
|
Fourth quarter |
|
$ |
29.25 |
|
|
$ |
20.55 |
|
As
of March 14, 2011, there were approximately 240 holders of record of our common stock.
The number of holders of record of our common stock does not reflect the number of beneficial
holders whose shares are held by depositors, brokers or other nominees.
Dividend Policy
We have never paid cash dividends. It is our policy to retain earnings to finance the growth
and development of our business and, therefore, we do not anticipate paying any dividends in the
foreseeable future.
Securities Authorized for Issuance Under Equity Compensation Plans
The following table provides certain information regarding our equity compensation plans in
effect as of December 31, 2010:
| |
|
|
|
|
|
|
|
|
|
|
|
|
| Equity Compensation Plan Information |
|
| |
|
|
|
|
|
|
|
|
|
Number of Securities |
|
| |
|
Number of |
|
|
|
|
|
|
Remaining Available |
|
| |
|
Securities to be |
|
|
|
|
|
|
for Issuance Under |
|
| |
|
Issued Upon |
|
|
Weighted-Average |
|
|
Equity Compensation |
|
| |
|
Exercise of |
|
|
Exercise Price of |
|
|
Plans (Excluding |
|
| |
|
Outstanding Options, |
|
|
Outstanding Options, |
|
|
Securities Reflected |
|
| Plan Category |
|
Warrant and Rights |
|
|
Warrants and Rights |
|
|
in Column (a)) |
|
| |
|
(a) |
|
|
(b) |
|
|
(c) |
|
|
|
|
|
|
|
|
|
|
|
|
|
|
Equity compensation plans approved by security holders |
|
|
12,094,265 |
(1) |
|
$ |
2.98 |
(2) |
|
|
2,644,280 |
(3) |
|
|
|
|
|
|
|
|
|
|
|
|
|
Equity compensation plans not approved by security holders |
|
|
— |
|
|
|
— |
|
|
|
— |
|
|
|
|
|
|
|
|
|
|
|
|
|
|
|
|
|
|
|
|
|
|
|
|
Total |
|
|
12,094,265 |
(1) |
|
$ |
2.98 |
(2) |
|
|
2,644,280 |
(3) |
|
|
|
|
|
|
|
|
|
|
| |
|
|
| (1) |
|
Includes 614,900 shares issuable upon exercise of outstanding options and 40,820
shares issuable upon settlement of restricted stock units under the 2010 Equity Incentive Plan. Includes
7,204,516 shares issuable upon exercise of outstanding options under the 2007 Equity
Incentive Plan. Includes 4,234,029 shares issuable upon exercise of outstanding options
under the 2004 Equity Incentive Plan. |
| |
| (2) |
|
Does not take into account restricted stock units, which have no exercise price. |
| |
| (3) |
|
On January 1 of each year, the number of shares reserved under the 2010 Equity
Incentive Plan is automatically increased by the lowest of (a) 3.75% of the total number of shares of Common
Stock that are outstanding at that time, or (b) 3,300,000 shares or (c) such lesser
number as may be approved by the Company’s board of directors. |
27
Stock Performance Graph
The following graph compares the cumulative 5-month total return to shareholders on Qlik
Technologies Inc.’s common stock relative to the cumulative total returns of the NASDAQ Composite
index and the NASDAQ Computer & Data Processing index. The graph assumes that the value of the
investment in the Company’s common stock and in each of the indexes (including reinvestment of
dividends) was $100 on July 16, 2010 and tracks it through December 31, 2010.
| |
|
|
|
|
|
|
|
|
| |
|
July 16, 2010 |
|
|
December 31, 2010 |
|
Qlik Technologies Inc. |
|
$ |
100.00 |
|
|
$ |
202.11 |
|
NASDAQ Composite |
|
$ |
100.00 |
|
|
$ |
126.26 |
|
NASDAQ Computer & Data Processing |
|
$ |
100.00 |
|
|
$ |
131.76 |
|
Recent Sales of Unregistered Securities
| |
|
|
| (1) |
|
From January 1, 2010 through July 15, 2010, we sold and issued to our employees and
service providers an aggregate of 776,443 shares of our common stock pursuant to option
exercises under our 2004 Omnibus Stock Option and Award Plan and 2007 Omnibus Stock Option
and Award Plan at prices ranging from $0.6298 to $3.81 per share for an aggregate purchase
price of $922,728. |
| |
| (2) |
|
From January 1, 2010 through July 15, 2010, we granted to our employees and service
providers options to purchase an aggregate of 1,425,500 shares of our common stock under
our 2007 Omnibus Stock Option and Award Plan at prices ranging from $5.18 to $6.91 per
share for an aggregate purchase price of $8,941,090. |
| |
| (3) |
|
On January 22, 2010, we issued an aggregate of 120,000 shares of our common stock at a
price of $5.18 per share to three individuals in connection with the acquisition of
Syllogic Corporation. |
| |
| (4) |
|
On November 2, 2010, we issued 253,605 shares of our common stock upon net exercise of
a warrant. |
| |
| (5) |
|
On November 4, 2010, we issued 93,981 shares of our common stock upon exercise of a
warrant for an aggregate of $155,069. |
| |
| (6) |
|
On December 8, 2010, we issued 214,200 shares of our common stock upon exercise of a
warrant for an aggregate of $494,802. |
28
No underwriters were involved in the foregoing sales of securities. The issuances of the
securities described above were deemed to be exempt from registration under the Securities Act in
reliance on Section 4(2) of the Securities Act, Rule 701 promulgated under Section 3(b) of the
Securities Act or Regulation S under the Securities Act. The recipients of securities in each such
transaction represented their intention to acquire the securities for investment only and not with
a view to or for sale in connection with any distribution thereof and appropriate legends were
affixed to the stock certificates, warrant agreements and option agreements issued in such
transactions.
Use of Proceeds
In July 2010, we completed the initial public offering of shares of our common stock, in which
12,880,000 shares of common stock were sold at a price to the public of $10.00 per share for an
aggregate offering price of $128.8 million. The offer and sale of all of the shares in the IPO were
registered under the Securities Act pursuant to a registration statement on Form S-1 (File No.
333-165844), which was declared effective by the SEC on July 15, 2010. The offering commenced as of
July 15, 2010 and did not terminate before all of the securities registered in the registration
statement were sold. The syndicate of underwriters was led by Morgan Stanley & Co. Incorporated,
Citigroup Global Markets Inc., and J.P. Morgan Securities Inc. as joint book-running managers for
the offering, Jefferies & Company, Inc. and Stifel Nicolaus Weisel served as co-managers for the
offering. The net proceeds from the initial public offering were approximately $115.1
million after deducting underwriting discounts of $9.0 million and offering costs of $4.7 million.
We used approximately $5.4 million of the net proceeds from the offering to repay in full the
principal and accrued interest and prepayment fee on our prior debt facility. We intend to use the
balance of the net proceeds from the offering for working capital and other general corporate
purposes, including financing our growth, developing new products and funding capital expenditures.
Pending such usage, we have invested the net proceeds primarily in short-term, interest-bearing
money market accounts.
29
|
|
|
| ITEM 6. |
|
SELECTED CONSOLIDATED FINANCIAL DATA |
The
consolidated statements of income data for the three years ended December 31, 2010 and
the consolidated balance sheet data as of December 31, 2010 and 2009 have been derived from our
audited consolidated financial statements included elsewhere in this Annual Report on Form 10-K. The
consolidated statements of income data for the years ended December 31, 2007 and 2006 and the
consolidated balance sheet data as of December 31, 2008, 2007 and 2006 have been derived from our
audited consolidated financial statements that do not appear in this Annual Report on Form 10-K.
The following selected consolidated financial data should be read in conjunction with “Management’s
Discussion and Analysis of Financial Conditions and Operations” set forth below and our
consolidated financial statements and related notes included elsewhere in this Annual Report on
Form 10-K. The historical results are not necessarily indicative of the results to be expected in
any future period.
| |
|
|
|
|
|
|
|
|
|
|
|
|
|
|
|
|
|
|
|
|
| |
|
Year Ended December 31, |
|
| |
|
2010 |
|
|
2009 |
|
|
2008 |
|
|
2007 |
|
|
2006 |
|
| |
|
(in thousands, except
share and per share data) |
|
Consolidated
statements of income data: |
|
|
|
|
|
|
|
|
|
|
|
|
|
|
|
|
|
|
|
|
Revenue: |
|
|
|
|
|
|
|
|
|
|
|
|
|
|
|
|
|
|
|
|
License revenue |
|
$ |
145,225 |
|
|
$ |
99,864 |
|
|
$ |
74,446 |
|
|
$ |
51,482 |
|
|
$ |
28,915 |
|
Maintenance revenue |
|
|
59,846 |
|
|
|
41,390 |
|
|
|
29,401 |
|
|
|
17,747 |
|
|
|
9,797 |
|
Professional services revenue |
|
|
21,450 |
|
|
|
16,105 |
|
|
|
14,417 |
|
|
|
11,357 |
|
|
|
5,558 |
|
|
|
|
|
|
|
|
|
|
|
|
|
|
|
|
|
Total revenue |
|
|
226,521 |
|
|
|
157,359 |
|
|
|
118,264 |
|
|
|
80,586 |
|
|
|
44,270 |
|
Cost of revenue: |
|
|
|
|
|
|
|
|
|
|
|
|
|
|
|
|
|
|
|
|
License revenue |
|
|
3,670 |
|
|
|
3,663 |
|
|
|
3,071 |
|
|
|
2,949 |
|
|
|
1,140 |
|
Maintenance revenue |
|
|
3,998 |
|
|
|
1,635 |
|
|
|
1,365 |
|
|
|
580 |
|
|
|
352 |
|
Professional services revenue |
|
|
16,054 |
|
|
|
11,802 |
|
|
|
9,562 |
|
|
|
8,177 |
|
|
|
4,582 |
|
|
|
|
|
|
|
|
|
|
|
|
|
|
|
|
|
Total cost of revenue |
|
|
23,722 |
|
|
|
17,100 |
|
|
|
13,998 |
|
|
|
11,706 |
|
|
|
6,074 |
|
|
|
|
|
|
|
|
|
|
|
|
|
|
|
|
|
Gross profit |
|
|
202,799 |
|
|
|
140,259 |
|
|
|
104,266 |
|
|
|
68,880 |
|
|
|
38,196 |
|
Operating expenses: |
|
|
|
|
|
|
|
|
|
|
|
|
|
|
|
|
|
|
|
|
Sales and marketing |
|
|
122,394 |
|
|
|
93,349 |
|
|
|
74,267 |
|
|
|
48,249 |
|
|
|
26,999 |
|
Research and development |
|
|
13,537 |
|
|
|
8,735 |
|
|
|
8,258 |
|
|
|
5,419 |
|
|
|
3,275 |
|
General and administrative |
|
|
39,300 |
|
|
|
25,009 |
|
|
|
20,190 |
|
|
|
15,154 |
|
|
|
9,699 |
|
|
|
|
|
|
|
|
|
|
|
|
|
|
|
|
|
Total operating expenses |
|
|
175,231 |
|
|
|
127,093 |
|
|
|
102,715 |
|
|
|
68,822 |
|
|
|
39,973 |
|
|
|
|
|
|
|
|
|
|
|
|
|
|
|
|
|
Income (loss) from operations |
|
|
27,568 |
|
|
|
13,166 |
|
|
|
1,551 |
|
|
|
58 |
|
|
|
(1,777 |
) |
Other income (expense), net |
|
|
(6,854 |
) |
|
|
(4,529 |
) |
|
|
3,304 |
|
|
|
(463 |
) |
|
|
(748 |
) |
|
|
|
|
|
|
|
|
|
|
|
|
|
|
|
|
Income
(loss) before benefit (provision) for income taxes |
|
|
20,714 |
|
|
|
8,637 |
|
|
|
4,855 |
|
|
|
(405 |
) |
|
|
(2,525 |
) |
Benefit (provision) for income taxes |
|
|
(7,198 |
) |
|
|
(1,776 |
) |
|
|
(1,860 |
) |
|
|
40 |
|
|
|
— |
|
|
|
|
|
|
|
|
|
|
|
|
|
|
|
|
|
Net income (loss) |
|
$ |
13,516 |
|
|
$ |
6,861 |
|
|
$ |
2,995 |
|
|
$ |
(365 |
) |
|
$ |
(2,525 |
) |
|
|
|
|
|
|
|
|
|
|
|
|
|
|
|
|
Net income (loss) per common share: |
|
|
|
|
|
|
|
|
|
|
|
|
|
|
|
|
|
|
|
|
Basic |
|
$ |
0.24 |
|
|
$ |
0.07 |
|
|
$ |
0.01 |
|
|
$ |
(0.03 |
) |
|
$ |
(0.20 |
) |
Diluted |
|
$ |
0.21 |
|
|
$ |
0.06 |
|
|
$ |
0.01 |
|
|
$ |
(0.03 |
) |
|
$ |
(0.20 |
) |
Weighted average number of common shares: |
|
|
|
|
|
|
|
|
|
|
|
|
|
|
|
|
|
|
|
|
Basic |
|
|
45,232,782 |
|
|
|
16,267,186 |
|
|
|
14,552,999 |
|
|
|
13,526,926 |
|
|
|
12,515,571 |
|
Diluted |
|
|
52,061,916 |
|
|
|
20,778,448 |
|
|
|
16,523,443 |
|
|
|
13,526,926 |
|
|
|
12,515,571 |
|
30
The chart above includes the following stock-based compensation expense:
| |
|
|
|
|
|
|
|
|
|
|
|
|
|
|
|
|
|
|
|
|
| |
|
2010 |
|
|
2009 |
|
|
2008 |
|
|
2007 |
|
|
2006 |
|
| |
|
(in thousands) |
|
|
|
|
|
|
|
|
|
|
|
|
|
|
|
|
|
|
|
|
|
|
Cost of revenue |
|
$ |
188 |
|
|
$ |
82 |
|
|
$ |
39 |
|
|
$ |
12 |
|
|
$ |
2 |
|
Sales and marketing |
|
|
1,572 |
|
|
|
733 |
|
|
|
285 |
|
|
|
103 |
|
|
|
12 |
|
Research and development |
|
|
96 |
|
|
|
79 |
|
|
|
19 |
|
|
|
6 |
|
|
|
1 |
|
General and administrative |
|
|
1,162 |
|
|
|
585 |
|
|
|
388 |
|
|
|
69 |
|
|
|
11 |
|
|
|
|
|
|
|
|
|
|
|
|
|
|
|
|
|
|
|
$ |
3,018 |
|
|
$ |
1,479 |
|
|
$ |
731 |
|
|
$ |
190 |
|
|
$ |
26 |
|
|
|
|
|
|
|
|
|
|
|
|
|
|
|
|
|
| |
|
|
|
|
|
|
|
|
|
|
|
|
|
|
|
|
|
|
|
|
| |
|
Year Ended December 31, |
|
| |
|
2010 |
|
|
2009 |
|
|
2008 |
|
|
2007 |
|
|
2006 |
|
| |
|
(in thousands) |
|
|
|
|
|
|
|
|
|
|
|
|
|
|
|
|
|
|
|
|
|
|
Consolidated balance sheet data: |
|
|
|
|
|
|
|
|
|
|
|
|
|
|
|
|
|
|
|
|
Cash and cash equivalents |
|
$ |
158,712 |
|
|
$ |
24,852 |
|
|
$ |
14,800 |
|
|
$ |
9,214 |
|
|
$ |
4,401 |
|
Working capital |
|
|
149,069 |
|
|
|
14,829 |
|
|
|
12,155 |
|
|
|
2,411 |
|
|
|
2,958 |
|
Total assets |
|
|
265,064 |
|
|
|
102,967 |
|
|
|
67,018 |
|
|
|
50,684 |
|
|
|
25,827 |
|
Deferred revenue |
|
|
50,024 |
|
|
|
35,575 |
|
|
|
22,143 |
|
|
|
17,297 |
|
|
|
9,760 |
|
Long-term debt, including current portion |
|
|
— |
|
|
|
11,436 |
|
|
|
10,762 |
|
|
|
1,855 |
|
|
|
1,965 |
|
Convertible preferred stock |
|
|
— |
|
|
|
23,901 |
|
|
|
23,901 |
|
|
|
23,901 |
|
|
|
23,901 |
|
Total stockholders’ equity (deficit) |
|
|
159,190 |
|
|
|
(9,103 |
) |
|
|
(17,368 |
) |
|
|
(20,877 |
) |
|
|
(21,190 |
) |
31
|
|
|
| ITEM 7. |
|
MANAGEMENT’S DISCUSSION AND ANALYSIS OF FINANCIAL CONDITION AND RESULTS OF OPERATIONS |
The following discussion and analysis of our financial condition and results of operations
should be read in conjunction with “Selected Consolidated Financial Data” and our consolidated
financial statements and related notes appearing elsewhere in this Annual Report on 10-K. In
addition to historical information, this discussion and analysis contains forward-looking
statements that involve risks, uncertainties and assumptions. Our actual results may differ
materially from those anticipated in these forward-looking statements as a result of certain
factors. We discuss factors that we believe could cause or contribute to these differences below
and elsewhere in this Annual Report on Form 10-K, including those set forth under “Risk Factors”
and “Special Note Regarding Forward-Looking Statements.”
Introduction
Management’s Discussion and Analysis of Financial Condition and Results of Operations is
provided to help provide an understanding of our financial condition and results of operations.
This item of our Annual Report on Form 10-K is organized as follows:
| |
• |
|
Overview and Key Financial Metrics and Trends. This section provides a general
description of our business, the key financial metrics that we use in assessing our
performance, and anticipated trends that we expect to affect our financial condition and
results of operations. |
| |
• |
|
Consolidated Results of Operations. This section provides an analysis of our results of
operations for the years ended December 31, 2010, 2009 and 2008. |
| |
• |
|
Foreign Exchange Rates. This section provides for impact of foreign exchange rates. |
| |
• |
|
Seasonality. This section discusses the seasonality in the sale of our products and
services. |
| |
• |
|
Acquisitions. This section discusses recent acquisitions and how we account for them. |
| |
• |
|
Liquidity and Capital Resources. This section provides an analysis of our cash flows
for the years ended December 31, 2010, 2009 and 2008, a discussion of our capital
requirements, and the resources available to us to meet those requirements. |
| |
• |
|
Critical Accounting Policies and Estimates. This section discusses accounting policies
that are considered important to our financial condition and results of operations. The
accounting policies require significant judgment or require estimates on our part in
applying them. Our significant accounting policies, including those considered to be
critical accounting policies, are summarized in Note 2 to the consolidated financial
statements. |
| |
• |
|
Contractual Obligations and Commitments & Off-Balance Sheet Arrangements. This section
discusses contractual obligations and commitments and off-balance sheet arrangements
expected to have an impact on our liquidity and cash flow in future periods. |
| |
• |
|
Inflation. This section discusses inflation that could impact our financial condition
and results of operations. |
| |
• |
|
Recent Accounting Pronouncements. This section provides for recent accounting
pronouncements that could impact our financial condition and results of operations. |
Overview
We have pioneered a powerful, user-driven business intelligence solution that enables our
customers to make better and faster business decisions. Our Business Discovery platform, QlikView,
combines enterprise-class analytics and search functionality with the simplicity and ease-of-use
found in office productivity software tools for a broad set of business users. QlikView is powered
by our in-memory associative search technology, which has utilized rapid advances in computing
power to yield significant improvement in flexibility and performance at a lower cost than
traditional business intelligence solutions. We have grown our customer base from over 4,000 active
customers in 2006 to approximately 18,000 active customers as of December 31, 2010 and increased
our revenue at a 50.4% compound annual growth rate during the same period. We added an average of approximately
400 new customers per month during fiscal year 2010. Our solution addresses the needs of a diverse
range of customers from middle market customers to large enterprises such as Autodesk, Campbell
Soup Company, Colonial Life, The Dannon Company, Inc., Heidelberger Druckmaschinen AG, ING, Kraft
foods, Lifetime Brands, Nasdaq OMX, National Health Service (NHS), Qualcomm, Symantec and Volvo Car
UK Limited. We currently have customers in over 100 countries, and approximately 75%, 77%, and 77%
of our revenue for the years ended December 31, 2010, 2009, and 2008, respectively, was derived
internationally.
We have a differentiated business model designed to accelerate the adoption of our product by
reducing the time and cost to purchase and implement our software. Our low risk approach to product
sales, which offers free product downloads to individuals and a 30-day money back guarantee upon
purchase, provides a needed alternative to costly, all-or-nothing, traditional business
intelligence sales models. We initially focus on specific business users or departments within a
prospective customer’s organization and seek to solve a targeted business need. After
demonstrating QlikView’s benefits to initial adopters within an organization, we work to
expand sales of our product to other business units, geographies and use cases with the long-term
goal of broad organizational deployment.
32
We license QlikView under perpetual licenses which include one year of maintenance as part of
the initial purchase price of the product. Our customers can renew, and generally have renewed,
their maintenance agreements for a fee that is based upon a percentage of the initial license fee
paid. For each of the years ended December 31, 2010 and 2009, our total revenue was comprised of
64% license revenue, 26% maintenance revenue, and 10% professional services revenue. For the year
ended December 31, 2008, our total revenue was comprised of 63% license revenue, 25% maintenance
revenue, and 12% professional services revenue. We have a diversified distribution model that
consists of a direct sales force and a partner network of resellers, OEM relationships and systems
integrators which accounted for more than 50% of our total product license and first years’
maintenance billings during the years ended December 31, 2010 and 2009. Additionally, our online
QlikCommunity provides us with a loyal and growing network of users who promote our software,
provide support for other users and contribute valuable insights and feedback for our product
development efforts.
To complement QlikView, we have developed a differentiated business model that has the
following attributes:
| |
• |
|
Broad User Focus — marketing and selling QlikView directly to the business user by
providing an easy-to-use platform that can be used with minimal training |
| |
• |
|
Low Risk Rapid Product Adoption — providing a low risk alternative to costly,
all-or-nothing, enterprise-wide deployment requirements |
| |
• |
|
“Land and Expand” Customer Penetration — initially targeting business users in an
organization to create a loyal user base that promotes broad adoption of our software
platform across an organization |
| |
• |
|
Globally Diversified Distribution Model — employing a multi-pronged international
sales approach that leverages a direct sales force and partner network |
| |
• |
|
Community-Based Marketing and Support — augmenting our development, marketing and
support efforts through our online QlikCommunity. |
In evaluating our operating results we focus on the productivity of our sales force, the
effectiveness of our local and corporate level marketing, our ability to close opportunities
generated by our marketing leads and the competitiveness of our technology. In each of these areas,
we have taken steps designed to improve our operating results, including undertaking additional
sales training for our sales representatives, hiring more experienced regional sales management,
investing further in our corporate website to improve its use as an effective lead generative tool,
developing a partner enablement program to focus on the results of our sales partners around the
world and expanding our research and development staff with a focus on testing and quality
assurance.
From a risk perspective, we have had to deal with the impact of the recessionary global
environment during the past several years, although we anticipate that the negative impact of these
conditions will continue to moderate. We have faced pricing pressure from some of our larger
competitors to which we have attempted to respond by focusing on the value delivered by QlikView in
comparison to more traditional business intelligence products, and we believe that this has helped
to minimize the loss of potential new business from this pressure. Also, the rapid growth in our
business has required the continued hiring of experienced staff across all of our geographic
territories. To aid this effort we have focused on improving our local recruiting initiatives, as
well as developing further internal training programs to prepare executives for greater
responsibilities.
We were founded in Sweden in 1993. From 1993 until 1999, our activities were focused on
software research and development that resulted in QlikView’s core technology, and from 1999 until
2004 we focused on the commercialization of our technology primarily in the Nordic market and
limited regions of Europe. In late 2004, we reincorporated in Delaware and began to broaden our
marketing and sales activities in the U.S. and continued our expansion globally.
In July 2010, we completed our initial public offering (“IPO”) of 12,880,000 shares of common
stock at an offering price of $10.00 per share, resulting in net proceeds to us of approximately
$115.1 million, after deducting underwriting discounts and offering costs. Offering costs of $4.7
million have been recorded as a reduction of the proceeds received in connection with the IPO. In
July 2010, in connection with our IPO, our then outstanding shares of convertible preferred stock
were automatically converted into an aggregate of 46,721,424 shares of common stock, and all
outstanding warrants to purchase convertible preferred stock were converted into warrants to
purchase an aggregate of 474,282 shares of common stock.
33
Key Financial Metrics and Trends
Revenues
Our revenue is comprised of license, maintenance and professional services. We license our
software under perpetual licenses which include one year of maintenance as part of the initial
purchase price of the product. License revenue reflects the revenue recognized from sales of
licenses to new customers and additional licenses to existing customers. Historically, the majority
of our license revenues have come from new customers. However, going forward we seek to increase
the contribution from existing customers based upon our “land and expand” sales strategy. Customers
can renew, and generally have renewed, their maintenance agreements for a fee that is based upon a
percentage of the initial license fee paid. Current customers with maintenance agreements are
entitled to receive unspecified upgrades and enhancements when and if they become available. We
have experienced growth in maintenance revenue primarily due to increased license sales and growth
in our customer base and high retention of those customers. In each of the years ended December 31,
2010 and 2009, our annual maintenance renewal rates exceeded 85%. Professional services revenue is
comprised of training, installation and other consulting revenues. Given the ease of implementation
of our product and our relationship with our partners, professional services revenue for the years
ended December 31, 2010, 2009 and 2008 was 10%, 10%, and 12%, respectively, of total revenues. We
do not expect that proportion to change significantly during the near term. Prior to 2009, we
generated the majority of sales through our direct sales channel rather than through our partner
network. However, the contribution from our partner network continues to grow, and we anticipate
that over time revenues from partners will continue to be more than 50% of total revenues. Given the size of
the U.S. market and our current limited penetration there, we expect that the U.S. will represent
our largest growth opportunity during the near term and will likely be an important contributor to
future revenue growth. Due to the global diversity of our customer base, our results are impacted
by movements in the currencies of the major territories in which we operate. The primary currencies
impacting results are the U.S. dollar (our functional currency), the Swedish kronor, the euro, and
the British pound. Inflation and changing prices had no material effect on our sales, revenue or
operating income from continuing operations during the years ended December 31, 2010, 2009, and
2008.
Cost of Revenue
Cost of revenue primarily consists of personnel costs, fees paid to subcontractors providing
technical support services, referral fees paid to third parties in connection with software license
sales and other discrete professional services. Personnel costs include salaries, employee benefit
and social costs, bonuses, stock-based compensation and direct overhead.
Operating Expenses
We classify our operating expenses into three categories: sales and marketing, research and
development, and general and administrative. Our operating expenses primarily consist of personnel
costs, sales commissions, marketing program costs, facilities, legal, accounting, consulting and
other professional services costs, and depreciation and amortization. Personnel costs include
salaries, employee benefit and social costs, bonuses, stock-based compensation, and direct
overhead. Historically, we have focused on the continued growth of our license revenues, and as a
result, sales and marketing has represented the largest amount of total expenses both in absolute
dollar terms and as a percentage of total revenues. Going forward, we expect to drive greater
efficiencies from this cost base and consequently expect that sales and marketing as a percentage
of revenues will decline in the long term. Conversely, we project that research and development
expenses will remain constant or grow as a percentage of total revenues as we continue to invest in
future product enhancements and new products.
Sales and Marketing. Sales and marketing expenses primarily consist of personnel costs for
our sales, marketing and business development employees and executives; commissions earned by our
sales personnel; facilities costs attributable to our sales and marketing personnel; the cost of
marketing programs; and the cost of business development programs. We expect to continue to hire
additional sales personnel in the U.S. and in our international locations in 2011.
Research and Development. Research and development expenses primarily consist of personnel
and facility costs for our research and development and product marketing employees. We have
devoted our development efforts primarily to enhancing the functionality and expanding the
capabilities of our software platform, including, for example, the development of our QlikView
mobile client (released in 2009). We expect that our research and development expenses will
continue to increase in absolute dollars and as a percentage of revenue in the long term as we
increase our research and development and product marketing headcount to further strengthen and
enhance our software platform. The vast majority of our research and development staff is based in
Lund, Sweden.
General and Administrative. General and administrative expenses primarily consist of
personnel costs for our executive, finance, legal, human resources, and administrative personnel,
as well as the cost of facilities attributable to general and administrative operations,
depreciation and amortization, legal, accounting, and other professional services fees and other
corporate expenses. We incurred additional costs in 2010 and 2009 and expect to continue to incur
higher costs, associated with being a public company, including higher legal, corporate insurance
and accounting expenses and the additional costs of achieving and then maintaining compliance with
Section 404 of the Sarbanes-Oxley Act and related regulations. We also expect that general and
administrative expenses will continue to increase in absolute dollars because of our efforts to
expand our international operations, but we believe over time general and administrative costs will
decline as a percentage of revenues as we expect to derive greater efficiencies from our corporate
infrastructure.
34
Stock-Based Compensation. Stock-based compensation expense is based on the fair value of
those awards at the date of grant. We use the Black-Scholes-Merton (“Black-Scholes”) option pricing
model to determine the fair value of stock-based compensation awards. The estimated fair value of
stock-based compensation awards on the date of grant is amortized on a straight-line basis over the
requisite service period. Stock-based compensation expense is recorded within cost of revenue,
sales and marketing, research and development and general and administrative expenses.
Other Income (Expense), net
Other income (expense), net primarily consists of net interest, change in the fair value of
warrants, foreign exchange gains (losses) and other income or expense. Net interest represents
interest income received on our cash and cash equivalents and interest expense associated with
previously outstanding debt. We expect interest income to increase in periods subsequent to the
quarter ended June 30, 2010, due to the proceeds from our IPO which was completed in July 2010. We
expect interest expense to decrease in periods subsequent to the quarter ended June 30, 2010, due
to the repayment of our outstanding long-term debt in July 2010. Change in the fair value of
warrants consists of charges recorded to mark our company’s outstanding preferred and common stock
warrants to fair value at each reporting date. In connection with our IPO, our preferred stock
warrants were reclassified to additional paid-in capital, and they are no longer required to be
classified as a liability and adjusted to their fair market value each period. Foreign exchange
gains (losses) relate to the re-measurement of certain transactions, primarily our outstanding note
payable with one of our stockholders, which was paid in full in July 2010, and intercompany
transactions denominated in currencies other than our functional reporting currency, the U.S.
dollar. As a result of our business activities in foreign countries, we expect that foreign
exchange gains (losses) will continue to occur due to fluctuations in exchange rates in the
countries where we do business.
Provision for Income Taxes
Provision for income taxes primarily consists of corporate income taxes related to profits
resulting from the sale of our software platform by our U.S. and international subsidiaries.
Impact of Foreign Currency Translation
Approximately 69%, 73%, and 72% of our operating revenues for the years ended December 31,
2010, 2009, and 2008 were earned in foreign denominated currencies, including the Swedish kronor,
euro and British pound. We expect that our exposure to foreign currency exchange risk will increase
to the extent we are able to continue to expand our business internationally. For purposes of our
consolidated financial statements, local currency assets and liabilities are translated at the rate
of exchange to the U.S. dollar on the balance sheet date and local currency revenues and expenses
are translated at average rates of exchange to the U.S. dollar during the reporting period. Foreign
currency transaction gains (losses) have been reflected as a component of our results from
operations and foreign currency translation gains (losses) have been included as a component of
accumulated other comprehensive income (loss).
Our operating results for the year ended December 31, 2010 were negatively impacted by the
general strengthening of the U.S. dollar relative to the Euro and the British pound offset by
weakening of the U.S. dollar relative to the Swedish kronor.
35
Consolidated Results of Operations
The following table sets forth a summary of our audited consolidated statement of operations for
the periods indicated as a percentage of total revenue:
| |
|
|
|
|
|
|
|
|
|
|
|
|
| |
|
Year Ended December 31, |
|
| |
|
2010 |
|
|
2009 |
|
|
2008 |
|
|
|
|
|
|
|
|
|
|
|
|
|
|
Revenue: |
|
|
|
|
|
|
|
|
|
|
|
|
License revenue |
|
|
64.1 |
% |
|
|
63.5 |
% |
|
|
62.9 |
% |
Maintenance revenue |
|
|
26.4 |
|
|
|
26.3 |
|
|
|
24.9 |
|
Professional services revenue |
|
|
9.5 |
|
|
|
10.2 |
|
|
|
12.2 |
|
|
|
|
|
|
|
|
|
|
|
Total revenues |
|
|
100.0 |
|
|
|
100.0 |
|
|
|
100.0 |
|
|
|
|
|
|
|
|
|
|
|
|
|
|
Cost of revenue: |
|
|
|
|
|
|
|
|
|
|
|
|
License revenue |
|
|
1.6 |
|
|
|
2.3 |
|
|
|
2.6 |
|
Maintenance revenue |
|
|
1.8 |
|
|
|
1.0 |
|
|
|
1.2 |
|
Professional services revenue |
|
|
7.1 |
|
|
|
7.5 |
|
|
|
8.0 |
|
|
|
|
|
|
|
|
|
|
|
Total cost of revenue |
|
|
10.5 |
|
|
|
10.8 |
|
|
|
11.8 |
|
|
|
|
|
|
|
|
|
|
|
|
|
|
|
|
|
|
|
|
|
|
|
|
Gross profit |
|
|
89.5 |
|
|
|
89.2 |
|
|
|
88.2 |
|
|
|
|
|
|
|
|
|
|
|
|
|
|
Operating expenses: |
|
|
|
|
|
|
|
|
|
|
|
|
Sales and marketing |
|
|
54.0 |
|
|
|
59.3 |
|
|
|
62.8 |
|
Research and development |
|
|
6.0 |
|
|
|
5.6 |
|
|
|
7.0 |
|
General and administrative |
|
|
17.3 |
|
|
|
15.9 |
|
|
|
17.1 |
|
|
|
|
|
|
|
|
|
|
|
Total operating expenses |
|
|
77.3 |
|
|
|
80.8 |
|
|
|
86.9 |
|
|
|
|
|
|
|
|
|
|
|
|
|
|
|
|
|
|
|
|
|
|
|
|
Income from operations |
|
|
12.2 |
|
|
|
8.4 |
|
|
|
1.3 |
|
Other income (expense), net |
|
|
(3.0 |
) |
|
|
(2.9 |
) |
|
|
2.8 |
|
|
|
|
|
|
|
|
|
|
|
|
|
|
|
|
|
|
|
|
|
|
|
|
Income before provision for income taxes |
|
|
9.2 |
|
|
|
5.5 |
|
|
|
4.1 |
|
Provision for income taxes |
|
|
(3.2 |
) |
|
|
(1.1 |
) |
|
|
(1.6 |
) |
|
|
|
|
|
|
|
|
|
|
|
|
|
|
|
|
|
|
|
|
|
|
|
Net income |
|
|
6.0 |
% |
|
|
4.4 |
% |
|
|
2.5 |
% |
|
|
|
|
|
|
|
|
|
|
Comparison of the Years Ended December 31, 2010 and 2009
Revenue
The following table sets forth revenue by source:
| |
|
|
|
|
|
|
|
|
|
|
|
|
|
|
|
|
|
|
|
|
|
|
|
|
| |
|
Year Ended December 31, |
|
|
|
|
| |
|
2010 |
|
|
2009 |
|
|
|
|
| |
|
|
|
|
|
Percentage of |
|
|
|
|
|
|
Percentage of |
|
|
|
|
| |
|
Amount |
|
|
Revenue |
|
|
Amount |
|
|
Revenue |
|
|
Period to Period Change |
|
| |
|
(dollars in thousands) |
|
|
|
|
|
|
|
|
|
|
|
|
|
|
|
|
|
|
|
|
|
|
|
|
|
|
|
|
|
|
|
|
|
|
Revenue |
|
|
|
|
|
|
|
|
|
|
|
|
|
|
|
|
|
|
|
|
|
|
|
|
License revenue |
|
$ |
145,225 |
|
|
|
64.1 |
% |
|
$ |
99,864 |
|
|
|
63.5 |
% |
|
$ |
45,361 |
|
|
|
45.4 |
% |
Maintenance revenue |
|
|
59,846 |
|
|
|
26.4 |
% |
|
|
41,390 |
|
|
|
26.3 |
% |
|
|
18,456 |
|
|
|
44.6 |
% |
Professional services revenue |
|
|
21,450 |
|
|
|
9.5 |
% |
|
|
16,105 |
|
|
|
10.2 |
% |
|
|
5,345 |
|
|
|
33.2 |
% |
|
|
|
|
|
|
|
|
|
|
|
|
|
|
|
|
|
|
|
Total revenue |
|
$ |
226,521 |
|
|
|
100.0 |
% |
|
$ |
157,359 |
|
|
|
100.0 |
% |
|
$ |
69,162 |
|
|
|
44.0 |
% |
|
|
|
|
|
|
|
|
|
|
|
|
|
|
|
|
|
|
|
36
Revenue was $226.5 million for the year ended December 31, 2010 compared to $157.4 million for
the year ended December 31, 2009, an increase of $69.1 million, or 44.0%. License revenue grew by
approximately $45.4 million, or 45.4%. All territories reported strong revenue growth, particularly
the Americas (includes North America and South America), the United Kingdom and German region
(includes Germany, Austria and Switzerland), which grew by 66%, 52% and 29% and contributed an
incremental $41.2 million in total revenue. In addition, revenue increased due to our acquisition
in January 2010 of a reseller in Japan which provided $2.7 million in incremental revenue during
the year ended December 31, 2010. There was no material change in the pricing for our product
during the year. Revenue growth was achieved primarily due to volume growth as more customers
acquired our product for the first time, along with additional license purchases by our existing
customers. Amounts invoiced to existing customers represented a larger share of total billings,
approximately 67%, resulting from our “land and expand” sales strategy. Billings from our indirect
partner channel for license and first year maintenance increased from 51% during the year ended
December 31, 2009 to 55% for the year ended December 31, 2010. We believe that an improving global
economic outlook during the year ended December 31, 2010 also contributed to higher revenues as
customer demand and their willingness to invest in information technology continued to grow
compared to the same period last year. Maintenance revenues grew by approximately 44.6% driven by
annual maintenance renewal rates of greater than 85%. Professional services revenue grew by 33.2%
in the year ended December 31, 2010 compared to the year ended December 31, 2009 due to growth in
consulting and training revenue, resulting from an increase in our customer base. The revenue
growth in the year ended December 31, 2010 as compared to the year ended December 31, 2009 may not
be indicative of our future revenue growth, if any.
Cost of Revenue and Gross Profit
The following table sets forth cost of revenue for each revenue source:
| |
|
|
|
|
|
|
|
|
|
|
|
|
|
|
|
|
|
|
|
|
|
|
|
|
| |
|
Year Ended December 31, |
|
|
|
|
| |
|
2010 |
|
|
2009 |
|
|
|
|
| |
|
|
|
|
|
Percentage of |
|
|
|
|
|
|
Percentage of |
|
|
|
|
| |
|
Amount |
|
|
Revenue |
|
|
Amount |
|
|
Revenue |
|
|
Period to Period Change |
|
| |
|
(dollars in thousands) |
|
|
|
|
|
|
|
|
|
|
|
|
|
|
|
|
|
|
|
|
|
|
|
|
|
|
|
|
|
|
|
|
|
|
Cost of Revenue: |
|
|
|
|
|
|
|
|
|
|
|
|
|
|
|
|
|
|
|
|
|
|
|
|
Cost of license revenue |
|
$ |
3,670 |
|
|
|
2.5 |
% |
|
$ |
3,663 |
|
|
|
3.7 |
% |
|
$ |
7 |
|
|
|
0.2 |
% |
Cost of maintenance revenue |
|
|
3,998 |
|
|
|
6.7 |
% |
|
|
1,635 |
|
|
|
4.0 |
% |
|
|
2,363 |
|
|
|
144.5 |
% |
Cost of professional services revenue |
|
|
16,054 |
|
|
|
74.8 |
% |
|
|
11,802 |
|
|
|
73.3 |
% |
|
|
4,252 |
|
|
|
36.0 |
% |
|
|
|
|
|
|
|
|
|
|
|
|
|
|
|
|
|
|
|
Total cost of revenue |
|
$ |
23,722 |
|
|
|
10.5 |
% |
|
$ |
17,100 |
|
|
|
10.9 |
% |
|
$ |
6,622 |
|
|
|
38.7 |
% |
|
|
|
|
|
|
|
|
|
|
|
|
|
|
|
|
|
|
|
|
|
|
|
|
|
|
|
|
|
|
|
|
|
|
|
|
|
|
|
|
|
|
|
|
Gross Profit: |
|
|
|
|
|
|
|
|
|
|
|
|
|
|
|
|
|
|
|
|
|
|
|
|
License revenue |
|
$ |
141,555 |
|
|
|
97.5 |
% |
|
$ |
96,201 |
|
|
|
96.3 |
% |
|
$ |
45,354 |
|
|
|
47.1 |
% |
Maintenance revenue |
|
|
55,848 |
|
|
|
93.3 |
% |
|
|
39,755 |
|
|
|
96.0 |
% |
|
|
16,093 |
|
|
|
40.5 |
% |
Professional services revenue |
|
|
5,396 |
|
|
|
25.2 |
% |
|
|
4,303 |
|
|
|
26.7 |
% |
|
|
1,093 |
|
|
|
25.4 |
% |
|
|
|
|
|
|
|
|
|
|
|
|
|
|
|
|
|
|
|
Total gross profit |
|
$ |
202,799 |
|
|
|
89.5 |
% |
|
$ |
140,259 |
|
|
|
89.1 |
% |
|
$ |
62,540 |
|
|
|
44.6 |
% |
|
|
|
|
|
|
|
|
|
|
|
|
|
|
|
|
|
|
|
Cost of revenue was $23.7 million for the year ended December 31, 2010 compared to $17.1
million for the year ended December 31, 2009, an increase of $6.6 million, or 38.7%. Overall cost
of revenue declined as a percentage of revenue from 10.9% for the year ended December 31, 2009 to
10.5% for the year ended December 31, 2010. Cost of license revenue largely consists of referral
fees paid to third parties in connection with software license sales. Referral fees were flat year
over year due to less referral fees paid for software license sales in 2010. In anticipation of
continued growth in our current customer base, we increased headcount in our support organization
which increased personnel costs by $1.6 million for the year ended December 31, 2010 as compared to
the same period in 2009. Fees paid to referral partners for license revenues remained flat for the
year ended December 31, 2010 compared to the year ended December 31, 2009. Cost of professional
services revenue increased by $4.2 million largely due to increased personnel costs of $4.6
million. These increases were offset by a decrease in other costs of professional services of $0.4
million. The growth in our gross profit in the year ended December 31, 2010 as compared to the year
ended December 31, 2009 may not be indicative of our future gross profit growth, if any.
Operating Expenses
The following table sets forth operating expenses as a percentage of revenue:
| |
|
|
|
|
|
|
|
|
|
|
|
|
|
|
|
|
|
|
|
|
|
|
|
|
| |
|
Year Ended December 31, |
|
|
|
|
| |
|
2010 |
|
|
2009 |
|
|
|
|
| |
|
|
|
|
|
Percentage of |
|
|
|
|
|
|
Percentage of |
|
|
|
|
| |
|
Amount |
|
|
Revenue |
|
|
Amount |
|
|
Revenue |
|
|
Period to Period Change |
|
| |
|
(dollars in thousands) |
|
|
|
|
|
|
|
|
|
|
|
|
|
|
|
|
|
|
|
|
|
|
|
|
|
|
|
|
|
|
|
|
|
|
Operating expenes: |
|
|
|
|
|
|
|
|
|
|
|
|
|
|
|
|
|
|
|
|
|
|
|
|
Sales and marketing |
|
$ |
122,394 |
|
|
|
54.0 |
% |
|
$ |
93,349 |
|
|
|
59.3 |
% |
|
$ |
29,045 |
|
|
|
31.1 |
% |
Research and development |
|
|
13,537 |
|
|
|
6.0 |
% |
|
|
8,735 |
|
|
|
5.6 |
% |
|
|
4,802 |
|
|
|
55.0 |
% |
General and adminstrative |
|
|
39,300 |
|
|
|
17.3 |
% |
|
|
25,009 |
|
|
|
15.9 |
% |
|
|
14,291 |
|
|
|
57.1 |
% |
|
|
|
|
|
|
|
|
|
|
|
|
|
|
|
|
|
|
|
Total operating expenses |
|
$ |
175,231 |
|
|
|
77.3 |
% |
|
$ |
127,093 |
|
|
|
80.8 |
% |
|
$ |
48,138 |
|
|
|
37.9 |
% |
|
|
|
|
|
|
|
|
|
|
|
|
|
|
|
|
|
|
|
37
Sales and Marketing. Sales and marketing expenses increased $29.0 million, or 31.1%, but
declined as a percentage of revenues, reflecting an increase in revenue achieved per sales
representative, an increased percentage of sales from existing customers, and an increased
percentage of sales from partners. The increase in sales and marketing expenses was primarily
attributable to an increase in personnel and commission costs of $22.7 million (including a $0.8
million increase in stock-based compensation), an increase in travel expenses of $2.8 million, $0.5
million of severance costs, $0.2 million of marketing costs, and $2.8 million of consulting and
other sales and marketing costs.
Research and Development. Research and development expenses grew by approximately $4.8
million or 55.0% during the year ended December 31, 2010 as compared to the year ended December 31,
2009. The increase was attributable to higher personnel costs of $3.1 million
as a result of the increase in our headcount in research and development and an increase in
other expenses such as facilities and travel related to a larger research and development function
of $1.3 million. The remaining increase of $0.4 million was due to changes in the value of the
Swedish kronor as the vast majority of our research and development staff is based in Lund, Sweden.
General and Administrative. General and administrative expenses were $39.3 million for the
year ended December 31, 2010 compared to $25.0 million for the year ended December 31, 2009, an
increase of $14.3 million, or 57.1%. This increase was due primarily to a $4.9 million increase in
personnel costs (including $0.6 million increase in stock-based compensation) to build out our
corporate level functions to support anticipated global growth and meet the demands and compliance
responsibilities of a U.S. public company. We began incurring additional public company costs, such
as accounting and legal fees and directors and officers insurance, totaling $2.8 million during the
year ended December 31, 2010, including $0.6 million of secondary offering costs. This increase was
also due to a $1.6 million increase in travel expenses primarily related to our annual employee
summit and increase in headcount, a $0.1 million increase in facility and infrastructure costs to
support international expansion and an increase in professional fees, such as legal and consulting,
and other general and administrative costs of $4.9 million related in part due to our increased
headcount.
Other Income (Expense), net. Other expense was $6.9 million for the year ended December 31,
2010 compared to expense of $4.5 million for the year ended December 31, 2009. We had a $4.4
million foreign exchange loss and other expense for the year ended December 31, 2010 compared to a
loss of $1.6 million for the year ended December 31, 2009. The increase is largely due to the
foreign currency impact of the U.S. dollar generally weakening relative to the Swedish kronor
during the year ended December 31, 2010. This increase was offset by a decrease in net interest
expense of $0.4 million primarily due to the prepayment of our outstanding note payable balance in
July 2010.
Provision for Income Taxes. Our annual effective tax rate for the year ended December 31, 2010
was 34.8%, which results in a provision for income taxes of approximately $7.2 million. The
effective tax rate increased from the 2009 annual effective tax rate of 20.6% due primarily to a
change in the amount of income earned in the various locations where we operate from one year to
the next, a change in the valuation allowance for deferred tax assets, charges recorded for the change in value of our preferred stock warrants and stock-based
compensation expense incurred by our U.S. holding company. We operate in an international
environment with significant operations in various locations outside of the U.S. Accordingly, the
consolidated income tax rate is a composite rate reflecting our earnings (losses) and the
applicable tax rates in the various locations where we operate.
Comparison of the Years Ended December 31, 2009 and 2008
Revenue
| |
|
|
|
|
|
|
|
|
|
|
|
|
|
|
|
|
|
|
|
|
|
|
|
|
| |
|
Year Ended December 31, |
|
|
|
|
| |
|
2009 |
|
|
2008 |
|
|
|
|
| |
|
|
|
|
|
Percentage of |
|
|
|
|
|
|
Percentage of |
|
|
|
|
| |
|
Amount |
|
|
Revenue |
|
|
Amount |
|
|
Revenue |
|
|
Period to Period Change |
|
| |
|
(dollars in thousands) |
|
|
|
|
|
|
|
|
|
|
|
|
|
|
|
|
|
|
|
|
|
|
|
|
|
|
|
|
|
|
|
|
|
|
Revenue: |
|
|
|
|
|
|
|
|
|
|
|
|
|
|
|
|
|
|
|
|
|
|
|
|
License revenue |
|
$ |
99,864 |
|
|
|
63.5 |
% |
|
$ |
74,446 |
|
|
|
62.9 |
% |
|
$ |
25,418 |
|
|
|
34.1 |
% |
Maintenance revenue |
|
|
41,390 |
|
|
|
26.3 |
% |
|
|
29,401 |
|
|
|
24.9 |
% |
|
|
11,989 |
|
|
|
40.8 |
% |
Professional services revenue |
|
|
16,105 |
|
|
|
10.2 |
% |
|
|
14,417 |
|
|
|
12.2 |
% |
|
|
1,688 |
|
|
|
11.7 |
% |
|
|
|
|
|
|
|
|
|
|
|
|
|
|
|
|
|
|
|
Total revenue |
|
$ |
157,359 |
|
|
|
100.0 |
% |
|
$ |
118,264 |
|
|
|
100.0 |
% |
|
$ |
39,095 |
|
|
|
33.1 |
% |
|
|
|
|
|
|
|
|
|
|
|
|
|
|
|
|
|
|
|
Revenue was $157.4 million in 2009 compared to $118.3 million in 2008, an increase of $39.1
million, or 33.1%. License revenue grew by approximately $25.4 million, or 34%. All territories
showed strong revenue growth, particularly Spain and France, which in their second full year of
operations as a direct sales office grew 72% and 96%, contributing an incremental $7.3 million in
total revenue. We also grew revenue by $9.0 million, or 27%, in our largest market, North America,
and saw growing contributions from relatively new markets in Eastern Europe and a brand new market,
Japan, which provided $1.7 million in incremental license revenue. Although we introduced a new
version of QlikView in 2009, there was no material increase in the pricing for our product. Revenue
growth was achieved primarily due to volume growth as more customers acquired our product for the
first time, along with additional license purchases by our existing customers. From a performance
perspective, we experienced an increasing contribution from existing customers, approximately 58%
of license revenues, which resulted from our “land and expand” sales strategy and greater
productivity from our sales representatives with revenue per representative growing 38%. We believe
that a better global economic outlook also contributed to higher revenues as customer demand and
their willingness to invest in information technology grew over the course of the year, with the
majority of our growth for 2009 coming in the third and fourth quarters of the fiscal year.
Maintenance revenues grew by approximately 41% driven by annual maintenance renewal rates of
greater than 85%. As a percentage of total revenues, maintenance grew to 26% in 2009 from 25% in
2008, reflecting the impact of the growing installed customer base and renewal rates. Professional
services revenue grew by 12% and was approximately 10% of our total revenues.
38
Cost of Revenue and Gross Profit
| |
|
|
|
|
|
|
|
|
|
|
|
|
|
|
|
|
|
|
|
|
|
|
|
|
| |
|
Year Ended December 31, |
|
|
|
|
| |
|
2009 |
|
|
2008 |
|
|
|
|
| |
|
|
|
|
|
Percentage of |
|
|
|
|
|
|
Percentage of |
|
|
|
|
| |
|
Amount |
|
|
Revenue |
|
|
Amount |
|
|
Revenue |
|
|
Period to Period Change |
|
| |
|
(dollars in thousands) |
|
|
|
|
|
|
|
|
|
|
|
|
|
|
|
|
|
|
|
|
|
|
|
|
|
|
|
|
|
|
|
|
|
|
Cost of Revenue: |
|
|
|
|
|
|
|
|
|
|
|
|
|
|
|
|
|
|
|
|
|
|
|
|
Cost of license revenue |
|
$ |
3,663 |
|
|
|
3.7 |
% |
|
$ |
3,071 |
|
|
|
4.1 |
% |
|
$ |
592 |
|
|
|
19.3 |
% |
Cost of maintenance revenue |
|
|
1,635 |
|
|
|
4.0 |
% |
|
|
1,365 |
|
|
|
4.6 |
% |
|
|
270 |
|
|
|
19.8 |
% |
Cost of professional services revenue |
|
|
11,802 |
|
|
|
73.3 |
% |
|
|
9,562 |
|
|
|
66.3 |
% |
|
|
2,240 |
|
|
|
23.4 |
% |
|
|
|
|
|
|
|
|
|
|
|
|
|
|
|
|
|
|
|
Total cost of revenue |
|
$ |
17,100 |
|
|
|
10.9 |
% |
|
$ |
13,998 |
|
|
|
11.8 |
% |
|
$ |
3,102 |
|
|
|
22.2 |
% |
|
|
|
|
|
|
|
|
|
|
|
|
|
|
|
|
|
|
|
|
|
|
|
|
|
|
|
|
|
|
|
|
|
|
|
|
|
|
|
|
|
|
|
|
Gross Profit: |
|
|
|
|
|
|
|
|
|
|
|
|
|
|
|
|
|
|
|
|
|
|
|
|
License revenue |
|
$ |
96,201 |
|
|
|
96.3 |
% |
|
$ |
71,375 |
|
|
|
95.9 |
% |
|
$ |
24,826 |
|
|
|
34.8 |
% |
Maintenance revenue |
|
|
39,755 |
|
|
|
96.0 |
% |
|
|
28,036 |
|
|
|
95.4 |
% |
|
|
11,719 |
|
|
|
41.8 |
% |
Professional services revenue |
|
|
4,303 |
|
|
|
26.7 |
% |
|
|
4,855 |
|
|
|
33.7 |
% |
|
|
(552 |
) |
|
|
-11.4 |
% |
|
|
|
|
|
|
|
|
|
|
|
|
|
|
|
|
|
|
|
Total gross profit |
|
$ |
140,259 |
|
|
|
89.1 |
% |
|
$ |
104,266 |
|
|
|
88.2 |
% |
|
$ |
35,993 |
|
|
|
34.5 |
% |
|
|
|
|
|
|
|
|
|
|
|
|
|
|
|
|
|
|
|
Cost of revenue was $17.1 million in 2009 compared to $14.0 million in 2008, an increase of
$3.1 million, or 22.2%. Overall cost of revenue declined as a percent of revenue from 11.8% in 2008
to 10.9% in 2009, despite a decrease in our margin related to professional services. In
anticipation of continued growth in our installed customer base, we increased headcount in our
professional services organization which increased costs by $1.5 million in 2009, but we did not
achieve a corresponding increase in related revenues, reducing our gross margin in the category to
26.7% from 33.7%. In addition, fees paid to subcontractors increased by $0.9 million. Fees paid to
referral partners for license revenues increased by $0.6 million in 2009 due to a significant
transaction.
Operating Expenses
| |
|
|
|
|
|
|
|
|
|
|
|
|
|
|
|
|
|
|
|
|
|
|
|
|
| |
|
Year Ended December 31, |
|
|
|
|
| |
|
2009 |
|
|
2008 |
|
|
|
|
| |
|
|
|
|
|
Percentage of |
|
|
|
|
|
|
Percentage of |
|
|
|
|
| |
|
Amount |
|
|
Revenue |
|
|
Amount |
|
|
Revenue |
|
|
Period to Period Change |
|
| |
|
(dollars in thousands) |
|
|
|
|
|
|
|
|
|
|
|
|
|
|
|
|
|
|
|
|
|
|
|
|
|
|
|
|
|
|
|
|
|
|
Operating expenes: |
|
|
|
|
|
|
|
|
|
|
|
|
|
|
|
|
|
|
|
|
|
|
|
|
Sales and marketing |
|
$ |
93,349 |
|
|
|
59.3 |
% |
|
$ |
74,267 |
|
|
|
62.8 |
% |
|
$ |
19,082 |
|
|
|
25.7 |
% |
Research and development |
|
|
8,735 |
|
|
|
5.6 |
% |
|
|
8,258 |
|
|
|
7.0 |
% |
|
|
477 |
|
|
|
5.8 |
% |
General and adminstrative |
|
|
25,009 |
|
|
|
15.9 |
% |
|
|
20,190 |
|
|
|
17.1 |
% |
|
|
4,819 |
|
|
|
23.9 |
% |
|
|
|
|
|
|
|
|
|
|
|
|
|
|
|
|
|
|
|
Total operating expenses |
|
$ |
127,093 |
|
|
|
80.8 |
% |
|
$ |
102,715 |
|
|
|
86.9 |
% |
|
$ |
24,378 |
|
|
|
23.7 |
% |
|
|
|
|
|
|
|
|
|
|
|
|
|
|
|
|
|
|
|
Sales and Marketing. Sales and marketing expenses increased $19.1 million, or 25.7%, but
declined as a percentage of revenues, reflecting an increase in revenue achieved per sales
representative and an increased percentage of sales from existing customers and through partners.
The increase was primarily attributable to an increase in personnel and commission costs of $12.9
million (including a $0.5 million increase in stock-based compensation), an increase in costs
related to marketing programs of $2.4 million, an increase in facility and other infrastructure
costs of $2.6 million and an increase in travel expenses of $0.9 million. Also in 2009, we
implemented an online customer relationship management tool to facilitate sales force growth. We
expect sales and marketing expenses to continue to increase in absolute dollars but to decrease as
a percentage of revenues over time as we continue to expand our sales force and marketing
activities.
Research and Development. Although total research and development headcount increased during
this period, total research and development expenses grew by only $0.5 million or 5.8%. With the
vast majority of our related staff based in Lund, Sweden, changes in the value of the Swedish
kronor reduced the impact of the staff increase by approximately $0.8 million. To accommodate the
increase in our research and development staff, we made further investment in our facility in
Sweden of approximately $0.2 million. We expect our research and development expenses will continue
to increase in absolute dollars and as a percentage of revenue in the long term as we increase our
research and development headcount to further strengthen and enhance our software platform.
39
General and Administrative. General and administrative expenses were $25.0 million in 2009
compared to $20.2 million in 2008, an increase of $4.8 million, or 23.9%. This increase was due
primarily to a $2.3 million increase in personnel costs to build out our corporate level functions
to support anticipated global growth and prepare for being a publicly traded company. This increase
was also due to a $1.2 million increase in travel expenses, a $0.2 million increase in stock-based
compensation expense, a $0.5 million increase in facility and infrastructure
costs to support international expansion, and an increase in depreciation and amortization of
$0.3 million related in part to additional investment in property and equipment due to our
increased headcount. We expect that general and administrative expenses will continue to increase
in absolute dollars because of our efforts to expand our international operations and due to costs
to be incurred in connection with our initial public offering, this offering and ongoing public
company related costs. However, we believe over time general and administrative costs will decline
as a percentage of revenues as we will derive greater efficiencies from our corporate
infrastructure.
Other Income (Expense), net
Other income (expense), net was an expense of $4.5 million in 2009 compared to income of $3.3
million in 2008. The change consisted of increased interest expense, charges for our common and
preferred stock warrants and foreign exchange. Interest expense increased due to a full year of
interest expense on our term loan. During the year ended December 31, 2009, the change in the fair
value of the stock warrants increased by $1.5 million in a manner consistent with the increased
value in our common stock. We had a $1.6 million foreign exchange loss in 2009 compared to a gain
of $4.2 million in 2008. The change is principally due to the foreign currency impact of our
outstanding debt as a result of the U.S. dollar generally weakening relative to the Swedish kronor
in 2009 compared to generally strengthening in 2008.
Provision for Income Taxes
Our provision for income taxes in 2009 was consistent with the provision for income taxes in
2008. The increase in our income before income taxes of $3.8 million from 2008 to 2009 was offset
by a decrease in our effective tax rate from 38% in 2008 to 21% in 2009 as a result of current year
reversal of valuation allowance in certain jurisdictions and a more significant impact of earnings
from foreign operations.
Foreign Exchange Rates
We conduct business in our foreign operations in local currencies. Accordingly, our revenue
and operating expense results presented above are affected by changes in foreign exchange rates.
Income and expense accounts are translated at the average monthly exchange rates during the period.
As a result, a decline in the value of the U.S. dollar relative to the local currencies of our
foreign subsidiaries can have a favorable effect on our profitability, and an increase in the value
of the U.S. dollar relative to the local currencies of foreign subsidiaries can have a negative
effect on our profitability.
Seasonality
Our quarterly results reflect seasonality in the sale of our products and services.
Historically, a pattern of increased license sales in the fourth quarter has positively impacted
sales activity in that period which can make it difficult to achieve sequential revenue growth in
the first quarter. Similarly, our gross margins and operating income have been affected by these
historical trends because the majority of our expenses are relatively fixed in the near-term. The
timing of revenues in relation to our expenses, much of which does not vary directly with revenue,
has an impact on the cost of revenue, sales and marketing expense, research and development
expense, and general and administrative expense as a percentage of revenue in each calendar quarter
during the year. The majority of our expenses are personnel-related and include salaries,
stock-based compensation, benefits, and incentive-based compensation plan expenses. As a result, we
have not experienced significant seasonal fluctuations in the timing of expenses from period to
period, other than an increase in general and administrative expenses during the first quarter of
each year as a result of our annual employee summit and an increase in sales and marketing expenses
in the second quarter of each year due to our annual partner event. On a quarterly basis, we have
usually generated the majority of our revenues in the final month of each quarter and a significant
amount in the last two weeks of a quarter. We believe this is due to customer buying patterns
typical in this industry. Although these seasonal factors are common in the technology sector,
historical patterns should not be considered a reliable indicator of our future sales activity or
performance.
Acquisitions
In January 2008, in order to achieve a direct sales presence in Spain, we acquired the
operations and tangible assets of P.C. Compatible Business Intelligence, S.L., or PCB, a Spanish
reseller of our product, for $1.9 million, including cash of $0.4 million and a warrant to purchase
an aggregate of 93,981 shares of our common stock at an exercise
price of $1.65 per share. PCB had
the right to exercise such warrant until December 31, 2010 and to require us to purchase the
acquired shares for an aggregate of
€1.8 million (approximately $2.4 million based on an assumed
exchange rate of approximately $1.33 as of December 31, 2010). This right expired on December 31, 2010.
40
In January 2010, in order to achieve a direct sales presence in Japan, we acquired all of the
issued and outstanding shares of Syllogic Corporation, or Syllogic, a Japanese reseller of our
product, for 120,000 shares of our common stock plus contingent cash consideration not to exceed
$0.8 million. The total estimated purchase price of Syllogic was $1.1 million.
We account for acquisitions using the purchase method of accounting. In each case, we
allocated the purchase price to the assets acquired, including intangible assets and liabilities
assumed, based on estimated fair values at the date of the acquisition.
Liquidity and Capital Resources
Since our inception, we have financed our operations through the sale of preferred stock and
common stock, cash flows generated by operations and borrowings under debt instruments. As of
December 31, 2010, we had cash and cash equivalents totaling $158.7 million, net accounts
receivable of $85.4 million, and $149.1 million of working capital.
Our capital expenditures for 2010 were $2.7 million, comprised primarily of additional
leasehold improvements, furniture and fixtures, and computer equipment. We believe that our
existing cash and cash equivalents and our cash flow from operations will be sufficient to fund our
operations and our capital expenditures for at least the next 12 months. Our future capital
requirements will depend on many factors, including our rate of revenue growth, the expansion of
our sales and marketing activities, the timing and extent of spending to support product
development efforts and expansion into new territories, the timing of introductions of new software
products and enhancements to existing software products and the continuing market acceptance of our
software offerings. We may from time to time enter into agreements,
arrangements or letters of intent regarding potential investments in, or acquisitions of, complementary businesses, applications or
technologies, which could require us to seek
additional equity or debt financing. Additional funds may not be available on terms favorable to us
or at all.
We have begun incurring costs as a public company that we had not previously incurred,
including, but not limited to, costs and expenses for directors fees, increased directors and
officers insurance, investor relations fees, expenses for compliance with the Sarbanes-Oxley Act of
2002 and rules implemented by the SEC and Nasdaq, the exchange, on which our common stock is
listed, and various other costs. The Sarbanes-Oxley Act of 2002 requires annual management
assessment of the effectiveness of our internal control over financial reporting.
The following table shows selected balance sheet data as well as our cash flows from operating
activities, investing activities, and financing activities for the stated periods:
| |
|
|
|
|
|
|
|
|
| |
|
December 31, |
|
|
December 31, |
|
| |
|
2010 |
|
|
2009 |
|
| |
|
(dollars in thousands) |
|
|
|
|
|
|
|
|
|
|
Cash and cash equivalents |
|
$ |
158,712 |
|
|
$ |
24,852 |
|
Accounts receivable, net |
|
|
85,364 |
|
|
|
63,729 |
|
| |
|
|
|
|
|
|
|
|
|
|
|
|
| |
|
Year Ended December 31, |
|
| |
|
2010 |
|
|
2009 |
|
|
2008 |
|
| |
|
(dollars in thousands) |
|
Cash flow activities |
|
|
|
|
|
|
|
|
|
|
|
|
Net cash provided by operating activities |
|
$ |
25,859 |
|
|
$ |
13,036 |
|
|
$ |
2,631 |
|
Net cash used in investing activities |
|
|
(2,483 |
) |
|
|
(2,128 |
) |
|
|
(2,158 |
) |
Net cash provided by (used in) financing activities |
|
|
110,621 |
|
|
|
(1,791 |
) |
|
|
6,926 |
|
Cash and Cash Equivalents
Our cash and cash equivalents at December 31, 2010 were held for working capital purposes and
were invested primarily in bank deposits and money market accounts having less than 90 day
maturities. We do not enter into investments for trading or speculative purposes. These balances
could be impacted if the underlying depository institutions or the guarantors fail or could be
subject to adverse conditions in the financial markets. We can provide no assurances that access to
our funds will not be impacted by adverse conditions in the financial markets.
41
Accounts Receivable, net
Our accounts receivable balance fluctuates from period to period which affects our cash flow
from operating activities. The fluctuations vary depending on the timing of our service delivery
and billing activity, cash collections and changes to our allowance for doubtful accounts. Our
allowance for doubtful accounts represents our best estimate of the amount of probable credit
losses. To date, we have not incurred any significant write-offs of accounts receivable.
Cash Flows
Cash Provided by Operating Activities
Net cash provided by operating activities was $25.9 million for the year ended December 31,
2010, which includes net income of $13.5 million. The reasons for the increase in net cash provided
by operating activities for the year ended December 31, 2010 include the increase in net income and
the change in our deferred revenue and accrued expense and other liabilities balance. We incurred
non-cash expenses totaling $10.3 million for the year ended December 31, 2010. Non-cash expenses
primarily consisted of stock-based compensation expense, provisions for bad debt, change in the
fair value of warrants, unrealized foreign currency gains and losses, and depreciation and
amortization expense. We incurred an excess tax benefit from stock-based compensation of $0.7
million for the year ended December 31, 2010.
The change in certain assets and liabilities resulted in a net source of cash of $2.8 million
for the year ended December 31, 2010. Cash provided by operating activities is driven by sales of
our products. Collection of accounts receivable from the product sales is a significant component
of our cash flows from operating activities, as is the change in deferred revenue related to these
sales.
Net cash provided by operating activities was $13.0 million for the year ended December 31,
2009, which includes net income of $6.9 million. The primary reason for the increase in net cash
provided by operating activities for the year ended December 31, 2009 relates to the increase in
net income. We incurred non-cash expenses totaling $3.2 million for the year ended December 31,
2009. Non-cash expenses primarily consisted of stock-based compensation expense, provisions for bad
debt, change in the fair value of warrants, unrealized foreign currency gains and losses, and
depreciation and amortization expense.
The change in certain assets and liabilities resulted in a net source of cash of $3.0 million
for the year ended December 31, 2009. Cash provided by operating activities is driven by sales of
our software offerings. Collection of accounts receivable from the sales of our software offerings
is a significant component of our cash flows from operating activities, as is the change in
deferred revenue related to these sales.
Net cash provided by operating activities was $2.6 million for the year ended December 31,
2008, which includes net income of $3.0 million. The primary reason for the increase in net cash
provided by operating activities for the year ended December 31, 2008 relates to the increase in
net income. We incurred non-cash expenses totaling $1.9 million for the year ended December 31,
2008. Non-cash expenses primarily consisted of stock-based compensation expense, provisions for bad
debt, change in the fair value of warrants, unrealized foreign currency gains and losses, and
depreciation and amortization expense.
The change in certain assets and liabilities resulted in a net use of cash of $2.2 million for
the year ended December 31, 2008. Cash provided by operating activities is driven by sales of our
software offerings. Collection of accounts receivable from the sales of our software offerings is a
significant component of our cash flows from operating activities, as is the change in deferred
revenue related to these sales.
Cash Used in Investing Activities
Net cash used in investing activities was $2.5 million for the year ended December 31, 2010.
Cash used in investing activities for the year was primarily for capital expenditures related to
leasehold improvements and computer equipment as we continued to expand our infrastructure and
workforce. During the year ended December 31, 2010, we acquired Syllogic which resulted in a source
of cash of approximately $0.2 million. This net cash acquired partially offset capital expenditures
for property and equipment of $2.7 million during the year ended December 31, 2010.
Net cash used in investing activities was $2.1 million for the year ended December 31, 2009.
Cash used in investing activities for the year was primarily for capital expenditures related to
property and equipment as we continued to expand our infrastructure and workforce.
Net cash used in investing activities was $2.2 million for the year ended December 31, 2008.
During the year ended 2008, we made $1.7 million of capital expenditures related to property and
equipment as we continued to expand our infrastructure and workforce. In addition, we acquired PCB
for an aggregate of $0.5 million in cash.
42
Cash Provided By (Used in) Financing Activities
Net cash provided by financing activities was $110.6 million for the year ended December 31,
2010. Net cash provided by financing activities for the year ended December 31, 2010 primarily
resulted from the net proceeds of our IPO of $119.8 million, proceeds from the exercise of stock
options of $1.7 million and exercise of warrants of $0.6 million, an excess tax benefit from
stock-based compensation of $0.7 million, and proceeds from the issuance of stock options of $0.1
million. These proceeds were offset by payments under our then outstanding long-term note payable
of $7.4 million, payments of equity issuance costs of $4.7 million, and payments on our then
outstanding line of credit of $0.2 million.
Net cash used in financing activities was $1.8 million for the year ended December 31, 2009.
Net cash used in financing activities for the year ended December 31, 2009 was due to payments
under our then outstanding long-term note payable arrangement of $2.3 million and the repurchase of
stock options of $0.3 million. These were offset by proceeds from the exercise of stock option of
$0.5 million, borrowings under a then outstanding line of credit of $0.2 million, and an excess tax
benefit from stock-based compensation of $0.1 million.
Net cash provided by financing activities was $6.9 million for the year ended December 31,
2008. Net cash provided by financing activities for the year ended December 31, 2008 resulted from
borrowings under a then outstanding long-term note payable arrangement of $10.0 million and
proceeds from the exercise of stock options of $1.6 million. These were partially offset by
payments made under our then outstanding line of credit of $3.7 million and payments made on a
previous long-term note payable of $1.0 million.
Non-GAAP Financial Measures
We use measures of non-generally accepted accounting principles (“Non-GAAP”) income from
operations, Non-GAAP net income and Non-GAAP income per share. We believe that the Non-GAAP
financial information provided can assist investors in understanding and assessing our on-going
core operations and prospects for the future. This Non-GAAP financial information provides an
additional tool for investors to use in comparing our financial results with other companies in our
industry, many of which present similar Non-GAAP financial measures to investors.
43
The following is a reconciliation of Non-GAAP income from operations, Non-GAAP net income and
Non-GAAP income per share to the most comparable U.S. generally accepted accounting principles
(“U.S. GAAP”) measure for the periods indicated:
| |
|
|
|
|
|
|
|
|
| |
|
Year Ended December 31, |
|
| |
|
2010 |
|
|
2009 |
|
| |
|
(dollars in thousands) |
|
Reconciliation of Non-GAAP Income from Operations: |
|
|
|
|
|
|
|
|
GAAP income from operations |
|
$ |
27,568 |
|
|
$ |
13,166 |
|
Stock-based compensation expense |
|
|
3,018 |
|
|
|
1,479 |
|
Secondary offering expense |
|
|
550 |
|
|
|
— |
|
Severance expense |
|
|
610 |
|
|
|
— |
|
|
|
|
|
|
|
|
|
|
|
|
|
|
|
|
|
Non-GAAP income from operations |
|
$ |
31,746 |
|
|
$ |
14,645 |
|
|
|
|
|
|
|
|
|
|
|
|
|
|
|
|
|
Reconciliation of Non-GAAP Net Income: |
|
|
|
|
|
|
|
|
GAAP net income |
|
$ |
13,516 |
|
|
$ |
6,861 |
|
Stock-based compensation expense |
|
|
3,018 |
|
|
|
1,479 |
|
Secondary offering expense |
|
|
550 |
|
|
|
— |
|
Severance expense |
|
|
610 |
|
|
|
— |
|
Income tax adjustment (1) |
|
|
228 |
|
|
|
(1,056 |
) |
|
|
|
|
|
|
|
|
|
|
|
|
|
|
|
|
Non-GAAP net income |
|
$ |
17,922 |
|
|
$ |
7,284 |
|
|
|
|
|
|
|
|
|
|
|
|
|
|
|
|
|
Reconciliation of Non-GAAP Income per Share: |
|
|
|
|
|
|
|
|
Non-GAAP net income per common share — basic |
|
$ |
0.23 |
|
|
$ |
0.10 |
|
|
|
|
|
|
|
|
Non-GAAP net income per common share — diluted |
|
$ |
0.21 |
|
|
$ |
0.09 |
|
|
|
|
|
|
|
|
|
|
|
|
|
|
|
|
|
GAAP net income per common share — basic |
|
$ |
0.24 |
|
|
$ |
0.07 |
|
|
|
|
|
|
|
|
GAAP net income per common share — diluted |
|
$ |
0.21 |
|
|
$ |
0.06 |
|
|
|
|
|
|
|
|
|
|
|
|
|
|
|
|
|
Non-GAAP weighted average number of common shares outstanding — basic |
|
|
77,074,638 |
|
|
|
75,868,610 |
|
|
|
|
|
|
|
|
Non-GAAP weighted average number of common shares outstanding — diluted (2) |
|
|
83,899,293 |
|
|
|
80,379,872 |
|
|
|
|
|
|
|
|
|
|
|
|
|
|
|
|
|
GAAP weighted average number of common shares outstanding — basic |
|
|
45,232,782 |
|
|
|
16,267,186 |
|
|
|
|
|
|
|
|
GAAP weighted average number of common shares outstanding — diluted |
|
|
52,061,916 |
|
|
|
20,778,448 |
|
|
|
|
|
|
|
|
| |
|
|
| (1) |
|
Income tax adjustment is used to adjust the U.S. GAAP provision (benefit) for income
taxes to a Non-GAAP provision (benefit) for income taxes utilizing an estimated tax rate
of 28%. |
| |
| (2) |
|
Reflects (a) the automatic conversion of the then outstanding shares of convertible
preferred stock into 46,721,424 shares of common stock and (b) the issuance of 12,880,000
shares of common stock as though the completion of the IPO had occurred at the beginning
of the respective periods, which results in us not applying the two-class method of
earnings per share as required under U.S. GAAP. |
Critical Accounting Policies and Estimates
We prepare our consolidated financial statements in accordance with U.S. GAAP. The preparation
of consolidated financial statements also requires us to make estimates and assumptions that affect
the reported amounts of assets, liabilities, revenue, costs and expenses, and related disclosures.
We base our estimates on historical experience and on various other assumptions that we believe to
be reasonable under the circumstances. Actual results could differ significantly from the estimates
made by our management. To the extent that there are differences between our estimates and actual
results, our future financial statement presentation, financial condition, results of operations,
and cash flows will be affected. We believe that these accounting policies are critical to
understanding our historical and future performance, as these policies relate to the more
significant areas involving management’s judgments and estimates. There were no material changes to
our critical accounting policies and use of estimates.
Revenue Recognition
We derive substantially all of our revenue from the licensing of our software products and
associated maintenance agreements and from the sale of training and other consulting services. We
require one year of maintenance as part of the initial purchase price of each software offering and
then sell annual renewals of this maintenance agreement. We recognize revenue for software,
maintenance and professional services when persuasive evidence of an arrangement exists, delivery
has occurred, the sales price is fixed or determinable and collectability is reasonably assured.
44
As substantially all of our software licenses are sold in multiple-element arrangements that
include either maintenance or both maintenance and professional services, we use the residual
method to determine the amount of license revenue to be recognized. Under the residual method,
consideration is allocated to undelivered elements based upon vendor-specific objective evidence
(“VSOE”) of the fair value of those elements, with the residual of the arrangement fee allocated to
and recognized as license revenue. We have established VSOE of the fair value of maintenance
through independent maintenance renewals which demonstrate a consistent relationship of maintenance
pricing as a percentage of the contractual license fee. Maintenance revenues are deferred and
recognized ratably over the contractual period of the maintenance arrangement which is generally 12
months. Arrangements that include other professional services are evaluated to determine whether
those services are essential to the functionality of other elements of the arrangement. We have
determined that these services are not considered essential and the amounts allocated to the
services are recognized as revenue when the services are performed. The VSOE of fair value of our
professional services is based on the price for these same services when they are sold separately.
Revenue for services that are sold either on a stand-alone basis or included in multiple-element
arrangements is recognized as the services are performed.
For sales through resellers, we recognize revenue upon the shipment of the product only if
those resellers provide us, at the time of placing their order, with the identity of the end-user
customer to whom the product has been sold. Our resellers do not carry inventory of our software.
Sales through resellers are evidenced by a reseller agreement, together with purchase orders on a
transaction-by-transaction basis.
We also sell software licenses to OEMs who integrate our product for distribution with their
applications. We do not currently offer any rights to return products sold to resellers. The OEM’s
end-user customer is licensed to use our products solely in conjunction with the OEM’s application.
In OEM arrangements, key delivery is required as the basis for revenue recognition. However,
depending upon the OEM partner’s business model we recognize revenue either up-front or over time
in subscription or royalty-based models.
We do not offer specified upgrades or incrementally significant discounts. We record advance
payments as deferred revenues until the product is shipped, services are delivered or obligations
are met and the revenue can be recognized. Deferred revenues represent the excess of amounts
invoiced or paid over amounts recognized as revenues. Any contingencies, such as rights of return,
conditions of acceptance, and warranties are accounted for as a separate element. The effect of
accounting for these contingencies included in revenue arrangements has not been material.
Stock-Based Compensation
Our stock-based compensation is as follows:
| |
|
|
|
|
|
|
|
|
|
|
|
|
| |
|
Year Ended December 31, |
|
| |
|
2010 |
|
|
2009 |
|
|
2008 |
|
| |
|
(in thousands) |
|
|
|
|
|
|
|
|
|
|
|
|
|
|
Cost of revenue |
|
$ |
188 |
|
|
$ |
82 |
|
|
$ |
39 |
|
Sales and marketing |
|
|
1,572 |
|
|
|
733 |
|
|
|
285 |
|
Research and development |
|
|
96 |
|
|
|
79 |
|
|
|
19 |
|
General and administrative |
|
|
1,162 |
|
|
|
585 |
|
|
|
388 |
|
|
|
|
|
|
|
|
|
|
|
|
|
$ |
3,018 |
|
|
$ |
1,479 |
|
|
$ |
731 |
|
|
|
|
|
|
|
|
|
|
|
For the years ended December 31, 2010, 2009 and 2008, we calculated the fair value of options
granted using the Black-Scholes pricing model with the following assumptions:
| |
|
|
|
|
|
|
| |
|
Year Ended December 31, |
| |
|
2010 |
|
2009 |
|
2008 |
|
|
|
|
|
|
|
Expected dividend yield |
|
0.0% |
|
0.0% |
|
0.0% |
Risk-free interest rate |
|
1.3% – 2.7% |
|
1.5% – 2.4% |
|
1.2% – 3.1% |
Expected volatility |
|
48.3% – 50.2% |
|
44.7% – 85.7% |
|
48.0% – 88.8% |
Expected life (Swedish grants, in years) |
|
4 |
|
4 |
|
4 |
Expected life (all other grants, in years) |
|
6.25 |
|
6.25 |
|
6.25 |
We use the Black-Scholes option-pricing model to value our stock option awards. The
Black-Scholes option-pricing model requires the input of subjective assumptions, including the
expected life of the stock-based payment awards and stock price volatility. In addition, one of the
most subjective inputs into the Black-Scholes option pricing model has been the estimated fair
value of common stock which is discussed below. Since there was no public market for our common
stock prior to our initial public offering, we lacked sufficient historical volatility for the
expected term of the options. We use comparable public companies as a basis for our expected
volatility to calculate the fair value of option grants. We intend to continue to consistently
apply this process using comparable companies until a sufficient amount of historical information
regarding the volatility of our own share price becomes available. The expected term for option
grants to employees based in Sweden is four years based on the contractual expiration date and our
historical experience. The expected term for all other grants is based on the simplified method.
The risk-free interest rate is based on U.S. Treasury yield curve with a remaining term equal to
the expected life assumed at grant. The assumptions used in calculating the fair value of
stock-based payment awards represent management’s best estimate and involve inherent uncertainties
and the application of management’s judgment. As a result, if factors change and management uses
different assumptions, share-based compensation expense could be materially different in the
future.
45
For all employee stock options, we recognize expense over the requisite service period using
the straight-line method. In addition to the assumptions used to calculate the fair value of the
options, we are required to estimate the expected forfeiture rate of all stock-based awards and
only recognize expense for those awards expected to vest. The estimation of the number of stock
awards that will ultimately vest requires judgment, and to the extent actual results or updated
estimates differ from our current estimates, such amounts will be recorded as a cumulative
adjustment in the period in which estimates are revised. We consider many factors when estimating
expected forfeitures, including types of awards, employee class and an analysis of our historical
and known forfeitures on existing awards. During the period in which the options vest, we will
record additional expense if the actual forfeiture rate is lower than estimated and a recovery of
expense if the actual forfeiture rate is higher than estimated.
As of December 31, 2010, there was approximately $10.2 million of unrecognized stock-based
compensation expense related to non-vested stock option awards, net of estimated forfeitures that
we expect to recognize over a weighted-average period of 2.5 years. As of December 31, 2010, there
was $0.2 million of total unrecognized compensation cost, net of estimated forfeitures, related to
the non-employee directors restricted stock unit awards which have not vested or settled. The
remaining cost is expected to be recognized over a weighted-average period of approximately 0.6
years.
Based upon the closing price of our common stock on December 31, 2010 of $25.87, the aggregate
intrinsic value of options outstanding as of December 31, 2010 was $271.8 million, of which $179.0
million related to vested options and $92.8 million related to unvested options.
Pre-IPO Common Stock Valuations
For all option grants prior to our IPO, the fair value of the common stock underlying the
option grants was determined by our board of directors, with the assistance of management, which
intended all options granted to be exercisable at a price per share not less than the per share
fair value of our common stock underlying those options on the date of grant.
Post-IPO Common Stock Valuations
In July 2010, in connection with our IPO, pursuant to our director compensation program we
granted restricted stock unit awards for an aggregate of 37,500 shares to our non-employee
directors having an aggregate fair value of $0.4 million based on our initial public offering price
of $10.00. In July 2010, we granted options to purchase 277,650 shares of common stock at an
exercise price of $14.06 per share. In October 2010, we granted options to purchase 353,250 shares
of common stock at an exercise price of $22.59 per share and granted restricted stock unit awards
for 3,320 shares having an aggregate then fair value of approximately $0.1 million.
Following our IPO, we established a policy of using the closing sale price per share of our
common stock as quoted on the Nasdaq Global Market on the date of grant for purposes of determining
the exercise price per share of our options to purchase common stock.
Research and Development Expense for Software Products
Software development costs are expensed as incurred until technological feasibility has been
established, at which time such costs are capitalized to the extent that the capitalizable costs do
not exceed the realizable value of such costs, until the product is available for general release
to customers. Based on our product development process, technological feasibility is established
upon the completion of a working model of the software product that has been tested to be
consistent with the product design specifications and that is free of any uncertainties related to
high-risk development issues. Costs incurred by us between completion of the working model and the
point at which the product is ready for general release have been insignificant. Accordingly, we
have charged all such costs to research and development expense.
Income Taxes
We recognize deferred tax assets and liabilities for the expected future tax consequences of
temporary differences between the respective financial statement carrying amounts of existing
assets and liabilities and their respective tax bases and operating loss and tax credit carry
forwards. For the year ended December 31, 2010 and 2009, our tax provision consists principally of
foreign tax expense which in 2009 was partially offset by U.S. federal and state benefit.
We continue to assess the realizability of our deferred tax assets. In assessing the
realizability of these deferred tax assets, management considers whether it is more likely than not
that some portion or all of the deferred tax assets will be realized. We establish valuation
allowances when necessary to reduce deferred tax assets to the amounts expected to be realized. The
factors used to assess the likelihood of realization include our latest forecast of future taxable
income and available tax planning strategies that could be implemented to realize the net deferred
tax assets. As of December 31, 2010 and 2009, our deferred tax assets had a valuation allowance of
$1.8 million and $1.7 million. During the year ended December 31, 2010, all valuation allowances
were released for the foreign subsidiaries due to increased profitability and a valuation allowance
was established for certain foreign tax credits of the U.S. operating company.
46
Because of certain prior period ownership changes, the utilization of a portion of our U.S.
federal and state NOL carry forward may be limited. We have not finalized our analysis to determine
the annual Internal Revenue Code section 382 limitation, but we estimate that approximately $2.0 million of our U.S. federal and
state net operating losses may be limited which has been reflected in our valuation allowance at
December 31, 2010. If we were to determine that certain amounts of the $2.0 million were not
limited, a portion of our valuation allowance could be reversed.
We use a more-likely-than-not recognition threshold based on the technical merits of tax
positions taken. Tax positions that meet the more-likely-than-not recognition threshold are
measured as the largest amount of the tax benefits, determined on a cumulative probability basis,
which is more likely than not to be realized upon ultimate settlement in the financial statements.
We recognize interest and penalties related to income tax matters in our provision for income taxes. At
December 31, 2010 and 2009, our reserve for uncertain tax positions was $3.2 million and $3.3
million, respectively.
We identify, evaluate and measure all uncertain tax positions taken or to be taken on tax
returns and record liabilities for the amount of these positions that may not be sustained, or
may only partially be sustained, upon examination by the relevant taxing authorities. Although we
believe that our estimates and judgments were reasonable, actual results may differ from these
estimates. Some or all of these judgments are subject to review by the taxing authorities.
Our annual provision for income taxes and the determination of the resulting deferred tax
assets and liabilities involve a significant amount of management judgment. Management’s judgments,
assumptions and estimates relative to the current provision for income tax take into account
current tax laws, our interpretation of current tax laws and possible outcomes of current and
future audits conducted by foreign and domestic tax authorities. We operate within U.S., state
and local and foreign taxing jurisdictions and are subject to audit in these jurisdictions. These
audits can involve complex issues which may require an extended period of time to resolve.
We accrue interest and penalties related to unrecognized tax benefits as a component of income
tax expense. As of December 31, 2010, there was $0.1 million of accrued interest and penalties. As
of December 31, 2009, there was no accrued interest or penalties.
We expect to repatriate certain amounts in 2011 from a foreign subsidiary and have provided
for deferred taxes, after the utilization of net operating losses and tax credits anticipated to
result from this planned repatriation. We expect that the remaining undistributed earnings generated by
foreign subsidiaries will continue to be reinvested indefinitely. Accordingly, no provision has
been made for U.S. federal and state income
taxes of these foreign earnings.
Contractual Obligations and Commitments & Off-Balance Sheet Arrangements
The following table summarizes our contractual obligations at December 31, 2010 and the effect
such obligations are expected to have on our liquidity and cash flow in future periods.
| |
|
|
|
|
|
|
|
|
|
|
|
|
|
|
|
|
|
|
|
|
| |
|
Payment Due by Period |
|
| |
|
|
|
|
|
Less Than |
|
|
|
|
|
|
|
|
|
|
More Than |
|
| |
|
Total |
|
|
1 Year |
|
|
1 to 3 Years |
|
|
3 to 5 Years |
|
|
5 Years |
|
| |
|
(dollars in thousands) |
|
|
|
|
|
|
|
|
|
|
|
|
|
|
|
|
|
|
|
|
|
|
Operating lease obligations |
|
$ |
36,805 |
|
|
$ |
10,650 |
|
|
$ |
16,667 |
|
|
$ |
7,508 |
|
|
$ |
1,980 |
|
We generally do not enter into long-term minimum purchase commitments. Our principal
commitments consist of obligations under facility leases for office space.
On January 22, 2010, we completed our acquisition of Syllogic Corporation (“Syllogic”) for
total consideration of $1.1 million. The purchase price included a contingent cash consideration of
$0.5 million, which is estimated to be paid out over a four year period. The total maximum
contingent cash consideration that could be paid pursuant to the agreement is $0.8 million. These
amounts are not included in the table above due to the uncertainty of when the payouts are to
occur.
We have obligations related to unrecognized tax benefit liabilities totaling $3.2 million,
which have been excluded from the tables above as we do not think it is practicable to make
reliable estimates of the periods in which payment for these obligations will be made. See Note 8
of our notes to the consolidated financial statements.
| |
|
|
|
|
|
|
|
|
|
|
|
|
|
|
|
|
|
|
|
|
| |
|
Expiration by Period |
|
| |
|
|
|
|
Less Than |
|
|
|
|
|
|
|
|
|
|
| |
|
Total |
|
|
1 Year |
|
|
1 to 3 Years |
|
|
3 to 5 Years |
|
|
Thereafter |
|
| |
|
(dollars in thousands) |
|
|
|
|
|
|
|
|
|
|
|
|
|
|
|
|
|
|
|
|
|
|
Unrecognized Tax Benefit Liabilities |
|
$ |
3,185 |
|
|
$ |
415 |
|
|
$ |
698 |
|
|
$ |
151 |
|
|
$ |
1,921 |
|
47
In November 2010, we entered into an amendment to the lease for our global corporate
headquarters and principal executive offices in Radnor, Pennsylvania which increased the aggregate
rentable square footage of space from approximately 17,330 square feet to up to approximately
39,200 square feet. The term of the lease for the additional space commences when the landlord’s
renovation work for the applicable portions of the additional space are “substantially completed”
(as defined in the amendment), accounting for the possibility that the landlord may substantially
complete renovations on certain portions of the additional space at different times. Commencing on
the date that the landlord substantially completes its renovation work on the entire additional
space, the term of the lease with respect to all 39,200 square feet will be extended for a period
of ten years and three months. We believe the term of the lease will commence during 2011. In
addition, the landlord has granted us the right to renew the lease for an additional five year
period, subject to certain conditions. In consideration of the landlord performing the renovations,
we agreed to pay the landlord a construction management fee equal to 4% of the total cost of such
renovations that is being paid out of the tenant improvement allowance which is being provided by
the landlord for the renovation work. Pursuant to the amendment, once all of the additional space
has been substantially completed, our base rental obligation to the landlord for our headquarters
will be adjusted to $27.50 per square foot for the first twelve months of the new lease term
(except for a one month free base rent period on the original leased premises and a three month
free base rent period on the additional space), with $0.75 per square foot annual increases.
In December 2010, we entered into a transfer agreement (the “Transfer Agreement”) with Sony
Ericsson Mobile Communications AB (“SEMC”) relating to the transfer by SEMC to us of certain rental
lease agreements for approximately 11,253 square meters of office space and designated parking
spaces located in the Ideon Science Park in Lund, Sweden (the “Property”). Pursuant to the Transfer
Agreement, effective as of January 1, 2011 we assumed the rights and obligations of SEMC under two
separate lease agreements, as amended and/or supplemented (the “Lease Agreements”), whereby SEMC
leased the Property from Fastighets AB Remulus Lund 3 (the “Property Owner”). We expect that the
Property will serve as our primary research and development center. The Lease Agreements expire on
October 31, 2013 and October 31, 2016, respectively. Each Lease Agreement will automatically renew
upon expiration for additional three year terms unless written notice is provided by us to the
Property Owner of our desire to not renew the applicable lease at least 12 months prior to the end
of the respective term. The Lease Agreements provide for the payment of annual base rent in the
amount of 21.6 million Swedish kronor (approximately $3.2 million based on an assumed exchange rate
of approximately 0.15 as of December 29, 2010), subject to annual increases. In addition to the
base rent,
we are required to pay to the Property Owner certain operating expenses and other fees in
accordance with the terms of the Lease Agreements. The Lease Agreements contain customary
representations and covenants regarding occupancy, maintenance and care of the Property.
In consideration for our assumption of SEMC’s obligations under the Lease Agreements, SEMC has
agreed to pay us 26.0 million Swedish kronor (approximately $3.8 million based on an assumed
exchange rate of approximately 0.15 as of December 29, 2010), exclusive of value added tax, which
will be offset by 7.3 million Swedish kronor (approximately $1.1 million based on an assumed
exchange rate of approximately 0.15 as of December 29, 2010), exclusive of value added tax, which
we have agreed to pay SEMC for certain personal property, furniture and fixtures located at the
Property. The net amount is scheduled to be paid by SEMC by July 1, 2011 following receipt of an
invoice from us.
We anticipate occupying the Property in the second quarter of 2011 and, once the Property is fully
occupied, we expect that we will cease use of our current leased facility in Lund, Sweden. As of
December 31, 2010, our current facility in Lund, Sweden has $2.8 million of lease payments remaining
under the lease, which expires in September 2013. We currently plan to sublease the current leased facility.
If we are not able to sublease our current leased facility at or near the current lease payment, we may incur
a charge at the cease-use date related to the remaining rent payments under the lease. We are unable to estimate
the amount of the potential charge related to abandoning this facility at this time.
Inflation
Normally, inflation does not have a significant impact on our operations as our products are
not generally sold on long-term contracts. Consequently, we can adjust our selling prices, to the
extent permitted by competition, to reflect cost increases caused by inflation.
Recent Accounting Pronouncements
In January 2010, the FASB issued updated guidance related to fair value measurements and
disclosures, which requires a reporting entity to disclose separately the amounts of significant
transfers in and out of Level 1 and Level 2 fair value measurements and to describe the reasons for
the transfers. In addition, in the reconciliation for fair value measurements using significant
unobservable inputs, or Level 3, a reporting entity should disclose separately information about
purchases, sales, issuances, and settlements (that is, on a gross basis rather than on a net
basis). The updated guidance also requires that an entity should provide fair value measurement
disclosures for each class of assets and liabilities and disclosures about the valuation techniques
and inputs used to measure fair value for both recurring and non-recurring fair value measurements
for Level 2 and Level 3 fair value measurements. The updated guidance is effective for interim or
annual financial reporting periods beginning after December 15, 2009, except for the disclosures
about purchases, sales, issuances, and settlements in the rollforward activity in Level 3 fair
value measurements, which are effective for fiscal years beginning after December 15, 2010 and for
interim periods within those fiscal years. We adopted the updated guidance in the first quarter of
2010, and the impact on the consolidated financial statements was not material.
48
|
|
|
| ITEM 7A. |
|
QUANTITATIVE AND QUALATATIVE DISCLOSURES ABOUT MARKET RISK |
Market risk represents the risk of loss that may impact our financial position due to adverse
changes in financial market prices and rates. Our market risk exposure is primarily a result of
fluctuations in interest rates. We do not hold financial instruments for trading purposes.
Market Risk
We are exposed to certain financial risks, including fluctuations in foreign currency exchange
rates and interest rates. We manage our exposure to these market risks through internally
established policies and procedures and, when deemed appropriate, through the use of derivative
financial instruments. Our policies do not allow speculation in derivative instruments for profit
or execution of derivative instrument contracts for which there are no underlying exposures. We do
not use financial instruments for trading purposes and we are not a party to any leveraged
derivatives. We monitor our underlying market risk exposures on an ongoing basis and believe that
we can modify or adapt our hedging strategies as needed.
Interest Rate Sensitivity
We had cash and cash equivalents of $158.7 million at December 31, 2010 and $24.9 million at
December 31, 2009. We held these amounts primarily in cash or money market funds.
We hold cash and cash equivalents for working capital purposes. We do not have material
exposure to market risk with respect to investments, as our investments consist primarily of highly
liquid investments purchased with original maturities of three months or less. We do not use
derivative financial instruments for speculative or trading purposes; however, we may adopt
specific hedging strategies in the future. Any declines in interest rates, however, will reduce
future interest income.
Foreign Exchange Risk
We market our products in the Americas, Europe, the Asia-Pacific Regions, and Africa and
develop our products in Europe. As a result of our business activities in foreign countries, our
financial results could be affected by factors such as changes in foreign currency exchange rates
or economic conditions in foreign markets, and there is no assurance that exchange rate
fluctuations will not harm our business in the future. We sell our products in certain countries in
the local currency of the respective country. In addition, our product development activities are
principally based at our facility in Lund, Sweden. This provides some natural hedging because most
of our subsidiaries’ operating expenses are denominated in their local currencies. Regardless of
this natural hedging, our results of operations may be adversely impacted by the exchange rate
fluctuation. Although we will continue to monitor our exposure to currency fluctuations and, where
appropriate, may use financial hedging techniques in the future to minimize the effect of these
fluctuations, we are not currently engaged in any financial hedging transactions.
Foreign exchange risk exposures arise from transactions denominated in a currency other than
our functional currency and from foreign denominated revenue and profit translated into U.S.
dollars. Approximately 69% and 73% of our operating revenues were denominated in currencies other
than the U.S. dollar for the years ended December 31, 2010 and 2009. The principal foreign
currencies in which we conduct business are the Swedish kronor, the British pound and the euro. The
translation of currencies in which we operate into the U.S. dollar may affect consolidated revenues
and gross profit margins as expressed in U.S. dollars. A weakening of the U.S. dollar versus other
currencies in which we operate may increase our consolidated revenues and gross profit margins
while the strengthening of the U.S. dollars versus these currencies may have an opposite effect on
our consolidated results expressed in U.S. dollars. For the year
ended December 31, 2010, a hypothetical 10% adverse change in foreign exchange rates would have resulted in a decrease to operating income of $0.5 million.
49
|
|
|
| ITEM 8. |
|
FINANCIAL STATEMENTS AND SUPPLEMENTAL DATA |
Our consolidated financial statements are submitted on pages F-1
through F-25 of this report.
|
|
|
| ITEM 9. |
|
CHANGES IN AND DISAGREEMENTS WITH ACCOUNTANTS ON ACCOUNTING AND FINANCIAL DISCLOSURES |
None.
|
|
|
| ITEM 9A(T). |
|
CONTROL AND PROCEDURES |
Evaluation of Disclosure and Control Procedures
Our management, with the participation of our Chief Executive Officer and Chief Financial
Officer, evaluated the effectiveness of our disclosure controls and procedures as of December 31,
2010. The term “disclosure controls and procedures,” as defined in Rules 13a-15(e) and 15d and
15(e) under the Securities Exchange Act of 1934, as amended (“Exchange Act”), means controls and
other procedures of a company that are designed to ensure that information required to be disclosed
by a company in the reports that it files or submits under the Exchange Act is recorded, processed,
summarized and reported within the time periods specified in the SEC’s rules and forms. Disclosure
controls and procedures include, without limitation, controls and procedures designed to ensure
that information require to be disclosed by a company in the reports that it files or submits under
the Exchange Act is accumulated and communicated to the company’s management, including its
principal executive and principal financial officers, as appropriated to allow timely decisions
regarding required disclosure. Management recognizes that any controls and procedures, no matter
how well designed and operated, can provide only reasonable assurance of achieving their objectives
and management necessarily applies its judgment in evaluating the cost-benefit relationship of
possible controls and procedures.
Our management, with the participation of the Chief Executive Officer and Chief Financial
Officer, has evaluated the effectiveness of the Company’s disclosure controls and procedures as of
the end of the period covered by this Annual Report on Form 10-K. Based upon that evaluation, our
Chief Executive Officer and Chief Financial Officer have concluded that, as of December 31, 2010,
our disclosure controls and procedures were effective at the reasonable assurance level.
Management’s Annual Report on Internal Control Over Financial Reporting
The SEC, as required by Section 404 of the Sarbanes Oxley Act, adopted rules requiring every
company that files reports with the SEC to include a management report on such company’s internal
control over financial reporting in its annual report. In addition, our independent registered
public accounting firm must attest to our internal control over
financial reporting. This Annual Report on
Form 10-K does not include a report of management’s assessment regarding internal control over
financial reporting or an attestation report of our independent registered public accounting firm
due to a transition period established by the SEC rules applicable to newly public companies.
Management will be required by provided an assessment of the effectiveness of our internal control
over financial reporting as of December 31, 2011. We believe we will have adequate resources and
expertise, both internal and external, in place to meet this requirement. However, there is no
guarantee that our efforts will result in management’s ability to conclude, or our independent
registered public accounting firm to attest, that our internal control over financial reporting is
effective as of December 31, 2011.
Changes in Internal Control Over Financial Reporting
No change in our internal control over financial reporting (as defined in Rule 13a-15(f) and
15d-(f) under the Exchange Act) occurred during the quarter ended December 31, 2010 that has
materially affected, or is reasonably likely to materially affect, our internal controls over
financial reporting.
Certifications
The certifications of our Chief Executive Officer and Chief Financial Officer pursuant to
Section 302 of the Sarbanes-Oxley Act of 2002 are filed as Exhibits 31.1 and 31.2 to this Annual
Report on Form 10-K.
|
|
|
| ITEM 9B. |
|
OTHER INFORMATION |
None.
50
PART III
|
|
|
| ITEM 10. |
|
DIRECTORS, EXECUTIVE OFFICERS AND CORPORATE GOVERNANCE |
Except as set forth below, the information required by this Item is incorporated by reference
from our proxy statement for our 2011 Annual Meeting of Stockholders to be filed with the SEC
within 120 days after the end of our fiscal year ended December 31, 2010.
Executive Officers of the Registrant
The following table sets forth the name, age, and position of each of our executive officers as of
March 1, 2011:
| |
|
|
|
|
| Name |
|
Age |
|
Positions Held |
|
|
|
|
|
Lars Björk (1) |
|
48 |
|
President, Chief Executive Officer and Director |
William G. Sorenson |
|
55 |
|
Chief Financial Officer, Treasurer and Secretary |
Leslie Bonney |
|
53 |
|
Chief
Operating Officer |
Anthony Deighton |
|
37 |
|
Senior Vice President, Products |
Douglas Laird |
|
49 |
|
Vice President, Marketing |
Deborah C. Lofton |
|
43 |
|
Vice President and General Counsel |
Jonas Nachmanson |
|
47 |
|
Chief Technology Officer |
| |
|
|
| (1) |
|
Member of the Board of Directors |
| |
| (2) |
|
Mr. Bonney, who previously served as our Executive Vice President, Global Field Operations,
was appointed Chief Operating Officer on March 14, 2011. |
Lars Björk has served as our President and Chief Executive Officer since October 2007 and
as a member of our board of directors since October 2004. From August 2006 to October 2007, he
served as our Chief Financial Officer and Chief Operating Officer. From August 2000 to August 2006,
Mr. Björk served as Chief Financial Officer of QlikTech International AB. From January 1999 to
August 2000, he served as Chief Information Officer of Resurs Finance. From May 1994 to January
1999, Mr. Björk served as Chief Financial Officer of ScandStick, a manufacturer of adhesive material.
Mr. Björk received an MBA from the University of Lund, Sweden and a Degree in Engineering from the
Technical College in Helsingborg, Sweden.
William G. Sorenson has served as our Chief Financial Officer, Treasurer and Secretary since
August 2008. From January 2007 to April 2008, Mr. Sorenson served as Chief Operating Officer of
Firebrand TV. From November 2005 to November 2006, Mr. Sorenson served as Chief Financial Officer
of Savaje Technologies, Inc. From January 2002 to March 2005, Mr. Sorenson served as Chief
Financial Officer of EMI Music Publishing. Prior to that Mr. Sorenson held executive level
positions at Bertlesmann AG and the News Corporation Ltd. Mr. Sorenson received an M.A. in
International Relations from The American University, Washington, D.C. and a B.A. in Foreign
Languages from LeMoyne College, Syracuse, New York.
Leslie Bonney has served as our Chief Operating Officer since March 2011. From March 2010 to
March 2011, Mr. Bonney served as our Executive Vice President of Global Field Operations. From
October 2007 to March 2010, Mr. Bonney served as our Senior Vice President Worldwide Sales. From
June 2005 to October 2007, Mr. Bonney served as our Vice President International Markets. From
January 2004 to June 2005, Mr. Bonney served as Senior Vice President and General Manager Europe,
Middle East and Africa markets of StreamServe, a document management company. Mr. Bonney received a
B.Sc. in Marine Biology from James Cook University.
Anthony Deighton has served as our Senior Vice President, Products since January 2005. He
previously served as the General Manager of Siebel Systems’ Employee Relationship Management (ERM)
business unit, among a variety of other product marketing roles at Siebel Systems from October 1999
to January 2005. Prior to joining Siebel, Mr. Deighton worked as a business analyst at A.T. Kearney
in Chicago, Illinois. Mr. Deighton received a B.A. in Economics from Northwestern University and an
M.B.A. with high distinction from Harvard Business School.
Douglas Laird has served as our Vice President, Marketing since November 2008. From November
2007 to November 2008, Mr. Laird served as Vice President of Marketing at SpikeSource, Inc. From
August 2006 to November 2007, Mr. Laird served as Vice
President of Marketing at Trapeze Networks,
Inc. From April 2005 to July 2006, Mr. Laird served as
Senior Vice President of Marketing at Virsa/SAP
America, Inc. From October 1998 to April 2005, Mr. Laird served as Vice President of Marketing at
Siebel Systems, Inc. Mr. Laird received a B.S. in Business Administration and Marketing from the
University of the Pacific.
51
Deborah C. Lofton has served as our Vice President and General Counsel since January 2011.
From November 2007 to January 2011, Ms. Lofton served as Counsel at McCausland Keen & Buckman.
Prior to joining McCausland Keen & Buckman, Ms. Lofton served as Senior Vice President, General
Counsel and Secretary of InfraSource Services, Inc. Ms. Lofton has a B.A. in American Government
from the University of Virginia and a J.D. from the University of Virginia School of Law.
Jonas Nachmanson has served as our Chief Technology Officer since October 2007. From September
1996 to October 2007, he served in various positions at our Company, including Vice President of
Research and Development, Director of Research and Development and Manager of Research and
Development. From September 1988 to August 1996, Mr. Nachmanson served in various positions at
Tetra Pak, a liquid food packager. Mr. Nachmanson received a Masters of Science in Electrical
Engineering and Computer Science from the Lund Institute of Technology and a B.Sc. in Business
Administration from Lund University, Sweden.
Code of Business Conduct
Our board of directors has adopted a code of business conduct that applies to all of our
employees, officers (including our principal executive officer, principal financial officer,
principal accounting officer or controller, or persons performing similar functions) and directors.
The full text of our code of business conduct is posted on our website at
http://www.qlikview.com under the Investor Relations section. We intend to disclose future
amendments to certain provisions of our code of business conduct, or waivers of such provisions,
applicable to our directors and executive officers (including our principal executive officer,
principal financial officer, principal accounting officer or controller, or persons performing
similar functions) at the same location on our website identified above and also in a Current
Report on Form 8-K within four business days following the date of such amendment or waiver. A copy
of the code of business conduct is also available upon request to the Corporate Secretary at Qlik
Technologies Inc., 150 N. Radnor-Chester Road, Suite E220, Radnor, PA 19087.
|
|
|
| ITEM 11. |
|
EXECUTIVE COMPENSATION |
The information required by this item is incorporated by reference from the information in our
proxy statement for our 2011 Annual Meeting of Stockholders to be filed with the SEC within 120
days after the end of our fiscal year ended December 31, 2010.
|
|
|
| ITEM 12. |
|
SECURITY OWNERSHIP OF CERTAIN BENEFICIAL OWNERS AND MANAGEMENT AND RELATED STOCKHOLDER MATTERS |
The information required by this item is incorporated by reference from the information in our
proxy statement for our 2011 Annual Meeting of Stockholders to be filed with the SEC within 120
days after the end of our fiscal year ended December 31, 2010.
|
|
|
| ITEM 13. |
|
CERTAIN RELATIONSHIPS AND RELATED TRANSACTIONS, AND DIRECTOR INDEPENDENCE |
The information required by this item is incorporated by reference from the information in our
proxy statement for our 2011 Annual Meeting of Stockholders to be filed with the SEC within 120
days after the end of our fiscal year ended December 31, 2010.
|
|
|
| ITEM 14. |
|
PRINCIPAL ACCOUNTANT FEES AND SERVICES |
The information required by this item is incorporated by reference from the information in our
proxy statement for our 2011 Annual Meeting of Stockholders to be filed with the SEC within 120
days after the end of our fiscal year ended December 31, 2010.
PART IV
|
|
|
| ITEM 15. |
|
EXHIBITS AND FINANCIAL STATEMENT SCHEDULES |
| |
(a) |
|
The following documents are filed as part of this Annual Report on Form 10-K: |
| |
(1) |
|
Financial Statements. |
| |
| |
|
|
The list of consolidated financial statements and schedules set forth in accompanying Index
to Consolidated Financial Statements on page F-1 of this Annual Report on Form 10-K, which is
incorporated into this item reference. |
| |
| |
(2) |
|
Financial Statement Schedule. |
| |
| |
|
|
No financial statement schedules have been submitted because they are not required or are
not applicable or because the information required is included in the consolidated financial
statements or the notes thereto. |
| |
| |
(3) |
|
Exhibits. |
| |
| |
|
|
The exhibits that are incorporated by reference in this
Annual Report on Form 10-K are listed on the Exhibit Index following the signature page of this Annual Report on
Form 10-K. |
52
SIGNATURES
Pursuant to the requirements of the Securities Exchange Act of 1934, the registrant has duly
caused this report to be signed on its behalf by the undersigned thereunto duly authorized, on
March 16, 2011.
| |
|
|
|
|
|
|
|
| |
|
QLIK TECHNOLOGIES INC. |
|
|
|
|
|
|
|
|
|
|
|
By:
|
|
/s/ LARS BJÖRK
|
|
|
|
|
|
|
Lars Björk |
|
|
|
|
|
|
President, Chief Executive Officer, and Director |
|
|
|
|
|
|
(Principal Executive Officer) |
|
|
Pursuant to the requirements of the Securities Exchange Act of 1934, this report has been
signed below by the following persons on behalf of the registrant and in the capacities and on the
dates indicated.
| |
|
|
|
|
| Signatures |
|
Title |
|
Date |
|
|
|
|
|
|
|
President, Chief Executive Officer, and |
|
|
Lars Björk
|
|
Director (Principal Executive Officer)
|
|
March 16, 2011 |
|
|
|
|
|
|
|
Chief Financial Officer, Treasurer, and |
|
|
William G. Sorenson
|
|
Secretary (Principal Financial Officer and Principal Accounting Officer)
|
|
March 16, 2011 |
|
|
|
|
|
|
|
|
|
|
Bruce Golden
|
|
Chairman of the Board
|
|
March 16, 2011 |
|
|
|
|
|
|
|
|
|
|
John C. Burris
|
|
Director
|
|
March 16, 2011 |
|
|
|
|
|
|
|
|
|
|
John Gavin, Jr.
|
|
Director
|
|
March 16, 2011 |
|
|
|
|
|
|
|
|
|
|
Erel N. Margalit
|
|
Director
|
|
March 16, 2011 |
|
|
|
|
|
|
|
|
|
|
Alexander Ott
|
|
Director
|
|
March 16, 2011 |
|
|
|
|
|
|
|
|
|
|
Paul Wahl
|
|
Director
|
|
March 16, 2011 |
53
EXHIBIT INDEX
| |
|
|
|
|
| Exhibit |
|
|
| Number |
|
Description of Document |
| |
|
|
|
|
| |
3.2 |
(5) |
|
Restated Certificate of Incorporation of Registrant |
| |
3.4 |
(1) |
|
Amended and Restated Bylaws of the Registrant |
| |
4.2 |
(3) |
|
Form of Registrant’s Common Stock Certificate |
| |
4.3 |
(1) |
|
Investors’ Rights Agreement, dated November 17, 2004 and as amended on various dates, by and among the
Registrant, certain stockholders and the investors listed on the signature pages thereto |
| |
4.3.A |
(5) |
|
Amendment and Waiver of Notice Agreement, dated June 11, 2010, by and among the Registrant and certain investors
listed on the signature pages thereto |
| |
10.1 |
† (3) |
|
Form of Indemnification Agreement between the Registrant and Lars Björk |
| |
10.2 |
† (3) |
|
Form of Indemnification Agreement between the Registrant and John Gavin, Jr. |
| |
10.3 |
† (3) |
|
Form of Indemnification Agreement between the Registrant and Bruce Golden |
| |
10.4 |
† (3) |
|
Form of Indemnification Agreement between the Registrant and Erel Margalit |
| |
10.5 |
† (3) |
|
Form of Indemnification Agreement between the Registrant and Alexander Ott |
| |
10.6 |
† (3) |
|
Form of Indemnification Agreement between the Registrant and Paul Wahl |
| |
10.7 |
† (3) |
|
Form of Indemnification Agreement between the Registrant and William G. Sorenson |
| |
10.8 |
† (3) |
|
Form of Indemnification Agreement between the Registrant and Leslie Bonney |
| |
10.9 |
† (3) |
|
Form of Indemnification Agreement between the Registrant and Anthony Deighton |
| |
10.10 |
† (3) |
|
Form of Indemnification Agreement between the Registrant and Douglas Laird |
| |
10.11 |
† (4) |
|
Amended and Restated Employment Agreement, dated June 1, 2010, by and between the Registrant and Lars Björk |
| |
10.12 |
† (4) |
|
Amended and Restated Employment Agreement, dated June 1, 2010, by and between the Registrant and William Sorenson |
| |
10.13 |
† (3) |
|
Employment Agreement, dated May 2, 2005, by and between the Registrant and Leslie Bonney |
| |
10.13.A |
† (4) |
|
Letter Agreement, dated June 1, 2010, by and between the Registrant and Leslie Bonney |
| |
10.14 |
† (4) |
|
Amended and Restated Employment Offer Letter, dated June 1, 2010, by and between the Registrant and Anthony
Deighton |
| |
10.15 |
† (4) |
|
Amended and Restated Employment Offer Letter, dated June 1, 2010, by and between the Registrant and Douglas Laird |
| |
10.16 |
† (1) |
|
Amended and Restated Consulting Agreement, dated September 1, 2005, by and between the Registrant and Paul Wahl |
| |
10.17 |
† (1) |
|
Consulting Agreement, dated October 1, 2004, by and between the Registrant and Alexander Ott |
| |
10.18 |
† (1) |
|
2004 Omnibus Stock Option and Award Plan |
| |
10.19 |
† (1) |
|
2007 Omnibus Stock Option and Award Plan |
| |
10.20 |
† (1) |
|
2010 Omnibus Equity Incentive Plan |
| |
10.21A |
†* |
|
Form of US Employee Notice of Stock Option Grant and Stock Option Agreement under 2010 Omnibus Equity Incentive Plan |
| |
10.21B |
†* |
|
Form of International Employee Notice of Stock Option Grant and Stock Option Agreement under 2010 Omnibus Equity
Incentive Plan |
| |
10.21C |
†* |
|
Form of Notice of Director Stock Unit Award under 2010 Omnibus Equity Incentive Plan |
| |
10.22 |
(1) |
|
Translation of Agreement by and between the Registrant, QlikTech International AB and Svenska Handelsbanken AB
dated as of July 11, 2008 |
| |
10.23 |
(1) |
|
Translation of Amendment Agreement by and between the Registrant, QlikTech International AB and Svenska
Handelsbanken AB dated as of July 13, 2009 |
| |
10.24 |
† (1) |
|
Omnibus Stock Option and Award Plan Non-Qualified Stock Option Award Agreement granted to Alexander Ott under
the 2004 Omnibus Stock Option and Award Plan |
| |
10.25 |
(1) |
|
Omnibus Stock Option and Award Plan Non-Qualified Stock Option Award Agreements granted to Anthony Deighton
under the 2004 Omnibus Stock Option and Award Plan and under the 2007 Omnibus Stock Option and Award Plan, and
Side letter, dated November 2006, between the Registrant and Anthony Deighton |
| |
10.25.A |
† (4) |
|
Omnibus Stock Option and Award Plan Non-Qualified Stock Option Award Agreement granted to Anthony Deighton under
the 2007 Omnibus Stock Option and Award Plan, dated May 21, 2010 |
| |
10.26 |
† (1) |
|
Omnibus Stock Option and Award Plan Non-Qualified Stock Option Award Agreement granted to Douglas Laird under
the 2007 Omnibus Stock Option and Award Plan |
| |
10.26.A |
† (4) |
|
Omnibus Stock Option and Award Plan Non-Qualified Stock Option Award Agreement granted to Douglas Laird under
the 2007 Omnibus Stock Option and Award Plan, dated May 21, 2010 |
| |
|
|
|
|
| Exhibit |
|
|
| Number |
|
Description of Document |
| |
|
|
|
|
| |
10.27 |
† (1) |
|
Omnibus Stock Option and Award Plan Non-Qualified Stock Option Award Agreements granted to Lars Björk under the
2004 Omnibus Stock Option and Award Plan and the 2007 Omnibus Stock Option and Award Plan |
| |
10.27.A |
† (4) |
|
Omnibus Stock Option and Award Plan Non-Qualified Stock Option Award Agreement granted to Lars Björk under the
2007 Omnibus Stock Option and Award Plan, dated May 21, 2010 |
| |
10.28 |
† (1) |
|
2004, 2005 and 2009 Omnibus Stock Option and Award Plans and Sub-Plans for the UK Agreements granted to Leslie
Bonney |
| |
10.28.A |
† (4) |
|
2010 Omnibus Stock Option and Award Plan and Sub-Plan for the UK Agreement granted to Leslie Bonney, dated May
21, 2010 |
| |
10.29 |
† (1) |
|
Omnibus Stock Option and Award Plan Non-Qualified Stock Option Award Agreements granted to Paul Wahl under the
2004 Omnibus Stock Option and Award Plan and 2007 Omnibus Stock Option and Award Plan |
| |
10.30 |
† (1) |
|
Omnibus Stock Option and Award Plan Non-Qualified Stock Option Award Agreement granted to William Sorenson under
the 2007 Omnibus Stock Option and Award Plan |
| |
10.30.A |
† (4) |
|
Omnibus Stock Option and Award Plan Non-Qualified Stock Option Award Agreement granted to William Sorenson under
the 2007 Omnibus Stock Option and Award Plan, dated May 21, 2010 |
| |
10.31 |
† (4) |
|
Omnibus Stock Option and Award Plan Non-Qualified Stock Option Award Agreement granted to John Gavin, Jr. under
the 2007 Omnibus Stock Option and Award Plan |
| |
10.32 |
(1) |
|
Term Loan Facility Agreement, dated June 16, 2008, between the Registrant and Stiftelsen Industrifonden |
| |
10.33 |
(1) |
|
Warrant to Purchase Shares of Preferred Stock, dated June 16, 2008, issued by the Registrant to Stiftelsen
Industrifonden |
| |
10.34 |
(1) |
|
Share Pledge Agreement, dated June 16, 2008, between the Registrant and Stiftelsen Industrifonden |
| |
10.35 |
(1) |
|
Stock Purchase Agreement, dated November 17, 2004, between the Registrant, QlikTech International AB and the
Investors (as defined therein) |
| |
10.36 |
(1) |
|
Lease, dated November 15, 2005, between the Registrant and Radnor Properties-SDC, L.P. |
| |
10.37 |
(1) |
|
First Amendment to Lease, dated March 13, 2009, between the Registrant and Radnor Properties-SDC, L.P. |
| |
10.38 |
(2) |
|
Translation of “Hyreskontrakt for local,” dated May 22, 2007, between QlikTech International AB and Ideon AB |
| |
10.39 |
|
|
Reference is made to Exhibits 4.3 and 4.3A |
| |
10.40 |
† (6) |
|
Form of Indemnification Agreement between the Registrant and John Burris |
| |
10.41 |
(7) |
|
Second Amendment to Lease dated as of November 23, 2010, by and between Radnor Properties — SDC, L.P. and the
Registrant |
| |
10.42 |
* |
|
Translation of Transfer Agreement dated December 29, 2010 between QlikTech International
AB and Sony Ericsson Mobile Communications AB (SEMC) and two separate lease agreements where by SEMC leased
property from Fastighets AB Remulus Lund 3 |
| |
21.1 |
* |
|
List of subsidiaries of the Registrant (including jurisdiction of organization and names under which
subsidiaries do business) |
| |
23.1 |
* |
|
Consent of Independent Registered Public Accounting Firm |
| |
24.1 |
* |
|
Powers of Attorney (included in the signature pages to the registration statement) |
| |
31.1 |
* |
|
Certification of Chief Executive Officer pursuant to Exchange Act Rules 13a-14(a) and 15d-14(a), as adopted
pursuant to Section 302 of the Sarbanes-Oxley Act of 2002 |
| |
31.2 |
* |
|
Certification of Chief Financial Officer pursuant to Exchange Act Rules 13a-14(a) and 15d-14(a), as adopted
pursuant to Section 302 of the Sarbanes-Oxley Act of 2002 |
| |
32.1 |
** |
|
Certifications of Chief Executive Officer and Chief Financial Officer pursuant to 18 U.S.C. Section 1350 as
adopted pursuant to Section 906 of the Sarbanes-Oxley Act of 2002 |
| |
|
|
| † |
|
Compensation arrangement |
| |
| * |
|
Filed herewith |
| |
| (1) |
|
Incorporated by reference to the same numbered exhibit to the Registrant’s Registration Statement on Form S-1 (SEC File No. 333-165844) filed on April 1, 2010. |
| |
| (2) |
|
Incorporated by reference to the same numbered exhibit to the Registrant’s Amendment No. 1 to Registration Statement on Form S-1 (SEC File No. 333-165844) filed on
May 5, 2010. |
| |
| (3) |
|
Incorporated by reference to the same numbered exhibit to the Registrant’s Amendment No. 2 to Registration Statement on Form S-1 (SEC File No. 333-165844) filed on
May 27, 2010. |
| |
| (4) |
|
Incorporated by reference to the same numbered exhibit to the Registrant’s Amendment No. 3 to Registration Statement on Form S-1 (SEC File No. 333-165844) filed on
June 4, 2010. |
| |
| (5) |
|
Incorporated by reference to the same numbered exhibit to the Registrant’s Amendment No. 4 to Registration Statement on Form S-1 (SEC File No. 333-165844) filed on
June 28, 2010. |
| |
| (6) |
|
Incorporated by reference to Exhibit 99.2 to the Registrant’s Current Report on Form 8-K (SEC File No. 001-34803) filed on October 14, 2010. |
| |
| (7) |
|
Incorporated by reference to Exhibit 10.1 to the Registrant’s Current Report on Form 8-K (SEC File No. 001-34803) filed on November 23, 2010. |
| |
| ** |
|
The certification attached as Exhibit 32.1 is not deemed “filed” with the SEC and is not to
be incorporated by reference into any filing of the registrant under the Securities Act of 1933 or
the Securities Exchange Act of 1934, whether made before or after the date hereof and irrespective
of any general incorporation language contained in such filing, except to the extent that the
registrant specifically incorporates it by reference. |
INDEX TO CONSOLIDATED FINANCIAL STATEMENTS
| |
|
|
|
|
| |
|
Page |
|
|
|
|
|
|
|
|
|
F-2 |
|
|
|
|
|
|
|
|
|
F-3 |
|
|
|
|
|
|
|
|
|
F-4 |
|
|
|
|
|
|
|
|
|
F-5 |
|
|
|
|
|
|
|
|
|
F-6 |
|
|
|
|
|
|
|
|
|
F-7 |
|
F-1
Report of Ernst & Young LLP, Independent Registered Public Accounting Firm
The Board of Directors and Stockholders of Qlik Technologies Inc.
We have audited the accompanying consolidated balance sheets of Qlik Technologies Inc. as of
December 31, 2010 and 2009, and the related consolidated statements of income, convertible
preferred stock and stockholders’ equity (deficit), and cash flows for each of the three years in
the period ended December 31, 2010. These consolidated financial statements are the responsibility
of the Company’s management. Our responsibility is to express an opinion on these consolidated
financial statements based on our audits.
We conducted our audits in accordance with the standards of the Public Company Accounting
Oversight Board (United States). Those standards require that we plan and perform the audit to
obtain reasonable assurance about whether the financial statements are free of material
misstatement. We were not engaged to perform an audit of the Company’s internal control over
financial reporting. Our audits included consideration of internal control over financial reporting
as a basis for designing audit procedures that are appropriate in the circumstances, but not for
the purpose of expressing an opinion on the effectiveness of the Company’s internal control over
financial reporting. Accordingly, we express no such opinion. An
audit also includes examining, on a
test basis, evidence supporting the amounts and disclosures in the
financial statements, assessing the accounting principles used and significant estimates made by
management, and evaluating the overall financial statement presentation. We believe that our
audits provide a reasonable basis for our opinion.
In our opinion, the financial statements referred to above present fairly, in all material
respects, the consolidated financial position of Qlik Technologies
Inc. as of December 31, 2010 and
2009, and the consolidated results of its operations and its cash flows for each of the three
years in the period ended December 31, 2010, in conformity with
U.S. generally accepted accounting principles.
/s/ Ernst & Young LLP
Philadelphia, Pennsylvania
March
16, 2011
F-2
QLIK TECHNOLOGIES INC.
CONSOLIDATED BALANCE SHEETS
(in thousands, except share data)
| |
|
|
|
|
|
|
|
|
| |
|
December 31, |
|
|
December 31, |
|
| |
|
2010 |
|
|
2009 |
|
Assets |
|
|
|
|
|
|
|
|
Current assets: |
|
|
|
|
|
|
|
|
Cash and cash equivalents |
|
$ |
158,712 |
|
|
$ |
24,852 |
|
Accounts receivable, net |
|
|
85,364 |
|
|
|
63,729 |
|
Prepaid expenses and other current assets |
|
|
7,107 |
|
|
|
3,970 |
|
Deferred income taxes |
|
|
527 |
|
|
|
810 |
|
|
|
|
|
|
|
|
Total current assets |
|
|
251,710 |
|
|
|
93,361 |
|
|
|
|
|
|
|
|
|
|
Property and equipment, net |
|
|
4,399 |
|
|
|
3,244 |
|
Intangible assets, net |
|
|
388 |
|
|
|
417 |
|
Goodwill |
|
|
2,746 |
|
|
|
1,308 |
|
Deferred income taxes |
|
|
4,248 |
|
|
|
4,207 |
|
Deposits and other noncurrent assets |
|
|
1,573 |
|
|
|
430 |
|
|
|
|
|
|
|
|
|
|
|
|
|
|
|
|
|
Total assets |
|
$ |
265,064 |
|
|
$ |
102,967 |
|
|
|
|
|
|
|
|
|
|
|
|
|
|
|
|
|
Liabilities, convertible preferred stock and stockholders’ equity (deficit) |
|
|
|
|
|
|
|
|
Current liabilities: |
|
|
|
|
|
|
|
|
Current portion of long-term debt |
|
$ |
— |
|
|
$ |
3,022 |
|
Line of credit |
|
|
— |
|
|
|
242 |
|
Income taxes payable |
|
|
8,431 |
|
|
|
3,203 |
|
Accounts payable |
|
|
5,627 |
|
|
|
5,232 |
|
Deferred revenue |
|
|
50,024 |
|
|
|
35,575 |
|
Accrued payroll and other related costs |
|
|
25,262 |
|
|
|
18,818 |
|
Accrued expenses |
|
|
12,960 |
|
|
|
10,015 |
|
Deferred income taxes |
|
|
337 |
|
|
|
— |
|
Stock warrant liability |
|
|
— |
|
|
|
2,425 |
|
|
|
|
|
|
|
|
Total current liabilities |
|
|
102,641 |
|
|
|
78,532 |
|
|
|
|
|
|
|
|
|
|
Long-term liabilities: |
|
|
|
|
|
|
|
|
Long-term debt |
|
|
— |
|
|
|
3,777 |
|
Deferred income taxes |
|
|
48 |
|
|
|
326 |
|
Other long-term liabilities |
|
|
3,185 |
|
|
|
3,322 |
|
Stock warrant liability |
|
|
— |
|
|
|
2,212 |
|
|
|
|
|
|
|
|
Total liabilities |
|
|
105,874 |
|
|
|
88,169 |
|
|
|
|
|
|
|
|
|
|
Commitments and contingencies |
|
|
|
|
|
|
|
|
Convertible preferred stock: |
|
|
|
|
|
|
|
|
Series A convertible preferred stock ($0.0001 par value, 20,320,561 shares authorized; 19,846,279
issued and outstanding at December 31, 2009) |
|
|
— |
|
|
|
12,082 |
|
Series AA convertible preferred stock ($0.0001 par value, 26,875,145 shares authorized, issued,
and outstanding at December 31, 2009) |
|
|
— |
|
|
|
11,819 |
|
|
|
|
|
|
|
|
Total convertible preferred stock |
|
|
— |
|
|
|
23,901 |
|
|
|
|
|
|
|
|
|
|
Stockholders’ equity (deficit): |
|
|
|
|
|
|
|
|
Preferred stock, $0.0001 par value, 10,000,000 authorized, none issued and outstanding at December
31, 2010;
none authorized, issued and outstanding at December 31, 2009 |
|
|
— |
|
|
|
— |
|
Common stock, $0.0001 par value, 300,000,000 shares authorized; 78,752,390 issued and outstanding at
December 31, 2010; 78,068,237 shares authorized; 16,629,146 issued and outstanding at December 31, 2009 |
|
|
8 |
|
|
|
2 |
|
Additional paid-in-capital |
|
|
157,928 |
|
|
|
5,743 |
|
Retained earnings (accumulated deficit) |
|
|
133 |
|
|
|
(13,383 |
) |
Accumulated other comprehensive income (loss) |
|
|
1,121 |
|
|
|
(1,465 |
) |
|
|
|
|
|
|
|
Total stockholders’ equity (deficit) |
|
|
159,190 |
|
|
|
(9,103 |
) |
|
|
|
|
|
|
|
|
|
|
|
|
|
|
|
|
Total liabilities, convertible preferred stock and stockholders’ equity (deficit) |
|
$ |
265,064 |
|
|
$ |
102,967 |
|
|
|
|
|
|
|
|
F-3
QLIK TECHNOLOGIES INC.
CONSOLIDATED STATEMENTS OF INCOME
(in thousands, except share and per share data)
| |
|
|
|
|
|
|
|
|
|
|
|
|
| |
|
Year Ended December 31, |
|
| |
|
2010 |
|
|
2009 |
|
|
2008 |
|
Revenue: |
|
|
|
|
|
|
|
|
|
|
|
|
License revenue |
|
$ |
145,225 |
|
|
$ |
99,864 |
|
|
$ |
74,446 |
|
Maintenance revenue |
|
|
59,846 |
|
|
|
41,390 |
|
|
|
29,401 |
|
Professional services revenue |
|
|
21,450 |
|
|
|
16,105 |
|
|
|
14,417 |
|
|
|
|
|
|
|
|
|
|
|
Total revenue |
|
|
226,521 |
|
|
|
157,359 |
|
|
|
118,264 |
|
|
|
|
|
|
|
|
|
|
|
|
|
|
Cost of revenue: |
|
|
|
|
|
|
|
|
|
|
|
|
License revenue |
|
|
3,670 |
|
|
|
3,663 |
|
|
|
3,071 |
|
Maintenance revenue |
|
|
3,998 |
|
|
|
1,635 |
|
|
|
1,365 |
|
Professional services revenue |
|
|
16,054 |
|
|
|
11,802 |
|
|
|
9,562 |
|
|
|
|
|
|
|
|
|
|
|
Total cost of revenue |
|
|
23,722 |
|
|
|
17,100 |
|
|
|
13,998 |
|
|
|
|
|
|
|
|
|
|
|
|
|
|
|
|
|
|
|
|
|
|
|
|
Gross profit |
|
|
202,799 |
|
|
|
140,259 |
|
|
|
104,266 |
|
|
|
|
|
|
|
|
|
|
|
|
|
|
Operating expenses: |
|
|
|
|
|
|
|
|
|
|
|
|
Sales and marketing |
|
|
122,394 |
|
|
|
93,349 |
|
|
|
74,267 |
|
Research and development |
|
|
13,537 |
|
|
|
8,735 |
|
|
|
8,258 |
|
General and administrative |
|
|
39,300 |
|
|
|
25,009 |
|
|
|
20,190 |
|
|
|
|
|
|
|
|
|
|
|
Total operating expenses |
|
|
175,231 |
|
|
|
127,093 |
|
|
|
102,715 |
|
|
|
|
|
|
|
|
|
|
|
|
|
|
|
|
|
|
|
|
|
|
|
|
Income from operations |
|
|
27,568 |
|
|
|
13,166 |
|
|
|
1,551 |
|
|
|
|
|
|
|
|
|
|
|
|
|
|
Other income (expense), net: |
|
|
|
|
|
|
|
|
|
|
|
|
Interest expense, net |
|
|
(488 |
) |
|
|
(941 |
) |
|
|
(361 |
) |
Change in fair value of warrants |
|
|
(1,962 |
) |
|
|
(1,953 |
) |
|
|
(463 |
) |
Foreign exchange gain (loss) and other
income (expense), net |
|
|
(4,404 |
) |
|
|
(1,635 |
) |
|
|
4,128 |
|
|
|
|
|
|
|
|
|
|
|
Total other income (expense), net |
|
|
(6,854 |
) |
|
|
(4,529 |
) |
|
|
3,304 |
|
|
|
|
|
|
|
|
|
|
|
|
|
|
|
|
|
|
|
|
|
|
|
|
Income before provision for income taxes |
|
|
20,714 |
|
|
|
8,637 |
|
|
|
4,855 |
|
Provision for income taxes |
|
|
(7,198 |
) |
|
|
(1,776 |
) |
|
|
(1,860 |
) |
|
|
|
|
|
|
|
|
|
|
|
|
|
|
|
|
|
|
|
|
|
|
|
Net income |
|
$ |
13,516 |
|
|
$ |
6,861 |
|
|
$ |
2,995 |
|
|
|
|
|
|
|
|
|
|
|
|
|
|
|
|
|
|
|
|
|
|
|
|
Net income per common share: |
|
|
|
|
|
|
|
|
|
|
|
|
Basic |
|
$ |
0.24 |
|
|
$ |
0.07 |
|
|
$ |
0.01 |
|
Diluted |
|
$ |
0.21 |
|
|
$ |
0.06 |
|
|
$ |
0.01 |
|
|
|
|
|
|
|
|
|
|
|
|
|
|
Weighted average number of common shares: |
|
|
|
|
|
|
|
|
|
|
|
|
Basic |
|
|
45,232,782 |
|
|
|
16,267,186 |
|
|
|
14,552,999 |
|
Diluted |
|
|
52,061,916 |
|
|
|
20,778,448 |
|
|
|
16,523,443 |
|
F-4
QLIK TECHNOLOGIES INC.
CONSOLIDATED STATEMENTS OF CONVERTIBLE PREFERRED STOCK AND STOCKHOLDERS’ EQUITY (DEFICIT)
(in thousands, except share data)
| |
|
|
|
|
|
|
|
|
|
|
|
|
|
|
|
|
|
|
|
|
|
|
|
|
|
|
|
|
|
|
|
|
|
|
|
|
|
|
|
|
| |
|
Convertible Preferred Stock |
|
|
Stockholders’ Equity (Deficit) |
|
| |
|
|
|
|
|
|
|
|
|
|
|
|
|
|
|
|
|
|
|
|
|
|
|
|
|
|
|
|
|
|
|
|
|
Accumulated Other |
|
|
|
|
| |
|
|
|
|
|
|
|
|
|
|
|
|
Additional Paid- |
|
|
|
|
|
|
Comprehensive |
|
|
|
|
| |
|
Series A Preferred |
|
|
Series AA Preferred |
|
|
Common |
|
|
in- |
|
|
Retained Earnings |
|
|
Income |
|
|
|
|
| |
|
Shares |
|
|
Amount |
|
|
Shares |
|
|
Amount |
|
|
Shares |
|
|
Amount |
|
|
Capital |
|
|
(Accumulated Deficit) |
|
|
(Loss) |
|
|
Total |
|
|
|
|
|
|
|
|
|
|
|
|
|
|
|
|
|
|
|
|
|
|
|
|
|
|
|
|
|
|
|
|
|
|
|
|
|
|
|
|
|
|
Balance at January 1, 2008 |
|
|
19,846,279 |
|
|
$ |
12,082 |
|
|
|
26,875,145 |
|
|
$ |
11,819 |
|
|
|
13,595,534 |
|
|
$ |
1 |
|
|
$ |
1,647 |
|
|
$ |
(23,239 |
) |
|
$ |
714 |
|
|
$ |
(20,877 |
) |
|
|
|
|
|
|
|
|
|
|
|
|
|
|
|
|
|
|
|
|
|
|
|
|
|
|
|
|
|
|
|
|
|
|
|
|
|
|
|
|
|
Exercise of stock options |
|
|
— |
|
|
|
— |
|
|
|
— |
|
|
|
— |
|
|
|
2,383,396 |
|
|
|
1 |
|
|
|
1,553 |
|
|
|
— |
|
|
|
— |
|
|
|
1,554 |
|
Stock-based compensation expense |
|
|
— |
|
|
|
— |
|
|
|
— |
|
|
|
— |
|
|
|
— |
|
|
|
— |
|
|
|
731 |
|
|
|
— |
|
|
|
— |
|
|
|
731 |
|
Payments for stock options |
|
|
— |
|
|
|
— |
|
|
|
— |
|
|
|
— |
|
|
|
— |
|
|
|
— |
|
|
|
83 |
|
|
|
— |
|
|
|
— |
|
|
|
83 |
|
Net income |
|
|
— |
|
|
|
— |
|
|
|
— |
|
|
|
— |
|
|
|
— |
|
|
|
— |
|
|
|
— |
|
|
|
2,995 |
|
|
|
— |
|
|
|
2,995 |
|
Foreign currency translation adjustment |
|
|
— |
|
|
|
— |
|
|
|
— |
|
|
|
— |
|
|
|
— |
|
|
|
— |
|
|
|
— |
|
|
|
— |
|
|
|
(1,854 |
) |
|
|
(1,854 |
) |
|
|
|
|
|
|
|
|
|
|
|
|
|
|
|
|
|
|
|
|
|
|
|
|
|
|
|
|
|
|
|
|
|
|
|
|
|
|
|
|
Comprehensive income |
|
|
— |
|
|
|
— |
|
|
|
— |
|
|
|
— |
|
|
|
— |
|
|
|
— |
|
|
|
— |
|
|
|
— |
|
|
|
— |
|
|
|
1,141 |
|
|
|
|
|
|
|
|
|
|
|
|
|
|
|
|
|
|
|
|
|
|
|
|
|
|
|
|
|
|
|
|
|
|
|
|
|
|
|
|
|
|
|
|
|
|
|
|
|
|
|
|
|
|
|
|
|
|
|
|
|
|
|
|
|
|
|
|
|
|
|
|
|
Balance at December 31, 2008 |
|
|
19,846,279 |
|
|
$ |
12,082 |
|
|
|
26,875,145 |
|
|
$ |
11,819 |
|
|
|
15,978,930 |
|
|
$ |
2 |
|
|
$ |
4,014 |
|
|
$ |
(20,244 |
) |
|
$ |
(1,140 |
) |
|
$ |
(17,368 |
) |
|
|
|
|
|
|
|
|
|
|
|
|
|
|
|
|
|
|
|
|
|
|
|
|
|
|
|
|
|
|
|
|
|
|
|
|
|
|
|
|
|
Exercise of stock options |
|
|
— |
|
|
|
— |
|
|
|
— |
|
|
|
— |
|
|
|
650,216 |
|
|
|
— |
|
|
|
513 |
|
|
|
— |
|
|
|
— |
|
|
|
513 |
|
Stock-based compensation expense |
|
|
— |
|
|
|
— |
|
|
|
— |
|
|
|
— |
|
|
|
— |
|
|
|
— |
|
|
|
1,479 |
|
|
|
— |
|
|
|
— |
|
|
|
1,479 |
|
Excess tax benefit from stock-based compensation |
|
|
— |
|
|
|
— |
|
|
|
— |
|
|
|
— |
|
|
|
— |
|
|
|
— |
|
|
|
53 |
|
|
|
— |
|
|
|
— |
|
|
|
53 |
|
Payments for stock options |
|
|
— |
|
|
|
— |
|
|
|
— |
|
|
|
— |
|
|
|
— |
|
|
|
— |
|
|
|
123 |
|
|
|
— |
|
|
|
— |
|
|
|
123 |
|
Repurchase of stock options |
|
|
— |
|
|
|
— |
|
|
|
— |
|
|
|
— |
|
|
|
— |
|
|
|
— |
|
|
|
(439 |
) |
|
|
— |
|
|
|
— |
|
|
|
(439 |
) |
Net income |
|
|
— |
|
|
|
— |
|
|
|
— |
|
|
|
— |
|
|
|
— |
|
|
|
— |
|
|
|
— |
|
|
|
6,861 |
|
|
|
— |
|
|
|
6,861 |
|
Foreign currency translation adjustment |
|
|
— |
|
|
|
— |
|
|
|
— |
|
|
|
— |
|
|
|
— |
|
|
|
— |
|
|
|
— |
|
|
|
— |
|
|
|
(325 |
) |
|
|
(325 |
) |
|
|
|
|
|
|
|
|
|
|
|
|
|
|
|
|
|
|
|
|
|
|
|
|
|
|
|
|
|
|
|
|
|
|
|
|
|
|
|
|
Comprehensive income |
|
|
— |
|
|
|
— |
|
|
|
— |
|
|
|
— |
|
|
|
— |
|
|
|
— |
|
|
|
— |
|
|
|
— |
|
|
|
— |
|
|
|
6,536 |
|
|
|
|
|
|
|
|
|
|
|
|
|
|
|
|
|
|
|
|
|
|
|
|
|
|
|
|
|
|
|
|
|
|
|
|
|
|
|
|
|
|
|
|
|
|
|
|
|
|
|
|
|
|
|
|
|
|
|
|
|
|
|
|
|
|
|
|
|
|
|
|
|
Balance at December 31, 2009 |
|
|
19,846,279 |
|
|
$ |
12,082 |
|
|
|
26,875,145 |
|
|
$ |
11,819 |
|
|
|
16,629,146 |
|
|
$ |
2 |
|
|
$ |
5,743 |
|
|
$ |
(13,383 |
) |
|
$ |
(1,465 |
) |
|
$ |
(9,103 |
) |
|
|
|
|
|
|
|
|
|
|
|
|
|
|
|
|
|
|
|
|
|
|
|
|
|
|
|
|
|
|
|
|
|
|
|
|
|
|
|
|
|
Proceeds from public offering, net of underwriters’ discount |
|
|
— |
|
|
|
— |
|
|
|
— |
|
|
|
— |
|
|
|
12,880,000 |
|
|
|
1 |
|
|
|
115,099 |
|
|
|
— |
|
|
|
— |
|
|
|
115,100 |
|
Conversion of preferred stock to common stock, net offering costs |
|
|
(19,846,279 |
) |
|
|
(12,082 |
) |
|
|
(26,875,145 |
) |
|
|
(11,819 |
) |
|
|
46,721,424 |
|
|
|
5 |
|
|
|
23,986 |
|
|
|
— |
|
|
|
— |
|
|
|
23,901 |
|
Warrant liability reclass |
|
|
— |
|
|
|
— |
|
|
|
— |
|
|
|
— |
|
|
|
— |
|
|
|
— |
|
|
|
6,403 |
|
|
|
— |
|
|
|
— |
|
|
|
6,403 |
|
Exercise of stock options |
|
|
— |
|
|
|
— |
|
|
|
— |
|
|
|
— |
|
|
|
1,840,034 |
|
|
|
— |
|
|
|
1,741 |
|
|
|
— |
|
|
|
— |
|
|
|
1,741 |
|
Exercise of common stock warrants |
|
|
— |
|
|
|
— |
|
|
|
— |
|
|
|
— |
|
|
|
561,786 |
|
|
|
— |
|
|
|
650 |
|
|
|
— |
|
|
|
— |
|
|
|
650 |
|
Stock-based compensation expense |
|
|
— |
|
|
|
— |
|
|
|
— |
|
|
|
— |
|
|
|
— |
|
|
|
— |
|
|
|
3,018 |
|
|
|
— |
|
|
|
— |
|
|
|
3,018 |
|
Excess tax benefit from stock-based compensation |
|
|
— |
|
|
|
— |
|
|
|
— |
|
|
|
— |
|
|
|
— |
|
|
|
— |
|
|
|
675 |
|
|
|
— |
|
|
|
— |
|
|
|
675 |
|
Payments for stock options |
|
|
— |
|
|
|
— |
|
|
|
— |
|
|
|
— |
|
|
|
— |
|
|
|
— |
|
|
|
81 |
|
|
|
— |
|
|
|
— |
|
|
|
81 |
|
Shares issued for acquisition |
|
|
— |
|
|
|
— |
|
|
|
— |
|
|
|
— |
|
|
|
120,000 |
|
|
|
— |
|
|
|
622 |
|
|
|
— |
|
|
|
— |
|
|
|
622 |
|
Net income |
|
|
— |
|
|
|
— |
|
|
|
— |
|
|
|
— |
|
|
|
— |
|
|
|
— |
|
|
|
— |
|
|
|
13,516 |
|
|
|
— |
|
|
|
13,516 |
|
Foreign currency translation adjustment |
|
|
— |
|
|
|
— |
|
|
|
— |
|
|
|
— |
|
|
|
— |
|
|
|
— |
|
|
|
— |
|
|
|
— |
|
|
|
2,586 |
|
|
|
2,586 |
|
|
|
|
|
|
|
|
|
|
|
|
|
|
|
|
|
|
|
|
|
|
|
|
|
|
|
|
|
|
|
|
|
|
|
|
|
|
|
|
|
Comprehensive income |
|
|
— |
|
|
|
— |
|
|
|
— |
|
|
|
— |
|
|
|
— |
|
|
|
— |
|
|
|
— |
|
|
|
— |
|
|
|
— |
|
|
|
16,102 |
|
|
|
|
|
|
|
|
|
|
|
|
|
|
|
|
|
|
|
|
|
|
|
|
|
|
|
|
|
|
|
|
|
|
|
|
|
|
|
|
|
|
|
|
|
|
|
|
|
|
|
|
|
|
|
|
|
|
|
|
|
|
|
|
|
|
|
|
|
|
|
|
|
Balance at December 31, 2010 |
|
|
— |
|
|
$ |
— |
|
|
|
— |
|
|
$ |
— |
|
|
|
78,752,390 |
|
|
$ |
8 |
|
|
$ |
157,928 |
|
|
$ |
133 |
|
|
$ |
1,121 |
|
|
$ |
159,190 |
|
|
|
|
|
|
|
|
|
|
|
|
|
|
|
|
|
|
|
|
|
|
|
|
|
|
|
|
|
|
|
|
F-5
QLIK TECHNOLOGIES INC.
CONSOLIDATED STATEMENTS OF CASH FLOWS
(in thousands)
| |
|
|
|
|
|
|
|
|
|
|
|
|
| |
|
Year Ended December 31, |
|
| |
|
2010 |
|
|
2009 |
|
|
2008 |
|
Cash flows from operating activities |
|
|
|
|
|
|
|
|
|
|
|
|
Net income |
|
$ |
13,516 |
|
|
$ |
6,861 |
|
|
$ |
2,995 |
|
Adjustments to reconcile net income to net cash provided by operating activities: |
|
|
|
|
|
|
|
|
|
|
|
|
Non-cash interest expense, including amortization of debt discount |
|
|
122 |
|
|
|
60 |
|
|
|
498 |
|
Depreciation and amortization |
|
|
1,713 |
|
|
|
1,108 |
|
|
|
793 |
|
Stock-based compensation expense |
|
|
3,018 |
|
|
|
1,479 |
|
|
|
731 |
|
Deferred income taxes |
|
|
443 |
|
|
|
(1,998 |
) |
|
|
866 |
|
Excess tax benefit from stock-based compensation |
|
|
(675 |
) |
|
|
(53 |
) |
|
|
— |
|
Provision for bad debts |
|
|
222 |
|
|
|
837 |
|
|
|
826 |
|
Change in fair value of warrants |
|
|
1,962 |
|
|
|
1,953 |
|
|
|
463 |
|
Unrealized foreign currency gain (loss), net |
|
|
2,816 |
|
|
|
(201 |
) |
|
|
(2,298 |
) |
Changes in assets and liabilities: |
|
|
|
|
|
|
|
|
|
|
|
|
Accounts receivable |
|
|
(22,176 |
) |
|
|
(20,692 |
) |
|
|
(13,118 |
) |
Prepaid expenses and other assets |
|
|
(3,201 |
) |
|
|
(101 |
) |
|
|
(1,970 |
) |
Other noncurrent assets |
|
|
(1,108 |
) |
|
|
(75 |
) |
|
|
(102 |
) |
Accounts payable |
|
|
271 |
|
|
|
298 |
|
|
|
1,275 |
|
Deferred revenue |
|
|
14,742 |
|
|
|
12,007 |
|
|
|
7,445 |
|
Accrued expenses and other liabilities |
|
|
14,194 |
|
|
|
11,553 |
|
|
|
4,227 |
|
|
|
|
|
|
|
|
|
|
|
Net cash provided by operating activities |
|
|
25,859 |
|
|
|
13,036 |
|
|
|
2,631 |
|
|
|
|
|
|
|
|
|
|
|
|
|
|
Cash flows from investing activities |
|
|
|
|
|
|
|
|
|
|
|
|
Acquisition, net of cash acquired |
|
|
194 |
|
|
|
— |
|
|
|
(442 |
) |
Purchase of property and equipment |
|
|
(2,677 |
) |
|
|
(2,128 |
) |
|
|
(1,716 |
) |
|
|
|
|
|
|
|
|
|
|
Net cash used in investing activities |
|
|
(2,483 |
) |
|
|
(2,128 |
) |
|
|
(2,158 |
) |
|
|
|
|
|
|
|
|
|
|
|
|
|
Cash flows from financing activities |
|
|
|
|
|
|
|
|
|
|
|
|
Proceeds from public offering, net of underwriters’ discount and
deferred offering costs |
|
|
115,100 |
|
|
|
— |
|
|
|
— |
|
Borrowings (payments) on line of credit, net |
|
|
(242 |
) |
|
|
229 |
|
|
|
(3,691 |
) |
Borrowings on long-term debt |
|
|
— |
|
|
|
— |
|
|
|
10,000 |
|
Payments on long-term debt |
|
|
(7,384 |
) |
|
|
(2,270 |
) |
|
|
(1,020 |
) |
Excess tax benefit on stock-based compensation |
|
|
675 |
|
|
|
53 |
|
|
|
— |
|
Proceeds from issuance (repurchase) of stock options |
|
|
81 |
|
|
|
(316 |
) |
|
|
83 |
|
Proceeds from exercise of common stock options |
|
|
1,741 |
|
|
|
513 |
|
|
|
1,554 |
|
Proceeds from exercise of common stock warrants |
|
|
650 |
|
|
|
— |
|
|
|
— |
|
|
|
|
|
|
|
|
|
|
|
Net cash provided by (used in) financing activities |
|
|
110,621 |
|
|
|
(1,791 |
) |
|
|
6,926 |
|
Effect of exchange rates on cash |
|
|
(137 |
) |
|
|
935 |
|
|
|
(1,813 |
) |
|
|
|
|
|
|
|
|
|
|
Net increase in cash and cash equivalents |
|
|
133,860 |
|
|
|
10,052 |
|
|
|
5,586 |
|
Cash and cash equivalents, beginning of period |
|
|
24,852 |
|
|
|
14,800 |
|
|
|
9,214 |
|
|
|
|
|
|
|
|
|
|
|
Cash and cash equivalents, end of period |
|
$ |
158,712 |
|
|
$ |
24,852 |
|
|
$ |
14,800 |
|
|
|
|
|
|
|
|
|
|
|
|
|
|
|
|
|
|
|
|
|
|
|
|
Supplemental cash flow information: |
|
|
|
|
|
|
|
|
|
|
|
|
Cash paid during the period for interest |
|
$ |
414 |
|
|
$ |
977 |
|
|
$ |
148 |
|
|
|
|
|
|
|
|
|
|
|
Cash paid during the period for income taxes |
|
$ |
1,500 |
|
|
$ |
822 |
|
|
$ |
670 |
|
|
|
|
|
|
|
|
|
|
|
Non-cash investing activities: |
|
|
|
|
|
|
|
|
|
|
|
|
Common stock issued for acquisition of business |
|
$ |
622 |
|
|
$ |
— |
|
|
$ |
1,492 |
|
|
|
|
|
|
|
|
|
|
|
F-6
QLIK TECHNOLOGIES INC.
NOTES TO CONSOLIDATED FINANCIAL STATEMENTS
(in thousands, except share and per share data)
(1) Description of Business
QlikTech International AB (“QlikTech Sweden”) was founded in Sweden in 1993. From 1993 until
1999, QlikTech Sweden’s activities were focused on software research and development that resulted
in the core technology for “QlikView”, software for business intelligence and data analysis. From
1999 until 2004, QlikTech Sweden focused on the commercialization of this technology primarily in
the Nordic market and limited regions of Europe. In 2004, Qlik Technologies Inc. (“QlikTech” or the
“Company”) was incorporated in Delaware, acquired all of the outstanding securities of QlikTech
Sweden and began to broaden these marketing and sales activities in the United States (“U.S.”) and
to continue this expansion in Europe. Through its wholly owned subsidiaries, the Company sells
software solutions that deliver fast, powerful, and affordable data analysis and reporting
solutions. QlikView is built upon techniques which offer greater flexibility for the user than
traditional business intelligence software.
(2) Significant Accounting Policies
Basis of Presentation and Consolidation
The accompanying consolidated financial statements include the accounts of the Company and its
wholly owned subsidiaries. All material intercompany balances and transactions have been
eliminated.
Use of Estimates
The preparation of consolidated financial statements in conformity with accounting principles
generally accepted in the U.S. (“U.S. GAAP”) requires management to make estimates and assumptions
that affect the reported amounts of assets and liabilities and disclosures of contingent assets and
liabilities at the date of the financial statements and the reported amounts of revenue and
expenses during the reporting period. Actual results could differ from those estimates.
On an ongoing basis, the Company evaluates its estimates, including those related to
the accounts receivable allowance, useful lives of long-lived assets, the recoverability of
goodwill and other intangible assets, the value of common stock through the completion of the
Company’s initial public offering (“IPO”), assumptions used for the purpose of determining
stock-based compensation, the value of common and preferred stock warrants through completion of
the IPO, and income taxes, among others. The Company bases its estimates on historical experience
and on various other assumptions that are believed to be reasonable, the results of which form the
basis for making judgments about the carrying value of assets and liabilities as well as reported
revenue and expenses during the periods presented.
Foreign Currency Translation
The financial statements of the Company’s foreign operations are measured using the local
currency as the functional currency. The local currency assets and liabilities are translated at
the rate of exchange to the U.S. dollar on the balance sheet date and the local currency revenues
and expenses are translated at average rates of exchange to the U.S. dollar during the reporting
periods. Foreign currency transaction gains (losses) have been reflected as a component of the
Company’s statements of operations and foreign currency translation gains (losses) have been
included as a component of accumulated other comprehensive income (loss). Gains and losses from
foreign currency transactions are included as a component of other income (expense), net.
Cash and Cash Equivalents
The Company considers all highly liquid investments having an original maturity of three
months or less when purchased to be cash equivalents. The Company maintains deposits with financial
institutions, the balances of which from time to time exceed the federally insured amount. These
balances could be impacted if the underlying financial depository institutions or the guarantors
fail or could be subject to adverse conditions in the financial markets.
Fair Value of Financial Instruments
The carrying amount of cash and cash equivalents, accounts receivable, other current assets,
and accounts payable approximate fair value, due to their short-term nature.
F-7
QLIK TECHNOLOGIES INC.
NOTES TO CONSOLIDATED FINANCIAL STATEMENTS
(in thousands, except share and per share data)
Accounts Receivable
The Company makes estimates regarding the collectability of accounts receivable. When the
Company evaluates the adequacy of its allowance for doubtful accounts, it considers multiple
factors, including historical write-off experience, the need for specific customer reserves, the
aging of receivables, customer creditworthiness, and changes in customer payment cycles.
Historically, the allowance for doubtful accounts
has been adequate based on actual results. If any of the factors used to calculate the
allowance for doubtful accounts change or if the allowance does not reflect the Company’s future
ability to collect outstanding receivables, additional provisions for doubtful accounts may be
needed, and future results of operations could be materially affected. Once the outstanding
receivable is determined to be uncollectible and all efforts at collections have been exhausted,
the outstanding receivable is written-off.
The following table summarizes the changes in the Company’s allowance for doubtful accounts
for the period indicated:
| |
|
|
|
|
|
|
|
|
|
|
|
|
| |
|
Year Ended December 31, |
|
| |
|
2010 |
|
|
2009 |
|
|
2008 |
|
|
|
|
|
|
|
|
|
|
|
|
|
|
Balance at the beginning of the
period |
|
$ |
1,171 |
|
|
$ |
868 |
|
|
$ |
285 |
|
Amounts to expense |
|
|
222 |
|
|
|
837 |
|
|
|
826 |
|
Accounts written off |
|
|
(586 |
) |
|
|
(534 |
) |
|
|
(243 |
) |
|
|
|
|
|
|
|
|
|
|
Balance at the end of the period |
|
$ |
807 |
|
|
$ |
1,171 |
|
|
$ |
868 |
|
|
|
|
|
|
|
|
|
|
|
Renaming of Common Stock
On June 29, 2010, the Company effected the renaming of its Series A common stock as common
stock. All common shares and per common share information referenced throughout these consolidated
financial statements have been retroactively adjusted to reflect such renaming.
Initial Public Offering
In July 2010, the Company completed its IPO of 12,880,000 shares of common stock at an
offering price of $10.00 per share, resulting in net proceeds to the Company of approximately
$115.1 million, after deducting underwriting discounts and
offering costs. Offering costs of $4.7 million have been recorded as
a reduction of the proceeds received in connection with the IPO in
July 2010. In connection with the
IPO, the Company’s then outstanding shares of convertible preferred stock were automatically
converted into an aggregate of 46,721,424 shares of common stock, and all then outstanding warrants
to purchase convertible preferred stock were converted into warrants to purchase an aggregate of
474,282 shares of common stock.
Concentration of Market Risk
The Company does not believe its business is substantially dependent on any particular
customer as no customer represented more than 2% of its revenue in 2010, 2009 or 2008. The
Company’s target markets are not confined to certain industries and geographies as we are focused
on providing a solution that generally meets the needs of all business users. As of December 31,
2010, the Company’s global partner network was comprised of more than 1,200 partners in over 100
countries. No individual partner represented more than 3% of the Company’s revenues in the fiscal
years ended December 31, 2010, 2009 or 2008.
Concentration of Credit Risk
The Company’s principal financial instruments subject to potential concentration of credit
risk are cash and cash equivalents and accounts receivable, which are unsecured. The Company’s cash
and cash equivalents are maintained at various financial institutions across different geographies.
Deposits held with banks may at times exceed the amount of insurance provided on such deposits.
Generally, these deposits may be redeemed upon demand and, therefore, management believes they bear
minimal risk. Concentration of credit risk with respect to trade accounts receivables is generally
limited by a large customer base and its geographic dispersion. The
Company believes it has a wide
customer base consisting of Fortune 500 corporations, universities, large international companies,
and other smaller businesses. As of and for the years ended December 31, 2010, 2009 and 2008, there
were no significant concentrations with respect to the Company’s consolidated revenue or accounts
receivable.
Property and Equipment
Property and equipment are recorded at cost. Depreciation is computed using the straight-line
method over estimated useful lives of the assets. The estimated useful lives are as follows: three
years for computers and equipment and five years for furniture and fixtures. Leasehold improvements
are amortized over the term of the lease.
Expenditures for major additions and improvements are capitalized, while minor replacements,
maintenance and repairs are charged to expense as incurred. When property is retired or otherwise
disposed of, the costs and accumulated depreciation are removed from the accounts. Any resulting
gain or loss is recognized concurrently.
F-8
QLIK TECHNOLOGIES INC.
NOTES TO CONSOLIDATED FINANCIAL STATEMENTS
(in thousands, except share and per share data)
Long-lived Assets
The Company considers whether indicators of impairment of long-lived assets, including
identified intangible assets, held for use are present. If such indicators are present, the Company
determines whether the sum of the estimated undiscounted future cash flows attributable to such
assets is less than their carrying amount, and if so, the Company recognizes an impairment loss
based on the excess of the carrying amount of the assets over their fair value. No circumstances or
events indicated impairment to long-lived assets as of December 31, 2010.
Business Combinations
The Company recognizes all of the assets acquired, liabilities assumed and contingent
consideration at their fair value on the acquisition date. The purchase price allocation process
requires management to make significant estimates and assumptions, especially at the acquisition
date with respect to intangible assets acquired, estimated contingent consideration payments and
pre-acquisition contingencies assumed. Unanticipated events and circumstances may occur which may
affect the accuracy or validity of such assumptions, estimates or actual results. Additionally,
any change in the fair value of the acquisition-related contingent consideration subsequent to the
acquisition date, including changes from events after the acquisition date, will be recognized in
earnings in the period of the estimated fair value change. All subsequent changes to a valuation
allowance or uncertain tax position relating to the acquired company that occur within the
measurement period and are based on facts and circumstances that existed at the acquisition date
are recognized as an adjustment to goodwill. All other changes in a valuation allowance or
uncertain tax positions are recognized as a reduction or increase to income tax expense.
Acquisition-related transaction costs, including legal and accounting fees and
other external costs directly related to the acquisition are recognized separately from the
acquisition and expensed as incurred in general and administrative expenses in the consolidated
statements of operations.
Goodwill and Other Intangible Assets
Goodwill represents the excess of the purchase price of an acquired business over the fair
value of the underlying net tangible and intangible assets acquired. The Company tests goodwill
resulting from acquisitions for impairment annually on October 1, or whenever events or changes in
circumstances indicate an impairment. If it is determined that an impairment has occurred, the
Company will record a write-down of the carrying value and charge the impairment as an operating
expense in the period the determination is made. Although the Company believes goodwill is
appropriately stated in the consolidated financial statements, changes in strategy or market
conditions could significantly impact these judgments and require an adjustment to the recorded
balance. There was no impairment during the years ended December 31,
2010, 2009 and 2008.
Intangible assets that are not considered to have an indefinite life are amortized over their
useful lives on a straight-line basis. On a periodic basis, the Company evaluates the estimated
remaining useful life of acquired intangible assets and whether events or changes in circumstances
warrant a revision to the remaining period of amortization. The carrying amounts of these assets
are periodically reviewed for impairment whenever events or changes in circumstances indicate that
the carrying value of these assets may not be recoverable. There was no impairment during the years ended December 31,
2010, 2009 and 2008.
Revenue Recognition
The Company derives its revenues from three sources: (i) license revenues; (ii) maintenance
revenues; and (iii) professional services. The majority of license revenue is from the sale of
perpetual licenses to customers or resellers. Maintenance, which generally has a contractual term
of 12 months, includes telephone and web-based support, software updates and rights to software
upgrades on a when-and-if-available basis. Professional services include training, implementation,
consulting, and expert services.
For each arrangement, the Company recognizes revenue when (a) persuasive evidence of an
arrangement exists (e.g. a signed contract or purchase order); (b) delivery of the product has
occurred and there are no remaining obligations or substantive customer acceptance provisions; (c)
the fee is fixed or determinable; and (d) collection of the fee is deemed reasonably assured.
Delivery is considered to have occurred upon electric transfer of the license key that provides
immediate availability of the product to the purchaser.
As substantially all of the Company’s software licenses are sold in multiple-element
arrangements that include either maintenance or both maintenance and professional services, the
Company uses the residual method to determine the amount of license revenue to be recognized. Under
the residual method, consideration is allocated to undelivered elements based upon vendor-specific
objective evidence (“VSOE”) of the fair value of those elements, with the residual of the
arrangement fee allocated to and recognized as license revenue. The Company has established VSOE of
the fair value of maintenance through independent maintenance renewals, which demonstrate a
consistent relationship of maintenance pricing as a percentage of the contractual license fee.
Maintenance revenue is deferred and recognized ratably over the contractual period of the
maintenance arrangement, which is generally 12 months. Arrangements that include other professional
services are evaluated to determine whether those services are essential to the functionality of
other elements of the arrangement. The Company has determined that these services are not
considered essential and the amounts allocated to the services are recognized as revenue when the
services are performed. The VSOE of fair value of the Company’s professional services is based on
the price for these same services when they are sold separately. Revenue for services that are sold
either on a stand-alone basis or included in multiple-element arrangements is recognized as the
services are performed.
F-9
QLIK TECHNOLOGIES INC.
NOTES TO CONSOLIDATED FINANCIAL STATEMENTS
(in thousands, except share and per share data)
For sales through resellers, the Company recognizes revenue upon the shipment of the product
only if those resellers provide the Company, at the time of placing their order, with the identity
of the end-user customer to whom the product has been sold. The Company’s resellers do not carry
inventory of its software. Sales through resellers are evidenced by a reseller agreement, together
with purchase orders on a transaction-by-transaction basis.
The Company also sells software licenses to original equipment manufacturers (“OEMs”) who
integrate the Company’s product for distribution with their applications. We do not offer any
rights to return products sold to resellers. The OEM’s end-user customer is licensed to use the
Company’s products solely in conjunction with the OEM’s application. In OEM arrangements, key
delivery is required as the basis for revenue recognition. However, depending upon the OEM
partner’s business model the Company recognizes revenue either up-front or over time in
subscription or royalty based models.
The Company offers a standard 30-day money back guarantee on license sales to its customers.
The Company considers its history of sales returns in determining the amount of sales return
allowance to be recorded. To date, sales returns have not been material in any period presented.
The Company records taxes collected on revenue-producing activities on a net basis.
Deferred Revenue
Deferred revenue consists of billings or payments received in advance of revenue recognition
from the Company’s maintenance agreements described above and is recognized as the revenue
recognition criteria are met. The Company generally invoices its customers in annual installments.
Accordingly, the deferred revenue balance does not represent the total contract value of annual
maintenance agreements.
Cost of License and Maintenance Revenue
Cost of license revenue is comprised of referral fees paid to third parties in connection with
software license sales.
Cost of maintenance revenue is primarily comprised of the costs associated with the customer
support and research and development personnel that provide maintenance and support services to the
Company’s customers.
Product Warranties
Substantially all of the Company’s software products are covered by a standard 90 day
warranty. In the event of a failure of software covered by this warranty, the Company must repair
or replace the software or, if those remedies are insufficient, provide a refund. To date, the
Company has not been required to record any reserve or revise any of the Company’s assumptions or
estimates used in determining its warranty allowance. If the historical data the Company uses to
calculate the adequacy of the warranty allowance is not indicative of future requirements, a
warranty reserve may be required.
Commissions
The Company records commission expense in the period in which the sale is made. Commission
expense is recorded for arrangements that consist solely of service in the period in which the
non-cancelable order for the services is received.
Research and Development
Software development costs are expensed as incurred until technological feasibility has been
established, at which time such costs are capitalized to the extent that the capitalizable costs do
not exceed the realizable value of such costs, until the product is available for general release
to customers. Based on the Company’s product development process, technological feasibility is
established upon the completion of a working model of the software product that has been tested to
be consistent with the product design specifications and that is free of any uncertainties related
to high-risk development issues. Costs incurred by the Company between completion of the working
model and the point at which the product is ready for general release have been insignificant.
Accordingly, the Company has charged all such costs to research and development expense in the
accompanying statements of income.
Advertising
Advertising costs are charged to operations as incurred and include direct marketing, events,
public relations, sales collateral materials and partner programs. Advertising expense was
approximately $15.3 million, $15.1 million, and $11.9 million for the years ended December 31,
2010, 2009 and 2008, respectively.
F-10
QLIK
TECHNOLOGIES INC.
NOTES TO CONSOLIDATED FINANCIAL STATEMENTS
(in thousands, except share and per share data)
Income Taxes
Deferred tax assets and liabilities are recognized for the future tax consequences
attributable to differences between the financial statement carrying amounts of existing assets and
liabilities and their respective tax bases and operating loss and tax credit carry forwards. These
deferred
tax assets and liabilities are measured using enacted tax rates expected to be applied to
taxable income in the years in which those temporary differences are expected to be reversed or
utilized. The effect on deferred tax assets and liabilities of a change in tax rates is recognized
in income in the period that includes the enactment date. Deferred tax assets are reduced by a
valuation allowance when, in the opinion of management, it is more likely than not that some
portion or all of the deferred tax assets will not be realized.
The Company uses a more-likely-than-not recognition threshold based on the technical merits of
tax positions taken. Tax positions that meet the more-likely-than-not recognition threshold are
measured as the largest amount of the tax benefits, determined on a cumulative probability basis,
which is more likely than not to be realized upon ultimate settlement in the financial statements.
The Company recognizes interest and penalties related to income tax matters in its provision for income
taxes.
Comprehensive Income
The Company classifies items of other comprehensive income separately within stockholders’
equity (deficit). For the years ended December 31, 2010, 2009 and 2008, comprehensive income was:
| |
|
|
|
|
|
|
|
|
|
|
|
|
| |
|
Year Ended December 31, |
|
| |
|
2010 |
|
|
2009 |
|
|
2008 |
|
|
|
|
|
|
|
|
|
|
|
|
|
|
Net income |
|
$ |
13,516 |
|
|
$ |
6,861 |
|
|
$ |
2,995 |
|
Foreign currency translation gain
(loss) |
|
|
2,586 |
|
|
|
(325 |
) |
|
|
(1,854 |
) |
|
|
|
|
|
|
|
|
|
|
Comprehensive income |
|
$ |
16,102 |
|
|
$ |
6,536 |
|
|
$ |
1,141 |
|
|
|
|
|
|
|
|
|
|
|
Stock-Based Compensation
The Company recognizes the cost of stock-based compensation based on the fair value of those
awards at the date of grant over the requisite service period. The Company uses the
Black-Scholes-Merton (“Black-Scholes”) option pricing model to determine the fair value of
stock-based compensation awards. Stock-based compensation plans, related expenses and assumptions
used in the Black-Scholes option pricing model are more fully described in Note 12 to these
consolidated financial statements. The estimated fair value of stock-based compensation awards on
the date of grant is amortized on a straight-line basis over the requisite service period.
Stock-based compensation expense is recorded within cost of revenue, sales and marketing, research
and development, and general and administrative expenses.
The following table sets forth the total stock-based compensation expense included in the
consolidated statements of operations for the years ended December 31, 2010, 2009, and 2008:
| |
|
|
|
|
|
|
|
|
|
|
|
|
| |
|
Year Ended December 31, |
|
| |
|
2010 |
|
|
2009 |
|
|
2008 |
|
|
|
|
|
|
|
|
|
|
|
|
|
|
Cost of revenue |
|
$ |
188 |
|
|
$ |
82 |
|
|
$ |
39 |
|
Sales and marketing |
|
|
1,572 |
|
|
|
733 |
|
|
|
285 |
|
Research and development |
|
|
96 |
|
|
|
79 |
|
|
|
19 |
|
General and administrative |
|
|
1,162 |
|
|
|
585 |
|
|
|
388 |
|
|
|
|
|
|
|
|
|
|
|
|
|
$ |
3,018 |
|
|
$ |
1,479 |
|
|
$ |
731 |
|
|
|
|
|
|
|
|
|
|
|
Net Income Attributable to Common Shares
Prior to completion of its IPO, the Company used the two-class method to compute net income
per common share because the Company previously issued securities, other than common stock, that
contractually entitled the holders to participate in dividends and earnings of the Company. All
common shares and per common share information referenced throughout these audited consolidated
financial statements have been retroactively adjusted to reflect such renaming. The two class
method required earnings available to common stockholders for the period, after an allocation of
earnings to participating securities, to be allocated between common and participating securities
based upon their respective rights to receive distributed and undistributed earnings. The Company’s
Series A and Series AA preferred stock were each entitled to receive annual non-cumulative
dividends of $0.0504 per share, payable prior and in preference to the holders of Series A common
stock (hereinafter referred to as “Common Stock”) when and if declared by the Board. In the event a
dividend was to be paid on Common Stock, holders of Series A and Series AA preferred stock were
entitled to a proportionate share of any such dividend as if they were holders of common shares (on
an as-if converted basis).
F-11
QLIK TECHNOLOGIES INC.
NOTES TO CONSOLIDATED FINANCIAL STATEMENTS
(in thousands, except share and per share data)
The following table sets forth the computation of basic and diluted net income per share for
the periods indicated:
| |
|
|
|
|
|
|
|
|
|
|
|
|
| |
|
Year Ended December 31, |
|
| |
|
2010 |
|
|
2009 |
|
|
2008 |
|
|
|
|
|
|
|
|
|
|
|
|
|
|
Basic net income per common share calculation: |
|
|
|
|
|
|
|
|
|
|
|
|
Net income |
|
$ |
13,516 |
|
|
$ |
6,861 |
|
|
$ |
2,995 |
|
Less: Undistributed earnings allocated to participating
securities |
|
|
(2,644 |
) |
|
|
(5,697 |
) |
|
|
(2,843 |
) |
|
|
|
|
|
|
|
|
|
|
Net income attributable to common shares |
|
|
10,872 |
|
|
|
1,164 |
|
|
|
152 |
|
Weighted average common shares outstanding |
|
|
45,232,782 |
|
|
|
16,267,186 |
|
|
|
14,552,999 |
|
|
|
|
|
|
|
|
|
|
|
Basic net income per share |
|
$ |
0.24 |
|
|
$ |
0.07 |
|
|
$ |
0.01 |
|
|
|
|
|
|
|
|
|
|
|
|
|
|
|
|
|
|
|
|
|
|
|
|
Diluted net income per common share calculation: |
|
|
|
|
|
|
|
|
|
|
|
|
Net income |
|
$ |
13,516 |
|
|
$ |
6,861 |
|
|
$ |
2,995 |
|
Less: Undistributed earnings allocated to participating
securities |
|
|
(2,644 |
) |
|
|
(5,697 |
) |
|
|
(2,843 |
) |
|
|
|
|
|
|
|
|
|
|
Net income attributable to common shares — diluted |
|
|
10,872 |
|
|
|
1,164 |
|
|
|
152 |
|
Weighted average shares used to compute basic net income
per share |
|
|
45,232,782 |
|
|
|
16,267,186 |
|
|
|
14,552,999 |
|
Effect of potentially dilutive securities: |
|
|
|
|
|
|
|
|
|
|
|
|
Common stock options and restricted stock units |
|
|
6,829,134 |
|
|
|
4,511,262 |
|
|
|
1,970,444 |
|
|
|
|
|
|
|
|
|
|
|
Weighted average shares used to compute diluted net income
per share |
|
|
52,061,916 |
|
|
|
20,778,448 |
|
|
|
16,523,443 |
|
|
|
|
|
|
|
|
|
|
|
Diluted net income per share |
|
$ |
0.21 |
|
|
$ |
0.06 |
|
|
$ |
0.01 |
|
|
|
|
|
|
|
|
|
|
|
Diluted net income per share for the periods presented does not reflect the following
potential common shares as the effect would be anti-dilutive:
| |
|
|
|
|
|
|
|
|
|
|
|
|
| |
|
Year Ended December 31, |
|
| |
|
2010 |
|
|
2009 |
|
|
2008 |
|
|
|
|
|
|
|
|
|
|
|
|
|
|
Common stock options |
|
|
614,900 |
|
|
|
1,104,552 |
|
|
|
1,046,475 |
|
Restricted stock units |
|
|
3,320 |
|
|
|
— |
|
|
|
— |
|
Warrants |
|
|
— |
|
|
|
474,282 |
|
|
|
474,282 |
|
|
|
|
|
|
|
|
|
|
|
|
|
|
618,220 |
|
|
|
1,578,834 |
|
|
|
1,520,757 |
|
|
|
|
|
|
|
|
|
|
|
Recent Accounting Pronouncements
In January 2010, the Financial Accounting Standards Board (“FASB”) issued updated guidance
related to fair value measurements and disclosures, which requires a reporting entity to disclose
separately the amounts of significant transfers in and out of Level 1 and Level 2 fair value
measurements and to describe the reasons for the transfers. In addition, in the reconciliation for
fair value measurements using significant unobservable inputs, or Level 3, a reporting entity
should disclose separately information about purchases, sales, issuances, and settlements (that is,
on a gross basis rather than on a net basis). The updated guidance also requires that an entity
should provide fair value measurement disclosures for each class of assets and liabilities and
disclosures about the valuation techniques and inputs used to measure fair value for both recurring
and non-recurring fair value measurements for Level 2 and Level 3 fair value measurements. The
updated guidance is effective for interim or annual financial reporting periods beginning after
December 15, 2009, except for the disclosures about purchases, sales, issuances, and settlements in
the rollforward activity in Level 3 fair value measurements, which are effective for fiscal years
beginning after December 15, 2010 and for interim periods within those fiscal years. The Company
adopted the updated guidance in the first quarter of 2010, and the impact on the consolidated
financial statements was not material.
(3) Acquisitions
On January 1, 2008, the Company acquired the operations and tangible assets related to
QlikView of PC Business Intelligence, S.L. (“PCB”), a referral partner in Madrid, Spain. The
acquisition is part of the Company’s strategy to establish a local presence in key markets and
further develop the direct sales and reseller networks. The Company paid consideration of $1.9
million, which includes $0.4 million in cash and $1.5 million in a warrant to purchase shares of
the Company’s Common Stock. The acquisition was accounted for under the purchase method of
accounting. The assets acquired and liabilities assumed were recorded at their fair values as of
January 1, 2008. Of the total estimated purchase price, approximately $0.6 million has been
allocated to finite lived intangible assets acquired, which consist principally of the value
assigned to PCB’s customer relationships, and approximately $1.3 million has been allocated to
goodwill, none of which is tax deductible.
F-12
QLIK TECHNOLOGIES INC.
NOTES TO CONSOLIDATED FINANCIAL STATEMENTS
(in thousands, except share and per share data)
In connection with this acquisition, PCB was granted a warrant (“PCB warrant”) to purchase
93,981 shares of the Company’s Common Stock at a purchase price of $1.65 per share. Because the IPO
did not occur on or before February 1, 2010, PCB had the right (“Put Right”) to exercise the PCB
warrant and on or before December 31, 2010 require the Company to purchase the shares acquired upon
exercise for an aggregate purchase price, not to exceed €1.8 million, equal to 50% of the Gross
Sales (as defined in the purchase agreement related to the PCB warrant) of QlikTech Iberica S.L.
(the Company’s Spanish subsidiary) during the fiscal year ended December 31, 2009 (“Put Right
Purchase Price”). The estimated fair value of the PCB warrant of $1.5 million was recorded as
purchase price on the date of the PCB acquisition. Subsequent changes in the fair value of the
warrant were recorded as a component of other income (expense) in the accompanying consolidated
statement of income. As of December 31, 2009, the fair value of the PCB warrant of $2.4 million was
classified in current liabilities as the warrant holder had the ability to exercise the Put Right
by December 31, 2010.
On November 4, 2010, the holder exercised the PCB warrant in full for cash. Upon the exercise
of the PCB warrant for cash, the 93,981 shares held by PCB became subject to the same put right
described above. The estimated fair value of the shares subject to the Put Right (“PCB Shares”) of
$2.4 million was reclassified from current liabilities to temporary equity on November 4, 2010. The
PCB Shares are required to be marked to their redemption amount at the end of each reporting
period, with changed recorded as a component of stockholders’ equity. The change in the value of
the PCB Shares from the November 4, 2010 fair value through the December 31, 2010 redemption amount
was de minimis. On December 31, 2010, the Put Right underlying the PCB Shares expired unexercised.
Accordingly, as the PCB Shares are no longer subject to a Put Right, the Company has reclassified
the PCB Shares from temporary to permanent equity as of December 31, 2010. Refer to Note 5 for fair
value measurement considerations.
On January 22, 2010, the Company completed its acquisition of Syllogic Corporation
(“Syllogic”) for total consideration of $1.1 million. The purchase price consisted of 120,000
shares of common stock valued at $0.6 million and contingent cash consideration of $0.5 million,
which is estimated to be paid out over a four year period. The total maximum contingent cash
consideration that could be paid pursuant to the agreement is $0.8 million. The Company paid $0.1
million through December 31, 2010, based on achievement of certain financial targets.
Syllogic was a reseller of the Company’s QlikView product in Japan. The Company believes the
acquisition of Syllogic gives it a direct sales presence in the country of Japan and access to the
Japanese market.
The acquisition was accounted for under the purchase method of accounting. Assets acquired and
liabilities assumed were recorded at their carrying values as of January 22, 2010, and were
determined to approximate fair value. Included in liabilities assumed were $0.5 million of notes
payable which were paid off during the quarter ended March 31, 2010. The total preliminary purchase
price was $1.1 million, excluding the estimated acquisition related transaction costs of
approximately $0.2 million. Acquisition-related transaction costs include legal and accounting fees
directly related to the acquisition.
Purchase Price Allocation
Under the acquisition method of accounting, the total estimated purchase price was allocated
to Syllogic’s net tangible liabilities and intangible assets based on their estimated fair values
as of January 22, 2010. The excess of the purchase price over the net tangible liabilities and
identifiable intangible assets was recorded as goodwill. The purchase price is allocated as
follows:
| |
|
|
|
|
|
Cash and cash equivalents |
|
$ |
194 |
|
Other current assets |
|
|
747 |
|
Liabilities, including notes payable |
|
|
(1,421 |
) |
|
|
|
|
|
|
|
|
|
Net tangible liabilities acquired |
|
|
(435 |
) |
Finite-lived intangible assets acquired |
|
|
185 |
|
Goodwill |
|
|
1,357 |
|
|
|
|
|
Total purchase price |
|
$ |
1,107 |
|
|
|
|
|
Finite-lived intangible assets consist of the value assigned to Syllogic’s customer
relationships of $0.1 million and trademarks of $0.1 million.
The value assigned to Syllogic’s customer relationships was determined by discounting the
estimated cash flows associated with the existing customers as of the date the acquisition of
Syllogic was consummated taking into consideration estimated attrition of the existing customer
base. The Company amortizes the value of Syllogic’s customer relationships on a straight-line basis
over five years. Amortization of customer relationships is not deductible for tax purposes.
The value assigned to Syllogic’s trademark was determined by utilizing the Relief from Royalty
Method. The royalty rates used to value the trademarks were based on estimates of prevailing
royalty rates paid for the use of similar trade names and trademarks in market transactions
involving license arrangements of companies that operate in the computer software industry. The
Company amortizes the trademarks on a straight-line basis over three years. Amortization of
trademarks is not deductible for tax purposes.
F-13
QLIK TECHNOLOGIES INC.
NOTES TO CONSOLIDATED FINANCIAL STATEMENTS
(in thousands, except share and per share data)
Included in other current assets is $0.1 million of deferred tax assets related to Syllogic
loss carry forwards that are available to be used to offset future income.
Of the total estimated purchase price, approximately $1.4 million has been allocated to
goodwill and is not deductible for tax purposes. Goodwill represents factors including expected
synergies from combining operations and is the excess of the purchase price of an acquired business
over the fair value of the net tangible and intangible assets acquired.
(4) Goodwill and Other Intangible Assets
The following table provides a rollforward of the Company’s goodwill activity:
| |
|
|
|
|
|
|
|
|
| |
|
2010 |
|
|
2009 |
|
|
|
|
|
|
|
|
Balance at January 1 |
|
$ |
1,308 |
|
|
$ |
1,268 |
|
Syllogic acquisition |
|
|
1,357 |
|
|
|
— |
|
Impact of foreign currency translation |
|
|
81 |
|
|
|
40 |
|
|
|
|
|
|
|
|
Balance at December 31 |
|
$ |
2,746 |
|
|
$ |
1,308 |
|
|
|
|
|
|
|
|
The following table provides information regarding the Company’s intangible assets
subject to amortization:
| |
|
|
|
|
|
|
|
|
|
|
|
|
|
|
|
|
|
|
|
|
|
|
|
|
| |
|
December 31, 2010 |
|
|
December 31, 2009 |
|
| |
|
Gross |
|
|
Accumulated |
|
|
Net |
|
|
Gross |
|
|
Accumulated |
|
|
Net |
|
| |
|
Amount |
|
|
Amortization |
|
|
Amount |
|
|
Amount |
|
|
Amortization |
|
|
Amount |
|
|
|
|
|
|
|
|
|
|
|
|
|
|
|
|
|
|
|
|
|
|
|
|
|
|
Purchased technology |
|
$ |
200 |
|
|
$ |
(160 |
) |
|
$ |
40 |
|
|
$ |
189 |
|
|
$ |
(114 |
) |
|
$ |
75 |
|
Customer relationships and
other identified
intangible assets |
|
|
735 |
|
|
|
(387 |
) |
|
|
348 |
|
|
|
571 |
|
|
|
(229 |
) |
|
|
342 |
|
|
|
|
|
|
|
|
|
|
|
|
|
|
|
|
|
|
|
|
|
|
|
|
|
|
|
|
|
|
|
|
|
|
|
|
|
|
|
|
|
|
|
|
|
Total |
|
$ |
935 |
|
|
$ |
(547 |
) |
|
$ |
388 |
|
|
$ |
760 |
|
|
$ |
(343 |
) |
|
$ |
417 |
|
|
|
|
|
|
|
|
|
|
|
|
|
|
|
|
|
|
|
|
The cost of finite-lived intangible assets is amortized on a straight-line basis over
their estimated useful lives of five years. Amortization of intangible assets was $0.2 million,
$0.2 million, and $0.1 million for the years ended December 31, 2010, 2009 and 2008, respectively.
The estimated aggregate amortization expense for each of the succeeding years is as follows: $0.2
million in 2011 and $0.2 million in 2012.
(5) Fair Value Measurements
Fair value is defined as the price that would be received from selling an asset or paid to
transfer a liability in an orderly transaction between market participants at the measurement date.
When determining the fair value measurements for assets and liabilities required or permitted to be
recorded at fair value, the Company considers the principal or most advantageous market in which it
would transact and it considers assumptions that market participants would use when pricing the
asset or liability. The Company evaluates the fair value of certain assets and liabilities using
the following fair value hierarchy which ranks the quality and reliability of inputs, or
assumptions, used in the determination of fair value:
| |
• |
|
Level 1 — quoted prices in active markets for identical assets and liabilities |
| |
• |
|
Level 2 — inputs other than Level 1 quoted prices that are directly or indirectly
observable |
| |
• |
|
Level 3 — unobservable inputs that are not corroborated by market data |
F-14
QLIK TECHNOLOGIES INC.
NOTES TO CONSOLIDATED FINANCIAL STATEMENTS
(in thousands, except share and per share data)
The Company evaluates assets and liabilities subject to fair value measurements on a recurring
and nonrecurring basis to determine the appropriate level to classify them for each reporting
period. This determination requires significant judgments to be made by the Company. The following
table sets forth the Company’s assets and liabilities that were measured at fair value as of
December 31, 2010 and 2009, by level within the fair value hierarchy:
| |
|
|
|
|
|
|
|
|
|
|
|
|
|
|
|
|
| |
|
Amounts at |
|
|
Fair Value Measurement Using |
|
| |
|
Fair Value |
|
|
Level 1 |
|
|
Level 2 |
|
|
Level 3 |
|
As of December 31, 2010 |
|
|
|
|
|
|
|
|
|
|
|
|
|
|
|
|
Assets |
|
|
|
|
|
|
|
|
|
|
|
|
|
|
|
|
Cash and cash
equivalents |
|
$ |
158,712 |
|
|
$ |
158,712 |
|
|
$ |
— |
|
|
$ |
— |
|
|
|
|
|
|
|
|
|
|
|
|
|
|
|
|
|
|
As of December 31, 2009 |
|
|
|
|
|
|
|
|
|
|
|
|
|
|
|
|
Assets |
|
|
|
|
|
|
|
|
|
|
|
|
|
|
|
|
Cash and cash
equivalents |
|
$ |
24,852 |
|
|
$ |
24,852 |
|
|
$ |
— |
|
|
$ |
— |
|
Liabilities |
|
|
|
|
|
|
|
|
|
|
|
|
|
|
|
|
Stock warrant liability |
|
$ |
4,637 |
|
|
$ |
— |
|
|
$ |
— |
|
|
$ |
4,637 |
|
Assets and liabilities that are measured at fair value on a non-recurring basis include
intangible assets and goodwill. These items are recognized at fair value when they are considered
to be impaired. During the year ended December 31, 2010 and 2009, there were no fair value
adjustments for assets and liabilities measured on a non-recurring basis.
In March 2006, in connection with the Company’s note payable, the Company granted a warrant
(“ETV warrant”) to ETV Capital S.A. to purchase 260,082 shares of the Company’s Series A preferred
stock at $0.6298 per share. The value of the ETV warrant at the date of grant of $0.1 million was
recorded as a warrant liability with the offset to debt discount. The debt discount was amortized
to interest expense over the term of the note payable. In November 2010, ETV Capital exercised the
ETV warrant and received 253,605 shares of common stock in a net share settlement.
In
January 2008, the Company granted a warrant to PCB to purchase 93,981 shares of the
Company’s Common Stock, in connection with a business acquisition (See Note 3). In November 2010,
the holder exercised the PCB warrant in full for cash.
In June 2008, in connection with the Company’s note payable, the Company granted a warrant
(“Industrifonden warrant”) to Stiftelsen Industrifonden (“Industrifonden”) to purchase 214,200
shares of the Company’s Series A preferred stock at $2.31 per share (See Note 7). The value of the
Industrifonden warrant at the grant date was $0.2 million and was recorded as a warrant liability,
with the offset to debt discount. The debt discount was amortized to interest expense over the term
of the note payable. In December 2010, the holder exercised the Industrifonden warrant in cash.
The ETV warrant and Industrifonden warrant were classified as liabilities on the accompanying
balance sheet as of December 31, 2009 as the warrant entitled the holder to purchase preferred
stock which was considered contingently redeemable. The PCB warrant was classified as warrant
liability as this warrant contained a put feature that could have been settled in cash.
The fair value of the stock warrant liability was based on Level 3 inputs. For this liability,
the Company developed its own assumptions that do not have observable inputs or available market
data to support the fair value.
The Company estimated the fair value of the warrant to purchase 93,981 shares of the Company’s
common stock at a purchase price of $1.65 per share held by PC Business Intelligence, S.L. by
utilizing a fair value methodology which incorporated both the Black Scholes pricing model, as well
as the probability of an IPO occurring by February 1, 2010, estimated of the level of Gross Sales
(as defined in the purchase agreement related to the PCB Warrant) of a subsidiary of the Company
for 2009, and an estimated discount rate. These warrants were exercised in November 2010 into
93,981 shares of common stock. The put right was not exercised and expired at December 31, 2010.
The Company estimated the fair value of its preferred stock warrant liability by utilizing a
Black Scholes based option pricing model, which considered the estimated fair value of these
preferred stock warrants in both an IPO scenario (“IPO scenario”), in which the warrants have
attributes of common stock warrants, and a merger and acquisition scenario (“M&A scenario”), in
which the warrants have attributes of preferred stock warrants. In the IPO scenario, the inputs in
the Black Scholes model included an expected term equal to the remaining contractual life of the
warrant, a risk free rate commensurate with the remaining term of the warrant, volatility of
comparable companies for a period consistent with the expected term, and a dividend yield of 0% as
the Company has never paid dividends. In the M&A scenario, the Company’s Black Scholes model
included an expected term commensurate with the estimated timing of a liquidity event, a risk free
rate commensurate with the expected term, volatility of comparable companies for a period
consistent with the expected term, and a dividend yield of 0%. The estimates of the fair value of
preferred stock warrants required a significant amount of judgment. In connection with the
Company’s IPO, all then outstanding shares of convertible preferred stock were automatically
converted into shares of common stock. As a result of this conversion, the then outstanding
warrants to purchase convertible preferred stock were converted into warrants to purchase 474,282
shares of common stock which are no longer considered to be contingently redeemable. Accordingly,
these warrants were reclassified to additional paid-in capital in July 2010 in connection with the
Company’s IPO.
F-15
QLIK TECHNOLOGIES INC.
NOTES TO CONSOLIDATED FINANCIAL STATEMENTS
(in thousands, except share and per share data)
The reconciliation of the stock warrant liability measured at fair value on a recurring basis
using significant unobservable inputs (Level 3) is as follows:
| |
|
|
|
|
|
|
|
|
| |
|
2010 |
|
|
2009 |
|
|
|
|
|
|
|
|
|
|
Balance at January 1 |
|
$ |
4,637 |
|
|
$ |
2,684 |
|
Impact of foreign currency translation (1) |
|
|
(196 |
) |
|
|
— |
|
Change in fair value of warrant liability (2) |
|
|
1,962 |
|
|
|
1,953 |
|
Reclass of warrant liability to additional
paid-in capital |
|
|
(6,403 |
) |
|
|
— |
|
|
|
|
|
|
|
|
Balance at December 31 |
|
$ |
— |
|
|
$ |
4,637 |
|
|
|
|
|
|
|
|
As reported in balance sheet: |
|
|
|
|
|
|
|
|
Current |
|
$ |
— |
|
|
$ |
2,425 |
|
Non-current |
|
$ |
— |
|
|
$ |
2,212 |
|
| |
|
|
| (1) |
|
The impact of foreign currency translation is shown in other comprehensive income. |
| |
| (2) |
|
The change in fair value of warrant liability is included in other income (expense),
net in the Consolidated Statement of Income. |
(6) Property and Equipment, net
The following is a summary of property and equipment, net:
| |
|
|
|
|
|
|
|
|
| |
|
December 31, |
|
| |
|
2010 |
|
|
2009 |
|
|
|
|
|
|
|
|
|
|
Computers and equipment |
|
$ |
4,741 |
|
|
$ |
3,061 |
|
Furniture and fixtures |
|
|
1,926 |
|
|
|
1,998 |
|
Leasehold improvements |
|
|
1,425 |
|
|
|
506 |
|
|
|
|
|
|
|
|
|
|
|
8,092 |
|
|
|
5,565 |
|
Less accumulated depreciation |
|
|
(3,693 |
) |
|
|
(2,321 |
) |
|
|
|
|
|
|
|
|
|
$ |
4,399 |
|
|
$ |
3,244 |
|
|
|
|
|
|
|
|
Depreciation and amortization expense totaled $1.5 million, $0.9 million, and $0.7
million for the years ended December 31, 2010, 2009 and 2008, respectively.
(7) Long-Term Debt
Line of Credit
During 2009 and 2010, a wholly owned subsidiary of the Company in Sweden had an agreement with
a bank in Sweden from which it could borrow up to a maximum of 60 million Swedish kronor (“SEK”)
(approximately $8.4 million based on the December 31, 2009
exchange rate of approximately 0.14). At December
31, 2009, the amount outstanding was $0.2 million. The maximum borrowing was collateralized by the
subsidiary’s total assets. The terms of this agreement required payment of an unused credit line
fee equal to 0.5% of the unused portion and a variable interest rate equivalent to the Swedish
Riksbank Repo Rate (0.25% at December 31, 2009) plus 1.75% of the outstanding balance. The line of
credit expired on September 30, 2010.
Long-term Debt
On
June 16, 2008, the Company entered into a 60.0 million SEK note payable to Stiftelsen Industrifonden,
a stockholder of the Company, which bore interest at a fixed 10% rate per annum through March 2012.
The loan agreement stipulated that interest accrued between the loan initiation and first scheduled
payment on June 30, 2009 will be capitalized and added to the principal
amount of the loan. The total principal as of June 30, 2009 (approximately 66.2 million SEK) would be paid off in 12 equal quarterly
payments, including accrued interest. Borrowings under the loan were collateralized by shares of
the Company’s wholly owned Swedish subsidiary. As the note payable was denominated in SEK, the
impact of exchange rate changes on the principal and interest of the note were recorded as
gain/(loss) in the consolidated statement of income. The gain/(loss) recorded during the years
ended December 31, 2010 and 2009 are $0.5 million and ($0.8) million, respectively.
As of December 31, 2009, the Company owed $6.9 million on this note payable, of which $3.0
million was classified as current portion of long-term debt and $3.8 million classified as
long-term debt. In addition, there was $0.1 million of unaccreted discount as of December 31, 2009.
On July 27, 2010, the Company paid in full the outstanding principal, accrued interest, and a
prepayment fee on the note payable. The note payable had an outstanding principal balance of 38.6
million Swedish kronor (approximately $5.3 million based on the current exchange rate of
approximately 0.14). In addition, the accrued interest and prepayment penalty amounted to 0.5
million Swedish kronor (approximately $0.1 million based on the current exchange rate of
approximately 0.14).
F-16
QLIK TECHNOLOGIES INC.
NOTES TO CONSOLIDATED FINANCIAL STATEMENTS
(in thousands, except share and per share data)
(8) Provision for Income Taxes
The effective tax rates for the year ended December 31, 2010, 2009, and 2008 were 34.8%,
20.6%, and 38.3%, respectively. It is anticipated that the Company’s effective tax rate may
fluctuate in the future due to the mix of foreign and domestic pre-tax earnings.
Income (loss) before provision for income taxes is allocated as follows:
| |
|
|
|
|
|
|
|
|
|
|
|
|
| |
|
Year Ended December 31, |
|
| |
|
2010 |
|
|
2009 |
|
|
2008 |
|
|
|
|
|
|
|
|
|
|
|
|
|
|
U.S. operations |
|
$ |
(5,666 |
) |
|
$ |
(4,611 |
) |
|
$ |
565 |
|
Foreign operations |
|
|
26,380 |
|
|
|
13,248 |
|
|
|
4,290 |
|
|
|
|
|
|
|
|
|
|
|
|
|
$ |
20,714 |
|
|
$ |
8,637 |
|
|
$ |
4,855 |
|
|
|
|
|
|
|
|
|
|
|
Provision (benefit) for income taxes is comprised of the following:
| |
|
|
|
|
|
|
|
|
|
|
|
|
| |
|
Current |
|
|
Deferred |
|
|
Total |
|
Year ended
December 31, 2010: |
|
|
|
|
|
|
|
|
|
|
|
|
U.S. federal |
|
$ |
182 |
|
|
$ |
687 |
|
|
$ |
869 |
|
State and local |
|
|
81 |
|
|
|
(197 |
) |
|
|
(116 |
) |
Foreign |
|
|
5,953 |
|
|
|
492 |
|
|
|
6,445 |
|
|
|
|
|
|
|
|
|
|
|
|
|
$ |
6,216 |
|
|
$ |
982 |
|
|
$ |
7,198 |
|
|
|
|
|
|
|
|
|
|
|
|
|
|
|
|
|
|
|
|
|
|
|
|
Year ended
December 31, 2009: |
|
|
|
|
|
|
|
|
|
|
|
|
U.S. federal |
|
$ |
1 |
|
|
$ |
(1,535 |
) |
|
$ |
(1,534 |
) |
State and local |
|
|
36 |
|
|
|
(123 |
) |
|
|
(87 |
) |
Foreign |
|
|
3,598 |
|
|
|
(201 |
) |
|
|
3,397 |
|
|
|
|
|
|
|
|
|
|
|
|
|
$ |
3,635 |
|
|
$ |
(1,859 |
) |
|
$ |
1,776 |
|
|
|
|
|
|
|
|
|
|
|
|
|
|
|
|
|
|
|
|
|
|
|
|
Year ended
December 31, 2008: |
|
|
|
|
|
|
|
|
|
|
|
|
U.S. federal |
|
$ |
(90 |
) |
|
$ |
577 |
|
|
$ |
487 |
|
State and local |
|
|
22 |
|
|
|
8 |
|
|
|
30 |
|
Foreign |
|
|
1,039 |
|
|
|
304 |
|
|
|
1,343 |
|
|
|
|
|
|
|
|
|
|
|
|
|
$ |
971 |
|
|
$ |
889 |
|
|
$ |
1,860 |
|
|
|
|
|
|
|
|
|
|
|
F-17
QLIK TECHNOLOGIES INC.
NOTES TO CONSOLIDATED FINANCIAL STATEMENTS
(in thousands, except share and per share data)
The provision for income taxes differs from the amount of taxes determined by applying
the U.S. federal statutory rate to income before provision for income taxes as a result of the
following:
| |
|
|
|
|
|
|
|
|
|
|
|
|
| |
|
Year Ended December 31, |
|
| |
|
2010 |
|
|
2009 |
|
|
2008 |
|
|
|
|
|
|
|
|
|
|
|
|
|
|
Statutory federal income tax |
|
$ |
(7,043 |
) |
|
$ |
(2,937 |
) |
|
$ |
(1,651 |
) |
Increase (reduction) in income taxes resulting from: |
|
|
|
|
|
|
|
|
|
|
|
|
Foreign tax benefit for income taxed at lower rates |
|
|
1,934 |
|
|
|
1,611 |
|
|
|
389 |
|
Foreign tax credit |
|
|
504 |
|
|
|
180 |
|
|
|
— |
|
Change in valuation allowance |
|
|
(83 |
) |
|
|
916 |
|
|
|
62 |
|
State and local income taxes, net of federal income tax benefit |
|
|
297 |
|
|
|
100 |
|
|
|
(22 |
) |
Permanent differences — warrant liability |
|
|
(667 |
) |
|
|
(719 |
) |
|
|
(38 |
) |
Permanent differences — other |
|
|
(259 |
) |
|
|
(392 |
) |
|
|
(302 |
) |
Internal revenue code 956 income and tax on earnings not
permenantly reinvested |
|
|
(1,447 |
) |
|
|
— |
|
|
|
— |
|
Other |
|
|
(434 |
) |
|
|
(535 |
) |
|
|
(298 |
) |
|
|
|
|
|
|
|
|
|
|
Total |
|
$ |
(7,198 |
) |
|
$ |
(1,776 |
) |
|
$ |
(1,860 |
) |
|
|
|
|
|
|
|
|
|
|
Deferred tax assets and liabilities reflect the net tax effects of temporary differences
between the carrying amount of assets and liabilities for financial reporting purposes and the
amounts used for income tax purposes.
Significant components of the Company’s deferred tax assets and liabilities are as follows:
| |
|
|
|
|
|
|
|
|
| |
|
December 31, 2010 |
|
|
December 31, 2009 |
|
Deferred tax assets: |
|
|
|
|
|
|
|
|
Accrued expenses |
|
$ |
283 |
|
|
$ |
501 |
|
Foreign tax credits |
|
|
778 |
|
|
|
273 |
|
Stock options |
|
|
1,008 |
|
|
|
454 |
|
Other tax credits |
|
|
3 |
|
|
|
15 |
|
Other assets |
|
|
419 |
|
|
|
71 |
|
Net operating loss carryforwards |
|
|
4,108 |
|
|
|
5,444 |
|
|
|
|
|
|
|
|
Total gross deferred tax assets |
|
|
6,599 |
|
|
|
6,758 |
|
Less: valuation allowance |
|
|
(1,824 |
) |
|
|
(1,741 |
) |
|
|
|
|
|
|
|
Net deferred tax assets |
|
|
4,775 |
|
|
|
5,017 |
|
Deferred tax liabilities: |
|
|
|
|
|
|
|
|
Exchange gains/losses |
|
|
— |
|
|
|
(326 |
) |
Other |
|
|
(385 |
) |
|
|
— |
|
|
|
|
|
|
|
|
Total deferred tax liabilities |
|
|
(385 |
) |
|
|
(326 |
) |
|
|
|
|
|
|
|
Total net deferred tax assets |
|
$ |
4,390 |
|
|
$ |
4,691 |
|
|
|
|
|
|
|
|
|
|
|
|
|
|
|
|
|
As reported |
|
|
|
|
|
|
|
|
Defererd tax assets, current |
|
$ |
527 |
|
|
$ |
810 |
|
Deferred tax assets, non-current |
|
|
4,248 |
|
|
|
4,207 |
|
Deferred tax liablities, current |
|
|
(337 |
) |
|
|
— |
|
Deferred tax liablities,
non-current |
|
|
(48 |
) |
|
|
(326 |
) |
|
|
|
|
|
|
|
Total net deferred tax assets |
|
$ |
4,390 |
|
|
$ |
4,691 |
|
|
|
|
|
|
|
|
In assessing the realizability of deferred tax assets, management considers whether it is
more likely than not that some portion or all of the deferred tax assets will not be realized. The
ultimate realization of deferred tax assets is dependent upon the generation of future taxable
income during the periods in which those temporary differences become deductible. Based upon the
level of historical taxable income and projections for future taxable income over the periods in
which the deferred tax assets are deductible as of December 31, 2010, management believes it is
more likely than not that the Company will realize the benefits of these deductible differences.
The amount of the deferred tax asset considered realizable, however, could be reduced in the near
term if estimates of future taxable income during the carry forward period are reduced.
F-18
QLIK TECHNOLOGIES INC.
NOTES TO CONSOLIDATED FINANCIAL STATEMENTS
(in thousands, except share and per share data)
Section 382 of the Internal Revenue Code (“Section 382”) limits the utilization of net
operating losses when ownership changes, as defined by that section, occur. The Company has
performed an analysis to identify its Section 382 ownership changes. Because of the ownership
changes, the utilization of some of its U.S. federal and state net operating loss carry forwards
may be limited. The Company has not completed the analysis to determine the annual Section 382
limitation, but estimates that approximately $2.0 million of its U.S. federal and state net
operating loss carry forwards may be limited. Therefore, no federal or state tax benefit has been
recorded on that portion of the net operating loss. Such limitation may have an impact on the
ultimate realization of the Company’s carry forwards and future tax deductions.
At
December 31, 2010 and 2009, there were approximately $7.6 million and $7.2 million of U.S.
federal and $5.0 million and $6.1 million of state net operating loss carry forwards, respectively.
The majority of these net operating loss carry forwards will expire, if unused, between 2020 and
2030. A valuation allowance of $1.0 million and $0.8 million was recorded at December 31, 2010 and
2009, respectively, in relation to the deferred tax asset attributable to these net operating
losses.
In addition, at December 31, 2010 and 2009, there were approximately $4.0 million and $7.3
million of foreign net operating loss carry forwards, respectively. The majority of these net
operating loss carry forwards have an indefinite carry forward period. A valuation allowance of
$0 and $0.6 million was recorded at December 31, 2010 and 2009,
respectively, in relation to the deferred tax assets attributable to these net operating losses.
As a result of the adoption of FIN 48 (codification in ASC 740) effective January 1, 2007, the
Company analyzed its tax return filing positions in all of the federal, state, and foreign filing
jurisdictions where it is required to file income tax returns, as well as all open years in those
jurisdictions, and concluded that there are no uncertain tax positions which would require a
cumulative effect adjustment to retained earnings.
The following table summarizes the changes in the Company’s
gross liabilities, excluding interest and penalties, associated with
unrecognized tax benefit:
| |
|
|
|
|
|
|
|
|
|
|
|
|
| |
|
Year Ended December 31, |
|
| |
|
2010 |
|
|
2009 |
|
|
2008 |
|
|
|
|
|
|
|
|
|
|
|
|
|
|
Beginning balance |
|
$ |
3,322 |
|
|
$ |
3,251 |
|
|
$ |
3,438 |
|
Expiration of statute of limitations for the
assessment of taxes |
|
|
(339 |
) |
|
|
— |
|
|
|
— |
|
Increase related to current tax year |
|
|
99 |
|
|
|
— |
|
|
|
— |
|
Increase related to prior tax years |
|
|
127 |
|
|
|
— |
|
|
|
— |
|
Foreign currency translation adjustments |
|
|
(113 |
) |
|
|
71 |
|
|
|
(187 |
) |
|
|
|
|
|
|
|
|
|
|
Ending balance |
|
$ |
3,096 |
|
|
$ |
3,322 |
|
|
$ |
3,251 |
|
|
|
|
|
|
|
|
|
|
|
All of the Company’s unrecognized tax benefit would affect the Company’s effective tax
rate if recognized. The Company does not expect its unrecognized tax benefit liability to change
significantly over the next 12 months. In December 2011, the
Company may realize a tax benefit of $0.4 million on the expiration
of statute of limitations in certain foreign jurisdictions. As of December 31, 2010, there
was $0.1 million of accrued interest and penalties.
Although the Company believes that the estimates and assumptions supporting its assessments
are reasonable, the final determination of tax audits and any related litigation could be
materially different than that which is reflected in the historical income tax provision and
recorded assets and liabilities. Based on the results of an audit or litigation, there could be a
material effect on the Company’s income tax provision, net income (loss) or cash flows in the
period or periods for which that determination is made.
As of December 31, 2010, the Company is subject to U.S. federal income tax examination for the
tax years 2006 through 2009, and to non-U.S. income tax examination for the tax years 2005 through
2009. In addition, because of net operating losses, the Company’s U.S. federal income tax returns
for 2003 and later years will remain subject to examination until the losses are utilized.
The Company expects to repatriate certain amounts in 2011 from a foreign subsidiary and has provided for deferred taxes, after the
utilization of net operating losses and tax credits that result from this planned repatriation. At December 31, 2010, the Company expects
that the remaining undistributed earnings generated by foreign subsidiaries of approximately $5.0 million will continue to be reinvested
indefinitely. Accordingly, no provision has been made for U.S. federal and state income taxes on these foreign earnings. The determination
of the amount of unrecognized deferred U.S. income tax liability on these earnings is not practicable because of the complexities associated
with the hypothetical calculation.
(9) Capital Stock
Our authorized capital consists of 300,000,000 shares of Common Stock, par value $0.0001 per
share, and 10,000,000 shares of preferred stock, par value $0.0001 per share.
Common Stock
Outstanding shares. At December 31, 2010, we had outstanding 78,752,390 shares of Common
Stock and we had approximately 371 record holders of our Common Stock.
As of December 31, 2010, there were 12,053,445 shares of Common Stock subject to outstanding
options and 40,820 shares of Common Stock issuable upon vesting of restricted stock units
outstanding.
F-19
QLIK TECHNOLOGIES INC.
NOTES TO CONSOLIDATED FINANCIAL STATEMENTS
(in thousands, except share and per share data)
Voting Rights. Each holder of Common Stock is entitled to one vote for each share of common
stock held on all matters submitted to a vote of the stockholders, including the election of
directors. Our restated certificate of incorporation and amended and restated bylaws do not provide
for cumulative voting rights. Because of this, the holders of a majority of the shares of common
stock entitled to vote in any election of directors can elect all of the directors standing for
election, if they should so choose.
Dividends. Subject to preferences that may be applicable to any then outstanding preferred
stock, the holders of our outstanding shares of common stock are entitled to receive dividends, if
any, as may be declared from time to time by our board of directors out of legally available funds.
At present, we have no plans to issue dividends.
Liquidation Preference. In the event of our liquidation, dissolution or winding up, holders
of common stock will be entitled to share ratably in the net assets legally available for
distribution to stockholders after the payment of all of our debts and other liabilities, subject
to the satisfaction of any liquidation preference granted to the holders of any outstanding shares
of preferred stock.
Other Rights and Preferences. Holders of our common stock have no preemptive, conversion or
subscription rights, and there are no redemption or sinking fund provisions applicable to our
common stock. The rights, preferences and privileges of the holders of common stock are subject to,
and may be adversely affected by, the rights of the holders of shares of any series of our
preferred stock that we may designate and issue in the future.
Fully Paid and Non-assessable. All of our outstanding shares of common stock are fully paid
and non-assessable.
Preferred Stock
At December 31, 2010, we had no shares of our preferred stock outstanding.
The Company’s board of directors is authorized to issue preferred stock in one or more series,
to establish the number of shares to be included in each such series and to fix the designation,
powers, preferences and rights of such shares and any qualifications, limitations or restrictions
thereof. The issuance of preferred stock may have the effect of delaying, deferring or preventing a
change in control of the
Company without further action by the stockholders and may adversely affect the voting and
other rights of the holders of common stock. The issuance of preferred stock with voting and
conversion rights may adversely affect the voting power of the holders of common stock, including
the loss of voting control to others. At present, the Company has no plans to issue any preferred
stock.
Convertible Preferred Stock
In July 2010, in connection with the Company’s IPO, the Company’s then outstanding shares of
convertible preferred stock were automatically converted into shares of common stock and all
outstanding warrants to purchase convertible preferred stock were converted into warrants to
purchase shares of common stock.
(10) Commitments and Contingencies
Litigation
From time to time, the Company is involved in disputes or legal actions arising in the
ordinary course of business. Management does not believe the outcome of such legal actions will
have a material adverse effect on the Company’s financial position, results of operations, or cash
flows.
Leases
The Company conducts its operations in leased facilities under leases expiring at various
dates through 2017. Rent expense was approximately $6.0 million, $4.0 million, and $3.5 million for
the years ended December 31, 2010, 2009 and 2008, respectively.
The future minimum lease payments under non-cancelable operating leases are as follows:
| |
|
|
|
|
|
Year ending December 31: |
|
|
|
|
2011 |
|
$ |
10,650 |
|
2012 |
|
|
9,120 |
|
2013 |
|
|
7,547 |
|
2014 |
|
|
4,271 |
|
2015 |
|
|
3,237 |
|
Thereafter |
|
|
1,980 |
|
|
|
|
|
|
|
|
|
|
Total future minimum lease payments |
|
$ |
36,805 |
|
|
|
|
|
The Company’s significant lease agreements relate to the global corporate headquarters
and principal executive offices located in Radnor, Pennsylvania and its primary research and
development center in Lund, Sweden.
Included in the minimum lease payments above are amounts due under a new lease in Lund that
the Company executed in December 2010 that is not yet occupied and amounts related to the Company’s
existing facility lease in Lund which expires in September 2013. The Company anticipates occupying
its new facility in the first half of 2011 and that once fully occupied, they will cease use of the
current leased facility. As of December 31, 2010, the current facility lease has $2.8 million of
lease payments remaining under the lease. The Company currently plans to sublease the current
leased facility, however, depending on the ultimate outcome, a charge may be required at the
cease-use date for the remaining rent payments under the lease, less any applicable sublease
income.
F-20
QLIK TECHNOLOGIES INC.
NOTES TO CONSOLIDATED FINANCIAL STATEMENTS
(in thousands, except share and per share data)
(11) Business and Geographic Segment Information
The Company currently operates in one business segment, namely, the development,
commercialization and implementation of software products and related services. The Company is
managed and operated as one business. A single management team that reports to the chief operating
decision maker comprehensively manages the entire business. The Company does not operate any
material separate lines of business or separate business entities with respect to its products or
product development. Accordingly, the Company views its business and manages its operations as one
reportable segment.
The following geographic data includes net revenues based on revenues generated by
subsidiaries located within that geographic area. The Company’s revenues were generated in the
following geographic regions:
| |
|
|
|
|
|
|
|
|
|
|
|
|
| |
|
Year Ended December 31, |
|
| |
|
2010 |
|
|
2009 |
|
|
2008 |
|
|
|
|
|
|
|
|
|
|
|
|
|
|
The Americas |
|
$ |
70,930 |
|
|
$ |
42,725 |
|
|
$ |
33,684 |
|
Europe |
|
|
138,364 |
|
|
|
103,824 |
|
|
|
76,180 |
|
Rest of world |
|
|
17,227 |
|
|
|
10,810 |
|
|
|
8,400 |
|
|
|
|
|
|
|
|
|
|
|
Consolidated total |
|
$ |
226,521 |
|
|
$ |
157,359 |
|
|
$ |
118,264 |
|
|
|
|
|
|
|
|
|
|
|
During the year ended December 31, 2010, sales from customers in the U.S., Sweden, the
United Kingdom and Germany were $57.7 million, $26.3 million, $23.1 million and $23.0 million,
respectively. During the year ended December 31, 2009, sales from customers in the U.S., Sweden,
and Germany were $35.9 million, $23.2 million and $20.1 million, respectively. During the year
ended December 31, 2008, sales from customers in the U.S., Sweden and Germany were $27.7 million,
$21.4 million and $13.7 million, respectively.
The following geographic data includes property and equipment based on physical location
within that geographic area. Long-lived assets by geographic area consist of property and equipment
and are as follows:
| |
|
|
|
|
|
|
|
|
| |
|
As of December 31, |
|
| |
|
2010 |
|
|
2009 |
|
|
|
|
|
|
|
|
|
|
The Americas |
|
$ |
841 |
|
|
$ |
623 |
|
Europe |
|
|
3,413 |
|
|
|
2,621 |
|
Rest of world |
|
|
145 |
|
|
|
— |
|
|
|
|
|
|
|
|
Consolidated total |
|
$ |
4,399 |
|
|
$ |
3,244 |
|
|
|
|
|
|
|
|
As of December 31, 2010, long-lived assets held in Sweden and the U.S. were $1.5 million
and $0.7 million, respectively. As of December 31, 2009, long-lived assets held in Sweden, the
U.S. and Germany were $1.8 million, $0.6 million and $0.3 million, respectively.
(12) Stock Option Plan
In 2004, the Company’s Board of Directors and stockholders approved the Company’s 2004
Omnibus Stock Option and Award Plan (“2004 Plan”) which provided for the granting of either incentive or nonqualified stock
options and other types of awards to purchase up to 11,124,400 shares of the Company’s Common Stock. In 2007, the Company’s
Board of Directors and stockholders approved the Company’s 2007 Omnibus Stock Option and Award Plan
(“2007 Plan”) which provided for the granting of either incentive stock options or
nonqualified stock options and other types of awards to purchase up to 18,124,400 shares of the Company’s Common Stock. The
2004 Plan and 2007 Plan each provided for stock-based awards to
employees, directors and advisors. Stock options were
granted at a strike price not less than the estimated fair market value at the date of grant as
determined by the Board of Directors.
The 2004 Plan and 2007 Plan were designed to help attract and retain the Company and its subsidiaries’
personnel, to reward employees and directors for past services and to motivate such individuals
through added incentives to further contribute to the success of the Company. The maximum term for
the options granted is ten years. Options granted pursuant to the 2004 Plan and 2007 Plan generally vest at 25% after the first year
and then vest 6.25% each quarter over the remaining three years.
Generally, we require
Swedish plan participants to purchase their stock options at a purchase price equal to the estimated
fair value of the options on the date of grant. Accordingly, payments received by the Company for the grant of
Swedish stock options were $0.1 million for the years ended December 31, 2010, 2009 and 2008. The term of stock
options granted to Swedish employees, directors and advisors is usually four years. Pursuant to our non-qualified stock option award agreements with our Swedish employees, stock
options are subject to the Company’s right of repurchase upon a termination of service to the
participant at a price equal to the fair market value on the date of termination of service. Total
proceeds from options repurchased by the Company were $0.4 million in 2009. Beginning in 2010, the Company
no longer repurchases options upon a termination of service.
F-21
QLIK TECHNOLOGIES INC.
NOTES TO CONSOLIDATED FINANCIAL STATEMENTS
(in thousands, except share and per share data)
The Company’s 2010 Equity Incentive Plan (“2010 Plan”) took effect on the effective date of
the registration statement for the Company’s IPO. The Company initially reserved 3,300,000
shares of its common stock for issuance under the 2010 Plan. The number of shares reserved for
issuance under the 2010 Plan will be increased automatically on January 1st of each year, starting
with 2011, by a number equal to the smallest of 3,300,000 shares; 3.75% of the shares of common
stock outstanding at that time; or the number shares determined by the Company’s Board of
Directors. As of December 31, 2010, there were 2,644,280 shares available for grant under the 2010
Plan. In February 2011, the Board of Directors of the Company authorized an automatic increase to
the 2010 Plan equal to 2,952,968 shares.
The 2010 Plan provides for the granting of either
incentive stock option or nonqualified stock options, restricted stock awards, restricted stock units, or stock
appreciation rights (“2010 Awards”) in the Company’s Common Stock. 2010 Awards may be made to employees,
directors and consultants. Options granted pursuant to the 2010 Plan have a maximum term of 10 years and generally vest 25% after the
first year and then 6.25% each quarter over the remaining three years.
The Company uses the Black-Scholes option-pricing model to value stock option awards. The
Black-Scholes option-pricing model requires the input of subjective assumptions, including the
expected life of the share-based payment awards and stock price volatility. The Company does not
have sufficient historical volatility for the expected term of the options. Prior to 2008, the
Company established the expected volatility assumption by determining an appropriate industry
sector that was representative of the nature of its operations as well as its market capitalization
size (mid-cap software industry). As of January 1, 2008 and forward, the Company uses comparable
public companies as a basis for its expected volatility to calculate the fair value of option
grants and intends to continue to consistently apply this process using comparable companies until
a sufficient amount of historical information regarding the volatility of the Company’s share price
becomes available. The expected term for all Swedish option grants is four years based on the
contractual expiration date of the option and based on the history of option exercise behavior. The
expected term for all other option grants is based on the simplified method provided by SEC
guidance. The risk-free interest rate is based on U.S. Treasury yield curve with a remaining term
equal to the expected life assumed at grant. The assumptions used in calculating the fair value of
share-based payment awards represent management’s best estimate and involve inherent uncertainties
and the application of management’s judgment. As a result, if factors change and management uses
different assumptions, share-based compensation expense could be materially different in the
future.
Common Stock Options
For all option grants during 2009 and prior to the Company’s IPO, the fair value of the Common
Stock underlying the option grants was determined by the Company’s Board of Directors, with the
assistance of management, which intended all options granted to be exercisable at a price per share
not less than the per share fair value of the Company’s Common Stock underlying those options on
the date of grant. The Company utilized the guidance set forth by the American Institute of
Certified Public Accountants, or the AICPA, in the AICPA Technical Practice Aid, “Valuation of
Privately-Held-Company Equity Securities Issued as Compensation", referred to herein as the AICPA
Practice Aid, when estimating the fair value of common stock at each grant date.
The Board of Directors, with the assistance of management, used the market approach and the
income approach in order to estimate the fair value of Common Stock underlying the Company’s option
grants prior to the Company’s IPO. The Company believes both of these approaches were appropriate
methodologies given its stage of development. For the market approach, the Company utilized the
guideline company method by analyzing a population of comparable companies and selected those
technology companies that it considered to be the
most comparable in terms of product offerings, revenues, margins, and growth. Under the market
approach, the Company then used these guideline companies to develop relevant market multiples and
ratios, which were then applied to its corresponding financial metrics to estimate the Company’s
equity value. For the income approach, the Company performed discounted cash flow analyses which
utilized projected cash flows as well as a residual value, which were then discounted to the
present in order to arrive at its current equity value. Prior to the Company’s IPO, the Company
utilized a probability weighted expected return model to allocate value to the various securities
outstanding in the Company’s capital structure.
The significant input assumptions used in the valuation models prior to the Company’s IPO are
based on subjective future expectations combined with management judgment, including:
Income approach assumptions:
| |
• |
|
expected revenue, operating performance and cash flows for the current and future
years, determined as of the valuation date based on the Company’s estimates; |
| |
• |
|
a discount rate, which was applied to discretely forecasted future cash flows in
order to calculate the present value of those cash flows; and |
| |
• |
|
a terminal value multiple, which was applied to the last year of discretely
forecasted cash flows to calculate the residual value of the Company’s future cash
flows. |
Assumptions utilized in the market approach are:
| |
• |
|
expected revenue, operating performance and cash flows for the current and future
years, determined as of the valuation date based on the Company’s estimates; |
| |
• |
|
multiples of market value to trailing revenues, determined as of the valuation date,
based on a group of comparable public companies identified; and |
| |
• |
|
multiples of market value to expected future revenues, determined as of the valuation
date, based on the same group of comparable public companies. |
F-22
QLIK TECHNOLOGIES INC.
NOTES TO CONSOLIDATED FINANCIAL STATEMENTS
(in thousands, except share and per share data)
The following provides a summary of the stock option activity for the Company as of the noted
dates:
| |
|
|
|
|
|
|
|
|
|
|
|
|
| |
|
|
|
|
|
|
|
|
|
Weighted- |
|
| |
|
|
|
|
|
|
|
|
|
Average |
|
| |
|
|
|
|
|
Weighted- |
|
|
Remaining |
|
| |
|
Number of |
|
|
Average |
|
|
Contractual |
|
| |
|
Shares |
|
|
Exercise Price |
|
|
Term (Years) |
|
|
|
|
|
|
|
|
|
|
|
|
|
|
Outstanding as of January 1, 2008 |
|
|
13,157,138 |
|
|
$ |
0.91 |
|
|
|
8.26 |
|
Authorized |
|
|
— |
|
|
$ |
— |
|
|
|
— |
|
Granted |
|
|
3,372,225 |
|
|
$ |
1.65 |
|
|
|
— |
|
Exercised |
|
|
(2,383,311 |
) |
|
$ |
0.65 |
|
|
|
— |
|
Forfeited |
|
|
(2,008,003 |
) |
|
$ |
0.73 |
|
|
|
— |
|
|
|
|
|
|
|
|
|
|
|
Outstanding as of December 31, 2008 |
|
|
12,138,049 |
|
|
$ |
1.19 |
|
|
|
8.26 |
|
|
|
|
|
|
|
|
|
|
|
|
|
|
Authorized |
|
|
— |
|
|
$ |
— |
|
|
|
— |
|
Granted |
|
|
2,709,754 |
|
|
$ |
2.53 |
|
|
|
— |
|
Exercised |
|
|
(650,216 |
) |
|
$ |
0.79 |
|
|
|
— |
|
Forfeited |
|
|
(1,856,114 |
) |
|
$ |
1.14 |
|
|
|
— |
|
|
|
|
|
|
|
|
|
|
|
Outstanding as of December 31, 2009 |
|
|
12,341,473 |
|
|
$ |
1.51 |
|
|
|
6.83 |
|
|
|
|
|
|
|
|
|
|
|
|
|
|
Authorized |
|
|
— |
|
|
$ |
— |
|
|
|
— |
|
Granted |
|
|
1,881,400 |
|
|
$ |
10.43 |
|
|
|
— |
|
Exercised |
|
|
(1,840,034 |
) |
|
$ |
1.09 |
|
|
|
— |
|
Forfeited |
|
|
(329,394 |
) |
|
$ |
2.21 |
|
|
|
— |
|
|
|
|
|
|
|
|
|
|
|
Outstanding as of December 31, 2010 |
|
|
12,053,445 |
|
|
$ |
2.95 |
|
|
|
6.71 |
|
|
|
|
|
|
|
|
|
|
|
|
|
|
|
|
|
|
|
|
|
|
|
|
Exercisable at December 31, 2010 |
|
|
7,312,003 |
|
|
$ |
1.39 |
|
|
|
5.80 |
|
|
|
|
|
|
|
|
|
|
|
|
|
|
Vested and expected to vest at
December 31, 2010 |
|
|
11,867,552 |
|
|
$ |
2.97 |
|
|
|
6.70 |
|
The grant date weighted-average fair value per common stock option for the years ended
December 31, 2010, 2009 and 2008 was $5.13, $1.23 and $1.00, respectively. The total fair value of
the common stock options that vested during the years ended December 31, 2010, 2009 and 2008 was
$2.3 million, $1.6 million and $0.7 million, respectively.
The total intrinsic value of common stock options exercised during 2010, 2009 and 2008 was $28.0 million, $1.3 million and $2.4 million,
respectively. The aggregate intrinsic value of common stock options outstanding and fully vested as of December 31, 2010, 2009 and 2008
was $179.0 million, $26.5 million and $3.9 million, respectively. The aggregate intrinsic value of common stock options outstanding and
expected to vest as of December 31, 2010, 2009 and 2008 was $271.8
million, $44.0 million and $5.2 million, respectively.
The assumptions used in the Black-Scholes option pricing model are:
| |
|
|
|
|
|
|
| |
|
Year Ended December 31, |
| |
|
2010 |
|
2009 |
|
2008 |
|
|
|
|
|
|
|
Expected dividend yield |
|
0.0% |
|
0.0% |
|
0.0% |
Risk-free interest rate |
|
1.3% – 2.7% |
|
1.5% – 2.4% |
|
1.2% – 3.1% |
Expected volatility |
|
48.3% – 50.2% |
|
44.7% – 85.7% |
|
48.0% – 88.8% |
Expected life (Swedish
grants, in years) |
|
4 |
|
4 |
|
4 |
Expected life (all
other grants, in
years) |
|
6.25 |
|
6.25 |
|
6.25 |
For the years ended December 31, 2010, 2009 and 2008, the Company recorded stock-based
compensation expenses of $3.0 million, $1.5 million and $0.7 million, respectively.
As of December 31, 2010, there was $10.2 million of total unrecognized compensation cost, net
of estimated forfeitures, related to non-vested employee and non-employee director common stock
options. The remaining cost is expected to be recognized over a weighted-average period of
approximately 2.5 years.
F-23
QLIK TECHNOLOGIES INC.
NOTES TO CONSOLIDATED FINANCIAL STATEMENTS
(in thousands, except share and per share data)
Restricted Stock Units
The Company grants restricted stock unit awards to its non-employee directors under the
provisions of the 2010 Plan. The cost of a restricted stock unit is determined using the fair value
of the Company’s common stock on the date of grant. A restricted stock unit award entitles the
holder to receive shares of the Company’s common stock as the award vests. Vesting may be based on
length of service, the attainment of performance-based milestones, or a combination of both.
Stock-based compensation expense is amortized on a straight-line basis over the vesting period.
In July 2010, in connection with the Company’s IPO, pursuant to the Company’s director
compensation program, the Company granted restricted stock unit awards for an aggregate of 37,500
shares of common stock to its non-employee directors having an aggregate value of $0.4 million
based on the Company’s IPO price of $10.00 per share. These restricted stock unit awards vest in
full on the earliest of, the anniversary of the Company’s IPO, the death of the recipient, or a
change of control of the Company.
On October 12, 2010, the Company granted restricted stock units for 3,320 shares of common
stock to a non-employee director having a value of $0.1 million based on the Company’s stock price
at the close of trading of $22.59 per share. This restricted stock unit award vests in full on the
earliest of, the anniversary of the grant, the death of the recipient, or a change of control of
the Company.
As of December 31, 2010, there was $0.2 million of total unrecognized compensation cost, net
of estimated forfeitures, related to the non-employee directors restricted stock unit awards which
have not vested or settled. The remaining cost is expected to be recognized over a weighted-average
period of approximately 0.6 years.
F-24
QLIK TECHNOLOGIES INC.
NOTES TO CONSOLIDATED FINANCIAL STATEMENTS
(in thousands, except share and per share data)
(13) Shares Reserved for Future Issuance
At December 31, 2010, the Company had reserved a total of its authorized shares of common
stock for issuance under its equity incentive plan and other classes of stock for future issuance
as follows:
| |
|
|
|
|
|
Granted and
outstanding common stock options and restricted stock units |
|
|
12,094,265 |
|
Future
issuance under 2010 plan |
|
|
2,644,280 |
|
Future issuance of preferred stock |
|
|
10,000,000 |
|
(14) Benefits Plans
The Company sponsors a 401(k) savings plan covering substantial all U.S. employees who
meet certain age and employment criteria. Employees may contribute up to the Internal Revenue
Service maximum employee contribution each year. The Company has contributed a 3% non-elective
contribution based on eligible employee earnings which is made in the first quarter following the
end of the plan year. There is no vesting period for non-elective contributions. In the foreign
entities, the Company has defined contribution plans for the employees’ retirements who meet
certain age, employment, and salary criteria. The Company’s benefit plans expense was approximately
$3.0 million, $2.3 million, and $2.4 million for the years ended December 31, 2010, 2009 and 2008,
respectively.
(15) Comparison of Summarized Unaudited Quarterly Results
The following table sets forth certain unaudited quarterly financial information for fiscal
2010 and 2009. This data should be read together with the Company’s consolidated financial
statements and the related notes included elsewhere in this Annual Report on Form 10-K. The Company
has prepared the unaudited information on a basis consistent with its audited financial statements
and have included all adjustments of a normal and recurring nature, which, in the opinion of
management, are considered necessary to fairly present the Company’s revenue and operating expenses
for the quarters presented. The Company’s historical operating results for any quarter are not
necessarily indicative of results for any future period.
| |
|
|
|
|
|
|
|
|
|
|
|
|
|
|
|
|
|
|
|
|
|
|
|
|
|
|
|
|
|
|
|
|
| |
|
For the Three Months Ended |
|
| |
|
March 31, |
|
|
June 30, |
|
|
September 30, |
|
|
December 31, |
|
|
March 31, |
|
|
June 30, |
|
|
September 30, |
|
|
December 31, |
|
| |
|
2009 |
|
|
2009 |
|
|
2009 |
|
|
2009 |
|
|
2010 |
|
|
2010 |
|
|
2010 |
|
|
2010 |
|
|
|
|
|
|
|
|
|
|
|
|
|
|
|
|
|
|
|
|
|
|
|
|
|
|
|
|
|
|
|
|
|
|
Consolidated statement of
operations data: |
|
|
|
|
|
|
|
|
|
|
|
|
|
|
|
|
|
|
|
|
|
|
|
|
|
|
|
|
|
|
|
|
Revenue: |
|
|
|
|
|
|
|
|
|
|
|
|
|
|
|
|
|
|
|
|
|
|
|
|
|
|
|
|
|
|
|
|
License revenue |
|
$ |
14,759 |
|
|
$ |
20,045 |
|
|
$ |
21,388 |
|
|
$ |
43,672 |
|
|
$ |
26,222 |
|
|
$ |
32,544 |
|
|
$ |
30,139 |
|
|
$ |
56,320 |
|
Maintenance revenue |
|
|
7,969 |
|
|
|
9,478 |
|
|
|
11,164 |
|
|
|
12,779 |
|
|
|
13,069 |
|
|
|
13,519 |
|
|
|
14,972 |
|
|
|
18,286 |
|
Professional services revenue |
|
|
3,676 |
|
|
|
3,322 |
|
|
|
3,754 |
|
|
|
5,353 |
|
|
|
4,474 |
|
|
|
5,067 |
|
|
|
5,157 |
|
|
|
6,752 |
|
|
|
|
|
|
|
|
|
|
|
|
|
|
|
|
|
|
|
|
|
|
|
|
|
|
Total revenue |
|
|
26,404 |
|
|
|
32,845 |
|
|
|
36,306 |
|
|
|
61,804 |
|
|
|
43,765 |
|
|
|
51,130 |
|
|
|
50,268 |
|
|
|
81,358 |
|
Cost of revenue: |
|
|
|
|
|
|
|
|
|
|
|
|
|
|
|
|
|
|
|
|
|
|
|
|
|
|
|
|
|
|
|
|
License revenue |
|
|
587 |
|
|
|
614 |
|
|
|
590 |
|
|
|
1,872 |
|
|
|
679 |
|
|
|
1,178 |
|
|
|
711 |
|
|
|
1,102 |
|
Maintenance revenue |
|
|
376 |
|
|
|
455 |
|
|
|
402 |
|
|
|
402 |
|
|
|
695 |
|
|
|
1,013 |
|
|
|
965 |
|
|
|
1,325 |
|
Professional services revenue |
|
|
2,817 |
|
|
|
2,589 |
|
|
|
2,732 |
|
|
|
3,664 |
|
|
|
2,912 |
|
|
|
3,554 |
|
|
|
4,458 |
|
|
|
5,130 |
|
|
|
|
|
|
|
|
|
|
|
|
|
|
|
|
|
|
|
|
|
|
|
|
|
|
Total cost of revenue |
|
|
3,780 |
|
|
|
3,658 |
|
|
|
3,724 |
|
|
|
5,938 |
|
|
|
4,286 |
|
|
|
5,745 |
|
|
|
6,134 |
|
|
|
7,557 |
|
|
|
|
|
|
|
|
|
|
|
|
|
|
|
|
|
|
|
|
|
|
|
|
|
|
Gross profit |
|
|
22,624 |
|
|
|
29,187 |
|
|
|
32,582 |
|
|
|
55,866 |
|
|
|
39,479 |
|
|
|
45,385 |
|
|
|
44,134 |
|
|
|
73,801 |
|
Total operating expenses |
|
|
29,004 |
|
|
|
31,896 |
|
|
|
30,843 |
|
|
|
35,350 |
|
|
|
37,470 |
|
|
|
39,544 |
|
|
|
40,972 |
|
|
|
57,245 |
|
|
|
|
|
|
|
|
|
|
|
|
|
|
|
|
|
|
|
|
|
|
|
|
|
|
Income (loss) from operations |
|
$ |
(6,380 |
) |
|
$ |
(2,709 |
) |
|
$ |
1,739 |
|
|
$ |
20,516 |
|
|
$ |
2,009 |
|
|
$ |
5,841 |
|
|
$ |
3,162 |
|
|
$ |
16,556 |
|
|
|
|
|
|
|
|
|
|
|
|
|
|
|
|
|
|
|
|
|
|
|
|
|
|
|
|
|
|
|
|
|
|
|
|
|
|
|
|
|
|
|
|
|
|
|
|
|
|
|
|
|
|
|
|
|
|
|
Net income (loss) |
|
$ |
(4,301 |
) |
|
$ |
(2,696 |
) |
|
$ |
(1,484 |
) |
|
$ |
15,344 |
|
|
$ |
(119 |
) |
|
$ |
3,538 |
|
|
$ |
(511 |
) |
|
$ |
10,608 |
|
|
|
|
|
|
|
|
|
|
|
|
|
|
|
|
|
|
|
|
|
|
|
|
|
|
|
|
|
|
|
|
|
|
|
|
|
|
|
|
|
|
|
|
|
|
|
|
|
|
|
|
|
|
|
|
|
|
|
Net income (loss) per common share: |
|
|
|
|
|
|
|
|
|
|
|
|
|
|
|
|
|
|
|
|
|
|
|
|
|
|
|
|
|
|
|
|
Basic |
|
$ |
(0.27 |
) |
|
$ |
(0.17 |
) |
|
$ |
(0.09 |
) |
|
$ |
0.21 |
|
|
$ |
(0.01 |
) |
|
$ |
0.02 |
|
|
$ |
(0.01 |
) |
|
$ |
0.14 |
|
Diluted |
|
$ |
(0.27 |
) |
|
$ |
(0.17 |
) |
|
$ |
(0.09 |
) |
|
$ |
0.16 |
|
|
$ |
(0.01 |
) |
|
$ |
0.02 |
|
|
$ |
(0.01 |
) |
|
$ |
0.12 |
|
The Company conducts business in its foreign operations in local currencies. Accordingly,
its revenue and operating expense results presented above are affected by changes in foreign
exchange rates. Income and expense accounts are translated at the average monthly exchange rates
during the period. As a result, a decline in the value of the U.S. dollar relative to the local
currencies of the Company’s foreign subsidiaries can have a favorable effect on its profitability,
and an increase in the value of the U.S. dollar relative to the local currencies of foreign
subsidiaries can have a negative effect on its profitability.
F-25