Attached files
| file | filename |
|---|---|
| EX-21 - EX-21 - POWER ONE INC | a2202549zex-21.htm |
| EX-31.2 - EX-31.2 - POWER ONE INC | a2202549zex-31_2.htm |
| EX-23 - EX-23 - POWER ONE INC | a2202549zex-23.htm |
| EX-31.1 - EX-31.1 - POWER ONE INC | a2202549zex-31_1.htm |
| EX-32 - EX-32 - POWER ONE INC | a2202549zex-32.htm |
Use these links to rapidly review the document
TABLE OF CONTENTS
PART IV
FINANCIAL STATEMENTS
UNITED STATES
SECURITIES AND EXCHANGE COMMISSION
Washington, D.C. 20549
FORM 10-K
| ý | ANNUAL REPORT PURSUANT TO SECTION 13 OR 15(d) OF THE SECURITIES EXCHANGE ACT OF 1934 | |
For the fiscal year ended January 2, 2011 |
||
or |
||
o |
TRANSITION REPORT PURSUANT TO SECTION 13 OR 15(d) OF THE SECURITIES EXCHANGE ACT OF 1934 |
|
For the transition period from to |
||
Commission File No. 0-29454 |
||
POWER-ONE, INC.
(Exact name of registrant as specified in its charter)
| DELAWARE | 77-0420182 | |
| (State or other jurisdiction of incorporation or organization) | (I.R.S. Employer Identification No.) | |
740 Calle Plano Camarillo, California (Address of principal executive offices) |
93012 (Zip code) |
|
Registrant's telephone number, including area code (805) 987-8741 |
||
Securities registered pursuant to Section 12(b) of the Act:
| Common Stock, $0.001 par value | The NASDAQ Stock Market LLC | |
| (Title of each class) | (Name of each exchange on which registered) |
Securities registered pursuant to Section 12(g) of the Act: None
Indicate by check mark if the registrant is a well-known seasoned issuer, as defined in Rule 405 of the Securities Act. Yes o No ý
Indicate by check mark if the registrant is not required to file reports pursuant to Section 13 or 15(d) of the Act. Yes o No ý
Indicate by check mark whether the registrant (1) has filed all reports required to be filed by Section 13 or 15(d) of the Securities Exchange Act of 1934 during the preceding 12 months (or for such shorter period that the registrant was required to file such reports), and (2) has been subject to such filing requirements for the past 90 days. Yes ý No o
Indicate by check mark whether the registrant has submitted electronically and posted on its corporate website, if any, every Interactive Data File required to be submitted and posted pursuant to Rule 405 of Regulation S-T (§ 232.405 of this chapter) during the preceding 12 months (or for such shorter period that the registrant was required to submit and post such files). Yes o No o
Indicate by check mark if disclosure of delinquent filers pursuant to Item 405 of Regulation S-K is not contained herein, and will not be contained, to the best of registrant's knowledge, in definitive proxy or information statements incorporated by reference in Part III of this Form 10-K or any amendment to this Form 10-K. o
Indicate by check mark whether the registrant is a large accelerated filer, an accelerated filer, a non-accelerated filer, or a smaller reporting company. See the definitions of "large accelerated filer," "accelerated filer" and "smaller reporting company" in Rule 12b-2 of Exchange Act. (Check one):
| Large accelerated filer o | Accelerated filer ý | Non-accelerated filer o (Do not check if a smaller reporting company) |
Smaller reporting company o |
Indicate by check mark whether the registrant is a shell company (as defined in Rule 12b-2 of the Act). Yes o No ý
Aggregate market value of registrant's common stock held by non-affiliates of the registrant, based upon the closing price of a share of the registrant's common stock on July 2, 2010, as reported by NASDAQ Global Market on that date was approximately $587,108,940
As of March 4, 2011, 104,143,546 shares of the registrant's $0.001 par value common stock were outstanding.
DOCUMENTS INCORPORATED BY REFERENCE
Portions of the registrant's definitive Proxy Statement to be filed with the Securities and Exchange Commission within 120 days after the close of the fiscal year ended January 2, 2011 are incorporated by reference into Parts II and III of this Annual Report on Form 10-K.
CAUTIONARY STATEMENT REGARDING FORWARD-LOOKING STATEMENTS
Unless the context indicates otherwise, all references herein to "Power-One," "the Company," "we," "us," and "our" refer collectively to Power-One, Inc. and its subsidiaries.
This Annual Report on Form 10-K, including documents incorporated by reference, contains forward-looking statements within the meaning of the Private Securities Litigation Reform Act of 1995 that can be identified by the use of forward-looking terminology such as "may,""might," "will," "would," "can," "could," "believe," "expect," "anticipate," "estimate," "plan," "intend," "project," "predict," or "continue" or the negative or other variations of such terms or comparable terminology. Forward-looking statements contained or incorporated by reference in this document, including those set forth in the sections of this Annual Report on Form 10-K in Item 7 entitled "Management's Discussion and Analysis of Financial Condition and Results of Operations," and in Item 1 entitled "Business" include but are not limited to statements regarding our plans, objectives, goals, strategies, future events, future sales or performance, projections of revenues, income or loss, capital expenditures, plans for future operations, products and services, legal matters, financing risks, needs and expectations, and other information that is not historical information, as well as assumptions relating to the foregoing. All forward-looking statements are based on our current expectations, projections and assumptions. We undertake no obligation to modify or revise any forward-looking statements to reflect events or circumstances occurring after the date that the forward looking statement was made. Factors that could cause actual results to differ materially from those expressed or implied by the forward-looking statements include, but are not limited to, those described in Item 1A entitled "Risk Factors."
Overview
Power-One is a leader in high efficiency and high density power supply products for a variety of industries. Our products convert process and manage both alternating current (AC) and direct current (DC) to meet the high levels of quality, reliability and precision required by our customers.
In 2010, we established two Strategic Business Units (SBU), the Renewable Energy Solutions SBU and the Power Solutions SBU, to address the two different market segments we serve. (See Part IV. Item 15. Note 15).
The Renewable Energy Solutions SBU sells a broad product line of high-efficiency inverters that provide our customers with better power harvesting, longer uptime, a wide range of service offerings and ease-of-installation. We are the world's second largest designer and manufacturer of photovoltaic inverters, selling string inverters to residential and commercial users, and central inverters for large commercial users and utility applications. Our renewable energy products are among the best in the industry to enable the highest yielding conversion of power from both solar arrays and wind farms, providing customers with a better return on investment and a lower total cost of ownership. And through a recent acquisition, we offer our customers software with data-driven life-cycle management solutions that include portfolio and asset management, event management and analytics.
Our Power Solutions SBU provides AC/DC converters, DC/DC converters and network power systems for data center applications, including routers, data storage, servers, wireless communications, and optical networking. We also target industrial applications such as transportation and semiconductor test equipment. With hundreds of different standard products and the ability to create custom and semi-custom products, we have one of the most comprehensive product lines in the power conversion and power management industry.
We design, manufacture, sell and service our products globally and have significant resources in Europe, North America and the Asia-Pacific region. For our Renewable Energy Solutions SBU, we strive to maintain a flexible manufacturing footprint and operate manufacturing and supply facilities in each major region in which we operate. For our Power Solutions SBU, we maintain manufacturing centers in Asia and Europe to efficiently supply the higher volumes demanded in these markets. We have established five research and design centers in North America, Europe and Asia with over two hundred design engineers to support product development.
No customer accounted for more than 10% of our sales during the years ended January 2, 2011 ("Fiscal 2010"), January 3, 2010 ("Fiscal 2009"), or December 28, 2008 ("Fiscal 2008"). However, see "Risk Factors—We rely on a few major customers for a material portion of our business and the loss of any of those customers, or a change in our product mix, could reduce our net income and operating results."
We were originally incorporated in 1973 as a California corporation and re-incorporated in the State of Delaware on January 1, 1996. On June 14, 2010, we consummated a reorganization pursuant to which we merged with and into a newly-formed corporation incorporated in the state of Delaware. The surviving corporation was immediately renamed "Power-One Inc."
Industry Background
The renewable energy, power conversion, and power management industries are comprised of a few large vendors as well as a number of smaller companies that focus on specialized products. The renewable energy market is one of the fastest growing markets in the power industry, with industry analysts estimating that the market will grow at a compound annual growth rate (CAGR) of over 20%
2
through 2014. The power conversion market, which includes the Networking and Telecom Equipment (NTE), Computer and Office Equipment (COE) and Industrial sectors, among others, is expected to grow at a 5-7% CAGR from 2011 through 2014 according to IMS Research. In 2009, the power conversion and power management products were negatively influenced by the global economic recession, as industry sales decreased approximately 15-20%, according to market studies.
Longer term, we believe the following key trends will continue to drive demand for renewable energy inverters and power conversion and power management products:
Increasing Demand for Renewable Energy. With global power needs expected to double by 2025, according to the U.S. Department of Energy, suppliers and users of electricity are seeking renewable sources of energy, with both public and private global investment driving the emerging market for renewable energy. Concern about the supply of traditional energy sources, including oil and natural gas, global warming and the need to minimize the carbon footprint of the power generation industry have prompted wide-spread legislation throughout the globe based on broad goals outlined in the Kyoto Protocol, an international agreement calling for the reduction of greenhouse gases. The outcome of this treaty has created a large number of country and local-level mandates and subsidies aimed at encouraging the emerging market for renewable forms of energy for electricity production. For example, certain European countries, such as Germany, Italy, France and the United Kingdom, have adopted Feed in Tariffs (FIT) whereby the government will pay approximately $0.30 to $0.40/ kWh over a 20-year time period for energy fed back into the utility grid. These incentives are intended to bring the production cost of electricity from renewable sources to parity with power generated from fossil and other fuels, thereby encouraging creation of energy from clean, renewable sources. See "Risk Factors—Much of our business is subject to risks associated with operations in foreign countries."
This convergence of energy needs and environmental concerns has resulted in significant growth in the markets for solar (or photovoltaic [PV]) energy and for wind energy. These renewable energy technologies have the further advantages of low carbon footprint and distributed architectures, which allow for both small and scalable investments by residences, businesses and utilities. As solar and wind energy have gained scale, they have become more economically viable and are attracting worldwide investment in R&D and manufacturing.
While renewable energy sources still meet only a small percentage of total global energy demand, solar and wind capacity are growing rapidly. Industry sources estimate that in 2010, approximately 17.5 GW of solar capacity came on line, an increase of approximately 119% over 2009. According to the Global Wind Energy Council (GWEC) and Jefferies & Co., 36 GW of wind generation were installed in 2010, versus 37 GW in 2009 and 27GW in 2008. Growth has been particularly strong in Europe, where the European Union's ("EU") goal to increase the share of renewable energy as a percent of total energy delivery to 20% in 2020 is driving the market. Despite continued dependence on government subsidies and the current credit-constrained environment, solar and wind energy are expected to continue to experience strong growth based on commitments by governments to support renewable energy sources and the continued decline of production costs for solar and wind systems, making them increasingly competitive with traditional energy sources.
Currently, legislation in multiple countries supports grid-tie rooftop systems installed by commercial and residential users and centralized PV generation by independent power providers and utilities. Roof-top systems generate all or some of the energy needed by the user and sell back excess power to the grid, particularly during peak generating times. Because solar energy still costs more per watt than grid-supplied electricity, the industry is reliant on various subsidies. PV technology is expected to reach grid parity, that is the cost of power from PV will equal the price of conventional power delivered to the user, in major regions within the next three to five years, having already reached grid parity in certain areas that do not have access to traditional energy sources and have high solar irradiance. It is expected that if prices decline enough to make solar energy competitive with traditional
3
energy sources, the market size would increase further, as solar would become more widely adopted by utilities. Wind energy has already reached grid parity in certain locations. IMS Research predicts that renewable energy on average will reach grid parity by 2014.
Solar and wind energy generation systems require inverters to convert electricity to feed it back to the grid. In 2010, we estimate that the market for solar inverters was over $5.0 billion, and wind inverters were over $2.0 billion. Inverters represent approximately 5-7% of the cost to install a solar system and approximately 3-5% of the cost to install a wind system. They are sold through multiple channels, including directly to the end user, or through distributors, systems integrators and OEMS. In 2009, we estimate the market for solar and wind inverters was approximately $4.0 billion, comprised of $1.8 billion for solar inverters and $2.2 billion for wind inverters. In 2008, we estimate the market for solar and wind inverters was at $2.8 billion, comprised of $1.3 billion for solar inverters and $1.5 billion for wind inverters. The primary geographic market for PV installations has traditionally been in Europe, while Asia and North America are also beginning to see significant PV investment. Wind turbine installations also initially gained strength primarily in Europe, but have seen rapid adoption in North America, Asia and other regions in recent years.
PV inverters are generally classed as either string inverters, which are typically used in rooftop applications for residences or small commercial use, or central inverters, which are predominately used for ground-mounted solar installations for larger commercial and utility applications. Power-One's string and central inverters utilize technologies that are optimized for either crystalline or thin-film solar panels.
Increasing Amounts of Power Required by the Communications Infrastructure Industry. With the development and proliferation of data centers and their related infrastructures, as well as the Internet, wireless communications, broadband applications, server and storage farms and other new technologies, recent years have witnessed unprecedented growth in the volume of information transmitted globally. We believe that the volume of broadband communication and data center usage will continue to drive a higher demand for infrastructure power and will further increase the demand for power conversion and power management products.
Increasing Demand for High Conversion Efficiencies, High-Density Power and Digital Power Management. Recent efforts in the European Union, the United States and China to reduce energy consumption are increasing the demand for high conversion efficiencies and digital power control. In addition, groups such as the Climate Savers Computing Initiative, consisting of a consortium of companies including Google and Intel and other eco-conscious businesses and conservation organizations, are promoting the development, deployment and adoption of smart technologies that can both improve the efficiency of a computer's power delivery and reduce the energy consumed when the computer is in an inactive state. Because a large portion of electrical energy waste occurs during the power conversion process, power supply companies have an opportunity to improve conversion efficiency and meet this market demand. Our AC/DC Front-end power supplies have met the target efficiency set forth by the Climate Savers as the Platinum standard within the single-output category, requiring a 94% minimum efficiency rating at 50% of rated output. Our digital power technologies allow us to achieve levels of power conversion efficiency and control that are not possible with analog designs. Higher conversion efficiencies help reduce overall power usage, and therefore cut greenhouse gas emissions and total cost of infrastructure ownership.
In addition, the digital power management market has grown as a result of the need for high-density power. Circuit boards continue to shrink despite becoming more complex, creating the need for high-density and more intelligent AC/DC and DC/DC power supplies. As the number of elements increases on circuit boards to provide more functionality, the available space for power supplies is increasingly limited. The use of digital power and digital control techniques can contribute to improved conversion efficiencies of AC/DC and board mounted DC/DC power supplies across a
4
wide range of conditions. Digital power technologies enable the OEM to utilize increased points-of-load in their products, increasing the end products' computing capabilities and performance. Digital power management reduces the footprint of DC-DC converters while increasing the product efficiency. We believe this market will be one of the fastest growing markets in power management.
Increasing Demand for High Reliability Power from Network Power Systems. Power demands from the proliferated use of internet-enabled devices, such as routers or mobile phones, is significantly different from the power provided by the electric utility grid. The electric utility grid supplies acceptable power quality, or power that is free from surges, spikes, or sags, 99.9% of the time, resulting in the equivalent of nine hours per year of interrupted, or unavailable, power. These nine hours of downtime often occur in many isolated interruptions of very short duration. In traditional industries, a brief interruption of power only interrupts operations for the time that the power is actually unavailable. For a modern communications network, however, a minor power disturbance or brief interruption could cause equipment to crash and significantly shorten the life-span of electrical components. A network crash could result in several hours of downtime, including the time necessary for complex microprocessor-based equipment to reboot and regain power. This downtime could lead to significant lost revenue and customer dissatisfaction. As a result, communications network operators demand significantly more reliable power than that provided by the electric utility grid. We believe this demand will increase as wireless communications, broadband applications and other new technologies become more pervasive in society and as society becomes more dependent on their reliability.
Our Strategy: Powering the Renewable Energy, Data Center and Communications Markets
Our primary objective is to continue to be a worldwide leader in energy-efficient power conversion and power management equipment for the global renewable energy, data center, communications equipment, industrial and telecommunications network power markets. To achieve this objective, we plan to do the following:
Continue to Invest in Renewable Energy. In 2007, we entered the commercial solar market with a series of inverter products that today range in power from 2 kW to 500 kW. Our products allow for the harvest of high levels of solar energy using single and multiple PV arrays, multiple channel and high-speed maximum power point tracking (MPPT). They operate across a wide range of voltages for longer periods of energy harvesting and high reliability.
During 2008, we began to develop wind inverter products for use in residential, commercial medium power applications, and mega turbine farms. These inverters range in power from 5kW in residential applications to 2.5MW used in large turbine farms, and are expected to improve efficiency while reducing capital cost. During the first quarter of 2010, we launched a 2.5MW wind inverter for a major offshore development. We are investing in expanding our worldwide sales and service infrastructure, focused primarily in Europe, but also in the United States and Asia, where we believe there is substantial opportunity.
Expand Product Lines in Renewable Energy. We are developing leading-edge products for future solar and wind technologies. We continue to expand our renewable energy product line to match global requirements for indoor and outdoor (NEMA3R) applications and we are investing in design and test capabilities to increase efficiency, provide higher power density products and guarantee the long-term reliability of our products.
Continue to Expand into Adjacent Markets on a Global Basis. Over the years, we expanded both the breadth of our product technologies and geographic reach of our business. While a majority of the renewable energy products were shipped to Europe, the world's largest market for PV installations, we expanded our product line to meet the needs of customers in North America and Asia. In addition, we established design, manufacturing and service operations in these new locations in order to more
5
rapidly respond to customer needs. We believe the North American and Asian markets provide substantial opportunities for growth in the next 12-18 months and beyond.
Target Data Center and Communications Markets. We continue to invest in our power solutions in order to target the growing market for higher efficiency and higher density power supplies. This market is being driven primarily by the building of large data centers necessary to support the proliferation of wireless and internet-enabled communication devices around the globe. The high power demands of the data centers put them at the forefront of greenhouse gas reduction initiatives and efforts to reduce operational costs due to the global economic downturn. We believe our high efficiency, high density and digital power management technologies are creating significant opportunity for growth in these markets over the next several years.
Continue to Support Industrial Markets. We continue to support and invest in our robust line of standard products that allow us to compete successfully across many different industrial end-market applications. The high margins in these less cost-sensitive applications help improve our margin profile. While this market has not been as sensitive to energy efficiency pressures as the computing market, we believe it will be increasingly affected as efficiency gains are harder to achieve in other markets.
License our digital power management technology. We began licensing our digital power management technology, for which we have over 32 patents and over 800 claims, to semiconductor and modular power companies in 2008. The typical terms of these non-exclusive licenses include an upfront fee plus royalties paid through a termination date that is based on the last-to-expire of the licensed patents. Currently, we have field of use licensing agreements with Linear Technology Corporation, Infineon Technologies AG, CUI Inc., Powervation Ltd., Texas Instruments, Ericsson Modules, Maxim Integrated Circuits, Lineage Power Corporation and Emerson. We expect additional companies to license our digital power technology patents during 2011.
Our Products
We design, develop, manufacture and market our products, which are designed to convert, regulate, purify, store, manage or distribute electrical power for electronic equipment. Renewable energy inverters harvest either solar or wind energy converting the DC power from solar panels or variable AC from wind turbines into conditioned AC energy for transportation on the grid. Power conversion products generally convert one voltage into another voltage (AC-to-DC) or modify the voltage being delivered (DC-to-DC), while power management products generally manage multiple voltages and provide other functionality.
Depending on our customer's needs, including the balancing of cost and time-to-market of new products, we offer standard, modified-standard and custom-designed products. Standard products refer to products that are standard to a particular manufacturer, while modified-standard products refer to standard products of a manufacturer that can be easily modified to meet a customer's particular application. Because they have already been designed and manufactured, standard and modified-standard products allow our customers to reduce their time-to-market and minimize costs for new product introductions. Custom products are usually designed to meet the specifications of a unique customer application and may require significant tool and die costs and four-to twelve-month lead-times from conception through production.
Our products can be classified into the following main groups: renewable energy inverters and associated products, AC/DC power supplies, DC/DC converters, DC power systems and a category of other products, including smart motor controls. Our silicon board power management products fall into the DC/DC converter category. These categories can be distinguished based on their location within a system, and on their size and function.
6
Renewable Energy (RE) Inverters:
- •
- convert solar (photovoltaic or "PV") or wind energy into useable grid connected power;
- •
- power a range of 2 kW to 2.5 MW;
- •
- provide software technologies to enhance control and product yield;
- •
- offer conversion efficiencies up to 98% for use in residential, commercial, and utility-grade solar panels and wind
turbine farms; and
- •
- provide monitoring of the renewable energy systems and enterprise by providing software-as-a-system (SaaS) platform.
AC/DC power supplies:
- •
- convert AC from a primary power source, such as a wall outlet, into a precisely controlled DC voltage;
- •
- are typically embedded within the equipment that they are powering;
- •
- may be standard, modified-standard or custom-designed;
- •
- are used primarily in networking systems, network servers and storage, and industrial equipment; and
- •
- include increasing product efficiency (>90%) and power densities (>20w/cu3).
DC/DC Converters ("Bricks") and POL Converters (including Digital Power Management):
- •
- modify an existing DC voltage level to a different DC voltage level to meet the power needs of various subsystems and
components within electronic equipment;
- •
- include high-density and low-density "brick" converters that are embedded within the equipment
that they are powering and are generally mounted directly on a printed circuit board within the equipment;
- •
- include Point-of-Load ("POL") converters that power devices within an Intermediate
Bus Architecture as well as in other applications. Our digital power management products fall into the DC/DC converter category and are the cornerstone of DPA and IBA technology; and
- •
- are used by our customers primarily to power communications infrastructure equipment, although their usage is expanding to other markets including server and storage.
DC Power Systems:
- •
- convert AC voltage into DC voltage and, together with a generator or an array of batteries, provide several hours of
additional power capacity in the event of an AC input disturbance or power outage;
- •
- can be either stand-alone units that are external to the equipment or sub-systems (commonly called "racks")
that are integrated into a system; and
- •
- are used primarily to power communications networks and cellular communications systems.
Smart Motor Control and Other Products:
- •
- are used primarily in sophisticated appliances, such as high-end clothes washers and dryers, and air
conditioners, where energy efficiency is very important; and
- •
- are generally board-level products or modules that are incorporated by the manufacturer in their system.
7
Restructuring
During 2009, we announced and implemented a plan to restructure our global organization in response to ongoing demand uncertainty and to exit our factory in the Dominican Republic. As a result, we reduced our global headcount by approximately 1,300, or 29% of our workforce, and incurred restructuring charges of approximately $11.4 million during the two years ended January 2, 2011. The plan was completed during the second quarter of 2010. Through implementation of these actions, we were able to (i) realign global manufacturing and sourcing; (ii) improve operational performance; (iii) increase efficiencies in the supply chain and manufacturing process and (iv) improve our ability to respond to customer requirements in a cost effective manner. During the two years ended January 2, 2011, we recorded severance benefits of approximately $7.1 million, and facilities closure charges of approximately $4.3 million related to exiting our factory in the Dominican Republic, all of which were settled in cash.
Reorganizaion
During 2010, we adopted a plan of reorganization (the "Reorganization") intended to better protect our substantial net operating loss carryforwards ("NOLs") by engaging in a two step merger, following which the Company was merged with and into New Power-One, Inc. ("New Power-One"), a newly formed company subsequently renamed "Power-One, Inc." The Reorganization was approved at the annual shareholders meeting on May 24, 2010 and consummated on June 14, 2010. The NOLs can benefit us by offsetting our U.S. federal taxable income dollar-for-dollar by the amount of the NOLs, thereby reducing or eliminating our U.S. federal corporate income tax (other than the U.S. federal alternative minimum tax) on such income. However, if there is an ownership change of the Company for tax purposes, significant limitations will be imposed on our use of the NOLs. Pursuant to the Reorganization, our charter contains restrictions on transfers of our capital stock that will reduce the risk of an ownership change for tax purposes. The purpose of the transfer restrictions is to help preserve the long-term value to us of our accumulated NOLs. At the same time, we terminated our Shareholder Rights Plan.
Sales and Marketing
We market our products through a global sales force. We have direct sales offices in Europe, North America, China, Singapore, Middle East, Australia, and are expanding into India. Our direct sales force works closely with existing and potential customers to determine their long-term technology requirements for power conversion products. This close collaboration allows us to design products that best fit our customers' expected applications. Our direct sales force is augmented by an extensive network of manufacturers' representatives and distributors.
Service
During 2010, we established a geographically-focused service program in order to provide service support to our renewable energy customers. Our renewable energy customers are purchasing a full solution to solve their business needs beginning with the base product and carried through the installation, service and maintenance of the system. Services include repair, technical support, on line support, monitoring and system integration. The services will vary based on customer geographic location, customer type, sales channel, product range, operating capability, and commercial requirements. Our service program includes both internal resources as well as 3rd party companies. In addition to service offices, we also have strategically located repair depots across Europe, China, Australia and North America in order to provide customers with pre-sale and post-sale support services.
8
Research and Development
We have spent and expect to continue spending significant capital on research and development efforts related to power conversion and power management technology. We spent approximately $23.2 million on research and development ("R&D") in 2010, approximately $15.6 million in 2009, and approximately $23.7 million in 2008. We have established engineering and design centers in areas that are strategically located for servicing our customers and where we have strong access to technical talent. Our engineering and design center in the United States is located in Carlsbad, California. We also operate engineering and design centers in Uster, Switzerland; Dubnica and Vahom, Slovakia; Valdarno, Italy; and GuangMing, China. During the first quarter of 2009, we closed our engineering and design center in Santo Domingo, Dominican Republic. Additionally, we have engineering staff at each of our manufacturing facilities as well as engineering teams at each of our power plant system integration facilities to enable more efficient customization of our system configurations for our customers.
At the beginning of the fourth quarter of fiscal 2010, we strengthened our renewable energy solutions R&D resources through the acquisition of the assets of a software firm. This acquisition included software that provides critical insight into revenue-generating renewable energy assets and provides a remote monitoring and asset management solution, increasing the value to our customers of our inverters, and added experienced software engineers to our renewable energy segment. The solution identifies and addresses problematic assets, allowing energy producers to increase energy harvest and performance ratios, cut the costs of operations & maintenance, reduce operational and financial risk, and improve return on investment.
Manufacturing Process and Quality Control
Production of many of our products typically entails subassembly of sophisticated printed circuit boards that are in turn combined with hardware components to produce a final product. In response to demand for increased quality and reliability, design complexity, and sophisticated technology, we continue to invest in state-of-the-art processes. We have also standardized many of our manufacturing processes and much of our equipment worldwide to increase efficiency and optimize flexibility between facilities.
Our manufacturing processes are designed to rapidly produce a wide variety of quality products at low cost. The use of surface mount technology, or SMT, permits us to reduce board size by eliminating the need for holes in the printed circuit boards and by allowing us to use smaller components. Our investment in SMT has significantly improved our product development processes and increased production capacity and it has also improved our product quality. We also have outsourcing arrangements with contract manufacturers in Asia.
Product quality and responsiveness to our customers' needs are critical to our ability to compete successfully and we emphasize quality and reliability in both the design and manufacturing of our products. In addition to testing throughout the design and manufacturing process, we test and /or burn-in our products using automated equipment and customer-approved processes. We also perform out-of-box tests and pre-ship audits on randomly selected units before delivery. We insist on the same levels of quality from our contract manufacturers. As a result, we have incurred and may continue to incur additional costs related to quality assurance.
As our customers' operations expand internationally, they increasingly require that their power products meet or exceed established international safety and quality standards. We therefore design and manufacture our power conversion and power management products in accordance with the certification requirements of many international agencies, including the Underwriters Laboratories in the U.S., the CSA International in Canada, and TUV Product Service for the European market. Our renewable energy products are designed to meet local safety requirements in each respective country in
9
which products are sold. In addition, various products may be tested to Network Equipment-Building System requirements for the U.S. telecommunications market and to European Telecom Standard Institute requirements for the European Union telecommunications market.
We have manufacturing operations in the United States, China, Italy and Slovakia. Production of our silicon-based products is entirely outsourced to contract manufacturers. All of our manufacturing facilities are ISO certified. In addition to our own facilities, we utilize low-cost contract manufacturing in several locations around the world, although most of our contract manufacturers are located in Asia.
Suppliers
We maintain a network of suppliers for components and other materials used in the manufacture of our power conversion and power management products. We typically design products using components readily available from several sources and attempt to minimize our use of components that we can only obtain through a single source. We procure components based upon our enterprise resource planning system and use a combination of forecasts, customer purchase orders and formal purchase agreements to create our materials requirements plan.
We occasionally use components or other materials that we can only obtain from a single source. We may seek to establish long-term relationships with such suppliers and we have volume purchase agreements with certain suppliers of key items. This practice enables us to maintain a more constant source of required supplies and produces cost savings through volume purchase discounts.
Backlog
We generally sell our products pursuant to purchase orders rather than long-term contracts. The 180-day backlog consists of purchase orders on-hand having delivery dates scheduled within the next six months. Our backlog may not necessarily be a reliable indicator of future revenue because our customers are able to cancel or modify their orders up to 60 days prior to delivery without penalty. In addition, a significant portion of our revenue is derived from "turns" business (that is, revenues from orders that are booked and shipped within the same reporting period). Under a VMI program, we manufacture products for our customers based on their forecast. As a result, the booking and billing occur simultaneously upon use of the product, and therefore there is always a book-to-bill ratio of 1.0 for these programs. We may bring additional VMI programs on-line in the future, which would result in higher "turns" business, lower backlog, and higher finished goods inventory.
Competition
In the renewable energy market, we compete with a number of companies, some of which are larger than Power-One, and have broader product portfolios and well-established distribution channels. Our competitors include SMA Solar Technology (Germany), Fronius International (Austria) KACO New Energy, Inc. (Germany), and Siemens (Germany) with new entrants into the market including General Electric (United States) and Delta (Taiwan). We compete on the basis of quality, reliability, technology, service, brand recognition, and on-time delivery. We believe that technological performance is the most important characteristic in gaining brand recognition and increasing market share and is the primary reason behind the significant growth in our revenue from the renewable energy market.
The power conversion and power management industry is highly fragmented and characterized by intense competition. No single company dominates the overall market, and our competitors vary depending upon the specific type of products they manufacture or sell. We believe that the principal bases of competition in our targeted markets are breadth of product line, technological advantages, stability and reputation of the provider, and cost. Our main competition includes companies located throughout the world, including Emerson Electric (US), Delta Electronics (Taiwan), LiteOn (Taiwan), Lineage Power (US), and Eltek Valere (Norway).
10
We believe that we have key advantages that have helped us to establish a leading brand for our products. Some of the factors that we believe have contributed to this leading position are:
Broad Product Line. We offer a broad range of products in both SBUs ranging in power from one watt to 2.5 megawatts. Our smaller products are no larger than a fingernail, while our larger DC power systems and renewable energy inverters can weigh over 3 tons. With millions of potential current and voltage configurations, our diverse product line offers our customers a one stop-shop opportunity, allowing them to purchase nearly all of their power conversion and power management products from a single supplier. As a result, we are one of the few companies that can power virtually every component and system of an infrastructure network. In addition, we offer a broad product line for renewable energy, with products for both wind and solar.
Leading Design and Development Capabilities. There are a limited number of highly skilled power engineers in the world, and we believe that we have assembled some of the most capable and innovative of such engineers through our hiring efforts and through strategic acquisitions. Furthermore, we have been effective at maintaining a high retention rate among our technical staff. This team of engineering talent has allowed us to consistently upgrade to new generations of power conversion and power management products, each of which has outperformed prior products with higher power density and smaller size. It has enabled us to become a market leader in the segments in which both SBUs compete.
Our design centers are equipped to deliver innovative designs for the renewable energy and power conversion and power management markets. In addition to excellent engineering resources, we equipped our laboratories with design and simulation software, advanced test equipment and product certification capabilities. Design activities are governed by marketing defined product roadmaps and custom requirements. To satisfy technological advances we collaborate with leading universities. Our main technology focus is; advanced circuit topologies, digital controls, innovative packaging and thermal management technologies, as well as cost competitive designs. Our products achieved the following performance differentiating features:
- •
- Renewable Energy
- •
- High energy harvesting
- •
- High power conversion efficiencies
- •
- High-speed and multiple channel maximum power point tracking (MPPT)
- •
- Broad range of voltage inputs
- •
- Field-proven reliability and high availability
- •
- Power Conversion (AC/DC and DC/DC Board Mounted Power):
- •
- High power densities
- •
- High efficiencies
- •
- Digital controls
Reputation for Quality and Reliability. We have been in the power conversion and power management product industry since 1973. By establishing rigorous internal quality control programs, we believe that we have been able to provide our customers with products that are highly reliable.
In the renewable energy industry, the inverter is seen as a single point of failure and the critical component in the PV array or the wind turbine. As a result, the operators cannot afford to have their system fail due to product failure. Our inverter products have established a reputation for high reliability, with longer uptimes and longer mean-time between failures than many of our competitors,
11
due in part to our modular design and other engineering factors. We believe this is a major factor in our recent market share growth in the inverter industry.
In the communications infrastructure industry, we have established a strong customer base that includes many of the industry's largest manufacturers, as a result of our focus on quality. Although power conversion products typically represent only 2% to 5% of the cost of an entire network, their failure can cripple the entire system in which they are installed. Consequently, we believe most customers are not willing to risk buying from an unproven supplier in an effort to cut costs in this area.
Intellectual Property Matters
We consider our intellectual property to be very important and valuable, and we have made intellectual property protection a key element of our overall business strategy. We rely on a combination of patent, trade secret and other intellectual property laws, confidentiality agreements executed by most of our exempt employees and other measures to protect our proprietary rights. We currently maintain 116 active U.S. patents, many of which are protected by corresponding foreign patents in selected jurisdictions. Additional U.S. and foreign patent applications are pending. We hold 10 U.S. registered trademarks with additional trademark applications pending, and we claim common law trademark rights to additional marks. We consider our intellectual property in the area of digital power management and control, including trademarks and patents that we have secured and are continuing to seek in that area, to be of particular importance and strategic significance. These particular patents have all been issued since 2004 and have patent terms extending for approximately 20 years from date of grant. See "Risk Factors—We face, and might in the future face, intellectual property infringement claims by competitors and actions by foreign governments that could adversely affect our intellectual property rights, which in turn could adversely affect our sales."
Employees
At January 2, 2011, we employed 3,470 employees at our facilities in the following functions:
Function
|
Number of Employees |
|||
|---|---|---|---|---|
Manufacturing |
2,734 | |||
Research and development |
395 | |||
General and administrative |
173 | |||
Sales and marketing |
168 | |||
Total |
3,470 | |||
In certain foreign locations, our employees operate under labor unions or work counsels. We believe that our continued success depends, in part, on our ability to attract and retain qualified personnel. We consider our relations with our employees to be good.
Company Website, Corporate Governance Website and Access to Company Filings
We post all of our periodic reports on Form 10-K and 10-Q, current reports on Form 8-K, and amendments to these reports filed or furnished pursuant to the Securities Exchange Act of 1934 on our website at www.power-one.com as soon as reasonably practicable after we file or furnish the reports with the Securities and Exchange Commission. Access to these reports is free of charge. In addition, we maintain a Corporate Governance section on our Website to provide the investor community with easy access to relevant information about our corporate governance. The public may read and copy any materials that we file with the SEC at the SEC's Public Reference Room at 100 F Street, NE, Washington, DC 20549, and the public may obtain information on the operation of the Public Reference Room by calling the SEC at 1-800-SEC-0330. In addition, the SEC maintains an Internet site that contains reports, proxy and information statements, and other information regarding issuers that file electronically with the SEC at http://www.sec.gov.
12
EXECUTIVE OFFICERS OF THE REGISTRANT
Set forth below is certain information concerning our executive officers.
Name
|
Age(1) | Position | |||
|---|---|---|---|---|---|
Richard J. Thompson |
61 | President and Chief Executive Officer | |||
Gary R. Larsen |
47 | Senior Vice President, Finance, and Chief Financial Officer | |||
Alexander Levran |
60 | President, Renewable Energy Solutions | |||
Neil Dial |
59 | Senior Vice President, Operations | |||
Steve Hogge |
53 | President, Power Solutions | |||
Tina D. McKnight |
53 | Secretary and General Counsel | |||
- (1)
- As of March 15, 2011

|
Richard J. Thompson. Mr. Thompson joined us as our Chief Executive Officer in February 2008. Before joining Power-One as an executive officer, Mr. Thompson served as a member of the Company's Board of Directors since August 2007. Mr. Thompson continues to serve on the Board of Directors. Mr. Thompson served as Senior Vice President, Finance and Chief Financial Officer of American Power Conversion Corporation (acquired by Schneider Electric in February 2007) from May 2005 to March 2007. Prior to joining American Power Conversion Corporation, Mr. Thompson served as Chief Financial Officer, Secretary and Treasurer of Artesyn Technologies for fifteen years. Mr. Thompson earned his BBA from Lamar University in Beaumont, Texas. |
|

|
Gary R. Larsen. Mr. Larsen joined Power-One in August 2010 as our Senior Vice President, Finance and Chief Financial Officer. Before joining us, Mr. Larsen was most recently serving as the CFO of AuthenTec, Inc., a provider of security identity management and touch control solutions since December 2006. Prior to joining AuthenTec, Mr. Larsen served as the CFO of Artesyn Technologies, Inc., a global power conversion and embedded systems manufacturer from May 2005 until November 2006, and as Artesyn's Controller from May 1999 until April 2005. Mr. Larsen also has held various financial positions with W.R. Grace & Co., from April 1988 until April 1999, and was with KPMG Peat Marwick LLP prior to joining W.R. Grace. Mr. Larsen holds a BS in Finance and Accounting from State University of New York at Buffalo and an M.B.A from New York University. |
13

|
Alexander Levran. Dr. Levran, who joined Power-One, Inc. in January 2007 as Chief Technology Officer, became the President of the Renewable Energy Solutions SBU in April 2010. Dr. Levran previously served as Executive Vice President and Chief Technology Officer of Magnetek, Inc. from July 1993 to December 2006. Dr. Levran received his B.S.E.E., and M.S.E.E. from Technion-Israel Institute of Technology, Haifa, Israel. He received his Ph.D. in Electrical Engineering from Polytechnic Institute of NY. Dr. Levran is a Director of the Power Sources Manufacturers Association, and is active in other industry associations and standards bodies. Dr. Levran holds a number of U.S. and foreign patents in the field of power conversion and electronics. |
|

|
Neil Dial. Neil Dial joined Power-One in October 2008 as our Senior Vice President, Operations. Prior to joining the Company, Mr. Dial served as Vice President, North American Operations, at Plexus Corporation, an electronic manufacturing service provider, from September 2002 to September 2008. Mr. Dial has also held senior management positions at Dell Computer, Adflex Solutions, Motorola, and Texas Instruments. Mr. Dial graduated from the University of Northern Iowa with a BA in Business Administration and from the University of Northern Colorado with a Masters in Management. |
|

|
Steve Hogge. Mr. Hogge joined the Company in July 2010 as President of the Power Solutions SBU. Prior to joining the Company, Mr. Hogge held several senior management positions at Cooper Industries from 1998 to June 2010 including serving as Vice President and General Manager for Cooper Bussmann's Electronics and Transportation business units, as well as serving as Managing Director of Bussmann's Asia Pacific operations. Prior to Cooper, Mr. Hogge also held senior management positions at Bourns Inc. and Raychem Corporation. Mr. Hogge holds an MBA from New York University's Stern School of Business and a B.S. in Electrical Engineering from the U.S. Naval Academy, Annapolis MD. |
|

|
Tina D. McKnight. Ms. McKnight joined Power-One in December 2008 as Secretary and General Counsel. Before joining Power-One, Ms. McKnight served as Senior Vice President and General Counsel of BCBG Max Azria Group, an international retailer, from December 2007 to November 2008. Prior to that she served as General Counsel and Secretary to Magnetek, Inc., a global power supplies and renewable energy business, from September 2000 to December 2006. Ms. McKnight has also held in-house legal positions with Natrol, Inc. and Great Western Financial Corporation and was an attorney in the Los Angeles office of Brobeck, Phleger and Harrison after graduating from law school. Ms. McKnight earned her J.D. from the University of Southern California's Gould School of Law and her B.A. from the University of California, Los Angeles. |
Our officers serve at the discretion of the Board.
14
We are a worldwide organization and leading designer and manufacturer of inverters for the renewable energy industry and make hundreds of high-quality brand name AC/DC and DC/DC power supplies, converters, and power management products for the servers, storage, networking, network power systems and industrial markets. We sell our products to original equipment manufacturers ("OEM"), distributors, engineering, procurement and construction ("EPC") firms, and service providers who value quality, reliability, technology and service. We have established a broad and global customer base.
Our future results of operations are subject to risks and uncertainties over which we have limited control and which could cause our actual results to differ materially from our expectations. We are subject to all of the business risks facing manufacturing companies, including business cycles and trends in the general economy, financial market conditions, demand variations and volatility, potential loss of key personnel, supply chain disruptions, government legislation and regulation, and natural causes. The following list of risk factors is not all-inclusive. Other factors and unanticipated events could adversely affect our financial position or results of operations. We believe that the most significant potential risk factors that could adversely impact us are the following:
Changes in demand or downturns in the renewable energy, communications infrastructure, server/storage or industrial markets could affect our business and profitability.
A majority of our sales in the past year have been to companies in the renewable energy industry. We expect our sales to renewable energy companies to continue to be significant in the future, and we are also pursuing customers in other industries, including the server/storage, network power systems , communications, medical, defense and transportation industries, among others. All of these industries are highly cyclical and may experience downturns. These industries also experience volatility, and future volatility as well as downturns in any of these industries, or any failure of these industries to recover from downturns, could materially harm our business and profitability. Likewise, if we have difficulty managing growth in this business, it could materially and adversely affect us. In addition, our business and financial position may be adversely affected by current and future economic conditions that cause a decline in business and consumer spending in the markets served by our or our customer's products.
Feed-in tariff and subsidy reductions could impact revenue and results of operations in the renewable energy markets.
Feed-in tariffs have been a significant driver in the growth of the solar industry, with countries throughout the world providing incentives to spur adoption of renewable energy. While many countries, including the United Kingdom, certain regions in the United States and Canada, India and China, are beginning to adopt feed-in tariffs and varying subsidies, others are re-evaluating the level of incentive they wish to provide. A number of countries, including Germany, Italy and the Czech Republic, have proposed reductions to their feed-in tariffs. As we do significant business in these regions, the proposed reductions could negatively affect the results of our operations. Such a reduction in the feed-in tariff, including any potential further reductions, could result in a significant decline in demand and price levels for renewable energy products, which could have a material adverse effect on our business, financial condition and results of operations.
Failure to anticipate trends in the mix of renewable energy and power conversion products that our customers will demand may adversely affect our business.
During 2007 and 2008, we entered the solar and wind markets which are fast growing markets in their infancy, and the trends within the industry have not yet been well established. Failure to forecast trends within the industry, may negatively impact us if we are not able to fulfill our customers' needs.
15
While we are investing in expanding our worldwide sales and service, in Europe, North America and Asia, in order to focus on our customer's needs and better align our strategy to meet those needs, there can be no assurance that such investments will result in increased revenue or allow us to better address trends within the industry. Because we have many customers in the communications infrastructure industry, the factors and economic trends that affect these companies also affect our business. The communications infrastructure industry has experienced rapid change in recent years. To respond to the needs of our customers in the communications infrastructure industry, we must continuously develop new and more advanced products at lower prices. We have made and will continue to make significant investments in next generation technologies, but there can be no assurance that the resulting products will be successful or that we will recoup our research and developments costs through increased sales.
We may fail to capture customers in the new markets that we are pursuing.
We are pursuing customers in new markets, most notably for our digital power management products, renewable energy, and in the server/storage industry. While we have secured design wins and order commitments from significant customers in these industries in the past, there can be no assurance that these design wins and order commitments will turn into revenue in the quantity or timeframe projected. We have made investments in our infrastructure, increased our operating costs and have forgone other business opportunities in order to service these new potentially significant customers. Failure of these design wins to translate into revenue in the quantities or timeline projected could have a materially adverse impact on our revenue, operating results and financial stability.
Cancellations, reductions or delays in purchases could cause our quarterly results to fluctuate.
We do not obtain long-term purchase orders or commitments from our customers, and therefore customers may generally cancel, reduce or postpone orders without penalty, outside of a 60 day delivery window. Cancellations, reductions and delays in orders could reduce our net sales and profitability. Our expense levels are based, in part, on expected future revenues and are relatively fixed once set. Our expectations for net sales beyond 90 days are based partially on our own estimate of future demand and partially on customer orders. However, we are limited in our ability to reduce expenses quickly if, for any reason, net sales do not meet our expectations in a particular period. Therefore, fluctuations in net sales, particularly if customers cancel, postpone or delay orders, may adversely impact our operating results.
Fluctuations in customer needs may also affect our mix of products sold and our volume of products orders, which in turn would affect our gross margin and operating results. In addition, high-volume orders, if cancelled, may increase the risk of inventory obsolescence and asset write-offs due to excess capacity.
We are subject to credit risks.
Some of our customers have experienced and may continue to experience financial difficulties and/or have failed to meet their financial obligations to us. As a result, we have incurred charges for bad debt provisions related to some trade receivables. In certain cases where our end-customers utilize contract manufacturers or distributors, our accounts receivable risk may lie with the contract manufacturer or distributor and may not be guaranteed by the end-customer. In addition, in connection with the growth of the renewable energy market, we are gaining a substantial number of new customers, some of which have relatively short histories of operations or are newly formed companies. As a result, it is difficult to ascertain financial information in order to appropriately extend credit to these customers. If more customers fail to meet their financial obligations to us, or if the assumptions underlying our recorded bad debt provisions with respect to receivables obligations do not accurately reflect our customers' financial conditions and payment levels, we could incur additional write-offs of
16
receivables in excess of our provisions, which could have a material adverse effect on our cash flow and operating results.
Vendor managed inventory programs give rise to variability in our revenue and operating results.
Certain significant customers purchase products from us through vendor managed inventory, or VMI, programs. For VMI programs, we build product to the customer's forecasts and the inventory is physically located at a site controlled by the customer, but the sale of product does not occur until the customer uses the inventory. We therefore cannot predict when the sale may occur, and this in turn may result in variability in our net sales and operating results and higher inventory balances.
We rely on a few major customers for a material portion of our business and the loss of any of those customers, or a change in our product mix, could reduce our net income and operating results.
Historically, a few customers accounted for a material portion of our net sales each year. For 2010, 2009 and 2008, our top five customers accounted for approximately 20%, 24% and 25% of our net sales, respectively. If we lose any of these key customers, if any of them reduces or cancels a significant order, if any of them experiences significant financial or other failure, or if our product mix changes significantly in favor of products that have lower gross margins, our net sales and operating results could decrease significantly.
We may experience manufacturing and supply chain problems that can cause an inability to deliver product on time.
We have experienced difficulties in aligning demand forecast with factory loading, materials procurement, and manpower utilization, such that certain delivery commitments have been missed, delayed, or rescheduled. Also, we may fail to adequately respond to unplanned increases in customer demand due to capacity constraints and material shortages on longer lead-time components. As demand on semiconductor companies has increased during 2009 and 2010, we have experienced difficulties in obtaining key components at the historical lead-times. While we have initiated actions that we believe will limit our exposure to these problems, the dynamic business conditions in many of our markets may challenge these solutions and these or similar issues may recur in the future.
We manufacture products at various facilities around the world. Any disruption of operations at those facilities, including through natural disaster, terrorist attack, labor strike or work stoppage, or other events that may be outside of our control, could seriously impact our business and profitability.
In addition, some of our products are manufactured, assembled and tested by third party subcontractors and contract manufacturers located in Asia. While we have had relationships with many of these third parties in the past, we cannot predict how or whether these relationships will continue in the future. In addition, changes in management, financial viability, manufacturing demand or capacity, or other factors at these third parties could hurt our ability to have our products manufactured.
We also transfer the production of certain products between our internal factories as well as between our contract manufacturers. These product transfers may cause delays in the production and shipment of certain products. Furthermore, due to the amount of time often required to qualify manufacturers, assemblers and testers, both on our part and by some of our customers, we could experience delays in the shipment of our products to customers and distributors if we are forced to find alternative third parties to manufacture, assemble or test products. These delays could adversely affect our business and profitability.
17
We face intense industry competition, price erosion and product obsolescence, which, in turn, could reduce our profitability.
We operate in an industry that is generally characterized by intense competition and rapid technological change. We believe that the principal bases of competition in our markets are breadth of product line, quality of products, stability, reliability and reputation of the provider, along with cost. Quantity discounts, price erosion, and rapid product obsolescence due to technological improvements are therefore common in our industry as competitors strive to retain or expand market share. Product obsolescence can lead to increases in unsellable inventory that may need to be written off and therefore could reduce our profitability. Similarly, price erosion can reduce our profitability by decreasing our revenues and our gross margins. In fact, we have seen price erosion over the last several years on most of the products we sell, and we have factored additional price erosion into our forecasts.
Our long-term operating results depend substantially upon our ability to continually develop, introduce, and market new and innovative products, to modify existing products, to respond to technological change, and to customize certain products to meet customer requirements. There are numerous risks inherent in this process, including the risks that we will be unable to anticipate the direction of technological change or that we will be unable to develop and market new products and applications in a timely fashion to satisfy customer demands, which could result in a decrease in our net sales and a loss of market share to our competitors. Historically, we have had write-offs of excess and obsolete inventory which negatively impacted our results of operations. In the future, excess or obsolete inventory may need to be written-off, and this in turn could reduce our profitability.
Our inventory levels may be too high or too low.
During periods of growth and high demand for our products, we may not have adequate supplies of inventory on hand to satisfy our customers' needs. Furthermore, during these periods of growth, our suppliers may also experience high demand and therefore may not have adequate levels of the components and other materials that we require to build products so that we can meet our customers' needs. As a result, it may take us longer to procure sufficient components for building products than our customers are willing to accept, and we therefore may lose sales. This could negatively affect our profitability.
In addition, we may transfer production between our facilities or our contract manufacturers. During the periods in which production is being transferred, we may be required to maintain inventory at both locations to ensure a seamless transition between factories.
We may choose to mitigate these risks by purchasing and maintaining higher inventory levels in order to better meet our customers' needs during these periods of growth, high demand, and production transfers. However, increased inventory levels could lead to increases in excess and obsolete inventory if these periods of high demand do not materialize or if there are unexpected changes to our product mix or our forecasts are otherwise inaccurate.
Much of our business is subject to risks associated with operations in foreign countries.
We generate a significant percentage of our revenue internationally through sales offices located throughout Europe and Asia, and many of our operations are located outside of the United States. For example, manufacturing is performed in our own facilities in, China, Italy and Slovakia, and at contract manufacturers in Asia and Canada. We expect to continue to build, acquire or move operations to lower cost locations, and there are inherent risks from operating overseas that may impact our business. For example, we face risks that the countries in which we conduct business or in which we have customers, suppliers, or contract manufacturers could:
- •
- Experience financial, economic or political instability;
18
- •
- Have an undeveloped rule of law or judicial system making the enforcement of our contractual or other legal rights and
remedies difficult or uncertain;
- •
- Provide inadequate intellectual property protection for our technology;
- •
- Impose restrictions on the export or import of technology that would affect our ability to obtain supplies from, or sell
products into, such countries;
- •
- Impose tariffs, quotas, taxes, other market barriers; or
- •
- Impose other laws, regulations or policies adversely affecting trade, investment or taxes, including those relating to the repatriation of funds and to withholding taxes.
In addition, because of our international operations, we face additional risks such as:
- •
- Currency risk, since we increasingly receive payments and purchase components in foreign currencies, and we have
historically not engaged in foreign currency hedging activities;
- •
- Compliance with laws and regulations in various regions in which we operate;
- •
- Reliance on overseas contract manufacturers that may not be able to manufacture and deliver products in the quantity,
quality and timeline required;
- •
- Greater difficulty and longer delays in collecting accounts receivable from international customers; and
- •
- Increased challenges to management associated with overseeing operations that are geographically dispersed across Europe
and Asia, particularly in countries where we have not historically done business and where we therefore may not be familiar with laws, regulations and business practices.
- •
- Increased risk of shipping disruptions particularly in foreign countries experiencing political instability.
Environmental, health and safety laws may restrict our operations.
We are subject to local laws and regulations in various regions in which we operate, including for example the United States, the European Union ("EU") and China. We face risks in complying with, or seeking to conduct our business in connection with various local laws and regulations, including directives like Restriction of Certain Hazardous Substances Directive ("RoHS"), Waste Electrical and Electronic Equipment Directive ("WEEE"), and Regulation No 1907/2006 on the Registration, Evaluation, Authorization of Chemicals ("REACH") that were issued by the EU, and Management Measures on Electronic Information Product Pollution Control issued by China. We believe we are in compliance with the existing directives; however the authorities have the ability to review and challenge our compliance which could result in additional costs. We also face risks that our products may not be compliant with future directives, which may result in reduced sales and also in additional excess and obsolete inventory risk related to non-compliant inventory. Costs of compliance with environmental, health and safety laws may also have a material adverse impact on our net sales and operating results.
Our success depends on our ability to retain our senior management and to attract and retain key personnel.
Turnover in key management positions could temporarily harm our financial performance and results of operations. In addition, if we lose certain members of our senior management, our operations may be disrupted and our operating results could be adversely affected. In addition, our capacity to develop and implement new technologies depends on our ability to employ personnel with highly technical skills. Competition for such qualified technical personnel in our industry is intense due to the
19
relatively limited number of power supply engineers worldwide, and we believe that this supply will remain constrained because of the limited number of engineering students concentrating on power conversion. If we cannot attract and retain key technical personnel, our technical expertise may suffer, and our operating results could be adversely affected. In addition, it could be difficult, time consuming and expensive to replace any key management member or other critical personnel and we cannot assure you that we will be able to recruit suitable replacements or assimilate new key management personnel into our organization to achieve our operating objectives.
Failure of our information technology infrastructure to operate effectively could adversely affect our business.
We depend heavily on information technology infrastructure to achieve our business objectives. If a problem occurs that impairs this infrastructure, the resulting disruption could impede our ability to record or process orders, manufacture and ship in a timely manner, or otherwise carry on business in the normal course. Any such events could cause us to lose customers or revenue and could require us to incur significant expense to remediate.
A prolonged economic slowdown or a lengthy or severe recession could hurt our operations, particularly if it results in a decline in profitability in the communications infrastructure and server/storage industries.
The risks associated with our business are more acute during economic slowdown or recession. These periods may be accompanied by decreased demand for our customers' products and weakness in our customers' businesses that result in decreased demand for, or additional downward pricing pressure on, our products. Accordingly, any prolonged economic slowdown or a lengthy or severe recession could have a material adverse effect on our results of operations, financial condition and business prospects.
Capital and credit markets continue to experience volatility and the availability of funds remains limited, and more recently is adversely affecting the European markets. Over half of our revenues are derived from European customers. Their ability to access the capital and credit markets may be limited by these or other factors at a time when they would like, or need to do so, which could have an impact on our ability to maintain or increase our current revenue levels.
Tax positions taken or failure to accumulate and consider relevant tax information may result in non-compliance with tax regulations or adverse tax consequences.
We conduct business in many countries, which requires us to interpret the income tax laws and rulings in each of those taxing jurisdictions. Due to the combined impact of tax laws between those jurisdictions, as well as the subjectivity of factual interpretations, our estimates of income tax liabilities may differ from actual payments or assessments. Claims from taxing authorities related to these differences could have an adverse impact on our operating results and financial position. In addition, we have accumulated significant net operating loss carry-forwards (NOLs) in the U.S. which are subject to section 382 of the Internal Revenue Code. Limitation of our NOLs under section 382 could have a material adverse impact on our future operating results.
Market fluctuations or volatility could cause the trading price of our common stock to decline and limit our ability to raise capital.
The stock market in general and the market for stocks of power conversion and power management companies in particular have experienced price and volume fluctuations, often unrelated to the operating performance of the affected companies. We believe that such volatility contributes to the decline in the trading price of common stock and that such volatility may negatively impact our
20
stock price. Trading volumes of our common stock can increase dramatically, resulting in a volatile trading price for our common stock. In addition, the trading price of our common stock could decline significantly as a result of sales of substantial number of shares of our common stock, or the perception that significant sales could occur.
We are subject to risks associated with future company and technology acquisitions, divestitures, joint ventures and strategic investments.
We may continue to pursue acquisitions and disposals of businesses, products and technologies, or enter into joint ventures and equity investment arrangements, that could complement or otherwise enhance our business. The negotiation of potential acquisitions, divestitures, joint ventures or investments as well as the integration of an acquired business, product or technology could require us to incur significant costs and divert management's time and resources. Further, if a transaction doesn't occur, those economic and opportunity costs cannot be recouped. Future transactions by us could result in the following consequences:
- •
- dilutive issuances of equity securities;
- •
- incurrence of debt and contingent liabilities;
- •
- impairment of tangible and intangible assets;
- •
- research and development write-offs; and
- •
- other acquisition-related expenses.
We may also encounter difficulties in integrating acquired assets with our operations. Furthermore, we may not realize the benefits we anticipated when entering into these transactions. In addition, after we complete an acquisition, our management must be able to assume greater responsibilities, and this in turn may divert their attention from our existing operations. Any of the foregoing could have a material adverse effect on our financial position and results of operations.
We face, and might in the future face, intellectual property infringement claims by competitors and actions by foreign governments that could adversely affect our intellectual property rights, which in turn could adversely affect our results.
We rely upon a combination of patents, trademarks, contractual provisions and trade secret laws to protect our proprietary rights in certain of our products. We have from time to time received, and may in the future receive, communications from third parties asserting patent or other intellectual property rights that are alleged to cover our products, some of which in the past have resulted in litigation. See "Item 3. Legal Proceedings". We have in the past initiated lawsuits against companies whom we believe are violating our intellectual property and we may bring such lawsuits in the future, further increasing our costs. If we do not prevail in any such litigation, our business may be adversely affected.
In addition, our industry is characterized by uncertain and conflicting intellectual property claims and vigorous protection and pursuit of intellectual property rights or positions, which have on occasion resulted in significant and often protracted and expensive litigation. See "Item 3. Legal Proceedings". We cannot assure that intellectual property claims will not be made against us in the future or that we will not be prohibited from using our technologies subject to any such claims or that we will not be required to obtain licenses and make corresponding royalty payments. In addition, the necessary management attention diverted to litigation, along with the associated legal costs, could have a significant adverse effect on operating results. In addition, competitors (either individually, or via alliance-type arrangements) may release infringing product(s) prior to or after any court ruling or other judicial action which upholds or supports our intellectual property rights, with the goal of securing market share with competing product. Significant costs associated with litigation, slower-than-expected
21
adoption rates of our new products, and competitor introductions of competing products could individually or in combination have a material adverse impact on our operating results.
Protecting our global intellectual property rights and contending with unlicensed copying and use of our products and other intellectual property is difficult. While piracy adversely affects U.S. revenue, the impact on revenue from outside the U.S. is more significant, particularly in countries where laws are less protective of intellectual property rights. As a result, our revenue in these markets will grow more slowly than the underlying power conversion and power management markets. Similarly, the absence of harmonized patent laws makes it more difficult to ensure consistent respect for patent rights. We currently own patents and continue to apply for additional patents, but the applicable governing patent office may reject some or all of our patent applications. The patents that we ultimately receive may not provide us with a competitive advantage or create a sufficiently broad claim to protect the technology that we develop.
Pending or future litigation could have a material adverse effect on our operating results and financial condition.
We are involved, from time to time, in litigation incidental to our business, including, but not limited to litigation related to product liability, patent infringement, contracts, employment and labor issues. Such litigation could result in substantial costs and could divert management's attention and resources which could harm our business. See "Item 3. Legal Proceedings". Risks associated with legal liability are often difficult to assess or quantify, and their existence and magnitude can remain unknown for significant periods of time. In cases where we record a liability, the amount of our estimates could be wrong. As a result, there can be no assurance that the actual outcome of pending or future litigation will not have a material adverse effect on our results of operations or financial condition.
We are subject to internal control evaluations and attestation requirements of Section 404 of the Sarbanes-Oxley Act.
Pursuant to Section 404 of the Sarbanes-Oxley Act of 2002, we must include in our Annual Report on Form 10-K management's report on internal control over financial reporting and an attestation by our independent registered public accounting firm on our internal control over financial reporting. Ongoing compliance with these requirements is complex, costly and time-consuming. We may be subject to regulatory sanctions and our reputation may decline if we fail to maintain effective internal control over financial reporting, if our management does not timely assess the adequacy of such internal control, or if our independent registered public accounting firm does not timely attest to the evaluation.
Certain provisions in our charter documents and Delaware law may hinder or prevent a change in control of our company.
Certain provisions of our Certificate of Incorporation and Bylaws could make it difficult for a third party to obtain control of the Company. For example, stockholders must timely inform our corporate secretary before a stockholders' meeting of any business they wish to discuss and any directors they wish to nominate. In addition, only our directors have the ability to call a special meeting of our stockholders, and our Certificate of Incorporation requires approval of the holders of at least 75% of our voting stock, together with the approval of the holders of the majority of our voting stock (exclusive of stock held by holder of 5% or more of our stock), to amend certain provisions. Subject to the rules of the NASDAQ Stock Market, our Board of Directors may also be able to issue preferred stock without stockholder approval. Stockholder rights could be adversely affected by the rights of holders of preferred stock that we issue in the future. Finally, following consummation of the Reorganization, our Certificate of Incorporation contains certain provisions which restrict any person from buying our stock if the transfer would result in a stockholder, or "group" of stockholders under
22
federal tax law, owning 5% or more of our outstanding stock. Any one of the provisions discussed above could discourage third parties from obtaining control of us. Such provisions may also impede a transaction in which our stockholders could receive a premium over then-current market prices and our stockholders' ability to approve transactions that they consider in their best interests.
ITEM 1B—UNRESOLVED STAFF COMMENTS
None.
The table below lists our principal facilities currently in operation.
Location
|
Approximate Size (square feet) |
Employees | Primary Activity | |||||
|---|---|---|---|---|---|---|---|---|
Camarillo, California |
98,000 | 123 | Administration, Warehousing, Marketing and Sales | |||||
Phoenix, Arizona |
100,000 | 12 | Administration and Manufacturing | |||||
Dubnica Nad Vahom, Slovakia |
245,000 | 797 | Administration, Manufacturing and Systems Integration, Warehousing, R&D | |||||
Valdarno, Italy |
170,000 | 510 | Administration, Manufacturing and Assembly, Warehousing, R&D, Marketing and Sales | |||||
Guangming, China |
227,000 | 1,809 | Administration, Manufacturing and Assembly, Warehousing, Marketing and Sales | |||||
We believe that the facilities we now use are adequate for our current and anticipated operating needs. We own facilities in Italy, Slovakia and Switzerland. We lease the remainder of our facilities pursuant to lease agreements with expiration dates through 2014 in Asia, 2015 in North America and 2016 in Europe. We believe that we will be able to renew these leases with similar terms upon expiration. If we cannot renew, we believe that we could find other suitable premises without any material adverse impact on our operations. We exited our factory in the Dominican Republic at the end of the first half of 2010.
SynQor, Inc. v Power-One, Inc, et. al. United States District Court, Eastern District of Texas, Civil Action No. 2:07cv497 TJW/CE. This action was initiated by SynQor, Inc. against the Company and eight other power supply manufacturers on November 13, 2007. The complaint alleges that certain products of the Company infringe certain patents held by SynQor in relation to unregulated bus converters and/or point of load (POL) converters used in intermediate bus architecture power supply systems. The Company filed its answer to the complaint denying infringement of the patents alleged, denying all claims of SynQor for entitlement to damages or other relief, and asserting various affirmative defenses, including invalidity and unenforceability of the applicable patents. Two new patents were subsequently issued to SynQor and SynQor filed motions for leave to amend its complaint to add claims for infringement of the two new patents. SynQor's motions were opposed by the Company and its codefendants, but on September 18, 2009 the Court granted SynQor's motions and deemed the amended complaints filed as of the dates SynQor's motions were filed (July 7, 2009 for the second amended complaint (adding the '083 patent) and July 21, 2009 for the third amended complaint (adding the '702 patent)). On October 2, 2009 Power-One filed its response to the third amended
23
complaint. The claim construction hearing took place in Marshall, Texas on July 13, 2010 and the court issued its Markman ruling on July 26, 2010, substantially adopting Power-One's construction of certain key terms. The parties participated in mediation in September 2010 but were unsuccessful in resolving the dispute. The case went to trial in December 2010 and the jury returned a verdict in favor of SynQor on December 21, 2010, finding that all of the defendants directly or indirectly infringed all of the claims in the five patents-in-suit and finding Power-One liable for damages in the amount of approximately $25.6 million. The patents-in-suit are United States patents and the decision covers only the sales of infringing products in the United States.
On January 24, 2011, the Judge entered a permanent injunction, enjoining all of the defendants from manufacturing, using, selling and offering for sale in the United States, and/or importing into the United States, certain families of unregulated and semi-regulated bus converters. Although the Company did not believe that the verdict or the injunction would materially impact its Power Solutions business, it joined with the other defendants in filing an emergency motion to stay the injunction and on January 25, 2011 the Judge entered a temporary stay of the injunction until January 28, 2011. On January 31, 2011, Power-One and its co-defendants filed an emergency motion with the United States Court of Appeals for the Federal Circuit, requesting a partial stay of the injunction to permit certain identified customers to continue purchasing the enjoined products for a limited transition period. That day, the Federal Circuit entered a temporary stay order and directed SynQor to file a response by February 4, 2011. On March 2, 2011 the parties were notified that the Appeal had been selected for the Federal Circuit's mandatory Appellate Mediation Program and that an initial mediation session had been scheduled for March 30, 2011.
A final judgment has not yet been entered in the case; however the Company believes that errors were made during the trial and that there is a strong basis for an appeal. The Patents and Trademarks Office is also re-examining four of the five SynQor patents and has issued office actions that preliminarily reject the claims in two of the four patents. Including interest and other items, the Company believes that its maximum exposure related to this matter is $29.2 million. The Company has accrued $22.1 million representing what it believes to be probable and reasonably estimable based on its discussion with and analysis by counsel of the basis for its appeal.
The Company is involved in certain claims and legal proceedings which have arisen in the normal course of business. Management does not believe that the outcome of any currently pending claims or legal proceedings in which the Company is involved will have a material adverse effect on the Company's consolidated financial position, results of operations or cash flow.
24
ITEM 5—MARKET FOR REGISTRANT'S COMMON EQUITY, RELATED STOCKHOLDER MATTERS AND ISSUER PURCHASES OF EQUITY SECURITIES
Our Common Stock is listed on the NASDAQ Global Market and is traded under the symbol "PWER." The following table sets forth, for the quarterly periods indicated, the range of high and low closing sale prices for our common stock.
| |
Year Ended | ||||||||||||
|---|---|---|---|---|---|---|---|---|---|---|---|---|---|
| |
January 2, 2011 |
January 3, 2010 |
|||||||||||
| |
High | Low | High | Low | |||||||||
First Quarter |
4.51 | 3.10 | 1.35 | 0.35 | |||||||||
Second Quarter |
8.80 | 4.08 | 1.63 | 0.86 | |||||||||
Third Quarter |
12.78 | 7.61 | 1.91 | 1.20 | |||||||||
Fourth Quarter |
11.14 | 8.65 | 4.60 | 1.88 | |||||||||
As of March 7, 2011, there were 40,859 holders of record of our common stock.
We have not paid any cash dividends on our common stock and do not anticipate paying cash dividends in the foreseeable future. Existing and future debt, credit and similar agreements may limit or restrict the Company's ability to pay dividends or repurchase its common stock.
Securities Authorized for Issuance Under Equity Compensation Plans
The information required by this item will be contained in our definitive Proxy Statement related to our 2011 Annual Meeting of Stockholders and is incorporated herein by reference.
25
Performance Graph
The following performance graph compares the yearly percentage change in the Company's cumulative total shareholder return to the cumulative total return of the NASDAQ Composite, the Russell 2000 Index, the Russell 3000 Index, and the Research Data Group Inc. ("RDG") Technology Composite Index for each period from December 31, 2005 through December 31, 2010. The comparison is based on the investment of $100 in each stock or index on December 31, 2005 and includes the reinvestment of dividends. The total return on the common stock is measured by dividing the difference between the common stock or index price at the end and the beginning of the measurement period by the common stock or index price at the beginning of the measurement period.
The Company believes that the peer-group of indices selected for inclusion in the graph is representative for comparison purposes. The Russell 3000 Index is a major index that is used by third party corporate governance raters for evaluating the Company's corporate governance performance. The RDG Index contains companies that are closely aligned with the product markets and industries most comparable to the Company's products and target markets.
COMPARISON OF 5 YEAR CUMULATIVE TOTAL RETURN*
$100 invested on 12/31/05 in stock or index-including reinvestment of dividends.
Fiscal year ended December 31,
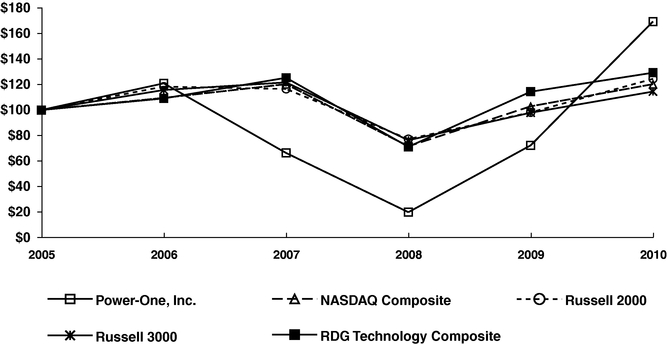
Year Ended December 31,
|
2005 | 2006 | 2007 | 2008 | 2009 | 2010 | |||||||||||||
|---|---|---|---|---|---|---|---|---|---|---|---|---|---|---|---|---|---|---|---|
Power-One, Inc. |
100.00 | 120.93 | 66.28 | 19.77 | 72.26 | 169.44 | |||||||||||||
NASDAQ Composite |
100.00 | 109.52 | 120.27 | 71.51 | 102.89 | 120.29 | |||||||||||||
Russell 2000 |
100.00 | 118.37 | 116.51 | 77.15 | 98.11 | 124.46 | |||||||||||||
Russell 3000 |
100.00 | 115.71 | 121.66 | 76.27 | 97.89 | 114.46 | |||||||||||||
RDG Technology Composite |
100.00 | 109.07 | 125.31 | 71.12 | 114.36 | 129.26 | |||||||||||||
26
ITEM 6—SELECTED FINANCIAL DATA
In the table below, we provide selected consolidated historical financial and operating data. We prepared this information using audited financial statements for the fiscal years ended January 2, 2011, January 3, 2010, December 28, 2008, December 30, 2007 and December 31, 2006. When reading this selected historical consolidated financial and operating data, it is important to read it along with "Item 7—Management's Discussion and Analysis of Financial Condition and Operating Results" included in this Form 10-K. Historical results are not necessarily indicative of future results.
| |
Fiscal Year Ended | |||||||||||||||||
|---|---|---|---|---|---|---|---|---|---|---|---|---|---|---|---|---|---|---|
| |
January 2, 2011(5) |
January 3, 2010(4) |
December 28, 2008(3) |
December 30, 2007(2) |
December 31, 2006(1) |
|||||||||||||
| |
(In millions, except per share amounts and percentages) |
|||||||||||||||||
STATEMENT OF OPERATIONS DATA: |
||||||||||||||||||
Net sales |
$ | 1,047.1 | $ | 431.6 | $ | 537.5 | $ | 511.6 | $ | 338.0 | ||||||||
Cost of goods sold |
644.0 | 335.3 | 426.9 | 406.5 | 245.4 | |||||||||||||
Gross profit |
403.1 | 96.3 | 110.6 | 105.1 | 92.6 | |||||||||||||
Selling, general and administrative |
74.6 | 57.7 | 75.1 | 76.0 | 63.9 | |||||||||||||
Engineering and quality assurance |
36.4 | 30.3 | 45.5 | 48.9 | 38.6 | |||||||||||||
Amortization of intangible assets |
1.5 | 1.6 | 2.4 | 4.4 | 4.0 | |||||||||||||
Restructuring and asset impairment costs |
3.9 | 8.0 | — | 4.3 | 0.4 | |||||||||||||
Goodwill impairment |
— | 57.0 | — | — | — | |||||||||||||
Litigation |
22.1 | — | — | — | — | |||||||||||||
Total expenses |
138.5 | 154.6 | 123.0 | 133.6 | 106.9 | |||||||||||||
Income (loss) from operations |
264.6 | (58.3 | ) | (12.4 | ) | (28.5 | ) | (14.3 | ) | |||||||||
Interest income |
0.3 | 0.2 | 0.7 | 1.2 | 2.1 | |||||||||||||
Interest expense |
(6.7 | ) | (8.7 | ) | (10.0 | ) | (7.9 | ) | (1.4 | ) | ||||||||
Gain (loss) on extinguishment of debt |
(5.7 | ) | 8.6 | 3.9 | — | — | ||||||||||||
Other income (expense), net |
(2.3 | ) | 1.2 | (2.6 | ) | 1.2 | (1.7 | ) | ||||||||||
Income (loss) before provision (benefit) for income taxes |
250.2 | (57.0 | ) | (20.4 | ) | (34.0 | ) | (15.3 | ) | |||||||||
Provision (benefit) for income taxes |
103.6 | 6.9 | (0.2 | ) | 2.4 | (0.7 | ) | |||||||||||
Income (loss) before equity in earnings of joint venture |
146.6 | (63.9 | ) | (20.2 | ) | (36.4 | ) | (14.6 | ) | |||||||||
Equity in earnings of joint venture, net of tax |
1.2 | 0.6 | 2.7 | — | — | |||||||||||||
Net income (loss) |
$ | 147.8 | $ | (63.3 | ) | $ | (17.5 | ) | $ | (36.4 | ) | $ | (14.6 | ) | ||||
Preferred stock dividend and accretion |
3.4 | 2.2 | — | — | — | |||||||||||||
Net income (loss) attributable to common stockholders |
$ | 144.4 | $ | (65.5 | ) | $ | (17.5 | ) | $ | (36.4 | ) | $ | (14.6 | ) | ||||
Basic income (loss) per common share |
$ | 1.30 | $ | (0.74 | ) | $ | (0.20 | ) | $ | (0.42 | ) | $ | (0.17 | ) | ||||
Diluted income (loss) per common share |
$ | 0.96 | $ | (0.74 | ) | $ | (0.20 | ) | $ | (0.42 | ) | $ | (0.17 | ) | ||||
Basic weighted average shares outstanding |
95.7 | 88.1 | 87.6 | 87.1 | 86.1 | |||||||||||||
Diluted weighted average shares outstanding |
141.9 | 88.1 | 87.6 | 87.1 | 86.1 | |||||||||||||
SELECTED OPERATING DATA: |
||||||||||||||||||
Gross profit margin |
38.5 | % | 22.3 | % | 20.6 | % | 20.5 | % | 27.4 | % | ||||||||
Depreciation and amortization |
$ | 15.4 | $ | 17.1 | $ | 18.9 | $ | 20.6 | $ | 15.0 | ||||||||
Capital expenditures |
27.6 | 6.7 | 8.8 | 8.4 | 5.6 | |||||||||||||
Cash flows provided by (used in): |
||||||||||||||||||
Operating activities |
$ | 209.9 | $ | 55.0 | $ | (22.3 | ) | $ | 2.6 | $ | (25.9 | ) | ||||||
Investing activities |
(29.9 | ) | (6.6 | ) | (1.2 | ) | (1.7 | ) | (33.6 | ) | ||||||||
Financing activities |
(42.9 | ) | 10.6 | 22.8 | (8.4 | ) | 53.8 | |||||||||||
BALANCE SHEET DATA: |
||||||||||||||||||
Working capital |
$ | 287.6 | $ | 160.1 | $ | 128.6 | $ | 121.8 | $ | 144.2 | ||||||||
Total assets |
761.8 | 371.3 | 429.0 | 431.6 | 449.3 | |||||||||||||
Total long-term debt(6) |
36.0 | 79.4 | 70.9 | 52.9 | 54.3 | |||||||||||||
Total debt(7) |
36.0 | 79.9 | 97.8 | 74.7 | 80.6 | |||||||||||||
Total stockholders' equity |
282.0 | 122.6 | 184.2 | 199.4 | 223.2 | |||||||||||||
- (1)
- On October 23, 2006, we acquired the Power Electronics Group of Magnetek Inc. The purchase price was approximately $69.4 million, of which $50.0 million was borrowed, and $19.4 million was paid in cash including $3.3 million of direct acquisition costs, plus the assumption of approximately $27.8 million in debt.
27
- (2)
- During
the year ended December 30, 2007, we recorded pre-tax restructuring charges of $3.1 million. We recorded approximately
$1.6 million related to severance payments for a reduction in headcount of approximately 100 employees, $1.2 million as contract termination costs related to facility closures and
downsizing, and $0.3 million related to consolidation of excess facilities and other contract termination costs. As a result of the restructuring, we recorded asset impairment charges of
$1.2 million for the year ended December 30, 2007. These charges were primarily incurred by our North American facilities and were related to leasehold improvements, computer software
and manufacturing equipment at facilities whose operations are being closed or downsized.
- (3)
- During
the year ended December 28, 2008, we recorded a cash dividend of $1.2 million from the joint venture located in China, representing a
return on investment. The cash dividend and approximately $1.5 million related to our share in the earnings of the joint venture were recorded in "Equity in earnings of joint venture" in the
consolidated statements of operations. We also realized a net gain of $3.9 million from the repurchase and retirement of $10 million of outstanding convertible debt for
$5.5 million.
- (4)
- During
the year ended January 3, 2010, we recorded pre-tax restructuring charges of $8.0 million in accordance with Accounting
Standards Codification ("ASC") 420 "Exit or Disposal Cost Obligations" and ASC 712 "Compensation—Nonretirement Postemployment Benefits," as applicable, as a result of our
plan to restructure our global organization in response to ongoing demand uncertainty and to exit our factory in the Dominican Republic. We recorded approximately $7.1 million of severance
benefits and approximately $0.9 million of facility closure costs related to continuing lease obligations and other facility closure costs.
In accordance with ASC 350 "Intangibles—Goodwill and Other," and as a result of the continued decrease in our market capitalization during the first fiscal quarter of 2009, we tested our goodwill for impairment and determined that goodwill was impaired. As a result of the impairment test, a goodwill impairment charge of $57.0 million was recorded in our consolidated statement of operations for the year ended January 3, 2010.
During the year ended January 3, 2010, we realized a net gain of $8.6 million from the repurchase $31.3 million of outstanding 8% senior secured convertible notes for approximately $20.9 million.
- (5)
- As
a result of the 2009 plan to restructure our global organization, we recorded approximately $3.4 million for facility closure costs related to
continuing lease obligations and other costs to close and vacate the facility during the year ended January 2, 2011. In addition, we recorded $0.4 million of asset impairment charges in
connection with the restructuring related to the consolidation of facilities.
During the year ended January 2, 2011, we realized a net loss of $5.7 million from the repurchase $4.5 million of outstanding 8% senior secured convertible notes for approximately $10 million.
During fiscal 2010, we recorded a litigation charge of $22.1 million related to a judgment assessed by the court in connection with the patent infringement lawsuit initiated by SynQor, Inc.
- (6)
- Includes
current and long-term portions of long-term debt and capital leases.
- (7)
- Includes items in footnote (6) above and short-term debt.
28
ITEM 7—MANAGEMENT'S DISCUSSION AND ANALYSIS OF FINANCIAL CONDITION AND RESULTS OF OPERATIONS
Forward-Looking Statements
Forward-looking statements reflect our current views with respect to future events. They reflect our expectations, beliefs, projections and assumptions, are made in good faith and we believe there is a reasonable basis for them; however, there can be no assurance that our financial condition or results of operations will meet the expectations set forth in the forward-looking statements set forth below. Forward-looking statements are inherently subject to risks and uncertainties that in many cases are beyond our control and cannot be predicted or quantified. As a result, future events and actual results could differ materially from those set forth in, contemplated by, or underlying forward-looking statements. Such risks and uncertainties include, but are not limited to economic conditions in general, sensitivity to industry conditions, competitive factors such as technology and pricing pressures, business conditions in our particular markets, currency exchange rates, the risk that current economic conditions will negatively impact our ability to satisfy the covenants of our lending agreements, international sales operations, our level of dependence on major customers, increased material costs, risks and costs associated with integrating our acquired businesses, litigation and the risks and that the risks and costs of doing business will exceed our present estimates. A discussion of these and other specific risks is included in Item 1A under the heading "Risk Factors". Forward looking statements contained in this Annual Report on Form 10-K speak only as of the date of this report or in the case of any document incorporated by reference, the date of that document. Except for our ongoing obligation to disclose material information as required by federal securities laws, we are not obligated to update or revise any forward- looking statement contained or incorporated by reference in this document to reflect events, circumstances or changed assumptions or operating results occurring after the date of this report. The following discussion should be read in conjunction with the Risk Factors as well as our financial statements and the related notes.
Introduction
We are a worldwide organization and leading designer and manufacturer of inverters for the renewable energy industry and hundreds of high-quality brand name AC/DC and DC/DC power supplies, converters, and power management products for the servers, storage, networking, network power systems and industrial markets. We sell our products to original equipment manufacturers ("OEM"), distributors, engineering, procurement and construction ("EPC") firms, and service providers who value quality, reliability, technology and service. We have established a broad and global customer base.
We are organized into two SBUs, Renewable Energy Solutions and Power Solutions. The SBUs were created during fiscal 2010 to focus on both the products and services we provide and the customers and end markets that we serve. Due to the structure of our internal organization and the manner in which expenses were tracked and managed and as a result of the design of our internal systems during fiscal 2009, we are unable to recast our financial statements by operating segment for fiscal 2009 and prior. As such, segment information, other than revenue, for the years ended January 3, 2010 and December 28, 2008, is not reported as it is impracticable to do so.
Renewable Energy Solutions: We offer inverters, management systems, accessories and services for the renewable energy market place that includes both photovoltaic/solar and wind applications. In the renewable energy market, we sell a broad product line of inverters and service offerings that provide our customers with industry-leading efficiency, harvesting power, uptime, reliability, monitoring through software and ease-of-installation. We sell our renewable energy products to distributors/installers, EPCs and OEMs. We are engaged in the design and production of inverters for renewable energy products that convert photovoltaic/solar or wind energy into useable AC power. Our string
29
inverters are used in residential and small commercial applications, while our central inverters are designed for large commercial and utility installations for both the solar and wind markets. These products scale in size from 2 kW up to 2.5 MW. The recent acquisition of the assets of a software firm expanded our product offering by providing our customers with greater control and monitoring of their renewable energy assets using this software-as-a-service (SaaS) platform.
Power Solutions: Our power conversion and power management solutions are used in computer servers, data storage, networking, telecommunications and industrial applications. We sell our power conversion products to OEMs, distributors, and service providers. We are engaged in the design and production of the following power conversion products:
- •
- AC/DC power supplies that convert AC from a primary power source, such as a wall outlet, into a precisely controlled DC
voltage. Virtually every electronic device that plugs into an AC wall outlet requires some type of AC/DC power supply, and we provide a broad range of supplies that power a wide variety of OEM
equipment;
- •
- DC power systems that are used by communications and Internet service providers to power their equipment, and are used as
backup power for large communications infrastructure equipment;
- •
- DC/DC converters that modify an existing DC voltage level to a different DC voltage level to meet the power needs of
various subsystems and components within electronic equipment. Our DC/DC converters include high-density and low-density "brick" converters that are generally used to control
power on communications printed circuit boards and also include Point-of-Load ("POL") converters that power devices within an Intermediate Bus Architecture as
well as in other applications; and
- •
- Additional products that include digital control products for motors and a variety of other application-specific specialty power products.
We are focused on improving our operational and financial performance and have implemented detailed plans to improve our performance, drive long-term growth and profitability, improve on-time delivery, and reduce manufacturing inefficiencies. The operating framework in which we manage our business and guide our strategies is based on the disciplined management of three business levers: targeted growth, operational efficiency and capital strategy.
Our top strategic objective is to grow our market share in both the renewable energy and power conversion markets, while expanding profitability. We plan to grow revenue through geographic expansion and introducing new product offerings. To support our objectives, we have launched new product introductions and will continue to invest in our go-to-market strategy by expanding both the sales and service teams and our research and development ("R&D") resources, as well as investing in new market-leading technologies.
At the beginning of the fourth quarter of fiscal 2010, we strengthened our R&D team by hiring additional engineers in connection with the acquisition of the assets of a software firm. This acquisition included software that provides critical insight into revenue-generating renewable energy assets and provides a remote monitoring and asset management solution, increasing the value to our customers of our inverters, and adding experienced software engineers to our renewable energy SBU. The solutions identify and address problematic assets, allowing energy producers to increase energy harvest and performance ratios, cut the costs of operations & maintenance, reduce operational and financial risk, and improve return on investment. In addition, we are investing in our supply chain and manufacturing capacity. We have expanded our capacity in our European plants and are adding production capacity in the United States, China and Canada to meet the increased demand of the renewable energy market.
30
As part of our initiative to increase profitability, we improved gross margin in 2010 by driving manufacturing and design efficiencies and focusing our supply chain on targeting cost reductions. While our supply chain organization actively manages component costs, it also manages component shortages that we are currently addressing in both the renewable energy and power solutions businesses in order to mitigate any negative impacts that these shortages may have on material costs and on meeting our customers' demands.
Lastly, we are continuing our initiatives to strengthen our balance sheet and improve our working capital performance. In an effort to reduce dilution, we repurchased $4.5 million in face value of the 8% senior secured convertible notes due 2013 during the first quarter of fiscal 2010, which resulted in a net loss of $5.7 million. In addition, we repurchased 3 million shares of our outstanding common stock in open market transactions for approximately $28.4 million during fiscal 2010.
Critical Accounting Policies
Application of our accounting policies requires management to make judgments and estimates about the amounts reflected in the financial statements. Management uses historical experience and all available information to make these estimates and judgments, although differing amounts may be reported if there are changes in the assumptions and estimates. Estimates are used for, but not limited to, the accounting for the allowance for doubtful accounts, inventory valuation, restructuring costs, goodwill impairment, impairment costs, depreciation and amortization, sales returns and discounts, warranty costs, uncertain tax positions and the recoverability of deferred tax assets, stock compensation, business combinations and contingencies. Management has identified the following accounting policies as critical to an understanding of our financial statements and as areas most dependent on management's judgment and estimates.
Revenue Recognition—we recognize revenue when persuasive evidence of an arrangement exists, title transfer has occurred, the price is fixed or readily determinable, and collectability is reasonably assured. We recognize revenue in accordance with ASC 605, "Revenue Recognition." Sales are recorded net of sales returns and discounts, which are estimated at the time of shipment based upon historical data.
We generally recognize revenue at the time of shipment (or at the time of inventory consumption for customers on Vendor Managed Inventory ("VMI") programs) because this is the point at which revenue is earned and realizable and the earnings process is complete. For most shipments, title to shipped goods transfers at the shipping point, so the risks and rewards of ownership transfer once the product leaves our warehouse. For shipments in which title transfers at a later date, revenue recognition is delayed. Revenue is only recognized when collectability is reasonably assured. Shipping and handling costs are included in cost of goods sold. We may charge shipping and handling costs to customers, which are included in revenue.
We offer our distributors a standard agreement which includes payment terms, description of rights to return or exchange product, and price discounts. Under our standard agreement, payment is due within 30 days of shipment of the product to the distributors. The distributor has a right to return only if we discontinue a product that the distributor has on hand. The distributor has a right to exchange up to 5% of the dollar value of products purchased within the prior six-month period, so long as the distributor is currently purchasing at least the equivalent dollar value in new product. Estimated product exchanges or returns are accrued for at the time of the sale based on historical information in accordance with ASC 605-15 "Revenue Recognition-Products." Finally, we may give price discounts to a distributor at the time a purchase order is received from the distributor for product that they will sell to a specific customer. The price discount is available for one year following issuance of the purchase order for items listed on the purchase order. We accrue for the estimated price discount at the time revenue is recognized.
31
We have a joint venture in Asia which, along with certain of our contract manufacturers, may purchase raw components and other goods from Power-One, and sell finished goods back to Power-One as well as to other third parties. We record revenue on sales to the joint venture and contract manufacturers only when the components and goods are for sales to third parties. When the joint venture or contract manufacturers purchase components that will be assembled and sold back to us, no revenue is recorded because the earnings process has not been completed.
Impairment of Long-Lived Assets and Goodwill—we review the recoverability of the carrying value of long-lived assets using the methodology prescribed in ASC 360 "Property, Plant, and Equipment." We review long-lived assets for impairment whenever events or changes in circumstances indicate that the carrying value of such assets may not be recoverable. Upon such an occurrence, recoverability of these assets is determined by comparing the forecasted undiscounted net cash flows to which the assets relate, to the carrying amount. If the asset is determined to be unable to recover its carrying value, it is written down to fair value. Fair value is determined based on discounted cash flows, appraised values or other information available in the market, depending on the nature of the assets. Methodologies for determining fair value are inherently based on estimates that may change, such as the useful lives of assets and our cash flow forecasts associated with certain assets. A change in these estimates may result in impairment charges, which would impact our operating results.
We review the carrying value of goodwill and non-amortizable intangible assets using the methodology prescribed in ASC 350 "Intangibles—Goodwill and Other." ASC 350 requires that we not amortize goodwill, but instead subject it to impairment tests on at least an annual basis and whenever circumstances suggest that they may be impaired. These impairment tests are also dependent on management's forecasts, which frequently change. A change in our forecasts may result in impairment charges. ASC 350 requires the Company to perform a two-step impairment test. Under the first step of the goodwill impairment test, we are required to compare the fair value of a reporting unit with its carrying amount, including goodwill. If the fair value of a reporting unit exceeds its carrying amount, goodwill of the reporting unit is not considered impaired and we do not perform the second step. If the results of the first step impairment test indicate that the fair value of a reporting unit does not exceed its carrying amount, then the second step of the goodwill impairment test is required. The second step of the goodwill impairment test compares the implied fair value of the reporting unit goodwill with the carrying amount of that goodwill. The impairment loss is measured by the excess of the carrying amount of the reporting unit goodwill over the implied fair value of that goodwill.
We test goodwill for impairment on an annual basis at the end of each August fiscal month. As a result of the continued decrease in our market capitalization during the first fiscal quarter of 2009, we tested our goodwill for impairment and determined that goodwill was impaired. As our carrying value exceeded our estimated fair value as of March 29, 2009, we applied the approach prescribed in ASC 350-20 for determining the impairment amount. As a result of the interim test, a goodwill impairment charge of $57.0 million was recorded in our consolidated statements of operations for the year ended January 3, 2010.
Restructuring Charges—we record restructuring charges in accordance with ASC 420 "Exit or Disposal Cost Obligations" and ASC 712 "Compensation—Nonretirement Postemployment Benefits," as applicable. ASC 420 requires that a liability for a cost associated with an exit or disposal activity be recognized when the liability is incurred, in contrast to the date of an entity's commitment to an exit plan. In accordance with the guidance provided under ASC 712, we accrue for severance expenses prior to notification for termination benefits that are contractual or required by regional labor laws or are pursuant to a substantive plan where the costs are deemed probable and reasonably estimable. Restructuring costs were related to the downsizing of operations and primarily consisted of specific charges that had been incurred or were to be incurred with no future economic benefit. These charges included costs related to personnel severance, continuing lease obligations for vacant facilities, and certain contract termination penalties and other shutdown costs. Calculation of the restructuring
32
reserves includes management's judgment regarding closed facilities, which include assumptions about the length of time it will take for facilities to be subleased as well as the likely sublease income amount. Changes in these estimates may impact our operating results.
Income Taxes—we record a deferred income tax asset in jurisdictions where the Company generates a loss. We also record a valuation allowance against these deferred income tax assets in accordance with ASC 740, "Income Taxes," when, in management's judgment, it is more likely than not that the deferred income tax assets will not be realized in the foreseeable future. We record uncertain tax positions under the provisions of ASC 740. We recognize in the consolidated financial statements only those tax positions determined to be more likely than not of being sustained upon examination, based on the technical merits of the positions. Under these provisions, we must assume that the taxing authority will examine the income tax position and will have full knowledge of all relevant information. For each income tax position that meets the more likely than not recognition threshold, we then assess the largest amount of tax benefit that is greater than 50 percent likely of being realized upon ultimate settlement with the taxing authority. Unrecognized tax positions, if ever recognized in the financial statements, are recorded in the statement of operations as part of the income tax provision.
Inventories—Inventories are stated at the lower of cost (first-in, first-out method) or market. Slow moving and obsolete inventory are written down quarterly based on a comparison of on-hand quantities to historical and projected usages. Additionally, reserves for non-cancelable open purchase orders for components we are obligated to purchase in excess of projected usage, or for open purchase orders where the market price is lower than the purchase order price, are recorded as other accrued expenses on the balance sheet. Calculation of inventory write-downs is based on management's assumptions regarding projected usage of each component, which are subject to changes in market demand.
Accounts Receivable and Allowance for Doubtful Accounts—we establish the allowance for doubtful accounts using the specific identification method and also provide a reserve in the aggregate. Our estimates for calculating the aggregate reserve are based on historical information. Any changes to our assumptions or estimates may impact our operating results.
Business Combinations—we account for our acquisitions utilizing the purchase method of accounting. Under the purchase method of accounting, the total consideration paid is allocated to the underlying assets and liabilities, based on their respective estimated fair values. The excess of the purchase price over the estimated fair values of the net assets acquired is recorded as goodwill. Determining the fair value of certain acquired assets and liabilities, identifiable intangible assets in particular, is subjective in nature and often involves the use of significant estimates and assumptions including, but not limited to: estimates of revenue growth rates; estimates of rates of return; royalty rates; and determination of appropriate discount rates. These assumptions are generally made based on available historical information. Identifiable intangible assets with finite lives are amortized on a straight-line basis over their useful lives.
Recent Pronouncements and Accounting Changes—See Note 2—"Recent Pronouncements and Accounting Changes" of Notes to our Consolidated Financial Statements.
33
Results of Operations
The year ended January 3, 2010 represents a 53-week year. The years ended January 2, 2011 and December 28, 2008 represent 52-week years. The following table represents our consolidated statements of operations as a percentage of net sales for the periods presented:
| |
Fiscal Year Ended | |||||||||
|---|---|---|---|---|---|---|---|---|---|---|
| |
January 2, 2011 |
January 3, 2010 |
December 28, 2008 |
|||||||
Net sales |
100.0 | % | 100.0 | % | 100.0 | % | ||||
Cost of goods sold |
61.5 | 77.7 | 79.4 | |||||||
Gross profit |
38.5 | 22.3 | 20.6 | |||||||
Selling, general and administrative |
7.1 | 13.4 | 13.9 | |||||||
Engineering and quality assurance |
3.5 | 7.0 | 8.5 | |||||||
Amortization of intangibles |
0.1 | 0.4 | 0.5 | |||||||
Restructuring and asset impairment costs |
0.4 | 1.9 | — | |||||||
Goodwill impairment |
— | 13.2 | — | |||||||
Litigation |
2.1 | — | — | |||||||
Income (loss) from operations |
25.3 | (13.6 | ) | (2.3 | ) | |||||
Interest income |
— | 0.1 | 0.1 | |||||||
Interest expense |
(0.6 | ) | (2.0 | ) | (1.9 | ) | ||||
Other income (expense), net |
(0.8 | ) | 2.3 | 0.3 | ||||||
Income (loss) before provision for income taxes |
23.9 | (13.2 | ) | (3.8 | ) | |||||
Provision for income taxes |
9.9 | 1.6 | — | |||||||
Income (loss) before equity in earnings of joint venture |
14.0 | (14.8 | ) | (3.8 | ) | |||||
Equity in earnings of joint venture, net of tax |
0.1 | 0.1 | 0.5 | |||||||
Net Income (loss) |
14.1 | (14.7 | ) | (3.3 | ) | |||||
Preferred stock dividend and accretion |
0.3 | 0.5 | — | |||||||
Net Income (loss) attributable to common stockholders |
13.8 | % | (15.2 | )% | (3.3 | )% | ||||
Comparison of Fiscal Year Ended January 2, 2011 with Fiscal Year Ended January 3, 2010
During fiscal 2010, demand increased from the reduced levels in fiscal 2009, which were the result of the global economic recession, both in the power conversion and the renewable energy markets. The revenue growth in the renewable energy market was driven primarily by higher demand in the overall solar market, as well as by our continued focus on geographic expansion further into Europe and Asia. In addition to increased revenue and order bookings, we have also increased our market share and outpaced the overall market growth in the renewable energy sector.
Net Sales. Net sales increased $615.5 million, or 143%, to $1,047.1 million for the year ended January 2, 2011 from $431.6 million for the year ended January 3, 2010. The increase in sales primarily related to the increased demand in the renewable energy market as sales continued to increase in Europe and as sales of our inverters expanded into Asia and Australia. The increase in sales of renewable energy products in the European market was due to the expansion of the renewable energy market promoted by favorable feed-in-tariffs, most notably in Germany and Italy.
34
Net sales by business segment were as follows, in millions:
| |
Year Ended January 2, 2011 |
Year Ended January 3, 2010 |
|||||||||||
|---|---|---|---|---|---|---|---|---|---|---|---|---|---|
Renewable Energy Solutions |
$ | 715.4 | 68 | % | $ | 128.6 | 30 | % | |||||
Power Solutions |
331.7 | 32 | % | 303.0 | 70 | % | |||||||
Total |
$ | 1,047.1 | 100 | % | $ | 431.6 | 100 | % | |||||
Net sales by customer category were as follows, in millions:
| |
Year Ended January 2, 2011 |
Year Ended January 3, 2010 |
|||||||||||
|---|---|---|---|---|---|---|---|---|---|---|---|---|---|
Distributors |
$ | 495.9 | 47 | % | $ | 124.7 | 29 | % | |||||
OEMs |
307.8 | 29 | % | 243.1 | 56 | % | |||||||
EPCs |
236.1 | 23 | % | 55.6 | 13 | % | |||||||
Service providers |
7.3 | 1 | % | 8.2 | 2 | % | |||||||
Total |
$ | 1,047.1 | 100 | % | $ | 431.6 | 100 | % | |||||
No customer accounted for more than 10% of our sales during either of the years ended January 2, 2011 or January 3, 2010.
We have defined our end-markets based on the customers we serve, and have reclassified certain customers. Net sales for the fiscal years 2010 and 2009 by end-markets were as follows:
| |
Year Ended | ||||||
|---|---|---|---|---|---|---|---|
| |
January 2, 2011 |
January 3, 2010 |
|||||
Renewable Energy |
68 | % | 30 | % | |||
Network Telecom Equipment |
13 | % | 28 | % | |||
Computer and Office Equipment |
9 | % | 18 | % | |||
Industrial Equipment |
7 | % | 17 | % | |||
Other |
3 | % | 7 | % | |||
Total |
100 | % | 100 | % | |||
Gross Profit.
| |
Year Ended | ||||||
|---|---|---|---|---|---|---|---|
| |
January 2, 2011 |
January 3, 2010 |
|||||
Gross profit, in millions |
$ | 403.1 | $ | 96.3 | |||
Gross margin |
38.5 | % | 22.3 | % | |||
Gross profit for the year ended January 2, 2011 was $403.1 million compared with $96.3 million for the year ended January 3, 2010. Our gross margin increased to 38.5% for fiscal 2010 from 22.3% for fiscal 2009. The increase in gross profit during fiscal 2010 primarily related to the increased sales volume of products into the renewable energy market as net sales into the renewable energy market increased by 456% during 2010 as compared with 2009. Gross margin also improved during 2010 as compared with fiscal 2009 as sales of renewable energy products, which tend to have higher gross margins, increased significantly relative to sales of power products during the year.
Selling, General and Administrative. Selling, general and administrative expense increased $16.9 million, or 29%, to $74.6 million for fiscal 2010 from $57.7 million for fiscal 2009. As a
35
percentage of net sales, selling, general and administrative expense decreased to 7% for fiscal 2010 from 13% for fiscal 2009.
Selling expense increased $8.6 million, or 35%, to $33.1 million for 2010 from $24.5 million for fiscal 2009. Selling expense increased primarily due to increases in sales bonuses, commissions, travel associated with the higher revenue levels achieved during 2010 and increased headcount costs to support our market growth . In addition, selling expense increased as a result of our investment in the expansion of the sales and service teams to support our initiative to grow market share and revenue in renewable energy.
Administrative expense increased $8.3 million, or 25% to $41.5 million for fiscal 2010 from $33.2 million for fiscal 2009. The increase in general and administrative expense is primarily a result of an increase in infrastructure to support the revenue growth.
Engineering and quality assurance. Engineering and quality assurance expense increased $6.1 million, or 20% to $36.4 million for fiscal 2010 from $30.3 million for fiscal 2009. As a percentage of net sales, engineering and quality assurance expense decreased to 4% for 2010 from 7% for 2009. The increase in research and development spending was primarily due to our investment in new product introductions and expansion of research and development efforts during 2010 as compared with 2009.
Amortization of Intangibles. Amortization of intangible assets decreased by $0.1 million to $1.5 million for fiscal 2010 compared to $1.6 million for fiscal 2009.
Restructuring Costs and Asset impairment. During fiscal 2010, we recorded pre-tax restructuring and asset impairment charges of $3.9 million, in accordance with ASC 420 "Exit or Disposal Cost Obligations" and ASC 712 "Compensation—Nonretirement Postemployment Benefits," as applicable.
During fiscal 2009, we announced and implemented a plan to restructure our global organization in response to ongoing demand uncertainty and to exit our factory in the Dominican Republic. The plan was completed during the second quarter of fiscal 2010. Through implementation of this action, we have (i) realigned global manufacturing and sourcing; (ii) improved operational performance; (iii) increased efficiencies in the supply chain and manufacturing process and (iv) improved our ability to respond to customer requirements in a cost effective manner.
During fiscal 2010, we recorded approximately $3.4 million for facility closure costs related to continuing lease obligations and other costs to close and vacate the facility. In addition, we recorded $0.4 million of asset impairment charges in connection with the restructuring related to the consolidation of facilities. In connection with the facility closure, we also recorded $2.7 million of inventory charges and $0.8 million of accelerated depreciation to cost of goods sold in the consolidated statement of operations for fiscal 2010.
During fiscal 2009, we recorded employee severance benefits of approximately $7.1 million. We also recorded approximately $0.9 million of facility closure costs related to continuing lease obligations during 2009. In connection with the facility closure, we also recorded $1.7 million of inventory charges and $1.8 million of accelerated depreciation to cost of goods sold in the consolidated statement of operations for fiscal 2009.
36
Goodwill Impairment. In accordance with ASC 350 "Intangibles—Goodwill and Other," we review goodwill and intangible assets for impairment annually at the end of each fiscal August. As a result of the continued decrease in our market capitalization during the first fiscal quarter of 2009, we tested our goodwill for impairment and determined that goodwill was impaired. Our testing approach utilized a discounted cash flow analysis and comparative market multiples to determine our (single reporting unit) fair value for comparison to our carrying value. As our carrying value exceeded our estimated fair value as of March 29, 2009, we applied the approach prescribed in ASC 350-20 for determining the impairment amount. As a result of the interim test, a goodwill impairment charge of $57.0 million was recorded in our consolidated statement of operations for fiscal 2009.
Litigation Charges. During fiscal 2010, we recorded $22.1 million related to a judgment assessed by the court in connection with the patent infringement lawsuit initiated by SynQor, Inc. On December 22, 2010, the jury found that certain products of Power-One directly or indirectly infringe on SynQor patents and awarded damages plus interest against the Company. In accordance with ASC 450-20, "Accounting for Contingencies: Loss Contingencies", we accrued the portion of the contingency that was deemed to be probable and reasonably estimable.
Income (Loss) from Operations. As a result of the items above, income from operations increased $322.9 million to income of $264.6 million for fiscal 2010 from an operating loss of $58.3 million for fiscal 2009.
Interest Income (Expense), Net. Net interest expense decreased $2.2 million to $6.3 million for fiscal 2010 compared to net interest expense of $8.5 million for fiscal 2009 due to lower debt outstanding during 2010 as a result of the conversion of the 8% senior secured convertible notes into 17.1 million shares of our common stock during the third quarter of fiscal 2010.
Gain (Loss) on Extinguishment of Debt. Loss on extinguishment of debt was $5.7 million during fiscal 2010 compared to a gain on extinguishment of debt of $8.6 million for fiscal 2009. We repurchased $4.5 million in face value of outstanding 8% senior secured convertible notes due 2013 for approximately $10 million during fiscal 2010. We repurchased $31.3 million of outstanding 8% senior secured convertible notes for $20.9 million during fiscal 2009.
Other Income (Expense), Net. Net other expense was $2.3 million for fiscal 2010, compared with net other income of $1.2 million for fiscal 2009. Net other expense during fiscal 2010 was primarily related to foreign currency transaction losses, offset in part by $0.7 million of gain due to changes in the market value of the embedded derivatives related to the securities issued to Silver Lake Sumeru during the second quarter of fiscal 2009. Our primary foreign currencies are the Euro, the Swiss Franc, the British Pound, and the Chinese RMB. Net other income during fiscal 2009 included $1.1 million of gain due to changes in the market value of the embedded derivatives related to the securities issued to Silver Lake Sumeru. Net other income during fiscal 2009 also included approximately $0.1 million related to foreign currency transaction losses.
Provision (Benefit) for Income Taxes. The provision for income taxes was $103.6 million for fiscal 2010 compared to a provision for income taxes of $6.9 million for fiscal 2009. The provision for income taxes recorded during both fiscal years 2009 and 2010 primarily related to taxes recorded at certain of our profitable European locations. Partially offsetting the provision for income taxes recorded during 2009 was approximately $1.4 million related to the reversal of certain reserves for uncertain tax positions due to a closed tax audit.
Although we record deferred income tax assets in jurisdictions where we generate a loss for income tax purposes, we also record a valuation allowance against these deferred income tax assets when, in management's judgment, it is not more likely than not that the deferred tax assets will be realized. As a result, we may record no tax benefit in jurisdictions where we incur a loss, but record tax
37
expense in jurisdictions where we record taxable income and have no net operating loss (NOL) carryforward.
Equity in Earnings of Joint Venture. During fiscal 2010 and fiscal 2009 we recorded approximately $1.2 million and $0.6 million, respectively, related to our equity share in the earnings of a joint venture.
Preferred Stock Dividend and Accretion. On the $23.6 million of redeemable convertible preferred stock issued to Silver Lake Sumeru, we recorded $2.4 million related to the 10% preferred stock dividend and $1.1 million related to the periodic accretions under the interest method during fiscal 2010, and $1.5 million related to the 10% preferred stock dividend and $0.7 million related to the periodic accretions under the interest method during fiscal 2009.
Renewable Energy Solutions
Results for the Renewable Energy Solutions business segment for the years ended January 2, 2011 and January 3, 2010 were as follows, in millions:
| |
Year Ended | ||||||
|---|---|---|---|---|---|---|---|
| |
January 2, 2011 | January 3, 2010 | |||||
Revenue |
$ | 715.4 | $ | 128.6 | |||
Operating Income |
309.4 | ||||||
During fiscal 2010, demand in the renewable energy market continued to increase at a rapid rate over levels achieved during fiscal 2009. The revenue growth in the renewable energy market was driven by increased demand in the overall solar market, as well as by our expansion further into Europe along with Asia and Australia. Revenue for fiscal 2010 increased by approximately 456% as compared with fiscal 2009. Operating income for fiscal 2009 is not disclosed as it is impracticable to do so.
Power Solutions
Results for the Power Solutions business segment for the years ended January 2, 2011 and January 3, 2010 were as follows, in millions:
| |
Year Ended | ||||||
|---|---|---|---|---|---|---|---|
| |
January 2, 2011 | January 3, 2010 | |||||
Revenue |
$ | 331.7 | $ | 303.0 | |||
Operating Income |
3.0 | ||||||
During fiscal 2010, revenue increased by $28.7 million, or 9%, as compared with fiscal 2009. Improved economic conditions in fiscal 2010 had a favorable impact on Power Solutions revenues. Operating income for fiscal year 2009 is not disclosed as it is impracticable to do so.
Comparison of Fiscal Year Ended January 3, 2010 with Fiscal Year Ended December 28, 2008
The Company's results for the year ended January 3, 2010 were impacted by the global economic recession. Demand across most of our product lines during the year decreased as many of our customers pushed orders out to future quarters and delayed new projects in response to the economic slowdown. While overall revenue decreased during fiscal 2009 as compared with levels of 2008, revenue generated from renewable energy market sales during the second half of the year significantly increased as compared with the same periods in 2008 as well as compared to the first half of fiscal 2009. The revenue growth in the renewable energy market was driven primarily by higher demand in the overall solar market, as well as by our continued focus on geographic expansion further into Europe and into Asia.
38
Net Sales. Net sales decreased $105.9 million, or 20%, to $431.6 million for the year ended January 3, 2010 from $537.5 million for the year ended December 28, 2008. The decrease in sales primarily related to the overall decline in demand across the power conversion market sectors resulting from the global economic conditions. In addition, the decrease in sales related to product paring in order to better align our strategy and increase focus on selected markets. The decline in sales across the power conversion markets was partially offset by an increase in sales to the renewable energy market during the year ended January 3, 2010 as compared with 2008, as we increased our presence and market share in both Europe and Asia. As a result of the US Dollar strengthening on average over functional currencies at our international locations, primarily the Euro, our consolidated revenue levels decreased by approximately $5 million during the year ended January 3, 2010 as compared with 2008. A substantial portion of our European revenue is transacted in foreign currencies such as the Euro and the British Pound. As these currencies weakened on average against the US Dollar in 2009, our consolidated net sales were unfavorably impacted for the year ended January 3, 2010.
Net sales by customer category were as follows, in millions:
| |
Year Ended January 3, 2010 |
Year Ended December 28, 2008 |
|||||||||||
|---|---|---|---|---|---|---|---|---|---|---|---|---|---|
OEMs |
$ | 291.4 | 67 | % | $ | 399.4 | 74 | % | |||||
Distributors |
132.0 | 31 | % | 113.2 | 21 | % | |||||||
Service providers |
8.2 | 2 | % | 24.9 | 5 | % | |||||||
Total |
$ | 431.6 | 100 | % | $ | 537.5 | 100 | % | |||||
No customer accounted for more than 10% of our sales during the years ended January 3, 2010 and December 28, 2008.
Net sales for the years ended January 3, 2010 and December 28, 2008 by end-markets under this new classification were as follows:
| |
Year Ended | ||||||
|---|---|---|---|---|---|---|---|
| |
January 3, 2010 | December 28, 2008 | |||||
Renewable Energy |
30 | % | 12 | % | |||
Network Telecom Equipment |
28 | % | 46 | % | |||
Computer and Office Equipment |
18 | % | 13 | % | |||
Industrial Equipment |
17 | % | 18 | % | |||
Other |
7 | % | 11 | % | |||
Total |
100 | % | 100 | % | |||
Gross Profit.
| |
Year Ended | ||||||
|---|---|---|---|---|---|---|---|
| |
January 3, 2010 | December 28, 2008 | |||||
Gross profit, in millions |
$ | 96.3 | $ | 110.6 | |||
Gross profit margin |
22.3 | % | 20.6 | % | |||
Gross profit for the year ended January 3, 2010 was $96.3 million compared with a gross profit of $110.6 million for the year ended December 28, 2008. Our gross margin increased to 22.3% for the year ended January 3, 2010 from a gross margin of 20.6% for the same period in 2008. Gross margin during the year ended January 3, 2010 was impacted by multiple factors.
- •
- Positive impacts resulting from the successful implementation of several of our operational initiatives resulted in improved on-time delivery to our customers, reduced materials and
39
- •
- The decrease in customer demand resulting in a reduction in sales volume of approximately 20%, as well as unfavorable
foreign currency translation impacts primarily due to the weakening of the Euro against the US dollar between periods, negatively impacted the gross margin by approximately 2 margin points.
- •
- Increased inventory write-downs during the year ended January 3, 2010 as compared with the prior year negatively impacted the gross margin by approximately 2 margin points.
logistics costs, and the reduction of the overall expense levels. As a result of these improvements, gross margin for the year ended January 3, 2010 was favorably impacted by approximately 5 margin points and was favorably impacted by approximately 1 margin point resulting from favorable product mix as compared with the prior year.
Selling, General and Administrative. Selling, general and administrative expense decreased $17.4 million, or 23%, to $57.7 million for the year ended January 3, 2010 from $75.1 million for the year ended December 28, 2008. As a percentage of net sales, selling, general and administrative expense decreased to 13% for the year ended January 3, 2010 from 14% for the same period in 2008.
Selling expense decreased $6.5 million, or 21%, to $24.5 million for the year ended January 3, 2010 from $31.0 million for the year ended December 28, 2008. Selling expense decreased primarily as a result of the reduced revenue levels during 2009 and the related reductions in sales bonuses and commissions. Selling expense also decreased related to foreign currency fluctuations as the functional currencies at certain of our foreign locations weakened against the US Dollar during 2009 as compared with 2008. In addition, selling expense decreased during 2009 as compared to 2008 as a result of our continued efforts to reduce the company's cost structure.
Administrative expense decreased $10.9 million, or 25% to $33.2 million for the year ended January 3, 2010 from $44.1 million for the year ended December 28, 2008. The decrease in general and administrative expenses is primarily a result of continued efforts to reduce the company's cost structure as well as a result of the US Dollar strengthening against the functional currencies at our foreign locations during 2009.
Engineering and quality assurance. Engineering and quality assurance expense decreased $15.2 million, or 33% to $30.3 million for the year ended January 3, 2010 from $45.5 million for year ended December 28, 2008. As a percentage of net sales, engineering and quality assurance expense decreased to 7% for the year ended January 3, 2010 from 8% for the same period in 2008. The decreases in engineering and quality assurance expense were primarily due to continued efforts to reduce the company's cost structure through spending reductions, relocation of engineering resources to lower cost locations, and efficiency improvements. Engineering and quality assurance expense also decreased as a result of foreign currency fluctuations for the year ended January 3, 2010 compared with 2008.
Amortization of Intangibles. Amortization of intangible assets decreased by $0.8 million to $1.6 million for the year ended January 3, 2010 compared to $2.4 million for the year ended December 28, 2008. The decrease was primarily due to certain intangibles reaching the end of their amortizable life.
Restructuring Costs and Asset impairment. During the year ended January 3, 2010, we recorded pre-tax restructuring charges of $8.0 million, in accordance with ASC 420 "Exit or Disposal Cost Obligations" and ASC 712 "Compensation—Nonretirement Postemployment Benefits," as applicable.
During 2009, we announced and implemented a plan to restructure our global organization in response to ongoing demand uncertainty and to exit our factory in the Dominican Republic. Through implementation of this action, the intent was to (i) realign global manufacturing and sourcing; (ii) improve operational performance; (iii) increase efficiencies in the supply chain and manufacturing
40
process and (iv) improve our ability to respond to customer requirements in a cost effective manner. With respect to the 2009 restructuring plan, we recorded approximately $8.0 million of severance and other charges during 2009.
During the year ended January 3, 2010, we recorded severance benefits of approximately $7.1 million. We also recorded approximately $0.9 million of facility closure costs related to continuing lease obligations during the year ended January 3, 2010. In connection with the facility closure, we also recorded $1.7 million of inventory charges and $1.8 million of accelerated depreciation to cost of goods sold in the consolidated statement of operations for the year ended January 3, 2010. No restructuring or asset impairment charges were recorded during the year ended December 28, 2008.
Goodwill Impairment. In accordance with ASC 350 "Intangibles—Goodwill and Other," we review goodwill and intangible assets for impairment annually at the end of each fiscal August. As a result of the continued decrease in our market capitalization during the first fiscal quarter of 2009, we tested our goodwill for impairment and determined that goodwill was impaired. Our testing approach utilized a discounted cash flow analysis and comparative market multiples to determine our (single reporting unit) fair value for comparison to our carrying value. As our carrying value exceeded our estimated fair value as of March 29, 2009, we applied the approach prescribed in ASC 350-20 for determining the impairment amount. As a result of the interim test, a goodwill impairment charge of $57.0 million was recorded in our consolidated statement of operations for the year ended January 3, 2010.
Loss from Operations. As a result of the items above, loss from operations increased $45.9 million to a loss of $58.3 million for the year ended January 3, 2010 from an operating loss of $12.4 million for the same period in 2008.
Interest Income (Expense), Net. Net interest expense was $8.5 million for the year ended January 3, 2010 compared to net interest expense of $9.3 million for the same period in 2008. The net interest expense recorded during the year ended January 3, 2010 related to interest on an average balance of approximately $49 million of 8% senior secured convertible notes carrying an effective interest rate of approximately 9.3%, as well as interest on approximately $36 million of senior convertible notes issued May 8, 2009 at an effective interest rate of 10.5%, and interest related to credit facilities and long-term debt obligations at certain foreign locations. The net interest expense recorded during the year ended December 28, 2008 related to interest on $50.0 million in term debt, carrying an effective interest rate of approximately 14.0%, and $0.9 million related to the write-off of the debt issue costs and debt discount related to the $50 million PWER Bridge term debt which was repaid near the end of the quarter ended June 29, 2008, as well as to interest expense recorded during the second half of fiscal 2008 related to $80 million of 8% senior secured convertible notes at an effective interest rate of approximately 9.3%. Also included in the interest expense for the year ended December 28, 2008 was interest related to credit facilities and long-term debt obligations at the certain foreign locations.
Gain on Extinguishment of Debt. Net gain on extinguishment of debt of $8.6 million for the year ended January 3, 2010 was recorded as a result of the repurchase of $31.3 million of outstanding 8% senior secured convertible notes for $20.9 million during the year ended January 3, 2010. Gain on extinguishment of debt of $3.9 million for the year ended December 28, 2008 was recorded as a result of the repurchase of $10 million of outstanding 8% senior secured convertible notes during the fourth quarter 2008.
Other Income (Expense), Net. Net other income was $1.2 million for the year ended January 3, 2010, compared with net other expense of $2.6 million for the year ended December 28, 2008. Net other income during 2009 included $1.1 million of gain due to changes in the market value of the embedded derivatives related to the securities issued to Silver Lake Sumeru. Net other income during 2009 also included approximately $0.1 million related to foreign currency transaction losses. Our primary foreign currencies are the Euro, the Swiss Franc, the British Pound, and the Chinese RMB.
41
Net other expense during 2008 included approximately $1.2 million expense related to the write-off of a loan to a foreign supplier and a $0.2 million investment in a privately-held company, as well as approximately $1.3 million related to foreign currency transaction losses.
Provision (Benefit) for Income Taxes. The provision for income taxes was $6.9 million for the year ended January 3, 2010 compared to a benefit for income taxes of $0.2 million for the year ended December 28, 2008. The provision for income taxes recorded during the year ended January 3, 2010 primarily related to taxes recorded at certain of our profitable European locations. Partially offsetting the provision for income taxes recorded during the year ended January 3, 2010 was approximately $1.4 million related to the reversal of certain reserves for uncertain tax positions due to a closed tax audit. During the year ended December 28, 2008, we reversed certain reserves for uncertain tax positions of approximately $0.9 million upon expiration of a tax statute as well as due to a closed tax audit.
Equity in Earnings of Joint Venture. During the years ended January 3, 2010 and December 28, 2008, we recorded approximately $0.6 million and $2.7 million, respectively, related to our equity share in the earnings of a joint venture. The amounts recorded during the year ended December 28, 2008 included approximately $1.5 million related to our equity share in the earnings of the joint venture and approximately $1.2 million related to a cash dividend, representing a return on our investment in the joint venture. During 2005 through fiscal 2007, we impaired our equity investment in our joint venture in Asia as a result of our analysis of the future discounted cash flows combined with other impairment indicators. However, during March 2008, we received a cash dividend of $1.2 million from the joint venture, representing a return on our investment.
Preferred Stock Dividend and Accretion. As a result of the issuance of $23.6 million of redeemable convertible preferred stock to Silver Lake Sumeru, in 2009, we recorded $1.5 million related to the 10% preferred stock dividend and $0.7 million related to the periodic accretions under the interest method.
Liquidity and Capital Resources
Our cash and cash equivalents balance increased to $227.9 million at January 2, 2011 from $89.6 million at January 3, 2010. Our primary source of cash in 2010 was $209.9 million generated from operating activities. Our primary uses of cash in 2010 consisted of $28.4 million to repurchase 3.0 million shares of our common stock, $27.6 million for the acquisition of property and equipment, and $10.0 million used to repurchase approximately $4.5 million of our 8% senior secured convertible notes.
Net cash provided by operating activities of $209.9 million included increases in accounts receivable, accounts payable, taxes payable and inventory of $144.2 million, $124.0 million, $94.1 million and $79.5 million, respectively. Increases in accounts receivable, inventories, and accounts payable are a result of significant increases in revenues and related inventory and purchase levels as compared with the levels of fiscal 2009. We expect significant impacts to our cash position during Q2 2011 due to cash disbursements to be made in connection with income taxes due of approximately $95 million.
We maintain credit facilities with various banks in Europe and Asia. The aggregate limit on all credit facilities is approximately $21.8 million. The credit facilities bear interest on amounts outstanding at various intervals based on published market rates. At January 2, 2011, no amounts were outstanding under these facilities and $1.6 million was committed for letters of credit. After consideration of these commitments, $20.2 million of additional borrowing capacity was available to us as of January 2, 2011.
We have certain long-term notes payable in a European subsidiary and amounts outstanding at January 2, 2011, were $0.1 million and bore interest at an interest rate of 2%. The long-term notes payable agreements require our subsidiary to provide certain financial reports to the lender but do not require compliance with any financial covenants.
42
We currently anticipate that our total capital expenditures for 2011 will be in the range of $50 to $60 million primarily for manufacturing equipment and process improvements, equipment related to research and development and product development, additions and upgrades to our facilities and information technology infrastructure, and other administrative requirements. However, the amount of these anticipated capital expenditures likely will change during the year based on changes in expected revenues, our financial condition and the general economic climate.
Based on current plans and business conditions, we believe our existing working capital and borrowing capacity, coupled with the funds that we expect to generate from our operations, will be sufficient to meet our liquidity requirements for the next twelve months. We will continue to evaluate our liquidity position, and when and if necessary explore alternatives to maximize our position and we may determine to raise additional funding through the issuance of equity or incurrence of debt.
We may from time to time seek to retire or purchase our outstanding debt through cash purchases, in open market purchases, privately negotiated transactions or otherwise. Such repurchases, if any, will depend on prevailing market conditions, our liquidity requirements, contractual restrictions and other factors. The amounts involved may be material.
Off-Balance Sheet Arrangements.
Below we identify and disclose all of our significant off balance sheet arrangements and related party transactions. We do not utilize special purpose entities or have any known financial relationships with other companies' special purpose entities.
Operating Leases. We enter into operating leases where the economic climate is favorable. The liquidity impact of operating leases generally is not material.
Purchase Commitments. We have purchase commitments for materials, supplies, services, and property, plant and equipment as part of the normal course of business. Commitments to purchase inventory at above market prices have been reserved. Certain supply contracts may contain penalty provisions for early termination. Based on current expectations, we do not believe that we are reasonably likely to incur any material amount of penalties under these contracts.
Other Contractual Obligations. We do not have material financial guarantees that are reasonably likely to affect liquidity.
Related Parties. We have entered into certain transactions, or have other arrangements with related parties. (See Part IV. Item 15. Note 19)
43
Summary of Contractual Obligations and Commitments. As of January 2, 2011, we had not entered into any material non-cancelable open purchase orders. A summary of our future contractual payments related to lease obligations, long-term debt and preferred stock dividends is as follows (in millions):
Year Ending December 31,
|
Operating Leases(1) |
Long-Term Debt Obligations |
Estimated Interest Obligations(2) |
Preferred Stock Dividend |
Total | |||||||||||
|---|---|---|---|---|---|---|---|---|---|---|---|---|---|---|---|---|
2011 |
$ | 5.0 | $ | 0.1 | $ | 3.4 | $ | 2.4 | $ | 10.9 | ||||||
2012 |
3.9 | — | 3.7 | 2.4 | 10.0 | |||||||||||
2013 |
3.6 | — | 3.6 | 2.4 | 9.6 | |||||||||||
2014 |
3.0 | — | 3.6 | 0.6 | 7.2 | |||||||||||
2015 |
1.3 | — | 3.6 | — | 4.9 | |||||||||||
2016 and thereafter |
— | 36.4 | 12.2 | — | 48.6 | |||||||||||
Total |
$ | 16.8 | $ | 36.5 | $ | 30.1 | $ | 7.8 | $ | 91.2 | ||||||
- (1)
- Our
restructuring reserve at January 2, 2011 includes approximately $0.5 million relating to the above operating lease commitments. The
Company intends to seek sub-leases for unused facilities.
- (2)
- We calculated estimated interest payments for long-term debt as follows: for fixed-rate term debt, we calculated interest based on the applicable rates and payment dates; for variable-rate term debt, we calculated interest based on the most recent applicable interest rates in effect.
ITEM 7A—QUANTITATIVE AND QUALITATIVE DISCLOSURES ABOUT MARKET RISK
Market risks relating to our operations result primarily from changes in interest rates on outstanding financial debt instruments and changes in foreign currency exchange rates.
Debt. Our exposure to interest rate risk results from financial debt instruments that we enter. We may also enter into derivative financial instrument transactions, such as swaps, in order to manage or reduce our exposure to interest rate changes related to our indebtedness. However, under no circumstances do we enter into derivative or other financial instrument transactions for speculative purposes. We are exposed to cash flow risk due to changes in market interest rates related to our outstanding debt. For example, in Europe our variable long term debt bears interest on borrowings outstanding at various time intervals and is based on the Euro Interbank Offered Rate (EURIBOR). Our principal risk with respect to our variable long-term debt is to changes in this market rate.
The table below presents principal cash flows and related weighted average interest rates for our credit facilities and long-term debt obligations at January 2, 2011 by expected maturity dates. The information is presented in U.S. dollar equivalents, our reporting currency, and parenthetically in Eurodollar, where applicable. Additionally, the U.S. dollar equivalent carrying value of Eurodollars denominated debt is sensitive to foreign currency exchange rates. However, a 10% change in the U.S. dollar exchange rate against these currencies would not be expected to have a significant effect on our future earnings.
| |
Expected Maturity Date | |
|
|||||||||||||||||||||||
|---|---|---|---|---|---|---|---|---|---|---|---|---|---|---|---|---|---|---|---|---|---|---|---|---|---|---|
| |
|
Fair Value |
||||||||||||||||||||||||
| |
2011 | 2012 | 2013 | 2014 | 2015 | Thereafter | Total | |||||||||||||||||||
| |
(Amounts in millions, except for percentages) |
|||||||||||||||||||||||||
Long-term Debt: |
||||||||||||||||||||||||||
Fixed Rate Sr. Convertible Notes Due 2019(USD) |
$ | — | $ | — | $ | — | $ | — | $ | — | $ | 36.4 | $ | 36.4 | $ | 254.4 | ||||||||||
Average Interest Rate |
10.5 | % | 10.5 | % | ||||||||||||||||||||||
Fixed Rate (EUR 0.1) |
$ | 0.1 | $ | — | $ | — | $ | — | $ | — | $ | — | $ | 0.1 | $ | 0.1 | ||||||||||
Average Interest Rate |
2.0 | % | 2.0 | % | ||||||||||||||||||||||
44
Foreign Currency. A significant portion of our business operations are conducted in various countries in Europe and Asia. As a result, we have a certain degree of market risk with respect to our cash flows due to changes in foreign currency exchange rates when transactions are denominated in currencies other than our functional currency, including inter-company transactions. Historically, we have not actively engaged in substantial exchange rate hedging activities, and at January 2, 2011, we had not entered into any significant foreign exchange contracts.
ITEM 8—FINANCIAL STATEMENTS AND SUPPLEMENTARY DATA
The financial statements and supplementary data listed in Item 15(a)(1) hereof are incorporated herein by reference and are filed as part of this Annual Report on Form 10-K beginning on page F-1.
ITEM 9—CHANGES IN AND DISAGREEMENTS WITH ACCOUNTANTS ON ACCOUNTING AND FINANCIAL DISCLOSURE
None
ITEM 9A—CONTROLS AND PROCEDURES
Evaluation of Disclosure Controls and Procedures
Power-One maintains a system of disclosure controls and procedures that is designed to provide reasonable assurance that material information relating to the company and its consolidated subsidiaries is timely communicated to the officers who certify Power-One's financial reports and to other members of senior management and the Board, as appropriate.
In accordance with Rule 13a-15(b) of the Securities Exchange Act of 1934 (the "Exchange Act"), the company's management evaluated, with the participation of the Chief Executive Officer and Chief Financial Officer, the effectiveness of the design and operation of the company's disclosure controls and procedures (as defined in Rules 13a-15(e) and 15d-15(e) under the Exchange Act) as of January 2, 2011. Based upon their evaluation of these disclosure controls and procedures, the Chief Executive Officer and Chief Financial Officer concluded that the disclosure controls and procedures were effective at the reasonable assurance level as of January 2, 2011, to ensure that information required to be disclosed by the company in the reports it files or submits under the Exchange Act is recorded, processed, summarized and reported, within the time period specified in the Securities and Exchange Commission rules and forms, and to ensure that information required to be disclosed by the company in the reports it files or submits under the Exchange Act is accumulated and communicated to the company's management, including its principal executive and principal financial officers, or persons performing similar functions, as appropriate, to allow timely decisions regarding required disclosure.
Changes In Internal Control Over Financial Reporting
There have been no significant changes in our internal control over financial reporting, as defined in Exchange Act Rule 13a-15(f), during the fourth fiscal quarter of 2010 that have materially affected, or are reasonably likely to materially affect, our internal control over financial reporting.
Management's Report on Internal Control Over Financial Reporting
Our management is responsible for establishing and maintaining adequate internal control over financial reporting (as defined in Exchange Act Rules 13a-15(f) and 15d-15(f) under the Securities Exchange Act of 1934, as amended). Under the supervision and with the participation of our management, including our Chief Executive Officer and Chief Financial Officer, we evaluated the effectiveness of our internal control over financial reporting based on the criteria set forth by the Committee of Sponsoring Organizations of the Treadway Commission in Internal Control—Integrated
45
Framework . Based on this assessment, the company's management believes that, as of January 2, 2011, our internal control over financial reporting was effective. The company's internal control over financial reporting as of January 2, 2011, has been audited by Deloitte & Touche LLP, an independent registered public accounting firm, as stated in their attestation report, which is included herein.
Our management, including the Chief Executive Officer and Chief Financial Officer, does not expect that our internal control over financial reporting will prevent all error or fraud. Because of inherent limitations, a system of internal control over financial reporting can provide only reasonable assurance and may not prevent or detect misstatements. Further, because of changes in conditions, the effectiveness of internal control over financial reporting may vary over time.
Not applicable.
46
ITEM 10—DIRECTORS, EXECUTIVE OFFICERS AND CORPORATE GOVERNANCE
The information pursuant to Items 401 (other than as described in the following paragraph), 407(c)(3), (d)(4) and (d)(5) of Regulation S-K required by this item will be contained in our definitive Proxy Statement related to our 2011 Annual Meeting of Stockholders, and such information is incorporated herein by reference.
The information relating to our executive officers required by this item is included herein in Part I, Item 1 under the caption "Executive Officers of the Registrant," and such information is incorporated by reference into this section.
The information required pursuant to Item 405 of Regulation S-K will be contained under the caption "Section 16(a) Beneficial Ownership Reporting Compliance" in our definitive Proxy Statement related to our 2011 Annual Meeting of Stockholders, and such information is incorporated herein by reference.
The information required pursuant to Item 406 of Regulation S-K is presented below.
We adopted a senior officer code of ethics that specifically applies to our principal executive officer, principal financial officer, and all associated principal corporate and divisional/business unit financial managers. This code of ethics is posted in the "Governance" section within the "Investor Relations" pages of our Website. The Internet address for our Website is www.power-one.com. Printed copies of the code of ethics are available upon written request to the Corporate Secretary, Power-One, Inc., 740 Calle Plano, Camarillo, California 93012.
Disclosure requirements regarding any amendment to or waiver of any provision of this code of ethics are satisfied by posting such information on our website at the address stated above, within the "Governance" section of the website.
ITEM 11—EXECUTIVE COMPENSATION
The information required by this item will be contained in our definitive Proxy Statement related to our 2011 Annual Meeting of Stockholders, and such information is incorporated herein by reference.
ITEM 12—SECURITY OWNERSHIP OF CERTAIN BENEFICIAL OWNERS AND MANAGEMENT AND RELATED STOCKHOLDER MATTERS
The information required by this item will be contained in our definitive Proxy Statement related to our 2011 Annual Meeting of Stockholders, and such information is incorporated herein by reference.
ITEM 13—CERTAIN RELATIONSHIPS AND RELATED TRANSACTIONS, AND DIRECTOR INDEPENDENCE
Additional information called for by this item will be contained in our definitive Proxy Statement related to our Annual Meeting of Stockholders expected to occur May 3, 2011, and is incorporated herein by reference.
ITEM 14—PRINCIPAL ACCOUNTING FEES AND SERVICES
The information called for by this item will be contained in our definitive Proxy Statement related to our 2011 Annual Meeting of Stockholders, and is incorporated herein by reference.
47
ITEM 15—EXHIBITS, FINANCIAL STATEMENT SCHEDULES
(a)(1) FINANCIAL STATEMENTS
The following financial statements are filed as a part of this Annual Report on Form 10-K:
(a)(2) SCHEDULES
The following financial statement schedule is filed as a part of this Annual Report on Form 10-K and is incorporated herein by reference.
POWER-ONE, INC.
|
Page | |
|---|---|---|
Schedule II: Valuation and Qualifying Accounts |
S-1 |
(c) EXHIBITS
The exhibit index on page S-2 is hereby incorporated by reference.
48
Pursuant to the requirements of Section 13 or 15(d) of the Securities Exchange Act of 1934, as amended, the registrant has duly caused this Annual Report on Form 10-K to be signed on its behalf by the undersigned, thereunto duly authorized.
| POWER-ONE, INC. | ||||
By: |
/s/ RICHARD J. THOMPSON Richard J. Thompson Chief Executive Officer |
|||
Date: March 15, 2011
We the undersigned directors and officers of Power-One, Inc. hereby constitute and appoint Richard J. Thompson and Gary R. Larsen, or any of them, our true and lawful attorneys and agents, to do any and all acts and things in our name and behalf in our capacities as directors and officers and to execute any and all instruments for us and in our names in the capacities indicated below, that said attorneys and agents, or either of them, may deem necessary or advisable to enable said corporation to comply with the Securities Exchange Act of 1934, as amended, any rules, regulations, and requirements of the SEC, in connection with this Annual Report on Form 10-K, including specifically, but not limited to, power and authority to sign for us or any of us in our names and in the capacities indicated below, any and all amendments and supplements to this Annual Report on Form 10-K, and we hereby ratify and confirm all that the said attorneys and agents, or any of them, shall do or cause to be done by virtue hereof.
Pursuant to the requirements of the Securities Exchange Act of 1934, as amended, this Annual Report on Form 10-K has been signed below by the following persons on behalf of the registrant and in the capacities and on the dates indicated below.
Signature
|
Title
|
Date
|
||
|---|---|---|---|---|
/s/ (RICHARD J. THOMPSON) |
President and Chief Executive Officer (Principal |
March 15, 2011 | ||
/s/ (GARY R. LARSEN) |
Senior Vice President—Finance and Chief Financial |
March 15, 2011 |
||
/s/ (JAY WALTERS) |
Chairman of the Board of Directors |
March 15, 2011 |
||
/s/ (DR. RICHARD SWANSON) |
Director |
March 15, 2011 |
||
/s/ (KENDALL R. BISHOP) |
Director |
March 15, 2011 |
||
/s/ (MARK MELLIAR-SMITH) |
Director |
March 15, 2011 |
||
/s/ (JON W. GACEK) |
Director |
March 15, 2011 |
||
/s/ (KAMBIZ HOOSHMAND) |
Director |
March 15, 2011 |
||
/s/ (AJAY SHAH) |
Director |
March 15, 2011 |
||
/s/ (KYLE RYLAND) |
Director |
March 15, 2011 |
49
The following financial statements are filed as a part of this Report:
POWER-ONE, INC.
F-1
REPORT OF INDEPENDENT REGISTERED PUBLIC ACCOUNTING FIRM
To
the Board of Directors and Stockholders of
Power-One, Inc.
Camarillo, California
We have audited the accompanying consolidated balance sheets of Power-One, Inc. and subsidiaries (the "Company") as of January 2, 2011 and January 3, 2010, and the related consolidated statements of operations, comprehensive income (loss), stockholders' equity, and cash flows for each of the three years in the period ended January 2, 2011. Our audits also included the financial statement schedule listed in the Index at Item 15. We also have audited the Company's internal control over financial reporting as of January 2, 2011, based on the criteria established in Internal Control—Integrated Framework issued by the Committee of Sponsoring Organizations of the Treadway Commission. The Company's management is responsible for these financial statements and the financial statement schedule, for maintaining effective internal control over financial reporting, and for its assessment of the effectiveness of internal control over financial reporting, included in the accompanying Management's Report on Internal Control Over Financial Reporting. Our responsibility is to express an opinion on these financial statements and the financial statement schedule and an opinion on the Company's internal control over financial reporting based on our audits.
We conducted our audits in accordance with the standards of the Public Company Accounting Oversight Board (United States). Those standards require that we plan and perform the audit to obtain reasonable assurance about whether the financial statements are free of material misstatement and whether effective internal control over financial reporting was maintained in all material respects. Our audits of the financial statements included examining, on a test basis, evidence supporting the amounts and disclosures in the financial statements, assessing the accounting principles used and significant estimates made by management, and evaluating the overall financial statement presentation. Our audit of internal control over financial reporting included obtaining an understanding of internal control over financial reporting, assessing the risk that a material weakness exists, testing and evaluating the design and operating effectiveness of internal control based on the assessed risk. Our audits also included performing such other procedures as we considered necessary in the circumstances. We believe that our audits provide a reasonable basis for our opinions.
A company's internal control over financial reporting is a process designed by, or under the supervision of, the company's principal executive and principal financial officers, or persons performing similar functions, and effected by the company's board of directors, management, and other personnel to provide reasonable assurance regarding the reliability of financial reporting and the preparation of financial statements for external purposes in accordance with generally accepted accounting principles. A company's internal control over financial reporting includes those policies and procedures that (1) pertain to the maintenance of records that, in reasonable detail, accurately and fairly reflect the transactions and dispositions of the assets of the company; (2) provide reasonable assurance that transactions are recorded as necessary to permit preparation of financial statements in accordance with generally accepted accounting principles and that receipts and expenditures of the company are being made only in accordance with authorizations of management and directors of the company; and (3) provide reasonable assurance regarding prevention or timely detection of unauthorized acquisition, use, or disposition of the company's assets that could have a material effect on the financial statements.
Because of the inherent limitations of internal control over financial reporting, including the possibility of collusion or improper management override of controls, material misstatements due to error or fraud may not be prevented or detected on a timely basis. Also, projections of any evaluation of the effectiveness of the internal control over financial reporting to future periods are subject to the risk that the controls may become inadequate because of changes in conditions, or that the degree of compliance with the policies or procedures may deteriorate.
F-2
In our opinion, the consolidated financial statements referred to above present fairly, in all material respects, the financial position of Power-One, Inc. and subsidiaries as of January 2, 2011 and January 3, 2010, and the results of their operations and their cash flows for each of the three years in the period ended January 2, 2011, in conformity with accounting principles generally accepted in the United States of America. Also, in our opinion, such financial statement schedule, when considered in relation to the basic consolidated financial statements taken as a whole, presents fairly, in all material respects, the information set forth therein. Also, in our opinion, the Company maintained, in all material respects, effective internal control over financial reporting as of January 2, 2011, based on the criteria established in Internal Control—Integrated Framework issued by the Committee of Sponsoring Organizations of the Treadway Commission.
/s/ DELOITTE
& TOUCHE LLP
Los Angeles, California
March 15, 2011
F-3
POWER-ONE, INC.
CONSOLIDATED STATEMENTS OF OPERATIONS
(In thousands, except per share data)
| |
Year Ended | |||||||||||
|---|---|---|---|---|---|---|---|---|---|---|---|---|
| |
January 2, 2011 |
January 3, 2010 |
December 28, 2008 |
|||||||||
NET SALES |
$ | 1,047,139 | $ | 431,572 | $ | 537,459 | ||||||
COST OF GOODS SOLD |
644,017 | 335,279 | 426,882 | |||||||||
GROSS PROFIT |
403,122 | 96,293 | 110,577 | |||||||||
EXPENSES: |
||||||||||||
Selling, general and administrative |
74,631 | 57,662 | 75,057 | |||||||||
Engineering and quality assurance |
36,401 | 30,314 | 45,498 | |||||||||
Amortization of intangibles |
1,533 | 1,553 | 2,408 | |||||||||
Restructuring and asset impairment costs |
3,852 | 8,035 | — | |||||||||
Goodwill impairment |
— | 56,999 | — | |||||||||
Litigation |
22,128 | — | — | |||||||||
Total expenses |
138,545 | 154,563 | 122,963 | |||||||||
INCOME (LOSS) FROM OPERATIONS |
264,577 | (58,270 | ) | (12,386 | ) | |||||||
INTEREST AND OTHER INCOME (EXPENSE): |
||||||||||||
Interest income |
361 | 240 | 685 | |||||||||
Interest expense |
(6,705 | ) | (8,744 | ) | (10,018 | ) | ||||||
Gain (loss) on extinguishment of debt |
(5,658 | ) | 8,608 | 3,922 | ||||||||
Other income (expense), net |
(2,323 | ) | 1,199 | (2,585 | ) | |||||||
Total interest and other income (expense) |
(14,325 | ) | 1,303 | (7,996 | ) | |||||||
INCOME (LOSS) BEFORE PROVISION (BENEFIT) FOR INCOME TAXES |
250,252 | (56,967 | ) | (20,382 | ) | |||||||
PROVISION (BENEFIT) FOR INCOME TAXES |
103,615 | 6,866 | (184 | ) | ||||||||
INCOME (LOSS) BEFORE EQUITY IN EARNINGS OF JOINT VENTURE |
146,637 | (63,833 | ) | (20,198 | ) | |||||||
EQUITY IN EARNINGS OF JOINT VENTURE |
1,219 | 568 | 2,657 | |||||||||
NET INCOME (LOSS) |
147,856 | (63,265 | ) | (17,541 | ) | |||||||
PREFERRED STOCK DIVIDEND AND ACCRETION |
3,427 | 2,198 | — | |||||||||
NET INCOME (LOSS) ATTRIBUTABLE TO COMMON STOCKHOLDERS |
$ | 144,429 | $ | (65,463 | ) | $ | (17,541 | ) | ||||
BASIC INCOME (LOSS) PER SHARE |
$ | 1.30 | $ | (0.74 | ) | $ | (0.20 | ) | ||||
DILUTED INCOME (LOSS) PER SHARE |
$ | 0.96 | $ | (0.74 | ) | $ | (0.20 | ) | ||||
BASIC WEIGHTED AVERAGE SHARES OUTSTANDING |
95,731 | 88,054 | 87,627 | |||||||||
DILUTED WEIGHTED AVERAGE SHARES OUTSTANDING |
141,910 | 88,054 | 87,627 | |||||||||
See notes to consolidated financial statements.
F-4
POWER-ONE, INC.
CONSOLIDATED BALANCE SHEETS
(In thousands, except per share data)
| |
January 2, 2011 |
January 3, 2010 |
||||||||
|---|---|---|---|---|---|---|---|---|---|---|
ASSETS |
||||||||||
CURRENT ASSETS: |
||||||||||
Cash and cash equivalents |
$ | 227,907 | $ | 89,553 | ||||||
Accounts receivable: |
||||||||||
Trade, less allowance for doubtful accounts of $5,876 in 2010 and $3,946 in 2009 |
262,546 | 119,783 | ||||||||
Other |
7,980 | 2,763 | ||||||||
Inventories |
152,286 | 73,173 | ||||||||
Prepaid expenses and other current assets |
21,671 | 10,612 | ||||||||
Total current assets |
672,390 | 295,884 | ||||||||
PROPERTY AND EQUIPMENT, net |
63,325 | 48,906 | ||||||||
OTHER INTANGIBLE ASSETS, net |
18,802 | 18,602 | ||||||||
OTHER ASSETS |
7,295 | 7,943 | ||||||||
TOTAL |
$ | 761,812 | $ | 371,335 | ||||||
LIABILITIES AND STOCKHOLDERS' EQUITY |
||||||||||
CURRENT LIABILITIES: |
||||||||||
Bank credit facilities and notes payable |
$ | — | $ | 504 | ||||||
Accounts payable |
213,096 | 89,074 | ||||||||
Restructuring |
549 | 6,866 | ||||||||
Long-term debt, current portion |
103 | 1,269 | ||||||||
Income tax payable |
103,739 | 11,955 | ||||||||
Other accrued expenses |
67,339 | 26,125 | ||||||||
Total current liabilities |
384,826 | 135,793 | ||||||||
LONG-TERM DEBT, less current portion |
35,911 | 78,146 | ||||||||
OTHER LONG-TERM LIABILITIES |
39,445 | 16,281 | ||||||||
COMMITMENTS AND CONTINGENCIES |
||||||||||
REDEEMABLE CONVERTIBLE PREFERRED STOCK par value $0.001; 23.625 series A redeemable convertible preferred stock issued and outstanding at January 2, 2011 and January 3, 2010; liquidation preference $1,000 per share plus accumulated dividends |
19,597 | 18,533 | ||||||||
STOCKHOLDERS' EQUITY |
||||||||||
Common stock, par value $0.001; 300,000 shares authorized; 103,975 and 88,239 shares issued and outstanding at January 2, 2011 and January 3, 2010 |
104 | 88 | ||||||||
Additional paid-in capital |
629,687 | 620,261 | ||||||||
Accumulated other comprehensive income |
41,420 | 39,267 | ||||||||
Accumulated deficit |
(389,178 | ) | (537,034 | ) | ||||||
Total stockholders' equity |
282,033 | 122,582 | ||||||||
TOTAL |
$ | 761,812 | $ | 371,335 | ||||||
See notes to consolidated financial statements.
F-5
POWER-ONE, INC.
CONSOLIDATED STATEMENTS OF COMPREHENSIVE INCOME (LOSS)
(In thousands)
| |
Year Ended | ||||||||||
|---|---|---|---|---|---|---|---|---|---|---|---|
| |
January 2, 2011 |
January 3, 2010 |
December 28, 2008 |
||||||||
NET INCOME (LOSS) |
$ | 147,856 | $ | (63,265 | ) | $ | (17,541 | ) | |||
OTHER COMPREHENSIVE INCOME (LOSS) |
|||||||||||
Unrealized loss on investments |
— | — | (7 | ) | |||||||
Foreign currency translation adjustments(a) |
2,153 | (378 | ) | (875 | ) | ||||||
COMPREHENSIVE INCOME (LOSS) |
$ | 150,009 | $ | (63,643 | ) | $ | (18,423 | ) | |||
- (a)
- Accumulated other comprehensive income (loss) consists of foreign currency translation gains of $41.4 million, $39.3 million and $39.6 million at January 2, 2011, January 3, 2010 and December 28, 2008, respectively.
See notes to consolidated financial statements.
F-6
POWER-ONE, INC.
CONSOLIDATED STATEMENTS OF STOCKHOLDERS' EQUITY
(In thousands, except share data)
| |
Common Stock— $.001 Par Value |
|
|
|
|
|||||||||||||||
|---|---|---|---|---|---|---|---|---|---|---|---|---|---|---|---|---|---|---|---|---|
| |
|
Accumulated Other Comprehensive Income (Loss) |
|
|
||||||||||||||||
| |
Additional Paid-in Capital |
Accumulated Deficit |
|
|||||||||||||||||
| |
Shares | Amount | Total | |||||||||||||||||
BALANCE, DECEMBER 30, 2007 |
87,356,194 | $ | 87 | $ | 615,040 | $ | 40,527 | $ | (456,228 | ) | $ | 199,426 | ||||||||
Net loss |
(17,541 | ) | (17,541 | ) | ||||||||||||||||
Other comprehensive loss |
||||||||||||||||||||
Cumulative translation adjustment |
(875 | ) | (875 | ) | ||||||||||||||||
Unrealized gains (loss) on investments |
(7 | ) | (7 | ) | ||||||||||||||||
Total comprehensive loss |
(18,423 | ) | ||||||||||||||||||
Issuance of common stock under stock option and purchase plans, net of tax |
136,387 | — | (62 | ) | (62 | ) | ||||||||||||||
Stock compensation |
308,839 | 1 | 2,637 | 2,638 | ||||||||||||||||
Issuance of warrants |
640 | 640 | ||||||||||||||||||
BALANCE, DECEMBER 28, 2008 |
87,801,420 | 88 | 618,255 | 39,645 | (473,769 | ) | 184,219 | |||||||||||||
Net loss |
(63,265 | ) | (63,265 | ) | ||||||||||||||||
Other comprehensive loss |
||||||||||||||||||||
Cumulative translation adjustment |
(378 | ) | (378 | ) | ||||||||||||||||
Total comprehensive loss |
(63,643 | ) | ||||||||||||||||||
Issuance of common stock under stock option and purchase plans, net of tax |
6,660 | — | (152 | ) | (152 | ) | ||||||||||||||
Stock compensation |
430,667 | — | 2,103 | 2,103 | ||||||||||||||||
Issuance of warrants |
3,294 | 3,294 | ||||||||||||||||||
Repurchase of warrants |
(1,045 | ) | (1,045 | ) | ||||||||||||||||
Accretion of discount on preferred stock |
(665 | ) | (665 | ) | ||||||||||||||||
Cash dividends on preferred stock |
(1,529 | ) | (1,529 | ) | ||||||||||||||||
BALANCE, JANUARY 3, 2010 |
88,238,747 | 88 | 620,261 | 39,267 | (537,034 | ) | 122,582 | |||||||||||||
Net income |
147,856 | 147,856 | ||||||||||||||||||
Other comprehensive loss |
||||||||||||||||||||
Cumulative translation adjustment |
2,153 | 2,153 | ||||||||||||||||||
Total comprehensive income |
150,009 | |||||||||||||||||||
Issuance of common stock under stock option and purchase plans, net of tax |
943,636 | 1 | 2,765 | 2,766 | ||||||||||||||||
Stock compensation |
668,041 | 1 | 5,619 | 5,620 | ||||||||||||||||
Issuance of common stock upon conversion of 8% Senior Secured Convertible Notes |
17,125,000 | 17 | 32,905 | 32,922 | ||||||||||||||||
Repurchase of common stock |
(3,000,000 | ) | (3 | ) | (28,436 | ) | (28,439 | ) | ||||||||||||
Accretion of discount on preferred stock |
(1,063 | ) | (1,063 | ) | ||||||||||||||||
Cash dividends on preferred stock |
(2,364 | ) | (2,364 | ) | ||||||||||||||||
BALANCE, JANUARY 2, 2011 |
103,975,424 | $ | 104 | $ | 629,687 | $ | 41,420 | $ | (389,178 | ) | $ | 282,033 | ||||||||
See notes to consolidated financial statements.
F-7
POWER-ONE, INC.
CONSOLIDATED STATEMENTS OF CASH FLOWS
(In thousands)
| |
Year Ended | ||||||||||||
|---|---|---|---|---|---|---|---|---|---|---|---|---|---|
| |
January 2, 2011 |
January 3, 2010 |
December 28, 2008 |
||||||||||
CASH FLOWS FROM OPERATING ACTIVITIES: |
|||||||||||||
Net Income (loss) |
$ | 147,856 | $ | (63,265 | ) | $ | (17,541 | ) | |||||
Adjustments to reconcile net loss to net cash provided by (used in) operating activities: |
|||||||||||||
Depreciation and amortization |
15,358 | 17,055 | 18,904 | ||||||||||
Undistributed earnings of joint venture(a) |
(1,219 | ) | (568 | ) | (1,480 | ) | |||||||
Asset impairment(b) |
409 | — | — | ||||||||||
Goodwill impairment(c) |
— | 56,999 | — | ||||||||||
Investment write-off(d) |
— | — | 243 | ||||||||||
Change in fair value of derivative liability |
(670 | ) | (1,110 | ) | — | ||||||||
Stock compensation |
5,620 | 2,103 | 2,637 | ||||||||||
Exchange (gain) loss |
2,373 | (5,484 | ) | 4,674 | |||||||||
Write-off of unamortized debt issue costs |
— | — | 908 | ||||||||||
Net loss on disposal of property and equipment |
190 | 110 | 977 | ||||||||||
Net loss (gain) on extinguishment of debt(e) |
5,658 | (8,608 | ) | (3,922 | ) | ||||||||
Deferred income taxes |
(3,733 | ) | (215 | ) | (1,650 | ) | |||||||
Changes in operating assets and liabilities: |
|||||||||||||
Accounts receivable, net |
(144,235 | ) | 28,525 | (19,204 | ) | ||||||||
Inventories |
(79,502 | ) | 29,651 | 5,115 | |||||||||
Prepaid expenses and other current assets |
(11,528 | ) | 2,900 | (3,460 | ) | ||||||||
Accounts payable |
124,032 | (14,020 | ) | (6,190 | ) | ||||||||
Restructuring reserve |
(6,318 | ) | 3,221 | (3,040 | ) | ||||||||
Income tax payable |
94,112 | 6,128 | 37 | ||||||||||
Accrued expenses |
54,134 | 2,192 | 2,073 | ||||||||||
Other liabilities |
7,398 | (636 | ) | (1,390 | ) | ||||||||
Net cash provided by (used in) operating activities |
209,935 | 54,978 | (22,309 | ) | |||||||||
CASH FLOWS FROM INVESTING ACTIVITIES: |
|||||||||||||
Purchases of available-for-sale investments |
— | — | (115 | ) | |||||||||
Proceeds from available-for-sale investments |
— | — | 7,590 | ||||||||||
Acquisition of property and equipment |
(27,634 | ) | (6,749 | ) | (8,799 | ) | |||||||
Proceeds from sale of property and equipment |
370 | 5 | 15 | ||||||||||
Other assets |
(706 | ) | 182 | 67 | |||||||||
Acquisition of assets of acquired business(f) |
(1,925 | ) | — | — | |||||||||
Net cash used in investing activities |
(29,895 | ) | (6,562 | ) | (1,242 | ) | |||||||
CASH FLOWS FROM FINANCING ACTIVITIES: |
|||||||||||||
Proceeds from (repayments of) borrowings on bank credit facilities |
(466 | ) | (20,643 | ) | 6,269 | ||||||||
Proceeds from issuance on long-term debt, net of debt issue costs |
— | 34,660 | 74,866 | ||||||||||
Repayments of borrowings on long-term debt |
(14,378 | ) | (22,769 | ) | (8,232 | ) | |||||||
Repayments of borrowings on related party indebtedness |
— | — | (50,000 | ) | |||||||||
Dividends paid |
(2,364 | ) | (938 | ) | — | ||||||||
Repurchase of stock warrants |
— | (1,045 | ) | — | |||||||||
Repurchases of common stock |
(28,439 | ) | — | — | |||||||||
Issuance of common stock |
5,685 | 14 | 300 | ||||||||||
Issuance of preferred stock, net of issue costs |
— | 21,445 | — | ||||||||||
Cash paid to satisfy nonvested share related employee tax withholding obligations |
(2,919 | ) | (166 | ) | (362 | ) | |||||||
Net cash provided by (used in) financing activities |
(42,881 | ) | 10,558 | 22,841 | |||||||||
EFFECT OF EXCHANGE RATE CHANGES ON CASH AND CASH EQUIVALENTS |
1,195 | 2,165 | 760 | ||||||||||
INCREASE (DECREASE) IN CASH AND CASH EQUIVALENTS |
138,354 | 61,139 | 50 | ||||||||||
CASH AND CASH EQUIVALENTS, BEGINNING OF PERIOD |
89,553 | 28,414 | 28,364 | ||||||||||
CASH AND CASH EQUIVALENTS, END OF PERIOD |
$ | 227,907 | $ | 89,553 | $ | 28,414 | |||||||
SUPPLEMENTAL CASH FLOW INFORMATION: |
|||||||||||||
Cash paid for: |
|||||||||||||
Interest |
$ | 4,208 | $ | 8,124 | $ | 6,191 | |||||||
Income taxes |
$ | 15,026 | $ | 2,794 | $ | 1,301 | |||||||
- (a)
- During the year ended December 28, 2008, the Company received a cash dividend of $1.2 million related to the undistributed earnings from the joint venture for which it holds a minority interest, representing a return on its investment. The cash dividend and approximately $1.5 million related to the Company's share in the earnings of the joint venture for the year ended December 28, 2008 were recorded in "Equity in earnings of joint venture" in the consolidated statements of operations. During the years ended January 2, 2011 and January 3, 2010, the Company recorded approximately $1.2 million and $0.6 million, respectively related to its share of the earnings in the joint venture in "Equity in earnings of joint venture" in the consolidated statements of operations.
F-8
POWER-ONE, INC.
CONSOLIDATED STATEMENTS OF CASH FLOWS (Continued)
(In thousands)
- (b)
- The
asset impairment charges of $0.4 million for the year ended January 2, 2011 related to the impairment of property and equipment as a
result of the Company's restructuring plan, determined in accordance with ASC 260.
- (c)
- As
a result of the interim goodwill impairment test which utilized the discounted cash flow analysis and comparative market multiples to determine the
Company's fair value for comparison to its carrying value, the Company recorded a goodwill impairment charge of $57.0 million in the consolidated statement of operations for the year ended
January 3, 2010.
- (d)
- The
investment write-off of $0.2 million for the year ended December 28, 2008 related to an investment in a
privately-held company.
- (e)
- During
the year ended December 28, 2008, the company paid $5.5 million to repurchase and extinguish $10 million of its 8% Senior
Secured Convertible Notes. The Company recorded a net gain of $3.9 million related to the extinguishment of debt in its consolidated statements of operations. During the year ended
January 3, 2010, the company paid $20.9 million to repurchase and extinguish $31.3 million of its 8% Senior Secured Convertible Notes. The Company recorded a gain of
$8.6 million, net of the write-off of the unamortized debt issuance costs and accrued interest, related to the extinguishment of debt in its consolidated statements of operations.
During the year ended January 2, 2011, the company paid $10.0 million plus accrued interest to repurchase and extinguish $4.5 million of its 8% Senior Secured Convertible Notes,
and recorded a net loss of $5.7 million net of the write-off of the unamortized debt issuance costs and accrued interest, related to the extinguishment of debt in its consolidated
statements of operations.
- (f)
- At the beginning of the fourth quarter of fiscal 2010, The Company strengthened its renewable energy solutions R&D team through the acquisition of the assets of a small software firm.
SUPPLEMENTAL DISCLOSURE OF NONCASH INVESTING AND FINANCING ACTIVITIES
During the year ended December 28, 2008, the Company recorded the fair value of $0.6 million related to the warrants issued pursuant to a Warrant Agreement dated as of March 6, 2008 between the Company and PWER Bridge, LLC, entered into in connection with the $50 million PWER Bridge loan extension as a discount on the Indebtedness to related parties and an increase to "Additional paid-in capital". The unamortized portion of the discount was subsequently written off and recorded as interest expense during the year ended December 28, 2008 as a result of the repayment of the $50 million PWER Bridge loan.
During the year ended January 3, 2010, the Company recorded $3.3 million in Additional paid-in capital in its consolidated balance sheet related to 8.7 million warrants issued to Silver Lake Sumeru in connection with their investment of $60 million on April 23, 2009.
During the years ended January 2, 2011 and January 3, 2010, the Company declared a dividend of approximately $2.4 million and $1.5 million, respectively on its preferred stock owned by Silver Lake Sumeru of which $0.6 million was unpaid at January 2, 2011 and January 3, 2010.
During the years ended January 2, 2011, January 3, 2010 and December 28, 2008, an additional $2.0 million, $0.9 million, and $0.9 million, respectively, of property and equipment had been purchased but not yet paid.
During the year ended January 2, 2011, $34.2 million face value of the 8% Senior Convertible Notes were converted into 17.1 million shares of the Company's stock. The Company accounted for this debt conversion in accordance with ASC 470, "Debt with Conversion and Other Options" as applicable.
F-9
POWER-ONE, INC.
NOTES TO CONSOLIDATED FINANCIAL STATEMENTS
YEARS ENDED JANUARY 2, 2011, JANUARY 3, 2010 AND DECEMBER 28, 2008
NOTE 1. GENERAL INFORMATION
The accompanying consolidated financial statements of Power-One, Inc. (the "Company" or "Power-One") reflect the consolidated results of its operations for the years ended January 2, 2011 ("Fiscal 2010"), January 3, 2010 ("Fiscal 2009") and December 28, 2008 ("Fiscal 2008") and include the accounts of the Company and its subsidiaries, all of which are wholly owned. The statements were prepared in accordance with accounting principles generally accepted in the United States of America and pursuant to the rules and regulations of the Securities and Exchange Commission ("SEC"). The Company's reporting period coincides with the 52- or 53-week period ending on the Sunday closest to December 31 and its fiscal quarters are the 13- or 14-week periods ending on the Sunday nearest to March 31, June 30, September 30 and December 31. The year ended January 3, 2010 was a 53-week year. The years ended January 2, 2011 and December 28, 2008 were 52-week years.
The Company manufactures and assembles its products primarily at facilities in United States, China, Italy, and Slovakia and at several contract manufacturers located predominantly in Asia. During the first half of fiscal 2010, the Company exited its factory in the Dominican Republic.
The Company is organized into the Renewable Energy Solutions and Power Solutions operating segments, or strategic business units ("SBUs"), based on the products and services provided. Renewable Energy Solutions offers inverters and accessories for the photovoltaic/solar and wind markets. These inverters convert DC energy from solar panels and wind turbines into AC energy for customer use or for the utility grid. The Power Solutions segment represents the Company's products for AC/DC, DC/DC and digital power conversion, including power conversion products for data centers, such as servers, storage and networking, as well as telecom and industrial power conversion products.
No customer exceeded 10% of the Company's sales in 2010, 2009 or 2008. No customer represented more than 10% of the Company's trade accounts receivable balances as of January 2, 2011 or January 3, 2010.
NOTE 2. SIGNIFICANT ACCOUNTING POLICIES AND NEW ACCOUNTING PRONOUNCEMENTS
Principles of Consolidation—The accompanying consolidated financial statements include the consolidated accounts of the Company and its wholly owned subsidiaries. All significant intercompany balances and transactions have been eliminated. The Company includes in its statement of operations its pro rata share of the financial results of investments accounted for under the equity method.
Use of Estimates in the Preparation of the Financial Statements—The preparation of the financial statements and related disclosures in conformity with accounting principles generally accepted in the United States of America requires management to make estimates and assumptions that affect amounts reported in the consolidated financial statements and accompanying notes. Estimates are used for, but not limited to, the accounting for the allowance for doubtful accounts, inventory valuation, restructuring costs, goodwill impairment analysis, impairment costs, depreciation and amortization, sales returns and discounts, warranty costs, uncertain tax positions and the recoverability of deferred tax assets, stock compensation, business combinations and contingencies. Due to the inherent uncertainty involved in making estimates, actual results reported in future periods may differ from those estimates.
F-10
POWER-ONE, INC.
NOTES TO CONSOLIDATED FINANCIAL STATEMENTS (Continued)
YEARS ENDED JANUARY 2, 2011, JANUARY 3, 2010 AND DECEMBER 28, 2008
Revenue Recognition—The Company recognizes revenue when persuasive evidence of an arrangement exists, title transfer has occurred, the price is fixed or readily determinable, and collectability is reasonably assured. The Company recognizes revenue in accordance with ASC 605, "Revenue Recognition." Sales are recorded net of sales returns and discounts, which are estimated based upon historical data.
The Company generally recognizes revenue at the time of shipment (or at the time of inventory consumption for customers on Vendor Managed Inventory ("VMI") programs) because this is the point at which revenue is earned and realizable and the earnings process is complete. For most shipments, title to shipped goods transfers at the shipping point, so the risks and rewards of ownership transfer once the product leaves the Company's warehouse. Revenue is only recognized when collectability is reasonably assured. Shipping and handling costs are included in cost of goods sold. Shipping and handling costs may be charged to customers, and are included in net sales.
The Company offers its distributors a standard agreement which includes payment terms, description of rights to return or exchange product, and price discounts. In general, payment is due within 30 days of shipment of the product to the distributors. The distributor has a right to return only if the Company discontinues a product that the distributor has on hand. The distributor has a right to exchange up to 5% of the dollar value of products purchased within the prior six-month period, so long as the distributor is currently purchasing at least the equivalent dollar value in new product. Estimated product exchanges or returns are accrued for at the time of the sale based on historical information in accordance with ASC 605-15 "Revenue Recognition-Products." Finally, the Company may give price discounts to a distributor at the time a purchase order is received from the distributor for product that they will sell to a specific customer. The price discount is typically available for one year following issuance of the purchase order for items listed on the purchase order. The Company accrues for the estimated price discount at the time revenue is recognized.
The Company has a joint venture in Asia that, along with certain of its contract manufacturers, may purchase raw components and other goods from Power-One, and sell finished goods back to Power-One as well as to other third parties. The Company records revenue on sales to the joint venture and contract manufacturers only when the components and goods are for sales to third parties. When the joint venture or contract manufacturers purchase components that will be assembled and sold back to the Company, no revenue is recorded because the earnings process has not been completed.
Cash and Cash Equivalents—The Company considers all highly liquid instruments with a maturity of three months or less at purchase date to be cash equivalents.
Accounts Receivable and Allowance for Doubtful Accounts—The Company establishes the allowance for doubtful accounts using the specific identification method and also provides a reserve in the aggregate. The estimates for calculating the aggregate reserve are based on historical information.
Inventories—Inventories are stated at the lower of cost (first-in, first-out method) or market. Slow moving and obsolete inventories are written down quarterly based on a comparison of on-hand quantities to historical and projected usages. Additionally, reserves for non-cancelable open purchase orders for components the Company is obligated to purchase in excess of projected usage, or for open purchase orders where the market price is lower than the purchase order price, are recorded as other accrued expenses on the balance sheet.
F-11
POWER-ONE, INC.
NOTES TO CONSOLIDATED FINANCIAL STATEMENTS (Continued)
YEARS ENDED JANUARY 2, 2011, JANUARY 3, 2010 AND DECEMBER 28, 2008
Property and Equipment—Property and equipment are recorded at cost. Provision for depreciation has been made based upon the estimated useful lives of the assets, which range from three to 30 years, using principally the straight-line method. Provision for amortization of leasehold improvements is made based upon the estimated lives of the assets or terms of the leases, whichever are shorter. Property and equipment held for sale have been classified in accordance with the provisions of ASC 360, "Property, Plant and Equipment."
Intangible Assets—Intangible assets include identifiable intangibles acquired in connection with the acquisition of the Company in 1995, the Power Electronics Group of Magnetek, Inc. in 2006 and Fat Spaniel during the fourth quarter of 2010. A portion of the acquisition cost was allocated among certain identifiable intangibles determined by management to have value, such as the Company's name, distribution network and product technology. Provision for amortization has been made based upon the estimated useful lives of the intangible asset categories, which range from three months to 20 years, using the straight-line method as this best represents the benefits derived.
Impairment of Long-Lived Assets and Goodwill—The Company reviews the recoverability of the carrying value of long-lived assets for each reportable segment using the methodology prescribed in ASC 360 "Property, Plant and Equipment." The Company reviews long-lived assets for impairment whenever events or changes in circumstances indicate that the carrying value of such assets may not be recoverable. Upon such an occurrence, recoverability of these assets is determined by comparing the forecasted undiscounted net cash flows to which the assets relate, to the carrying amount. If the asset is determined to be unable to recover its carrying value, it is written down to fair value. Fair value is determined based on discounted cash flows, appraised values or other information available in the market, depending on the nature of the assets.
The Company reviews the carrying value of goodwill and non-amortizable intangible assets for each reportable segment using the methodology prescribed in ASC 350, "Intangibles—Goodwill and Other." ASC 350 requires that the Company not amortize goodwill and intangible assets with indefinite lives, but instead subject them to impairment tests on at least an annual basis and whenever circumstances suggest that they may be impaired. The Company tests its goodwill and non-amortizable intangible assets for impairment on an annual basis at the end of its August fiscal month. ASC 350 requires the Company to perform a two-step impairment test. Under the first step of the goodwill impairment test, the Company is required to compare the fair value of a reporting unit with its carrying amount, including goodwill. If the fair value of a reporting unit exceeds its carrying amount, goodwill of the reporting unit is not considered impaired and the Company does not perform the second step. If the results of the first step impairment test indicate that the fair value of a reporting unit does not exceed its carrying amount, then the second step of the goodwill impairment test is required. The second step of the goodwill impairment test compares the implied fair value of the reporting unit goodwill with the carrying amount of that goodwill. The impairment loss is measured by the excess of the carrying amount of the reporting unit goodwill over the implied fair value of that goodwill.
As a result of the continued decrease in its market capitalization during the first fiscal quarter of 2009, the Company tested its goodwill for impairment and determined that goodwill was impaired. The Company's testing approach utilized a discounted cash flow analysis and comparative market multiples to determine the entity's fair value for comparison to its carrying value. As the Company's carrying value exceeded its estimated fair value as of March 29, 2009, the Company applied the approach prescribed in ASC 350-20 for determining the impairment amount. As a result of the Company's
F-12
POWER-ONE, INC.
NOTES TO CONSOLIDATED FINANCIAL STATEMENTS (Continued)
YEARS ENDED JANUARY 2, 2011, JANUARY 3, 2010 AND DECEMBER 28, 2008
interim test, a goodwill impairment charge of $57.0 million was recorded in the Company's consolidated statement of operations during the year ended January 3, 2010.
Restructuring Costs—The Company records restructuring charges in accordance with ASC 420, "Exit or Disposal Cost Obligations," and ASC 712 "Compensation—Nonretirement Postemployment Benefits," as applicable. ASC 420 requires that a liability for a cost associated with an exit or disposal activity be recognized when the liability is incurred, in contrast to the date of an entity's commitment to an exit plan. Restructuring costs related to the downsizing of the Company's operations and primarily consisted of specific charges that had been incurred or are to be incurred with no future economic benefit. These charges included costs related to personnel severance, continuing lease obligations for vacant facilities, and certain contract termination penalties and other shutdown costs. In accordance with the guidance provided under ASC 712, costs are accrued for severance expenses prior to notification for termination benefits that are contractual or required by regional labor laws or are pursuant to a substantive plan where the costs are deemed probable and reasonably estimable. During the year ended January 2, 2011 and January 3, 2010, the Company incurred charges and expenses related to various restructuring efforts, including pre-tax restructuring charges of $3.4 million and $8.0 million, respectively, in connection with the exit of its factory in the Dominican Republic.
Income Taxes—Income taxes are provided for taxes currently payable or refundable, and for deferred income taxes arising from future tax consequences of events that have been recognized in the Company's financial statements or tax returns. The effects of income taxes are measured based on enacted tax laws and rates applicable to periods in which the differences are expected to reverse. If necessary, a valuation allowance is established to reduce deferred income tax assets to an amount that will more likely than not be realized in accordance with ASC 740 "Income Taxes." Income taxes are provided for in foreign locations where the Company is profitable.
The Company records uncertain tax positions under the provisions of ASC 740. The Company recognizes in the consolidated financial statements only those tax positions determined to be more likely than not of being sustained upon examination, based on the technical merits of the positions. Under these provisions, the Company must assume that the taxing authority will examine the income tax position and will have full knowledge of all relevant information. For each income tax position that meets the more likely than not recognition threshold, the Company then assesses the largest amount of tax benefit that is greater than 50 percent likely of being realized upon effective settlement with the taxing authority. Unrecognized tax positions, if ever recognized in the financial statements, are recorded in the statement of operations as part of the income tax provision. The Company's policy is to recognize interest and penalties accrued on uncertain tax positions as part of income tax provision. The Company or one of its subsidiaries files income tax returns in the U.S. federal, and various state, local and foreign jurisdictions.
Stock Compensation—The Company accounts for stock based compensation under the provisions of ASC 718, "Compensation—Stock Compensation" using the modified prospective method. Under this method, compensation cost is recognized on or after the effective date for the portion of outstanding awards, for which the requisite service has not yet been rendered, based on the grant date fair value of those awards. For stock-based awards issued on or after January 1, 2006, the Company recognizes the compensation cost on a straight-line basis over the requisite service period for the entire award.
Earnings Per Share—The Company presents both basic and diluted earnings (loss) per share ("EPS") amounts. Basic and diluted earnings per common share ("EPS") are calculated utilizing the
F-13
POWER-ONE, INC.
NOTES TO CONSOLIDATED FINANCIAL STATEMENTS (Continued)
YEARS ENDED JANUARY 2, 2011, JANUARY 3, 2010 AND DECEMBER 28, 2008
"two-class" method. Under the two-class method, EPS is computed by dividing earnings allocated to common stockholders by the weighted-average number of common shares outstanding for the period. Earnings are allocated to both common shares and participating securities based on the respective number of weighted-average shares outstanding for the period. The Company's convertible preferred stock are participating securities due to their participation rights related to cash dividends declared by the Company. If dividends are distributed to the common stockholders, the Company is required to pay dividends to the holders of the preferred stock and common stock pro-rata on an as converted basis. Authoritative guidance issued by the FASB requires net losses attributable to common stockholders to be allocated among common stock and participating securities to the extent that the securities are required to share in the losses. Since the convertible preferred stock is not contractually obligated to share in the Company's losses, no allocation was made to preferred stock for periods where a net loss existed.
Engineering and Research and Development—Engineering costs include existing product engineering, custom product development and research and development costs. Research and development costs are expensed in the period incurred in accordance with ASC 730, "Research and Development." Research and development expenses were $23.2 million, $15.6 million, and $23.7 million, for the years ended January 2, 2011, January 3, 2010, and December 28, 2008, respectively.
Warranties—The Company generally offers its customers a two-year warranty on power products sold, although warranty periods may vary by product type and application. The Company offers its renewable energy customers extended warranty contracts with terms between five and ten years after the base warranty period expires and accounts for such warranty contracts in accordance with ASC 605-20-25, "Revenue Recognition." Based on warranty repair costs and the estimated rate of return, the Company periodically reviews and adjusts its warranty accrual. Actual repair costs are charged against the reserve balance as incurred.
Derivative Instruments—The Company accounts for derivative instruments in accordance with ASC 815, "Derivatives and Hedging" and subsequent amendments, which establish accounting and reporting standards for derivative instruments, including certain derivative instruments embedded in other contracts, and for hedging activities.
Concentration of Risk—Financial instruments that potentially subject the Company to concentrations of credit risk consist primarily of cash and cash equivalents placed with high credit quality institutions and trade receivables. The Company sells products and extends credit to customers, primarily in the United States, Europe and Asia; periodically monitors its exposure to credit losses; and maintains allowances for anticipated losses.
Translation of Foreign Currencies—The reporting currency for the consolidated financial statements of the Company is the U.S. dollar. The assets and liabilities of companies whose functional currency is other than the U.S. dollar are included in the consolidation by translating the assets and liabilities at the exchange rates applicable at the end of the reporting period. The statements of operations and cash flows of such companies are translated at the average exchange rates during the applicable period. Translation gains or losses are accumulated as a separate component of stockholders' equity. The Company has not tax-effected the cumulative translation adjustment as it is the Company's intention to permanently re-invest the undistributed earnings.
F-14
POWER-ONE, INC.
NOTES TO CONSOLIDATED FINANCIAL STATEMENTS (Continued)
YEARS ENDED JANUARY 2, 2011, JANUARY 3, 2010 AND DECEMBER 28, 2008
Business Combinations—The Company accounts for its acquisitions utilizing the purchase method of accounting in accordance with ASC 805 "Business Combinations." Under the purchase method of accounting, the total consideration paid is allocated to the underlying assets and liabilities, based on their respective estimated fair values. The excess of the purchase price over the estimated fair values of the net assets acquired is recorded as goodwill. Determining the fair value of certain acquired assets and liabilities, identifiable intangible assets in particular, is subjective in nature and often involves the use of significant estimates and assumptions including, but not limited to: estimates of revenue growth rates; estimates of rates of return; royalty rates; and determination of appropriate discount rates. These assumptions are generally made based on available historical information. Identifiable intangible assets with finite lives are amortized on a straight-line basis over their useful lives.
Segment Reporting—The Company is organized into two operating segments, Renewable Energy Solutions and Power Solutions based on the products and services provided. Corporate is a non-operating business segment with the main purpose of supporting operations. The Company accounts for segments in accordance with ASC 280, "Segment Reporting." The Company's chief operating decision maker and management personnel view the Company's performance and make resource allocation decisions by looking at the operating segments.
Recent Pronouncements and Accounting Changes—In January 2010, the Financial Accounting Standards Board ("FASB") issued Accounting Standards Update ("ASU") 2010-06, an update that improves the requirements related to Fair Value Measurements and Disclosures Subtopic 820-10 of the FASB Accounting Standards Codification ("ASC") originally issued as FASB Statement 157. This update requires disclosures about transfers between Level 1, Level 2 and Level 3 assets and the disaggregated activity in the roll forward for level 3 Fair Value measurements. The Company adopted the measurement requirements of this guidance during the year ended January 2, 2011 with no impact to the consolidated financial statements.
In October 2009, the FASB issued ASU No. 2009-13, "Multiple-Deliverable Revenue Arrangements a consensus of the FASB Emerging Issues Task Force," ("ASU 2009-13"). This update provides amendments to the criteria of ASC 605, "Revenue Recognition," for separating consideration in multiple-deliverable arrangements. The amendments to this update establish a selling price hierarchy for determining the selling price of a deliverable. This Accounting Standards Update will be applied on a prospective basis for revenue arrangements entered into or materially modified in fiscal years beginning on or after June 15, 2010, with earlier application permitted. Alternatively, an entity can elect to adopt this standard on a retrospective basis.
NOTE 3—FAIR VALUE FINANCIAL INSTRUMENTS
ASC 820, "Fair Value Measurements and Disclosures" establishes a framework for measuring fair value, and expands disclosures about fair value measurements. ASC 820 establishes a fair value hierarchy that prioritizes the inputs to valuation techniques used to measure fair values into three levels as follows:
- •
- Level 1—Inputs are unadjusted quoted prices in active markets for identical assets or liabilities that
the Company has the ability to access at the measurement date.
- •
- Level 2—Inputs include quoted prices for similar assets and liabilities in active markets, quoted prices for identical or similar assets or liabilities in markets that are not active, inputs other than
F-15
POWER-ONE, INC.
NOTES TO CONSOLIDATED FINANCIAL STATEMENTS (Continued)
YEARS ENDED JANUARY 2, 2011, JANUARY 3, 2010 AND DECEMBER 28, 2008
- •
- Level 3—Unobservable inputs reflect the Company's judgments about the assumptions market participants would use in pricing the asset or liability since limited market data exists. The Company develops these inputs based on the best information available, including the Company's own data.
quoted prices that are observable for the asset or liability and inputs that are derived principally from or corroborated by observable market data by correlation or other means.
The following table presents the fair values of the Company's financial instruments (in millions):
Description
|
Level 3 | |||
|---|---|---|---|---|
Embedded Put Options (at January 3, 2010) |
$ | 0.7 | ||
Change in fair value of derivative liability |
(0.7 | ) | ||
Embedded Put Options (at January 2, 2011) |
$ | — | ||
The fair value of the Embedded Put Options was determined using the Binomial model, using a stock price of $10.20, an exercise price of $1.35 per share, volatility factor of 82%, risk-free interest rate of 1.22%, contractual term of 3.3 years and a probability factor of 8.3%. During the year ended January 2, 2011, the Company recorded an unrealized gain of $0.7 million as other income in the consolidated statement of operations resulting from the change in fair value of the embedded put option.
The fair value of certain of the Company's financial instruments, including cash and cash equivalents, accounts receivable, accounts payable and other current liabilities approximate their recorded carrying amounts because of their short-term nature.
- •
- The fair value of the Senior Convertible Notes due 2019 was determined by adding the fair value of the notes' conversion
feature to the present value of the notes which includes a 10% discount for lack of marketability. The fair value of the notes' conversion feature was determined using the Binomial model, using a
stock price of $10.20, an exercise price of $1.35 per share, a volatility factor of 82%, a risk free interest rate of 1.22%, coupon rates of 6%, 8% and 10% and a contractual life of 3.3 years.
- •
- The fair value of the Redeemable Convertible Preferred Stock was determined by adding the fair value of the preferred
stock conversion feature to the present value of the preferred stock which includes a 10% discount for lack of marketability. The fair value of the preferred stock conversion feature was determined
using the Binomial model, using a stock price of $10.20, an exercise price of $1.35 per share, a volatility factor of 82%, a risk free interest rate of 1.22%, a dividend yield factor of 10% and a
contractual life of 3.3 years.
- •
- The secured notes payable have variable rates of interest and reflect current market rates of interest and the fair value approximates the carrying amount.
F-16
POWER-ONE, INC.
NOTES TO CONSOLIDATED FINANCIAL STATEMENTS (Continued)
YEARS ENDED JANUARY 2, 2011, JANUARY 3, 2010 AND DECEMBER 28, 2008
- •
- The fair values of the Company's installment notes were determined using quoted market prices for similar financial instruments.
| |
January 2, 2011 | January 3, 2010 | |||||||||||
|---|---|---|---|---|---|---|---|---|---|---|---|---|---|
Description
|
Fair Value |
Carrying Value |
Fair Value |
Carrying Value |
|||||||||
Senior Convertible Notes, due 2019 |
$ | 254.4 | $ | 35.9 | $ | 94.5 | $ | 35.7 | |||||
Redeemable Convertible Preferred Stock |
165.5 | 19.6 | 60.4 | 18.5 | |||||||||
Credit facilities, secured note payable and installment notes |
0.1 | 0.1 | 5.4 | 5.4 | |||||||||
8% Senior Secured Convertible Notes, due 2013 |
— | — | 84.6 | 38.8 | |||||||||
NOTE 4. INVESTMENTS
The Company has an investment in a joint venture in China which is included in other assets on the Company's consolidated balance sheets and is accounted for using the equity method. The carrying value of this investment was $3.1 million and $1.7 million at January 2, 2011 and January 3, 2010, respectively. During the years ended January 2, 2011 and January 3, 2010, the Company recorded equity in earnings in joint venture of $1.2 million and $0.6 million, respectively, in its consolidated statements of operations. See Note 19.
NOTE 5. INVENTORIES
Inventories consist of the following (in millions):
| |
January 2, 2011 |
January 3, 2010 |
|||||
|---|---|---|---|---|---|---|---|
Raw materials |
$ | 107.6 | $ | 45.6 | |||
Subassemblies-in-process |
6.3 | 4.8 | |||||
Finished goods |
38.4 | 22.8 | |||||
|
$ | 152.3 | $ | 73.2 | |||
The Company looks at historical and projected usage for inventory in determining what is excess and obsolete. The methodology for forecasting demand may be modified depending on specific product lifecycles and local circumstances. Any inventory in excess of this demand is written off. During the years ended January 2, 2011, January 3, 2010 and December 28, 2008, the Company wrote off $11.1 million, $13.3 million and $9.2 million, respectively, related to excess and obsolete inventory and other inventory adjustments, and recorded the charges as costs of goods sold.
F-17
POWER-ONE, INC.
NOTES TO CONSOLIDATED FINANCIAL STATEMENTS (Continued)
YEARS ENDED JANUARY 2, 2011, JANUARY 3, 2010 AND DECEMBER 28, 2008
NOTE 6. PROPERTY AND EQUIPMENT
Property and equipment consist of the following (in millions):
| |
January 2, 2011 |
January 3, 2010 |
|||||
|---|---|---|---|---|---|---|---|
Land |
$ | 2.0 | $ | 2.1 | |||
Buildings (useful lives of 20 to 30 years) |
18.3 | 18.5 | |||||
Building related equipment (useful lives of 20 to 30 years) |
4.0 | 4.2 | |||||
Factory and office equipment (useful lives of 3 to 10 years) |
103.6 | 97.7 | |||||
Vehicles (useful lives of 3 to 7 years) |
0.3 | 0.4 | |||||
Leasehold improvements (useful lives of 5 to 10 years) |
6.7 | 13.4 | |||||
Construction in progress |
1.3 | 0.8 | |||||
|
136.2 | 137.1 | |||||
Less accumulated depreciation and amortization |
72.9 | 88.2 | |||||
|
$ | 63.3 | $ | 48.9 | |||
Depreciation expense was $12.7 million, $14.2 million and $15.4 million, for the years ended January 2, 2011, January 3, 2010 and December 28, 2008, respectively.
NOTE 7. INTANGIBLE ASSETS
Intangible assets consist of the following (in millions):
| |
January 2, 2011 | |
||||||||||||
|---|---|---|---|---|---|---|---|---|---|---|---|---|---|---|
| |
Gross Intangible Assets |
Accumulated Amortization |
Net Intangible Assets |
Weighted Average Life (In Years) |
||||||||||
Non-amortizable intangibles |
||||||||||||||
Trade name |
$ | 11.4 | $ | — | $ | 11.4 | ||||||||
Amortizable intangibles |
||||||||||||||
Product technology |
8.0 | 4.2 | 3.8 | 10 | ||||||||||
Customer relationships |
5.5 | 3.3 | 2.2 | 7 | ||||||||||
Other |
6.4 | 5.0 | 1.4 | 17 | ||||||||||
Subtotal |
19.9 | 12.5 | 7.4 | 12 | ||||||||||
Total |
$ | 31.3 | $ | 12.5 | $ | 18.8 | ||||||||
F-18
POWER-ONE, INC.
NOTES TO CONSOLIDATED FINANCIAL STATEMENTS (Continued)
YEARS ENDED JANUARY 2, 2011, JANUARY 3, 2010 AND DECEMBER 28, 2008
| |
January 3, 2010 | |
||||||||||||
|---|---|---|---|---|---|---|---|---|---|---|---|---|---|---|
| |
Gross Intangible Assets |
Accumulated Amortization |
Net Intangible Assets |
Weighted Average Life (In Years) |
||||||||||
Non-amortizable intangibles |
||||||||||||||
Trade name |
$ | 11.4 | $ | — | $ | 11.4 | ||||||||
Subtotal |
||||||||||||||
Amortizable intangibles |
||||||||||||||
Product technology |
5.8 | 3.7 | 2.1 | 13 | ||||||||||
Customer relationships |
5.9 | 2.7 | 3.2 | 7 | ||||||||||
Other |
6.5 | 4.6 | 1.9 | 17 | ||||||||||
Subtotal |
18.2 | 11.0 | 7.2 | 12 | ||||||||||
Total |
$ | 29.6 | $ | 11.0 | $ | 18.6 | ||||||||
In accordance with ASC 350, "Intangibles—Goodwill and Other," the Company reviews goodwill and indefinite-lived intangible assets for impairment annually at the end of each fiscal August, or more often if events or circumstances indicate that impairment may have occurred. In addition to the testing above, which is done on an annual basis, management considers whether certain impairment indicators are present in assessing whether the carrying value of goodwill and other intangible assets may be impaired. As a result of the continued decrease in its market capitalization during the first fiscal quarter of 2009, the Company tested its goodwill for impairment in accordance with ASC 350-20 and determined that goodwill was impaired. The Company's testing approach utilized a discounted cash flow analysis and comparative market multiples to determine the entity's (single reporting unit) fair value for comparison to its carrying value. As the Company's carrying value exceeded its estimated fair value as of March 29, 2009, the Company applied the approach prescribed in ASC 350-20 for determining the impairment amount. As a result of the Company's interim test, a goodwill impairment charge of $57.0 million was recorded in the Company's consolidated statements of operations during the year ended January 3, 2010. The Company's accumulated goodwill impairment charges since its adoption of ASC 350 was $124.6 million.
Total amortization expense for the years ended January 2, 2011, January 3, 2010 and December 28, 2008 was $1.8 million, $1.8 million and $2.7 million, respectively. Of the $1.8 million of expense recorded during the year ended January 2, 2011, approximately $1.5 million was recorded as amortization of intangibles and $0.3 million recorded as cost of goods sold. Of the $1.8 million of expense recorded during the year ended January 3, 2010, approximately $1.6 million was recorded as amortization of intangibles and approximately $0.2 million recorded as cost of goods sold. Of the $2.7 million of expense recorded during the year ended December 28, 2008, approximately $2.4 million was recorded as amortization of intangibles and approximately $0.3 million recorded as cost of goods sold.
F-19
POWER-ONE, INC.
NOTES TO CONSOLIDATED FINANCIAL STATEMENTS (Continued)
YEARS ENDED JANUARY 2, 2011, JANUARY 3, 2010 AND DECEMBER 28, 2008
Estimated future amortization expense for the next five years is as follows, (in millions):
Year Ending December 31,
|
Amortization Expense |
|||
|---|---|---|---|---|
2011 |
$ | 2.0 | ||
2012 |
1.8 | |||
2013 |
1.6 | |||
2014 |
1.0 | |||
2015 |
0.8 | |||
Total |
$ | 7.2 | ||
The changes in the carrying amount of goodwill for the year ended January 3, 2010 is as follows (in millions):
| |
January 3, 2010 |
|||
|---|---|---|---|---|
Beginning balance |
$ | 59.0 | ||
Decrease related to impairment charge |
(57.0 | ) | ||
Changes due to foreign currency fluctuations |
(2.0 | ) | ||
Ending balance |
$ | — | ||
NOTE 8. CREDIT FACILITIES
The Company maintains credit facilities with various banks in Europe and Asia. The aggregate limit on all credit facilities was approximately $21.8 million at January 2, 2011. The credit facilities bear interest on amounts outstanding at various intervals based on published market rates. At January 2, 2011, there were no outstanding borrowings on the credit facilities; however, $1.6 million was committed to guarantee letters of credit. After consideration of these commitments, $20.2 million of borrowing capacity was available to the Company as of January 2, 2011. The revolving credit agreements do not contain financial covenants, but require the Company's subsidiary to provide certain financial reports to the lenders. At January 3, 2010, the total outstanding borrowings on all credit facilities was $0.5 million at a weighted average interest rate of 8.7%, and $1.3 million was committed to guarantee letters of credit. After consideration of these commitments, $21.1 million of borrowing capacity was available to the Company as of January 3, 2010.
F-20
POWER-ONE, INC.
NOTES TO CONSOLIDATED FINANCIAL STATEMENTS (Continued)
YEARS ENDED JANUARY 2, 2011, JANUARY 3, 2010 AND DECEMBER 28, 2008
NOTE 9. OTHER ACCRUED EXPENSES
Other accrued expenses consist of the following (in millions):
| |
January 2, 2011 |
January 3, 2010 |
|||||
|---|---|---|---|---|---|---|---|
Litigation reserve |
$ | 22.1 | $ | — | |||
Accrued bonuses |
16.3 | 2.9 | |||||
Accrued payroll and related expenses |
9.2 | 7.6 | |||||
Accrued warranties |
8.1 | 4.1 | |||||
Other accrued expenses |
11.6 | 11.5 | |||||
|
$ | 67.3 | $ | 26.1 | |||
NOTE 10. WARRANTIES
The Company offers its customers warranties on products sold based on product type and application. Management reviews and adjusts the warranty accrual based on warranty repair costs and the rate of return. Actual repair costs are charged against the reserve. A tabular presentation of the activity within the warranty accrual account for the years ended January 2, 2011, January 3, 2010 and December 28, 2008 is presented below, (in millions):
| |
January 2, 2011 |
January 3, 2010 |
December 28, 2008 |
|||||||
|---|---|---|---|---|---|---|---|---|---|---|
Beginning balance |
$ | 4.1 | $ | 4.0 | $ | 3.1 | ||||
Charges and costs accrued |
19.3 | 3.1 | 4.2 | |||||||
Adjustments related to pre-existing warranties (including changes in estimates) |
(0.1 | ) | (0.8 | ) | — | |||||
Less repair costs incurred |
(2.3 | ) | (2.3 | ) | (3.3 | ) | ||||
Change due to foreign currency |
0.4 | 0.1 | — | |||||||
Ending balance |
$ | 21.4 | $ | 4.1 | $ | 4.0 | ||||
As of January 2, 2011, $13.3 million of long-term accrued warranties were included as a component of Other Long-Term Liabilities in the Consolidated Balance Sheets.
The Company offers its renewable energy customers extended warranty contracts with terms between five and ten years after the base warranty period expires and accounts for such warranty contract in accordance with ASC 605-20-25. Deferred revenue related to such extended warranty contracts was $8.8 million and $1.3 million, as of January 2, 2011, January 3, 2010, respectively, which were included as part of Other Long-Term Liabilities in the Consolidated Balance Sheets.
F-21
POWER-ONE, INC.
NOTES TO CONSOLIDATED FINANCIAL STATEMENTS (Continued)
YEARS ENDED JANUARY 2, 2011, JANUARY 3, 2010 AND DECEMBER 28, 2008
NOTE 11. RESTRUCTURING COSTS AND ASSET IMPAIRMENT CHARGES
Restructuring Costs
A summary of the restructuring activity during the years ended January 2, 2011, January 3, 2010 and December 28, 2008 is as follows (in millions):
| |
Worldwide Workforce Reduction |
Facilities Closure |
Total | ||||||||
|---|---|---|---|---|---|---|---|---|---|---|---|
Balance at December 31, 2007 |
$ | 2.0 | $ | 4.7 | $ | 6.7 | |||||
Applications of reserve |
(1.1 | ) | (1.9 | ) | (3.0 | ) | |||||
Balance at December 28, 2008 |
0.9 | 2.8 | 3.7 | ||||||||
Restructuring charges |
7.1 | 0.9 | 8.0 | ||||||||
Applications of reserve |
(2.9 | ) | (1.9 | ) | (4.8 | ) | |||||
Balance at January 3, 2010 |
5.1 | 1.8 | 6.9 | ||||||||
Restructuring charges |
— | 3.4 | 3.4 | ||||||||
Applications of reserve |
(5.1 | ) | (4.7 | ) | (9.8 | ) | |||||
Balance at January 2, 2011 |
$ | — | $ | 0.5 | $ | 0.5 | |||||
During the second quarter of 2009, the Company announced a plan to restructure its global organization in response to ongoing demand uncertainty and to exit its factory in the Dominican Republic which was completed during the second quarter of 2010. During fiscal 2010 and 2009, approximately $3.4 million and $8.0 million, respectively, of pre-tax restructuring charges were recorded in accordance with ASC 420 and ASC 712, as applicable.
During the year ended January 2, 2011, the Company recorded facility closure costs of approximately $3.4 million. The liabilities related to facilities closures contain continuing lease obligations, the longest of which extends into 2014. In connection with the Dominican Republic facility closure, the Company has recorded $2.7 million of inventory charges and $0.8 million of accelerated depreciation as part of cost of goods sold in the consolidated statement of operations for the year ended January 2, 2011. At January 2, 2011, $0.5 million of continuing lease obligations related to the 2005 restructuring plan were included in the Company's consolidated balance sheet. All restructuring obligations have been or will be settled with cash.
During the year ended January 3, 2010, the Company recorded severance benefits of approximately $7.1 million and approximately $0.9 million of facility closure costs. The liabilities related to facilities closures contain continuing lease obligations, the longest of which extends into 2014. In connection with the Dominican Republic facility closure, the Company recorded $1.7 million of inventory charges and $1.8 million of accelerated depreciation as part of cost of goods sold in the consolidated statement of operations for the year ended January 3, 2010. At January 3, 2010, $1.5 million of continuing lease obligations related to the 2005 restructuring plan was included in the Company's consolidated balance sheet.
Impairment of Fixed Assets
The Company tests the recoverability of its long lived assets held for use whenever events or changes in circumstances indicate its carrying amount may not be recoverable in accordance with
F-22
POWER-ONE, INC.
NOTES TO CONSOLIDATED FINANCIAL STATEMENTS (Continued)
YEARS ENDED JANUARY 2, 2011, JANUARY 3, 2010 AND DECEMBER 28, 2008
ASC 360. During 2010, 2009 and 2008, the Company performed impairment reviews in accordance with ASC 360 in response the Company's recent history of operating and cash flow losses. During the fiscal year, 2010, the Company recorded asset impairment charges of $0.4 million in connection with its plan to exit the Dominican Republic facility and consolidate certain operations. No assets were impaired by the Company during fiscal years 2009 and 2008.
NOTE 12. LONG-TERM DEBT
Long-term debt consists of the following (in millions):
| |
January 2, 2011 |
January 3, 2010 |
||||||
|---|---|---|---|---|---|---|---|---|
Senior Convertible Notes, due 2019 |
$ | 35.9 | $ | 35.7 | ||||
8% Senior Secured Convertible Notes, due 2013 |
— | 38.8 | ||||||
Secured note payable |
— | 4.6 | ||||||
2% Installment notes, due 2011 |
0.1 | 0.3 | ||||||
Total long-term debt |
36.0 | 79.4 | ||||||
Less current portion |
0.1 | 1.3 | ||||||
Total long-term debt, less current portion |
$ | 35.9 | $ | 78.1 | ||||
On April 23, 2009, the Company entered into a Securities Purchase Agreement (the "Purchase Agreement") with Silver Lake Sumeru Fund, L.P. and Silver Lake Technology Investors Sumeru, L.P. (collectively, "Silver Lake Sumeru") pursuant to which Silver Lake Sumeru invested $60 million of new capital in the Company. As a result of the transaction, the Company issued $36.4 million in aggregate principal amount of senior convertible notes due 2019 (the "New Notes"). The principal sum of the New Notes is due on May 8, 2019. The Company may force redemption of the New Notes between the 2.5 year anniversary date and the five year anniversary date if the Company's common stock price is 300% of the conversion price. Holders of the Notes may force redemption after year five, and annually thereafter, for an amount equaling principal plus accrued interest. Interest relating to the notes is paid semi-annually at a rate of 6% per year the first year, 8% the second year and 10% thereafter. The New Notes are convertible into Power-One common stock at a conversion price of $1.35. The conversion price is subject to adjustment under certain circumstances. There are no financial covenants relating to the New Notes; however, there are certain restrictions that limit the sale of assets, and the incurrence of liens and debt.
The Company held 8% Senior Secured Convertible Notes, due 2013 ("8% Notes") that were governed by an indenture, dated as of June 17, 2008 between the Company and The Bank of New York Trust Company, N.A., as trustee. The Notes bore interest at a rate of 8% per annum, payable in cash in arrears on March 31, June 30, September 30 and December 31 of each year. The 8% Notes were convertible, into shares of common stock of the Company, $0.001 par value per share (the "Common Stock"), at an adjusted conversion rate of 500 shares of Common Stock per $1,000 in principal amount of the 8% Notes (which is equivalent to an adjusted conversion price of $2.00 per share). The Company had the right to redeem for cash the outstanding 8% Notes, if on or after June 17, 2010, the closing price of its common stock as reported on The Nasdaq Global Market exceeds for twenty (20) or more trading days out of a thirty (30) consecutive trading day period, 175% of the then current conversion price of the Notes. On July 2, 2010, the Company sent a redemption notice to registered holders of its 8% Notes that called for the redemption of all outstanding Notes on August 11, 2010, the
F-23
POWER-ONE, INC.
NOTES TO CONSOLIDATED FINANCIAL STATEMENTS (Continued)
YEARS ENDED JANUARY 2, 2011, JANUARY 3, 2010 AND DECEMBER 28, 2008
Redemption Date. Pursuant to the terms of the indenture governing the Notes, all Notes outstanding on the Redemption Date would be redeemed at a redemption price of $1,139.29 per $1,000 principal amount Note, which included accrued and unpaid interest, payable in cash. During the third quarter of 2010, all note holders converted $34.2 million face value of the 8% Notes into 17.1 million shares of the Company's stock. The Company accounted for this debt conversion in accordance with ASC 470, "Debt with Conversion and Other Options" as applicable.
During years ended January 2, 2011 and January 3, 2010, the Company used $10.0 million and $20.9 million net cash to repurchase and extinguish $4.5 million and $31.3 million of the 8% Notes, respectively. The Company recorded a net loss on extinguishment of debt of $5.7 million and a net gain on extinguishment of debt of $8.6 million for the years ended January 2, 2011 and January 3, 2010, respectively.
The Company has certain long-term notes payable through fiscal year 2013 held at a European subsidiary. Amounts outstanding at January 2, 2011 and January 3, 2010 related to the installment notes were $0.1 million and $0.3 million, respectively, bearing interest at 2%. The long-term notes payable agreements require the Company's subsidiary to provide certain financial reports to the lender but do not require compliance with any financial covenants. In addition, this subsidiary has an agreement with a European bank to provide borrowings secured by the subsidiary's land and building over a ten-year period. The initial commitment to lend under this agreement was $9.2 million, with the commitment amount reduced ratably on a quarterly basis beginning March 31, 2004 and ending December 30, 2013. At January 2, 2011, no borrowings were outstanding under this secured note payable agreement. At January 3, 2010, borrowings outstanding under this secured note payable agreement were $4.6 million and bore interest at the EURIBOR plus one and one-half percent (2.3% at January 3, 2010). The agreement contains financial covenants that require a minimum EBITDA as a percentage of net revenue and a maximum percentage of debt to equity. At January 2, 2011 and January 3, 2010, the Company was in compliance with the debt covenants related to all long-term borrowing arrangements.
Aggregate principal maturities on long-term debt outstanding at January 2, 2011 are as follows (in millions):
Year Ending December 31,
|
|
|||
|---|---|---|---|---|
2011 |
$ | 0.1 | ||
2012 |
— | |||
2013 |
— | |||
2014 |
— | |||
2015 |
— | |||
2016 and thereafter |
36.4 | |||
Total |
$ | 36.5 | ||
NOTE 13. COMMITMENTS AND CONTINGENCIES
Leases—The Company leases facilities in various locations around the world under lease agreements expiring at various dates through 2014 in Asia, 2015 in North America and 2016 in Europe.
F-24
POWER-ONE, INC.
NOTES TO CONSOLIDATED FINANCIAL STATEMENTS (Continued)
YEARS ENDED JANUARY 2, 2011, JANUARY 3, 2010 AND DECEMBER 28, 2008
Future minimum lease payments for operating leases as of January 2, 2011 are as follows (in millions):
Years Ending December 31,
|
Operating Leases |
|||
|---|---|---|---|---|
2011 |
$ | 5.0 | ||
2012 |
3.9 | |||
2013 |
3.6 | |||
2014 |
3.0 | |||
2015 |
1.3 | |||
2016 and thereafter |
— | |||
Total minimum lease payments |
$ | 16.8 | ||
Total rent expense was $5.3 million, $5.1 million and $5.0 million for the years ended January 2, 2011, January 3, 2010 and December 28, 2008, respectively. Approximately $0.5 million of operating lease commitments above were reserved for in the restructuring charge accruals as of January 2, 2011. The Company intends to seek subleases for unused facilities.
Legal Proceedings—SynQor, Inc. v Power-One, Inc, et. al. United States District Court, Eastern District of Texas, Civil Action No. 2:07cv497 TJW/CE. This action was initiated by SynQor, Inc. against the Company and eight other power supply manufacturers on November 13, 2007. The complaint alleges that certain products of the Company infringe certain patents held by SynQor in relation to unregulated bus converters and/or point of load (POL) converters used in intermediate bus architecture power supply systems. The Company filed its answer to the complaint denying infringement of the patents alleged, denying all claims of SynQor for entitlement to damages or other relief, and asserting various affirmative defenses, to include invalidity and unenforceability of the applicable patents. Two new patents were subsequently issued to SynQor and SynQor filed motions for leave to amend its complaint to add claims for infringement of the two new patents. SynQor's motions were opposed by the Company and its codefendants, but on September 18, 2009 the Court granted SynQor's motions and deemed the amended complaints filed as of the dates SynQor's motions were filed (July 7, 2009 for the second amended complaint (adding the '083 patent) and July 21, 2009 for the third amended complaint (adding the '702 patent)). On October 2, 2009 Power-One filed its response to the third amended complaint. The claim construction hearing took place in Marshall, Texas on July 13, 2010 and the court issued its Markman ruling on July 26, 2010, substantially adopting Power-One's construction of certain key terms. The parties participated in mediation in September 2010 but were unsuccessful in resolving the dispute. The case went to trial in December 2010 and the jury returned a verdict in favor of SynQor on December 21, 2010, finding that all of the defendants directly or indirectly infringed all of the claims in the five patents-in-suit and finding Power-One liable for damages in the amount of approximately $25.6 million. The patents-in-suit are United States patents and the decision covers only the sales of infringing products in the United States.
On January 24, 2011, the Judge entered a permanent injunction, enjoining all of the defendants from manufacturing, using, selling and offering for sale in the United States, and/or importing into the United States, certain families of unregulated and semi-regulated bus converters. Although the Company did not believe that the verdict or the injunction would materially impact its Power Solutions business, it joined with the other defendants in filing an emergency motion to stay the injunction and on January 25, 2011 the Judge entered a temporary stay of the injunction until January 28, 2011. On
F-25
POWER-ONE, INC.
NOTES TO CONSOLIDATED FINANCIAL STATEMENTS (Continued)
YEARS ENDED JANUARY 2, 2011, JANUARY 3, 2010 AND DECEMBER 28, 2008
January 31, 2011, Power-One and its co-defendants filed an emergency motion with the United States Court of Appeals for the Federal Circuit, requesting a partial stay of the injunction to permit certain identified customers to continue purchasing the enjoined products for a limited transition period. That day, the Federal Circuit entered a temporary stay order and directed SynQor to file a response by February 4, 2011. On March 2, 2011 the parties were notified that the Appeal had been selected for the Federal Circuit's mandatory Appellate Mediation Program and that an initial mediation session had been scheduled for March 30, 2011.
A final judgment has not yet been entered in the case; however the Company believes that errors were made during the trial and that there is a strong basis for an appeal. The Patents and Trademarks Office is also re-examining four of the five SynQor patents and has issued office actions that preliminarily reject the claims in two of the four patents. Including interest and other items, the Company believes that its maximum exposure related to this matter is $29.2 million. The Company has accrued $22.1 million representing what it believes to be probable and reasonably estimable based on its discussion with and analysis by counsel of the basis for its appeal.
In addition, the Company is involved in various other claims and legal proceedings which have arisen in the normal course of business. Management does not believe that the outcome of any currently pending claims or legal proceedings in which the Company is involved will have a material adverse effect on the Company's consolidated financial position, results of operations or cash flow.
NOTE 14. COMMON AND PREFERRED STOCK
Preferred Stock—On April 23, 2009, the Company entered into a Securities Purchase Agreement with Silver Lake Sumeru pursuant to which Silver Lake Sumeru invested $60 million of new capital in the Company consisting of $23.6 million to acquire 23,625 shares of redeemable convertible preferred stock (the "Preferred Stock"), $36.4 million to acquire senior convertible notes due 2019 at par (the "New Notes"), and warrants to acquire 8.7 million shares of Power-One common stock (the "Warrants").
The Warrants are exercisable fifteen months after issuance at an exercise price of $1.33 and will expire in seven years. The warrants had a fair value of $3.1 million on the Purchase Agreement date, each warrant option having a value of $0.48 per share. The fair value was determined using the Black-Scholes model using, an adjusted stock price of $0.91, a volatility factor of 72%, a risk free interest rate of 2.68% and a contractual life of 7 years. Proceeds of $3.3 million were allocated to the warrants as an increase to Additional paid-in capital in the consolidated balance sheet.
Under the Purchase Agreement, 23,625 shares of redeemable convertible preferred stock were issued. (Under the Company's existing articles of incorporation, 30.0 million shares of preferred stock at a par value of $0.001 are authorized for issuance) The Preferred Stock issued under the Purchase Agreement pays quarterly dividends at a rate of 10% per year and are convertible into Power-One common stock at a conversion price of $1.35. During the year ended January 2, 2011 and January 3, 2010, the Company declared a Preferred Stock dividend of $2.4 million and $1.5 million, respectively. After the fifth anniversary of the issuance, the Company may redeem any or all of the Preferred Stock at a redemption price equal to the purchase price plus accrued dividends. The Company may force conversion of the Preferred Stock on and after the 2.5 year anniversary date if the Company's common stock price is 300% of the conversion price. The Preferred Stock may be redeemed at the request of the holders of such securities after the fifth anniversary of their issuance, and annually thereafter, at a redemption price equal to the purchase price plus accrued dividends. The Company's failure to redeem
F-26
POWER-ONE, INC.
NOTES TO CONSOLIDATED FINANCIAL STATEMENTS (Continued)
YEARS ENDED JANUARY 2, 2011, JANUARY 3, 2010 AND DECEMBER 28, 2008
the Preferred Stock would result in a 2% per year increase in the dividend, plus another 1% increase per six month period after the redemption date, up to a maximum of 16% per year.
At January 2, 2011, the carrying value of the Preferred Stock was $19.6 million. The Preferred Stock initial carrying amount of $17.9 million and the mandatory redemption amount of $23.6 million will be increased by periodic accretions using the interest method, such that the carrying amount of the Preferred Stock will equal the mandatory redemption amount at the mandatory redemption date. During the year ended January 2, 2011 and January 3, 2010, the Company recorded the $1.1 million and $0.7 million, respectively, of accretion charges against Additional paid-in capital in its consolidated balance sheet.
Stock Plans—In February 1996, the Board of Directors approved a stock incentive plan (the "1996 Plan"). In January 1999, the 1996 Plan was amended to increase the shares issuable under the plan. In May 2004, the 1996 Plan was amended by the Board of Directors to prevent further increases in shares issuable under this plan, to prevent grants to non-employees, and to eliminate any provisions that might allow or result in a repricing of the exercise price of options issued under the plan without shareholder approval. Under the terms of the 1996 Plan, power and authority to issue grants and awards under the plan terminated effective February 22, 2006. Any grant or award issued prior to that date remains outstanding per the terms of the original grant or award. The maximum contractual life of each option is 10 years from the date of grant. Any shares available for issuance under the 1996 Plan which had not been issued as of February 22, 2006 were cancelled as of that date and are no longer available for issuance. The Company issued either qualified or non-qualified stock options, restricted stock and restricted stock units under the 1996 Plan. The option exercise price was determined by the Board of Directors based on the fair market value of the Company's common stock on the date of grant. The existing options generally vest over four- and seven-year terms. Those options with seven-year vesting terms include accelerated vesting provisions that allowed for vesting over five years if certain performance measures were met.
In September 2001, the Board of Directors approved a stock option plan for the issuance of 2.5 million shares of common stock (the "2001 Plan"). The Company only issued non-qualified stock options under the 2001 Plan, and did not issue options under the 2001 Plan to any member of the Board of Directors or any executive officer (i.e. an officer as defined under and subject to Section 16 of the Securities Exchange Act of 1934). The Board of Directors determined the option exercise price based on the fair market value of the Company's common stock on the date of grant. All options under the 2001 Plan were granted at fair market value. Options granted under the 2001 Plan generally vest over four years and have a maximum contractual life of 10 years. In May 2004, the Board of Directors approved an amendment to this plan whereby the Company may not grant additional awards under the 2001 Plan and the Company may not reprice options previously granted under this plan.
In May 2004, the Board of Directors and shareholders approved the adoption of the Power-One 2004 stock incentive plan (the "2004 Plan") for the issuance of 4.8 million shares of common stock. Under this plan, the Company can issue stock options, stock appreciation rights, restricted stock, stock bonuses and other forms of awards denominated in common stock or units as well as cash bonus awards. The option exercise price is determined by the Board of Directors based on the fair market value of the Company's common stock on the date of grant. The existing options and awards generally vest over four-year terms and have a maximum contractual life of 10 years. In April 2008, the Board of Directors approved certain amendments to this plan. The first amendment increased the individual award sub-limits from 0.5 million shares to 1.5 million shares, the maximum number of shares that may
F-27
POWER-ONE, INC.
NOTES TO CONSOLIDATED FINANCIAL STATEMENTS (Continued)
YEARS ENDED JANUARY 2, 2011, JANUARY 3, 2010 AND DECEMBER 28, 2008
be subject to awards granted to any individual in a calendar year, and the maximum number of shares that may be subject to stock options and stock appreciation rights granted to any individual in a calendar year, is now 1.5 million shares. The second amendment extended the Company's authority to grant new awards that are intended to qualify as performance-based compensation within the meaning of Section 162(m) of the U.S. Internal Revenue Code through the first annual meeting of our stockholders that occurs in 2013. None of these amendments increased the existing limits on the total number of shares that may be delivered or the limits on the total number of shares that may be delivered as so-called "full value awards." The Board of Directors and shareholders approved the adoption of the amended and restated Power-One, Inc. 2004 Stock Incentive Plan in February 2010 and May 2010, respectively. The amendment increased the existing limit on the number of shares that may be delivered pursuant to awards granted under the 2004 Plan from 4,750,000 shares to 10,750,000 shares, decreased the maximum number of shares subject to all awards granted under the 2004 Plan to any non-employee director from 500,000 shares to 62,500 shares. The amendment also set the per share exercise price or base price for each stock option or stock appreciation right at no less than 100% of the fair market value of a share of common stock on the date of grant of the option or stock appreciation right, and provided that, other than in connection with a change in the Corporation's capitalization, neither the exercise price of an option nor the base price of a stock appreciation right may be reduced without stockholder approval. At January 2, 2011, approximately 3.2 million shares of common stock were available for future grants. Of the 3.2 million shares available for future grants as of January 2, 2011, approximately 0.5 million are available for grant as awards other than stock options or stock appreciation rights.
Stock Awards—The Company has granted non-vested share units under its 1996 and 2004 stock incentive plans. A summary of the activity for nonvested share awards is presented below:
| |
Shares | Weighted Average Grant Date Fair Value |
||||||
|---|---|---|---|---|---|---|---|---|
| |
(in millions) |
|
||||||
Nonvested awards outstanding at December 30, 2007 |
1.8 | $ | 4.97 | |||||
Awards granted |
1.0 | 2.27 | ||||||
Awards vested and issued |
(0.5 | ) | 2.26 | |||||
Awards forfeited |
(0.7 | ) | 4.55 | |||||
Nonvested awards outstanding at December 28, 2008 |
1.6 | $ | 3.39 | |||||
Awards granted |
1.5 | 3.10 | ||||||
Awards vested and issued |
(0.5 | ) | 3.77 | |||||
Awards forfeited |
(0.3 | ) | 2.93 | |||||
Nonvested awards outstanding at January 3, 2010 |
2.3 | $ | 3.16 | |||||
Awards granted |
2.2 | 9.40 | ||||||
Awards vested and issued |
(0.9 | ) | 3.42 | |||||
Awards forfeited |
(0.1 | ) | 4.82 | |||||
Nonvested awards outstanding at January 2, 2011 |
3.5 | $ | 6.78 | |||||
F-28
POWER-ONE, INC.
NOTES TO CONSOLIDATED FINANCIAL STATEMENTS (Continued)
YEARS ENDED JANUARY 2, 2011, JANUARY 3, 2010 AND DECEMBER 28, 2008
The fair value of non-vested share units awarded by the Company is measured using the closing fair market value as reported on the NASDAQ Global Market of the Company's stock on the date the awards are granted. The awards generally vest over three to four years. As of January 2, 2011, there was $20.7 million of total unrecognized compensation cost related to nonvested stock awards granted under the Company's stock option plans. That cost is expected to be recognized over a weighted average period of 2.6 years. At January 2, 2011, there were 3.4 million stock awards that were expected to vest with an aggregate intrinsic value of $34.1 million and a weighted average grant date fair value of $6.78 per share.
For the years ended January 2, 2011, January 3, 2010 and December 28, 2008, the fair value of the vested portion of non-vested share units and the stock compensation cost in the income statement related to these stock awards were as follows, (in millions):
| |
Year Ended | |||||||||
|---|---|---|---|---|---|---|---|---|---|---|
| |
January 2, 2011 |
January 3, 2010 |
December 28, 2008 |
|||||||
Total fair value of stock awards vested |
$ | 3.2 | $ | 2.1 | $ | 2.2 | ||||
Stock compensation expense related to stock awards |
$ | 4.3 | $ | 1.3 | $ | 2.3 | ||||
Stock Options—The Company estimates the value of employee stock options using the Black-Scholes model. The determination of the fair value of share-based payment awards on the date of grant using an option-pricing model is impacted by the Company's stock price as well as assumptions regarding a number of complex and subjective variables. In determining the fair value of the options, the Company used an estimated forfeiture rate determined at the time of grant, which is revised, as necessary, if actual experience is different than estimated. The weighted-average assumptions were determined as follows:
- •
- The risk-free interest rate assumption was based on the return of US government bonds maturing at
approximately the same time as the expected term of the options.
- •
- The expected volatility is based on the historical volatilities of the Company, selected guideline companies and factors
applicable to the Company.
- •
- The expected term represents the weighted-average period the stock options are expected to remain outstanding. For "plain vanilla" stock options, the Company used the average of the time to vest plus contracted term, to estimate the expected term of the unvested options. Employee share options generally differ from transferable, or tradable share options in that an employee cannot sell their share options and can only exercised them, therefore employees generally exercise their options before the end of their contractual term.
F-29
POWER-ONE, INC.
NOTES TO CONSOLIDATED FINANCIAL STATEMENTS (Continued)
YEARS ENDED JANUARY 2, 2011, JANUARY 3, 2010 AND DECEMBER 28, 2008
The fair value of each option and stock appreciation right granted during the years ended January 2, 2011 and January 3, 2010 was estimated on the date of grant using the Black-Scholes model, with the assumptions shown below.
| |
Year Ended | ||||||
|---|---|---|---|---|---|---|---|
| |
January 2, 2011 |
January 3, 2010 |
|||||
Risk-free interest rate |
2.6 | % | 2.8 | % | |||
Volatility |
80 | % | 80 | % | |||
Option life, years |
5.4 | 5.4 | |||||
Stock options granted, in millions |
0.9 | 0.1 | |||||
For the years ended January 2, 2011, January 3, 2010 and December 28, 2008, the total options available for exercise, the weighted average exercise price, the intrinsic value of stock options exercised, and the stock compensation cost in the income statement related to stock options were as follows:
| |
Year Ended | |||||||||
|---|---|---|---|---|---|---|---|---|---|---|
| |
January 2, 2011 |
January 3, 2010 |
December 28, 2008 |
|||||||
Total options exercisable, in millions |
1.8 | 2.9 | 4.9 | |||||||
Weighted average exercisable stock option exercise price |
$ | 5.32 | $ | 9.16 | $ | 9.84 | ||||
Total intrinsic value of stock options exercised, in millions |
$ | 4.6 | $ | 0.1 | $ | 0.1 | ||||
Stock compensation expense related to stock options and stock appreciation rights, in millions |
$ | 1.3 | $ | 0.8 | $ | 0.3 | ||||
As the Company currently has net operating loss carryforwards, there is no net impact on the Company's APIC pool related to stock-based compensation for the years ended January 2, 2011, January 3, 2010 and December 28, 2008.
As of January 2, 2011, there was $5.1 million of total unrecognized compensation cost related to nonvested stock options granted under the Company's stock option plans which will be recognized over a weighted average 2.4 years.
F-30
POWER-ONE, INC.
NOTES TO CONSOLIDATED FINANCIAL STATEMENTS (Continued)
YEARS ENDED JANUARY 2, 2011, JANUARY 3, 2010 AND DECEMBER 28, 2008
During the years ended January 2, 2011, January 3, 2010 and December 28, 2008, the following activity related to stock option and stock appreciation rights occurred under our plans:
| |
Options | Exercise Price per Option |
Weighted Average Exercise Price |
Weighted Average Grant-Date Fair Value |
Weighted Average Remaining Contractual Term |
Aggregate Intrinsic Value |
|||||||||||||
|---|---|---|---|---|---|---|---|---|---|---|---|---|---|---|---|---|---|---|---|
| |
(in millions) |
|
|
|
|
(in millions) |
|||||||||||||
Options outstanding—December 30, 2007 |
7.5 | $2.05 - $82.22 | $ | 10.01 | |||||||||||||||
Options granted |
1.6 | $1.23 - $ 2.38 | $ | 2.09 | $ | 1.21 | |||||||||||||
Options exercised |
(0.1 | ) | $2.05 | $ | 2.05 | ||||||||||||||
Options forfeited |
(2.6 | ) | $2.05 - $82.22 | $ | 10.45 | ||||||||||||||
Options outstanding—December 28, 2008 |
6.4 | $1.23 - $82.22 | $ | 8.05 | |||||||||||||||
Options granted |
0.1 | $1.19 - $ 2.80 | $ | 1.61 | $ | 1.11 | |||||||||||||
Options exercised |
— | $2.09 | $ | 2.09 | |||||||||||||||
Options forfeited |
(2.3 | ) | $1.19 - $47.50 | $ | 9.50 | ||||||||||||||
Options outstanding—January 3, 2010 |
4.2 | $1.19 - $82.22 | $ | 7.07 | |||||||||||||||
Options granted |
0.9 | $7.54 - $12.78 | $ | 8.49 | $ | 5.70 | |||||||||||||
Options exercised |
(1.0 | ) | $2.09 - $ 9.12 | $ | 6.03 | ||||||||||||||
Options forfeited |
(0.6 | ) | $1.19 - $82.22 | $ | 19.59 | ||||||||||||||
Options outstanding—January 2, 2011 |
3.5 | $1.19 - $20.25 | $ | 5.46 | 6.25yrs | 16.9 | |||||||||||||
Options exercisable—January 2, 2011 |
1.8 | $ | 5.32 | 4.14yrs | 8.8 | ||||||||||||||
Options vested and expected to vest—January 2, 2011 |
3.4 | $ | 5.43 | 6.19yrs | 16.7 | ||||||||||||||
The following table summarizes information regarding options outstanding at January 2, 2011:
| |
Options Outstanding | Options Exercisable | ||||||||||||||
|---|---|---|---|---|---|---|---|---|---|---|---|---|---|---|---|---|
Range of Exercise Prices
|
Millions Outstanding | Remaining Contractual Life | Weighted Average Exercise Price | Millions Exercisable | Weighted Average Exercise Price | |||||||||||
$ 1.19 - $ 2.26 |
0.7 | 7.23 yrs | $ | 1.73 | 0.6 | $ | 1.67 | |||||||||
$ 2.27 - $ 2.80 |
0.7 | 7.14 yrs | $ | 2.38 | — | $ | 2.80 | |||||||||
$ 2.81 - $ 7.19 |
0.6 | 2.05 yrs | $ | 5.18 | 0.6 | $ | 5.18 | |||||||||
$ 7.20 - $ 9.00 |
0.6 | 8.77 yrs | $ | 7.65 | 0.1 | $ | 8.95 | |||||||||
$ 9.01 - $ 9.12 |
0.5 | 4.77 yrs | $ | 9.10 | 0.4 | $ | 9.12 | |||||||||
$ 9.13 - $11.64 |
0.3 | 8.13 yrs | $ | 10.06 | — | $ | 10.37 | |||||||||
$11.65 - $20.25 |
0.1 | 4.48 yrs | $ | 14.94 | 0.1 | $ | 16.54 | |||||||||
$ 1.19 - $20.25 |
3.5 | 6.25 yrs | $ | 5.46 | 1.8 | $ | 5.32 | |||||||||
F-31
POWER-ONE, INC.
NOTES TO CONSOLIDATED FINANCIAL STATEMENTS (Continued)
YEARS ENDED JANUARY 2, 2011, JANUARY 3, 2010 AND DECEMBER 28, 2008
During the years ended January 2, 2011, January 3, 2010 and December 28, 2008, the Company received cash of $5.7 million, less than $0.1 million and $0.3 million, respectively, from the exercise of stock options granted under its stock options plans.
Employee Stock Purchase Plan—The Company adopted, effective January 1, 1998 and expired on January 1, 2008, an Employee Stock Purchase Plan, under which 9.0 million shares are reserved for purchase by employees. At each of the years ended January 2, 2011, January 3, 2010 and December 28, 2008 there were approximately 0.5 million shares issued cumulatively under this plan. During the year ended December 28, 2008, the Company received cash of approximately $0.1 million, for shares issued under the plan.
Share Repurchase Program—In September 2010, the Company announced that it had received authorization from its Board of Directors to purchase up to 10 million shares of its outstanding common stock in open-market transactions. At January 2, 2011, 7 million shares remain available for purchase in accordance with this authorization. This authorization expires on September 21, 2012.
NOTE 15. SEGMENT INFORMATION
During the second quarter of fiscal 2010, the Company began to operate as two reportable business segments in accordance with ASC 280, "Segment Reporting." The Company's chief operating decision maker and management personnel began reviewing the Company's performance and making resource allocation decisions by reviewing the results of the two business segments separately. Revenue and operating profit is now reviewed by the chief operating decision maker, however the Company assets are not divided based on business segment. Due to the structure of the Company's internal organization and the manner in which expenses were tracked and managed and as a result of the design of the Company's internal systems during fiscal 2009, the Company was unable to recast related financial information by operating segment for fiscal 2009 and prior. As such, segment information, other than revenue, for the fiscal years, 2009 and 2008 is not reported as it is impracticable to do so.
The Company is organized into the Renewable Energy Solutions and Power Solutions segments based on the products and services provided. Renewable Energy Solutions offers inverters and accessories for the photovoltaic/solar and wind markets. These inverters convert DC energy from solar panels and wind turbines into AC energy for customer use or for the utility grid. The Power Solutions segment represents the Company's products for AC/DC, DC/DC and digital power conversion, including power conversion products for data centers, such as servers, storage and networking, as well as telecom and industrial power conversion products.
Revenue with respect to operating segments for the fiscal years 2010, 2009 and 2008, (in millions):
| |
Year Ended | |||||||||
|---|---|---|---|---|---|---|---|---|---|---|
| |
January 2, 2011 |
January 3, 2010 |
December 28, 2008 |
|||||||
Sales: |
||||||||||
Renewable Energy Solutions |
$ | 715.4 | $ | 128.6 | $ | 65.8 | ||||
Power Solutions |
331.7 | 303.0 | 471.7 | |||||||
Total |
$ | 1,047.1 | $ | 431.6 | $ | 537.5 | ||||
F-32
POWER-ONE, INC.
NOTES TO CONSOLIDATED FINANCIAL STATEMENTS (Continued)
YEARS ENDED JANUARY 2, 2011, JANUARY 3, 2010 AND DECEMBER 28, 2008
Operating Income (Loss) by operating segment for the year ended January 2, 2011 is as follows, (in millions):
Operating Income (Loss): |
||||||
Renewable Energy Solutions |
$ | 309.4 | ||||
Power Solutions |
3.0 | |||||
Total segment operating income |
$ | 312.4 | ||||
Unallocated amounts: |
||||||
Restructuring and Asset Impairment |
(3.9 | ) | ||||
Litigation |
(22.1 | ) | ||||
Corporate and unallocated |
(21.8 | ) | ||||
Total |
$ | 264.6 | ||||
Corporate is a non-operating business segment with the main purpose of supporting operations. Restructuring and asset impairment charges and litigation are not allocated to business segment financial statements reviewed by the Company's chief operating decision maker and management personnel.
Depreciation and amortization for the year ended January 2, 2011 is as follows, (in millions):
| |
Depreciation | Amortization | |||||
|---|---|---|---|---|---|---|---|
Renewable Energy Solutions |
$ | 2.3 | $ | 0.1 | |||
Power Solutions |
9.9 | 1.7 | |||||
Corporate and unallocated |
0.5 | — | |||||
Total |
$ | 12.7 | $ | 1.8 | |||
No customer accounted for more than 10% of sales during fiscal year 2010, 2009 or 2008.
The Company's customers are located throughout the world, and the following table summarizes revenues in different geographic locations for the Company's two product lines (in millions):
| |
Years Ended | |||||||||||||||||||||||||||||
|---|---|---|---|---|---|---|---|---|---|---|---|---|---|---|---|---|---|---|---|---|---|---|---|---|---|---|---|---|---|---|
| |
January 2, 2011 | January 3, 2010 | December 28, 2008 | |||||||||||||||||||||||||||
| |
Renewable Energy Solutions |
Power Solutions |
Total | Renewable Energy Solutions |
Power Solutions |
Total | Renewable Energy Solutions |
Power Solutions |
Total | |||||||||||||||||||||
Revenues:(a) |
||||||||||||||||||||||||||||||
North America(b) |
$ | 10.0 | $ | 119.3 | $ | 129.3 | $ | 1.2 | $ | 100.2 | $ | 101.4 | $ | 0.4 | $ | 152.8 | $ | 153.2 | ||||||||||||
Italy |
365.8 | 15.9 | 381.7 | 79.9 | 4.8 | 84.7 | 44.3 | 23.3 | 67.6 | |||||||||||||||||||||
Other European countries |
289.2 | 83.7 | 372.9 | 44.0 | 107.7 | 151.7 | 21.1 | 165.2 | 186.3 | |||||||||||||||||||||
Asian countries |
49.6 | 105.8 | 155.4 | 3.3 | 79.9 | 83.2 | - | 112.2 | 112.2 | |||||||||||||||||||||
Other |
0.8 | 7.0 | 7.8 | 0.2 | 10.4 | 10.6 | - | 18.2 | 18.2 | |||||||||||||||||||||
Total |
$ | 715.4 | $ | 331.7 | $ | 1,047.1 | $ | 128.6 | $ | 303.0 | $ | 431.6 | $ | 65.8 | $ | 471.7 | $ | 537.5 | ||||||||||||
- (a)
- Revenues are attributable to countries based on location of customer.
F-33
POWER-ONE, INC.
NOTES TO CONSOLIDATED FINANCIAL STATEMENTS (Continued)
YEARS ENDED JANUARY 2, 2011, JANUARY 3, 2010 AND DECEMBER 28, 2008
- (b)
- Included in revenue attributable to North America are sales to customers in the United States of America $110.3 million, $91.6 million, and $137.0 million for the years ended January 2, 2011, January 3, 2010, and December 28, 2008, respectively.
Long-lived Assets
The following is a summary of our long-lived assets by geographical locations and operating segment, in millions:
| |
Years Ended | ||||||||||||||||||||
|---|---|---|---|---|---|---|---|---|---|---|---|---|---|---|---|---|---|---|---|---|---|
| |
January 2, 2011 | January 3, 2010 |
December 28, 2008 |
||||||||||||||||||
| |
Renewable Energy Solutions |
Power Solutions |
Corporate | Total | Total | Total | |||||||||||||||
Long-Lived Assets: |
|||||||||||||||||||||
United States |
$ | 7.1 | $ | 16.3 | $ | 0.1 | $ | 23.5 | $ | 16.3 | $ | 39.1 | |||||||||
Italy |
37.6 | - | - | 37.6 | 27.2 | 52.5 | |||||||||||||||
China |
- | 11.1 | - | 11.1 | 8.1 | 9.1 | |||||||||||||||
Slovakia |
- | 5.2 | - | 5.2 | 5.9 | 6.8 | |||||||||||||||
Switzerland |
- | 3.4 | - | 3.4 | 4.0 | 17.0 | |||||||||||||||
Dominican Republic |
- | - | - | - | 4.4 | 8.5 | |||||||||||||||
Other |
- | 1.3 | - | 1.3 | 1.6 | 1.7 | |||||||||||||||
Total |
$ | 44.7 | $ | 37.3 | $ | 0.1 | $ | 82.1 | $ | 67.5 | $ | 134.7 | |||||||||
Long-lived assets by operating segment for the years ended January 3, 2010 and December 28, 2008 are not reported as it is impracticable to do so.
NOTE 16. RETIREMENT PLANS
The Company sponsors or participates in various retirement and pension plans, including defined benefit and defined contribution plans. Most international employees are covered by government-sponsored programs where the costs to the Company are not significant. The costs and liabilities associated with the various plans are not material to the Company as of January 2, 2011 and January 3, 2010.
In accordance with Italian law, the Company has an unfunded severance plan under which all employees in Italy are entitled to receive severance indemnities (Trattamento di Fine Rapporto or "TFR") upon termination of their employment. The amounts payable are based on salary paid and increases in cost of living, and are included in other long-term liabilities in the consolidated balance sheets. The liability is recorded in accordance with ASC 715, "Compensation—Retirement Benefits." The severance indemnities accrue approximately at the rate of 1/12 of the gross salaries paid during the year, and are revalued applying a cost of living factor established by the Italian Government. The amounts accrued become payable upon termination of employment for any reason, e.g., retirement, dismissal or reduction in work force. Employees are fully vested in TFR benefits after two months of service. Prior to July 2007, the Company was required to accrue for these liabilities and pay the respective amounts to employees upon termination. Beginning July 2007, the Company is required to remit these severance indemnities to the government at the time in which the funds are accrued. At
F-34
POWER-ONE, INC.
NOTES TO CONSOLIDATED FINANCIAL STATEMENTS (Continued)
YEARS ENDED JANUARY 2, 2011, JANUARY 3, 2010 AND DECEMBER 28, 2008
January 2, 2011 and January 3, 2010, the Company had recorded in other long-term liabilities in its consolidated balance sheets approximately $8.1 million and $8.6 million, respectively, related to these severance indemnities. The Company recorded expense related to the severance indemnities of approximately $1.6 million, $1.4 million and $1.6 million for the years ended January 2, 2011, January 3, 2010 and December 28, 2008, respectively.
The Company has a 401(k) retirement savings plan covering all U.S. employees, subject to certain participation, age and vesting requirements. The plan provides for a partial Company match at either a discretionary amount or up to specified percentages. Total Company contributions were $0.5 million, $0.4 million and $0.5 million, for the years ended January 2, 2011, January 3, 2010 and December 28, 2008, respectively.
NOTE 17. INCOME TAXES
Income (loss) before provision (benefit) for income taxes consisted of the following (in millions):
| |
Year Ended | ||||||||||
|---|---|---|---|---|---|---|---|---|---|---|---|
| |
January 2, 2011 |
January 3, 2010 |
December 28, 2008 |
||||||||
United States |
$ | (61.1 | ) | $ | (75.0 | ) | $ | (17.8 | ) | ||
Non-United States |
311.3 | 18.0 | (2.6 | ) | |||||||
Total |
$ | 250.2 | $ | (57.0 | ) | $ | (20.4 | ) | |||
The components of the provision (benefit) for income taxes are as follows (in millions):
| |
Year Ended | ||||||||||
|---|---|---|---|---|---|---|---|---|---|---|---|
| |
January 2, 2011 |
January 3, 2010 |
December 28, 2008 |
||||||||
Current: |
|||||||||||
Federal |
$ | — | $ | — | $ | — | |||||
State |
— | — | 0.1 | ||||||||
Foreign |
106.4 | 7.4 | 1.0 | ||||||||
Total current |
$ | 106.4 | 7.4 | 1.1 | |||||||
Deferred: |
|||||||||||
Federal |
3.9 | — | — | ||||||||
State |
0.3 | — | — | ||||||||
Foreign |
(7.0 | ) | (0.5 | ) | (1.3 | ) | |||||
Total deferred |
(2.8 | ) | (0.5 | ) | (1.3 | ) | |||||
Provision (benefit) for income taxes |
$ | 103.6 | $ | 6.9 | $ | (0.2 | ) | ||||
F-35
POWER-ONE, INC.
NOTES TO CONSOLIDATED FINANCIAL STATEMENTS (Continued)
YEARS ENDED JANUARY 2, 2011, JANUARY 3, 2010 AND DECEMBER 28, 2008
For the years ended January 2, 2011 and January 3, 2010, the components of deferred income tax assets (liabilities) were as follows (in millions):
| |
Year Ended | |||||||||||||||||||
|---|---|---|---|---|---|---|---|---|---|---|---|---|---|---|---|---|---|---|---|---|
| |
January 2, 2011 | January 3, 2010 | ||||||||||||||||||
| |
Federal | State | Foreign | Federal | State | Foreign | ||||||||||||||
Current: |
||||||||||||||||||||
Uniform capitalization |
$ | 0.1 | $ | — | $ | — | $ | 0.4 | $ | — | $ | — | ||||||||
Sales discount reserve |
0.6 | — | — | 0.6 | 0.1 | — | ||||||||||||||
Bad debt reserve |
0.3 | — | 1.1 | 0.2 | — | 0.7 | ||||||||||||||
Inventory reserve |
3.6 | 0.3 | 2.2 | 3.2 | 0.2 | 3.4 | ||||||||||||||
Warranty reserve |
0.5 | — | 5.5 | 0.6 | — | 0.3 | ||||||||||||||
Legal Reserves |
7.7 | 0.5 | — | — | — | — | ||||||||||||||
Restructuring reserve |
0.2 | — | — | 2.4 | 0.1 | — | ||||||||||||||
Other |
0.5 | 0.1 | 0.2 | (0.5 | ) | 0.1 | 1.0 | |||||||||||||
Subtotal |
13.5 | 0.9 | 9.0 | 6.9 | 0.5 | 5.4 | ||||||||||||||
Valuation allowance |
(13.5 | ) | (0.9 | ) | (0.3 | ) | (6.9 | ) | (0.5 | ) | (0.8 | ) | ||||||||
Total current |
— | — | 8.7 | — | — | 4.6 | ||||||||||||||
Non-current: |
||||||||||||||||||||
NOL |
109.0 | 7.4 | 24.2 | 110.0 | 2.3 | 16.5 | ||||||||||||||
Intangible assets |
(2.2 | ) | 0.9 | (1.2 | ) | 0.8 | 1.0 | (1.7 | ) | |||||||||||
Fixed assets |
(0.1 | ) | — | (1.9 | ) | 1.1 | — | (1.9 | ) | |||||||||||
Other |
3.3 | 1.2 | 0.6 | 0.6 | 0.9 | (0.3 | ) | |||||||||||||
Subtotal |
110.0 | 9.5 | 21.7 | 112.5 | 4.2 | 12.6 | ||||||||||||||
Valuation allowance |
(113.9 | ) | (9.8 | ) | (16.9 | ) | (112.5 | ) | (4.2 | ) | (15.8 | ) | ||||||||
Total non-current |
(3.9 | ) | (0.3 | ) | 4.8 | — | — | (3.2 | ) | |||||||||||
Net deferred income tax assets (liabilities) |
$ | (3.9 | ) | $ | (0.3 | ) | $ | 13.5 | $ | — | $ | — | $ | 1.4 | ||||||
The Company had gross deferred tax assets of $171.4 million and $154.8 million and gross deferred tax liabilities of $6.8 million and $12.7 million at January 2, 2011 and January 3, 2010, respectively.
The Company records a valuation allowance against its deferred income tax assets in accordance with ASC 740 "Income Taxes" when, in management's judgment, the deferred income tax assets will not more likely than not be realized in the foreseeable future. For the years ended January 2, 2011, January 3, 2010 and December 28, 2008, the Company recorded increases in valuation allowances against deferred income tax assets of $14.6 million, $9.3 million and $3.9 million, respectively. Our deferred tax assets at January 2, 2011 and January 3, 2010 do not include approximately $2.6 million and zero respectively of excess tax benefits from employee stock based compensation that are a component of our net operating loss carryovers. Shareholders' equity will be increased by approximately $2.6 million if and when such benefits are ultimately realized.
F-36
POWER-ONE, INC.
NOTES TO CONSOLIDATED FINANCIAL STATEMENTS (Continued)
YEARS ENDED JANUARY 2, 2011, JANUARY 3, 2010 AND DECEMBER 28, 2008
A reconciliation of the Company's provision (benefit) for income taxes to the U.S. federal statutory rate is as follows (in millions):
| |
Year Ended | ||||||||||||||||||
|---|---|---|---|---|---|---|---|---|---|---|---|---|---|---|---|---|---|---|---|
| |
January 2, 2011 |
January 3, 2010 |
December 28, 2008 |
||||||||||||||||
| |
Amount | % | Amount | % | Amount | % | |||||||||||||
Provision for income taxes at statutory rate |
$ | 87.6 | 35 | % | $ | (20.0 | ) | (35 | )% | $ | (7.1 | ) | (35 | )% | |||||
State taxes, net of federal benefit |
0.2 | 0.1 | 0.2 | — | 0.7 | 4 | |||||||||||||
Foreign income taxed at different rates |
(9.6 | ) | (3.8 | ) | 0.6 | 1 | 0.7 | 3 | |||||||||||
Deemed Foreign Dividends |
13.1 | 5.2 | — | — | — | — | |||||||||||||
Non-deductible goodwill |
— | — | 16.1 | 28 | 0.2 | 1 | |||||||||||||
Other |
4.5 | 1.8 | 0.7 | 2 | 1.4 | 7 | |||||||||||||
Valuation allowance |
7.8 | 3.1 | 9.3 | 16 | 3.9 | 19 | |||||||||||||
|
$ | 103.6 | 41.4 | % | $ | 6.9 | 12 | % | $ | (0.2 | ) | (1 | )% | ||||||
As of January 2, 2011, the Company had net operating loss (NOL) carry-forwards for federal and state income tax purposes of approximately $318.4 million and $88.8 million, respectively. These operating loss carry- forwards expire in various years beginning in 2022 and 2010, respectively. The Company also has foreign NOLs in various countries totaling approximately $90 million.
Pursuant to Sections 382 and 383 of the US Internal Revenue Code, the utilization of domestic NOL carry-forwards and other tax attributes may be subject to limitations if certain ownership changes occur during a three-year testing period. The Company does not believe an ownership change has occurred as of January 2, 2011 that would limit the Company's utilization of its domestic NOL carry-forwards or other tax attributes.
At January 2, 2011, the Company's liability for uncertain tax positions was $9.2 million of which $7.0million was recorded in other assets, $1.9 million was recorded in other accrued expense, and $0.3 million was recorded in other long-term liabilities. At January 3, 2010, the Company's liability for uncertain tax positions was $3.8 million which was recorded in other long term liabilities. The Company recognized an increase of approximately $5.4 million during 2010 in liability for unrecognized tax benefits, including interest and penalties. A reconciliation of the beginning and ending amount of unrecognized tax benefits is as follows:
Balance at December 30, 2007 |
$ | 2.2 | |||
Gross decreases—tax positions in prior periods |
(0.4 | ) | |||
Balance at December 28, 2008 |
1.8 | ||||
Gross increases—tax positions in prior periods |
2.8 | ||||
Gross decreases—tax positions in prior periods |
(1.2 | ) | |||
Balance at January 3, 2010 |
3.4 | ||||
Gross increases- tax positions in prior periods |
8.7 | ||||
Gross decreases—tax positions in prior periods |
(3.2 | ) | |||
Balance at January 2, 2011 |
$ | 8.9 | |||
F-37
POWER-ONE, INC.
NOTES TO CONSOLIDATED FINANCIAL STATEMENTS (Continued)
YEARS ENDED JANUARY 2, 2011, JANUARY 3, 2010 AND DECEMBER 28, 2008
The total amount of unrecognized tax positions that would impact the effective tax rate is approximately $1.8 million if recognized.
The Company recognizes interest and penalties related to unrecognized tax benefits in income tax expense. The liability related to unrecognized tax benefits included accrued interest of approximately $0.2 million, $0.2 million and $0.3 million at January 2, 2011, January 3, 2010 and December 28, 2008, respectively. The liability related to unrecognized tax benefits included accrued penalties of approximately $0.1 million, $0.2 million and $0.2 million at January 2, 2011, January 3, 2010 and December 28, 2008, respectively. Interest included in income tax provision in the Company's consolidated statement of operations was less than $0.1 million for the year ended January 2, 2011, less than $0.1 million for the year ended January 3, 2010 and $0.1 million for the year ending December 28, 2008. No penalties were recorded to the income tax provision for the years ended January 2, 2011, January 3, 2010, and December 28, 2008. In the current year the decrease in penalties resulted from movement in exchange rates.
The Company is currently under audit by several tax authorities. Based on the expected timing of the resolution and/or closure of these audits, the Company anticipates that the issues related to $1.8 million of the unrecognized tax benefits for positions existing at January 2, 2011 will be resolved during the fiscal year ending January 1, 2012.
As of January 2, 2011, US income taxes have not been provided on approximately $208.5 million of undistributed earnings of foreign subsidiaries since the Company considers these earnings to be reinvested indefinitely. Determination of the amount of unrecognized deferred tax liabilities for temporary differences related to investments in these non-U.S. subsidiaries that are essentially permanent in duration is not practicable.
The Company is subject to federal income tax as well as income taxes in many state and foreign jurisdictions. The federal statute of limitations on assessment remains open for the tax years 2007 through 2009, and the statutes of limitation in state jurisdictions remain open in general from tax years 2006 through 2009. The major foreign jurisdictions remain open for examination in general for tax years 2001 through 2009. The Company anticipates that some of these audits may be finalized in the foreseeable future. However, based upon the complexity of the positions and the protocol for finalizing audits by the relevant tax authorities, the Company cannot reasonably estimate the range of increases and decreases in the next 12 months.
NOTE 18. EARNINGS (LOSS) PER SHARE (EPS)
Basic and diluted earnings per common share ("EPS") are calculated utilizing the "two-class" method. Under the two-class method, EPS is computed by dividing earnings allocated to common stockholders by the weighted-average number of common shares outstanding for the period. Earnings are allocated to both common shares and participating securities based on the respective number of weighted-average shares outstanding for the period. The Company's convertible preferred stock are participating securities due to their participation rights related to cash dividends declared by the Company. If dividends are distributed to the common stockholders, the Company is required to pay dividends to the holders of the preferred stock and common stock pro-rata on an as converted basis. Authoritative guidance issued by the FASB requires net losses attributable to common stockholders to be allocated among common stock and participating securities to the extent that the securities are required to share in the losses. Since the convertible preferred stock is not contractually obligated to
F-38
POWER-ONE, INC.
NOTES TO CONSOLIDATED FINANCIAL STATEMENTS (Continued)
YEARS ENDED JANUARY 2, 2011, JANUARY 3, 2010 AND DECEMBER 28, 2008
share in the Company's losses, no allocation was made to preferred stock for periods where a net loss existed.
Components of basic and diluted earnings (loss) per share are calculated as follows (in millions, except per share data):
| |
12 Months Ended | ||||||||||
|---|---|---|---|---|---|---|---|---|---|---|---|
| |
January 2, 2011 |
January 3, 2010 |
December 28, 2008 |
||||||||
Basic EPS |
|||||||||||
Net income (loss) attributable to common stockholders |
$ | 144.4 | $ | (65.5 | ) | $ | (17.5 | ) | |||
Less: undistributed income allocated to participating preferred stockholders |
(20.3 | ) | — | — | |||||||
Net income (loss) allocated to common stockholders |
$ | 124.1 | $ | (65.5 | ) | $ | (17.5 | ) | |||
Weighted average common shares outstanding (basic) |
95.7 | 88.1 | 87.6 | ||||||||
|
$ | 1.30 | $ | (0.74 | ) | $ | (0.20 | ) | |||
Diluted EPS |
|||||||||||
Net income (loss) attributable to common stockholders |
$ | 144.4 | $ | (65.5 | ) | $ | (17.5 | ) | |||
Add: effect of dilutive convertible debt |
5.7 | — | — | ||||||||
Less: undistributed income allocated to participating preferred stockholders |
(14.4 | ) | — | — | |||||||
Net income (loss) attributable to common stockholders |
$ | 135.7 | $ | (65.5 | ) | $ | (17.5 | ) | |||
Weighted average common shares outstanding (basic) |
95.7 | 88.1 | 87.6 | ||||||||
Common shares issuable assuming dilution |
46.2 | — | — | ||||||||
Weighted average common shares outstanding (diluted) |
141.9 | 88.1 | 87.6 | ||||||||
|
$ | 0.96 | $ | (0.74 | ) | $ | (0.20 | ) | |||
Due to the Company's net loss during the fiscal years 2009 and 2008, the inclusion of dilutive common share equivalents in the calculation of diluted earnings per share would be anti-dilutive, therefore such common share equivalents have been excluded from the computation of diluted loss per share. Using the treasury stock method, had the Company been in a net income position for the fiscal year 2009 and 2008, the weighted average common share equivalents of approximately 1.6 million and 0.2 million, respectively, which were outstanding, would have been dilutive.
Using the treasury stock method, the weighted average common share equivalents outstanding during each period that were excluded from the computation of diluted earnings per share because the exercise price for these options was greater than the average market price of the Company's shares of common stock during the fiscal years 2010, 2009 and 2008 were 2.1 million, 9.3 million and 8.9 million, respectively.
During the fiscal years 2009 and 2008, the Company excluded its convertible securities from the diluted earnings per share computation as the effect would be anti-dilutive. At January 3, 2010 and December 28, 2008, the weighted average common share equivalents outstanding related to convertible debt that were excluded from the computation of diluted earnings per share because their inclusion in the calculation of diluted earnings per share would be anti-dilutive was 30.0 million shares and 12.9 million shares, respectively. The weighted average common share equivalents outstanding related
F-39
POWER-ONE, INC.
NOTES TO CONSOLIDATED FINANCIAL STATEMENTS (Continued)
YEARS ENDED JANUARY 2, 2011, JANUARY 3, 2010 AND DECEMBER 28, 2008
to convertible preferred stock that were excluded from the computation of diluted earnings per share because their inclusion in the calculation of diluted earnings per share for the year ended January 3, 2010 would be anti-dilutive was 11.3 million shares.
NOTE 19. RELATED PARTY TRANSACTIONS
The Company maintains minority ownership in a joint venture located in China. The joint venture is accounted for and recorded on the consolidated balance sheet as other assets under the equity method. During 2005 and through fiscal 2007, the Company impaired the entire investment in the joint venture as a result of its analysis of the future discounted cash flows combined with other unfavorable indicators. However, during the first fiscal quarter of 2008, the Company received a cash dividend of $1.2 million from the joint venture, representing a return on its investment. The cash dividend along with approximately $1.5 million related to the Company's share in the earnings of the joint venture for the year ended December 28, 2008 were recorded in "Equity in earnings of joint venture" in the consolidated statement of operations. During the year ended January 2, 2011 and January 3, 2010, the Company recorded $1.2 million and $0.6 million related to the Company's equity share in the earnings of the joint venture.
The joint venture may purchase raw components and other goods from the Company and may sell finished goods to the Company as well as to other third parties. The Company records revenue on sales to the joint venture only when the components and goods are for sales to third parties. When the joint venture purchases components that will be assembled and sold back to the Company, no revenue is recorded. The Company also has significant and similar relationships with contract manufacturers. These contract manufacturers may purchase raw components from and sell finished goods back to the Company. No revenue is recognized for these transactions. Revenue is recognized only when the products are for sale to third parties.
No revenue was recognized related to the joint venture during the years ended January 2, 2011, January 3, 2010 and December 28, 2008. The Company paid $17.7 million, $15.8 million and $18.1 million for inventory purchased from the joint venture during the years ended January 2, 2011, January 3, 2010 and December 28, 2008, respectively. At January 2, 2011, January 3, 2010 and December 28, 2008, the Company owed the joint venture approximately $3.2 million, $2.7 million and $12.0 million, respectively.
In accordance with the policies and procedures adopted by the Board of Directors with respect to related party transactions, any transaction, arrangement or relationship in which the Company or any of its subsidiaries is a party, and in which a related person as defined in the instructions to Item 404(a) of Regulation S-K has a direct or indirect material interest, is subject to (i) approval or ratification by the Audit Committee, or (ii) approval by the disinterested members of the Board of Directors, in each case after having determined that the proposed transaction is not inconsistent with the best interests of the Company and its shareholders. At the Audit Committee's first meeting of each fiscal year, or as soon thereafter as practicable, the Committee evaluates any continuing transactions with related parties that involve receivables of more than $120,000 to determine if it is in the best interests of the Company and its shareholders to continue, modify or terminate the transaction.
Related party transactions are disclosed in the Company's filings with the Securities Exchange Commission as and when required by the Securities Act of 1933 and the Securities Exchange Act of 1934 and related rules and regulations. Regardless of any reporting or disclosure obligation pursuant to applicable laws and regulations, all transactions with related parties are disclosed to the Audit
F-40
POWER-ONE, INC.
NOTES TO CONSOLIDATED FINANCIAL STATEMENTS (Continued)
YEARS ENDED JANUARY 2, 2011, JANUARY 3, 2010 AND DECEMBER 28, 2008
Committee and material transactions with related parties are disclosed to the Board of Directors. During the fiscal year ended January 2, 2011 no transactions were required to be reported under Item 404(a) of Regulation S-K that were not subject to the Company's written policies and procedures or with respect to which the policies and procedures were not followed.
F-41
POWER-ONE, INC.
QUARTERLY FINANCIAL DATA FOR THE
2010 AND 2009 QUARTERS (Unaudited)
(In millions, except per share data)
| |
2010 Quarters Ended | ||||||||||||
|---|---|---|---|---|---|---|---|---|---|---|---|---|---|
| |
Apr. 4(1) | Jul. 4 | Oct. 3 | Jan. 2 2011(2) | |||||||||
Net sales |
$ | 152.4 | $ | 214.5 | $ | 314.0 | $ | 366.2 | |||||
Gross profit |
45.7 | 79.4 | 129.1 | 148.9 | |||||||||
Income from operations |
21.1 | 49.3 | 100.5 | 93.7 | |||||||||
Net income |
4.6 | 25.2 | 63.7 | 54.4 | |||||||||
Diluted earnings per share |
0.4 | 0.17 | 0.40 | 0.35 | |||||||||
| |
2009 Quarters Ended | ||||||||||||
|---|---|---|---|---|---|---|---|---|---|---|---|---|---|
| |
Mar. 29(3) | Jun. 28(4) | Sept. 27 | Jan. 3 2010 | |||||||||
Net sales |
$ | 97.8 | $ | 91.2 | $ | 100.1 | $ | 142.5 | |||||
Gross profit |
13.9 | 18.1 | 23.2 | 41.1 | |||||||||
Income (loss) from operations |
(65.4 | ) | (7.0 | ) | 0.1 | 14.0 | |||||||
Net income (loss) |
(61.2 | ) | (6.3 | ) | (2.0 | ) | 6.2 | ||||||
Diluted earnings (loss) per share |
(0.70 | ) | (0.08 | ) | (0.03 | ) | 0.05 | ||||||
- (1)
- During
the first quarter of 2010, we recorded a net loss of $5.7 million from the repurchase and retirement of outstanding convertible debt.
- (2)
- During
the fourth quarter of 2010, we recorded a $22.1 million charge as a result of litigation.
- (3)
- During
the first quarter of 2009, we recorded a goodwill impairment charge of $57.0 million and a net gain of $3.1 million from the repurchase
and retirement of outstanding convertible debt.
- (4)
- During the second quarter of 2009, we recorded a net gain of $5.3 million from the repurchase and retirement of outstanding convertible debt.
F-42
SUPPLEMENTAL SCHEDULE II: VALUATION AND QUALIFYING ACCOUNTS
FOR EACH OF THE YEARS ENDED JANUARY 2, 2011, JANUARY 3, 2010 AND
DECEMBER 28, 2008
(In millions)
Descriptions
|
Balance at Beginning of Period |
Charged to Costs and Expenses(1) |
Deductions(2) | Foreign Currency Impact |
Balance at End of Period |
|||||||||||
|---|---|---|---|---|---|---|---|---|---|---|---|---|---|---|---|---|
Allowance for doubtful accounts: |
||||||||||||||||
Year ended |
||||||||||||||||
January 2, 2011 |
$ | 3.9 | $ | 2.7 | $ | (0.6 | ) | $ | (0.1 | ) | $ | 5.9 | ||||
January 3, 2010 |
5.3 | 0.8 | (2.3 | ) | 0.1 | 3.9 | ||||||||||
December 28, 2008 |
5.5 | 1.3 | (1.2 | ) | (0.3 | ) | 5.3 | |||||||||
Accrued sales discounts and returns: |
||||||||||||||||
Year ended |
||||||||||||||||
January 2, 2011 |
$ | 1.8 | $ | 8.0 | $ | (6.3 | ) | $ | — | $ | 3.5 | |||||
January 3, 2010 |
1.4 | 9.1 | (8.7 | ) | — | 1.8 | ||||||||||
December 28, 2008 |
1.3 | 9.8 | (9.7 | ) | — | 1.4 | ||||||||||
Deferred tax asset valuation allowance: |
||||||||||||||||
Year ended |
||||||||||||||||
January 2, 2011 |
$ | 140.7 | $ | 18.2 | $ | (0.7 | ) | $ | 0.4 | $ | 158.6 | |||||
January 3, 2010 |
143.4 | 9.3 | (15.0 | ) | 3.0 | 140.7 | ||||||||||
December 28, 2008 |
151.6 | 6.8 | (10.9 | ) | (4.1 | ) | 143.4 | |||||||||
- (1)
- For
the allowance for doubtful accounts, represents charges to bad debt expense for the year. For the accrued sales discounts and returns, represents the
provisions for estimated discounts and returns. For the deferred tax asset valuation allowance, represents additional reserves for deferred tax assets generated during the current period.
- (2)
- For the allowance for doubtful accounts, represents write off of bad debt. For the accrued sales discounts and returns, represents products returned from and discounts granted to customers. For the deferred tax asset valuation allowance, represents the utilization of previously reserved deferred tax assets.
S-1
The exhibits listed below are filed as part of, or incorporated by reference, into this Annual Report on Form 10-K.
| |
Description | ||
|---|---|---|---|
| 3.1(a) | Certificate of Incorporation of the Company, filed with the Secretary of State of the State of Delaware on June 11, 2010, effective June 14, 2010 | ||
3.4(a) |
Bylaws of the Company dated as of June 14, 2010 |
||
4.1(a) |
Specimen Common Stock Certificate |
||
4.2(f) |
Rights Agreement, dated as of July 27, 2000, between Power-One, Inc. and American Stock Transfer & Trust Company, as Rights Agent, including as exhibits thereto the terms of the Junior Participating Preferred Stock and Form of Right Certificate |
||
4.3(s) |
Amended and Restated Rights Agreement, dated as of April 23, 2009, between Power-One, Inc. and American Stock Transfer & Trust Company, as Rights Agent, including as an exhibit thereto the Form of Rights Certificate |
||
4.4(g) |
Certificate of Designation of Junior Participating Preferred Stock of Power-One, Inc. |
||
4.5(p) |
Indenture dated as of June 17, 2008, between Power-One, Inc., and The Bank of New York Trust Company, N.A., as Trustee |
||
4.6(p) |
Form of 8% Senior Secured Convertible Notes due 2013 |
||
4.7(n) |
Form of Warrant to purchase up to 2,000,000 shares of common stock of Power-One, Inc. |
||
4.8(i) |
Form of Warrant to purchase up to 8,628.941 shares of common stock of Power-One, Inc. |
||
4.9(i) |
Form of Warrant to purchase up to 71,059 shares of common stock of Power-One, Inc. |
||
4.10(i) |
Indenture dated as of May 8, 2009, between Power-One, Inc., and The Bank of New York Mellon Trust Company, N.A., as Trustee |
||
4.11(i) |
Supplemental Indenture dated as of May 8, 2009, between Power-One, Inc., and The Bank of New York Mellon Trust Company, N.A., as Trustee |
||
4.12(a) |
Certificate of Designation of Series A Convertible Preferred Stock of Power-One, Inc. (formerly New Power-One, Inc.) |
||
4.13(a) |
Certificate of Designation of Series B Junior Participating Convertible Preferred Stock of Power-One, Inc. (formerly New Power-One, Inc.) |
||
4.14(a) |
Certificate of Designation of Series C Junior Participating Convertible Preferred Stock of Power-One, Inc. (formerly New Power-One, Inc.) |
||
10.1(e) |
Form of Indemnification Agreement between the Company and its directors |
||
10.2(h) |
Amended and Restated 1996 Stock Incentive Plan, dated January 25, 2002 |
||
10.3(j) |
Power-One 2001 Stock Option Plan, dated September 28, 2001 |
||
10.4(k) |
Amended and Restated Power-One, Inc. 2004 Stock Incentive Plan, dated May 24, 2010 |
||
10.5(u) |
Form of Stock Unit award agreement under 2004 Stock Incentive Plan for new non-employee director |
||
S-2
| |
Description | ||
|---|---|---|---|
| 10.6(u) | Form of Stock Unit award agreement under 2004 Stock Incentive Plan for continued service as a non-employee director | ||
10.7(u) |
Form of Stock Unit award agreement under 2004 Stock Incentive Plan for employee award |
||
(see 10.4) |
|||
10.9(l) |
Senior Executive Change in Control Agreement |
||
10.10(l) |
Executive Change in Control Agreement |
||
10.11(m) |
Employment Agreement, dated as of February 18, 2008, between Power-One, Inc. and Richard J. Thompson |
||
10.123(m) |
Stock Unit Award Agreement for Richard J. Thompson, dated as of February 18, 2008 |
||
10.13(m) |
Notice of Grant of Stock Option and Terms and Conditions of Richard J. Thompson Stock Option, dated as of February 18, 2008 |
||
10.14(m) |
Notice of Grant of Stock Appreciation Rights and Terms and Conditions of Richard J. Thompson Stock Appreciation Rights, dated as of February 18, 2008 |
||
1015(n) |
Warrant Agreement, dated as of March 6, 2008 between Power-One, Inc. and PWER Bridge LLC |
||
10.16(n) |
Registration Rights Agreement, dated as of March 6, 2008 between Power-One, Inc. and PWER Bridge, LLC |
||
10.17(p) |
Purchase Agreement dated as of June 12, 2008 between Power-One, Inc., and Lehman Brothers, Inc., as initial purchaser of the 8% Senior Secured Convertible Notes |
||
10.18(p) |
Pledge and Security Agreement dated as of June 17, 2008 among Power-One, Inc. and its subsidiaries named therein and The Bank of New York Trust Company, N.A., as collateral agent. |
||
10.19(q) |
Employment Letter, dated as of July 31, 2008, between Power-One, Inc. and Linda C. Heller |
||
10.20(r) |
Employment Offer Letter effective as of September 29, 2008, between the Company and Neil Dial |
||
10.21(r) |
Notice of Grant of Stock Option and Terms and Conditions of Neil Dial Stock Option, dated as of September 29, 2008 |
||
10.228(s) |
Securities Purchase Agreement between Power-One, Inc., and Silver Lake Sumeru Fund L.P. and Silver Lake Technology Investors Sumeru, L.P. dated April 23, 2009 |
||
10.23(i) |
Registration Rights Agreement dated as of May 8, 2009 between Power-One, Inc., and Silver Lake Sumeru Fund L.P. and Silver Lake Technology Investors Sumeru L.P. |
||
10.24(i) |
First Amendment to Pledge and Security Agreement among Power-One, Inc. and its subsidiaries named therein and The Bank of New York Mellon Trust Company, N.A. as collateral agent dated as of May 8, 2009 |
||
10.25(e) |
Form of Indemnification Agreement between the Company and its executive officers and certain other officers |
||
21 |
List of Subsidiaries |
||
S-3
| |
Description | ||
|---|---|---|---|
| 23 | Consent of Independent Registered Public Accounting Firm | ||
24 |
Power of Attorney (Contained on Signature Page) |
||
31.1 |
Section 302 Certification of Principal Executive Officer |
||
31.2 |
Section 302 Certification of Principal Financial Officer |
||
32 |
Section 906 Certifications of Principal Executive Officer and Principal Financial Officer |
||
- (a)
- Previously
filed as an exhibit to the Current Report on Form 8-K filed on June 16, 2010.
- (b)
- (c)
- (d)
- (e)
- Previously
filed as an exhibit to the Quarterly Report on Form 10-Q for the Quarterly Period Ended June 28, 2009.
- (f)
- Previously
filed as an exhibit to the Registration Statement on Form 8-A of Power-One, Inc. filed on August 9,
2000.
- (g)
- Previously
filed as an exhibit to the Current Report on Form 8-K filed on August 9, 2000.
- (h)
- Previously
filed as an exhibit to the Annual Report on Form 10-K for the Fiscal Year ended December 31, 2001 filed on
March 29, 2002
- (i)
- Previously
filed as an exhibit to the Current Report on Form 8-K filed on May 8, 2009.
- (j)
- Previously
filed as an exhibit to the Registration Statement on Form S-8 filed on September 28, 2001.
- (k)
- Previously
filed as an appendix to the Registration Statement on Form S-8 filed on August 16, 2010.
- (l)
- Previously
filed as an exhibit to the Current Report on Form 8-K filed on May 24, 2007.
- (m)
- Previously
filed as an exhibit to the Current Report on Form 8-K filed on February 21, 2008.
- (n)
- Previously
filed as an exhibit to the Current Report on Form 8-K filed on March 11, 2008.
- (o)
- Previously
filed as an exhibit to the Current Report on Form 8-K filed on April 28, 2008.
- (p)
- Previously
filed as an exhibit to the Current Report on Form 8-K filed on June 18, 2008.
- (q)
- Previously
filed as an exhibit to the Current Report on Form 8-K filed on August 5, 2008.
- (r)
- Previously
filed as an exhibit to the Current Report on Form 8-K filed on October 1, 2008.
- (s)
- Previously
filed as an exhibit to the Current Report on Form 8-K filed on April 28, 2009.
- (t)
- Previously
filed as an exhibit to the Current Report on Form 8-A12G/A filed on April 27, 2009.
- (u)
- Previously filed as an exhibit to the quarterly report on Form 10Q filed March 31, 2006.
New exhibits filed in 2010:
Amendment No. 1 to the Amended and Restated Rights Agreement, dated as of April 23, 2009, between Power-One, Inc. and American Stock Transfer & Trust Company, as Rights Agent—Previously filed as an exhibit to the Registration Statement on Form 8-A/A filed June 16, 2010.
S-4
First Supplemental Indenture, dated as of June 14, 2010, between Power-One, Inc. (formerly New Power-One, Inc.) and the Bank of New York Mellon Trust Company, N.A., as trustee—Previously filed as an exhibit to the Current Report on Form 8-K filed June 16, 2010. (foot note "a")
Second Supplemental Indenture, dated as of June 14, 2010, between Power-One, Inc. (formerly New Power-One, Inc.) and the Bank of New York Mellon Trust Company, N.A., as trustee—Previously filed as an exhibit to the Current Report on Form 8-K filed June 16, 2010. (foot note "a")
Agreement and Plan of Reorganization, dated as of June 11, 2010, by and between New Power-One, Inc., Power-One, Inc., and Power-One Merger-Sub, Inc.—Previously filed as an exhibit to the Current Report on Form 8-K filed June 16, 2010. (foot note "a")
Form of Notice of Redemption of the Company's 8% Senior Secured Convertible Notes due 2013.—Previously filed as an exhibit to the Current Report on Form 8-K filed July 6, 2010.
Employment Offer Letter effective July 15, 2010 between the Company and Steven Hogge—Previously filed as an exhibit to the quarterly report on Form 10-Q filed November 12, 2010.
Employment Offer Letter effective August 16, 2010 between the Company and Gary Larsen—Previously filed as an exhibit to the quarterly report on Form 10-Q filed November 12, 2010.
Separation Agreement and Release of Claimes effective August 13, 2010 between Power One, Inc. and Linda Heller—Previously filed as an exhibit to the quarterly report on Form 10-Q filed November 12, 2010.
S-5