Attached files
Table of Contents
UNITED STATES
SECURITIES AND EXCHANGE COMMISSION
Washington, D.C. 20549
FORM 10-K
| x | ANNUAL REPORT PURSUANT TO SECTION 13 OR 15(d) OF THE SECURITIES EXCHANGE ACT of 1934 |
For the fiscal year ended December 31, 2010
| ¨ | TRANSITION REPORT PURSUANT TO SECTION 13 OR 15(d) OF THE SECURITIES EXCHANGE ACT of 1934 |
Commission File No. 1-11859
PEGASYSTEMS INC.
(Exact name of Registrant as specified in its charter)
Massachusetts
(State or other jurisdiction of incorporation or organization)
(IRS Employer Identification No. 04-2787865)
| 101 Main Street Cambridge, MA |
02142-1590 | |
| (Address of principal executive offices) | (zip code) |
(617) 374-9600
(Registrant’s telephone number, including area code)
Securities registered pursuant to Section 12(b) of the Act:
| Title of Each Class | Name of Each Exchange on Which Registered | |
| Common Stock, $0.01 par value per share | NASDAQ Global Select Market |
Securities registered pursuant to Section 12(g) of the Act:
None
Indicate by check mark if the Registrant is a well-known seasoned issuer, as defined in Rule 405 of the Securities Act of 1933. Yes ¨ No x
Indicate by check mark if the Registrant is not required to file reports pursuant to Section 13 or Section 15(d) of the Exchange Act. Yes ¨ No x
Indicate by check mark whether the Registrant (1) has filed all reports required to be filed by Section 13 or 15(d) of the Securities Exchange Act of 1934 during the preceding 12 months (or for such shorter period that the Registrant was required to file such reports) and (2) has been subject to such filing requirements for the past 90 days. Yes x No ¨
Indicate by check mark whether the registrant has submitted electronically and posted on its corporate Web site, if any, every Interactive Data File required to be submitted and posted pursuant to Rule 405 of Regulation S-T during the preceding 12 months (or for such shorter period that the registrant was required to submit and post such files). Yes ¨ No ¨
Indicate by check mark if disclosure of delinquent filers pursuant to Item 405 of Regulation S-K is not contained herein, and will not be contained, to the best of the Registrant’s knowledge, in definitive proxy or information statements incorporated by reference in Part III of this Form 10-K or any amendment to this Form 10-K. x
Indicate by check mark whether the Registrant is a large accelerated filer, an accelerated filer, a non-accelerated filer, or a smaller reporting company. See the definitions of “large accelerated filer”, “accelerated filer”, and “smaller reporting company” in Rule 12b-2 of the Exchange Act. (Check one):
| Large accelerated filer ¨ |
Accelerated filer x | Non-accelerated filer ¨ | Smaller reporting company ¨ | |||
| (Do not check if a smaller reporting company) |
Indicate by check mark whether the Registrant is a shell company (as defined in Rule 12b-2 of the Exchange Act). Yes ¨ No x
The aggregate market value of the Registrant’s common stock held by non-affiliates of the Registrant based on the closing price (as reported by NASDAQ) of such common stock on the last business day of the Registrant’s most recently completed second fiscal quarter (June 30, 2010) was approximately $511 million.
There were 37,285,030 shares of the Registrant’s common stock, $0.01 par value per share, outstanding on March 3, 2011.
DOCUMENTS INCORPORATED BY REFERENCE
Portions of the Registrant’s definitive proxy statement related to it 2011 annual meeting of stockholders to be filed subsequently are incorporated by reference into Part III of this report.
Table of Contents
| Item |
Page | |||||
| PART I | ||||||
| 1 |
3 | |||||
| 1A |
10 | |||||
| 1B |
15 | |||||
| 2 |
15 | |||||
| 3 |
15 | |||||
| 4 |
15 | |||||
| PART II | ||||||
| 5 |
16 | |||||
| 6 |
18 | |||||
| 7 |
Management’s Discussion and Analysis of Financial Condition and Results of Operations |
19 | ||||
| 7A |
39 | |||||
| 8 |
40 | |||||
| 9 |
Changes in and Disagreements with Accountants on Accounting and Financial Disclosure |
73 | ||||
| 9A |
73 | |||||
| 9B |
75 | |||||
| PART III | ||||||
| 10 |
75 | |||||
| 11 |
76 | |||||
| 12 |
Security Ownership of Certain Beneficial Owners and Management and Related Stockholder Matters |
76 | ||||
| 13 |
Certain Relationships and Related Transactions, and Director Independence |
79 | ||||
| 14 |
79 | |||||
| PART IV | ||||||
| 15 |
79 | |||||
| 80 | ||||||
2
Table of Contents
PART I
Forward-looking statements
This Annual Report on Form 10-K contains or incorporates forward-looking statements within the meaning of section 27A of the Securities Act of 1933 and section 21E of the Securities Exchange Act of 1934. These forward-looking statements are based on current expectations, estimates, forecasts and projections about the industry and markets in which we operate and management’s beliefs and assumptions. In addition, other written or oral statements that constitute forward-looking statements may be made by us or on our behalf. Words such as “expect,” “anticipate,” “intend,” “plan,” “believe,” “could,” “estimate,” “may,” “target,” “project,” or variations of such words and similar expressions are intended to identify such forward-looking statements. These statements are not guarantees of future performance and involve certain risks, uncertainties and assumptions that are difficult to predict. We have identified certain risk factors included in Item 1A of this Annual Report on Form 10-K that we believe could cause our actual results to differ materially from the forward-looking statements we make. We do not intend to update publicly any forward-looking statements, whether as a result of new information, future events or otherwise.
| ITEM 1. | Business |
Pegasystems Inc. was incorporated in Massachusetts in 1983. Our stock is traded on the NASDAQ Global Select Market under the symbol PEGA. Our Website address is www.pega.com. We are not including the information contained on our Website as part of, or incorporating it by reference into, this Annual Report on Form 10-K. Unless the context otherwise requires, references in this Annual Report on Form 10-K to “the Company,” “we,” “us” or “our” refer to Pegasystems Inc. and its subsidiaries.
Our business
We develop, market, license, and support software to automate complex, changing business processes. Our software enables organizations to build, deploy, and change enterprise applications easily and quickly by directly capturing business objectives, automating programming, and automating work. It also allows organizations to avoid the time and expense required to create lengthy policy manuals and system specifications by unifying business rules with business processes in the software and automating the creation of system documentation. Our software is standards-based and can leverage existing technology investments to reduce implementation time. Our customers use our software and services to improve their customer service, generate new business, improve productivity, and facilitate case management.
Our PegaRULES Process Commander ® (“PRPC”) software is the primary component of our Pega BPM ® Suite, which is complemented by software solutions that we refer to as frameworks. These frameworks provide purpose or industry-specific functionality that allows our customers to quickly implement and easily customize our software to suit their unique requirement.
We provide implementation, consulting, training, and technical support services to help our customers maximize the business value they obtain from the use of our software. We maintain alliances with systems integrators and technology consulting firms that also provide consulting services to our customers.
We lead the Business Process Management (“BPM”) software market by leveraging our patented Build for Change ® technology that unifies business processes and business rules. We are also a leader in the Customer Relationship Management (“CRM”) and Dynamic Case Management software markets. We focus our sales efforts on target accounts, which are large companies or divisions within companies, and typically leaders in their industry. We frequently sell initial licenses that are focused on a specific purpose or area of operations, rather than selling large enterprise licenses. A primary objective of this strategy is to have our customers quickly realize
3
Table of Contents
business value from our software. Once a customer has realized this initial value, we work with that customer to identify opportunities for follow-on sales. The sales process for follow-on sales is often shorter as a result of our established relationship with the customer. We invest resources in professional services, customer support, and customer and partner enablement to help our customers achieve success.
Our partners
Strategic partnerships with technology consulting firms and systems integrators are important to our sales efforts because they influence buying decisions, help us to identify engagements, and complement our software with their domain expertise and services capabilities. These partners may deliver strategic business planning, consulting, project management, and implementation services to our customers. Currently, our partners include, but are not limited to, Accenture Ltd., Capgemini SA, Cognizant Technology Solutions Inc., Infosys Technologies Limited, International Business Machines Corporation (“IBM”), PricewaterhouseCoopers LLP, Tata Consultancy Services Limited, and Wipro Ltd.
Our products
Our primary software solutions are as follows:
PegaRULES Process Commander
PRPC provides capabilities designed to model, execute, monitor, and analyze results. PRPC includes an application profiler that allows a business process application to be defined based on business goals and objectives, with simplified “fill in the blank” forms. The product also simplifies process modeling, allowing business users to graphically describe and test an intended business process within the system itself. The software uses the results of the application profiler and the process modeling to create the new business solution, including the user interface and executable business models. PRPC also provides a browser-based graphical development environment, execution engine, and management dashboard for rapid business application and solution development. This product helps solve a wide range of BPM problems, including acquiring new business, providing customer service, creating a servicing backbone for enterprise-wide processing, and managing risk, fraud and compliance with regulatory requirements. PRPC also allows our customers to leverage previous technology investments by integrating software applications across a common platform.
Pega BPM Suite and Solution Frameworks
The Pega BPM Suite adds process analysis, process simulation, enterprise integration, portal integration, content management, case management and more to the PRPC capabilities.
We also offer purpose or industry-specific solution frameworks built on the capabilities of our PRPC software. These frameworks allow organizations to quickly implement new customer-facing practices and processes, bring new offerings to market, and provide customized or specialized processing to meet the needs of different customers, departments, geographies or regulatory requirements. We also offer other frameworks that address exceptions management—transactions that are not automatically processed by existing systems. By automating not only research and decision making, but also the business processes necessary to execute the decisions, our exceptions management frameworks can reduce the costs and risks associated with manual processing, while improving quality and efficiency.
Pega CRM ®
Pega CRM software offers a process-driven, customer-centric business solution in order to optimize the customer experience while reducing costs. The capabilities within Pega CRM automate customer service
4
Table of Contents
inquiries and marketing and apply analytics to predict and adapt customer service processes, which result in the delivery of a personal customer interaction. As a result of our acquisition of Chordiant Software, Inc. (“Chordiant”) in April 2010, we have increased our customer base and depth of CRM-related product capabilities.
Pega Decision Management
We offer Pega Decision Management as a result of our acquisition of Chordiant. Our decision management products and capabilities are designed to manage processes so that all actions optimize the outcome based on business objectives. Pega Decision Manager and Recommendation Advisor support cross-channel decision-making for offer management, risk, and other marketing and customer management solutions. Pega frameworks for Cross-Sell/Up-Sell, Retention, and Collections help marketing professionals build and deploy decision making solutions fast, while Predictive and Adaptive analytics support creation and improvement of decision models for outstanding operational performance.
Pega Cloud ®
Pega Cloud is Pegasystems’ cloud computing service offering that allows customers to create and run PRPC applications using an internet-based infrastructure. This offering enables our customers to immediately build, test, and deploy their applications in a secure cloud environment while minimizing their infrastructure and hardware costs.
Our services and support
We offer services and support through our professional services group, customer support group, and our training services group. We also utilize third party contractors to assist us in providing services.
Professional services
Our professional services group helps companies and partners implement our software. This enables us to guide our customers through deployment of our software. Many of our customers choose to engage our professional services group to expand their use of our software to additional business or product lines or automate additional processes within existing solutions. In addition, systems integrators and consulting firms, with which we have alliances, help our customers deploy our products.
Customer support
Our customer support group is responsible for support of our software deployed at customer sites when customer support has been purchased. Support services include automated problem tracking, prioritization and escalation procedures, periodic preventive maintenance, documentation updates, new software releases, and regularly scheduled customer meetings with our staff.
Training services
The success of our sales strategy for multiple follow-on sales to target customers depends on our ability to train a larger number of partners and customers to implement our technology. We offer training for our staff, customers, and partners. Training is offered at our regional training facilities in Cambridge, Massachusetts, Bedford, New Hampshire, London, England, Hyderabad, India, Sydney, Australia, at third party facilities in numerous other locations, and at customer sites. Courses are designed to meet the specific requirements of process architects, system architects, and system administrators.
5
Table of Contents
Our markets and representative customers
The market for BPM and the related software markets are driven by businesses that seek to close the execution gaps that may exist between their business objectives and their existing business processes. Our target customers are large, industry-leading organizations faced with managing transaction intensive, complex and changing processes that seek the agility needed for growth, productivity, customer retention, and compliance. Our customers are typically large companies in the financial services, healthcare and insurance markets. With PRPC, we are also able to offer solutions to a broader range of companies as well as a broader range of industries, such as life sciences, communications, travel and entertainment, and government.
Financial services
Financial services organizations require software to improve the quality, accuracy, and efficiency of customer interactions and transactions processing. Pegasystems’ customer process and exceptions management products allow customers to be responsive to changing business requirements. Representative financial services customers of ours include: BBVA Bancomer S.A., BNP Paribas, Citigroup Inc., HSBC Holdings Plc, ING Bank, JP Morgan Chase, MasterCard Worldwide, National Australia Bank Limited, and RBC Financial Group.
Healthcare
Healthcare organizations seek products that integrate their front and back office initiatives and help drive customer service, efficiency, and productivity. Representative healthcare customers of ours include: Aetna Inc., Blue Cross Blue Shield of Massachusetts, Blue Cross Blue Shield of Minnesota, Blue Cross Blue Shield of Tennessee, Group Health Cooperative, HealthNow New York Inc., Medco Health Solutions, Inc., United Healthcare Services, Inc., and ViPS/WebMD.
Insurance
Insurance companies, whether competing globally or nationally for customers and channels, need software to automate the key activities of policy rating, quoting, customization, underwriting, and servicing as well as products that improve customer service and the overall customer experience. Representative insurance industry customers of ours include: American National Insurance Group, CARDIF, Chartis, Farmers Insurance Group of Companies, John Hancock Life Insurance Co., Manulife Financial Corporation, and Zurich North America.
Other industries
PRPC offers solutions to a broad range of companies and industries. We sell rules-based BPM technology to customers in telecommunications, government, life sciences, manufacturing, and travel services. Customers include: Advanced Micro Devices, Inc. (“AMD”), Deutsche Telekom, Novartis International AG, O2, Orange, The British Airport Authority, The ServiceMaster Company, UPS, and Vodafone.
Competition
We compete in the BPM, CRM, Case Management and Decision Management software markets. These markets are intensely competitive, rapidly changing, and highly fragmented, as current competitors expand their product offerings and new companies enter the market. Competitors vary in size and in the scope and breadth of the products and services offered. We encounter competition from:
| • | Service-Oriented Architecture (“SOA”) middleware vendors including IBM, Oracle Corporation, Software AG, and Tibco Software Inc.; |
6
Table of Contents
| • | BPM vendors such as Appian Corporation, Global360, Inc. the Lombardi Software division of IBM, Metastorm Inc. (pending acquisition by Open Text), and the Savvion division of Progress Software; |
| • | Business Rules Engine vendors such as Corticon Technologies Inc., Fair Isaac Corporation, and the ILOG division of IBM; |
| • | Customer Relationship Management (“CRM”) application vendors such as the Microsoft Dynamics CRM division of Microsoft, Salesforce.com, and the Siebel division of Oracle; |
| • | Enterprise Content Management-based vendors such as the Documentum division of EMC Corporation, and the FileNet division of IBM’s Information Management Group; |
| • | Companies that provide application specific software for the financial services, healthcare, insurance and other specific markets such as Guidewire Software, Inc., Norkom Group Plc, SmartStream Technologies Ltd., SunGard, and The TriZetto Group, Inc.; and |
| • | Current customers’ information technology departments, which may seek to modify existing systems or develop proprietary systems. |
We have been most successful competing for customers whose businesses are characterized by a high degree of change, complexity, and size. We believe that the principal competitive factors within our market include:
| • | Product adaptability, scalability, functionality, and performance; |
| • | Proven success in delivering cost-savings and efficiency improvements; |
| • | Ease-of-use for developers, business units, and end-users; |
| • | Timely development and introduction of new products and product enhancements; |
| • | Establishment of a significant base of reference customers; |
| • | Ability to integrate with other products and technologies; |
| • | Customer service and support; |
| • | Product price; |
| • | Vendor reputation; and |
| • | Relationships with systems integrators. |
We believe we compete favorably with our competitors on the basis of most of these competitive factors as our Build for Change technology includes a comprehensive set of business rules that are unified with business processes, can be developed quickly by both client business and IT staff, and incorporates a single, browser-based user interface. We believe we also compete favorably due to our expertise in our target industries and our long-standing customer relationships. We believe we compete less favorably on the basis of some of these factors with respect to our larger competitors, many of which have greater sales, marketing and financial resources, more extensive geographical presence and greater name recognition than we do. In addition, we may be at a disadvantage with respect to our ability to provide expertise outside our target industries.
7
Table of Contents
Sales and marketing
We market our software and services primarily through a direct sales force. Strategic partnerships with consultants and systems integrators are important to our sales efforts because they influence buying decisions, help us to identify engagements, and complement our software with their domain expertise and services capabilities.
To support our sales efforts, we conduct a broad range of marketing programs, including targeted solution campaigns, industry trade shows, including our PegaWorld user conference, solution seminars industry analysts and press relations, web marketing, community development, social media, and other direct and indirect marketing efforts. Our consulting staff, business partners, and other third parties also generate sales leads.
Sales by geography
In 2010, 2009, and 2008, sales to customers based outside of the United States of America (“U.S.”) represented approximately 41%, 34%, and 38%, respectively, of our total revenue. We currently operate in one operating segment — Business Process Solutions. We derive substantially all of our operating revenue from the sale and support of one group of similar products and services. Substantially all of our assets are located within the U.S. See Note 16 “Geographic Information and Major Customers” included in the notes to the accompanying audited consolidated financial statements for further detail.
Research and development
Our development organization is responsible for product architecture, core technology development, product testing, and quality assurance. Our product development priority is to continue expanding the capabilities of our rules-based technology. We intend to maintain and extend the support of our existing solution frameworks, and we may choose to invest in additional frameworks which incorporate the latest business innovations. We also intend to maintain and extend the support of popular hardware platforms, operating systems, databases, and connectivity options to facilitate easy and rapid deployment in diverse information technology infrastructures. Our goal with all of our products is to enhance product capabilities, ease of implementation, long-term flexibility, and the ability to provide improved customer service.
During 2010, 2009, and 2008, research and development expenses were approximately $55.2 million, $38.9 million, and $31.5 million, respectively. We expect that we will continue to commit significant resources to our product research and development in the future to maintain our leadership position.
Employees
As of January 31, 2011, we had 1,509 employees worldwide, of which 950 were based in the U.S., 278 were based in Europe, 209 were based in India, 30 were based in Canada, 22 were based in Australia and 20 were based in Asia. Our total headcount includes 535 consulting and customer support employees, 392 sales and marketing employees, 400 research and development employees, and 182 administrative employees. In addition, we augmented our research and development and professional services employees with approximately 345 contractors.
Backlog of license, maintenance, and professional services
As of December 31, 2010, we had software license, maintenance, and professional services agreements with customers expected to result in approximately $232.1 million of future revenue, of which we expect approximately $143.9 million to be recognized in 2011. As of December 31, 2009, we had backlog of software license, maintenance, and professional services agreements with customers of approximately $192 million.
8
Table of Contents
Under some of these agreements, we must fulfill certain conditions prior to recognizing revenue, and there can be no assurance when, if ever, we will be able to satisfy all such conditions in each instance. Business conditions could change and, therefore, backlog may not be a reliable indicator of future financial performance.
Available Information
We make available free of charge through our Website www.pegasystems.com our Annual Reports on Form 10-K, Quarterly Reports on Form 10-Q and Current Reports on Form 8-K, and amendments to these reports, as soon as reasonably practicable after we electronically file such material with, or furnish such material to, the Securities and Exchange Commission (“SEC”). The SEC maintains a Website that contains reports, proxy, and information statements and other information regarding issuers that file electronically with the SEC at www.sec.gov. We make available on our Website reports filed by our executive officers and Directors on Forms 3, 4, and 5 regarding their ownership of our securities. Our Code of Conduct, and any amendments to our Code of Conduct, is also available on our Website.
9
Table of Contents
| ITEM 1A. | RISK FACTORS |
The following important factors could cause our actual business and financial results to differ materially from those contained in forward-looking statements made in this Annual Report on Form 10-K or elsewhere by management from time to time.
Factors relating to our financial results
The number of our license arrangements has been increasing, and we may not be able to sustain this growth unless we can provide sufficient high quality professional services, training, and maintenance resources to enable our customers to realize significant business value from our software. Our customers typically request professional services and training to assist them in implementing our products. Our customers also purchase maintenance on our products in almost all cases. As a result, an increase in the number of license arrangements is likely to increase demand for professional services, training, and maintenance relating to our products. Given that the number of our license arrangements has been increasing, we will need to provide our customers with more professional services, training, and maintenance to enable our customers to realize significant business value from our software. Accordingly, we have been hiring additional personnel in these areas and improving our “on-boarding” process to ramp up new personnel in a shorter period of time. We have also been increasingly enabling our partners and customers through training to create an expanded universe of people that are skilled in the implementation of our products. However, if we are unable to provide sufficient high quality professional services, training, or maintenance resources to our customers, our customers may not realize sufficient business value from our products to justify follow-on sales, which could impact our future financial performance. In addition, the growth required to meet the increased demand for our professional services could strain our ability to deliver our services engagements at desired levels of profitability, thereby impacting our overall profitability and financial results.
We frequently enter into limited scope initial licenses with new customers, which could adversely affect our financial performance if we are not successful in obtaining follow-on business from these customers. We frequently enter into initial licenses with our new customers that are focused on a specific purpose or area of operations, rather than selling large enterprise licenses, to allow these new customers to realize business value from our software quickly and for a limited initial investment. Once a customer has realized this initial value, we work with the customer to identify opportunities for follow-on sales. However, we may not be successful in demonstrating this initial value to some customers, for reasons relating to the performance of our products, the quality of the services and support we provide for our products, or external reasons. For these customers, we may not obtain follow-on sales or the follow-on sales may be delayed, and our license revenue will be limited to the smaller initial sale. This could lower the total value of all transactions and adversely affect our financial performance.
Our professional services revenue is dependent to a significant extent on closing new license transactions with customers. We derive a substantial portion of our professional services revenue from implementation of new software licenses with our customers. Accordingly, it is imperative that we close more license transactions with our customers if we are to maintain or grow our services revenue.
If we are unable to maintain vendor specific objective evidence (“VSOE”) of fair value of our professional services arrangements, we may be required to delay a portion of our revenue to future periods. We have established VSOE of fair value of our professional services in North America and Europe, other than Spain, based on the price charged when these services are sold separately. The weakened economy and significant competition within our industry have created pricing pressure on professional services provided by technology companies. If we elect to discount our professional services pricing or otherwise introduce variability in our professional services arrangements to attract or retain customers, this could lead to an insufficient number of consistently priced professional services arrangements for us to maintain VSOE. If we do not have VSOE of fair value of our professional services, we may be required to recognize all revenue for these professional services arrangements, including any related license, maintenance, and other services revenue if the professional
10
Table of Contents
services are bundled in an arrangement, ratably over the longer of the software maintenance period or the service period.
The timing of our license revenue is difficult to predict accurately, which may cause our quarterly operating results to vary considerably. A change in the number or size of high value license arrangements, or a change in the mix between perpetual and term licenses, can cause our revenues to fluctuate materially from quarter to quarter. Our decision to enter into term licenses that require the term license revenue to be recognized over the license term as payments become due or earlier if prepaid may adversely affect our profitability in any period due to sales commissions being paid at the time of signing and the corresponding revenue being recognized over time. We plan selling and marketing expenses, product development, and other expenses based on anticipated future revenue. If the timing or amount of revenue fails to meet our expectations in any given quarter, our financial performance is likely to be adversely affected because only small portions of expenses vary with revenue. As a result, period-to-period comparisons of operating results are not necessarily meaningful and should not be relied upon to predict future performance.
Our financial results may be adversely affected if we are required to change certain estimates, judgments, and positions relative to our income taxes. In the ordinary course of conducting a global business enterprise, there are many transactions and calculations undertaken whose ultimate tax outcome cannot be certain. Some of these uncertainties arise as a consequence of positions we have taken regarding valuation of deferred tax assets, transfer pricing for transactions with our subsidiaries, and potential challenges to nexus and tax credit estimates. We estimate our exposure to unfavorable outcomes related to these uncertainties and estimate the probability for such outcomes. Future realization of our deferred tax assets ultimately depends on the existence of sufficient taxable income within the available carryback or carryforward periods. We record a valuation allowance to reduce our deferred tax assets to an amount we believe is more likely than not to be realized. If our taxable income is not consistent with our expectations or the timing of income is not within the applicable carryforward period, we may be required to establish a valuation allowance on all or a portion of these deferred tax assets. Changes in our valuation allowance impact income tax expense in the period of adjustment. Although we believe our estimates are reasonable, no assurance can be given that the final tax outcome of these matters or our current estimates regarding these matters will not be different from what is reflected in our historical income tax provisions, returns, and accruals. Such differences, or changes in estimates relating to potential differences, could have a material impact, unfavorable or favorable, on our income tax provisions, require us to change the recorded value of deferred tax assets, and adversely affect our financial results.
We are investing heavily in sales and marketing and professional services in anticipation of a continued increase in license arrangements, and we may experience decreased profitability or losses if we are unsuccessful in increasing the value of our license arrangements in the future. We have been increasing our investment in sales and marketing to meet increasing demand by hiring additional sales and marketing personnel. We anticipate that we will need to provide our customers with more professional services, training, and maintenance as a result of this increase in demand, and have been hiring additional personnel in these areas. These investments have resulted in increased fixed costs that do not vary with the level of revenue. If the increased demand for our products does not continue, we could experience decreased profitability or losses as a result of these increased fixed costs.
Factors relating to our products and markets
The continued weakness in the U.S and international economies may negatively impact our sales to, and the collection of receivables from, our financial services and insurance customers and possibly our customers in other industries. Our sales to, and our collection of receivables from, our customers may be impacted by adverse changes in global economic conditions, especially in the U.S., Europe and Asia Pacific. In the past few years, these regions have experienced instability in financial markets, tightening credit, and weak overall economic conditions, which has impacted the financial services and insurance industries in particular. These trends could impact the ability and willingness of our financial services and insurance
11
Table of Contents
customers, and possibly our customers in other industries, to make investments in technology, which may delay or reduce the amount of purchases of our software and professional services. These factors could also impact the ability and willingness of these customers to pay their trade obligations and honor their contractual commitments under their non-cancellable term licenses. These customers may also become subject to increasingly restrictive regulatory requirements, which could limit or delay their ability to proceed with new technology purchases. Our financial services and insurance customers as a group represent a significant amount of our revenues and receivables. Accordingly, their potential financial instability could negatively impact our business, operating results, and financial condition.
We will need to acquire or develop new products, evolve existing ones, and adapt to technology change. Technical developments, customer requirements, programming languages, and industry standards change frequently in our markets. As a result, success in current markets and new markets will depend upon our ability to enhance current products, to acquire or develop and introduce new products that meet customer needs, keep pace with technology changes, respond to competitive products, and achieve market acceptance. Product development requires substantial investments for research, refinement, and testing. There can be no assurance that we will have sufficient resources to make necessary product development investments. We may experience difficulties that will delay or prevent the successful development, introduction, or implementation of new or enhanced products. Inability to introduce or implement new or enhanced products in a timely manner would adversely affect future financial performance.
The market for our offerings is increasingly and intensely competitive, rapidly changing, and highly fragmented. The market for BPM software and related implementation, consulting, and training services is intensely competitive, rapidly changing and highly fragmented. We currently encounter significant competition from internal information systems departments of potential or existing customers that develop custom software. We also compete with large technology companies such as IBM, Oracle and SAP, companies that target the customer interaction and workflow markets, companies focused on business rules engines or enterprise application integration, “pure play” BPM companies, and professional service organizations that develop custom software in conjunction with rendering consulting services. Competition for market share and pressure to reduce prices and make sales concessions are likely to increase. Many competitors have far greater resources and may be able to respond more quickly and efficiently to new or emerging technologies, programming languages or standards or to changes in customer requirements or preferences. Competitors may also be able to devote greater managerial and financial resources to develop, promote, and distribute products and provide related consulting and training services. There has been recent consolidation in the BPM market whereby larger companies such as IBM, Oracle, SAP and Progress Software have acquired companies that provide BPM software, which we expect will further increase competition. There can be no assurance that we will be able to compete successfully against current or future competitors or that the competitive pressures faced by us will not materially adversely affect our business, operating results, and financial condition.
We have historically sold to the financial services, insurance and healthcare markets, and rapid changes or consolidation in these markets could affect the level of demand for our products. We have historically derived a significant portion of our revenue from customers in the financial services, insurance, and healthcare markets, and sales to these markets are important for our future growth. Competitive pressures, industry consolidation, decreasing operating margins, regulatory changes, and privacy concerns affect the financial condition of our customers and their willingness to buy. In addition, customers’ purchasing patterns in these industries for large technology projects are somewhat discretionary. The financial services and insurance markets are undergoing intense domestic and international consolidation and financial turmoil, and consolidation has been occurring in the healthcare market. Consolidation may interrupt normal buying behaviors and increase the volatility of our operating results. In recent years, several of our customers have been merged or consolidated, and we expect this to continue in the near future. Future mergers or consolidations may cause a decline in revenues and adversely affect our future financial performance. All of these factors affect the level of demand for our products from customers in these industries, and could adversely affect our business, operating results and financial condition.
12
Table of Contents
We rely on certain third-party relationships. We have a number of relationships with third parties that are significant to sales, marketing and support activities, and product development efforts. We rely on software and hardware vendors, large system integrators, and technology consulting firms to provide marketing and sales opportunities for the direct sales force and to strengthen our products through the use of industry-standard tools and utilities. We also have relationships with third parties that distribute our products. There can be no assurance that these companies, most of which have significantly greater financial and marketing resources, will not develop or market products that compete with ours in the future or will not otherwise end or limit their relationships with us.
We face risks from operations and customers based outside of the U.S. Sales to customers located outside of the U.S. represented approximately 41% of our total revenue in 2010, 34% of our total revenue in 2009, and 38% of our total revenue in 2008. We, in part through our wholly owned subsidiaries, market products and render consulting and training services to customers based outside of the U.S. including, for example, customers based in Canada, the United Kingdom, France, Germany, Spain, Italy, the Netherlands, Belgium, Switzerland, Austria, Ireland, Finland, Hungry, Poland, Sweden, Turkey, Russia, Mexico, Australia, China, Hong Kong, and Singapore. We have established offices in Canada, Europe, Asia and Australia. We believe that growth will necessitate expanded international operations, requiring a diversion of managerial attention and increased costs. We anticipate hiring additional personnel to accommodate international growth, and we may also enter into agreements with local distributors, representatives, or resellers. If we are unable to do one or more of these things in a timely manner, our growth, if any, in our foreign operations may be restricted, and our business, operating results, and financial condition could be materially and adversely affected.
In addition, there can be no assurance that we will be able to maintain or increase international market demand for our products. Several of our international sales are denominated in U.S. dollars. Accordingly, any appreciation of the value of the U.S. dollar relative to the currencies of those countries in which we sell our products may place us at a competitive disadvantage by effectively making our products more expensive as compared to those of our competitors. Additional risks inherent in our international business activities generally include unexpected changes in regulatory requirements, increased tariffs and other trade barriers, the costs of localizing products for local markets and complying with local business customs, longer accounts receivable patterns and difficulties in collecting foreign accounts receivable, difficulties in enforcing contractual and intellectual property rights, heightened risks of political and economic instability, the possibility of nationalization or expropriation of industries or properties, difficulties in managing international operations, potentially adverse tax consequences (including restrictions on repatriating earnings and the threat of “double taxation”), increased accounting and internal control expenses, and the burden of complying with a wide variety of foreign laws. There can be no assurance that one or more of these factors will not have a material adverse effect on our foreign operations, and, consequentially, our business, operating results, and financial condition.
We are exposed to fluctuations in currency exchange rates that could negatively impact our financial results and cash flows. Because a significant portion of our business is conducted outside the U.S., we face exposure to adverse movements in foreign currency exchange rates. These exposures may change over time as business practices evolve, and they could have a material adverse impact on our financial results and cash flows. Our international sales have increasingly become denominated in foreign currencies. The operating expenses of our foreign operations are primarily denominated in foreign currencies, which partially offset our foreign currency exposure. Our U.S. operating company invoices most of our foreign customers in foreign currencies, so it holds cash and receivables valued in these foreign currencies, which are subject to foreign currency transaction gains or losses. A decrease in the value of foreign currencies, particularly the British pound and the Euro relative to the U.S. dollar, could adversely impact our financial results and cash flows.
13
Table of Contents
Factors relating to our internal operations and potential liabilities
We depend on certain key personnel, and must be able to attract and retain qualified personnel in the future. The business is dependent on a number of key, highly skilled technical, managerial, consulting, sales, and marketing personnel, including our Chief Executive Officer. The loss of key personnel could adversely affect financial performance. We do not have any significant key-man life insurance on any officers or employees and do not plan to obtain any. Our success will depend in large part on the ability to hire and retain qualified personnel. The number of potential employees who have the extensive knowledge of computer hardware and operating systems needed to develop, sell, and maintain our products is limited, and competition for their services is intense, and there can be no assurance that we will be able to attract and retain such personnel. If we are unable to do so, our business, operating results, and financial condition could be materially adversely affected.
We may experience significant errors or security flaws in our product and services, and could face privacy, product liability and warranty claims as a result. Despite testing prior to their release, software products frequently contain errors or security flaws, especially when first introduced or when new versions are released. Errors in our software products could affect the ability of our products to work with other hardware or software products, or could delay the development or release of new products or new versions of products. The detection and correction of any security flaws can be time consuming and costly. Errors or security flaws in our software could result in the inadvertent disclosure of confidential information or personal data relating to our customers, employees, or third parties. Software product errors and security flaws in our products or services could expose us to privacy, product liability and warranty claims as well as harm our reputation, which could impact our future sales of products and services. Our license agreements typically contain provisions intended to limit the nature and extent of our risk of product liability and warranty claims. There is a risk that a court might interpret these terms in a limited way or could hold part or all of these terms to be unenforceable. Also, there is a risk that these contract terms might not bind a party other than the direct customer. Furthermore, some of our licenses with our customers are governed by non-U.S. law, and there is a risk that foreign law might give us less or different protection. Although we have not experienced any material product liability claims to date, a product liability suit or action claiming a breach of warranty, whether or not meritorious, could result in substantial costs and a diversion of management’s attention and our resources.
We face risks related to intellectual property claims or appropriation of our intellectual property rights. We rely primarily on a combination of copyright, trademark and trade secrets laws, as well as confidentiality agreements to protect our proprietary rights. We have obtained patents from the U.S. Patent and Trademark Office relating to the architecture of our systems. We cannot assure that such patents will not be invalidated or circumvented or that rights granted thereunder or the claims contained therein will provide us with competitive advantages. Moreover, despite our efforts to protect our proprietary rights, unauthorized parties may attempt to copy aspects of our products or to obtain the use of information that we regard as proprietary. In addition, the laws of some foreign countries do not protect our proprietary rights to as great an extent as do the laws of the U.S. There can be no assurance that our means of protecting our proprietary rights will be adequate or that our competitors will not independently develop similar technology.
There can be no assurance that third parties will not claim infringement by us with respect to current or future products. Although we attempt to limit the amount and type of our contractual liability for infringement of the proprietary rights of third parties, these limitations often contain certain exclusions, and we cannot be assured that these limitations will be applicable and enforceable in all cases. Even if these limitations are found to be applicable and enforceable, our liability to our customers for these types of claims could be material in amount given the size of certain of our transactions. We expect that software product developers will increasingly be subject to infringement claims as the number of products and competitors in our industry segment grows and the functionality of products in different industry segments overlaps. Any such claims, with or without merit, could be time-consuming, result in costly litigation, cause product shipment delays, or require us to enter into royalty or licensing agreements. Such royalty or licensing agreements, if required, may not be available on terms acceptable to us or at all, which could have a material adverse effect upon our business, operating results, and financial condition.
14
Table of Contents
If our security measures are breached and unauthorized access is obtained to a customer’s confidential information from our cloud computing service offering, we may be exposed to significant legal and financial liabilities. Our cloud computing service offering allows customers to create and run PRPC-based applications using an internet-based infrastructure. This offering involves the hosting of customers’ confidential information, including personal and financial data regarding their end customers. Security breaches could expose us to a risk of loss or misuse of this information. Our security measures may be breached as a result of third-party action, including intentional misconduct by computer hackers, system error, human error or otherwise. Because the techniques used to obtain unauthorized access or to sabotage systems change frequently and generally are not recognized until launched against a target, we may be unable to anticipate these techniques or to implement adequate preventative measures. Any security breach could result in a loss of confidence in the security of our service, damage our reputation, disrupt our business, lead to legal liability and negatively impact our future sales.
The acquisition of other businesses and technologies may present new risks. We have undertaken an acquisition during the past two years and may continue to evaluate and consider other potential strategic transactions, including acquisitions of businesses, technologies, services, products and other assets in the future. These acquisitions, if undertaken, may involve significant new risks and uncertainties, including distraction of management attention away from our current business operations, insufficient new revenue to offset expenses, inadequate return on capital, integration challenges, new regulatory requirements, and issues not discovered in our due diligence process. No assurance can be given that such acquisitions will be successful and will not adversely affect our profitability or operations.
| ITEM 1B. | UNRESOLVED STAFF COMMENTS |
None.
| ITEM 2. | Properties |
Our principal administrative, sales, marketing, support, and research and development operations are located at 101 Main Street, Cambridge, Massachusetts in an approximately 105,000 square foot leased facility. The lease for this facility expires in 2013, subject to our option to extend for two additional five-year periods. We also lease space for our other offices in the U.S., Australia, Canada, India, the United Kingdom and in other European countries. These leases expire at various dates through 2020. We believe that additional or alternative space will be available as needed in the future on commercially reasonable terms.
| ITEM 3. | Legal Proceedings |
None.
| ITEM 4. | [Removed and Reserved] |
15
Table of Contents
PART II
| ITEM 5. | Market for Registrant’s Common Equity, Related Stockholder Matters and Issuer Purchases of Equity Securities |
Market Information
Our common stock is quoted on the NASDAQ Global Select Market (“NASDAQ”) under the symbol “PEGA.” The following table sets forth the range of high and low sales prices of our common stock on NASDAQ for each quarter in the years ended December 31:
| Common Stock Price | ||||||||||||||||
| 2010 | 2009 | |||||||||||||||
| High | Low | High | Low | |||||||||||||
| First Quarter |
$ | 39.65 | $ | 32.25 | $ | 19.20 | $ | 11.74 | ||||||||
| Second Quarter |
$ | 39.66 | $ | 26.33 | $ | 27.98 | $ | 16.21 | ||||||||
| Third Quarter |
$ | 33.94 | $ | 20.36 | $ | 35.29 | $ | 22.23 | ||||||||
| Fourth Quarter |
$ | 37.81 | $ | 23.92 | $ | 36.09 | $ | 25.75 | ||||||||
Holders
As of February 11, 2011, we had approximately 39 stockholders of record and approximately 26,300 beneficial owners of our common stock.
Dividends
In July 2006, we began paying a quarterly cash dividend of $0.03 per share of common stock. Quarterly cash dividends are expected to continue at $0.03 per share to stockholders of record as of the first trading day of each quarter, subject to change or elimination at any time by our Board of Directors.
Issuer Purchases of Equity Securities
The following table sets forth information regarding our repurchases of our common stock during the fourth quarter of 2010.
| Period |
Total Number of Shares Purchased |
Average Price Paid per Share |
Total Number of Shares Purchased as Part of Publicly Announced Share Repurchase Program (1) |
Approximate Dollar Value of Shares That May Yet Be Purchased Under Publicly Announced Share Repurchased Programs (1) (in thousands) |
||||||||||||
| 10/1/10 – 10/31/10 |
20,137 | $ | 26.96 | 20,137 | $ | 9,250 | ||||||||||
| 11/1/10 – 11/30/10 |
56,000 | 29.36 | 56,000 | 13,356 | ||||||||||||
| 12/1/10 – 12/31/10 |
3,247 | 36.52 | 3,247 | 13,237 | ||||||||||||
| Total |
79,384 | $ | 29.05 | |||||||||||||
| (1) | Since 2004, our Board of Directors has approved stock repurchase programs that have authorized the repurchase, in the aggregate, up to $80.8 million of our common stock. On November 8, 2010, we announced that our Board of Directors approved an increase in the remaining funds available under the program expiring on December 31, 2010, from $9.2 million to $15 million, and an extension of the |
16
Table of Contents
| expiration date to December 31, 2011. Under this program, purchases may be made from time to time on the open market or in privately negotiated transactions. Shares may be repurchased in such amounts as market conditions warrant, subject to regulatory and other considerations. We have established a pre-arranged stock repurchase plan, intended to comply with the requirements of Rule 10b5-1 under the Securities Exchange Act of 1934, as amended, and of Rule 10b-18 of the Exchange Act (the “10b5-1 Plan”). All share repurchases under the Current Program during closed trading window periods will be made pursuant to the 10b5-1 Plan. |
Stock Performance Graph and Cumulative Total Stockholder Return
The following performance graph represents a comparison of the cumulative total stockholder return (assuming the reinvestment of dividends) for a $100 investment on December 31, 2005 in our common stock, the Total Return Index for the NASDAQ Composite (“NASDAQ Composite”), a broad market index, and the Standard & Poors (“S&P”) North Software-Software Index™ (“S&P NSSI”), a published industry index that was formerly the S&P Goldman Sachs Technology Software Index. We paid dividends of $0.12 per share during 2010, 2009, 2008, and 2007 and $0.06 per share during 2006. The graph lines merely connect measurement dates and do not reflect fluctuations between those dates.
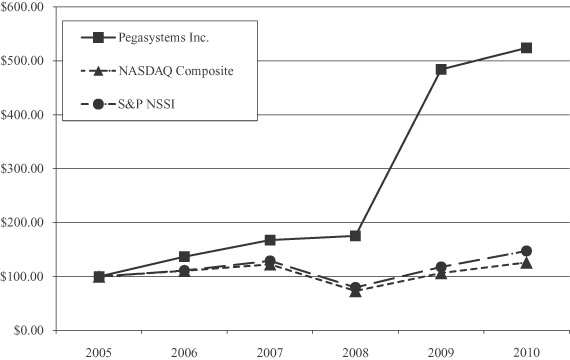
| 12/31/2005 | 12/31/2006 | 12/31/2007 | 12/31/2008 | 12/31/2009 | 12/31/2010 | |||||||||||||||||||
|
Pegasystems Inc. |
$ | 100.00 | $ | 136.53 | $ | 167.39 | $ | 175.22 | $ | 484.20 | $ | 523.60 | ||||||||||||
| NASDAQ Composite |
$ | 100.00 | $ | 110.39 | $ | 122.15 | $73.32 | $ | 106.58 | $ | 125.93 | |||||||||||||
| S&P NSSI |
$ | 100.00 | $ | 111.03 | $ | 129.06 | $79.75 | $ | 117.95 | $ | 147.62 | |||||||||||||
17
Table of Contents
| ITEM 6. | Selected Financial Data |
The selected financial data presented below has been derived from our audited consolidated financial statements. This data should be read in conjunction with “Management’s Discussion and Analysis of Financial Condition and Results of Operations”, the consolidated financial statements and accompanying notes.
| Year Ended December 31, | ||||||||||||||||||||
| 2010 | 2009 | 2008 | 2007 | 2006 | ||||||||||||||||
| (in thousands, except per share amounts) | ||||||||||||||||||||
| Consolidated Statements of Operations Data: |
||||||||||||||||||||
| Total revenue |
$ | 336,599 | $ | 264,013 | $ | 211,647 | $ | 161,949 | $ | 126,023 | ||||||||||
| (Loss) income from operations |
(2,580 | ) | 41,819 | 14,479 | 1,951 | (7,114 | ) | |||||||||||||
| (Loss) income before (benefit) provision for income taxes |
(6,197 | ) | 47,415 | 15,672 | 9,942 | 1,187 | ||||||||||||||
| Net (loss) income |
(5,891 | ) | 32,212 | 10,977 | 6,595 | 1,842 | ||||||||||||||
| Net (loss) earnings per share: |
||||||||||||||||||||
| Basic |
$ | (0.16 | ) | $ | 0.89 | $ | 0.30 | $ | 0.18 | $ | 0.05 | |||||||||
| Diluted |
$ | (0.16 | ) | $ | 0.85 | $ | 0.29 | $ | 0.18 | $ | 0.05 | |||||||||
| Cash dividends declared per common share |
$ | 0.12 | $ | 0.12 | $ | 0.12 | $ | 0.12 | $ | 0.09 | ||||||||||
| Year Ended December 31, | ||||||||||||||||||||
| 2010 | 2009 | 2008 | 2007 | 2006 | ||||||||||||||||
| (in thousands) | ||||||||||||||||||||
| Consolidated Balance Sheet Data: |
||||||||||||||||||||
| Total cash, cash equivalents, and marketable securities |
$ | 87,251 | $ | 202,653 | $ | 167,229 | $ | 149,981 | $ | 127,758 | ||||||||||
| Working capital |
71,944 | 188,552 | 159,080 | 159,547 | 147,229 | |||||||||||||||
| Long-term license installments, net of unearned interest income |
1,223 | 2,976 | 5,413 | 8,267 | 17,458 | |||||||||||||||
| Intangible assets, net of accumulated amortization |
80,684 | 336 | 479 | - | - | |||||||||||||||
| Goodwill |
22,618 | 2,391 | 2,141 | 1,933 | 2,346 | |||||||||||||||
| Total assets |
337,481 | 279,585 | 245,850 | 243,307 | 214,008 | |||||||||||||||
| Stockholders’ equity |
195,670 | 205,219 | 173,114 | 172,944 | 166,158 | |||||||||||||||
The following items impact the comparability of our consolidated financial data:
| — | Our acquisition of Chordiant in April 2010. See Note 7 “Acquisition, Goodwill, and Other Intangibles Assets” in the notes to the accompanying audited consolidated financial statements for further discussion. |
| — | Foreign currency transaction (losses) gains of $(5.6) million, $2.1 million, $(4.5) million, $0.3 million, and $1.2 million during the years ended December 31, 2010, 2009, 2008, 2007, and 2006, respectively. See Item 7A. “Quantitative and Qualitative Disclosure about Market Risk” for further discussion of our foreign currency exchange risk. |
18
Table of Contents
| ITEM 7. | Management’s Discussion and Analysis of Financial Condition and Results of Operations |
Business overview
We develop, market, license, and support software to automate complex, changing business processes. Our software enables organizations to build, deploy, and change enterprise applications easily and quickly by directly capturing business objectives, automating programming, and automating work. Our software is used to build a wide range of business process solutions including customer on-boarding and account opening, CRM, exception and case management, and risk/fraud and compliance management. We also provide professional services, maintenance, and training related to our software.
We focus our sales efforts on target accounts, which are large companies or divisions within companies, and typically leaders in their industry. Our strategy is to sell initial licenses that are focused on a specific purpose or area of operations, rather than selling large enterprise licenses. This strategy allows our customers to quickly realize business value from our software and limits their initial investment. Once a customer has realized this initial value, we work with the customer to identify opportunities for follow-on sales.
Our license revenue is primarily derived from sales of our PRPC software and related solution frameworks. PRPC is a comprehensive platform for building and managing BPM applications that unifies business rules and business processes. Our solution frameworks are built on the capabilities of PRPC and are purpose or industry-specific collections of best practice functionality to allow organizations to quickly implement new customer-facing practices and processes, bring new offerings to market, and provide customized or specialized processing. These products often result in shorter implementation periods than competitive enterprise software products. PRPC and related solution frameworks can be used by a broad range of customers within financial services, insurance and healthcare markets, as well as other markets, such as life sciences and government.
As a result of our acquisition of Chordiant in April 2010, we expanded our ability to develop and license CRM software. We acquired additional products (Chordiant Decision Management, Chordiant Foundation Server, and Chordiant Marketing Director solutions) that enable customers to maximize customer lifetime value through a suite of industry-leading technologies. We intend to remain a leader in the use of decision management to improve customer experiences, provide better cross-sell/up-sell abilities, and aid customer retention by leveraging our flexible, Build for Change configuration capabilities.
We also offer Pega Cloud, which is our cloud computing service offering that allows customers to create and run PRPC applications using an internet-based infrastructure. This offering enables our customers to immediately build, test, and deploy their applications in a secure cloud environment while minimizing their infrastructure and hardware costs.
Our total revenue increased 27% in 2010 compared to 2009 and reflects revenue growth in each of software license, maintenance, and professional services revenue. Maintenance revenue increased 67% primarily due to the recognition of the fair value of deferred maintenance revenue acquired from Chordiant and the continued increase in the aggregate value of the installed base of our software. Due to the rapid integration of the products, sales force, and operations of Chordiant, it is no longer feasible to separately identify revenue from new arrangements as being attributable to either Chordiant or Pegasystems. However, our total revenue in 2010 includes approximately $12.1 million of maintenance revenue related to the recognition of the fair value of deferred maintenance revenue acquired from Chordiant and approximately $3.6 million of professional services revenue related to Chordiant professional services arrangements existing at the acquisition date. We incurred $5.9 million of acquisition-related expenses and $8.1 million in restructuring costs associated with our acquisition of Chordiant. In 2010, we generated approximately $18.4 million in cash from operations, which was primarily driven by our net loss as adjusted for noncash items and changes in working capital, and ended the year with $87.3 million in cash, cash equivalents, and marketable securities.
19
Table of Contents
We believe our growth and success in 2010 were due to:
| — | Increased market acceptance of our industry leading technology; |
| — | Expansion of our solutions frameworks offerings; |
| — | Disciplined and focused strategy of selling to targeted customers; |
| — | Expansion of our targeted customer list; |
| — | Development and growth of our proficiency across new industries; and |
| — | Our acquisition of Chordiant. |
We believe that the ongoing challenges for our business include our ability to drive revenue growth, expand our expertise in new and existing industries, remain a leader in the decision management market, and maintain our leadership position in the BPM market.
To support our growth and successfully address these challenges through 2011 we plan to:
| — | Invest in our research and development by significantly increasing headcount; |
| — | Hire significantly more sales and marketing professionals; |
| — | Expand our partner alliances; and |
| — | Develop and increase our solutions frameworks offerings and expertise across targeted industries. |
RESULTS OF OPERATIONS
2010 Compared to 2009
| (Dollars in thousands) | Year Ended December 31, | Increase (Decrease) | ||||||||||||||
| 2010 | 2009 | |||||||||||||||
| Total revenue |
$ | 336,599 | $ | 264,013 | $ | 72,586 | 27 | % | ||||||||
| Gross profit |
207,865 | 173,076 | 34,789 | 20 | % | |||||||||||
| Acquisition-related costs |
5,924 | - | 5,924 | n/m | ||||||||||||
| Restructuring costs |
8,064 | - | 8,064 | n/m | ||||||||||||
| Other operating expenses |
196,457 | 131,257 | 65,200 | 50 | % | |||||||||||
| Total operating expenses |
210,445 | 131,257 | 79,188 | 60 | % | |||||||||||
| (Loss) income before (benefit) provision for income taxes |
(6,197) | 47,415 | (53,612) | (113) | % | |||||||||||
n/m – not meaningful
We continue to experience demand for our software solutions and related services, which we believe is due to the strong value proposition, short implementation period, and variety of licensing models we offer our customers.
The increase in gross profit was primarily due to the increase in maintenance and license revenue.
The increase in operating expenses during 2010 was primarily due to the continued expansion of our sales force and our research and development operations. It was also due to the acquisition-related expenses and restructuring costs associated with our acquisition of Chordiant.
20
Table of Contents
The decrease in (loss) income before (benefit) provision for income taxes during 2010 compared to 2009 was primarily due to the higher growth rate in operating expenses and lower total gross profit percent in 2010. The lower total gross profit percent was due to lower software license gross profit percent in 2010 as a result of the amortization of acquired Chordiant technology intangible assets. The decrease in (loss) income before (benefit) provision for income taxes was also due to the $5.6 million foreign currency transaction loss in 2010 compared to a gain of $2.1 million in 2009.
Revenue
| (Dollars in thousands) | Year Ended December 31, |
Increase (Decrease) |
||||||||||||||||||||||
| 2010 | 2009 | |||||||||||||||||||||||
| License revenue |
||||||||||||||||||||||||
| Perpetual licenses |
$ | 79,041 | 66 | % | $ | 71,678 | 62 | % | $ | 7,363 | 10 | % | ||||||||||||
| Term licenses |
31,940 | 27 | % | 36,638 | 32 | % | (4,698 | ) | (13) | % | ||||||||||||||
| Subscription |
8,858 | 7 | % | 7,618 | 6 | % | 1,240 | 16 | % | |||||||||||||||
| Total license revenue |
$ | 119,839 | 100 | % | $ | 115,934 | 100 | % | $ | 3,905 | 3 | % | ||||||||||||
License revenue is primarily due to new license arrangements executed in the period. Through the first three quarters of 2010, the aggregate value of new license arrangements executed was lower compared to the same periods in 2009. However, we executed a record aggregate value of new license arrangements during the fourth quarter of 2010, and as a result, the aggregate value of new license arrangements executed for the year exceeded that of 2009. Consistent with our strategy to focus on follow-on sales to our targeted customers, approximately 75% of the aggregate value of new license arrangements executed during 2010 were from existing customers.
The increase in perpetual license revenue during 2010 compared to 2009 was driven by an increase in the number and value of new perpetual license arrangements. Many of our perpetual license arrangements include extended payment terms and/or additional rights of use that delay the recognition of revenue to future periods. The aggregate value of payments due under these perpetual and certain subscription licenses was $32.8 million as of December 31, 2010 compared to $57.1 million as of December 31, 2009. See the table of future cash receipts by year from perpetual and subscription licenses on page 31.
We recognize revenue for our term license arrangements over the term of the agreement as payments become due or earlier if prepaid. Our term license revenue decreased in 2010 compared to 2009 primarily due to more prepayments of term licenses by a few customers in 2009 and the expiration of one term license in 2009. While term license revenue decreased in 2010, the aggregate value of new term license arrangements executed in 2010 was significantly higher than in 2009. As a result, the aggregate value of future payments due under term licenses increased to $90.9 million as of December 31, 2010 compared to $76.3 million as of December 31, 2009 and includes approximately $30.9 million of term license payments that we expect to recognize as revenue in 2011. Our term license revenue in 2011 could be higher than $30.9 million as we complete new term license agreements in 2011 or if we receive prepayments from existing term license agreements. See the table of future cash receipts by year from these term licenses on page 31.
A change in the mix between perpetual and term license arrangements executed, which varies based on customer needs, can cause our revenues to vary materially quarter to quarter.
21
Table of Contents
Subscription revenue primarily relates to our arrangements that include a right to unspecified future products and is recognized ratably over the term of the arrangement. The increase in subscription revenue during 2010 compared to 2009 was due to a new customer arrangement that began in the third quarter of 2009 and continued through all of 2010. The timing of scheduled payments under customer arrangements and a change in a customer’s selection of a renewal option can cause our subscription revenue to vary quarter to quarter.
| (Dollars in thousands) | Year Ended December 31, | Increase | ||||||||||||||
| 2010 | 2009 | |||||||||||||||
| Maintenance revenue |
||||||||||||||||
| Maintenance |
$ | 83,878 | $ | 50,099 | $ | 33,779 | 67 | % | ||||||||
The increase in maintenance revenue during 2010 compared to 2009 was primarily due to the $12.1 million in maintenance revenue attributable to the recognition of the fair value of deferred maintenance revenue acquired from Chordiant and the continued increase in the aggregate value of the installed base of our software.
| (Dollars in thousands) | Year Ended December 31, | Increase | ||||||||||||||||||||||
| 2010 | 2009 | |||||||||||||||||||||||
| Professional services revenue |
||||||||||||||||||||||||
| Consulting services |
$ | 126,283 | 95 | % | $ | 93,910 | 96 | % | $ | 32,373 | 34 | % | ||||||||||||
| Training |
6,599 | 5 | % | 4,070 | 4 | % | 2,529 | 62 | % | |||||||||||||||
| Total Professional services |
$ | 132,882 | 100 | % | $ | 97,980 | 100 | % | $ | 34,902 | 36 | % | ||||||||||||
Professional services are primarily consulting services related to new license implementations. The increase in consulting services and training revenue during 2010 compared to 2009 was primarily due to a higher demand for these services in North America associated with new license arrangements executed in the later part of 2009 and includes approximately $3.6 million of revenue associated with professional services arrangements existing at the acquisition date of Chordiant.
| (Dollars in thousands) | Year Ended December 31, | Increase | ||||||||||||||
| 2010 | 2009 | |||||||||||||||
| Gross Profit |
||||||||||||||||
| Software license |
$ | 115,536 | $ | 115,813 | $ | (277 | ) | n/m | ||||||||
| Maintenance |
72,837 | 43,896 | 28,941 | 66 | % | |||||||||||
| Professional services |
19,492 | 13,367 | 6,125 | 46 | % | |||||||||||
| Total gross profit |
$ | 207,865 | $ | 173,076 | $ | 34,789 | 20 | % | ||||||||
| Total gross profit percent |
62 | % | 66 | % | ||||||||||||
| Software license gross profit percent |
96 | % | 100 | % | ||||||||||||
| Maintenance gross profit percent |
87 | % | 88 | % | ||||||||||||
| Professional services gross profit percent |
15 | % | 14 | % | ||||||||||||
n/m – not meaningful
The decrease in software license gross profit percent during 2010 compared to 2009 was due to the amortization of acquired technology intangibles related to Chordiant.
22
Table of Contents
Gross profit percent for maintenance and professional services during 2010 were relatively unchanged compared to 2009.
| (Dollars in thousands) |
Year Ended December 31, |
Increase | ||||||||||||||
| 2010 | 2009 | |||||||||||||||
| Amortization of intangibles: |
||||||||||||||||
| Cost of software license |
$ | 4,231 | $ | 121 | $ | 4,110 | n/m | |||||||||
| Selling and marketing |
3,285 | - | 3,285 | n/m | ||||||||||||
| General and administrative |
185 | 20 | 165 | n/m | ||||||||||||
| $ | 7,701 | $ | 141 | $ | 7,560 | n/m | ||||||||||
n/m – not meaningful
The increase in amortization expense during 2010 compared to 2009 was due to the amortization associated with $88 million of acquired intangible assets recognized as a result of the purchase price allocation of Chordiant. The identifiable intangible assets are expected to be amortized over a weighted-average period of 8.4 years on a straight-line basis.
Operating expenses
| (Dollars in thousands) |
Year Ended December 31, |
Increase | ||||||||||||||
| 2010 | 2009 | |||||||||||||||
| Selling and marketing |
||||||||||||||||
| Selling and marketing |
$ | 116,230 | $ | 74,378 | $ | 41,852 | 56 | % | ||||||||
| As a percent of total revenue |
35 | % | 28 | % | ||||||||||||
| Selling and marketing headcount |
377 | 253 | 124 | 49 | % | |||||||||||
Selling and marketing expenses include compensation, benefits, and other headcount-related expenses associated with our selling and marketing personnel as well as expenses for advertising, promotions, trade shows, seminars, and other programs. Selling and marketing expenses also include the amortization of customer related intangibles.
We significantly increased sales hiring in the first half of 2010 in order to target new accounts across expanded geographies and to create additional sales capacity for future periods. The increase in selling and marketing expenses was primarily due to a $23.3 million increase in compensation and benefit expenses associated with higher headcount, a $3.3 million increase in amortization expense related to the acquired Chordiant customer related intangibles, a $3.9 million increase in travel expenses, a $3.2 million increase in expenses related to marketing programs, including our 2010 PegaWorld user conference. We did not host a PegaWorld conference in 2009. The increase was also due to a $1.0 million increase in contractor services, a $1.0 million increase in telecom expenses, a $0.5 million increase in training expenses and a $0.3 million increase in agency and recruiting expenses.
| (Dollars in thousands) |
Year Ended December 31, |
Increase | ||||||||||||||
| 2010 | 2009 | |||||||||||||||
| Research and development |
||||||||||||||||
| Research and development |
$ | 55,193 | $ | 38,862 | $ | 16,331 | 42 | % | ||||||||
| As a percent of total revenue |
16 | % | 15 | % | ||||||||||||
| Research and development headcount |
397 | 222 | 175 | 79 | % | |||||||||||
Research and development expenses include compensation, benefits, contracted services, and other headcount-related expenses associated with research and development. The increase in headcount reflects growth in our Indian research facility as well as new employees from the Chordiant acquisition. The increase in offshore headcount lowered our average compensation expense per employee.
23
Table of Contents
The increase in research and development expenses during 2010 compared to 2009 was due to an $11.0 million increase in compensation and benefit expenses associated with higher headcount, a $1.4 million increase in engineering contractor expenses, a $0.6 million increase in travel expenses, and a $0.5 million increase in depreciation and equipment related expenses.
| (Dollars in thousands) |
Year Ended December 31, |
Increase | ||||||||||||||
| 2010 | 2009 | |||||||||||||||
| General and administrative |
||||||||||||||||
| General and administrative |
$ | 25,034 | $ | 18,017 | $ | 7,017 | 39 | % | ||||||||
| As a percent of total revenue |
7 | % | 7 | % | ||||||||||||
| General and administrative headcount |
180 | 144 | 36 | 25 | % | |||||||||||
General and administrative expenses include compensation, benefits, and other headcount-related expenses associated with the finance, legal, corporate governance, and other administrative headcount. It also includes accounting, legal, and other professional consulting, and administrative fees. The general and administrative headcount includes employees in human resources, information technology and corporate services departments whose costs are allocated to the rest of our functional departments.
The general and administrative expenses during 2010 include $1.1 million of compensation and benefit expenses for Chordiant employees who were in transitional roles that ended by the end of the third quarter of 2010.
The increase in general and administrative expenses during 2010 compared to 2009 was primarily due to a $2.2 million increase in compensation and benefit expenses associated with higher headcount, a $1.3 million increase in contractor expenses, a $1.2 million increase in professional fees, and a $1.2 million increase in our non-income tax reserves.
Acquisition-related costs
Acquisition-related costs are expensed as incurred and include direct and incremental costs associated with an impending or completed acquisition. During 2010, we incurred $5.9 million of acquisition-related costs associated with the Chordiant acquisition. These costs consisted of approximately $3.1 million of due diligence costs and advisory and legal transaction fees, approximately $0.8 million of valuation and tax consulting fees, approximately $1.6 million of legal costs associated with acquired litigation, and approximately $0.4 million of integration and other expenses.
Restructuring costs
Restructuring costs included approximately $6.5 million of severance and related benefit costs recognized during the second and third quarters of 2010 for the reduction of approximately 50 personnel as a result of the integration of Chordiant. These personnel were in redundant roles, primarily in general and administrative functions.
In connection with our evaluation of our combined facilities, we approved a plan to eliminate one redundant facility. We ceased use of this space during the fourth quarter of 2010 and recorded approximately $1.6 million of restructuring expenses, consisting of future lease payments and demising costs, net of estimated sublease income for this space.
Stock-based compensation
We recognize stock-based compensation expense associated with equity awards in our consolidated statements of operations based on the fair value of these awards at the date of grant.
24
Table of Contents
| (Dollars in thousands) | Year Ended December 31, | Increase | ||||||||||||||
| 2010 | 2009 | |||||||||||||||
| Stock-based compensation: |
||||||||||||||||
| Cost of services |
$ | 1,825 | $ | 1,096 | $ | 729 | 67 | % | ||||||||
| Operating expenses |
4,920 | 3,577 | 1,343 | 38 | % | |||||||||||
| Total stock-based compensation before tax |
6,745 | 4,673 | $ | 2,072 | 44 | % | ||||||||||
| Income tax benefit |
(2,185 | ) | (1,688 | ) | ||||||||||||
The increase in stock-based compensation expense in 2010 compared to 2009 was primarily due to an increase in the number of employees electing to receive 50% of their corporate incentive compensation plan (“CICP”) in RSUs and in the number of new hire stock-based grants. As of December 31, 2010, we had approximately $9.5 million of unrecognized stock-based compensation expense, net of estimated forfeitures, related to the unvested portion of our equity awards that is expected to be recognized over a weighted-average period of approximately 2.3 years. See Note 13 “Stock-Based Compensation” in the notes to the accompanying audited consolidated financial statements for further information on our stock-based awards.
Non-operating income and (expenses), net
| (Dollars in thousands) | Year Ended December 31, | Change | ||||||||||||||
| 2010 | 2009 | |||||||||||||||
| Foreign currency transaction (loss) gain |
$ | (5,569 | ) | $ | 2,083 | $ | (7,652 | ) | n/m | |||||||
| Interest income, net |
883 | 3,144 | (2,261 | ) | (72 | )% | ||||||||||
| Installment receivable interest income |
255 | 347 | (92 | ) | (27 | )% | ||||||||||
| Other income, net |
814 | 22 | 792 | n/m | ||||||||||||
| $ | (3,617 | ) | $ | 5,596 | $ | (9,213 | ) | n/m | ||||||||
n/m – not meaningful
Foreign currency transaction losses in 2010 compared to gains in 2009 were due to the significant decrease in the value of the British pound and the Euro relative to the U.S. dollar and the higher total amount of foreign currency denominated net assets held in the U.S. during 2010, consisting primarily of cash and receivables. As a result of our acquisition of Chordiant, we expanded our international operations. We hold U.S. dollars in these foreign operations whose functional currency is the Euro, which partially offsets our exposure to foreign currency transaction losses related to foreign currencies held by our U.S. operating company. See Item 7A. “Quantitative and Qualitative Disclosure about Market Risk” for further discussion of our foreign currency exchange risk.
The decrease in interest income during 2010 compared to 2009 was due to the sale of our marketable securities we used to pay for the Chordiant acquisition.
Other income during 2010 includes a $0.6 million realized gain on the sale of shares of a closely-held private company.
(Benefit) provision for income taxes
The (benefit) provision for income taxes represents current and future amounts owed for federal, state, and foreign taxes. During 2010 and 2009, we recorded a $0.3 million benefit and a $15.2 million provision, respectively, which resulted in an effective tax rate of (4.9%) and 32.1%, respectively.
During 2010, we recorded a valuation allowance against state credits and a discrete item related to the nondeductible portion of acquisition-related costs we incurred during 2010, which reduced our tax benefit by
25
Table of Contents
approximately $2.3 million and $0.7 million, respectively. The consolidation of Chordiant’s operations had a significant impact on our consolidated state apportionment factors. As a result of this change, we recorded a valuation allowance against certain state credits.
Our effective income tax rate for 2009 was below the statutory federal income tax rate due to a $0.8 million benefit related to the current period domestic operating activities, a $0.9 million benefit from tax-exempt income, and a $0.8 million reduction in the Company’s reserve for uncertain tax positions related to the settlement of the Company’s income tax audit with the United Kingdom government and tax positions of prior years for which the statute of limitations had expired. These benefits were partially offset by $0.4 million of permanent differences, primarily related to nondeductible meals and entertainment expenses.
As of December 31, 2010, unrecognized tax benefits totaled approximately $20.3 million, all of which if recognized, would decrease our effective tax rate. However, approximately $11.1 million of these unrecognized tax benefits relate to acquired net operating losses (“NOLs”) and research tax credits, which if recognized, would be subject to limitations on use. We expect that the changes in the unrecognized benefits within the next twelve months will be approximately $2 million and would reduce our effective tax rate.
2009 Compared to 2008
| (Dollars in thousands) | Year Ended December 31, | Increase | ||||||||||||||
| 2009 | 2008 | |||||||||||||||
| Total revenue |
$ | 264,013 | $ | 211,647 | $ | 52,366 | 25 | % | ||||||||
| Gross profit |
173,076 | 129,890 | 43,186 | 33 | % | |||||||||||
| Total operating expenses |
131,257 | 115,411 | 15,846 | 14 | % | |||||||||||
| Income before provision for income taxes |
47,415 | 15,672 | 31,743 | 203 | % | |||||||||||
The increase in our total revenue during 2009 compared to 2008 was attributable to an increase in the demand for our software products due to growth in the BPM sector and our position as leader in that sector.
The increase in gross profit was primarily due to the increase in license revenue and to a lesser extent due to the increase in maintenance revenue, partially offset by a decrease in our professional services gross profit. The increase in income before provision for income taxes during 2009 compared to 2008 was primarily due to our license and maintenance revenue growing at a faster rate than our operating expenses. These increases in revenue offset the higher expenses associated with our continued investment in research and development, expanding our sales and marketing personnel, and our professional services infrastructure. During 2008, due to credit market turmoil and adverse changes in the economy, we changed the mix of our investment portfolio to increase our holdings of tax-exempt pre-refunded municipal bonds, which resulted in $1.9 million of lower interest income in 2009 compared to 2008. Our income before provision for income taxes in 2009 was positively impacted by $2.1 million of foreign currency transaction gains.
Revenue
| (Dollars in thousands) | Year Ended December 31, | Increase | ||||||||||||||||||||||
| 2009 | 2008 | |||||||||||||||||||||||
| License revenue |
||||||||||||||||||||||||
| Perpetual licenses |
$ | 71,678 | 62 | % | $ | 46,667 | 61 | % | $ | 25,011 | 54 | % | ||||||||||||
| Term licenses |
36,638 | 32 | % | 25,611 | 33 | % | 11,027 | 43 | % | |||||||||||||||
| Subscription |
7,618 | 6 | % | 4,294 | 6 | % | 3,324 | 77 | % | |||||||||||||||
| Total license revenue |
$ | 115,934 | 100 | % | $ | 76,572 | 100 | % | $ | 39,362 | 51 | % | ||||||||||||
The mix between perpetual and term license arrangements fluctuates based on customer circumstances. The increase in perpetual license revenue during 2009 compared to 2008 was driven by increases in the number
26
Table of Contents
of perpetual licenses. We generated the majority of our license revenue in 2009 from follow-on sales to existing customers. Many of the perpetual license arrangements include extended payment terms and/or additional rights of use that delay the recognition of revenue to future periods. The aggregate value of payments due under these perpetual and certain subscription licenses was $57.1 million as of December 31, 2009 compared to $30.3 million as of December 31, 2008.
The increase in term license revenue during 2009 compared to 2008 was primarily due to significant prepayments of certain term licenses. In addition, the increase in term license revenue in 2009 compared to 2008 was due to the increase in the aggregate value of payments for non-cancellable term licenses signed during 2009, 2008, and 2007 for which a portion of the revenue was recognized in 2009. The remainder of the revenue under these agreements will be recognized in future periods. The aggregate value of future payments due under these term licenses decreased to $76.3 million as of December 31, 2009 compared to $88.5 million as of December 31, 2008 primarily due to the higher proportion of new perpetual licenses arrangements in 2009 and due to significant prepayments in 2009.
The increase in subscription revenue during 2009 compared 2008 was primarily due to a new customer arrangement.
| (Dollars in thousands) | Year Ended December 31, | Increase | ||||||||||||||
| 2009 | 2008 | |||||||||||||||
| Maintenance revenue |
||||||||||||||||
| Maintenance |
$ | 50,099 | $ | 40,115 | $ | 9,984 | 25 | % | ||||||||
The increase in maintenance revenue in 2009 compared to 2008 was primarily due to the continued increase in the installed base of our software and to a lesser extent due to fees paid by a customer to reinstate maintenance.
| (Dollars in thousands) | Year Ended December 31, | Increase (Decrease) |
||||||||||||||||||||||
| 2009 | 2008 | |||||||||||||||||||||||
| Professional services revenue |
||||||||||||||||||||||||
| Consulting services |
$ | 93,910 | 96 | % | $ | 89,842 | 95 | % | $ | 4,068 | 5 | % | ||||||||||||
| Training |
4,070 | 4 | % | 5,118 | 5 | % | (1,048 | ) | (20 | )% | ||||||||||||||
| Total Professional services |
$ | 97,980 | 100 | % | $ | 94,960 | 100 | % | $ | 3,020 | 3 | % | ||||||||||||
Professional services are primarily consulting services related to new license implementations. While we continue to experience demand for these services as the number of our new license arrangements increases, our professional services revenue was negatively impacted by pricing pressures associated with a weaker global economy and the decline in the value of the European currencies relative to the U.S. dollar during 2009 compared to 2008.
| (Dollars in thousands) | Year Ended December 31, | Increase (Decrease) |
||||||||||||||
| 2009 | 2008 | |||||||||||||||
| Gross Profit |
||||||||||||||||
| Software license |
$ | 115,813 | $ | 76,477 | $ | 39,336 | 51 | % | ||||||||
| Maintenance |
43,896 | 34,725 | 9,171 | 26 | % | |||||||||||
| Professional services |
13,367 | 18,688 | (5,321 | ) | (28 | )% | ||||||||||
| Total gross profit |
$ | 173,076 | $ | 129,890 | $ | 43,186 | 33 | % | ||||||||
| Maintenance gross margin |
88 | % | 87 | % | ||||||||||||
| Professional services gross margin |
14 | % | 20 | % | ||||||||||||
27
Table of Contents
Professional services gross profit during 2009 compared to 2008 was adversely impacted by lower realization rates globally due to the challenging economic conditions. In addition, the direct costs associated with the professional services bundled with a license arrangement recognized on a subscription basis were recorded in the third quarter of 2009, but the related revenue will be recognized over the subscription period. The bundled professional services for this arrangement were completed during the third quarter of 2009.
In addition, during the second half of 2009, a significant number of our professional services consultants completed our enhanced training curriculum to achieve the master level of PRPC certification, which resulted in lower billable hours and an increased use of contractors.
Operating expenses
| (Dollars in thousands) | Year Ended December 31, | Increase | ||||||||||||||
| 2009 | 2008 | |||||||||||||||
| Selling and marketing |
||||||||||||||||
| Selling and marketing |
$ | 74,378 | $ | 63,799 | $ | 10,579 | 17 | % | ||||||||
| As a percent of total revenue |
28 | % | 30 | % | ||||||||||||
| Selling and marketing headcount |
253 | 190 | 63 | 33 | % | |||||||||||
The increase in selling and marketing expenses was primarily due to a $6.0 million increase in compensation and benefit expenses associated with higher headcount, as well as $4.4 million higher sales commissions in 2009 compared to 2008, mainly due to an increase in the value of our new license arrangements in 2009 compared to 2008. Selling and marketing expenses also increased due to a $0.5 million increase in contractor expenses and a $0.2 million increase in marketing campaign expenses, partially offset by a $0.5 million decrease in employment agency fees.
| (Dollars in thousands) | Year Ended December 31, | Increase | ||||||||||||||
| 2009 | 2008 | |||||||||||||||
| Research and development |
||||||||||||||||
| Research and development |
$ | 38,862 | $ | 31,472 | $ | 7,390 | 23 | % | ||||||||
| As a percent of total revenue |
15 | % | 15 | % | ||||||||||||
| Research and development headcount |
222 | 162 | 60 | 37 | % | |||||||||||
During the first three quarters of 2008, our research and development center in India was not operational and therefore associated start-up expenses were classified as general and administrative expenses. Subsequent to becoming operational in October 2008, all expenses associated with our development center are classified as research and development. The change in classification of these expenses resulted in a $2.1 million increase in research and development expenses during 2009 compared to 2008.
The increase in research and development expenses during 2009 compared to 2008 was also due to a $4.1 million increase in compensation and benefit expenses associated with higher headcount, a $0.6 million increase in depreciation expense, and a $0.4 million increase in contractor expenses.
| (Dollars in thousands) | Year Ended December 31, | Increase (Decrease) |
||||||||||||||
| 2009 | 2008 | |||||||||||||||
| General and administrative |
||||||||||||||||
| General and administrative |
$ | 18,017 | $ | 20,140 | $ | (2,123) | (11 | )% | ||||||||
| As a percent of total revenue |
7 | % | 10 | % | ||||||||||||
| General and administrative headcount |
144 | 129 | 15 | 12 | % | |||||||||||
During 2009 compared to 2008, the change in classification of the expenses related to the research and development center in India resulted in a $2.1 million decrease in general and administrative. In addition, general and administrative expenses decreased by $1.0 million due to a reduction in our reserves for non-income related
28
Table of Contents
taxes. These decreases in general and administrative expenses were partially offset by a $1.6 million increase in compensation and benefit expenses and a $1.5 million increase in contractor expenses.
Stock-based compensation
The following table summarizes stock-based compensation expense included in our consolidated statements of operations in 2009 and 2008:
| (Dollars in thousands) | Year Ended December 31, | Increase | ||||||||||||||
| 2009 | 2008 | |||||||||||||||
| Stock-based compensation expense: |
||||||||||||||||
| Cost of services |
$ | 1,096 | $ | 995 | $ | 101 | 10 | % | ||||||||
| Operating expenses |
3,577 | 2,537 | 1,040 | 41 | % | |||||||||||
| Total stock-based compensation before tax |
4,673 | 3,532 | $ | 1,141 | 32 | % | ||||||||||
| Income tax benefit |
(1,688 | ) | (1,090 | ) | ||||||||||||
The increase in stock-based compensation expense in 2009 compared to 2008 was primarily due to our periodic stock option grant in December 2008 and new hire stock option grants, partially offset by a decrease in our stock-based compensation as a result of our refining our forfeiture estimate in the second quarter of 2009. As of December 31, 2009, we had approximately $6.7 million of unrecognized stock-based compensation expense related to the unvested portion of all our stock options and RSUs that is expected to be recognized over a weighted-average period of approximately 2.4 years. See Note 13 “Stock-Based Compensation” in the notes to the accompanying audited consolidated financial statements for further information on our stock-based awards.
| (Dollars in thousands) | Year Ended December 31, | Increase (Decrease) |
||||||||||||||
| 2009 | 2008 | |||||||||||||||
| Interest income, Other income and Income taxes |
||||||||||||||||
| Interest income, net |
$ | 3,144 | $ | 5,029 | $ | (1,885 | ) | (37 | )% | |||||||
| Foreign currency transaction gain (loss) |
2,083 | (4,537 | ) | 6,620 | 146 | % | ||||||||||
| Installment receivable interest income |
347 | 597 | (250 | ) | (42 | )% | ||||||||||
| Other income, net |
22 | 104 | (82 | ) | (79 | )% | ||||||||||
| Interest income and other |
$ | 5,596 | $ | 1,193 | $ | 4,403 | 369 | % | ||||||||
The decrease in interest income in 2009 compared to 2008 was primarily due to our investment in lower yielding tax-exempt municipal bonds. During 2008, due to credit market turmoil and adverse changes in the economy, we changed the mix of our investment portfolio to increase our holdings of pre-refunded municipal bonds. These bonds are collateralized by the issuer purchasing U.S. Treasury securities to fund all the cash flows of the refunded municipal bonds that will mature when the issuer’s bond matures.
The increase in foreign currency transaction gains resulted primarily from the increase in the value of foreign currency denominated net assets held in the U.S., consisting primarily of cash, receivables, license installments and accounts payable. As a result of the significant increase in the value of the British pound and Euro relative to the U.S. dollar during 2009, we recorded a $2.1 million foreign currency exchange transaction gain as compared to a $4.5 million foreign exchange transaction loss in 2008.
Provision for income taxes
During 2009 and 2008, we recorded a $15.2 million and $4.7 million provision, respectively, which resulted in an effective tax rate of 32% and 30%, respectively.
Our effective income tax rate for 2009 was below the statutory federal income tax rate due to a $0.8 million benefit related to the current period domestic production activities, a $0.9 million benefit from
29
Table of Contents
tax-exempt income, and a $0.8 million reduction in the Company’s reserve for uncertain tax positions related to the settlement of the Company’s income tax audit with United Kingdom government and tax positions of prior years for which the statute of limitations has expired, all of which reduced the Company’s effective tax rate. These benefits were partially offset by $0.4 million of permanent differences, primarily related to nondeductible meals and entertainment expenses.
Our effective income tax rate for 2008 was below the statutory federal income tax rate due to a $0.5 million benefit related to the current period domestic production activities, approximately $0.8 million of estimated federal income tax credits, and a $0.6 million benefit from tax-exempt income. These benefits were partially offset by an increase in the Company’s reserve for uncertain tax positions of $1.3 million, the majority of which is related to the state tax credits, and permanent differences of $0.4 million primarily related to nondeductible meals and entertainment expenses.
As of December 31, 2009, the amount of unrecognized tax benefits totaled approximately $4.4 million, all of which if recognized, would decrease our effective tax rate.
LIQUIDITY AND CAPITAL RESOURCES
| (in thousands) | Year Ended December 31, | |||||||||||
| 2010 | 2009 | 2008 | ||||||||||
| Cash provided by (used in): |
||||||||||||
| Operating activities |
$ | 18,414 | $ | 49,581 | $ | 38,399 | ||||||
| Investing activities |
6,841 | (18,163 | ) | (13,764 | ) | |||||||
| Financing activities |
(13,251 | ) | (5,049 | ) | (13,354 | ) | ||||||
| Effect of exchange rate on cash |
(4,734 | ) | 1,401 | (1,904 | ) | |||||||
| Net increase in cash and cash equivalents |
$ | 7,270 | $ | 27,770 | $ | 9,377 | ||||||
| As of December 31, | ||||||||||||
| 2010 | 2009 | 2008 | ||||||||||
| Total cash, cash equivalents, and marketable securities |
$ | 87,251 | $ | 202,653 | $ | 167,229 | ||||||
We have funded our operations primarily from cash provided by operations and we expect to continue funding our operations in this manner in 2011.
The decrease in cash, cash equivalents, and marketable securities in 2010 compared to 2009 was primarily due to our acquisition of Chordiant, for which we paid $109.2 million in cash, net of approximately $47.6 million of cash acquired. The increase in cash, cash equivalents, and marketable securities in 2009 as compared to 2008 was primarily due to $49.6 million of cash provided by operations offset by $20.9 million in repurchases of our common stock and $4.3 million in dividend payments to our shareholders. Working capital was $71.9 million as of December 31, 2010 compared to $188.6 million as of December 31, 2009.
In connection with our integration plan of Chordiant and the reduction of approximately 50 employees, we paid approximately $3.7 million in severance and related benefit costs during the 2010. We will pay an additional $2.8 million in severance and related benefit costs through the second half of 2012, of which $2.5 million will be paid in 2011. In connection with our elimination of space within one facility, we expect to pay approximately $2.1 million in lease payments and demising costs, net of estimated sublease income, of which approximately $1.2 million will be paid in 2011.
We believe that our current cash, cash equivalents, marketable securities, and cash from operations in 2011 will be sufficient to fund our operations and our share repurchase program for at least the next 12 months. We also evaluate acquisition opportunities from time to time, which if pursued, could require use of our funds.
30
Table of Contents
Approximately $30.1 million of our total cash and cash equivalents is held in our foreign subsidiaries. If it became necessary to repatriate these funds, we may be required to pay U.S. tax, net of any applicable foreign tax credits, upon repatriation. There can be no assurance that changes in our plans or other events affecting our operations will not result in materially accelerated or unexpected expenditures.
Cash provided by operating activities
The $31.2 million decrease in cash provided by operating activities in 2010 compared to 2009 was primarily due to the decrease in our net income and the $23.9 million increase in accounts receivable. The primary components of cash provided by operations during 2009 was $32.2 million of net income, a $16.3 million increase in accounts payable and accrued expenses due to the timing of payments, and a $5.1 million decrease in license installments for term license arrangements with extended payment terms.
Future Cash Receipts from License Arrangements
The following table summarizes the cash receipts due in connection with our existing license agreements:
| As of December 31, (in thousands) |
Installment payments for licenses recorded on the balance sheet (1) |
Installment payments for term licenses not recorded on the balance sheet (2) |
Other license payments not recorded on the balance sheet (3) |
|||||||||
| 2011 |
$ | 2,258 | $ | 30,920 | $ | 21,480 | ||||||
| 2012 |
1,318 | 25,818 | 9,915 | |||||||||
| 2013 |
- | 17,507 | 633 | |||||||||
| 2014 |
- | 8,413 | 724 | |||||||||
| 2015 |
- | 6,650 | - | |||||||||
| Thereafter |
- | 1,622 | - | |||||||||
| Total |
3,576 | $ | 90,930 | $ | 32,752 | |||||||
| Unearned installment interest income |
(95 | ) | ||||||||||
| Total license installments receivable, |
$ | 3,481 | ||||||||||
| (1) | These license installment payments have already been recognized as license revenue and are included in short and long-term license installments in the accompanying audited consolidated balance sheet as of December 31, 2010. |
| (2) | These amounts will be recognized as revenue in the future over the term of the agreement as payments become due or earlier if prepaid. |
| (3) | These amounts will be recognized as revenue in future periods and relate to perpetual and subscription licenses with extended payment terms and/or additional rights of use. |
Cash provided by (used in) investing activities
During the first quarter of 2010, we sold our marketable securities to pay for the Chordiant acquisition. During the second quarter of 2010, we paid $109.2 million, net of cash acquired, to complete the Chordiant acquisition. During 2010, we invested $3.6 million in computer equipment, leasehold improvements and furniture and fixtures primarily for our Cambridge location and $1.2 million in capitalized software primarily related to our implementation of an accounting system.
31
Table of Contents
During 2009, cash used in investing activities was primarily for purchases of marketable debt securities of $79.4 million, partially offset by the proceeds received from the sales, maturities and called marketable debt securities of $67.3 million.
During 2008, we paid approximately $0.8 million in cash to acquire certain assets of privately held Focus Technology Group, Inc. and a related entity (collectively, “Focus”). In September 2009, the parties to the original Focus asset purchase agreement entered into an amendment of that agreement such that $1.8 million of the original potential contingent consideration was forfeited and $0.3 million of the contingent consideration was earned and paid in January 2010.
Cash used in financing activities
Net cash used in financing activities during 2010, 2009, and 2008 was primarily for repurchases of our common stock and the payment of our quarterly dividend. Since 2004, our Board of Directors has approved annual stock repurchase programs that have authorized the repurchase up to $80.8 million of our common stock. Purchases under these programs have been made on the open market.
Common stock repurchases
The following table is a summary of our repurchase activity under all of our stock repurchase programs during 2010, 2009, and 2008:
| (Dollars in thousands) | 2010 | 2009 | 2008 | |||||||||||||||||||||
| Shares | Amount | Shares | Amount | Shares | Amount | |||||||||||||||||||
| Prior year authorizations at January 1, |
$ | 15,779 | $ | 12,862 | $ | 1,210 | ||||||||||||||||||
| Authorizations |
5,750 | 15,000 | 30,000 | |||||||||||||||||||||
| Repurchases paid |
294,059 | (8,272 | ) | 673,066 | (11,947 | ) | 1,503,551 | (17,969 | ) | |||||||||||||||
| Repurchases unsettled |
538 | (20 | ) | 3,898 | (136 | ) | 32,376 | (379 | ) | |||||||||||||||
| Authorized dollars remaining as of December 31, |
$ | 13,237 | $ | 15,779 | $ | 12,862 | ||||||||||||||||||
In addition to the share repurchases made under our repurchase programs, we net settled the majority of our employee stock options exercised and RSUs vested. During 2010 and 2009, equity holders net settled their equity awards representing the right to purchase a total of 889,000 shares and 2,451,000 shares, respectively, of which only 493,000 shares and 1,188,000 shares, respectively, were issued. The balance of the shares was surrendered to us to pay for the exercise price and the applicable taxes. During 2010 and 2009, instead of receiving cash from these equity holders, we withheld shares with a value of $7.0 million and $8.6 million, respectively, for payment of taxes, and $6.7 million and $22.3 million, respectively, for payment of the exercise price. The value of share repurchases and shares withheld for net settlement of our employee stock option exercises and vesting of RSUs offset the proceeds received under our various share-based compensation plans during 2010, 2009, and 2008.
Dividends
We declared a cash dividend of $0.12 per share for each of the years ended December 31, 2010, 2009, and 2008 and paid cash dividends of $4.4 million, $4.3 million, and $4.4 million, in 2010, 2009, and 2008, respectively. It is our current intention to pay a quarterly cash dividend of $0.03 per share to shareholders of record as of the first trading day of each quarter, however, the Board of Directors may terminate or modify this dividend program at any time without notice.
32
Table of Contents
Contractual obligations
As of December 31, 2010, we had material purchase obligations for customer support and consulting services and payments under operating leases. Our principal administrative, sales, marketing, support, and research and development operations are located in approximately 105,000 square foot leased facility in Cambridge, Massachusetts. The lease for this facility expires in 2013, subject to our option to extend for two additional five-year periods.
We also lease space for our other offices under non-cancelable leases that expire at various dates through 2020. Rent expense under operating leases is recognized on a straight-line basis to account for scheduled rent increases. The excess of expense over current payments is recorded as deferred rent and included in accrued expenses and other long-term liabilities.
As of December 31, 2010, our known contractual obligations, including future minimum rental payments required under operating leases with non-cancelable terms in excess of one year were as follows:
| Payment due by period | ||||||||||||||||||||||||
| Contractual obligations: (in thousands) |
Total | 2011 | 2012 & 2013 |
2014 & 2015 |
2016 & Thereafter |
Other | ||||||||||||||||||
| Purchase obligations (1) |
$ | 1,288 | $ | 1,288 | $ | — | $ | — | $ | — | $ | — | ||||||||||||
| Liability for uncertain tax positions (2) |
5,434 | — | — | — | — | 5,434 | ||||||||||||||||||
| Operating lease obligations (3) |
26,564 | 7,542 | 11,197 | 2,480 | 5,345 | — | ||||||||||||||||||
| Total |
$ | 33,286 | $ | 8,830 | $ | 11,197 | $ | 2,480 | $ | 5,345 | $ | 5,434 | ||||||||||||
| (1) | Represents the fixed or minimum amounts due under purchase obligations for customer support and consulting services. |
| (2) | As of December 31, 2010, our recorded liability for uncertain tax positions was approximately $5.4 million. We are unable to reasonably estimate the timing of the cash outflow due to uncertainties in the timing of the effective settlement of tax positions. |
| (3) | Includes deferred rent of approximately $1.3 million included in accrued expenses and approximately $1.1 million in other long-term liabilities in the accompanying audited consolidated balance sheet as of December 31, 2010. |
CRITICAL ACCOUNTING POLICIES, SIGNIFICANT JUDGMENTS AND ESTIMATES
Management’s discussion and analysis of the financial condition and results of operations is based upon our consolidated financial statements, which have been prepared in accordance with accounting principles generally accepted in the U.S. and the rules and regulations of the SEC for annual financial reporting. The preparation of these financial statements requires us to make estimates and judgments that affect the reported amounts of assets, liabilities, revenues and expenses, and related disclosure of contingent assets and liabilities. We base our estimates and judgments on historical experience, knowledge of current conditions and beliefs of what could occur in the future given available information. We consider the following accounting policies to be both those most important to the portrayal of our financial condition and those that require the most subjective judgment. If actual results differ significantly from management’s estimates and projections, there could be a material effect on our financial statements.
Revenue recognition
Our revenue is derived from software licenses, maintenance fees related to our software licenses, and professional services. Our license arrangements, whether involving a perpetual license or a term license,
33
Table of Contents
generally contain multiple elements, including professional consulting services, training, and software maintenance services.
Software revenue recognition requires judgment, including whether a software arrangement includes multiple elements, and if so, whether vendor-specific objective evidence (“VSOE”) of fair value exists for those elements. The amount of revenue allocated to undelivered elements is based on the VSOE of fair value for those elements and recognized as those elements are delivered. Any remaining portion of the total arrangement fee is then allocated to the software license, the delivered element. Revenue is recognized for each element when all of the revenue recognition criteria have been met.
Changes in the mix of the elements in a software arrangement, the ability to identify VSOE for those elements, the fair value of the respective elements, and changes to a product’s estimated life cycle could materially impact the amount of earned and unearned revenue.
Before we can recognize revenue, the following four basic criteria must be met:
• Persuasive evidence of an arrangement—As evidence of the existence of an arrangement, we use a contract signed by the customer for software licenses and a statement of work for professional services.
• Delivery of product—Software is delivered electronically or shipped via disk media.
• Fee is fixed or determinable—We assess whether a fee is fixed or determinable at the outset of the arrangement. In addition, we assess whether contract modifications to an existing term arrangement constitute a concession. Our software license agreements do not include a right of return.
• Collection of fee is probable—We assess the probability of collecting from each customer at the outset of the arrangement based on a number of factors, including the customer’s payment history, its current creditworthiness, economic conditions in the customer’s industry and geographic location, and general economic conditions. If in our judgment collection of a fee is not probable, revenue is recognized as cash is collected, provided all other conditions for revenue recognition have been met.
Software license revenues
Perpetual software license fees are recognized as revenue when the software is delivered, any acceptance required by contract that is not perfunctory is obtained, no significant obligations or contingencies exist related to the software other than maintenance support, and all other revenue recognition criteria are met.
Term software license fees are generally payable on a monthly basis under license agreements that typically have a three to five-year term and may be renewed for additional terms at the customer’s option.
As a result of our focus on frequent sales to our targeted customers, our strategy to sell initial term licensing agreements to those customers with the goal to generate follow-on sales, and as a result of extended payment terms, we recognize term license revenue over the term of the agreement as payments become due or earlier if prepaid, provided all other criteria for revenue recognition have been met.
Until 2005, the majority of our term license arrangements were larger agreements with extended payment terms that did not typically result in follow-on license agreements. We have a history of successfully collecting payments under the original payment terms, therefore for these arrangements, we have recognized the present value of the future term license payments upon customer acceptance, provided that no significant obligations or contingencies exist related to the software, other than maintenance support, and provided all other criteria for revenue recognition have been met. A portion of the license fees payable under these agreements (equal to the difference between the total license payments and the discounted present value of those payments) was initially deferred and recognized as installment receivable interest income (and is not part of total revenue) over the
34
Table of Contents
license term. For purposes of the present value calculations, the discount rates used were estimates of customers’ borrowing rates at the time of recognition, typically below prime rate. As of December 31, 2010, the discount rates associated with the remaining installment receivables ranged from 4.00% to 6.50%. As of December 31, 2010, the remaining balance of these installment receivables totaled approximately $3.5 million as summarized in the table on page 31.
For licensing arrangements that include a right to unspecified future products, fees are accounted for as subscriptions and the revenue is recognized ratably over the term of the arrangement.
Maintenance revenues
First-year maintenance typically is sold with the related software license and renewed on an annual basis thereafter. Maintenance revenue is deferred and recognized ratably over the term of the support period, which is generally one year and subject to annual renewals. Perpetual license maintenance obligations are based on separately stated renewal rates in the arrangement that are substantive and therefore represent VSOE of fair value. Term license arrangements include separately stated maintenance fees and the Company uses separate sales to determine VSOE of fair value.
Professional services revenues
Our services revenue is comprised of fees for consulting services, including software implementation, training, and reimbursable expenses. Consulting services may be provided on a “stand-alone” basis or bundled with a license and software maintenance services.
Revenue from “stand-alone” training services and consulting services under time and materials contracts is recognized as services are performed. We have VSOE of fair value for our training services and consulting services under time and materials contracts in North America and Europe, other than Spain.
Consulting services may be provided on a fixed-price basis. We do not have VSOE of fair value for fixed-price services. When fixed-price services are part of a multiple element arrangement, and the services are not essential to the functionality of the software, and when services, including maintenance, are the only undelivered element, we recognize the revenue from the total arrangement ratably over the longer of the software maintenance period or the service period. In the past, in a limited number of our arrangements, the fixed-price services were essential to the arrangement because we made significant alterations to the functionality of the software or built complex interfaces necessary for the software to be functional in the customer’s environment. We have not been able to make reasonably dependable estimates for the purpose of determining our progress to completion, as we have limited experience with these types of unique and complex arrangements. Accordingly, when the fixed-price services are essential to the arrangement, all revenue and costs are deferred until the completion of the fixed-price services under the completed contract method. Revenue from fixed-price services that are not bundled with a software license is generally recognized ratably during the service period, which is typically less than four months.
Revenue from stand-alone sales of Pega Cloud, our platform-as-a-service offering, is recognized ratably over the term of the service.
Warranties and Indemnification
We warrant to our customers that our software products will conform to documented specifications for a limited period. We have not experienced significant claims related to software warranties beyond the scope of maintenance support, which we are already obligated to provide, and consequently we have not established reserves for warranty obligations.
35
Table of Contents
Our agreements with customers generally require us to indemnify the customer against claims that our software infringes third party patent, copyright, trademark or other proprietary rights. Such indemnification obligations are generally limited in a variety of industry-standard respects, including our right to replace an infringing product. As of December 31, 2010, we had not experienced any material losses related to these indemnification obligations and no material claims were outstanding, other than as discussed in Note 11 “Commitments and Contingencies” in the accompanying notes to the audited consolidated financial statements. The Company is currently defending claims related to certain software that was assumed in the acquisition of Chordiant.
Deferred revenue
Deferred software license revenue typically results from customer specific acceptance provisions and other arrangements for which all of the criteria to recognize revenue have not been met. Deferred maintenance revenue represents software license updates and product support contracts that are typically billed on an annual basis in advance and are recognized ratably over the support periods. Deferred professional services revenue represents advanced billings for consulting and training services that are recognized as the services are performed.
Allowance for doubtful accounts and allowance for sales credit memos
We maintain an allowance for doubtful accounts for estimated losses resulting from the inability of our customers to make required payments. Our estimates are based on the composition of the accounts receivable aging, historical bad debts, changes in payment patterns, customer creditworthiness and current economic trends. If we used different assumptions, or if the financial condition of customers were to deteriorate that resulted in their inability to make required payments, additional provisions for doubtful accounts would be required and would increase bad debt expense.
We record allowances for estimates of sales credit memos for services rendered. We base these estimates on historical analyses of sales credit memos and assumptions about future events and experience with customer disputes. If we used different assumptions in calculating the allowance, adjustments would be reflected as changes to revenue.
Goodwill and Intangible Assets Impairment
Goodwill represents the residual purchase price paid in a business combination after all identified assets and liabilities have been recorded. Goodwill is not amortized, but is tested annually, in the fourth quarter, for impairment by the fair value model at a reporting unit level. If the fair value of the reporting unit is less than its carrying amount, we would determine the implied fair value of the goodwill and evaluate if it is impaired.
We evaluate our intangible assets for impairment whenever events or changes in circumstances indicate that the carrying amount of such assets may not be recoverable. In evaluating potential impairment of these assets, we specifically consider whether any indicators of impairment are present, including, but not limited to:
| l | whether there has been a significant adverse change in the business climate that affects the value of an asset; |
| l | whether there has been a significant change in the extent or manner in which an asset is used; and |
| l | whether there is an expectation that the asset will be sold or disposed of before the end of its originally estimated useful life. |
If indicators of impairment are present, we compare the estimated undiscounted cash flows that the specific asset is expected to generate to its carrying value. These estimates involve significant subjectivity. If such assets are considered to be impaired, the impairment to be recognized is measured by the amount by which the carrying amount of the asset exceeds its fair value.
36
Table of Contents
Valuation of Acquired Intangible Assets
In connection with our acquisition of Chordiant and our preliminary purchase price allocation, we recorded $88 million of intangible assets, relating principally to customer related intangible assets and acquired technology. The valuation process used to calculate the values assigned to these acquired intangible assets is complex and involves significant estimation relative to our financial projections. The principal component of the valuation process is the determination of discounted future cash flows, which are based on a number of estimates and assumptions. There is inherent uncertainty involved with this estimation process. The estimates and assumptions that are most sensitive include, but are not limited to:
| l | the selection of an appropriate discount rate; |
| l | the required return on all assets employed by the valued asset to generate future income; |
| l | our projected overall revenue growth and mix of revenue from a market participant’s perspective; |
| l | our gross margin estimates (which are highly dependent on our mix of revenue); |
| l | our technology life cycles; |
| l | the attrition rate of our customers; |
| l | our planned level of operating expenses. |
Accounting for Income Taxes
We recognize deferred tax assets and liabilities due to temporary differences between the book and tax bases of recorded assets and liabilities. Future realization of our deferred tax assets ultimately depends on the existence of sufficient taxable income within the available carryback or carryforward periods. Sources of taxable income include future reversals of existing taxable temporary differences, future taxable income, taxable income in prior carryback years, and tax planning strategies. We record a valuation allowance to reduce our deferred tax assets to an amount we believe is more likely than not to be realized. Changes in our valuation allowance impact income tax expense in the period of adjustment. Our deferred tax valuation allowances require significant judgment and uncertainties, including assumptions about future taxable income that are based on historical and projected information.
We have preliminarily determined that we may utilize approximately $150.8 million of acquired Chordiant federal and foreign net operating losses (“NOLs”). The acquired federal NOLs are subject to annual limitations through 2029. As a result of the preliminary purchase price allocation, we recorded deferred tax assets of approximately $52.3 million related to these acquired NOLs. If our taxable income is not consistent with our expectations or the timing of income is not within the applicable carryforward period, we may be required to establish a valuation allowance on all or a portion of these deferred tax assets.
We assess our income tax positions and record tax benefits based upon management’s evaluation of the facts, circumstances, and information available at the reporting date. For those tax positions where it is more-likely-than-not that a tax benefit will be sustained, we record the largest amount of tax benefit with a greater than 50 percent likelihood of being realized upon ultimate settlement with a taxing authority having full knowledge of all relevant information. For those income tax positions where it is not more-likely-than-not that a tax benefit will be sustained, no tax benefit is recognized in the financial statements. We classify liabilities for uncertain tax positions as non-current liabilities unless the uncertainty is expected to be resolved within one year. We classify interest and penalties on uncertain tax positions as income tax expense.
37
Table of Contents
As a global company, we use significant judgment to calculate and provide for income taxes in each of the tax jurisdictions in which we operate. In the ordinary course of our business, there are transactions and calculations undertaken whose ultimate tax outcome cannot be certain. Some of these uncertainties arise as a consequence of transfer pricing for transactions with our subsidiaries and nexus and tax credit estimates. In addition, the calculation of acquired tax attributes and the associated limitations are complex. We estimate our exposure to unfavorable outcomes related to these uncertainties and estimate the probability for such outcomes.
Although we believe our estimates are reasonable, no assurance can be given that the final tax outcome will not be different from what is reflected in our historical income tax provisions, returns, and accruals. Such differences, or changes in estimates relating to potential differences, could have a material impact on our income tax provision and operating results in the period in which such a determination is made.
See Note 14 “Income Taxes” in the notes to the accompanying audited consolidated financial statements for further information.
Stock-based compensation
We recognize stock-based compensation expense associated with equity awards in our consolidated statements of operations based on the fair value of these awards at the date of grant. Stock-based compensation is recognized over the requisite service period, which is generally the vesting period of the equity award, and is adjusted each period for anticipated forfeitures. We recognize stock-based compensation using the ratable method, which treats each vesting tranche as if it were an individual grant.
We periodically grant stock options and RSUs for a fixed number of shares to employees and non-employee Directors. RSUs deliver to the recipient a right to receive a specified number of shares of our common stock upon vesting, net of tax withholding. Unlike stock options, there is no cost to the employee at share issuance. We value our RSUs at the fair value of our common stock on the grant date, which is the closing price of our common stock on the grant date, less the present value of expected dividends as the employee is not entitled to dividends during the requisite service period. The exercise price for stock options is greater than or equal to the fair market value of the shares at the date of the grant.
We estimate the fair value of stock options using the Black-Scholes option valuation model, which requires us to make estimates of key assumptions including the expected term of the option, the expected volatility of our stock price over the option’s expected term, the risk-free interest rate over the option’s expected term, and our expected annual dividend yield. The expected term of options granted is derived from historical data on employee exercises and post-vesting employment termination behavior. The expected volatility is based on the historical volatility of our stock price. The expected annual dividend yield is based on the expected annual dividend of $0.12 per share divided by the average stock price. The risk-free interest rate is based on the yield of zero-coupon U.S. Treasury securities for a period that is commensurate with the expected option term at the time of grant. If factors change and we employ different assumptions in future periods, the compensation expense that we record may differ significantly from what we have recorded in the current period.
The choice of a valuation model, and the underlying assumptions used in applying that model, involves significant judgment. Our judgment reflects our assessment of the most accurate method of valuing the stock options we issue based on our historical experience, knowledge of current conditions, and beliefs of what could occur in the future given available information. Our judgment could change over time as additional information becomes available to us, or the facts underlying our assumptions change over time, and any change in our judgments could have a material effect on our financial statements.
See Note 13 “Stock-Based Compensation” in the notes to the accompanying audited consolidated financial statements for further information.
38
Table of Contents
| ITEM 7A. | Quantitative and Qualitative Disclosure about Market Risk |
Market risk represents the risk of loss that may affect us due to adverse changes in financial market prices and rates. Our market risk exposure is primarily related to fluctuations in foreign exchange rates and interest rates. To date we have not entered into derivative or hedging transactions to manage risk in connection with such fluctuations.
Foreign currency exposure
We derived approximately 41%, 34%, and 38%, of our total revenue from sales to customers based outside of the U.S. in 2010, 2009, and 2008, respectively. Our international license and professional services sales have increasingly become denominated in foreign currencies. However, the operating expenses of our foreign operations are also primarily denominated in foreign currencies, which partially offset our foreign currency exposure. A decrease in the value of foreign currencies, particularly the British pound and the Euro relative to the U.S. dollar, could adversely impact our revenues and operating results.
Our U.S. operating company invoices most of our foreign customers in foreign currencies, so it holds cash and receivables valued in these foreign currencies. Our U.S. operating company’s functional currency is the U.S. dollar. Therefore, when there are changes in the foreign currency exchange rates versus the U.S. dollar, we recognize a foreign currency transaction gain or (loss) in our consolidated statements of operations. In addition, we have intercompany accounts that are eliminated in consolidation, but that expose us to foreign currency exchange rate fluctuation, which are recorded as foreign currency transaction gains or (losses) in our consolidated statements of operations.
As a result of our acquisition of Chordiant, we have expanded our international operations. We hold U.S. dollars in these foreign operations whose functional currency is the Euro, which partially offsets our exposure to foreign currency transaction losses related to foreign currencies held by our U.S. operating company. As of December 31, 2010, we held cash and receivables subject to foreign currency transaction gains or losses with a net carrying value of approximately $27.1 million. A ten percent change in the foreign currency exchange rates as of December 31, 2010 would have changed the net carrying value of our net monetary assets by approximately $2.7 million as of that date with a corresponding currency gain (loss) recognized in our consolidated statement of operations. During 2010, we recorded a $5.6 million foreign currency transaction loss due to the decrease in the value of our net monetary assets held in foreign currencies, primarily the Euro and British pound, relative to the U.S. dollar.
Interest rate exposure
During the first quarter of 2010, we sold our marketable securities to pay for the Chordiant acquisition. During the second quarter of 2010, we paid approximately $109.2 million in cash, net of approximately $47.6 million in cash acquired to complete the Chordiant acquisition. As of December 31, 2010, we had $14.3 million of cash equivalents, which were primarily liquid money market funds, and $16.1 million of marketable debt securities, which consisted of government sponsored enterprise bonds, corporate bonds, and municipal bonds. Due to the highly liquid nature of these investments, we are not subject to significant interest rate risk.
39
Table of Contents
| ITEM 8. | Financial Statements and Supplementary Data |
INDEX TO CONSOLIDATED FINANCIAL STATEMENTS
40
Table of Contents
REPORT OF INDEPENDENT REGISTERED PUBLIC ACCOUNTING FIRM
To the Board of Directors and Stockholders of Pegasystems Inc.
Cambridge, Massachusetts
We have audited the accompanying consolidated balance sheets of Pegasystems Inc. and subsidiaries (the “Company”) as of December 31, 2010 and 2009, and the related consolidated statements of operations, stockholders’ equity and comprehensive income (loss), and cash flows for each of the three years in the period ended December 31, 2010. These financial statements are the responsibility of the Company’s management. Our responsibility is to express an opinion on these financial statements based on our audits.
We conducted our audits in accordance with the standards of the Public Company Accounting Oversight Board (United States). Those standards require that we plan and perform the audit to obtain reasonable assurance about whether the financial statements are free of material misstatement. An audit includes examining, on a test basis, evidence supporting the amounts and disclosures in the financial statements. An audit also includes assessing the accounting principles used and significant estimates made by management, as well as evaluating the overall financial statement presentation. We believe that our audits provide a reasonable basis for our opinion.
In our opinion, such consolidated financial statements present fairly, in all material respects, the financial position of Pegasystems Inc. and subsidiaries as of December 31, 2010 and 2009, and the results of their operations and their cash flows for each of the three years in the period ended December 31, 2010, in conformity with accounting principles generally accepted in the United States of America.
We have also audited, in accordance with the standards of the Public Company Accounting Oversight Board (United States), the Company’s internal control over financial reporting as of December 31, 2010, based on the criteria established in Internal Control—Integrated Framework issued by the Committee of Sponsoring Organizations of the Treadway Commission and our report dated March 16, 2011 expressed an unqualified opinion on the Company’s internal control over financial reporting.
/s/DELOITTE & TOUCHE LLP
Boston, Massachusetts
March 16, 2011
41
Table of Contents
CONSOLIDATED BALANCE SHEETS
(in thousands, except per share amounts)
| As of December 31, | ||||||||
| 2010 | 2009 | |||||||
| ASSETS | ||||||||
| Current assets: |
||||||||
| Cash and cash equivalents |
$ | 71,127 | $ | 63,857 | ||||
| Marketable securities |
16,124 | 138,796 | ||||||
| Total cash, cash equivalents, and marketable securities |
87,251 | 202,653 | ||||||
| Trade accounts receivable, net of allowance of $1,159 and $649 |
77,638 | 39,396 | ||||||
| Short-term license installments |
2,258 | 2,829 | ||||||
| Deferred income taxes |
5,466 | 2,523 | ||||||
| Income taxes receivable |
9,266 | 5,046 | ||||||
| Other current assets |
5,121 | 3,794 | ||||||
| Total current assets |
187,000 | 256,241 | ||||||
| Long-term license installments, net of unearned interest income |
1,223 | 2,976 | ||||||
| Property and equipment, net |
11,010 | 8,931 | ||||||
| Long-term deferred income taxes |
32,729 | 7,515 | ||||||
| Long-term other assets |
2,217 | 1,195 | ||||||
| Intangible assets, net |
80,684 | 336 | ||||||
| Goodwill |
22,618 | 2,391 | ||||||
| Total assets |
$ | 337,481 | $ | 279,585 | ||||
| LIABILITIES AND STOCKHOLDERS’ EQUITY | ||||||||
| Current liabilities: |
||||||||
| Accounts payable |
$ | 6,286 | $ | 4,791 | ||||
| Accrued expenses |
24,742 | 6,748 | ||||||
| Accrued compensation and related expenses |
27,125 | 23,280 | ||||||
| Deferred revenue |
56,903 | 32,870 | ||||||
| Total current liabilities |
115,056 | 67,689 | ||||||
| Income taxes payable |
5,783 | 4,828 | ||||||
| Long-term deferred revenue |
17,751 | — | ||||||
| Other long-term liabilities |
3,221 | 1,849 | ||||||
| Total liabilities |
141,811 | 74,366 | ||||||
| Commitments and contingencies |
||||||||
| Stockholders’ equity: |
||||||||
| Preferred stock, $0.01 par value, 1,000 shares authorized; no shares issued and outstanding |
— | — | ||||||
| Common stock, $0.01 par value, 70,000 shares authorized; 37,250 shares and 36,818 shares issued and outstanding |
372 | 368 | ||||||
| Additional paid-in capital |
122,607 | 121,389 | ||||||
| Retained earnings |
71,431 | 81,776 | ||||||
| Accumulated other comprehensive income: |
||||||||
| Net unrealized (loss) gain on available-for-sale marketable securities |
(36 | ) | 539 | |||||
| Foreign currency translation adjustments |
1,296 | 1,147 | ||||||
| Total stockholders’ equity |
195,670 | 205,219 | ||||||
| Total liabilities and stockholders’ equity |
$ | 337,481 | $ | 279,585 | ||||
See notes to consolidated financial statements.
42
Table of Contents
CONSOLIDATED STATEMENTS OF OPERATIONS
(in thousands, except per share amounts)
| Year ended December 31, | ||||||||||||
| 2010 | 2009 | 2008 | ||||||||||
| Revenue: |
||||||||||||
| Software license |
$ | 119,839 | $ | 115,934 | $ | 76,572 | ||||||
| Maintenance |
83,878 | 50,099 | 40,115 | |||||||||
| Professional services |
132,882 | 97,980 | 94,960 | |||||||||
| Total revenue |
336,599 | 264,013 | 211,647 | |||||||||
| Cost of revenue: |
||||||||||||
| Cost of software license |
4,303 | 121 | 95 | |||||||||
| Cost of maintenance |
11,041 | 6,203 | 5,390 | |||||||||
| Cost of professional services |
113,390 | 84,613 | 76,272 | |||||||||
| Total cost of revenue |
128,734 | 90,937 | 81,757 | |||||||||
| Gross profit |
207,865 | 173,076 | 129,890 | |||||||||
| Selling and marketing |
116,230 | 74,378 | 63,799 | |||||||||
| Research and development |
55,193 | 38,862 | 31,472 | |||||||||
| General and administrative |
25,034 | 18,017 | 20,140 | |||||||||
| Acquisition-related costs |
5,924 | — | — | |||||||||
| Restructuring costs |
8,064 | — | — | |||||||||
| Total operating expenses |
210,445 | 131,257 | 115,411 | |||||||||
| (Loss) income from operations |
(2,580 | ) | 41,819 | 14,479 | ||||||||
| Foreign currency transaction (loss) gain |
(5,569 | ) | 2,083 | (4,537 | ) | |||||||
| Interest income, net |
883 | 3,144 | 5,029 | |||||||||
| License installment receivable interest income |
255 | 347 | 597 | |||||||||
| Other income, net |
814 | 22 | 104 | |||||||||
| (Loss) income before (benefit) provision for income taxes |
(6,197 | ) | 47,415 | 15,672 | ||||||||
| (Benefit) provision for income taxes |
(306 | ) | 15,203 | 4,695 | ||||||||
| Net (loss) income |
$ | (5,891 | ) | $ | 32,212 | $ | 10,977 | |||||
| Net (loss) earnings per share |
||||||||||||
| Basic |
$ | (0.16 | ) | $ | 0.89 | $ | 0.30 | |||||
| Diluted |
$ | (0.16 | ) | $ | 0.85 | $ | 0.29 | |||||
| Weighted-average number of common shares outstanding |
||||||||||||
| Basic |
37,031 | 36,208 | 36,146 | |||||||||
| Diluted |
37,031 | 38,113 | 37,605 | |||||||||
| Cash dividends declared per share |
$ | 0.12 | $ | 0.12 | $ | 0.12 | ||||||
See notes to consolidated financial statements.
43
Table of Contents
CONSOLIDATED STATEMENTS OF STOCKHOLDERS’ EQUITY AND
COMPREHENSIVE INCOME (LOSS)
(in thousands, except per share amounts)
| Common Stock | Additional Paid-In Capital |
Retained Earnings |
Accumulated Other Comprehensive Income |
Total Stock-holders’ Equity |
||||||||||||||||||||
| Number of Shares |
Amount | |||||||||||||||||||||||
| Balance at December 31, 2007 |
36,192 | $ | 362 | $ | 123,401 | $ | 47,321 | $ | 1,860 | $ | 172,944 | |||||||||||||
| Repurchase of common stock |
(1,536 | ) | (15 | ) | (18,333 | ) | — | — | (18,348 | ) | ||||||||||||||
| Issuance of common stock for share-based compensation plans |
1,108 | 11 | 5,806 | — | — | 5,817 | ||||||||||||||||||
| Issuance of stock under Employee Stock Purchase Plan |
24 | — | 265 | — | — | 265 | ||||||||||||||||||
| Stock-based compensation expense |
22 | — | 3,532 | — | — | 3,532 | ||||||||||||||||||
| Tax benefit from exercise of stock options net of deferred tax asset deficiencies of $216 |
— | — | 3,255 | — | — | 3,255 | ||||||||||||||||||
| Cash dividends declared ($0.12 per share) |
— | — | — | (4,363 | ) | — | (4,363 | ) | ||||||||||||||||
| Comprehensive income: |
||||||||||||||||||||||||
| Foreign currency translation adjustments |
— | — | — | — | (2,020 | ) | (2,020 | ) | ||||||||||||||||
| Net unrealized holding gain on investments available-for-sale, net of tax $2 |
— | — | — | — | 1,055 | 1,055 | ||||||||||||||||||
| Net income |
— | — | — | 10,977 | — | 10,977 | ||||||||||||||||||
| Total comprehensive income |
$ | 10,012 | ||||||||||||||||||||||
| Balance at December 31, 2008 |
35,810 | 358 | 117,926 | 53,935 | 895 | 173,114 | ||||||||||||||||||
| Repurchase of common stock |
(677 | ) | (7 | ) | (12,076 | ) | — | — | (12,083 | ) | ||||||||||||||
| Issuance of common stock for share-based compensation plans |
1,645 | 17 | (4,140 | ) | — | — | (4,123 | ) | ||||||||||||||||
| Issuance of stock under Employee Stock Purchase Plan |
15 | — | 335 | — | — | 335 | ||||||||||||||||||
| Exercise of common stock warrants |
7 | — | — | |||||||||||||||||||||
| Issuance of stock awards |
18 | 454 | 454 | |||||||||||||||||||||
| Stock-based compensation expense |
— | — | 4,219 | — | — | 4,219 | ||||||||||||||||||
| Tax benefit from exercise or vesting of equity awards, net of deferred tax asset deficiencies of $740 |
— | — | 14,671 | — | — | 14,671 | ||||||||||||||||||
| Cash dividends declared ($0.12 per share) |
— | — | — | (4,371 | ) | — | (4,371 | ) | ||||||||||||||||
| Comprehensive income: |
||||||||||||||||||||||||
| Foreign currency translation adjustments |
— | — | — | — | 1,314 | 1,314 | ||||||||||||||||||
| Net unrealized holding gain on investments available-for-sale, net of tax of $45 |
— | — | — | — | (523 | ) | (523 | ) | ||||||||||||||||
| Net income |
— | — | — | 32,212 | — | 32,212 | ||||||||||||||||||
| Total comprehensive income |
$ | 33,003 | ||||||||||||||||||||||
| Balance at December 31, 2009 |
36,818 | 368 | 121,389 | 81,776 | 1,686 | 205,219 | ||||||||||||||||||
| Repurchase of common stock |
(295 | ) | (3 | ) | (8,289 | ) | — | — | (8,292 | ) | ||||||||||||||
| Issuance of common stock for share-based compensation plans |
690 | 7 | (4,720 | ) | — | — | (4,713 | ) | ||||||||||||||||
| Issuance of stock under Employee Stock Purchase Plan |
22 | — | 595 | — | — | 595 | ||||||||||||||||||
| Issuance of stock awards |
15 | 420 | 420 | |||||||||||||||||||||
| Stock-based compensation expense |
— | — | 6,325 | — | — | 6,325 | ||||||||||||||||||
| Value of stock options issued for acquisition of Chordiant |
— | — | 3,519 | — | — | 3,519 | ||||||||||||||||||
| Tax benefit from exercise or vesting of equity awards, net of deferred tax asset deficiencies of $351 |
— | — | 3,368 | — | — | 3,368 | ||||||||||||||||||
| Cash dividends declared ($0.12 per share) |
— | — | — | (4,454 | ) | — | (4,454 | ) | ||||||||||||||||
| Comprehensive loss: |
||||||||||||||||||||||||
| Foreign currency translation adjustments |
— | — | — | — | 149 | 149 | ||||||||||||||||||
| Unrealized loss on securities: |
||||||||||||||||||||||||
| Net unrealized holding loss on investments available-for-sale, net of tax of $19 |
— | — | — | — | (338 | ) | (338 | ) | ||||||||||||||||
| Less: reclassifications adjustment for gains included in net loss, net of tax of $5 |
(237 | ) | (237 | ) | ||||||||||||||||||||
| Net loss |
— | — | — | (5,891 | ) | — | (5,891 | ) | ||||||||||||||||
| Total comprehensive loss |
$ | (6,317 | ) | |||||||||||||||||||||
| Balance at December 31, 2010 |
37,250 | $ | 372 | $ | 122,607 | $ | 71,431 | $ | 1,260 | $ | 195,670 | |||||||||||||
See notes to consolidated financial statements.
44
Table of Contents
CONSOLIDATED STATEMENTS OF CASH FLOWS
(in thousands)
| Year ended December 31, | ||||||||||||
| 2010 | 2009 | 2008 | ||||||||||
| Operating activities: |
||||||||||||
| Net (loss) income |
$ | (5,891 | ) | $ | 32,212 | $ | 10,977 | |||||
| Adjustment to reconcile net (loss) income to cash provided by operating activities: |
||||||||||||
| Excess tax benefits from exercise or vesting of equity awards |
(3,719 | ) | (15,411 | ) | (3,471 | ) | ||||||
| Deferred income taxes |
(1,574 | ) | 1,413 | (3,806 | ) | |||||||
| Depreciation and amortization |
10,838 | 2,801 | 2,153 | |||||||||
| Amortization of investments |
994 | 3,910 | 2,108 | |||||||||
| Stock-based compensation expense |
6,745 | 4,673 | 3,532 | |||||||||
| Foreign currency transaction loss |
4,753 | - | - | |||||||||
| Gain on sale of investments |
(242 | ) | (1 | ) | (84 | ) | ||||||
| Loss on disposal of equipment |
147 | 114 | 98 | |||||||||
| Change in operating assets and liabilities: |
||||||||||||
| Trade accounts receivable |
(23,935 | ) | 3,405 | 3,121 | ||||||||
| License installments |
2,324 | 5,053 | 16,592 | |||||||||
| Income taxes receivable and other current assets |
(1,217 | ) | (4,544 | ) | 448 | |||||||
| Accounts payable and accrued expenses |
4,515 | 16,311 | 7,396 | |||||||||
| Deferred revenue |
23,927 | 639 | (947 | ) | ||||||||
| Other long-term assets and liabilities |
749 | (994 | ) | 282 | ||||||||
| Cash provided by operating activities |
18,414 | 49,581 | 38,399 | |||||||||
| Investing activities: |
||||||||||||
| Purchases of marketable securities |
(73,619 | ) | (79,447 | ) | (194,474 | ) | ||||||
| Proceeds from sales, maturities and called marketable securities |
195,686 | 67,327 | 185,558 | |||||||||
| Payments for 2010 acquisition, net of cash acquired |
(109,228 | ) | — | — | ||||||||
| Payments for 2008 acquisition |
(250 | ) | — | (798 | ) | |||||||
| Investment in property and equipment |
(5,748 | ) | (6,043 | ) | (4,050 | ) | ||||||
| Cash provided by (used in) investing activities |
6,841 | (18,163 | ) | (13,764 | ) | |||||||
| Financing activities: |
||||||||||||
| Issuance of common stock for share-based compensation plans |
2,268 | 4,473 | 6,720 | |||||||||
| Proceeds from sale of stock under Employee Stock Purchase Plan |
595 | 335 | 265 | |||||||||
| Excess tax benefits from exercise or vesting of equity awards |
3,719 | 15,411 | 3,471 | |||||||||
| Dividend payments to shareholders |
(4,441 | ) | (4,346 | ) | (4,368 | ) | ||||||
| Common stock repurchases for tax withholdings for net settlement of equity awards |
(6,984 | ) | (8,596 | ) | (904 | ) | ||||||
| Common stock repurchases under share repurchase programs |
(8,408 | ) | (12,326 | ) | (18,538 | ) | ||||||
| Cash used in financing activities |
(13,251 | ) | (5,049 | ) | (13,354 | ) | ||||||
| Effect of exchange rate on cash and cash equivalents |
(4,734 | ) | 1,401 | (1,904 | ) | |||||||
| Net increase in cash and cash equivalents |
7,270 | 27,770 | 9,377 | |||||||||
| Cash and cash equivalents, beginning of year |
63,857 | 36,087 | 26,710 | |||||||||
| Cash and cash equivalents, end of year |
$ | 71,127 | $ | 63,857 | $ | 36,087 | ||||||
| Supplemental disclosures: |
||||||||||||
| Income taxes paid |
$ | 1,582 | $ | 7,024 | $ | 4,956 | ||||||
| Non-cash investing and financing activity: |
||||||||||||
| Dividends payable |
$ | 1,118 | $ | 1,105 | $ | 1,080 | ||||||
| Repurchases of common stock unsettled |
$ | 20 | $ | 136 | $ | 379 | ||||||
| Contingent consideration payable |
$ | - | $ | 250 | $ | - | ||||||
See notes to consolidated financial statements.
45
Table of Contents
NOTES TO CONSOLIDATED FINANCIAL STATEMENTS
| 1. | BASIS OF PRESENTATION |
(a) Business
The Company develops, markets, licenses, and supports software to automate complex, changing business processes. The Company provides implementation, consulting, training, and technical support services to facilitate the use of its software.
(b) Management estimates and reporting
The preparation of financial statements in conformity with accounting principles generally accepted in the United States of America (“U.S.”) requires management to make estimates and judgments that affect the reported amounts of assets and liabilities and disclosure of contingent assets and liabilities at the date of the financial statements and the reported amounts of revenues and expenses during the periods presented. Actual results could differ from those estimates. Accounts with reported amounts based on significant estimates and judgments include revenue, allowance for sales credit memos, deferred income taxes, income taxes payable, intangible assets, goodwill, accrued expenses, deferred revenue, and stock-based compensation.
(c) Principles of consolidation
The consolidated financial statements include Pegasystems Inc. and its wholly owned subsidiaries. All inter-company accounts and transactions have been eliminated in consolidation.
(d) Reclassifications
The Company combined certain captions within the investing section of its consolidated statement of cash flows to conform to the current period presentation. The combining of these captions did not have any impact on the total cash used in investing activities.
| 2. | SIGNIFICANT ACCOUNTING POLICIES |
(a) Revenue recognition
The Company’s revenue is derived from software licenses, maintenance fees related to the Company’s software licenses, and professional services. The Company’s license arrangements, whether involving a perpetual license or a term license, generally contain multiple elements, including professional consulting services, training, and software maintenance services.
Software revenue recognition requires judgment, including whether a software arrangement includes multiple elements, and if so, whether vendor-specific objective evidence (“VSOE”) of fair value exists for those elements. The amount of revenue allocated to undelivered elements is based on the VSOE of fair value for those elements and recognized as those elements are delivered. Any remaining portion of the total arrangement fee is then allocated to the software license, the delivered element. Before we can recognize revenue, the following four basic criteria must be met:
| • | Persuasive evidence of an arrangement—As evidence of the existence of an arrangement, we use a contract signed by the customer for software licenses and maintenance, and a statement of work for professional services. |
46
Table of Contents
PEGASYSTEMS INC.
NOTES TO CONSOLIDATED FINANCIAL STATEMENTS—(Continued)
| • | Delivery of product—Software is delivered electronically or shipped via disk media. |
| • | Fee is fixed or determinable—We assess whether a fee is fixed or determinable at the outset of the arrangement. In addition, we assess whether contract modifications to an existing term arrangement constitute a concession. Our software license agreements do not include a right of return. |
| • | Collection of fee is probable—We assess the probability of collecting from each customer at the outset of the arrangement based on a number of factors, including the customer’s payment history, its current creditworthiness, economic conditions in the customer’s industry and geographic location, and general economic conditions. If in our judgment collection of a fee is not probable, revenue is recognized as cash is collected, provided all other conditions for revenue recognition have been met. |
Software license revenues
Perpetual software license fees are recognized as revenue when the software is delivered, any acceptance required by contract that is not perfunctory is obtained, no significant obligations or contingencies exist related to the software, other than maintenance support, and all other revenue recognition criteria are met.
Term software license fees are generally payable on a monthly basis under license agreements that typically have a three to five-year term and may be renewed for additional terms at the customer’s option.
As a result of the Company’s focus on frequent sales to its targeted customers, the Company’s strategy is to sell initial term licensing agreements to those customers with the goal to generate follow-on sales, and as a result of extended payment terms, the Company recognizes term license revenue over the term of the agreement as payments become due or earlier if prepaid, provided all other criteria for revenue recognition have been met.
Until 2005, the majority of the Company’s term license arrangements were larger agreements with extended payment terms that did not typically result in follow-on license agreements. The Company has a history of successfully collecting payments under the original payment terms, therefore for these arrangements, the Company has recognized the present value of the future term license payments upon customer acceptance, provided that no significant obligations or contingencies exist related to the software, other than maintenance support, and provided all other criteria for revenue recognition have been met. A portion of the license fees payable under these agreements (equal to the difference between the total license payments and the discounted present value of those payments) was initially deferred and recognized as installment receivable interest income (and is not part of total revenue) over the license term. For purposes of the present value calculations, the discount rates used were estimates of customers’ borrowing rates at the time of recognition, typically below prime rate. As of December 31, 2010, the discount rates associated with the remaining installment receivables ranged from 4.00% to 6.50%.
For licensing arrangements that include a right to unspecified future products, fees are accounted for as subscriptions and the revenue is recognized ratably over the term of the arrangement.
Maintenance revenues
First-year maintenance typically is sold with the related software license and renewed on an annual basis thereafter. Maintenance revenue is deferred and recognized ratably over the term of the support period, which is generally one year and subject to annual renewals. Perpetual license maintenance obligations are based on separately stated renewal rates in the arrangement that are substantive and therefore represent VSOE of fair
47
Table of Contents
PEGASYSTEMS INC.
NOTES TO CONSOLIDATED FINANCIAL STATEMENTS—(Continued)
value. Term license arrangements include separately stated maintenance fees and the Company uses separate sales to determine VSOE of fair value.
Professional services revenues
The Company’s services revenue is comprised of fees for training, consulting services including software implementation, and reimbursable expenses. Consulting services may be provided on a “stand-alone” basis or bundled with a license and software maintenance services.
Revenue from “stand-alone” training services and consulting services under time and materials contracts is recognized as services are performed. The Company has VSOE of fair value for our training services and consulting services under time and materials contracts in North America and Europe, other than Spain.
Consulting services may be provided on a fixed-price basis. The Company does not have VSOE of fair value for fixed-price services. When fixed-price services are part of a multiple element arrangement, and the services are not essential to the functionality of the software, and when services including maintenance, are the only undelivered element, the Company recognizes the revenue from the total arrangement ratably over the longer of the software maintenance period or the service period. In the past, in a limited number of the Company’s arrangements, the fixed-price services were essential to the arrangement because the Company made significant alterations to the functionality of the software or built complex interfaces necessary for the software to be functional in the customer’s environment. The Company has not been able to make reasonably dependable estimates for the purpose of determining the Company’s progress to completion, as the Company has limited experience with these types of unique and complex arrangements. Accordingly, when the fixed-price services are essential to the arrangement, all revenue and costs are deferred until the completion of the fixed-price services under the completed contract method. Revenue from fixed-price services that are not bundled with a software license is generally recognized ratably during the service period, which is typically less than four months.
Revenue from stand-alone sales of Pega Cloud, the Company’s platform-as-a-service offering, is recognized ratably over the term of the service.
Warranties and Indemnification
The Company warrants to its customers that its software products will conform to documented specifications for a limited period. The Company has not experienced significant claims related to software warranties beyond the scope of maintenance support, which it is already obligated to provide, and consequently it has not established reserves for warranty obligations.
The Company’s agreements with customers generally require it to indemnify the customer against claims that the Company’s software infringes third party patent, copyright, trademark or other proprietary rights. Such indemnification obligations are generally limited in a variety of industry-standard respects, including the Company’s right to replace an infringing product. As of December 31, 2010, the Company had not experienced any material losses related to these indemnification obligations and no material claims were outstanding, other than as discussed in Note 11 “Commitments and Contingencies”. The Company is currently defending claims related to certain software that was assumed in the acquisition of Chordiant.
Deferred revenue
Deferred software license revenue typically results from customer specific acceptance provisions and other arrangements for which all of the criteria to recognize revenue have not been met. Deferred maintenance
48
Table of Contents
PEGASYSTEMS INC.
NOTES TO CONSOLIDATED FINANCIAL STATEMENTS—(Continued)
revenue represents software license updates and product support contracts that are typically billed on a per annum basis in advance and are recognized ratably over the support periods. Deferred professional services revenue represents advanced billings for consulting and training services that are recognized as the services are performed.
Allowance for doubtful accounts and allowance for sales credit memos
The Company maintains an allowance for doubtful accounts for estimated losses resulting from the inability of the Company’s customers to make required payments. The Company’s estimates are based on the composition of the accounts receivable aging, historical bad debts, changes in payment patterns, customer creditworthiness and current economic trends. If the financial condition of the Company’s customers were to deteriorate resulting in their inability to make required payments, additional provisions for doubtful accounts would be required and would increase bad debt expense.
The Company records allowances for estimates of sales credit memos for services rendered. The Company bases these estimates on historical analyses of sales credit memos and assumptions about future events and experience with customer disputes. If the Company experienced actual results that were different than those used in determining the assumptions in calculating the allowance, adjustments to the allowance would be reflected as changes to revenue.
(b) Fair value of financial instruments
The principal financial instruments held by the Company consist of cash equivalents, marketable securities, accounts receivable, and accounts payable. The carrying value of these instruments approximates their fair value. See Note 3 “Marketable Securities” and Note 4 “Fair Value Measurements” for further discussion of financial instruments that are carried at fair value on a recurring basis.
(c) Property and equipment
Property and equipment are recorded at cost. Depreciation and amortization are computed using the straight-line method over the estimated useful lives of the assets, which are three years for equipment and five years for furniture and fixtures. Leasehold improvements are amortized over the lesser of the term of the lease or the useful life of the asset. Repairs and maintenance costs are expensed as incurred.
The Company capitalizes and amortizes certain direct costs associated with computer software developed or purchased for internal use. The Company amortizes capitalized software costs generally over three to five years commencing on the date the software is placed into service. During 2010 and 2009, the Company capitalized $0.7 million and $0.5 million of computer software costs related to the Company’s implementation of an accounting system for internal use. During 2008, the Company did not capitalize any costs for computer software developed for internal use.
(d) Goodwill
Goodwill represents the residual purchase price paid in a business combination after all identified assets and liabilities have been recorded. Goodwill is not amortized, but is tested annually in the fourth quarter for impairment or between annual tests if indicators of potential impairment exist. To test for impairment, the Company compares the carrying value of the reporting unit to its fair value. If the reporting unit’s carrying value
49
Table of Contents
PEGASYSTEMS INC.
NOTES TO CONSOLIDATED FINANCIAL STATEMENTS—(Continued)
exceeds its fair value, the Company would record an impairment loss to the extent that the carrying value of goodwill exceeds its implied fair value. The Company performed its annual impairment test in 2010, 2009, and 2008 and determined that goodwill was not impaired.
(e) Intangible Assets
All of the Company’s intangible assets are amortized using the straight-line method over their estimated useful life, which ranges from one to nine years. The Company evaluates its intangible assets for impairment whenever events or changes in circumstances indicate that the carrying amount of such assets may not be recoverable. Impairment is assessed by comparing the undiscounted cash flows expected to be generated by the intangible asset to its carrying value. If an impairment exists, the Company calculates the impairment by comparing the carrying value of the intangible asset to its fair value as determined by discounted expected cash flows. The Company has not recorded any impairments in 2010, 2009, or 2008.
(f) Research and development and software costs
Research and development costs are expensed as incurred. Capitalization of computer software developed for resale begins upon the establishment of technological feasibility, generally demonstrated by a working model or an operative version of the computer software product. Such costs have not been material to date as technological feasibility is established within a short timeframe from the software’s general availability and, as a result, no costs were capitalized during 2010, 2009, and 2008.
(g) Stock-Based Compensation
The Company recognizes stock-based compensation expense associated with equity awards based on the fair value of these awards at the grant date. Stock-based compensation is recognized over the requisite service period, which is generally the vesting period of the equity award, and is adjusted each period for anticipated forfeitures. The Company recognizes stock-based compensation using the ratable method, which treats each vesting tranche as if it were an individual grant. See Note 13 “Stock-based Compensation” for discussion of the Company’s key assumptions included in determining the fair value of its equity awards at grant date.
(h) Acquisition-related costs
Acquisition-related costs are expensed as incurred and include direct and incremental costs associated with an impending or completed acquisition. During 2010, the Company incurred $5.9 million of acquisition-related costs associated with its acquisition of Chordiant Software, Inc. (“Chordiant”). These costs consisted of approximately $3.1 million of due diligence costs and advisory and legal transaction fees, approximately $0.8 million of valuation and tax consulting fees, $1.6 million of legal costs associated with the assumed litigation, and $0.4 million of integration and other expenses. See Note 7 “Acquisition, Goodwill and Intangibles” for further discussion of the acquisition.
(i) Restructuring costs
Restructuring costs include severance and related benefit costs for the reduction of personnel during the second and third quarter of 2010 related to the Chordiant acquisition. They also include future lease payments and demising costs, net of estimated sublease income, for the elimination of space within one facility. See Note 10 “Accrued Restructuring Costs” for further detail.
50
Table of Contents
PEGASYSTEMS INC.
NOTES TO CONSOLIDATED FINANCIAL STATEMENTS—(Continued)
(j) Foreign currency translation
The translation of assets and liabilities for the majority of the Company’s foreign subsidiaries is made at period-end exchange rates, while revenue and expense accounts are translated at the average exchange rates during the period transactions occurred. The resulting translation adjustments are reflected in accumulated other comprehensive income. Our India subsidiary uses the U.S. dollar as its functional currency, therefore, its monetary assets and liabilities are remeasured at current rates and its non-monetary assets are recorded at historical exchange rates. Realized and unrealized exchange gains or losses from transactions and remeasurement adjustments are reflected in foreign currency transaction (loss) gain, in the accompanying consolidated statements of operations.
(k) Accounting for Income Taxes
The Company recognizes deferred tax assets and liabilities due to temporary differences between the book and tax bases of recorded assets and liabilities. Future realization of the Company’s deferred tax assets ultimately depends on the existence of sufficient taxable income within the available carryback or carryforward periods. Sources of taxable income include future reversals of existing taxable temporary differences, future taxable income, taxable income in prior carryback years, and tax planning strategies. The Company records a valuation allowance to reduce its deferred tax assets to an amount it believes is more-likely-than-not to be realized. Changes in the valuation allowance impacts income tax expense in the period of adjustment. The Company’s deferred tax valuation allowance requires significant judgment and uncertainties, including assumptions about future taxable income that are based on historical and projected information. The Company recognizes excess tax benefits when they are realized through a reduction in income taxes payable using the with and without method.
The Company assesses its income tax positions and records tax benefits based upon management’s evaluation of the facts, circumstances, and information available at the reporting date. For those tax positions where it is more-likely-than-not that a tax benefit will be sustained, the Company records the largest amount of tax benefit with a greater than 50 percent likelihood of being realized upon ultimate settlement with a taxing authority having full knowledge of all relevant information. For those income tax positions where it is not more-likely-than-not that a tax benefit will be sustained, no tax benefit is recognized in the financial statements. The Company classifies liabilities for uncertain tax positions as non-current liabilities unless the uncertainty is expected to be resolved within one year. The Company classifies interest and penalties on uncertain tax positions as income tax expense.
As a global company, the Company uses significant judgment to calculate and provide for income taxes in each of the tax jurisdictions in which it operates. In the ordinary course of our business, there are transactions and calculations undertaken whose ultimate tax outcome cannot be certain. Some of these uncertainties arise as a consequence of transfer pricing for transactions with the Company’s subsidiaries and nexus and tax credit estimates. In addition, the calculation of acquired tax attributes and the associated limitations are complex. See Note 14 “Income Taxes” for further information.
51
Table of Contents
PEGASYSTEMS INC.
NOTES TO CONSOLIDATED FINANCIAL STATEMENTS—(Continued)
| 3. | MARKETABLE SECURITIES |
| (in thousands) |
December 31, 2010 | |||||||||||||||
| Amortized Cost |
Unrealized Gains |
Unrealized Losses |
Fair Value | |||||||||||||
| Marketable securities: |
||||||||||||||||
| Government sponsored enterprise bonds |
$ | 5,601 | 1 | (9 | ) | $ | 5,593 | |||||||||
| Corporate bonds |
5,468 | — | (49 | ) | 5,419 | |||||||||||
| Commercial paper |
2,999 | — | (1 | ) | 2,998 | |||||||||||
| Municipal bonds |
2,114 | — | — | 2,114 | ||||||||||||
| Marketable securities |
$ | 16,182 | 1 | (59 | ) | $ | 16,124 | |||||||||
| (in thousands) | December 31, 2009 | |||||||||||||||
| Amortized Cost |
Unrealized Gains |
Unrealized Losses |
Fair Value | |||||||||||||
| Marketable securities: |
||||||||||||||||
| Municipal bonds |
$ | 112,127 | 601 | (5 | ) | $ | 112,723 | |||||||||
| Government sponsored enterprise bonds |
19,650 | 17 | (107 | ) | 19,560 | |||||||||||
| Corporate bonds |
6,517 | — | (4 | ) | 6,513 | |||||||||||
| Marketable securities |
$ | 138,294 | 618 | (116 | ) | $ | 138,796 | |||||||||
The Company considers debt securities with maturities of three months or less when purchased, to be cash equivalents. Interest is recorded when earned. All of the Company’s investments are classified as available-for-sale and are carried at fair value with unrealized gains and losses recorded as a component of accumulated other comprehensive income.
As of December 31, 2010, remaining maturities of marketable debt securities ranged from January 2011 to November 2013, with a weighted-average remaining maturity of approximately 17 months. Proceeds from available-for-sale securities that were sold during 2010 were $161.3 million with gross realized gains of approximately $0.4 million and $0.1 million gross realized losses. Proceeds from available-for-sale securities that were sold during 2008 were $93.9 million with gross realized gains of $0.3 million and gross realized losses of $0.2 million. The Company did not sell any of its marketable debt securities in 2009. Specific identification of the individual securities was used to determine the basis on which the gain or loss was calculated.
| 4. | FAIR VALUE MEASUREMENTS |
Fair value is an exit price, representing the amount that would be received from the sale of an asset or paid to transfer a liability in an orderly transaction between market participants based on assumptions that market participants would use in pricing an asset or liability. As a basis for classifying the fair value measurements, a three-tier fair value hierarchy, which classifies the fair value measurements based on the inputs used in measuring fair value, was established as follows: (Level 1) observable inputs such as quoted prices in active markets for identical assets or liabilities; (Level 2) significant other observable inputs that are observable either directly or indirectly; and (Level 3) significant unobservable inputs in which there is little or no market data, which requires the Company to develop its own assumptions. This hierarchy requires the Company to use observable market data, when available, and to minimize the use of unobservable inputs when determining fair value. On a recurring basis, the Company records its marketable securities at fair value.
52
Table of Contents
PEGASYSTEMS INC.
NOTES TO CONSOLIDATED FINANCIAL STATEMENTS—(Continued)
The Company’s investments classified within Level 1 of the fair value hierarchy are valued using quoted market prices. The Company’s investments classified within Level 2 of the fair value hierarchy are valued based on matrix pricing compiled by third party pricing vendors, using observable market inputs such as interest rates, yield curves, and credit risk.
The fair value hierarchy of the Company’s cash equivalents and marketable securities at fair value is as follows:
| Fair Value Measurements at
Reporting Date Using |
||||||||||||
| (in thousands) | December 31, 2010 | Quoted Prices in Active Markets for Identical Assets (Level 1) |
Significant Other Observable Inputs (Level 2) |
|||||||||
| Money market funds |
$ | 14,342 | $ | 14,342 | $ | — | ||||||
| Marketable securities: |
||||||||||||
| Government sponsored enterprise bonds |
$ | 5,593 | $ | - | $ | 5,593 | ||||||
| Corporate bonds |
5,419 | 5,419 | — | |||||||||
| Commercial paper |
2,998 | — | 2,998 | |||||||||
| Municipal bonds |
2,114 | — | 2,114 | |||||||||
| Total marketable securities |
$ | 16,124 | $ | 5,419 | $ | 10,705 | ||||||
| Fair Value Measurements at
Reporting Date Using |
||||||||||||
| (in thousands) | December 31, 2009 | Quoted Prices in Active Markets for Identical Assets (Level 1) |
Significant Other Observable Inputs (Level 2) |
|||||||||
| Money market funds |
$ | 9,880 | $ | 9,880 | $ | — | ||||||
| Marketable securities: |
||||||||||||
| Municipal bonds |
$ | 112,723 | $ | 27,152 | $ | 85,571 | ||||||
| Government sponsored enterprise bonds |
19,560 | — | 19,560 | |||||||||
| Corporate bonds |
6,513 | 6,513 | — | |||||||||
| Total marketable securities |
$ | 138,796 | $ | 33,665 | $ | 105,131 | ||||||
Assets Measured at Fair Value on a Nonrecurring Basis
Assets not recorded at fair value on a recurring basis, such as property and equipment, and intangible assets are recognized at fair value when they are impaired. During 2010, 2009, and 2008, the Company did not recognize any nonrecurring fair value measurements from impairments. The Company recorded assets acquired and liabilities assumed related to its acquisition of Chordiant at fair value as described in Note 7 “Acquisition, Goodwill, and Other Intangible Assets.”
53
Table of Contents
PEGASYSTEMS INC.
NOTES TO CONSOLIDATED FINANCIAL STATEMENTS—(Continued)
| 5. | TRADE ACCOUNTS RECEIVABLE, NET OF ALLOWANCES |
Unbilled trade accounts receivable relate to services earned under time and material arrangements, maintenance and license arrangements that had not been invoiced as of December 31, 2010 and December 31, 2009, respectively.
| (in thousands) | December 31, 2010 |
December 31, 2009 |
||||||
| Trade accounts receivable |
$ | 65,373 | $ | 32,042 | ||||
| Unbilled accounts receivable |
13,424 | 8,003 | ||||||
| Total accounts receivable |
78,797 | 40,045 | ||||||
| Allowance for sales credit memos |
(1,027 | ) | (540 | ) | ||||
| Allowance for doubtful accounts |
(132 | ) | (109 | ) | ||||
| Total allowance |
(1,159 | ) | (649 | ) | ||||
| $ | 77,638 | $ | 39,396 | |||||
The Company records an allowance for estimates of potential sales credit memos when the related revenue is recorded and reviews this allowance periodically. The following reflects the activity of the allowance for sales credit memos for each of three years ended December 31:
| (in thousands) | 2010 | 2009 | 2008 | |||||||||
| Balance at beginning of year |
$ | 540 | $ | 1,125 | $ | 986 | ||||||
| Provision for credit memos |
3,050 | 2,600 | 1,777 | |||||||||
| Credit memos issued |
(2,563 | ) | (3,185 | ) | (1,638 | ) | ||||||
| $ | 1,027 | $ | 540 | $ | 1,125 | |||||||
| 6. | PROPERTY AND EQUIPMENT |
| (in thousands) | December 31, 2010 |
December 31, 2009 |
||||||
| Computer equipment |
$ | 8,550 | $ | 6,654 | ||||
| Leasehold improvements |
7,242 | 5,714 | ||||||
| Computer software purchased |
3,079 | 1,342 | ||||||
| Furniture and fixtures |
2,736 | 2,227 | ||||||
| Computer software developed for internal use |
721 | 721 | ||||||
| Fixed assets in progress |
626 | 694 | ||||||
| 22,954 | 17,352 | |||||||
| Less: accumulated depreciation and amortization |
(11,944 | ) | (8,421 | ) | ||||
| Property and equipment, net |
$ | 11,010 | $ | 8,931 | ||||
As of December 31, 2010, the majority of fixed assets in progress are leasehold improvement costs related to the Company’s expansion of its existing office in Hyderabad, India.
Depreciation and amortization expense was approximately $4.3 million, $2.8 million, and $2.2 million for the years ended December 31, 2010, 2009, and 2008, respectively.
54
Table of Contents
PEGASYSTEMS INC.
NOTES TO CONSOLIDATED FINANCIAL STATEMENTS—(Continued)
| 7. | ACQUISITION, GOODWILL, AND OTHER INTANGIBLE ASSETS |
Chordiant Acquisition
On April 21, 2010, the Company acquired all of the outstanding shares of common stock of Chordiant, a leading provider of customer relationship management (“CRM”) software and services with a focus on improving customer experiences through decision technology. The aggregate purchase price for Chordiant was approximately $160.3 million, consisting of $156.8 million in cash and stock options with a fair value of $3.5 million. The Company issued approximately 241,000 stock options as replacement of outstanding Chordiant stock options at the acquisition date. The majority of the fair value of these stock options was recorded as purchase price based on the portion of the awards related to pre-combination services. The compensation expense associated with the portion of the replacement awards related to post-combination services totaled $0.2 million and will be recognized as compensation expense over the remaining service period. The Company has expensed all transaction costs, as described in Note 2 “Significant Accounting Policies.” These costs have been included in acquisition-related costs in the accompanying consolidated statement of operations.
The Company believes the acquisition will expand its global customer base and provide complementary solutions. Chordiant clients will be able to incorporate Pegasystems process automation to enhance their experience in their existing call center and marketing solutions. Pegasystems’ clients will benefit from Chordiant’s decision management solutions and extensive CRM assets. In addition, the Company believes the combination of the two companies will expand the partner network and provide incremental business opportunity growth.
The operations of Chordiant are included in the Company’s operating results from the date of acquisition. Due to the rapid integration of the products, sales force, and operations of Chordiant, other than the maintenance revenue attributable to the recognition of the fair value of acquired deferred maintenance revenue and professional services revenue attributable to arrangements existing at the acquisition date, it is no longer feasible for the Company to identify revenue from new arrangements attributable to Chordiant.
The valuation of acquired tax assets, uncertain tax liabilities, and certain accrued liabilities is preliminary. The Company is in the process of investigating the facts and circumstances existing as of the acquisition date in order to finalize its valuation and establish the related recoverable deferred tax assets. During the third quarter of 2010, the Company preliminarily determined that it may utilize approximately $146 million of acquired Chordiant federal net operating losses (“NOLs”), which are subject to annual limitations through 2029. As a result of this determination and other tax related adjustments, the Company updated its purchase price allocation in the third quarter of 2010 and recorded a $31.5 million increase in net deferred tax assets, a $0.3 million decrease in accrued federal income taxes, a decrease of $2.4 million in acquired intangible assets, and a $29.4 million decrease in goodwill. During the fourth quarter of 2010, the Company recorded a valuation adjustment on certain acquired foreign NOLs, preliminarily determined it may utilize a total of $150.8 million of acquired Chordiant federal and foreign NOLs, and recorded additional assumed liabilities. As a result of these changes, the Company recorded a $1.8 million increase in net deferred tax assets, a $3.4 million increase to accrued liabilities, and a $0.6 million decrease to long-term liabilities, which resulted in a $1.0 million net increase to goodwill.
55
Table of Contents
PEGASYSTEMS INC.
NOTES TO CONSOLIDATED FINANCIAL STATEMENTS—(Continued)
As of December 31, 2010, as a result of the purchase price allocation, the Company recognized approximately $20.2 million of goodwill, which is primarily due to the expected synergies of the combined entities and the workforce in place. The goodwill created by the transaction is nondeductible for tax purposes. A summary of the preliminary purchase price allocation for the acquisition of Chordiant is as follows:
| (in thousands) | ||||
| Total purchase consideration: |
||||
| Cash |
$ | 156,832 | ||
| Stock options |
3,519 | |||
| Total purchase consideration |
$ | 160,351 | ||
| Allocation of the purchase consideration: |
||||
| Cash |
$ | 47,604 | ||
| Accounts receivable, net of allowance |
14,231 | |||
| Other assets |
2,661 | |||
| Property and equipment |
753 | |||
| Deferred tax assets, net |
26,583 | |||
| Identifiable intangible assets |
88,049 | |||
| Goodwill |
20,227 | |||
| Accounts payable |
(5,303) | |||
| Accrued liabilities |
(13,878) | |||
| Deferred maintenance revenue |
(17,863) | |||
| Long-term liabilities |
(2,713) | |||
| Net assets acquired |
$ | 160,351 | ||
The valuation of the assumed deferred maintenance revenue was based on the Company’s contractual commitment to provide post-contract customer support to Chordiant customers. The fair value of this assumed liability was based on the estimated cost plus a reasonable margin to fulfill these service obligations. The majority of the deferred revenue is expected to be recognized in the 12 months following the acquisition.
The valuation of the acquired intangible assets is inherently subjective and relies on significant unobservable inputs. The Company used an income approach to value the acquired customer related intangible assets, technology and tradename. The valuation for each of these intangible assets was based on estimated projections of expected cash flows to be generated by the assets, discounted to the present value at discount rates commensurate with perceived risk. The valuation assumptions take into consideration the Company’s estimates of contract renewal, technology attrition and revenue growth projections.
The values for specifically identifiable intangible assets, by major asset class, are as follows:
| (in thousands) | Weighted-average amortization period (in years) | |||||
| Customer related intangible assets |
$ | 44,355 | 9 | |||
| Technology |
43,446 | 8 | ||||
| Trade name |
248 | 1 | ||||
| $ | 88,049 | 8.4 | ||||
56
Table of Contents
PEGASYSTEMS INC.
NOTES TO CONSOLIDATED FINANCIAL STATEMENTS—(Continued)
Pro forma Information
The following pro forma financial information presents the combined results of operations of the Company and Chordiant as if the acquisition had occurred on January 1, 2009 after giving effect to certain pro forma adjustments. The pro forma adjustments reflected herein include only those adjustments that are directly attributable to the Chordiant acquisition, factually determinable, and expected to have a continuing impact on the Company. These pro forma adjustments include a reduction of historical Chordiant revenue for fair value adjustments related to acquired deferred revenue and elimination of deferred costs associated with revenue, a net increase in amortization expense to eliminate historical amortization of Chordiant intangible assets and to record amortization expense for the $88 million of acquired identifiable intangibles, and a decrease in interest income as a result of the cash paid for the acquisition. The pro forma financial information for 2010 includes approximately $8.5 million of acquisition-related costs, including transaction costs incurred by the Company and Chordiant. The pro forma financial information does not reflect any adjustments for anticipated synergies resulting from the acquisition and is not necessarily indicative of the operating results that would have actually occurred had the transaction been consummated as of January 1, 2009.
| Pro Forma Twelve Months Ended December 31, |
||||||||
| 2010 | 2009 | |||||||
| Revenue |
$ | 355,433 | $ | 323,478 | ||||
| Net (loss) income |
(21,890) | 5,490 | ||||||
| Net (loss) income per basic share |
$ | (0.59) | $ | 0.15 | ||||
| Net (loss) income per diluted share |
$ | (0.59) | $ | 0.14 | ||||
Goodwill and Intangibles
The Company operates in one operating segment, business process solutions, for which discrete financial information is available and its performance is evaluated regularly by the CEO, who is the chief operating decision maker. The Company has one reporting unit, the fair value of which, is evaluated annually to determine whether goodwill is impaired.
The following table presents the changes in the carrying amount of goodwill:
| (in thousands) | 2010 | 2009 | ||||||
| Balance as of January 1, |
$ | 2,391 | $ | 2,141 | ||||
| Goodwill acquired during the year |
20,227 | — | ||||||
| Adjustment to goodwill balance |
— | 250 | ||||||
| Balance as of December 31, |
$ | 22,618 | $ | 2,391 | ||||
57
Table of Contents
PEGASYSTEMS INC.
NOTES TO CONSOLIDATED FINANCIAL STATEMENTS—(Continued)
Intangible assets are recorded at cost and are amortized using the straight-line method over their estimated useful life, which range from one to nine years. The technology designs and non-compete agreements are being amortized over their estimated useful lives of four and five years, respectively.
| (in thousands) | Cost | Accumulated Amortization |
Net Book Value |
|||||||||
| As of December 31, 2010 |
||||||||||||
| Customer related intangibles |
$ | 44,355 | $ | (3,286 | ) | $ | 41,069 | |||||
| Technology |
43,446 | (4,108 | ) | 39,338 | ||||||||
| Trade name |
248 | (165 | ) | 83 | ||||||||
| Technology designs |
490 | (340 | ) | 150 | ||||||||
| Non-compete agreements |
100 | (56 | ) | 44 | ||||||||
| Intellectual property |
1,400 | (1,400 | ) | — | ||||||||
| Total |
$ | 90,039 | $ | (9,355 | ) | $ | 80,684 | |||||
| As of December 31, 2009 |
||||||||||||
| Technology designs |
$ | 490 | $ | (218 | ) | $ | 272 | |||||
| Non-compete agreements |
100 | (36 | ) | 64 | ||||||||
| Intellectual property |
1,400 | (1,400 | ) | — | ||||||||
| Total |
$ | 1,990 | $ | (1,654 | ) | $ | 336 | |||||
Amortization expense for acquired intangibles was $7.7 million during the year ended December 31, 2010, of which $4.2 million was included in cost of software licenses and $3.5 million was included in operating expenses. Amortization expense was de minimis in 2009 and 2008.
| (in thousands) As of December 31, |
Future estimated amortization expense |
|||
| 2011 |
$ | 11,315 | ||
| 2012 |
11,137 | |||
| 2013 |
11,095 | |||
| 2014 |
9,489 | |||
| 2015 |
8,688 | |||
| 2016 and thereafter |
28,960 | |||
| $ | 80,684 | |||
58
Table of Contents
PEGASYSTEMS INC.
NOTES TO CONSOLIDATED FINANCIAL STATEMENTS—(Continued)
| 8. | ACCRUED EXPENSES |
| (in thousands) | December 31, 2010 |
December 31, 2009 |
||||||
| Accrued restructuring |
$ | 3,671 | $ | - | ||||
| Accrued other taxes |
2,971 | 1,289 | ||||||
| Accrued self-insurance medical and dental claims |
1,635 | - | ||||||
| Accrued professional fees |
1,615 | 389 | ||||||
| Accrued professional services partners fees |
1,498 | 1,055 | ||||||
| Accrued short-term deferred rent |
1,272 | 422 | ||||||
| Accrued income taxes |
1,201 | - | ||||||
| Dividends payable |
1,118 | 1,105 | ||||||
| Accrued employee reimbursable expenses |
575 | 799 | ||||||
| Repurchases of common stock unsettled |
20 | 136 | ||||||
| Accrued other |
9,166 | 1,553 | ||||||
| $ | 24,742 | $ | 6,748 | |||||
| 9. | DEFERRED REVENUE |
| (in thousands) | December 31, 2010 |
December 31, 2009 |
||||||
| Software license |
$ | 7,617 | $ | 4,413 | ||||
| Maintenance |
43,594 | 22,039 | ||||||
| Professional services and other |
5,692 | 6,418 | ||||||
| Current deferred revenue |
56,903 | 32,870 | ||||||
| Software license |
15,833 | - | ||||||
| Maintenance and professional services |
1,918 | - | ||||||
| Long-term deferred revenue |
17,751 | - | ||||||
| $ | 74,654 | $ | 32,870 | |||||
Deferred maintenance revenue includes the fair value of maintenance obligations assumed in our acquisition of Chordiant. See Note 7 “Acquisition, Goodwill, and Intangibles” for further discussion of the acquired assets and assumed liabilities from the acquisition.
| 10. | ACCRUED RESTRUCTURING COSTS |
During 2010, in connection with the Company’s integration plan of Chordiant, the Company recorded $6.5 million of severance and related benefit costs for the reduction of approximately 50 personnel in redundant roles. These personnel were primarily in general and administrative functions and their employment ended by the third quarter of 2010. The severance and related benefit costs will be paid by the end of the second quarter of 2012.
In connection with the Company’s evaluation of its combined facilities, the Company approved a plan to eliminate space within one facility. The Company ceased use of this space during the fourth quarter of 2010 and recognized $1.6 million of restructuring expenses, representing future lease payments and demising costs, net of estimated sublease income for this space. The lease payments will be completed by the end of 2013.
59
Table of Contents
PEGASYSTEMS INC.
NOTES TO CONSOLIDATED FINANCIAL STATEMENTS—(Continued)
A summary of the restructuring activity during 2010 is as follows:
| (in thousands) | Personnel | Facilities | Total | |||||||||
| Balance as of April 21, 2010 |
$ | - | $ | - | $ | - | ||||||
| Restructuring costs |
6,501 | 1,563 | 8,064 | |||||||||
| Cash payments |
(3,749 | ) | (69 | ) | (3,818 | ) | ||||||
| Other (1) |
- | 623 | 623 | |||||||||
| Balance as of December 31, 2010 |
$ | 2,752 | $ | 2,117 | $ | 4,869 | ||||||
(1) Reflects the liability initially recorded for the acquired above market operating lease terms at acquisition, which was subsequently restructured.
| (in thousands) | As of December 31, 2010 |
|||
| Reported as: |
||||
| Accrued expenses |
$ | 3,671 | ||
| Other long-term liabilities |
1,198 | |||
| $ | 4,869 | |||
| 11. | COMMITMENTS AND CONTINGENCIES |
The Company’s principal administrative, sales, marketing, support, and research and development operations are located in an approximate 105,000 square foot leased facility in Cambridge, Massachusetts. The lease for this facility expires in 2013, subject to the Company’s option to extend for two additional five-year periods. The Company also leases space for its other offices under non-cancelable operating leases that expire at various dates through 2020.
As of December 31, 2010, the Company’s future minimum rental payments required under operating leases with non-cancelable terms in excess of one year were as follows:
| (in thousands) For the calendar year |
Operating Leases |
|||
| 2011 |
$ | 7,542 | ||
| 2012 |
7,396 | |||
| 2013 |
3,801 | |||
| 2014 |
1,393 | |||
| 2015 |
1,087 | |||
| 2016 & Thereafter |
5,345 | |||
| $ | 26,564 | |||
Rent expense under operating leases is recognized on a straight-line basis to account for scheduled rent increases and any landlord tenant allowance. The excess of expense over current payments is recorded as deferred rent and included in accrued expenses and other long-term liabilities. As of December 31, 2010, deferred rent of approximately $1.3 million was included in accrued expenses and approximately $1.1 million was included in other long-term liabilities in the accompanying consolidated balance sheet. Total rent expense under operating leases was approximately $8.8 million for the year ended December 31, 2010, and $5.3 million for each of the years ended December 31, 2009 and 2008, respectively.
60
Table of Contents
PEGASYSTEMS INC.
NOTES TO CONSOLIDATED FINANCIAL STATEMENTS—(Continued)
As of December 31, 2010, the Company did not have any unconditional purchase obligations.
Yue vs. Chordiant Software, Inc.
On January 2, 2008, Chordiant and certain of its officers and one other employee were named in a complaint filed in the United States District Court for the Northern District of California (the “Court”) by Dongxiao Yue under the caption Dongxiao Yue (“Plaintiff”) v. Chordiant Software, Inc. et al. Case No. CV 08-0019 (N.D. Cal.). The complaint alleged that Chordiant’s Marketing Director (“CMD”) software product infringed copyrights in certain software marketed by Netbula LLC. On May 14, 2010, a jury awarded the Plaintiff approximately $1.4 million, which the Company deposited with the Court in November 2010. This judgment was approved by the Court on August 3, 2010, following the conclusion of various post-trial motions filed by the parties. The Company has not yet determined whether it will file an appeal in this matter.
On August 17, 2010, the Plaintiff filed an additional complaint with the Court against a number of Chordiant customers and partners, alleging that their use of CMD infringed the same copyrights at issue in the complaint filed against Chordiant. In accordance with the terms of Chordiant’s contracts with these customers and partners, the Company has agreed to indemnify and defend these customers and partners in this matter. On November 1, 2010, the Company filed motions with the Court seeking to dismiss the claims in this complaint. The Court hearing for this compliant will be in May 2011.
The matters subject to litigation against Chordiant and its customers existed at the date of acquisition and are included in assumed liabilities at the date of the business combination. The Company has accrued for probable losses based on its best estimate of the liability assumed at acquisition. The Company does not expect that the outcome of these matters will result in a material charge to the results of operations. Any adjustments made to the assumed liabilities after the conclusion of the Company’s purchase accounting will be reflected in earnings.
The Company is a party in various other contractual disputes, litigation and potential claims arising in the ordinary course of business. The Company does not believe that the resolution of these other matters will have a material adverse effect on its financial position or results of operations. Accordingly, no material accruals have been recorded in the Company’s consolidated balance sheets related to such contract disputes, litigation or potential claims.
| 12. | STOCKHOLDERS’ EQUITY |
(a) Preferred stock
The Company has authorized 1,000,000 shares of preferred stock, which may be issued from time to time in one or more series. The Board of Directors has the authority to issue the shares of preferred stock in one or more series, to establish the number of shares to be included in each series, and to fix the designation, powers, preferences and rights of the shares of each series and the qualifications, limitations or restrictions thereof, without any further vote or action by the stockholders. The issuance of preferred stock could decrease the amount of earnings and assets available for distribution to holders of common stock, and may have the effect of delaying, deferring or defeating a change in control of the Company. The Company had not issued any shares of preferred stock through December 31, 2010.
(b) Common stock
The Company has 70,000,000 authorized shares of common stock, $0.01 par value per share, of which 37,250,099 shares were issued and outstanding at December 31, 2010.
61
Table of Contents
PEGASYSTEMS INC.
NOTES TO CONSOLIDATED FINANCIAL STATEMENTS—(Continued)
Since 2004, the Company’s Board of Directors has approved stock repurchase programs that have authorized the Company to repurchase in the aggregate up to $80.8 million of its common stock. Purchases under these programs have been made on the open market.
The following table is a summary of the Company’s repurchase activity under all of the Company’s repurchase programs for the years ended December 31:
| (Dollars in thousands) | 2010 | 2009 | 2008 | |||||||||||||||||||||
| Shares | Amount | Shares | Amount | Shares | Amount | |||||||||||||||||||
| Prior year authorizations at January 1, |
$ | 15,779 | $ | 12,862 | $ | 1,210 | ||||||||||||||||||
| Authorizations |
5,750 | 15,000 | 30,000 | |||||||||||||||||||||
| Repurchases paid |
294,059 | (8,272 | ) | 673,066 | (11,947 | ) | 1,503,551 | (17,969 | ) | |||||||||||||||
| Repurchases unsettled |
538 | (20 | ) | 3,898 | (136 | ) | 32,376 | (379 | ) | |||||||||||||||
| Authorized dollars remaining as of December 31, |
$ | 13,237 | $ | 15,779 | $ | 12,862 | ||||||||||||||||||
(c) Dividends
On May 30, 2006, the Company’s Board of Directors approved an ongoing quarterly cash dividend of $0.03 per share, beginning with the second quarter ended June 30, 2006. Accordingly, the Company declared $0.12 per share, for the years ended December 31, 2010, 2009 and 2008, and paid cash dividends of $4.4 million, $4.3 million, and $4.4 million for the years ended December 31, 2010, 2009, and 2008, respectively.
(d) Warrants summary
In August 2009, the Company issued 7,264 shares of its common stock in connection with the exercise of warrants originally issued as part of the consideration for its acquisition of 1mind in 2002. These warrants were exercised by former stockholders of 1mind. As of December 31, 2010, there were outstanding warrants to purchase 3,567 shares of the Company’s common stock with an exercise price of $0.85 per share. These warrants expire in 2012.
| 13. | STOCK-BASED COMPENSATION |
The majority of the Company’s stock-based compensation arrangements vest over either a four or five year vesting schedule and the Company’s stock options have a ten-year term. The Company recognizes stock-based compensation using the ratable method, which treats each vesting tranche as if it were an individual grant.
The Company periodically grants stock options and restricted stock units (“RSUs”) for a fixed number of shares to employees and non-employee Directors. The exercise price for stock options is greater than or equal to the fair market value of the shares at the grant date. RSUs deliver to the recipient a right to receive a specified number of shares of the Company’s common stock upon vesting. Unlike stock options, there is no cost to the employee at share issuance. The Company values its RSUs at the fair value of our common stock on the grant date, which is the closing price of our common stock on the grant date, less the present value of expected dividends, as the employee is not entitled to dividends during the requisite service period. Upon vesting of the RSUs, the Company withholds shares of common stock in an amount sufficient to cover the minimum statutory tax withholding obligations and issues shares of its common stock for the remaining amount.
62
Table of Contents
PEGASYSTEMS INC.
NOTES TO CONSOLIDATED FINANCIAL STATEMENTS—(Continued)
Employees may elect to receive 50% of their target incentive compensation under the Company’s Corporate Incentive Compensation Plan (the “CICP”) in the form of RSUs instead of cash. If elected by an employee, the equity amount is equal in value on the date of grant to 50% of his or her target incentive opportunity, based on the employee’s base salary. The number of RSUs granted is determined by dividing 50% of the employee’s target incentive opportunity by the fair value of a RSU on the grant date. If elected, the award vests 100% on the CICP payout date of the following year for all participants. Vesting is conditioned upon the performance conditions of the CICP and on continued employment; if threshold funding does not occur, the equity grant will be cancelled. The Company recognizes the associated stock-based compensation expense over the requisite service period beginning on the grant date and ending on the vest date.
The Company grants options that allow for the settlement of vested stock options on a net share basis (“net settled stock options”), instead of settlement with a cash payment (“cash settled stock options”). With net settled stock options, the employee does not surrender any cash or shares upon exercise. Rather, the Company withholds the number of shares to cover the option exercise price and the minimum statutory tax withholding obligations from the shares that would otherwise be issued upon exercise. The settlement of vested stock options on a net share basis results in fewer shares issued by the Company.
Share-Based Compensation Plans:
(a) 1994 Long-term Incentive Plan
In 1994, the Company adopted a 1994 Long-Term Incentive Plan (as amended in 2003, the “1994 Plan”) to provide employees, Directors and consultants with opportunities to purchase stock through incentive stock options and non-qualified stock options. In addition to options, participants under the 1994 Plan were eligible to receive stock appreciation rights, restricted stock and long-term performance awards. As of December 31, 2010, options to purchase an aggregate of approximately 482,000 shares of common stock were outstanding under the 1994 Plan. The Company does not intend to issue any additional options or make any other awards under the 1994 Plan in the future.
(b) 1996 Non-Employee Director Stock Option Plan
In 1996, the Company adopted a 1996 Non-Employee Director Stock Option Plan (the “Director Plan”), which provided for the grant to non-employee Directors of the Company of options to purchase shares of its common stock. All shares authorized for issue under this plan have been awarded. Beginning in July 2006, in lieu of granting fully vested options, the Company grants shares of its common stock to is non-employee directors under the 2004 Long-term incentive plan, as described below. As of December 31, 2010, options to purchase an aggregate of approximately 100,000 shares of common stock were outstanding under the Director Plan.
(c) 2004 Long-Term Incentive Plan
In 2004, the Company adopted a 2004 Long-Term Incentive Plan (the “2004 Plan”) to provide employees, non-employee Directors and consultants with opportunities to purchase stock through incentive stock options and non-qualified stock options. In addition to options, eligible participants under the 2004 Plan may be granted stock purchase rights and other stock-based awards. Beginning in June 2006, each member of the Company’s Board of Directors (except the Company’s Chairman and Chief Executive Officer) is entitled to receive on an annual basis a number of shares of common stock, which as of March 2010 was equal to $70,000, divided by the fair market value of its common stock on the grant date. As of December 31, 2010, approximately 2,851,000 shares were subject to outstanding options and stock-based awards under the 2004 Plan.
63
Table of Contents
PEGASYSTEMS INC.
NOTES TO CONSOLIDATED FINANCIAL STATEMENTS—(Continued)
(d) 2006 Employee Stock Purchase Plan
In 2006, the Company adopted a 2006 Employee Stock Purchase Plan (the “2006 ESPP”) pursuant to which the Company’s employees are entitled to purchase up to an aggregate of 500,000 shares of common stock at a price equal to 85% of the fair market value of the Company’s common stock on either the commencement date or completion date for offerings under the plan, whichever is less, or such higher price as the Company’s Board of Directors may establish from time to time. Until the Company’s Board of Directors determines otherwise, the Board has set the purchase price at 95% of the fair market value on the completion date of the offering period. As a result, the 2006 Stock Purchase Plan is non-compensatory and is tax qualified. Therefore, as of December 31, 2010, no compensation expense related to shares issued under the plan had been recognized. As of December 31, 2010, approximately 79,000 shares had been issued thereunder.
Shares reserved
As of December 31, 2010, there were approximately 1,600,000 shares remaining for issuance for future equity grants under the Company’s stock plans, consisting of approximately 1,179,000 shares under the 2004 Plan and approximately 421,000 shares under the 2006 ESPP. There were no shares available for future equity grants under the 1994 Plan or the Director Plan.
Equity grants, Assumptions and Activity
During 2010, the Company issued approximately 506,000 shares to its employees under the Company’s share-based compensation plans and approximately 15,000 shares to its non-employee Directors.
The following table presents the stock-based compensation expense included in the Company’s consolidated statements of operations for the years ended December 31:
| (in thousands) | 2010 | 2009 | 2008 | |||||||||
| Stock-based compensation expense: |
||||||||||||
| Cost of services |
$ | 1,825 | $ | 1,096 | $ | 995 | ||||||
| Operating expenses |
4,920 | 3,577 | 2,537 | |||||||||
| Total stock-based compensation before tax |
6,745 | 4,673 | 3,532 | |||||||||
| Income tax benefit |
(2,185 | ) | (1,688 | ) | (1,090 | ) | ||||||
Stock Options
The Company estimates the fair value of stock options using a Black-Scholes option valuation model. Key inputs used to estimate the fair value of stock options include the exercise price of the award, the expected term of the option, the expected volatility of the Company’s common stock over the option’s expected term, the risk-free interest rate over the option’s expected term, and the Company’s expected annual dividend yield. The amount of stock-based compensation recognized during a period is based on the value of the awards that are ultimately expected to vest. Forfeitures are estimated at the time of grant and revised, if necessary, in subsequent periods if actual forfeitures differ from those estimates. Ultimately, the Company recognizes the actual expense over the vesting period only for the shares that vest. The weighted-average grant-date fair value for stock options granted in 2010, 2009, and 2008 was $12.22, $10.15, and $4.75 per share, respectively.
64
Table of Contents
PEGASYSTEMS INC.
NOTES TO CONSOLIDATED FINANCIAL STATEMENTS—(Continued)
The weighted-average assumptions used in the Black-Scholes option valuation model are as follows for the years ended December 31:
| 2010 | 2009 | 2008 | ||||||||||
| Expected volatility (1) |
41 | % | 41 | % | 46 | % | ||||||
| Expected term in years (2) |
5.1 | 6.1 | 5.9 | |||||||||
| Risk-free interest rate (3) |
1.65 | % | 2.52 | % | 2.36 | % | ||||||
| Expected annual dividend yield (4) |
0.71 | % | 0.81 | % | 1.07 | % | ||||||
| (1) | The expected volatility for each grant is determined based on the average of historical weekly price changes of the Company’s common stock over a period of time which approximates the expected option term. |
| (2) | The expected option term for each grant is determined based on the historical exercise behavior of employees and post-vesting employment termination behavior. |
| (3) | The risk-free interest rate is based on the yield of zero-coupon U.S. Treasury securities for a period that is commensurate with the expected option term at the time of grant. |
| (4) | The expected annual dividend yield is based on the weighted-average of the dividend yield assumptions used for options granted during the applicable period. The expected annual dividend is based on the expected dividend of $0.12 per share, per year ($0.03 per share, per quarter times 4 quarters) divided by the average stock price. |
The Company elected to adopt the alternative transition method (“short cut method”) in calculating their historical pool of windfall tax benefits in regards to its share-based compensation.
The following table summarizes the combined stock option activity under the Company’s stock option plans for the years ended December 31, 2010:
| Shares (in thousands) |
Weighted-average exercise price |
Weighted- average remaining contractual term (in years) |
Aggregate intrinsic value (in thousands) |
|||||||||||||
| Options outstanding as of January 1, 2010 |
3,669 | $ | 9.95 | |||||||||||||
| Granted |
206 | 34.12 | ||||||||||||||
| Assumed |
241 | 23.84 | ||||||||||||||
| Exercised |
(951 | ) | 9.42 | |||||||||||||
| Forfeited/Cancelled |
(162 | ) | 16.50 | |||||||||||||
| Options outstanding as of December 31, 2010 |
3,003 | $ | 12.54 | |||||||||||||
| Vested and expected to vest as of December 31, 2010 |
2,667 | $ | 11.72 | 5.16 | $ | 66,470 | ||||||||||
| Exercisable as of December 31, 2010 |
2,125 | $ | 9.28 | 4.37 | $ | 58,154 | ||||||||||
The aggregate intrinsic value of stock options exercised (i.e., the difference between the market price at exercise and the price paid by the employee at exercise) in 2010, 2009, and 2008 was $23.8 million, $42.8 million, and $7.6 million, respectively. The aggregate intrinsic value of stock options outstanding and exercisable as of December 31, 2010 is based on the difference between the closing price of the Company’s stock of $36.63 on December 31, 2010 and the exercise price of the applicable stock options.
65
Table of Contents
PEGASYSTEMS INC.
NOTES TO CONSOLIDATED FINANCIAL STATEMENTS—(Continued)
As of December 31, 2010, the Company had unrecognized stock-based compensation expense related to the unvested portion of stock options of approximately $2.7 million that is expected to be recognized as expense over a weighted-average period of approximately 2.2 years.
RSUs
The weighted-average grant-date fair value for RSUs granted in 2010, 2009, and 2008 was $33.90, $27.29, and $11.23, respectively. The following table summarizes the combined RSU activity for periodic grants and the CICP under the 2004 Plan for the year ended December 31, 2010:
| Shares (in thousands) |
Weighted- Average Grant-Date Fair Value |
Aggregate Intrinsic Value (in thousands) |
||||||||||
| Nonvested at January 1, 2010 |
432 | $ | 17.94 | |||||||||
| Granted |
300 | 33.90 | ||||||||||
| Vested |
(135 | ) | 16.37 | |||||||||
| Forfeited |
(27 | ) | 25.18 | |||||||||
| Nonvested at December 31, 2010 |
570 | $ | 26.45 | $ | 20,869 | |||||||
| Expected to vest at December 31, 2010 |
380 | $ | 27.37 | $ | 13,932 | |||||||
The RSUs associated with periodic grants vest over five years with 20% vesting after one year and the remaining 80% vesting in equal quarterly installments over the remaining four years. Approximately 42,000 RSUs granted in connection with the 2010 CICP are expected to vest 100% in March 2011.
The fair value of RSUs vested in 2010, 2009, and 2008 was $4.5 million, $3.0 million, and $0.5 million, respectively. The aggregate intrinsic value of RSUs outstanding and expected to vest as of December 31, 2010 is based on the closing price of the Company’s stock of $36.63 on December 31, 2010.
As of December 31, 2010, the Company had approximately $6.8 million of unrecognized stock-based compensation expense related to all unvested RSUs that is expected to be recognized as expense over a weighted-average period of approximately 2.4 years.
| 14. | INCOME TAXES |
The components of (loss) income before (benefit) provision for income taxes are as follows for the years ended December 31:
| (in thousands) | 2010 | 2009 | 2008 | |||||||||
| Domestic |
$ | (13,695 | ) | $ | 42,513 | $ | 13,221 | |||||
| Foreign |
7,498 | 4,902 | 2,451 | |||||||||
| Total |
$ | (6,197 | ) | $ | 47,415 | $ | 15,672 | |||||
66
Table of Contents
PEGASYSTEMS INC.
NOTES TO CONSOLIDATED FINANCIAL STATEMENTS—(Continued)
The components of the (benefit) provision for income taxes are as follows for the years ended December 31:
| (in thousands) | 2010 | 2009 | 2008 | |||||||||
| Current: |
||||||||||||
| Federal |
$ | (376 | ) | $ | 10,784 | $ | 6,947 | |||||
| State |
292 | 1,442 | 647 | |||||||||
| Foreign |
1,352 | 1,564 | 907 | |||||||||
| Total current provision |
1,268 | 13,790 | 8,501 | |||||||||
| Deferred: |
||||||||||||
| Federal |
(4,622 | ) | 899 | (2,651 | ) | |||||||
| State |
2,486 | 671 | (1,063 | ) | ||||||||
| Foreign |
562 | (157 | ) | (92 | ) | |||||||
| Total deferred (benefit) provision |
(1,574 | ) | 1,413 | (3,806 | ) | |||||||
| Total (benefit) provision |
$ | (306 | ) | $ | 15,203 | $ | 4,695 | |||||
The effective income tax rate differed from the statutory federal income tax rate due to the following:
| 2010 | 2009 | 2008 | ||||||||||
| Statutory federal income tax rate |
35.0 | % | 35.0 | % | 35.0 | % | ||||||
| Valuation allowance |
(37.2 | ) | 0.5 | (1.3 | ) | |||||||
| Transaction costs |
(10.7 | ) | - | - | ||||||||
| State income taxes, net of federal benefit and tax credits |
7.8 | 1.8 | (1.4 | ) | ||||||||
| Permanent differences |
(7.8 | ) | 0.8 | 2.7 | ||||||||
| Domestic production activities |
- | (1.8 | ) | (3.4 | ) | |||||||
| Federal research and experimentation credits |
5.5 | (0.4 | ) | (4.9 | ) | |||||||
| Tax effects of foreign activities |
14.1 | (1.1 | ) | (1.6 | ) | |||||||
| Tax-exempt income |
1.8 | (1.8 | ) | (3.9 | ) | |||||||
| Provision to return adjustments |
1.7 | 0.1 | 0.3 | |||||||||
| Tax exposure reserve |
0.2 | (1.7 | ) | 8.3 | ||||||||
| Other |
(5.5 | ) | 0.7 | 0.2 | ||||||||
| Effective income tax rate |
4.9 | % | 32.1 | % | 30.0 | % | ||||||
67
Table of Contents
PEGASYSTEMS INC.
NOTES TO CONSOLIDATED FINANCIAL STATEMENTS—(Continued)
Deferred income taxes reflect the tax attributes and tax effects of temporary differences between the carrying amounts of assets and liabilities for financial reporting purposes and the amounts used for income tax purposes. Significant components of net deferred tax assets and liabilities are as follows:
| (in thousands) | 2010 | 2009 | ||||||
| Deferred tax assets: |
||||||||
| Net operating loss carryforwards |
$ | 64,639 | $ | - | ||||
| Accruals and reserves |
9,799 | 5,202 | ||||||
| Software revenue |
1,332 | 607 | ||||||
| Depreciation |
2,652 | 521 | ||||||
| Tax credit carryforwards |
4,991 | 3,872 | ||||||
| Other |
67 | 93 | ||||||
| Total deferred tax assets |
83,480 | 10,295 | ||||||
| Less valuation allowances |
(14,613 | ) | (257 | ) | ||||
| Net deferred tax assets |
$ | 68,867 | $ | 10,038 | ||||
| Deferred tax liabilities: |
||||||||
| Software revenue |
$ | (429 | ) | $ | - | |||
| Intangibles |
(30,243 | ) | - | |||||
| Total deferred tax liabilities |
(30,672 | ) | - | |||||
| Net deferred income taxes |
$ | 38,195 | $ | 10,038 | ||||
| Reported as: |
||||||||
| Current deferred tax asset |
$ | 5,466 | $ | 2,523 | ||||
| Long-term deferred income tax assets |
32,729 | 7,515 | ||||||
| Total deferred income taxes |
$ | 38,195 | $ | 10,038 | ||||
The Company recognized approximately $174 million of federal net operating losses (“NOLs”) and approximately $6 million of foreign NOLs from the Chordiant acquisition. The Company has preliminarily determined that it may utilize approximately $150.8 million of acquired Chordiant federal and foreign NOLs after application of applicable tax limitations impacting the annual use of the NOLs. A valuation allowance is recorded on the deferred tax assets in excess of the NOL that is recoverable as a result of these limitations. The Company has also preliminarily recorded approximately $2.5 million of deferred tax assets related to acquired Chordiant state NOLs.
As of December 31, 2010, the Company had approximately $174 million of federal NOLs, of which $145 million are available for use subject to annual limitations through 2029, and $4.2 million of foreign NOLs that have an unlimited carryover period. As of December 31, 2010, the Company had approximately $4.4 million of federal credits that it has not recognized as a deferred tax asset in the table above due to the existence of excess tax deductions from stock-based compensation that are not realized. When such excess tax deductions are realized, additional paid-in capital will be increased.
The Company records a valuation allowance for deferred tax assets when it is more-likely-than-not that the Company will not realize the entire benefit of the assets. This determination requires significant judgment, including assumptions about future taxable income that are based on historical and projected information. The $14.4 million increase in the valuation allowance during 2010 primarily relates to a $12 million valuation allowance recorded against acquired Chordiant federal and state NOLs, which the Company has determined it will not be able to utilize due to various statutory limitations. In addition, the consolidation of Chordiant’s
68
Table of Contents
PEGASYSTEMS INC.
NOTES TO CONSOLIDATED FINANCIAL STATEMENTS—(Continued)
operations had a significant impact on the Company’s consolidated state apportionment factors, which reduced the Company’s ability to realize state research credits. As a result of this change, the Company recorded a $2.3 million valuation allowance against state research credits in 2010. The Company recorded a $0.3 million valuation allowance during 2009 against state research credits generated during 2009.
As of December 31, 2010, the Company had available $6.3 million of state tax research and experimentation (“R&E”) credits and $0.2 million of investment tax credits expiring in the years 2012 through 2025.
Our India subsidiary is a development center in an area designated as a Special Economic Zone (“SEZ”), and is entitled to a tax holiday in India. The tax holiday reduces or eliminates income tax in that country and expires in 2022. For the years ended December 31, 2010, 2009, and 2008, the effect of the income tax holiday was to reduce the overall income tax provision by approximately $0.4 million, $0.2 million, and $0.1 million, respectively.
Undistributed earnings of the Company’s foreign subsidiaries amounted to approximately $25.2 million as of December 31, 2010. The Company has not provided any additional federal or state income taxes or foreign withholding taxes on the undistributed earnings as such earnings have been indefinitely reinvested in the business.
A reconciliation of the beginning and ending balances of the total amounts of gross unrecognized tax benefits is as follows:
| (in thousands) | 2010 | 2009 | 2008 | |||||||||
| Balance as of January 1, |
$ | 4,442 | $ | 6,201 | $ | 9,825 | ||||||
| Additions based on tax positions related to the current year |
54 | 128 | 450 | |||||||||
| Additions for tax positions of prior years |
16 | 50 | 860 | |||||||||
| Additions for acquired uncertain tax benefits |
16,670 | - | - | |||||||||
| Reductions for tax positions of prior years |
(916 | ) | (1,937 | ) | (4,934 | ) | ||||||
| Balance as of December 31, |
$ | 20,266 | $ | 4,442 | $ | 6,201 | ||||||
As of December 31, 2010, approximately $20.3 million of the total unrecognized tax benefits would decrease our effective tax rate if recognized. However, approximately $11.1 million of these unrecognized tax benefits relate to acquired NOLs and research tax credits, which are subject to limitations on use. The Company expects that the changes in the unrecognized benefits within the next twelve months will be approximately $2 million, which would reduce the Company’s effective tax rate if realized.
For the years ended December 31, 2010 and 2008, the Company recognized interest expense of approximately $44,000 and $0.1 million, respectively. For the year ended December 31, 2009, the Company recognized a reduction of interest expense of approximately $0.5 million. For the years ended December 31, 2010, 2009, and 2008, the Company did not recognize any significant penalties. As of December 31, 2010 and 2009, the Company had accrued approximately $1.4 million and $1.3 million, respectively, for interest and penalties.
The Company files income tax returns in the U.S. and in foreign jurisdictions. Generally, the Company is no longer subject to U.S. federal, state, or local, or foreign income tax examinations by tax authorities for the years before 2007. With few exceptions, the statute of limitations remains open in all other jurisdictions for the tax years 2007 to the present.
69
Table of Contents
PEGASYSTEMS INC.
NOTES TO CONSOLIDATED FINANCIAL STATEMENTS—(Continued)
| 15. | NET (LOSS) EARNINGS PER SHARE |
Basic net (loss) earnings per share is computed using the weighted-average number of common shares outstanding during the period. Diluted net earnings per share is computed using the weighted-average number of common shares outstanding during the period, plus the dilutive effect of outstanding options, warrants and RSUs, using the treasury stock method and the average market price of our common stock during the applicable period. Certain shares related to some of our outstanding stock options, warrants, and RSUs were excluded from the computation of diluted earnings per share because they were antidilutive in the periods presented, but could be dilutive in the future.
| Year Ended December 31, | ||||||||||||
| (in thousands, except per share amounts) | 2010 | 2009 | 2008 | |||||||||
| Basic |
||||||||||||
| Net (loss) income |
$ | (5,891 | ) | $ | 32,212 | $ | 10,977 | |||||
| Weighted-average common shares outstanding |
37,031 | 36,208 | 36,146 | |||||||||
| Net (loss) earnings per share, basic |
$ | (0.16 | ) | $ | 0.89 | $ | 0.30 | |||||
| Diluted |
||||||||||||
| Net (loss) income |
$ | (5,891 | ) | $ | 32,212 | $ | 10,977 | |||||
| Weighted-average common shares outstanding |
37,031 | 36,208 | 36,146 | |||||||||
| Weighted-average effect of dilutive securities: |
||||||||||||
| Stock options |
- | 1,297 | 1,382 | |||||||||
| RSUs |
- | 601 | 67 | |||||||||
| Warrants |
- | 7 | 10 | |||||||||
| Effect of assumed exercise of stock options, warrants and RSUs |
- | 1,905 | 1,459 | |||||||||
| Weighted-average common shares outstanding, assuming dilution |
37,031 | 38,113 | 37,605 | |||||||||
| Net (loss) earnings per share, diluted |
$ | (0.16 | ) | 0.85 | 0.29 | |||||||
| Outstanding options, warrants and RSUs excluded as impact would be antidilutive |
3,779 | 362 | 1,523 | |||||||||
| 16. | GEOGRAPHIC INFORMATION AND MAJOR CUSTOMERS |
Operating segments are defined as components of an enterprise about which separate financial information is available that is evaluated regularly by the chief operating decision maker (“CODM”) in deciding how to allocate resources and in assessing performance.
The Company develops and licenses its rules-based software solutions and provides professional services, maintenance, and training related to its software. The Company derives substantially all of its revenue from the sale and support of one group of similar products and services— software that provides business process solutions in the enterprise applications market. The Company’s CODM is its Chief Executive Officer. To assess performance, the Company’s CODM primarily reviews financial information on a consolidated basis. Therefore, the Company has determined it operates in one segment—business process solutions.
70
Table of Contents
PEGASYSTEMS INC.
NOTES TO CONSOLIDATED FINANCIAL STATEMENTS—(Continued)
The Company’s international revenue is from sales to customers based outside of the U.S. The Company derived its operating revenue from the following geographic areas for the years ended December 31:
| (Dollars in thousands) | 2010 | 2009 | 2008 | |||||||||||||||||||||
| U.S. |
$ | 200,183 | 59 | % | $ | 174,976 | 66 | % | $ | 131,250 | 62 | % | ||||||||||||
| United Kingdom |
59,571 | 18 | % | 46,416 | 18 | % | 40,063 | 19 | % | |||||||||||||||
| Europe, other |
42,530 | 13 | % | 27,127 | 10 | % | 27,345 | 13 | % | |||||||||||||||
| Other |
34,315 | 10 | % | 15,494 | 6 | % | 12,989 | 6 | % | |||||||||||||||
| $ | 336,599 | 100 | % | $ | 264,013 | 100 | % | $ | 211,647 | 100 | % | |||||||||||||
Long-lived assets related to the Company’s U.S. and international operations as of December 31 were as follows:
| (Dollars in thousands) | 2010 | 2009 | ||||||||||||||
| U.S. |
$ | 8,616 | 78 | % | $ | 6,609 | 74 | % | ||||||||
| India |
2,120 | 19 | % | 2,072 | 23 | % | ||||||||||
| International, other |
274 | 3 | % | 250 | 3 | % | ||||||||||
| $ | 11,010 | 100 | % | $ | 8,931 | 100 | % | |||||||||
There were no customers accounting for more than 10% of the Company’s total revenue in 2010, 2009, and 2008 or trade receivables, net, as of December 31, 2010 and 2009. The Company’s financial services and insurance customers as a group represent a significant amount of the Company’s revenues and receivables, which the Company considered and determined it did not have a material impact on its allowances for doubtful accounts and sales credit memos as of December 31, 2010.
Marketable securities are another financial instrument that potentially subject the Company to a concentration of credit risk. See Note 3 “Marketable Securities” and Note 4 “Fair Value Measurements” for further discussion.
| 17. | EMPLOYEE BENEFIT PLANS |
The Company sponsors a 401(k) defined contribution retirement plan for qualifying employees pursuant to which the Company makes discretionary matching profit sharing contributions. Company contributions under the plan totaled approximately $2.0 million in 2010, $1.6 million in 2009, and $1.3 million in 2008. In addition, the Company has defined contribution plans for qualifying international employees and contributions expensed under those plans totaled approximately $1.2 million in 2010, approximately $1.0 million in 2009, and approximately $0.6 million in 2008.
| 18. | SELECTED QUARTERLY INFORMATION (UNAUDITED) |
| 2010 | ||||||||||||||||
| (in thousands, except per share amounts) | 1st Quarter | 2nd Quarter | 3rd Quarter | 4th Quarter | ||||||||||||
| Revenue |
$ | 75,084 | $ | 82,246 | $ | 90,016 | $ | 89,253 | ||||||||
| Gross profit |
48,648 | 50,986 | 55,026 | 53,205 | ||||||||||||
| Income (loss) from operations |
8,562 | (9,140 | ) | 1,943 | (3,945 | ) | ||||||||||
| Income (loss) before provision (benefit) for income taxes |
6,294 | (11,510 | ) | 4,208 | (5,189 | ) | ||||||||||
| Net income (loss) |
3,851 | (8,188 | ) | 3,139 | (4,693 | ) | ||||||||||
| Net earnings (loss) per share, basic and diluted |
$ | 0.10 | $ | (0.22 | ) | $ | 0.08 | $ | (0.13 | ) | ||||||
71
Table of Contents
PEGASYSTEMS INC.
NOTES TO CONSOLIDATED FINANCIAL STATEMENTS—(Continued)
| 2009 | ||||||||||||||||
| (in thousands, except per share amounts) | 1st Quarter | 2nd Quarter | 3rd Quarter | 4th Quarter | ||||||||||||
| Revenue |
$ | 62,367 | $ | 63,878 | $ | 64,821 | $ | 72,947 | ||||||||
| Gross profit |
41,836 | 42,286 | 40,761 | 48,193 | ||||||||||||
| Income from operations |
12,335 | 11,830 | 7,465 | 10,189 | ||||||||||||
| Income before provision for income taxes |
12,410 | 15,716 | 8,526 | 10,763 | ||||||||||||
| Net income |
8,642 | 11,241 | 6,001 | 6,328 | ||||||||||||
| Net earnings per share, basic |
$ | 0.24 | $ | 0.31 | $ | 0.16 | $ | 0.17 | ||||||||
| Net earnings per share, diluted |
$ | 0.23 | $ | 0.30 | $ | 0.16 | $ | 0.16 | ||||||||
72
Table of Contents
| ITEM 9. | Changes In and Disagreements with Accountants on Accounting and Financial Disclosure |
None.
| ITEM 9A. | Controls and Procedures |
(a) Evaluation of Disclosure Controls and Procedures.
Our management, with the participation of our Chief Executive Officer, or CEO, and Chief Financial Officer, or CFO, evaluated the effectiveness of our disclosure controls and procedures (as defined in Rules 13a-15(e) and 15d-15(e) under the Securities Exchange Act) as of December 31, 2010. In designing and evaluating our disclosure controls and procedures, our management recognized that any controls and procedures, no matter how well designed and operated, can provide only reasonable assurance of achieving their objectives, and our management necessarily applied its judgment in evaluating the cost-benefit relationship of possible controls and procedures. Based on this evaluation, our CEO and CFO concluded that our disclosure controls and procedures were effective as of December 31, 2010.
(b) Management’s Report on Internal Control over Financial Reporting.
Our management is responsible for establishing and maintaining adequate internal control over financial reporting, as such term is defined in Rules 13a-15(f) and 15d-15(f) under the Securities Exchange Act. Under the supervision and with the participation of our management, including our CEO and CFO, we conducted an evaluation of the effectiveness of our internal control over financial reporting based on the framework in Internal Control—Integrated Framework issued by the Committee of Sponsoring Organizations of the Treadway Commission (“COSO”).
Our internal control over financial reporting includes policies and procedures that pertain to the maintenance of records that, in reasonable detail, accurately and fairly reflect transactions and dispositions of assets, provide reasonable assurances that transactions are recorded as necessary to permit preparation of financial statements in accordance with U.S. generally accepted accounting principles, and that receipts and expenditures are being made in accordance with authorizations of our management and Directors; and provide reasonable assurance regarding prevention or timely detection of unauthorized acquisitions, use or disposition of our assets that could have a material effect on our financial statements.
Our management assessed the effectiveness of our internal control over financial reporting as of December 31, 2010. Based on this evaluation, our management concluded that we maintained effective internal control over financial reporting as of December 31, 2010, based on criteria in Internal Control—Integrated Framework issued by the COSO.
Deloitte & Touche LLP, our independent registered public accounting firm which also audited our consolidated financial statements, has issued an attestation report on our internal control over financial reporting, which is included below.
73
Table of Contents
REPORT OF INDEPENDENT REGISTERED PUBLIC ACCOUNTING FIRM
To the Board of Directors and Stockholders of Pegasystems Inc.
Cambridge, Massachusetts
We have audited the internal control over financial reporting of Pegasystems Inc. and subsidiaries (the “Company”) as of December 31, 2010, based on criteria established in Internal Control—Integrated Framework issued by the Committee of Sponsoring Organizations of the Treadway Commission. The Company’s management is responsible for maintaining effective internal control over financial reporting and for its assessment of the effectiveness of internal control over financial reporting, included in the accompanying Management’s Report on Internal Control over Financial Reporting. Our responsibility is to express an opinion on the Company’s internal control over financial reporting based on our audit.
We conducted our audit in accordance with the standards of the Public Company Accounting Oversight Board (United States). Those standards require that we plan and perform the audit to obtain reasonable assurance about whether effective internal control over financial reporting was maintained in all material respects. Our audit included obtaining an understanding of internal control over financial reporting, assessing the risk that a material weakness exists, testing and evaluating the design and operating effectiveness of internal control based on the assessed risk, and performing such other procedures as we considered necessary in the circumstances. We believe that our audit provides a reasonable basis for our opinion.
A company’s internal control over financial reporting is a process designed by, or under the supervision of, the company’s principal executive and principal financial officers, or persons performing similar functions, and effected by the company’s board of directors, management, and other personnel to provide reasonable assurance regarding the reliability of financial reporting and the preparation of financial statements for external purposes in accordance with generally accepted accounting principles. A company’s internal control over financial reporting includes those policies and procedures that (1) pertain to the maintenance of records that, in reasonable detail, accurately and fairly reflect the transactions and dispositions of the assets of the company; (2) provide reasonable assurance that transactions are recorded as necessary to permit preparation of financial statements in accordance with generally accepted accounting principles, and that receipts and expenditures of the company are being made only in accordance with authorizations of management and directors of the company; and (3) provide reasonable assurance regarding prevention or timely detection of unauthorized acquisition, use, or disposition of the company’s assets that could have a material effect on the financial statements.
Because of the inherent limitations of internal control over financial reporting, including the possibility of collusion or improper management override of controls, material misstatements due to error or fraud may not be prevented or detected on a timely basis. Also, projections of any evaluation of the effectiveness of the internal control over financial reporting to future periods are subject to the risk that the controls may become inadequate because of changes in conditions, or that the degree of compliance with the policies or procedures may deteriorate.
In our opinion, the Company maintained, in all material respects, effective internal control over financial reporting as of December 31, 2010, based on the criteria established in Internal Control—Integrated Framework issued by the Committee of Sponsoring Organizations of the Treadway Commission.
We have also audited, in accordance with the standards of the Public Company Accounting Oversight Board (United States), the consolidated financial statements as of and for the year ended December 31, 2010 of the Company and our report dated March 16, 2011 expressed an unqualified opinion on those financial statements.
| /s/DELOITTE & TOUCHE LLP |
| Boston, Massachusetts |
| March 16, 2011 |
74
Table of Contents
(c) Changes in Internal Control over Financial Reporting.
There have been no changes in our internal control over financial reporting (as defined in Rules 13a-15(f) and 15d-15(f) under the Securities Exchange Act) during the quarter ended December 31, 2010 that have materially affected, or are reasonably likely to materially affect, our internal control over financial reporting.
| ITEM 9B. | Other Information |
None.
PART III
| ITEM 10. | Directors, Executive Officers, and Corporate Governance |
Except as set forth below, the information required by this Item is contained in our proxy statement for our 2011 annual stockholders meeting (the “2011 proxy statement”) under the heading “Election of Directors,” and is incorporated herein by reference. Information relating to certain filings on Forms 3, 4, and 5 is contained in our 2011 proxy statement under the heading “Section 16(a) Beneficial Ownership Reporting Compliance,” and is incorporated herein by reference. Information required by this item pursuant to Items 407 (c) (3), 407(d) (4), and 407(d) (5) of Regulation S-K relating to an audit committee financial expert, the identification of the audit committee of our Board of Directors and procedures of security holders to recommend nominees to our Board of Directors is contained in the 2011 proxy statement under the heading “Corporate Governance” and is incorporated herein by reference.
We have adopted a written code of conduct that applies to our Board of Directors and all of our employees, including our principal executive officer, principal financial officer, principal accounting officer, or persons performing similar functions. A copy of our code of conduct can be found on our website, www.pega.com. We intend to satisfy the disclosure requirements under Item 5.05 of Form 8-K and under the applicable the NASDAQ Global Select Market rules by posting such information on our website in accordance with such requirements.
EXECUTIVE OFFICERS
The names of our executive officers and certain information about them are set forth below as of February 1, 2011:
Alan Trefler, age 54, a founder of Pegasystems, serves as Chief Executive Officer and Chairman and has been a Director since we organized in 1983. Prior to 1983, he managed an electronic funds transfer product for TMI Systems Corporation, a software and services company. Mr. Trefler holds a B.A. degree in Economics and Computer Science from Dartmouth College.
Craig Dynes, age 55, joined Pegasystems in September 2006 as Chief Financial Officer and Senior Vice President. Mr. Dynes also served as the Company’s principal accounting officer from November 2007 until May 2008. From 2004 to 2006, Mr. Dynes served as Chief Financial Officer at Demandware, a venture-backed enterprise software firm. From 2003 to 2004, Mr. Dynes served as President and CEO of Narad Networks, a manufacturer of equipment for the cable television industry. From 1997 to 2002, Mr. Dynes served as Chief Financial Officer of SilverStream Software, Inc., an application development software company. Prior to SilverStream, Mr. Dynes held senior financial positions at Sybase Inc. and Powersoft Corp. Mr. Dynes is a graduate of the Richard Ivey School of Business Administration, the University of Western Ontario and is a Canadian Chartered Accountant.
75
Table of Contents
Efstathios Kouninis, age 49, joined Pegasystems in April 2008 as Vice President of Finance. In May 2008, the Board of Directors appointed Mr. Kouninis as the Company’s Chief Accounting Officer. From February 2006 to April 2008, Mr. Kouninis served as Chief Financial Officer and Treasurer of Tasker Products Corporation, a publicly traded manufacturer of antimicrobial chemicals. From November 2004 to February 2006, Mr. Kouninis served on the Staff of the Division of Corporation Finance of the U. S. Securities and Exchange Commission. Mr. Kouninis holds a Post Baccalaureate in Accounting, a M.S. in taxation from Bentley College, and a B.S. from the University of Massachusetts.
Douglas Kra, age 48, joined Pegasystems in November 2004 as Vice President of Global Services. From 2002 to 2004, Mr. Kra served as Vice President at eLoyalty Corp., a consulting company specializing in customer relationship management. From 2000 to 2001, Mr. Kra served as President of Zefer Corp., an internet consulting firm. Prior to Zefer, Mr. Kra spent ten years at Cambridge Technology Partners Inc. in a variety of senior roles. He holds a B.A. in Computer Science from Brandeis University and an M.B.A. in finance from the New York University Stern School of Business.
Michael Pyle, age 56, joined Pegasystems in 1985 and has served as Senior Vice President of Product Development since August 2000. Including his positions with Pegasystems, Mr. Pyle’s professional background encompasses almost thirty years of software development and managerial experience throughout Europe and the U.S. Mr. Pyle completed his B.C.S. specializing in Computer Science and Systems Programming at the Civil Service College in London.
Leon Trefler, age 50, joined Pegasystems in April 1998 as an Account Executive for Strategic Business Development. Since then he has held various senior sales management positions across the Company and in Channel Sales. In 2002, he launched the commercialization of PRPC. From April 2007 to January 2010, Mr. Trefler served as Vice President of Sales, North America and in January 2010, Mr. Trefler was promoted to Senior Vice President of Sales. Mr. Trefler holds a B.A. degree from Dartmouth College.
Alan Trefler and Leon Trefler are brothers. There are no other family relationships among any of our executive officers or Directors.
| ITEM 11. | Executive Compensation |
The information required by this item is contained in the 2011 proxy statement under the headings “Director Compensation”, “Compensation Discussion and Analysis”, and “Executive Compensation” and is incorporated herein by reference.
| ITEM 12. | Security Ownership of Certain Beneficial Owners and Management and Related Stockholder Matters |
Information required by this item with respect to stock ownership of certain beneficial owners and management is contained in the 2011 proxy statement under the heading “Security Ownership of Certain Beneficial Owners and Management” and is incorporated herein by reference.
76
Table of Contents
Equity Compensation Plan Information
The following table provides certain information with respect to our equity compensation plans in effect as of December 31, 2010:
| (In thousands, except per share amounts) | (a) | (b) | (c) | |||||||||
| Number of shares
of common stock to be issued upon exercise of outstanding stock options and vesting of RSUs (3) |
Weighted-average exercise price per share of outstanding stock options (4) |
Number of shares of Common stock Remaining available For future issuance (excluding those in Column (a)) (5) |
||||||||||
| Equity compensation plans approved by stockholders (1) |
3,433 | $ | 11.92 | 1,600 | ||||||||
| Equity compensation plans not approved by stockholders (2) |
140 | $ | 25.25 | - | ||||||||
| (1) | Our equity compensation plans include the Amended and Restated 1994 Long-Term Incentive Plan (the “1994 Plan”), the 1996 Non-Employee Director Stock Option Plan (the “Director Plan”), the 2004 Long-Term Incentive Plan (the “2004 Plan”), the 2006 Employee Stock Purchase Plan (the “2006 ESPP”). Our stockholders previously approved each of these plans and all amendments that were subject to stockholder approval. In addition to the issuance of stock options, the 1994 Plan allowed for the issuance of stock appreciation rights, restricted stock, and long-term performance awards. The Company does not intend to issue any additional options or make any other awards under the 1994 Plan or the Director Plan in the future. In addition to the issuance of stock options, the 2004 Plan allows for the issuance of stock purchase rights and other stock-based awards, including RSUs. See Note 13 “Stock-Based Compensation” included in the notes to the accompanying audited consolidated financial statements for further information and description of our equity compensation plans. |
| (2) | These stock options were assumed in connection with our acquisition of Chordiant and were originally granted under the Chordiant Software, Inc. 2005 Equity Incentive Plan (the “2005 Plan”), the Chordiant Software, Inc. 2000 Nonstatutory Equity Incentive Plan (the “2000 Plan”), the Chordiant Software, Inc. Amended and Restated 1999 Non-Employee Director Stock Option Plan (the “1999 Director Plan”), and the Prime Response Group, Inc. 1998 Stock Options/Stock Issuance Plan (the “1998 Prime Response Plan”) (collectively, the “Chordiant Plans”). No additional awards were or may be granted under the Chordiant Plans following the date of acquisition. These plans were not approved by our stockholders since they were adopted at the date of acquisition. In connection with our acquisition of Chordiant, all outstanding equity awards issued under the Chordiant Plans with an exercise price of $6.00 or lower were assumed by us and converted into the right to receive 0.13 shares of Pegasystems common stock for every one share of Chordiant common stock covered by such awards. All other outstanding equity awards issued under the Chordiant Plans were cancelled. |
The 2005 Plan was approved by Chordiant’s stockholders and provided for the grant of incentive stock options, nonstatutory stock options, stock purchase awards, RSAs, RSUs and other forms of equity compensation. Awards granted under the 2005 Plan generally expire four to ten years after the grant date and generally become exercisable over a period of two to four years, with either yearly or monthly vesting. The 2000 Plan provided for the grant of nonstatutory stock options, restricted stock and stock bonuses to employees. Generally, awards under the 2000 Plan vest over a period of four years in equal monthly installments with 25% of the shares vesting after one year, and the remainder vesting in equal monthly installments over the remaining three years. The 1999 Director Plan provided directors to be issued a single grant at each year’s annual meeting of the stockholders equal to a number of shares of restricted stock equal to $100,000 divided by the fair market value of Chordiant’s common stock on the date of the annual meeting. These shares of restricted stock generally vest on the earlier of the next Chordiant annual meeting or twelve months from the date of grant. The 1998 Prime Response Plan provided for the grant of stock options, common stock and stock bonuses to employees, non-employee directors, and consultants or other
77
Table of Contents
independent advisors who provided service to Prime Response. Awards granted under this plan had a maximum expiration of ten years.
| (3) | The number of shares of common stock issued upon exercise of vested stock options and vesting of RSUs will be less than 3,573,000 because of the “net settlement” feature of most of these stock options and RSUs. This feature enables the employee to satisfy the cost to exercise (in the case of stock options) and, if applicable, taxes due (in the case of stock options and RSUs) by surrendering shares to the Company based on the fair value of the shares at the exercise date (in the case of stock options) or vesting date (in the case of RSUs), instead of selling all of the shares on the open market to satisfy these obligations. The settlement of vested stock options and vested RSUs on a net share basis will result in fewer shares issued by the Company. During 2010, stock option and RSU holders net settled stock options and RSUs representing the right to purchase a total of 889,000 shares, of which only 493,000 were issued to the stock option and RSU holders and the balance of the shares were surrendered to the Company to pay for the exercise price and the applicable taxes. |
| (4) | The weighted-average exercise price does not take into account the shares issuable upon vesting of outstanding RSUs, which have no exercise price. |
| (5) | Includes approximately 421,000 shares remaining available for issuance as of December 31, 2010 under the 2006 ESPP. |
78
Table of Contents
| ITEM 13. | Certain Relationships and Related Transactions, and Director Independence |
The information required by this item is contained in the 2011 proxy statement under the headings “Certain Relationships and Related Transactions” and “Determination of Independence” and is incorporated herein by reference.
| ITEM 14. | Principal Accounting Fees and Services |
The information required by this item is contained in the 2011 proxy statement under the heading “Independent Registered Public Accounting Firm Fees and Services” and is incorporated herein by reference.
PART IV
| ITEM 15. | Exhibits and Financial Statement Schedules |
(a) The following are filed as part of this Annual Report on Form 10-K:
(1) Financial Statements
The following consolidated financial statements are included in Item 8:
(b) Exhibits
The exhibits listed in the Exhibit Index immediately preceding such exhibits are filed as part of this Annual Report on Form 10-K.
(c) Financial Statement Schedules
All financial statement schedules are omitted because the required information is not present or not present in sufficient amounts to require submission of the schedule or because the information is reflected in the consolidated financial statements or notes thereto.
79
Table of Contents
Pursuant to the requirements of Section 13 or 15(d) of the Securities Exchange Act of 1934, the Registrant has duly caused this Annual Report on Form 10-K to be signed on its behalf by the undersigned, thereunto duly authorized.
| PEGASYSTEMS INC. | ||
| BY: | /s/ CRAIG DYNES | |
| Craig Dynes | ||
| Senior Vice President, Chief Financial Officer (principal financial officer) (duly authorized officer) | ||
Date: March 16, 2011
Pursuant to the requirements of the Securities Exchange Act of 1934, this Annual Report on Form 10-K has been signed below on March 16, 2011 by the following persons on behalf of the Registrant and in the capacities indicated.
| Signature |
Title | |
| /s/ ALAN TREFLER Alan Trefler |
Chief Executive Officer and Chairman (principal executive officer) | |
| /s/ CRAIG DYNES Craig Dynes |
Senior Vice President, Chief Financial Officer (principal financial officer) | |
| /s/ EFSTATHIOS KOUNINIS Efstathios Kouninis |
Vice President of Finance and Chief Accounting Officer (principal accounting officer) | |
| /s/ RICHARD JONES Richard Jones |
Vice Chairman and Director | |
| /s/ CRAIG CONWAY Craig Conway |
Director | |
| /s/ PETER GYENES Peter Gyenes |
Director | |
| /s/ STEVEN KAPLAN Steven Kaplan |
Director | |
| /s/ JAMES O’HALLORAN James O’Halloran |
Director | |
| /s/ WILLIAM WYMAN William Wyman |
Director | |
80
Table of Contents
EXHIBIT INDEX
| Exhibit No. |
Description | |
| 2.1 | Agreement and Plan of Merger, dated as of March 14, 2010, by and among Pegasystems Inc., Maple Leaf Acquisition Corp. and Chordiant Software, Inc. (Filed as Exhibit 2.1 to the Registrant’s March 15, 2010 Form 8-K and incorporated herein by reference.) | |
| 3.3 | Restated Articles of Organization, of the Registrant. (Filed as exhibit 99.2 to the Registrant’s June 2, 2005 Form 8-K and incorporated herein by reference.) | |
| 3.4 | Amended and Restated Bylaws of Pegasystems Inc. (Filed as Exhibit 99.3 to the Registrant’s April 1, 2009 Form 8-K and incorporated herein by reference.) | |
| 4.1 | Specimen Certificate Representing the Common Stock. (Filed as exhibit 4.1 to the Registrant’s Registration Statement on Form S-1 (Registration No. 333-03807) or an amendment thereto and incorporated herein by reference.) | |
| 10.1++ | Amended and Restated 1994 Long-Term Incentive Plan. (Filed in the Registrant’s Proxy Statement for its 2003 annual stockholders meeting and incorporated herein by reference.) | |
| 10.2++ | 1996 Non-Employee Director Stock Option Plan. (Filed in the Registrant’s Proxy Statement for its 2000 annual stockholders meeting and incorporated herein by reference.) | |
| 10.3 | Lease Agreement dated February 26, 1993 between the Registrant and Riverside Office Park Joint Venture. (Filed as exhibit 10.13 to the Registrant’s Registration Statement on Form S-1 (Registration No. 333-03807) or an amendment thereto and incorporated herein by reference.) | |
| 10.4 | Amendment Number 1 to Lease Agreement dated August 17, 1994 between the Registrant and Riverside Office Park Joint Venture. (Filed as exhibit 10.14 to the Registrant’s Registration Statement on Form S-1 (Registration No. 333-03807) or an amendment thereto and incorporated herein by reference.) | |
| 10.5 | Amendment Number 8 to Lease Agreement dated July 31, 2002 between the Registrant and NOP Riverfront LLC. (Filed as exhibit 10.23 to the Registrant’s 2002 Form 10-K and incorporated herein by reference.) | |
| 10.6 | Letter Amendment to Lease Agreement dated July 31, 2002 between the Registrant and NOP Riverfront LLC. (Filed as exhibit 10.24 to the Registrant’s 2002 Form 10-K and incorporated herein by reference.) | |
| 10.7++ | 2004 Long-Term Incentive Plan, as amended on November 24, 2008. (Filed as exhibit 10.7 to the Registrant’s 2008 Form 10-K and incorporated herein by reference.) | |
| 10.8++ | Form of Employee Stock Option Agreement, as amended on December 15, 2009. (Filed as Exhibit 10.8 to the Registrant’s 2009 Form 10-K and incorporated herein by reference.) | |
| 10.9++ | Form of Restricted Stock Unit Agreement, as amended on December 15, 2009. (Filed as Exhibit 10.9 to the Registrant’s 2009 Form 10-K and incorporated herein by reference.) | |
| 10.10 | Form of Non-Employee Director Stock Option Agreement. (Filed as exhibit 10.2 to the Registrant’s September 30, 2004 Form 10-Q and incorporated herein by reference.) | |
| 10.11++ | Offer Letter between the Registrant and Douglas I. Kra dated October 19, 2004. (Filed as Exhibit 10.20 to the Registrant’s 2004 Form 10-K and incorporated herein by reference.) | |
| 10.12 | Form of Director Indemnification Agreement. (Filed as Exhibit 99.1 to the Registrant’s April 11, 2005 Form 8-K and incorporated herein by reference.) | |
| 10.13++ | 2006 Employee Stock Purchase Plan, as amended on February 14, 2008. (Filed as exhibit 10.15 to the Registrant’s 2007 Form 10-K and incorporated herein by reference.) | |
81
Table of Contents
EXHIBIT INDEX—(CONTINUED)
| Exhibit No. |
Description | |
| 10.14++ | Compensation program for members of the Registrant’s Board of Directors, effective May 30, 2006. (Detailed in Registrant’s June 5, 2006 Form 8-K and incorporated herein by reference.) | |
| 10.15++ | Offer Letter between the Registrant and Craig A. Dynes dated September 7, 2006. (Filed as Exhibit 99.1 to the Registrant’s September 7, 2006 Form 8-K and incorporated herein by reference.) | |
| 10.16 | Amendment Number 10 to Lease Agreement dated July 24, 2006 between the Registrant and NOP Riverfront LLC. (Filed as exhibit 10.1 to the Registrant’s September 30, 2006 Form 10-Q and incorporated herein by reference.) | |
| 10.17++ | Amendment to Stock Option Agreement between the Registrant and Richard H. Jones dated December 29, 2006. (Filed as Exhibit 99.1 to the Registrant’s January 4, 2007 Form 8-K and incorporated herein by reference.) | |
| 10.18 | Amendment Number 11 to Lease Agreement dated as of June 11, 2008 between the Registrant and NOP Riverfront LLC. (Filed as Exhibit 10.2 to the Registrant’s June 30, 2008 Form 10-Q and incorporated herein by reference.) | |
| 10.19++ | Director Indemnification Agreement dated as of March 8, 2009 by and between Pegasystems Inc. and Peter Gyenes. (Filed as Exhibit 99.1 to the Registrant’s March 11, 2009 Form 8-K and incorporated herein by reference.) | |
| 10.20++ | 2009 Section 16 Officer/FLT Member Corporate Incentive Compensation Plan. (Filed as Exhibit 99.1 to the Registrant’s March 19, 2009 Form 8-K and incorporated herein by reference.) | |
| 10.21++ | 2009 Executive Officers Base Salaries and Target Bonus Payments. (Filed as Exhibit 99.2 to the Registrant’s March 19, 2009 Form 8-K and incorporated herein by reference.) | |
| 10.22++ | Director Indemnification Agreement dated as of March 26, 2009 by and between Pegasystems Inc. and Craig Conway. (Filed as Exhibit 99.1 to the Registrant’s April 1, 2009 Form 8-K and incorporated herein by reference.) | |
| 10.23++ | 2010 Section 16 Officer/FLT Member Corporate Incentive Compensation Plan. (Filed as Exhibit 99.1 to the Registrant’s February 17, 2010 Form 8-K and incorporated herein by reference.) | |
| 10.24++ | 2010 Section Executive Officers Base Salaries and Target Bonus Payments. (Filed as Exhibit 99.2 to the Registrant’s February 17, 2010 Form 8-K and incorporated herein by reference.) | |
| 10.25 | Form of Tender and Voting Agreement by and among Pegasystems Inc., Maple Leaf Acquisition Corp. and the individuals listed on the signatures pages thereto, dated as of March 14, 2010 (Filed as Exhibit 10.1 to the Registrant’s March 15, 2010 Form 8-K and incorporated herein by reference.) | |
| 10.26++ | 2011 Section 16 Officer/FLT Member Corporate Incentive Compensation Plan. (Filed as Exhibit 99.1 to the Registrant’s March 2, 2011 Form 8-K and incorporated herein by reference.) | |
| 10.27++ | 2011 Section Executive Officers Base Salaries and Target Bonus Payments. (Filed as Exhibit 99.2 to the Registrant’s March 2, 2011 Form 8-K and incorporated herein by reference.) | |
| +21.1 | Subsidiaries of the Registrant. | |
| +23.1 | Consent of Independent Registered Public Accounting Firm—Deloitte & Touche LLP. | |
82
Table of Contents
EXHIBIT INDEX—(CONTINUED)
| Exhibit No. |
Description | |
| +31.1 | Certification pursuant to Exchange Act Rules 13a-14 and 15d-14 of the Chief Executive Officer. | |
| +31.2 | Certification pursuant to Exchange Act Rules 13a-14 and 15d-14 of the Chief Financial Officer. | |
| +32 | Certification pursuant to 18 U.S.C. Section 1350 of the Chief Executive Officer and the Chief Financial Officer. | |
| ++ | Management contracts and compensatory plan or arrangements required to be filed pursuant to Item 15(c) of Form 10-K. |
| + | Filed herewith |
83