Attached files
| file | filename |
|---|---|
| 10-K - MONARCH CEMENT CO | form10k.htm |
| EX-21 - MONARCH CEMENT CO | exhibit21.htm |
| EX-31 - MONARCH CEMENT CO | exhibit31_2.htm |
| EX-31 - MONARCH CEMENT CO | exhibit31_1.htm |
| EX-32 - MONARCH CEMENT CO | exhibit32_1.htm |
| EX-32 - MONARCH CEMENT CO | exhibit32_2.htm |
EXHIBIT 13


March 16, 2011
Annual Report to Stockholders
We entered 2010 in the midst of an extended recession with record unemployment, plummeting state budgets, and limited construction activity. The lingering impact of the severe recession limited our sales opportunities and put downward pressure on sales prices. As a result, net sales for 2010 decreased from $132.2 million in 2009 to $121.2 million in 2010, and cost of sales decreased from $110.6 million to $105.0 million during the same two periods, reducing our gross profit by $5.4 million. Because our business is extremely capital intensive, and requires employees with unique skills, we are limited in our options to reduce costs as sales decline. As a result, we experience higher per unit manufacturing costs during times of declining sales volumes. Our loss on impairment of equity investments increased from $0.5 million in 2009 to $0.9 million in 2010. Net income for 2010 totaled $0.2 million compared to $4.7 million for 2009.
I believe we are currently in one of the longest periods of reduced demand in the history of the cement industry and the Company. The Portland Cement Association (PCA) is predicting a modest gain of 1.4% in cement consumption during 2011 followed by a 4.0% gain in 2012. Longer-range PCA forecasts point to continued growth in cement consumption beginning with a 16.9% increase in 2013 due to pent-up demand.
Current economic conditions have provided opportunities to replace and add equipment at more favorable prices. While we plan to continue to take advantage of these opportunities, we anticipate most of our capital expenditures for 2011 will be aimed at meeting new environmental regulations imposed by the Environmental Protection Agency. We anticipate our capital expenditures during 2011 will exceed our 2010 capital expenditures. We believe we can finance our planned capital expenditures with a mixture of cash from operations and our existing line of credit.
As we look forward to 2011, we are hopeful that the construction industry in our market area has seen the bottom of this downturn and demand will begin to improve. We are fortunate that our product, our Company, and many of our stockholders, customers and employees span multiple generations. Together we have weathered the ups and downs in this industry and understand the value of perseverance and patience over the long term as we eagerly await the forecasted improvement in demand for our products. We cannot stress enough the importance of our many loyal customers, our devoted employees and our steadfast stockholders. Thank you for your continued support and confidence in our Company. Most importantly, we thank our Heavenly Father for His blessings and ask His continued support in meeting the challenges we face in the current uncertain economic times.
We wish to invite you, our stockholders, to attend Monarch's annual meeting to be held at 2:00 p.m. on April 13, 2011 in our corporate office at 449 1200 Street, Humboldt, Kansas. Thank you for your support throughout the years and God Bless.
Walter H. Wulf, Jr.
President and Chairman of the Board
The Monarch Cement Company and Subsidiaries
Selected Financial Data
For the Five Years Ended December 31, 2010
(Dollar amounts in thousands except per share data)
(Dollar amounts in thousands except per share data)
|
2010
|
2009
|
2008
|
2007
|
2006
|
||||||||||||||||
|
Net sales
|
$ | 121,185 | $ | 132,195 | $ | 153,886 | $ | 146,770 | $ | 154,213 | ||||||||||
|
Net income
|
$ | 224 | $ | 4,685 | $ | 10,233 | $ | 15,110 | $ | 13,211 | ||||||||||
|
Net income per share
|
$0.06 | $1.18 | $2.54 | $3.78 | $3.28 | |||||||||||||||
|
Total assets
|
$ | 174,099 | $ | 176,998 | $ | 174,765 | $ | 167,488 | $ | 162,504 | ||||||||||
|
Long‑term debt obligations
|
$ | 9,154 | $ | 12,097 | $ | 17,752 | $ | 20,206 | $ | 22,083 | ||||||||||
|
Cash dividends declared per share
|
$0.92 | $0.92 | $0.92 | $0.88 | $0.84 | |||||||||||||||
|
Stockholders’ equity per share
|
$25.32 | $25.65 | $24.98 | $24.92 | $22.84 | |||||||||||||||
Description of the Business
The Monarch Cement Company (Monarch) was organized as a corporation under the laws of the State of Kansas in 1913. Since its inception, Monarch has been engaged in the manufacture and sale of portland cement.
The manufacture of portland cement by Monarch involves the quarrying of clay and limestone and the crushing, drying and blending of these raw materials into the proper chemical ratio. The raw materials are then heated in kilns to 2800o Fahrenheit at which time chemical reactions occur forming a new compound called clinker. After the addition of a small amount of gypsum, the clinker is ground into a very fine powder that is known as portland cement. The term “portland cement” is not a brand name but is a term that distinguishes cement manufactured by this chemical process from natural cement, which is no longer widely used. Portland cement is the basic material used in the production of ready-mixed concrete that is used in highway, bridge and building construction where strength and durability are primary requirements.
Subsidiaries of Monarch (which together with Monarch are referred to herein as the “Company”) are engaged in the ready-mixed concrete, concrete products and sundry building materials business. Ready-mixed concrete is manufactured by combining aggregates with portland cement, water and chemical admixtures in batch plants. It is then loaded into mixer trucks and mixed in transit to the construction site where it is delivered to the contractor. Concrete products primarily include pre-formed components produced by the Company that are ready for use in the construction of commercial buildings, institutional facilities and parking garages.
As used herein, “Cement Business” refers to our manufacture and sale of cement and “Ready-Mixed Concrete Business” refers to our ready-mixed concrete, concrete products and sundry building materials business.
Lines of Business
The Company is engaged in two lines of business – Cement Business and Ready-Mixed Concrete Business.
The marketing area for Monarch’s products, which is limited by the relatively high cost of transporting cement, consists primarily of the State of Kansas, the State of Iowa, southeast Nebraska, western Missouri, northwest Arkansas and northern Oklahoma. Included within this area are the metropolitan markets of Des Moines, Iowa; Kansas City, Missouri; Springfield, Missouri; Wichita, Kansas; Omaha, Nebraska; Lincoln, Nebraska; Fayetteville, Arkansas and Tulsa, Oklahoma. Sales of cement are made primarily to contractors, ready-mixed concrete plants, concrete products plants, building materials dealers and governmental agencies. Monarch cement is delivered either in bulk or in paper bags and is sold under the “MONARCH” brand name. The cement is distributed both by truck and rail, either common or private carrier.
Subsidiaries of Monarch sell ready-mixed concrete, concrete products and sundry building materials in Monarch’s primary market.
The following table sets forth for the Company’s last three fiscal years the percentage of total sales by the (1) Cement Business and (2) Ready-Mixed Concrete Business:
|
Total Sales
|
|||||
|
December 31,
|
|||||
|
2010
|
2009
|
2008
|
|||
| Cement Business | 40.8% | 42.1% | 45.3% | ||
| Ready-Mixed Concrete Business | 59.2% | 57.9% | 54.7% | ||
| 100.0% | 100.0% | 100.0% | |||
Management’s Discussion and Analysis
of Financial Condition and Results of Operations
Forward-Looking Statements
Certain statements under the caption “Management’s Discussion and Analysis of Financial Condition and Results of Operations” and elsewhere in this Annual Report, our Form 10-K report and our other reports filed with the Securities and Exchange Commission constitute “forward-looking information”. Except for historical information, the statements made in this report are forward-looking statements that involve risks and uncertainties. You can identify these statements by forward-looking words such as “should”, “expect”, “anticipate”, “believe”, “intend”, “may”, “hope”, “forecast” or similar words. In particular, statements with respect to variations in future demand for our products in our market area or the future activity of federal and state highway programs and other major construction projects, the timing, scope, cost and benefits of our proposed and recently completed capital improvements and expansion plans, including the resulting increase in production capacity, our forecasted cement sales, the timing and source of funds for the repayment of our line of credit, our ability to pay dividends at the current level, the timing and/or collectability of retainage, our anticipated expenditures for benefit plans, and our anticipated increase in solid fuels and electricity required to operate our facilities and equipment are all forward-looking statements. You should be aware that forward-looking statements involve known and unknown risks, uncertainties and other factors that may affect the actual results, performance or achievements expressed or implied by such forward-looking statements. Such factors include, among others:
-
general economic and business conditions;
-
competition;
-
raw material and other operating costs;
-
costs of capital equipment;
-
changes in business strategy or expansion plans;
-
demand for our Company’s products;
-
cyclical and seasonal nature of our business;
-
the effect of weather on our business;
-
the effect of environmental and other government regulations;
-
the availability of credit at reasonable prices; and
-
the effect of federal and state funding on demand for our products.
We have described under the caption “Risk Factors” in Item 1A of our Annual Report on Form 10-K for the year ended December 31, 2010 and in other reports that we file with the SEC from time to time, additional factors that could cause actual results to be materially different from those described in the forward-looking statements. Other factors that we have not identified in this report could also have this effect. You are cautioned not to put undue reliance on any forward-looking statement, which speak only as of the date they were made.
Results of Operations
|
Ready‑Mixed
|
||||||||||||
|
Cement
|
Concrete
|
|||||||||||
|
Business
|
Business
|
Consolidated
|
||||||||||
|
For the Year Ended December 31, 2010
|
||||||||||||
|
Sales to unaffiliated customers
|
$ | 49,436,170 | $ | 71,748,664 | $ | 121,184,834 | ||||||
|
Income (loss) from operations
|
6,147,514 | (6,005,382 | ) | 142,132 | ||||||||
|
For the Year Ended December 31, 2009
|
||||||||||||
|
Sales to unaffiliated customers
|
$ | 55,687,700 | $ | 76,506,842 | $ | 132,194,542 | ||||||
|
Income (loss) from operations
|
7,019,307 | (2,070,723 | ) | 4,948,584 | ||||||||
|
For the Year Ended December 31, 2008
|
||||||||||||
|
Sales to unaffiliated customers
|
$ | 69,683,762 | $ | 84,202,711 | $ | 153,886,473 | ||||||
|
Income (loss) from operations
|
18,362,170 | (1,607,168 | ) | 16,755,002 | ||||||||
See Note 10, Lines of Business, of Notes to Consolidated Financial Statements for further discussion of each of the Company’s reportable operating lines of business.
General--Our products are used in residential, commercial and governmental construction. In recent years, the Company has spent substantial sums on major plant modifications designed to increase our cement production capacity to meet our customers’ needs and to improve our production processes. Improvements are planned over the next few years to further enhance our production processes and to meet emission limitations included in the latest regulations issued by the Environmental Protection Agency (EPA).
The residential construction slowdown, which began during 2008 and continued through 2010, has resulted in a declining demand for cement and ready-mixed concrete. The additional slowdown in commercial construction has also impacted the demand for our cement and ready-mixed concrete. Recent economic forecasts from the Portland Cement Association (PCA) indicate the construction industry is likely to remain weak for another year or more. This weakness in the industry is putting downward pressure on the pricing of cement and ready-mixed concrete. The decline in volume and pricing pressure in the industry has adversely impacted our revenues, gross margins, and net profits. To a lesser extent, sales of cement and ready-mixed concrete in the first
3.
quarter of 2010 were adversely impacted by a longer period of cold weather when compared to the same period in 2009.
Based on sales forecasts and inventory levels, the Company elected to reduce cement production in both the first quarter of 2009 and 2010 to undertake plant repairs and maintenance, largely using our own production personnel. The Company normally performs repairs and maintenance every winter, but the decision to use employees or outside contractors is determined by anticipated sales demand, by whether we have the internal expertise and by our inventory target levels. During the remainder of the year, the Company evaluates inventory levels and sales forecasts to determine if reductions in cement production are warranted and can be scheduled around maintenance needs. In addition to costs that vary with the volume of production, our cost of sales includes certain fixed costs that do not vary with the volume of production. We have extremely limited ability to reduce these fixed costs in the short term. As a result, lower production levels which result from extended shutdowns generally have, and in 2009 and 2010 have had, a negative impact on our gross profit margins.
2010 Compared to 2009--Consolidated net sales for the year ended December 31, 2010 were approximately $121.2 million, a decrease of $11.0 million as compared to the year ended December 31, 2009. Sales in our Cement Business were lower by $6.3 million while sales in our Ready-Mixed Concrete Business decreased $4.7 million. Cement Business sales decreased $5.5 million due to a 9.9% decrease in volume sold and $0.8 million due to price decreases. Decreases in construction contract sales of $9.0 million more than offset the increases in sales of other products in the Ready-Mixed Concrete Business. Ready-mixed concrete sales increased $3.8 million primarily due to an 8.0% increase in cubic yards sold. Sales of block, brick and other sundry items increased $0.5 million.
Consolidated cost of sales for 2010 were $5.7 million less than cost of sales for 2009. Cost of sales in our Cement Business was lower by $4.9 million, while cost of sales in our Ready-Mixed Concrete Business was lower by $0.8 million. Cement Business cost of sales decreased $4.0 million due to the 9.9% decrease in volume sold. The remaining $0.9 million decrease was due to reduced contract labor expenses. Ready-Mixed Concrete Business cost of sales increased $3.5 million due to the 8.0% increase in cubic yards of ready-mixed concrete sold and $0.5 million due to increases in direct material costs. Ready-Mixed Concrete Business cost of sales increases were offset by a $5.2 million decrease in cost of sales for construction contracts which resulted from the $9.0 million decrease in construction contract sales. With the reduction in contract sales, the Company had fewer projects over which to allocate its indirect costs resulting in a significantly smaller reduction in cost of goods sold compared to the $9.0 million reduction in sales. The remaining $0.4 million increase in the Ready-Mixed Concrete Business segment was due to increases in the block, brick and other sundry items cost of sales.
As a result of the above sales and cost of sales factors, our overall gross profit rate for the year ended December 31, 2010 was 13.4% compared to 16.3% for the year ended December 31, 2009. The decline was primarily due to the Ready-Mixed Concrete Business in which the gross profit rate dropped from 8.6% for 2009 to 3.6% for 2010. The segment’s gross profit rate decline was largely due to the deterioration of the gross profit margin in construction contract sales mentioned above. The Cement Business gross profit rate improved slightly from 26.9% for 2009 to 27.5% for 2010.
Selling, general and administrative expenses decreased by $0.5 million or 3.2% for the year ended December 31, 2010 as compared to the year ended December 31, 2009. These costs are normally considered fixed costs that do not vary significantly with changes in sales volume.
Other, net contains miscellaneous nonoperating income (expense) items excluding interest income, interest expense, gains (losses) on equity investments and dividend income. Significant items in other, net for 2010 include farm income of approximately $154,500, a gain of $700,000 related to the sale of a nonoperating asset, and proceeds from scrap sales of approximately $51,000. Significant items in other, net for 2009 include income
4.
from oil properties of approximately $180,000, farm income of approximately $90,000, proceeds from an insurance policy of approximately $429,000 and proceeds related to the settlement of a lawsuit of approximately $424,000.
During 2010, there was a $0.9 million impairment loss recorded on equity investments due to impairments that were other-than-temporary while the Company realized a $0.5 million impairment loss for 2009. See Note 2, Investments, of Notes to Consolidated Financial Statements for further discussion.
The effective tax rates for 2010 and 2009 were 394.3% (a tax benefit of $300,000 on a book loss of $76,078) and 13.0%, respectively. The Company’s effective tax rate for 2010 differed from the federal and state statutory income tax rate primarily due to the effects of percentage depletion and domestic production activities deduction. For the year 2010, the Company incurred a book loss before taxes of $(76,078) while its taxable income was approximately $2.5 million before percentage depletion and the domestic production activities deduction. The differences between the book loss before taxes and taxable income before percentage depletion and the domestic production activities deduction were primarily timing differences resulting in an increase in the Company’s deferred tax asset. For example, in 2010, the Company’s net periodic post-retirement benefit cost expensed on the books was $3.1 million; however, the Company’s tax deduction was limited to its actual contributions of $1.3 million as reported in Note 6, Postretirement Benefits, of Notes to Consolidated Financial Statements. The difference of $1.8 million is a timing difference between book and taxable income which increased our deferred tax asset by approximately $0.8 million. As the Company’s net income decreased, the permanent differences between book and taxable income for percentage depletion and domestic production activities did not decrease proportionately resulting in a reduction in our effective tax rate. The tax deductions for percentage depletion and domestic production activities are permanent book tax differences that resulted in a reduction in taxable income from approximately $2.5 million to $0.8 million. During 2010, percentage depletion increased the tax benefit and changed the effective tax rate by 725.6%. In 2009, percentage depletion decreased the effective tax rate by 12.6%.
The change in the effective tax rate for 2010 as compared with 2009 was also affected by an income tax charge of $685,000 recorded during the first quarter of 2010 as a result of the Patient Protection and Affordable Care Act, as modified by the Health Care and Education Reconciliation Act of 2010. As a result of this legislation, beginning in 2013, we will no longer be able to claim an income tax deduction for prescription drug benefits provided to retirees that were subsequently reimbursed under the Medicare Part D retiree drug subsidy. During 2010, the income tax charges related to postretirement benefits decreased our tax benefit which changed the effective tax rate by 900.4%.
2009 Compared to 2008--Consolidated net sales for the year ended December 31, 2009 were approximately $132.2 million, a decrease of $21.7 million as compared to the year ended December 31, 2008. Sales in our Cement Business were lower by $14.0 million while sales in our Ready-Mixed Concrete Business decreased $7.7 million. Cement Business sales decreased $13.2 million due to decreased volume sold and $0.8 million due to price decreases. Increases in construction contract sales of $3.7 million helped offset the declines in other areas of the Ready-Mixed Concrete Business. Ready-mixed concrete sales declined $10.4 million due to a $10.9 million (19.9%) decrease in cubic yards sold net of a $0.5 million increase due to price increases. Block, brick and other sundry items accounted for the remaining decline in sales.
Consolidated cost of sales for 2009 were $10.2 million less than cost of sales for 2008. Cost of sales in our Cement Business was lower by $3.1 million, while cost of sales in our Ready-Mixed Concrete Business was lower by $7.1 million. Cement Business cost of sales decreased $8.3 million due to the 18.9% decrease in volume sold which was largely offset by higher production costs primarily resulting from inefficiencies of lower production levels. Ready-Mixed Concrete Business cost of sales decreased $9.4 million due to the 19.9% decrease in cubic yards of ready-mixed concrete sold and $0.8 million due to reductions in direct material costs.
5.Ready-Mixed Concrete Business cost of sales decreases were partially offset by a $2.4 million increase in cost of sales for construction contracts which resulted from the $3.7 million increase in construction contract sales.
As a result of the above sales and cost of sales factors, our overall gross profit rate for the year ended December 31, 2009 was 16.3% compared to 21.4% for the year ended December 31, 2008.
Selling, general and administrative expenses increased by 2.2% for 2009 as compared to 2008. These costs are normally considered fixed costs that do not vary significantly with changes in sales volume.
During 2009, there was a $0.5 million impairment loss recorded on equity investments due to impairments that were other-than-temporary while the Company realized a $4.2 million impairment loss for 2008. See Note 2, Investments, of Notes to Consolidated Financial Statements for further discussion.
Other, net contains miscellaneous nonoperating income (expense) items excluding interest income, interest expense, gains (losses) on equity investments and dividend income. Significant items in other, net for 2009 include income from oil properties of approximately $180,000, farm income of approximately $90,000, proceeds from an insurance policy of approximately $429,000 and proceeds related to the settlement of a lawsuit of approximately $424,000. Significant items in other, net for 2008 include income from oil properties of approximately $466,000, proceeds from scrap sales of approximately $230,000 and farm income of approximately $108,000.
The effective tax rates for 2009 and 2008 were 13.0% and 21.0%, respectively. The Company’s effective tax rate differs from the federal and state statutory income tax rate primarily due to the effects of percentage depletion, domestic production activities deduction, and valuation allowance. During 2009 and 2008, percentage depletion decreased the effective tax rate by 12.6% and 10.2%, respectively.
Liquidity
The Company considers all liquid investments with original maturities of three months or less to be cash equivalents. At December 31, 2010 and 2009, cash equivalents consisted primarily of money market investments and repurchase agreements with various banks. The FDIC, through the Dodd-Frank Wall Street Reform and Consumer Protection Act (Dodd-Frank Act), has permanently raised the standard maximum deposit insurance amount (SMDIA) to fully guarantee all deposit accounts up to $250,000. In addition, the FDIC has adopted section 343 of the Dodd-Frank Act, effective December 31, 2010, which provides for unlimited deposit insurance for noninterest-bearing transaction accounts for two years starting December 31, 2010. This temporary unlimited coverage is in addition to, and separate from, the coverage of at least $250,000 available to depositors under the FDIC’s general deposit insurance rules.
At December 31, 2010, the Company’s accounts did not exceed federally insured limits. The Company also had $1.3 million in sweep arrangement accounts that were not covered by FDIC’s general deposit insurance. See Note 1(e), Cash Equivalents, of Notes to Consolidated Financial Statements for further discussion.
We are able to meet our cash needs primarily from a combination of cash from operations and bank loans.
Net cash provided by operating activities totaled $13.9 million for 2010, a $4.8 million decrease from 2009. Net income decreased by $4.5 million from 2009 to 2010, primarily due to the decline in overall sales volume combined with some decline in gross profit margins. A $0.9 million non-cash adjustment for the other-than-temporary loss on impairment of other investments was realized in 2010 while $0.5 million was realized in 2009. See Note 2, Investments, of Notes to Consolidated Financial Statements for further discussion. Receivables decreased by $2.9 million from 2008 to 2009 due primarily to the $3.9 million decline in December 2009 sales as compared to December 2008 sales. Receivables decreased $0.5 million from 2009 to 2010 despite
6.
the $1.3 million increase in December 2010 sales as compared to December 2009 sales primarily as a result of a reduction in noncurrent balances in 2010. Cash provided by operating activities in 2010 includes $1.7 million for decreased inventories primarily due to the consumption of coal and petroleum coke in the production process exceeding purchases. Cash was used by operating activities in 2009 for increased inventories of $3.0 million. Finished cement inventory increased due to greater volumes held in inventory and to the higher cost of those inventories in 2009; fuel, gypsum, paper sacks and other inventory increased primarily due to coal and petroleum coke purchases exceeding amounts consumed in the production process; and operating and maintenance supplies increased due to the purchase of specialized repair parts that support the recently completed production facility improvements. Accounts payable and accrued liabilities declined approximately $2.3 million in 2010 from 2009 levels primarily due to a decline in prepayments held on account in accrued liabilities.
Net cash provided by operating activities totaled $18.7 million for 2009, a $5.3 million decrease from 2008. Net income decreased by $5.5 million from 2008 to 2009. A $4.2 million non-cash adjustment for the other-than-temporary loss on impairment of other investments was realized in 2008 while $0.5 million was realized in 2009. See Note 2, Investments, of Notes to Consolidated Financial Statements for further discussion. Cash was provided by operating activities when receivables decreased by $2.9 million during 2009. Cash used for operating activities includes $3.0 million for increased inventories. Finished cement inventory increased due to greater volumes held in inventory and to the higher cost of those inventories compared to 2008; fuel, gypsum, paper sacks and other inventory increased primarily due to coal and petroleum coke purchases exceeding amounts consumed in the production process; and operating and maintenance supplies increased due to the purchase of specialized repair parts that support the recently completed production facility improvements. Accounts payable and accrued liabilities remained approximately at 2008 levels which had increased from 2007 due to prepayments held on account in accrued liabilities.
Net cash provided by operating activities totaled $24.0 million for 2008, a $1.7 million increase over 2007. Net income decreased by $5.0 million from 2007 to 2008. There were no realized gains on sale of other investments for 2008; however a $4.2 million non-cash adjustment for the other-than-temporary loss on impairment of other investments was realized while none was realized in 2007. Cash was also provided by the increase in accounts payable and accrued liabilities which increased by $2.0 million in 2008 primarily due to prepayments held on account in accrued liabilities. Cash used for operating activities includes receivable increases of $2.0 million in 2008.
Net cash used for investing activities totaled $6.0 million, $12.9 million, and $19.2 million in 2010, 2009 and 2008, respectively. The $6.3 million decrease in net cash used for investing activities from 2008 to 2009 is principally due to the $2.1 million used for short-term investments in 2008 while $2.1 million was provided by the redemption of the same short-term investments in 2009. In addition, $1.6 million was provided by the disposal of equity investments in 2009 while no disposals were made in 2008. The $6.9 million decrease in net cash used for investing activities from 2009 to 2010 is due to a $4.2 million decrease in purchases of equity investments, a $1.2 million decline in proceeds from disposals of equity investments, and a $3.6 million decline in the cash acquisition of property, plant and equipment. In addition, $1.7 million was used for business acquisitions and $2.1 million was provided by the redemption of short-term investments in 2009 while no such acquisitions or redemptions were made in 2010. During 2010, $0.7 million was provided from the sale of a nonoperating asset.
Net cash used for financing activities totaled $7.3 million, $6.8 million, and $6.1 million for 2010, 2009 and 2008, respectively. The differences were primarily due to changes in the line of credit balance, purchases of noncontrolling interests in 2009 and the purchase of treasury stock in 2010. The line of credit was used to cover operating expenses and for capital expenditures.
7.
In December 2010, Monarch renewed and modified the loan agreement with its current lender, Bank of Oklahoma, N.A., under similar terms as the prior agreement. The amended agreement adds a financial covenant that requires the Company to pledge its investment account to the Bank of Oklahoma, N.A. as collateral for the term loan and revolving line of credit. The fair value of the investment account pledged as collateral was $20.6 million as of December 31, 2010. The proceeds of the sale of any assets held in the investment account would be paid to the Bank of Oklahoma, N.A. to be applied to the balance of the revolving line of credit and then to the term loan, at the lender’s discretion. Monarch’s current secured credit commitment consists of a $17.8 million term loan maturing December 31, 2014 and a $15.0 million line of credit maturing December 31, 2011. See Note 4, Line of Credit and Long-Term Debt, of Notes to Consolidated Financial Statements for further discussion of the terms of this credit commitment. The term loan was used to help finance the expansion project at our cement manufacturing facility. The line of credit is used to cover operating expenses primarily during the first half of the year when we build inventory due to the seasonality of our business and for capital expenditures. Our Board of Directors has given management the authority to borrow a maximum of $50 million. We have not discussed additional financing with any banks or other financial institutions; therefore, no assurances can be given that we will be able to obtain this additional borrowing on favorable terms, if at all.
Contractual obligations at December 31, 2010, consisting of maturities on long-term debt, estimated interest payments on debt, pension, postretirement benefit obligations and open purchase orders are as follows:
|
2011
|
2012
|
2013
|
2014
|
2015
|
Thereafter
|
|||||||||||||||||||
|
Long-term debt
|
$ | 2,823,648 | $ | 3,018,713 | $ | 3,015,188 | $ | 3,120,186 | $ | - | $ | - | ||||||||||||
|
Interest payments
|
367,865 | 265,243 | 164,517 | 63,928 | - | - | ||||||||||||||||||
|
Pension
|
3,118,000 | - | - | - | - | - | ||||||||||||||||||
|
Postretirement
|
||||||||||||||||||||||||
|
benefit obligations
|
1,773,836 | 1,878,055 | 2,000,562 | 2,109,258 | 2,214,397 | 11,936,481 | ||||||||||||||||||
|
Open purchase orders
|
4,991,021 | 1,701,171 | 850,585 | - | - | - | ||||||||||||||||||
|
Total
|
$ | 13,074,370 | $ | 6,863,182 | $ | 6,030,852 | $ | 5,293,372 | $ | 2,214,397 | $ | 11,936,481 | ||||||||||||
The long-term debt obligation is based on current interest rates and assumes that the term loan is paid off at maturity.
The Company has been required to make a pension contribution each of the past three years. In 2010, 2009 and 2008, the Company contributed approximately $2.3 million, $2.1 million and $1.4 million, respectively, to the pension fund. No estimates of required pension payments have been asked for or made beyond 2011. The decline in the bond and stock markets in 2008 significantly reduced the value of our pension funds at December 31, 2008. By December 31, 2010, actual returns on plan assets had increased the value of our pension funds enough to recover approximately 80% of the 2008 year reductions. Based on the pension laws currently in effect, any resulting increases in minimum funding requirements could cause a negative impact to our liquidity. See Note 7, Pension Plans, of Notes to Consolidated Financial Statements for disclosures about 2010 pension contributions.
Each segment of the cement manufacturing process requires significant investment in major pieces of equipment. Once installed, this equipment, if properly maintained, can function for many years. Generally we spend several million dollars each year on preventive maintenance and equipment repairs; however, capital expenditures vary from year to year. A piece of equipment that costs $25 - $30 million may remain in service for fifty years. After a period of time, this equipment may be modified to incorporate the latest technology, increasing its efficiency and production capacity and extending its useful life. Modifications may also be required to comply with environmental regulations. In the years Monarch invests in major equipment replacements or enhancements, current operations do not generate enough cash to pay for the improvements, requiring us to use our cash on hand or bank financing. As projects are completed, we seek to reduce the amount needed for major capital expenditures, allowing us to pay off any outstanding bank loans and accumulate cash for the next major plant improvement.
8.
The Company has projects in the planning and design phases in addition to projects already in progress. For discussion of these projects, see “Capital Resources” below. We anticipate capital expenditures for 2011 to exceed 2010 levels, but we do not anticipate the need for additional bank financing other than that available under the existing line of credit.
For several years the Company has paid a dividend in January, March, June and September. For each of the four dividend payments of 2010, the Board of Directors declared a $0.23 per share dividend. Under the terms and conditions of our loan agreement, the Company’s ability to pay dividends is subject to its satisfaction of a requirement to maintain a tangible net worth of $90 million and an adjusted tangible net worth, which is tangible net worth before accumulated other comprehensive income, of $95 million. The Company was in compliance with these requirements at year end. The minimum net worth requirements could impact the Company’s ability to pay dividends in the future. Although dividends are declared at the Board’s discretion and could be impacted by the minimum net worth requirements of the Company’s loan agreement, we project future earnings will support the continued payment of dividends at the current level.
Financial Condition
Total assets as of December 31, 2010 were $174.1 million, a decrease of $2.9 million since December 31, 2009 due primarily to decreases in receivables, inventories and property, plant and equipment and an increase in investments. Receivables decreased by $0.5 million from 2009 to 2010 despite a $1.3 million increase in December 2010 sales as compared to December 2009 sales primarily as a result of a reduction in noncurrent balances in December 2010 receivables. Inventories decreased by $1.7 million primarily due to a decrease in fuel inventory as a result of the consumption of coal and petroleum coke in the production process in excess of purchases. In order to conserve cash, we limited our capital expenditures resulting in a $5.9 million reduction in net property, plant and equipment. Investments increased $5.6 million primarily as a result of an increase in the fair value of equity investments.
Other accrued liabilities decreased by $3.3 million in 2010 from 2009 levels primarily due to a decline in prepayments held on account. Indebtedness decreased about $3.4 million during 2010 primarily as a result of payments on the bank loan with cash provided by operations.
During 2010, we adjusted the pension liability, resulting in an increase in long-term accrued pension expense of $0.5 million and a decrease in stockholders’ equity of $0.5 million. The decrease in stockholders’ equity was due to a current year actuarial loss. We also adjusted the postretirement liability, resulting in an increase in accrued postretirement expense of $4.6 million and a decrease in stockholders’ equity of $0.9 million. The decrease in stockholders’ equity was due to a current year actuarial loss. Actuarial gains (losses) are a measure of the difference between actual experience and that expected based upon the actuarial assumptions between two measurement dates. The gains (losses) are directly calculated and are amortized over average expected future service, to the extent that such gains (losses) are greater than 10% of the greater of the Accrued Postretirement Benefit Obligation and the Plan’s assets.
Stockholders’ equity decreased 1.50% during 2010 as a result of net income and unrealized holding gain changes in comprehensive income, which was reduced by dividends, the retirement of stock, and the changes in comprehensive income due to pension and postretirement. Basic earnings were $0.06 per share and dividends declared were $0.92 per share for 2010.
9.
Capital Resources
The Company historically invests $10 million to $12 million per year on capital expenditures to keep its equipment and facilities in good operating condition. Property, plant and equipment expenditures for the year 2010 totaled $5.5 million. These expenditures were for routine equipment purchases and were almost equally divided between the Cement Business and Ready-Mixed Concrete Business. Cash expenditures for property, plant and equipment for 2010 totaled approximately $6.2 million, excluding the amounts that are included in accounts payable.
The Company does not currently meet certain emission limitations included in latest regulations issued by the EPA. For discussion on the regulations, see NESHAP discussed below under “Environmental Regulations”. To comply with these new regulations, the Company will need to install additional pollution control equipment in its Cement Business. There is no proven technology that enables us to give 100% assurance that we can reach the limits required by the new regulations; however, we feel compliance is possible at our modern facility through the installation of additional pollution control equipment. We plan to use a step approach, beginning with the installation of additional dust collectors on one of our two kilns. Once they are installed, we will test for compliance to determine if other pollution control equipment is needed. If we are not in compliance, we will continue to install pollution control equipment, testing for compliance after each installation, until our emissions are within limits. Once we have successfully modified one kiln to meet the new emission standards, we will proceed with our second kiln. Equipment (and its estimated cost) which may be required includes additional dust collectors on both kilns ($4.0 million), upgraded dust collectors on both clinker coolers ($3.0 million), hydrated lime injection system ($0.6 million), roller mill upgrade ($4.0 million) and a chloride by-pass system ($7.0 million). Cost estimates will be updated as the modifications are engineered and priced for our facility. We are hopeful that we can comply with the new regulations without having to upgrade the roller mill or install a chloride by-pass system. We have until September 2013 to comply and may be able to get a one year extension if we have shown continuous progress toward becoming compliant. Various court challenges and legislative actions are pending against the NESHAP regulations issued by the EPA. If any of these court challenges or legislative actions are successful in delaying or overruling the regulation, we will evaluate whether or not to complete the projects currently in process.
NESHAP regulations also require us to install analyzers capable of continuously monitoring certain pollutants. Analyzers capable of continuously monitoring these pollutants at the extremely low levels (i.e. emissions of particulate matter are limited to 3 parts per million) specified in the regulation do not currently exist. We are partnering with an analyzer manufacturer to assist in the development of the required technology and estimate we will spend approximately $0.8 million for these analyzers.
The Company plans to invest in other miscellaneous equipment and facility improvements in both the Cement Business and Ready-Mixed Concrete Business in 2011. These expenditures, plus the ones discussed in the above paragraphs related to NESHAP compliance, are expected to reach approximately $8.9 million during 2011 and will be funded with a mixture of cash from operations and temporary bank loans. We do not anticipate the need for additional bank financing beyond the amount available through our existing revolving line of credit. Projects in the planning and design phases include an overland conveyor system to improve efficiencies in moving raw materials. The Company has capitalized an accumulated $0.5 million for the overland conveyor system. Due to the reduction in sales caused by the economic slowdown, and the uncertainty of the total amount of capital expenditures required to become compliant with NESHAP, we are indefinitely postponing this project. The Company did not impair the carrying amount of the assets related to the overland conveyor system based on a review of the project which indicated the Company would likely recover their carrying amounts upon resumption of the project. For further discussion of the Company’s accounting policy for the impairment of long-lived assets, see Accounting Policies below.
10.
Accounting Policies--The critical accounting policies with respect to the Company are those related to pension benefits, postretirement benefits, and long-lived assets.
Monarch has defined benefit pension plans covering substantially all permanent employees in the Cement Business. Plans covering staff (salaried) employees provide pension benefits that are based on years of service and the employee’s last sixty calendar months of earnings or the highest five consecutive calendar years of earnings out of the last ten calendar years of service, whichever is greater. Plans covering production (hourly) employees provide benefits of stated amounts for each year of service. Generally, Monarch’s funding policy is to contribute annually an amount within the minimum/maximum range of tax deductible contributions. Contributions are intended to provide for benefits attributed to service to date and for those expected to be earned in the future. Monarch expects 2011 cash expenditures for these plans to be approximately $3.1 million.
Monarch also provides other postretirement employee benefits including health care and life insurance benefits to all retired employees in the Cement Business who, as of their retirement date, have completed ten or more years of credited service under the pension plans and retire with an immediate pension. These benefits are self-insured by Monarch and are paid out of Monarch’s general assets. Monarch expects 2011 cash expenditures for postretirement benefits to be approximately $1.8 million.
We account for our pension plans in accordance with Financial Accounting Standards Board (FASB) Accounting Standards Codification (ASC) 715-30, “Defined Benefit Plans - Pension” and our postretirement benefits in accordance with FASB ASC 715-60, “Defined Benefit Plans - Other Postretirement”. ASC 715-30 and 715-60 require us to make various estimates and assumptions, including discount rates used to value liabilities, expected rates of return on plan assets, salary increases, employee turnover rates, anticipated employee mortality rates and expected future healthcare costs. The estimates we used are based on our historical experience as well as current facts and circumstances and are updated at least annually. These sections of the ASC also require us to recognize the entire overfunded or underfunded status of our defined benefit and postretirement plans as assets or liabilities in the statement of financial position and to recognize changes, net of taxes, in that funded status in the year in which the changes occur through comprehensive income.
In December 2008, the FASB issued an amendment to ASC 715-20, “Compensation - Retirement Benefits - Defined Benefit Plans - General”, which requires enhanced disclosures regarding Company benefit plans. Disclosures regarding plan assets should include discussion about how investment allocation decisions are made, the major categories of plan assets, the inputs and valuation techniques used to measure plan assets and significant concentrations of risk within the plan assets. These amendments to ASC 715-20 are effective for fiscal years ending after December 15, 2009. Prior year periods presented for comparative purposes are not required to comply. See Note 7, Pension Plans, of Notes to Consolidated Financial Statements for disclosures required by this standard.
The Company continually evaluates whether events or changes in circumstances have occurred that would indicate that the carrying amount of long-lived assets may not be recoverable. An impairment loss would be recognized when estimated future cash flows expected to result from the use of the asset and its eventual disposition is less than its carrying amount. Examples of events or circumstances that could trigger a review could include, but are not limited to, a prolonged economic downturn, current period operating or cash flow losses combined with a history of losses or a forecast of continuing losses associated with the use of an asset or asset group, technological advances in equipment, accumulated costs related to the construction of production equipment or facilities that are significantly higher than originally expected and a significant adverse change in legal factors or in the business climate that could affect the value of a long-lived asset including an adverse action or assessment by a regulator. Various factors that the Company considers in its review include changes in expected use of the assets, changes in technology, changes in operating performance and changes in expected future cash flows. No asset impairment was recognized during the years ended December 31, 2010 and 2009.
11.
The following are some additional accounting standards recently adopted by the Company:
In January 2010, the FASB issued Accounting Standards Update (ASU) 2010-02, “Accounting and Reporting for Decreases in Ownership of a Subsidiary--a Scope Clarification”, which clarifies who the scope of the decrease in ownership provisions of the Subtopic and related guidance apply to and expands the disclosures about the deconsolidation of a subsidiary or derecognition of a group of assets within the scope of Subtopic 810-10. The amendments in this Update were effective for the Company beginning January 1, 2010 and their adoption did not have a material impact on our consolidated financial statements.
In January 2010, the FASB issued ASU 2010-06, “Improving Disclosures About Fair Value Measurements”, which amends Subtopic 820-10 with new disclosure requirements and clarification of existing disclosure requirements. Reporting entities must make new disclosures about recurring or nonrecurring fair-value measurements including significant transfers into and out of Level 1 and Level 2 fair-value measurements and information on purchases, sales, issuances, and settlements on a gross basis in the reconciliation of Level 3 fair-value measurements. The ASU also provides additional guidance related to the level of disaggregation in determining classes of assets and liabilities and disclosures about inputs and valuation techniques. ASU 2010-06 is effective for annual or interim reporting periods beginning after December 15, 2009, except for Level 3 reconciliation disclosures which are effective for annual periods beginning after December 15, 2010 and for interim periods within those fiscal years. For the Company, ASU 2010-06 was effective beginning January 1, 2010. The adoption of ASU 2010-06 did not have a material impact on our disclosures or our consolidated financial statements.
In February, 2010, the FASB issued ASU No. 2010-09, “Subsequent Events (Topic 855) – Amendments to Certain Recognition and Disclosure Requirements”. This ASU provides amendments to Subtopic 855-10 to clarify that SEC filers are required to evaluate subsequent events through the date that the financial statements are issued, but are not required to disclose the date through which subsequent events have been evaluated. ASU 2010-09 was effective upon issuance for the Company and its adoption did not have a material impact on the Company’s consolidated financial statements.
See Note 14, Future Change in Accounting Principles, of Notes to Consolidated Financial Statements for information concerning the accounting pronouncements issued by the Financial Accounting Standards Board.
Accounting and Disclosure Rules Impact--Generally accepted accounting principles and accompanying accounting pronouncements, implementation guidelines, and interpretations for many areas of our business, such as revenue recognition, accounting for investments, fair value estimates, and accounting for pension and postretirement, are very complex and involve significant and sometimes subjective judgments. Changes in these rules or their interpretation could significantly impact our reported earnings and operating income and could add significant volatility to those measurements in the future, without a corresponding change in cash flows.
Market Risks--Market risks relating to the Company’s operations result primarily from changes in demand for our products. Construction activity has been adversely impacted by the global financial crisis even though interest rates are at historically low levels. A continuation of the financial crisis, including a scarcity of credit, or a significant increase in interest rates could lead to a further reduction in construction activities in both the residential and commercial market. Budget shortfalls during economic slowdowns could cause money to be diverted away from highway projects, schools, detention facilities and other governmental construction projects. Reduction in construction activity lowers the demand for cement, ready-mixed concrete, concrete products and sundry building materials. As demand decreases, competition to retain sales volume could create downward pressure on sales prices. The manufacture of cement requires a significant investment in property, plant and equipment and a trained workforce to operate and maintain this equipment. These costs do not materially vary with the level of production. As a result, by operating at or near capacity, regardless of demand, companies can
12.
reduce per unit production costs. The continual need to control production costs encourages overproduction during periods of reduced demand. See Note 8, Significant Estimates and Certain Concentrations, of Notes to Consolidated Financial Statements for further discussion.
The Company invests in equity investments which are subject to market fluctuations. The Company had $24.0 million of equity securities, primarily of publicly traded entities, as of December 31, 2010. The aggregate amount of securities carried at cost, for which the Company has not elected the fair value option, was $2.4 million as of December 31, 2010. The remaining $21.6 million in equity investments, which are stated at fair value, are not hedged and are exposed to the risk of changing market prices. The Company classifies all securities as “available-for-sale” for accounting purposes and marks them to market on the balance sheet at the end of each period unless they are securities for which the Company has not elected the fair value option. Securities carried at cost are adjusted for impairment, if conditions warrant. Management estimates that its publicly traded investments will generally be consistent with trends and movements of the overall stock market excluding any unusual situations. An immediate 10% change in the market price of our equity securities carried at fair value would have a $1.3 million effect on comprehensive income. At December 31, 2010, the Company evaluated all of its equity investments for impairment. The results of those evaluations are discussed in Note 2, Investments, of Notes to Consolidated Financial Statements.
Interest rates on the Company’s term loan and line of credit for 2011 are variable, subject to interest rate minimums or floors, and are based on the lender’s national prime rate less 0.75% and lender’s national prime rate less 0.50%, respectively. See Note 4, Line of Credit and Long-Term Debt, of Notes to Consolidated Financial Statements.
Inflation-- Inflation directly affects the Company’s operating costs. The manufacture of cement requires the use of a significant amount of energy. The Company burns primarily solid fuels, such as coal and petroleum coke, and to a lesser extent natural gas, in its kilns. Increases above the rate of inflation in the cost of these solid fuels, natural gas, or in the electricity required to operate our cement manufacturing equipment could adversely affect our operating profits. Prices of the specialized replacement parts and equipment the Company must continually purchase tend to increase directly with the rate of inflation with the exception of equipment and replacement parts containing large amounts of steel. In recent years, steel prices have tended not to follow inflationary trends, but rather have been influenced by worldwide demand. Prices for diesel fuel used in the transportation of our raw materials and finished products also vary based on supply and demand and in some years exceed the rate of inflation adversely affecting our operating profits.
Environmental Regulations--The Company’s cement plant emissions are regulated by the Kansas Department of Health and Environment (KDHE) and the EPA. KDHE is responsible for the administration and enforcement of Kansas environmental regulations, which typically mirror national regulations.
A recent ruling promulgated by the EPA in 2009 required us to install carbon dioxide (CO2) Continuous Emission Monitors (CEMs) to track various aspects of the production process to effectively establish a Greenhouse Gas (GHG) inventory for our cement manufacturing facility.
The EPA Administrator has made two important findings clearing the way for EPA to regulate greenhouse gases under the Clean Air Act. The “Endangerment Finding” clarifies EPA’s belief that current and projected concentrations of six key greenhouse gases in the atmosphere pose a threat to human health and welfare. Further, the “Cause or Contribute Finding,” associates the emissions of the six named GHGs with the threat to public health and welfare. At this time it is difficult to determine if the EPA will act on the “Endangerment Finding”, what that action may involve and when it might be put into place.
At this time, we are not aware of any proposed or pending climate change regulations. There are many variables making it difficult to predict the overall cost of carbon legislation. It is equally difficult to determine
13.
when those costs will be realized, or even the feasibility of legislation being passed. There is consensus in the industry that the costs of CO2 limits required through regulation or legislation could be substantial enough to fundamentally change the cement manufacturing business.
On September 9, 2010, the EPA published modifications to the National Emission Standard for Hazardous Air Pollutants (NESHAP) regulation in the Federal Register. The compliance date for all U.S. cement plants is September 9, 2013. The final rule differs from the proposed rule by requiring more stringent emission limitations on mercury (Hg), total hydrocarbons (THC), hydrochloric acid (HCL), and particulate matter less than 10 microns in diameter (PM 10). Our current emission levels are below the proposed limitations for mercury and THC so additional control equipment is not required for these pollutants; however, we expect to incur increased costs for control equipment for PM 10 & HCL. There will also be additional costs for monitoring, testing, and increased maintenance labor. Initial costs to comply are discussed above under “Capital Resources”.
On September 9, 2010 the EPA published New Source Performance Standards (NSPS) for nitrous oxide (NOx), sulphur dioxide (SO2), and particulate matter (PM 10). The rule applies to new or modified sources. At this time, management does not anticipate that modifications necessitated to comply with NESHAP will trigger application of NSPS.
Although there are presently no proposed or pending climate change regulations, climate change regulation could result in (1) increased energy costs, (2) a shift toward carbon neutral fuels or carbon neutral offset strategies, and (3) increased labor costs to acquire the specialized technical expertise needed to comply with the environmental regulations. Demand for our products could decrease due to increased pollution control costs. Conversely, demand could increase as others try to meet their government environmental mandates by using concrete products known for their sustainability benefits and energy efficiency.
In management’s opinion, the physical impact of a warmer climate in our market area will increase the number of days with weather conducive for work to proceed on construction projects which in turn will create the potential for greater profitability. Conversely, legislation and regulatory attempts to interfere with natural warming and cooling cycles will, if successful, have an adverse affect on profitability. In addition, differences in environmental regulations in the United States from those of other cement producing countries could affect our ability to continue to compete with the cost of cement imported from other countries.
Stock Market and Dividend Data
On February 16, 2011, Monarch’s Capital Stock and Class B Capital Stock was held by approximately 560 and 400 record holders, respectively. Monarch is the transfer agent for Monarch’s stock which is traded on the over-the-counter market under the trading symbol “MCEM.OB”. Over-the-counter market quotations reflect interdealer prices, without retail mark-up, mark-down or commission and may not necessarily represent actual transactions. Following is a schedule of the range of the low and high bid quotations for Monarch’s stock as reported by Yahoo! at http://finance.yahoo.com/, and of the dividends declared on Monarch’s stock, for each quarter of our two latest fiscal years:
14.
| 2010 | 2009 | |||||||||||||||||||||||
| Price |
Dividends
|
Price |
Dividends
|
|||||||||||||||||||||
|
Quarter
|
Low
|
High
|
Declared
|
Low
|
High
|
Declared
|
||||||||||||||||||
|
First
|
$28.50 | $30.56 | $ - | $20.25 | $27.23 | $ - | ||||||||||||||||||
|
Second
|
$25.67 | $29.05 | $0.23 | $23.00 | $30.75 | $0.23 | ||||||||||||||||||
|
Third
|
$23.37 | $26.17 | $0.23 | $30.51 | $31.50 | $0.23 | ||||||||||||||||||
|
Fourth
|
$22.00 | $25.00 | $0.46 | * | $30.24 | $33.00 | $0.46 | * | ||||||||||||||||
| *Reflects declaration of two $0.23 dividends payable in the first quarter of 2011 and 2010. | ||||||||||||||||||||||||
For additional information concerning the Company’s payment of dividends, see “Management’s Discussion and Analysis of Financial Condition and Results of Operations – Liquidity”. The Company’s loan agreement contains a financial covenant that requires it to maintain a minimum net worth which the Company was in compliance with at year end. The financial covenant of the loan agreement could impact the payment of future dividends. See Note 4, Line of Credit and Long-Term Debt, of Notes to Consolidated Financial Statements.
The following performance graph and table show a five-year comparison of cumulative total returns for the Company, the S&P 500 composite index and an index of a peer group of companies selected by the Company.
The cumulative total return on investment for each of the periods for the Company, the S&P 500 and the peer group is based on the stock price or composite index at December 31, 2005. The performance graph assumes that the value of an investment in the Company’s capital stock and each index was $100 at December 31, 2005 and that all dividends were reinvested. The information presented in the performance graph is historical in nature and is not intended to represent or guarantee future returns.
The performance graph compares the performance of the Company with that of the S&P 500 composite index and an index of a peer group of companies in the Company’s industry in which the returns are weighted according to each company’s market capitalization. The peer group consists of Cemex Sab De CV, Eagle Materials, Inc., Lafarge S.A., Texas Industries, Inc., and Vulcan Materials Company. Ready Mix, Inc. is no longer included in the peer group because it sold substantially all its assets in 2010.
15.
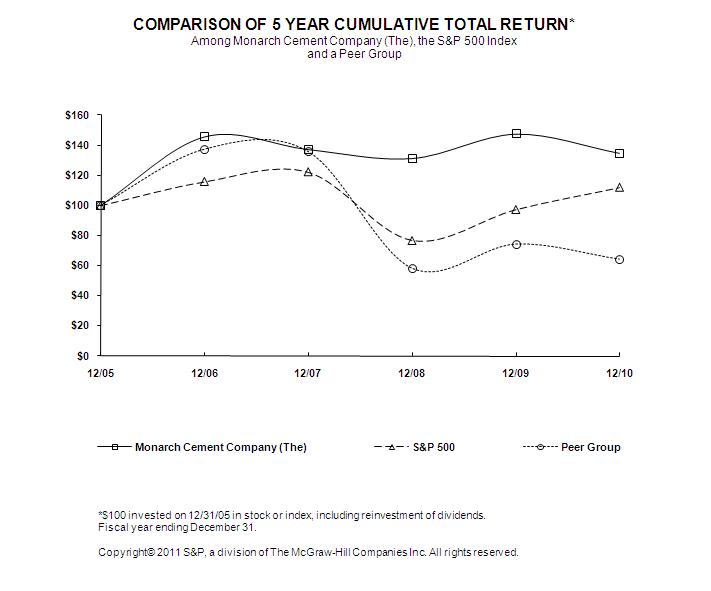
| 12/05 | 12/06 | 12/07 | 12/08 | 12/09 | 12/10 | |||||||||||||||||||
|
Monarch Cement Company (The)
|
$100.00 | $145.59 | $137.20 | $131.24 | $147.43 | $134.73 | ||||||||||||||||||
|
S&P 500
|
100.00 | 115.80 | 122.16 | 76.96 | 97.33 | 111.99 | ||||||||||||||||||
|
Peer Group
|
100.00 | 137.31 | 135.76 | 58.17 | 74.24 | 64.20 |
Copyright© 2011 Standard & Poor’s, a division of The McGraw-Hill Companies Inc. All rights reserved. (www.researchdatagroup.com/S&P.htm)
16.
Management’s Report on Internal Control Over Financial Reporting
Management of the Company is responsible for establishing and maintaining adequate internal control over financial reporting as defined in Rules 13a-15(f) and 15d-15(f) under the Securities Exchange Act of 1934. The Company’s internal control over financial reporting is designed to provide reasonable assurance regarding the reliability of financial reporting and the preparation of financial statements for external purposes in accordance with accounting principles generally accepted in the United States of America (GAAP). Internal control over financial reporting includes those policies and procedures that (1) pertain to the maintenance of records that, in reasonable detail, accurately and fairly reflect the transactions and dispositions of our assets; (2) provide reasonable assurance that transactions are recorded as necessary to permit preparation of financial statements in accordance with GAAP, and that our receipts and expenditures are being made only in accordance with authorizations of our management and directors; and (3) provide reasonable assurance regarding prevention or timely detection of unauthorized acquisition, use or disposition of our assets that could have a material effect on the financial statements.
Because of its inherent limitations, internal control over financial reporting may not prevent or detect misstatements. A control system, no matter how well conceived and operated, can provide only reasonable, not absolute, assurance that the objectives of the control system are met. No evaluation of controls can provide absolute assurance that all control issues and instances of fraud, if any, have been detected. Also, projections of any evaluation of effectiveness to future periods are subject to the risk that controls may become inadequate because of changes in conditions, or that the degree of compliance with the policies or procedures may deteriorate.
As required by Section 404 of the Sarbanes-Oxley Act of 2002, management assessed the effectiveness of the Company’s internal control over financial reporting as of December 31, 2010. In making this assessment, management used the framework and criteria set forth by the Committee of Sponsoring Organizations of the Treadway Commission (COSO) in Internal Control-Integrated Framework.
Based on our assessment and those criteria, management believes that the Company maintained effective internal control over financial reporting as of December 31, 2010.
The effectiveness of the Company’s internal control over financial reporting as of December 31, 2010 has been audited by BKD, LLP, an independent registered public accounting firm, as stated in their report which is included herein.
The Monarch Cement Company
17.

Report of Independent Registered Public Accounting Firm
Audit Committee, Board of Directors and Stockholders
The Monarch Cement Company
Humboldt, Kansas
We have audited The Monarch Cement Company’s internal control over financial reporting as of December 31, 2010, based on criteria established in Internal Control – Integrated Framework issued by the Committee of Sponsoring Organizations of the Treadway Commission (COSO). The Company’s management is responsible for maintaining effective internal control over financial reporting and for its assessment of the effectiveness of internal control over financial reporting, included in the accompanying Management’s Report on Internal Control Over Financial Reporting. Our responsibility is to express an opinion on the Company’s internal control over financial reporting based on our audit.
We conducted our audit in accordance with the standards of the Public Company Accounting Oversight Board (United States). Those standards require that we plan and perform the audit to obtain reasonable assurance about whether effective internal control over financial reporting was maintained in all material respects. Our audit included obtaining an understanding of internal control over financial reporting, assessing the risk that a material weakness exists and testing and evaluating the design and operating effectiveness of internal control based on the assessed risk. Our audit also included performing such other procedures as we considered necessary in the circumstances. We believe that our audit provides a reasonable basis for our opinion.
A company’s internal control over financial reporting is a process designed to provide reasonable assurance regarding the reliability of financial reporting and the preparation of financial statements for external purposes in accordance with generally accepted accounting principles. A company’s internal control over financial reporting includes those policies and procedures that (1) pertain to the maintenance of records that, in reasonable detail, accurately and fairly reflect the transactions and dispositions of the assets of the company; (2) provide reasonable assurance that transactions are recorded as necessary to permit preparation of financial statements in accordance with generally accepted accounting principles, and that receipts and expenditures of the company are being made only in accordance with authorizations of management and directors of the company; and (3) provide reasonable assurance regarding prevention or timely detection of unauthorized acquisition, use or disposition of the company’s assets that could have a material effect on the financial statements.
Because of its inherent limitations, internal control over financial reporting may not prevent or detect misstatements. Also, projections of any evaluation of effectiveness to future periods are subject to the risk that controls may become inadequate because of changes in conditions or that the degree of compliance with the policies or procedures may deteriorate.
In our opinion, The Monarch Cement Company maintained, in all material respects, effective internal control over financial reporting as of December 31, 2010, based on criteria established in Internal Control – Integrated Framework issued by the Committee of Sponsoring Organizations of the Treadway Commission (COSO).
We have also audited, in accordance with the standards of the Public Company Accounting Oversight Board (United States), the consolidated financial statements of The Monarch Cement Company and our report dated March 16, 2011 expressed an unqualified opinion thereon.

Kansas City, Missouri
March 16, 2011

Report of Independent Registered Public Accounting Firm
Audit Committee, Board of Directors and Stockholders
The Monarch Cement Company
Humboldt, Kansas
We have audited the accompanying consolidated balance sheets of The Monarch Cement Company as of December 31, 2010 and 2009, and the related consolidated statements of income, stockholders’ equity and noncontrolling interests, comprehensive income and cash flows for each of the years in the three-year period ended December 31, 2010. The Company’s management is responsible for these financial statements. Our responsibility is to express an opinion on these financial statements based on our audits.
We conducted our audits in accordance with the standards of the Public Company Accounting Oversight Board (United States). Those standards require that we plan and perform the audits to obtain reasonable assurance about whether the financial statements are free of material misstatement. Our audits included examining, on a test basis, evidence supporting the amounts and disclosures in the financial statements, assessing the accounting principles used and significant estimates made by management and evaluating the overall financial statement presentation. We believe that our audits provide a reasonable basis for our opinion.
In our opinion, the consolidated financial statements referred to above present fairly, in all material respects, the financial position of The Monarch Cement Company as of December 31, 2010 and 2009, and the results of its operations and its cash flows for each of the years in the three-year period ended December 31, 2010, in conformity with accounting principles generally accepted in the United States of America.
We also have audited, in accordance with the standards of the Public Company Accounting Oversight Board (United States), The Monarch Cement Company’s internal control over financial reporting as of December 31, 2010, based on criteria established in Internal Control – Integrated Framework issued by the Committee of Sponsoring Organizations of the Treadway Commission (COSO) and our report dated March 16, 2011 expressed an unqualified opinion on the effectiveness of the Company’s internal control over financial reporting.
Kansas City, Missouri
March 16, 2011
| The Monarch Cement Company and Subsidiaries | ||||||||
| Consolidated Balance Sheets | ||||||||
| December 31, 2010 and 2009 | ||||||||
|
ASSETS
|
2 0 1 0
|
2 0 0 9
|
||||||
|
Current Assets:
|
||||||||
|
Cash and cash equivalents
|
$ | 2,695,267 | $ | 2,149,397 | ||||
|
Receivables, less allowances of $707,000 in 2010 and
|
||||||||
|
$911,000 in 2009 for doubtful accounts
|
12,016,919 | 12,558,856 | ||||||
|
Inventories, priced at cost which is not in excess of market-
|
||||||||
|
Finished cement
|
$ | 5,665,411 | $ | 5,345,468 | ||||
|
Work in process
|
2,095,963 | 2,050,200 | ||||||
|
Building products
|
4,692,327 | 5,225,431 | ||||||
|
Fuel, gypsum, paper sacks and other
|
5,838,637 | 7,625,573 | ||||||
|
Operating and maintenance supplies
|
11,751,562 | 11,538,788 | ||||||
|
Total inventories
|
$ | 30,043,900 | $ | 31,785,460 | ||||
|
Refundable federal and state income taxes
|
- | 310,795 | ||||||
|
Deferred income taxes
|
735,000 | 775,000 | ||||||
|
Prepaid expenses
|
125,787 | 324,844 | ||||||
|
Total current assets
|
$ | 45,616,873 | $ | 47,904,352 | ||||
|
Property, Plant and Equipment, at cost, less accumulated depreciation
|
||||||||
|
and depletion of $173,656,095 in 2010 and $162,880,507 in 2009
|
84,912,099 | 90,817,394 | ||||||
|
Deferred Income Taxes
|
19,254,393 | 19,093,778 | ||||||
|
Investments
|
23,984,320 | 18,419,208 | ||||||
|
Other Assets
|
331,143 | 762,945 | ||||||
| $ | 174,098,828 | $ | 176,997,677 | |||||
|
LIABILITIES AND EQUITY
|
||||||||
|
Current Liabilities:
|
||||||||
|
Accounts payable
|
$ | 5,054,236 | $ | 5,083,300 | ||||
|
Line of credit payable
|
- | 511,944 | ||||||
|
Current portion of term loan
|
2,823,648 | 2,732,490 | ||||||
|
Accrued liabilities-
|
||||||||
|
Dividends
|
1,845,988 | 1,851,131 | ||||||
|
Compensation and benefits
|
3,259,188 | 3,064,633 | ||||||
|
Federal and state income taxes
|
135,470 | - | ||||||
|
Miscellaneous taxes
|
744,126 | 777,349 | ||||||
|
Other
|
1,947,343 | 5,207,483 | ||||||
|
Total current liabilities
|
$ | 15,809,999 | $ | 19,228,330 | ||||
|
Long-Term Debt
|
9,154,087 | 12,096,835 | ||||||
|
Accrued Postretirement Benefits
|
34,782,978 | 30,206,610 | ||||||
|
Accrued Pension Expense
|
12,723,073 | 12,250,038 | ||||||
|
Stockholders’ Equity:
|
||||||||
|
Capital Stock, par value $2.50 per share, one vote per share ‑
|
||||||||
|
Authorized 10,000,000 shares, Issued and Outstanding 2,532,328
|
||||||||
|
shares at December 31, 2010 and 2,532,463 shares at
|
||||||||
|
December 31, 2009
|
$ | 6,330,820 | $ | 6,331,158 | ||||
|
Class B Capital Stock, par value $2.50 per share, ten votes per
|
||||||||
|
share - Authorized 10,000,000 shares, Issued and Outstanding
|
||||||||
|
1,480,690 shares at December 31, 2010 and 1,491,735 shares
|
||||||||
|
at December 31, 2009
|
3,701,725 | 3,729,337 | ||||||
|
Retained earnings
|
102,270,564 | 105,989,712 | ||||||
|
Accumulated other comprehensive loss
|
(10,674,418 | ) | (12,834,343 | ) | ||||
|
Total Stockholders’ Equity
|
$ | 101,628,691 | $ | 103,215,864 | ||||
| $ | 174,098,828 | $ | 176,997,677 | |||||
|
See notes to consolidated financial statements
|
||||||||
20.
| The Monarch Cement Company and Subsidiaries | ||||||||||||
| Consolidated Statements of Income | ||||||||||||
| For the Years Ended December 31, 2010, 2009 and 2008 | ||||||||||||
|
2 0 1 0
|
2 0 0 9
|
2 0 0 8
|
||||||||||
|
NET SALES
|
$ | 121,184,834 | $ | 132,194,542 | $ | 153,886,473 | ||||||
|
COST OF SALES
|
104,977,712 | 110,646,807 | 120,887,764 | |||||||||
|
Gross profit from operations
|
$ | 16,207,122 | $ | 21,547,735 | $ | 32,998,709 | ||||||
|
SELLING, GENERAL AND
|
||||||||||||
|
ADMINISTRATIVE EXPENSES
|
16,064,990 | 16,599,151 | 16,243,707 | |||||||||
|
Income from operations
|
$ | 142,132 | $ | 4,948,584 | $ | 16,755,002 | ||||||
|
OTHER INCOME (EXPENSE)
|
||||||||||||
|
Interest income
|
$ | 120,071 | $ | 74,624 | $ | 175,895 | ||||||
|
Interest expense
|
(540,439 | ) | (631,600 | ) | (917,218 | ) | ||||||
|
Loss on impairment of equity investments
|
(858,787 | ) | (524,188 | ) | (4,157,612 | ) | ||||||
|
Gain (loss) on sale of equity investments
|
(79,793 | ) | 136,853 | - | ||||||||
|
Dividend income
|
249,929 | 186,752 | 267,435 | |||||||||
|
Other, net
|
890,809 | 1,193,594 | 834,205 | |||||||||
| $ | (218,210 | ) | $ | 436,035 | $ | (3,797,295 | ) | |||||
|
INCOME (LOSS) BEFORE PROVISION FOR
|
||||||||||||
|
(BENEFIT FROM) INCOME TAXES
|
$ | (76,078 | ) | $ | 5,384,619 | $ | 12,957,707 | |||||
|
PROVISION FOR (BENEFIT FROM) INCOME TAXES
|
(300,000 | ) | 700,000 | 2,725,000 | ||||||||
|
NET INCOME
|
$ | 223,922 | $ | 4,684,619 | $ | 10,232,707 | ||||||
|
Less: Net loss attributable to noncontrolling interest
|
- | (48,799 | ) | (174 | ) | |||||||
|
NET INCOME ATTRIBUTABLE TO COMPANY
|
$ | 223,922 | $ | 4,733,418 | $ | 10,232,881 | ||||||
|
Basic earnings per share
|
$0.06 | $1.18 | $2.54 | |||||||||
| Consolidated Statements of Comprehensive Income | ||||||||||||
| For the Years Ended December 31, 2010, 2009 and 2008 | ||||||||||||
| 2 0 1 0 | 2 0 0 9 | 2 0 0 8 | ||||||||||
|
NET INCOME
|
$ | 223,922 | $ | 4,684,619 | $ | 10,232,707 | ||||||
|
UNREALIZED APPRECIATION (DEPRECIATION) ON AVAILABLE
|
||||||||||||
|
FOR SALE SECURITIES (Net of deferred tax (benefit) expense
|
||||||||||||
|
of $1,972,000, $816,000 and $(3,040,000) for 2010, 2009 and 2008,
|
||||||||||||
|
respectively)
|
2,959,420 | 1,226,665 | (4,557,612 | ) | ||||||||
|
RECLASSIFICATION ADJUSTMENT FOR REALIZED (GAINS)
|
||||||||||||
|
LOSSES INCLUDED IN NET INCOME (Net of deferred tax (benefit)
|
||||||||||||
|
expense of $(376,000), $(156,000), and $(1,664,000) for 2010, 2009
|
||||||||||||
|
and 2008, respectively)
|
562,580 | 231,335 | 2,493,612 | |||||||||
|
MINIMUM PENSION LIABILITY (Net of deferred tax (benefit) expense
|
||||||||||||
|
of $(300,000), $1,070,000 and $(3,800,000) for 2010, 2009 and 2008,
|
||||||||||||
|
respectively)
|
(453,765 | ) | 1,616,189 | (5,705,931 | ) | |||||||
|
POSTRETIREMENT LIABILITY (Net of deferred tax (benefit) expense
|
||||||||||||
|
of $(1,050,000), $(945,000) and $975,000 for 2010, 2009 and 2008,
|
||||||||||||
|
respectively)
|
(908,310 | ) | (1,399,409 | ) | 1,462,306 | |||||||
|
COMPREHENSIVE INCOME
|
$ | 2,383,847 | $ | 6,359,399 | $ | 3,925,082 | ||||||
|
See notes to consolidated financial statements
|
||||||||||||
21.
| The Monarch Cement Company and Subsidiaries | ||||||||||||||||||||||||||||
| Consolidated Statements of Stockholders’ Equity and Noncontrolling Interests | ||||||||||||||||||||||||||||
| For the Years Ended December 31, 2010, 2009 and 2008 | ||||||||||||||||||||||||||||
| Company Stockholders | ||||||||||||||||||||||||||||
|
Accumu-
|
||||||||||||||||||||||||||||
|
Class B
|
lated Other
|
Non-
|
||||||||||||||||||||||||||
| Capital |
Capital
|
Retained |
Treasury
|
Comprehen- |
Controlling
|
|||||||||||||||||||||||
| Stock |
Stock
|
Earnings
|
Stock
|
sive Income |
Interest
|
Total | ||||||||||||||||||||||
|
Balance
|
||||||||||||||||||||||||||||
|
January 01, 2008
|
$ | 6,276,770 | $ | 3,790,625 | $ | 98,488,627 | $ | - | $ | (8,201,498 | ) | $ | 709,038 | $ | 101,063,562 | |||||||||||||
|
Net income
|
- | - | 10,232,881 | - | - | (174 | ) | 10,232,707 | ||||||||||||||||||||
|
Dividends declared
|
||||||||||||||||||||||||||||
|
($0.92 per share)
|
- | - | (3,703,531 | ) | - | - | - | (3,703,531 | ) | |||||||||||||||||||
|
Transfer of shares
|
26,775 | (26,775 | ) | - | - | - | - | - | ||||||||||||||||||||
|
Purchase of treasury stock
|
- | - | - | (66,321 | ) | - | - | (66,321 | ) | |||||||||||||||||||
|
Retirement of treasury stock
|
(6,900 | ) | - | (59,421 | ) | 66,321 | - | - | - | |||||||||||||||||||
|
Change in unrealized
|
||||||||||||||||||||||||||||
|
appreciation on available-
|
||||||||||||||||||||||||||||
|
for-sale securities
|
- | - | - | - | (2,064,000 | ) | - | (2,064,000 | ) | |||||||||||||||||||
|
Adjustment to recognize
|
||||||||||||||||||||||||||||
|
minimum pension liability
|
- | - | - | - | (5,705,931 | ) | - | (5,705,931 | ) | |||||||||||||||||||
|
Adjustment to recognize
|
||||||||||||||||||||||||||||
|
postretirement liability
|
- | - | - | - | 1,462,306 | - | 1,462,306 | |||||||||||||||||||||
|
Balance
|
||||||||||||||||||||||||||||
|
December 31, 2008
|
$ | 6,296,645 | $ | 3,763,850 | $ | 104,958,556 | $ | - | $ | (14,509,123 | ) | $ | 708,864 | $ | 101,218,792 | |||||||||||||
|
Net income
|
- | - | 4,733,418 | - | - | (48,799 | ) | 4,684,619 | ||||||||||||||||||||
|
Dividends declared
|
||||||||||||||||||||||||||||
|
($0.92 per share)
|
- | - | (3,702,262 | ) | - | - | - | (3,702,262 | ) | |||||||||||||||||||
|
Transfer of shares
|
34,513 | (34,513 | ) | - | - | - | - | - | ||||||||||||||||||||
|
Change in unrealized
|
||||||||||||||||||||||||||||
|
appreciation on available-
|
||||||||||||||||||||||||||||
|
for-sale securities
|
- | - | - | - | 1,458,000 | - | 1,458,000 | |||||||||||||||||||||
|
Adjustment to recognize
|
||||||||||||||||||||||||||||
|
minimum pension liability
|
- | - | - | - | 1,616,189 | - | 1,616,189 | |||||||||||||||||||||
|
Adjustment to recognize
|
||||||||||||||||||||||||||||
|
postretirement liability
|
- | - | - | - | (1,399,409 | ) | - | (1,399,409 | ) | |||||||||||||||||||
|
Increase (decrease) in
|
||||||||||||||||||||||||||||
|
noncontrolling interest
|
- | - | - | - | - | (660,065 | ) | (660,065 | ) | |||||||||||||||||||
|
Balance
|
||||||||||||||||||||||||||||
|
December 31, 2009
|
$ | 6,331,158 | $ | 3,729,337 | $ | 105,989,712 | $ | - | $ | (12,834,343 | ) | $ | - | $ | 103,215,864 | |||||||||||||
|
Net income
|
- | - | 223,922 | - | - | - | 223,922 | |||||||||||||||||||||
|
Dividends declared
|
||||||||||||||||||||||||||||
|
($0.92 per share)
|
- | - | (3,697,119 | ) | - | - | - | (3,697,119 | ) | |||||||||||||||||||
|
Transfer of shares
|
27,612 | (27,612 | ) | - | - | - | - | - | ||||||||||||||||||||
|
Purchase of treasury stock
|
- | - | - | (273,901 | ) | - | - | (273,901 | ) | |||||||||||||||||||
|
Retirement of treasury stock
|
(27,950 | ) | - | (245,951 | ) | 273,901 | - | - | - | |||||||||||||||||||
|
Change in unrealized
|
||||||||||||||||||||||||||||
|
appreciation on available-
|
||||||||||||||||||||||||||||
|
for-sale securities
|
- | - | - | - | 3,522,000 | - | 3,522,000 | |||||||||||||||||||||
|
Adjustment to recognize
|
||||||||||||||||||||||||||||
|
minimum pension liability
|
- | - | - | - | (453,765 | ) | - | (453,765 | ) | |||||||||||||||||||
|
Adjustment to recognize
|
||||||||||||||||||||||||||||
|
postretirement liability
|
- | - | - | - | (908,310 | ) | - | (908,310 | ) | |||||||||||||||||||
|
Balance
|
||||||||||||||||||||||||||||
|
December 31, 2010
|
$ | 6,330,820 | $ | 3,701,725 | $ | 102,270,564 | $ | - | $ | (10,674,418 | ) | $ | - | $ | 101,628,691 | |||||||||||||
| See notes to consolidated financial statements | ||||||||||||||||||||||||||||
22.
| The Monarch Cement Company and Subsidiaries | ||||||||||||
| Consolidated Statements of Cash Flows | ||||||||||||
| For the Years Ended December 31, 2010, 2009 and 2008 | ||||||||||||
|
2 0 1 0
|
2 0 0 9
|
2 0 0 8
|
||||||||||
|
OPERATING ACTIVITIES:
|
||||||||||||
|
Net income
|
$ | 223,922 | $ | 4,684,619 | $ | 10,232,707 | ||||||
|
Adjustments to reconcile net income to
|
||||||||||||
|
net cash provided by operating activities:
|
||||||||||||
|
Depreciation, depletion and amortization
|
11,742,667 | 12,588,799 | 12,270,723 | |||||||||
|
Deferred income taxes
|
(1,118,615 | ) | (782,238 | ) | (2,192,006 | ) | ||||||
|
Gain on disposal of assets
|
(58,335 | ) | (69,668 | ) | (234,940 | ) | ||||||
|
Realized (gain) loss on sale of equity investments
|
79,793 | (136,853 | ) | - | ||||||||
|
Realized loss on impairment of equity investments
|
858,787 | 524,188 | 4,157,612 | |||||||||
|
Gain on disposal of other assets
|
(700,000 | ) | - | - | ||||||||
|
Postretirement benefits and pension expense
|
2,362,328 | 2,057,067 | 717,711 | |||||||||
|
Change in assets and liabilities:
|
||||||||||||
|
Receivables, net
|
541,937 | 2,940,782 | (1,968,417 | ) | ||||||||
|
Inventories
|
1,741,560 | (2,987,972 | ) | (721,888 | ) | |||||||
|
Refundable income taxes
|
310,795 | (283,693 | ) | (27,102 | ) | |||||||
|
Prepaid expenses
|
199,057 | 183,480 | (259,944 | ) | ||||||||
|
Other assets
|
2,442 | 20,447 | 32,821 | |||||||||
|
Accounts payable and accrued liabilities
|
(2,281,418 | ) | 4,764 | 2,033,813 | ||||||||
|
Net cash provided by operating activities
|
$ | 13,904,920 | $ | 18,743,722 | $ | 24,041,090 | ||||||
|
INVESTING ACTIVITIES:
|
||||||||||||
|
Acquisition of property, plant and equipment
|
$ | (6,205,837 | ) | $ | (9,830,150 | ) | $ | (8,150,297 | ) | |||
|
Proceeds from disposals of property, plant and equipment
|
120,176 | 130,442 | 250,727 | |||||||||
|
Proceeds from disposals of other assets
|
700,000 | - | - | |||||||||
|
Payment for acquisition of business
|
- | (1,696,840 | ) | (2,319,934 | ) | |||||||
|
Payment for purchases of equity investments
|
(1,046,224 | ) | (5,225,374 | ) | (6,869,537 | ) | ||||||
|
Proceeds from disposals of equity investments
|
412,532 | 1,589,076 | - | |||||||||
|
(Increase) decrease in short-term investments, net
|
- | 2,100,000 | (2,100,000 | ) | ||||||||
|
Net cash used for investing activities
|
$ | (6,019,353 | ) | $ | (12,932,846 | ) | $ | (19,189,041 | ) | |||
|
FINANCING ACTIVITIES:
|
||||||||||||
|
Increase (decrease) in line of credit, net
|
$ | (511,944 | ) | $ | 511,944 | $ | - | |||||
|
Payment on bank loans
|
(2,731,213 | ) | (2,644,316 | ) | (2,116,417 | ) | ||||||
|
Payments on other long-term debt
|
(120,377 | ) | (278,289 | ) | (337,656 | ) | ||||||
|
Cash dividends paid
|
(3,702,262 | ) | (3,702,262 | ) | (3,624,262 | ) | ||||||
|
Purchases of noncontrolling interests
|
- | (660,065 | ) | - | ||||||||
|
Purchase of treasury stock
|
(273,901 | ) | - | (66,321 | ) | |||||||
|
Net cash used for financing activities
|
$ | (7,339,697 | ) | $ | (6,772,988 | ) | $ | (6,144,656 | ) | |||
|
Net increase (decrease) in cash and cash equivalents
|
$ | 545,870 | $ | (962,112 | ) | $ | (1,292,607 | ) | ||||
|
Cash and Cash Equivalents, beginning of year
|
2,149,397 | 3,111,509 | 4,404,116 | |||||||||
|
Cash and Cash Equivalents, end of year
|
$ | 2,695,267 | $ | 2,149,397 | $ | 3,111,509 | ||||||
|
Additional Cash Flow Information:
|
||||||||||||
|
Interest paid, net of amount capitalized
|
$ | 545,034 | $ | 635,939 | $ | 939,179 | ||||||
|
Income taxes paid, net of refunds
|
(303,996 | ) | 1,764,563 | 5,500,016 | ||||||||
| Capital equipment additions included in accounts payable | 12,495 | 748,479 | 221,914 | |||||||||
| Acquisition of business included in accrued liabilities | - | 400,000 | - | |||||||||
|
See notes to consolidated financial statements
|
||||||||||||
23.
|
The Monarch Cement Company and Subsidiaries
Notes to Consolidated Financial Statements
December 31, 2010, 2009 and 2008
|
(1) Nature of Operations and Summary of Significant Accounting Policies
(a) Nature of Operations--The Monarch Cement Company (Monarch) is principally engaged in the manufacture and sale of portland cement. The marketing area for Monarch’s products consists primarily of the State of Kansas, the State of Iowa, southeast Nebraska, western Missouri, northwest Arkansas and northern Oklahoma. Sales are made primarily to contractors, ready-mixed concrete plants, concrete products plants, building materials dealers and governmental agencies. Companies controlled by Monarch sell ready-mixed concrete, concrete products and sundry building materials within Monarch’s marketing area.
(b) Principles of Consolidation--Monarch has direct control of certain operating companies that have been deemed to be subsidiaries within the meaning of accounting principles generally accepted in the United States of America and the rules and regulations of the Securities and Exchange Commission. Accordingly, the financial statements of such companies have been consolidated with Monarch’s financial statements. All significant intercompany transactions have been eliminated in consolidation.
As a result of Financial Accounting Standards Board (FASB) Accounting Standards Codification (ASC) Section 810-10-65, “Consolidation- Overall - Transition and Effective Date Information”, which was effective January 1, 2009, minority interest previously presented in the mezzanine section of the balance sheet has been retrospectively reclassified as noncontrolling interest within equity. In addition, the consolidated net income and comprehensive income (loss) presented in the statements of income have been retrospectively revised to include the net loss attributable to the noncontrolling interest. Beginning January 1, 2009, losses attributable to the noncontrolling interest have been allocated to the noncontrolling interest even if the carrying amount of the noncontrolling interest is reduced below zero. Any changes in ownership after January 1, 2009 that did not result in a loss of control have been prospectively accounted for as equity transactions in accordance with FASB ASC 810.
(c) Use of Estimates--The preparation of financial statements in conformity with accounting principles generally accepted in the United States of America requires management to make estimates and assumptions that affect the reported amounts of assets and liabilities and disclosure of contingent assets and liabilities at the date of the financial statements and the reported amounts of revenues and expenses during the reporting period. Actual results could differ from those estimates.
(d) Reclassifications--Certain reclassifications have been made to the 2009 and 2008 financial statements to conform to the current year presentation. These reclassifications had no material effect on net earnings.
(e) Cash Equivalents--The Company considers all liquid investments with original maturities of three months or less to be cash equivalents. At December 31, 2010 and 2009, cash equivalents consisted primarily of money market investments and repurchase agreements with various banks.
The FDIC, through the Dodd-Frank Wall Street Reform and Consumer Protection Act (Dodd-Frank Act), has permanently raised the standard maximum deposit insurance amount (SMDIA) to fully guarantee all deposit accounts up to $250,000. In addition, the FDIC has adopted section 343 of the Dodd-Frank Act, effective December 31, 2010, which provides for unlimited deposit insurance for noninterest-bearing transaction accounts for two years starting December 31, 2010. This temporary unlimited coverage is in addition to, and separate from, the coverage of at least $250,000 available to depositors under the FDIC’s general deposit insurance rules.
At December 31, 2010, the Company’s accounts did not exceed federally insured limits. The Company also had $1.3 million in sweep arrangement accounts that were not covered by FDIC’s general deposit insurance.
24.
|
The Monarch Cement Company and Subsidiaries
Notes to Consolidated Financial Statements
December 31, 2010, 2009 and 2008
|
(f) Investments--Equity securities for which the Company has no immediate plan to sell but that may be sold in the future are classified as available for sale. If the fair value of the equity security is readily determinable, it is carried at fair value and unrealized gains and losses are recorded, net of related income tax effects, in stockholders’ equity. Realized gains and losses, based on the specifically identified cost of the security, are included in net income. Equity securities whose fair value is not readily determinable are carried at cost unless the Company is aware of significant adverse effects which have impaired the investments.
The Company does not participate in hedging activities and does not use derivative instruments.
(g) Receivables--Accounts receivables are stated at the amount billed to customers. The Company provides an allowance for doubtful accounts, which is based upon a review of outstanding receivables, historical collection information and existing economic conditions. Accounts receivables are ordinarily due 30 days after the issuance of the invoice. Accounts past due are considered delinquent. Delinquent receivables are written off based on individual credit evaluation and specific circumstances of the customer.
(h) Inventories--Inventories of finished cement and work in process are recorded at the lower of cost or market on a last-in, first-out (LIFO) basis. Total inventories reported under LIFO amounted to $7,761,374 and $7,395,668 as of December 31, 2010 and 2009, respectively. Under the average cost method of accounting (which approximates current cost), these inventories would have been $4,374,800, $4,082,000 and $2,764,000 higher than those reported at December 31, 2010, 2009 and 2008, respectively. The cost of manufactured items includes all material, labor, factory overhead and production-related administrative overhead required in their production.
We incurred a permanent reduction in the LIFO layers of work in process and cement inventories resulting in liquidation gains of $0.2 million and $0.3 million for the years 2009 and 2008, respectively. The liquidation gains were recognized as reductions of cost of sales. We did not incur any material liquidation gains in the LIFO layers for the year 2010.
Other inventories are purchased from outside suppliers. Fuel and other materials are priced by the first-in, first-out (FIFO) method while operating and maintenance supplies are recorded using the average cost method.
Inventories of fuel, gypsum, paper sacks and other are used in the manufacture of cement. The operating and maintenance supplies consist primarily of spare parts for our cement manufacturing equipment.
(i) Property, Plant and Equipment--Property, plant and equipment are stated at cost of acquisition or construction. The Company capitalizes the cost of interest on borrowed funds used to finance the construction of property, plant and equipment. During 2010, 2009 and 2008, the Company capitalized approximately $121,700, $111,000 and $110,100, respectively, of interest expense related to current construction projects.
As of December 31, 2010 and 2009, the amount of accounts payable related to property, plant and equipment was $12,495 and $748,479, respectively.
The Company records depreciation, depletion and amortization related to manufacturing operations in Cost of Sales, those related to general operations are recorded in Selling, General and Administrative Expenses, and those related to non-operational activities are in Other, net on the Consolidated Statements of Income. The approximate amounts included in each line item as of December 31, 2010, 2009 and 2008 are as follows:
25.
|
|
|
2010
|
2009
|
2008
|
||||||||||
|
Cost of Sales
|
$ | 10,900,000 | $ | 11,700,000 | $ | 11,500,000 | ||||||
|
Selling, General and Administrative
|
300,000 | 400,000 | 400,000 | |||||||||
|
Other, net
|
500,000 | 500,000 | 400,000 | |||||||||
|
Total
|
$ | 11,700,000 | $ | 12,600,000 | $ | 12,300,000 | ||||||
Depreciation of property, plant and equipment is provided by charges to operations over the estimated useful lives of the assets using accelerated methods. The Company’s buildings, machinery and equipment are depreciated using double declining balance depreciation. The Company switches to straight line depreciation once it exceeds the amount computed under the double declining balance method until the asset is fully depreciated. The Company does not depreciate construction in process. Depletion rates for quarry lands are designed to amortize the cost over the estimated recoverable reserves. Expenditures for improvements that significantly increase the assets’ useful lives are capitalized while maintenance and repairs are charged to expense as incurred.
The Company continually evaluates whether events or changes in circumstances have occurred that would indicate that the carrying amount of long-lived assets may not be recoverable. An impairment loss would be recognized and the asset cost would be adjusted to fair value when undiscounted estimated future cash flows expected to result from the use of the asset and its eventual disposition is less than its carrying amount. The impairment loss would be the amount by which the carrying amount of a long-lived asset exceeds its fair value. Various factors that the Company considers in its review include changes in expected use of the assets, changes in technology, changes in operating performance and changes in expected future cash flows. No asset impairment was recognized during the years ended December 31, 2010 and 2009.
(j) Income Taxes--Deferred tax assets and liabilities are recognized for the tax effects of differences between the financial statement and tax bases of assets and liabilities. A valuation allowance is established to reduce deferred tax assets if it is more likely than not that a deferred tax asset will not be realized.
(k) Revenue Recognition--The Company records revenue from the sale of cement, ready-mixed concrete, concrete products and sundry building materials following delivery of the products to customers. In the event the Company receives advance payment on orders, we defer revenue recognition until the product is delivered.
Our Ready-Mixed Concrete Business includes precast concrete construction which involves short-term and long-term contracts. Short-term contracts for specific projects are generally of three to six months in duration. Long-term contracts relate to specific projects with terms in excess of one year from the contract date. Revenues for these contracts are recognized on the percentage-of-completion method based on the ratio of contract costs incurred to date to total estimated costs. Full provision is made for any anticipated losses. The majority of the long-term contracts will allow only scheduled billings and contain retainage provisions under which 5 to 10% of the contract invoicing may be withheld by the customer pending project completion. As of December 31, 2010, the amount of billed retainage which is included in accounts receivable was approximately $120,000, all of which is expected to be collected within one year. The amount of billed retainage which was included in accounts receivable at December 31, 2009 was approximately $360,000. The amount of unbilled revenue in accounts receivable was approximately $380,000 and $780,000 at December 31, 2010 and 2009, respectively. Unbilled revenue contained approximately $43,000 and $525,000 of not-currently-billable retainage at December 31, 2010 and 2009, respectively, which is expected to be collected within one year.
26.
|
The Monarch Cement Company and Subsidiaries
Notes to Consolidated Financial Statements
December 31, 2010, 2009 and 2008
|
(l) Cost of Sales--The Company considers all production and shipping costs, (gain) loss on disposal of operating assets, inbound freight charges, purchasing and receiving costs, inspection costs, warehousing costs and internal transfer costs as cost of sales.
(m) Selling, General and Administrative Expenses--Selling, general and administrative expenses consist of sales personnel salaries and expenses, promotional costs, accounting personnel salaries and expenses, director and administrative officer salaries and expenses, legal and professional expenses, and other expenses related to overall corporate costs.
(n) Other, net--Other, net contains miscellaneous nonoperating income (expense) items excluding interest income, interest expense, gains (losses) on equity investments and dividend income. Significant items in other, net for 2010 include farm income of approximately $154,500, a gain of $700,000 related to the sale of a nonoperating asset, and proceeds from scrap sales of approximately $51,000. Significant items in other, net for 2009 include income from oil properties of approximately $180,000, farm income of approximately $90,000, proceeds from an insurance policy of approximately $429,000 and proceeds related to the settlement of a lawsuit of approximately $424,000. Significant items in other, net for 2008 include income from oil properties of approximately $466,000, proceeds from scrap sales of approximately $230,000 and farm income of approximately $108,000.
(o) Earnings per Share--Basic earnings per share is based on the weighted average common shares outstanding during each year. Diluted earnings per share are based on the weighted average common and common equivalent shares outstanding each year. Monarch has no common stock equivalents and therefore does not report diluted earnings per share. The weighted average number of shares outstanding was 4,020,411 in 2010, 4,024,198 in 2009 and 4,026,694 in 2008.
(p) Taxes Collected from Customers and Remitted to Governmental Authorities--Taxes collected from customers and remitted to governmental authorities are presented in the accompanying consolidated statements of income on a net basis.
(q) Self Insurance--The Company has elected to self-insure certain costs related to employee and retiree health and accident benefits programs. Costs resulting from self-insured losses are charged to income when incurred. Health and accident benefits provided to employees and retirees in the Cement Business are totally self-insured. Health benefits provided to employees in the Ready-Mixed Concrete Business are also self-insured but were subject to a $50,000 individual stop loss and an aggregate stop loss of 115% of expected claims. The individual stop loss has increased to $75,000 for 2011.
(r) Disclosure about Fair Value of Financial Instruments--Fair value is the estimated amount at which financial assets or liabilities could be exchanged in a current transaction between willing parties, other than in a forced or liquidation sale. Cash and cash equivalents, receivables, accounts payable and short and long-term debt have carrying values that approximate fair values. Investment fair values equal quoted market prices, if available. If quoted market prices are not available, fair value is estimated based on quoted market prices of similar securities. If it is not practicable to estimate the fair value of an investment, the investment is recorded at cost and evaluated quarterly for events that may adversely impact its fair value.
(s) Disclosure about Defined Benefit Pension and Other Postretirement Plans--In December 2008, the FASB issued an amendment to ASC 715-20, “Compensation – Retirement Benefits – Defined Benefit Plans – General”, which requires enhanced disclosures regarding Company benefit plans. Disclosures regarding plan assets include discussion about how investment allocation decisions are made, the major categories of plan
27.
|
|
assets, the inputs and valuation techniques used to measure plan assets and significant concentrations of risk within the plan assets. These amendments to ASC 715-20 are effective for fiscal years ending after December 15, 2009. Prior year periods presented for comparative purposes are not required to comply.
(2) Investments
Realized gains (losses) on equity investments are computed using the specific identification method. The Company defines fair value as the exchange price that would be received to sell an asset or paid to transfer a liability in the principal or most advantageous market for the asset or liability in an orderly transaction between market participants at the measurement date. The Company measures fair value using the following fair value hierarchy which is based on three levels of inputs intended to maximize the use of observable inputs and minimize the use of unobservable inputs when measuring fair value:
Level 1 - quoted prices in active markets for identical assets or liabilities.
Level 2 - observable inputs other than Level 1 prices such as quoted prices for similar assets or liabilities; quoted prices in markets that are not active; or other inputs that are observable or can be corroborated by observable market data for substantially the full term of the assets or liabilities.
Level 3 - unobservable inputs that are supported by little or no market activity and that are significant to the fair value of the assets or liabilities.
The following table summarizes the bases used to measure certain assets at fair value on a recurring basis in the balance sheet at December 31, 2010 and 2009:
|
Fair Value Measurements at Reporting Date Using:
|
||||||||||||||||
|
Quoted Prices
|
Significant
|
|||||||||||||||
|
in Active
|
Other
|
Significant
|
||||||||||||||
|
Markets for
|
Observable
|
Unobservable
|
||||||||||||||
|
Identical Assets
|
Inputs
|
Inputs
|
||||||||||||||
|
Assets:
|
12/31/2010
|
(Level 1)
|
(Level 2)
|
(Level 3)
|
||||||||||||
|
Available-for-sale equity securities
|
||||||||||||||||
|
Cement industry
|
$ | 9,499,615 | $ | 9,499,615 | $ | - | $ | - | ||||||||
|
General building materials industry
|
3,623,769 | 3,623,769 | - | - | ||||||||||||
|
Oil and gas refining and marketing industry
|
7,545,978 | 7,545,978 | - | - | ||||||||||||
|
Residential construction industry
|
896,346 | 896,346 | - | - | ||||||||||||
|
Total assets measured at fair value
|
$ | 21,565,708 | $ | 21,565,708 | $ | - | $ | - | ||||||||
|
Assets:
|
12/31/2009
|
|||||||||||||||
|
Available-for-sale equity securities
|
||||||||||||||||
|
Cement industry
|
$ | 7,910,269 | $ | 7,910,269 | $ | - | $ | - | ||||||||
|
General building materials industry
|
4,091,932 | 4,091,932 | - | - | ||||||||||||
|
Oil and gas refining and marketing industry
|
3,410,106 | 3,410,106 | - | - | ||||||||||||
|
Residential construction industry
|
1,020,500 | 1,020,500 | - | - | ||||||||||||
|
Total assets measured at fair value
|
$ | 16,432,808 | $ | 16,432,808 | $ | - | $ | - | ||||||||
No reconciliation (roll forward) of the beginning and ending balances for Level 3 is presented since the Company does not have any assets or liabilities measured at fair value on a recurring basis using significant unobservable inputs (Level 3) during any of the periods reported in the table above. The Company has no liabilities in either year requiring remeasurement to fair value on a recurring basis in the balance sheet. The Company has no additional assets or liabilities in either year requiring remeasurement to fair value on a non-recurring basis in the balance sheet.
28.
|
The Monarch Cement Company and Subsidiaries
Notes to Consolidated Financial Statements
December 31, 2010, 2009 and 2008
|
The following table shows the gross unrealized losses and fair value of the Company’s investments with unrealized losses that are not deemed to be other-than-temporarily impaired, aggregated by investment category and length of time that individual securities have been in a continuous unrealized loss position at December 31, 2010 and 2009:
|
Available-for-sale equity securities
|
Less than 12 Months | 12 Months or Greater | Total | |||||||||||||||||||||
|
Unrealized
|
Unrealized
|
Unrealized
|
||||||||||||||||||||||
|
December 31, 2010
|
Fair Value
|
Losses
|
Fair Value
|
Losses
|
Fair Value
|
Losses
|
||||||||||||||||||
|
Cement industry
|
$ | - | $ | - | $ | 16,400 | $ | 1,716 | $ | 16,400 | $ | 1,716 | ||||||||||||
|
Residential construction industry
|
488,379 | 86,054 | - | - | 488,379 | 86,054 | ||||||||||||||||||
|
Total
|
$ | 488,379 | $ | 86,054 | $ | 16,400 | $ | 1,716 | $ | 504,779 | $ | 87,770 | ||||||||||||
|
December 31, 2009
|
||||||||||||||||||||||||
|
Cement industry
|
$ | 14,600 | $ | 3,516 | $ | - | $ | - | $ | 14,600 | $ | 3,516 | ||||||||||||
|
Oil and gas refining and
|
||||||||||||||||||||||||
|
marketing industry
|
952,168 | 114,528 | - | - | 952,168 | 114,528 | ||||||||||||||||||
|
Residential construction industry
|
381,580 | 32,198 | 105,300 | 12,724 | 486,880 | 44,922 | ||||||||||||||||||
|
Total
|
$ | 1,348,348 | $ | 150,242 | $ | 105,300 | $ | 12,724 | $ | 1,453,648 | $ | 162,966 | ||||||||||||
2010 Impairment Analysis--The Company’s investments in marketable equity securities carried at fair value were evaluated every quarter for impairment by comparing the specifically identified cost of each purchase to market price. As a result of these evaluations, the Company identified a $0.9 million other-than-temporary impairment for the third quarter in its general building materials industry investments resulting in a recognized loss in earnings of equity investments. The fair value of those investments then became the new cost basis.
In its fourth quarter evaluation, the Company identified some specific purchases of marketable equity securities it believes are temporarily impaired resulting in the recognition of unrealized losses (see 2010 information in table above). These unrealized losses relate to investments in the common stock of two companies, one in the residential construction industry and another in the cement industry. When the Company evaluated the impairments by comparing the specifically identified cost of each purchase to market price as of February 14, 2011, the residential construction industry securities had recovered approximately $8,400 (9.8%) of their December 31, 2010 temporary impairments. The cement industry securities slightly increased their temporary impairments. The Company evaluated the near-term prospects of all of the issuers in relation to the severity of the impairments (fair value was approximately 15 percent less than cost in the residential construction industry investment and approximately 9 percent less than cost in the cement industry investment as of December 31, 2010) and the duration of the impairments (approximately 6 months in the residential construction industry investment and 12 months in the cement industry investment). Based on that evaluation, the Company does not consider these investments to be other-than-temporarily impaired at December 31, 2010.
The Company owns stock in two privately-owned companies accounted for by the cost method; one in the brick industry and the other in the ethanol production industry. These investments were evaluated for impairment based on average cost and specific identification, respectively. The evaluations of the ethanol production industry investment were based on quoted prices in markets that are not active and no impairments were identified during the year. Since there is not an active market for the brick industry investment, the Company relied on a discounted future net cash flow valuation of the investee which did not identify any impairment. As a result of those evaluations, the Company does not consider these cost-method investments to be impaired at December 31, 2010. The aggregate cost of the Company’s cost-method investments totaled $2.4 million at December 31, 2010.
29.
|
|
2009 Impairment Analysis--Due to continued adverse market conditions, the Company’s investments in marketable equity securities carried at fair value were evaluated for impairment by comparing the specifically identified cost of each purchase to market price. As a result of these evaluations, the Company identified $0.5 million in other-than-temporary impairments in an investment in the common stock of a company that produces construction aggregates, construction materials and cement resulting in a recognized loss in earnings of equity investments. The fair value of this impaired investment then became the new cost basis.
The Company also identified some specific purchases of marketable equity securities that were not other-than-temporarily impaired resulting in the recognition of unrealized losses (see table above). These unrealized losses relate to investments in the common stock of two companies, one in the oil and gas refinery and marketing industry and another whose core business is in the residential construction industry. When the Company evaluated the impairments by comparing the specifically identified cost of each purchase to market price as of February 20, 2010, these securities had recovered substantially all of their December 31, 2009 temporary impairments. The Company evaluated the near-term prospects of all of the issuers in relation to the severity of the impairments (fair value was approximately 8 percent less than cost in the residential construction industry investment and approximately 11 percent less than cost in the oil and gas refinery and marketing industry as of December 31, 2009) and the duration of the impairments (less than three months in both investments). Based on that evaluation, the Company did not consider these investments to be other-than-temporarily impaired at December 31, 2009.
The Company owns stock in two privately-owned companies accounted for by the cost method; one in the brick industry and the other in the ethanol production industry. Due to continued adverse market conditions, these investments were evaluated for impairment based on average cost and specific identification, respectively. Since there is not an active market for the brick industry investment, the Company relied on a discounted future net cash flow valuation of the investee which did not identify any impairment. As a result of those evaluations, the Company did not consider these cost-method investments to be impaired at December 31, 2009. The aggregate cost of the Company’s cost-method investments totaled $2.0 million at December 31, 2009.
Investment Results--The investment results for the years ended December 31, 2010 and 2009 are as follows for available for sale equity securities carried at fair value:
|
Gross
|
Gross
|
|||||||||||||||
|
Amortized
|
Unrealized
|
Unrealized
|
Fair
|
|||||||||||||
|
December 31, 2010
|
Cost
|
Holding Gains
|
Holding Losses
|
Value
|
||||||||||||
|
Available for sale equity securities
|
||||||||||||||||
|
Cement industry
|
$ | 4,971,000 | $ | 4,529,000 | $ | - | $ | 9,500,000 | ||||||||
|
General building materials industry
|
2,866,000 | 758,000 | - | 3,624,000 | ||||||||||||
|
Oil and gas refining and marketing industry
|
2,600,000 | 4,946,000 | - | 7,546,000 | ||||||||||||
|
Residential construction industry
|
849,000 | 47,000 | - | 896,000 | ||||||||||||
|
Total available for sale equity securities
|
$ | 11,286,000 | $ | 10,280,000 | $ | - | $ | 21,566,000 | ||||||||
|
Less: Deferred taxes on unrealized holding gains
|
4,112,000 | |||||||||||||||
|
Unrealized gains recorded in equity, net of deferred tax
|
$ | 6,168,000 | ||||||||||||||
30.
|
The Monarch Cement Company and Subsidiaries
Notes to Consolidated Financial Statements
December 31, 2010, 2009 and 2008
|
|
Gross
|
Gross
|
|||||||||||||||
|
Amortized
|
Unrealized
|
Unrealized
|
Fair
|
|||||||||||||
|
December 31, 2009
|
Cost
|
Holding Gains
|
Holding Losses
|
Value
|
||||||||||||
|
Available for sale equity securities
|
||||||||||||||||
|
Cement industry
|
$ | 5,000,000 | $ | 2,910,000 | $ | - | $ | 7,910,000 | ||||||||
|
General building materials industry
|
3,590,000 | 500,000 | - | 4,090,000 | ||||||||||||
|
Oil and gas refining and marketing industry
|
2,600,000 | 810,000 | - | 3,410,000 | ||||||||||||
|
Residential construction industry
|
830,000 | 190,000 | - | 1,020,000 | ||||||||||||
|
Total available for sale equity securities
|
$ | 12,020,000 | $ | 4,410,000 | $ | - | $ | 16,430,000 | ||||||||
|
Less: Deferred taxes on unrealized holding gains
|
1,764,000 | |||||||||||||||
|
Unrealized gains recorded in equity, net of deferred tax
|
$ | 2,646,000 | ||||||||||||||
Investment-related cash flow information for December 31, 2010 and 2009 are as follows:
|
2010
|
2009
|
2008
|
||||||||||
|
Proceeds from sale of equity securities
|
$ | 412,532 | $ | 1,589,076 | $ | - | ||||||
| Realized gain/(loss) on equity securities | (79,793 | ) | 136,853 | - | ||||||||
|
Realized losses due to other-than-temporary
|
||||||||||||
| impairment of equity securities | (858,787 | ) | (524,188 | ) | (4,157,612 | ) | ||||||
(3) Property, Plant and Equipment
Property, plant and equipment and their estimated useful lives at December 31, 2010 and 2009 consisted of:
|
Lives (Years)
|
2010
|
2009
|
||||||||||
|
Quarry land
|
$ | 2,004,549 | $ | 2,004,549 | ||||||||
|
Other land
|
7,906,086 | 7,755,444 | ||||||||||
|
Buildings and improvements
|
15 – 39 | 31,042,385 | 30,451,877 | |||||||||
|
Cement manufacturing equipment
|
15 – 25 | 122,435,381 | 122,293,513 | |||||||||
|
Ancillary equipment
|
5 – 10 | 12,964,237 | 12,791,566 | |||||||||
|
Ready-mix and concrete production
|
||||||||||||
|
machinery and equipment
|
5 – 15 | 33,220,392 | 31,849,800 | |||||||||
|
Transportation and mobile equipment
|
3 – 7 | 40,689,339 | 40,330,336 | |||||||||
|
Office machinery, equipment,
|
||||||||||||
|
furniture and fixtures
|
3 – 10 | 2,872,920 | 2,199,862 | |||||||||
|
Construction in process
|
5,432,905 | 4,020,954 | ||||||||||
| $ | 258,568,194 | $ | 253,697,901 | |||||||||
|
Less--Accumulated depreciation and depletion
|
173,656,095 | 162,880,507 | ||||||||||
| $ | 84,912,099 | $ | 90,817,394 | |||||||||
(4) Line of Credit and Long-Term Debt
In December 2010, Monarch entered into an amendment to the loan agreement with its current lender, Bank of Oklahoma, N.A., to, among other things, renew and modify the terms of Monarch’s term loan and revolving line of credit. The amendment adds a financial covenant that requires the Company to pledge its investment account to the Bank of Oklahoma, N.A. as collateral for the term loan and revolving line of credit. The fair value of the investment account pledged as collateral was $20.6 million as of December 31, 2010. The proceeds of the sale of any assets held in the investment account would be paid to the Bank of Oklahoma, N.A. to be applied to the balance of the revolving line of credit and then to the term loan, at the lender’s discretion.
31.
|
|
Under the amended loan agreement, interest rates on the Company’s line of credit remain variable and are based on the lender’s national prime rate less 0.50% with a 3.50% interest rate minimum or floor. Interest rates on the Company’s term loan remain variable and based on the lender’s national prime rate less 0.75% with a 3.00% interest rate minimum or floor. Monarch’s secured credit commitment consists of a $17.8 million term loan maturing December 31, 2014 and a $15.0 million line of credit maturing December 31, 2011.
The loan agreement contains a financial covenant related to net worth which the Company was in compliance with at year end. The Company had $11.9 million of bank loans as of December 31, 2010.
The average outstanding balance of the line of credit during 2010 and 2009 was $5.3 million and $5.5 million, respectively. At December 31, 2010 and 2009, there was $0 and $0.5 million, respectively, borrowed against the line of credit. The balance available on the line of credit at December 31, 2010 was $15.0 million. Interest on the line of credit varied with the lender’s national prime rate less .50% with a 3.50% interest rate minimum or floor for 2010 and 1.25% with a 2.50% interest rate minimum or floor for 2009. The annual weighted average interest rate we paid on the line of credit during 2010 and 2009 was 3.50% and 2.75%, respectively. The applicable interest rate was 3.50% and 2.75% at December 31, 2010 and 2009, respectively, and was payable quarterly.
As of December 31, 2010 and 2009, there was $11.9 million and $14.6 million, respectively, borrowed on the term loan. Interest on the Company’s term loan was variable and was based on the lender’s national prime rate less 0.75% with a 3.00% interest rate minimum or floor for 2010 and 2009. The annual weighted average interest rate we paid on the term loan during 2010 and 2009 was 3.25%. The applicable interest rate was 3.25% at December 31, 2010 and 2009.
|
2010
|
2009
|
|||||||
|
Note payable, bank (a)
|
$ | 11,866,018 | $ | 14,597,231 | ||||
|
Other
|
111,717 | 232,094 | ||||||
| $ | 11,977,735 | $ | 14,829,325 | |||||
|
Less current maturity
|
||||||||
|
of bank note payable
|
2,823,648 | 2,732,490 | ||||||
|
Total long-term debt
|
$ | 9,154,087 | $ | 12,096,835 | ||||
|
(a) Due December 31, 2014; payable $794,611 quarterly including interest.
|
||||||||
Aggregate annual maturities of long-term debt as of December 31, 2010 are:
|
2011
|
$ | 2,823,648 | ||
|
2012
|
3,018,713 | |||
|
2013
|
3,015,188 | |||
|
2014
|
3,120,186 | |||
| $ | 11,977,735 |
(5) Income Taxes
The components of the provision for federal and state income taxes in the accompanying consolidated statements of income are as follows:
|
2010
|
2009
|
2008
|
||||||||||
|
Taxes currently payable
|
$ | 134,000 | $ | 1,482,000 | $ | 4,917,000 | ||||||
| Deferred income taxes | (434,000 | ) | (782,000 | ) | (2,192,000 | ) | ||||||
|
Provision for (benefit from) income taxes
|
$ | (300,000 | ) | $ | 700,000 | $ | 2,725,000 | |||||
A reconciliation of income tax expense at the statutory rate to the Company’s actual income tax expense (benefit) is as follows:
32.
|
The Monarch Cement Company and Subsidiaries
Notes to Consolidated Financial Statements
December 31, 2010, 2009 and 2008
|
|
2010
|
2009
|
2008
|
||||||||||
|
Computed at statutory rate
|
||||||||||||
|
(34%; over $10 million-35%)
|
$ | (25,000 | ) | $ | 1,831,000 | $ | 4,435,000 | |||||
|
Increase (decrease) resulting from:
|
||||||||||||
|
State income taxes, net of federal
|
||||||||||||
|
tax benefit (expense)
|
(244,000 | ) | (40,000 | ) | - | |||||||
|
Percentage depletion
|
(552,000 | ) | (675,000 | ) | (1,328,000 | ) | ||||||
|
Valuation allowance
|
- | (110,000 | ) | (40,000 | ) | |||||||
|
Domestic production activities deduction
|
(26,000 | ) | (91,000 | ) | (284,000 | ) | ||||||
|
Life insurance proceeds
|
- | (146,000 | ) | - | ||||||||
|
Adjustment for Medicare drug subsidy
|
685,000 | - | - | |||||||||
|
Dividends received deduction
|
(43,000 | ) | (44,000 | ) | (48,000 | ) | ||||||
|
Other
|
(95,000 | ) | (25,000 | ) | (10,000 | ) | ||||||
|
Provision for (benefit from) income taxes
|
$ | (300,000 | ) | $ | 700,000 | $ | 2,725,000 | |||||
The tax effects of significant temporary differences relating to deferred taxes shown on the balance sheets were:
|
2010
|
2009
|
|||||||
|
Current:
|
||||||||
|
Allowance for doubtful accounts
|
$ | 285,000 | $ | 365,000 | ||||
|
Accrued vacation
|
450,000 | 410,000 | ||||||
|
Net current deferred tax assets
|
$ | 735,000 | $ | 775,000 | ||||
|
Noncurrent:
|
||||||||
|
Depreciation
|
$ | (44,000 | ) | $ | (65,000 | ) | ||
|
Postretirement benefits
|
14,121,000 | 12,322,000 | ||||||
|
Pension liability
|
5,122,000 | 4,933,000 | ||||||
|
Unrealized holding gains
|
(4,112,000 | ) | (1,764,000 | ) | ||||
|
Net operating loss carryforwards
|
1,412,000 | 1,433,000 | ||||||
|
Alternative minimum tax credit
|
373,000 | 200,000 | ||||||
|
Impairment on investments
|
1,624,000 | 1,399,775 | ||||||
|
Other, net
|
758,393 | 635,003 | ||||||
|
Net long-term deferred tax assets
|
$ | 19,254,393 | $ | 19,093,778 | ||||
Some of the Company’s subsidiaries file separate federal and/or state income tax returns which have resulted in net operating loss carryforwards. Deferred taxes resulting from net operating loss carryforwards are included in the above table net of valuation allowances. The valuation allowance has been used to reduce the tax benefit associated with the net operating loss carryforwards. The provision (benefit) for income taxes and income tax liabilities recorded in the financial statements include those separate calculations. The following table presents the expiration dates of the Company’s operating loss carryforwards for tax purposes as of December 31, 2010:
|
Expiration
Date |
Operating
Loss |
|||
| 2024 | $ | 78,000 | ||
| 2025 | 685,000 | |||
| 2026 | 380,000 | |||
| 2027 | 19,000 | |||
| 2028 | 136,000 | |||
| 2029 | 114,000 | |||
| $ | 1,412,000 | |||
|
|
The Company uses a recognition threshold of “more likely than not” that a tax position would be sustained upon examination before any part of the benefit of that position be recognized in an enterprise’s financial statements.
The Company or one of its subsidiaries files income tax returns in the U.S. Federal jurisdiction and various state jurisdictions. With few exceptions, the Company is no longer subject to U.S. Federal or state income tax examinations for years before 2007. The Company believes it is not subject to any significant tax risk. The Company does not have any accrued interest or penalties associated with any unrecognized tax benefits, nor were any interest expenses recognized during the years ended December 31, 2010, 2009 and 2008.
(6) Postretirement Benefits
Monarch provides certain postretirement health care and life insurance benefits to all retired employees in the Cement Business who, as of their retirement date, meet the eligibility requirements. These benefits are self-insured by Monarch and are paid out of Monarch’s general assets. Monarch expects 2011 cash expenditures for this plan to be approximately $1,775,000 which is equal to expected benefits and expenses.
Monarch uses a December 31 measurement date for the plans. At December 31, 2010 and 2009, the current portion of the accrued benefit cost of approximately $1,775,000 and $1,750,000, respectively, is recorded in compensation and benefits. Information about the plans’ funded status and postretirement cost follows:
| 2010 | 2009 | |||||||
|
Change in benefit obligation
|
||||||||
|
Beginning of year
|
$ | 31,956,610 | $ | 27,770,409 | ||||
|
Service cost
|
545,569 | 523,914 | ||||||
|
Interest cost
|
1,868,486 | 1,822,318 | ||||||
|
Actuarial (gain)/loss
|
3,364,218 | 3,461,520 | ||||||
|
Benefits and expenses paid*
|
(1,176,905 | ) | (1,352,568 | ) | ||||
|
Plan amendments
|
- | (268,983 | ) | |||||
|
Benefit obligation at end of year
|
$ | 36,557,978 | $ | 31,956,610 | ||||
|
Change in fair value of plan assets
|
||||||||
|
Beginning of year
|
$ | - | $ | - | ||||
|
Employer contributions*
|
1,176,905 | 1,352,568 | ||||||
|
Benefits paid and expenses*
|
(1,176,905 | ) | (1,352,568 | ) | ||||
|
Fair value of plan asset at end of year
|
$ | - | $ | - | ||||
| *Amounts are net of retiree prescription drug subsidy received during the fiscal year. | ||||||||
|
Funded status = year-end benefit liability
|
$ | (36,557,978 | ) | $ | (31,956,610 | ) | ||
Accrued Postretirement Benefits represents the accumulated difference between actual contributions and actual expenses from past years. It is updated from the prior year as follows:
|
2010
|
2009
|
|||||||||
| A. |
Accrued postretirement benefits at beginning of year
|
$ | (19,601,943 | ) | $ | (17,760,151 | ) | |||
| B. |
Net periodic postretirement benefit cost
|
3,134,963 | 3,194,360 | |||||||
| C. |
Employer contributions
|
1,329,046 | 1,428,696 | |||||||
| D. |
Retiree Drug Subsidy
|
152,141 | 76,128 | |||||||
| E. |
Accrued postretirement benefits at end of year
|
$ | (21,560,001 | ) | $ | (19,601,943 | ) | |||
|
(A) - (B) + (C) - (D)
|
||||||||||
34.
|
The Monarch Cement Company and Subsidiaries
Notes to Consolidated Financial Statements
December 31, 2010, 2009 and 2008
|
Amounts recognized in the balance sheets consist of:
| 2010 | 2009 | |||||||
|
Current liability
|
$ | (1,775,000 | ) | $ | (1,750,000 | ) | ||
|
Noncurrent liability
|
(34,782,978 | ) | (30,206,610 | ) | ||||
|
Net amount recognized
|
$ | (36,557,978 | ) | $ | (31,956,610 | ) | ||
Amounts recognized in accumulated other comprehensive income consist of:
| 2010 | 2009 | |||||||
|
Net actuarial loss/(gain)
|
$ | 15,216,208 | $ | 12,623,650 | ||||
|
Prior service cost/(credit)
|
(218,231 | ) | (268,983 | ) | ||||
| $ | 14,997,977 | $ | 12,354,667 | |||||
Other changes in plan assets and benefit obligations recognized in other comprehensive income:
|
2010
|
2009
|
2008
|
||||||||||
|
Current year actuarial (gain)/loss
|
$ | 3,364,218 | $ | 3,461,520 | $ | (1,734,298 | ) | |||||
|
Amortization of actuarial loss
|
(771,660 | ) | (848,128 | ) | (703,008 | ) | ||||||
|
Current year prior service credit
|
- | (268,983 | ) | - | ||||||||
|
Amortization of prior service credit
|
50,752 | - | - | |||||||||
|
Total recognized in other comprehensive income
|
$ | 2,643,310 | $ | 2,344,409 | $ | (2,437,306 | ) | |||||
Estimated amounts that will be amortized from accumulated other comprehensive income into net periodic postretirement benefit cost in 2011:
|
Actuarial loss
|
$ | 1,014,961 | ||
|
Prior service credit
|
(50,752 | ) | ||
|
Total
|
$ | 964,209 |
The assumed annual rate of increase in the per capita cost of covered health care benefits was 10% for 2010, 2009 and 2008. This trend rate is assumed to decrease in future years, 1% per year to an ultimate annual rate of 5%. Following are the components of net periodic benefit cost:
|
2010
|
2009
|
2008
|
||||||||||
|
Components of net periodic benefit cost
|
||||||||||||
|
Service cost
|
$ | 545,569 | $ | 523,914 | $ | 473,443 | ||||||
|
Interest cost
|
1,868,486 | 1,822,318 | 1,611,513 | |||||||||
|
Amortization of prior service cost
|
(50,752 | ) | - | - | ||||||||
|
Unrecognized net loss
|
771,660 | 848,128 | 703,008 | |||||||||
|
Net periodic benefit cost
|
$ | 3,134,963 | $ | 3,194,360 | $ | 2,787,964 | ||||||
The amortization schedule for prior service costs is as follows:
|
12/31/10
|
|||||||||||||||
|
Date
|
Initial
|
Initial
|
Outstanding
|
Annual
|
|||||||||||
|
Description
|
Established
|
Amount
|
Period
|
Balance
|
Amortization
|
||||||||||
|
Lifetime
|
|||||||||||||||
|
Maximums
|
12/31/09
|
$ | (268,983 | ) |
5.3 years
|
$ | (218,231 | ) | $ | (50,752 | ) | ||||
35.
|
|
The weighted-average assumptions as of December 31:
|
2010
|
2009
|
2008
|
||||||||||
|
Discount rate- benefit obligation
|
6.00 | % | 6.00 | % | 6.00 | % | ||||||
|
Discount rate- postretirement cost
|
5.50 | % | 6.00 | % | 6.00 | % | ||||||
Assumed health care cost trend rates have a significant effect on the amounts reported for the health care plans. A one-percentage-point change in assumed health care cost trend rates would have the following effects:
|
1% Increase
|
1% Decrease
|
|||||||
|
Interest cost and service cost for 2010
|
$ | 387,652 | $ | (314,121 | ) | |||
|
Accumulated postretirement benefit obligation at December 31, 2010
|
5,324,567 | (4,380,686 | ) | |||||
On December 8, 2003, the Medicare Prescription Drug Improvement Modernization Act of 2003 (the Act) was signed into law. The Act introduces a prescription drug benefit under Medicare Part D, as well as a federal subsidy of sponsors of retiree health care benefit plans that provide benefits at least actuarially equivalent to Medicare Part D. The Company has concluded that the benefits provided to most of our retirees are actuarially equivalent to Medicare Part D under the Act.
The accumulated postretirement benefit obligation as of December 31, 2010 is shown below:
|
Assuming Medicare Part D Subsidy receipts
|
$ | 36,557,978 | ||
|
Assuming no Medicare Part D Subsidy receipts
|
38,850,330 |
As of December 31, 2010, the following benefit payments and expenses (net of employee contributions) are expected to be paid:
|
December 31, 2011
|
$ | 1,773,836 | ||
|
December 31, 2012
|
1,878,055 | |||
|
December 31, 2013
|
2,000,562 | |||
|
December 31, 2014
|
2,109,258 | |||
|
December 31, 2015
|
2,214,397 | |||
|
Five fiscal years ending December 31, 2020
|
11,936,481 |
(7) Pension Plans
Monarch has noncontributory defined benefit pension plans covering substantially all employees in the Cement Business who meet the eligibility requirements. Monarch’s funding policy is to contribute annually an amount within the minimum/maximum range of tax deductible contributions. Monarch expects to contribute approximately $3,120,000 to the plans in 2011.
Monarch uses a December 31 measurement date for the plans. Information about the Plans’ funded status and pension cost follows:
|
Change in benefit obligation
|
2010
|
2009
|
||||||
|
Benefit obligation at beginning of year
|
$ | 34,200,588 | $ | 32,344,767 | ||||
|
Service cost
|
668,980 | 606,644 | ||||||
|
Interest cost
|
2,063,316 | 1,905,750 | ||||||
|
Actuarial (gain)/loss
|
2,238,159 | 1,145,444 | ||||||
|
Plan amendment
|
- | 55,026 | ||||||
|
Benefits paid and expenses
|
(1,912,401 | ) | (1,857,043 | ) | ||||
|
Benefit obligation at end of year
|
$ | 37,258,642 | $ | 34,200,588 | ||||
36.
|
The Monarch Cement Company and Subsidiaries
Notes to Consolidated Financial Statements
December 31, 2010, 2009 and 2008
|
|
Change in plan assets
|
2010
|
2009
|
||||||
|
Fair value of plan assets at beginning of year
|
$ | 21,950,550 | $ | 17,623,815 | ||||
|
Actual return on plan assets
|
2,231,098 | 4,087,805 | ||||||
|
Employer contribution
|
2,266,322 | 2,095,973 | ||||||
|
Benefits paid and expenses
|
(1,912,401 | ) | (1,857,043 | ) | ||||
|
Fair value of plan assets at end of year
|
$ | 24,535,569 | $ | 21,950,550 | ||||
|
Funded status, end of year
|
||||||||
|
Fair value of plan assets
|
$ | 24,535,569 | $ | 21,950,550 | ||||
|
Benefits obligation
|
37,258,642 | 34,200,588 | ||||||
|
Funded status
|
$ | (12,723,073 | ) | $ | (12,250,038 | ) | ||
The actuarial formula used to calculate the projected benefit obligation takes into account future increases in pension contributions that would take place as the employee’s salary increases. The accumulated benefit obligation uses an actuarial formula to calculate the projected benefit obligation which assumes that the employees cease to work for the Company at the time the estimation is made. The Plans’ accumulated benefit obligation follows:
|
Accumulated benefit obligation, end of year
|
$ | 35,538,166 | $ | 32,365,998 |
Amounts recognized in the balance sheets consist of:
|
2010
|
2009
|
|||||||
|
Current liability
|
$ | - | $ | - | ||||
|
Noncurrent liability
|
(12,723,073 | ) | (12,250,038 | ) | ||||
|
Net amount recognized
|
$ | (12,723,073 | ) | $ | (12,250,038 | ) | ||
Amounts recognized in accumulated other comprehensive income not yet recognized as components of net periodic benefit cost consist of:
|
2010
|
2009
|
|||||||
|
Net actuarial loss
|
$ | 13,270,761 | $ | 12,407,018 | ||||
|
Prior service cost
|
948,680 | 1,058,658 | ||||||
| $ | 14,219,441 | $ | 13,465,676 | |||||
|
Less: Deferred tax
|
5,690,000 | 5,390,000 | ||||||
|
Additional Pension Liability, net of deferred tax
|
$ | 8,529,441 | $ | 8,075,676 | ||||
Other changes in plan assets and benefit obligations recognized in other comprehensive income:
|
2010
|
2009
|
2008
|
||||||||||
|
Current year actuarial (gain)/loss
|
$ | 1,732,397 | $ | (1,586,733 | ) | $ | 9,838,021 | |||||
|
Amortization of actuarial gain/(loss)
|
(868,654 | ) | (1,020,563 | ) | (196,253 | ) | ||||||
|
Current year prior service (credit)/loss
|
- | 55,026 | - | |||||||||
|
Amortization of prior service credit/(cost)
|
(109,978 | ) | (133,919 | ) | (135,837 | ) | ||||||
| $ | 753,765 | $ | (2,686,189 | ) | $ | 9,505,931 | ||||||
|
Less: Deferred tax
|
300,000 | (1,070,000 | ) | 3,800,000 | ||||||||
|
Minimum pension liability, net of deferred tax
|
$ | 453,765 | $ | (1,616,189 | ) | $ | 5,705,931 | |||||
Estimated amounts that will be amortized from accumulated other comprehensive income into net periodic pension cost in 2011:
|
Actuarial loss
|
$ | 925,000 | ||
|
Prior service cost
|
111,000 | |||
|
Total to be amortized
|
$ | 1,036,000 |
The amortization schedule for prior service costs is as follows:
37.
|
|
|
12/31/2010
|
||||||||||||||
|
Established
|
Initial
|
Initial
|
Outstanding
|
Annual
|
||||||||||
|
Description
|
Dec. 31 of:
|
Amount
|
Period
|
Balance
|
Amortization
|
|||||||||
| Unrecognized Prior Service Cost |
1996
|
$ | 162,785 |
15.881 Years
|
$ | 19,285 | $ | 10,250 | ||||||
|
1999
|
37,715 |
16.530 Years
|
12,613 | 2,282 | ||||||||||
|
2001
|
409,804 |
15.745 Years
|
175,552 | 26,028 | ||||||||||
|
2003
|
22,267 |
13.230 Years
|
10,486 | 1,683 | ||||||||||
|
2007
|
876,119 |
13.410 Years
|
680,120 | 65,333 | ||||||||||
|
2009
|
55,026 |
12.500 Years
|
50,624 | 4,402 | ||||||||||
| $ | 948,680 | $ | 109,978 | |||||||||||
Cumulative employer contributions in excess of net periodic pension cost are as follows:
|
2010
|
2009
|
|||||||
|
A. Cumulative balance at beginning of year
|
$ | 1,215,638 | $ | 1,430,913 | ||||
|
B. Net periodic pension cost
|
1,985,592 | 2,311,248 | ||||||
|
C. Contributions
|
2,266,322 | 2,095,973 | ||||||
|
D. Cumulative balance at end of year
|
$ | 1,496,368 | $ | 1,215,638 | ||||
|
(A) – (B) + (C)
|
||||||||
The weighted average assumptions used to determine net pension cost and benefit obligations as of December 31, 2010, 2009 and 2008 are as follows:
|
2010
|
2009
|
2008
|
||||||||||
|
Benefit obligation:
|
||||||||||||
|
Discount rate
|
5.50 | % | 6.00 | % | 6.00 | % | ||||||
|
Expected return on plan assets
|
8.00 | % | 8.00 | % | 8.00 | % | ||||||
|
Rate of compensation increase (Staff plan only)
|
4.00 | % | 4.50 | % | 4.50 | % | ||||||
| Pension cost: | ||||||||||||
|
Discount rate
|
6.00 | % | 6.00 | % | 6.00 | % | ||||||
|
Expected return on plan assets
|
8.00 | % | 8.00 | % | 8.00 | % | ||||||
|
Rate of compensation increase (Staff plan only)
|
4.50 | % | 4.50 | % | 4.50 | % | ||||||
The following table presents the components of net periodic pension cost as of December 31, 2010, 2009 and 2008:
|
2010
|
2009
|
2008
|
||||||||||
|
Service cost
|
$ | 668,980 | $ | 606,644 | $ | 580,046 | ||||||
|
Interest cost
|
2,063,316 | 1,905,750 | 1,878,251 | |||||||||
|
Expected return on plan assets
|
(1,725,336 | ) | (1,355,628 | ) | (1,996,149 | ) | ||||||
|
Amortization of prior service cost
|
109,978 | 133,919 | 135,837 | |||||||||
|
Recognized net actuarial (gain)/loss
|
868,654 | 1,020,563 | 196,253 | |||||||||
|
Net periodic pension expense
|
$ | 1,985,592 | $ | 2,311,248 | $ | 794,238 | ||||||
The Company has estimated the long-term rate of return on plan assets based primarily on historical returns on plan assets as well as current facts and circumstances.
Plan assets are held by a trustee bank. A fund manager has been retained to make investment decisions within guidelines specified by Monarch. The guidelines permit investment in both equities and fixed income securities including common stocks, corporate bonds and debentures and U.S. Government securities. An investment committee appointed by the Board also invests a portion of the funds in equity securities. Asset allocation is primarily based on a strategy to provide stable earnings through investing in interest-generating or fixed income investments while still permitting the plan to recognize potentially higher returns through investment in equity securities. Focusing on balancing the risks and rewards of each broad asset class, the percentage of allocation between fixed income and equity investments for 2010 and 2009 are as follows:
38.
|
The Monarch Cement Company and Subsidiaries
Notes to Consolidated Financial Statements
December 31, 2010, 2009 and 2008
|
|
Equities
|
60%
|
|
|
Fixed Income
|
40%
|
The pension investment guidelines strive for diversification of equity securities among the various market sectors and do not permit participation in higher risk investment strategies involving hedging activities and the use of derivative instruments.
The Plan allows a 5% fluctuation before assets are re-balanced. During periods of extreme market volatility, the fluctuation may exceed 5% before re-balancing is complete. At December 31, 2010 and 2009, plan assets by category were as follows:
| 2010 | 2009 | |||||||
|
Equities
|
57 | % | 60 | % | ||||
|
Debt securities
|
38 | % | 34 | % | ||||
|
Other
|
5 | % | 6 | % |
Following is a description of the valuation methodologies used for pension plan assets measured at fair value on a recurring basis and recognized in the accompanying balance sheets, as well as the general classification of pension plan assets pursuant to the valuation hierarchy.
Where quoted market prices are available in an active market, plan assets are classified within Level 1 of the valuation hierarchy. Level 1 plan assets include equity securities which were priced at the market close. If quoted market prices are not available, then fair values are estimated by using pricing models, quoted prices of plan assets with similar characteristics or discounted cash flows. Level 2 plan assets include fixed income securities such as corporate bonds, U.S. Government Obligations and government issues. In certain cases where Level 1 or Level 2 inputs are not available, plan assets are classified within Level 3 of the hierarchy. The Plan was not invested in any Level 3 securities at December 31, 2010 or 2009.
The fair value of Monarch’s pension plan assets by asset category at December 31, 2010 and 2009 are as follows:
| Fair Value Measurements Using: | ||||||||||||||||
|
Quoted Prices
|
||||||||||||||||
|
in Active
|
Significant
|
Significant
|
||||||||||||||
|
Markets for
|
Observable
|
Unobservable
|
||||||||||||||
|
Identical Assets
|
Inputs
|
Inputs
|
||||||||||||||
|
2010
|
Total
|
(Level 1)
|
(Level 2)
|
(Level 3)
|
||||||||||||
|
Cash and cash equivalents
|
$ | 1,347,066 | $ | 1,347,066 | $ | - | $ | - | ||||||||
|
Equity securities:
|
||||||||||||||||
|
Materials
|
862,935 | 862,935 | - | - | ||||||||||||
|
Industrials
|
1,692,975 | 1,692,975 | - | - | ||||||||||||
|
Telecommunication
|
1,061,276 | 1,061,276 | - | - | ||||||||||||
|
Consumer discretion
|
1,747,794 | 1,747,794 | - | - | ||||||||||||
|
Consumer staples
|
1,274,340 | 1,274,340 | - | - | ||||||||||||
|
Energy
|
1,857,015 | 1,857,015 | - | - | ||||||||||||
|
Financials
|
2,135,305 | 2,135,305 | - | - | ||||||||||||
|
Healthcare
|
1,706,119 | 1,706,119 | - | - | ||||||||||||
|
Information technology
|
875,584 | 875,584 | - | - | ||||||||||||
|
Utilities
|
727,869 | 727,869 | - | - | ||||||||||||
|
Fixed income securities:
|
||||||||||||||||
|
Corporate bonds
|
3,209,469 | - | 3,209,469 | - | ||||||||||||
|
Foreign obligations
|
530,320 | - | 530,320 | - | ||||||||||||
|
U.S. government obligations
|
5,507,504 | - | 5,507,504 | - | ||||||||||||
|
Total
|
$ | 24,535,569 | $ | 15,288,276 | $ | 9,247,293 | $ | - | ||||||||
39.
|
|
| Fair Value Measurements Using: | ||||||||||||||||
|
Quoted Prices
|
||||||||||||||||
|
in Active
|
Significant
|
Significant
|
||||||||||||||
|
Markets for
|
Observable
|
Unobservable
|
||||||||||||||
|
Identical Assets
|
Inputs
|
Inputs
|
||||||||||||||
|
2009
|
Total
|
(Level 1)
|
(Level 2)
|
(Level 3)
|
||||||||||||
|
Cash and cash equivalents
|
$ | 1,313,332 | $ | 1,313,332 | $ | - | $ | - | ||||||||
|
Equity securities:
|
- | |||||||||||||||
|
Materials
|
471,040 | 471,040 | - | - | ||||||||||||
|
Industrials
|
1,065,459 | 1,065,459 | - | - | ||||||||||||
|
Telecommunication
|
1,351,285 | 1,351,285 | - | - | ||||||||||||
|
Consumer discretion
|
2,035,289 | 2,035,289 | - | - | ||||||||||||
|
Consumer staples
|
759,525 | 759,525 | - | - | ||||||||||||
|
Energy
|
1,960,261 | 1,960,261 | - | - | ||||||||||||
|
Financials
|
2,635,158 | 2,635,158 | - | - | ||||||||||||
|
Healthcare
|
1,235,468 | 1,235,468 | - | - | ||||||||||||
|
Information technology
|
1,412,894 | 1,412,894 | - | - | ||||||||||||
|
Utilities
|
243,181 | 243,181 | - | - | ||||||||||||
|
Fixed income securities:
|
||||||||||||||||
|
Corporate bonds
|
3,480,146 | - | 3,480,146 | - | ||||||||||||
|
Foreign obligations
|
586,157 | - | 586,157 | - | ||||||||||||
|
U.S. government obligations
|
3,401,355 | - | 3,401,355 | - | ||||||||||||
|
Total
|
$ | 21,950,550 | $ | 14,482,892 | $ | 7,467,658 | $ | - | ||||||||
The Plan’s expected benefit payments as of December 31, 2010, shown separately for the next five fiscal years and in the aggregate for the subsequent five-year period, are presented below:
|
2011
|
$ | 2,128,409 | ||
|
2012
|
2,201,311 | |||
|
2013
|
2,298,392 | |||
|
2014
|
2,320,542 | |||
|
2015
|
2,416,054 | |||
|
Five fiscal years ending
December 31, 2020 |
13,349,932 |
The Company has defined contribution plans covering substantially all permanent employees of the Ready-Mixed Concrete Business. These plans allow the Company, at its discretion, to match the employee’s contributions. For the 2010, 2009 and 2008 plan years, the Company matched 25% of the first 6% of the employee’s compensation up to a maximum match of $2,500. The Company contributed $61,361, $58,859 and $64,028 to these plans for the years 2010, 2009 and 2008, respectively. The Company expects to contribute $60,000 to these plans in 2011.
(8) Significant Estimates and Certain Concentrations
Thirty-four percent (34%) of the Company’s employees are covered by various collective bargaining agreements. None of the Company’s agreements expire in 2011. The Company believes it has a good working relationship with its employees and has been successful in negotiating multi-year union contracts without work stoppages.
The Company has a noncontributory defined benefit pension plan and a postretirement health care plan that provide certain postretirement benefits to eligible employees. The benefit obligation is the actuarial present value of all benefits attributed to services rendered prior to the valuation date based on the Entry Age Actuarial Cost
40.
|
The Monarch Cement Company and Subsidiaries
Notes to Consolidated Financial Statements
December 31, 2010, 2009 and 2008
|
Method and the Projected Unit Credit Actuarial Cost Method, respectively. It is reasonably possible that events could occur that would change the estimated amount of these liabilities materially in the near term.
The current protracted economic decline continues to present companies with unprecedented circumstances and challenges, which in some cases have resulted in large declines in the fair value of investments and other assets, declines in the volume of business, constraints on liquidity and difficulty obtaining financing. The financial statements have been prepared using values and information currently available to the Company.
Current economic and financial market conditions could adversely affect our results of operations in future periods. The current instability in the financial markets may make it difficult for certain of our customers to obtain financing, which may significantly impact the volume of future sales which could have an adverse impact on the Company’s future operating results.
In addition, given the volatility of current economic conditions, the values of assets and liabilities recorded in the financial statements could change rapidly, resulting in material future adjustments in investment values (including defined benefit pension plan investments), allowances for accounts, net realizable value of inventory, and realization of deferred tax assets that could negatively impact the Company’s ability to meet debt covenants or maintain sufficient liquidity.
The Company self-reported potential violations of certain permitting requirements of the Kansas Department of Health and Environment (KDHE). As a result, the Company was notified by letter dated April 27, 2009 of allegations by KDHE that the Company has performed multiple modifications and alterations at the Company’s facility for which the Company did not apply for or obtain the KDHE construction permits required by the Kansas Air Quality Act and related regulations. KDHE also alleged that the Company did not apply for or obtain from KDHE the necessary permits for modifications or alterations to a facility that are significant for Prevention of Significant Deterioration (PSD). Based on these allegations, KDHE proposes to assess a civil penalty of $351,000, and to require the Company to submit a new, complete PSD permit application, including therein a proposal by the Company for installation of air emission controls to achieve Best Available Control Technology (BACT) as provided in applicable regulations. The Company does not agree with certain of KDHE’s factual and legal allegations, and is attempting to resolve these issues through negotiation and mutual agreement between the Company and KDHE. The Company reserves all legal rights in the event such a resolution cannot be reached. As of December 31, 2010, it is probable that losses may result, but such losses are estimated to be insignificant.
The Company is subject to claims and lawsuits that arise primarily in the ordinary course of business. It is the opinion of management that the disposition or ultimate resolution of such claims and lawsuits will not have a material adverse effect on the consolidated financial position, results of operations and cash flows of the Company.
The Company invests in various equity securities which are exposed to market risks. Due to the level of risk associated with certain equity securities, it is at least reasonably possible that changes in the values of equity securities will occur in the near term and that such change could materially affect the amounts reported in the accompanying balance sheet.
(9) Stockholders’ Equity
Capital Stock and Class B Capital Stock have the same rights except as follows: Class B Capital Stock has voting rights of ten votes per share and restricted transferability; Class B Capital Stock is convertible at all
41.
|
|
times into Capital Stock on a share-for-share basis; and Capital Stock has one vote per share and is freely transferable.
(10) Lines of Business
The Company groups its operations into two lines of business - Cement Business and Ready-Mixed Concrete Business. The Company’s business lines are separate business units that offer different products. The accounting policies for each line are the same as those described in the summary of significant accounting policies. Corporate assets include for 2010: cash and cash equivalents, deferred income taxes, investments and other assets; for 2009: cash and cash equivalents, refundable federal and state income taxes, deferred income taxes, investments and other assets; and for 2008: cash and cash equivalents, short-term investments, refundable federal and state income taxes, deferred income taxes, investments and other assets.
Following is information for each line for the years ended December 31, 2010, 2009 and 2008:
|
Ready-Mixed
|
Adjustments
|
|||||||||||||||
|
Cement
|
Concrete
|
and
|
||||||||||||||
|
Business
|
Business
|
Eliminations
|
Consolidated
|
|||||||||||||
|
For the Year Ended December 31, 2010
|
||||||||||||||||
|
Sales to unaffiliated customers
|
$ | 49,436,170 | $ | 71,748,664 | $ | - | $ | 121,184,834 | ||||||||
|
Intersegment sales
|
14,846,799 | 14,667 | (14,861,466 | ) | - | |||||||||||
|
Total net sales
|
$ | 64,282,969 | $ | 71,763,331 | $ | (14,861,466 | ) | $ | 121,184,834 | |||||||
|
Income (loss) from operations
|
$ | 6,147,514 | $ | (6,005,382 | ) | $ | 142,132 | |||||||||
|
Other loss, net
|
(218,210 | ) | ||||||||||||||
|
Loss before income taxes
|
$ | (76,078 | ) | |||||||||||||
|
Identifiable assets at December 31, 2010
|
$ | 89,992,392 | $ | 37,106,313 | $ | 127,098,705 | ||||||||||
|
Corporate assets
|
47,000,123 | |||||||||||||||
|
Total assets at December 31, 2010
|
$ | 174,098,828 | ||||||||||||||
|
For the Year Ended December 31, 2009
|
||||||||||||||||
|
Sales to unaffiliated customers
|
$ | 55,687,700 | $ | 76,506,842 | $ | - | $ | 132,194,542 | ||||||||
|
Intersegment sales
|
12,478,688 | - | (12,478,688 | ) | - | |||||||||||
|
Total net sales
|
$ | 68,166,388 | $ | 76,506,842 | $ | (12,478,688 | ) | $ | 132,194,542 | |||||||
|
Income (loss) from operations
|
$ | 7,019,307 | $ | (2,070,723 | ) | $ | 4,948,584 | |||||||||
|
Other income, net
|
436,035 | |||||||||||||||
|
Income before income taxes
|
$ | 5,384,619 | ||||||||||||||
|
Identifiable assets at December 31, 2009
|
$ | 95,490,586 | $ | 39,995,968 | $ | 135,486,554 | ||||||||||
|
Corporate assets
|
41,511,123 | |||||||||||||||
|
Total assets at December 31, 2009
|
$ | 176,997,677 | ||||||||||||||
|
For the Year Ended December 31, 2008
|
||||||||||||||||
|
Sales to unaffiliated customers
|
$ | 69,683,762 | $ | 84,202,711 | $ | - | $ | 153,886,473 | ||||||||
|
Intersegment sales
|
15,873,001 | 1,079 | (15,874,080 | ) | - | |||||||||||
|
Total net sales
|
$ | 85,556,763 | $ | 84,203,790 | $ | (15,874,080 | ) | $ | 153,886,473 | |||||||
|
Income (loss) from operations
|
$ | 18,362,170 | $ | (1,607,168 | ) | $ | 16,755,002 | |||||||||
|
Other loss, net
|
(3,797,295 | ) | ||||||||||||||
|
Income before income taxes
|
$ | 12,957,707 | ||||||||||||||
|
Identifiable assets at December 31, 2008
|
$ | 94,620,462 | $ | 40,705,428 | $ | 135,325,890 | ||||||||||
|
Corporate assets
|
39,438,759 | |||||||||||||||
|
Total assets at December 31, 2008
|
$ | 174,764,649 | ||||||||||||||
42.
|
The Monarch Cement Company and Subsidiaries
Notes to Consolidated Financial Statements
December 31, 2010, 2009 and 2008
|
Total sales by line of business before adjustments and eliminations include both sales to unaffiliated customers (as reported in the Company’s consolidated statements of income, comprehensive income and stockholders’ equity and noncontrolling interests) and intersegment sales. Intersegment sales are accounted for by the same method as sales to unaffiliated customers.
Income from operations is total net sales less operating expenses. In computing income from operations, none of the following items have been added or deducted: general corporate income and expenses; interest expense; and income taxes. Depreciation and depletion for the Cement Business and Ready-Mixed Concrete Business, respectively, was approximately: $7,400,000 and $3,900,000 in 2010; $7,600,000 and $4,500,000 in 2009; and $7,700,000 and $4,200,000 in 2008. Capital expenditures for the Cement Business and Ready-Mixed Concrete Business, respectively, were: $2,549,023 and $2,920,830 in 2010; $6,911,591 and $3,445,124 in 2009; and $2,932,393 and $4,893,733 in 2008. Identifiable assets by line of business are those assets that are used in the Company’s operations in each industry.
During 2010, 2009 and 2008, there were no sales to any one customer in excess of 10% of consolidated net sales.
(11) Subsequent Events
Subsequent events have been evaluated through the date the financial statements were issued. During this period, no material recognizable subsequent events were identified.
|
First
|
Second
|
Third
|
Fourth
|
|||||||||||||
|
2010
|
Quarter
|
Quarter
|
Quarter
|
Quarter
|
||||||||||||
|
Net sales
|
$ | 18,194,726 | $ | 34,073,747 | $ | 37,123,469 | $ | 31,792,892 | ||||||||
|
Gross profit (loss) from operations
|
(2,464,272 | ) | 7,511,514 | 6,466,840 | 4,693,040 | |||||||||||
|
Income (loss) from operations
|
(6,351,790 | ) | 3,649,746 | 2,616,147 | 228,029 | |||||||||||
|
Net income (loss)
|
(4,697,326 | ) | 2,511,966 | 1,228,351 | 1,180,931 | |||||||||||
|
Basic earnings (loss) per share
|
(1.17 | ) | 0.62 | 0.31 | 0.30 | |||||||||||
|
Loss on impairment of equity investments
|
- | - | (858,787 | ) | - | |||||||||||
|
2009
|
||||||||||||||||
|
Net sales
|
$ | 25,330,736 | $ | 36,164,068 | $ | 42,410,390 | $ | 28,289,348 | ||||||||
|
Gross profit from operations
|
471,912 | 8,230,625 | 10,648,719 | 2,196,479 | ||||||||||||
|
Income (loss) from operations
|
(3,649,721 | ) | 4,197,728 | 6,633,114 | (2,232,537 | ) | ||||||||||
|
Net income (loss)
|
(2,664,491 | ) | 2,980,062 | 4,947,133 | (578,085 | ) | ||||||||||
|
Basic earnings (loss) per share
|
(0.66 | ) | 0.75 | 1.23 | (0.14 | ) | ||||||||||
|
Loss on impairment of equity investments
|
- | - | - | (524,188 | ) | |||||||||||
(13) Other Comprehensive Income
Accumulated other comprehensive income (loss) included in the balance sheet at December 31 is as follows:
|
2009
|
Change
|
2010
|
||||||||||
|
Unrealized appreciation on available-
|
||||||||||||
|
for-sale securities
|
$ | 2,646,000 | $ | 3,522,000 | $ | 6,168,000 | ||||||
|
Pension liability adjustment
|
(8,075,676 | ) | (453,765 | ) | (8,529,441 | ) | ||||||
|
Postretirement liability adjustment
|
(7,404,667 | ) | (908,310 | ) | (8,312,977 | ) | ||||||
| $ | (12,834,343 | ) | $ | 2,159,925 | $ | (10,674,418 | ) | |||||
43.
|
|
|
2008
|
Change
|
2009
|
||||||||||
|
Unrealized appreciation on available-
|
||||||||||||
|
for-sale securities
|
$ | 1,188,000 | $ | 1,458,000 | $ | 2,646,000 | ||||||
|
Pension liability adjustment
|
(9,691,865 | ) | 1,616,189 | (8,075,676 | ) | |||||||
|
Postretirement liability adjustment
|
(6,005,258 | ) | (1,399,409 | ) | (7,404,667 | ) | ||||||
| $ | (14,509,123 | ) | $ | 1,674,780 | $ | (12,834,343 | ) | |||||
(14) Future Change in Accounting Principles
In January 2010, the FASB issued ASU 2010-06, “Improving Disclosures About Fair Value Measurements”, which amends Subtopic 820-10 with new disclosure requirements and clarification of existing disclosure requirements. Reporting entities must make new disclosures about recurring or nonrecurring fair-value measurements including significant transfers into and out of Level 1 and Level 2 fair-value measurements and information on purchases, sales, issuances, and settlements on a gross basis in the reconciliation of Level 3 fair- value measurements. The ASU also provides additional guidance related to the level of disaggregation in determining classes of assets and liabilities and disclosures about inputs and valuation techniques. ASU 2010-06 is effective for annual or interim reporting periods beginning after December 15, 2009, except for Level 3 reconciliation disclosures which are effective for annual periods beginning after December 15, 2010 and for interim periods within those fiscal years. We do not expect the Level 3 reconciliation disclosures will have a material impact on our consolidated financial statements and disclosures.
In April 2010, the FASB issued ASU No. 2010-17, “Revenue Recognition - Milestone Method (Topic 605): Milestone Method of Revenue Recognition”. This ASU provides guidance on defining a milestone and determining when it may be appropriate to apply the milestone method of revenue recognition. Consideration that is contingent on achievement of a milestone in its entirety may be recognized as revenue in the period in which the milestone is achieved only if the milestone is judged to meet certain criteria to be considered substantive. The updated guidance is effective on a prospective basis for milestones achieved in fiscal years, and interim periods within those years, beginning on or after June 15, 2010. Entities may elect to adopt the amendments in the ASU retrospectively for all prior periods. The Company does not expect the adoption of these provisions to have a material effect on its consolidated financial statements.
In December 2010, the FASB issued ASU 2010-28, “Intangibles - Goodwill and Other (Topic 350)”, which amends Subtopic 350-20 with modifications to Step 1 of the goodwill impairment test for those reporting units with zero or negative carrying amounts so that an entity is required to perform Step 2 of the goodwill impairment test if it is more likely than not, based on an assessment of qualitative indicators, that a goodwill impairment exists. ASU 2010-28 is effective for fiscal years, and interim periods within those years, beginning after December 15, 2010. Early adoption is not permitted. The Company does not expect adoption of this standard to have a material impact on its consolidated financial statements.
In December 2010, the FASB issued ASU No. 2010-29, “Business Combinations (Topic 805)”, which requires public entities that present comparative financial statements to disclose revenue and earnings of the combined entity as though the business combination(s) that occurred during the current year had occurred at the beginning of the comparable prior annual reporting period only. The amendments also expand the supplemental pro forma disclosures under Topic 805 to include a description of the nature and amount of material, nonrecurring pro forma adjustments directly attributable to the business combination included in the reported pro forma revenue and earnings. These amendments are effective for business combinations for which the acquisition date is on or after the beginning of the first annual reporting period beginning on or after December 15, 2010. The Company does not expect the adoption of this standard to have a material impact on our consolidated financial statements.
44.
| CORPORATE INFORMATION | ||
| CORPORATE OFFICE | DIRECTORS | |
| 449 1200 Street | Jack R. Callahan | |
| P.O. Box 1000 | Retired President, The Monarch Cement Company | |
| Humboldt, KS 66748 | Ronald E. Callaway | |
| Phone: (620) 473-2222 | Retired feed yard manager | |
| Fax: (620) 473-2447 | David L. Deffner | |
| Director of Music, Davis Community Church | ||
| AUDITORS | Robert M. Kissick | |
| BKD, LLP | Chairman, Hydraulic Power Systems, Inc. | |
| Kansas City, Missouri | Gayle C. McMillen | |
| Adjunct Professor, Kansas Wesleyan University | ||
| ANNUAL MEETING | Richard N. Nixon | |
| The annual meeting of the stockholders of | Retired partner, Stinson Morrison Hecker LLP law firm | |
| The Monarch Cement Company is held the | Byron J. Radcliff | |
| second Wednesday in April of each year at the | Rancher | |
| Company’s corporate offices. | Byron K. Radcliff | |
| Owner/Manager, Radcliff Ranch | ||
| TRANSFER AGENT AND REGISTRAR | Michael R. Wachter | |
| The Monarch Cement Company | Vice President, Civil Engineer and Director of | |
| P.O. Box 1000 | Operations, Concrete Technology Corp. | |
| Humboldt, KS 66748-0900 | Walter H. Wulf, Jr. | |
| shareholder.relations@monarchcement.com | President and Chairman of the Board | |
| Walter H. Wulf, III | ||
| District Sales Manager, General Motors Corporation | ||
| STOCK TRADING INFORMATION | ||
| Trading Symbol: MCEM | OFFICERS | |
| Over-the-Counter Market | Walter H. Wulf, Jr. | |
| President and Chairman of the Board | ||
| INVESTOR RELATIONS | ||
| Inquiries may be directed to Debra P. Roe, | *Byron K. Radcliff | |
| Chief Financial Officer and Assistant Secretary- | Vice Chairman of the Board, Secretary and Treasurer | |
| Treasurer, at the corporate address shown above. | ||
| *Robert M. Kissick | ||
| Vice President | ||
| FORM 10-K | ||
| The Company’s Annual Report on Form 10-K, as | Rick E. Rush | |
| filed with the Securities and Exchange Commission, | Vice President | |
| is available upon request by writing to Debra P. Roe | ||
| at the corporate address shown above. The Form | Debra P. Roe | |
| 10-K, without exhibits, will be provided at no | Chief Financial Officer and | |
| charge, and also is available on the Company’s | Assistant Secretary-Treasurer | |
| website, http://www.monarchcement.com. | ||
| Lisa J. Fontaine | ||
| Assistant Secretary | ||
| The Company’s financial information is also available | ||
| from the SEC at their EDGAR internet address, | Harvey D. Buckley | |
| http://www.sec.gov. | Vice President - Cement Manufacturing | |
| N. Joan Perez | ||
| ETHICS POLICY | Vice President - Sales | |
| The Company’s ethics policy is available on the About | ||
| Us link of the Company’s website, | ||
| http://www.monarchcement.com. | *Not actively involved in the daily affairs of the Company. | |