Attached files
| file | filename |
|---|---|
| 10-K - METRO BANCORP, INC. | a2010q410k.htm |
| EX-99 - METRO BANCORP, INC. | ex99201010k.htm |
| EX-23 - METRO BANCORP, INC. | ex23201010k.htm |
| EX-32 - METRO BANCORP, INC. | ex32201010k.htm |
| EX-21 - METRO BANCORP, INC. | ex21201010k.htm |
| EX-10.7 - METRO BANCORP, INC. | ex107201010k.htm |
| EX-31.1 - METRO BANCORP, INC. | ex311201010k.htm |
| EX-31.2 - METRO BANCORP, INC. | ex312201010k.htm |
| EX-10.8 - METRO BANCORP, INC. | ex108201010k.htm |
| EX-10.13 - METRO BANCORP, INC. | ex1013201010k.htm |
| EX-10.11 - METRO BANCORP, INC. | ex1011201010k.htm |
| EX-10.12 - METRO BANCORP, INC. | ex1012201010k.htm |
Exhibit 13
Management's Discussion and Analysis of Financial Condition and Results of Operations analyzes the major elements of our consolidated balance sheets and statements of operations. This section should be read in conjunction with our consolidated financial statements and accompanying notes.
Executive Summary
The year 2010 was a challenge for the Banking industry with a difficult credit environment combined with a weakened economy that continues to suffer the effects of a recession. In spite of these outside pressures, Metro Bancorp has remained fully committed to our competitive strategy which utilizes a unique retail model, built upon the gathering and retention of low-cost core deposits. We believe deposit growth continues to be the primary driver of our success and that service and a superior customer experience drives deposit growth.
Our 2010 highlights are summarized below:
• | The number of households served increased by 5%. |
• | We introduced the Metro Bank Personal Visa ® Credit Card and "Pay Anyone", a free feature of our online bill pay service that enables customers to send personal payments to anyone with a U.S. bank account by using the recipient's e-mail or cell phone number. |
• | For fiscal year 2010, the Bank ranked third for number of loans originated and fourth in total dollars of loan production in the U.S. Small Business Administration's Philadelphia District, which comprises 40 counties in the eastern half of Pennsylvania. |
• | For the 13th time in the past 14 years, the Central Pennsylvania Business Journal has named Metro Bancorp as one of the 50 Fastest Growing Companies in Central Pennsylvania. |
• | For the seventh straight year, Metro Bank was voted Best Bank by the Harrisburg Magazine Simply the Best Reader's Poll. |
• | During the first quarter we terminated our proposed merger agreement with Republic First Bancorp, Inc. because of uncertainties regarding regulatory approval of the application for merger. We intend to pursue de novo expansion in both our existing Central Pennsylvania footprint as well as Metro Philadelphia. |
• | Total assets reached $2.23 billion. |
• | Total deposits exceeded $1.83 billion. |
• | Total average deposits for the year were up $160.6 million, or 9%, over the previous year. |
• | The Bank's deposit cost of funds was 0.72% as compared to 1.02% for the same period one year ago. |
• | Net loans totaled $1.36 billion. |
• | Net loan charge-offs for 2010 totaled $13.8 million, or 0.98%, of average loans, excluding loans held for sale, compared to $14.8 million, or 1.02%, of average loans for 2009. Nonperforming assets as a percentage of total assets were 2.68% at December 31, 2010 compared to 2.12% as of December 31, 2009. |
• | Stockholders' equity totaled $205.4 million at December 31, 2010 and the ratio of stockholders' equity to total assets was 9.19%. |
• | The Company's capital levels remained strong with a consolidated leverage ratio as of December 31, 2010 of 10.68% and a total risk-based capital ratio of 15.83%. |
• | Total revenues for 2010 were $109.2 million, up $9.2 million, or 9%, compared to 2009. |
• | The Company's net interest margin on a fully tax-equivalent basis for 2010 was a very strong 4.00% compared to 3.92% for the same period in 2009. |
The Company recorded a net loss of $4.3 million for 2010, compared to a net loss of $1.9 million in 2009. Fully diluted net loss per share was $(0.33) for 2010 versus $(0.24) for the prior year. Despite posting a net loss for the full year, the Company recorded net income in three of the four quarters of 2010. Results of operations for the year ended December 31, 2010 were impacted by the following pretax transactions:
• | Provision for loan losses of $21.0 million versus $12.4 million for the prior year; |
• | Consulting fees of $4.5 million versus $762,000 in 2009; and |
• | Foreclosed real estate expenses totaling $1.4 million compared to $578,000 in 2009. |
1
Key financial highlights for 2010 compared to 2009 are summarized in the following table:
December 31, | % | |||||||||
(dollars in millions) | 2010 | 2009 | Change | |||||||
Total assets | $ | 2,234.5 | $ | 2,147.8 | 4 | % | ||||
Total loans (net) | 1,357.6 | 1,429.4 | (5 | ) | ||||||
Total deposits | 1,832.2 | 1,814.7 | 1 | |||||||
Stockholders' equity | 205.4 | 200.0 | 3 | |||||||
Years Ended December 31, | % | |||||||||
(dollars in millions, except per share data) | 2010 | 2009 | Change | |||||||
Total revenues | $ | 109.2 | $ | 100.1 | 9 | % | ||||
Provision for loan losses | 21.0 | 12.4 | 69 | |||||||
Noninterest expenses | 97.1 | 91.7 | 6 | |||||||
Net loss | (4.3 | ) | (1.9 | ) | (129 | ) | ||||
Diluted net loss per share | (0.33 | ) | (0.24 | ) | (38 | ) | ||||
Application of Critical Accounting Policies
Our accounting policies are fundamental to understanding Management's Discussion and Analysis of Financial Condition and Results of Operations. Our accounting policies are more fully described in Note 1 of the Notes to Consolidated Financial Statements for December 31, 2010 included herein. Our consolidated financial statements are prepared in conformity with accounting principles generally accepted in the United States of America (GAAP). These principles require our management to make estimates and assumptions, including those related to future events, about future events that affect the amounts reported in our consolidated financial statements and accompanying notes. Since future events and their effects cannot be determined with absolute certainty, actual results may differ from those estimates. Management makes adjustments to its assumptions and estimates when facts and circumstances dictate. We evaluate our estimates and assumptions on an ongoing basis and predicate those estimates and assumptions on historical experience and on various other factors that are believed to be reasonable under the circumstances. Management believes the following critical accounting policies encompass the more significant assumptions and estimates used in preparation of our consolidated financial statements.
Allowance for Loan Losses. The allowance for loan losses represents the amount available for estimated probable losses existing in our loan portfolio. While the allowance for loan losses is maintained at a level believed to be adequate by management for estimated probable losses in the loan portfolio, the determination of the allowance is inherently subjective, as it involves significant estimates by management, all of which may be susceptible to significant change.
While management uses available information to make such evaluations, future adjustments to the allowance and the provision for loan losses may be necessary if economic conditions or loan credit quality differ substantially from the estimates and assumptions used in making the evaluations. The use of different assumptions could materially impact the level of the allowance for loan losses and, therefore, the provision for loan losses to be charged against earnings. Such changes could impact future financial results.
Monthly, systematic reviews of our loan portfolio are performed to identify inherent losses and assess the overall probability of collection. These reviews include an analysis of historical default and loss experience, which results in the identification and quantification of loss factors. These loss factors are used in determining the appropriate level of allowance to cover the estimated probable losses existing in specific loan types. Management judgment involving the estimates of loss factors can be impacted by many variables, such as the number of years of actual loss history included in the evaluation.
During the third quarter of 2010, as part of the quantitative analysis of the adequacy of the allowance for loan losses, management adjusted its projection of probable loan losses based upon a much shorter and more recent period of actual historical losses. This was done as a result of the higher level of loan charge-offs experienced by the Company over the past two years compared to previous years. Given the continued state of the economy and its impact on borrowers and on loan collateral values, management feels this is currently a better predictor of probable additional loan losses until such time that the economy, borrower repayment ability and loan collateral values show sustained signs of improvement. The change in this estimate resulted in an additional $3.6 million of provision. The impact to the net loss after taxes was an additional loss of $2.4 million or $0.17 per share.
2
The methodology used to determine the appropriate level of the allowance for loan losses and related provisions differs for commercial and consumer loans and involves other overall evaluations. In addition, significant estimates are involved in the determination of the appropriate level of allowance related to impaired loans. The portion of the allowance related to impaired loans is based on (1) discounted cash flows using the loan's effective interest rate, (2) the fair value of the collateral for collateral-dependent loans, or (3) the observable market price of the impaired loan. Each of these variables involves judgment and the use of estimates.
In addition to calculating and testing of loss factors, we periodically evaluate changes in levels and trends of charge-offs, delinquencies and nonaccrual loans, trends in the volume and the terms of loans, changes in underwriting standards and practices, tenure of the loan officers and management, changes in credit concentrations and national and local economic trends and conditions, among other things.
Management judgment is involved at many levels of these evaluations.
An integral aspect of our risk management process is allocating the allowance for loan losses to various components of the loan portfolio based upon an analysis of risk characteristics, demonstrated losses, industry and other segmentations and other more judgmental factors.
Other-than-Temporary Impairment of Investment Securities. We perform no less than quarterly reviews of the fair value of the securities in the Company's investment portfolio and evaluate individual securities for declines in fair value that may be other-than-temporary. If declines are deemed other-than-temporary, an impairment loss is recognized against earnings for the portion of the impairment deemed to be related to credit. The remaining portion of the impairment that is not related to credit is written down to its current fair value through other comprehensive income.
Effective April 1, 2009, the Company adopted the provisions to fair value measurement guidance regarding Recognition and Presentation of Other-Than-Temporary Impairments. This critical accounting policy is more fully described in Note 1 and Note 3 of the Notes to Consolidated Financial Statements included elsewhere in this annual report for the year ended December 31, 2010.
Stock-Based Compensation. The Company recognizes compensation costs related to share-based payment transactions in the income statement (with limited exceptions) based on the grant-date fair value of the stock-based compensation issued. Compensation costs are recognized over the period that an employee provides service in exchange for the award. The grant-date fair value and ultimately, the amount of compensation expense recognized are dependent upon certain assumptions we make such as the expected term the options will remain outstanding, the volatility and dividend yield of our Company stock and a risk free interest rate. This critical accounting policy is more fully described in Note 1 and Note 14 of the Notes to Consolidated Financial Statements included elsewhere in this annual report for the year ended December 31, 2010.
Fair Value Measurements. The Company is required to disclose the fair value of its financial instruments that are measured at fair value within a fair value hierarchy. The fair value hierarchy prioritizes the inputs to valuation techniques used to measure fair value, giving the highest priority to unadjusted quoted prices in active markets for identical assets or liabilities (level 1 measurement) and the lowest priority to unobservable inputs (level 3 measurements). These disclosures appear in Note 20 of the Notes to Consolidated Financial Statements for the year ended December 31, 2010. Judgment is involved not only with deriving the estimated fair values but also with classifying the particular assets recorded at fair value in the fair value hierarchy. Estimating the fair value of impaired loans or the value of collateral securing foreclosed assets requires the use of significant unobservable inputs (level 3 measurements). At December 31, 2010, the fair value of assets based on level 3 measurements constituted 3% of the total assets measured at fair value. The fair value of collateral securing impaired loans or constituting foreclosed assets is generally determined based upon independent third party appraisals of the properties, recent offers, or prices on comparable properties in the proximate vicinity. Such estimates can differ significantly from the amounts the Company would ultimately realize from the loan or disposition of underlying collateral.
The Company's available for sale (AFS) investment security portfolio constitutes 97% of the total assets measured at fair value and all securities are classified as a level 2 fair value measurement (quoted prices in markets that are not active, or inputs that are observable, either directly or indirectly, for substantially the full term of the asset or liability). Management utilizes third party service providers to aid in the determination of the fair value of the portfolio. Most securities are not quoted on an exchange, but are traded in active markets and fair values were obtained from matrix pricing on similar securities.
Results of Operations
Average Balances and Average Interest Rates
Table 1 that follows sets forth balance sheet items on a daily average basis for the years ended December 31, 2010, 2009 and 2008 and presents the daily average interest rates earned on assets and the daily average interest rates paid on liabilities for such periods. During 2010, average interest-earning assets were $2.03 billion, an increase of $64.4 million, or 3%, over 2009. This was the result of an increase in the average balance of investment securities of $105.7 million, or 22%, partially offset by a decrease in the average balance of loans receivable (including loans held for sale) of $51.0 million, or 3%. The growth in the average balance of interest-earning assets was funded,
3
primarily by a $132.4 million, or 9%, increase in the average balance of interest-bearing deposits as well as an increase in the average balance of noninterest-bearing funds of $28.1 million, 9%, partially offset by a decrease in the average balance of short-term borrowings and long-term debt of $139.3 million.
The tax-equivalent yield on total interest-earning assets decreased by 22 basis points (bps), from 5.08% in 2009 to 4.86% in 2010. This decrease resulted from lower yields on our securities and loan portfolios during 2010. Based on the amortized cost, approximately 91% of our investment securities have a fixed interest rate, however, yields received on most new investment securities purchased in 2010 were lower than yields received on the existing portfolio due to the overall lower level of market interest rates in 2010 versus prior years. Floating rate loans represent approximately 48% of our total loans receivable portfolio. The interest rates charged on the majority of these loans are tied to the New York prime lending rate which decreased 400 bps throughout 2008, to a 53 year low of 3.25% and has remained at this level throughout 2009 and 2010.
Given the continued low level of general market interest rates, we expect the yields we receive on our interest-earning assets will continue to remain at their current levels until short-term interest rates, such as London Interbank Offered Rate (LIBOR) and the New York prime lending rate, begin to increase.
The aggregate cost of our interest-bearing liabilities decreased 33 bps from 1.39% in 2009 to 1.06% in 2010. Our deposit cost of funds decreased from 1.02% in 2009 to 0.72% for 2010. The aggregate average cost of all funding sources for the Company was 0.85% in 2010, down 31 bps, or 27%, from 1.16% in 2009. The decreases are primarily related to the continued low level of general market interest rates present throughout 2010. The average rate paid on savings deposits decreased by 12 bps from 0.59% in 2009 to 0.47% in 2010. The average rate paid on interest checking and money market accounts decreased by 23 bps from 0.92% to 0.69%. For time deposits, the average rate paid in 2010 was 2.40%, down 65 bps from 3.05% in 2009 and the rate on public fund time deposits decreased by 88 bps from 1.51% in 2009 to 0.63% in 2010. At December 31, 2010, approximately 12% of our total deposits were those of local municipalities, school districts, not-for-profit organizations or corporate cash management customers, indexed to either the 91-day Treasury bill, the overnight federal funds rate, or the one-month LIBOR. The average interest rate of the 91-day Treasury bill decreased from 0.16% for 2009 to 0.13% in 2010 thereby slightly reducing the average interest rate paid on these deposits.
Average low rate short-term borrowings decreased by $120.7 million from $172.9 million in 2009 to $52.2 million in 2010. The cost of this non-deposit funding source in 2010 was 0.60%, an increase of 1 bp compared to 2009. The average outstanding balance of long-term debt decreased in 2010 due to a full year's impact of the maturity and repayment of a $25.0 million Federal Home Loan Bank (FHLB) convertible select borrowing in August 2009 and the prepayment of a $25.0 million FHLB convertible select borrowing in November 2010. The cost of this funding source was 4.29% in 2010 compared to 4.37% in 2009, an 8 bp decrease. The junior subordinated debt remained unchanged from 2009 to 2010. The aggregate cost of non-deposit funding sources increased 153 bps in 2010 to 3.77% from 2.24% in 2009.
See the Long-Term Debt section later in this Management's Discussion and Analysis of Financial Condition and Results of Operations for further discussion regarding the convertible select borrowing and our long-term debt.
4
In Table 1, nonaccrual loans have been included in the average loan balances. Securities include securities available for sale, securities held to maturity and restricted investments in bank stock. Securities available for sale are carried at amortized cost for purposes of calculating the average rate received on taxable securities. Yields on tax-exempt securities and loans are computed on a tax-equivalent basis, assuming a 34% tax rate for the year ending 2010 and assuming a 35% tax rate for the years ending 2009 and 2008.
TABLE 1
Years Ended December 31, | |||||||||||||||||||||||||||||
(dollars in thousands) | 2010 | 2009 | 2008 | ||||||||||||||||||||||||||
Earning Assets | Average Balance | Interest | Average Rate | Average Balance | Interest | Average Rate | Average Balance | Interest | Average Rate | ||||||||||||||||||||
Securities: | |||||||||||||||||||||||||||||
Taxable | $ | 595,378 | $ | 22,275 | 3.74 | % | $ | 488,415 | $ | 19,858 | 4.07 | % | $ | 575,422 | $ | 28,401 | 4.94 | % | |||||||||||
Tax-exempt | 334 | 20 | 6.09 | 1,624 | 100 | 6.16 | 1,622 | 101 | 6.23 | ||||||||||||||||||||
Total securities | 595,712 | 22,295 | 3.74 | 490,039 | 19,958 | 4.07 | 577,044 | 28,502 | 4.94 | ||||||||||||||||||||
Federal funds sold | 11,106 | 14 | 0.12 | 1,375 | 2 | 0.13 | — | — | — | ||||||||||||||||||||
Total loans receivable | 1,426,225 | 77,274 | 5.36 | 1,477,222 | 80,796 | 5.41 | 1,326,246 | 84,519 | 6.30 | ||||||||||||||||||||
Total earning assets | $ | 2,033,043 | $ | 99,583 | 4.86 | % | $ | 1,968,636 | $ | 100,756 | 5.08 | % | $ | 1,903,290 | $ | 113,021 | 5.89 | % | |||||||||||
Sources of Funds | |||||||||||||||||||||||||||||
Interest-bearing deposits: | |||||||||||||||||||||||||||||
Regular savings | $ | 324,698 | $ | 1,514 | 0.47 | % | $ | 329,799 | $ | 1,930 | 0.59 | % | $ | 351,291 | $ | 3,849 | 1.10 | % | |||||||||||
Interest checking and money market | 946,982 | 6,501 | 0.69 | 795,835 | 7,342 | 0.92 | 727,783 | 11,160 | 1.53 | ||||||||||||||||||||
Time deposits | 216,434 | 5,189 | 2.40 | 254,086 | 7,750 | 3.05 | 187,467 | 6,595 | 3.52 | ||||||||||||||||||||
Public funds time | 41,608 | 263 | 0.63 | 17,557 | 265 | 1.51 | 16,338 | 607 | 3.72 | ||||||||||||||||||||
Total interest-bearing deposits | 1,529,722 | 13,467 | 0.88 | 1,397,277 | 17,287 | 1.24 | 1,282,879 | 22,211 | 1.73 | ||||||||||||||||||||
Short-term borrowings | 52,170 | 317 | 0.60 | 172,870 | 1,038 | 0.59 | 265,518 | 5,349 | 1.98 | ||||||||||||||||||||
Long-term debt | 51,660 | 3,613 | 6.99 | 70,222 | 4,452 | 6.34 | 79,400 | 4,875 | 6.14 | ||||||||||||||||||||
Total interest-bearing liabilities | 1,633,552 | 17,397 | 1.06 | 1,640,369 | 22,777 | 1.39 | 1,627,797 | 32,435 | 1.98 | ||||||||||||||||||||
Demand deposits (noninterest- bearing) | 332,099 | 303,963 | 276,120 | ||||||||||||||||||||||||||
Sources to fund earning assets | 1,965,651 | 17,397 | 0.88 | % | 1,944,332 | 22,777 | 1.17 | % | 1,903,917 | 32,435 | 1.70 | % | |||||||||||||||||
Noninterest-bearing funds (net) | 67,392 | 24,304 | (627 | ) | |||||||||||||||||||||||||
Total sources to fund earning assets | $ | 2,033,043 | $ | 17,397 | 0.85 | % | $ | 1,968,636 | $ | 22,777 | 1.16 | % | $ | 1,903,290 | $ | 32,435 | 1.70 | % | |||||||||||
Net interest income and margin on a tax-equivalent basis | $ | 82,186 | 4.00 | % | $ | 77,979 | 3.92 | % | $ | 80,586 | 4.19 | % | |||||||||||||||||
Tax-exempt adjustment | 2,336 | 2,373 | 1,881 | ||||||||||||||||||||||||||
Net interest income and margin | $ | 79,850 | 3.89 | % | $ | 75,606 | 3.80 | % | $ | 78,705 | 4.09 | % | |||||||||||||||||
Other Balances: | |||||||||||||||||||||||||||||
Cash & due from banks | $ | 44,583 | $ | 43,665 | $ | 44,686 | |||||||||||||||||||||||
Other assets | 113,172 | 86,456 | 80,601 | ||||||||||||||||||||||||||
Total assets | 2,190,798 | 2,098,757 | 2,028,577 | ||||||||||||||||||||||||||
Other liabilities | 17,695 | 12,270 | 11,687 | ||||||||||||||||||||||||||
Stockholders' equity | 207,452 | 142,155 | 112,970 | ||||||||||||||||||||||||||
5
Net Interest Income and Net Interest Margin
Net interest income is the difference between interest income on loans, investment securities and other interest-earning assets and the interest expense paid on deposits and borrowed funds. Changes in net interest income and net interest margin result from the interaction between the volume and composition of earning assets, related yields and associated funding costs. Net interest income is our primary source of earnings. There are several factors that affect net interest income, including:
• | the volume, pricing mix and maturity of earning assets and interest-bearing liabilities; |
• | market interest rate fluctuations; and |
• | the level of nonperforming loans. |
Net interest income on a fully tax-equivalent basis (which adjusts for the tax-exempt status of income earned on certain loans and investment securities in order to show such income as if it were taxable) increased $4.2 million, or 5%, to $82.2 million for 2010 from $78.0 million in 2009. Interest income on a tax-equivalent basis for 2010 totaled $99.6 million, a decrease of $1.2 million, or 1%, from $100.8 million in 2009. The majority of this decrease was related to the continued low interest rate environment throughout 2010, partially offset by a volume increase in the level of interest-earning assets. Volume increases in the investment securities portfolio more than offset volume decreases in the loans receivable portfolio. Interest expense for 2010 decreased $5.4 million, or 24%, from $22.8 million in 2009 to $17.4 million in 2010. This decrease was related to the lower interest rate environment partially offset by a volume increase in the level of interest-bearing deposits. The average rate paid on interest-bearing deposits in 2010 was 36 bps less then in 2009 combined with significant decreases in short-term and long-term borrowings.
The Company has experienced an improvement in its net interest margin as a result of a lower cost of deposits and lower cost of borrowings. The Federal Reserve Bank (FRB) decreased the overnight federal funds rate several times throughout 2008 and prior by a total of 500 bps from 5.25% to 0.25%. The rate remained at 0.25% throughout 2009 and 2010. The decreases in the federal funds rate have led to a lower level of interest rates associated with our overnight short-term borrowings as well as allowed us to significantly reduce the rates we paid on our interest-bearing deposits in an effort to partially offset corresponding decreases on the yields we received on our interest-earning assets.
Changes in net interest income are frequently measured by two statistics: net interest rate spread and net interest margin. Net interest rate spread is the difference between the average rate earned on earning assets and the average rate incurred on interest-bearing liabilities. Net interest margin represents the difference between interest income, including net loan fees earned and interest expense, reflected as a percentage of average earning assets. Our net interest rate spread increased to 3.80% in 2010 from 3.69% in 2009 on a fully tax-equivalent basis. The net interest margin (non-tax-equivalent) increased 9 bps from 3.80% in 2009 to 3.89% in 2010. The slight rate spread and net interest margin increases in 2010 reflect the previously mentioned improvement in the Company's cost of funds. This improvement resulted as continued efforts to manage the cost of funds downward through its strategic pricing process and limited exception pricing, combined with the positive impact of higher rate certificate of deposit (CD) roll off being renewed at lower current rates or deposited into lower cost checking and savings accounts.
6
Table 2 demonstrates the relative impact on net interest income of changes in the volume of earning assets and interest-bearing liabilities and changes in rates earned and paid by us on such assets and liabilities. For purposes of this table, nonaccrual loans have been included in the average loan balances and tax-exempt loans and securities are reported on a fully-taxable equivalent basis.
TABLE 2
2010 v. 2009 | 2009 v. 2008 | ||||||||||||||||||||||
Increase (Decrease) | Increase (Decrease) | ||||||||||||||||||||||
Due to Changes in (1) | Due to Changes in (1) (2) | ||||||||||||||||||||||
(in thousands) | Volume | Rate | Total | Volume | Rate | Total | |||||||||||||||||
Interest on securities: | |||||||||||||||||||||||
Taxable | $ | 4,191 | $ | (1,774 | ) | $ | 2,417 | $ | (4,457 | ) | $ | (4,086 | ) | $ | (8,543 | ) | |||||||
Tax-exempt | (80 | ) | — | (80 | ) | — | (1 | ) | (1 | ) | |||||||||||||
Federal funds sold | 12 | — | 12 | 1 | 1 | 2 | |||||||||||||||||
Interest on loans receivable | (3,712 | ) | 190 | (3,522 | ) | 6,188 | (9,911 | ) | (3,723 | ) | |||||||||||||
Total interest income | 411 | (1,584 | ) | (1,173 | ) | 1,732 | (13,997 | ) | (12,265 | ) | |||||||||||||
Interest on deposits: | |||||||||||||||||||||||
Regular savings | (138 | ) | (278 | ) | (416 | ) | (107 | ) | (1,812 | ) | (1,919 | ) | |||||||||||
Interest checking and money market | 1,436 | (2,277 | ) | (841 | ) | 1,811 | (5,629 | ) | (3,818 | ) | |||||||||||||
Time deposits | (503 | ) | (2,058 | ) | (2,561 | ) | 2,524 | (1,369 | ) | 1,155 | |||||||||||||
Public funds time | 152 | (154 | ) | (2 | ) | 18 | (360 | ) | (342 | ) | |||||||||||||
Short-term borrowings | (725 | ) | 4 | (721 | ) | (801 | ) | (3,510 | ) | (4,311 | ) | ||||||||||||
Long-term debt | (822 | ) | (17 | ) | (839 | ) | (414 | ) | (9 | ) | (423 | ) | |||||||||||
Total interest expense | (600 | ) | (4,780 | ) | (5,380 | ) | 3,031 | (12,689 | ) | (9,658 | ) | ||||||||||||
Net increase (decrease) | $ | 1,011 | $ | 3,196 | $ | 4,207 | $ | (1,299 | ) | $ | (1,308 | ) | $ | (2,607 | ) | ||||||||
(1) | Changes due to both volume and rate have been allocated on a pro rata basis to either rate or volume. |
(2) | Changes due to the difference in the number of days (2008 was a leap year) are divided between Rate and Volume columns based on each categories percent of the total difference. |
Provision for Loan Losses
Management undertakes a rigorous and consistently applied process in order to evaluate the allowance for loan losses and to determine the level of provision for loan losses. The continued deterioration in economic conditions had a direct and significant impact on our asset quality in 2010. During the third quarter of 2010, as part of the quantitative analysis of the adequacy of the allowance for loan losses, management adjusted its projection of probable loan losses based upon a much shorter and more recent period of actual historical losses. This was done as a result of the higher level of loan charge-offs experienced by the Company over the past two years compared to previous years. Given the continued state of the economy and its impact on borrowers and on loan collateral values, management feels this is currently a better predictor of probable additional loan losses until such time that the economy, borrower repayment ability and loan collateral values show sustained signs of improvement.
We recorded $21.0 million as a provision for loan losses in 2010 compared to $12.4 million in 2009. The increase in the provision for loan losses in 2010 is a direct result of a decrease in collateral values of nonperforming loans, an increase in the amount of specific reserves associated with impaired loans and the level of actual net charge-offs throughout the year. The level of nonperforming loans increased from $37.7 million, or 2.61%, of total loans outstanding at December 31, 2009 to $53.0 million, or 3.84%, of total loans outstanding at December 31, 2010. See the Nonperforming Loans and Assets section later in this Management's Discussion and Analysis of Financial Condition and Results of Operations for further discussion regarding the increase in nonperforming loans. Net charge-offs during 2010 were $13.8 million, or 0.98%, of average loans outstanding as compared to $14.8 million, or 1.02%, of average loans outstanding in 2009. Approximately $10.5 million, or 76%, of total net charge-offs for 2010 were associated with 10 different specific relationships. A breakdown of the net charge-offs on the 10 relationships is as follows: approximately $4.4 million, or 42%, were commercial real estate loans, approximately $4.3 million, or 41%, were commercial and industrial loans, $902,000, or 9%, were construction and land development loans, approximately $444,000, or 4%, were owner occupied real estate loans and $423,000, or 4%, were residential loans. As a result of current appraisals that reflected a decrease in value, approximately $10.2 million was charged down on 31 relationships for year ended December 31, 2010. See the Application of Critical Accounting Policies section in this Management's Discussion and Analysis regarding the allowance for loan losses as well as Note 1 in the Notes to Consolidated Financial Statements for
7
the year ended December 31, 2010 included herein for further discussion regarding our methodology for determining the provision for loan losses.
Noninterest Income
Noninterest income increased by $4.9 million, or 20%, from $24.5 million in 2009 to $29.4 million in 2010. Service charges, fees and other operating income increased 8%, over the same period in 2009, totaling $26.7 million. In 2010, total gains on sales of loans were comprised of $2.4 million of gains on the sale of residential and Small Business Administration (SBA) loans compared to $546,000 in 2009. During 2010, Metro aggressively began to grow its SBA loan portfolio with the intention of selling the loans on the secondary market. The gains on the sale of SBA loans were $1.5 million in 2010 compared to $47,000 in 2009. During 2010 gains on the sale of residential loans were $885,000 compared to $1.1 million during 2009. Negatively impacting net gains on sale of loans in 2009 was a $627,000 loss recorded on the sale of a majority of the Company's student loan portfolio. There were no sales of the Company's student loans in 2010.
Included in noninterest income are net gains on sales of investment securities totaling $2.8 million for 2010 and $1.6 million for 2009. These gains were offset by other-than-temporary impairment (OTTI) charges on private-label collateralized mortgage obligations (CMOs) totaling $962,000 in 2010 as compared to $2.3 million of charges in 2009. See Securities section in this Management's Discussion and Analysis as well as Note 3 in the Notes to Consolidated Financial Statements for further discussion regarding OTTI.
Netted against noninterest income for 2010 was a $1.6 million charge recorded for the early retirement of a $25.0 million fixed rate borrowing from the FHLB. Comparatively, there was no such charge in 2009.
Noninterest Expenses
Noninterest expenses totaled $97.1 million for 2010, an increase of $5.4 million, or 6%, over 2009. This overall increase was primarily the result of significantly higher data processing and consulting costs in 2010 over those incurred in 2009 as well as higher levels of expenses associated with foreclosed assets, problem loans and regulatory-related costs. Noninterest expense line items experiencing decreases in 2010 from 2009 levels include salaries and benefits, postage and supplies, telephone costs, merger and acquisition charges and one time core system conversion and rebranding expenses. The Company did not incur any conversion related or rebranding costs in 2010 compared to $917,000 of such expenses in 2009. Throughout 2009, Metro incurred total gross one-time costs of $6.9 million associated with our core computer system conversion, the transition of all services previously performed by TD Bank (TD) to Fiserv Solutions, Inc. (Fiserv) and other service providers as well as with the rebranding of the entire Company and most of its products and services. During the third quarter of 2009, at the conclusion of all conversion and rebranding efforts, Metro received a fee of $6.0 million from TD to partially defray the costs associated with the conversion and rebranding. This fee was offset against the total one-time gross costs and therefore net one-time core system conversion/rebranding expenses totaled $917,000 in 2009. Excluding the impact of the net one-time core conversion and rebranding costs incurred in 2009, total noninterest expenses for 2010 increased by $6.3 million, or 7%, over 2009. A comparison of noninterest expenses for certain categories for 2010 and 2009 is discussed below.
Salary expenses and employee benefits, which represent the largest component of our noninterest expenses, decreased $1.9 million, or 4%, in 2010 from 2009. The decrease in 2010 compared to 2009 directly relates to the additional resources required in 2009 to facilitate our conversion and rebranding processes. The reduction in conversion related resources is partially offset by an increase in operations and technology staff levels to maintain the infrastructure that was built during conversion. The Company also experienced a reduction in employee health care claims during 2010. An additional decrease in benefits expense relates to the reversal of $200,000 of expense during 2010 (that had been recorded in prior periods) as a result of the reconcilement of projected option forfeitures to actual option forfeitures for all stock options granted during the first quarter of 2006.
Occupancy expenses were $263,000, or 3%, higher in 2010 compared to 2009. This was primarily due to higher electric utility rates throughout 2010 and 2009 for the majority of our stores as well as our headquarter's building.
Furniture and equipment expenses increased by $368,000, or 8%, over 2009, due to increased depreciation and maintenance agreements on new systems, a result of the transition of services from TD to Fiserv and new signage due to the name change of the Company, events both completed in June of 2009.
Advertising and marketing expenses totaled $3.0 million in 2010, a $216,000, or 8%, increase over 2009. During the first half of 2009, the Company did minimal advertising in anticipation of the rebranding effort which occurred late in the second quarter and throughout the third quarter of 2009. The 2010 expense level represents normal marketing activity for the Company.
Data processing expenses totaled $13.1 million in 2010, a $4.0 million, or 43%, increase over 2009. The increase was due to a combination of the following expenses incurred for the full year in 2010 versus six months in 2009:
8
• | Costs associated with new infrastructure which supports services now being performed in-house; |
• | Higher costs for data processing and item processing services with Fiserv, our new core service provider. |
• | Certain postage and supply expenses are included in the data processing expenses which are now incorporated in Fiserv's third party statement rendering services. |
Postage and supplies decreased $1.4 million, or 60%, in 2010 compared to the same period in 2009, primarily as a result of outsourcing customer statement rendering services in July of 2009 as part of the transition of operational services from TD to Fiserv as discussed above.
Regulatory assessments and related fees of $4.6 million in 2010 reflected a 15% increase over 2009. The Bank incurred higher Federal Deposit Insurance Corporation (FDIC) premiums for its regular assessment in 2010 compared to 2009 due to increased deposit levels over the past twelve months combined with a higher premium rate. The Bank, like all financial institutions whose deposits are guaranteed by the Deposit Insurance Fund (DIF), pays a quarterly premium to the FDIC for such deposit insurance coverage.
Telephone expense decreased from $4.1 million in 2009 to $3.5 million in 2010, a 16% decrease. The reduction is primarily due to some duplicity in dataline service in 2009 while conversion was ongoing. The duplicity discontinued post conversion during the second half of 2009. The higher expense in 2009 was also a result of greater levels of call center support staff utilized to assist customers and handle the increased call volume experienced following our conversion of systems from TD and our rebranding.
Loan expenses totaled $1.7 million in 2010, a 5% increase over 2009 expenses of $1.6 million. The majority of the loan expense increase is associated with the cost of developing and launching a new Metro Credit Card which occurred in August 2010. This was partially offset with a reduction of costs to service the student loan portfolio. A large portion of the student loan portfolio was sold during 2009.
Foreclosed real estate expenses of $1.4 million increased by $802,000, or 139%, in 2010 compared to 2009. The increase was primarily a result of write-downs of foreclosed assets totaling $860,000 in 2010 compared to $272,000 of write-downs in 2009. In addition, the Company realized an increase in foreclosed assets in mid-2009 which resulted in an increase in annual real estate taxes due on foreclosed properties in 2010 versus 2009.
Included in non-interest expenses were $17,000 and $765,000 for the years ended December 31, 2010 and 2009, respectively, of costs associated with our previously planned acquisition of Republic First Bancorp, Inc. During the first quarter of 2010, the Company and Republic First announced the termination of their merger agreement due to uncertainties over regulatory approval of the application for merger.
Consulting fees totaled $4.5 million up $3.7 million in 2010 over 2009. The increase is a result of consultants hired to assist the Company in developing and implementing a system of procedures and controls designed to ensure full compliance with the Bank Secrecy Act (BSA) and Office of Foreign Assets Control (OFAC). We believe the majority of the work related to developing and implementing these procedures and controls is complete and expect a materially lower level of such consulting expenses in 2011 from the level experienced in 2010.
Other noninterest expenses totaled $9.4 million for 2010, compared to $8.4 million for 2009, an increase of $946,000 or 11%. Primary components related to the increase include costs related to legal expenses, bank shares tax, increased coin processing costs and costs related to a canceled potential branch site.
One key measure used to monitor progress in controlling overhead expenses is the ratio of net noninterest expenses to average assets. For purposes of this calculation, net noninterest expenses equal noninterest expenses less nonrecurring expenses and less noninterest income (exclusive of gains or losses on sales/calls of investment securities). This ratio equaled 3.02% for 2010, compared to 3.01% for 2009. Another productivity measure is the operating efficiency ratio. This ratio expresses the relationship of noninterest expenses to net interest income plus noninterest income (excluding gains or losses on sales of investment securities). For 2010, the operating efficiency ratio was 87.6% compared to 87.9% for 2009.
Provision (Benefit) for Federal Income Taxes
The benefit realized for federal income taxes was $4.5 million for 2010 compared to $2.2 million for 2009. The effective (benefit) tax rate, which is the ratio of income tax expense to income before taxes, was (51.1)% in 2010 compared to (53.3)% in 2009 and were due to a net loss incurred in both 2010 and in 2009 as well as to the proportion of tax-exempt income to total pretax loss for both years. See Note 11 of the Notes to Consolidated Financial Statements for the year ended December 31, 2010, included herein, for an additional analysis of the provision for income taxes for the years ended December 31, 2010 and 2009.
9
Income taxes are accounted for under the liability method. Under the liability method, deferred tax assets and liabilities are recognized for future tax consequences attributable to temporary differences between the financial statement and tax bases of existing assets and liabilities.
At December 31, 2010, deferred tax assets amounted to $14.2 million and deferred tax liabilities amounted to $6.0 million. Deferred tax assets are realizable primarily through the carryback of existing deductible temporary differences to recover taxes paid in prior years and through future reversals of existing taxable temporary differences. Management currently anticipates the Company's future earnings will be adequate to utilize all of its net deferred tax assets.
Net (Loss) Income and Net (Loss) Income per Share
The Company recorded a net loss of $4.3 million for 2010, a decrease of $2.4 million from the $1.9 million net loss recorded in 2009. This decrease was due to an increase in the provision for loan losses of $8.6 million in 2010 over the amount recorded in 2009 and an increase in noninterest expenses of $5.4 million, all of which were partially offset by an increase in noninterest income of $4.9 million, an increase in net interest income of $4.2 million and an increase in the benefit for federal income taxes of $2.4 million.
Basic and diluted loss per common share was $(0.33) for 2010 compared to basic and diluted loss per common share of $(0.24) in 2009. See Note 13 in the Notes to Consolidated Financial Statements for the year ended December 31, 2010, included herein, for an analysis of earnings (loss) per share.
Return on Average Assets and Average Equity
Return on average assets (ROA) measures our net income (loss) in relation to our total average assets. Our ROA was (0.20)% for 2010 compared to (0.09)% for 2009. Return on average equity (ROE) indicates how effectively we can generate net income (loss) on the capital invested by our shareholders. ROE is calculated by dividing net income (loss) by average stockholders' equity. ROE for 2010 was (2.09)%, compared to (1.34)% for 2009.
2009 versus 2008
Net loss for 2009 was $1.9 million, compared to net income of $12.9 million recorded in 2008.
Basic and fully-diluted loss per common share was $(0.24) for 2009 compared to basic and fully-diluted earnings per common share of $2.02 and $1.97, respectively.
Net interest income on a tax-equivalent basis for 2009 decreased $2.6 million, or 3%, from 2008 to $78.0 million. Interest income on earnings assets on a tax-equivalent basis totaled $100.8 million, a decrease of $12.3 million, or 11%, from 2008. Interest expense for 2009 decreased by $9.7 million, or 30%, from $32.4 million in 2008 to $22.8 million.
Our net interest rate spread decreased to 3.69% in 2009 from 3.91% in 2008 on a fully tax-equivalent basis. The net interest margin decreased 29 bps from 4.09% in 2008 to 3.80% in 2009 on a non tax-equivalent basis.
The provision for loan losses totaled $12.4 million in 2009 compared to $7.5 million in 2008. Net charge-offs in 2009 totaled $14.8 million, or 1.02%, of average loans outstanding as compared to $1.5 million, or 0.11%, of average loans outstanding in 2008.
Noninterest income for 2009 decreased by $976,000, or 4%, from 2008 to $24.5 million. Included in total noninterest income in 2009 were net gains of $546,000 on the sale of residential loans, SBA loans and student loans. Also netted against noninterest income was a $770,000 loss on investment securities. Included in total noninterest income in 2008 were gains of $738,000 on the sale of residential loans and SBA loans offset by a $157,000 pretax loss on the sale of a corporate debt security.
Noninterest expenses totaled $91.7 million for 2009, an increase of $13.8 million, or 18%, over 2008. Costs associated with the intent to acquire Republic First, the core system conversion and transition of services from TD to a new service provider, as well as our rebranding initiatives all served to increase our 2009 expense levels.
Salary expenses and employee benefits increased by $5.3 million, or 14%, in 2009 over 2008, primarily due to additional staffing in operations and information technology to handle the conversion and rebranding process as well as functions that were previously performed by TD.
Occupancy expenses for 2009 were basically flat compared to 2008 while furniture and equipment expenses increased by $459,000, or 11%, to $4.8 million. The increase primarily related to purchases of computer hardware related to the conversion of our systems and our
10
rebranding initiative.
Advertising and marketing expenses were $2.8 million for 2009, the same as 2008. Data processing expenses increased by $1.9 million, or 27%, in 2009 over 2008, primarily related to building a new network infrastructure in-house to support daily operations of the Company post conversion. Regulatory expenses of $4.0 million in 2009 were $1.2 million higher than 2008, primarily due to increased FDIC premiums. Telephone expenses of $4.1 million were $1.9 million higher for 2009 compared to 2008 as a result of transitioning the call center servicing from TD to another provider as well as higher call volumes during the conversion period.
Expenses related to the Company's planned acquisition of Republic First were $765,000 for 2009 compared to $491,000 for 2008. Other noninterest expenses totaled $8.4 million for 2009, compared to $7.7 million for 2008.
Financial Condition
Securities
Securities are purchased and sold as part of our overall asset and liability management function. The classification of all securities is determined at the time of purchase. Securities expected to be held for an indefinite period of time are classified as securities available for sale and are carried at fair value. Decisions by management to purchase or sell these securities are based on an assessment of financial and economic conditions, including changes in prepayment risks and interest rates, liquidity needs, capital adequacy, collateral requirements for pledging, alternative asset and liability management strategies, tax considerations and regulatory requirements.
Securities are classified as held to maturity if, at the time of purchase, management has both the intent and ability to hold the securities until maturity. Securities held to maturity are carried at amortized cost. Sales of securities in this portfolio should only occur in unusual and rare situations where significant unforeseeable changes in circumstances may cause a change in intent. Examples of such instances would include deterioration in the issuer's creditworthiness that is evidently supportable and significant or a change in tax law that eliminates or reduces the tax-exempt status of interest (but not the revision of marginal tax rates applicable to interest income). Held to maturity (HTM) securities cannot be sold based upon any of the decisions used to sell securities available for sale as listed above. See Note 3 in the Notes to Consolidated Financial Statements for the year ended December 31, 2010, included herein, for further analysis of our securities portfolio.
Based on the amortized cost, approximately 91% of our investment securities carry fixed rate coupons that do not change over the life of the securities. Since many of the amortizing securities are purchased at premiums or discounts, their yield and average life will change depending on any change in the estimated rate of prepayments. We amortize premiums and accrete discounts over the estimated average life of the securities. Changes in the estimated average life of the securities portfolio will lengthen or shorten the period in which the premium or discount must be amortized or accreted, thus affecting our securities yields. At December 31, 2010, the yield on our securities portfolio was 3.44%, down 50 bps from 3.94% at December 31, 2009. This decrease was due to prepayments, calls and maturities of securities in 2010 with higher interest rates combined with purchases of new securities in 2010 at lower yields than those purchased in previous years, due to the low level of general market interest rates present in 2010 as compared to previous years.
At December 31, 2010, the weighted average life and duration of our securities portfolio was approximately 6.0 and 4.7 years, respectively, as compared to 3.8 years and 3.3 years, respectively, at December 31, 2009. The weighted average life of the portfolio is calculated by estimating the average rate of repayment of the underlying collateral of each security. Mortgage-backed obligations historically experience repayment rates in excess of the scheduled repayments, causing a shorter weighted average life of the security. Our securities portfolio contained no derivatives as of December 31, 2010 or 2009.
Securities available for sale increased by $41.0 million in 2010 (excluding the effect of changes in unrealized gains or losses), primarily as a result of purchases of $486.0 million offset by principal repayments, sales, calls, maturities and write-downs of OTTI of $445.0 million, excluding net gains on sales. The AFS portfolio is comprised of U.S. Government agency securities, agency residential mortgage-backed securities (MBSs), agency CMOs, and private-label CMO securities. At December 31, 2010, the unrealized loss on securities available for sale included in stockholders' equity totaled $5.6 million, net of tax, compared to a $10.9 million unrealized loss on securities, net of tax, at December 31, 2009. The market for certain MBSs held in the Company's securities portfolio improved in 2010 as conditions in the overall economy and in the mortgage markets began to improve. Management believes that the unrealized losses on these securities at December 31, 2010 were primarily the result of changes in general market interest rates.
During 2010, securities held to maturity increased by $109.8 million, primarily as a result of purchases of $177.5 million offset by principal repayments, sales, calls and maturities of $67.7 million, excluding net gains on sales. The securities held in this portfolio include U.S. Government agency securities, agency residential MBSs, agency CMOs and corporate debt securities.
During 2010, the Company sold a total of 56 securities with a combined fair market value of $296.2 million and realized a net pretax
11
gain of $2.8 million. The securities sold included 23 private-label CMOs with a combined fair market value of $62.6 million; 13 agency CMOs with a fair market value of $138.1 million; 18 residential MBSs with a combined fair market value of $74.5 million and two agency debentures with a combined fair market value of $21.0 million. Of this total, 53 securities with a combined fair market value of $292.9 million had been classified as available for sale. Two agency MBSs with a combined fair market value of $440,000 had been classified as held to maturity, however, their current par value had fallen to less than 15% of their original par value and could be sold without tainting the remaining HTM portfolio. One private-label CMO with a fair market value of $2.9 million had been classified as held to maturity. Previously, the Company had recognized an OTTI charge due to a projected credit loss of $3,000 and this deterioration in creditworthiness was the basis for selling the security without tainting the remaining HTM portfolio. The Company uses the specific identification method to record security sales. In addition, the Company had a total of $105.0 million of agency debentures called, at par, by their issuing agencies during 2010. Of this total, $70.0 million were classified as available for sale and $35.0 million were classified as held to maturity. Most of the securities were carried at par, however, one security was carried at a discount and the Company realized a gain of $5,000. Also during 2010, the Company had a total of $1.6 million of tax-free municipal bonds called at par. All were classified as held to maturity, were carried at a slight discount and the Company realized a gain of $1,000.
The amortized cost of AFS and HTM securities are summarized below in Table 3 as of December 31, for each of the years 2008 through 2010:
TABLE 3
December 31, | |||||||||||
(in thousands) | 2010 | 2009 | 2008 | ||||||||
Available for Sale: | |||||||||||
U.S. Government agency securities | $ | 22,500 | $ | 55,004 | $ | 5,000 | |||||
Residential MBSs | 2,383 | 80,916 | 62,489 | ||||||||
Agency CMOs | 388,414 | 149,233 | 145,823 | ||||||||
Private-label CMOs | 33,246 | 120,407 | 154,929 | ||||||||
Total available for sale | $ | 446,543 | $ | 405,560 | $ | 368,241 | |||||
Held to Maturity: | |||||||||||
U.S. Government agency securities | $ | 140,000 | $ | 25,000 | $ | 36,500 | |||||
Residential MBSs | 48,497 | 54,822 | 71,576 | ||||||||
Agency CMOs | 29,079 | 30,362 | 35,423 | ||||||||
Private-label CMOs | — | 4,010 | 5,473 | ||||||||
Corporate debt securities | 10,000 | 1,997 | 1,992 | ||||||||
Municipal securities | — | 1,624 | 1,623 | ||||||||
Total held to maturity | $ | 227,576 | $ | 117,815 | $ | 152,587 | |||||
The contractual maturity distribution and weighted average yield of our AFS and HTM portfolios at December 31, 2010 are summarized in Table 4. For mortgage-backed obligations, the contractual maturities may be significantly different than actual maturities. Changes in payment patterns and prepayments may occur depending on the market conditions and other economic variables. Weighted average yield is calculated by dividing income within each maturity range by the outstanding amount of the related investment and has been tax effected, assuming a tax rate of 34%, on tax-exempt obligations.
12
TABLE 4
December 31, 2010 | Due Under 1 Year | Due 1-5 Years | Due 5-10 Years | Due Over 10 Years | Total | ||||||||||||||||||||||||
(dollars in thousands) | Amount/Yield | Amount/Yield | Amount/Yield | Amount/Yield | Amount/Yield | ||||||||||||||||||||||||
Available for Sale: | |||||||||||||||||||||||||||||
U.S. Government agency obligations | $ | — | — | % | $ | — | — | % | $ | — | — | % | $ | 22,500 | 3.00 | % | $ | 22,500 | 3.00 | % | |||||||||
Residential MBSs | — | — | — | — | — | — | 2,383 | 3.91 | 2,383 | 3.91 | |||||||||||||||||||
Agency CMOs | — | — | — | — | 5,633 | 5.53 | 382,781 | 3.01 | 388,414 | 3.05 | |||||||||||||||||||
Private-label CMOs | — | — | — | — | — | — | 33,246 | 5.71 | 33,246 | 5.71 | |||||||||||||||||||
Total available for sale | $ | — | — | % | $ | — | — | % | $ | 5,633 | 5.53 | % | $ | 440,910 | 3.22 | % | $ | 446,543 | 3.25 | % | |||||||||
Held to Maturity: | |||||||||||||||||||||||||||||
U.S. Government agency obligations | $ | — | — | % | $ | — | — | % | $ | 50,000 | 3.16 | % | $ | 90,000 | 3.60 | % | $ | 140,000 | 3.45 | % | |||||||||
Residential MBSs | — | — | — | — | 3,990 | 4.39 | 44,507 | 5.00 | 48,497 | 4.95 | |||||||||||||||||||
Agency CMOs | — | — | — | — | — | — | 29,079 | 4.04 | 29,079 | 4.04 | |||||||||||||||||||
Corporate debt securities | — | — | 10,000 | 3.75 | — | — | — | — | 10,000 | 3.75 | |||||||||||||||||||
Total held to maturity | $ | — | — | % | $ | 10,000 | 3.75 | % | $ | 53,990 | 3.25 | % | $ | 163,586 | 4.06 | % | $ | 227,576 | 3.86 | % | |||||||||
Note: Securities available for sale are carried at amortized cost in the table above for purposes of calculating the weighted average yield received on such securities.
Loans Held for Sale
Loans held for sale are comprised of student loans, selected residential loans and SBA loans the Company originates with the intention of selling in the future. Occasionally, loans held for sale also include business and industry loans that the Company decides to sell. These loans are carried at the lower of cost or estimated fair value, calculated in the aggregate. At the present time, the majority of the Company's residential loans are originated with the intent to sell to the secondary market unless the loan is nonconforming to the secondary market standards or if we agree not to sell the loan due to a customer's request. The residential mortgage loans that are designated as held for sale are sold to other financial institutions in correspondent relationships. The sale of these loans takes place typically within 30 days of funding. At December 31, 2010 and December 31, 2009, no residential mortgage loans held for sale were past due or impaired. Throughout 2010, the Company originated SBA loans totaling $32.3 million and transferred the guaranteed portions of those loans totaling $28.1 million. Metro recognized total gains of $1.5 million, $47,000 and $11,000 in 2010, 2009 and 2008, respectively, on the sales of SBA loans. At December 31, 2010 there was a deferred gain of $930,000 on loans sold during the fourth quarter of 2010 which will be recognized in the first quarter of 2011 at the expiration of the 90-day warranty period. Total loans held for sale were $18.6 million and $12.7 million at December 31, 2010 and 2009, respectively. At December 31, 2010, loans held for sale were comprised of $6.0 million of student loans, $5.2 million of SBA loans and $7.4 million of residential mortgages as compared to $6.6 million of student loans and $6.1 million of residential mortgages at December 31, 2009. Loans held for sale, as a percentage of total Company assets, were less than 1% at December 31, 2010 and 2009.
Loans Receivable
In order to add clarity and improve credit quality disclosures, the Financial Accounting Standards Board (FASB) issued additional guidance in 2010 that requires each company to disclose its various classes of loans outstanding based on the same portfolio segment that it develops and documents a systematic method for determining its allowance for loan losses. This accounting guidance is discussed more fully in Note 1 of Notes to Consolidated Financial Statements for the year ended December 31, 2010, included herein. Accordingly, we have reclassified our loans receivable for the previous four years into the portfolio segments as shown throughout the discussion that follows. The following table summarizes the composition of our loan portfolio by segment as of December 31, for each of the years 2006 through 2010:
13
TABLE 5
December 31, | |||||||||||||||||||
(in thousands) | 2010 | 2009 | 2008 | 2007 | 2006 | ||||||||||||||
Commercial and industrial | $ | 348,036 | $ | 405,211 | $ | 370,113 | $ | 327,305 | $ | 299,448 | |||||||||
Commercial tax-exempt | 89,401 | 108,861 | 86,187 | 43,959 | 26,903 | ||||||||||||||
Owner occupied real estate | 241,537 | 263,413 | 269,280 | 254,138 | 123,573 | ||||||||||||||
Commercial construction and land development | 112,094 | 115,013 | 104,122 | 75,110 | 61,315 | ||||||||||||||
Commercial real estate | 299,034 | 255,560 | 284,416 | 155,931 | 190,512 | ||||||||||||||
Residential | 81,124 | 85,035 | 91,775 | 90,132 | 99,440 | ||||||||||||||
Consumer | 207,979 | 210,690 | 233,890 | 210,796 | 181,527 | ||||||||||||||
Total loans outstanding | $ | 1,379,205 | $ | 1,443,783 | $ | 1,439,783 | $ | 1,157,371 | $ | 982,718 | |||||||||
We manage risk associated with our loan portfolio in part through diversification, and through what we believe are sound policies and underwriting procedures that are reviewed, updated and approved at least annually, as well as through our ongoing loan monitoring efforts. Additionally, we monitor concentrations of loans or loan relationships by purpose, collateral or industry. At December 31, 2010, we did not have a concentration to any one industry or borrower.
Our commercial and industrial loans are typically made to small and medium-sized businesses. The average loan size originated in 2010 in this category was approximately $382,000. Based on our underwriting standards, loans may be secured in whole or in part by collateral such as liquid assets, accounts receivable, equipment, inventory and real property and typically require owner guarantees. Additionally, our underwriting policy has established maximum terms for these loans depending on the loan type within the commercial and industrial loans category. The value of the collateral in this category may vary depending on market conditions. The Company maintains advance rate guidelines for particular collateral categories to mitigate the risk when the borrower defaults and the value of the collateral is not sufficient to cover the outstanding loan balance. As of December 31, 2010, unused commitments on commercial and industrial loans were $124.1 million.
Commercial tax exempt loans are made primarily to municipalities and school districts and rely on the cash flows of the borrowing entity for repayment. The average loan size originated in 2010 in this category was $1.3 million. We underwrite these loans based upon our own analysis of the cash flow, operating results, and financial condition of the borrower and we use our established underwriting guidelines.
Owner occupied real estate loans are for commercial properties and are typically made to small and medium-sized businesses. The primary source of repayment is the cash flow from the ongoing operations and activities conducted by the business or a related interest of the business or an affiliate of the party who owns the property. Based on our underwriting standards, loans may be secured by real property as collateral and typically require owner guarantees. The average loan size originated in 2010 in this category was approximately $699,000.
Our commercial real estate and our construction and land development loans are typically made to small and medium-sized investors, builders and developers and are secured by mortgages on real property located principally in South Central Pennsylvania (principally office buildings, multifamily residential, land development and other commercial properties). The average loan size originated in 2010 in these categories was approximately $462,000. Our underwriting policy has established maximum terms for these types of loans depending on the type of loan within the commercial real estate category. A five-year call option is standard on commercial mortgages. Our underwriting guidelines establish maximum loan-to-value ratios depending upon the type of primary collateral and typically require owner guarantees and may require other collateral depending on our assessment of the overall risk.
Residential real estate mortgage loans represented approximately 6% of our total loans at December 31, 2010. Loans in this category are collateralized by first mortgages on residential properties located primarily in South Central Pennsylvania. Our underwriting policy provides that all residential loans are to be written based upon standards used by the secondary market.
Consumer term loans and consumer lines of credit represented approximately 15% of our total loans at December 31, 2010. These loans and lines are secured by first and second mortgages, personal assets of the borrower, or may be unsecured. As of December 31, 2010, 24% of consumer loans and consumer lines of credit were secured by second mortgages. Our underwriting policy sets limitations on the term of the loan, defines allowable collateral and the valuation of the collateral, outlines acceptable debt to income ratios as well as acceptable credit sources to determine if the applicant meets our standards. We review these lines of credit annually and remove availability
14
if the borrower is no longer compliant with our underwriting standards or is delinquent. As of December 31, 2010, unused commitments under consumer lines of credit were $30.3 million.
During 2010, total gross loans receivable decreased by $64.6 million from December 31, 2009 to December 31, 2010. Total loan originations as well as net loan growth were below our historical norms in 2010 as compared to prior years. This was due to a combination of lower loan demand and the current economic conditions combined with our tightening of underwriting guidelines for new and existing loans in the current economic environment. As the economy improves, we expect loan demand to increase and, therefore, expect a higher level of originations in 2011 as compared to 2010. During 2010, commercial and industrial loans decreased $57.2 million, or 14%, commercial tax-exempt loans decreased $19.5 million, or 18%, owner occupied real estate loans decreased $21.9 million, or 8%, while commercial real estate loans increased $43.5 million or 17%. Changes in total loan balances outstanding for commercial construction and land development, residential and consumer loans were not material. Also included in gross loans are deposit accounts that are reclassified as loans as a result of overdrawn deposit account balances. The total of overdrawn deposit accounts reclassified as loans aggregated $431,000 at December 31, 2010 compared to $9.6 million at December 31, 2009.
Total loans outstanding represented 75% of total deposits and 62% of total assets at December 31, 2010, excluding the loans held for sale, compared to 80% and 67%, respectively, at December 31, 2009.
15
The maturity ranges of the loan portfolio and the amounts of loans with fixed interest rates and floating interest rates in each maturity range, as of December 31, 2010, are presented in the following table:
TABLE 6
December 31, 2010 | |||||||||||||||
(in thousands) | Due Within One Year | Due 1-5 Years | Due Over Five Years | Total | |||||||||||
Commercial and industrial | $ | 132,828 | $ | 124,805 | $ | 90,403 | $ | 348,036 | |||||||
Commercial tax exempt | 65 | 2,058 | 87,278 | 89,401 | |||||||||||
Owner occupied real estate | 5,967 | 18,514 | 217,056 | 241,537 | |||||||||||
Commercial construction and land development | 82,672 | 18,209 | 11,213 | 112,094 | |||||||||||
Commercial real estate | 14,907 | 42,813 | 241,314 | 299,034 | |||||||||||
Residential | 9,835 | 7,615 | 63,674 | 81,124 | |||||||||||
Consumer | 41,194 | 17,231 | 149,554 | 207,979 | |||||||||||
Total loans | $ | 287,468 | $ | 231,245 | $ | 860,492 | $ | 1,379,205 | |||||||
Interest rates: | |||||||||||||||
Fixed | $ | 31,336 | $ | 141,989 | $ | 645,820 | $ | 819,145 | |||||||
Floating | 256,132 | 89,256 | 214,672 | 560,060 | |||||||||||
Total loans | $ | 287,468 | $ | 231,245 | $ | 860,492 | $ | 1,379,205 | |||||||
Concentrations of Credit Risk
Commercial real estate and commercial construction and land development loans were 30% of our total loans outstanding and made up the largest portion of loans on our balance sheet at December 31, 2010. Our commercial real estate loan portfolio is principally to borrowers throughout Cumberland, Dauphin, Lancaster, Lebanon, York and Berks counties of Pennsylvania where we have full-service store locations. Commercial real estate, construction and land development loans, including tax exempt commercial real estate loans aggregated $414.7 million at December 31, 2010, compared to $377.2 million at December 31, 2009. Commercial real estate loans are collateralized by the related project (principally office building, multi-family residential, land development and other properties) and generally require loan-to-value ratios of no greater than 80%, in conformance with regulatory guidelines.
Commercial and industrial loans represented 25% of total loans at December 31, 2010. Collateral for these types of loans varies depending upon the type and purpose of the loans and management's credit evaluations of the respective borrowers and generally includes the following: business assets, and/or personal assets of the borrower.
Owner occupied real estate loans equaled 18% of total loans outstanding and are collateralized by real estate. The primary source of repayment is the cash flow from the ongoing operations and activities conducted by the party or an affiliate of the party who owns the property.
Consumer loans comprised 15% of total loans at December 31, 2010. Approximately $201.1 million of consumer loans are secured by real estate, $1.7 million are loans collateralized by personal assets of the borrower and $5.2 million are unsecured.
Management reviews various concentration reports monthly to monitor risk in the portfolio. Quarterly, a Risk Management Booklet is prepared and reviewed by both management and our Board of Directors, which identifies areas of risk and quantifies if any exceptions were made to policies and procedures in the lending area during the preceding quarter. Management and the Board utilize the Risk Management Booklet as a tool to identify, limit and control procedure and policy exceptions and to reduce any material risk in the lending function.
16
Loan and Asset Quality
The following table summarizes information regarding nonperforming loans and nonperforming assets as of December 31, 2006 through 2010. Prior year's amounts have been reclassified to conform to the 2010 presentation format.
TABLE 7
December 31, | ||||||||||||||||||||
(dollars in thousands) | 2010 | 2009 | 2008 | 2007 | 2006 | |||||||||||||||
Nonaccrual loans: | ||||||||||||||||||||
Commercial and industrial | $ | 23,103 | $ | 14,254 | $ | 6,863 | $ | 534 | $ | 984 | ||||||||||
Commercial tax-exempt | — | — | — | — | — | |||||||||||||||
Owner occupied real estate | 4,318 | 3,201 | — | — | — | |||||||||||||||
Commercial construction and land development | 14,155 | 11,771 | 6,915 | — | 247 | |||||||||||||||
Commercial real estate | 5,424 | 5,497 | 9,893 | 176 | 1,019 | |||||||||||||||
Residential | 3,609 | 2,368 | 2,959 | 2,168 | 1,110 | |||||||||||||||
Consumer | 1,579 | 654 | 492 | 57 | 19 | |||||||||||||||
Total nonaccrual loans | 52,188 | 37,745 | 27,122 | 2,935 | 3,379 | |||||||||||||||
Loans past due 90 days or more and still accruing | 650 | — | — | — | 2 | |||||||||||||||
Renegotiated loans | 177 | — | — | — | — | |||||||||||||||
Total nonperforming loans | 53,015 | 37,745 | 27,122 | 2,935 | 3,381 | |||||||||||||||
Foreclosed real estate | 6,768 | 7,821 | 743 | 489 | 159 | |||||||||||||||
Total nonperforming assets | $ | 59,783 | $ | 45,566 | $ | 27,865 | $ | 3,424 | $ | 3,540 | ||||||||||
Nonperforming loans to total loans | 3.84 | % | 2.61 | % | 1.88 | % | 0.25 | % | 0.34 | % | ||||||||||
Nonperforming assets to total assets | 2.68 | % | 2.12 | % | 1.30 | % | 0.17 | % | 0.19 | % | ||||||||||
Interest income received on nonaccrual loans | $ | 340 | $ | 976 | $ | 1,268 | $ | 157 | $ | 133 | ||||||||||
Interest income that would have been recorded under the original terms of the loans | $ | 3,363 | $ | 1,880 | $ | 1,776 | $ | 280 | $ | 329 | ||||||||||
Total nonperforming assets (nonperforming loans, foreclosed real estate and loans past due 90 days or more and still accruing interest) at December 31, 2010, were $59.8 million, or 2.68%, of total assets as compared to $45.6 million, or 2.12%, of total assets at December 31, 2009. Total nonperforming loans (nonaccrual loans, 90 days or more past due loans and restructured loans) at December 31, 2010 were $53.0 million compared to $37.7 million one year ago. Much like most of the banking industry, we experienced significant increases in nonperforming loans during 2009 and 2010 as overall economic conditions deteriorated in our market area and in most of the United States. The increase in nonperforming loans experienced by the Company during 2010, resulted from the addition of $31.4 million of additional loans designated as nonaccrual during the year partially offset by $13.8 million of net charge-offs, as well as the reclassification of $3.4 million into foreclosed real estate. Of the total net charge-offs in 2010, $5.1 million was related to loans that were nonperforming at December 31, 2009 and the remaining $8.7 million was associated with loans classified as nonperforming during 2010. Of the ten relationships added, three had an aggregate specific loss allocation of $2.3 million at year end 2010.
Additionally, total delinquent loans (those loans 30 days or more delinquent including nonaccrual loans) as a percentage of total loans were 4.39% at December 31, 2010, compared to 3.25% at December 31, 2009. Excluding non-accrual loans, total loans delinquent for 30 days or more as a percentage of total loans were 0.61% and 0.64% at December 31, 2010 and 2009, respectively. We generally place a loan on nonaccrual status and cease accruing interest when loan payment performance is deemed unsatisfactory and the loan is past due 90 days or more, unless the loan is both well-secured and in the process of collection. Loans past due 90 days and still accruing interest at December 31, 2010 were $650,000 as compared to no loans 90 days past due and still accruing at December 31, 2009. At December 31, 2010 there was one renegotiated loan totaling $177,000. This loan was moved to performing status at the beginning of 2011. Additional loans considered by our internal loan review department as potential problem loans totaled $47.3 million at December 31, 2010 compared to $53.1 million at December 31, 2009. Those loans have been evaluated as to risk exposure in determining the adequacy of the allowance for loan losses. See Note 4 of Notes to Consolidated Financial Statements for the year ended December 31, 2010, included herein, for an age analysis of delinquent loans and for further discussion regarding impaired loans.
Foreclosed real estate totaled $6.8 million as of December 31, 2010 as compared to $7.8 million as of December 31, 2009. The Company obtains third-party appraisals by a pre-approved certified general appraiser on nonperforming loans secured by real estate at the time the
17
loan is determined to be nonperforming. Appraisals are ordered by the Company's Real Estate Loan Administration Department which is independent of both loan workout and loan production functions. The Company properly charges down loans based on the fair value of the collateral as determined by the current appraisal or other collateral valuations less any costs to sell before the properties are transferred to foreclosed real estate.
No charged-off amount was different from what was determined to be fair value of collateral (net of estimated costs to sell) as presented in the appraisal for any period presented.
Any specific reserve or charge-off is accounted for upon receipt and satisfactory review of an appraisal and in no event, later than the end of the quarter in which the loan was determined to be nonperforming. No significant time lapses during this process have occurred for any period presented.
The Company also considers the volatility of the fair value of the collateral, timing and reliability of the appraisal, timing of the third party's inspection of the collateral, confidence in the Company's lien on the collateral, historical losses on similar loans and other factors based on the type of real estate securing the loan. As deemed necessary, the Company will perform inspections of the collateral to determine if an adjustment of the value of the collateral is necessary.
Partially charged off loans with an updated appraisal remain on nonperforming status and are subject to the Company's standard recovery policies and procedures, including, but not limited to, foreclosure proceedings, a forbearance agreement, or classified as a Troubled Debt Restructure, unless collectibility of the entire contractual balance of principal and interest (book and charged off amounts) is no longer in doubt and the loan is current or will be brought current within a short period of time.
As a result of continued economic conditions affecting unemployment, consumer spending, home sales and collateral values, it is possible that increased levels of nonperforming assets and probable losses may continue in the foreseeable future.
The table below and discussion that follows provides additional details of commercial and industrial and commercial construction and land development loans, our two largest nonaccrual categories, which also experienced the largest increases in 2010:
TABLE 8
Nonaccrual Loans | |||||||
(dollars in thousands) | 2010 | 2009 | |||||
Commercial and Industrial: | |||||||
Number of loans | 53 | 40 | |||||
Number of loans greater than $1 million | 6 | 2 | |||||
Average outstanding balance of those loans: | |||||||
Greater than $1 million | $ | 2,954 | $ | 4,600 | |||
Less than $1 million | $ | 118 | $ | 136 | |||
Commercial Construction and Land Development: | |||||||
Number of loans | 8 | 6 | |||||
Number of loans greater than $1 million | 5 | 4 | |||||
Average outstanding balance of those loans: | |||||||
Greater than $1 million | $ | 2,560 | $ | 2,735 | |||
Less than $1 million | $ | 452 | $ | 133 | |||
At December 31, 2010, 53 loans were in the nonaccrual commercial and industrial category ranging from $2,000 to $5.6 million and eight loans were in the nonaccrual commercial construction and land development category ranging from $150,000 to $4.8 million. Of the 53 commercial and industrial loans, six of the loans were in excess of $1.0 million and totaled $17.7 million, or 77%, of the total nonaccrual balances for this category with an average outstanding balance of $3.0 million per loan. The remaining 47 loans account for the difference at an average outstanding balance of $118,000 per loan. Of the eight nonaccrual commercial construction and land development loans, five loans, were in excess of $1.0 million and totaled $12.8 million, or 90%, of total nonaccrual balances for this loan category, with an average outstanding balance of $2.6 million per loan. The remaining three loans account for the difference at an average outstanding balance of $452,000 per loan.
At December 31, 2009, 40 loans were in the nonaccrual commercial and industrial category ranging from $5,000 to $6.2 million and six
18
loans were in the nonaccrual commercial construction and land development category ranging from $116,000 to $4.8 million. Of the 40 commercial loans, two of the loans were in excess of $1.0 million and totaled $9.3 million, or 65%, of the total nonaccrual balances for this category, with an average outstanding balance of $4.6 million per loan. The remaining 38 loans account for the difference at an average of $136,000 per loan. Of the commercial construction and land development loans, four of the loans were in excess of $1.0 million and totaled $10.9 million, or 93%, of the total nonaccrual balances for this loan category, with an average outstanding balance of $2.7 million per loan. The remaining two loans account for the difference at an average of $133,000 per loan.
Allowance for Loan Losses
The allowance for loan losses (ALLL) is a reserve established in the form of a provision expense for loan losses and is reduced by loan charge-offs, net of recoveries. When loans are deemed to be uncollectible, they are charged off. Management has established a reserve that it believes is adequate for estimated losses in the loan portfolio. In conjunction with an internal loan review function that operates independently of the lending function, management monitors the loan portfolio to identify risks on a timely basis so that an appropriate allowance is maintained. Based on an evaluation of the loan portfolio, management presents a quarterly review of the allowance for loan losses to the Board of Directors, indicating any changes in the allowance since the last review. In making the evaluation, management considers the results of recent regulatory examinations, which typically include a review of the allowance for loan losses as an integral part of the examination process.
In establishing the allowance, management evaluates, on a quantitative basis, classified loans to determine an aggregate reserve for those loans based on that review. In addition, an allowance for the remainder of the loan portfolio is determined based on historical loss experience within certain components of the portfolio. These allocations may be modified if current conditions indicate that loan losses may differ from historical experience. In addition, a portion of the allowance is established for losses inherent in the loan portfolio, which have not been identified by the quantitative processes described above. This determination inherently involves a higher degree of subjectivity and considers risk factors that may not have yet manifested themselves in historical loss experience. These factors include:
• | Changes in lending policies and procedures, including changes in underwriting standards; |
• | Changes in levels and trends in collection, charge-off and recovery practices; changes in the volume and severity of past due loans, the volume of nonaccrual loans and the volume and severity of adversely classified or graded loans; |
• | Changes in the nature and volume of the portfolio and the terms of loans; |
• | Changes in the value of underlying collateral for collateral-dependent loans; |
• | Changes in the quality of our loan review system; |
• | Changes in the experience, ability and depth of lending management and other relevant staff; |
• | The existence and effect of any concentrations of credit and changes in the level of such concentrations; and |
• | Changes in international, national, regional and local economic and business conditions and developments that affect the collectibility of the portfolio, including the condition of various market segments and the effect of other external factors such as competition and legal and regulatory requirements on the level of estimated credit losses in our existing portfolio. |
More specifically, the methodology utilized to assess the adequacy of the allowance includes:
• | Identifying loans for individual review under current guidance as required by GAAP. Generally, the loans identified for individual review consist of larger balance commercial business loans and commercial mortgages; |
• | Assessing whether the loans identified for review are “impaired” based on the probability that all amounts due under the loan will not be collected according to the contractual terms of the loan agreement; |
• | For loans identified as impaired, calculating the estimated fair value of the loans, using one of the following methods, a) observable market price, b) discounted cash flow or c) the value of the underlying collateral; |
• | Identifying other loans for evaluation collectively as required by GAAP. In general, these other loans include residential mortgages and consumer loans; |
• | Segmenting loans into groups with similar characteristics and allocating an allowance for loan losses to each segment based on recent loss history and other relevant information; and |
• | Reviewing the results to determine the appropriate amount of the allowance for loan losses. |
While the allowance for loan losses is maintained at a level believed to be adequate by management to cover estimated losses in the loan
19
portfolio, determination of the allowance is inherently subjective, as it requires estimates, all of which may be susceptible to significant change. Changes in these estimates may impact the provisions charged to expense in future periods. See Note 4 of Notes to Consolidated Financial Statements for the year ended December 31, 2010, included herein, for further discussion regarding the allowance for loan losses.
The Company recorded provisions of $21.0 million to the allowance for loan losses in 2010, compared to $12.4 million for 2009. During 2010, net charge-offs totaled to $13.8 million, or 0.98%, of average loans outstanding, excluding loans held for sale, for the year, compared to $14.8 million, or 1.02%, of average loans outstanding for 2009. Approximately $10.5 million, or 76%, of total net charge-offs for 2010 were concentrated in a total of ten different lending relationships. Eight different lending relationships accounted for approximately $11.7 million, or 79%, of the total net charge-off figure for 2009. The increased provision to the allowance for loan losses in 2010 over 2009 and prior years is directly related to the increase in the level of nonperforming loans from December 31, 2009 to December 31, 2010, the increase in specific reserves relating to those loans and an adjustment by management during the third quarter of 2010 in the qualitative analysis of the adequacy of the allowance for loan losses. See Note 4 in the Notes to Consolidated Financial Statements for the year ended December 31, 2010 included herein for further discussion regarding the adjustment. The allowance for loan losses as a percentage of loans receivable increased from 1.00% of total loans outstanding at December 31, 2009, to 1.57% of total loans outstanding at December 31, 2010. The allowance at December 31, 2010 provided coverage of 41% of total nonperforming loans compared with 38% of nonperforming at December 31, 2009. See the Application of Critical Accounting Policies section in this Management's Discussion and Analysis regarding the allowance for loan losses as well as Notes 1 and 4 in the Notes to Consolidated Financial Statements for the year ended December 31, 2010 included herein for further discussion regarding our allowance for loan losses.
20
The following table presents a summary of our provision and allowance for loan losses. Prior year's data have been reclassified to conform to the 2010 presentation format.
TABLE 9
Years Ended December 31, | |||||||||||||||||||
(dollars in thousands) | 2010 | 2009 | 2008 | 2007 | 2006 | ||||||||||||||
Balance at beginning of year | $ | 14,391 | $ | 16,719 | $ | 10,742 | $ | 9,685 | $ | 9,231 | |||||||||
Provisions charged to operating expenses | 21,000 | 12,425 | 7,475 | 1,762 | 1,634 | ||||||||||||||
35,391 | 29,144 | 18,217 | 11,447 | 10,865 | |||||||||||||||
Recoveries of loans previously charged-off: | |||||||||||||||||||
Commercial and industrial | 407 | 92 | 145 | 11 | 34 | ||||||||||||||
Commercial tax-exempt | — | — | — | — | — | ||||||||||||||
Owner occupied real estate | 3 | — | — | — | — | ||||||||||||||
Commercial construction and land development | 58 | 1 | — | — | — | ||||||||||||||
Commercial real estate | 25 | 121 | — | 8 | — | ||||||||||||||
Residential | 5 | 87 | — | — | — | ||||||||||||||
Consumer | 24 | 7 | 25 | 53 | 71 | ||||||||||||||
Total recoveries | 522 | 308 | 170 | 72 | 105 | ||||||||||||||
Loans charged-off: | |||||||||||||||||||
Commercial and industrial | (5,995 | ) | (6,807 | ) | (1,426 | ) | (610 | ) | (895 | ) | |||||||||
Commercial tax-exempt | — | — | — | — | — | ||||||||||||||
Owner occupied real estate | (614 | ) | (342 | ) | — | — | — | ||||||||||||
Commercial construction and land development | (1,249 | ) | (3,652 | ) | — | — | — | ||||||||||||
Commercial real estate | (4,668 | ) | (3,634 | ) | — | (2 | ) | — | |||||||||||
Residential | (705 | ) | (299 | ) | (69 | ) | (72 | ) | — | ||||||||||
Consumer | (1,064 | ) | (327 | ) | (173 | ) | (93 | ) | (390 | ) | |||||||||
Total charged-off | (14,295 | ) | (15,061 | ) | (1,668 | ) | (777 | ) | (1,285 | ) | |||||||||
Net charge-offs | (13,773 | ) | (14,753 | ) | (1,498 | ) | (705 | ) | (1,180 | ) | |||||||||
Balance at end of year | $ | 21,618 | $ | 14,391 | $ | 16,719 | $ | 10,742 | $ | 9,685 | |||||||||
Net charge-offs to average loans outstanding | 0.98 | % | 1.02 | % | 0.11 | % | 0.07 | % | 0.13 | % | |||||||||
Allowance for loan losses to year-end loans | 1.57 | % | 1.00 | % | 1.16 | % | 0.93 | % | 0.99 | % | |||||||||
Allocation of the Allowance for Loan Losses
The allocation of the allowance for loan losses is made for analytical purposes and it is not necessarily indicative of the categories in which future credit losses may occur. The total allowance is available to absorb losses from any segment of loans. The allocations in the following table were determined by a combination of the following factors: specific allocations made on loans considered impaired as determined by management and the loan review committee, a general allocation on certain other impaired loans and historical losses in each loan type category combined with a weighting of the current loan composition. The following table details the allocation of the allowance for loan losses to the various categories. Prior year amounts have been reclassified to conform to the 2010 presentation format.
21
TABLE 10
December 31, | ||||||||||||||||||||||||||||||||||
2010 | 2009 | 2008 | 2007 | 2006 | ||||||||||||||||||||||||||||||
(dollars in thousands) | Amount | % Gross Loans | Amount | % Gross Loans | Amount | % Gross Loans | Amount | % Gross Loans | Amount | % Gross Loans | ||||||||||||||||||||||||
Commercial and industrial | $ | 9,848 | 25 | % | $ | 5,043 | 28 | % | $ | 5,755 | 26 | % | $ | 3,499 | 28 | % | $ | 3,319 | 30 | % | ||||||||||||||
Commercial tax-exempt | 89 | 6 | 1,336 | 7 | 917 | 6 | 521 | 4 | 228 | 3 | ||||||||||||||||||||||||
Owner occupied real estate | 910 | 18 | 2,419 | 18 | 2,020 | 19 | 1,914 | 22 | 1,023 | 13 | ||||||||||||||||||||||||
Commercial construction and land development | 5,420 | 8 | 914 | 8 | 2,231 | 7 | 62 | 7 | 387 | 6 | ||||||||||||||||||||||||
Commercial real estate | 4,051 | 22 | 2,249 | 18 | 2,834 | 20 | 1,736 | 13 | 1,825 | 19 | ||||||||||||||||||||||||
Residential | 442 | 6 | 738 | 6 | 1,002 | 6 | 893 | 8 | 705 | 10 | ||||||||||||||||||||||||
Consumer | 702 | 15 | 1,687 | 15 | 1,899 | 16 | 1,800 | 18 | 1,868 | 19 | ||||||||||||||||||||||||
Unallocated | 156 | — | 5 | — | 61 | — | 317 | — | 330 | — | ||||||||||||||||||||||||
Total | $ | 21,618 | 100 | % | $ | 14,391 | 100 | % | $ | 16,719 | 100 | % | $ | 10,742 | 100 | % | $ | 9,685 | 100 | % | ||||||||||||||
Deposits
Total deposits at December 31, 2010, were $1.8 billion, an increase of $17.4 million, or 1%, over total deposits one year ago. We regard core deposits as all deposits other than public CDs. Core deposits decreased by $13.1 million, or 1%, from $1.78 billion at December 31, 2009 to $1.77 billion at December 31, 2010. Total core demand noninterest bearing deposits increased by $21.1 million, or 7%, year over year while core demand interest-bearing and savings account balances were flat. Commercial core deposits grew by $34.2 million, or 7%, in 2010 to $552.2 million while governmental core deposits decreased by $43.2 million, or 12%, to $323.0 million. Core consumer deposits totaled $895 million at December 31, 2010 and comprise 51% of our total core deposits. Total average deposits for 2010 were $1.86 billion, an increase of $160.6 million, or 9%, over the 2009 average of $1.70 billion. As noted in Table 11 below, declines in average savings and time deposit balances were more than offset by growth in average demand deposits.
The average balances and weighted average rates paid on deposits for 2010, 2009 and 2008 are presented below:
TABLE 11
Years Ended December 31, | ||||||||||||||||||||
2010 | 2009 | 2008 | ||||||||||||||||||
(dollars in thousands) | Average Balance/Rate | Average Balance/Rate | Average Balance/Rate | |||||||||||||||||
Demand deposits: | ||||||||||||||||||||
Noninterest-bearing | $ | 332,099 | $ | 303,963 | $ | 276,120 | ||||||||||||||
Interest-bearing (money market and checking) | 946,982 | 0.69 | % | 795,835 | 0.92 | % | 727,783 | 1.53 | % | |||||||||||
Savings | 324,698 | 0.47 | 329,799 | 0.59 | 351,291 | 1.10 | ||||||||||||||
Time | 258,042 | 2.11 | 271,643 | 2.95 | 203,805 | 3.53 | ||||||||||||||
Total deposits | $ | 1,861,821 | 0.72 | % | $ | 1,701,240 | 1.02 | % | $ | 1,558,999 | 1.42 | % | ||||||||
The decrease in the average rates paid on deposits from 2008 to 2009 and again from 2009 to 2010 are a direct result of the general level of short-term market interest rates and the Company's pricing of its deposit rates paid in accordance with such market rates. See the Results of Operations section earlier in this Management's Discussion and Analysis regarding the Company's cost of deposits.
22
The remaining maturities for CDs with balances of $100,000 or more as of December 31, 2010 are presented in Table 12.
TABLE 12
December 31, | |||
(in thousands) | 2010 | ||
3 months or less | $ | 51,942 | |
3 to 6 months | 31,941 | ||
6 to 12 months | 23,907 | ||
Over 12 months | 25,593 | ||
Total | $ | 133,383 | |
Short-Term Borrowings
Short-term borrowings used to meet temporary funding needs consist of overnight and short-term advances from the FHLB. For 2010, short-term borrowings averaged $52.2 million, a $120.7 million, or 70%, decrease from 2009. The decrease in the average level of short-term borrowings in 2010 as compared to 2009 and to 2008 is attributable to a lower need for such borrowings as a result of the level of deposit growth throughout the last two years as well as the receipt of proceeds from a common stock offering at the end of the third quarter in 2009. The weighted-average rate paid during 2010 for short-term borrowings was 0.60% compared with 0.59% during 2009. Rates paid by Metro on short-term borrowings are directly related to the level of overall general market interest rates. Therefore, due to the lower level of market rates prevalent throughout 2009 and 2010 compared to 2008, the rate paid on such borrowings by Metro decreased by 138 bps in 2010 compared to 2008. At December 31, 2010, short-term borrowings outstanding totaled $140.5 million at a rate of 0.60%. As of December 31, 2009, short-term borrowings outstanding totaled $51.1 million at a rate of 0.62%. As of December 31, 2008, short-term borrowings outstanding totaled $300.1 million at a rate of 0.57%. The maximum short-term borrowings outstanding at any one month-end were $140.5 million in 2010, $317.7 million in 2009 and $356.5 million in 2008.
Long-Term Debt
Long-term debt totaled $29.4 million at December 31, 2010 compared to $54.4 million at December 31, 2009. Our long-term debt consists of $29.4 million of Trust Capital Securities through Commerce Harrisburg Capital Trust I, Commerce Harrisburg Capital Trust II and Commerce Harrisburg Capital Trust III, our Delaware business trust subsidiaries. As part of the Company's Asset/Liability management strategy, management utilized the FHLB convertible select borrowing product during the third quarter of 2007 with the acquisition of a $25.0 million borrowing with a 5-year maturity and a six month conversion term at an initial interest rate of 4.29%. As part of a strategy to increase future net interest income, the Company elected to pay off the entire $25.0 million during the fourth quarter of 2010 and incurred a $1.6 million prepayment charge. At December 31, 2010, all of the Capital Trust Securities qualified as Tier I capital for regulatory capital purposes. Proceeds of the trust capital securities were used for general corporate purposes, including additional capitalization of our wholly-owned banking subsidiary. See Note 10 in the Notes to Consolidated Financial Statements for the year ended December 31, 2010 for further analysis of our long-term debt.
Stockholders' Equity and Capital Adequacy
At December 31, 2010, stockholders' equity totaled $205.4 million, up $5.3 million, or 3%, over stockholders' equity at December 31, 2009. The ratio of stockholders' equity as a percent of total assets decreased to 9.19% at December 31, 2010, from 9.31% at December 31, 2009 primarily as a result of total asset growth of $86.7 million in 2010. Average stockholders' equity to average assets for the year 2010 was 9.47% compared to 6.77% in 2009. See Note 12 of Notes to Consolidated Financial Statements for the year ended December 31, 2010, included herein, for additional discussion regarding Stockholders' Equity.
On August 6, 2009, Metro Bancorp filed a shelf registration statement on Form S-3 with the Securities and Exchange Commission (SEC) which will allow the Company, from time to time, to offer and sell up to a total aggregate of $250.0 million of common stock, preferred stock, debt securities, or warrants, either separately or together in any combination. The shelf registration statement also registered trust preferred securities. The Dodd-Frank Wall Street Reform and Consumer Protection Act (Dodd-Frank Act) excludes from regulatory capital trust preferred securities issued after May 19, 2010. Consequently, Metro Bancorp has no foreseeable plans to issue additional trust preferred securities. The Company has been well-capitalized under federal regulatory guidelines, however the shelf registration better positions us to take advantage of potential opportunities for growth and to address current economic conditions.
The Company completed a common stock offering in 2009 of 6.88 million shares, at $12.00 per share, for new capital proceeds, net of expenses, of $77.8 million. The additional capital has significantly strengthened the Company's capital ratios far beyond regulatory
23
guidelines for “well-capitalized” status and positioned us for strong future growth as well as any potential continuation of difficult market economic conditions.
Risk-based capital provides the basis for which all banks are evaluated in terms of capital adequacy. The risk-based capital standards require all banks to have Tier 1 capital of at least 4% and total capital, including Tier 1 capital, of at least 8% of risk-adjusted assets. Tier 1 capital includes common stockholders' equity and qualifying perpetual preferred stock together with related surpluses and retained earnings. Total capital may be comprised of total Tier 1 capital plus limited life preferred stock, qualifying debt instruments and the allowance for loan losses.
The following table provides a comparison of the Company's risk-based capital ratios and leverage ratios to the minimum regulatory requirements for the periods indicated:
TABLE 13
Company | Bank | Minimum Regulatory Requirements | ||||||||||||
December 31, | December 31, | |||||||||||||
2010 | 2009 | 2010 | 2009 | |||||||||||
Total Capital | 15.83 | % | 14.71 | % | 14.06 | % | 12.85 | % | 8.00 | % | ||||
Tier 1 Capital | 14.58 | 13.88 | 12.81 | 12.01 | 4.00 | |||||||||
Leverage ratio (to total average assets) | 10.68 | 11.31 | 9.38 | 9.82 | 4.00 | |||||||||
At December 31, 2010, the capital levels of the Bank met the regulatory definition of a “well-capitalized” financial institution, i.e., a leverage capital ratio exceeding 5%, a Tier 1 risk-based capital ratio exceeding 6% and a total risk-based capital ratio exceeding 10%.
Our common stock trades on the NASDAQ Global Select Market under the symbol METR. The table below sets forth the prices on the NASDAQ Global Select Market known to us for the period beginning January 1, 2009 through December 31, 2010. As of December 31, 2010, there were approximately 4,000 holders of record of the Company's common stock.
Sales Price | |||||||
Quarter Ended: | High | Low | |||||
March 31, 2010 | $ | 14.22 | $ | 10.82 | |||
June 30, 2010 | 14.76 | 11.72 | |||||
September 30, 2010 | 13.45 | 9.05 | |||||
December 31, 2010 | 11.33 | 9.30 | |||||
March 31, 2009 | $ | 27.48 | $ | 11.00 | |||
June 30, 2009 | 22.95 | 17.60 | |||||
September 30, 2009 | 19.99 | 11.50 | |||||
December 31, 2009 | 13.16 | 10.31 | |||||
24
The following graph shows the yearly percentage change in the Company's cumulative total shareholder return on its common stock from December 31, 2005 to December 31, 2010 compared with the cumulative total return of a NASDAQ Bank Index and the NASDAQ Composite Market Index.
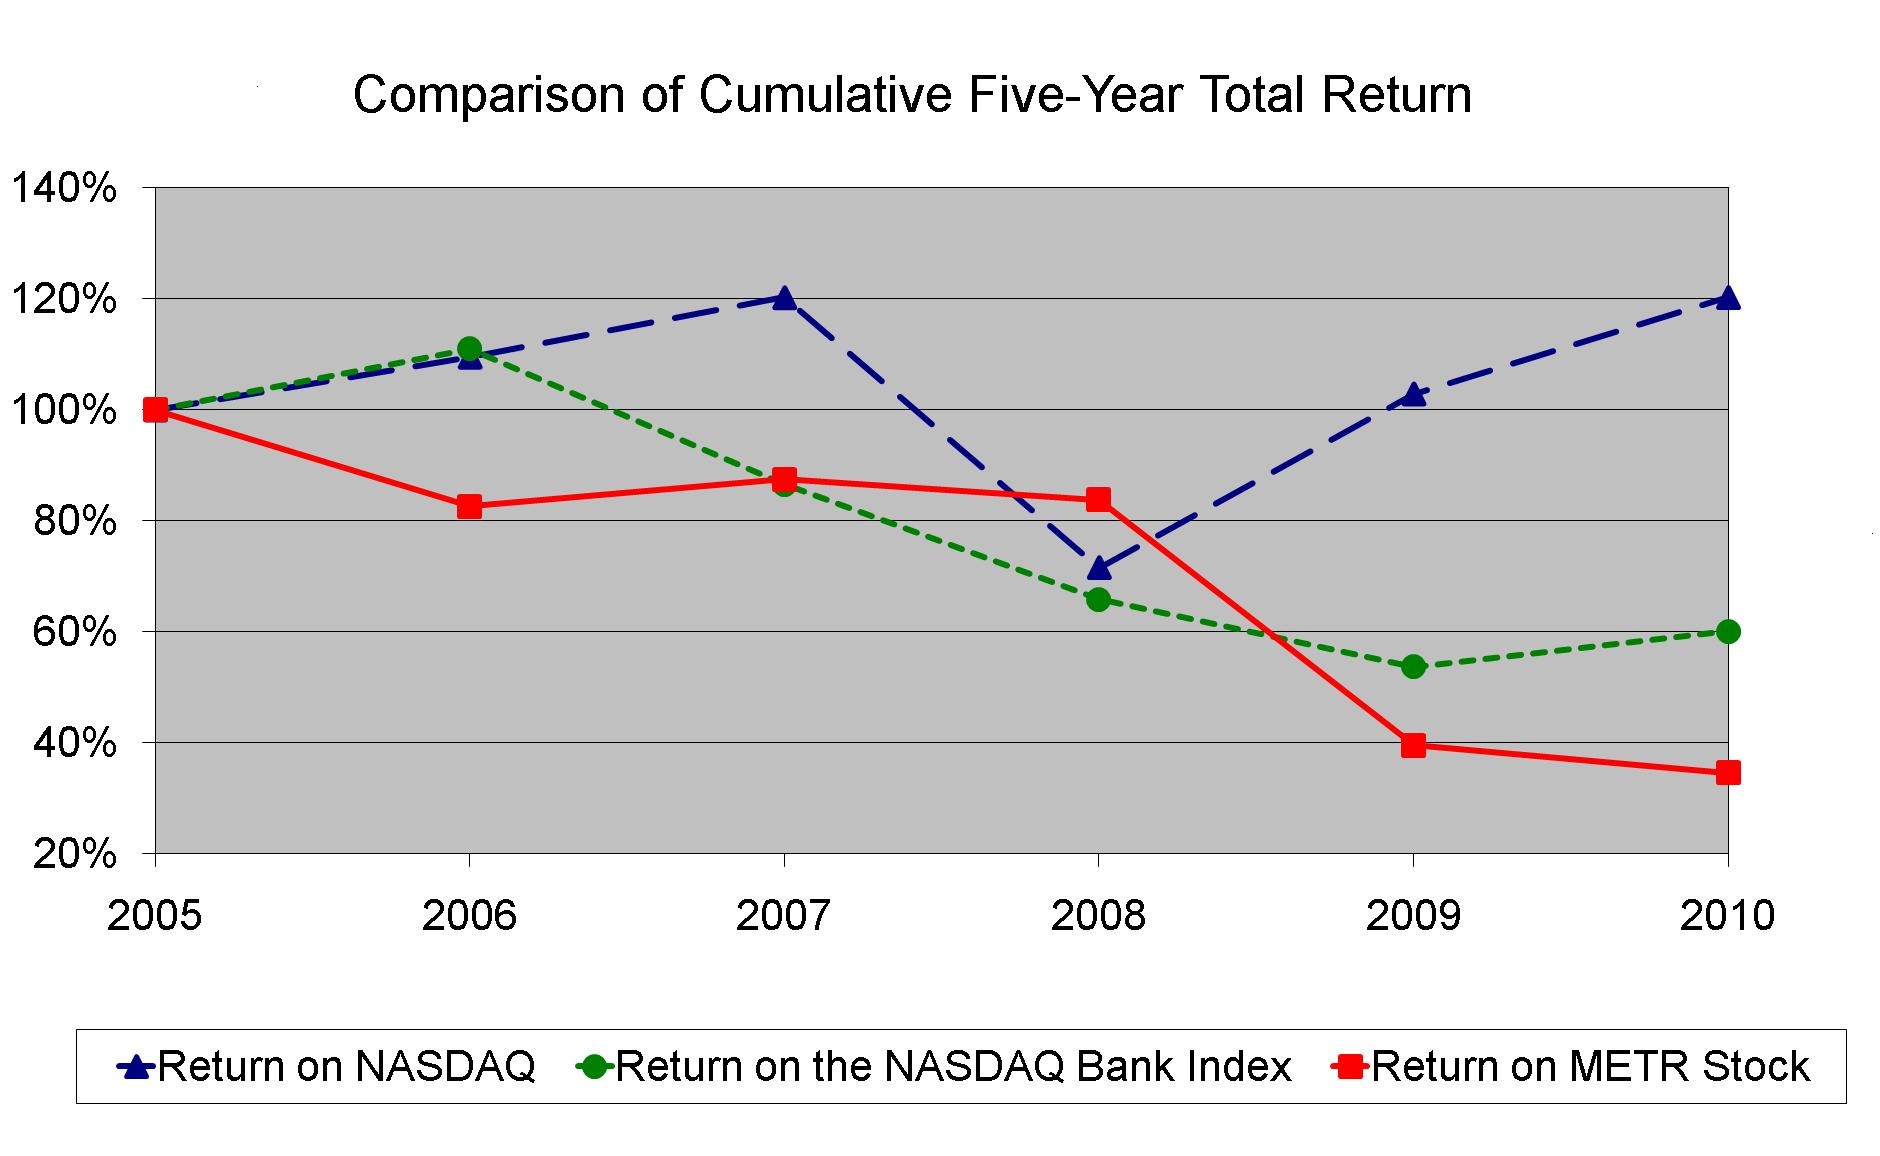 We offer a Dividend Reinvestment and Stock Purchase Plan by which dividends on our Common Stock and optional cash payments of not less than $100 per month and no more than $25,000 per month may be invested in our Common Stock at a 3% discount to the market price and without payment of brokerage commissions. During 2010, our shareholders purchased 288,349 shares directly from the Company under this plan and, as a result, the Company received proceeds of approximately $3.2 million from such purchases.
Interest Rate Sensitivity
The management of interest rate sensitivity seeks to avoid fluctuating net interest margins and to provide consistent net interest income through periods of changing interest rates.
Our risk of loss arising from adverse changes in the fair value of financial instruments, or market risk, is composed primarily of interest rate risk. The primary objective of our asset/liability management activities is to maximize net interest income while maintaining acceptable levels of interest rate risk. Our Asset/Liability Committee (ALCO) is responsible for establishing policies to limit exposure to interest rate risk and to ensure procedures are established to monitor compliance with those policies. Our Board of Directors reviews the guidelines established by ALCO.
An interest rate sensitive asset or liability is one that, within a defined time period, either matures or experiences an interest rate change in line with general market interest rates. Historically, the most common method of estimating interest rate risk was to measure the maturity and repricing relationships between interest-earning assets and interest-bearing liabilities at specific points in time, referred to as “GAP,” typically one year. Under this method, a company is considered liability sensitive when the amount of its interest-bearing liabilities exceeds the amount of its interest-earning assets within the one-year horizon. However, assets and liabilities with similar repricing characteristics may not reprice at the same time or to the same degree. As a result, our GAP does not necessarily predict the impact of changes in general levels of interest rates on net interest income. Table 14 shows our GAP position as of December 31, 2010. The repricing assumptions used in the table are as follows:
• | Fixed rate loans receivable are scheduled according to their contractual amortization and payment schedules specific to each loan. A market consensus Constant Prepayment Rate (CPR) is applied to Residential Mortgage Fixed rate loans; |
• | Floating rate loans receivable are tied to a floating index such as New York Prime and are scheduled according to their repricing |
25
characteristics;
• | Securities with pre-payment characteristics such as MBSs and CMOs are scheduled based upon their remaining weighted average lives as calculated utilizing a market consensus CPR. Securities with call options are analyzed in the context of the existing interest rate environment to estimate the likelihood of their call and to project their resulting payment schedule. All other securities are assumed to reprice at their contractual maturity; |
• | Fixed rate transaction accounts are scheduled to reprice in accordance with their estimated decay rates as determined in a core deposit study produced by an independent consultant. Floating rate transaction accounts are scheduled in the 1-90 day category as they are tied to a floating index such as the 91-Day Treasury bill; and |
• | Time deposit accounts, short-term borrowings and trust capital securities are scheduled based upon their contractual maturity dates. |
TABLE 14
December 31, 2010 | |||||||||||||||||||||||
(dollars in thousands) | 1 - 90 Days | 91 - 180 Days | 181 - 365 Days | 1 - 5 Years | Beyond 5 Years | Total | |||||||||||||||||
Interest-earning assets: | |||||||||||||||||||||||
Loans receivable, including loans held for sale | $ | 601,330 | $ | 35,815 | $ | 61,437 | $ | 475,003 | $ | 224,225 | $ | 1,397,810 | |||||||||||
Securities | 74,690 | 35,792 | 61,906 | 233,620 | 280,208 | 686,216 | |||||||||||||||||
Total interest-earning assets | 676,020 | 71,607 | 123,343 | 708,623 | 504,433 | 2,084,026 | |||||||||||||||||
Interest-bearing liabilities: | |||||||||||||||||||||||
Transaction accounts, excluding noninterest-bearing demand | 262,262 | 44,333 | 51,413 | 218,623 | 643,939 | 1,220,570 | |||||||||||||||||
Time deposits | 79,112 | 52,160 | 58,031 | 81,350 | — | 270,653 | |||||||||||||||||
Short-term borrowings | 140,475 | — | — | — | — | 140,475 | |||||||||||||||||
Long-term debt | — | — | — | — | 29,400 | 29,400 | |||||||||||||||||
Total interest-bearing liabilities | 481,849 | 96,493 | 109,444 | 299,973 | 673,339 | 1,661,098 | |||||||||||||||||
Period GAP | 194,171 | (24,886 | ) | 13,899 | 408,650 | (168,906 | ) | $ | 422,928 | ||||||||||||||
Cumulative GAP | $ | 194,171 | $ | 169,285 | $ | 183,184 | $ | 591,834 | $ | 422,928 | |||||||||||||
Cumulative RSA / RSL | 140.30 | % | 129.27 | % | 126.63 | % | 159.92 | % | 125.46 | % | |||||||||||||
Notes: Securities are reported at face value for purposes of this table. Securities include restricted investment in bank stock for purposes of this table. RSA means rate sensitive assets; RSL means rate sensitive liabilities.
Shortcomings are inherent in any GAP analysis since certain assets and liabilities may not move proportionately as interest rates change. As the interest rate environment has become more volatile, we have continued to place greater reliance on interest income sensitivity modeling and less on GAP reporting.
Our management understands that the preparation of GAP reports can only provide a guide to the impact of the movement of interest rates. Modeling is the best means to predict the movement in interest rates. This is true because even with the achievement of a perfectly matched balance sheet (per a GAP report), we may be subject to interest rate risk due to: differences in the timing of repricing, basis risk, market risk, customer ability to prepay loans or withdraw funds and yield curve risk.
Our management believes the simulation of net interest income in different interest rate environments provides a more meaningful measure of interest rate risk. Income simulation analysis captures not only the potential of all assets and liabilities to mature or reprice, but also the probability that they will do so. Income simulation also attends to the relative interest rate sensitivities of these items and projects their behavior over an extended period of time. Finally, income simulation permits management to assess the probable effects on the balance sheet not only of changes in interest rates, but also of proposed strategies for responding to them.
Our income simulation model analyzes interest rate sensitivity by projecting net interest income over the next 24 months in a flat rate scenario versus net interest income in alternative interest rate scenarios. Our management continually reviews and refines its interest rate risk management process in response to the changing economic climate. Currently, our model projects a 200 bp increase and a 100 bp decrease during the next year, with rates remaining constant in the second year. We also model a 300, 400 and 500 bp increase in market
26
interest rates over the next two years.
Our ALCO policy has established that income sensitivity will be considered acceptable if overall net interest income volatility in the above mentioned interest rate scenarios are within 4% of forecasted net interest income in the first year and within 5% using a two-year time frame.
The following table compares the impact on forecasted net income at December 31, 2010 of a plus 200 and minus 100 bp change in interest rates to the impact at December 31, 2009 in the plus 200 and minus 100 bp scenarios.
Plus 200 | Minus 100 | ||||
December 31, 2010 | |||||
Twelve Months | (0.3 | )% | (2.4 | )% | |
Twenty-Four Months | 1.7 | % | (3.1 | )% | |
December 31, 2009 | |||||
Twelve Months | 2.1 | % | (2.0 | )% | |
Twenty-Four Months | 5.7 | % | (4.5 | )% | |
Management continues to evaluate strategies in conjunction with the Company's ALCO to effectively manage the interest rate risk position. Such strategies could include the sale of a portion of our AFS investment portfolio, purchasing floating rate securities, altering the mix of our deposits by type and therefore rate paid, the use of risk management tools such as interest rate swaps and caps, adjusting the investment leverage position funded by short-term borrowings extending the maturity structure of the Company's short-term borrowing position or fixing the cost of our short-term borrowings.
Management uses many assumptions to calculate the impact of changes in interest rates. Actual results may not be similar to our projections due to several factors including the timing and frequency of rate changes, market conditions and the shape of the yield curve. In general, a flattening of the yield curve would result in reduced net interest income compared to a normal-shaped interest rate curve scenario and proportionate rate shift assumptions. Actual results may also differ due to Management's actions, if any, in response to the changing rates.
Management also monitors interest rate risk by utilizing a market value of equity model. The model assesses the impact of a change in interest rates on the market value of all our assets and liabilities, as well as any off balance sheet items. Market value of equity is defined as the market value of assets less the market value of liabilities plus the market value of off-balance sheet items. The model calculates the market value of equity in the current rate scenario and then compares the market value of equity given an immediate 200 bp increase and a 100 bp decrease in rates. Our ALCO policy indicates that the level of interest rate risk is unacceptable if the immediate change in rates would result in a loss of more than 30% of the market value calculated in the current rate scenario. This measurement of interest rate risk represents a change from the previously reported metric which focused on the change in the excess of market value over book value in each of the interest rate scenarios. At December 31, 2010 the market value of equity calculation indicated acceptable levels of interest rate risk in all scenarios per the policies established by our ALCO.
The market value of equity model reflects certain estimates and assumptions regarding the impact on the market value of our assets and liabilities given an immediate plus 200 or minus 100 bp change in rates. One of the key assumptions is the market value assigned to our core deposits, or the core deposit premiums. Using an independent consultant, we have completed and updated comprehensive core deposit studies in order to assign our own core deposit premiums as permitted by regulation. The studies have consistently confirmed management's assertion that our core deposits have stable balances over long periods of time, are generally insensitive to changes in interest rates and have significantly longer average lives and durations than our loans and investment securities. Thus, these core deposit balances provide an internal hedge to market fluctuations in our fixed rate assets. Management believes the core deposit premiums produced by its market value of equity model at December 31, 2010 provide an accurate assessment of our interest rate risk. At December 31, 2010, the average life of our core deposition transaction accounts was eight years.
Liquidity
The objective of liquidity management is to ensure our ability to meet our financial obligations. These obligations include the payment of deposits on demand at their contractual maturity; the repayment of borrowings as they mature; the payment of lease obligations as they become due; the ability to fund new and existing loans and other funding commitments; and the ability to take advantage of new business opportunities. The Board of Directors is responsible for approving a Liquidity Policy to be implemented by ALCO and management.
27
Liquidity sources are found on both sides of the balance sheet. Liquidity is provided on a continuous basis through scheduled and unscheduled principal reductions and interest payments on outstanding loans and investments. Liquidity is also provided through the availability and maintenance of a strong base of core customer deposits; maturing short-term assets; the ability to sell marketable securities; short-term borrowings and access to capital markets.
Liquidity is measured and monitored daily, allowing management to better understand and react to balance sheet trends. On a monthly basis, a comprehensive liquidity analysis is reviewed by our Board of Directors. The analysis provides a summary of the current liquidity measurements, projections and future liquidity positions given various levels of liquidity stress. Management also maintains a detailed liquidity contingency plan designed to respond to an overall decline in the condition of the banking industry or a problem specific to the Company.
The Consolidated Statements of Cash Flows provide additional information on our sources and uses of funds. From a funding standpoint, we have been able to rely over the years on a stable base of strong “core” deposit growth. Cash from operating activities during 2010 decreased to $8.7 million from $58.8 million during 2009. This decrease was primarily attributed to the timing of loan sales, a higher provision for loan losses and a decrease in other liabilities, partially offset by a higher net loss in 2010 as compared to 2009. Investing activities resulted in a net cash outflow of $99.6 million during 2010 compared to $54.3 million in 2009, primarily due to an increase in purchases of securities in 2010 as compared to 2009. Financing activities resulted in net cash of $83.5 million provided in 2010 compared to a net outflow of $13.7 million in 2009. The net cash inflow in 2010 was mostly from an increase in short-term borrowings of $89.4 million and an increase in deposits of $17.4 million compared to a $180.7 million increase in 2009. In addition, 2009 cash inflows included proceeds from the issuance of common stock which generated $77.8 million in net cash proceeds.
Our investment portfolio consists mainly of MBSs. Cash flows from such investments are dependent upon the performance of the underlying mortgage loans and are generally influenced by the level of interest rates. As rates increase, cash flows generally decrease as prepayments on the underlying mortgage loans slow. As rates decrease, cash flows generally increase as prepayments increase. In the current market environment which has adversely impacted the pricing on certain securities in the Company's investment portfolio, the Company would not be inclined to act on a sale of such securities for liquidity purposes. If the Company attempted to sell certain securities of its investment portfolio, the current performance of the underlying collateral as well as the current depressed market price could affect the Company's ability to sell those securities, as well as the value the Company would be able to realize.
We also maintain secondary sources of liquidity consisting of federal funds lines of credit and borrowing capacity at the FHLB, which can be drawn upon if needed. In addition, we have the ability to borrow at the Federal Discount Window. As of December 31, 2010, our total potential liquidity through these secondary sources was $528.9 million of which $388.4 million was currently available, as compared to $572.1 million at December 31, 2009 of which $496.1 million was currently available.
The Bank opted to remain in the FDIC-sponsored Temporary Liquidity Guarantee Program which provided 100% federal deposit insurance coverage for any individual non-interest demand checking account and low-interest NOW checking account whose balance exceeds $250,000. The program expired on December 31, 2010. The Dodd-Frank Act provides temporary unlimited coverage for noninterest-bearing transaction accounts at all FDIC-insured depository institutions. The separate coverage for these accounts became effective on December 31, 2010 and terminates on December 31, 2012. Upon such expiration, customer deposit and withdrawal behavior for such accounts could fluctuate materially and, as a result, have an adverse impact on our liquidity position.
The Company and the Bank's liquidity are managed separately. On an unconsolidated basis, the principal source of the Company's revenue is dividends paid to the Company by the Bank. The Bank is subject to regulatory restrictions on its ability to pay dividends to the Company. The Company's net cash outflows consist principally of interest on the trust-preferred securities, dividends on the preferred stock and unallocated corporate expenses.
As a result of Metro Bank entering into a Consent Order with both the FDIC and the Pennsylvania Department of Banking on April 29, 2010, the FHLB has temporarily reduced the Bank's available borrowing level to 50% of the Bank's normal maximum borrowing capacity. Additionally, the Bank may borrow between 50% and 75% of its maximum borrowing capacity upon delivery of acceptable collateral to the FHLB.
28
Aggregate Contractual Obligations
The following table represents our on-and-off balance sheet aggregate contractual obligations to make future payments as of December 31, 2010:
TABLE 15
December 31, 2010 | |||||||||||||||||||
(in thousands) | Less than 1 Year | 1 to 3 Years | 3 to 5 Years | Over 5 Years | Total | ||||||||||||||
Time deposits | $ | 189,303 | $ | 59,299 | $ | 22,051 | $ | — | $ | 270,653 | |||||||||
Long-term debt | — | — | — | 29,400 | 29,400 | ||||||||||||||
Fiserv obligation | 7,032 | 15,500 | 17,308 | — | 39,840 | ||||||||||||||
Operating leases | 2,498 | 4,280 | 4,074 | 21,960 | 32,812 | ||||||||||||||
Sponsorship obligation | 338 | 677 | 677 | 1,015 | 2,707 | ||||||||||||||
Total | $ | 199,171 | $ | 79,756 | $ | 44,110 | $ | 52,375 | $ | 375,412 | |||||||||
For further discussion regarding our commitments and contingencies, please see Notes 7 and 18 in the Notes to Consolidated Financial Statements for December 31, 2010, included herein.
Off-Balance Sheet Arrangements
During the conduct of ordinary business operations we routinely enter into contracts for services. These contracts may require payment for services to be provided in the future and may also contain penalty clauses for the early termination of the contract. Management is not aware of any additional commitments or contingent liabilities, which may have a material adverse impact on our liquidity or capital resources.
We are also party to financial instruments with off-balance sheet risk in the normal course of business to meet the financing needs of our customers. These financial instruments include commitments to extend credit and standby letters of credit. See Note 5 in the Notes to the Consolidated Financial Statements for December 31, 2010, included herein, for additional information.
Forward-Looking Statements
This annual report on Form 10-K and the documents incorporated by reference contain forward-looking statements, within the meaning of Section 27A of the Securities Act of 1933, as amended, which we refer to as the Securities Act and Section 21E of the Securities Exchange Act of 1934, which we refer to as the Exchange Act, with respect to the financial condition, liquidity, results of operations, future performance and business of Metro Bancorp, Inc. These forward-looking statements are intended to be covered by the safe harbor for “forward-looking statements” provided by the Private Securities Litigation Reform Act of 1995. Forward-looking statements are those that are not historical facts. These forward-looking statements include statements with respect to our beliefs, plans, objectives, goals, expectations, anticipations, estimates and intentions that are subject to significant risks and uncertainties and are subject to change based on various factors (some of which are beyond our control). The words “may,” “could,” “should,” “would,” “believe,” “anticipate,” “estimate,” “expect,” “intend,” “plan” and similar expressions are intended to identify forward-looking statements.
While we believe our plans, objectives, goals, expectations, anticipations, estimates and intentions as reflected in these forward-looking statements are reasonable, we can give no assurance that any of them will be achieved. You should understand that various factors, in addition to those discussed elsewhere in this annual report on Form 10-K and incorporated by reference in this annual report on Form 10-K, could affect our future results and could cause results to differ materially from those expressed in these forward-looking statements, including:
• | the effects of and changes in trade, monetary and fiscal policies, including interest rate policies of the Board of Governors of the Federal Reserve System; |
• | the FDIC deposit fund is continually being used due to increased bank failures and existing financial institutions are being assessed higher premiums in order to replenish the fund; |
• | the impact of the recently enacted Dodd-Frank Wall Street Reform and Consumer Protection Act and other changes in financial services' laws and regulations (including laws concerning taxes, banking, securities and insurance); |
• | general economic or business conditions, either nationally, regionally or in the communities in which we do business, may be |
29
less favorable than expected, resulting in, among other things, a deterioration in credit quality and loan performance or a reduced demand for credit;
• | continued levels of loan quality and volume origination; |
• | the adequacy of loan loss reserves; |
• | the willingness of customers to substitute competitors' products and services for our products and services and vice versa, based on price, quality, relationship or otherwise; |
• | unanticipated regulatory or judicial proceedings and liabilities and other costs; |
• | interest rate, market and monetary fluctuations; |
• | the timely development of competitive new products and services by us and the acceptance of such products and services by customers; |
• | changes in consumer spending and saving habits relative to the financial services we provide; |
• | the loss of certain key officers; |
• | continued relationships with major customers; |
• | our ability to continue to grow our business internally and through acquisition and successful integration of new or acquired entities while controlling costs; |
• | compliance with laws and regulatory requirements of federal, state and local agencies; |
• | the ability to hedge certain risks economically; |
• | effect of terrorist attacks and threats of actual war; |
• | deposit flows; |
• | changes in accounting principles, policies and guidelines; |
• | rapidly changing technology; |
• | compliance with the April 29, 2010 consent order may result in continued increased noninterest expenses; |
• | other economic, competitive, governmental, regulatory and technological factors affecting the Company's operations, pricing, products and services; and |
• | our success at managing the risks involved in the foregoing. |
Because such forward-looking statements are subject to risks and uncertainties, actual results may differ materially from those expressed or implied by such statements. The foregoing list of important factors is not exclusive and you are cautioned not to place undue reliance on these factors or any of our forward-looking statements, which speak only as of the date of this document or, in the case of documents incorporated by reference, the dates of those documents. We do not undertake to update any forward-looking statements, whether written or oral, that may be made from time to time by or on behalf of us except as required by applicable law.
The Company may, from time to time, make written or oral “forward-looking statements”, including statements contained in the Company's filings with the SEC (including the annual report on Form 10-K and the exhibits thereto), in its reports to stockholders and in other communications by the Company, which are made in good faith by the Company pursuant to the “safe harbor” provisions of the Private Securities Litigation Reform Act of 1995.
Impact of Inflation and Changing Prices
Interest rates have a more significant impact on our performance than do the effects of general levels of inflation, since most of our assets and liabilities are monetary in nature. Interest rates do not necessarily move in the same direction or in the same magnitude as the prices of goods and services as measured by the Consumer Price Index. The liquidity and maturity structure of our assets and liabilities are critical to the maintenance of acceptable performance levels.
Quantitative and Qualitative Disclosures about Market Risk
Our exposure to market risk principally includes interest rate risk, which was previously discussed. Historically, our net interest margin has remained fairly stable. Our net interest margin for the year ended December 31, 2010 was 3.89%, an increase of 9 bps from 3.80% for the year ended December 31, 2009. See the section titled “Net Interest Income and Net Interest Margin” in this Management's
30
Discussion and Analysis for further discussion regarding our net interest margin performance.
Currently, we have 97% of our deposits in accounts which we consider core deposits. These accounts, which have a relatively low interest cost, have historically contributed significantly to our net interest margin.
31
Metro Bancorp, Inc.
Report on Management's Assessment of Internal Control Over
Financial Reporting
Metro Bancorp, Inc. is responsible for the preparation, integrity, and fair presentation of the consolidated financial statements included in this annual report. The consolidated financial statements and notes included in this annual report have been prepared in conformity with United States generally accepted accounting principles and necessarily include some amounts that are based on management's best estimates and judgments.
We, as management of Metro Bancorp, Inc., are responsible for establishing and maintaining effective internal control over financial reporting that is designed to produce reliable financial statements in conformity with United States generally accepted accounting principles. Internal control over financial reporting includes those policies and procedures that pertain to the maintenance of records that in reasonable detail accurately and fairly reflect the transactions and disposition of the assets of the Company; provide reasonable assurance that the transactions are recorded as necessary to permit preparation of financial statement in accordance with generally accepted accounting principles, that receipts and expenditures of the Company are only being made in accordance with authorizations of management and directors of the Company; and provide reasonable assurance regarding prevention or timely detection of unauthorized acquisition, use, or disposition of the Company's assets that could have a material effect on the financial statements. The system of internal control over financial reporting as it relates to the financial statements is evaluated for effectiveness by management and tested for liability through a program of internal audits. Actions are taken to correct potential deficiencies as they are identified.
Any system of internal control, no matter how well designed, has inherent limitations, including the possibility that a control can be circumvented or overridden and misstatements due to error or fraud may occur and not be detected. Also, because of changes in conditions, internal control effectiveness may vary over time. Accordingly, even an effective system of internal control will provide only reasonable assurance with respect to financial statement preparation.
Management assessed the Company's system of internal control over financial reporting as of December 31, 2010, in relation to criteria for effective internal control over financial reporting as described in Internal Control - Integrated Framework, issued by the Committee of Sponsoring Organizations of the Treadway Commission. Based on this assessment, management concludes that, as of December 31, 2010, its system of internal control over financial reporting is effective and meets the criteria of Internal Control - Integrated Framework.
ParenteBeard LLC, an independent registered public accounting firm, has audited the consolidated financial statements of the Company for the year ended December 31, 2010, appearing elsewhere in this annual report, and has issued an audit report on the effectiveness of the Company's internal control over financial reporting as of December 31, 2010, as stated in their report, which is included herein.
/s/ Gary L. Nalbandian | |
Gary L. Nalbandian | |
Chairman, President and Chief Executive Officer | |
(Principal Executive Officer) | |
/s/ Mark A. Zody | |
Mark A. Zody | |
Executive Vice President and Chief Financial Officer | |
(Principal Financial and Accounting Officer) | |
March 16, 2011 |
32

Report of Independent Registered Public Accounting Firm
To the Board of Directors and Stockholders
of Metro Bancorp, Inc.
Harrisburg, Pennsylvania
We have audited Metro Bancorp, Inc.'s (the “Company”) internal control over financial reporting as of December 31, 2010, based on criteria established in Internal Control-Integrated Framework issued by the Committee of Sponsoring Organizations of the Treadway Commission (COSO). Metro Bancorp, Inc.'s management is responsible for maintaining effective internal control over financial reporting, and for its assessment of the effectiveness of internal control over financial reporting, included in the accompanying Report on Management's Assessment of Internal Control over Financial Reporting. Our responsibility is to express an opinion on the Company's internal control over financial reporting based on our audit.
We conducted our audit in accordance with the standards of the Public Company Accounting Oversight Board (United States). Those standards require that we plan and perform the audit to obtain reasonable assurance about whether effective internal control over financial reporting was maintained in all material respects. Our audit of internal control over financial reporting included obtaining an understanding of internal control over financial reporting, assessing the risk that a material weakness exists, and testing and evaluating the design and operating effectiveness of internal control based on the assessed risk. Our audit also included performing such other procedures as we considered necessary in the circumstances. We believe that our audit provides a reasonable basis for our opinion.
A company's internal control over financial reporting is a process designed to provide reasonable assurance regarding the reliability of financial reporting and the preparation of financial statements for external purposes in accordance with accounting principles generally accepted in the United States of America. A company's internal control over financial reporting includes those policies and procedures that (1) pertain to the maintenance of records that, in reasonable detail, accurately and fairly reflect the transactions and dispositions of the assets of the company; (2) provide reasonable assurance that transactions are recorded as necessary to permit preparation of financial statements in accordance with generally accepted accounting principles, and that receipts and expenditures of the company are being made only in accordance with authorizations of management and directors of the company; and (3) provide reasonable assurance regarding prevention or timely detection of unauthorized acquisition, use, or disposition of the company's assets that could have a material effect on the financial statements.
Because of its inherent limitations, internal control over financial reporting may not prevent or detect misstatements. Also, projections of any evaluation of effectiveness to future periods are subject to the risk that controls may become inadequate because of changes in conditions, or that the degree of compliance with the policies or procedures may deteriorate.
In our opinion, Metro Bancorp, Inc. maintained, in all material respects, effective internal control over financial reporting as of December 31, 2010, based on criteria established in Internal Control-Integrated Framework issued by the Committee of Sponsoring Organizations of the Treadway Commission (COSO).
We have also audited, in accordance with the standards of the Public Company Accounting Oversight Board (United States), the consolidated balance sheets of Metro Bancorp, Inc. and subsidiaries as of December 31, 2010 and 2009 and the related consolidated statements of operations, stockholders' equity, and cash flows for each of the years in the three-year period ended December 31, 2010 and our report dated March 16, 2011 expressed an unqualified opinion.

Harrisburg, Pennsylvania
March 16, 2011
33
Report of Independent Registered Public Accounting Firm
To the Board of Directors and Stockholders
of Metro Bancorp, Inc.
Harrisburg, Pennsylvania
We have audited the accompanying consolidated balance sheets of Metro Bancorp, Inc. and subsidiaries (the “Company”) as of December 31, 2010 and 2009, and the related consolidated statements of operations, stockholders' equity, and cash flows for each of the years in the three-year period ended December 31, 2010. Metro Bancorp, Inc.'s management is responsible for these consolidated financial statements. Our responsibility is to express an opinion on these consolidated financial statements based on our audits.
We conducted our audits in accordance with the standards of the Public Company Accounting Oversight Board (United States). Those standards require that we plan and perform the audit to obtain reasonable assurance about whether the consolidated financial statements are free of material misstatement. An audit includes examining, on a test basis, evidence supporting the amounts and disclosures in the consolidated financial statements. An audit also includes assessing the accounting principles used and significant estimates made by management, as well as evaluating the overall financial statement presentation. We believe that our audits provide a reasonable basis for our opinion.
In our opinion, the consolidated financial statements referred to above present fairly, in all material respects, the financial position of Metro Bancorp, Inc. and its subsidiaries as of December 31, 2010 and 2009, and the results of their operations and their cash flows for each of the years in the three-year period ended December 31, 2010, in conformity with accounting principles generally accepted in the United States of America.
We also have audited, in accordance with the standards of the Public Company Accounting Oversight Board (United States), Metro Bancorp, Inc.'s internal control over financial reporting as of December 31, 2010, based on criteria established in Internal Control-Integrated Framework issued by the Committee of Sponsoring Organizations of the Treadway Commission (COSO), and our report dated March 16, 2011 expressed an unqualified opinion.
Harrisburg, Pennsylvania
March 16, 2011
34
Consolidated Balance Sheets
December 31, | |||||||
(in thousands, except share and per share amounts) | 2010 | 2009 | |||||
Assets | |||||||
Cash and cash equivalents | $ | 32,858 | $ | 40,264 | |||
Securities, available for sale at fair value | 438,012 | 388,836 | |||||
Securities, held to maturity at cost (fair value 2010: $224,202; 2009: $119,926) | 227,576 | 117,815 | |||||
Loans, held for sale | 18,605 | 12,712 | |||||
Loans receivable, net of allowance for loan losses (allowance 2010: $21,618; 2009: $14,391) | 1,357,587 | 1,429,392 | |||||
Restricted investments in bank stock | 20,614 | 21,630 | |||||
Premises and equipment, net | 88,162 | 93,780 | |||||
Other assets | 51,058 | 43,330 | |||||
Total assets | $ | 2,234,472 | $ | 2,147,759 | |||
Liabilities and Stockholders' Equity | |||||||
Deposits: | |||||||
Noninterest-bearing | $ | 340,956 | $ | 319,850 | |||
Interest-bearing | 1,491,223 | 1,494,883 | |||||
Total deposits | 1,832,179 | 1,814,733 | |||||
Short-term borrowing and repurchase agreements | 140,475 | 51,075 | |||||
Long-term debt | 29,400 | 54,400 | |||||
Other liabilities | 27,067 | 27,529 | |||||
Total liabilities | 2,029,121 | 1,947,737 | |||||
Stockholders' Equity: | |||||||
Preferred stock - Series A noncumulative; $10.00 par value; | |||||||
1,000,000 shares authorized; 40,000 shares issued and outstanding | 400 | 400 | |||||
Common stock - $1.00 par value; 25,000,000 shares authorized; | |||||||
(issued and outstanding shares 2010: 13,748,384; 2009: 13,448,447) | 13,748 | 13,448 | |||||
Surplus | 151,545 | 147,340 | |||||
Retained earnings | 45,288 | 49,705 | |||||
Accumulated other comprehensive loss | (5,630 | ) | (10,871 | ) | |||
Total stockholders' equity | 205,351 | 200,022 | |||||
Total liabilities and stockholders' equity | $ | 2,234,472 | $ | 2,147,759 | |||
See accompanying notes.
35
Consolidated Statements of Operations
Years Ended December 31, | |||||||||||
(in thousands, except per share amounts) | 2010 | 2009 | 2008 | ||||||||
Interest Income | |||||||||||
Loans receivable, including fees: | |||||||||||
Taxable | $ | 70,423 | $ | 74,113 | $ | 79,247 | |||||
Tax-exempt | 4,521 | 4,345 | 3,427 | ||||||||
Securities: | |||||||||||
Taxable | 22,275 | 19,858 | 28,401 | ||||||||
Tax-exempt | 14 | 65 | 65 | ||||||||
Federal funds sold | 14 | 2 | — | ||||||||
Total interest income | 97,247 | 98,383 | 111,140 | ||||||||
Interest Expense | |||||||||||
Deposits | 13,467 | 17,287 | 22,211 | ||||||||
Short-term borrowings | 317 | 1,038 | 5,349 | ||||||||
Long-term debt | 3,613 | 4,452 | 4,875 | ||||||||
Total interest expense | 17,397 | 22,777 | 32,435 | ||||||||
Net interest income | 79,850 | 75,606 | 78,705 | ||||||||
Provision for loan losses | 21,000 | 12,425 | 7,475 | ||||||||
Net interest income after provision for loan losses | 58,850 | 63,181 | 71,230 | ||||||||
Noninterest Income | |||||||||||
Service charges, fees and other operating income | 26,681 | 24,681 | 24,852 | ||||||||
Gains on sales of loans | 2,434 | 546 | 738 | ||||||||
Total fees and other income | 29,115 | 25,227 | 25,590 | ||||||||
Other-than-temporary impairment losses | (2,005 | ) | (4,793 | ) | — | ||||||
Portion recognized in other comprehensive income (before taxes) | 1,043 | 2,452 | — | ||||||||
Net impairment loss on investment securities | (962 | ) | (2,341 | ) | — | ||||||
Net gains (losses) on sales/call of securities | 2,801 | 1,571 | (157 | ) | |||||||
Debt prepayment charge | (1,574 | ) | — | — | |||||||
Total noninterest income | 29,380 | 24,457 | 25,433 | ||||||||
Noninterest Expenses | |||||||||||
Salaries and employee benefits | 41,494 | 43,426 | 38,085 | ||||||||
Occupancy | 8,429 | 8,166 | 8,087 | ||||||||
Furniture and equipment | 5,134 | 4,766 | 4,307 | ||||||||
Advertising and marketing | 2,967 | 2,751 | 2,747 | ||||||||
Data processing | 13,121 | 9,155 | 7,234 | ||||||||
Postage and supplies | 920 | 2,278 | 1,878 | ||||||||
Regulatory assessments and related fees | 4,598 | 3,992 | 2,834 | ||||||||
Telephone | 3,492 | 4,134 | 2,214 | ||||||||
Loan expense | 1,658 | 1,581 | 864 | ||||||||
Foreclosed real estate | 1,380 | 578 | 363 | ||||||||
Core system conversion/branding (net) | — | 917 | 935 | ||||||||
Merger/acquisition | 17 | 765 | 491 | ||||||||
Consulting fees | 4,508 | 762 | 177 | ||||||||
Other | 9,385 | 8,439 | 7,693 | ||||||||
Total noninterest expenses | 97,103 | 91,710 | 77,909 | ||||||||
Income (loss) before taxes | (8,873 | ) | (4,072 | ) | 18,754 | ||||||
Provision (benefit) for federal income taxes | (4,536 | ) | (2,174 | ) | 5,853 | ||||||
Net income (loss) | $ | (4,337 | ) | $ | (1,898 | ) | $ | 12,901 | |||
Net Income (Loss) per Common Share | |||||||||||
Basic | $ | (0.33 | ) | $ | (0.24 | ) | $ | 2.02 | |||
Diluted | (0.33 | ) | (0.24 | ) | 1.97 | ||||||
Average Common and Common Equivalent Shares Outstanding | |||||||||||
Basic | 13,563 | 8,241 | 6,356 | ||||||||
Diluted | 13,563 | 8,241 | 6,520 | ||||||||
See accompanying notes.
36
Consolidated Statements of Stockholders' Equity
(in thousands, except share amounts) | Preferred Stock | Common Stock | Surplus | Retained Earnings | Accumulated Other Comprehensive (Loss) | Total | |||||||||||||||||
January 1, 2008 | $ | 400 | $ | 6,314 | $ | 70,610 | $ | 38,862 | $ | (3,851 | ) | $ | 112,335 | ||||||||||
Comprehensive loss: | |||||||||||||||||||||||
Net income | — | — | — | 12,901 | — | 12,901 | |||||||||||||||||
Other comprehensive loss, net of tax impact | — | — | — | — | (13,429 | ) | (13,429 | ) | |||||||||||||||
Total comprehensive loss | (528 | ) | |||||||||||||||||||||
Dividends declared on preferred stock | — | — | — | (80 | ) | — | (80 | ) | |||||||||||||||
Common stock of 95,386 shares issued under stock option plans, including tax benefit of $102 | — | 95 | 548 | — | — | 643 | |||||||||||||||||
Common stock of 160 shares issued under employee stock purchase plan | — | — | 4 | — | — | 4 | |||||||||||||||||
Proceeds from issuance of 37,212 shares of common stock in connection with dividend reinvestment and stock purchase plan | — | 37 | 917 | — | — | 954 | |||||||||||||||||
Common stock share-based awards | — | — | 1,142 | — | — | 1,142 | |||||||||||||||||
December 31, 2008 | 400 | 6,446 | 73,221 | 51,683 | (17,280 | ) | 114,470 | ||||||||||||||||
Comprehensive income: | |||||||||||||||||||||||
Net loss | — | — | — | (1,898 | ) | — | (1,898 | ) | |||||||||||||||
Other comprehensive income, net of tax impact | — | — | — | — | 6,409 | 6,409 | |||||||||||||||||
Total comprehensive income | 4,511 | ||||||||||||||||||||||
Dividends declared on preferred stock | — | — | — | (80 | ) | — | (80 | ) | |||||||||||||||
Common stock of 48,007 shares issued under stock option plans, including tax benefit of $76 | — | 48 | 661 | — | — | 709 | |||||||||||||||||
Common stock of 400 shares issued under employee stock purchase plan | — | — | 7 | — | — | 7 | |||||||||||||||||
Proceeds from issuance of 78,619 shares of common stock in connection with dividend reinvestment and stock purchase plan | — | 79 | 1,095 | — | — | 1,174 | |||||||||||||||||
Common stock share-based awards | — | — | 1,439 | — | — | 1,439 | |||||||||||||||||
Proceeds from issuance of 6,875,000 shares of common stock in connection with stock offering | — | 6,875 | 70,917 | — | — | 77,792 | |||||||||||||||||
December 31, 2009 | 400 | 13,448 | 147,340 | 49,705 | (10,871 | ) | 200,022 | ||||||||||||||||
Comprehensive income: | |||||||||||||||||||||||
Net loss | — | — | — | (4,337 | ) | — | (4,337 | ) | |||||||||||||||
Other comprehensive income, net of tax impact | — | — | — | — | 5,241 | 5,241 | |||||||||||||||||
Total comprehensive income | 904 | ||||||||||||||||||||||
Dividends declared on preferred stock | — | — | — | (80 | ) | — | (80 | ) | |||||||||||||||
Common stock of 11,378 shares issued under stock option plans, including tax benefit of $25 | — | 12 | 91 | — | — | 103 | |||||||||||||||||
Common stock of 210 shares issued under employee stock purchase plan | — | — | 2 | — | — | 2 | |||||||||||||||||
Proceeds from issuance of 288,349 shares of common stock in connection with dividend reinvestment and stock purchase plan | — | 288 | 2,868 | — | — | 3,156 | |||||||||||||||||
Common stock share-based awards | — | — | 1,244 | — | — | 1,244 | |||||||||||||||||
December 31, 2010 | $ | 400 | $ | 13,748 | $ | 151,545 | $ | 45,288 | $ | (5,630 | ) | $ | 205,351 | ||||||||||
See accompanying notes.
37
Consolidated Statements of Cash Flows
Years Ended December 31, | |||||||||||
(in thousands) | 2010 | 2009 | 2008 | ||||||||
Operating Activities | |||||||||||
Net income (loss) | $ | (4,337 | ) | $ | (1,898 | ) | $ | 12,901 | |||
Adjustments to reconcile net income (loss) to net cash provided by operating activities: | |||||||||||
Provision for loan losses | 21,000 | 12,425 | 7,475 | ||||||||
Provision for depreciation and amortization | 6,142 | 5,517 | 5,007 | ||||||||
Deferred income (benefit) taxes | (4,772 | ) | 1,667 | (2,215 | ) | ||||||
Amortization of securities premiums and accretion of discounts, net | 122 | 416 | 450 | ||||||||
(Gains) losses on sales/calls of securities (net) | (2,801 | ) | (1,571 | ) | 157 | ||||||
Other-than-temporary impairment losses on investment securities | 962 | 2,341 | — | ||||||||
Proceeds from sales and transfers of SBA loans originated for sale | 30,573 | — | — | ||||||||
Proceeds from sales of other loans originated for sale | 65,892 | 152,668 | 60,620 | ||||||||
Loans originated for sale | (98,994 | ) | (123,686 | ) | (86,897 | ) | |||||
Gains on sales of loans originated for sale | (2,434 | ) | (546 | ) | (738 | ) | |||||
Loss on write-down on foreclosed real estate | 860 | 272 | 303 | ||||||||
Net (gains) losses on sales of foreclosed real estate | (51 | ) | 18 | (2 | ) | ||||||
Loss on disposal of equipment | 89 | 839 | — | ||||||||
Stock-based compensation | 1,244 | 1,439 | 1,142 | ||||||||
Amortization of deferred loan origination fees and costs | 1,928 | 2,092 | 1,726 | ||||||||
Debt prepayment charge | 1,574 | — | — | ||||||||
(Increase) decrease in other assets | (6,856 | ) | (8,221 | ) | 1,961 | ||||||
(Decrease) increase in other liabilities | (1,392 | ) | 14,982 | 3,502 | |||||||
Net cash provided by operating activities | 8,749 | 58,754 | 5,392 | ||||||||
Investing Activities | |||||||||||
Securities available for sale: | |||||||||||
Proceeds from principal repayments, calls and maturities | 153,786 | 98,557 | 47,627 | ||||||||
Proceeds from sales/calls | 292,899 | 46,125 | — | ||||||||
Purchases | (485,985 | ) | (183,303 | ) | (23,212 | ) | |||||
Securities held to maturity: | |||||||||||
Proceeds from principal repayments, calls and maturities | 64,481 | 56,485 | 113,348 | ||||||||
Proceeds from sales/calls | 3,327 | 3,404 | 1,840 | ||||||||
Purchases | (177,535 | ) | (25,000 | ) | (10,571 | ) | |||||
Proceeds from sales of loans receivable | — | 5,782 | 1,806 | ||||||||
Proceeds from sales of foreclosed real estate | 3,513 | 2,108 | 304 | ||||||||
Net (increase) decrease in loans receivable | 45,505 | (45,376 | ) | (289,286 | ) | ||||||
Net redemption (purchase) of restricted investments in bank stock | 1,016 | — | (3,396 | ) | |||||||
Proceeds from sale of premises and equipment | 25 | 19 | 175 | ||||||||
Purchases of premises and equipment | (638 | ) | (13,095 | ) | (2,867 | ) | |||||
Net cash used by investing activities | (99,606 | ) | (54,294 | ) | (164,232 | ) | |||||
Financing Activities | |||||||||||
Net increase in demand, interest checking, money market, and savings deposits | 17,505 | 139,620 | 9,247 | ||||||||
Net (decrease) increase in time deposits | (59 | ) | 41,128 | 63,842 | |||||||
Net increase (decrease) in short-term borrowings | 89,400 | (249,050 | ) | 82,790 | |||||||
Repayment of long-term borrowings | (26,574 | ) | (25,000 | ) | — | ||||||
Proceeds from common stock options exercised | 78 | 633 | 541 | ||||||||
Proceeds from dividend reinvestment and common stock purchase plan | 3,156 | 1,174 | 954 | ||||||||
Proceeds from issuance of common stock in connection with stock offering | — | 77,792 | — | ||||||||
Tax benefit on exercise of stock options | 25 | 76 | 102 | ||||||||
Cash dividends on preferred stock | (80 | ) | (80 | ) | (80 | ) | |||||
Net cash provided (used) by financing activities | 83,451 | (13,707 | ) | 157,396 | |||||||
Decrease in cash and cash equivalents | (7,406 | ) | (9,247 | ) | (1,444 | ) | |||||
Cash and cash equivalents at beginning of year | 40,264 | 49,511 | 50,955 | ||||||||
Cash and cash equivalents at year-end | $ | 32,858 | $ | 40,264 | $ | 49,511 | |||||
Supplementary cash flow information: | |||||||||||
Transfer of loans to foreclosed assets | $ | 3,372 | $ | 9,348 | $ | 928 | |||||
See accompanying notes.
38
Notes to Consolidated Financial Statements
1. Summary of Significant Accounting Policies
Nature of Operations and Basis of Presentation
Metro Bancorp, Inc. (the Company) is a Pennsylvania business corporation, which is registered as a bank holding company under the Bank Holding Company Act of 1956, as amended. The Company was incorporated on April 23, 1999 and became an active bank holding company on July 1, 1999 through the acquisition of 100% of the outstanding shares of Commerce Bank/Harrisburg, N.A. The Company is a one-bank holding company head-quartered in Harrisburg, Pennsylvania and provides full banking services through its subsidiary Metro Bank (Metro or the Bank). The Company is subject to regulation of the Federal Reserve Bank (FRB). Metro Bank is the Company's operating entity and is headquartered in Harrisburg, Pennsylvania. The Bank became a state-chartered bank on November 7, 2008, following approval by the Pennsylvania Department of Banking of the Bank's application to convert from a national bank charter to a state bank charter. As a Pennsylvania state-chartered bank, Metro is supervised jointly by the Pennsylvania Department of Banking and the Federal Deposit Insurance Corporation (FDIC). The Bank is a financial services retailer with 33 stores in the counties of Berks, Cumberland, Dauphin, Lancaster, Lebanon and York, Pennsylvania.
Pursuant to a Transition Agreement with TD Bank, N.A. (TD) and Commerce Bancorp LLC (formerly Commerce Bancorp, Inc.), which terminated the Network Agreement and Master Services Agreement with Commerce Bank N.A. (now known as TD Bank, N.A.), the Company had a non-exclusive royalty-free license to continue using the name “Commerce Bank” and, subject to certain limitations, the red “C” logo, within its primary service area. Effective June 15, 2009, the Company amended its articles of incorporation to change its name from Pennsylvania Commerce Bancorp, Inc. to Metro Bancorp, Inc. and on July 21, 2009 the Bank changed its name from Commerce Bank/Harrisburg, N.A. to Metro Bank. During the third quarter of 2009, the Company completed the rebranding of all of its banking offices. The Company entered into a master agreement with Fiserv Solutions, Inc. (Fiserv), to provide many of the administrative and data processing services that were provided by TD. The conversion to Fiserv's system was completed in 2009.
The consolidated financial statements presented include the accounts of Metro Bancorp, Inc. and its wholly-owned subsidiary Metro Bank. All material intercompany transactions have been eliminated. Events occurring subsequent to the date of the balance sheet have been evaluated for potential recognition or disclosure in the consolidated financial statements. See Note 23 for additional information.
Estimates
The financial statements are prepared in conformity with generally accepted accounting principles (GAAP). GAAP requires management to make estimates and assumptions that affect reported amounts of assets and liabilities and require disclosure of contingent assets and liabilities. In the opinion of management, all adjustments considered necessary for fair presentation have been included and are of a normal, recurring nature. Actual results could differ from these estimates. Material estimates that are particularly susceptible to significant change in the near term relate to the determination of the allowance for loan losses, impaired loans, the valuation of securities available for sale, the determination of other-than-temporary impairment (OTTI) on the Company's investment securities portfolio and fair value measurements.
Significant Group Concentrations of Credit Risk
Most of the Company's activities are with customers located within the South Central Pennsylvania Region. Note 3 discusses the types of securities that the Company invests in. Notes 4 and 6 discuss the types of lending that the Company engages in as well as loan concentrations. The Company does not have any significant concentrations to any one customer.
Securities
Securities classified as held to maturity are those debt securities that the Company has both the intent and ability to hold to maturity regardless of changes in market conditions, liquidity needs, or general economic conditions. These securities are carried at cost adjusted for amortization of premium and accretion of discount, computed by the interest method over the estimated average life of the securities.
Securities classified as available for sale are those debt securities that the Company intends to hold for an indefinite period of time, but not necessarily to maturity. Any decision to sell a security classified as available for sale would be based on various factors, including significant movements in interest rates, changes in the maturity mix of the Company's assets and liabilities, liquidity needs, regulatory capital considerations and other similar factors. Securities available for sale are carried at fair value. Unrealized gains or losses are reported in other comprehensive income, net of the related deferred tax effect. Realized gains or losses, determined on the basis of the cost of the specific securities sold, are included in earnings. Premiums and discounts are recognized in interest income using the interest method over the estimated average life of the securities. Management determines the appropriate classification of debt securities at the time of
39
purchase and reevaluates such designation as of each balance sheet date.
Prior to April 1, 2009, unrealized losses that were determined to be temporary were recorded, net of tax, in other comprehensive income for available-for-sale (AFS) securities, whereas unrealized losses related to held to maturity (HTM) securities determined to be temporary were not recognized. Declines in the fair value of HTM and AFS securities below their cost that were deemed to be other-than-temporary were reflected in earnings as realized losses. In estimating OTTI losses, management considered (1) adverse changes in the general market condition of the industry in which the investment is related, (2) the financial condition and near-term prospects of the issuer, (3) the seniority of the tranche owned by the Company in relation to the entire bond issue, (4) current prepayment behavior, (5) current credit agency ratings, (6) the credit support available in the bond structure to absorb losses and (7) each of the following with respect to the underlying collateral: (a) delinquency percentages and trends, (b) weighted average loan-to-value ratios, (c) weighted average Financing Corporation (FICO) scores and (d) the level of foreclosure and other real estate owned (OREO) activity. Also considered was the intent and ability of the Company to retain its investment in the issuer for a period of time sufficient to allow for any anticipated recovery in fair value.
During the second quarter of 2009 the Company adopted fair value measurement guidance that clarifies the interaction of the factors that should be considered when determining whether a debt security is other-than-temporarily impaired. For debt securities, management must assess whether we have the intent to sell the security or it is more likely than not that we will be required to sell the security prior to its anticipated recovery. Previously, this assessment required management to assert we had both the intent and the ability to hold a security for a period of time sufficient to allow for an anticipated recovery in fair value to avoid recognizing an OTTI. This change does not affect the need to forecast recovery of the value of the security through either cash flows or market price.
In instances when a determination is made that an OTTI exists but we do not intend to sell the debt security and it is not likely that we will be required to sell the debt security prior to its anticipated recovery, the OTTI is separated into (a) the amount of the total OTTI related to a decrease in cash flows expected to be collected from the debt security (the credit loss) and (b) the amount related to all other factors. The amount of the OTTI related to the credit loss is recognized in earnings and the amount of the OTTI related to all other factors is recognized in other comprehensive income.
Loans Held for Sale
Loans held for sale are comprised of student loans, selected residential loans and small business administration (SBA) loans the Company originates with the intention of selling in the future. Occasionally, loans held for sale also include selected business and industry loans that the Company decides to sell. These loans are carried at the lower of cost or estimated fair value, calculated in the aggregate. Throughout 2010, the Company originated SBA loans with the intent to sell the guaranteed portion of the loan. The Company originated $32.3 million and transferred $28.1 million of SBA loans in 2010. At December 31, 2010 there was a deferred gain of $930,000 which will be recognized in the first quarter of 2011 at the expiration of the 90-day warranty period. Total SBA loan sale gains of $1.5 million were recognized in 2010. Total loans held for sale were $18.6 million and $12.7 million at December 31, 2010 and 2009, respectively. At December 31, 2010, loans held for sale were comprised of $6.0 million of student loans, $5.2 million of SBA loans and $7.4 million of residential mortgages as compared to $6.6 million of student loans and $6.1 million of residential mortgages at December 31, 2009.
Loans Receivable
Loans receivable that management has the intent and ability to hold for the foreseeable future, or until maturity or payoff, are stated at their outstanding unpaid principal balances, net of an allowance for loan losses and any deferred fees and costs. Interest income is accrued on the unpaid principal balance. Loan origination fees and costs are deferred and recognized as an adjustment of the yield (interest income) of the related loans. The Company is generally amortizing these amounts over the contractual life of the loan or to the loan's call date.
A loan is considered past due or delinquent if payment is not received on or before the due date. The accrual of interest is generally discontinued when the contractual payment of principal or interest has become 90 days past due or management has serious doubts about further collectibility of principal or interest, even though the loan is currently performing. A loan may remain on accrual status if it is in the process of collection and is either guaranteed or well secured. When a loan is placed on nonaccrual status, unpaid interest credited to income in the current year is reversed and unpaid interest accrued in prior years is charged against the allowance for loan losses. Interest received on nonaccrual loans generally is either applied against principal or reported as interest income, according to management's judgment as to the collectibility of principal. If a loan is substandard and accruing, interest is recognized as accrued. Generally, loans are restored to accrual status when the obligation is brought current, has performed in accordance with the contractual terms for a reasonable period of time and the ultimate collectibility of the total contractual principal and interest is no longer in doubt.
40
Allowance for Loan Losses
The allowance for loan losses is established through provisions for loan losses charged against income. Loans deemed to be uncollectible are charged against the allowance for loan losses and subsequent recoveries, if any, are credited to the allowance. The evaluation is inherently subjective as it requires estimates that are susceptible to significant revision as more information becomes available. Loans are evaluated for impairment upon the loan being internally risk rated substandard or below.
The allowance consists of specific and general components. The specific component relates to loans that are classified as impaired. For such loans, an allowance is established when the discounted cash flows or net collateral value or observable market price of the impaired loan is lower than the carrying value of that loan. The general component covers non-classified loans and is based on historical loss experience adjusted for qualitative factors. These qualitative factors represent a portion of the allowance established for losses inherent in the loan portfolio, which have not been identified by the quantitative processes. This determination inherently involves a higher degree of subjectivity and considers risk factors that may not have yet manifested themselves in historical loss experience. These factors include:
• | Changes in lending policies and procedures, including changes in underwriting standards; |
• | Changes in levels and trends in collection, charge-off and recovery practices; changes in the volume and severity of past due loans, the volume of nonaccrual loans and the volume and severity of adversely classified or graded loans; |
• | Changes in the nature and volume of the portfolio and the terms of loans; |
• | Changes in the value of underlying collateral for collateral-dependent loans; |
• | Changes in the quality of our loan review system; |
• | Changes in the experience, ability and depth of lending management and other relevant staff; |
• | The existence and effect of any concentrations of credit and changes in the level of such concentrations; and |
• | Changes in international, national, regional and local economic and business conditions and developments that affect the collectibility of the portfolio, including the condition of various market segments and the effect of other external factors such as competition and legal and regulatory requirements on the level of estimated credit losses in our existing portfolio. |
Additionally, the general component is maintained to cover uncertainties that could affect management's estimates of probable losses. This component reflects the margin of imprecision inherent in the underlying assumptions used in the methodologies for estimating losses in the portfolio.
The allowance for loan losses is maintained at a level considered adequate to provide for losses that can be reasonably anticipated. Management's periodic evaluation of the adequacy of the allowance is based on the Company's past loan loss experience, known and inherent risks in the portfolio, adverse situations that may affect the borrower's ability to repay, the estimated value of any underlying collateral, composition of the loan portfolio, current economic conditions and other relevant factors. This evaluation is inherently subjective as it requires material estimates that may be susceptible to change. During the third quarter of 2010, as part of the quantitative analysis of the adequacy of the allowance for loan losses, management adjusted its projection of probable loan losses based upon a much shorter and more recent period of actual historical losses. This was done as a result of the higher level of loan charge-offs experienced by the Company over the past two years compared to previous years. Given the continued state of the economy and its impact on borrowers and on loan collateral values, management feels this is currently a better predictor of probable additional loan losses until such time that the economy, borrower repayment ability and loan collateral values show sustained signs of improvement. The change in this estimate resulted in an additional $3.6 million of provision. The impact to the net loss after taxes was an additional loss of $2.4 million or $0.17 per share.
A loan is considered impaired when, based on current information and events, it is probable that the Company will be unable to collect the scheduled payments of principal or interest when due according to the contractual terms of the loan agreement. Factors considered by management in determining impairment include payment status, collateral value and the probability of collecting scheduled principal and interest payments when due. Loans that experience insignificant payment delays generally are not classified as impaired. Management determines the significance of payment delays on a case-by-case basis, taking into consideration all of the circumstances surrounding the loan and the borrower, including the length of the delay, the reasons for the delay, and the borrower's prior payment record. Impairment is measured on a loan-by-loan basis for commercial loans by either the present value of expected future cash flows discounted at the loan's effective interest rate, the loan's obtainable market price or the fair value of the collateral if the loan is collateral dependent.
All nonaccrual loans, including any non-homogenous portfolio residential mortgages and home equity loans are evaluated individually to determine whether a charge off is necessary due to a collateral deficiency.
41
Restricted Investments in Bank Stock
Restricted investments in bank stock consists of stock of the Federal Home Loan Bank (FHLB) of Pittsburgh and Atlantic Central Bankers Bank (ACBB). Federal law requires a member institution of the FHLB system to hold stock of its district FHLB according to a predetermined formula. At December 31, 2010, the Company held $20.5 million of FHLB stock and $65,000 of ACBB stock. Of this amount, $3.7 million was required for membership, $6.4 million was required to cover the Company's borrowing level on its credit line at the FHLB and the remaining $10.4 million was excess that the FHLB has not repurchased at this time due to a repurchase suspension the FHLB put in place in December of 2008. Approximately $1.1 million of the stock was redeemed in 2010. The stock is carried at cost.
Management evaluates the restricted stock for impairment in accordance with Financial Accounting Standards Board (FASB) guidance on Accounting by Certain Entities (including Entities with Trade Receivables that Lend to or Finance the Activities of Others). Management determines whether this investment is impaired based on an assessment of the ultimate recoverability of the cost rather than by recognizing temporary declines in value. The determination of whether a decline affects the ultimate recoverability of the cost is influenced by criteria such as (1) the significance of the decline in net assets of the FHLB as compared to the capital stock amount for the FHLB and the length of time this situation has persisted, (2) commitments by the FHLB to make payments required by law or regulation and the level of such payments in relation to the operating performance of the FHLB and (3) the impact of legislative and regulatory changes on institutions and, accordingly, on the customer base of the FHLB. Management believes no impairment charge is necessary related to the FHLB restricted stock as of December 31, 2010.
Premises and Equipment
Premises and equipment are carried at cost less accumulated depreciation and amortization. Depreciation is charged to operations over the estimated useful lives of the respective assets. Leasehold improvements are amortized over the terms of the respective leases or the estimated useful lives of the improvements, whichever is shorter. Depreciation and amortization are determined on the straight-line method for financial reporting purposes and accelerated methods for income tax purposes.
Foreclosed Assets
Assets acquired through, or in lieu of, loan foreclosures are held for sale and are initially recorded at fair value less estimated costs to sell the assets at the date of foreclosure, establishing a new cost basis. Subsequent to foreclosure, valuations are periodically performed by management and the assets are carried at the lower of carrying amount or fair value, less estimated costs to sell the asset. Revenue and expenses from operations, changes in the valuation allowance and gains/losses on sales of foreclosed real estate are included in foreclosed real estate expense. Foreclosed assets are included in other assets and totaled $6.8 million as of December 31, 2010 as compared to $7.8 million as of December 31, 2009.
Net expenses associated with foreclosed assets are detailed below:
Years Ended December 31, | |||||||||||
(in thousands) | 2010 | 2009 | 2008 | ||||||||
Operating expenses, net of rental income | $ | 571 | $ | 288 | $ | 62 | |||||
Loss on write-down on foreclosed real estate | 860 | 272 | 303 | ||||||||
Net (gain) loss on sales of real estate | (51 | ) | 18 | (2 | ) | ||||||
Total | $ | 1,380 | $ | 578 | $ | 363 | |||||
Income Taxes
Deferred income taxes are provided on the liability method whereby deferred tax assets are recognized for deductible temporary differences and deferred tax liabilities are recognized for taxable temporary differences. Temporary differences are the differences between the reported amounts of assets and liabilities and their tax bases. Deferred tax assets and liabilities are adjusted through the provision for income taxes for the effects of changes in tax laws and rates on the date of enactment.
Transfers of Financial Assets
Transfers of financial assets, including sales of loans and loan participations, are accounted for as sales when control over the assets has been surrendered. Control over transferred assets is deemed to be surrendered when (1) the assets have been isolated from the Company,
42
(2) the transferee obtains the right (free of conditions that constrain it from taking advantage of that right) to pledge or exchange the transferred assets and (3) the Company does not maintain effective control over the transferred assets through an agreement to repurchase them before their maturity.
Per Share Data
Basic earnings (loss) per share represents income (loss) available to common stockholders divided by the weighted-average number of common shares outstanding during the period. Diluted earnings (loss) per share reflect additional common shares that would have been outstanding if dilutive potential common shares had been issued as well as any adjustments to income (loss) that would result from the assumed issuance. Potential common shares that may be issued by the Company relate solely to outstanding common stock options and are determined using the treasury stock method.
Off-Balance Sheet Financial Instruments
In the ordinary course of business, the Company has entered into off-balance sheet financial instruments consisting of commitments to extend credit, commercial letters of credit and standby letters of credit. Such financial instruments are recorded on the balance sheet when they become payable by the borrower to the Company.
Cash Flow Information
For purposes of the statements of cash flows, the Company considers cash and due from banks, interest-bearing deposits and federal funds sold as cash and cash equivalents. Generally, federal funds, a component of cash and cash equivalents are purchased and sold for one-day periods. Cash paid during the years ended December 31, 2010, 2009 and 2008 for interest expense on deposits, borrowings and debt was $17.6 million, $23.0 million and $32.2 million, respectively. Income taxes paid totaled $0, $1.4 million and $8.0 million in 2010, 2009 and 2008, respectively.
Stock-Based Compensation
The Company recognizes compensation costs related to share-based payment transactions in the income statement (with limited exceptions) based on the grant-date fair value of the stock-based compensation issued. Compensation costs are recognized over the period that an employee provides service in exchange for the award.
The cash flows resulting from the tax benefits due to deductions in excess of the compensation cost recognized for options (excess tax benefits) are classified as financing cash flows.
Advertising Costs
The Company follows the policy of charging the costs of advertising to expense as incurred.
Recent Accounting Standards
In January 2010, the FASB issued additional guidance to improve the disclosures for fair value measurements. The guidance requires new disclosures that report separately the amounts of significant transfers in and out of Level 1 and Level 2 fair value measurements and describe the reasons for the transfers. In the reconciliation for fair value measurements using significant unobservable inputs (Level 3), a reporting entity should present separately information about purchases, sales, issuances and settlements. The guidance also provides clarity to existing disclosures regarding the level of disaggregation and input and valuation techniques. This update, with the exception of the Level 3 requirements, was effective for interim and annual reporting periods beginning after December 15, 2009. The adoption of this guidance has not had a material impact on our consolidated financial statements. The Level 3 requirements have a delayed effective date for interim and annual reporting periods beginning after December 15, 2010. We do not believe the adoption of this guidance will have a material impact on our consolidated financial statements.
In July 2010, the FASB updated guidance to provide greater transparency about an entity's allowance for credit losses and the credit quality of its financing receivables. Entities will be required to provide the following disclosures on a disaggregated basis: 1) the nature of credit risk inherent in the entity's portfolio of financing receivables, 2) how the risk is analyzed and assessed in arriving at the allowance for credit losses and 3) the changes and reasons for those changes in the allowance for credit losses. The disclosures as of the end of a reporting period are effective for interim and annual reporting periods ending on or after December 15, 2010. The adoption of this guidance has not had a material impact on our consolidated financial statements. The disclosures about activity that occurs during a reporting period are effective for interim and annual reporting periods beginning on or after December 15, 2010. We do not believe the adoption of this guidance will have a material impact on our consolidated financial statements.
43
Segment Reporting
Metro acts as an independent community financial services provider and offers traditional banking and related financial services to individual, business and government customers. Through its stores, the Company offers a full array of commercial and retail financial services.
Management does not separately allocate expenses, including the cost of funding loan demand, between the commercial and retail operations of the Company. As such, discrete financial information is not available and segment reporting would not be meaningful.
Reclassifications
Certain amounts in the 2009 and 2008 financial statements have been reclassified to conform to the 2010 presentation format. Such reclassifications had no impact on the Company's net operations and stockholders' equity.
2. Restrictions on Cash and Due from Bank Accounts
The Bank is required to maintain average reserves, in the form of cash and balances with the FRB, against its deposit liabilities. The average amount of these reserve balances maintained for 2010 and 2009 was approximately $15.1 million and $7.8 million, respectively. The Company has no due from balances with institutions in excess of FDIC insurance limitations.
3. Securities
The amortized cost and fair value of securities are summarized in the following tables:
December 31, 2010 | |||||||||||||||
(in thousands) | Amortized Cost | Gross Unrealized Gains | Gross Unrealized Losses | Fair Value | |||||||||||
Available for Sale: | |||||||||||||||
U.S. Government agency securities | $ | 22,500 | $ | — | $ | (1,091 | ) | $ | 21,409 | ||||||
Residential mortgage-backed securities | 2,383 | 3 | — | 2,386 | |||||||||||
Agency collateralized mortgage obligations | 388,414 | 2,025 | (7,225 | ) | 383,214 | ||||||||||
Private-label collateralized mortgage obligations | 33,246 | — | (2,243 | ) | 31,003 | ||||||||||
Total | $ | 446,543 | $ | 2,028 | $ | (10,559 | ) | $ | 438,012 | ||||||
Held to Maturity: | |||||||||||||||
U.S. Government agency securities | $ | 140,000 | $ | — | $ | (6,408 | ) | $ | 133,592 | ||||||
Residential mortgage-backed securities | 48,497 | 2,727 | (311 | ) | 50,913 | ||||||||||
Agency collateralized mortgage obligations | 29,079 | 878 | (209 | ) | 29,748 | ||||||||||
Corporate debt securities | 10,000 | — | (51 | ) | 9,949 | ||||||||||
Total | $ | 227,576 | $ | 3,605 | $ | (6,979 | ) | $ | 224,202 | ||||||
44
December 31, 2009 | ||||||||||||||||
(in thousands) | Amortized Cost | Gross Unrealized Gains | Gross Unrealized Losses | Fair Value | ||||||||||||
Available for Sale: | ||||||||||||||||
U.S. Government agency securities | $ | 55,004 | $ | 69 | $ | (315 | ) | $ | 54,758 | |||||||
Residential mortgage-backed securities | 80,916 | 1,419 | (1,748 | ) | 80,587 | |||||||||||
Agency collateralized mortgage obligations | 149,233 | 1,694 | (799 | ) | 150,128 | |||||||||||
Private-label collateralized mortgage obligations | 120,407 | — | (17,044 | ) | 103,363 | |||||||||||
Total | $ | 405,560 | $ | 3,182 | $ | (19,906 | ) | $ | 388,836 | |||||||
Held to Maturity: | ||||||||||||||||
U.S. Government agency securities | $ | 25,000 | $ | — | $ | (458 | ) | $ | 24,542 | |||||||
Residential mortgage-backed securities | 54,822 | 2,287 | — | 57,109 | ||||||||||||
Agency collateralized mortgage obligations | 30,362 | 844 | — | 31,206 | ||||||||||||
Private-label collateralized mortgage obligations | 4,010 | — | (602 | ) | 3,408 | |||||||||||
Corporate debt securities | 1,997 | 37 | — | 2,034 | ||||||||||||
Municipal securities | 1,624 | 3 | 3 | — | 1,627 | |||||||||||
Total | $ | 117,815 | $ | 3,171 | $ | (1,060 | ) | $ | 119,926 | |||||||
The amortized cost and fair value of debt securities by contractual maturity at December 31, 2010 are shown in the following table. Expected maturities will differ from contractual maturities because borrowers may have the right to call or prepay obligations.
Available for Sale | Held to Maturity | ||||||||||||||
(in thousands) | Amortized Cost | Fair Value | Amortized Cost | Fair Value | |||||||||||
Due in one year or less | $ | — | $ | — | $ | — | $ | — | |||||||
Due after one year through five years | — | — | 10,000 | 9,949 | |||||||||||
Due after five years through ten years | — | — | 50,000 | 48,592 | |||||||||||
Due after ten years | 22,500 | 21,409 | 90,000 | 85,000 | |||||||||||
22,500 | 21,409 | 150,000 | 143,541 | ||||||||||||
Residential mortgage-backed securities | 2,383 | 2,386 | 48,497 | 50,913 | |||||||||||
Agency collateralized mortgage obligations | 388,414 | 383,214 | 29,079 | 29,748 | |||||||||||
Private-label collateralized mortgage obligations | 33,246 | 31,003 | — | — | |||||||||||
Total | $ | 446,543 | $ | 438,012 | $ | 227,576 | $ | 224,202 | |||||||
During 2010, the Company sold a total of 56 securities with a combined fair market value of $296.2 million and realized a net pretax gain of $2.8 million. The securities sold included 23 private-label collateralized mortgage obligations (CMOs) with a combined fair market value of $62.6 million; 13 agency CMOs with a fair market value of $138.1 million; 18 residential mortgage-backed securities (MBSs) with a combined fair market value of $74.5 million and two agency debentures with a combined fair market value of $21.0 million. Of this total, 53 securities with a combined fair market value of $292.9 million had been classified as available for sale. Two agency mortgage-backed securities with a combined fair market value of $440,000 had been classified as held to maturity, however, their current par value had fallen to less than 15% of their original par value and could be sold without tainting the remaining HTM portfolio. One private-label CMO with a fair market value of $2.9 million had been classified as held to maturity. Previously, the Company had recognized an OTTI charge due to a projected credit loss of $3,000 and this deterioration in creditworthiness was the basis for selling the security without tainting the remaining HTM portfolio. The Company uses the specific identification method to record security sales. Also during 2010, the Company had ten agency debentures and four municipal bonds called at par. The bonds had a combined market value of $106.6 million.
In 2009, the Company sold a total of 65 MBSs with a combined fair market value of $49.5 million. Of this total, 42 securities had been classified as available for sale with a combined carrying value of $44.7 million. The Company realized proceeds of $46.1 million for net pretax gains of $1.4 million. The securities sold also included 23 MBSs with a combined fair market value of $3.4 million and a
45
carrying value of $3.2 million that had been classified as held to maturity and were sold due to their small remaining size. In every case, the current face had fallen below 15% of the original purchase amount. A pretax gain of $170,000 was recognized on the sale of securities classified as held to maturity. Also during 2009, the Company had a total of $41.5 million of agency debentures called, at par, by their issuing agencies. Of this total, $5.0 million were classified as available for sale and $36.5 million were classified as held to maturity. All of the securities were carried at par.
There were no sales of securities in the AFS portfolio in 2008. There was one sale in the HTM portfolio during the second quarter of 2008. The Company sold a $2.0 million corporate debt security due to significant deterioration in the creditworthiness of the issuer. A pretax loss of $157,000 was recognized on this sale during the second quarter of 2008.
At December 31, 2010 and 2009, securities with a carrying value of $437.6 million and $417.8 million, respectively, were pledged to secure public deposits and for other purposes as required or permitted by law.
The following table summarizes the Company's gains and losses on the sales or calls of debt securities and losses recognized for the OTTI of investments:
(in thousands) | Gross Realized Gains | Gross Realized (Losses) | OTTI Credit Losses | Net Gains (Losses) | |||||||||||
Years Ended: | |||||||||||||||
December 31, 2010 | $ | 6,690 | $ | (3,889 | ) | $ | (962 | ) | $ | 1,839 | |||||
December 31, 2009 | 1,581 | (10 | ) | (2,341 | ) | (770 | ) | ||||||||
December 31, 2008 | — | (157 | ) | — | (157 | ) | |||||||||
In determining fair market values for its portfolio holdings, the Company has consistently relied upon a third-party provider. Under the current guidance, these values are considered Level 2 inputs, based upon matrix pricing and observed data from similar assets. They are not Level 1 direct quotes, nor do they reflect Level 3 inputs that would be derived from internal analysis or judgment. As the Company does not manage a trading portfolio and typically only sells from its AFS portfolio in order to manage interest rate risk or credit exposure, direct quotes, or street bids, are warranted on an as-needed basis only.
The unrealized losses in the Company's investment portfolio at December 31, 2010 were associated with two distinct types of securities. The first type, those backed by the U.S. Government or one of its agencies, includes nine agency debentures, three residential mortgage-backed securities and 25 government agency sponsored CMOs. Management believes that the unrealized losses on these investments were primarily caused by the sharp rise in mid-term to long-term interest rates that occurred at the end of 2010 and notes the contractual cash flows of those investments are guaranteed by an agency of the U.S. Government. Accordingly, it is expected that the securities would not be settled at a price less than the amortized cost of the Company's investment. The Company also owns one investment-grade corporate bond that was in a loss position as of December 31, 2010. Due to its structure and credit rating, the Company does not anticipate incurring any credit-related losses on this bond. Because management believes the decline in fair value is attributable to changes in interest rates and not credit quality and because the Company has the ability and intent to hold those investments until a recovery of fair value, which may be maturity, the Company does not consider any of these investments to be other-than-temporarily impaired at December 31, 2010.
The following table shows the fair value and gross unrealized losses associated with the Company's investment portfolio, aggregated by investment category and length of time that individual securities have been in a continuous unrealized loss position:
46
December 31, 2010 | |||||||||||||||||||||||
Less than 12 months | 12 months or more | Total | |||||||||||||||||||||
(in thousands) | Fair Value | Unrealized (Losses) | Fair Value | Unrealized (Losses) | Fair Value | Unrealized (Losses) | |||||||||||||||||
Available for Sale: | |||||||||||||||||||||||
U.S. Government agency securities | $ | 21,409 | $ | (1,091 | ) | $ | — | $ | — | $ | 21,409 | $ | (1,091 | ) | |||||||||
Agency CMOs | 261,330 | (7,216 | ) | 9,092 | (9 | ) | 270,422 | (7,225 | ) | ||||||||||||||
Private-label CMOs | 2,644 | (9 | ) | 28,359 | (2,234 | ) | 31,003 | (2,243 | ) | ||||||||||||||
Total | $ | 285,383 | $ | (8,316 | ) | $ | 37,451 | $ | (2,243 | ) | $ | 322,834 | $ | (10,559 | ) | ||||||||
Held to Maturity: | |||||||||||||||||||||||
U.S. Government agency securities | $ | 133,592 | $ | (6,408 | ) | $ | — | $ | — | $ | 133,592 | $ | (6,408 | ) | |||||||||
Residential MBSs | 7,287 | (311 | ) | — | — | 7,287 | (311 | ) | |||||||||||||||
Agency CMOs | 7,957 | (209 | ) | — | — | 7,957 | (209 | ) | |||||||||||||||
Corporate debt securities | 9,949 | (51 | ) | — | — | 9,949 | (51 | ) | |||||||||||||||
Total | $ | 158,785 | $ | (6,979 | ) | $ | — | $ | — | $ | 158,785 | $ | (6,979 | ) | |||||||||
December 31, 2009 | |||||||||||||||||||||||
Less than 12 months | 12 months or more | Total | |||||||||||||||||||||
(in thousands) | Fair Value | Unrealized (Losses) | Fair Value | Unrealized (Losses) | Fair Value | Unrealized (Losses) | |||||||||||||||||
Available for Sale: | |||||||||||||||||||||||
U.S. Government agency securities | $ | 29,685 | $ | (315 | ) | $ | — | $ | — | $ | 29,685 | $ | (315 | ) | |||||||||
Residential MBSs | 47,654 | (1,748 | ) | — | — | 47,654 | (1,748 | ) | |||||||||||||||
Agency CMOs | 43,641 | (352 | ) | 45,057 | (447 | ) | 88,698 | (799 | ) | ||||||||||||||
Private-label CMOs | 8,233 | (652 | ) | 95,130 | (16,392 | ) | 103,363 | (17,044 | ) | ||||||||||||||
Total | $ | 129,213 | $ | (3,067 | ) | $ | 140,187 | $ | (16,839 | ) | $ | 269,400 | $ | (19,906 | ) | ||||||||
Held to Maturity: | |||||||||||||||||||||||
U.S. Government agency securities | $ | 24,542 | $ | (458 | ) | $ | — | $ | — | $ | 24,542 | $ | (458 | ) | |||||||||
Private-label CMOs | — | — | 3,408 | (602 | ) | 3,408 | (602 | ) | |||||||||||||||
Total | $ | 24,542 | $ | (458 | ) | $ | 3,408 | $ | (602 | ) | $ | 27,950 | $ | (1,060 | ) | ||||||||
The Company's investment securities portfolio consists primarily of U.S. Government agency securities, U.S. Government sponsored agency mortgage-backed obligations and private-label CMOs. The securities of the U.S. Government sponsored agencies and the U.S. Government MBSs have little credit risk because their principal and interest payments are backed by an agency of the U.S. Government.
The second type of security in the Company's investment portfolio with unrealized losses at December 31, 2010 was private-label CMOs. Private-label CMOs are not backed by the full faith and credit of the U.S. Government nor are their principal and interest payments guaranteed. Historically, most private-label CMOs have carried a AAA bond rating on the underlying issuer, however, the subprime mortgage problems and decline in the residential housing market in the U.S. in recent years have led to ratings downgrades and subsequent OTTI of many CMOs. As of December 31, 2010, Metro owned eight such non-agency CMO securities in its investment portfolio with a total book value of $33.2 million. Management performs no less than quarterly assessments of these securities for OTTI and to determine what, if any, portion of the impairment may be credit related. As part of this process, management asserts that (a) we do not have the intent to sell the securities and (b) it is more likely than not we will not be required to sell the securities before recovery of the Company's cost basis. This assertion is based, in part, upon the most recent liquidity analysis prepared for the Company's Asset/Liability Committee (ALCO) which indicates if the Company has sufficient excess funds to consider the potential purchase of investment securities and sufficient unused borrowing capacity available to meet any potential outflows. Furthermore, the Company knows of no contractual or regulatory obligations that would require these bonds to be sold.
Next, in order to bifurcate the impairment into its components, the Company uses the Bloomberg analytical service to analyze each individual security. The Company looks at the overall bond ratings as well as specific, underlying characteristics such as pool factor,
47
weighted average coupon, weighted average maturity, weighted average life, loan to value, delinquencies, credit score, prepayment speeds, geographic concentration, etc. Using reported data for prepayment speeds, default rates, loss severity rates and lag times, the Company analyzes each bond under a variety of scenarios. As the results may vary depending upon the historic time period analyzed, the Company uses this information for the purpose of managing the investment portfolio and its inherent risk. However, the Company reports it findings based upon the three month data points for Constant Prepayment Rate (CPR) speed, default rate and loss severity as it believes this time point best captures both current and historic trends. For management purposes, the Company also analyzes each bond using an assumed, projected default rate based upon each pool's most recent level of 90-day delinquencies, bankruptcies and foreclosed real estate. This projected analysis also assumes loss severity percentages subjectively assigned to each pool based upon credit ratings.
When the analysis shows a bond to have no projected loss, there is considered to be no credit-related loss. When the analysis shows a bond to have a projected loss, a cash flow projection is created, including the projected loss, for the duration of the bond. This projection is then used to calculate the present value of the cash flows expected to be collected and compared to the amortized cost basis. The difference between these two figures is recognized as the amount of other-than-temporary impairment due to credit loss. The difference between the total impairment and this credit loss portion is determined to be the amount related to all other factors. The amount of impairment related to credit loss is to be recognized in current earnings while the amount of impairment related to all other factors is to be recognized in other comprehensive income.
Using this method, the Company determined that during 2010, a total of ten private-label CMOs had losses attributable to credit. This was due to a number of factors including the bonds' credit ratings and rising trends for delinquencies, bankruptcies and foreclosures on the underlying collateral. Three of the bonds subsequently had their fair market value recover to their carrying value and were sold with no loss. One bond was sold before recovering its carrying value due to deteriorating creditworthiness and the potential for even greater loss. Of the remaining six bonds, three no longer indicated a loss position due to credit as of December 31, 2010. Credit losses were projected for the remaining three bonds as of December 31, 2010, however, the present value of the cash flows for these bonds was greater than the carrying value and no further write-downs were required. In total, for the year ended December 31, 2010, the Company recognized $962,000 of losses on private-label CMOs related to credit issues and did not recapture any of the previous write-downs.
The tables below roll forward the cumulative life to date credit losses which have been recognized in earnings for the private-label CMOs previously mentioned for the years ended December 31, 2010 and 2009, respectively:
Private-label CMOs | |||||||||||
(in thousands) | Available for Sale | Held to Maturity | Total | ||||||||
Cumulative OTTI credit losses at January 1, 2010 | $ | 2,338 | $ | 3 | $ | 2,341 | |||||
Additions for which OTTI was not previously recognized | 675 | — | 675 | ||||||||
Additional increases for OTTI previously recognized when there is no intent to sell and no requirement to sell before recovery of amortized cost basis | 287 | — | 287 | ||||||||
Reduction due to credit impaired security sold | (675 | ) | (3 | ) | (678 | ) | |||||
Cumulative OTTI credit losses recognized for securities still held at December 31, 2010 | $ | 2,625 | $ | — | $ | 2,625 | |||||
Private-label CMOs | |||||||||||
(in thousands) | Available for Sale | Held to Maturity | Total | ||||||||
Cumulative OTTI credit losses at January 1, 2009 | $ | — | $ | — | $ | — | |||||
Additions for which OTTI was not previously recognized | 2,338 | 3 | 2,341 | ||||||||
Cumulative OTTI credit losses recognized for securities still held at December 31, 2009 | $ | 2,338 | $ | 3 | $ | 2,341 | |||||
48
4. Loans Receivable and Allowance for Loan Losses
A summary of loans receivable is as follows:
December 31, | |||||||
(in thousands) | 2010 | 2009 | |||||
Commercial and industrial | $ | 348,036 | $ | 405,211 | |||
Commercial tax-exempt | 89,401 | 108,861 | |||||
Owner occupied real estate | 241,537 | 263,413 | |||||
Commercial construction and land development | 112,094 | 115,013 | |||||
Commercial real estate | 299,034 | 255,560 | |||||
Residential | 81,124 | 85,035 | |||||
Consumer | 207,979 | 210,690 | |||||
1,379,205 | 1,443,783 | ||||||
Less: allowance for loan losses | 21,618 | 14,391 | |||||
Net loans receivable | $ | 1,357,587 | $ | 1,429,392 | |||
Certain directors and executive officers of the Company, including their associates and companies, have loans with the Bank. Such loans were made in the ordinary course of business at the Bank's normal credit terms including interest rates and collateralization, as those prevailing at the time for comparable loans with persons not related to the lender, and do not represent more than a normal risk of collection. Total loans to these persons and companies amounted to approximately $12.0 million and $15.7 million at December 31, 2010 and 2009, respectively. During 2010, $1.9 million of new advances were made and repayments totaled $5.6 million.
The following table summarizes nonperforming loans by loan type at December 31, 2010 and 2009:
December 31, | |||||||
(in thousands) | 2010 | 2009 | |||||
Nonaccrual loans: | |||||||
Commercial and industrial | $ | 23,103 | $ | 14,254 | |||
Commercial tax-exempt | — | — | |||||
Owner occupied real estate | 4,318 | 3,201 | |||||
Commercial construction and land development | 14,155 | 11,771 | |||||
Commercial real estate | 5,424 | 5,497 | |||||
Residential | 3,609 | 2,368 | |||||
Consumer | 1,579 | 654 | |||||
Total nonaccrual loans | 52,188 | 37,745 | |||||
Loans past due 90 days or more and still accruing | 650 | — | |||||
Renegotiated loan | 177 | — | |||||
Total nonperforming loans | $ | 53,015 | $ | 37,745 | |||
No additional funds were committed on nonaccrual and renegotiated loans. Generally commitments are canceled and no additional advances are made when a loan is placed on nonaccrual. Included in nonaccrual loans are 2 relationships which a partial charge-off was made and the terms were modified.
Generally, the Company's policy is to move a loan to nonaccrual status as soon as it becomes 90 days past due. Once a loan is on nonaccrual it is not returned back to accrual status unless the loan has been current for at least six consecutive months and the borrower and/or any guarantors demonstrate evidence of the ability to pay. Under certain circumstances such as bankruptcy, if a loan is under collateralized, or if the borrower and/or guarantors do not show evidence of the ability to pay, the loan may be placed on nonaccrual even though not past due by 90 days or greater. Therefore our nonaccrual loan balance of $52.2 million above exceeds the balance of loans that are 90 days past due and greater presented below.
49
The following table is an age analysis of past due loan receivables as of December 31, 2010:
(in thousands) | 30-59 Days Past Due | 60-89 Days Past Due | 90 Days Past Due and Greater | Total Past Due | Current | Total Loan Receivables | Recorded Investment in Loans 90 Days and Greater and Still Accruing | ||||||||||||||
Commercial and industrial | $ | 1,213 | $ | 521 | $ | 18,914 | $ | 20,648 | $ | 327,388 | $ | 348,036 | $ | 23 | |||||||
Commercial tax-exempt | — | — | — | — | 89,401 | 89,401 | — | ||||||||||||||
Owner occupied real estate | 1,314 | 258 | 4,243 | 5,815 | 235,722 | 241,537 | — | ||||||||||||||
Commercial construction and land development | — | — | 14,155 | 14,155 | 97,939 | 112,094 | — | ||||||||||||||
Commercial real estate | 1,214 | 77 | 5,871 | 7,162 | 291,872 | 299,034 | 624 | ||||||||||||||
Residential | 3,724 | 1,606 | 2,124 | 7,454 | 73,670 | 81,124 | — | ||||||||||||||
Consumer | 2,547 | 903 | 1,294 | 4,744 | 203,235 | 207,979 | 3 | ||||||||||||||
Total | $ | 10,012 | $ | 3,365 | $ | 46,601 | $ | 59,978 | $ | 1,319,227 | $ | 1,379,205 | $ | 650 | |||||||
A summary of the allowance for loan losses by loan class and by impairment method as of December 31, 2010 and 2009 is as follows:
(in thousands) | Comm. and industrial | Comm. tax-exempt | Owner occupied real estate | Comm. construction and land development | Comm. real estate | Residential | Consumer | Unallocated | Total | ||||||||||||||||||
2010 | |||||||||||||||||||||||||||
Quantitative Analysis: | |||||||||||||||||||||||||||
Individually evaluated for impairment | $ | 2,055 | $ | — | $ | 260 | $ | 1,310 | $ | — | $ | — | $ | — | $ | — | $ | 3,625 | |||||||||
Collectively evaluated for impairment | 3,904 | — | 302 | 2,475 | 2,667 | 248 | 289 | — | 9,885 | ||||||||||||||||||
Qualitative analysis: | 3,889 | 89 | 348 | 1,635 | 1,384 | 194 | 413 | — | 7,952 | ||||||||||||||||||
Unallocated | — | — | — | — | — | — | — | 156 | 156 | ||||||||||||||||||
Total allowance for loan losses | $ | 9,848 | $ | 89 | $ | 910 | $ | 5,420 | $ | 4,051 | $ | 442 | $ | 702 | $ | 156 | $ | 21,618 | |||||||||
2009 | |||||||||||||||||||||||||||
Quantitative Analysis: | |||||||||||||||||||||||||||
Individually evaluated for impairment | $ | 900 | $ | — | $ | — | $ | — | $ | — | $ | — | $ | — | $ | — | $ | 900 | |||||||||
Collectively evaluated for impairment | 1,146 | 352 | 259 | 88 | 240 | 66 | 58 | — | 2,209 | ||||||||||||||||||
Qualitative analysis: | 2,997 | 984 | 2,160 | 826 | 2,009 | 672 | 1,629 | — | 11,277 | ||||||||||||||||||
Unallocated | — | — | — | — | — | — | — | 5 | 5 | ||||||||||||||||||
Total allowance for loan losses | $ | 5,043 | $ | 1,336 | $ | 2,419 | $ | 914 | $ | 2,249 | $ | 738 | $ | 1,687 | $ | 5 | $ | 14,391 | |||||||||
Generally, construction and land development and commercial real estate loans present a greater risk of non-payment by a borrower than other types of loans. The market value of real estate, particularly real estate held for investment, can fluctuate significantly in a relatively short period of time. Commercial and industrial, tax exempt and owner occupied real estate loans carry a lower risk factor because the repayment of these loans relies primarily on the cash flow from a business, a municipality, or a school district.
50
Consumer loans collections are dependent on the borrower's continued financial stability and thus are more likely to be affected by adverse personal circumstances. Residential loans also are impacted by the market value of real estate. Furthermore, the application of various federal and state laws, including bankruptcy and insolvency laws, may limit the amount that can be recovered on these loans.
The risk of non-payment is affected by changes in economic conditions, the credit risks of a particular borrower, the duration of the loan and in the case of a collateralized loan, uncertainties as to the future value of the collateral and other factors.
During the third quarter of 2010, as part of the quantitative analysis of the adequacy of the allowance for loan losses, management adjusted its projection of probable loan losses based upon a much shorter and more recent period of actual historical losses. This was done as a result of the much higher level of loan charge-offs experienced by the Company over the past two years compared to previous years. Given the continued state of the economy and its impact on borrowers and on loan collateral values, management feels this is currently a better predictor of probable additional loan losses until such time that the economy, borrower repayment ability and loan collateral values show sustained signs of improvement. The change in this estimate resulted in an additional $3.6 million of provision. The impact to the net loss after taxes was an additional loss of $2.4 million or $0.17 per share.
The following is a summary of the transactions in the allowance for loan losses:
Years Ended December 31, | |||||||||||
(in thousands) | 2010 | 2009 | 2008 | ||||||||
Balance at beginning of year | $ | 14,391 | $ | 16,719 | $ | 10,742 | |||||
Provision charged to expense | 21,000 | 12,425 | 7,475 | ||||||||
Recoveries | 522 | 308 | 170 | ||||||||
Loans charged off | (14,295 | ) | (15,061 | ) | (1,668 | ) | |||||
Balance at end of year | $ | 21,618 | $ | 14,391 | $ | 16,719 | |||||
51
The followings tables present additional information regarding the Company's impaired loans:
December 31, 2010 | |||||||||||
(in thousands) | Recorded Investment | Unpaid Principal Balance | Related Allowance | ||||||||
Loans with no related allowance: | |||||||||||
Commercial and industrial | $ | 21,630 | $ | 24,817 | $ | — | |||||
Commercial tax-exempt | — | — | — | ||||||||
Owner occupied real estate | 8,483 | 8,758 | — | ||||||||
Commercial construction and land development | 16,401 | 17,173 | — | ||||||||
Commercial real estate | 6,045 | 6,853 | — | ||||||||
Residential | 3,609 | 3,609 | — | ||||||||
Consumer | 1,579 | 1,579 | — | ||||||||
Total impaired loans with no related allowance | 57,747 | 62,789 | — | ||||||||
Loans with an allowance recorded: | |||||||||||
Commercial and industrial | 8,967 | 9,022 | 2,055 | ||||||||
Owner occupied real estate | 754 | 768 | 260 | ||||||||
Commercial construction and land development | 4,348 | 8,108 | 1,310 | ||||||||
Total impaired loans with an allowance recorded | 14,069 | 17,898 | 3,625 | ||||||||
Total impaired loans: | |||||||||||
Commercial and industrial | 30,597 | 33,839 | 2,055 | ||||||||
Commercial tax-exempt | — | — | — | ||||||||
Owner occupied real estate | 9,237 | 9,526 | 260 | ||||||||
Commercial construction and land development | 20,749 | 25,281 | 1,310 | ||||||||
Commercial real estate | 6,045 | 6,853 | — | ||||||||
Residential | 3,609 | 3,609 | — | ||||||||
Consumer | 1,579 | 1,579 | — | ||||||||
Total impaired loans as of December 31, 2010 | $ | 71,816 | $ | 80,687 | $ | 3,625 | |||||
52
December 31, 2009 | |||||||||||
(in thousands) | Recorded Investment | Unpaid Principal Balance | Related Allowance | ||||||||
Loans with no related allowance: | |||||||||||
Commercial and industrial | $ | 25,893 | $ | 27,805 | $ | — | |||||
Commercial tax-exempt | — | — | — | ||||||||
Owner occupied real estate | 3,163 | 3,183 | — | ||||||||
Commercial construction and land development | 15,584 | 18,911 | — | ||||||||
Commercial real estate | 17,964 | 18,483 | — | ||||||||
Residential | 2,368 | 2,368 | — | ||||||||
Consumer | 654 | 654 | — | ||||||||
Total impaired loans with no related allowance | 65,626 | 71,404 | — | ||||||||
Loans with an allowance recorded: | |||||||||||
Commercial and industrial | 1,283 | 3,072 | 900 | ||||||||
Total impaired loans with an allowance recorded | 1,283 | 3,072 | 900 | ||||||||
Total impaired loans: | |||||||||||
Commercial and industrial | 27,176 | 30,877 | 900 | ||||||||
Commercial tax-exempt | — | — | — | ||||||||
Owner occupied real estate | 3,163 | 3,183 | — | ||||||||
Commercial construction and land development | 15,584 | 18,911 | — | ||||||||
Commercial real estate | 17,964 | 18,483 | — | ||||||||
Residential | 2,368 | 2,368 | — | ||||||||
Consumer | 654 | 654 | — | ||||||||
Total impaired loans as of December 31, 2009 | $ | 66,909 | $ | 74,476 | $ | 900 | |||||
Impaired loans averaged approximately $74.6 million, $52.6 million and $21.0 million during 2010, 2009 and 2008, respectively. Interest income on impaired loans that were still accruing totaled $1.3 million, $1.6 million and $917,000 during 2010, 2009 and 2008, respectively. Interest income received on nonaccrual loans prior to them being moved to nonaccrual totaled $340,000, $976,000 and $1.3 million in 2010, 2009 and 2008, respectively.
The Company uses the following credit quality indicators which follow regulatory guidelines: Pass-rated , special mention, substandard accrual and substandard nonaccrual loans. Monthly, the Company tracks commercial loans that are no longer pass rated. We review the cash flow, operating results, and financial condition of the borrower as well as the collateral position against established policy guidelines as a means of providing a targeted list of loans and loan relationships that need additional attention within the loan portfolio. We categorize loans possessing increased risk as special mention, substandard accrual and substandard nonaccrual. Special mention loans are those loans that are currently protected, but potentially weak. The potential weaknesses may, if not corrected, weaken the loan or inadvertently jeopardize the Company's credit position in the future. Substandard accrual and substandard nonaccrual assets are characterized by well-defined weaknesses that jeopardize the liquidation of the debt, and by the possibility that the Company will sustain some loss if the weaknesses are not corrected. Substandard accrual loans would move from accrual to non accrual when the loan is 90 days past due in principal or interest, unless the loan is well secured and in the process of collection or when there is doubt about the collectibility of all contractual principal and interest, regardless if the loan is 90 days past due or not. Special mention and substandard loans are reviewed monthly. Pass rated loans are reviewed throughout the year through the recurring review process of our independent loan review department.
53
Credit quality indicators for commercial loans broken out by loan type are presented in the following table:
December 31, 2010 | |||||||||||||||
(in thousands) | Pass Rated Loans | Special Mention | Substandard Accrual | Substandard Nonaccrual | Total | ||||||||||
Commercial credit exposure: | |||||||||||||||
Commercial and industrial | $ | 311,713 | $ | 5,726 | $ | 7,494 | $ | 23,103 | $ | 348,036 | |||||
Commercial tax-exempt | 89,401 | — | — | — | 89,401 | ||||||||||
Owner occupied real estate | 228,207 | 4,093 | 4,918 | 4,319 | 241,537 | ||||||||||
Commercial construction and land development | 84,155 | 7,190 | 6,594 | 14,155 | 112,094 | ||||||||||
Commercial real estate | 282,378 | 10,611 | 622 | 5,423 | 299,034 | ||||||||||
Total | $ | 995,854 | $ | 27,620 | $ | 19,628 | $ | 47,000 | $ | 1,090,102 | |||||
Consumer credit exposures are rated as performing or nonperforming as detailed below:
December 31, 2010 | |||||||||
(in thousands) | Performing | Nonperforming | Total | ||||||
Consumer credit exposure: | |||||||||
Residential | $ | 77,515 | $ | 3,609 | $ | 81,124 | |||
Consumer | 206,400 | 1,579 | 207,979 | ||||||
Total | $ | 283,915 | $ | 5,188 | $ | 289,103 | |||
5. Loan Commitments and Standby Letters of Credit
Loan commitments are made to accommodate the financial needs of Metro's customers. Standby letters of credit commit the Company to make payments on behalf of customers when certain specified future events occur. They primarily are issued to facilitate the customers' normal course of business transactions. Historically, almost all of the Company's standby letters of credit expire unfunded.
Letters of credit have risk essentially the same as that involved in extending loans to customers and are subject to the Company's normal credit policies. Since the majority of the commitments are expected to expire without being drawn upon, the total commitment amount does not necessarily represent future funding requirements. Commitments generally have fixed expiration dates or other termination clauses.
Outstanding letters of credit are written conditional commitments issued by the Company to guarantee the performance of a customer to a third party. The majority of these standby letters of credit expire within twenty-four months from the date of issuance. The Company requires collateral supporting these letters of credit as deemed necessary. The amount of the liability as of December 31, 2010 and 2009 for guarantees under standby letters of credit issued was $0.
The Company's maximum exposure to credit loss for loan commitments (unfunded loans and unused lines of credit, including home equity lines of credit) and standby letters of credit outstanding were as follows:
December 31, | |||||||
(in thousands) | 2010 | 2009 | |||||
Commitments to grant loans | $ | 4,624 | $ | 2,993 | |||
Unfunded commitments of existing commercial loans | 304,329 | 277,306 | |||||
Unfunded commitments of existing consumer loans | 33,788 | 41,384 | |||||
Standby letters of credit | 32,272 | 34,479 | |||||
Total | $ | 375,013 | $ | 356,162 | |||
54
6. Concentrations of Credit Risk
The Company's loan portfolio is principally to borrowers throughout Cumberland, Dauphin, York, Lebanon, Lancaster and Berks counties of Pennsylvania where it has full-service stores. Commercial real estate loans and loan commitments for commercial real estate projects aggregated $415.5 million at December 31, 2010. Owner occupied real estate loans and loan commitments for commercial properties aggregated $252.2 million at December 31, 2010.
Commercial real estate loans are collateralized by the related project (principally office buildings, multifamily residential, land development and other properties) and the Company generally requires loan-to-value ratios of no greater than 80% at the time the loan is granted, in conformance with regulatory guidelines.
7. Premises, Equipment and Leases
Premises and equipment are stated at cost less accumulated depreciation and amortization. Depreciation and amortization expense for 2010, 2009, and 2008 was $6.1 million, $5.5 million and $5.0 million, respectively, and is computed on the straight-line method over the following estimated useful lives of the related assets. The estimated life for leasehold improvements is based on the shorter of the useful life or the lease term.
Years | |
Buildings and leasehold improvements | 1 - 40 |
Furniture, fixtures and equipment | 1 - 15 |
Computer equipment and software | 3 - 8 |
A summary of premises and equipment is as follows:
December 31, | |||||||
(in thousands) | 2010 | 2009 | |||||
Land | $ | 15,386 | $ | 15,386 | |||
Buildings | 67,114 | 67,851 | |||||
Construction in process | 1,453 | 1,408 | |||||
Leasehold improvements | 2,541 | 2,533 | |||||
Furniture, fixtures and equipment | 35,095 | 35,723 | |||||
121,589 | 122,901 | ||||||
Less accumulated depreciation and amortization | 33,427 | 29,121 | |||||
Total | $ | 88,162 | $ | 93,780 | |||
Land, buildings and equipment are leased under noncancelable operating lease agreements that expire at various dates through 2032. Total rental expense for operating leases in 2010, 2009 and 2008 was $3.0 million, $2.9 million and $2.7 million, respectively. At December 31, 2010 future minimum lease payments for noncancelable operating leases are payable as follows:
(in thousands) | |||
2011 | $ | 2,498 | |
2012 | 2,214 | ||
2013 | 2,066 | ||
2014 | 2,019 | ||
2015 | 2,055 | ||
Thereafter | 21,960 | ||
Total minimum lease payments | $ | 32,812 | |
55
8. Deposits
The composition of deposits is as follows:
December 31, | |||||||
(in thousands) | 2010 | 2009 | |||||
Noninterest-bearing demand | $ | 340,956 | $ | 319,850 | |||
Interest checking and money market | 927,575 | 930,846 | |||||
Savings | 292,995 | 293,325 | |||||
Time certificates $100,000 or more | 133,383 | 113,120 | |||||
Other time certificates | 137,270 | 157,592 | |||||
Total | $ | 1,832,179 | $ | 1,814,733 | |||
At December 31, 2010, the scheduled maturities of time deposits are as follows:
(in thousands) | |||
2011 | $ | 189,303 | |
2012 | 42,127 | ||
2013 | 17,172 | ||
2014 | 13,421 | ||
2015 | 8,630 | ||
Thereafter | — | ||
Total | $ | 270,653 | |
9. Short-term Borrowings
Short-term borrowings consist of securities sold under agreements to repurchase and lines of credit. The Bank has a line of credit commitment from the FHLB for borrowings up to $513.9 million and certain qualifying assets of the Bank collateralize the line. There was $140.5 million outstanding at December 31, 2010 and $51.1 million outstanding at December 31, 2009 on this line of credit, all of which was collateralized by loans held at the Bank. In addition to the previously mentioned sources, the Bank also has a $15.0 million federal funds line of credit with another correspondent bank as of December 31, 2010 of which $0 was outstanding. The average balance of short-term borrowings was $52.2 million in 2010. The weighted average interest rate on total short-term borrowings was 0.60% at December 31, 2010 and 0.62% at December 31, 2009.
10. Long-term Debt
As part of the Company's Asset/Liability management strategy, management utilized the Federal Home Loan Bank convertible select borrowing product during the third quarter of 2007 when it obtained $25.0 million in borrowings with a five year maturity and a six month conversion term at an initial interest rate of 4.29%. The Company paid off the entire $25.0 million during the fourth quarter of 2010 and incurred a $1.6 million prepayment charge. There was $0 outstanding on this borrowing at December 31, 2010.
On June 15, 2000, the Company issued $5.0 million of 11% fixed rate Trust Capital Securities to Commerce Bancorp LLC through Trust I, a Delaware business trust subsidiary. The Trust Capital Securities evidence a preferred ownership interest in the Trust, of which the Company owns 100% of the common equity. The proceeds from the issuance of the Trust Capital Securities were invested in substantially similar Junior Subordinated Debt of the Company. The Company unconditionally guarantees the Trust Capital Securities. Interest on the debt is payable quarterly in arrears on March 31, June 30, September 30 and December 31 of each year. The Trust Capital Securities are scheduled to mature on June 15, 2030. The Trust Capital Securities may be redeemed in whole or in part at the option of the Company on or after June 15, 2010 at 105.50% of the principal plus accrued interest, if any. The redemption price declines by 0.55% on June 15 of each year from 2011 through 2020 at which time the securities may be redeemed at 100% of the principal plus accrued interest, if any, to the date fixed for redemption, subject to certain conditions. All $5.0 million of the Trust Capital Securities qualifies as Tier 1 capital for regulatory capital purposes.
On September 28, 2001, the Company issued $8.0 million of 10% fixed rate Trust Capital Securities to Commerce Bancorp LLC through Trust II, a Delaware business trust subsidiary. The issuance of the Trust Capital Securities has similar properties as Trust I. The Trust
56
Capital Securities evidence a preferred ownership interest in the Trust II of which the Company owns 100% of the common equity. The proceeds from the issuance of the Trust Capital Securities were invested in substantially similar Junior Subordinated Debt of the Company. The Company unconditionally guarantees the Trust Capital Securities. Interest on the debt is payable quarterly with similar terms as in Trust I. The Trust Capital Securities are scheduled to mature on September 28, 2031. The Trust Capital Securities may be redeemed in whole or in part at the option of the Company on or after September 28, 2011 at 105.00% of the principal plus accrued interest, if any. The redemption price declines by 0.50% on September 28 of each year from 2012 through 2021 at which time the securities may be redeemed at 100% of the principal plus accrued interest, if any, to the date fixed for redemption, subject to certain conditions. All $8.0 million of the Trust Capital Securities qualifies as Tier 1 capital for regulatory capital purposes.
On September 29, 2006, the Company issued $15.0 million of 7.75% fixed rate Trust Capital Securities to TD Bank, N.A. (formerly known as Commerce Bank, N.A.) through Trust III, a Delaware business trust subsidiary. The issuance of the Trust Capital Securities has similar properties as Trust I and Trust II. The Trust Capital Securities evidence a preferred ownership interest in Trust III of which the Company owns 100% of the common equity. The proceeds from the issuance of the Trust Capital Securities were invested in substantially similar Junior Subordinated Debt of the Company. The Company unconditionally guarantees the Trust Capital Securities. Interest on the debt is payable quarterly with similar terms as in Trust I and Trust II. The Trust Capital Securities are scheduled to mature on September 29, 2036. The Trust Capital Securities may be redeemed in whole or in part at the option of the Company on or after September 29, 2011 at 100.00% of the principal plus accrued interest, if any. All $15.0 million of the Trust Capital Securities qualifies as Tier 1 capital for regulatory capital purposes.
The remaining $1.4 million in long-term debt represents the Company's ownership interest in the non-bank subsidiary Trusts.
The scheduled maturities for long-term debt over the next five years and thereafter are as follows:
(in thousands) | |||
2011-2015 | $ | — | |
Thereafter | 29,400 | ||
Total | $ | 29,400 | |
11. Income Taxes
A reconciliation of the provision (benefit) for income taxes and the amount that would have been provided at statutory rates is as follows:
Years Ended December 31, | |||||||||||
(in thousands) | 2010 | 2009 | 2008 | ||||||||
(Benefit) Provision at statutory rate on pretax income (loss) | $ | (3,017 | ) | $ | (1,425 | ) | $ | 6,564 | |||
Tax-exempt income on loans and investments | (1,446 | ) | (1,263 | ) | (1,087 | ) | |||||
Exercise of nonqualified stock options | (25 | ) | (76 | ) | (102 | ) | |||||
Stock-based compensation | 209 | 296 | 229 | ||||||||
Merger related expenses | (358 | ) | 161 | 103 | |||||||
Other | 101 | 133 | 146 | ||||||||
Total | $ | (4,536 | ) | $ | (2,174 | ) | $ | 5,853 | |||
The statutory tax rate used to calculate the provision in 2010 was 34% and in 2009 and 2008 a 35% statutory tax rate was used due to the projected pretax consolidated earnings of the Company.
The components of income tax expense (benefit) are as follows:
Years Ended December 31, | |||||||||||
(in thousands) | 2010 | 2009 | 2008 | ||||||||
Current | $ | 236 | $ | (3,841 | ) | $ | 8,068 | ||||
Deferred expense (benefit) | (4,772 | ) | 1,667 | (2,215 | ) | ||||||
Total | $ | (4,536 | ) | $ | (2,174 | ) | $ | 5,853 | |||
57
The components of the net deferred tax asset were as follows:
December 31, | |||||||
(in thousands) | 2010 | 2009 | |||||
Deferred tax assets: | |||||||
Allowance for loan losses | $ | 7,350 | $ | 5,037 | |||
Unrealized losses on securities | 2,901 | 5,853 | |||||
Other-than-temporary losses | 892 | 819 | |||||
Stock-based compensation | 757 | 559 | |||||
Nonaccrual interest | 1,492 | 654 | |||||
Gain on sale of SBA | 316 | — | |||||
Other | 525 | 144 | |||||
Total deferred tax assets | 14,233 | 13,066 | |||||
Deferred tax liabilities: | |||||||
Premises and equipment | (4,514 | ) | (4,900 | ) | |||
Prepaid expenses | (571 | ) | (765 | ) | |||
Deferred loan fees | (885 | ) | (958 | ) | |||
Total deferred tax liabilities | (5,970 | ) | (6,623 | ) | |||
Net deferred tax asset | $ | 8,263 | $ | 6,443 | |||
Tax expense of $952,000 and $550,000 was recognized on net securities gains during 2010 and 2009, respectively, and a tax benefit of $55,000 was recognized on net securities losses during 2008. For 2010, the Company will receive a tax benefit on its federal income tax return totaling $25,000 and for 2009 and 2008, the Company received a tax benefit totaling $76,000 and $102,000, respectively, related to the exercise of non-qualified stock options and disqualified dispositions of employee stock from options exercised. The Company, or one of its subsidiaries, files income tax returns in the U.S. Federal jurisdiction and various states. The Company is no longer subject to U.S. Federal, state and local examinations by tax authorities for years before 2007.
12. Stockholders' Equity
At December 31, 2010 and 2009, TD Banknorth, Inc., (formerly known as Commerce Bancorp, Inc.) owned 40,000 shares of the Company's Series A $10 par value noncumulative nonvoting preferred stock. The preferred stock is redeemable at the option of the Company at the price of $25 per share plus any unpaid dividends. Dividends on the preferred stock are payable quarterly at a rate of $2 per share per annum.
The Company has a dividend reinvestment and stock purchase plan. Holders of common stock may participate in the plan in which reinvested dividends and voluntary cash payments of not less than $100 per month and not more than $25,000 per month may be reinvested in additional common shares at a 3% discount from the current market price. Officers are eligible immediately and employees who have been continuously employed for at least one year are also eligible to participate in the plan. The minimum investment is $25 per month for employees and $50 for officers with a maximum of $25,000 per month. During 2010, 500,000 additional shares were registered to the plan. A total of 288,559, 79,019 and 37,372 common shares were issued pursuant to this plan in 2010, 2009 and 2008, respectively. At December 31, 2010, the Company had reserved approximately 388,000 common shares to be issued in connection with the plan.
On August 6, 2009, Metro Bancorp filed a shelf registration statement on Form S-3 with the Securities and Exchange Commission (SEC) which will allow the Company, from time to time, to offer and sell up to a total aggregate of $250.0 million of common stock, preferred stock, debt securities, or warrants, either separately or together in any combination. The shelf registration statement also registered trust preferred securities. The Dodd-Frank Wall Street Reform and Consumer Protection Act (Dodd-Frank Act) excludes from regulatory capital trust preferred securities issued after May 19, 2010. Consequently, Metro Bancorp has no plans to issue additional trust preferred securities. While Metro has always been well-capitalized under federal regulatory guidelines, the shelf registration better positions the Company to take advantage of potential opportunities for growth and to address current economic conditions.
On September 30, 2009, the Company completed a common stock offering of 6.25 million shares, at $12.00 per share, for new capital proceeds (net of expenses) of $70.7 million. In October 2009, the underwriters exercised their 10% over-allotment option and Metro issued an additional 625,000 common shares for additional net proceeds of $7.1 million. The total net proceeds of $77.8 million have significantly strengthened Metro's capital ratios far beyond regulatory guidelines for “well-capitalized” status and position the Company
58
for strong future growth.
13. Earnings (Loss) per Share
The following table sets forth the computation of basic and diluted earnings (loss) per share:
For the Years Ended December 31, | ||||||||||||||||||||||||||||||||
2010 | 2009 | 2008 | ||||||||||||||||||||||||||||||
(in thousands, except per share amounts) | Loss | Weighted-average Shares | Per Share Amount | Loss | Weighted-average Shares | Per Share Amount | Income | Weighted-average Shares | Per Share Amount | |||||||||||||||||||||||
Basic earnings (loss) per share: | ||||||||||||||||||||||||||||||||
Net income (loss) | $ | (4,337 | ) | $ | (1,898 | ) | $ | 12,901 | ||||||||||||||||||||||||
Preferred stock dividends | (80 | ) | (80 | ) | (80 | ) | ||||||||||||||||||||||||||
Income (loss) available to common stockholders | (4,417 | ) | 13,563 | $ | (0.33 | ) | (1,978 | ) | 8,241 | $ | (0.24 | ) | 12,821 | 6,356 | $ | 2.02 | ||||||||||||||||
Effect of dilutive securities: | ||||||||||||||||||||||||||||||||
Stock options | — | — | 164 | |||||||||||||||||||||||||||||
Diluted earnings (loss) per share: | ||||||||||||||||||||||||||||||||
Income (loss) available to common stockholders plus assumed conversions | $ | (4,417 | ) | 13,563 | $ | (0.33 | ) | $ | (1,978 | ) | 8,241 | $ | (0.24 | ) | $ | 12,821 | 6,520 | $ | 1.97 | |||||||||||||
There were 1,069,774 common stock options excluded from the computation of diluted loss per share for the year ended December 31, 2010 which were exercisable between the prices of $11.55 and $33.50 per option. There were 1,030,267 options excluded from the computation of diluted loss per share for the year ended December 31, 2009 which were exercisable between the prices of $6.93 and $33.50 per option. There were 533,966 options excluded from the computation of diluted earnings per share for the year ended December 31, 2008 which were exercisable between the prices of $27.00 and $33.50 per option.
14. Stock Option Plans
In 2005, the Board of Directors adopted and the Company's stockholders approved the adoption of the 2006 Employee Stock Option Plan for the officers and employees of the Company. The Plan commenced January 1, 2006 and replaced the 1996 Employee Stock Option Plan, which expired December 31, 2005. The Plan covers 1,000,000 authorized shares of common stock reserved for issuance upon exercise of options granted or available for grant to employees and will expire on December 31, 2015. The Plan provides that the option price of qualified incentive stock options will be fixed by the Board of Directors, but will not be less than 100% of the fair market value of the stock at the date of grant. In addition, the Plan provides that the option price of nonqualified stock options (NQSO's) also will be fixed by the Board of Directors, however for NQSO's the option price may be less than 100% of the fair market value of the stock at the date of grant. Options granted are exercisable one year after the grant date, will vest over a four-year period and expire ten years after the grant date.
In 2000, the Board of Directors adopted and the Company's stockholders approved the adoption of the 2001 Directors' Stock Option Plan. The Plan commenced January 1, 2001 and replaced the 1990 Directors' Stock Option Plan, which expired December 31, 2000. The Plan covered 343,100 authorized shares of common stock reserved for issuance upon exercise of options granted or available for grant to non-employee directors and expired on December 31, 2010. In 2010, the Company's shareholders approved the adoption of the 2011 Directors' Stock Option Plan. The Plan commences January 1, 2011 and replaces the 2000 Directors' Stock Option Plan which expired December 31, 2010. The Plan covers 200,000 authorized shares of common stock reserved for issuance upon exercise of options granted or available for grant to directors, directors emeritus, advisory directors, consultants and others with outstanding abilities and will expire on December 31, 2020. Under the Company's Directors' Stock Option Plan, each non-employee director of the Company, consultants and others who are not regularly employed on a salaried basis by the Company may be entitled to an option to acquire shares, as determined by the Board
59
of Directors, of the Company's common stock during each year in which the Director serves on the Board. The Plan provides that the option price will be fixed by the Board of Directors, but will not be less than 100% of the fair market value of the stock on the date of the grant.
As of December 31, 2010, there was $2.2 million of total unrecognized compensation cost related to nonvested stock option awards. This cost is expected to be recognized over the next 3.4 year period. Cash received from the exercise of options for 2010, 2009 and 2008 was $78,000, $633,000 and $541,000, respectively.
The fair value of each option grant was established at the date of grant using the Black-Scholes option pricing model. The Black-Scholes option valuation model was developed for use in estimating the fair value of traded options, which have no vesting restrictions and are fully transferable. In addition, option valuation models require the input of highly subjective assumptions including the stock price volatility. Because the Company's stock options have characteristics significantly different from those of traded options and because changes in the subjective input assumptions can materially affect the fair value estimate, in management's opinion, the existing models do not necessarily provide a reliable single measure of the fair value of the Company's stock options. The Black-Scholes model used the following weighted-average assumptions for 2010, 2009 and 2008, respectively: risk-free interest rates of 3.3%, 2.5% and 3.3%; volatility factors of the expected market price of the Company's common stock of .45, .32 and .29; weighted average expected lives of the options of 7.5 years for the three years presented and no cash dividends. Based upon these assumptions, the weighted average fair value of options granted was $6.47, $6.18 and $10.66 for the years ended December 31, 2010, 2009 and 2008, respectively.
The Company recorded compensation expense of approximately $1.2 million for the year ended December 31, 2010 compared to $1.4 million and $1.1 million for the years ended December 31, 2009 and 2008, respectively. The tax benefit associated with compensation expense was $214,000, $208,000 and $170,000 for 2010, 2009 and 2008, respectively.
Stock option transactions under the Plans were as follows:
Years Ended December 31, | |||||||||||||||
2010 | 2009 | 2008 | |||||||||||||
Options | Weighted Avg. Exercise Price | Options | Weighted Avg. Exercise Price | Options | Weighted Avg. Exercise Price | ||||||||||
Outstanding at beginning of year | 1,030,267 | $ | 22.92 | 943,915 | $ | 24.42 | 924,215 | $ | 22.19 | ||||||
Granted | 192,900 | 12.31 | 211,270 | 15.69 | 174,325 | 27.00 | |||||||||
Exercised | (13,508 | ) | 7.92 | (49,702 | ) | 13.40 | (133,232 | ) | 11.53 | ||||||
Forfeited/expired | (139,885 | ) | 18.75 | (75,216 | ) | 27.66 | (21,393 | ) | 29.61 | ||||||
Outstanding at end of year | 1,069,774 | $ | 21.74 | 1,030,267 | $ | 22.92 | 943,915 | $ | 24.42 | ||||||
Exercisable at December 31 | 663,259 | $ | 24.63 | 619,490 | $ | 23.62 | 601,805 | $ | 22.23 | ||||||
Options available for grant at December 31 | 511,525 | 624,085 | 781,786 | ||||||||||||
Weighted-average fair value of options granted during the year | $ | 6.47 | $ | 6.18 | $ | 10.66 | |||||||||
Options exercisable and outstanding at December 31, 2010 had an intrinsic value of $0. The intrinsic value of options exercised was $77,000 in 2010, $282,000 in 2009 and $2.0 million in 2008.
The Company allows for option exercises to be paid for in cash or in whole or in part with Metro stock owned by the optionee. The value of the stock used to exercise the options is the fair market value on the date of exercise. Stock option exercises paid for with the Company's stock were 2,130 shares, 1,695 shares and 37,846 shares for the years ended December 31, 2010, 2009 and 2008, respectively.
60
Exercise prices for options outstanding as of December 31, 2010 are presented in the following table:
Options Outstanding | Weighted Avg. Exercise Price | Weighted Avg. Remaining Contractual Life | Options Exercisable | Weighted Avg. Exercise Price | |||||||||||
Options with exercise prices ranging from $11.55 to $16.41 | 435,686 | $ | 14.15 | 7.2 Years | 127,831 | $ | 15.15 | ||||||||
Options with exercise prices ranging from $16.42 to $25.38 | 200,060 | 21.37 | 2.5 Years | 198,407 | 21.38 | ||||||||||
Options with exercise prices ranging from $25.39 to $33.50 | 434,028 | 29.54 | 5.7 Years | 337,021 | 30.14 | ||||||||||
Total options outstanding with exercise prices ranging from $11.55 to $33.50 | 1,069,774 | $ | 21.74 | 5.7 Years | 663,259 | $ | 24.63 | ||||||||
The remaining weighted average contractual life for options exercisable at December 31, 2010 is 4.1 years.
The following table represents non-vested options as of December 31, 2010:
Number of Shares | Weighted Avg. Grant Date Fair Value | ||||||
Non-vested options, | December 31, 2009 | 410,777 | $ | 8.73 | |||
Granted | 192,900 | 6.47 | |||||
Vested | (148,124 | ) | 9.16 | ||||
Forfeited | (49,038 | ) | 7.56 | ||||
Non-vested options, | December 31, 2010 | 406,515 | $ | 7.64 | |||
15. Regulatory Matters
Regulatory authorities restrict the amount of cash dividends the Bank can declare without prior regulatory approval. Presently, the Bank cannot declare cash dividends in one year in excess of its net profits for the current year plus its retained net profits for the two preceding years, less any required transfers to surplus. In addition, dividends paid by the Bank to the Company would be prohibited if the effect thereof would cause the Bank's capital to be reduced below applicable minimum capital requirements.
The Company and the Bank are subject to various regulatory capital requirements administered by federal banking agencies. Failure to meet minimum capital requirements can initiate certain mandatory and possible additional discretionary actions by regulators that, if undertaken, could have a direct material effect on the Company's financial statements. Under capital adequacy guidelines and the regulatory framework for prompt corrective action, the Company and the Bank must meet specific capital guidelines that involve quantitative measures of assets, liabilities and certain off-balance sheet items as calculated under regulatory accounting practices. The capital amounts and classification are also subject to qualitative judgments by the regulators about components, risk weightings and other factors.
Quantitative measures established by regulation to ensure capital adequacy require the Company and the Bank to maintain minimum amounts and ratios (set forth below) of total and Tier 1 capital (as defined in the regulations) to risk-weighted assets and of Tier 1 capital to average assets. Management believes, as of December 31, 2010, that the Company and the Bank meet all capital adequacy requirements to which they are subject.
As of December 31, 2010 the Bank was categorized as well-capitalized under the regulatory framework for prompt corrective action. To be categorized as well-capitalized the Bank must maintain minimum total risk-based, Tier 1 risk-based and Tier 1 leverage ratios as set forth in the table below. There are no conditions or events since that notification that management believes have changed the Bank's category.
61
The following table presents the risk-based and leverage capital amounts and ratios at December 31, 2010 and 2009 for the Company and the Bank:
Actual | For Capital Adequacy Purposes | To Be Well-Capitalized Under Prompt Corrective Action Provisions | ||||||||||||||||||||||||||
(dollars in thousands) | Amount | Ratio | Amount | Ratio | Amount | Ratio | ||||||||||||||||||||||
Company as of December 31, 2010 | ||||||||||||||||||||||||||||
Risk-based capital ratios: | ||||||||||||||||||||||||||||
Total capital | $ | 259,479 | 15.83 | % | ≥ | $ | 131,092 | ≥ | 8.0 | % | ≥ | N/A | ≥ | N/A | ||||||||||||||
Tier 1 capital | 238,981 | 14.58 | ≥ | 65,546 | ≥ | 4.0 | ≥ | N/A | ≥ | N/A | ||||||||||||||||||
Leverage ratio | 238,981 | 10.68 | ≥ | 89,494 | ≥ | 4.0 | ≥ | N/A | ≥ | N/A | ||||||||||||||||||
Bank as of December 31, 2010 | ||||||||||||||||||||||||||||
Risk-based capital ratios: | ||||||||||||||||||||||||||||
Total capital | $ | 229,682 | 14.06 | % | ≥ | $ | 130,647 | ≥ | 8.0 | % | ≥ | $ | 163,308 | ≥ | 10.0 | % | ||||||||||||
Tier 1 capital | 209,254 | 12.81 | ≥ | 65,323 | ≥ | 4.0 | ≥ | 97,985 | ≥ | 6.0 | ||||||||||||||||||
Leverage ratio | 209,254 | 9.38 | ≥ | 89,269 | ≥ | 4.0 | ≥ | 111,586 | ≥ | 5.0 | ||||||||||||||||||
Company as of December 31, 2009 | ||||||||||||||||||||||||||||
Risk-based capital ratios: | ||||||||||||||||||||||||||||
Total capital | $ | 253,284 | 14.71 | % | ≥ | $ | 137,734 | ≥ | 8.0 | % | ≥ | N/A | ≥ | N/A | ||||||||||||||
Tier 1 capital | 238,893 | 13.88 | ≥ | 68,867 | ≥ | 4.0 | ≥ | N/A | ≥ | N/A | ||||||||||||||||||
Leverage ratio | 238,893 | 11.31 | ≥ | 84,468 | ≥ | 4.0 | ≥ | N/A | ≥ | N/A | ||||||||||||||||||
Bank as of December 31, 2009 | ||||||||||||||||||||||||||||
Risk-based capital ratios: | ||||||||||||||||||||||||||||
Total capital | $ | 221,054 | 12.85 | % | ≥ | $ | 137,608 | ≥ | 8.0 | % | ≥ | $ | 172,010 | ≥ | 10.0 | % | ||||||||||||
Tier 1 capital | 206,663 | 12.01 | ≥ | 68,804 | ≥ | 4.0 | ≥ | 103,206 | ≥ | 6.0 | ||||||||||||||||||
Leverage ratio | 206,663 | 9.82 | ≥ | 84,206 | ≥ | 4.0 | ≥ | 105,257 | ≥ | 5.0 | ||||||||||||||||||
On April 29, 2010, the Bank consented and agreed to the issuance of a Consent Order (Order) by the FDIC, the Bank's federal banking regulator and a substantially similar consent order by the Pennsylvania Department of Banking. The Order requires the Bank to take all necessary steps, consistent with the Order and sound banking practices, to correct and prevent certain unsafe or unsound banking practices and violations of law or regulation alleged by the FDIC to have been committed by the Bank. Among other things, the Order requires certain analyses and assessments, including an analysis and assessment of the Bank Secrecy Act (BSA) and Office of Foreign Assets Control (OFAC) staffing needs and qualifications and an analysis and assessment of the independence and performance of the Company's directors and senior executive officers. It also requires the development, adoption and implementation of a system of internal controls designed to ensure full compliance with BSA and OFAC provisions; training programs to ensure that all appropriate personnel are aware of and can comply with applicable requirements of BSA and OFAC provisions; periodic reviews by internal and external auditors of compliance with BSA and OFAC provisions; and a review by an independent third party of the Bank's compliance with the Order. Most of these expenses are captured under consulting fees and make up the majority of this line item on the consolidated statement of operations.
16. Employee Benefit Plan
The Company has established a 401(k) Retirement Savings Plan for all of its employees who meet eligibility requirements. Employees may contribute up to 15% of their salary to the Plan. The Company provides a discretionary matching contribution for up to 6% of each employee's salary. In 2010, 2009 and 2008, the Company's matching contribution was established at 50% of the employee's salary deferral up to a maximum of 6% of the employee's salary. The amount charged to expense was $490,000, $494,000 and $407,000 in 2010, 2009 and 2008, respectively.
62
17. Comprehensive Income
Accounting principles generally require that recognized revenue, expenses, gains and losses be included in net income. Although certain changes in assets and liabilities, such as unrealized gains and losses on AFS securities, are reported as a separate component of the equity section of the balance sheet, such items, along with net income are components of comprehensive income. The only comprehensive income item that the Company presently has is net unrealized gains on securities available for sale and unrealized losses for noncredit-related losses on debt securities. The federal (income taxes) benefits allocated to the net unrealized gains (losses) are presented in the table below.
Years Ended December 31, | |||||||||||
(in thousands) | 2010 | 2009 | 2008 | ||||||||
Unrealized holding gains (losses) arising during the year | $ | 1,533 | $ | 6,108 | $ | (20,751 | ) | ||||
Reclassification adjustment on securities | 5,617 | 1,301 | — | ||||||||
OTTI losses on securities not expected to be sold | 1,043 | 2,452 | — | ||||||||
Subtotal | 8,193 | 9,861 | (20,751 | ) | |||||||
Income tax effect | (2,952 | ) | (3,452 | ) | 7,322 | ||||||
Other comprehensive income (loss), net of tax impact | $ | 5,241 | $ | 6,409 | $ | (13,429 | ) | ||||
18. Commitments and Contingencies
In January 2005, the Company entered into an agreement for naming rights to Metro Bank Park located on Harrisburg City Island, Harrisburg, Pennsylvania. Metro Bank Park is home of the Harrisburg Senators, an AA team affiliated with Major League Baseball. The term of the naming rights agreement is 15 years with a total obligation of $3.5 million spread over the term.
The Company has purchased the land at the corner of Carlisle Road and Alta Vista Road in Dover Township, York County, Pennsylvania. The Company plans to construct a full-service store on this property to be opened in the future.
The Company has entered into a land lease for the premises located at 2121 Lincoln Highway East, East Lampeter Township, Lancaster County, Pennsylvania. The Company plans to construct a full service store on this property to be opened in the future.
The Company has purchased land at 105 N. George Street, York City, York County, Pennsylvania. The Company plans to open a store on this property to be opened in the future.
On November 10, 2008, Metro announced it had entered into a services agreement with Fiserv. The agreement, effective November 7, 2008, is for a period of seven years, subject to automatic renewal for additional terms of two years unless either party gives the other written notice of non-renewal at least 180 days prior to the expiration date of the term. The agreement allowed the Company to transition to Fiserv many of the services that had been provided by Commerce Bank, N.A., now known as TD Bank, N.A. The initial investment with Fiserv was $3.4 million with an expected obligation for support, license fees and processing services of $39.8 million over the next five years. The various services include: core system hosting, item processing, deposit and loan processing, electronic banking, data warehousing and other banking functions. The transition was successfully completed in June 2009.
In addition, the Company is also subject to certain routine legal proceedings and claims arising in the ordinary course of business. It is management's opinion that the ultimate resolution of these claims will not have a material adverse effect on the Company's financial position and results of operations.
19. Related Party Transactions
Commerce Bancorp LLC (a 4.38% shareholder of common stock and 100% shareholder of Series A preferred stock of the Company), through an affiliate TD Bank, N.A., historically provided various services to the Company. These services included maintenance to the store LAN network, proof and encoding services, deposit account statement rendering, automated teller machine (ATM)/VISA card processing, data processing, implementation of new software for systems and call center support. On and effective as of December 30, 2008, the Company and the Bank entered into a Transition Agreement with TD and Commerce Bancorp LLC (formerly Commerce Bancorp, Inc.). The Transition Agreement terminated the Network Agreement dated January 1, 1997, as thereafter amended in April 2002 and September 29, 2004 (the Network Agreement) and the Master Services Agreement dated July 21, 2006 and its addenda (the Master Services Agreement) by and between the Company, the Bank and TD (and/or their predecessors). With timely advance notice by
63
TD under the Network and Master Services agreements, the agreements would have otherwise terminated on December 31, 2009. The agreements were terminated prior to such date in connection with the March 2008 merger of Commerce Bancorp, Inc. into a subsidiary of TD Bank N.A.
Pursuant to the Transition Agreement, TD provided to the Bank certain transaction services, representing a continuation of the services provided to the Bank under the terms of the Master Services Agreement until the third quarter of 2009, at which time all such services were transitioned to other service providers. Because all services provided by TD under the Transition Agreement were terminated according to terms in the agreement, TD paid to the Bank a fee in the amount of $6.0 million, which was used to help defray the costs of transition and the rebranding of the Company and the Bank.
The Company did not receive nor pay for services from TD in 2010; however, paid approximately $2.2 million and $4.7 million for services provided during 2009 and 2008, respectively. Insurance premiums and commissions, which were paid to a subsidiary of Commerce Bancorp LLC, are included in the total amount paid in 2008. A non-recourse loan in which the Company had participated was foreclosed in 2009 and resulted in the Company's ownership of a 15% interest in commercial property in which TD now owns a 70% interest. The gross balance due on the loan was $45.9 million at the time of foreclosure.
The Company has engaged in certain transactions with entities which are considered related parties. Payments for goods and services, including legal services, to these related parties totaled $699,000, $835,000 and $756,000, in 2010, 2009 and 2008, respectively. Management believes disbursements made to related parties were substantially equivalent to those that would have been paid to unaffiliated companies for similar goods and services.
20. Fair Value Measurements
The Company uses its best judgment in estimating the fair value of its financial instruments; however, there are inherent weaknesses in any estimation technique due to assumptions that are susceptible to significant change. Therefore, for substantially all financial instruments, the fair value estimates herein are not necessarily indicative of the amounts the Company could have realized in a sale transaction on the dates indicated. The estimated fair value amounts have been measured as of their respective year-ends and have not been reevaluated or updated for purposes of these financial statements subsequent to those respective dates. As such, the estimated fair values of these financial instruments subsequent to the respective reporting dates may be different than the amounts reported at each year-end.
Fair value is the price that would be received to sell an asset or paid to transfer a liability in an orderly transaction between market participants at the measurement date. The Company uses the following fair value hierarchy in selecting inputs with the highest priority given to unadjusted quoted prices in active markets for identical assets or liabilities (Level 1 measurements) and the lowest priority to unobservable inputs (Level 3 measurements):
Level 1: Unadjusted quoted prices in active markets that are accessible at the measurement date for identical, unrestricted assets or liabilities;
Level 2: Quoted prices in markets that are not active, or inputs that are observable either directly or indirectly, for substantially the full term of the asset or liability;
Level 3: Prices or valuation techniques that require inputs that are both significant to the fair value measurement and unobservable (i.e., supported with little or no market activity).
64
As required, financial assets and liabilities are classified in their entirety based on the lowest level of input that is significant to the fair value measurement. The following table sets forth the Company's financial assets that were measured at fair value on a recurring basis at December 31, 2010 by level within the fair value hierarchy:
Fair Value Measurements at Reporting Date Using | |||||||||||||||
Description | Quoted Prices in Active Markets for Identical Assets | Significant Other Observable Inputs | Significant Unobservable Inputs | ||||||||||||
(in thousands) | December 31, 2010 | (Level 1) | (Level 2) | (Level 3) | |||||||||||
U.S. Government agency securities | $ | 21,409 | $ | — | $ | 21,409 | $ | — | |||||||
Residential MBSs | 2,386 | — | 2,386 | — | |||||||||||
Agency CMOs | 383,214 | — | 383,214 | — | |||||||||||
Private-label CMOs | 31,003 | — | 31,003 | — | |||||||||||
Securities available for sale | $ | 438,012 | $ | — | $ | 438,012 | $ | — | |||||||
For financial assets measured at fair value on a recurring basis at December 31, 2009, the fair value measurements by level within the fair value hierarchy used were as follows:
Fair Value Measurements at Reporting Date Using | |||||||||||||||
Description | Quoted Prices in Active Markets for Identical Assets | Significant Other Observable Inputs | Significant Unobservable Inputs | ||||||||||||
(in thousands) | December 31, 2009 | (Level 1) | (Level 2) | (Level 3) | |||||||||||
U.S. Government agency securities | $ | 54,758 | $ | — | $ | 54,758 | $ | — | |||||||
Residential MBSs | 80,587 | — | 80,587 | — | |||||||||||
Agency CMOs | 150,128 | — | 150,128 | — | |||||||||||
Private-label CMOs | 103,363 | — | 103,363 | — | |||||||||||
Securities available for sale | $ | 388,836 | $ | — | $ | 388,836 | $ | — | |||||||
As of December 31, 2010 and December 31, 2009, the Company did not have any liabilities that were measured at fair value on a recurring basis.
Impaired Loans (Generally Carried at Fair Value)
Impaired loans are those that the Company has measured impairment of based on the fair value of the loan's collateral. Fair value is generally determined based upon independent third-party appraisals of the properties, or discounted cash flows based upon the expected proceeds. These assets are included as Level 3 fair values, based upon the lowest level of input that is significant to the fair value measurements. The fair value consists of the loan balances less any valuation allowance. The valuation allowance amount is calculated as the difference between the recorded investment in a loan and the present value of expected future cash flows. At December 31, 2010 the fair value of five related impaired loans with reserve allocations and their associated relationship totaled $10.4 million, net of a valuation allowance of $3.6 million. At December 31, 2009, the fair value of impaired loans with reserve allocations and their associated loan relationships totaled $383,000, net of a valuation allowance of $900,000. The Company's impaired loans are more fully discussed in Note 4.
Foreclosed Assets (Carried at Lower of Cost or Fair Value)
The fair value of real estate acquired through foreclosure was based on independent third party appraisals of the properties. The carrying value of foreclosed assets, with valuation allowances recorded subsequent to initial foreclosure, was $4.8 million and $718,000 at December 31, 2010 and December 31, 2009, respectively, which are net of valuation allowances of $410,000 and $194,000 that were
65
established in 2010 and 2009, respectively.
For assets measured at fair value on a nonrecurring basis, the fair value measurements by level within the fair value hierarchy used were as follows:
Fair Value Measurements at Reporting Date Using | |||||||||||||||
Description | Quoted Prices in Active Markets for Identical Assets | Significant Other Observable Inputs | Significant Unobservable Inputs | ||||||||||||
(in thousands) | December 31, 2010 | (Level 1) | (Level 2) | (Level 3) | |||||||||||
Impaired loans | $ | 10,444 | $ | — | $ | — | $ | 10,444 | |||||||
Foreclosed assets | 4,774 | — | — | 4,774 | |||||||||||
Total | $ | 15,218 | $ | — | $ | — | $ | 15,218 | |||||||
Fair Value Measurements at Reporting Date Using | |||||||||||||||
Description | Quoted Prices in Active Markets for Identical Assets | Significant Other Observable Inputs | Significant Unobservable Inputs | ||||||||||||
(in thousands) | December 31, 2009 | (Level 1) | (Level 2) | (Level 3) | |||||||||||
Security held to maturity | $ | 4,010 | $ | — | $ | 4,010 | $ | — | |||||||
Impaired loans | 383 | — | — | 383 | |||||||||||
Foreclosed assets | 718 | — | — | 718 | |||||||||||
Total | $ | 5,111 | $ | — | $ | 4,010 | $ | 1,101 | |||||||
The following information should not be interpreted as an estimate of the fair value of the entire Company since a fair value calculation is only provided for a limited portion of the Company's assets and liabilities. Due to a wide range of valuation techniques and the degree of subjectivity used in making the estimates, comparisons between the Company's disclosures and those of other companies may not be meaningful. The following valuation techniques were used to estimate the fair values of the Company's financial instruments at December 31, 2010 and 2009:
Cash and Cash Equivalents (Carried at Cost)
The carrying amounts reported in the balance sheet for cash and short-term instruments approximate those assets' fair values.
Securities
The fair value of securities available for sale (carried at fair value) and held to maturity (carried at amortized cost) are determined by matrix pricing (Level 2), which is a mathematical technique used widely in the industry to value debt securities without relying exclusively on quoted market prices for the specific securities but rather by relying on the securities' relationship to other benchmark prices.
Loans Held for Sale (Carried at Lower of Cost or Fair Value)
The fair value of loans held for sale is determined, when possible, using quoted secondary-market prices. If no such quoted prices exist, the fair value of a loan is determined using quoted prices for a similar loan or loans, adjusted for the specific attributes of that loan. The Company did not write down any loans held for sale during the years ended December 31, 2010 and 2009.
Loans Receivable (Carried at Cost)
The fair value of loans, excluding impaired loans with specific loan allowances, are estimated using discounted cash flow analysis, using market rates at the balance sheet date that reflect the credit and interest rate-risk inherent in the loans. Projected future cash flows are calculated based upon contractual maturity, projected repayments and prepayments of principal. Generally, for variable rate loans that reprice frequently and with no significant change in credit risk, fair values are based on carrying values.
66
Restricted Investment in Bank Stock (Carried at Cost)
The carrying amount of restricted investment in bank stock approximates fair value and considers the limited marketability of such securities. The restricted investment in bank stock consisted of Federal Home Loan Bank and Atlantic Central Bankers Bank (ACBB) stock at of December 31, 2010 and FHLB stock at December 31, 2009.
Accrued Interest Receivable and Payable (Carried at Cost)
The carrying amount of accrued interest receivable and accrued interest payable approximates its fair value.
Deposit Liabilities (Carried at Cost)
The fair values disclosed for demand deposits (e.g., interest and noninterest checking, passbook savings and money market accounts) are, by definition, equal to the amount payable on demand at the reporting date (i.e., their carrying amounts). Fair values for fixed-rate certificates of deposits (CDs) are estimated using a discounted cash flow calculation that applies interest rates currently being offered in the market on certificates to a schedule of aggregated expected monthly maturities on time deposits.
Short-Term Borrowings (Carried at Cost)
The carrying amounts of short-term borrowings approximate their fair values.
Long-Term Debt (Carried at Cost)
The fair value of the $25.0 million FHLB convertible select borrowing advance at December 31, 2009 was estimated using discounted cash flow analysis, based on a quoted price for new FHLB advances with similar credit risk characteristics, terms and remaining maturity. The price obtained from this active market represents a fair value that is deemed to represent the transfer price if the liability were assumed by a third party. Other long-term debt was estimated using discounted cash flow analysis, based on quoted prices from a third party broker for new debt with similar characteristics, terms and remaining maturity. The price for the other long-term debt was obtained in an inactive market where these types of instruments are not traded regularly.
Off-Balance Sheet Financial Instruments (Disclosed at Cost)
Fair values for the Company's off-balance sheet financial instruments (lending commitments and letters of credit) are based on fees currently charged in the market to enter into similar agreements, taking into account, the remaining terms of the agreements and the counterparties' credit standing.
67
The estimated fair values of the Company's financial instruments were as follows at December 31, 2010 and 2009:
2010 | 2009 | ||||||||||||||
(in thousands) | Carrying Amount | Fair Value | Carrying Amount | Fair Value | |||||||||||
Financial assets: | |||||||||||||||
Cash and cash equivalents | $ | 32,858 | $ | 32,858 | $ | 40,264 | $ | 40,264 | |||||||
Securities | 665,588 | 662,214 | 506,651 | 508,762 | |||||||||||
Loans, net (including loans held for sale) | 1,376,192 | 1,358,509 | 1,442,104 | 1,424,648 | |||||||||||
Restricted investments in bank stock | 20,614 | 20,614 | 21,630 | 21,630 | |||||||||||
Accrued interest receivable | 7,347 | 7,347 | 7,010 | 7,010 | |||||||||||
Financial liabilities: | |||||||||||||||
Deposits | $ | 1,832,179 | $ | 1,835,782 | $ | 1,814,733 | $ | 1,818,045 | |||||||
Long-term debt | 29,400 | 18,431 | 54,400 | 42,786 | |||||||||||
Short-term borrowings | 140,475 | 140,475 | 51,075 | 51,075 | |||||||||||
Accrued interest payable | 669 | 669 | 930 | 930 | |||||||||||
Off-balance sheet instruments: | |||||||||||||||
Standby letters of credit | $ | — | $ | — | $ | — | $ | — | |||||||
Commitments to extend credit | — | — | — | — | |||||||||||
68
21. Quarterly Financial Data (unaudited)
The following represents summarized unaudited quarterly financial data of the Company which, in the opinion of management, reflects adjustments (comprising only normal recurring accruals) necessary for fair presentation, note that certain balances may not cross foot due to rounding:
Three Months Ended | |||||||||||||||
(in thousands, except per share amounts) | December 31 | September 30 | June 30 | March 31 | |||||||||||
2010 | |||||||||||||||
Interest income | $ | 24,508 | $ | 24,248 | $ | 24,396 | $ | 24,095 | |||||||
Interest expense | 4,062 | 4,261 | 4,412 | 4,662 | |||||||||||
Net interest income | 20,446 | 19,987 | 19,984 | 19,433 | |||||||||||
Provision for loan losses | 2,600 | 13,400 | 2,600 | 2,400 | |||||||||||
Gains on sales of securities (net) | 1,765 | 117 | 298 | 621 | |||||||||||
Provision (benefit) for federal income taxes | 376 | (3,772 | ) | (238 | ) | (902 | ) | ||||||||
Net income (loss) | 1,457 | (6,160 | ) | 360 | 6 | ||||||||||
Net income (loss) per share: | |||||||||||||||
Basic | $ | 0.10 | $ | (0.46 | ) | $ | 0.02 | $ | — | ||||||
Diluted | 0.10 | (0.46 | ) | 0.02 | — | ||||||||||
2009 | |||||||||||||||
Interest income | $ | 23,822 | $ | 24,310 | $ | 24,947 | $ | 25,304 | |||||||
Interest expense | 5,247 | 5,631 | 5,932 | 5,967 | |||||||||||
Net interest income | 18,575 | 18,679 | 19,015 | 19,337 | |||||||||||
Provision for loan losses | 1,800 | 3,725 | 3,700 | 3,200 | |||||||||||
Gains on sales/call of securities | 1 | 1,515 | 55 | — | |||||||||||
Provision (benefit) for federal income taxes | (803 | ) | (502 | ) | (1,041 | ) | 172 | ||||||||
Net income (loss) | (890 | ) | (490 | ) | (1,355 | ) | 837 | ||||||||
Net income (loss) per share: | |||||||||||||||
Basic | $ | (0.07 | ) | $ | (0.08 | ) | $ | (0.21 | ) | $ | 0.13 | ||||
Diluted | (0.07 | ) | (0.08 | ) | (0.21 | ) | 0.13 | ||||||||
69
22. Condensed Financial Statements of Parent Company
Balance Sheets
December 31, | |||||||
(in thousands) | 2010 | 2009 | |||||
Assets | |||||||
Cash | $ | 26,237 | $ | 32,863 | |||
Investment in subsidiaries: | |||||||
Banking subsidiary | 203,623 | 195,792 | |||||
Non-banking subsidiaries | 1,400 | 1,400 | |||||
Other assets | 4,119 | 4,737 | |||||
Total assets | $ | 235,379 | $ | 234,792 | |||
Liabilities | |||||||
Long-term debt | $ | 29,400 | $ | 29,400 | |||
Other liabilities | 628 | 5,370 | |||||
Total liabilities | 30,028 | 34,770 | |||||
Stockholders' Equity | |||||||
Preferred stock | 400 | 400 | |||||
Common stock | 13,748 | 13,448 | |||||
Surplus | 151,545 | 147,340 | |||||
Retained earnings | 45,288 | 49,705 | |||||
Accumulated other comprehensive loss | (5,630 | ) | (10,871 | ) | |||
Total stockholders' equity | 205,351 | 200,022 | |||||
Total liabilities and stockholders' equity | $ | 235,379 | $ | 234,792 | |||
Statements of Operations
Years Ended December 31, | |||||||||||
(in thousands) | 2010 | 2009 | 2008 | ||||||||
Income | |||||||||||
Dividends from bank subsidiary | $ | — | $ | 2,818 | $ | 2,337 | |||||
Interest income | 124 | 124 | 124 | ||||||||
124 | 2,942 | 2,461 | |||||||||
Expenses | |||||||||||
Interest expense | 2,645 | 2,645 | 2,645 | ||||||||
Other | 1,149 | 1,668 | 1,265 | ||||||||
3,794 | 4,313 | 3,910 | |||||||||
Loss before income tax benefit and equity in undistributed net income of subsidiaries | (3,670 | ) | (1,371 | ) | (1,449 | ) | |||||
Income tax benefit | 1,248 | 1,466 | 1,304 | ||||||||
(2,422 | ) | 95 | (145 | ) | |||||||
Equity in undistributed net income (loss) of bank subsidiary | (1,915 | ) | (1,993 | ) | 13,046 | ||||||
Net income (loss) | $ | (4,337 | ) | $ | (1,898 | ) | $ | 12,901 | |||
70
Statements of Cash Flows
Years Ended December 31, | |||||||||||
(in thousands) | 2010 | 2009 | 2008 | ||||||||
Operating Activities | |||||||||||
Net income (loss) | $ | (4,337 | ) | $ | (1,898 | ) | $ | 12,901 | |||
Adjustments to reconcile net income (loss) to net cash (used in) provided by operating activities: | |||||||||||
Amortization of financing costs | 8 | 8 | 8 | ||||||||
Stock-based compensation | 1,244 | 1,439 | 1,142 | ||||||||
(Decrease) increase in other liabilities | (4,742 | ) | 4,325 | 304 | |||||||
Decrease (increase) in other assets | 610 | (4,350 | ) | (173 | ) | ||||||
Equity in undistributed net (income) loss of bank subsidiary | 1,915 | 1,993 | (13,046 | ) | |||||||
Net cash (used in) provided by operating activities | (5,302 | ) | 1,517 | 1,136 | |||||||
Investing Activities | |||||||||||
Investment in bank subsidiary | (4,478 | ) | (48,970 | ) | (2,637 | ) | |||||
Net cash used by investing activities | (4,478 | ) | (48,970 | ) | (2,637 | ) | |||||
Financing Activities | |||||||||||
Proceeds from common stock options exercised | 78 | 633 | 541 | ||||||||
Proceeds from issuance of common stock under stock purchase plan | 3,156 | 1,174 | 954 | ||||||||
Proceeds from issuance of common stock in connection with stock offering | — | 77,792 | — | ||||||||
Cash dividends on preferred stock | (80 | ) | (80 | ) | (80 | ) | |||||
Net cash provided by financing activities | 3,154 | 79,519 | 1,415 | ||||||||
(Decrease) increase in cash and cash equivalents | (6,626 | ) | 32,066 | (86 | ) | ||||||
Cash and cash equivalents at beginning of the year | 32,863 | 797 | 883 | ||||||||
Cash and cash equivalents at end of year | $ | 26,237 | $ | 32,863 | $ | 797 | |||||
23. Subsequent Event
On or about June 15, 2009, we changed our name and the name of the Bank and began using the red “M” logo. Several companies in the United States, including companies in the banking and financial services industries, use variations of the word “Metro” and the letter “M” as part of a trademark or trade name. As such, we face potential objections to our use of these marks.
On or about June 19, 2009, Members 1st Federal Credit Union, or “Members 1st,” filed a complaint in the United States District Court for the Middle District of Pennsylvania against Metro Bancorp, Inc., Metro Bank, Republic First and Republic First Bank. Members 1st claimed federal trademark infringement, federal unfair competition, and common law trademark infringement and unfair competition by Metro in Metro’s use of a red letter “M” alone, or in conjunction with its trade name “Metro” Members 1st alleged that such use infringes Members 1st’s federally registered and common law trademark for the mark M1ST (stylized). On February 25, 2011, the parties to this lawsuit executed and filed with the court a Stipulation and Proposed Order of Dismissal under which the complaint against Metro and the Bank was dismissed without prejudice. While Metro intends to make certain modifications to its logos in the near future, we can provide no assurance that the Members 1st lawsuit will not be reinstituted at a later time or that other trademark infringement actions will not be brought against us.
71