Attached files
Table of Contents
UNITED STATES
SECURITIES AND EXCHANGE COMMISSION
WASHINGTON, D.C. 20549
FORM 10-K
| x |
ANNUAL REPORT PURSUANT TO SECTION 13 OR 15(d) OF THE SECURITIES EXCHANGE ACT OF 1934 | |
| For the fiscal year ended December 31, 2010 | ||
| OR | ||
| ¨ |
TRANSITION REPORT PURSUANT TO SECTION 13 OR 15(d) OF THE SECURITIES EXCHANGE ACT OF 1934 | |
Commission File No. 0-25837
HEIDRICK & STRUGGLES INTERNATIONAL, INC.
(Exact Name of Registrant as Specified in its Charter)
| Delaware | 36-2681268 | |
| (State or Other Jurisdiction of Incorporation or Organization) |
(I.R.S. Employer Identification Number) |
233 South Wacker Drive, Suite 4200, Chicago, Illinois 60606-6303
(Address of principal executive offices) (Zip Code)
(312) 496-1200
(Registrant’s telephone number, including area code)
Securities registered pursuant to Section 12(b) of the Act:
| Title Of Each Class |
Name Of Each Exchange On Which Registered | |
| Common Stock, $.01 par value | The Nasdaq Global Market |
Securities registered pursuant to Section 12(g) of the Act: None
Indicate by check mark if the registrant is a well-known seasoned issuer as defined in Rule 405 of the Securities Act. Yes ¨ No x
Indicate by check mark if the registrant is not required to file reports pursuant to Section 13 of Section 15(d) of the Act. Yes ¨ No x
Indicate by check mark whether the registrant (1) has filed all reports required to be filed by Section 13 or 15(d) of the Securities Exchange Act of 1934 during the preceding 12 months (or for such shorter period that the registrant was required to file such reports), and (2) has been subject to such filing requirements for the past 90 days. Yes x No ¨
Indicate by check mark whether the Registrant has submitted electronically and posted on its corporate Web site, if any, every Interactive Data File required to be submitted and posted pursuant to Rule 405 of Regulation S-T (§232.405 of this chapter) during the preceding 12 months (or for such shorter period that the Registrant was required to submit and post such files). Yes ¨ No ¨
Indicate by check mark if disclosure of delinquent filers pursuant to Item 405 of Regulation S-K is not contained herein, and will not be contained, to the best of registrant’s knowledge, in definitive proxy or information statements incorporated by reference in Part III of this Form 10-K or any amendment to this Form 10-K. ¨
Indicate by check mark whether the registrant is a large accelerated filer, an accelerated filer, a non-accelerated filer, or a smaller reporting company. See definition of “large accelerated filer,” “accelerated filer” and “smaller reporting company” in Rule 12b-2 of the Exchange Act. (Check one):
Large Accelerated Filer ¨ Accelerated Filer x Non-Accelerated Filer ¨ Smaller Reporting Company ¨
Indicate by check mark whether the registrant is a shell company (as defined in Rule 12b-2 of the Exchange Act). Yes ¨ No x
The aggregate market value of the registrant’s Common Stock held by non-affiliates of the registrant on June 30, 2010 was approximately $395,606,356 based upon the closing market price of $22.82 on that date of a share of Common Stock as reported on the Nasdaq Global Stock Market. As of March 10, 2011, there were 17,558,098 shares of the Company’s Common Stock outstanding.
DOCUMENTS INCORPORATED BY REFERENCE
Portions of the registrant’s definitive Proxy Statement for its Annual Meeting of Stockholders to be held on May 26, 2011, are incorporated by reference into Part III of this Form 10-K.
Table of Contents
HEIDRICK & STRUGGLES INTERNATIONAL, INC. AND SUBSIDIARIES
Table of Contents
PART I
Overview
Heidrick & Struggles International, Inc. (“Heidrick & Struggles”) is a leadership advisory firm providing executive search and leadership consulting services. We help our clients build leadership teams by facilitating the recruitment, management and deployment of senior executives. Focusing on top-level services offers us several advantages that include access to and influence with key decision makers, increased potential for recurring search and consulting engagements, higher fees per search, enhanced brand visibility, and a leveraged global footprint, which create added barriers to entry for potential competitors. Working at the top of client organizations also allows us to attract and retain high-caliber consultants.
In addition to executive search, we provide a range of leadership consulting services to clients. These services include succession planning, executive assessment, talent retention management, executive development, transition consulting for newly appointed executives, and mergers & acquisitions human capital integration consulting.
Heidrick & Struggles has been a leadership advisor for nearly 60 years. We provide our services to a broad range of clients through the expertise of 347 consultants located in 36 countries throughout the world as of December 31, 2010. For many of our clients, our global access to and knowledge of regional and functional markets and candidate talent is an important differentiator of our business. We provide our executive search services on a retained basis, recruiting senior executives whose first year base salary and bonus averaged approximately $325,500 in 2010 on a worldwide basis. Our clients include the following:
| • | Fortune 1000 companies |
| • | Major non-U.S. companies |
| • | Middle market and emerging growth companies |
| • | Governmental, higher education and not-for-profit organizations |
| • | Other leading private and public entities |
The executive search industry is highly fragmented, consisting of several thousand executive search firms worldwide. Executive search firms are generally separated into two broad categories: retained and contingency. Retained executive search firms fulfill their clients’ senior leadership needs by identifying potentially qualified candidates and assisting clients in evaluating and assessing these candidates. Retained executive search firms generally are compensated for their services regardless of whether the client employs a candidate identified by the search firm and are generally retained on an exclusive basis. Retained executive search firms normally charge a fee for their services equal to approximately one-third of the first year’s total compensation for the position being filled. In contrast, contingency search firms are compensated only upon successfully placing a recommended candidate.
We are a retained executive search firm. Our search process typically consists of the following steps:
| • | Analyze the client’s business needs in order to understand its organizational structure, relationships, and culture; determine the required set of skills for the position; define the required experience; and identify the other characteristics desired of the successful candidate |
| • | Select, contact, interview and evaluate candidates on the basis of experience and potential cultural fit with the client organization |
| • | Present confidential written reports on the candidates who potentially fit the position specification |
| • | Schedule a mutually convenient meeting between the client and each candidate |
1
Table of Contents
| • | Complete references on the final candidate selected by the client |
| • | Assist the client in structuring the compensation package and supporting the successful candidate’s integration into the client team |
Available Information
We maintain an Internet website at http://www.heidrick.com. Our annual reports on Form 10-K, quarterly reports on Form 10-Q, current reports on Form 8-K and amendments to these reports are available free of charge on this site as soon as reasonably practicable after the reports are filed with or furnished to the Securities and Exchange Commission. We also post news releases on our financial results, investor presentations and other documents containing additional information related to our company on this site. Our Internet website and the information contained in or accessible from our website are for informational purposes only and are not incorporated into this annual report on Form 10-K.
Organization
Our organizational structure, which is arranged by geography and industry/functional practices, is designed to enable us to better understand our clients’ cultures, operations, business strategies, industries and regional markets for executive talent.
Geographic Structure. We provide senior-level executive search and leadership consulting services to our clients worldwide through a network of more than 69 offices in 40 countries. Major locations are staffed with consultants, research associates, administrative assistants and other support staff. Administrative functions are centralized where possible, although certain support and research functions are situated regionally because of variations in local requirements.
Our worldwide network includes affiliate relationships in Finland, South Africa, Turkey and Portugal. We have no financial investment in these affiliates but receive licensing fees from them for the use of our name and our databases. Licensing fees are less than 1% of our net revenue.
Information by Geographic Segment. We operate our executive search and leadership consulting services in three geographic regions: the Americas; Europe, which includes the Middle East and Africa; and Asia Pacific.
Americas. As of December 31, 2010, we had 157 consultants in our Americas segment, which includes the United States, Canada, Mexico and Latin America. The largest offices in this region, as defined by net revenue, are located in New York, Chicago and Atlanta.
Europe. As of December 31, 2010, we had 116 consultants in our European segment. Our offices in the United Kingdom, Germany and France produced the highest levels of net revenue in this segment.
Asia Pacific. As of December 31, 2010, we had 74 consultants in our Asia Pacific segment. China (including Hong Kong), Australia/New Zealand and Singapore produced the highest levels of net revenue in this segment.
The relative percentages of net revenue attributable to each segment were as follows:
| Year Ended December 31, | ||||||||||||
| 2010 | 2009 | 2008 | ||||||||||
| Americas |
52 | % | 51 | % | 51 | % | ||||||
| Europe |
26 | % | 30 | % | 33 | % | ||||||
| Asia Pacific |
22 | % | 19 | % | 16 | % | ||||||
2
Table of Contents
For financial information relating to each geographic segment, see Note 21, Segment Information, in the Notes to Consolidated Financial Statements.
Global Industry Practices. Our executive search business also operates in six broad industry groups: Financial Services, Industrial, Consumer Markets, Global Technology and Services, Life Sciences, and Education and Social Enterprise. These industry categories and their relative sizes, as measured by net revenue for 2010 are as follows:
| Global Industry Practices |
Percentage of Net Revenue |
|||
| Financial Services |
31 | % | ||
| Industrial |
23 | % | ||
| Global Technology & Services |
18 | % | ||
| Consumer Markets |
17 | % | ||
| Life Sciences |
8 | % | ||
| Education and Social Enterprise |
3 | % | ||
| 100 | % | |||
Within each broad industry group are a number of industry sub sectors. Consultants often specialize in one or more sub sectors to provide clients with market intelligence and candidate knowledge specific to their industry. For example, within the Financial Services sector our business is diversified among a number of industry sub sectors including Asset & Wealth Management, Consumer & Commercial Finance, Financial Services Practices & Infrastructure, Investment Banking, Global Markets, Hedge Fund, Insurance, Private Equity Investment Professionals, and Real Estate.
We service our clients through unified global executive search teams who specialize in industry practices. This go-to-market strategy allows us to better leverage our global diversity and market intelligence to provide better client service. Each client is served by one global account team, which we believe is a key differentiator from our competition.
Global Functional Practices. Our executive search consultants also specialize in searches for specific “C-level” functional positions, which are roles that generally report directly to the chief executive officer. These include chief financial officers, chief information officers, chief legal officers, chief marketing officers and chief human resources officers.
Our Global Functional Practices include Chief Executive Officer and Board of Directors; Chief Human Resources Officers; Financial Officers; Information Officers; Interim Executives; Legal, Risk, Compliance & Government Affairs; Marketing, Sales & Strategy Officers; Multicultural & Digital Marketing; Sales Officers; Research & Development; and Supply Chain & Transportation.
Our team of executive search consultants may service clients from any one of our offices around the world. For example, an executive search for a chief financial officer of an industrial company located in the United Kingdom may involve a consultant in the United Kingdom with an existing relationship with the client, another executive search consultant in the United States with expertise in our Industrial practice and a third executive search consultant with expertise in recruiting chief financial officers. This same industrial client may also engage us to perform skill-based assessments for each of its senior managers, which could require the expertise of one of our leadership advisory consultants trained in this service.
Seasonality
There is no discernible seasonality in our business, although as a percentage of total annual net revenue, the first quarter is typically the lowest. Revenue and operating income have historically varied by quarter and are
3
Table of Contents
hard to predict from quarter to quarter. In addition, the volatility in the global economy impacts our quarterly revenue and operating income. On average, the variance between the highest and lowest amount of quarterly net revenue, as expressed as a percentage of annual net revenue, is approximately 5 percentage points.
Clients and Marketing
Our consultants market the firm’s executive search and leadership consulting services through two principal means: targeted client calling and industry networking with clients and referral sources. These efforts are supported by proprietary databases, which provide our consultants with information as to contacts made by their colleagues with particular referral sources, candidates and clients. In addition, we benefit from a significant number of referrals generated by our reputation for high quality service and successfully completed assignments, as well as repeat business resulting from our ongoing client relationships.
Either by agreement with the clients or to maintain strong client relationships, executive search firms generally refrain from recruiting employees of a client, and possibly other entities affiliated with that client, for a specified period of time but typically not more than one year from the commencement of a search. We seek to mitigate any adverse effects of these off-limits arrangements by strengthening our long-term relationships, allowing us to communicate our belief to prospective clients that we can conduct searches without these off-limits arrangements impeding the quality of our work.
No single client accounted for more than 2% of our net revenue in 2010, 2009 or 2008. Our top ten clients in 2010, 2009 and 2008 in aggregate accounted for less than 12% of total net revenue.
Information Management Systems
We rely on technology to support our consultants and staff in the search process. Our technology infrastructure consists of internally developed databases containing candidate profiles and client records, coupled with online services and industry reference sources. We use technology to manage and share information on current and potential clients and candidates, to communicate to both internal and external constituencies and to support administrative functions.
Professional Staff and Employees
Our professionals are generally categorized either as consultants or associates. Associates assist consultants by providing research support, coordinating candidate contact and performing other engagement-related functions. As of December 31, 2010, we had 1,516 full-time equivalent employees, of whom 347 were executive search consultants, 436 were associates and 733 were other search, support and Global Operations Support staff.
In each of the past five years, no single consultant accounted for a material portion of our net revenue. We recruit our consultants from other executive search or human capital firms, or in the case of executive search, consultants new to search who have worked in industries or functions represented by our practices. In the latter case, these are often seasoned executives with extensive contacts and outstanding reputations who are entering the search profession as a second career and who we train in our techniques and methodologies. We are not a party to any collective bargaining agreement, and we consider relations with our employees to be good.
Competition
The executive search industry is highly competitive. While we face competition to some degree from all firms in the industry, we believe our most direct competition comes from four established global retained executive search firms that conduct searches primarily for the most senior-level positions within an organization. In particular, our competitors include Egon Zehnder International, Korn/Ferry International, Russell Reynolds Associates, Inc. and Spencer Stuart & Associates. To a lesser extent, we also face competition from smaller boutique and Internet-based firms that specialize in certain regional markets or industry segments. Each firm with which we compete is also a competitor in the marketplace for effective consultants.
4
Table of Contents
Overall, the search industry has relatively few barriers to entry. Higher barriers exist, however, for global retained executive search firms that can provide leadership consulting services at the senior level. At this level, clients rely more heavily on a search firm’s reputation, global access and the experience level of its consultants. We believe that the segment of executive search in which we compete is more quality-sensitive than price-sensitive. As a result, we compete on the level of service we offer, reflected by our client services specialties and, ultimately, by the quality of our search results. We believe that our emphasis on senior-level executive search, the depth of experience of our search consultants and our global presence enable us to compete favorably with other executive search firms.
Competition in the leadership consulting services markets in which we operate are highly fragmented, with no universally recognized market leaders.
5
Table of Contents
Our executive officers as of March 16, 2011 are as follows:
| Name |
Age | Position With Company | ||||
| L. Kevin Kelly |
45 | President and Chief Executive Officer; Director | ||||
| S. John Kim |
38 | Managing Partner, Global Practices | ||||
| Stephen W. Beard |
39 | Executive Vice President and General Counsel | ||||
| Richard J. Caldera |
53 | Executive Vice President and Chief Human Resources Officer | ||||
| Scott J. Krenz |
59 | Executive Vice President and Chief Financial Officer | ||||
There are no family relationships between any executive officer or director. The following information sets forth the business experience for at least the past five years for each of our executive officers as of March 16, 2011:
L. Kevin Kelly was elected Chief Executive Officer and a Director in September 2006. He was elected President in May 2007. Previously, Mr. Kelly was President, Europe, Middle East, Africa and Asia Pacific from March 2005 to September 2006; Regional Managing Partner, Asia Pacific from September 2002 to March 2005; and Office Managing Partner, Tokyo from February 2002 to September 2002. He joined us in 1997.
S. John Kim joined us in April 2008 and was elected Managing Partner, Global Practices in June 2010. Previously, Mr. Kim was global head of capital markets at another international search firm based in New York; prior to that he was a senior consultant with another large executive search firm based in New York. He focused on executive recruitment in the derivatives, structured products, equity and fixed income sales and trading in New York, London, and Hong Kong. Mr. Kim has also held senior positions at other search firms. During this period, Mr. Kim spent three years in one of the firm’s Seoul, Korea office specializing in senior-level executive search across a number of different industry sectors throughout the Asia Pacific region.
Stephen W. Beard was elected Executive Vice President and General Counsel in November 2010. Mr. Beard was Vice President, Deputy General Council and Chief Compliance Officer from 2008 through November 2010 and Assistant General Counsel from 2003 through 2008. He joined us in 2003. Previously, Mr. Beard worked with Schiff Hardin, LLP, in Chicago where he was a member of the firm’s corporate and securities practice group, representing public and private companies in mergers and acquisitions, corporate finance, securities and corporate governance matters.
Richard J. Caldera joined us in May 2008, when he was elected Executive Vice President and Chief Human Resources Officer. Previously, Mr. Caldera was Senior Vice President, Human Resources, Mergers and Acquisitions, for the Healthcare Sector at Royal Philips Electronics N.V. from 2004 to 2008; Senior Vice President, Human Resources, at Skanska AB from 2002 to 2004; and Vice President and Senior Human Resources Officer, Global Operations at CNA Financial Corporation from 1998 to 2002.
Scott J. Krenz joined us in August 2008, when he was elected Executive Vice President and Chief Financial Officer. Previously, Mr. Krenz was Executive Vice President and Chief Financial Officer at Navigant Consulting from 2007 to 2008; Chief Financial Officer at Sapient Corporation from 2004 to 2006; and held senior finance positions of increasing responsibility at Electronic Data Systems Corporation (EDS) from 1985 to 2004.
6
Table of Contents
In addition to other information in this Form 10-K, the following risk factors should be carefully considered in evaluating our business because such factors may have a significant impact on our business, operating results, cash flows and financial condition. As a result of the risks set forth below and elsewhere in this Form 10-K, and the risks discussed in our other Securities and Exchange Commission filings, actual results could differ materially from those projected in any forward-looking statements.
We depend on attracting and retaining qualified consultants.
Our success depends upon our ability to attract and retain consultants who possess the skills and experience necessary to fulfill our clients’ needs. Our ability to hire and retain qualified consultants could be impaired by any diminution of our reputation, decrease in compensation levels relative to our competitors or modifications of our total compensation philosophy or competitor hiring programs. If we cannot attract, hire and retain qualified consultants, our business, financial condition and results of operations may suffer.
We may not be able to prevent our consultants from taking our clients with them to another firm.
Our success depends upon our ability to develop and maintain strong, long-term relationships with our clients. Although we work on building these relationships between our firm and our clients, in many cases, one or two consultants have primary responsibility for a client relationship. When a consultant leaves one executive search firm and joins another, clients who have established relationships with the departing consultant may move their business to the consultant’s new employer. We may also lose clients if the departing consultant has widespread name recognition or a reputation as a specialist in executing searches in a specific industry or management function. If we fail to limit departing consultants from moving business to another employer, our business, financial condition and results of operations may be adversely affected.
Our success depends on our ability to maintain our professional reputation and brand name.
We depend on our overall professional reputation and brand name recognition to secure new engagements and hire qualified consultants. Our success also depends on the individual reputations of our consultants. We obtain many of our new engagements from existing clients or from referrals by those clients. A client who is dissatisfied with our work can adversely affect our ability to secure new engagements. If any factor hurts our reputation, including poor performance, we may experience difficulties in competing successfully for both new engagements and qualified consultants. Failure to maintain our professional reputation and brand name could seriously harm our business, financial condition and results of operations.
Our net revenue may be affected by adverse economic conditions.
Periods of slowed economic activity, such as that recently experienced, can adversely affect our net revenue. In particular, volatility in the capital markets can affect our net revenue in the Financial Services industry group. Unfavorable changes in economic conditions could cause our business, financial condition and results of operations to suffer.
Because our clients may restrict us from recruiting their employees we may be unable to fill or obtain new executive search assignments.
Clients frequently require us to refrain from recruiting certain of their employees when conducting executive searches on behalf of other clients. These restrictions generally remain in effect for no more than one year following the commencement of an engagement. However, the specific duration and scope of the off-limits arrangements depend on the length of the client relationship, the frequency with which the client engages us to perform searches, the number of assignments we have performed for the client and the potential for future business with the client.
7
Table of Contents
Client restrictions on recruiting their employees could hinder us from fulfilling executive searches. Additionally, if a prospective client believes that we are overly restricted by these off-limits arrangements from recruiting the employees of our existing clients, these prospective clients may not engage us to perform their executive searches. As a result, our business, financial condition and results of operations may suffer.
We face aggressive competition.
The global executive search industry is extremely competitive and highly fragmented. We compete with other large global executive search firms, smaller specialty firms, and more recently with Internet-based firms. Specialty firms can focus on regional or functional markets or on particular industries. Some of our competitors may possess greater resources, greater name recognition and longer operating histories than we do in particular markets or practice areas, or be willing to reduce their fees in order to attract clients and increase market share. There are limited barriers to entry into the search industry and new search firms continue to enter the market. Many executive search firms that have a smaller client base may be subject to fewer off-limits arrangements. In addition, our clients or prospective clients may decide to perform executive searches using in-house personnel. We may not be able to continue to compete effectively with existing or potential competitors. Our inability to meet these competitive challenges could have an adverse impact on our business, financial condition and results of operations.
We rely heavily on information management systems.
Our success depends upon our ability to store, retrieve, process and manage substantial amounts of information. To achieve our goals, we must continue to improve and upgrade our information management systems. We may be unable to license, design and implement, in a cost-effective and timely manner, improved information systems that allow us to compete effectively. In addition, business process reengineering efforts may result in a change in software platforms and programs. Such efforts may result in an acceleration of depreciation expense over the shortened expected remaining life of the software and present transitional problems. In addition, if we experience any interruptions or loss in our information processing capabilities, our business, financial condition and results of operations may suffer.
We face the risk of liability in the services we perform.
We are exposed to potential claims with respect to the executive search process. A client could assert a claim for violations of off-limits arrangements, breaches of confidentiality agreements or professional malpractice. The growth and development of our other leadership advisory services brings with it the potential for new types of claims. In addition, candidates and client employees could assert claims against us. Possible claims include failure to maintain the confidentiality of the candidate’s employment search or for discrimination or other violations of the employment laws or malpractice. In various countries, we are subject to data protection laws impacting the processing of candidate information. We maintain professional liability insurance in amounts and coverage that we believe are adequate; however, we cannot guarantee that our insurance will cover all claims or that coverage will always be available. Significant uninsured liabilities could have a negative impact on our business, financial condition and results of operations.
Our multinational operations may be adversely affected by social, political, legal and economic risks.
We generate substantial revenue outside the United States. We offer our services through a network of offices in 40 countries around the world. We are exposed to the risk of changes in social, political, legal and economic conditions inherent in international operations, which could have a significant impact on our business, financial condition and results of operations. In particular, we conduct business in countries where the legal systems, local laws and trade practices are unsettled and evolving. Commercial laws in these countries are sometimes vague, arbitrary and inconsistently applied. Under these circumstances, it is difficult for us to determine at all times the exact requirements of such local laws. If we fail to comply with local laws, our
8
Table of Contents
business, financial condition and results of operations could suffer. In addition, the global nature of our operations poses challenges to our management, and financial and accounting systems. Failure to meet these challenges could seriously harm our business, financial condition and results of operations.
A significant currency fluctuation between the U.S. dollar and other currencies could adversely impact our operating income.
With our operations in the Americas, Europe and Asia Pacific, we conduct business using various currencies. As we typically transact business in the local currency of our subsidiaries, our profitability may be impacted by the translation of foreign currency financial statements into U.S. dollars. Significant long-term fluctuations in relative currency values, in particular an increase in the value of the U.S. dollar against foreign currencies, could have an adverse effect on our profitability and financial condition.
We may not be able to align our cost structure with net revenue.
We must ensure that our costs and workforce continue to be in proportion to demand for our services. Failure to align our cost structure and headcount with net revenue could adversely affect our business, financial condition, and results of operations.
The global financial crisis could adversely affect the financial position of our clients.
The ongoing financial crisis has tightened credit markets and lowered liquidity levels. Some of our clients may experience serious financial problems due to reduced access to credit and lower revenues resulting in their inability to meet their payment obligation to us.
We may not be able to generate sufficient profits to realize the benefit of our net deferred tax assets.
We establish valuation allowances against deferred tax assets when there is insufficient evidence that we will be able to realize the benefit of these deferred tax assets. We reassess the realizability of the deferred tax assets as facts and circumstances dictate. If after future assessments of the realizability of the deferred tax assets, we determine that a lesser or greater allowance is required, we record a reduction or increase to the income tax expense and the valuation allowance in the period of such determination. The uncertainty surrounding the future realization of our net deferred tax assets could adversely impact our results of operations.
Our inability to successfully integrate consultants hired through acquisitions may have an adverse effect on our business.
We may continue to grow through selective acquisitions, however, we may not be able to identify appropriate acquisition candidates, consummate acquisitions on satisfactory terms or integrate the acquired businesses effectively and profitably into our existing operations. Our future success will depend in part on our ability to complete the integration of acquisitions successfully into our operations. Failure to successfully integrate new employees and complementary businesses may adversely affect our profitability by creating operating inefficiencies that could increase operating expenses as a percentage of net revenues and reduce operating income. Further, after any acquisition, the acquired businesses’ clients may choose not to move their business to us causing an adverse affect on our business, financial condition and results of operations.
We may experience impairment of our goodwill and other intangible assets.
In accordance with generally accepted accounting principles, we perform assessments of the carrying value of our goodwill and other intangible assets at least annually or whenever events occur or circumstances indicate that a carrying amount of these assets may not be recoverable which include, a significant change in business climate, attrition of key personnel, changes in financial condition or results of operations, a prolonged decline in
9
Table of Contents
our stock price and market capitalization, competition , and other factors. In performing these assessments, we must make assumptions regarding the estimated fair value of our goodwill and other intangible assets. These assumptions include estimates of future market growth and trends, forecasted revenue and costs, capital investments, discount rates, and other variables. If the fair market value of one of our reporting units or other long term assets is less than the carrying amount of the related assets, we could be required to record an impairment charge. During 2010, we conducted our annual goodwill impairment assessment which resulted in an estimated fair value over net carrying value of our European reporting unit of approximately five percent. Given the current market conditions and continued economic uncertainty, the fair value of our European reporting unit may deteriorate resulting in an impairment of our goodwill within that unit. Due to continual changes in market and general business conditions, we cannot predict whether, and to what extent, our goodwill and long-lived intangible assets may be impaired in future periods. Any resulting impairment loss could have an adverse impact on our business, financial condition and results of operations.
We have anti-takeover provisions that make an acquisition of us difficult and expensive.
Anti-takeover provisions in our Certificate of Incorporation, our Bylaws and the Delaware laws make it difficult and expensive for someone to acquire us in a transaction which is not approved by our Board of Directors. Some of the provisions in our Certificate of Incorporation and Bylaws include:
| • | a classified board of directors |
| • | limitations on the removal of directors |
| • | limitations on stockholder actions |
| • | the ability to issue one or more series of preferred stock by action of our Board of Directors |
These provisions could discourage an acquisition attempt or other transaction in which stockholders could receive a premium over the current market price for the common stock.
Our ability to access additional credit could be limited.
In the current economic environment, banks can be expected to strictly enforce the terms of our credit agreement. Although we are currently in compliance with the financial covenants of our revolving credit facility, a further deterioration of economic conditions may negatively impact our business resulting in our failure to comply with these covenants, which could limit our ability to borrow funds under our credit facility or from other borrowing facilities in the future. In such circumstances, we may not be able to secure alternative financing or may only be able to do so at significantly higher costs.
ITEM 1B. UNRESOLVED STAFF COMMENTS
None.
Our corporate headquarters is located in Chicago, Illinois. We have leased offices in major metropolitan areas in 33 countries around the world. All of our offices are leased. We do not own any real estate. The aggregate square footage of office space under lease was 620,809 as of December 31, 2010. These office leases call for future minimum lease payments of approximately $213.3 million and have terms that expire between 2011 and 2024, exclusive of renewal options that we can exercise. Approximately 53,000 square feet of office space has been sublet to third parties.
10
Table of Contents
Our office space and future minimum lease payments by geographic segment as of December 31, 2010 are as follows:
| Square Footage |
Office Leases (in millions) |
|||||||
| Americas |
358,083 | $127.1 | ||||||
| Europe |
157,047 | 64.7 | ||||||
| Asia Pacific |
105,679 | 21.5 | ||||||
| Total |
620,809 | $213.3 | ||||||
We have contingent liabilities from various pending claims and litigation matters arising in the ordinary course of our business, some of which involve claims for damages that may be substantial in amount. Some of these matters are covered by insurance. Although our ultimate liability in the matters discussed below cannot be determined, based upon information currently available, we believe the ultimate resolution of such claims and litigation will not have a material adverse effect on our financial condition, results of operations or liquidity.
European Tax Audit
During the fourth quarter of 2005, a European country commenced a tax audit for the years 2001 through 2004, including an examination of our arrangement with professional service companies that provide consulting services to us. On November 24, 2006, the examining tax authority issued a final assessment in the amount for €4.3 million, consisting of unpaid withholding tax, plus unpaid Value Added Tax (“VAT”). We appealed this assessment, however, in accordance with the local law, we were required to provide a bank guarantee to the tax authority. In September 2009, we received a definitive and final ruling that our appeal with respect to the withholding tax portion of the assessment had been decided in our favor, thereby canceling that assessment. We recovered approximately €4.1 million of the original bank guarantee. In May 2010, we received a definite and final ruling that our appeal with respect to the VAT portion of the assessment had been decided in our favor, thereby canceling that assessment, and the remaining guarantee balance was released to us. See Note 5, Restricted Cash and Note 22, Guarantees.
UK Employee Benefits Trust
On January 27, 2010, HM Revenue & Customs (“HMRC”) in the United Kingdom notified us that it was challenging the tax treatment of certain of our contributions in the United Kingdom to an Employee Benefits Trust between 2002 and 2008. HMRC alleges that these contributions should have been subject to Pay As You Earn tax and Class 1 National Insurance Contributions in the United Kingdom; and HMRC is proposing an adjustment to our payroll tax liability for the affected years. The aggregate amount of HMRC’s proposed adjustment is approximately £3.9 million (equivalent to $6.1 million at December 31, 2010). We have appealed the proposed adjustment. At this time, we believe that the likelihood of an unfavorable outcome with respect to the proposed adjustment is not probable and the potential amount of any loss cannot be reasonably estimated. We also believe that the amount of a final adjustment, if any, would not be material to our financial condition.
Employee Litigation
In March 2010, a court of appeals in Europe reversed a 2008 lower court ruling and entered judgment in favor of a former employee. The former employee was separated from us in 2006 and subsequently commenced litigation, which resulted in 2008’s ruling in our favor. As a result of the 2010 reversal, we recorded a charge of $1.0 million reflecting the cost of the award, net of insurance coverage for which we have received commitments at this time. This amount is a component of other charges on the Consolidated Statement of Operations for the year ended December 31, 2010. We have appealed the reversal and are evaluating the availability of additional insurance coverage.
11
Table of Contents
PART II
| ITEM 5. | MARKET FOR REGISTRANT’S COMMON EQUITY, RELATED STOCKHOLDER MATTERS AND ISSUER PURCHASES OF EQUITY SECURITIES |
Market for Registrant’s Common Equity
Our common stock is listed on the Nasdaq Global Stock Market under the symbol “HSII.” The following table sets forth the high and low stock price per share of the common stock for the periods indicated, as reported on the Nasdaq Global Stock Market.
| Year Ended December 31, 2010 |
High | Low | ||||||
| First Quarter |
$ | 32.15 | $ | 24.59 | ||||
| Second Quarter |
30.95 | 21.16 | ||||||
| Third Quarter |
23.30 | 16.29 | ||||||
| Fourth Quarter |
29.90 | 18.22 | ||||||
| Year Ended December 31, 2009 |
||||||||
| First Quarter |
$ | 22.29 | $ | 13.52 | ||||
| Second Quarter |
23.51 | 16.50 | ||||||
| Third Quarter |
26.46 | 15.65 | ||||||
| Fourth Quarter |
31.65 | 21.76 | ||||||
As of March 10, 2011, the last reported price on the Nasdaq Global Stock Market for our common stock was $25.79 per share, and there were 107 stockholders of record of the common stock.
12
Table of Contents
Performance Graph
We have presented below a graph which compares the cumulative total stockholder return on our common shares with the cumulative total stockholder return of the Standard & Poor’s SmallCap 600 Index and the Standard & Poor’s Composite 1500 Human Resource and Employment Services Index. Cumulative total return for each of the periods shown in the performance graph is measured assuming an initial investment of $100 on December 31, 2005.
The stock price performance depicted in this graph is not necessarily indicative of future price performance. This graph will not be deemed to be filed as part of this Form 10-K and will not be deemed to be incorporated by reference by any general statement incorporating this Form 10-K into any filing by us under the Securities Act of 1933 or the Securities Exchange Act of 1934, except to the extent we specifically incorporate this information by reference.
Comparison of Five-Year Cumulative Total Return*
Comparison is among Heidrick & Struggles, the S&P SmallCap 600 Index and the S&P Composite 1500 Human Resource & Employment Services Index. The S&P Composite 1500 Human Resource & Employment Services Index includes 13 companies in related businesses, including Heidrick & Struggles.
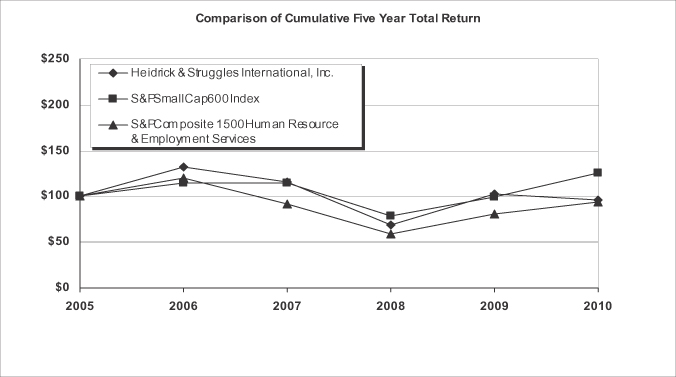
*Assuming $100 invested on 12/31/05 in HSII or index, including reinvestment of dividends.
Source: Standard & Poor’s
13
Table of Contents
Dividends
Since September 2007, we have paid a quarterly cash dividend of $0.13 per share as approved by our Board of Directors. In 2010, the total cash dividend paid was $0.52 per share.
The following table outlines the record date, payment date and amount of quarterly cash dividends paid during 2009 and 2010:
|
Quarter |
Record Date |
Payment Date |
Dividends | |||
| Q4 2008 |
February 6, 2009 |
February 20, 2009 | $2.1 | |||
| Q1 2009 |
May 1, 2009 |
May 15, 2009 | 2.2 | |||
| Q2 2009 |
August 7, 2009 |
August 21, 2009 | 2.2 | |||
| Q3 2009 |
November 6, 2009 |
November 20, 2009 | 2.2 | |||
| Q4 2009 |
February 5, 2010 |
February 19, 2010 | 2.2 | |||
| Q1 2010 |
May 7, 2010 |
May 21, 2010 | 2.3 | |||
| Q2 2010 |
August 6, 2010 |
August 20, 2010 | 2.3 | |||
| Q3 2010 |
November 5, 2010 |
November 19, 2010 | 2.3 |
Cash dividends payable of $2.3 million related to the fourth quarter 2010 cash dividend, which was paid in the first quarter of 2011, and cash dividends payable of $2.2 million related to the fourth quarter 2009 cash dividend, which was paid in the first quarter of 2010, are accrued in the Consolidated Balance Sheets as of December 31, 2010 and 2009, respectively.
In connection with the quarterly cash dividend, we also pay a dividend equivalent on outstanding restricted stock units. The amounts related to the dividend equivalent payments for restricted stock units are accrued over the vesting period and paid upon vesting. In 2010 and 2009, we paid $0.7 million and $0.6 million, respectively, in dividend equivalent payments.
Issuer Purchases of Equity Securities
The following table provides information related to our purchase of common shares for the quarter ended December 31, 2010. For further information of our share repurchase activity, see “Management’s Discussion and Analysis of Financial Condition and Results of Operations—Liquidity and Capital Resources.”
|
Period |
Total Number of Shares Purchased |
Average Price Paid per Share |
Total Number of Shares Purchased as Part of Publicly Announced Plans or Programs |
Approximate Dollar Value of Shares That May Yet Be Purchased Under Publicly Announced Plans or Programs |
||||||||||||
| Oct. 1, 2010 – Oct. 31, 2010 |
— | $ | — | — | $ | 22,788,650 | ||||||||||
| Nov. 1, 2010 – Nov. 30, 2010 |
— | — | — | 22,788,650 | ||||||||||||
| Dec. 1, 2010 – Dec. 31, 2010 |
— | — | — | 22,788,650 | ||||||||||||
| Total |
— | — | — | |||||||||||||
On May 24, 2007, our Board of Directors authorized management to repurchase shares of our common stock with an aggregate purchase price up to $50 million. We purchased 1,403,738 shares of our common stock for $50 million under the May 2007 authorization, which was completed during the first quarter of 2008.
On February 8, 2008, our Board of Directors authorized management to repurchase shares of our common stock with an aggregate purchase price up to $50 million. As of December 31, 2008, we purchased 951,160 shares of our common stock under the February 2008 authorization for a total of $27.2 million. We intend from time to time and as business conditions warrant, to purchase shares of our common stock on the open market or in negotiated or block trades. No time limit has been set for completion of this program. We did not repurchase any shares during 2009 or 2010. As of December 31, 2010 and 2009, $22.8 million remains available under this authorization.
14
Table of Contents
ITEM 6. SELECTED FINANCIAL DATA
The selected financial data presented below have been derived from our audited consolidated financial statements. The data as of December 31, 2010 and 2009 and for the years ended December 31, 2010, 2009 and 2008 are derived from the audited current and historical consolidated financial statements, which are included elsewhere in this Form 10-K. The data as of December 31, 2008, 2007 and 2006 and for the years ended December 31, 2007 and 2006 are derived from audited historical consolidated financial statements, which are not included in this report. The data set forth is qualified in its entirety by, and should be read in conjunction with, “Management’s Discussion and Analysis of Financial Condition and Results of Operations,” the audited consolidated financial statements, the notes thereto, and the other financial data and statistical information included in this Form 10-K.
| Year Ended December 31, | ||||||||||||||||||||
| 2010 | 2009 | 2008 | 2007 | 2006 | ||||||||||||||||
| (in thousands, except per share and other operating data) | ||||||||||||||||||||
| Statement of Operations Data: |
||||||||||||||||||||
| Revenue: |
||||||||||||||||||||
| Revenue before reimbursements (net revenue) |
$ | 493,091 | $ | 395,651 | $ | 615,904 | $ | 619,654 | $ | 478,523 | ||||||||||
| Reimbursements |
20,145 | 19,067 | 28,956 | 28,612 | 23,471 | |||||||||||||||
| Total revenue |
513,236 | 414,718 | 644,860 | 648,266 | 501,994 | |||||||||||||||
| Operating expenses: |
||||||||||||||||||||
| Salaries and employee benefits |
340,178 | 281,545 | 435,306 | 418,952 | 328,714 | |||||||||||||||
| General and administrative expenses |
130,622 | 115,758 | 125,061 | 121,198 | 99,352 | |||||||||||||||
| Other charges |
4,218 | (1) | — | — | — | — | ||||||||||||||
| Reimbursed expenses |
20,145 | 19,067 | 28,956 | 28,612 | 23,471 | |||||||||||||||
| Restructuring and impairment charges |
1,621 | (2) | 26,720 | (4) | — | — | 408 | |||||||||||||
| Other operating income |
(1,072 | )(3) | (1,661 | )(5) | — | — | — | |||||||||||||
| Total operating expenses |
495,712 | 441,429 | 589,323 | 568,762 | 451,945 | |||||||||||||||
| Operating income (loss) |
17,524 | (26,711 | ) | 55,537 | 79,504 | 50,049 | ||||||||||||||
| Non-operating income (expense): |
||||||||||||||||||||
| Interest income, net |
813 | 1,201 | 5,103 | 8,035 | 6,257 | |||||||||||||||
| Other, net |
(1,389 | ) | (4,189 | )(6) | 1,613 | (404 | ) | (1,040 | ) | |||||||||||
| Net non-operating income (expense) |
(576 | ) | (2,988 | ) | 6,716 | 7,631 | 5,217 | |||||||||||||
| Income (loss) before income taxes |
16,948 | (29,699 | ) | 62,253 | 87,135 | 55,266 | ||||||||||||||
| Provision for (benefit from) income taxes |
9,455 | (8,791 | ) | 23,179 | 30,672 | 21,023 | ||||||||||||||
| Net income (loss) |
$ | 7,493 | $ | (20,908 | ) | $ | 39,074 | $ | 56,463 | $ | 34,243 | |||||||||
| Basic earnings (loss) per common share |
$ | 0.43 | $ | (1.24 | ) | $ | 2.33 | $ | 3.16 | $ | 1.91 | |||||||||
| Basic weighted average common shares outstanding |
17,437 | 16,901 | 16,747 | 17,854 | 17,925 | |||||||||||||||
| Diluted earnings (loss) per common share |
$ | 0.42 | $ | (1.24 | ) | $ | 2.20 | $ | 2.97 | $ | 1.81 | |||||||||
| Diluted weighted average common shares outstanding |
17,869 | 16,901 | 17,727 | 18,984 | 18,916 | |||||||||||||||
| Dividends per share |
$ | 0.52 | $ | 0.52 | $ | 0.52 | $ | 0.26 | — | |||||||||||
| Balance Sheet Data (at end of period): |
||||||||||||||||||||
| Working capital |
$ | 140,010 | $ | 127,661 | $ | 140,139 | $ | 117,861 | $ | 135,880 | ||||||||||
| Total assets |
545,027 | 474,847 | 590,303 | 616,884 | 513,309 | (7) | ||||||||||||||
| Long-term debt, less current maturities |
— | — | — | — | — | |||||||||||||||
| Stockholders’ equity |
294,542 | 290,852 | 306,304 | 309,800 | 263,705 | |||||||||||||||
| Other Operating Data: |
||||||||||||||||||||
| Average number of consultants during the period |
353 | 385 | 413 | 401 | 348 | |||||||||||||||
15
Table of Contents
Notes to Selected Financial Data:
| (1) | In 2010, we recorded other charges of $4.2 million, which consists of $3.2 million of accelerated occupancy costs and depreciation, dilapidation costs, and professional fees related to the settlement of our lease obligations for our former London office which we vacated and $1.0 million due to an unfavorable judgment in a lawsuit filed by a former European employee separated from us in 2006. See Note 18, Other Charges, in the Notes to Consolidated Financial Statements. |
| (2) | In 2010, we recorded restructuring charges of $1.6 million. These charges consist of $0.6 million of severance associated with reductions in our workforce of 19 employees globally in connection with continued initiatives to reduce our overall costs and improve operational efficiencies and $1.0 million related to the default of two of our subtenants in previously restructured offices. By segment, the restructuring charges recorded in 2010 were $1.0 million in the Americas, $0.3 million in Europe, and $0.3 million in Global Operations Support. |
| (3) | In 2010, as a result of continued lower than expected 2010 revenue production from consultants acquired in the Ray and Berndston Sp. z o. o acquisition, we performed a fair value assessment of the potential future earnout payments under the purchase agreement. This assessment indicated that there would not be any future earnout payments and resulted in a $1.1 million adjustment. Under the acquisition method of accounting for business combinations, we recognized the fair value adjustment as other operating income in the Consolidated Statement of Operations. |
| (4) | In 2009, we recorded restructuring charges of $22.9 million in connection with initiatives to reduce overall costs and improve operational efficiencies. These charges relate to severance and other employee-related costs associated with reductions in our workforce of 363 employees globally and included 75 executive search consultants. By segment, the restructuring charges recorded in 2009 were $9.5 million in the Americas, $9.5 million in Europe, $2.4 million in Asia Pacific and $1.5 million in Global Operations Support. Additionally, during 2009 we recorded a reduction of $0.3 million in Europe related to a previously restructured office. As a result of our workforce reductions in January and May 2009 and continued business and economic uncertainty, we performed an evaluation of the remaining client relationship intangible asset associated with our 2006 acquisition of Highland Partners. Based on this analysis, we recorded an impairment charge related to the Americas region of $3.8 million. Additionally, the deterioration in business performance from the consultants acquired in the Ray and Berndtson Sp. z o. o acquisition triggered a review of the client relationship intangible assets associated with this acquisition, resulting in an impairment charge in the European region of $0.2 million. See Note 10, Goodwill and Other Intangible Assets, in the Notes to Consolidated Financial Statements. |
| (5) | In 2009, as a result of significantly lower than expected 2009 revenue production from consultants acquired in the Ray and Berndtson Sp. z o. o acquisition and uncertainty regarding their future performance, we performed a fair value assessment of the potential future earnout payments under the purchase agreement. This assessment resulted in a $1.7 million reduction to the original earnout accrual. Under the acquisition method of accounting for business combinations, we recognized the fair value adjustment as other operating income in the Consolidated Statement of Operations. |
| (6) | In 2009, we wrote-off our investment in VisualCV, Inc. of $3.0 million. |
| (7) | In 2007, we determined that the UK Employee Benefit Trust should not be consolidated and as a result reduced total assets and liabilities by $6.5 million in 2006. |
16
Table of Contents
| ITEM 7. | MANAGEMENT’S DISCUSSION AND ANALYSIS OF FINANCIAL CONDITION AND RESULTS OF OPERATIONS |
Management’s Discussion and Analysis of Financial Condition and Results of Operations as well as other sections of this annual report on Form 10-K contain forward-looking statements. The Private Securities Litigation Reform Act of 1995 provides a safe harbor for forward-looking statements. The forward-looking statements are based on current expectations, estimates, forecasts and projections about the industry in which we operate and management’s beliefs and assumptions. Forward-looking statements may be identified by the use of words such as “expects,” “anticipates,” “intends,” “plans,” “believes,” “seeks,” “estimates,” “projects,” “forecasts,” and similar expressions. Forward-looking statements are not guarantees of future performance and involve certain known and unknown risks, uncertainties and assumptions that are difficult to predict. Actual outcomes and results may differ materially from what is expressed, forecasted or implied in the forward-looking statements. Factors that may affect the outcome of the forward-looking statements include, among other things, our ability to attract and retain qualified executive search consultants; further declines in the global economy and our ability to execute successfully through business cycles; the timing, speed or robustness of any future economic recovery; social or political instability in markets where we operate, the impact of foreign currency exchange rate fluctuations; price competition; the ability to forecast, on a quarterly basis, variable compensation accruals that ultimately are determined based on the achievement of annual results; our ability to realize our tax losses; the timing of the establishment or reversal of valuation allowance on deferred tax assets; the mix of profit and loss by country; an impairment of our goodwill and other intangible assets; delays in the development and/or implementation of new technology and systems; and the ability to meet and achieve the expected savings resulting from cost-reduction initiatives and restructuring activities. For more information on the factors that could affect the outcome of forward-looking statements, see Risk Factors in Item 1A of this Form 10-K. We caution the reader that the list of factors may not be exhaustive. We undertake no obligation to update publicly any forward-looking statements, whether as a result of new information, future events or otherwise.
Executive Overview
Our Business
We are a leadership advisory firm providing executive search and leadership consulting services. We help our clients build leadership teams by facilitating the recruitment, management and deployment of senior executives. Focusing on top-level services offers us several advantages that include access to and influence with key decision makers, increased potential for recurring search consulting engagements, higher fees per search, enhanced brand visibility, and a leveraged global footprint, which create added barriers to entry for potential competitors. Working at the top of client organizations also allows us to attract and retain high-caliber consultants.
In addition to executive search, we provide a range of leadership consulting services to clients. These services include succession planning, executive assessment, talent retention management, executive development, transition consulting for newly appointed executives, and mergers and acquisitions human capital integration consulting.
We provide our services to a broad range of clients through the expertise of 347 consultants located in 36 countries throughout the world as of December 31, 2010. Our executive search services are provided on a retained basis. Revenue before reimbursements of out-of-pocket expenses (“net revenue”) consists of retainers and indirect expenses billed to clients. Typically, we are paid a retainer for our executive search services equal to approximately one-third of the estimated first year compensation for the position to be filled. In addition, if the actual compensation of a placed candidate exceeds the estimated compensation, we often are authorized to bill the client for one-third of the excess. Indirect expenses are calculated as a percentage of the retainer with certain dollar limits per search.
17
Table of Contents
Key Performance Indicators
We manage and assess Heidrick & Struggles’ performance through various means, with the primary financial and operational measures including net revenue growth, operating income, operating margin, consultant headcount, confirmation trends, consultant productivity, and average revenue per search or project.
Revenue growth is driven by a combination of an increase in executive search wins and leadership consulting projects, higher consultant productivity, higher average revenue per search or project and the hiring of additional consultants. With the exception of compensation expense, incremental increases in revenue do not necessarily result in proportional increases in costs, particularly operating and administrative expenses, thus potentially improving operating margins.
The number of consultants, confirmation trends, number of searches or projects completed, productivity levels and the average revenue per search or project will vary from quarter to quarter, affecting revenue growth and operating margin.
Our Compensation Model
At the consultant level, individuals are largely rewarded for their performance based on a system that directly ties a significant portion of their compensation to the amount of net revenue for which they are responsible. A proportion of the rewards is based upon individual performance against a series of non-financial measures. Credit towards the variable portion of a consultant’s compensation is earned by generating net revenue for winning and executing work. Each quarter, we review and update the expected annual performance of all consultants and accrue variable compensation accordingly. The amount of variable compensation that is accrued for each consultant is based on a tiered payout model and adjusted for overall Company performance. The more net revenue that is generated by the consultant, the higher the percentage credited towards the consultant’s variable compensation and thus accrued by our company as expense. The mix of individual consultants who generate the revenue can significantly affect the total amount of compensation expense recorded and thus, operating margins. As a result, the variable portion of the compensation expense may fluctuate significantly from quarter to quarter. The total variable compensation is discretionary and is based on company-wide profitability targets approved by the Human Resources and Compensation Committee of the Board of Directors.
In 2008, the portion of bonus previously deferred into restricted stock units was changed to be in the form of deferred cash to be paid ratably over a three year period for consultants and management globally. In 2008, a premium of 10% was applied to the bonus amount deferred. In 2009 and 2010, we continued with the bonus cash deferral arrangement but did not apply a premium to the amounts deferred. The portion of the bonus that is deferred varies between 10% and 15% depending on the employee’s level or position.
The compensation expense related to the amounts being deferred is recognized on a graded vesting attribution method over the requisite service period. This service period begins on January 1 of the respective fiscal year and continues through the deferral date which coincides with our bonus payments in the first quarter of the following year and for an additional three year vesting period. The deferrals vest and are paid ratably over the three year vesting period and are recorded in accrued salaries and employee benefits and other non-current liabilities in the Consolidated Balance Sheets. We will continue to grant restricted stock units under other existing programs.
2010 Overview
Consolidated net revenue of $493.1 million increased 24.6% or $97.4 million in 2010, compared to 2009. Net revenue increased 26.9% in the Americas, 6.6% in Europe and 47.5% in Asia Pacific. Consultant productivity measured by net revenue per consultant increased to $1.4 million for the year ended December 31, 2010 compared to $1.0 million for the year ended December 31, 2009. Average revenue per executive search was $108,500 for the year ended December 31, 2010 compared to $101,000 for the year ended December 31, 2009.
18
Table of Contents
Operating income as a percentage of net revenue was 3.6% in 2010 compared to operating loss as a percentage of net revenue of 6.8% in 2009 primarily as a result of an increase in net revenue of 24.6%, a decrease in restructuring and impairment charges of $25.1 million, offset by increases in salaries and employee benefits expense of 20.8%, general and administrative expenses of 12.8%, other charges of $4.2 million and a decrease in other operating income of $0.6 million. Salaries and employee benefits expense as a percentage of net revenue decreased from 71.2% in 2009 to 69.0% in 2010. General and administrative expenses as a percentage of net revenue decreased from 29.3% in 2009 to 26.5% in 2010.
We ended the year with a combined cash and cash equivalents balance of $181.1 million, an increase of $58.1 million compared to a combined cash and cash equivalents balance of $123.0 million at December 31, 2009. We pay the majority of bonuses in the first quarter following the year in which they were earned. Employee bonuses are accrued throughout the year and are based on the Company’s performance and the performance of the individual employee. In early 2011, we expect to pay approximately $91 million related to the 2010 bonus accruals.
2011 Outlook
We are currently forecasting 2011 net revenue of between $515 million and $545 million and an operating margin of between 6 and 10 percent, for the year ending December 31, 2011.
Results of Operations
The following table summarizes, for the periods indicated, the results of operations (in thousands):
| Year Ended December 31, | ||||||||||||
| 2010 | 2009 | 2008 | ||||||||||
| Revenue: |
||||||||||||
| Revenue before reimbursements (net revenue) |
$ | 493,091 | $ | 395,651 | $ | 615,904 | ||||||
| Reimbursements |
20,145 | 19,067 | 28,956 | |||||||||
| Total revenue |
513,236 | 414,718 | 644,860 | |||||||||
| Operating expenses (income): |
||||||||||||
| Salaries and employee benefits |
340,178 | 281,545 | 435,306 | |||||||||
| General and administrative expenses |
130,622 | 115,758 | 125,061 | |||||||||
| Other charges |
4,218 | — | — | |||||||||
| Reimbursed expenses |
20,145 | 19,067 | 28,956 | |||||||||
| Restructuring and impairment charges |
1,621 | 26,720 | — | |||||||||
| Other operating income |
(1,072 | ) | (1,661 | ) | — | |||||||
| Total operating expenses |
495,712 | 441,429 | 589,323 | |||||||||
| Operating income (loss) |
17,524 | (26,711 | ) | 55,537 | ||||||||
| Non-operating income (expense): |
||||||||||||
| Interest income, net |
813 | 1,201 | 5,103 | |||||||||
| Other, net |
(1,389 | ) | (4,189 | ) | 1,613 | |||||||
| Net non-operating income (expense) |
(576 | ) | (2,988 | ) | 6,716 | |||||||
| Income (loss) before income taxes |
16,948 | (29,699 | ) | 62,253 | ||||||||
| Provision for (benefit from) income taxes |
9,455 | (8,791 | ) | 23,179 | ||||||||
| Net income (loss) |
$ | 7,493 | $ | (20,908 | ) | $ | 39,074 | |||||
19
Table of Contents
The following table summarizes, for the periods indicated, our selected statements of operations data as a percentage of revenue before reimbursements (net revenue):
| Year Ended December 31, | ||||||||||||
| 2010 | 2009 | 2008 | ||||||||||
| Revenue: |
||||||||||||
| Revenue before reimbursements (net revenue) |
100.0 | % | 100.0 | % | 100.0 | % | ||||||
| Reimbursements |
4.1 | 4.8 | 4.7 | |||||||||
| Total revenue |
104.1 | 104.8 | 104.7 | |||||||||
| Operating expenses: |
||||||||||||
| Salaries and employee benefits |
69.0 | 71.2 | 70.7 | |||||||||
| General and administrative expenses |
26.5 | 29.3 | 20.3 | |||||||||
| Other charges |
0.9 | — | — | |||||||||
| Reimbursements |
4.1 | 4.8 | 4.7 | |||||||||
| Restructuring and impairment charges |
0.3 | 6.8 | — | |||||||||
| Other operating income |
(0.2 | ) | (0.4 | ) | — | |||||||
| Total operating expenses |
100.5 | 111.6 | 95.7 | |||||||||
| Operating income (loss) |
3.6 | (6.8 | ) | 9.0 | ||||||||
| Non-operating income (expense) |
||||||||||||
| Interest income, net |
0.2 | 0.3 | 0.9 | |||||||||
| Other, net |
(0.3 | ) | (1.1 | ) | 0.2 | |||||||
| Net non-operating income (expense) |
(0.1 | ) | (0.8 | ) | 1.1 | |||||||
| Income (loss) before income taxes |
3.4 | (7.5 | ) | 10.1 | ||||||||
| Provision for (benefit from) income taxes |
1.9 | (2.2 | ) | 3.8 | ||||||||
| Net income (loss) |
1.5 | % | (5.3 | )% | 6.3 | % | ||||||
| Note: | Totals and subtotals may not equal the sum of individual line items due to rounding. |
We operate our executive search and leadership consulting services in three geographic regions: the Americas; Europe, which includes the Middle East and Africa; and Asia Pacific.
For segment purposes, reimbursements of out-of-pocket expenses classified as revenue, restructuring and impairment charges and other operating income are reported separately and, therefore, are not included in the results of each geographic region. We believe that analyzing trends in revenue before reimbursements (net revenue), analyzing operating expenses as a percentage of net revenue, and analyzing operating income (loss) excluding restructuring and impairment charges and other operating income, more appropriately reflects our core operations. By segment the restructuring charges recorded in 2010 were $1.0 million in the Americas, $0.3 million in the European region, and $0.3 million in Global Operations Support. The other operating income of $1.1 million in 2010 was recorded in the European region. By segment, the restructuring and impairment charges recorded in 2009 were $13.3 million in the Americas, $9.5 million in Europe, $2.4 million in Asia Pacific and $1.5 million in Global Operations Support. The other operating income of $1.7 million in 2009 was recorded in the European region.
20
Table of Contents
The following table sets forth, for the periods indicated, our revenue and operating income (loss) by segment (in thousands):
| Year Ended December 31, | ||||||||||||
| 2010 | 2009 | 2008 | ||||||||||
| Revenue: |
||||||||||||
| Americas |
$ | 255,690 | $ | 201,530 | $ | 314,412 | ||||||
| Europe |
127,267 | 119,441 | 201,462 | |||||||||
| Asia Pacific |
110,134 | 74,680 | 100,030 | |||||||||
| Revenue before reimbursements (net revenue) |
493,091 | 395,651 | 615,904 | |||||||||
| Reimbursements |
20,145 | 19,067 | 28,956 | |||||||||
| Total |
$ | 513,236 | $ | 414,718 | $ | 644,860 | ||||||
| Operating income (loss): |
||||||||||||
| Americas |
$ | 40,307 | $ | 18,509 | $ | 45,783 | ||||||
| Europe |
(604 | ) | 2,741 | 24,479 | ||||||||
| Asia Pacific |
24,517 | 9,457 | 15,351 | |||||||||
| Total regions |
64,220 | 30,707 | 85,613 | |||||||||
| Global Operations Support |
(46,147 | ) | (32,359 | ) | (30,076 | ) | ||||||
| Operating income (loss) before restructuring and impairment charges and other operating income |
18,073 | (1,652 | ) | 55,537 | ||||||||
| Restructuring and impairment charges |
(1,621 | ) | (26,720 | ) | — | |||||||
| Other operating income |
1,072 | 1,661 | — | |||||||||
| Total |
$ | 17,524 | $ | (26,711 | ) | $ | 55,537 | |||||
2010 Compared to 2009
Total revenue. Consolidated total revenue increased $98.5 million, or 23.8%, to $513.2 million in 2010 from $414.7 million in 2009. The increase in total revenue was due to the increase in revenue before reimbursements (net revenue).
Revenue before reimbursements (net revenue). Consolidated net revenue increased $97.4 million, or 24.6%, to $493.1 million in 2010 from $395.7 million in 2009. The positive impact of exchange rate fluctuations resulted in approximately one percentage point of the increase in 2010. Net revenue increased in all regions and industry groups with significant growth in the Global Technology & Services and Financial Services industry groups. In 2010, the number of confirmed executive searches increased 14.5% to 4,181 from 3,651 in 2009. The number of consultants decreased to 347 as of December 31, 2010 compared to 359 as of December 31, 2009. Productivity, as measured by annualized net revenue per consultant, increased to $1.4 million for the year ended December 31, 2010 from $1.0 million for the year ended December 31, 2009, and average revenue per executive search was $108,500 for the year ended December 31, 2010 compared to $101,000 for the year ended December 31, 2009.
Net revenue in the Americas was $255.7 million in 2010, an increase of $54.2 million, or 26.9% from $201.5 million in 2009. The positive impact of exchange rate fluctuations in Canada and Latin America resulted in approximately one percentage point of the increase in 2010. Net revenue in Europe was $127.3 million in 2010, an increase of $7.8 million, or 6.6% from $119.4 million in 2009. The negative impact of exchange rate fluctuations offset the increase in net revenue by approximately 3 percentage points in 2010. Net revenue in Asia Pacific was $110.1 million in 2010, an increase of $35.5 million, or 47.5% from $74.7 million in 2009. The positive impact of exchange rate fluctuations resulted in approximately 9 percentage points of the increase in 2010.
21
Table of Contents
Salaries and employee benefits. Consolidated salaries and employee benefits expense increased $58.6 million or 20.8% to $340.2 million in 2010 from $281.5 million in 2009. The increase in salaries and employee benefits expense is primarily a result of a $62.7 million increase in performance-related compensation expense reflecting higher bonus accruals associated with higher net revenue. Included in this increase is approximately $7.1 million of discretionary consultant compensation related to individual performance factors. The increase in performance-related compensation expense was offset by a $4.1 million decrease in fixed compensation primarily related to a year-over-year decline in stock-based compensation of $11.3 million as a result of a decrease in the amount of equity awards granted in 2009 and 2010 and significant forfeitures in 2010, and a $3.9 million decrease in amortization of deferred cash compensation associated with lower 2009 bonus accruals due to lower 2009 net revenue levels and consultant headcount. These decreases were partially offset by a $0.8 million increase in base compensation, payroll taxes, and other employee-related expenses associated with increased headcount and the restoration of salaries following a 5% salary reduction in 2009, additional severance expense of $2.7 million, and $1.5 million primarily due to the reinstatement of the Company’s 401(k) match in 2010. In 2010, we issued special recognition awards to certain of our consultants in order to incentivize future service to the Company which resulted in additional fixed compensation expense of $6.1 million. At December 31, 2010 we had 1,516 total employees, up 8.3% compared to 1,400 total employees at December 31, 2009.
Excluding a negative impact of $3.7 million due to exchange rate fluctuations, which we believe provides a better comparison of operational performance, consolidated salaries and employee benefits expense increased by 19.6% versus 20.8% as reported in 2010 compared to 2009.
As a percentage of net revenue, salaries and employee benefits expense decreased to 69.0% in 2010 from 71.2% in 2009.
General and administrative expenses. Consolidated general and administrative expenses increased $14.9 million, or 12.8%, to $130.6 million in 2010 from $115.8 million in 2009. The increase reflects $8.0 million in fees for professional services primarily related to investments in various initiatives intended to yield cost savings and improve productivity. These initiatives include additional hiring, increased training and development programs, the outsourcing of a portion of our information technology function, and the ongoing development of our internal search system. The increase also included non-recurring legal costs incurred in 2010, offset by a decrease in expenses related to a process improvement project aimed at increasing operational effectiveness and efficiency, which we substantially completed during 2010.
Additionally, we incurred $5.0 million in travel expenses related to training and business development initiatives reinstated in 2010, $2.5 million of expense related to the worldwide consultants’ meeting held in the second quarter of 2010, $1.9 million of temporary employee and hiring expenses, $1.6 million of increased bad debt expenses and $0.4 million of other operating and infrastructure expenses. During 2010, we recorded impairment charges of $0.7 million associated with intangible assets related to our Schwab Enterprise, LLC, 75 Search Partners, LLC and Ray and Berndtson Sp. z o. o acquisitions. These increases were partially offset by decreases in premise-related costs and depreciation expense of $3.6 million and $1.6 million, respectively, as a result of favorable lease terminations in the Americas and European regions.
Excluding a negative impact of $1.1 million due to exchange rate fluctuations, which we believe provides a better comparison of operational performance, consolidated general and administrative expenses increased by 11.9% versus 12.8% as reported in 2010 compared to 2009.
As a percentage of net revenue, general and administrative expenses decreased to 26.5% in 2010 from 29.3% in 2009.
Other charges. The other charges of $4.2 million for the year ended December 31, 2010 consist of $3.2 million of accelerated occupancy costs and depreciation, dilapidation costs, and professional fees related to the
22
Table of Contents
settlement of our lease obligations with our former London office which we vacated during 2010 and $1.0 million due to an unfavorable judgment in a lawsuit filed by a former European employee separated from us in 2006.
Restructuring and impairment charges. In 2010, we recorded restructuring charges of $1.6 million. These charges consist of $0.6 million of severance associated with reductions in our workforce of 19 employees globally in connection with continued initiatives to reduce our overall costs and improve operational efficiencies and $1.0 million related to the default of two of our subtenants in previously restructured offices. By segment the restructuring charges recorded in the year ended December 31, 2010 were $1.0 million in the Americas, $0.3 million in Europe, and $0.3 million in Global Operations Support.
In 2009, we recorded restructuring charges of $22.9 million in connection with initiatives to reduce overall costs and improve operational efficiencies. These charges relate to severance and other employee-related costs associated with reductions in our workforce of 363 employees globally and included 75 executive search consultants. By segment, the restructuring charges recorded in 2009 were $9.5 million in the Americas, $9.5 million in Europe, $2.4 million in Asia Pacific and $1.5 million in Global Operations Support. Additionally, during 2009 we recorded a reduction of $0.3 million in Europe related to a previously restructured office. As a result of our workforce reductions in January and May 2009 and continued business and economic uncertainty, we performed an evaluation of the remaining client relationship intangible asset associated with our 2006 acquisition of Highland Partners. Based on this analysis, we recorded an impairment charge related to the Americas region of $3.8 million in 2009. Additionally, we recorded an impairment charge of $0.2 million on our client relationship asset associated with our acquisition of Ray and Berndtson Sp. z o. o.
Other operating income. As a result of continued lower than expected 2010 revenue production from consultants acquired in the Ray and Berndtson Sp. z o. o acquisition, we performed a fair value assessment of the potential future earnout payments under the purchase agreement. This assessment indicated that there would not be any future earnout payments and resulted in a $1.1 million adjustment.
As a result of significantly lower than expected 2009 revenue production from consultants acquired in the Ray and Berndtson Sp. z. o. o acquisition, and uncertainty regarding their future performance, we performed a fair value assessment of the potential future earnout payments under the purchase agreement. This assessment resulted in a $1.7 million reduction to the original earnout accrual.
Under the acquisition method of accounting for business combinations, we recognized the 2010 and 2009 fair value adjustments as other operating income in the Consolidated Statements of Operations.
Operating income (loss). Our consolidated operating income was $17.5 million in 2010 compared to an operating loss of $26.7 million in 2009. The increase in operating income is primarily due to an increase in net revenue of $97.4 million and a decrease in restructuring and impairment charges of $25.1 million, offset by increases in salaries and employee benefits expense of $58.6 million, general and administrative expenses of $14.9 million, other charges of $4.2 million, and a decrease in other operating income of $0.6 million.
For segment purposes, restructuring and impairment charges and other operating income are not included in operating income (loss) by geographic region. We believe that analyzing trends in operating income (loss) excluding restructuring and impairment charges and other operating income more appropriately reflects our core operations.
The Americas reported operating income of $40.3 million in 2010, compared to $18.5 million in 2009. The increase in operating income of $21.8 million is due to an increase in net revenue of $54.2 million and lower general and administrative expenses of $0.3 million offset by a $32.7 million increase in salaries and employee benefits expense.
23
Table of Contents
Europe reported an operating loss of $0.6 million in 2010, compared to operating income of $2.7 million in 2009. The decrease in operating income is due to a $5.0 million increase in salaries and employee benefits expense, other charges of $4.2 million and a $1.9 million increase in general and administrative expenses. These increases were partially offset by a $7.8 million increase in net revenue. The increase in salaries and employee benefits expense primarily reflects higher bonus accruals associated with higher net revenue levels in 2010. Other charges of $4.2 million include $3.2 million related to exit and settlement expenses for a lease obligation at our former London office, and $1.0 million due to an unfavorable judgment in a lawsuit filed by a former European employee separated from us in 2006.
Asia Pacific reported operating income of $24.5 million in 2010, compared to $9.5 million in 2009. The increase in operating income of $15.0 million is due to higher net revenue of $35.5 million offset by a $16.1 million increase in salaries and employee benefits expense and a $4.4 million increase in general and administrative expenses.
Global Operations Support expenses in 2010 were $46.1 million, an increase of $13.8 million, compared to $32.4 million in 2009. General and administrative expenses increased $8.9 million and salaries and employee benefits expense increased $4.9 million. The increase in general and administrative expenses is due to $5.2 million in fees for professional services associated with investments in various initiatives intended to yield cost savings and increase productivity, including the outsourcing of various aspects of Global Operations Support, hiring, and training and development programs. The increase also included non-recurring legal fees, $2.5 million related to the worldwide consultants’ meeting held in the second quarter of 2010, and $2.8 million reflecting several initiatives reinstated in 2010 including travel, hiring and temporary employee expenses, offset by a decrease of $1.6 million in expenses related to a process improvement project aimed at increasing operational effectiveness and efficiency which we substantially completed during 2010. The increase in compensation expense is primarily due to increased base compensation expense related to the restoration of salaries following a 5% salary reduction in place for 2009, $2.4 million of search and Global Operations Support expenses previously provided through the regions that has been provided through our Global Business Services group since May 2010, and $2.1 million of severance expense, offset by a $0.2 million reduction in stock-based compensation expense as a result of significant forfeitures in 2010 and an overall decrease in the amount of equity awards granted in 2009 and 2010.
Net non-operating income (expense). Net non-operating expense was $0.6 million in 2010 compared to net non-operating expense of $3.0 million in 2009.
Net interest income in 2010 was $0.8 million, compared to $1.2 million in 2009. Interest income decreased primarily due to lower average interest rates in 2010 compared to 2009.
Net other non-operating expense was $1.4 million in 2010, compared to net other non-operating expense of $4.2 million in 2009. Net other non-operating expense consists of exchange gains and losses on cash and intercompany balances, which are denominated in currencies other than the functional currency and are not considered permanent in nature. Additionally, during 2010, we identified that we were not properly accounting for our non-controlling interest associated with our operations in China. As a result, we recorded a cumulative adjustment of $1.1 million in net other non-operating expense. During 2009, we wrote-off our investment in VisualCV, Inc. of $3.0 million.
Income taxes. In 2010, we reported income before taxes of $16.9 million and recorded an income tax provision of $9.5 million. Our effective income tax rate for 2010 was 55.8%. This tax rate is higher than the statutory tax rate due to losses not benefited in several foreign jurisdictions, the non-deductibility of certain costs like vacating our former London office, and tax costs associated with the domestic inclusion of foreign earnings.
In 2009, we reported a loss before taxes of $29.7 million and recorded an income tax benefit of $8.8 million. The effective tax rate for 2009 was 29.6%.
24
Table of Contents
2009 Compared to 2008
Total revenue. Consolidated total revenue decreased $230.1 million, or 35.7%, to $414.7 million in 2009 from $644.9 million in 2008. The decrease in total revenue was due to the decrease in revenue before reimbursements (net revenue).
Revenue before reimbursements (net revenue). Consolidated net revenue decreased $220.3 million, or 35.8%, to $395.7 million in 2009 from $615.9 million in 2008. The negative impact of exchange rate fluctuations resulted in approximately 3 percentage points of the decline in 2009. Net revenue declined in all regions and industry groups. In 2009, the number of confirmed executive searches decreased 24.1% to 3,651 from 4,812 in 2008. The number of consultants decreased to 359 as of December 31, 2009 compared to 419 as of December 31, 2008. Productivity, as measured by annualized net revenue per consultant, decreased to $1.0 million for the year ended December 31, 2009 from $1.5 million for the year ended December 31, 2008, and average revenue per executive search decreased to $101,000 for the year ended December 31, 2009 compared to $122,600 for the year ended December 31, 2008.
Net revenue in the Americas was $201.5 million in 2009, a decrease of $112.9 million, or 35.9% from $314.4 million in 2008. The negative impact of exchange rate fluctuations in Canada and Latin America resulted in less than 1 percentage point of the decline in 2009. Net revenue in Europe was $119.4 million in 2009, a decrease of $82.0 million, or 40.7% from $201.5 million in 2008. The negative impact of exchange rate fluctuations resulted in approximately 6 percentage points of the decline in 2009. Net revenue in Asia Pacific was $74.7 million in 2009, a decrease of $25.4 million, or 25.3% from $100.0 million in 2008. The negative impact of exchange rate fluctuations resulted in approximately 2 percentage points of the decline in 2009.
Salaries and employee benefits. Consolidated salaries and employee benefits expense decreased $153.8 million, or 35.3%, to $281.5 million in 2009 from $435.3 million in 2008. The decrease in salaries and employee benefits expense is primarily a result of a $105.9 million decrease in performance-related compensation expense related to lower net revenue and operating margin in 2009. Additionally, fixed compensation expense decreased by $47.9 million primarily related to the two workforce reductions, base salary reductions and a decrease in severance expense of $3.8 million in 2009 as compared to 2008. At December 31, 2009 we had 1,400 total employees, down 20.0% compared to 1,751 total employees at December 31, 2008.
As a percentage of net revenue, salaries and employee benefits expense increased to 71.2% in 2009 from 70.7% in 2008. Although we implemented various cost savings initiatives in 2009, this percentage increase reflects a more rapid decline in our revenue than the reductions in our cost structure. Excluding a positive impact of $11.4 million due to exchange rate fluctuations, which we believe provides a better comparison of operational performance, consolidated salaries and employee benefits expense decreased by approximately 32.7% versus 35.3% as reported in 2009 compared to 2008.
General and administrative expenses. Consolidated general and administrative expenses decreased $9.3 million, or 7.4%, to $115.8 million in 2009 from $125.1 million in 2008. The decrease primarily reflects savings of $12.5 million associated with cost containment initiatives, a $2.6 million decrease in bad debt expense and a $1.4 million decrease in premise related costs. The decrease was partially offset by higher fees for professional services of $6.4 million of which $5.1 million is related to a process improvement project aimed at increasing operational effectiveness and efficiency. Additionally, we wrote-off $0.8 million of costs related to a software development project and $0.4 million of software and maintenance agreement costs associated with VisualCV, Inc. during 2009. Infrastructure and other operating expenses increased by $0.8 million in 2009 as compared to 2008.
As a percentage of net revenue, general and administrative expenses increased to 29.3% in 2009 from 20.3% in 2008. Although we implemented various cost savings initiatives in 2009, this percentage increase reflects a more rapid decline in our revenue than the reductions in our cost structure. Excluding a positive impact of $4.7
25
Table of Contents
million due to exchange rate fluctuations, which we believe provides a better comparison of operational performance, consolidated general and administrative expenses decreased by approximately 3.7% versus 7.4% as reported in 2009 compared to 2008.
Restructuring and impairment charges. In 2009, we recorded restructuring charges of $22.9 million in connection with initiatives to reduce overall costs and improve operational efficiencies. These charges relate to severance and other employee-related costs associated with reductions in our workforce of 363 employees globally and included 75 executive search consultants. By segment, the restructuring charges recorded in 2009 were $9.5 million in the Americas, $9.5 million in Europe, $2.4 million in Asia Pacific and $1.5 million in Global Operations Support. Additionally, during 2009 we recorded a reduction of $0.3 million in Europe related to a previously restructured office. As a result of our workforce reductions in January and May 2009 and continued business and economic uncertainty, we performed an evaluation of the remaining client relationship intangible asset associated with our 2006 acquisition of Highland Partners. Based on this analysis, we recorded an impairment charge related to the Americas region of $3.8 million in 2009. Additionally, we recorded an impairment charge of $0.2 million on our client relationship asset associated with our acquisition of Ray and Berndtson Sp. z o. o.
Other operating income. As a result of significantly lower than expected 2009 revenue production from consultants acquired in the Ray and Berndtson Sp. z o. o acquisition and uncertainty regarding their future performance, we performed a fair value assessment of the potential future earnout payments under the purchase agreement. This assessment resulted in a $1.7 million reduction to the original earnout accrual. Under the acquisition method of accounting for business combinations, we recognized the fair value adjustment as other operating income in the Consolidated Statement of Operations.
Operating income (loss). Our consolidated operating loss was $26.7 million in 2009 compared to operating income of $55.5 million in 2008. The operating loss is primarily due to a decrease in net revenue of $220.3 million and restructuring and impairment charges of $26.7 million, offset by decreases in salaries and employee benefits expense of $153.8 million, general and administrative expenses of $9.3 million, and other operating income of $1.7 million. The reductions made to salaries and employee benefits and continued savings in general and administrative expenses did not keep pace with the sharp decline in net revenue.
For segment purposes, restructuring and impairment charges and other operating income are not included in operating income (loss) by geographic region. We believe that analyzing trends in operating income (loss) excluding restructuring and impairment charges and other operating income more appropriately reflects our core operations.
Each region experienced significant declines in revenue partially offset by a decrease in salary and employee benefits expense and general and administrative expenses. The decrease in salaries and employee benefits expense is due to a decrease in performance-related compensation expense due to lower net revenue and operating margin for 2009, a decrease in fixed salaries related to the workforce and salary reductions in 2009 and lower search support staff costs. The decrease in general and administrative expenses is due to cost containment initiatives including a reduction in travel expenses offset by higher fees for professional services in 2009 compared to 2008.
In the Americas, operating income decreased $27.3 million to $18.5 million in 2009 compared to $45.8 million in 2008. The decrease is due to lower net revenue of $112.9 million offset by an $82.0 million decrease in salaries and employee benefits expense and a $3.6 million decrease in general and administrative expenses.
In Europe, operating income decreased $21.8 million to $2.7 million in 2009 compared to $24.5 million in 2008. The decrease is due to lower net revenue of $82.0 million offset by a $51.5 million decrease in salaries and employee benefits expense and an $8.7 million decrease in general and administrative expenses.
26
Table of Contents
In Asia Pacific, operating income decreased $5.8 million to $9.5 million in 2009 compared to $15.3 million in 2008. The decrease is due to lower net revenue of $25.4 million offset by a $17.5 million decrease in salaries and employee benefits expense and a $2.1 million decrease in general and administrative expenses.
Global Operations Support expenses increased $2.3 million in 2009 to $32.4 million from $30.1 million in 2008. The increase was primarily the result of a $5.1 million increase in general and administrative expenses, offset by a $2.8 million decrease in compensation expense. The $5.1 million increase in general and administrative expense is due to a $6.1 million increase in professional service fees offset by $1.0 million of cost containment initiatives and other operating and infrastructure expenses. The increase in professional service fees is primarily related to a process improvement project aimed at increasing operational effectiveness and efficiency. Additionally, we wrote off $0.8 million of costs related to a software development project. The $2.8 million decrease in compensation expense is primarily due to a reduction in performance-related compensation expense related to lower net revenue and operating margin for 2009. The savings were offset by a $0.5 million write-off of capitalized salaries expense related to a software development project.
Net non-operating income (expense). Net non-operating expense was $3.0 million in 2009 compared to net non-operating income $6.7 million in 2008.
Net interest income in 2009 was $1.2 million, compared to $5.1 million in 2008. The decrease in net interest income as compared to 2008 is due to a lower cash balance and lower interest rates.
Net other non-operating expense was $4.2 million in 2009, compared to net other non-operating income of $1.6 million in 2008. The 2009 non-operating loss primarily reflects the write-off of our investment in VisualCV, Inc. of $3.0 million. The 2008 non-operating income primarily reflects $1.0 million resulting from the recognition of previously capitalized exchange gains due to our 2008 sale of the Portugal business. The remaining other non-operating income (expense) in 2009 and 2008 consists of realized and unrealized gains and losses on our cost and equity method investments and exchange gains and losses on cash and intercompany balances, which are denominated in currencies other than the functional currency and are not considered permanent in nature.
Income taxes. In 2009, we reported a loss before taxes of $29.7 million and recorded an income tax benefit of $8.8 million. Our effective income tax benefit rate for 2009 was 29.6%.
In 2008, we reported income before taxes of $62.3 million and recorded an income tax provision of $23.2 million. The effective tax rate for 2008 was 37.2%.
Liquidity and Capital Resources
General. We continually evaluate our liquidity requirements, capital needs and availability of capital resources based on our operating needs. We believe that our available cash balances and the cash flows expected to be generated from operations will be sufficient to satisfy our current and planned working capital and investment needs for the next twelve months. We also believe that we can satisfy our longer-term working capital and other funding requirements through cash flows from operations and, to the extent necessary, from borrowing facilities.
We pay the non-deferred portion of annual bonuses in the first quarter following the year in which they are earned. Employee bonuses are accrued throughout the year and are based on our performance and the performance of the individual employee.
In 2008, the portion of bonus previously deferred into restricted stock units was changed to be in the form of deferred cash to be paid ratably over a three year period for consultants and management globally. In 2008, a premium of 10% was applied to the bonus amount deferred. In 2009 and 2010, we continued with the bonus cash
27
Table of Contents
deferral arrangement but did not apply a premium to the amounts deferred. The portion of the bonus that is deferred varies between 10% and 15% depending on the employee’s level or position.
The compensation expense related to the amounts being deferred is recognized on a graded vesting attribution method over the requisite service period. This service period begins on January 1 of the respective fiscal year and continues through the deferral date which coincides with our bonus payments in the first quarter of the following year and for an additional three year vesting period. The deferrals vest and are paid ratably over the three year vesting period and are recorded in accrued salaries and employee benefits and other non-current liabilities in the Consolidated Balance Sheets. We will continue to grant restricted stock units under other existing programs.
Lines of credit. Since April 2009, we have had a $75 million committed unsecured revolving credit facility (the “Facility”). Under the Facility, we may borrow U.S. dollars, euros, or other major traded currencies as agreed by the lenders. Borrowings under the Facility bear interest at the existing Alternate Base Rate or at LIBOR plus a spread as determined by our leverage ratio. A fee is charged by the lenders even if no portion of the Facility is used. The Facility expires in October 2011.
There were no borrowings made or outstanding during the years ended December 31, 2010 or 2009. Due to the restructuring charge recorded in the quarter ended March 31, 2009, we were not in compliance with one of the financial covenants of the Facility. As a result, we amended the Facility and the lenders waived compliance for that quarter. During 2010 and 2009 we were in compliance with the amended financial covenants of the Facility and no event of default existed.
Cash and cash equivalents. Cash and cash equivalents at December 31, 2010 were $181.1 million, an increase of $58.1 million compared to $123.0 million at December 31, 2009. We expect to pay approximately $91 million in bonuses in early 2011.
Cash flows from operating activities. In 2010, cash provided by operating activities was $83.5 million, principally reflecting an increase in bonus related accruals, other non-cash charges and net income of $7.5 million, partially offset by bonus payments of approximately $47 million in March 2010 and a $17.2 million increase in trade and other receivables.
In 2009, cash used in operating activities was $72.7 million, principally reflecting our net loss of $20.9 million, cash bonus payments and the associated payroll taxes of approximately $127 million and restructuring payments of $25.0 million.
In 2008, cash provided by operating activities was $51.3 million, principally reflecting our net income of $39.1 million and other non-cash charges offset by decreases in accrued expenses, income taxes recoverable and other assets and liabilities.
Cash flows from investing activities. Cash used in investing activities was $15.5 million in 2010 primarily due to capital expenditures of $17.6 million and $0.6 million related to the Bell McCaw Bampfylde Limited acquisition, offset by the release of $2.6 million of restricted cash.
Cash used in investing activities was $23.9 million in 2009, primarily due to acquisition earn-out payments of $12.8 million, the Ray & Berndtson Sp. z o. o acquisition of $2.6 million, capital expenditures of $12.3 million and $1.3 million related to the second payment associated with our 2008 purchase of an equity method investment, offset by the release of $5.1 million restricted cash.
Cash used in investing activities was $6.6 million in 2008, primarily as a result of cash paid for acquisitions of $14.8 million, capital expenditures of $13.4 million, and purchases of cost and equity method investments of $2.8 million, offset by net proceeds from sales of short-term investments of $22.3 million and proceeds from the sale of a business of $1.6 million.
28
Table of Contents
Capital expenditures were $17.6 million, $12.3 million, and $13.4 million in 2010, 2009 and 2008, respectively. Capital expenditures in 2010 were primarily related to office buildouts associated with new office leases executed during the year, the development of our internal search system and a process improvement project aimed at increasing operational effectiveness and efficiency. We anticipate that our capital expenditures for 2011 will be approximately $17 million to $21 million, which primarily reflects investments in a new internal search system, as well as office build outs in Chicago, New Delhi and Zurich and ongoing capital expenditures.
Cash flows from financing activities. Cash used in financing activities in 2010 was $14.3 million primarily due to $9.7 million of quarterly cash dividends to shareholders and $4.6 million of payments for employee tax withholdings on equity transactions.
Cash used in financing activities in 2009 was $11.5 million primarily due to $9.3 million of quarterly cash dividends to shareholders and $3.4 million of payments for employee tax withholdings on equity transactions offset by $1.2 million of proceeds from stock options exercised during the year.
Cash used in financing activities in 2008 was $64.7 million primarily as a result of repurchasing $48.1 million of our common stock, $8.8 million of quarterly cash dividends to shareholders and $8.8 million of payments for employee tax withholdings on equity transactions offset by $0.9 million of proceeds from stock options exercised during the year.
On May 24, 2007, our Board of Directors authorized management to repurchase shares of our common stock with an aggregate total amount up to $50 million. We purchased 1,403,738 shares of our common stock for $50 million under the May 2007 authorization, which was completed during the first quarter of 2008.
On February 8, 2008, our Board of Directors authorized management to repurchase shares of our common stock with an aggregate total amount up to $50 million. We intend from time to time and as business conditions warrant, to purchase shares of our common stock on the open market or in negotiated or block trades. No time limit has been set for completion of this program. As of December 31, 2008, we purchased 951,160 shares of our common stock under the February 2008 authorization for a total of $27.2 million. As of December 31, 2010 and 2009, $22.8 million remains available under this authorization.
Off-Balance Sheet Arrangements. We do not have material off-balance sheet arrangements, special purpose entities, trading activities of non-exchange traded contracts or transactions with related parties.
Contractual obligations. The following table presents our known contractual obligations as of December 31, 2010 and the expected timing of cash payments related to these contractual obligations (in millions):
| Payments due for the years ended December 31, | ||||||||||||||||||||||||||||
| Contractual obligations: |
2011 | 2012 | 2013 | 2014 | 2015 | Thereafter | Total | |||||||||||||||||||||
| Office space and equipment lease obligations |
$ | 31.3 | $ | 29.4 | $ | 24.5 | $ | 19.2 | $ | 17.0 | $93.3 | $ | 214.7 | |||||||||||||||
| Accrued restructuring charges-severance |
0.3 | — | — | — | — | — | 0.3 | |||||||||||||||||||||
| Asset retirement obligations (1) |
— | 0.3 | 0.6 | — | — | 1.0 | 1.9 | |||||||||||||||||||||
| Total |
$ | 31.6 | $ | 29.7 | $ | 25.1 | $ | 19.2 | $ | 17.0 | $94.3 | $ | 216.9 | |||||||||||||||
| (1) | Represents the fair value of the obligation associated with the retirement of tangible long-lived assets, primarily related to our obligation at the end of the lease term to return office space to the landlord in its original condition. |
In addition to the contractual obligations included in the above table, we have liabilities related to certain employee benefit plans. These liabilities are recorded in our Consolidated Balance Sheet at December 31, 2010. The obligations related to these employee benefit plans are described in Note 13, Employee Benefit Plans, and
29
Table of Contents
Note 14, Pension Plan and Life Insurance Contract, in the Notes to Consolidated Financial Statements. As the timing of cash disbursements related to these employee benefit plans is uncertain, we have not included these obligations in the above table. The table excludes our liability for uncertain tax positions including accrued interest and penalties, which totaled $4.5 million as of January 1, 2010 and $1.3 million as of December 31, 2010, since we cannot predict with reasonable reliability the timing of cash settlements to the respective taxing authorities.
Subsequent Developments
On March 2, 2011, we announced that our Executive Vice President and Chief Financial Officer Scott J. Krenz will retire from the Company subsequent to the completion of the first quarter ending March 31, 2011 and filing of our annual report on Form 10-K. The formal search for a new Chief Financial Officer is underway.
Application of Critical Accounting Policies and Estimates
General. Management’s Discussion and Analysis of Financial Condition and Results of Operations is based upon our Consolidated Financial Statements, which have been prepared using accounting principles generally accepted in the United States of America. Our significant accounting policies are discussed in Note 2, Summary of Significant Accounting Policies, in the Notes to Consolidated Financial Statements. The preparation of these financial statements requires management to make estimates and assumptions that affect the reported amounts of assets, liabilities, revenue and expenses, and related disclosure of contingent assets and liabilities. Management bases its estimates on historical experience and on various other assumptions that are believed to be reasonable under the circumstances, the results of which form the basis for making judgments about the carrying values of assets and liabilities that are not readily apparent from other sources. Actual results may differ from these estimates under different assumptions or conditions. If actual amounts are ultimately different from previous estimates, the revisions are included in our results of operations for the period in which the actual amounts become known.
An accounting policy is deemed to be critical if it requires an accounting estimate to be made based on assumptions about matters that are highly uncertain at the time the estimate is made, and if different estimates that reasonably could have been used, or changes in the accounting estimates that are reasonably likely to occur periodically, could materially impact the financial statements. Management believes the following critical accounting policies reflect its more significant estimates and assumptions used in the preparation of the Consolidated Financial Statements:
Revenue recognition. Revenue before reimbursements for out-of-pocket expenses (“net revenue”) is recognized when earned and realizable and therefore when the following criteria have been met: (a) persuasive evidence of an arrangement exists; (b) services have been rendered; (c) the fee to our client is fixed or determinable; and (d) collectibility is reasonably assured. Net revenue consists of retainers and indirect expenses billed to clients. Typically, we are paid a retainer for our executive search services equal to approximately one-third of the estimated first year compensation of the position to be filled. If actual compensation of the placed candidate exceeds the estimated compensation, we are generally authorized to bill the client for one-third of the excess.
Typically, net revenue from standard executive search engagements is recognized over the expected average period of performance, in proportion to the estimated personnel time incurred to fulfill our obligations under the arrangements. Net revenue in excess of the retainer, resulting from actual compensation of the placed candidate exceeding estimated compensation, is recognized upon completion of the executive search when the amount of the additional fee is known. Our assumptions about the duration of the time and extent of efforts for search teams to complete our services in an executive search engagement require significant judgment as these variables have fluctuated in the past and are expected to continue to do so. These assumptions are updated annually or whenever conditions exist to indicate that more frequent updates are necessary.
30
Table of Contents
Net revenue from certain leadership consulting and non-standard executive search engagements is recognized in accordance with the completion of the engagement deliverables.
Restructuring charges. We account for restructuring charges by recognizing a liability at fair value when the costs are incurred.
Inherent in these accruals are expected sublease income and costs to terminate the leases. These accruals are periodically updated to reflect information concerning the commercial real estate markets in which the offices are located. We believe that the accounting estimate related to accruals for the consolidation and closing of offices is a critical accounting estimate because it is highly susceptible to changes in the commercial real estate markets and the local regional economic factors where this leased office space is located.
Income taxes. Determining the consolidated provision for income tax expense, income tax liabilities and deferred tax assets and liabilities involves judgment. As a global company, we calculate and provide for income taxes in each of the tax jurisdictions in which we operate. This involves estimating current tax exposures in each jurisdiction as well as making judgments regarding the recoverability of deferred tax assets. Tax exposures can involve complex issues and may require an extended period to resolve. Changes in the geographic mix or estimated level of annual income before taxes can affect the overall effective tax rate.
We apply an estimated annual effective tax rate to our cumulative quarterly operating results to determine the provision for income tax expense. In the event there are significant unusual or infrequent items recognized in our quarterly operating results, the tax attributable to that item is recorded in the interim period in which it occurs.
No deferred tax liabilities have been recorded for U.S. income taxes and foreign withholding taxes related to undistributed foreign earnings that are planned to be indefinitely reinvested. If future events, including material changes in estimates of cash, working capital and long-term investment requirements, necessitate that these earnings be distributed, an additional provision for taxes may apply, which could materially affect our future effective tax rate.
As a matter of course, we are regularly audited by various taxing authorities, and sometimes these audits result in proposed assessments where the ultimate resolution may result in our owing additional taxes. We establish reserves on uncertain tax return positions that do not meet the more likely than not recognition criteria. We evaluate these reserves each quarter and adjust the reserves and the related accrued interest in light of changing facts and circumstances regarding the uncertainty of realizing tax benefits, such as the ultimate settlement of tax audits or the expiration of a statute of limitations. We believe the estimates and assumptions used to support our evaluation of tax benefit realization are reasonable. However, final determinations of prior year tax liabilities, either by settlement with tax authorities or expiration of statutes of limitations, could be materially different than estimates reflected in assets and liabilities and historical income tax provisions. The outcome of these final determinations could have a material effect on our income tax provision, net income, or cash flows in the period in which that determination is made. We believe our tax positions comply with applicable tax law and that we have adequately provided for any known tax reserves.
Goodwill and other intangible assets. We review goodwill for impairment annually. We also review goodwill and long-lived assets; including identifiable intangible assets for impairment whenever events or changes in circumstances indicate that it is more likely than not that the fair value has fallen below the carrying amount of an asset. We review factors such as a significant change in business climate, attrition of key personnel, changes in financial condition or results of operations, a prolonged decline in our stock price and market capitalization, competition, and other factors. The goodwill impairment test is performed using a two step, fair value based test. The first step compares the fair value of a reporting unit with its carrying amount, including goodwill. The second step measures the impairment charge and is performed only if the carrying amount of a reporting unit exceeds its fair value as determined in step one. To measure the amount of the impairment loss, the
31
Table of Contents
implied fair value of a reporting unit’s goodwill is compared to the carrying amount of that goodwill. If the carrying amount of a reporting unit’s goodwill exceeds the implied fair value of that goodwill, an impairment loss is recognized in an amount equal to that excess. The implied fair value of goodwill is determined in the same manner as the amount of goodwill recognized in a business combination is determined.
The impairment test is considered for each of our reporting units as defined in the accounting standard for goodwill and intangible assets. We operate our executive search and leadership consulting services in three geographic regions: the Americas; Europe, which includes the Middle East and Africa; and Asia Pacific. The Americas is comprised of the North America and the Latin America operations. These operating segments are also considered to be our reporting units as follows: North America, Latin America, Europe, and Asia Pacific.
During the first step, the fair value of each of our reporting units is determined using a combination of valuation techniques, including a discounted cash flow methodology and comparable public company methodology, with the assistance of an independent valuation firm.
The discounted cash flow approach is dependent on a number of factors including estimates of future market growth and trends, forecasted revenue and costs, capital investments, appropriate discount rates, certain assumptions to allocate shared assets and liabilities, and other variables to calculate the carrying values for each of our reporting units. We base our fair value estimates on assumptions we believe to be reasonable, but which are unpredictable and inherently uncertain. The fair value of our reporting units is also impacted by our overall market capitalization and may be impacted by volatility in our stock price and assumed control premium, among other factors. As a result, actual future results may differ from those estimates. These assumptions are updated annually, at a minimum, to reflect information concerning our reportable segments.
Additionally, we review long-lived assets, such as property, equipment, and purchased intangibles subject to amortization for impairment whenever events or changes in circumstances indicate that the carrying amount of an asset may not be recoverable. Recoverability of assets to be held and used is measured by a comparison of the carrying amount of an asset to estimated undiscounted future cash flows expected to be generated by the asset. If the carrying amount of an asset exceeds its estimated future cash flows, an impairment charge, equal to the amount by which the carrying amount of the asset exceeds the fair value of the asset, is recognized.
We believe that the accounting estimate related to goodwill and other intangible asset impairment is a critical accounting estimate because the assumptions used are highly susceptible to changes in the operating results and cash flows of our reportable segments.
Allowance for doubtful accounts. Accounts receivable from our customers are recorded at the invoiced amount and do not bear interest. The allowance for doubtful accounts is our best estimate of the amount of probable credit losses in existing accounts receivable balances. We determine the allowance for doubtful accounts through an analysis of several factors, including the aging of our accounts receivable, historical write-off experience, and specific account analyses. We consider current and projected economic conditions and historical trends when determining the allowance for doubtful accounts. Actual collections of accounts receivable could differ from our estimates due to changes in future economic or industry conditions or specific customers’ financial condition.
The allowance for doubtful accounts is recorded as a reduction in revenue to the extent the provision relates to fee adjustments and other discretionary pricing adjustments. To the extent the provision relates to a customer’s inability to make required payments on accounts receivables, the provision is recorded as bad debt expense within general and administrative expenses.
Stock-based compensation. We measure our stock-based compensation costs based on the grant date fair value of the awards and recognize these costs in the financial statements over the requisite service period. We apply a forfeiture rate to our share-based awards that represents our best estimate of the amount of awards that
32
Table of Contents
will be forfeited. Our estimate is based on our historical experience and specific analysis. We review our forfeiture rate quarterly or whenever events or changes in circumstances indicate our estimate may need to be revised. Actual forfeitures could differ from our estimates due to changes in retention rates of our employee population.
Recently Adopted Financial Accounting Standards
On February 1, 2010, we adopted an amendment to previously adopted accounting guidance on subsequent event disclosure, which established standards of accounting for and disclosure of events or transactions that occur after the balance sheet date but before financial statements are issued. Under the amended guidance, we are no longer required to disclose the date through which subsequent events have been evaluated. The adoption of this requirement did not have material impact on our financial condition or results of operations.
Recently Issued Financial Accounting Standards
In January 2010, the Financial Accounting Standards Board issued guidance which expands the required disclosures about fair value measurements. This guidance requires disclosures about transfers of investments between levels in the fair value hierarchy and disclosures relating to the reconciliation of fair value measurements using significant unobservable inputs (level 3 investments). This guidance is effective for us as of January 1, 2011. We do not believe the adoption of this guidance will have a material impact on our financial condition or results of operations.
In April 2010, the Financial Accounting Standards Board issued guidance on milestone accounting. The guidance applies to transactions involving research or development deliverables or other units of accounting where a performance obligation is met over a period of time and a portion or all of the consideration is contingent upon achievement of a milestone. After meeting specified criteria, entities can make an accounting policy election to recognize arrangement consideration received for achieving specified performance measures during the periods in which the milestones are achieved. The guidance is effective for us beginning on January 1, 2011. We do not believe the adoption of this guidance will have a material impact on its financial condition or results of operations.
Quarterly Financial Information
The following table sets forth certain financial information for each quarter of 2010 and 2009. The information is derived from our quarterly consolidated financial statements which are unaudited but which, in the opinion of management, have been prepared on the same basis as the audited annual consolidated financial statements included in this document. The consolidated financial data shown below should be read in conjunction with the consolidated financial statements and notes thereto. The operating results for any quarter are not necessarily indicative of results for any future period.
| Quarter Ended | ||||||||||||||||||||||||||||||||
| 2010 | 2009 | |||||||||||||||||||||||||||||||
| Mar. 31 | Jun. 30 | Sept. 30 | Dec. 31 | Mar. 31 | Jun. 30 | Sept. 30 | Dec. 31 | |||||||||||||||||||||||||
| (in thousands, except per share) | ||||||||||||||||||||||||||||||||
| Revenue before reimbursements (net revenue) |
$ | 113,668 | $ | 126,071 | $ | 126,129 | $ | 127,223 | $ | 89,141 | $ | 93,115 | $ | 103,523 | $ | 109,872 | ||||||||||||||||
| Operating income (loss) |
(3,776 | ) | 7,593 | 4,380 | 9,327 | (32,380 | ) | (11,553 | ) | 6,716 | 10,506 | |||||||||||||||||||||
| Income (loss) before income taxes |
(3,494 | ) | 5,333 | 5,270 | 9,839 | (32,617 | ) | (14,912 | ) | 7,250 | 10,580 | |||||||||||||||||||||
| Provision for (benefit from) income taxes |
(1,948 | ) | 2,661 | 4,086 | 4,656 | (13,690 | ) | 855 | 2,842 | 1,202 | ||||||||||||||||||||||
| Net income (loss) |
(1,546 | ) | 2,672 | 1,184 | 5,183 | (18,927 | ) | (15,767 | ) | 4,408 | 9,378 | |||||||||||||||||||||
| Basic earnings (loss) per common share |
(0.09 | ) | 0.15 | 0.07 | 0.30 | (1.15 | ) | (0.93 | ) | 0.26 | 0.55 | |||||||||||||||||||||
| Diluted earnings (loss) per Common share |
(0.09 | ) | 0.15 | 0.07 | 0.29 | (1.15 | ) | (0.93 | ) | 0.25 | 0.52 | |||||||||||||||||||||
| Cash dividends paid per share |
0.13 | 0.13 | 0.13 | 0.13 | 0.13 | 0.13 | 0.13 | 0.13 | ||||||||||||||||||||||||
33
Table of Contents
ITEM 7A. QUANTITATIVE AND QUALITATIVE DISCLOSURES ABOUT MARKET RISK
Currency market risk. With our operations in the Americas, Europe and Asia Pacific we conduct business using various currencies. Revenue earned in each country is generally matched with the associated expenses incurred, thereby reducing currency risk to earnings. However, because certain assets and liabilities are denominated in currencies other than the U.S. dollar, changes in currency rates may cause fluctuations in the valuation of such assets and liabilities. As the local currency of our subsidiaries has generally been designated as the functional currency, we are affected by the translation of foreign currency financial statements into U.S. dollars. A 1% change in the average exchange rate for currencies of all foreign countries in which we operate would have increased or decreased our 2010 net income by less than $0.1 million. For financial information by geographic segment, see Note 21, Segment Information, in the Notes to Consolidated Financial Statements.
34
Table of Contents
ITEM 8. FINANCIAL STATEMENTS AND SUPPLEMENTARY DATA
HEIDRICK & STRUGGLES INTERNATIONAL, INC. AND SUBSIDIARIES
INDEX TO CONSOLIDATED FINANCIAL STATEMENTS
CONSOLIDATED FINANCIAL STATEMENTS
35
Table of Contents
REPORT OF INDEPENDENT REGISTERED PUBLIC ACCOUNTING FIRM
The Board of Directors and Stockholders
Heidrick & Struggles International, Inc.:
We have audited the accompanying consolidated balance sheets of Heidrick & Struggles International, Inc. and subsidiaries (the Company) as of December 31, 2010 and 2009, and the related consolidated statements of operations, stockholders’ equity and comprehensive income (loss), and cash flows for each of the years in the three-year period ended December 31, 2010. We also have audited the Company’s internal control over financial reporting as of December 31, 2010, based on criteria established in Internal Control—Integrated Framework issued by the Committee of Sponsoring Organizations of the Treadway Commission (COSO). The Company’s management is responsible for these consolidated financial statements, for maintaining effective internal control over financial reporting, and for its assessment of the effectiveness of internal control over financial reporting, included in the accompanying Item 9A(b) Management’s Report on Internal Control over Financial Reporting. Our responsibility is to express an opinion on these consolidated financial statements and an opinion on the Company’s internal control over financial reporting based on our audits.
We conducted our audits in accordance with the standards of the Public Company Accounting Oversight Board (United States). Those standards require that we plan and perform the audits to obtain reasonable assurance about whether the financial statements are free of material misstatement and whether effective internal control over financial reporting was maintained in all material respects. Our audits of the consolidated financial statements included examining, on a test basis, evidence supporting the amounts and disclosures in the financial statements, assessing the accounting principles used and significant estimates made by management, and evaluating the overall financial statement presentation. Our audit of internal control over financial reporting included obtaining an understanding of internal control over financial reporting, assessing the risk that a material weakness exists, and testing and evaluating the design and operating effectiveness of internal control based on the assessed risk. Our audits also included performing such other procedures as we considered necessary in the circumstances. We believe that our audits provide a reasonable basis for our opinions.
A company’s internal control over financial reporting is a process designed to provide reasonable assurance regarding the reliability of financial reporting and the preparation of financial statements for external purposes in accordance with generally accepted accounting principles. A company’s internal control over financial reporting includes those policies and procedures that (1) pertain to the maintenance of records that, in reasonable detail, accurately and fairly reflect the transactions and dispositions of the assets of the company; (2) provide reasonable assurance that transactions are recorded as necessary to permit preparation of financial statements in accordance with generally accepted accounting principles, and that receipts and expenditures of the company are being made only in accordance with authorizations of management and directors of the company; and (3) provide reasonable assurance regarding prevention or timely detection of unauthorized acquisition, use, or disposition of the company’s assets that could have a material effect on the financial statements.
Because of its inherent limitations, internal control over financial reporting may not prevent or detect misstatements. Also, projections of any evaluation of effectiveness to future periods are subject to the risk that controls may become inadequate because of changes in conditions, or that the degree of compliance with the policies or procedures may deteriorate.
A material weakness is a deficiency, or a combination of deficiencies, in internal control over financial reporting, such that there is a reasonable possibility that a material misstatement of the company’s annual or interim financial statements will not be prevented or detected on a timely basis. A material weakness related to controls over the accounting for compensation arrangements between the Company and certain of its employees has been identified and included in management’s assessment. This material weakness was considered in determining the nature, timing, and extent of audit tests applied in our audit of the 2010 consolidated financial statements.
36
Table of Contents
In our opinion, the consolidated financial statements referred to above present fairly, in all material respects, the financial position of Heidrick & Struggles International, Inc. and subsidiaries as of December 31, 2010 and 2009, and the results of their operations and their cash flows for each of the years in the three-year period ended December 31, 2010, in conformity with U.S. generally accepted accounting principles.
Also, in our opinion, because of the effect of the aforementioned material weakness on the achievement of the objectives of the control criteria, the Company has not maintained effective internal control over financial reporting as of December 31, 2010, based on criteria established in Internal Control—Integrated Framework issued by the Committee of Sponsoring Organizations of the Treadway Commission. Our opinion on the effectiveness of internal control over financial reporting does not affect our opinion on the consolidated financial statements.
KPMG LLP
Chicago, Illinois
March 16, 2011
37
Table of Contents
HEIDRICK & STRUGGLES INTERNATIONAL, INC. AND SUBSIDIARIES
CONSOLIDATED BALANCE SHEETS
(In thousands, except share amounts)
| December 31, | ||||||||
| 2010 | 2009 | |||||||
| Current assets: |
||||||||
| Cash and cash equivalents |
$ | 181,124 | $ | 123,030 | ||||
| Restricted cash |
393 | 2,402 | ||||||
| Accounts receivable, net |
83,360 | 64,224 | ||||||
| Other receivables |
7,724 | 7,964 | ||||||
| Prepaid expenses |
15,323 | 15,916 | ||||||
| Other current assets |
1,871 | 1,693 | ||||||
| Income taxes recoverable |
11,912 | 15,649 | ||||||
| Deferred income taxes |
10,759 | 10,576 | ||||||
| Total current assets |
312,466 | 241,454 | ||||||
| Non-current assets: |
||||||||
| Property and equipment, net |
34,406 | 26,092 | ||||||
| Restricted cash |
1,609 | 2,250 | ||||||
| Assets designated for retirement and pension plans |
23,647 | 25,502 | ||||||
| Investments |
11,021 | 10,417 | ||||||
| Other non-current assets |
8,593 | 6,843 | ||||||
| Goodwill |
109,888 | 109,010 | ||||||
| Other intangible assets, net |
6,480 | 8,636 | ||||||
| Deferred income taxes |
36,917 | 44,643 | ||||||
| Total non-current assets |
232,561 | 233,393 | ||||||
| Total assets |
$ | 545,027 | $ | 474,847 | ||||
| Current liabilities: |
||||||||
| Accounts payable |
$ | 8,408 | $ | 5,948 | ||||
| Accrued salaries and employee benefits |
124,969 | 65,096 | ||||||
| Other current liabilities |
34,064 | 37,812 | ||||||
| Income taxes payable |
3,208 | 3,070 | ||||||
| Deferred income taxes |
1,807 | 1,867 | ||||||
| Total current liabilities |
172,456 | 113,793 | ||||||
| Non-current liabilities: |
||||||||
| Retirement and pension plans |
30,907 | 31,687 | ||||||
| Other non-current liabilities |
47,015 | 38,476 | ||||||
| Deferred income taxes |
107 | 39 | ||||||
| Total non-current liabilities |
78,029 | 70,202 | ||||||
| Total liabilities |
250,485 | 183,995 | ||||||
| Commitments and contingencies (Note 23) |
— | — | ||||||
| Stockholders’ equity: |
||||||||
| Preferred stock, $.01 par value, 10,000,000 shares authorized, no shares issued at December 31, 2010 and 2009 |
— | — | ||||||
| Common stock, $.01 par value, 100,000,000 shares authorized, 19,585,777 shares issued, 17,558,098 and 17,072,517 shares outstanding at December 31, 2010 and 2009, respectively |
196 | 196 | ||||||
| Treasury stock at cost, 2,027,679 and 2,513,260 shares at December 31, 2010 and 2009, respectively |
(69,549 | ) | (86,419 | ) | ||||
| Additional paid in capital |
246,601 | 260,256 | ||||||
| Retained earnings |
99,056 | 101,091 | ||||||
| Accumulated other comprehensive income |
18,238 | 15,728 | ||||||
| Total stockholders’ equity |
294,542 | 290,852 | ||||||
| Total liabilities and stockholders’ equity |
$ | 545,027 | $ | 474,847 | ||||
The accompanying notes to Consolidated Financial Statements are an integral part of these statements.
38
Table of Contents
HEIDRICK & STRUGGLES INTERNATIONAL, INC. AND SUBSIDIARIES
CONSOLIDATED STATEMENTS OF OPERATIONS
(In thousands, except per share amounts)
| Year Ended December 31, | ||||||||||||
| 2010 | 2009 | 2008 | ||||||||||
| Revenue: |
||||||||||||
| Revenue before reimbursements (net revenue) |
$ | 493,091 | $ | 395,651 | $ | 615,904 | ||||||
| Reimbursements |
20,145 | 19,067 | 28,956 | |||||||||
| Total revenue |
513,236 | 414,718 | 644,860 | |||||||||
| Operating expenses (income): |
||||||||||||
| Salaries and employee benefits |
340,178 | 281,545 | 435,306 | |||||||||
| General and administrative expenses |
130,622 | 115,758 | 125,061 | |||||||||
| Other charges |
4,218 | — | — | |||||||||
| Reimbursed expenses |
20,145 | 19,067 | 28,956 | |||||||||
| Restructuring and impairment charges |
1,621 | 26,720 | — | |||||||||
| Other operating income |
(1,072 | ) | (1,661 | ) | — | |||||||
| Total operating expenses |
495,712 | 441,429 | 589,323 | |||||||||
| Operating income (loss) |
17,524 | (26,711 | ) | 55,537 | ||||||||
| Non-operating income (expense): |
||||||||||||
| Interest income, net |
813 | 1,201 | 5,103 | |||||||||
| Other, net |
(1,389 | ) | (4,189 | ) | 1,613 | |||||||
| Net non-operating income (expense) |
(576 | ) | (2,988 | ) | 6,716 | |||||||
| Income (loss) before income taxes |
16,948 | (29,699 | ) | 62,253 | ||||||||
| Provision for (benefit from) income taxes |
9,455 | (8,791 | ) | 23,179 | ||||||||
| Net income (loss) |
$ | 7,493 | $ | (20,908 | ) | $ | 39,074 | |||||
| Basic weighted average common shares outstanding |
17,437 | 16,901 | 16,747 | |||||||||
| Diluted weighted average common shares outstanding |
17,869 | 16,901 | 17,727 | |||||||||
| Basic earnings (loss) per common share |
$ | 0.43 | $ | (1.24 | ) | $ | 2.33 | |||||
| Diluted earnings (loss) per common share |
$ | 0.42 | $ | (1.24 | ) | $ | 2.20 | |||||
| Cash dividends paid per share |
$ | 0.52 | $ | 0.52 | $ | 0.52 | ||||||
The accompanying notes to Consolidated Financial Statements are an integral part of these statements.
39
Table of Contents
HEIDRICK & STRUGGLES INTERNATIONAL, INC. AND SUBSIDIARIES
CONSOLIDATED STATEMENT OF STOCKHOLDERS’ EQUITY AND
COMPREHENSIVE INCOME (LOSS)
(In thousands)
| Common Stock | Treasury Stock | Additional Paid in Capital |
Retained Earnings |
Accumulated Other Compre- hensive Income |
Total | |||||||||||||||||||||||||||
| Shares | Amount | Shares | Amount | |||||||||||||||||||||||||||||
| Balance at December 31, 2007 |
19,586 | $196 | 2,314 | $ (88,871 | ) | $273,287 | $ | 100,624 | $24,564 | $ | 309,800 | |||||||||||||||||||||
| Net income |
— | — | — | — | — | 39,074 | — | 39,074 | ||||||||||||||||||||||||
| Other comprehensive income: |
||||||||||||||||||||||||||||||||
| Unrealized loss on available-for-sale investments, net of tax |
— | — | — | — | — | — | (1,746 | ) | (1,746 | ) | ||||||||||||||||||||||
| Foreign currency translation adjustment |
— | — | — | — | — | — | (10,819 | ) | (10,819 | ) | ||||||||||||||||||||||
| Pension adjustment, net of tax |
— | — | — | — | — | — | 155 | 155 | ||||||||||||||||||||||||
| Other comprehensive income |
— | — | — | — | — | 39,074 | (12,410 | ) | 26,664 | |||||||||||||||||||||||
| Treasury and common stock transactions: |
||||||||||||||||||||||||||||||||
| Issuance of restricted stock units previously classified as liabilities |
— | — | — | — | 10,536 | — | — | 10,536 | ||||||||||||||||||||||||
| Stock-based compensation |
— | — | — | — | 23,887 | — | — | 23,887 | ||||||||||||||||||||||||
| Exercise of stock options |
— | — | (64 | ) | 2,369 | (1,472 | ) | — | — | 897 | ||||||||||||||||||||||
| Vesting of restricted stock units, net of tax witholdings |
— | — | (571 | ) | 21,822 | (30,584 | ) | — | — | (8,762 | ) | |||||||||||||||||||||
| Purchases of treasury stock |
— | — | 1,546 | (46,466 | ) | — | — | — | (46,466 | ) | ||||||||||||||||||||||
| Re-issuance of treasury stock |
— | — | (9 | ) | 308 | (70 | ) | — | — | 238 | ||||||||||||||||||||||
| Cash dividends declared ($0.52 per share) |
— | — | — | — | — | (8,628 | ) | — | (8,628 | ) | ||||||||||||||||||||||
| Dividend equivalents on restricted stock units |
— | — | — | — | — | (9 | ) | — | (9 | ) | ||||||||||||||||||||||
| Tax deficit related to stock-based compensation |
— | — | — | — | (1,853 | ) | — | — | (1,853 | ) | ||||||||||||||||||||||
| Balance at December 31, 2008 |
19,586 | $196 | 3,216 | $(110,838 | ) | $273,731 | $ | 131,061 | $12,154 | $ | 306,304 | |||||||||||||||||||||
| Net loss |
— | — | — | — | — | (20,908 | ) | — | (20,908 | ) | ||||||||||||||||||||||
| Other comprehensive loss: |
||||||||||||||||||||||||||||||||
| Unrealized gain on available for sale investments |
— | — | — | — | — | — | 1,336 | 1,336 | ||||||||||||||||||||||||
| Foreign currency translation adjustment |
— | — | — | — | — | — | 3,175 | 3,175 | ||||||||||||||||||||||||
| Pension adjustment, net of tax |
— | — | — | — | — | — | (937 | ) | (937 | ) | ||||||||||||||||||||||
| Other comprehensive loss: |
— | — | — | — | — | (20,908 | ) | 3,574 | (17,334 | ) | ||||||||||||||||||||||
| Treasury and common stock transactions: |
||||||||||||||||||||||||||||||||
| Stock-based compensation |
— | — | — | — | 18,677 | — | — | 18,677 | ||||||||||||||||||||||||
| Exercise of stock options |
— | — | (88 | ) | 3,072 | (1,834 | ) | — | — | 1,238 | ||||||||||||||||||||||
| Vesting of restricted stock units, net of tax witholdings |
— | — | (595 | ) | 20,645 | (24,034 | ) | — | — | (3,389 | ) | |||||||||||||||||||||
| Re-issuance of treasury stock |
— | — | (20 | ) | 702 | (327 | ) | — | — | 375 | ||||||||||||||||||||||
| Cash dividends declared ($0.52 per share) |
— | — | — | — | — | (8,860 | ) | — | (8,860 | ) | ||||||||||||||||||||||
| Dividend equivalents on restricted stock units |
— | — | — | — | — | (202 | ) | — | (202 | ) | ||||||||||||||||||||||
| Tax deficit related to stock-based compensation |
— | — | — | — | (5,957 | ) | — | — | (5,957 | ) | ||||||||||||||||||||||
| Balance at December 31, 2009 |
19,586 | $196 | 2,513 | $ (86,419 | ) | $260,256 | $ | 101,091 | $15,728 | $ | 290,852 | |||||||||||||||||||||
| Net income |
— | — | — | — | — | 7,493 | — | 7,493 | ||||||||||||||||||||||||
| Other comprehensive income: |
||||||||||||||||||||||||||||||||
| Unrealized gain on available for sale investments |
— | — | — | — | — | — | 706 | 706 | ||||||||||||||||||||||||
| Pension adjustment, net of tax |
— | — | — | — | — | — | (1,055 | ) | (1,055 | ) | ||||||||||||||||||||||
| Foreign currency translation adjustment |
— | — | — | — | — | — | 2,859 | 2,859 | ||||||||||||||||||||||||
| Other comprehensive income |
— | — | — | — | — | 7,493 | 2,510 | 10,003 | ||||||||||||||||||||||||
| Treasury and common stock transactions: |
||||||||||||||||||||||||||||||||
| Stock-based compensation |
— | — | — | — | 8,552 | — | — | 8,552 | ||||||||||||||||||||||||
| Vesting of restricted stock units, net of tax witholdings |
— | — | (473 | ) | 16,431 | (21,060 | ) | — | — | (4,629 | ) | |||||||||||||||||||||
| Re-issuance of treasury stock |
— | — | (13 | ) | 439 | (139 | ) | — | — | 300 | ||||||||||||||||||||||
| Cash dividends declared ($0.52 per share) |
— | — | — | — | — | (9,114 | ) | — | (9,114 | ) | ||||||||||||||||||||||
| Dividend equivalents on restricted stock units |
— | — | — | — | — | (414 | ) | — | (414 | ) | ||||||||||||||||||||||
| Tax deficit related to stock-based compensation |
— | — | — | — | (1,008 | ) | — | — | (1,008 | ) | ||||||||||||||||||||||
| Balance at December 31, 2010 |
19,586 | $196 | 2,027 | $ (69,549 | ) | $246,601 | $ | 99,056 | $18,238 | $ | 294,542 | |||||||||||||||||||||
The accompanying notes to consolidated financial statements are an integral part of these statements.
40
Table of Contents
HEIDRICK & STRUGGLES INTERNATIONAL, INC. AND SUBSIDIARIES
CONSOLIDATED STATEMENTS OF CASH FLOWS
(In thousands)
| Year Ended December 31, | ||||||||||||
| 2010 | 2009 | 2008 | ||||||||||
| Cash flows from operating activities: |
||||||||||||
| Net income (loss) |
$ | 7,493 | $ | (20,908 | ) | $ | 39,074 | |||||
| Adjustments to reconcile net income (loss) to net cash provided by (used in) operating activities: |
||||||||||||
| Depreciation and amortization |
11,584 | 11,265 | 10,544 | |||||||||
| Write-off of investment |
— | 2,977 | — | |||||||||
| Write-off of software development project |
— | 1,329 | — | |||||||||
| Deferred income taxes |
7,093 | (10,107 | ) | 11,960 | ||||||||
| Loss on sale of property and equipment |
— | — | 67 | |||||||||
| Net realized and unrealized (gains) losses on investments |
1,509 | 2,054 | (1,579 | ) | ||||||||
| Stock-based compensation expense |
7,765 | 19,016 | 24,772 | |||||||||
| Other operating income |
(1,072 | ) | (1,661 | ) | — | |||||||
| Impairment charge |
— | 4,080 | — | |||||||||
| Restructuring charges |
1,621 | 22,640 | — | |||||||||
| Cash paid for restructuring charges |
(3,439 | ) | (25,020 | ) | (2,841 | ) | ||||||
| Changes in assets and liabilities, net of effects of acquisitions: |
||||||||||||
| Trade and other receivables |
(17,211 | ) | 7,786 | 2,925 | ||||||||
| Accounts payable |
2,203 | (566 | ) | (349 | ) | |||||||
| Accrued expenses |
65,162 | (86,708 | ) | (13,488 | ) | |||||||
| Income taxes recoverable (payable), net |
3,726 | (4,848 | ) | (10,061 | ) | |||||||
| Retirement and pension assets and liabilities |
(1,237 | ) | 2,097 | (1,248 | ) | |||||||
| Prepayments |
672 | 4,397 | (4,367 | ) | ||||||||
| Other assets and liabilities, net |
(2,329 | ) | (552 | ) | (4,154 | ) | ||||||
| Net cash provided by (used in) operating activities |
83,540 | (72,729 | ) | 51,255 | ||||||||
| Cash flows from investing activities: |
||||||||||||
| Restricted cash |
2,620 | 5,058 | 129 | |||||||||
| Acquisition of businesses, net of cash acquired |
(554 | ) | (15,453 | ) | (14,801 | ) | ||||||
| Capital expenditures |
(17,564 | ) | (12,274 | ) | (13,402 | ) | ||||||
| Purchases of cost and equity method investments |
— | (1,300 | ) | (2,812 | ) | |||||||
| Proceeds from sales of short-term investments |
— | — | 22,275 | |||||||||
| Proceeds from sale of a business, net |
— | — | 1,559 | |||||||||
| Other, net |
— | 90 | 469 | |||||||||
| Net cash used in investing activities |
(15,498 | ) | (23,879 | ) | (6,583 | ) | ||||||
| Cash flows from financing activities: |
||||||||||||
| Proceeds from stock options exercised |
— | 1,238 | 897 | |||||||||
| Purchases of treasury stock |
— | — | (48,071 | ) | ||||||||
| Cash dividends paid |
(9,696 | ) | (9,332 | ) | (8,750 | ) | ||||||
| Payment of employee tax withholdings on equity transactions |
(4,585 | ) | (3,386 | ) | (8,764 | ) | ||||||
| Net cash used in financing activities |
(14,281 | ) | (11,480 | ) | (64,688 | ) | ||||||
| Effect of exchange rates fluctuations on cash and cash equivalents |
4,333 | (3,413 | ) | (6,033 | ) | |||||||
| Net increase (decrease) in cash and cash equivalents |
58,094 | (111,501 | ) | (26,049 | ) | |||||||
| Cash and cash equivalents at beginning of period |
123,030 | 234,531 | 260,580 | |||||||||
| Cash and cash equivalents at end of period |
$ | 181,124 | $ | 123,030 | $ | 234,531 | ||||||
| Supplemental disclosures of cash flow information |
||||||||||||
| Cash paid (received) for |
||||||||||||
| Interest |
$ | (487 | ) | $ | 12 | $ | 58 | |||||
| Income taxes, net |
954 | 4,777 | 22,542 | |||||||||
| Supplemental schedule of noncash financing and investing activities |
||||||||||||
| Unrealized gain (loss) on available-for-sale investments |
$ | 706 | $ | 1,336 | $ | (1,746 | ) | |||||
| Beginning of period—Accrued treasury stock purchases |
$ | — | $ | — | $ | 1,605 | ||||||
| Treasury stock purchases |
— | — | 46,466 | |||||||||
| Cash paid for treasury stock purchases |
— | — | (48,071 | ) | ||||||||
| Accrued treasury stock purchases |
$ | — | $ | — | $ | — | ||||||
The accompanying notes to Consolidated Financial Statements are an integral part of these statements.
41
Table of Contents
HEIDRICK & STRUGGLES INTERNATIONAL, INC. AND SUBSIDIARIES
NOTES TO CONSOLIDATED FINANCIAL STATEMENTS
(All tables in thousands, except share and per share figures)
1. Basis of Presentation
Heidrick & Struggles International, Inc. and Subsidiaries (the “Company”) is engaged in providing executive search and leadership consulting services to clients on a retained basis. The Company operates in the Americas, Europe and Asia Pacific.
The consolidated financial statements include Heidrick & Struggles International, Inc. and its wholly-owned subsidiaries and have been prepared using accounting principles generally accepted in the United States of America (“GAAP”). The preparation of these financial statements in conformity with GAAP requires management to make estimates and assumptions that affect the reported amounts of assets and liabilities, revenues and expenses and certain financial statement disclosures. Significant items subject to estimates and assumptions include revenue recognition, allowance for doubtful accounts, allowances for deferred tax assets, assessment of goodwill and other intangible assets for impairment, compensation accruals, stock-based compensation and contingent liabilities. Given that global economies are undergoing a period of substantial uncertainty, estimates are subject to a greater degree of uncertainty, and actual results could differ from these estimates.
The consolidated financial statements include an adjustment to correct an error identified during 2010. The Company recorded a cumulative adjustment of $1.1 million which increased other non-operating expense related to its non-controlling interest in its operations in China.
2. Summary of Significant Accounting Policies
Cash and Cash Equivalents
The Company considers all highly liquid instruments with an original maturity of three months or less to be cash equivalents.
Concentration of Risk
The Company is potentially exposed to concentrations of risk associated with its accounts receivable. However, this risk is limited due to the Company’s large number of clients and their dispersion across many different industries and geographies. At December 31, 2010, the Company had no significant concentrations of risk.
Accounts Receivable
The Company’s accounts receivable primarily consist of trade receivables. The allowance for doubtful accounts is developed based upon several factors including the age of the Company’s accounts receivable, historical write-off experience and specific account analysis. These factors may change over time, impacting the allowance level.
Fair Value of Financial Instruments
Cash and cash equivalents are stated at cost, which approximates fair market value. The carrying value for receivables from clients, accounts payable, deferred revenue and other accrued liabilities reasonably approximate fair market value due to the nature of the financial instruments and the short term nature of the items.
42
Table of Contents
Property and Equipment
Property and equipment are stated at cost. Depreciation is computed using the straight-line method over the estimated useful life of the asset or, for leasehold improvements, the shorter of the lease term or the estimated useful life of the asset, as follows:
| Office furniture, fixtures and equipment |
5–10 years | |||
| Computer equipment and software |
3–8 years |
Depreciation is calculated for tax purposes using accelerated methods, where applicable.
Long-lived Assets
The Company reviews its long-lived assets, including property and equipment, for impairment whenever events or changes in circumstances indicate that the carrying amount of an asset may not be recoverable. Recoverability of assets to be held and used is measured by a comparison of the carrying amount of an asset to estimated undiscounted future cash flows expected to be generated by the asset. If the carrying amount of an asset exceeds its estimated future cash flows, an impairment charge, equal to the amount by which the carrying amount of the asset exceeds the fair value of the asset, is recognized.
Investments
The Company’s investments consist primarily of available-for-sale investments within the U.S. non-qualified deferred compensation plan (the “Plan”), an equity method investment associated with the Company’s joint venture investment in JobKoo, and warrants for equity securities in client companies classified as derivative instruments, cost method investments or available-for-sale investments.
Available-for-sale investments are reported at fair value with changes in unrealized gains (losses) recorded as a separate component of accumulated other comprehensive income in the Consolidated Balance Sheets until realized. Realized gains (losses) resulting from an employee’s termination from the Plan are recorded as a non-operating gain (loss) in the Consolidated Statements of Operations.
The equity method of accounting is used to account for investments in which the Company has the ability to exercise significant influence, but not control, over an investee. Significant influence is generally deemed to exist if the Company has ownership interest in the voting stock of an investee of between 20% and 50%. The Company accounts for its ownership percentage as a non-operating gain (loss) in the Consolidated Statement of Operations.
The Company receives warrants for equity securities in client companies, in addition to the cash fee, for services rendered on some searches. Some warrants meet the definition of a derivative instrument while others are classified as cost method investments. Both investment classifications are initially recorded in the Consolidated Balance Sheets at their fair value, using a Black-Scholes model, with a corresponding amount recorded as net revenue in the Consolidated Statements of Operations. Bonus expense related to this net revenue is also recorded. Subsequent changes in the fair value of the warrants are accounted for depending on the classification of the warrants. Changes in warrants classified as derivative instruments are recorded in the Consolidated Statements of Operations as unrealized gains (losses), net of the consultants’ share of the gains (losses), whereas warrants classified as cost method investments are regularly reviewed for other-than-temporary declines in fair value. Any permanent declines in the fair value of these warrants are recorded in the Consolidated Statements of Operations as realized losses, net of the consultants’ share of the losses.
Upon a value event such as an initial public offering or an acquisition, any changes in the fair value of the warrants, both derivatives and non-derivatives, are recorded in the Consolidated Statements of Operations as unrealized gains (losses), net of the consultants’ share of the gains (losses).
43
Table of Contents
Any equity securities arising from the exercise of a warrant are accounted for as available-for-sale investments. Upon the sale of these investments, the Company records a realized gain (loss), net of the consultants’ share of the gain (loss) and other costs.
Goodwill and Other Intangible Assets
Goodwill represents the difference between the purchase price of acquired companies and the related fair value of the net assets acquired, which is accounted for by the acquisition method of accounting. Other intangible assets include client relationships, candidate databases, employee non-compete agreements and backlog revenue. The Company performs assessments of the carrying value of its goodwill and other intangible assets at least annually or whenever events occur or circumstances indicate that a carrying amount of these assets may not be recoverable. These circumstances include a significant change in business climate, attrition of key personnel, changes in financial condition or results of operations, a prolonged decline in the Company’s stock price and market capitalization, competition, and other factors.
The goodwill impairment test compares the fair value of a reporting unit to its carrying amount, including goodwill. If the carrying amount of a reporting unit exceeds its fair value, goodwill of the reporting unit would be considered impaired. To measure the amount of the impairment loss, the implied fair value of a reporting unit’s goodwill is compared to the carrying amount of that goodwill. If the carrying amount of a reporting unit’s goodwill exceeds the implied fair value of that goodwill, an impairment loss is recognized in an amount equal to that excess. The implied fair value of goodwill is determined in the same manner as the amount of goodwill recognized in a business combination is determined. The fair value of each of the Company’s reporting units is determined using a combination of valuation techniques, including a discounted cash flow methodology and comparable public company methodology, with the assistance of an independent valuation firm.
The other intangible asset impairment review compares the carrying amount of an asset to estimated undiscounted future cash flows expected to be generated by the asset. If the carrying amount of an asset exceeds its estimated future cash flows, an impairment charge, equal to the amount by which the carrying amount of the asset exceeds the fair value, is recognized.
Other intangible assets acquired are amortized either using the straight-line method over their estimated useful lives or based on the projected cash flow associated with the respective intangible assets.
Restructuring Charges
The Company accounts for restructuring charges by recognizing a liability at fair value when the costs are incurred.
Revenue Recognition
Revenue before reimbursements of out-of-pocket expenses (“net revenue”) consists of retainers and indirect expenses billed to clients. For each assignment, the Company and its client enter into a contract that outlines the general terms and conditions of the assignment. Typically, the Company is paid a retainer for its executive search services equal to approximately one-third of the estimated first year compensation for the position to be filled. In addition, if the actual compensation of a placed candidate exceeds the estimated compensation, the Company often will be authorized to bill the client for one-third of the excess. Indirect expenses are calculated as a percentage of the retainer with certain dollar limits per search. The Company generally bills its clients for its retainer and indirect expenses in one-third increments over a three-month period commencing in the month of a client’s acceptance of the contract.
Net revenue is recognized when earned and realizable and therefore when the following criteria have been met: (a) persuasive evidence of an arrangement exists, (b) services have been rendered, (c) the fee to our client is
44
Table of Contents
fixed or determinable, and (d) collectibility is reasonably assured. Typically, net revenue from standard executive search engagements is recognized over the expected average period of performance, in proportion to the estimated personnel time incurred to fulfill our obligations under the arrangements. Net revenue in excess of the retainer, resulting from actual compensation of the placed candidate exceeding the estimated compensation, is recognized upon completion of the executive search when the amount of the additional fee is known.
Net revenue from certain leadership consulting and non-standard executive search engagements is recognized in accordance with the completion of the engagement deliverables.
Reimbursements
The Company incurs certain out-of-pocket expenses that are reimbursed by its clients, which are accounted for as revenue in its Consolidated Statements of Operations.
Salaries and Employee Benefits
Salaries and employee benefits consist of compensation and benefits paid to consultants, executive officers, and administrative and support personnel, of which the most significant elements are salaries and annual performance-related bonuses. Other items in this category are expenses related to signing bonuses and minimum guaranteed bonuses (often incurred in connection with the hiring of new consultants), restricted stock unit amortization, payroll taxes, profit sharing and retirement benefits, and employee insurance benefits.
Salaries and employee benefits are recognized on an accrual basis. Certain signing bonuses, retention awards, and minimum guaranteed compensation are capitalized and amortized in accordance with the terms of the respective agreements.
In 2008, the portion of bonus previously deferred into restricted stock units was changed to be in the form of deferred cash to be paid ratably over a three year period for consultants and management globally. The Company will continue to grant restricted stock units under other existing programs. In 2008, a premium of 10% was applied to the bonus amount deferred. In 2009 and 2010, the Company continued with the bonus cash deferral arrangement but did not apply a premium to the amounts deferred. The portion of the bonus that is deferred varies between 10% and 15% depending on the employee’s level or position.
The compensation expense related to the amounts being deferred is recognized on a graded vesting attribution method over the requisite service period. This service period begins on January 1 of the respective fiscal year and continues through the deferral date which coincides with the Company’s bonus payments in the first quarter of the following year and for an additional three year vesting period. The deferrals vest and are paid ratably over the three year vesting period and are recorded in accrued salaries and employee benefits and other non-current liabilities in the Consolidated Balance Sheets.
Stock-Based Compensation
The Company accounts for stock-based compensation based on the fair value of the award at grant date and recognizes compensation expense over the requisite service period.
Consultants’ Share of Gains Related to Warrant Monetizations
Historically, the Company’s policy with respect to warrants was that 55% of the net proceeds resulting from the monetizations of warrants was payable to the consultants involved in the search. For warrants received by the Company after April 1, 2005, the portion of the net proceeds payable to consultants was reduced from 55% to 50% and is limited to $10 million per monetization. In addition, of the 50% of the net proceeds retained by the Company, 20% (or 10% of the total net proceeds) will be reserved for discretionary distributions to the broader employee population.
45
Table of Contents
Income Taxes
Deferred tax assets and liabilities are determined based on the differences between the financial statement and tax basis of assets and liabilities, applying enacted statutory tax rates in effect for the year in which the tax differences are expected to reverse. Deferred tax assets are reduced by a valuation allowance when, in the opinion of management, it is more likely than not that some portion or all of the deferred tax assets will not be realized. Deferred tax assets and liabilities are adjusted for the effects of changes in tax laws and rates on the date of enactment.
Earnings per Common Share
Basic earnings per common share is computed by dividing net income (loss) by weighted average common shares outstanding for the year. Diluted earnings per share reflect the potential dilution that could occur if securities or other contracts to issue common stock were exercised or converted. Common equivalent shares are excluded from the determination of diluted earnings per share in periods in which they have an anti-dilutive effect.
Translation of Foreign Currencies
The Company generally designates the local currency for all its subsidiaries as the functional currency. The Company translates the assets and liabilities of its subsidiaries into U.S. dollars at the current rate of exchange prevailing at the balance sheet date. Revenue and expenses are translated at a monthly average exchange rate for the period. Translation adjustments are reported as a component of accumulated other comprehensive income.
Recently Adopted Financial Accounting Standards
On February 1, 2010, the Company adopted an amendment to previously adopted accounting guidance on subsequent event disclosure, which established standards of accounting for and disclosure of events or transactions that occur after the balance sheet date but before financial statements are issued. Under the amended guidance, the Company is no longer required to disclose the date through which subsequent events have been evaluated. The adoption of this requirement did not have material impact on the Company’s financial condition or results of operations.
3. Allowance for Doubtful Accounts
The following table summarizes the activity of the allowance for doubtful accounts for the years ended:
| December 31, | ||||||||||||
| 2010 | 2009 | 2008 | ||||||||||
| Balance at January 1, |
$ | 4,854 | $ | 5,808 | $ | 4,262 | ||||||
| Provision charged to income |
3,305 | 1,006 | 3,338 | |||||||||
| Write-offs |
(1,447 | ) | (1,729 | ) | (1,954 | ) | ||||||
| Currency |
(123 | ) | (231 | ) | 162 | |||||||
| Balance at December 31, |
$ | 6,589 | $ | 4,854 | $ | 5,808 | ||||||
46
Table of Contents
4. Property and Equipment
The components of the Company’s property and equipment are as follows:
| December 31, | ||||||||
| 2010 | 2009 | |||||||
| Leasehold improvements |
$ | 41,556 | $ | 41,125 | ||||
| Office furniture, fixtures and equipment |
23,588 | 25,328 | ||||||
| Computer equipment and software |
35,279 | 30,741 | ||||||
| Property and equipment, gross |
100,423 | 97,194 | ||||||
| Accumulated depreciation |
(66,017 | ) | (71,102 | ) | ||||
| Property and equipment, net |
$ | 34,406 | $ | 26,092 | ||||
5. Restricted Cash
The Company had $2.0 million and $2.3 million of restricted cash at December 31, 2010 and 2009, respectively, in support of lease guarantees. In accordance with the terms of the lease agreements, the cash balances are restricted through the termination dates of the leases, which extend through 2019. Additionally, at December 31, 2009, the Company had $2.4 million of restricted cash in support of a bank guarantee related to a tax audit in a European country, which was released in 2010. See Note 23, Commitments and Contingencies, for a discussion of the tax audit.
6. Investments
The components of the Company’s Investments are as follows:
| December 31, | ||||||||
| 2010 | 2009 | |||||||
| U.S. non-qualified deferred compensation plan |
$ | 8,487 | $ | 6,813 | ||||
| JobKoo |
1,803 | 2,763 | ||||||
| Warrants and equity securities |
731 | 841 | ||||||
| Total |
$ | 11,021 | $ | 10,417 | ||||
The Company’s U.S. non-qualified deferred compensation plan consists primarily of U.S. marketable securities and mutual funds, all of which are valued using Level 1 inputs. The aggregate cost basis for these investments was $7.4 million and $6.4 million as of December 31, 2010 and 2009, respectively. The Company’s joint venture investment in JobKoo is accounted for as an equity method investment. The warrants and equity securities primarily consist of cost method investments, none of which were evaluated for impairment since there were no triggering events in the respective periods.
7. Fair Value Measurements
Fair value is defined as the price that would be received to sell an asset or paid to transfer a liability in an orderly transaction between market participants at the measurement date. A three-level fair value hierarchy prioritizes the inputs used to measure fair value. The hierarchy requires entities to maximize the use of observable inputs and minimize the use of unobservable inputs. The three levels of inputs used to measure fair value are as follows:
| • | Level 1 – Quoted prices in active markets for identical assets and liabilities. |
| • | Level 2 – Quoted prices in active markets for similar assets and liabilities, or other inputs that are observable for the asset or liability, either directly or indirectly, for substantially the full term of the financial instrument. |
47
Table of Contents
| • | Level 3 – Unobservable inputs that are supported by little or no market activity and that are significant to the fair value of the assets and liabilities. This includes certain pricing models, discounted cash flow methodologies and similar techniques that use significant unobservable inputs. |
Substantially all of the Company’s assets that are measured at fair value on a recurring basis are measured using Level 1 inputs. The Company considers the recorded value of its financial assets and liabilities, which consist primarily of cash and cash equivalents, accounts receivable, and accounts payable, to approximate the fair value of the respective assets and liabilities at December 31, 2010 and 2009 based upon the short-term nature of the assets and liabilities.
8. Other Non-Current Assets
At December 31, 2010 and 2009, the Company had $8.6 million and $6.8 million of other non-current assets, respectively. Other non-current assets consist of $6.4 million of deferred compensation, $2.1 million of prepaid rent and $0.1 million of other assets as of December 31, 2010 and $4.4 million of deferred compensation and $2.4 million of prepaid rent as of December 31, 2009.
9. Acquisitions
IronHill Partners, LLC
In May 2008, the Company acquired IronHill Partners, LLC (“IronHill”), an executive search boutique firm in the United States, specializing in the venture capital sector with a particular focus on technology companies. The previous owners of IronHill, who are now Heidrick & Struggles employees, are eligible to receive earnout payments up to $4.4 million based on the achievement of certain revenue metrics in 2009, 2010, and 2011. The Company has not accrued a liability for the earnout as of December 31, 2009 and 2010 as the required revenue metrics for 2009 and 2010 were not achieved.
Ray & Berndtson Sp. z o. o
In February 2009, the Company acquired Ray & Berndtson Sp. z o. o, a retained executive search firm in Warsaw, Poland, for $2.7 million of initial consideration, pursuant to a stock purchase, which was funded from existing cash. The previous owners of Ray & Berndtson Sp. z o. o, who are now employees of Heidrick & Struggles, were eligible to receive earnout payments of up to €3.0 million (equivalent to $4.0 million at December 31, 2010) based on the achievement of certain revenue metrics in 2009, 2010, and 2011. As a result, the Company accrued €1.8 million (equivalent to $2.4 million at December 31, 2010) representing the estimated fair value of the future earnout payments as of the acquisition date. Additionally, the Company recorded $4.2 million of goodwill, $0.7 million of identifiable intangible assets, $0.3 million of assets and assumed $0.1 million of liabilities.
As a result of significantly lower than expected 2009 revenue production from the consultants acquired and uncertainty regarding future performance, the Company performed a fair value assessment of the future earnout payments under the purchase agreement. This assessment resulted in a $1.7 million reduction to the original earnout accrual in 2009. As a result of continued lower than expected 2010 revenue production from consultants acquired and uncertainty regarding future performance, the Company performed a second fair value assessment which indicated that there would not be any future earnout payments which resulted in a $1.1 million adjustment. Under the acquisition method of accounting for business combinations, the Company recognized the 2010 and 2009 fair value adjustments as other operating income in the Consolidated Statement of Operations. Additionally, the deterioration in business performance in 2009 triggered a review of the client relationship intangible assets associated with this acquisition, resulting in an impairment charge in the European region of $0.2 million during 2009.
48
Table of Contents
Bell McCaw Bampflyde Limited
In March 2010, the Company acquired Bell McCaw Bampflyde Limited, a retained executive search firm based in New Zealand for 0.8 million New Zealand dollars (equivalent to $0.6 million at December 31, 2010) of initial consideration, pursuant to an asset purchase, which was funded from existing cash. The previous owner of Bell McCaw Bampflyde Limited, who is now an employee of Heidrick & Struggles, is eligible to receive earnout payments of up to 1.4 million New Zealand dollars based on the achievement of certain revenue metrics in 2011, 2012 and 2013. As a result, the Company accrued the entire 1.4 million New Zealand dollars (equivalent to $1.1 million at December 31, 2010), representing the estimated fair value of future earnout payments as of the acquisition date. As part of the purchase price allocation, the Company recorded 0.2 million New Zealand dollars (equivalent to $0.1 million at December 31, 2010) of property and equipment, and 2.0 million New Zealand dollars (equivalent to $1.6 million at December 31, 2010) of goodwill. There were no intangibles recorded as part of this acquisition.
The 2008 acquisitions were accounted for using the purchase method of accounting and the 2009 and 2010 acquisitions were accounted for using the acquisition method of accounting for business combinations. The results of operations of these entities have been included in the consolidated financial statements since their respective acquisition dates. Additionally, none of these acquisitions are considered material to the Company, and, therefore, pro-forma information has not been presented.
10. Goodwill and Other Intangible Assets
Goodwill
Changes in the carrying amount of goodwill by segment for the years ended December 31, 2010 and 2009 were as follows:
| Americas | Europe | Asia Pacific | Total | |||||||||||||
| Balance at December 31, 2008 |
$ | 78,056 | $ | 18,499 | $4,679 | $ | 101,234 | |||||||||
| Ray & Berndtson Sp.z o.o acquisition |
— | 4,156 | — | 4,156 | ||||||||||||
| RentonJames earnout adjustment |
— | — | 394 | 394 | ||||||||||||
| IronHill acquisition adjustment |
108 | — | — | 108 | ||||||||||||
| Exchange rate fluctuations |
591 | 1,615 | 912 | 3,118 | ||||||||||||
| Balance at December 31, 2009 |
78,755 | 24,270 | 5,985 | 109,010 | ||||||||||||
| Bell McCaw Bampflyde Limited acquisition |
— | — | 1,386 | 1,386 | ||||||||||||
| Exchange rate fluctuations |
234 | (1,288 | ) | 546 | (508 | ) | ||||||||||
| Balance at December 31, 2010 |
$ | 78,989 | $ | 22,982 | $7,917 | $ | 109,888 | |||||||||
During the 2010 fourth quarter, the Company, with the assistance of an independent valuation firm, conducted its annual goodwill impairment evaluation. The goodwill impairment test is performed using a two step, fair value based test. The first step compares the fair value of a reporting unit with its carrying amount, including goodwill. The second step measures the impairment charge and is performed only if the carrying amount of a reporting unit exceeds its fair value as determined in step one. To measure the amount of the impairment loss, the implied fair value of a reporting unit’s goodwill is compared to the carrying amount of that goodwill. If the carrying amount of a reporting unit’s goodwill exceeds the implied fair value of that goodwill, an impairment loss is recognized in an amount equal to that excess. The implied fair value of goodwill is determined in the same manner as the amount of goodwill recognized in a business combination is determined.
During the first step, the Company uses discounted cash flow and comparable company methodologies to estimate the fair value of its reporting units. The discounted cash flow approach is dependent on a number of factors including estimates of future market growth and trends, forecasted revenue and costs, capital investments, appropriate discount rates, certain assumptions to allocate shared assets and liabilities, historical and projected
49
Table of Contents
performance of the Company’s reporting units the outlook for the executive search industry, and the macroeconomic conditions affecting each of the Company’s reporting units.
The impairment test is considered for each of the Company’s reporting units as defined in the accounting standard for goodwill and intangible assets. The Company operates its executive search and leadership consulting services in three geographic regions: the Americas; Europe, which includes the Middle East and Africa; and Asia Pacific. The Americas is comprised of North America and Latin America operations. These operating segments are also considered to be the Company’s reporting units as follows: North America, Latin America, Europe and Asia Pacific.
The completion of the first step of this goodwill impairment test indicated that the fair value of each of the Company’s reporting units exceeded its carrying amount. The key assumptions used in the determination of fair value included a forecast of moderate growth in the near term coinciding with continued improvement of economic conditions followed by stabilization in the longer term, improved profit margin expectations and other factors. There was no indication of impairment and the second step of the impairment evaluation was not performed. The estimated fair value of the Americas and Asia Pacific reporting units were significantly in excess of their net asset carrying values. The estimated fair value of the European reporting unit exceeded its net asset carrying value by approximately 5% which is lower than previous goodwill analyses.
Given the current market conditions and continued economic uncertainty, the fair value of the European reporting unit may deteriorate and could result in the need to record an impairment charge in future periods. The Company continues to monitor potential triggering events including changes in the business climate in which it operates, attrition of key personnel, the current volatility in the capital markets, the Company’s market capitalization compared to its book value, the Company’s recent operating performance, and the Company’s financial projections specifically in relation to the European reporting unit. Any changes in these factors could result in an impairment charge.
Other Intangible Assets
The carrying amount of amortizable intangible assets and the related accumulated amortization were as follows:
| December 31, | ||||||||||||||||||||||||||||
| 2010 | 2009 | |||||||||||||||||||||||||||
| Weighted Average Life (in years) |
Gross Carrying Amount |
Accumulated Amortization |
Net Carrying Amount |
Gross Carrying Amount |
Accumulated Amortization |
Net Carrying Amount |
||||||||||||||||||||||
| Client relationships |
14.9 | $ | 18,430 | $(12,503 | ) | $5,927 | $ | 19,251 | $(11,513 | ) | $7,738 | |||||||||||||||||
| Candidate database |
6.0 | 1,800 | (1,275 | ) | 525 | 1,800 | (975 | ) | 825 | |||||||||||||||||||
| Other |
6.0 | 204 | (176 | ) | 28 | 202 | (129 | ) | 73 | |||||||||||||||||||
| Total intangible assets |
14.2 | $ | 20,434 | $(13,954 | ) | $6,480 | $ | 21,253 | $(12,617 | ) | $8,636 | |||||||||||||||||
During 2009, the Company recorded $0.7 million of intangible assets in conjunction with the acquisition of Ray and Berndtson Sp. z o. o, consisting entirely of client relationships amortized over 11 years. Additionally, the deterioration in business performance from the consultants acquired in the acquisition triggered a review of the client relationship intangible asset associated with this acquisition, resulting in an impairment charge in the European region of $0.2 million. See Note 9, Acquisitions.
As a result of the Company’s workforce reductions in January and May 2009 and continued business and economic uncertainty, during 2009, the Company performed an analysis of the remaining client relationship intangible asset associated with its 2006 acquisition of Highland Partners. The analysis was conducted in
50
Table of Contents
accordance with accounting guidance on fair value assumptions regarding the highest and best use of the asset by market participants in the context of the executive search business. Based on this analysis, the Company recorded an impairment charge related to the Americas region of $3.8 million. See Note 19, Restructuring and Impairment Charges.
As a result of the departure of certain consultants during the second quarter of 2010 and post acquisition performance associated with the Company’s 2008 acquisitions of Schwab Enterprise, LLC and 75 Search Partners, LLC, and 2009 acquisition of Ray and Berndtson Sp. z o. o, the Company performed analyses of the remaining client relationship intangible assets related to these acquisitions. Based on these analyses, the Company recorded impairment charges of $0.5 million in the Americas region and $0.2 million in the European region during the second quarter of 2010 which are included in general and administrative expenses in the Consolidated Statement of Operations for the year ended December 31, 2010.
Intangible asset amortization expense for the years ended December 31, 2010, 2009, and 2008 was $1.3 million, $1.8 million and $2.2 million, respectively. The estimated intangible amortization expense is $1.2 million for fiscal year 2011, $1.1 million for fiscal year 2012, $0.8 million for fiscal year 2013 and 2014, and $0.7 million for fiscal year 2015. These amounts are based on intangible assets recorded as of December 31, 2010, and actual amortization expense could differ from these estimates as a result of future acquisitions and other factors.
11. Other Current and Non-Current Liabilities
The components of other current liabilities are as follows:
| December 31, | ||||||||
| 2010 | 2009 | |||||||
| Deferred revenue |
$ | 16,639 | $ | 17,228 | ||||
| Sales and value-added taxes |
4,744 | 2,699 | ||||||
| Dividend payable |
2,283 | 2,220 | ||||||
| Accounting and legal fees |
1,927 | 1,331 | ||||||
| Pension liability |
1,401 | 1,391 | ||||||
| Premise related costs |
920 | 3,415 | ||||||
| Restructuring charges |
850 | 3,043 | ||||||
| Earnout payments |
363 | 929 | ||||||
| Other |
4,937 | 5,556 | ||||||
| Total other current liabilities |
$ | 34,064 | $ | 37,812 | ||||
The components of other non-current liabilities are as follows:
| December 31, | ||||||||
| 2010 | 2009 | |||||||
| Accrued salaries and employee benefits |
$ | 26,084 | $ | 21,345 | ||||
| Premise related costs |
15,240 | 12,228 | ||||||
| Restructuring charges |
1,549 | 1,225 | ||||||
| Earnout payments |
759 | — | ||||||
| Other |
3,383 | 3,678 | ||||||
| Total other non-current liabilities |
$ | 47,015 | $ | 38,476 | ||||
51
Table of Contents
12. Line of Credit
Since April 2009, the Company has had a $75 million committed unsecured revolving credit facility (the “Facility”). Under the Facility, the Company may borrow U.S. dollars, euros, or other major traded currencies as agreed by the lenders. Borrowings under the Facility bear interest at the existing Alternate Base Rate or at LIBOR plus a spread as determined by our leverage ratio. A fee is charged by the lenders even if no portion of the Facility is used. The Facility expires in October 2011.
There were no borrowings made or outstanding during the years ended December 31, 2010 or 2009. Due to the restructuring charge recorded in the quarter ended March 31, 2009, the Company was not in compliance with one of the financial covenants of the Facility. As a result, the Company amended the Facility and the lenders waived compliance for that quarter. As a result of the amendment, the Company was in compliance with the amended financial covenants of the Facility and no event of default existed, during 2010 and 2009.
13. Employee Benefit Plans
Qualified Retirement Plan
The Company has a defined contribution retirement plan (the “Plan”) for all eligible employees in the United States. Eligible employees may begin participating in the Plan upon their hire date. The Plan contains a 401(k) provision, which provides for employee pre-tax and/or after-tax contributions, from 1% to 50% of their eligible compensation up to a combined maximum permitted by law. The Plan also allows for higher limitations if an employee is age 50 or older. The Company matched employee contributions on a dollar for dollar basis per participant up to the greater of $4,000 or 3% of eligible compensation for the year ended December 31, 2010. The Company suspended its employer matching contribution for the year ended December 31, 2009 and matched employee contributions up to the greater of $4,000 or 3% of eligible compensation for the year ended December 31, 2008. Employees are eligible for the Company match after satisfying a one year service requirement provided that they are working on the last day of the Plan year in which the match is made. The Plan also provides for employees who retire, die or become disabled during the Plan year to receive the Company match for that Plan year. The Plan provides that forfeitures will be used to reduce the Company’s contributions. Forfeitures are created when participants terminate employment before becoming entitled to the Company’s matching contribution under the Plan. The Company also has the option of making discretionary contributions. There were no discretionary contributions made for the years ended December 31, 2010, 2009 and 2008. The Company match expense for the years ended December 31, 2010, 2009 and 2008 was $1.8 million, zero and $2.2 million, respectively.
Through September 30, 2004, the Plan allowed participants the option of having their account balances or portions thereof invested in the Company’s common stock. As of October 1, 2004, participants were no longer allowed the option of purchasing the Company’s common stock under the Plan. However, those participants who held the Company’s common stock were allowed to maintain their shares. At December 31, 2010 and 2009, the Plan held 4,772 and 267,133 shares, respectively, of the Company’s common stock.
The Company maintains additional retirement plans in the Americas, Europe and Asia Pacific regions which the Company does not consider as material, and, therefore additional disclosure has not been presented. The balances associated with these plans have been reported in the Consolidated Statements of Operations for the years ended December 31, 2010, 2009 and 2008 and in the Consolidated Balance Sheets as of December 31, 2010 and 2009.
Deferred Compensation Plans
The Company has a deferred compensation plan for certain U.S. employees (the “U.S. Plan”) that became effective on January 1, 2006. The U.S. Plan allows participants to defer up to 25% of their base compensation and up to the lesser of $500,000 or 25% of their eligible bonus compensation into several different investment
52
Table of Contents
vehicles, including a Company stock fund. These deferrals are immediately vested and are not subject to a risk of forfeiture. In 2010 and 2009, all deferrals in the U.S. Plan were funded. In addition to the U.S. Plan, at December 31, 2009, there was a $0.6 million carry over balance from a previous plan, which was fully accrued. As of December 31, 2010, this balance has been included in the U.S. Plan. The compensation deferred in the U.S. Plan was $7.2 million and $5.8 million, at December 31, 2010 and 2009, respectively. The assets and liabilities of this plan are included in the Consolidated Balance Sheets at December 31, 2010 and 2009.
The Company has a Non-Employee Directors Voluntary Deferred Compensation Plan whereby non-employee members of the Company’s Board of Directors may elect to defer up to 100% of the cash component of their directors’ fees into several different investment vehicles, including a Company stock fund. As of December 31, 2010 and 2009, the total amounts deferred under the plan were $1.3 million and $1.0 million, respectively, all of which was funded.
14. Pension Plan and Life Insurance Contract
The Company maintains a pension plan for certain employees in Germany. The pensions are individually fixed Euro amounts that vary depending on the function and the eligible years of service of the employee.
The following tables reconcile the benefit obligation for the pension plan:
| 2010 | 2009 | |||||||
| Benefit obligation at January 1, |
$ | 24,330 | $ | 22,980 | ||||
| Service cost |
129 | 126 | ||||||
| Interest cost |
1,148 | 1,280 | ||||||
| Actuarial gain (loss) |
681 | 701 | ||||||
| Benefits paid |
(1,281 | ) | (1,348 | ) | ||||
| Cumulative translation adjustment |
(1,601 | ) | 591 | |||||
| Benefit obligation at December 31, |
$ | 23,406 | $ | 24,330 | ||||
The benefit obligation amounts recognized in the Consolidated Balance Sheets are as follows:
| December 31, | ||||||||
| 2010 | 2009 | |||||||
| Current liabilities |
$ | 1,401 | $ | 1,391 | ||||
| Noncurrent liabilities |
22,005 | 22,939 | ||||||
| Total |
$ | 23,406 | $ | 24,330 | ||||
The accumulated benefit obligation amounts at December 31, 2010 and 2009 are $23.3 million and $24.2 million, respectively.
The components of and assumptions used to determine the net periodic benefit cost are as follows:
| December 31, | ||||||||||||
| 2010 | 2009 | 2008 | ||||||||||
| Net period benefit cost: |
||||||||||||
| Service cost |
$ | 129 | $ | 126 | $ | 138 | ||||||
| Interest cost |
1,148 | 1,280 | 1,287 | |||||||||
| Amortization of net gain |
(624 | ) | (880 | ) | (666 | ) | ||||||
| Net periodic benefit cost |
$ | 653 | $ | 525 | $ | 759 | ||||||
| Weighted average assumptions |
||||||||||||
| Discount rate (1) |
5.10 | % | 5.75 | % | 5.20 | % | ||||||
| Rate of compensation increase |
1.75 | % | 1.75 | % | 1.75 | % | ||||||
53
Table of Contents
Assumptions to determine the Company’s benefit obligation are as follows:
| December 31, | ||||||||||||
| 2010 | 2009 | 2008 | ||||||||||
| Discount rate (1) |
5.10 | % | 5.25 | % | 5.75 | % | ||||||
| Rate of compensation increase |
1.75 | % | 1.75 | % | 1.75 | % | ||||||
| Measurement Date |
12/31/2010 | 12/31/2009 | 12/31/2008 | |||||||||
| (1) | The discount rates are based on long-term bond indices adjusted to reflect the longer duration of the benefit obligation. |
The amounts in accumulated other comprehensive income as of December 31, 2010 and 2009 that had not yet been recognized as components of net periodic benefit cost were $3.3 million and $5.0 million, respectively. Accumulated other comprehensive income as of December 31, 2010 includes $0.3 million that is expected to be recognized as a component of net periodic benefit cost in 2011.
The Company’s investment strategy is to support its pension obligations through reinsurance contracts. The BaFin—German Federal Financial Supervisory Authority—supervises the insurance companies and the reinsurance contracts and requires each to guarantee a fixed minimum return. The Company’s pension benefits are fully reinsured within group insurance contracts with ERGO Lebensversicherung AG which are measured in accordance with BaFin guidelines (including mortality tables and discount rates) which are considered Level 2 inputs. The fair value at December 31, 2010 and 2009 was $25.0 million and $26.9 million, respectively. The expected contribution to be paid into the plan in 2011 is $1.4 million.
Since the pension assets are not segregated in trust from the Company’s other assets, the pension assets are not shown as an offset against the pension liabilities in the Consolidated Balance Sheets. These assets are included in the Consolidated Balance Sheets at December 31, 2010 and 2009, as a component of other current assets and assets designated for retirement and pension plans.
The benefits expected to be paid in each of the next five years, and in the aggregate for the five years thereafter are as follows:
| Year ending December 31, |
||||
| 2011 |
$ | 1,401 | ||
| 2012 |
1,413 | |||
| 2013 |
1,424 | |||
| 2014 |
1,823 | |||
| 2015 |
1,726 | |||
| 2016 through 2020 |
8,600 |
15. Stock-Based Compensation
GlobalShare Program
On May 24, 2007, the stockholders of the Company approved the 2007 Heidrick & Struggles GlobalShare Program (the “Plan”) at the Company’s Annual Meeting of Stockholders. The Plan had previously been approved by the Board of Directors of the Company on April 16, 2007, subject to approval of the stockholders of the Company.
The Plan reflects the merger of the Company’s prior stock-based plans, GlobalShare Program I and GlobalShare Program II. The Plan provides for grants of stock options, stock appreciation rights, restricted stock awards, restricted stock units, performance stock units and other stock-based awards that are valued based upon the fair market value of shares. These awards may be granted to directors, selected employees and independent contractors. Awards are paid in shares, but may be paid in cash. No incentive option can have a term greater than ten years and the option price per share of common stock cannot be less than 100% of the fair market value of the Company’s common stock on the date of grant.
54
Table of Contents
The Plan provides 2,000,000 shares available for awards to be granted on or after May 24, 2007 (the effective date of the Plan). This number includes the shares that were not subject to awards and still available for issuance under the GlobalShare Programs I and II as of May 24, 2007. As of December 31, 2010, there are 784,579 shares available for future awards.
The Plan limits the number of shares that may be granted to any participant who is or may be a “covered employee” under Code Section 162(m) to 200,000 stock options and stock appreciation rights and 200,000 performance-based awards.
The total number of restricted stock units and performance stock units and the underlying shares of the Company’s common stock that may be issued or delivered under the Plan is recommended by management and approved by the Human Resources and Compensation Committee of the Board of Directors on an annual basis.
The Company has the ability to settle equity awards by issuing shares held in treasury or through the issuance of authorized but unissued common stock.
The Plan provides that no awards can be granted after May 31, 2011.
A summary of information with respect to stock-based compensation is as follows:
| December 31, | ||||||||||||
| 2010 | 2009 | 2008 | ||||||||||
| Total stock-based compensation expense included in net income |
$ | 7,765 | $ | 19,016 | $ | 24,772 | ||||||
| Income tax benefit related to stock-based compensation included in net income |
3,106 | 7,606 | 9,909 | |||||||||
As of December 31, 2010, there was $8.0 million of pre-tax unrecognized compensation expense related to unvested restricted stock, performance stock and non-qualified stock options, which is expected to be recognized over a weighted average of 2.0 years.
Restricted Stock Units
Restricted stock units are generally subject to ratable vesting over a three year period. Compensation expense related to service-based restricted stock units is recognized on a straight-line basis over the vesting period. For awards requiring satisfaction of both service and performance conditions, compensation expense is recognized using a graded vesting attribution method.
55
Table of Contents
Restricted stock unit activity for the years ended December 31, 2010, 2009 and 2008:
| Number of Restricted Stock Units |
Weighted- Average Grant-date Fair Value |
|||||||
| Outstanding on December 31, 2007 |
1,634,736 | $40.23 | ||||||
| Granted |
1,203,334 | 33.04 | ||||||
| Vested and converted to common stock |
(816,976 | ) | 38.62 | |||||
| Forfeited |
(140,375 | ) | 38.28 | |||||
| Outstanding on December 31, 2008 |
1,880,719 | 36.48 | ||||||
| Granted |
314,738 | 14.56 | ||||||
| Vested and converted to common stock |
(818,768 | ) | 37.09 | |||||
| Forfeited |
(162,169 | ) | 33.92 | |||||
| Outstanding on December 31, 2009 |
1,214,520 | 30.73 | ||||||
| Granted |
297,183 | 26.62 | ||||||
| Vested and converted to common stock |
(637,693 | ) | 34.44 | |||||
| Forfeited |
(160,616 | ) | 27.03 | |||||
| Outstanding on December 31, 2010 |
713,394 | 26.52 | ||||||
As of December 31, 2010, there was $6.8 million of pre-tax unrecognized compensation expense related to unvested restricted stock units, which is expected to be recognized over a weighted average of 2.0 years.
Performance Stock Units
The Company began granting performance stock units in 2009. The performance stock units are generally subject to a cliff vesting at the end of a three year period. The actual shares issued upon vesting will vary between 0%—175% of the performance stock units granted based on the Company’s total shareholder return relative to its prescribed peer group over the 3 year service period. The performance stock units are expensed on a straight-line basis over the 3 year vesting period.
Performance share unit activity for the years ended December 31, 2010, 2009 and 2008:
| Number of Performance Share Units |
Weighted- Average Grant-date Fair Value |
|||||||
| Outstanding on December 31, 2008 |
— | — | ||||||
| Granted |
104,023 | $17.85 | ||||||
| Vested and converted to common stock |
— | — | ||||||
| Forfeited |
— | — | ||||||
| Outstanding on December 31, 2009 |
104,023 | 17.85 | ||||||
| Granted |
62,760 | 28.28 | ||||||
| Vested and converted to common stock |
— | — | ||||||
| Forfeited |
(54,260 | ) | 21.23 | |||||
| Outstanding on December 31, 2010 |
112,523 | 22.03 | ||||||
As of December 31, 2010, there was $1.2 million of pre-tax unrecognized compensation expense related to unvested performance stock units, which is expected to be recognized over a weighted average of 1.9 years.
56
Table of Contents
Non-qualified Stock Options
Stock options granted under the Plan have an exercise price that is equal to the fair value of the Company’s common stock on the grant date. Options under the Plan are generally subject to ratable vesting over a 3 year period, and compensation expense is recognized on a straight-line basis over the vesting period.
Non-qualified stock option activity for the years ended December 31, 2010, 2009 and 2008:
| Number of Non-qualified Stock Options |
Weighted- Average Exercise Price Per Share |
Weighted- Average Remaining Contractual Term (in years) |
Aggregate Intrinsic Value |
|||||||||||||
| Outstanding on December 31, 2007 |
714,895 | $30.35 | 2.4 | $ | 10,395 | |||||||||||
| Granted |
149,452 | 33.37 | ||||||||||||||
| Exercised |
(64,299 | ) | 13.95 | |||||||||||||
| Expired |
(41,260 | ) | 36.43 | |||||||||||||
| Forfeited |
(20,835 | ) | 41.78 | |||||||||||||
| Outstanding on December 31, 2008 |
737,953 | 31.72 | 3.0 | 10,947 | ||||||||||||
| Granted |
— | — | ||||||||||||||
| Exercised |
(88,412 | ) | 14.00 | |||||||||||||
| Expired |
(125,814 | ) | 24.23 | |||||||||||||
| Forfeited |
(13,727 | ) | 39.45 | |||||||||||||
| Outstanding on December 31, 2009 |
510,000 | 36.44 | 3.0 | 8,505 | ||||||||||||
| Granted |
— | — | ||||||||||||||
| Exercised |
— | — | ||||||||||||||
| Expired |
(159,360 | ) | 37.46 | |||||||||||||
| Forfeited |
(13,318 | ) | 33.79 | |||||||||||||
| Outstanding on December 31, 2010 |
337,322 | 35.77 | 2.4 | 5,462 | ||||||||||||
| Exercisable on December 31, 2008 |
533,664 | $30.13 | 1.3 | $ | 8,686 | |||||||||||
| Exercisable on December 31, 2009 |
400,532 | 36.73 | 1.8 | 7,319 | ||||||||||||
| Exercisable on December 31, 2010 |
303,781 | 36.06 | 1.9 | 5,116 | ||||||||||||
Information about non-qualified stock options at December 31, 2010 is as follows:
| Options Outstanding | Options Exercisable | |||||||||||||||||||
| Range of Exercise |
Number Outstanding |
Weighted Average Remaining Contractual Life in years |
Weighted Average Exercise Price |
Number Exercisable |
Weighted Average Exercise Price |
|||||||||||||||
| $28.65 to $33.79 | 140,288 | 5.2 | $33.10 | 106,747 | $33.09 | |||||||||||||||
| $35.13 to $36.45 | 159,784 | 0.2 | 35.15 | 159,784 | 35.15 | |||||||||||||||
| $48.45 | 37,250 | 1.2 | 48.45 | 37,250 | 48.45 | |||||||||||||||
| $28.65 to $48.45 | 337,322 | 2.4 | $35.77 | 303,781 | $36.06 | |||||||||||||||
As of December 31, 2010, there was $0.1 million of pre-tax unrecognized compensation expense related to unvested non-qualified stock options, which is expected to be recognized over a weighted average of 0.3 years.
| Year Ended December 31, | ||||||||||||
| 2010 | 2009 | 2008 | ||||||||||
| Weighted average grant date fair value of stock options granted |
$ | — | $ | — | $ | 10.37 | ||||||
| Total grant date fair value of stock options vested (in 000’s) |
700 | 914 | 1,561 | |||||||||
| Total intrinsic value of stock options exercised (in 000’s) |
— | 257 | 1,111 | |||||||||
57
Table of Contents
The fair value of each option grant is estimated on the date of grant using the Black-Scholes valuation model with the following weighted average assumptions:
| Year Ended December 31, | ||||||||||||
| 2010 | 2009 | 2008 | ||||||||||
| Expected life (in years) (1) |
— | — | 4.7 | |||||||||
| Risk-free interest rate |
— | — | 2.5 | % | ||||||||
| Expected volatility |
— | — | 37.7 | % | ||||||||
| Expected divident yield |
— | — | 1.5 | % | ||||||||
| (1) | There were no options granted during 2010 or 2009. Options granted during 2008 have a contractual term of 10 years. |
The expected option life input is based on a forward-looking stock price Monte Carlo simulation model incorporating the Company’s historical exercise data and projected post-vest turnover rate. The risk-free interest rate is based on the implied yield currently available on U.S. Treasury zero coupon issues with a remaining term equal to the expected option life. The expected volatility is based on a simple average of the historical volatility of the Company’s stock corresponding to the expected life of the option and the implied volatility provided by its traded options.
16. Comprehensive Income (Loss)
Comprehensive income (loss) includes net income (loss) and also considers the effect of additional economic events that are not required to be reported in determining net income, but rather are reported as a separate component of stockholders’ equity. The Company reports foreign currency translation gains and losses and unrealized gains and losses on available-for-sale investments and pension adjustments, as components of comprehensive income (loss).
| Year Ended December 31, | ||||||||||||
| 2010 | 2009 | 2008 | ||||||||||
| Comprehensive income (loss): |
||||||||||||
| Net income (loss) |
$ | 7,493 | $ | (20,908 | ) | $ | 39,074 | |||||
| Change in foreign currency translation adjustment |
2,859 | 3,175 | (10,819 | ) | ||||||||
| Change in unrealized gain (loss) on available-for-sale investments |
706 | 1,336 | (1,746 | ) | ||||||||
| Pension adjustment, net of tax |
(1,055 | ) | (937 | ) | 155 | |||||||
| Total comprehensive income (loss) |
$ | 10,003 | $ | (17,334 | ) | $ | 26,664 | |||||
The Company recorded a deferred tax benefit of $0.6 million and $0.5 million in 2010 and 2009, respectively, and a deferred tax liability of $0.1 million in 2008 related to the pension adjustment.
| December 31, | ||||||||
| 2010 | 2009 | |||||||
| Accumulated other comprehensive income: |
||||||||
| Cumulative foreign currency translation adjustment |
$ | 15,355 | $ | 12,496 | ||||
| Net unrealized gain (loss) on available-for-sale investments, net of tax |
669 | (37 | ) | |||||
| Pension adjustment, net of tax |
2,214 | 3,269 | ||||||
| Total accumulated other comprehensive income |
$ | 18,238 | $ | 15,728 | ||||
58
Table of Contents
17. Basic and Diluted Earnings (Loss) Per Common Share
A reconciliation of the basic and diluted earnings (loss) per common share, and the shares used in the computation are as follows:
| December 31, | ||||||||||||
| 2010 | 2009 | 2008 | ||||||||||
| Net income (loss) |
$ | 7,493 | $ | (20,908 | ) | $ | 39,074 | |||||
| Weighted average common shares outstanding |
17,437 | 16,901 | 16,747 | |||||||||
| Dilutive common shares |
432 | — | 980 | |||||||||
| Weighted average diluted common shares outstanding |
17,869 | 16,901 | 17,727 | |||||||||
| Basic earnings (loss) per common share |
$ | 0.43 | $ | (1.24 | ) | $ | 2.33 | |||||
| Diluted earnings (loss) per common share |
$ | 0.42 | $ | (1.24 | ) | $ | 2.20 | |||||
Options to purchase 0.3 million, 0.5 million, and 0.6 million shares of common stock that were outstanding during 2010, 2009 and 2008, respectively, were not included in the computation of diluted earnings per share as the exercise prices of these options were greater than the average market price of common shares. Additionally, approximately 0.8 million dilutive common shares were excluded from the computation of the loss per common share for the year ended December 31, 2009 because the effect of their inclusion would be anti-dilutive as a result of the Company’s net loss position.
18. Other Charges
The other charges of $4.2 million in the Consolidated Statement of Operations for the year ended December 31, 2010 consist of $3.2 million of accelerated occupancy costs and depreciation, dilapidation costs, and professional fees related to the settlement of the Company’s lease obligations with its former London office which the Company vacated and $1.0 million due to an unfavorable judgment in a lawsuit filed by a former European employee separated from the Company in 2006.
19. Restructuring and Impairment Charges
Restructuring Charges
In 2009, the Company recorded restructuring charges of $22.9 million in connection with initiatives to reduce overall costs and improve operational efficiencies. These charges relate to severance and other employee-related costs associated with reductions in the Company’s workforce of 363 employees globally and included 75 executive search consultants. By segment, the restructuring charges recorded in 2009 were $9.5 million in the Americas, $9.5 million in Europe, $2.4 million in Asia Pacific and $1.5 million in Global Operations Support. Additionally, during 2009 the Company recorded a reduction of $0.3 million in Europe related to a previously restructured office.
In 2010, the Company recorded restructuring charges of $1.6 million. These charges consist of $0.6 million of severance associated with reductions in the Company’s workforce of 19 employees globally in connection with continued initiatives to reduce our overall costs and improve operational efficiencies and $1.0 million related to the default of two of our subtenants in previously restructured offices. By segment the restructuring charges recorded in the year ended December 31, 2010 were $1.0 million in the Americas, $0.3 million in Europe, and $0.3 million in Global Operations Support.
The accrued restructuring charges at December 31, 2010 and 2009, consist of employee-related costs that require cash payments based on individual severance agreements and real estate leases that require cash payments through the lease terms reduced by sublease income. These accruals are included within other current and non-current liabilities in the Consolidated Balance Sheets at December 31, 2010 and 2009, respectively.
59
Table of Contents
Based on current estimates, the Company expects that cash outlays over the next twelve months related to restructuring charges accrued at December 31, 2010 will be $0.9 million, with the remainder payable over the remaining lease terms of the vacated properties, which extend through 2016.
Impairment Charges
As a result of the Company’s workforce reductions in January and May 2009 and continued business and economic uncertainty, during 2009, the Company performed an evaluation of the remaining client relationship intangible asset associated with its 2006 acquisition of Highland Partners. Based on this analysis, the Company recorded an impairment charge related to the Americas region of $3.8 million in 2009. See Note 10, Goodwill and Other Intangible Assets.
The deterioration in business performance in 2009 from the consultants acquired in the Ray and Berndtson Sp. z o. o acquisition triggered a review of the associated client relationship intangible assets, resulting in an impairment charge in the European region of $0.2 million. See Note 10, Goodwill and Other Intangible Assets.
The table below outlines the restructuring and impairment charges along with related cash payments for each of the years in the three-year period ended December 31, 2010:
| Restructuring | ||||||||||||||||
| Employee Related |
Office Related |
Impairment | Total | |||||||||||||
| Accrual balance at December 31, 2007 |
$ | — | $ | 9,548 | $ | — | $ | 9,548 | ||||||||
| Cash payments |
— | (2,841 | ) | — | (2,841 | ) | ||||||||||
| Exchange rate fluctuations |
— | (954 | ) | — | (954 | ) | ||||||||||
| Accrual balance at December 31, 2008 |
— | 5,753 | — | 5,753 | ||||||||||||
| Restructuring and impairment charges |
22,901 | (261 | ) | 4,080 | 26,720 | |||||||||||
| Cash payments |
(22,031 | ) | (2,989 | ) | — | (25,020 | ) | |||||||||
| Non cash write-offs |
455 | — | (4,080 | ) | (3,625 | ) | ||||||||||
| Exchange rate fluctuations |
202 | 238 | — | 440 | ||||||||||||
| Accrual balance at December 31, 2009 |
1,527 | 2,741 | — | 4,268 | ||||||||||||
| Restructuring charges |
580 | 1,041 | — | 1,621 | ||||||||||||
| Cash payments |
(1,745 | ) | (1,694 | ) | — | (3,439 | ) | |||||||||
| Exchange rate fluctuations |
(47 | ) | (6 | ) | — | (53 | ) | |||||||||
| Accrual balance at December 31, 2010 |
$ | 315 | $ | 2,082 | $ | — | $ | 2,397 | ||||||||
20. Income Taxes
The sources of income (loss) before income taxes are as follows:
| December 31, | ||||||||||||
| 2010 | 2009 | 2008 | ||||||||||
| United States |
$ | 4,396 | $ | (18,226 | ) | $ | 27,162 | |||||
| Foreign |
12,552 | (11,473 | ) | 35,091 | ||||||||
| Income (loss) before income taxes |
$ | 16,948 | $ | (29,699 | ) | $ | 62,253 | |||||
60
Table of Contents
The provision for (benefit from) income taxes are as follows:
| December 31, | ||||||||||||
| 2010 | 2009 | 2008 | ||||||||||
| Current |
||||||||||||
| Federal |
$ | (6,479 | ) | $ | (3,397 | ) | $ | 2,825 | ||||
| State and local |
327 | 258 | 1,690 | |||||||||
| Foreign |
8,903 | 3,643 | 9,762 | |||||||||
| Deferred |
6,704 | (9,295 | ) | 8,902 | ||||||||
| Total provision for (benefit from) income taxes |
$ | 9,455 | $ | (8,791 | ) | $ | 23,179 | |||||
A reconciliation of the provision for (benefit from) income taxes to income taxes at the statutory U.S. federal income tax rate of 35% is as follows:
| December 31, | ||||||||||||
| 2010 | 2009 | 2008 | ||||||||||
| Income tax provision (benefit) at the statutory U.S. federal rate |
$ | 5,932 | $ | (10,395 | ) | $ | 21,789 | |||||
| State income tax provision (benefit), net of federal tax benefit |
513 | (828 | ) | 1,292 | ||||||||
| Nondeductible expenses |
1,936 | 428 | 4,007 | |||||||||
| Foreign tax higher (lower) than U.S. (includes changes in foreign valuation allowance) |
2,367 | 1,625 | (2,347 | ) | ||||||||
| Establishment of valuation allowance |
2,078 | 1,436 | — | |||||||||
| U.S. tax (benefit) on foreign dividends |
379 | (991 | ) | (12 | ) | |||||||
| Change in uncertain tax positions |
(3,079 | ) | — | — | ||||||||
| Other, net |
(671 | ) | (66 | ) | (1,550 | ) | ||||||
| Total provision for (benefit from) income taxes |
$ | 9,455 | $ | (8,791 | ) | $ | 23,179 | |||||
61
Table of Contents
The deferred tax assets and liabilities are attributable to the following components:
| December 31, | ||||||||
| 2010 | 2009 | |||||||
| Deferred tax assets attributable to: |
||||||||
| Receivable allowances |
$ | 2,349 | $ | 1,646 | ||||
| Accrued vacation |
2,257 | 1,929 | ||||||
| Accrued bonuses |
5,943 | 6,249 | ||||||
| Liability for nonqualified retirement plans |
5,782 | 5,913 | ||||||
| Accrued compensation-restricted stock units |
2,695 | 7,408 | ||||||
| Accrued rent |
5,152 | 4,496 | ||||||
| Depreciation on property and equipment |
— | 170 | ||||||
| Foreign net operating loss carryforwards |
15,679 | 14,483 | ||||||
| Goodwill |
55 | 533 | ||||||
| Accrued restructuring charges |
551 | 674 | ||||||
| Deferred compensation |
13,616 | 10,554 | ||||||
| Foreign tax credit carryforwards |
17,455 | 20,630 | ||||||
| U.S. state net operating loss carryforwards |
609 | 684 | ||||||
| U.S. capital loss carryforward |
1,173 | 1,436 | ||||||
| Other accrued expenses |
4,138 | 3,147 | ||||||
| Deferred tax assets, before valuation allowance |
77,454 | 79,952 | ||||||
| Deferred tax liabilities attributable to: |
||||||||
| Unrealized gain on equity and warrant portfolio |
(758 | ) | (842 | ) | ||||
| Prepaid expenses |
(478 | ) | (525 | ) | ||||
| Depreciation on property and equipment |
(1,380 | ) | — | |||||
| Goodwill |
(5,133 | ) | (3,480 | ) | ||||
| Deferred revenue |
(1,164 | ) | (985 | ) | ||||
| Other |
(4,387 | ) | (4,911 | ) | ||||
| Deferred tax liabilities |
(13,300 | ) | (10,743 | ) | ||||
| Valuation allowance |
(18,392 | ) | (15,896 | ) | ||||
| Net deferred tax assets |
$ | 45,762 | $ | 53,313 | ||||
The recognition of deferred tax assets is based on management’s belief that it is more likely than not that the tax benefits associated with temporary differences, net operating loss carryforwards and tax credits will be utilized. The Company assesses the recoverability of the deferred tax assets on an ongoing basis. In making this assessment, the Company considers all positive and negative evidence, and all potential sources of taxable income including scheduled reversals of deferred tax liabilities, tax-planning strategies, projected future taxable income and recent financial performance.
The valuation allowance increased from $15.9 million at December 31, 2009 to $18.4 million at December 31, 2010. The valuation allowance at December 31, 2010 was related to U.S. capital loss carryforwards, certain foreign deferred tax assets and foreign net operating loss carryforwards. The Company intends to maintain these valuation allowances until sufficient positive evidence exists to support their reversal.
At December 31, 2010, the Company had net operating loss carryforwards of $52.9 million and $11.7 million related to its foreign and U.S. state tax filings, respectively. Depending on the tax rules of the tax jurisdictions, the losses can be carried forward indefinitely or the carryforward periods are limited, ranging from 5 years to 20 years. The Company also had foreign tax credit carryforwards of $17.5 million, expiring in 2012 through 2020. Additionally, the Company has U.S. capital loss and charitable contribution carryforwards of $1.2 million that may be carried forward 4 years.
62
Table of Contents
As of December 31, 2010, the Company had unremitted earnings held in its foreign subsidiaries of approximately $64.8 million. The Company did not recognize a deferred tax liability for U.S. income taxes and foreign withholding taxes related to the unremitted earnings of its foreign operations because the Company intends to reinvest those earnings indefinitely. Determination of the amount of unrecognized deferred tax liability related to unremitted earnings of foreign subsidiaries is not practicable. A deferred tax liability will be recognized if and when the Company is no longer able to demonstrate that it plans to permanently reinvest unremitted earnings.
As of January 1, 2010, the Company had $3.8 million of unrecognized tax benefits. As of December 31, 2010 the Company had $1.0 million of unrecognized tax benefits of which, if recognized, approximately $0.2 million, net of federal tax benefits, would be recorded as a component of income tax expense. A reconciliation of the beginning and ending balances of the total amounts of gross unrecognized tax benefits is as follows:
| December 31, | ||||||||||||
| 2010 | 2009 | 2008 | ||||||||||
| Gross unrecognized tax benefits at January 1, |
$ | 3,850 | $ | 4,090 | $ | 5,552 | ||||||
| Gross increases for tax positions of prior years |
76 | 254 | 1,006 | |||||||||
| Gross increases for tax positions of current year |
— | — | 271 | |||||||||
| Gross decreases for tax positions of prior years |
(18 | ) | (4 | ) | (1,720 | ) | ||||||
| Settlements |
(2,814 | ) | — | — | ||||||||
| Lapse of statute of limitations |
(122 | ) | (490 | ) | (1,019 | ) | ||||||
| Gross unrecognized tax benefits at December 31, |
$ | 972 | $ | 3,850 | $ | 4,090 | ||||||
In many cases the Company’s uncertain tax positions are related to tax years that remain subject to examination by the relevant taxable authorities. The following table summarizes these open tax years by major jurisdiction:
| Jurisdiction |
Open Tax Years | |
| France | 2006–2009 | |
| Hong Kong | 2004–2009 | |
| United States (1) | 2003–2009 |
| (1) | Includes federal as well as state and local jurisdictions, as applicable. |
The Company is currently under audit by several U.S. state and foreign jurisdictions. It is likely that the examination phase of several of these audits will conclude in the next 12 months. Additionally, there are several statutes of limitation expected to close within the next 12 months. No significant increases or decreases in unrecognized tax benefits are expected to occur by December 31, 2011.
Estimated interest and penalties related to the underpayment of income taxes are classified as a component of the provision for income taxes in the Consolidated Statements of Operations. Accrued interest and penalties are $0.4 million as of December 31, 2010.
21. Segment Information
The Company operates its executive search and leadership consulting services in three geographic regions: the Americas; Europe, which includes the Middle East and Africa; and Asia Pacific.
For segment purposes, reimbursements of out-of-pocket expenses classified as revenue and restructuring and impairment charges are reported separately and, therefore, are not included in the results of each geographic region. The Company believes that analyzing trends in revenue before reimbursements (net revenue), analyzing
63
Table of Contents
operating expenses as a percentage of net revenue, and analyzing operating income (loss) excluding restructuring and impairment charges and other operating income, more appropriately reflects its core operations. By segment the restructuring charges recorded in 2010 were $1.0 million in the Americas, $0.3 million in the European region, and $0.3 million in Global Operations Support. The other operating income of $1.1 million in 2010 was recorded in the European region. By segment, the restructuring and impairment charges recorded in 2009 were $13.3 million in the Americas, $9.5 million in Europe, $2.4 million in Asia Pacific and $1.5 million in Global Operations Support. The other operating income of $1.7 million in 2009 was recorded in the European region.
The revenue, operating income (loss), depreciation and amortization, and capital expenditures, by segment, are as follows:
| Year Ended December 31, | ||||||||||||
| 2010 | 2009 | 2008 | ||||||||||
| Revenue: |
||||||||||||
| Americas |
$ | 255,690 | $ | 201,530 | $ | 314,412 | ||||||
| Europe |
127,267 | 119,441 | 201,462 | |||||||||
| Asia Pacific |
110,134 | 74,680 | 100,030 | |||||||||
| Revenue before reimbursements (net revenue) |
493,091 | 395,651 | 615,904 | |||||||||
| Reimbursements |
20,145 | 19,067 | 28,956 | |||||||||
| Total |
$ | 513,236 | $ | 414,718 | $ | 644,860 | ||||||
| Operating income (loss): |
||||||||||||
| Americas |
$ | 40,307 | $ | 18,509 | $ | 45,783 | ||||||
| Europe |
(604 | ) | 2,741 | 24,479 | ||||||||
| Asia Pacific |
24,517 | 9,457 | 15,351 | |||||||||
| Total regions |
64,220 | 30,707 | 85,613 | |||||||||
| Global Operations Support |
(46,147 | ) | (32,359 | ) | (30,076 | ) | ||||||
| Operating income (loss) before restructuring and impairment charges and other operating income |
18,073 | (1,652 | ) | 55,537 | ||||||||
| Restructuring and impairment charges |
(1,621 | ) | (26,720 | ) | — | |||||||
| Other operating income |
1,072 | 1,661 | — | |||||||||
| Total |
$ | 17,524 | $ | (26,711 | ) | $ | 55,537 | |||||
| Depreciation and amortization: |
||||||||||||
| Americas |
$ | 4,746 | $ | 5,086 | $ | 5,091 | ||||||
| Europe |
4,218 | 2,956 | 2,611 | |||||||||
| Asia Pacific |
2,016 | 2,398 | 2,202 | |||||||||
| Total regions |
10,980 | 10,440 | 9,904 | |||||||||
| Global Operations Support |
604 | 825 | 640 | |||||||||
| Total |
$ | 11,584 | $ | 11,265 | $ | 10,544 | ||||||
| Capital expenditures: |
||||||||||||
| Americas |
$ | 5,600 | $ | 9,013 | $ | 7,643 | ||||||
| Europe |
9,917 | 1,792 | 2,636 | |||||||||
| Asia Pacific |
1,862 | 988 | 2,545 | |||||||||
| Total regions |
17,379 | 11,793 | 12,824 | |||||||||
| Global Operations Support |
185 | 481 | 578 | |||||||||
| Total |
$ | 17,564 | $ | 12,274 | $ | 13,402 | ||||||
64
Table of Contents
Identifiable assets, and goodwill and other intangible assets, net, by segment, are as follows:
| December 31, | ||||||||
| 2010 | 2009 | |||||||
| Identifiable assets: |
||||||||
| Americas |
$ | 279,096 | $ | 249,101 | ||||
| Europe |
142,145 | 128,086 | ||||||
| Asia Pacific |
120,011 | 77,583 | ||||||
| Total regions |
541,252 | 454,770 | ||||||
| Global Operations Support |
3,775 | 20,077 | ||||||
| Total |
$ | 545,027 | $ | 474,847 | ||||
| Goodwill and other intangible assets, net: |
||||||||
| Americas |
$ | 82,353 | $ | 83,373 | ||||
| Europe |
25,657 | 27,792 | ||||||
| Asia Pacific |
8,358 | 6,481 | ||||||
| Total |
$ | 116,368 | $ | 117,646 | ||||
22. Guarantees
The Company had provided a bank guarantee to a European country’s tax authority in the amount of the tax authority’s audit assessment plus post-assessment interest as required by law. In the second quarter of 2010, the bank guarantee was cancelled resulting in the release of the associated restricted cash balance on the Consolidated Balance Sheet. See Note 5, Restricted Cash.
The Company has issued guarantees supporting the payment of office lease obligations of certain of its subsidiaries in Europe and Asia Pacific. The guarantees were made to secure the respective lease agreements and are for the term of the lease agreements, which extend through 2019. For each guarantee issued, should the subsidiary default on a lease payment, the Company would have to perform under the guarantee. The maximum amount of undiscounted payments the Company would be required to make in the event of default on all outstanding guarantees is approximately $2.0 million as of December 31, 2010. The Company has not accrued for these guarantee arrangements as no event of default exists.
23. Commitments and Contingencies
Operating Leases
The Company leases office space in various buildings for its own use. The terms of these office-related leases provide that the Company pay base rent and a share of operating expenses and real estate taxes in excess of defined amounts. These leases expire at various dates through 2024. The Company also leases certain computer equipment and cars, the terms of which are accounted for as operating leases. Rent expense, which includes the base rent, operating expenses and real estate taxes, and the costs of equipment leases for the years ended December 31, 2010, 2009 and 2008 was $35.5 million, $39.2 million, and $40.6 million, respectively.
65
Table of Contents
Minimum future office space and equipment lease payments due in each of the next five years and thereafter are as follows:
| Office Leases |
Equipment Leases |
Total | ||||||||||
| Year ending December 31, |
||||||||||||
| 2011 |
$ | 30,477 | $ 871 | $ | 31,348 | |||||||
| 2012 |
28,977 | 394 | 29,371 | |||||||||
| 2013 |
24,437 | 113 | 24,550 | |||||||||
| 2014 |
19,126 | 43 | 19,169 | |||||||||
| 2015 |
16,993 | 12 | 17,005 | |||||||||
| Thereafter |
93,290 | — | 93,290 | |||||||||
| Total |
$ | 213,300 | $1,433 | $ | 214,733 | |||||||
The aggregate minimum future payments on office leases are $213.3 million. The Company has contractual arrangements to receive aggregate sublease income of $6.3 million related to certain leases that expire at various dates through 2016. This sublease income relates to properties that were part of prior office consolidations and closings.
Certain leases provide for renewal options and payments of real estate taxes and other occupancy costs. In addition, certain leases contain rent escalation clauses that require additional rental amounts in later years of the term. Rent expense for leases with rent escalation clauses is recognized on a straight-line basis over the minimum lease term.
Litigation
The Company has contingent liabilities from various pending claims and litigation matters arising in the ordinary course of the Company’s business, some of which involve claims for damages that are substantial in amount. Some of these matters are covered by insurance. Although the Company’s ultimate liability in the matters discussed below cannot be determined, based upon information currently available, the Company believes the ultimate resolution of such claims and litigation will not have a material adverse effect on its financial condition, results of operations or liquidity.
European Tax Audit
During the fourth quarter of 2005, a European country commenced a tax audit for the years 2001 through 2004, including an examination of the Company’s arrangement with professional service companies that provide consulting services to the Company. In November 2006, the examining tax authority issued an assessment in the amount of €4.3 million, consisting of unpaid withholding tax, plus unpaid Value Added Tax (“VAT”). The Company appealed this assessment, however in accordance with local law, the Company was required to provide a bank guarantee to the tax authority. In September 2009, the Company received a definitive and final ruling that its appeal with respect to the withholding tax portion of the assessment had been decided in its favor, thereby canceling that assessment. The Company recovered approximately €4.1 million of the original bank guarantee. In May 2010, the Company received a definitive and final ruling that its appeal with respect to the VAT portion of the assessment had been decided in its favor, thereby canceling that assessment and the remaining guarantee balance was released to the Company. See Note 5, Restricted Cash and Note 22, Guarantees.
UK Employee Benefits Trust
On January 27, 2010, HM Revenue & Customs (“HMRC”) in the United Kingdom notified the Company that it was challenging the tax treatment of certain of the Company’s contributions in the United Kingdom to an
66
Table of Contents
Employee Benefits Trust between 2002 and 2008. HMRC alleges that these contributions should have been subject to Pay As You Earn tax and Class 1 National Insurance Contributions in the United Kingdom; and HMRC is proposing an adjustment to the Company’s payroll tax liability for the affected years. The aggregate amount of HMRC’s proposed adjustment is approximately £3.9 million (equivalent to $6.1 million at December 31, 2010). The Company has appealed the proposed adjustment. At this time, the Company believes that the likelihood of an unfavorable outcome with respect to the proposed adjustment is not probable and the potential amount of any loss cannot be reasonably estimated. The Company also believes that the amount of any final adjustment would not be material to the Company’s financial condition.
Employee Litigation
In March 2010, a court of appeals in Europe reversed a 2008 lower court ruling and entered judgment in favor of a former employee. The former employee was separated from the Company in 2006 and subsequently commenced litigation, which resulted in 2008’s ruling in the Company’s favor. As a result of the 2010 reversal, the Company recorded a charge of $1.0 million reflecting the cost of the award, net of insurance coverage for which the Company has received commitments at this time. This amount is a component of other charges on the Consolidated Statement of Operations for the year ended December 31, 2010. The Company has appealed the reversal and is evaluating the availability of additional insurance coverage.
24. Subsequent Events
On March 2, 2011, the Company announced that its Executive Vice President and Chief Financial Officer Scott J. Krenz will retire from the Company subsequent to the completion of the first quarter ending March 31, 2011 and filing of the Company’s annual report on Form 10-K. The formal search for a new Chief Financial Officer is underway.
67
Table of Contents
PART II (continued)
ITEM 9. CHANGES IN AND DISAGREEMENTS WITH ACCOUNTANTS ON ACCOUNTING AND FINANCIAL DISCLOSURE
Not applicable.
ITEM 9A. CONTROLS AND PROCEDURES
(a) Evaluation of Disclosure Controls and Procedures
The Company maintains disclosure controls and procedures (as defined in the Securities Exchange Act of 1934, as amended, (the Exchange Act) Rule 13a-15(e) and 15d-15(e)) that are designed to ensure that information required to be disclosed in the Company’s reports filed or submitted under the Exchange Act is recorded, processed, summarized and reported within the time frames specified in the SEC’s rules and regulations, and that such information is accumulated and communicated to the Company’s management, including its principal executive officer and principal financial officer, as appropriate, to allow timely decisions regarding required disclosure. Any system of controls and procedures, no matter how well designed and operated, can provide only reasonable assurance of achieving the desired control objectives.
Management of the Company, with the participation of the principal executive officer and the principal financial officer, evaluated the effectiveness of the design and operation of the Company’s disclosure controls and procedures as of December 31, 2010. Based on the material weakness discussed below, the principal executive officer and principal financial officer have concluded that the Company’s disclosure controls and procedures were not effective as of December 31, 2010.
(b) Management’s Report on Internal Control over Financial Reporting
Management is responsible for establishing and maintaining adequate internal control over financial reporting, as defined in Exchange Act Rule 13a-15(f) and 15d-15(f). The Company’s internal control over financial reporting is a process designed by, or under the supervision of, the company’s principal executive and principal financial officers, or persons performing similar functions, and effected by the company’s board of directors, management, and other personnel, to provide reasonable assurance regarding the reliability of financial reporting and the preparation of financial statements for external purposes in accordance with U.S. generally accepted accounting principles (U.S. GAAP) and includes those policies and procedures that:
| (1) | Pertain to the maintenance of records that, in reasonable detail, accurately and fairly reflect the transactions and dispositions of the assets of the company; |
| (2) | Provide reasonable assurance that transactions are recorded as necessary to permit preparation of financial statements in accordance with U.S. GAAP, and that receipts and expenditures of the company are being made only in accordance with authorizations of management and directors of the company; and |
| (3) | Provide reasonable assurance regarding prevention or timely detection of unauthorized acquisition, use, or disposition of the company’s assets that could have a material effect on the financial statements. |
Internal control over financial reporting has inherent limitations. Internal control over financial reporting is a process that involves human diligence and compliance and is subject to lapses in judgment and breakdowns resulting from human failures. Internal control over financial reporting also can be circumvented by collusion or improper management override. Because of such limitations, there is a risk that material misstatements will not be prevented or detected on a timely basis by internal control over financial reporting. Management assessed the effectiveness of the Company’s internal control over financial reporting as of December 31, 2010. In making this assessment, management used the control criteria framework of the Committee of Sponsoring Organizations of
68
Table of Contents
the Treadway Commission (COSO) published in its report entitled Internal Control – Integrated Framework. As a result of this assessment, management identified a material weakness in internal control over financial reporting related to controls over the accounting for compensation arrangements between the Company and certain of its employees. Specifically, the Company did not maintain appropriate controls over the complete and timely distribution of compensation related agreements to accounting personnel. Additionally, the Company did not maintain sufficient review controls over recording the financial statement impact of changes made to underlying data and assumptions within compensation arrangements.
This material weakness resulted in immaterial misstatements in the Company’s consolidated financial statements related to both the current and prior periods. Additionally, there is a reasonable possibility that a material misstatement of the Company’s annual or interim consolidated financial statements would not be prevented or detected on a timely basis. Based on this material weakness, management concluded that the Company’s internal control over financial reporting was not effective as of December 31, 2010.
KPMG LLP, an independent registered public accounting firm, has issued an auditors’ report on the effectiveness of the Company’s internal control over financial reporting as of December 31, 2010.
(c) Changes in Internal Control over Financial Reporting
Except as described below, there have been no changes in our internal control over financial reporting that occurred during the quarter ended December 31, 2010 that have materially affected or are reasonably likely to materially affect our internal control over financial reporting.
During the fourth quarter of 2010, the Company completed the outsourcing of certain of its Information Technology (IT) functions. In connection with the outsourcing arrangement, execution of certain IT controls, procedures, and processes were transitioned from Company employees to a third party contractor who now executes those on behalf of the Company. In addition, certain IT hardware owned by the Company was relocated to the third party contractor’s facilities.
In connection with the outsourcing of certain IT functions, the Company performed significant pre-implementation planning, design and testing. The Company has also conducted post-implementation monitoring and testing to ensure the effectiveness of internal control over financial reporting. The Company will continue to monitor and test its new controls, procedures, and processes to ensure the effectiveness of internal control over financial reporting.
In response to the material weakness noted above, management’s plan to remediate include the following measures:
| • | Evaluating and enhancing controls to develop a more formal process for granting, updating and disseminating compensation arrangements to facilitate the complete and timely review by accounting personnel. |
| • | Continuing to improve the review processes and procedures over the compensation process and period end compensation liability. Such procedures will include additional levels of oversight and implementing controls around the validation of information utilized in the calculations. |
The implementation of these additional controls and procedures is expected to be completed by the third quarter of 2011. The Company will not be able to conclude that the material weakness has been successfully remediated and cannot make assurances that it will be able to reach such conclusion, until the testing of controls demonstrates that the controls have operated effectively for a sufficient period of time.
None.
69
Table of Contents
PART III
ITEM 10. DIRECTORS, EXECUTIVE OFFICERS AND CORPORATE GOVERNANCE
The information required by this Item will be included under the captions “Election of Class III Directors,” “Committees of the Board of Directors,” “Nominees for Directors,” “Code of Ethics” and “Section 16(a) Beneficial Ownership Reporting Compliance” in our 2011 Proxy Statement and is incorporated herein by reference. See also “Executive Officers” included in Part I of this report.
ITEM 11. EXECUTIVE COMPENSATION
The information required by this Item will be included under the captions “Executive Compensation” and “Director Compensation” in our 2011 Proxy Statement and is incorporated herein by reference.
ITEM 12. SECURITY OWNERSHIP OF CERTAIN BENEFICIAL OWNERS AND MANAGEMENT AND RELATED STOCKHOLDER MATTERS
The information required by this Item will be included under the caption “Voting Securities of Certain Beneficial Owners and Management” in our 2011 Proxy Statement and is incorporated herein by reference.
Equity Compensation Plan Information
The following table sets forth additional information as of December 31, 2010, about shares of our common stock that may be issued upon the vesting of restricted stock units and performance stock units and the exercise of options under our existing equity compensation plans and arrangements, divided between plans approved by our stockholders and plans or arrangements not submitted to the stockholders for approval. For a description of the types of securities that may be issued under our 2007 Heidrick & Struggles GlobalShare Program, see Note 15, Stock-Based Compensation.
| (a) | (b) | (c) | ||||||||||
| Plan Category |
Number of securities to be issued upon exercise of outstanding options, warrants and rights |
Weighted-average exercise price of outstanding options, warrants and rights |
Number of securities remaining available for future issuance under equity compensation plans (excluding securities reflected in column (a)) |
|||||||||
| Equity compensation plans approved by stockholders |
337,322 | $35.77 | 784,579 | |||||||||
| Equity compensation plans not approved stockholders |
— | — | — | |||||||||
| Total equity compensation plans |
337,322 | $35.77 | 784,579 | |||||||||
| ITEM 13. | CERTAIN RELATIONSHIPS AND RELATED TRANSACTIONS, AND DIRECTOR INDEPENDENCE |
The information required by this Item will be included under the captions “Certain Relationships and Related Transactions” and “Corporate Governance” in our 2011 Proxy Statement and is incorporated herein by reference.
| ITEM 14. | PRINCIPAL ACCOUNTANT FEES AND SERVICES |
The information required by this Item will be included under the caption “Principal Accountant Fees and Services” in our 2011 Proxy Statement and is incorporated herein by reference.
70
Table of Contents
PART IV
ITEM 15. EXHIBITS AND FINANCIAL STATEMENT SCHEDULES
(a) THE FOLLOWING DOCUMENTS ARE FILED AS PART OF THIS REPORT:
1. Index to Consolidated Financial Statements:
See Consolidated Financial Statements included as part of this Form 10-K beginning on page 32.
2. Exhibits:
| Exhibit No. |
Description | |||
| 3.01 | Amended and Restated Certificate of Incorporation of the Registrant (Incorporated by reference to Exhibit 3.02 of this Registrant’s Registration Statement on Form S-4 (File No. 333-61023)) | |||
| 3.02 | Amended and Restated By-laws of the Registrant (Incorporated by reference to Exhibit 3.02 of the Registrant’s Form 10-K filed March 26, 2003) | |||
| 4.01 | Specimen Stock Certificate (Incorporated by reference to Exhibit 4.01 of this Registrant’s Registration Statement on Form S-4 (File No. 333-61023)) | |||
| 10.01 | Credit Agreement among Heidrick & Struggles International, Inc., the Lenders party thereto and JPMorgan Chase Bank, as Administrative Agent dated October 26, 2006 (Incorporated by reference to Exhibit 10.03 of the Registrant’s Form 10-K filed March 15, 2007) | |||
| 10.02 | Amendment No. 1 to the Credit Agreement among Heidrick & Struggles International, Inc., the Lenders party thereto and JPMorgan Chase Bank, as Administrative Agent, dated as of February 25, 2008 (Incorporated by reference to Exhibit 10.02 of the Registrant’s Form 10-K filed on February 28, 2008) | |||
| 10.03 | Amendment No. 2 to the Credit Agreement among Heidrick & Struggles International, Inc., the Lenders party thereto and JPMorgan Chase Bank, as Administrative Agent, dated as of April 27, 2009 (Incorporated by reference to Exhibit 10.01 of the Registrant’s Form 8-K filed on April 30, 2009) | |||
| 10.04 | Purchase Agreement, dated as of September 18, 2006, by and among Hudson Highland Group, Inc., Highland Partners Co (Canada), Highland Partners (Aust) Pty Ltd and Highland Partners Limited, and the Company, Heidrick & Struggles Canada, Inc. and Heidrick & Struggles Australia, Ltd (Incorporated by reference to Exhibit 10.01 of the Registrant’s Form 8-K Filed September 20, 2006) | |||
| 10.05 | Lease between 1114 6th Avenue Co., LLC and Heidrick & Struggles International, Inc., and Heidrick & Struggles, Inc., dated August 31, 2007 (Incorporated by reference to Exhibit 10.04 of the Registrant’s From 10-K filed on February 28, 2008) | |||
| 10.06 | Employment Agreement of L. Kevin Kelly (Incorporated by reference to Exhibit 1.01 of the Registrant’s Form 10-Q filed on April 3, 2007) | |||
| 10.07 | First Amendment to Employment Agreement of L. Kevin Kelly (Incorporated by reference to Exhibit 10.04 of the Registrant’s Form 8-K filed on January 15, 2009) | |||
| 10.08 | Employment Agreement of K. Steven Blake (Incorporated by reference to Exhibit 10.07 of the Registrant’s Form 10-K filed on February 28, 2008) | |||
| 10.09 | Employment Agreement of Charles G. Davis (Incorporated by reference to Exhibit 10.01 of the Registrant’s Form 8-K filed on January 15, 2009) | |||
| 10.10 | Employment Agreement of Richard Caldera (Incorporated by reference to Exhibit 10.1 of the Registrant’s Form 8-K filed on May 6, 2008) | |||
71
Table of Contents
| Exhibit No. |
Description | |||
| 10.11 | Employment Agreement of Scott Krenz (Incorporated by reference to Exhibit 10.1 of the Registrant’s Form 8-K filed on June 12, 2008) | |||
| 10.12 | Employment Agreement of S. John Kim (Incorporated by reference to Exhibit 10.1 of the Registrant’s Form 8-K filed December 20, 2010) | |||
| *10.13 | Employment Agreement of Stephen Beard | |||
| 10.14 | Transition and Separation Agreement and General Release between K. Steven Blake and Heidrick & Struggles International, Inc. (Incorporated by reference to Exhibit 99.01 of the Registrant’s Form 8-K filed on September 2, 2010) | |||
| *10.15 | Heidrick & Struggles International, Inc. Management Severance Pay Plan and Summary Plan Description as Amended and Restated Effective December 31, 2010 | |||
| 10.16 | 2007 Heidrick & Struggles GlobalShare Plan (Incorporated by reference to Exhibit 10.01 of the Registrant’s Form 8-K filed on June 8, 2007) | |||
| 10.17 | The Heidrick & Struggles Incentive Plan, as Amended and Restated Effective January 1, 2008 (Incorporated by reference to Exhibit 10.20 of the Registrant’s From 10-K filed on February 27, 2009) | |||
| 10.18 | Form of Heidrick & Struggles Non-Qualified Stock Option Agreement (Incorporated by reference to Exhibit 10.03 of the Registrant’s Form 8-K filed on June 8, 2007) | |||
| 10.19 | Form of Heidrick & Struggles Restricted Stock Unit Participation Agreement (Incorporated by reference to Exhibit 10.04 of the Registrant’s Form 8-K filed on June 8, 2007) | |||
| 10.20 | Heidrick & Struggles International, Inc. U.S. Employees Deferred Compensation Plan (Incorporated by reference to Exhibit 10.10 of the Registrant’s Form 10-K filed on March 10, 2006) | |||
| 10.21 | The Heidrick & Struggles International, Inc. Deferred Compensation Plan (Incorporated by reference to Exhibit 4.1 of this Registrant’s Registration Statement on Form S-8 (File No. 333-82424)) | |||
| 10.22 | The First Amendment to The Heidrick & Struggles International, Inc. U.S. Employees Deferred Compensation Plan (Incorporated by reference to Exhibit 10.25 of the Registrant’s Form 10-K filed on February 27, 2009) | |||
| *21.01 | Subsidiaries of the Registrant | |||
| *23.01 | Consent of Independent Registered Public Accounting Firm | |||
| *31.1 | Certification of the Company’s Chief Executive Officer pursuant to Section 302 of the Sarbanes-Oxley Act of 2002 | |||
| *31.2 | Certification of the Company’s Chief Financial Officer pursuant to Section 302 of the Sarbanes-Oxley Act of 2002 | |||
| *32.1 | Certification of the Company’s Chief Executive Officer pursuant to 18 U.S.C. Section 1350, as adopted pursuant to Section 906 of the Sarbanes-Oxley Act of 2002 | |||
| *32.2 | Certification of the Company’s Chief Financial Officer pursuant to 18 U.S.C. Section 1350, as adopted pursuant to Section 906 of the Sarbanes-Oxley Act of 2002 | |||
| * | Filed herewith. |
| (b) | SEE EXHIBIT INDEX ABOVE |
| (c) | FINANCIAL STATEMENTS NOT PART OF ANNUAL REPORT |
None.
72
Table of Contents
Pursuant to the requirements of Section 13 or 15(d) of the Securities Exchange Act of 1934, as amended, the registrant has duly caused this report to be signed on its behalf by the undersigned, thereunto duly authorized on March 16, 2011.
| HEIDRICK & STRUGGLES INTERNATIONAL, INC. | ||
| By |
/s/ SCOTT J. KRENZ | |
| Title |
Executive Vice President & Chief Financial Officer | |
Pursuant to the requirements of the Securities Exchange Act of 1934, this report has been signed below by the following persons on behalf of the registrant and in the capacities indicated on March 16, 2011.
| Signature |
Title | |
| /s/ L. KEVIN KELLY L. Kevin Kelly (principal executive officer) |
Chief Executive Officer | |
| /s/ SCOTT J. KRENZ Scott J. Krenz (principal financial officer) |
Executive Vice President & | |
| /s/ MATTHEW W. HALLGREN (principal accounting officer) |
Chief Accounting Officer | |
| /s/ RICHARD I. BEATTIE Richard I. Beattie |
Director | |
| /s/ JOHN A. FAZIO John A. Fazio |
Director | |
| /s/ JILL KANIN-LOVERS Jill Kanin-Lovers |
Director | |
| /s/ GARY E. KNELL Gary E. Knell |
Director | |
| /s/ ROBERT E. KNOWLING, JR. Robert E. Knowling, Jr. |
Director | |
| /s/ JANE D. HARTLEY Jane D. Hartley |
Director | |
| /s/ V. PAUL UNRUH V. Paul Unruh |
Director | |
73