Attached files
Table of Contents
UNITED STATES
SECURITIES AND EXCHANGE COMMISSION
Washington, D.C. 20549
FORM 10-K
| x | ANNUAL REPORT PURSUANT TO SECTION 13 OR 15(d) OF THE SECURITIES |
EXCHANGE ACT OF 1934
For the fiscal year ended December 31, 2010
| ¨ | TRANSITION REPORT PURSUANT TO SECTION 13 OR 15(d) OF THE SECURITIES |
EXCHANGE ACT OF 1934
For the transition period from to
Commission File Number 0-28240
EXACTECH, INC.
(Exact name of registrant as specified in its charter)
| FLORIDA | 59-2603930 | |
| (State or other jurisdiction of incorporation or organization) | (I.R.S. Employer Identification No.) |
2320 NW 66TH COURT, GAINESVILLE, FL, 32653
(Address of principal executive offices)
(352) 377-1140
(Registrant’s telephone number, including area code)
Securities registered pursuant to Section 12(b) of the Act:
| (Title of each class) | (Name of each exchange on which registered) | |
| Common Stock, $0.01 par value per share Common Stock Purchase Rights |
NASDAQ Global Select Market |
Securities registered pursuant to Section 12(g) of the Act:
None.
Indicate by check mark if the registrant is a well-known seasoned issuer, as defined in Rule 405 of the Act. Yes ¨ No x
Indicate by check mark if the registrant is not required to file reports pursuant to Section 13 or Section 15(d) of the Act. Yes ¨ No x
Indicate by check mark whether the registrant (1) has filed all reports required to be filed by Section 13 or 15(d) of the Securities Exchange Act of 1934 during the preceding 12 months (or for such shorter period that the registrant was required to file such reports), and (2) has been subject to such filing requirements for the past 90 days. Yes x No ¨
Indicate by check mark if disclosure of delinquent filers pursuant to Item 405 of Regulation S-K is not contained herein, and will not be contained, to the best of registrant’s knowledge, in definitive proxy or information statements incorporated by reference in Part III of this Form 10-K or any amendment to this Form 10-K. x
Indicate by check mark whether the registrant has submitted electronically and posted on its corporate website, if any, every Interactive Data File required to be submitted and posted pursuant to Rule 405 of Regulation S-T (§232.405 of this chapter) during the preceding 12 months (or for such shorter period that the registrant was required to submit and post such files). Yes ¨ No ¨
Indicate by check mark whether the registrant is a large accelerated filer, an accelerated filer, a non-accelerated filer or a smaller reporting company. See definition of “accelerated filer and large accelerated filer” in Rule 12b-2 of the Act.
Large Accelerated Filer ¨ Accelerated Filer x Non-Accelerated Filer ¨ Smaller Reporting Company ¨
Indicate by check mark whether the registrant is a shell company (as defined in Rule 12b-2 of the Act). Yes ¨ No x
As of March 11, 2011, the number of shares of the registrant’s Common Stock outstanding was 13,049,535. The aggregate market value of our Common Stock held by non-affiliates as of June 30, 2010 was approximately $142,903,000 based on a closing sale price of $17.08 for Common Stock as reported on the NASDAQ Global Market on such date. For purposes of the foregoing computation, all of our executive officers, directors and five percent beneficial owners are deemed to be affiliates. Such determination should not be deemed to be an admission that such executive officers, directors or five percent beneficial owners are, in fact, our affiliates.
DOCUMENTS INCORPORATED BY REFERENCE
The information required by Part III (Items 10, 11, 12, 13, and 14) is incorporated by reference to the registrant’s definitive proxy statement for its 2011 Annual Meeting of Shareholders (to be filed pursuant to Regulation 14A).
Table of Contents
and
CROSS REFERENCE SHEET
1
Table of Contents
CAUTIONARY NOTE REGARDING FORWARD LOOKING STATEMENTS
We are making this statement pursuant to the safe harbor provisions for forward-looking statements described in the Private Securities Litigation Reform Act of 1995. These forward-looking statements are not historical facts but are the intent, belief, or current expectations of our business and industry. We make statements in this report, including statements that are incorporated by reference, that are forward-looking. When used in this report or in any other presentation, statements which are not historical in nature, including the words “anticipate,” “estimate,” “could,” “should,” “may,” “plan,” “seek,” “expect,” “believe,” “intend,” “target,” “project” and similar expressions are intended to identify forward-looking statements. They also include statements regarding:
| • | our future growth and profitability; |
| • | our competitive strengths; and |
| • | our business strategy and the trends we anticipate in the industries and economies in which we operate. |
These forward-looking statements are based on our current expectations and are subject to a number of risks, uncertainties and assumptions. These statements are not guarantees of future performance and are subject to risks, uncertainties, and other factors, some of which are beyond our control, are difficult to predict, and could cause actual results to differ materially from those expressed or forecasted in the forward-looking statements. Important factors that could cause actual results to differ materially from those in forward-looking statements include:
| • | economic downturns, reduced capital expenditures, consolidation and technological and regulatory changes in the industries we serve; |
| • | the highly competitive nature of our industry; |
| • | our ability to attract and retain qualified managers and skilled employees; |
| • | the outcome of our plans for future operations and growth; and |
| • | the other factors referenced in this report, including, without limitation, under “Risk Factors.” |
We believe these forward-looking statements are reasonable; however, you should not place undue reliance on any forward-looking statements, which are based on current expectations. Furthermore, forward-looking statements speak only as of the date they are made. If any of these risks or uncertainties materialize, or if any of our underlying assumptions are incorrect, our actual results may differ significantly from the results that we express in or imply by any of our forward-looking statements. These and other risks are detailed in this report, in the documents that we incorporate by reference into this report and in other documents that we file with the Securities and Exchange Commission. We do not undertake any obligation to publicly update or revise these forward-looking statements after the date of this report to reflect future events or circumstances; except to the extent required by applicable law. We qualify any and all of our forward-looking statements by these cautionary factors. Except where the context otherwise requires, the terms "the Company", "Exactech", “we”, “our”, or “us” refer to the business of Exactech, Inc. and its consolidated subsidiaries.
2
Table of Contents
We develop, manufacture, market, distribute and sell orthopaedic implant devices, related surgical instrumentation and biologic services to hospitals and physicians in the United States and internationally. Exactech was founded by an orthopaedic surgeon in November 1985, and is incorporated under the laws of the State of Florida. Our revenues are principally derived from sales and distribution of our joint replacement systems, including knee, hip, spine, and extremity implant systems, and distribution of biologic products and services and bone cement materials used in orthopaedic surgery and dental procedures.
We manufacture some components of our knee, extremity, and hip joint replacement systems at our facility in Gainesville, Florida, utilizing modern, highly automated computer aided manufacturing equipment. Our cellular based manufacturing processes, which are organized in groups, or cells, are dedicated to specific product lines to minimize change-over and increase efficiency, and are designed to help us reduce our production cycle times while permitting flexibility to adjust quickly to changes in demand. To supplement our manufacturing of components, we have formed strategic alliances with suppliers and business partners to externally manufacture some components. Additionally, we acquire and distribute other products and services through exclusive agreements, such as our agreement with Tecres® S.p.A, or Tecres, and non-exclusive agreements, such as with RTI Biologics, Inc., or RTI, and Biomatlante SARL, or Biomatlante.
Orthopaedic Products Industry
According to a research report published in 2010 by Orthoworld, Inc., the worldwide market for orthopaedic products in 2009 was estimated to be nearly $37.8 billion, which represented an increase of 6% from the previous year. According to this study, the three primary market segments in which we offer our products and services, reconstructive devices, orthobiologics and other products (which includes instrumentation and other orthopaedic products), were estimated to be $13.3 billion, $3.9 billion and $4.9 billion, respectively, during 2009. This study also estimates that the spinal implant/instrumentation market was $7.1 billion during 2009. According to this report, the segment of the population over the age of 45 is growing 3% annually, a rate faster than the 1% for the overall population. Further, the report highlights the fact that more than 90% of all joint replacement procedures were performed on patients over the age of 45. The report suggests that demographics alone will drive growth in the global orthopaedic marketplace. Management continues to share the belief that the industry will continue to grow due to an aging population in much of the world. Increasing life spans and lifestyles impact the number of individuals with joints subject to failure, thereby increasing demand for joint replacement procedures.
Products
Our joint replacement products are used by orthopaedic surgeons to repair or replace joints that have deteriorated as a result of injury or disease. Reconstructive joint surgery involves modification of the area surrounding the affected joint and insertion of a set of manufactured implant components to replace or augment the joint. During the surgery, the surgeon removes damaged cartilage and a portion of the bones that comprise the joint, prepares the remaining bone surfaces and surrounding tissue and then installs the implant. When necessary, the surgeon uses biologic allograft services, like those services we distribute, to repair bone defects and provide an environment to stimulate new bone growth. In many joint replacement procedures, acrylic bone cement is used to affix implant components to the prepared bone surfaces.
Spinal implants are used as an adjunct to the fusion of vertebrae in the treatment of spinal disease and deformity. Indications for spinal surgery are genetic reasons, trauma, or degeneration. Spinal surgery is performed to remove bone and/or other tissue from the spinal column to restore stability and alleviate pain. Metal rods, screws and plates are used to stabilize two or more vertebrae in order to promote fusion of a portion of the spinal column, thereby eliminating irregular motion that can cause pain and damage tissue. Biologic allograft services can be one of the treatments used in conjunction with the other implants to enhance the potential for a successful result.
3
Table of Contents
The following table includes the net revenue and percentage of net revenue for each of our product lines for the years ended December 31, 2010, 2009 and 2008. Other financial information relating to our reportable segments is included in Note 14 of our Consolidated Financial Statements, in Part II Item 8. – Financial Statements and Supplementary Data of this Annual Report on Form 10-K.
|
|
Sales by Product Line (dollars in thousands) |
|
||||||||||||||||||||||
| Year Ended | ||||||||||||||||||||||||
| December 31, 2010 | December 31, 2009 | December 31, 2008 | ||||||||||||||||||||||
| Knee Implants |
$ | 76,509 | 40.1% | $ | 75,833 | 42.8% | $ | 72,629 | 44.9% | |||||||||||||||
| Hip Implants |
28,710 | 15.1 | 26,826 | 15.1 | 22,777 | 14.1 | ||||||||||||||||||
| Biologics & Spine |
27,987 | 14.7 | 27,440 | 15.5 | 26,453 | 16.4 | ||||||||||||||||||
| Extremities |
30,033 | 15.8 | 22,829 | 12.9 | 16,844 | 10.4 | ||||||||||||||||||
| Other Products |
27,244 | 14.3 | 24,382 | 13.7 | 23,027 | 14.2 | ||||||||||||||||||
| Total |
$ | 190,483 | 100.0% | $ | 177,310 | 100.0% | $ | 161,730 | 100.0% | |||||||||||||||
Knee Implants. We believe that our Optetrak® knee system represents a major advancement in knee implant design. The Optetrak comprehensive knee system addresses orthopaedic surgeons’ concerns for contact stress, patellar tracking, polyethylene wear, joint stability and bone preservation. The Optetrak’s streamlined instrumentation allows the surgeon to work quickly and efficiently. This system provides symmetrical (same for right and left) implants for primary cruciate ligament sparing, posterior stabilized and a constrained condylar design usually intended for revision surgery.
We also offer a complimentary asymmetrical femoral component product line extension to the Optetrak knee system. This line extension includes a cruciate ligament sparing, posterior stabilized and a high flexion component, which allows for a larger range of motion. These asymmetrical line extensions provide for differentiated right and left femoral components to meet surgeon preferences. The Optetrak system also offers a unicondylar knee system, featuring our low profile instrumentation and a rotating bearing knee system for international markets. In 2007, we commenced full market introduction of the Optetrak Uni complete with enhanced instrumentation along with updated versions of the Optetrak Low Profile InstrumentationTM and ligament balancing instrument systems. In 2008, we introduced a cruciate retaining tibial insert, the Optetrak CR Slope™ and its PCL Referencing System, that helps the surgeon manage the cruciate ligament tension during surgery. During 2010, we continued release of our PS Logic™ knee system which is the next evolution step for our comprehensive Optetrak knee system.
Hip Implants. Our line of hip implant and instrument products includes the AcuMatch® Integrated Hip System, which is designed to address the majority of requirements for total hip replacement, including primary, or first time hip replacement surgery, and revision, or a surgery to replace or repair a previously implanted device. The system includes the C-Series cemented femoral stem, the A-Series acetabular components for the hip socket, the P-Series press-fit femoral stem, the M-Series modular femoral stem, the L-Series femoral stem system, bipolar and unipolar partial hip replacement components, a variety of femoral heads and a cemented acetabular component. The AcuMatch cemented revision components include revision long stems and calcar replacement stems that were originally part of the AuRA® Revision Hip System.
Our AcuMatch C-Series Cemented Femoral Stem is a forged cobalt chromium stem designed to improve stability and reduce dislocation complications by improving the head/neck ratio and restoring anatomic offset for patients requiring cemented total hip arthroplasty, or joint reconstructive surgery. The AcuMatch A-Series was designed to provide a comprehensive acetabular offering with sufficient polyethylene thickness to help lower stresses in the polyethylene liner. The AcuMatch M-Series modular femoral stem offers components that are 100% interchangeable, allowing the surgeon to customize the prosthesis at the time of surgery and according to the patient’s bony structures. This versatility and the manner in which the components mate can have a positive effect on patient outcomes. The AcuMatch P-Series
4
Table of Contents
Press Fit Femoral Stem System has multiple coating options for fixation to bone and features a scientifically sound solution to stiffness mismatch and rotational instability in the bone, potential underlying causes of post-operative residual thigh pain. The AcuMatch L-Series hip system features both cemented and press fit femoral components, as well as unipolar and bipolar endoprostheses, often used for the treatment of hip fractures.
Our Novation® hip system features both press-fit tapered and splined and cemented primary femoral stems. The Novation hip system offers a comprehensive acetabular system, the Novation Crown Cup, which incorporates the use of Connexion GXL® enhanced polyethylene. In 2007 we launched our ceramic-on-ceramic hip bearing system, Novation Ceramic AHS. During 2008 we introduced the Novation Element™ hip system which is a flat wedge design system to allow Exactech to meet a large portion of the primary hip market. In addition to the stem, the Novation Element A+™ Instrumentation affords surgeons the ability to complete hip surgery using the direct anterior approach resulting in less soft tissue and muscle disruption.
Biologics and Spine. We make and distribute various products designed for the healing and regeneration of bone and soft tissue, including products which contain human allograft. We have maintained a distribution relationship with RTI since 1998 for the marketing of its Opteform® and Optefil® product lines of Demineralized Bone Matrix. We also distribute Regenaform® and Regenafil® allograft tissue implants for oral and dental applications.
We market OpteMx®, a Tri-Calcium Phosphate/Hydroxyapatite based synthetic bone graft substitute, licensed under a non-exclusive U.S. distribution agreement with Biomatlante. Additionally, we market a new platform of Demineralized Bone Matrix products, under the brand name Optecure®. These products were the first products containing human tissue to receive FDA clearance as a medical device. The product also contains a synthetic bioabsorbable polymer carrier material licensed from Genzyme Corp. In 2007, a product line extension was introduced to the Optecure brand that combines Demineralized Bone Matrix with additional allograft product within the formulation (Optecure®+CCC).
Our Accelerate® Platelet Concentration System is a means of extracting and concentrating autologous growth factors and fibrinogen from a patients’ own blood to improve the healing quality of joints and tissue following orthopaedic procedures. In 2009, we introduced the Accelerate Bone Marrow Concentrate system for concentrating mesenchymal stem cells derived from bone marrow to aid in the repair and regeneration of bone.
As a result of our acquisition of Altiva Corporation in January 2008, we added spinal fusion products to our biologics and spine product portfolio. These product lines include two Pedicle Screw fixation systems for lumbar fusion, two plating systems for anterior cervical fixation, intervertebral body fusion devices utilizing PEEK material, and an anterior plate used in thoracolumbar fusion.
The Hydralok® pedicle screw fixation system is a rod and screw system used for stabilization of the lumbar spine as an adjunct to fusion. The system incorporates a 6.0mm rod design and provides stability and flexibility to the surgeon during attachment to the vertebrae. We distribute a system of PEEK intervertebral body fusion devices from Spinal Elements, Inc., non-exclusively, and we have the right to distribute a full line of intervertebral body fusion cages including products for posterior lumbar intervertebral body fusion, transforaminal lumbar intervertebral body fusion, anterior lumbar intervertebral body fusion, and anterior cervical intervertebral body fusion. The ACP anterior cervical plating system is a product that features screw fixation with a fixed angle to the plate, for use in anterior cervical discectomy and fusion. We also have a non-exclusive distribution relationship with Rhausler, Inc. to sell the Rhausler anterior cervical plating system, which offers multiple plate options for dynamization and variable angled screws, which allows surgeons options in screw placement into the cervical vertebra. The AltesTM anterior buttress plate is utilized in thoracolumbar fusion procedures during an anterior approach to the spinal column and serves to fix bone graft in the disc space. Its unique screw fixation reduces the potential for screw backout. During August 2010 we acquired certain spinal assets from VertiFlex, Inc. including the Silverbolt percutaneous MIS instrumentation system, Mainframe pedicle screw fixation system and
5
Table of Contents
Octane peek products. This product line addition gives us the opportunity to serve customers who prefer to perform minimally invasive surgery in thoracolumbar fusion procedures. Additional product development is underway to enhance the spinal product lines listed above and to provide to our customers additional options intended to improve patient care.
Extremities. Our Equinoxe® shoulder replacement product family includes primary, fracture and reverse shoulder systems. The addition of the reverse shoulder system has fueled significant growth over the last three years. While our commercialized products continued to grow at a rapid pace in 2010, we intensified our product development efforts with the initial launch of two new products – the Equinoxe Proximal Humerus Fracture Plate and the Equinoxe Platform Fracture Stem. We continue our development on the Equinoxe Cage Glenoid and expect to initially launch in 2011, dependent upon FDA 510(k) clearance.
Other Products. The AcuDriverTM Automated Osteotome System is an air-driven impact hand piece that surgeons can use during joint implant revision procedures to effectively remove failed prostheses and bone cement. The AcuDriver accomplishes this by providing the surgeon with precise positioning without the inconvenience and inconsistency of striking the osteotome, a cement removal tool, with a mallet.
The Cemex® bone cement system features a unique self-contained delivery system that has been clinically proven in Europe for more than two decades. By integrating bone cement powder and liquid into a sealed mixing system, Cemex is designed to offer surgeons and operating room personnel simplicity, safety and reliability in bone cement, and includes Cemex Genta, a bone cement containing antibiotics. The InterSpace® hip, knee, and shoulder spacers are used in two stage revision procedures that involve an infection with a previously implanted prosthesis and provide orthopaedic surgeons with a unique and convenient way to treat this difficult problem. We distribute Cemex in the United States and Canada under an exclusive distribution agreement with the Italian manufacturer, Tecres. During 2010 we continued rollout of a highly loaded antibiotic option of the InterSpace hip, knee and shoulder spacers. During April 2008, pursuant to our French distributor acquisition, we assumed French distribution agreements for various medical products that are reported through our Other segment.
Marketing and Sales
We market our orthopaedic implant products in the United States through a network of independent sales agencies and direct sales representatives. These organizations, along with their independently contracted personnel, serve as our sales representatives. Internationally, we market our products through a network of independent distributors and our wholly owned subsidiaries that distribute products and services in more than thirty countries. The customers for our products are hospitals, surgeons and other physicians and clinics.
We generally have contractual arrangements with our independent sales organizations to grant the exclusive right to sell our products in a specified territory. In turn, we require that the sales organizations meet certain sales quotas. We typically pay our sales agencies a commission based on net sales. We are highly dependent on the expertise and customer service effectiveness of our independent sales force. Our sales organization is managed by Regional Directors of Sales assigned to regions throughout the United States. We currently offer our products in all fifty states, Puerto Rico, and the District of Columbia. Our international subsidiaries purchase inventory from the parent company and utilize a network of independent sales representatives to distribute our products and services in their territories.
We provide inventories of our products to our United States sales organizations, which remain in their possession until sold or returned to us. These inventories are necessary for sales representatives to market our products and fill customer orders. Because the size of a particular component to be used for a specific patient is typically not known with certainty until the time of surgery a minimum of one of each size of each component in the system to be used must be available to the surgeons at the time of each particular surgery. Accordingly, we must incur significant expenditures in order to maintain the necessary levels of inventory. Our failure to maintain required levels of inventory could have a material adverse effect on our continued expansion. As a result of the need to maintain substantial levels of inventory, we are subject to the risk of inventory obsolescence. In the event that a substantial portion of our inventory
6
Table of Contents
becomes obsolete, it would have a material adverse effect on our results of operations and liquidity. We review our inventory for obsolescence on a regular basis and record an allowance to reduce the carrying value of our inventory.
We generally have contractual arrangements with our international distributors that grant the distributor the exclusive right to market our products in a specified territory, and we require that the distributor meet certain sales quotas. International distributors typically purchase product inventory and instruments from us for their use in marketing, consigning inventory for surgery, and filling customer orders. We have wholly owned subsidiaries operating in China, France, Japan, Spain, Germany, Taiwan, Switzerland, and the United Kingdom, and a branch office in Canada.
Financial Information about Geographic Areas
For the years ended December 31, 2010, 2009 and 2008, international sales accounted for $58.5 million, $54.9 million, and $49.3 million, respectively, representing approximately 31%, 31% and 30%, respectively, of our net sales. Of those international sales, sales to our Spanish distributor accounted for $11.6 million, and $10.3 million in 2009 and 2008, respectively. During 2010, we terminated the agreement with our Spanish distributor and commenced direct sales operations in the third quarter of 2010. Total sales recognized in the Spanish market during 2010 were $7.1 million reflecting sales to our former distributor in the first half of the year, net of sales return allowances, and sales through our direct operations in the second half of the year. We intend to continue to expand our sales in international markets in which there is increasing demand for orthopaedic implant products. We anticipate increasing our reliance on direct sales efforts through subsidiaries.
Manufacturing and Supply
Early in our history, third-party vendors manufactured all of our component parts, while we internally performed product design, quality assurance and packaging. More recently, our strategy has been to continue to develop and expand our own internal manufacturing and supply chain capabilities. We have done this through strategically creating state-of-the-art cellular manufacturing processing, utilizing highly automated, computer-aided production and inspection equipment.
Our manufacturing process typically involves the final machining of semi-completed raw materials of both our metal and polyethylene or compression molded plastic components that make up our joint replacement systems. After parts are machined, they are inspected and processed for final polishing and finishing as needed. Prior to packaging, our parts are inspected again to ensure that they are within approved specifications. Packaged finished parts are then made sterile and ready for surgery through gamma irradiation performed by an outside vendor.
At present, we manufacture approximately 59% of our knee, hip, and shoulder implant components at our facility and headquarters in Gainesville, Florida. With the increase of internal manufacturing, we have experienced a greater degree of control in reducing production costs, while improving response time, flexibility, and other time-saving activities related to continuous process improvement, and we expect this trend to continue. We also continually assess the quality, manufacturing capabilities, on time delivery and cost-effectiveness of our existing and potential vendors in an attempt to secure our supply chain and decrease dependency on key suppliers. For the years ended December 31, 2010, 2009 and 2008, we purchased approximately 33%, 30% and 32%, respectively, of our externally sourced component requirements from our top three suppliers. In May 2010, we acquired 100% of the outstanding shares of Brighton Partners, Inc. which is our sole supplier of the net compression molded polyethylene bearings used in our Optetrak knee replacement system. See Note 5 to Notes to the Consolidated Financial statements for further discussion on the acquisition. We typically do not maintain supply contracts with most of our manufacturers and we instead purchase components pursuant to purchase orders placed from time to time in the ordinary course of business. We continue to develop alternative sources for components. While we do not anticipate encountering difficulties in obtaining adequate supplies of components, we cannot provide assurance that we will continue to be able to obtain components under
7
Table of Contents
acceptable terms and in a timely manner. We provide certain tooling and equipment unique to our products to our suppliers. Order backlog is not a material aspect of our business.
Our internal manufacturing, assembly, packaging and quality control operations are conducted at our principal offices in Gainesville, Florida. Components received from suppliers, as well as those internally manufactured, are examined by our personnel throughout the process and prior to assembly or packaging to ensure that our specifications and standards are maintained.
Additionally, we produce knee instrument components in a 13,125 square foot building we lease in Sarasota, Florida. This facility was added to our ISO 13485:2003 certification.
Patents and Proprietary Technology; License and Consulting Agreements
We hold U.S. and international patents covering several of our implant components, biologic materials technologies and some of our surgical instrumentation with lives ranging from five to seventeen years. We believe that patents and intellectual property will continue to be important to our business and in the orthopaedic industry overall. In this regard, we defend our intellectual property rights and believe that our patents and products do not and will not infringe patents or violate proprietary rights of others, however, it is possible that our existing patent rights may not be valid or that infringement of existing or future patents or proprietary rights may occur. If some of our intellectual property and/or agreements relating to our products were deemed invalid, then such invalidation could have a material adverse effect on our financial condition and results of operations.
In connection with the development of our knee implant systems, we pay royalties to Dr. William Petty and Dr. Gary Miller, who are executive officers and principal shareholders of the Company. Dr. Petty also serves as the Chairman of our Board of Directors. Employment agreements entered into between us and each of Drs. Petty and Miller provide for the continuation of the royalty payments in addition to their regular compensation as executive officers. Compensation associated with these agreements is the only compensation paid by us to Drs. Petty and Miller.
We also pay royalties to a significant hospital customer, pursuant to a license agreement we entered into for its assistance in the development and promotion of our knee implant systems as well as the training of persons in the use of such systems.
We have entered into an oral consulting agreement with Albert Burstein, Ph.D., one of our directors, to provide services regarding many facets of the orthopaedic industry, including product design rationale, manufacturing and development techniques and product sales and marketing. During 2010, we paid Dr. Burstein $180,000 as compensation under this consulting agreement. See Note 8 to Notes to our Consolidated Financial Statements for further discussion on related party transactions.
Research and Development
During 2010, 2009 and 2008, we expended $13.6 million, $11.5 million, and $9.3 million, respectively, on research and development and we anticipate that research and development expenses will continue to increase. Our research and development efforts contributed to the successful release of product line extensions to the Novation® hip stem systems, Equinoxe shoulder systems, and the Optetrak knee system, as well as design improvements targeted to improving internal manufacturing efficiency. Our research and development efforts continue to focus on implant product line extensions, advanced biologic materials, extremity joint reconstruction and alternative bearing surfaces.
As an important part of our research and development efforts, we have developed a strategic partnership through an agreement with Genzyme Biosurgery Corporation to bring expertise in advanced materials to our products. The agreement with Genzyme relates to development of polymer-based synthetic biomaterials, which, when delivered with other biologic products, support the growth of new bone.
Our Taiwanese subsidiary, Exactech Taiwan, has entered into a license agreement with the Industrial Technology Research Institute (ITRI) and the National Taiwan University Hospital (NTUH) for the rights to
8
Table of Contents
technology and patents related to the repair of cartilage lesions. Using the technology, we plan to launch a cartilage repair program that would include a device and method for the treatment and repair of cartilage in the knee joint. The agreement terms include a license fee based on the achievement of specific, regulatory milestones and a royalty arrangement based on sales if regulatory clearances are established. It is expected that the project will require us to complete human clinical trials under the guidance of the FDA in order to obtain premarket approval for the device in the United States.
We believe that our purchase of intellectual property and product-line assets, augmented by additional development, provides a cost-effective and efficient way to bring products to market, and we expect to continue to do so in the future to complement our internal product development.
Competition
The orthopaedic device industry is highly competitive and dominated by a number of large companies with substantially greater financial and other resources than us. Our largest competitors in the orthopaedic market are DePuy, Inc., a division of Johnson and Johnson, Zimmer, Inc., a subsidiary of Zimmer Holdings, Inc., Stryker Corporation, Smith and Nephew plc, and Biomet, Inc. According to “The Orthopaedic Industry Annual Report: 2009 - 2010” for the year ended June 15, 2010, by Orthoworld, Inc., these five companies had an estimated aggregate market share of approximately 53% in 2009.
Companies in the industry compete on the basis of product features and design, innovation, service, the ability to maintain new product flow, and the strength of their distribution network and price. While price is a key factor in the orthopaedic market, there are other significant factors, including: surgeon preference, ease of use, clinical results, and service provided by us and our representatives.
Product Liability and Insurance
We are subject to potential product liability risks that are inherent in the design, manufacture and distribution of orthopaedic implants and surgical instrumentation. We have implemented strict quality control measures and currently maintain product liability insurance in amounts that we believe are typical in the industry for similar companies. For our most recent three fiscal years, we experienced stable insurance premiums as a percentage of sales. We evaluate our levels of product liability insurance annually, as well as the amount of retention carried compared to other companies in the industry. Due to the volatility of the insurance marketplace, the value of the product liability insurance products delivered and the small number of providers of these products, there can be no guarantees as to whether we will be able to secure such coverage in the future at a reasonable cost, or at all.
Government Regulation
Healthcare Regulation
Healthcare is heavily regulated by the federal government and by state and local governments. The federal laws and regulations affecting healthcare change regularly thereby increasing the uncertainty and risk associated with any healthcare-related venture. Congress recently enacted the Patient Protection and Affordable Care Act, and the Executive Branch is in the process of implementing that legislation. There have been efforts to repeal the new law and its constitutionality is currently being tested in the court. Congress may also consider other healthcare legislation. The Affordable Care Act has adverse financial consequences for device manufacturers and it is possible that new legislation, if enacted, could potentially have profound adverse financial consequences for entities, such as ours, that manufacture or distribute medical devices.
The federal government regulates healthcare, in general, and Exactech, in particular, through various agencies, including but not limited to the following: (i) the FDA, which administers the Food, Drug, and Cosmetic Act, or FD&C Act, as well as other relevant laws; (ii) the Centers for Medicare & Medicaid Services, or CMS, which administers the Medicare and Medicaid programs; (iii) the Office of Inspector General, or OIG, which enforces various laws aimed at curtailing fraudulent or abusive practices, including by way of example, the Anti-Kickback Law, the Anti-Physician Referral Law, commonly referred
9
Table of Contents
to as Stark, the Anti-Inducement Law, the Civil Money Penalty Law, and the laws that authorize the OIG to exclude health care providers and others from participating in federal healthcare programs; and (iv) the Office of Civil Rights which administers the privacy aspects of the Health Insurance Portability and Accountability Act of 1996, or HIPAA. All of the aforementioned are agencies within the Department of Health and Human Services, or HHS. Healthcare is also provided or regulated, as the case may be, by the Department of Defense through its TriCare program, the Department of Veterans Affairs under, among other laws, the Veterans Health Care Act of 1992, the Public Health Service within HHS under the Public Health Service Act, the Department of Justice through the Federal False Claims Act and various criminal statutes, and state governments under the Medicaid program and their internal laws regulating all healthcare activities.
| I. | FDA Regulates the Design, Manufacture, and Distribution of Our Medical Devices |
The FDA regulates medical devices and classifies medical devices into one of three classes. Devices are subject to varying levels of regulatory control depending on their class. In the United States, a company generally can obtain permission to distribute a new device in two ways. The first applies to Class I and II devices that are substantially equivalent to a device first marketed prior to May 1976 or to another device marketed after that date, but which was substantially equivalent to a pre-May 1976 device. To obtain FDA permission to distribute the device, a company generally must submit a pre-market notification application (a section 510(k) submission), and receive an FDA order finding substantial equivalence to a predicate device (pre-May 1976 or post-May 1976 device that was substantially equivalent to a pre-May 1976 device) and permitting commercial distribution of that device for its intended use. If clinical data from human clinical trials are required to support the 510(k) submission, these data must be gathered in compliance with investigational device exemption (IDE) regulations for investigations performed in the United States. The FDA review process for pre-market notifications submitted pursuant to section 510(k) takes on average about 90 days, but it can take substantially longer if the agency has concerns, and there is no guarantee that the agency will “clear” the device for marketing, in which case the device cannot be distributed in the United States. Nor is there any guarantee that the agency will deem the article subject to the 510(k) process, as opposed to the pre-market approval (“PMA”) process described below.
The PMA approval process applies to a new device that is not substantially equivalent to a pre-1976 product or is to be used in supporting or sustaining life or preventing impairment. These devices are normally Class III devices. Two steps of FDA approval generally are required before a company can market a product in the U.S. that is subject to approval as opposed to clearance. First, a company must comply with IDE regulations in connection with any human clinical investigation of the device. Second, the FDA must review the company’s pre-market approval (PMA) application, which contains, among other things, clinical information acquired under the IDE. The FDA will approve the PMA application if it finds there is reasonable assurance the device is safe and effective for its intended use. The PMA process takes substantially longer than the 510(k) process.
We currently market medical devices that have been cleared for marketing by the FDA under the 510(k) process and approved for marketing through the PMA process. FDA approval or clearance, as the case may be, is always uncertain. The agency may refuse to clear or approve a device or it may do so, but restrict its intended uses to such a degree that manufacturing and distributing device is not commercially viable.
We are registered with the FDA as a device establishment. As a result, we are subject to periodic inspection by the FDA for compliance with the FDA’s Quality System Regulation requirements and other regulations. The Medical Device Reporting regulations require that we provide information to the FDA whenever there is evidence to reasonably suggest that a device may have caused or contributed to a death or serious injury or, if a malfunction were to occur, could cause or contribute to a death or serious injury. In addition, the FDA prohibits us from promoting a medical device for unapproved or non-cleared indications. The FDA in the course of enforcing the FD&C Act may subject a company to various sanctions for violating FDA regulations or provision of the Act, including requiring recalls, issuing Warning Letters, seeking to impose civil money penalties, seizing devices that the agency believes are non-
10
Table of Contents
compliant, seeking to enjoin distribution of a specific type of device or other product, seeking to revoke an approval or clearance, seeking disgorgement of profits, and seeking to criminally prosecute a company and its officers and other responsible parties.
In the European Union, we are required to maintain certain International Organization for Standardization (ISO) certifications in order to sell products within the EU. These regulations require us to manufacture products and maintain documents in a prescribed manner with respect to design, manufacturing, testing and control activities, and to undergo periodic inspections by notified bodies to obtain and maintain these certifications.
| II. | Medicare Reimbursement Levels Are Uncertain and Subject to Change |
Medicare reimburses for medical devices in a variety of ways depending on where and how the device is used. Under Medicare prospective payment system, devices sold to hospitals and used in connection with treating an inpatient are not separately reimbursable by Medicare. Reduction in payments to hospitals under Medicare Part A (inpatient) or restrictions in coverage for those procedures using our devices would adversely affect the Company. Usually, Medicaid pays less than Medicare, assuming that the state covers the service. In addition, private payors, including managed care payors, increasingly are demanding discounted fee structures and the assumption by healthcare providers of all or a portion of the financial risk. Efforts to impose greater discounts and more stringent cost controls upon healthcare providers, e.g., physicians, by private and public payors are expected to continue.
Significant limits on the scope of services covered or on reimbursement rates and fees on those services that are covered could have a material adverse effect on our ability to commercialize our products and therefore, on our liquidity and financial condition.
| III. | We Must Comply with the Government’s Anti-Fraud and Abuse Rules Which Are Vigorously Enforced |
There are extensive federal and state laws and regulations prohibiting fraud and abuse in the healthcare industry that can result in significant criminal and civil penalties, including exclusion from participation in federal reimbursement programs that can materially affect us. These federal laws include, by way of example, the following:
| • | The anti-kickback statute (Section 1128B(b) of the Social Security Act) prohibits certain business practices and relationships that might affect the provision and cost of healthcare services reimbursable under Medicare, Medicaid and other federal healthcare programs, including the payment or receipt of remuneration for the referral of patients whose care will be paid by Medicare or other governmental programs; |
| • | The physician self-referral prohibition (Ethics in Patient Referral Act of 1989, as amended, commonly referred to as the Stark Law, Section 1877 of the Social Security Act), which prohibits referrals by physicians of Medicare or Medicaid patients to providers of a broad range of designated healthcare services in which the physicians (or their immediate family members) have ownership interests or with which they have certain other financial arrangements. |
| • | The anti-inducement law (Section 1128A(a)(5) of the Social Security Act), which prohibits providers from offering anything to a Medicare or Medicaid beneficiary to induce that beneficiary to use items or services covered by either program; |
| • | The False Claims Act (31 U.S.C. § 3729 et seq.), which prohibits any person from knowingly presenting or causing to be presented false or fraudulent claims for payment to the federal government (including the Medicare and Medicaid programs); |
11
Table of Contents
| • | The Civil Monetary Penalties Law (Section 1128A of the Social Security Act), which authorizes the United States Department of Health and Human Services to impose civil penalties administratively for fraudulent or abusive acts. |
Sanctions for violating these federal laws include criminal and civil penalties that range from punitive sanctions, damage assessments, money penalties, imprisonment, to denial of Medicare and Medicaid payments, or exclusion from the Medicare and Medicaid programs–or both.
Many states have adopted or are considering legislative proposals similar to the federal fraud and abuse laws, some of which extend beyond the Medicare and Medicaid programs to prohibit the payment or receipt of remuneration for the referral of patients and physician self-referrals regardless of whether the service was reimbursed by Medicare or Medicaid. Many states have also adopted or are considering legislative proposals to increase patient protections, such as limiting the use and disclosure of patient specific health information. These state laws also impose criminal and civil penalties similar to the federal laws.
In the ordinary course of their business, medical device manufacturers and suppliers have been and are subject regularly to inquiries, investigations and audits by federal and state agencies that oversee these laws and regulations. Recent federal and state legislation has greatly increased funding for investigations and enforcement actions which have increased dramatically over the past several years. This trend is expected to continue. See Item 1A Risk Factors for discussion on a Department of Justice inquiry. Private enforcement of healthcare fraud also has increased due in large part to amendments to the civil False Claims Act in 1986 that were designed to encourage private persons to sue on behalf of the government.
As federal and state budget pressures continue, federal and state administrative agencies may also continue to escalate investigation and enforcement efforts to control fraud and abuse in governmental healthcare programs. A violation of any of these federal and state fraud and abuse laws and regulations could have a material adverse effect on a suppliers’ liquidity and financial condition. An investigation into the use of a device by physicians may dissuade physicians from either purchasing or using the device. This could have a material adverse effect on our ability to commercialize the device.
| IV. | We May be Compelled to Comply with the Privacy Provisions of HIPAA |
HIPAA, among other things, protects the privacy and security of individually identifiable health information by limiting its use and disclosure. HIPAA directly regulates “covered entities” (healthcare providers, insurers, and clearinghouses) and indirectly regulates “business associates” with respect to the privacy of patients’ medical information. All entities that receive and process protected health information are required to adopt certain procedures to safeguard the security of that information. It is uncertain whether we would be deemed to be a covered entity under HIPAA, and, based on our current business model, it is unlikely that we would be a business associate. However, HIPAA was amended on February 17, 2009, as part of the American Recovery and Reinvestment Act of 2009, to broaden the requirements imposed on covered entities and business associates, to authorize the imposition of civil money penalties and other penalties on those who violate HIPAA, and to authorize States to institute suit to protect the privacy under HIPAA of their citizens. Irrespective of whether we are deemed to be a covered entity or a business associate, we will likely be contractually required to physically safeguard the integrity and security of any patient information that we receive, store, create or transmit. Moreover, many states have privacy statutes that might apply to our operations, even if HIPAA does not.
Environmental Law Compliance
Our operations are subject to numerous and increasingly stringent federal, state and local environmental laws and regulations concerning, among other things, the generation, handling, storage, transportation, treatment and disposal of toxic and hazardous substances and the discharge of pollutants into the environment. Environmental permits and controls are required for some of our manufacturing operations, and these permits are subject to modification, renewal and revocation by the issuing authorities. We do not
12
Table of Contents
have underground storage tanks, and we believe that our facilities are in material compliance with our permits and environmental laws and regulations. We do not believe that future environmental compliance will have a material adverse effect on our business, financial condition or results of operations. Our environmental capital expenditures and costs for environmental compliance may increase in the future as a result of changes in environmental laws and regulations or as a result of increased manufacturing activities at our facilities. We could be materially adversely affected by any failure to comply with environmental laws, including the costs of undertaking a clean-up at a site to which our wastes were transported.
Employees
As of December 31, 2010, we employed 553 full-time employees. We have no union contracts and believe that our relationship with our employees is good.
Executive Officers of the Registrant
Our executive officers, and their ages, as of March 11, 2011, are as follows:
| Name |
Age |
Position | ||
| William Petty, M.D | 68 | Chief Executive Officer and Chairman of the Board | ||
| Gary J. Miller, Ph.D | 63 | Executive Vice President, Research and Development | ||
| David W. Petty | 44 | President and Director | ||
| Joel C. Phillips | 43 | Chief Financial Officer and Treasurer | ||
| Bruce Thompson | 53 | Senior Vice President, General Manager – Biologics and Spine Division | ||
| Betty Petty | 68 | Vice President, Administration and Corporate Secretary |
William Petty, M.D. is a founder of Exactech. He has been Chairman of the Board and Chief Executive Officer of the Company since its inception and was President from January 2002 until December 2007. Dr. Petty was a Professor at the University of Florida College of Medicine from July 1975 to September 1998. Dr. Petty also served as Chairman of the Department of Orthopaedic Surgery at the University of Florida College of Medicine from July 1981 to January 1996. Dr. Petty has served as a member of the Hospital Board of Shands Hospital, Gainesville, Florida, as an examiner for the American Board of Orthopaedic Surgery, as a member of the Orthopaedic Residency Review Committee of the American Medical Association, on the Editorial Board of the Journal of Bone and Joint Surgery, on the Executive Board of the American Academy of Orthopaedic Surgeons, and as President of the Corporate Advisory Council of the American Academy of Orthopaedic Surgeons. He holds the Kappa Delta Award for Outstanding Research from the American Academy of Orthopaedic Surgeons. His book, Total Joint Replacement, was published in 1991. Dr. Petty received his B.S., M.S., and M.D. degrees from the University of Arkansas. He completed his residency in Orthopaedic Surgery at the Mayo Clinic in Rochester, Minnesota. Dr. Petty is the husband of Betty Petty, and the father of David W. Petty.
Gary J. Miller, Ph.D. is a founder and has been Executive Vice President, Research and Development of Exactech since February 2000. He was Vice President, Research and Development from 1986 until 2000 and was a Director from March 1989 through May 2003. Dr. Miller was Associate Professor of Orthopaedic Surgery and Director of Research and Biomechanics at the University of Florida College of Medicine from July 1986 until August 1996. Dr. Miller received his B.S. from the University of Florida, his M.S. (Biomechanics) from the Massachusetts Institute of Technology, and his Ph.D. in Mechanical Engineering (Biomechanics) from the University of Florida. He has held an Adjunct Associate Professorship in the College of Veterinary Medicine’s Small Animal Surgical Sciences Division since 1982 and was appointed as an Adjunct Associate Professor in the Department of Aerospace, Mechanics and Engineering Sciences in 1995. He was a consultant to the FDA from 1989 to 1992 and has served as a consultant to such companies as Johnson & Johnson Orthopaedics, Dow-Corning Wright and Orthogenesis.
David W. Petty has been President of Exactech since November 2007. Mr. Petty has served the Company in various capacities in the areas of operations and sales and marketing since joining the
13
Table of Contents
Company in 1988. From February 2000 to November 2007, Mr. Petty served as Executive Vice President of Sales and Marketing, from 1993 to 2000, he served as Vice President of Marketing and, from April 1991 until April 1993, he served as Vice President of Operations. Mr. Petty received his B.A. from the University of Virginia in 1988 and completed The Executive Program of the Darden School of Business in 1999. He is the son of Dr. and Ms. Petty.
Joel C. Phillips, CPA has been Chief Financial Officer of Exactech since July 1998 and Treasurer since March 1996. Mr. Phillips was Manager, Accounting and Management Information Systems at the Company from April 1993 to June 1998. From January 1991 to April 1993, Mr. Phillips was employed by Arthur Andersen. Mr. Phillips received a B.S. and a Masters in Accounting from the University of Florida and is a Certified Public Accountant. During 2008, Mr. Phillips completed the Advanced Executive Program at the Kellogg School of Management at Northwestern University.
Bruce Thompson has been Senior Vice President, General Manager – Biologics Division since joining the Company in July 2004. In 2008 he assumed the role of general manager of both the biologics and spine divisions of Exactech. Prior to joining Exactech, Mr. Thompson spent 22 years with Smith & Nephew in their Orthopaedic Division. During that time, he held various positions within Smith & Nephew, including Vice President – International Sales, Vice President – Product Planning and Launch, Vice President, General Manager – Spine Division, Group Director of Trauma Manufacturing, Director of Materials Management, and held various product and sales management positions. Mr. Thompson earned a B.S. in Accountancy at Miami University, Oxford, Ohio, and completed the Executive MBA program at the University of Memphis in 1989.
Betty Petty is a founder, Corporate Secretary, and Vice President, Administration. She has been Vice President, Human Resources and Administration since February 2000. She has also been Corporate Secretary of Exactech since its inception and served as Treasurer and a Director until March 1996. Ms. Petty served in the dual capacities of Human Resources Coordinator and Director of Marketing Communications from the founding of the Company until 2001. She received her B.A. from the University of Arkansas at Little Rock and her M.A. in English from Vanderbilt University. Ms. Petty is the wife of Dr. Petty and the mother of David W. Petty.
Our officers are elected annually by the Board of Directors and serve at the discretion of the Board.
Available Information
Our Internet website address is www.exac.com. We make available free of charge on or through our website our Annual Reports on Form 10-K, Quarterly Reports on Form 10-Q, Current Reports on Form 8-K and any other reports we file or furnish under the Securities Exchange Act of 1934, as amended, as well as Section 16 insider holdings reports on Form 3, Form 4 and Form 5, filed by our executive officers and directors and all amendments to these reports, as soon as reasonably practicable after such material is filed electronically with, or furnished to, the Securities and Exchange Commission (“SEC”). These reports may be found at http://www.exac.com/investors/financials by selecting the option entitled “SEC FILINGS”. Additionally, our board committee charters and code of ethics are available on our website and in print to any shareholder who requests them. We intend to post to this website all amendments to the charters and code of ethics. We do not intend for information contained in our web site to be part of this Annual Report on Form 10-K. In addition, the SEC maintains an Internet site that contains reports, proxy and information statements and other information regarding issuers that file electronically with the SEC at http://www.sec.gov.
| ITEM 1A. | RISK FACTORS |
You should carefully consider the risks described below, together with all of the other information in this Annual Report on Form 10-K. The risks described below are not the only risks facing us. Additional risks and uncertainties not currently known to us or that we currently deem to be immaterial may also materially and adversely affect our business operations. If any of the following risks actually occurs, our business,
14
Table of Contents
financial condition and results of operations could suffer and the trading price of our common stock could decline.
If we fail to comply with the terms of the Deferred Prosecution Agreement and Corporate Integrity Agreement we entered into in December 2010, we may be subject to criminal prosecution and/or exclusion from federal healthcare programs.
As previously reported, on December 7, 2010, we entered into a Deferred Prosecution Agreement, or DPA, with the United States Attorney’s Office for the District of New Jersey, or USAO, a civil Settlement Agreement with the United States of America, acting through the United States Department of Justice and on behalf of the Office of Inspector General of the Department of Health and Human Services, or OIG-HHS, and a Corporate Integrity Agreement, or CIA, with the Office of the Inspector General of the United States Department of Health and Human Services. The foregoing agreements resolve the investigation commenced by the USAO in December 2007 into the Company’s consulting arrangements with orthopaedic surgeons relating to the Company’s hip and knee products in the United States. Pursuant to the DPA, an independent monitor will review and evaluate our compliance with our obligations under the DPA. The DPA and CIA impose certain obligations on us to maintain compliance with U.S. healthcare regulatory laws. Our failure to do so could expose us to significant liability including, but not limited to, extension of the term of the DPA, exclusion from federal healthcare program participation, including Medicaid and Medicare, civil and criminal fines or penalties, and additional litigation cost and expense. Any of these consequences would have a material adverse effect on our financial position, results of operations and cash flows. The CIA acknowledges the existence of our Corporate Compliance Program and provides for certain other compliance-related activities during the five-year term of the agreement. If we breach the CIA, the OIG-HHS may take further action against us, up to and including excluding us from participation in federal healthcare programs, which would have a material adverse effect on our financial condition, results of operations and cash flows.
Our recent settlement with the United States Department of Justice and OIG-HHS could lead to further governmental investigations or actions by other third parties.
As a result of the allegations of wrongdoing made by the USAO and the publicity surrounding our recent settlement with the United States Department of Justice and OIG-HHS, other governmental agencies, including state authorities, could conduct investigations or institute proceedings that are not precluded by terms of that settlement. In addition, the settlement with the United States Department of Justice could increase our exposure to lawsuits by potential whistleblowers under the federal false claims acts, based on new theories or allegations arising from the allegations made by the USAO. We cannot assure you that the costs of defending or resolving any such investigations or proceedings would not have a material adverse effect on our financial condition, results of operations and cash flows.
Efforts to enhance our corporate compliance program require the cooperation of many individuals and may divert resources from our other business activities and require substantial investment.
We are committed to the continued enhancement of our corporate compliance program. This will require additional financial and human resources. Successful implementation of our enhanced corporate compliance program will require the full and sustained cooperation of our employees, distributors and sales agents as well as the healthcare professionals with whom they interact. These efforts will require increased expenses, which may negatively impact our results of operations.
If the negative world-wide economic situation intensifies, potential disruptions in the capital and credit markets may adversely affect our business, including the availability and cost of short-term funds for liquidity requirements and our ability to meet long-term commitments and our ability to grow our business; each could adversely affect a registrant’s results of operations, cash flows and financial condition.
The global economy is still experiencing a significant contraction, with an almost unprecedented lack of availability of business and consumer credit. We rely on the capital markets, particularly for publicly offered equity, as well as the credit markets, to meet our financial commitments and short-term liquidity
15
Table of Contents
needs if internal funds are not available from our operations. Disruptions in the capital and credit markets could adversely affect our ability to draw on our bank revolving credit facility. Our access to funds under this credit facility is dependent on the ability of the banks that are parties to the facility to meet their funding commitments. Those banks may not be able to meet their funding commitments to us if they experience shortages of capital and liquidity or if they experience excessive volumes of borrowing requests from us and other borrowers within a short period of time.
Long-term disruptions in the capital and credit market, similar to those experienced during 2008 and 2009, could result from uncertainty, changing or increased regulation, reduced alternatives or failures of significant financial institutions and could adversely affect our access to liquidity needed for our business. Any disruption could require us to take measures to conserve cash until the markets stabilize or until alternative credit arrangements or other funding for our business needs can be arranged. Such measures could include deferring capital expenditures, and reducing or eliminating discretionary uses of cash.
Continued market disruptions could cause broader economic downturns, which may lead to lower demand for our services and increased incidence of customers’ inability to pay their accounts. Further, bankruptcies or similar events by customers may cause us to incur bad debt expense at levels higher than historically experienced. These events would adversely impact our results of operations, cash flows and financial position.
We are subject to extensive government regulation, and our failure to comply with these regulations could materially adversely impact our operations.
Failure to obtain government approvals and clearances for new products and/or modifications to existing products or otherwise comply with applicable laws and regulations on a timely basis would have a material adverse effect on our business and financial results. See “Business—Government Regulation.” A significant recall of one or more of our products could have a material adverse effect on our business and financial results. We cannot provide assurance that such clearances will be granted or that review by government authorities will not involve delays that could materially adversely affect our revenues, earnings, and cash flows.
We expect the healthcare industry to face increased scrutiny over reimbursement and healthcare reform, which could adversely impact how much or under what circumstances healthcare providers will prescribe or administer our products.
In the United States and other countries, sales of our products depend in part upon the availability of reimbursement from third party payers, which include government health administration authorities, managed care providers and private health insurers. Third party payers are increasingly challenging the price and examining the cost effectiveness of medical products and services. Increasing expenditures for healthcare have been the subject of considerable public attention in the United States. Both private and government entities are seeking ways to reduce or contain healthcare costs. Numerous proposals that would affect changes in the United States healthcare system have been introduced or proposed in Congress and in some state legislatures. Although we cannot predict the full effect on our business of the implementation of this legislation, we believe that legislation that reduces reimbursement for our products could adversely impact sales. This could materially and adversely impact our business by reducing our ability to generate revenue, raise capital, obtain additional collaborators and market our products.
We are required to incur significant expenditures of resources in order to maintain relatively high levels of inventory, which can reduce our cash flows.
As a result of our need to maintain substantial levels of inventory, we are subject to the risk of inventory obsolescence. In the event that a substantial portion of our inventory becomes obsolete, it could have a material adverse effect on our earnings and cash flows due to the resulting costs associated with the inventory impairment charges and out-of-pocket costs required to replace such inventory.
16
Table of Contents
We rely upon third party suppliers for raw materials and supplies, and such parties’ failure to perform would adversely impact our production costs.
Some of our suppliers rely on a single source of supply for raw materials and/or other inputs of production. Should the availability and on-time delivery of raw materials and supplies needed in the production of our products and services become unreliable or significantly more costly, then our earnings may be materially and adversely impacted due to the resulting increased costs of production.
We conduct business in a highly competitive industry.
The orthopaedic implant industry is subject to competition in the following areas: product features and design, innovation, service, the ability to maintain new product flow, clinical acceptance of our products by key orthopaedic surgeons and hospitals, strength of distribution network and price. In addition, we face competition for regional sales representatives within the medical community. Our largest competitors in the orthopaedic device market are DePuy, Inc., a division of Johnson and Johnson, Zimmer, Inc., a subsidiary of Zimmer Holdings, Inc., Stryker Corporation, Smith and Nephew plc, and Biomet, Inc. Many of our competitors have significantly greater resources than we have. We cannot provide assurance that we will be able to compete successfully.
Our success is partially dependent upon our ability to successfully market new and improved products and the failure of the market to accept our new or improved products, or our failure to successfully market these products would adversely impact our revenues, cash flows and results of operations.
The failure of our products to gain market acceptance would likely have a material adverse effect on our revenues, cash flows and results of operations. We cannot provide assurance that our new or improved products will gain market acceptance. Future acceptance and use of our products will depend upon a number of factors including:
| • | perceptions by surgeons, patients, third party payors and others in the medical community, about the safety and effectiveness of our products; |
| • | the willingness of the target patient population to try new products and of surgeons to decide to use these products; |
| • | the prevalence and severity of any side effects, including any limitations or warnings contained in our product’s approved labeling; |
| • | the efficacy and potential advantages relative to competing products and products under development; |
| • | effectiveness of education, marketing and distribution efforts by us and our licensees and distributors, if any; |
| • | publicity concerning our products or competing products and treatments; |
| • | reimbursement of our products by third party payors; and |
| • | the price for our products and competing products. |
Our sales are partially derived from the distribution of third party manufacturers’ products who, in certain instances could discontinue their relationships with us.
Should we fail to meet the minimum sales performance or purchase commitments contained in our distribution agreements with third party manufacturers, those third parties may elect to discontinue our distribution of their respective products and services. Should we lose the rights to one or more of our distribution agreements, it could have a material adverse effect on our revenues, cash flows, and results of operations.
We are subject to federal anti-kickback laws and regulations, the violation of which can result in the imposition of harsh penalties materially adversely affecting our results of operations and cash flows.
There are extensive federal and state laws and regulations prohibiting fraud and abuse in the healthcare industry, violations of which can result in significant criminal and civil penalties. These federal laws
17
Table of Contents
include: the anti-kickback statute, which prohibits certain business practices and relationships, including the payment or receipt of remuneration for the referral of patients whose care will be paid by Medicare or other federal healthcare programs; the physician self-referral prohibition, commonly referred to as the Stark Law; the anti-inducement law, which prohibits providers from offering anything to a Medicare or Medicaid beneficiary to induce that beneficiary to use items or services covered by either program; the False Claims Act, which prohibits any person from knowingly presenting or causing to be presented false or fraudulent claims for payment by the federal government, including the Medicare and Medicaid programs, and; the Civil Monetary Penalties Law, which authorizes the United States Department of Health and Human Services to impose civil penalties administratively for fraudulent or abusive acts. Sanctions for violating these federal laws include criminal and civil penalties that range from punitive sanctions, damage assessments, money penalties, imprisonment, to denial of Medicare and Medicaid payments, or exclusion from the Medicare and Medicaid programs, or both. As federal and state budget pressures continue, federal and state administrative agencies may also continue to escalate investigation and enforcement efforts to root out waste and to control fraud and abuse in governmental healthcare programs. Private enforcement of healthcare fraud has also increased, due in large part to amendments to the civil False Claims Act in 1986 that were designed to encourage private persons to sue on behalf of the government. A violation of any of these federal and state fraud and abuse laws and regulations, or any investigation or other legal proceedings relating to such alleged violations, could have a material adverse effect on our liquidity and financial condition. An investigation into the use by physicians of any of our products, once commercialized, may dissuade physicians from either purchasing or using them, and could have a material adverse effect on our ability to commercialize those products.
We cannot provide assurance as to the level of protection patents on specific designs and processes will afford us and with respect to some products, we rely on trade secrets and proprietary know-how which provide less protection.
We cannot provide assurance as to the breadth or degree of protection which existing or future patents, if any, may afford us, that those confidential or proprietary information agreements will not be breached, that the parties from whom we have licensed or otherwise acquired patent rights, proprietary rights and technology have full rights to those patent rights and technology, or that our trade secrets and proprietary know-how will not otherwise become known to or independently developed by competitors. Our Optetrak knee system is one such product that is subject to a patent that we license. Due to the relatively large percentage of our revenue attributable to the Optetrak knee system, if the holder of this patent is determined to not have sufficient legal rights to the patent, our use of the patent under the license could be compromised, which would have a material adverse effect on our business and financial results.
Our business depends on proprietary technology which we may not be able to protect and which may infringe on the intellectual property rights of others.
Our success depends, in part, on the strength of the intellectual property rights relating to our products and proprietary technology. There are no guarantees that patent protection will be obtainable for all of our products whether in the U.S. or abroad, or that any protection that is obtained will be broad enough to be effective and of value, or that it will withstand challenges as to validity and enforceability.
We do not currently have patent protection for all of our products. For our unpatented products, the only intellectual property rights that exist at present, if any, are trade secret rights. We cannot guarantee that others will not readily ascertain by proper means the proprietary technology used in or embodied by our products, or that others will not independently develop substantially equivalent products or that we can meaningfully protect the rights to unpatented products. We cannot guarantee that our agreements with our employees, consultants, advisors, sub-licensees and strategic partners restricting the disclosure and use of trade secrets, inventions and confidential information relating to our products will provide meaningful protection.
It is possible that third parties may assert that our products infringe upon their proprietary rights. It is virtually impossible for us to be certain that no infringement exists. Furthermore, because we have acquired some of the intellectual property used in our business from third parties, there are additional
18
Table of Contents
inherent uncertainties about the origin and ownership of the intellectual property that could contribute to our infringement exposure.
It is also possible that we may need to acquire additional licenses from third parties in order to avoid infringement. We cannot assure you that any required license would be made available to us on acceptable terms, if at all.
We could incur substantial costs in defending ourselves in suits brought against us for alleged infringement of another party’s intellectual property rights as well as in enforcing our rights against others; and if we are found to infringe, the manufacture, sale and use of our products could be enjoined. Any claims against us, with or without merit, would likely be time-consuming, requiring our management team to dedicate substantial time to addressing the issues presented. Furthermore, many of the parties bringing claims may have greater resources than we have.
Any of these events could materially harm our business.
We must devote substantial resources to research and development, which adversely impacts our cash flows and provides no guarantee of success.
We cannot provide assurance that we will be successful in developing competitive new products and/or improving existing products so that our products remain competitive and avoid obsolescence. In addition, whether or not successful, these research and development efforts place stress on our cash flows which could have a material adverse effect on our business, should our efforts prove unsuccessful in producing competitive products that achieve market acceptance.
We are subject to potential product liability risks, which are inherent in the design, marketing and sale of orthopaedic implants and surgical instrumentation.
We cannot provide assurance we will not face claims resulting in substantial liability for which we are not fully insured. A partially or completely uninsured successful claim against us of sufficient magnitude could have a material adverse effect on our earnings and cash flows due the cost of defending ourselves against such a claim. Any product liability claim, even one that was not in excess of our insurance coverage or one that is meritless and/or unsuccessful, could adversely affect our cash available for other purposes, such as research and development, which would have a material adverse effect on our business and results of operations. Product liability claims may result in reduced demand for our products, if approved, which would have a material adverse effect on our business and results of operations. In addition, the existence of a product liability claim could affect the market price of our common stock.
We may not be able to secure and maintain adequate levels of product liability insurance coverage on acceptable terms.
Product liability insurance premiums are volatile. Should premiums increase significantly, it could have a material adverse effect on our earnings and cash flows due to the increase in operating costs that would result. We presently carry product liability insurance with coverage in an amount we consider reasonable and customary. However, this insurance coverage includes various deductibles, limitations and exclusions from coverage, and in any event might not fully cover any potential claims. We may not be able to obtain adequate insurance in the future at an acceptable cost.
Our products, including products that are manufactured by third parties but distributed by us, may be subject to recall or product liability claims.
These products are used in medical contexts in which it is important that those products function with precision and accuracy. If these products do not function as designed, or are designed improperly, we or the third party manufacturer of these products may choose to or be forced by regulatory agencies to withdraw such products from the market. In addition, if patients suffer injury as a result of any failure of these products to function as designed, or an inappropriate design, we could be subject to lawsuits
19
Table of Contents
seeking significant compensatory and punitive damages. Any product recall or lawsuit seeking significant monetary damages may have a material adverse effect on our business, operations or financial condition. In October 2005, RTI Biologics, Inc. or RTI, a distributor of allograft materials with whom we have a distribution relationship, announced a voluntary recall of some of its allograft tissue implants due to questions raised with respect to donor documentation on donated tissues received from an unaffiliated donor recovery organization. This recall affected some of the allograft tissue services distributed by Exactech. The ultimate effect of this recall on our results of operations, financial condition and cash flows is uncertain. Furthermore, we are currently a party to several product liability suits related to the products distributed by us on behalf of RTI. These suits generally allege, among other claims, that we negligently and intentionally distributed diseased, contaminated and/or defective allograft materials. Pursuant to our license and distribution agreement with RTI, we will tender all cases to RTI. While we believe that the various claims are without merit, a negative outcome of such litigation, including any finding of fraud, may have a material adverse effect on our business, operations and financial condition.
We partially depend on third parties for sales and marketing, and our inability to effectively utilize the services provided by these third parties would materially adversely impact our ability to generate sales.
With respect to our international markets, we depend on independent sales representatives and distributors for the sale and marketing of certain of our products. Our contracts with distributors generally grant them the exclusive right to market our products in a specified territory. The distributor typically is set designated sales quotas. Our arrangements with our independent sales representatives and distributors typically do not preclude them from selling competitive products. Our success depends upon the expertise of our independent sales representatives and distributors and the acceptance of our products by our customers. Our inability to attract and retain qualified sales representatives and distributors would have a material adverse effect on our business, results of operations, financial condition and prospects.
During our history we have incurred a number of transitions from independent international distributors to direct subsidiary sales operations. During such transitions, revenues, expenses and related operating profits can be negatively impacted. We will most likely face similar transitions that could have a material impact on our financial operations, specifically on a quarterly basis. Our inability to manage such significant distributor transitions could have a material adverse effect on our business, results of operations, financial condition and prospects.
We are dependent on third-party technology, the loss of which would harm our business.
We rely on third parties to gain access to technologies that are used in our current products and in products under development. Consequently, we must rely upon these third parties to develop, to introduce and maintain technologies which continue to enhance our current products and enable us, in turn, to develop our own products on a timely and cost-effective basis to meet changing customer needs and technological trends in the orthopedic industry. In many cases, our purchases from the technology supplier are accomplished by submission of purchase orders. Accordingly, we do not obtain a contractual agreement with the technology supplier and, accordingly, we do not have guaranteed access to the technology for the intended lifecycle of the product which incorporates that technology. Additionally, these technology suppliers may go out of business or may be subject to injunctions or natural disasters which prevent them from being able to supply that technology to us in the future. Additionally, the technology may evolve due to changes in industry standards or changes in the market, and due to the lack of contractual agreements with the technology suppliers, we may not have access to the evolved technology in the future. Were we to lose the ability to obtain needed technology from a supplier, or were that technology no longer available to us under reasonable terms and conditions, our business and results of operations would be materially and adversely affected.
Any impairment in our relationships with the licensors of technologies used in our products would force us to find other developers on a timely basis or develop our own technology. For example, we estimate that it would take us from approximately 18 to 24 months to re-engineer and reintroduce a product if we lost our existing licenses to certain technologies used in some of our products. There is no guarantee that we will be able to obtain the third-party technology necessary to continue to develop and introduce
20
Table of Contents
new and enhanced products, that we will obtain third-party technology on commercially reasonable terms or that we will be able to replace third-party technology in the event such technology becomes unavailable, obsolete or incompatible with future versions of our products. We would have severe difficulty competing if we cannot obtain or replace much of the third-party technology used in our products. Any absence or delay in obtaining third-party technology necessary for our products would materially adversely affect our business and operating results.
Acquisitions may result in disruptions to our business or distractions of our management due to the efforts required to integrate acquired personnel and operations, and there is no assurance that any such integration will proceed as planned.
On April 1, 2010, we consummated our acquisition of certain assets of Tantum AG, our prior independent distributor in Germany, and established Exactech Deutschland. On May 24, 2010, we completed the 100% acquisition of our supplier, Brighton Partners, Inc., the sole source supplier for our net compression molded (NCM) polyethylene bearings for our Optetrak® knee system. Also, on August 27, 2010, we acquired the inventory, instruments and design licenses for several innovative spine product lines from VertiFlex, Inc., a leading developer of minimally invasive and motion preserving spinal surgery technologies. We intend to continue to expand our business through the acquisition of companies, technologies, products and services. Acquisitions involve a number of special problems and risks, including:
| • | difficulty integrating acquired technologies, products, services, operations and personnel with the existing businesses; |
| • | difficulty maintaining relationships with important third parties, including those relating to marketing alliances and providing preferred partner status and favorable pricing; |
| • | diversion of management’s attention in connection with both negotiating the acquisitions and integrating the businesses; |
| • | strain on managerial and operational resources as management tries to oversee larger operations; |
| • | inability to retain and motivate management and other key personnel of the acquired businesses; |
| • | exposure to unforeseen liabilities of acquired companies, as well as risk of potential litigation arising from such acquisitions; |
| • | potential costly and time-consuming litigation, including stockholder lawsuits; |
| • | potential issuance of securities to equity holders of the company being acquired with rights that are superior to the rights of holders of our common stock, or which may have a dilutive effect on our common stockholders; |
| • | the need to incur additional debt or use cash; and |
| • | the requirement to record potentially significant additional future operating costs for the amortization of intangible assets. |
As a result of our significant growth and initiative to acquire businesses during 2010, there has been a significant strain on internal resources impacting the design and effectiveness of certain internal control processes. As a result of these or other problems and risks, businesses we acquire may not produce the revenues, earnings or business synergies that we anticipated, and acquired products, services or technologies might not perform as we expected. As a result, we may incur higher costs and realize lower revenues than we had anticipated. We may not be able to successfully address these problems and we cannot assure you that the acquisitions will be successfully identified and completed or that, if acquisitions are completed, the acquired businesses, products, services or technologies will generate sufficient revenue to offset the associated costs or other harmful effects on our business.
Any of these risks can be greater if an acquisition is large relative to the size of our company. Failure to effectively manage our growth through acquisitions could adversely affect our growth prospects, business, results of operations and financial condition.
21
Table of Contents
We are dependent on key personnel and the loss of these key personnel could have a material adverse effect on our success.
We are highly dependent on the skills, experience and services of key personnel. The loss of key personnel could have a material adverse effect on our business, operating results or financial condition. If Dr. William Petty, our Chief Executive Officer and Chairman, terminates his employment with Exactech for any reason, his absence could have a material adverse effect on our business, results of operation and financial condition. We do not maintain key-man life insurance with respect to these key individuals. Our recent and potential growth and expansion are expected to place increased demands on our management skills and resources. Therefore, our success also depends upon our ability to recruit, hire, train and retain additional skilled and experienced management personnel. Employment and retention of qualified personnel is important due to the competitive nature of our industry. Our inability to hire new personnel with the requisite skills could impair our ability to manage and operate our business effectively.
Difficulties presented by international economic, political, legal, accounting and business conditions could harm our business in international markets.
The international component of our business has been increasing. For the years ended December 31, 2010, 2009 and 2008, 31%, 31% and 30% of our total revenues were generated in countries outside of the United States. Some risks inherent in conducting business internationally include:
| • | unexpected changes in regulatory, tax and political environments; |
| • | longer payment cycles and problems collecting accounts receivable; |
| • | financial instability of government payors in some markets; |
| • | fluctuations in currency exchange and interest rates; |
| • | our ability to secure and maintain the necessary physical infrastructure; |
| • | challenges in staffing and managing foreign operations; |
| • | healthcare laws and regulations may be more restrictive than those currently in place in the United States; |
| • | changes in third-party reimbursement policy that may require some of the patients who receive our implant products to directly absorb medical costs or that may necessitate our reducing selling prices for our products; and |
| • | our inability to successfully transition to a significant international platform, including the establishment of internal operational, supply and distribution capabilities. |
Any one or more of these factors could materially and adversely affect our business.
Our stock price may be volatile, and you could lose all or part of your investment.
The market for our common stock has been volatile (ranging from $14.03 per share to $22.34 per share during the 52-week trading period ended March 11, 2011). Factors that could cause the market price of our common stock to fluctuate significantly include, but are not limited to the following:
| • | actual or anticipated variations in our quarterly and annual results of operations; |
| • | the failure of our results of operations to meet the expectations of public market analysts or investors; |
| • | changes in market valuations of companies in our industry; |
| • | changes in expectations of future financial performance or changes in estimates of securities analysts; |
| • | adverse regulatory or legal proceedings; |
| • | general market conditions; |
| • | future issuances of common stock or other securities; |
| • | the addition or departure of key personnel; and |
| • | announcements by us or our competitors of acquisitions, investments or strategic alliances. |
22
Table of Contents
Our common shares are thinly traded and, therefore, relatively illiquid.
As of March 11, 2011, we had 13,049,535 common shares outstanding. While our common shares trade on the NASDAQ, our stock is thinly traded (approximately 0.2%, or 24,000 shares, of our stock traded on an average daily basis during the 52 week trading period ended March 11, 2011) and you may have difficulty in selling your shares quickly. The low trading volume of our common stock is outside of our control, and may not increase in the near future or, even if it does increase in the future, may not be maintained.
Existing stockholders’ interest in us may be diluted by additional issuances of equity securities.
We expect to issue additional equity securities, to fund the acquisition of additional businesses and pursuant to employee benefit plans. We may also issue additional equity for other purposes. These securities may have the same rights as our common stock or, alternatively, may have dividend, liquidation, or other preferences to our common stock. The issuance of additional equity securities will dilute the holdings of existing stockholders and may reduce the share price of our common stock.
We do not expect to pay dividends on our common stock, and investors will be able to receive cash in respect of the shares of common stock only upon the sale of the shares.
We have no intention in the foreseeable future to pay any cash dividends on our common stock, and we are restricted from doing so in accordance with the terms of our credit agreements. Furthermore, we may not pay cash or stock dividends without the written consent of our senior lenders. Therefore, an investor in our common stock may obtain an economic benefit from the common stock only after an increase in its trading price and only by selling the common stock.
Directors, executive officers, principal shareholders and affiliated entities own a significant percentage of our capital stock, and they may make decisions that an investor may not consider to be in the best interests of our shareholders.
Our directors, executive officers, principal shareholders and affiliated entities beneficially own, in the aggregate, approximately 38% of our outstanding common stock. As a result, if some or all of them acted together, they would have the ability to exert substantial influence over the election of our Board of Directors and the outcome of issues requiring approval by our shareholders. This concentration of ownership may have the effect of delaying or preventing a change in control of our company that may be favored by other shareholders. This could prevent the consummation of transactions favorable to other shareholders, such as a transaction in which shareholders might otherwise receive a premium for their shares over current market prices.
Our business and customers may be subject to use taxes and other taxes.
The application of indirect taxes (such as use tax, value-added tax (VAT), goods and services tax, business tax, and gross receipt tax) to the surgical instrumentation we provide in connection with the orthopaedic implant devices we manufacture is a complex and evolving issue. Many of the fundamental statutes and regulations are vague as to whether their application is appropriate in this arena. In many cases, it is not clear how existing statutes apply to the provision of surgical instrumentation. The application of such statutes and regulations, particularly as many states seek avenues with which they may expand revenues generated from broader taxes, could adversely affect our business as it would result in the imposition of use taxes, as well as costs associated with complex tax collection, remittance and audit compliance requirements on us and our dealers and would impact the cost profile of our surgical instrumentation. From time to time, some taxing authorities have notified us that they believe we owe them certain taxes. We are currently contesting these determinations. We continue to work with the relevant tax authorities to clarify our obligations under these laws and regulations.
23
Table of Contents
Failure to achieve and maintain effective internal controls in accordance with Section 404 of the Sarbanes-Oxley Act could have a material adverse effect on our business and operating results. In addition, current and potential shareholders could lose confidence in our financial reporting, which could have a material adverse effect on the price of our common stock.
Effective internal controls are necessary for us to provide reliable financial reports and effectively prevent fraud. If we cannot provide reliable financial reports or prevent fraud, our results of operation could be harmed. Section 404 of the Sarbanes-Oxley Act of 2002 requires annual management assessments of the effectiveness of our internal controls over financial reporting and a report by our independent registered public accounting firm addressing these assessments. If it is determined that we are not in compliance with Section 404, we may be required to implement new internal control procedures and reevaluate our financial reporting. We may experience higher than anticipated operating expenses as well as increased independent auditor fees during the implementation of these changes and thereafter. Further, we may need to hire additional qualified personnel. In addition, if we fail to maintain the adequacy of our internal controls, as such standards are modified, supplemented or amended from time to time, we may not be able to conclude on an ongoing basis that we have effective internal controls over financial reporting in accordance with Section 404 of the Sarbanes-Oxley Act, which could result in our being unable to obtain an unqualified report on internal controls from our independent auditors. Failure to achieve and maintain an effective internal control environment could also cause investors to lose confidence in our reported financial information, which could have a material adverse effect on the price of our common stock.
Compliance with changing regulation of corporate governance and public disclosure may result in additional expenses, or divert management’s attention from operating our business which could have a material adverse effect on our business.
There have been other changing laws, regulations and standards relating to corporate governance and public disclosure in addition to the Sarbanes-Oxley Act, as well as new regulations promulgated by the SEC and rules promulgated by the national securities exchanges, including the NASDAQ. These new or changed laws, regulations and standards are subject to varying interpretations in many cases due to their lack of specificity, and as a result, their application in practice may evolve over time as new guidance is provided by regulatory and governing bodies, which could result in continuing uncertainty regarding compliance matters and higher costs necessitated by ongoing revisions to disclosure and governance practices. As a result, our efforts to comply with evolving laws, regulations and standards are likely to continue to result in increased general and administrative expenses and a diversion of management time and attention from revenue-generating activities to compliance activities. Our board members, Chief Executive Officer and Chief Financial Officer could face an increased risk of personal liability in connection with the performance of their duties. As a result, we may have difficulty attracting and retaining qualified board members and executive officers, which could have a material adverse effect on our business. If our efforts to comply with new or changed laws, regulations and standards differ from the activities intended by regulatory or governing bodies, we may incur additional expenses to comply with standards set by regulatory authorities or governing bodies which would have a material adverse effect on our business and results of operations.
| ITEM 1B. | UNRESOLVED STAFF COMMENTS |
None.
24
Table of Contents
We operate in the following properties:
| Owned Property |
||||||||
| Facility | Location | Square Feet | ||||||
| Headquarters, research & development and manufacturing | Gainesville, FL | 177,195 | ||||||
| Sales office and warehouse | Illkirch, France | 5,188 | ||||||
| Leased Property |
||||||||||||||
| Facility | Location | Square Feet |
Lease Term Expiration Date |
Annual Rental ($) |
||||||||||
| SE Ohio Sales Office |
Lima, OH | 2,327 | 04/30/2011 | 35,000 | ||||||||||
| Exactech Canada Sales Office |
Mt. Hope, Ontario | 4,200 | 08/31/2013 | 22,000 | ||||||||||
| Instrument Manufacturing Shop |
Sarasota, FL | 13,125 | 06/30/2013 | 117,000 | ||||||||||
| Manufacturing Shop |
Sarasota, FL | 10,000 | 05/31/2012 | 111,000 | ||||||||||
| Research Office |
Hsinchu, Taiwan | 849 | 12/31/2011 | 13,000 | (1) | |||||||||
| Office Space |
Taipei, Taiwan | 270 | 10/15/2011 | 1,000 | (1) | |||||||||
| Sales Office |
Redditch, England | 800 | 03/31/2013 | 13,000 | (1) | |||||||||
| Sales Office |
Tokyo, Japan | 2,239 | 01/31/2012 | 104,000 | (1) | |||||||||
| Sales Office |
Shanghai, PROC | 3,650 | 02/28/2012 | 75,000 | (1) | |||||||||
| Sales Office |
Beijing, PROC | 773 | 02/14/2012 | 15,000 | (1) | |||||||||
| Warehouse (Lille) |
Capinghem, France | 3,714 | 08/14/2016 | 59,000 | (1) | |||||||||
| Office Space |
Illkirch, France | 2,217 | 03/31/2015 | 35,000 | (1) | |||||||||
| Sales Office |
Gijon, Spain | 6,232 | 03/01/2017 | 95,000 | (1) | |||||||||
| Sales Office |
Madrid, Spain | 1,504 | 08/01/2012 | 36,000 | (1) | |||||||||
| Sales Office |
Malaga, Spain | 1,066 | 05/01/2011 | 16,000 | (1) | |||||||||
| Sales Office |
Sevilla, Spain | 677 | 05/01/2011 | 13,000 | (1) | |||||||||
| Sales Office |
Barcelona, Spain | 955 | 06/01/2011 | 23,000 | (1) | |||||||||
| Sales Office |
Valencia, Spain | 269 | 06/01/2011 | 16,000 | (1) | |||||||||
| Sales Office |
Pamplona, Spain | 1,897 | 05/01/2014 | 19,000 | (1) | |||||||||
| Sales Office |
Palma de Mallorca, Spain | 1,346 | 06/01/2011 | 17,000 | (1) | |||||||||
| Sales Office |
Kiel, Germany
|
2,002 | 12/31/2017 | 20,000 | (1) | |||||||||
| (1) | Annual lease amounts are translated into U.S. Dollars using December 31, 2010 exchange rates. |
In addition to the above, we own approximately four and one-half acres of undeveloped land near our existing facilities in Gainesville, Florida that we may use for future expansion.
There are various claims, lawsuits, and disputes with third parties and pending actions involving various allegations against us incident to the operation of our business, principally product liability cases. We are currently a party to several product liability suits related to the products distributed by us on behalf of RTI Biologics, Inc. (“RTI”). Pursuant to our license and distribution agreement with RTI, we will tender all cases to RTI. While we believe that the various claims are without merit, we are unable to predict the ultimate outcome of such litigation. We therefore maintain insurance, subject to self-insured retention limits, for all such claims, and establish accruals for product liability and other claims based upon our experience with similar past claims, advice of counsel and the best information available. At December 31, 2010, we did not have any accruals for product liability claims. At December 31, 2009, we had $160,000 accrued for product liability claims. These matters are subject to various uncertainties, and it is possible that they may be resolved unfavorably to us. However, while it is not possible to predict with certainty the outcome of the various cases, it is the opinion of management that, upon ultimate resolution,
25
Table of Contents
the cases will not have a material adverse effect on our consolidated financial position, results of operations or cash flows.
Our insurance policies covering product liability claims must be renewed annually. Although we have been able to obtain insurance coverage concerning product liability claims at a cost and on other terms and conditions that are acceptable to us, we may not be able to procure acceptable policies in the future.
On December 7, 2010, we entered into a twelve-month Deferred Prosecution Agreement, or DPA, with the United States Attorney’s Office for the District of New Jersey, or the USAO, and a five year Corporate Integrity Agreement, or CIA, with the Office of the Inspector General of the United States Department of Health and Human Services. The foregoing agreements, together with a related settlement agreement, resolve the investigation commenced by the USAO in December 2007 into our consulting arrangements with orthopaedic surgeons relating to our hip and knee products in the United States, which we refer to as the Subject Matter. As set forth in the DPA, the USAO specifically acknowledges that it does not allege that our conduct adversely affected patient health or patient care. Pursuant to the DPA, the USAO has agreed not to prosecute us in connection with the Subject Matter provided that we comply with our obligations under the DPA during its term. Additionally, pursuant to the DPA, an independent monitor will review and evaluate our compliance with our obligations under the DPA. CIA acknowledges the existence of our corporate compliance program and provides us with certain other compliance-related obligations during the CIA’s term. See “Item 1A — Risk Factors” for more information about our obligations under these agreements. We continue to enhance and apply our corporate compliance program, and we monitor our practices on an ongoing basis to ensure that we have in place proper controls necessary to comply with applicable laws in the jurisdictions in which we do business. Our failure to maintain compliance with U.S. healthcare regulatory laws could expose us to significant liability including, but not limited to, extension of the term of the DPA, exclusion from federal healthcare program participation, including Medicaid and Medicare, civil and criminal fines or penalties, and additional litigation cost and expense. Pursuant to the CSA, we settled civil and administrative claims relating to the matter for a payment of $3.0 million, without any admission by the Company. We previously accrued approximately $3.5 million for an anticipated settlement and legal expenses related to this investigation, and therefore, these agreements did not materially impact our results of operations for the fourth quarter of 2010.
On October 18, 2010, MBA Incorporado, S.L., or MBA, our former distributor in Spain filed an action against Exactech, Inc. and Exactech Ibérica, S.A.U. in the Court of First Instance No. 10 of Gijon, Spain in connection with our termination of the distribution agreement with MBA in July 2010. In the lawsuit, MBA alleges, (i) wrongful solicitation of certain employees of MBA subsequent to the termination of the distribution agreement, (ii) breach of contract with respect to the termination date established by Exactech and Exactech’s alleged failure to follow the termination transitioning protocols set forth in the distribution agreement, and (iii) commercial damages and lost sales and customers due to Exactech's alleged failure to supply products requested by MBA during the transition period of the distribution agreement termination. In the Complaint 1 filing MBA seeks damages of forty-four million (€44,000,000) Euros compensation for all benefits alleged to be owed by Exactech under the distribution agreement, including alleged loss of clientele, alleged loss of prestige and credibility, alleged loss of client confidence and alleged illegitimate business practices. On December 1, 2010, MBA filed a second action (“Complaint 2”) against Exactech Iberica and two of the former principals of MBA, in the Mercantile Court No. 3 of Gijon, Spain, also in connection with our termination of the distribution agreement with MBA in July 2010, seeking among other things injunctive relief. Both complaints are currently working through the legal proceedings process. While it is not possible to predict with certainty the outcome of the lawsuit, we believe that our termination of the distribution agreement with MBA was proper, all actions taken by us in connection with the termination (including during the transition period) were proper and, accordingly, the claims are without merit and subject to a number of defenses we possess. We intend to vigorously defend ourselves against these claims.
ITEM 4. (Removed and Reserved)
26
Table of Contents
| ITEM 5. | MARKET FOR REGISTRANT’S COMMON EQUITY, RELATED STOCKHOLDER MATTERS AND ISSUER PURCHASES OF EQUITY SECURITIES |
Our common stock trades on the Nasdaq Global Select Market under the symbol “EXAC”. The following table sets forth, for the periods indicated, the high and low sales prices of our common stock, as reported on the Nasdaq Global Select Market:
| 2010 | High | Low | ||||||
| First Quarter |
$ | 21.13 | $ | 15.44 | ||||
| Second Quarter |
22.34 | 16.25 | ||||||
| Third Quarter |
18.10 | 14.03 | ||||||
| Fourth Quarter |
19.23 | 14.40 | ||||||
|
2009 |
||||||||
| First Quarter |
$ | 17.16 | $ | 10.74 | ||||
| Second Quarter |
16.86 | 11.12 | ||||||
| Third Quarter |
16.28 | 12.69 | ||||||
| Fourth Quarter |
19.24 | 14.95 | ||||||
We have paid no cash dividends to date on our common stock. We intend to retain all future earnings for the operation and expansion of our business and do not anticipate the payment of cash dividends in the foreseeable future. Any future determination as to the payment of cash dividends will depend upon a number of factors, including our future earnings, results of operations, capital requirements, financial condition and any restrictions under credit agreements existing from time to time, as well as such other factors as the Board of Directors may deem relevant. Our line of credit with SunTrust Bank limits our ability to pay dividends.
As of March 11, 2011 we had approximately 229 shareholders of record.
Securities Authorized for Issuance Under Equity Compensation Plans
The following table provides information as of December 31, 2010 with respect to compensation plans (including individual compensation arrangements) under which our equity securities are authorized for issuance.
Equity Compensation Plan Information
| Plan Category | Number of securities to be issued upon exercise of outstanding options, warrants and rights (in thousands) |
Weighted-average exercise price of outstanding options, warrants and rights |
Number of securities remaining available for future issuance under equity compensation plans (excluding securities reflected in column (a)) (in thousands) |
|||||||||
| (a) | (b) | (c) | ||||||||||
| Equity compensation plans approved by security holders |
1,379 | $ | 15.79 | 368 | ||||||||
| Equity compensation plans not approved by security holders(1) |
— | — | — | |||||||||
| Total(2) |
1,379 | $ | 15.79 | 368 | ||||||||
| (1) | The 2009 Executive Incentive Compensation Plan, approved by shareholders at the Annual Meeting on May 7, 2009, superseded and consolidated all of our previous incentive stock plans. |
| (2) | See Note 11 to our consolidated financial statements for additional information regarding our stock option awards. |
27
Table of Contents
Purchases of Equity Securities by the Issuer and Affiliated Purchasers
None.
Performance Graph
The following graph compares the cumulative total shareholder return on our common stock for the period from December 31, 2005 to December 31, 2010 with (i) the Nasdaq Stock Market index prepared by Zacks Investment Research, Inc. (“Zacks”), and (ii) Zack’s index (the “SIC Index”) for companies with our Standard Industry Code.
The graph assumes an investment of $100 in our common stock and each of the respective indices for the period from December 31, 2005 to December 2010. The comparisons set forth in the graph are provided pursuant to SEC rules and are not intended to forecast or be indicative of the future performance of our common stock or either of the included indices.
The performance graph shall not be deemed incorporated by reference by any general statement incorporating by reference this annual report into any filing under the Securities Act of 1933, as amended, or the Securities Exchange Act of 1934, as amended, except to the extent we specifically incorporate this information by reference, and shall not otherwise be deemed filed under such acts.
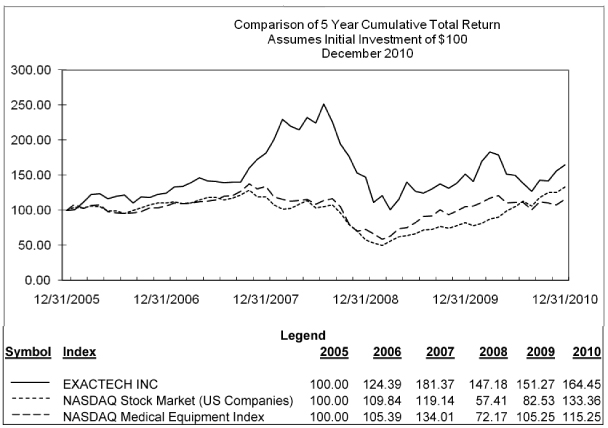
28
Table of Contents
| ITEM 6. | SELECTED FINANCIAL DATA |
The selected financial data set forth below has been derived from our audited consolidated financial statements. This data should be read in conjunction with the financial statements, the notes thereto and “Management’s Discussion and Analysis of Financial Condition and Results of Operations” included elsewhere herein.
| Year Ended December 31, | ||||||||||||||||||||
| (in thousands, except per share amounts) |
2010 | 2009 | 2008 | 2007 | 2006 | |||||||||||||||
| Statement of Income Data: |
||||||||||||||||||||
| Net sales |
$ | 190,483 | $ | 177,310 | $ | 161,730 | $ | 124,209 | $ | 102,430 | ||||||||||
| Cost of goods sold |
63,961 | 65,002 | 58,620 | 43,758 | 36,571 | |||||||||||||||
| Gross profit |
126,522 | 112,308 | 103,110 | 80,451 | 65,859 | |||||||||||||||
| Operating expenses: |
||||||||||||||||||||
| Sales and marketing |
66,123 | 55,318 | 51,263 | 38,699 | 30,012 | |||||||||||||||
| General and administrative |
17,622 | 21,797 | 16,471 | 10,984 | 9,955 | |||||||||||||||
| Research and development |
13,631 | 11,533 | 9,255 | 8,126 | 6,241 | |||||||||||||||
| Impairment loss |
— | — | — | 1,519 | — | |||||||||||||||
| Depreciation and amortization |
10,744 | 8,930 | 7,569 | 6,156 | 5,718 | |||||||||||||||
| Total operating expenses |
108,120 | 97,578 | 84,558 | 65,484 | 51,926 | |||||||||||||||
| Income from operations |
18,402 | 14,730 | 18,552 | 14,967 | 13,933 | |||||||||||||||
| Other income (expense): |
||||||||||||||||||||
| Interest expense, net |
(636 | ) | (683 | ) | (1,096 | ) | (950 | ) | (1,941 | ) | ||||||||||
| Other income (expense) |
64 | 65 | 485 | (72 | ) | — | ||||||||||||||
| Foreign currency exchange gain (loss) |
391 | 60 | (229 | ) | (152 | ) | (114 | ) | ||||||||||||
| Income before provision for income taxes |
18,221 | 14,172 | 17,712 | 13,793 | 11,878 | |||||||||||||||
| Provision for income taxes |
7,756 | 5,845 | 6,521 | 4,859 | 3,954 | |||||||||||||||
| Income before equity in loss of other investments |
10,465 | 8,327 | 11,191 | 8,934 | 7,924 | |||||||||||||||
| Equity in net loss of other investments |
— | — | (98 | ) | (451 | ) | (172 | ) | ||||||||||||
| Net income |
10,465 | 8,327 | 11,093 | 8,483 | 7,752 | |||||||||||||||
| Basic earnings per common share |
$ | 0.81 | $ | 0.65 | $ | 0.90 | $ | 0.73 | $ | 0.68 | ||||||||||
| Diluted earnings per common share |
$ | 0.80 | $ | 0.65 | $ | 0.87 | $ | 0.72 | $ | 0.67 | ||||||||||
| (in thousands) |
2010 | 2009 | 2008 | 2007 | 2006 | |||||||||||||||
| Balance Sheet Data: |
||||||||||||||||||||
| Total current assets |
$ | 112,539 | $ | 97,468 | $ | 100,572 | $ | 70,863 | $ | 60,087 | ||||||||||
| Total assets |
219,993 | 171,020 | 167,520 | 116,459 | 113,274 | |||||||||||||||
| Total current liabilities |
26,064 | 23,745 | 21,789 | 17,167 | 11,940 | |||||||||||||||
| Total long-term debt, net of current portion |
41,709 | 13,015 | 22,412 | 9,025 | 21,784 | |||||||||||||||
| Total liabilities |
74,577 | 39,267 | 45,905 | 28,821 | 36,351 | |||||||||||||||
| Total shareholders’ equity |
|
145,416
|
|
|
131,753
|
|
|
121,615
|
|
|
87,638
|
|
|
76,923
|
| |||||
29
Table of Contents
ITEM 7. MANAGEMENT’S DISCUSSION AND ANALYSIS OF FINANCIAL CONDITION AND RESULTS OF OPERATIONS
The following discussion and analysis of our financial condition and results of operations should be read in conjunction with our historical consolidated financial statements and related notes thereto in “Item 8. Financial Statements and Supplementary Data.” The discussion below contains forward-looking statements that are based upon our current expectations and are subject to uncertainty and changes in circumstances. Actual results may differ materially from these expectations due to inaccurate assumptions and known or unknown risks and uncertainties, including those identified in “Cautionary Note Regarding Forward-Looking Statements” and “Item lA. Risk Factors” contained in this Annual Report on Form 10-K.
Overview of the Company
We develop, manufacture, market and sell orthopaedic implant devices, related surgical instrumentation, supplies and biologic materials to hospitals and physicians in the United States and internationally. Our revenues are derived from sales of knee, hip, and extremity joint replacement systems, spinal fusion products, and distribution of biologic materials. Our continuing research and development projects will enable us to continue the introduction of new, advanced biologic materials and other products and services. Revenue from sales of other products, including surgical instrumentation, Cemex® bone cement, the InterSpace™ pre-formed, antibiotic cement hip, knee and shoulder spacers have continued to contribute to our revenue growth and are expected to remain an important part of our anticipated future revenue growth.
Our operating expenses consist of sales and marketing expenses, general and administrative expenses, research and development expenses, and depreciation expenses. The largest component of operating expenses, sales and marketing expenses primarily consists of payments made to independent sales representatives for their services to hospitals and surgeons on our behalf. These expenses tend to be variable in nature and related to sales growth. Research and development expenses primarily consist of expenditures on projects concerning knee, extremities, spine and hip implant product lines and biologic materials and services.
In marketing our products, we use a combination of traditional targeted media marketing together with our primary marketing focus, direct customer contact and service to orthopaedic surgeons. Because surgeons are the primary decision makers when it comes to the choice of products and services that best meet the needs of their patients, our marketing strategy is focused on meeting the needs of the orthopaedic surgeon community. In addition to surgeon’s preference, hospitals and buying groups, as the economic customer, are actively participating with physicians in the choice of implants and services.
Overview of 2010
Total sales increased 7% to $190.5 million during 2010 from $177.3 million in 2009. Gross profit margin increased to 66% in 2010 from 63% in 2009. International sales of $58.5 million, which represented 31% of total sales, increased 6%, as compared to $54.9 million, or 31% of total sales in 2009. Increases in operating expenses in 2010 were driven by additional expenses related to our expansion projects, including our new distribution offices in Spain and Germany. The increase was partially offset by a reduction in compliance and legal costs to $1.3 million from $7.0 million in 2009 as a result of lower costs associated with the DOJ inquiry and the fact that the DOJ settlement was accrued for in 2009. Overall, operating expenses increased 11% during 2010 resulting in income from operations increasing by 25% from 2009. Income before provision for income taxes increased 29% to $18.2 million from $14.2 million in 2009. Net income increased 26% from the prior year, equaling 5% of sales, comparable to the 5% of sales achieved in 2009.
On the balance sheet, at the end of 2010, working capital increased 17% to $86.5 million from $73.7 million in 2009. This change in working capital was due to the increased inventory levels as a result of
30
Table of Contents
our expansion efforts and accounts receivable in correlation with heightened sales. Current liabilities increased 10% to $26.1 million. The long-term liabilities increase to $48.5 million from $15.5 million at the end of 2009 is attributed to the increase in the line of credit to fund our acquisitions and costs of our start-up operations. As a result, total outstanding debt increased during 2010 to $42.8 million from $14.2 million at the end of 2009.
The following table includes the net revenue and percentage of net sales for each of our product lines for the years ended December 31, 2010, 2009 and 2008:
| Sales by Product Line | ||||||||||||||||||||||||||||||||
| (dollars in thousands)
|
| |||||||||||||||||||||||||||||||
| Year Ended | 2010-2009 | 2009-2008 | ||||||||||||||||||||||||||||||
| December 31, 2010 | December 31, 2009 | December 31, 2008 | % Change | % Change | ||||||||||||||||||||||||||||
| Knee |
$ | 76,509 | 40.1% | $ | 75,833 | 42.8% | $ | 72,629 | 44.9% | 0.9 | 4.4 | |||||||||||||||||||||
| Hip |
28,710 | 15.1 | 26,826 | 15.1 | 22,777 | 14.1 | 7.0 | 17.8 | ||||||||||||||||||||||||
| Biologics & Spine |
27,987 | 14.7 | 27,440 | 15.5 | 26,453 | 16.4 | 2.0 | 3.7 | ||||||||||||||||||||||||
| Extremities |
30,033 | 15.8 | 22,829 | 12.9 | 16,844 | 10.4 | 31.6 | 35.5 | ||||||||||||||||||||||||
| Other Products |
27,244 | 14.3 | 24,382 | 13.7 | 23,027 | 14.2 | 11.7 | 5.9 | ||||||||||||||||||||||||
| Total |
$ | 190,483 | 100.0% | $ | 177,310 | 100.0% | $ | 161,730 | 100.0% | 7.4 | 9.6 | |||||||||||||||||||||
The following table includes: (i) items from the Statements of Income for the year ended December 31, 2010 as compared to 2009, and the dollar and percentage change from year to year and the percentage relationship to net sales, and (ii) items from the Statements of Income for the year ended December 31, 2009 as compared to 2008, and the dollar and percentage change from year to year and the percentage relationship to net sales (dollars in thousands):
Comparative Statement of Income Data
| Year Ended | 2010 - 2009 | 2009 - 2008 | ||||||||||||||||||||||||||||||||||||||||||||||||
| December 31, | Incr (decr) | Incr (decr) | % of Sales | |||||||||||||||||||||||||||||||||||||||||||||||
| 2010 | 2009 | 2008 | $ | % | $ | % | 2010 | 2009 | 2008 | |||||||||||||||||||||||||||||||||||||||||
| Net sales |
190,483 | 177,310 | 161,730 | 13,173 | 7.4 | 15,580 | 9.6 | 100.0 | 100.0 | 100.0 | ||||||||||||||||||||||||||||||||||||||||
| Cost of goods sold |
63,961 | 65,002 | 58,620 | (1,041 | ) | (1.6 | ) | 6,382 | 10.9 | 33.6 | 36.7 | 36.2 | ||||||||||||||||||||||||||||||||||||||
| Gross profit |
126,522 | 112,308 | 103,110 | 14,214 | 12.7 | 9,198 | 8.9 | 66.4 | 63.3 | 63.8 | ||||||||||||||||||||||||||||||||||||||||
| Operating expenses: |
||||||||||||||||||||||||||||||||||||||||||||||||||
| Sales and marketing |
66,123 | 55,318 | 51,263 | 10,805 | 19.5 | 4,055 | 7.9 | 34.7 | 31.2 | 31.7 | ||||||||||||||||||||||||||||||||||||||||
| General and administrative |
17,622 | 21,797 | 16,471 | (4,175 | ) | (19.2 | ) | 5,326 | 32.3 | 9.2 | 12.3 | 10.2 | ||||||||||||||||||||||||||||||||||||||
| Research and development |
13,631 | 11,533 | 9,255 | 2,098 | 18.2 | 2,278 | 24.6 | 7.2 | 6.5 | 5.7 | ||||||||||||||||||||||||||||||||||||||||
| Depreciation and amortization |
10,744 | 8,930 | 7,569 | 1,814 | 20.3 | 1,361 | 18.0 | 5.6 | 5.0 | 4.7 | ||||||||||||||||||||||||||||||||||||||||
| Total operating expenses |
108,120 | 97,578 | 84,558 | 10,542 | 10.8 | 13,020 | 15.4 | 56.7 | 55.0 | 52.3 | ||||||||||||||||||||||||||||||||||||||||
| Income from operations |
18,402 | 14,730 | 18,552 | 3,672 | 24.9 | (3,822 | ) | (20.6 | ) | 9.7 | 8.3 | 11.5 | ||||||||||||||||||||||||||||||||||||||
| Other expenses, net |
(181 | ) | (558 | ) | (840 | ) | 377 | (67.6 | ) | 282 | (33.6 | ) | (0.1 | ) | (0.3 | ) | (0.5 | ) | ||||||||||||||||||||||||||||||||
| Income before taxes |
18,221 | 14,172 | 17,712 | 4,049 | 28.6 | (3,540 | ) | (20.0 | ) | 9.6 | 8.0 | 11.0 | ||||||||||||||||||||||||||||||||||||||
| Provision for income taxes |
7,756 | 5,845 | 6,521 | 1,911 | 32.7 | (676 | ) | (10.4 | ) | 4.1 | 3.3 | 4.0 | ||||||||||||||||||||||||||||||||||||||
| Income before equity in loss of other investments |
10,465 | 8,327 | 11,191 | 2,138 | 25.7 | (2,864 | ) | (25.6 | ) | 5.5 | 4.7 | 7.0 | ||||||||||||||||||||||||||||||||||||||
| Equity in loss of other investments |
— | — | (98 | ) | — | — | 98 | (100.0 | ) | — | — | (0.1 | ) | |||||||||||||||||||||||||||||||||||||
| Net income |
10,465 | 8,327 | 11,093 | 2,138 | 25.7 | (2,766 | ) | (24.9 | ) | 5.5 | 4.7 | 6.9 | ||||||||||||||||||||||||||||||||||||||
Net Sales
Net sales increased 7% to $190.5 million for the year ended 2010 from $177.3 million in 2009. Sales of knee implant products increased 1% to $76.5 million as compared to $75.8 million for 2009, as we continued the introduction of our PS Logic™ knee system. Our sales of hip implant products increased
31
Table of Contents
7% to $28.7 million as compared to $26.8 million for 2009 due to the continued interest in our expanded Novation hip system. Our extremities revenues increased 32% to $30.0 million as compared to $22.8 million for 2009 due to the continued market acceptance of our Equinoxe® shoulder replacement systems. We experienced growth of 2% in our biologic and spine services revenue to $28.0 million as compared to $27.4 million for 2009 partially due to our expanded spine product line. Sales of other products increased 12% to $27.2 million as compared to $24.4 million for 2009 as a result of sales growth of our cement and other products from our distributors. Internationally, net sales increased 6% to $58.5 million, representing 31% of total sales, from $54.9 million, also 31% of total sales, during 2009. Domestically, sales increased 8% during 2010 to $132.0 million from $122.4 million in 2009.
Net sales increased 10% to $177.3 million in 2009 from $161.7 million in 2008, as a result of increased unit sales. Our extremities revenues increased 36% to $22.8 million as compared to $16.8 million for 2008 due to continuing market penetration of our primary and reverse Equinoxe® shoulder replacement systems. We experienced growth of 4% in our biologic and spine services revenue to $27.4 million as compared to $26.5 million for 2008 due to the increase in our biologics distribution. During 2009, sales of knee implant products increased 4% to $75.8 million as compared to $72.6 million for 2008, and our sales of hip implant products increased 18% to $26.8 million as compared to $22.8 million for 2008 as we continued to experience market share gains from our expanded Novation hip system. Sales of other products increased 6% to $24.4 million as compared to $23.0 million for 2008 as a result of cement sales increases and other products from our acquired French distributor. Internationally, net sales increased 11% to $54.9 million, representing 31% of total sales, from $49.3 million, or 30% of total sales, during 2008, as we recognized a full year of sales from our acquired French distributor as compared to nine months of sales for 2008, as well as, benefited from continued increases in market share in Japan. Domestically, sales increased 9% during 2009 to $122.4 million from $112.4 million in 2008, due primarily to growth in our extremity, hip, biologics, and cement products.
Gross Profit
Gross profit increased 13% to $126.5 million in 2010 or 66% gross profit margin from $112.3 million or 63% in 2009, which is primarily due to growth in the domestic market and direct international operations with generally higher gross margin sales. Gross profit decreased in 2009 to 63% from 64% in 2008, which was principally due to a shift to more independent international business, which generally entails lower margins. We expect gross margins to expand during 2011 from 1-2%, as we expect a higher mix of direct business in our international operations, and we continue to focus on improving manufacturing efficiencies through process improvement initiatives.
Operating Expenses
Sales and marketing expenses increased 20% in 2010 from 2009, due to our growth efforts in the internationals market, which includes expenses in our new distribution subsidiaries in Germany and Spain. Sales and marketing expenses increased 8% in 2009 from 2008, primarily due to our continued support for newly launched products, distribution subsidiary expenses and increased variable selling expenses. As a percentage of sales, sales and marketing expenses were 35% for 2010, compared to 31% for 2009. We expect that sales and marketing expenses in 2011 will be slightly higher than 2010 on a percentage of sales basis as we expect these expenses to increase 15-20%.
General and administrative expenses decreased 19% in 2010 from 2009. The decrease was due to a reduction in expenses and settlement costs related to the Department of Justice inquiry. General and administrative expenses increased 32% in 2009 from 2008. This increase was principally due to the expenses we incurred during 2009 in connection with the Department of Justice inquiry. During 2011 we are anticipating approximately $5.0 million in compliance related expenses and therefore expect general and administrative expenses to increase 18-22%. See Liquidity and Capital Resources-Operating Activities later in this MD&A for further discussion of the Department of Justice inquiry.
Research and development expenses increased 18% to $13.6 million in 2010 from $11.5 million in 2009, primarily related to product development expenses related to knee system improvements, product line
32
Table of Contents
extensions in our extremities segment, and improvements in our surgical instrumentation. Research and development expenses increased 25% in 2009 from the prior year as we completed the enrollment phase of the clinical trial for the Optetrak RBK® knee system, expanded our hip product lines, completed line extensions in our biologics portfolio and advanced the product development efforts on a number of new extremity products. As a percentage of sales, research and development expenses remained at 7% for both 2010 and 2009, and increased to 7% for 2009 from 6% for 2008. As we continue to invest in ongoing development projects in all of our product segments, we expect research and development expenditures to increase between 13-17% in 2011 and continue to be in the range of 7% to 8% of total sales.
Depreciation and amortization expenses increased 20% in 2010, to $10.7 million from $8.9 million in 2009, as we invested $25.6 million in capital expenditures, including $2.8 million in facility expansion, $4.0 million to purchase manufacturing equipment, and $18.3 million in surgical instrumentation. Depreciation and amortization expenses increased 18% in 2009, to $8.9 million, as we invested $15.3 million in capital expenditures, including $2.8 million in facility expansion, $2.0 million to purchase manufacturing equipment, and $10.3 million in surgical instrumentation. Capital expenditures in 2011 are anticipated to range from $20 million to $24 million to continue to support surgical instrumentation for product launches, increased manufacturing capacity and an expansion of our distribution channels.
Income from Operations
Income from operations increased 25% to $18.4 million in 2010 from $14.7 million in 2009, which was due to the reduction in expenses related to the DOJ inquiry, and partially offset by increased expenses from our expanded operations. As a percentage of sales, income from operations increased to 10% in 2010 from 8% in 2009. Income from operations decreased 21% to $14.7 million in 2009 from $18.6 million in 2008, primarily as a result of the $7.0 million in gross charges we recorded for the DOJ inquiry and estimated settlement charges. As a percentage of sales, income from operations decreased to 8% in 2009 from 11% in 2008. See later in this Management’s Discussion and Analysis under Non-GAAP Financial Measures, for adjusted income from operations excluding the DOJ related charges and a reconciliation of income from operations excluding DOJ related charges.
Other Income and Expenses
Other expenses, net of other income, decreased 68% to $0.2 million in 2010 from $0.6 million in 2009, as interest expense decreased due to lower interest rates during the year, as well as a gain on foreign currency transactions. Other expenses, net of other income, decreased 34% to $0.6 million for 2009 from $0.8 million for 2008 primarily due to a reduction of interest expense to $0.7 million in 2009 from $1.1 million in 2008, as a result of lower borrowing on our line of credit during the year. Looking forward, we expect other expenses, net of other income, to increase as interest expense is incurred on increased anticipated borrowing under our line of credit to fund technology and expansion activity.
Taxes and Net Income
Income before provision for income taxes increased 29% in 2010 from 2009. The effective income tax rate, as a percentage of income before taxes, for 2010 was 42.6%, as compared to 41.2% in 2009. The increase in the effective rate during 2010 was primarily the result of losses incurred for the new direct sales operations that did not result in effective tax rate benefit during 2010. Income before provision for income taxes decreased 20% in 2009 from 2008. The effective income tax rate, as a percentage of income before taxes, for 2009 was 41.2%, as compared to 36.8% in 2008. The increase in the effective rate during 2009 was primarily the result of management’s assessment of lack of deductibility of certain components of the DOJ inquiry related settlement charges. In 2011, we expect the effective tax rate to be approximately 35% assuming expected benefits from our international operations activities
As a result of the foregoing, we realized an increase in net income of 26% in 2010, representing 5% of sales, and diluted earnings per share of $0.80 as compared to 5% of sales and diluted earnings per share of $0.65 in 2009. The 2009 net income decreased 25% from 2008, which was 5% of net sales and
33
Table of Contents
diluted earnings per share of $0.65 as compared to 7% of sales and diluted earnings per share of $0.87 in 2008.
Non-GAAP Financial Measures
In addition to providing results that are determined in accordance with accounting principles generally accepted in the United States, referred to as GAAP, we have provided certain financial measures that are not in accordance with GAAP. Our non-GAAP financial measures of adjusted net income and adjusted diluted earnings per share exclude the charges we incurred in relation to the DOJ inquiry, less the tax effect of the charges. Because the DOJ inquiry is a unique event, not directly related to our normal operations, we believe these non-GAAP financial measures may help investors better understand and compare our quarterly operating results and trends by eliminating this unusual component included in GAAP financial measures.
Excluding the impact of the pre-tax expenses of $1.3 million for the DOJ inquiry recognized during 2010, and $7.0 million during 2009, adjusted income from operations for the year ended December 31, 2010, decreased 9% to $19.7 million from $21.7 million adjusted income from operations during 2009. Excluding the impact of the pre-tax expenses of $1.3 million for the DOJ inquiry recognized during 2010, adjusted net income for the year ended December 31, 2010, decreased 15% to $11.3 million, as compared to an adjusted 2009 net income of $13.2 million, adjusted for elimination of the DOJ inquiry related expenses taken during 2009. Adjusted diluted earnings per share for 2010 decreased to $0.86 as compared to adjusted diluted earnings per share of $1.03 for 2009. The adjusted decreases reflect the higher costs associated with the expansion of our international direct distribution operations.
Excluding the impact of the pre-tax expenses of $7.0 million for the DOJ inquiry recognized during 2009, and $2.6 million during 2008, adjusted income from operations for the year ended December 31, 2009, increased 3% to $21.7 million from $21.2 million adjusted income from operations during 2008. Excluding the impact of the pre-tax expenses of $7.0 million for the DOJ inquiry recognized during 2009, adjusted net income for the year ended December 31, 2009, increased 5% to $13.2 million, as compared to an adjusted 2008 net income of $12.7 million, adjusted for elimination of the DOJ inquiry related expenses taken during 2008. Adjusted diluted earnings per share for 2009 increased to $1.03 as compared to adjusted diluted earnings per share of $0.99 for 2008.
The reconciliations of these non-GAAP financial measures are as follows (in thousands, except per share amounts):
| Year Ended | ||||||||||||
| December 31, | ||||||||||||
| 2010 | 2009 | 2008 | ||||||||||
| Income from operations |
$ | 18,402 | $ | 14,730 | $ | 18,552 | ||||||
| Adjustments for DOJ inquiry expenses and asset impairment charges: |
||||||||||||
| DOJ inquiry expenses, pre-tax |
1,284 | 7,018 | 2,605 | |||||||||
| Adjusted income from operations - excluding DOJ related expenses and asset impairment charges |
$ | 19,686 | $ | 21,748 | $ | 21,157 | ||||||
34
Table of Contents
| Year Ended | ||||||||||||
| December 31, | ||||||||||||
| 2010 | 2009 | 2008 | ||||||||||
| Net Income |
$ | 10,465 | $ | 8,327 | $ | 11,093 | ||||||
| Adjustments for DOJ inquiry expenses and asset impairment charges: |
||||||||||||
| DOJ inquiry expenses, pre-tax |
1,284 | 7,018 | 2,605 | |||||||||
| Income tax benefit |
(483 | ) | (2,103 | ) | (1,026 | ) | ||||||
| Adjustments, net of tax |
801 | 4,915 | 1,579 | |||||||||
| Adjusted net income - excluding DOJ related expenses and asset impairment charges |
$ | 11,266 | $ | 13,242 | $ | 12,672 | ||||||
| Diluted earnings per share |
$ | 0.80 | $ | 0.65 | $ | 0.87 | ||||||
| Adjustment of DOJ and asset impairment related expenses, net |
0.06 | 0.38 | 0.12 | |||||||||
| Adjusted diluted earnings per share |
$ | 0.86 | $ | 1.03 | $ | 0.99 | ||||||
The weighted-average diluted shares outstanding used in the calculation of these non-GAAP financial measures are the same as the weighted-average shares outstanding used in the calculation of the reported per share amounts.
Liquidity and Capital Resources
We have financed our operations through a combination of commercial debt financing, sales of equity securities and cash flows from operating activities. At December 31, 2010, we had working capital of $86.5 million, an increase of 17% from $73.7 million at the end of 2009. Working capital in 2010 increased due to the increased inventory levels we held as of December 31, 2010 to support the expansion of our international operations, and increased accounts receivable. We project that cash flows from operating activities and borrowing under our existing line of credit will be sufficient to meet our commitments and cash requirements in the following twelve months and for the foreseeable future. If not, we will seek additional funding options with any number of possible combinations of additional debt, additional equity or convertible debt. See Item 1A. Risk Factors for discussion on the capital markets.
Operating Activities
Operating activities provided net cash of $6.4 million for 2010, as compared to $26.3 million in 2009, partially as a result of an increase in total inventory of $14.3 million as compared to a decrease in inventory of $5.1 million in 2009. This decrease is a reflection of our inventory stocking for our geographic expansion and an increase in accounts receivable levels as our direct international operations gain sales momentum. Looking forward, we anticipate the inventory balance to increase modestly during the first two quarters of 2011 and then stabilize in the second half of the year due to new product releases and inventory increases in our distribution subsidiaries.
In 2010 our total accounts receivable balances increased 18% to $39.8 million from $33.8 million in 2009 and the total days sales outstanding (DSO) ratio, based on average accounts receivable balances, increased from 66 for 2009 to 70 for 2010. As we continue to expand our operations internationally, our DSO ratio could continue to increase, due to the fact that credit terms in the international community can run longer than our current DSO, and could extend to one year. Our allowance for doubtful accounts and sales return allowance at December 31, 2010, increased to $2.8 million as compared to $0.8 million at December 31, 2009, principally as a result of an estimated sales return, net of cost of goods sold, of $1.3 million related to the nonrenewal of our agreement with our Spanish independent distributor. We cannot give assurances that the transitioning to direct sales outside the U.S. will not result in a larger amount of returned products with a corresponding increase in this allowance. There have not been any significant changes in our credit terms and policies and we anticipate accounts receivable to continue to increase based on sales growth.
35
Table of Contents
Litigation
There are various claims, lawsuits, and disputes with third parties and pending actions involving various allegations against us incident to the operation of our business, principally product liability cases. We are currently a party to several product liability suits related to the products distributed by us on behalf of RTI Biologics, Inc. (“RTI”). Pursuant to our license and distribution agreement with RTI, we will tender all cases to RTI. While we believe that the various claims are without merit, we are unable to predict the ultimate outcome of such litigation. We therefore maintain insurance, subject to self-insured retention limits, for all such claims, and establish accruals for product liability and other claims based upon our experience with similar past claims, advice of counsel and the best information available. At December 31, 2010, we did not have any accruals for product liability claims. At December 31, 2009, we had $160,000 accrued for product liability claims. These matters are subject to various uncertainties, and it is possible that they may be resolved unfavorably to us. However, while it is not possible to predict with certainty the outcome of the various cases, it is the opinion of management that, upon ultimate resolution, the cases will not have a material adverse effect on our consolidated financial position, results of operations or cash flows.
Our insurance policies covering product liability claims must be renewed annually. Although we have been able to obtain insurance coverage concerning product liability claims at a cost and on other terms and conditions that are acceptable to us, we may not be able to procure acceptable policies in the future.
On December 7, 2010, we entered into a twelve-month Deferred Prosecution Agreement, or DPA, with the United States Attorney’s Office for the District of New Jersey, or the USAO, and a five year Corporate Integrity Agreement, or CIA, with the Office of the Inspector General of the United States Department of Health and Human Services. The foregoing agreements, together with a related settlement agreement, resolve the investigation commenced by the USAO in December 2007 into our consulting arrangements with orthopaedic surgeons relating to our hip and knee products in the United States, which we refer to as the Subject Matter. As set forth in the DPA, the USAO specifically acknowledges that it does not allege that our conduct adversely affected patient health or patient care. Pursuant to the DPA, the USAO has agreed not to prosecute us in connection with the Subject Matter provided that we comply with our obligations under the DPA during its term. Additionally, pursuant to the DPA, an independent monitor will review and evaluate our compliance with our obligations under the DPA. CIA acknowledges the existence of our corporate compliance program and provides us with certain other compliance-related obligations during the CIA’s term. See “Item 1A — Risk Factors” for more information about our obligations under these agreements. We continue to enhance and apply our corporate compliance program, and we monitor our practices on an ongoing basis to ensure that we have in place proper controls necessary to comply with applicable laws in the jurisdictions in which we do business. Our failure to maintain compliance with U.S. healthcare regulatory laws could expose us to significant liability including, but not limited to, extension of the term of the DPA, exclusion from federal healthcare program participation, including Medicaid and Medicare, civil and criminal fines or penalties, and additional litigation cost and expense. Pursuant to the CSA, we settled civil and administrative claims relating to the matter for a payment of $3.0 million, without any admission by the Company. We previously accrued approximately $3.5 million for an anticipated settlement and legal expenses related to this investigation, and therefore, these agreements did not materially impact our results of operations for the fourth quarter of 2010.
On October 18, 2010, MBA Incorporado, S.L., or MBA, our former distributor in Spain filed an action against Exactech, Inc. and Exactech Ibérica, S.A.U. in the Court of First Instance No. 10 of Gijon, Spain in connection with our termination of the distribution agreement with MBA in July 2010. In the lawsuit, MBA alleges, (i) wrongful solicitation of certain employees of MBA subsequent to the termination of the distribution agreement, (ii) breach of contract with respect to the termination date established by Exactech and Exactech’s alleged failure to follow the termination transitioning protocols set forth in the distribution agreement, and (iii) commercial damages and lost sales and customers due to Exactech’s alleged failure to supply products requested by MBA during the transition period of the distribution agreement termination. In the Complaint 1 filing MBA seeks damages of forty-four million (€44,000,000) Euros compensation for all benefits alleged to be owed by Exactech under the distribution agreement, including alleged loss of clientele, alleged loss of prestige and credibility, alleged loss of client confidence and alleged illegitimate business practices. On December 1, 2010, MBA filed a second action (“Complaint 2”)
36
Table of Contents
against Exactech Iberica and two of the former principals of MBA, in the Mercantile Court No. 3 of Gijon, Spain, also in connection with our termination of the distribution agreement with MBA in July 2010, seeking among other things injunctive relief. Both complaints are currently working through the legal proceedings process. While it is not possible to predict with certainty the outcome of the lawsuit, we believe that our termination of the distribution agreement with MBA was proper, all actions taken by us in connection with the termination (including during the transition period) were proper and, accordingly, the claims are without merit and subject to a number of defenses we possess. We intend to vigorously defend ourselves against these claims.
Investing Activities
Investing activities used $35.8 million of net cash during 2010, including cash outlays of approximately $24.9 million for investment in manufacturing equipment, facility expansion, and surgical instrumentation. Additionally, we expended net cash of $9.3 million for our business combinations and asset acquisition discussed below. During 2009 we used net cash of $17.9 million for investments in equipment and technology. In 2011, investment in capital acquisitions is estimated to be in the range of $16 million to $18 million to continue to support surgical instrumentation for product launches, increased manufacturing capacity and expansion of our facilities.
Acquisition of Spine Assets
Effective August 27, 2010, we acquired the inventory, instruments and design licenses for several innovative spine product lines from VertiFlex, Inc. a leading developer of minimally invasive and motion preserving spinal surgery technologies. The VertiFlex products were acquired to enhance our current product offering for minimally invasive spinal surgery procedures. We also acquired the customer list related to the acquired products. We initially paid $2.5 million in cash for these assets, with two contingent consideration payments for a potential maximum of an additional $1.0 million payable in cash. See note 9 of Notes to Consolidated Financial Statements for further discussion on these contingencies. As part of the acquisition terms of the spine assets acquired from VertiFlex, Inc., two contingent consideration payables were recorded. The first contingent consideration for $500,000 was due upon VertiFlex completing certain regulatory matters prior to the end of the year, which was completed in December 2010 and was paid. The second contingent consideration is for up to an additional $500,000 payable based on our achieving certain sales targets during the six month period following the date of close. The range of contingent earn-out payment is $150,000 for the minimum US sales and $500,000 for the maximum sales goal. We have recorded $300,000 in contingencies payable based on our estimated probability of completing the earn-out contingency measures. We paid closing fees of approximately $78,000.
Acquisition of Brighton Partners
Effective May 24, 2010, we completed the 100% acquisition of our supplier, Brighton Partners, Inc, the sole source supplier for our net compression molded (NCM) polyethylene bearings for our Optetrak® knee system. We acquired inventory of $167,000 and equipment of $270,000, and assumed $24,000 in current liabilities. Our purchase price at closing was $5.5 million dollars in cash, paid to the shareholders of Brighton in exchange for their shares of common stock in Brighton. We financed the acquisition through our existing line of credit. We acquired cash of approximately $42,000. Accounts payable to Brighton Partners related to our supplier relationship of $99,000 was eliminated at acquisition.
The acquisition of Brighton was accomplished to obtain the technology of the NCM process and to better control the supply of the product. The NCM technology and the resulting bearings are unique and critical to our Optetrak knee system. The NCM process and manufacturing technology is a closely held trade secret, and studies have shown that the product is more durable than other technology available in the market today.
We accounted for the acquisition under the Business Combinations topic of the Accounting Standards Codification. We have expensed acquisition related costs as incurred, as general and administrative expense. We have assessed the acquired assets and assumed liabilities at their estimated fair value based on the highest and best use. We identified and recognized an intangible asset for the technology
37
Table of Contents
process, which management has determined to be the principal asset acquired. We recognized a net deferred tax liability related to the differences in the tax treatment of the acquired assets. An independent valuation firm was used to assist management in determining the final appraisal values of the identifiable assets.
The following table summarizes the preliminary purchase price allocation and determination of goodwill, which is not deductible for tax purposes, as of May 2010 (in thousands):
| Total | ||||
| Consideration: |
||||
| Cash |
$ | 5,500 | ||
| Accounts payable from Exactech at closing |
(99 | ) | ||
| $ | 5,401 | |||
| Acquisition related expenses – included in general and administrative expenses in the condensed consolidated statement of income. | $ | 52 | ||
| Preliminary identifiable assets acquired and liabilities assumed |
||||
| Current assets acquired |
$ | 209 | ||
| Property and equipment acquired |
270 | |||
| Identifiable intangible assets |
4,781 | |||
| Current liabilities assumed |
(24 | ) | ||
| Deferred tax liability assumed |
(1,883 | ) | ||
| Total identifiable net assets |
3,353 | |||
| Goodwill |
2,048 | |||
| $ | 5,401 | |||
Prior to acquisition, Brighton Partners was deemed to be 24% beneficially owned by Albert H. Burstein, Ph.D., a director of the Company. Additionally, William Petty, Chairman of the Board and Chief Executive Officer of the Company, and Betty Petty, Secretary of the Company, jointly owned 4.6% of Brighton Partners. Gary J. Miller, Executive Vice President of the Company, beneficially owned 2.8% of Brighton Partners. Other executive officers of the Company owned less than 3% of Brighton Partners, Inc. No member of Exactech’s management had control over, or influenced the operations of, Brighton Partners.
We have an oral consulting agreement with Albert Burstein, Ph.D., to provide services regarding many facets of the orthopaedic industry including product design rationale, manufacturing and development techniques and product sales and marketing. This agreement is terminable at will by either party. Pursuant to this agreement, we paid Dr. Burstein $180,000 each year in 2010, 2009 and 2008, as compensation under the consulting agreement. The consulting agreement continues post acquisition.
Acquisition of Germany Assets
During the first quarter of 2010, we established a distribution subsidiary in Germany, Exactech Deutschland, GmbH. Effective April 1, 2010, we completed the acquisition of certain assets of Tantum AG, our prior independent distributor in Germany. Our purchase price at closing was approximately 1 million EUR, or $1.35 million translated at the March 31, 2010 exchange rate of $1.35 per 1.00 EUR. Consideration paid was in the form of 410,000 EUR in cash and 563,000 EUR in forgiven accounts receivable that were owed to us as of March 31, 2010. We financed the acquisition through our existing line of credit.
The acquisition and establishment of a direct distribution subsidiary in Germany was accomplished to obtain a certain hip product line and to maintain access to a large European market with an established workforce and existing customers.
We accounted for the acquisition under the Business Combinations topic of the Accounting Standards Codification. We have expensed acquisition related costs as incurred, as general and administrative
38
Table of Contents
expense. The accounting for the German acquisition is preliminary, pending final valuation assessment of acquired assets based on the highest and best use. We have identified and recognized an intangible asset for the customer relationships acquired.
The following table summarizes the preliminary purchase price allocation and determination of goodwill, which is not deductible for tax purposes, as of April 2010 (in thousands):
| Total | ||||
| Consideration: | ||||
| Cash | $ | 556 | ||
| Offset of accounts receivable from Tantum at closing | 760 | |||
| $ | 1,316 | |||
| Acquisition related expenses – included in general and administrative expenses in the condensed consolidated statement of income. |
$ | 62 | ||
| Preliminary identifiable assets acquired and liabilities assumed |
||||
| Current assets acquired |
$ | 101 | ||
| Instrumentation acquired |
327 | |||
| Identifiable intangible assets |
193 | |||
| Total identifiable net assets |
621 | |||
| Goodwill |
695 | |||
| $ | 1,316 | |||
Acquisition of France Medica
Effective April 1, 2008, we completed the acquisition of our French distributor, France Medica. A portion of the purchase price was a contingent purchase price supplement of between 1.2 million EUR and 1.7 million EUR, or $1.8 million and $2.7 million, payable to certain shareholders of France Medica over a two year period, if certain sales results were achieved in each of the annual periods. If the conditional terms are not met, the supplemental payment to some shareholders can be reduced by up to 50%. In July 2008, we paid $1.5 million of the supplement payments. During 2009, we paid an additional $386,000 of supplement payments, of which $234,000 was previously held in escrow. In May 2009 we transferred an additional 180,000 EUR, or $248,000, of supplement payments into an escrow fund in lieu of transferring the funds directly to the former shareholder, which will be used to fulfill the terms of one of the guarantees discussed below. In March 2010, we recorded an additional 153,000 EUR, or $207,000, for the final supplement payment. During April 2010, we paid the final supplement payment of $404,000. In addition to the purchase price supplement, two former shareholders of France Medica made guarantees against future claims for damages resulting from certain events prior to the acquisition date. Under these guarantees, 570,000 EUR, or $890,000, was withheld from the cash purchase price and an escrow fund was established. An additional escrow fund of 180,000 EUR, or $248,000, was established in May 2009 upon disbursement of contingent price supplement funds discussed above. The funds in the escrow agreements will be distributed in three annual installments on July 1, 2009, 2010 and 2011, less any deductions for damages. During 2010 and 2009, we paid the first two installments of the guarantee from the escrow funds for $356,000 and $234,000, respectively. As of December 31, 2010, the escrow funds are recorded at the translated amount of $383,000, based on the exchange rate as of the end of December of $1.31 per 1.00 EUR. The remaining escrow fund is recorded as a long-term asset on our consolidated balance sheets, until the obligation to the former shareholder is determined beyond a reasonable doubt. Amounts paid out under these contingencies were added to the cost of acquisition when they were determinable with certainty.
During 2010, we recorded $563,000 for additional purchase price supplements and guarantee reimbursement payable, offset by a foreign currency translation effect of $147,000, for a 2010 adjustment to goodwill of $416,000. As of December 31, 2010, we have recognized additional goodwill of $1.0 million for
39
Table of Contents
the purchase price supplement liability and the guarantee reimbursement, based on terms of the agreement and currency translation effect of $290,000, for adjustment to goodwill of $752,000.
New Subsidiaries
Exactech Iberica
During the first quarter of 2010, we established a distribution subsidiary in Spain, Exactech Iberica, S.A.. (“Exactech Iberica”), and commenced distributing our products directly in the third quarter of 2010. The sales distribution subsidiary, based in Gijon, enables us to directly control our Spanish marketing and distribution operations. We have obtained our import registration to allow Exactech Iberica to import our products for sale in Spain and actively commenced distribution activities during the third quarter. During the first quarter of 2010, we notified our existing independent distributor in Spain of the non-renewal of our distribution agreement. As a result of that non-renewal, our relationship terminated during the third quarter of 2010. We expect a return of product from the former distributor, and as a result we reduced our 2010 reported net sales by $3.2 million, and recorded a corresponding sales return allowance of $1.3 million against accounts receivable on the consolidated balance sheet.
Exactech International Operations
During 2010, we established an international sales office in Switzerland, to manage the international sales and marketing efforts for our foreign subsidiaries. In January 2011, we renamed our international sales office to Exactech International Operations, AG (“EIO”), and relocated the office to Bern, Switzerland, as part of a plan to realign our foreign subsidiaries and operations. The equity ownership of our foreign subsidiaries, with the exception of our Chinese operations, was transferred to EIO. EIO also acquired certain licenses to our intangibles to allow the use of our intellectual property outside the U.S. These actions have been undertaken to streamline and consolidate our international operations with the expectation of achieving improved customer service, cost savings, and international tax efficiency.
License technology
Our Taiwanese subsidiary, Exactech Taiwan, has entered into a license agreement with the Industrial Technology Research Institute (ITRI) and the National Taiwan University Hospital (NTUH) for the rights to technology and patents related to the repair of cartilage lesions. As of December 31, 2010, we have paid approximately $1.5 million for the licenses, patents, and equipment related to this license agreement, and we will make royalty payments when the technology becomes marketable. Using the technology, we plan to launch a cartilage repair program that will include a device and method for the treatment and repair of cartilage in the knee joint. It is expected that the project will require us to complete human clinical trials under the guidance of the Food & Drug Administration in order to obtain pre-market approval for the device in the United States. The agreement terms include a license fee based on the achievement of specific, regulatory milestones and a royalty arrangement based on sales once regulatory clearances are established.
Financing Activities
Financing activities provided net cash of $30.6 million during 2010, as compared to net cash used of $8.8 million during 2009. During 2010 we received proceeds of $2.0 million from the issuance of common stock. We used the proceeds to fund capital expenditures. During 2010, we had net borrowings under our credit line of $29.8 million, as compared to net repayments of $7.0 million for 2009. Our commercial debt facilities decreased in 2010 by $1.2 million as a result of repayments during the year.
Long-term Debt
On June 13, 2008, we entered into a revolving credit agreement for an aggregate principal amount of $40 million, referred to as the Credit Agreement with SunTrust Bank, a Georgia banking corporation, or SunTrust, as administrative agent and swingline lender and potential other lenders. The credit agreement was originally composed of a revolving credit line in an amount equal to $25 million between us and SunTrust, and a revolving credit line in an amount equal to $15 million between us and Compass Bank, an Alabama banking corporation, or Compass. Included in the credit agreement is a swingline note for $3 million, whereby excess bank account cash balance is swept into the swingline to reduce the outstanding
40
Table of Contents
balance. Interest on the notes consists of annual LIBOR, adjusted monthly, and an applicable margin, ranging from 1.25 % to 2.00%, based on a ratio of funded debt to EBITDA. The Credit Agreement has a five year term and the lending commitments under it terminate on June 13, 2013, with the swingline commitment terminating and all outstanding amounts thereunder due in full one week prior to the revolver note. The obligations under the Credit Agreement have been guaranteed by the domestic subsidiaries of the Company under the terms of a subsidiary guarantee and are secured by a security interest granted in substantially all of the assets of the Company and its domestic subsidiaries to the lenders party to the Credit Agreement. The outstanding balance under the Credit Agreement may be prepaid at any time without premiums or penalties. Upon an event of default the commitment will be terminated, all principal and interest will be payable immediately and begin to accrue interest at a default rate equal to the applicable rate in effect plus five percentage points. The Credit Agreement includes certain covenants and terms that place certain restrictions on our ability to incur additional debt, incur additional liens, engage in certain investments, effect certain mergers, declare or pay dividends, effect certain sales of assets, or engage in certain transactions with affiliates, sale and leaseback transactions, hedging agreements, or capital expenditures. Additionally, there are restrictions against us using the proceeds borrowed under this facility for funding our foreign subsidiaries unless such foreign subsidiaries are included in the facility by virtue of execution of a subsidiary guarantee or pledge of the capital stock of such foreign subsidiary. We are also subject to several financial covenants regarding the ratio of its debt to EBITDA and fixed charge coverage ratio.
On November 10, 2010, we entered into an amendment to the Credit Agreement. The amendment provides us with an accordion facility that permits us to increase the revolver commitment available by an amount up to $15 million, provided that aggregate commitments available under the Credit Agreement may not exceed $55 million. Interest on the accordion facility accrues at an applicable margin between 2.35% and 2.50% above the LIBOR rate at the time of exercising the accordion. Additionally, the amendment amends certain terms of the Credit Agreement in respect to the calculation of the fixed charge coverage ratio as well as covenants relating to the our ability to effect transactions involving our subsidiaries. We paid aggregate closing costs of $172,000 for the Credit Agreement and amendment, which we are expensing over the life of the Credit Agreement. Additional administrative fees will be due and expensed each fiscal quarter based on a percentage of the unused revolver balance. As of December 31, 2010, there was $37.6 million outstanding under the revolving line of credit bearing an interest rate of 1.8%.
In September 2002, we entered into a long-term commercial construction loan of up to $4.2 million, bearing interest at a rate equal to one month LIBOR plus 1.5%, with a local lending institution, secured by an existing letter of credit, to fund the expansion of our corporate facility. At December 31, 2010, there was $2.5 million outstanding under this loan bearing a variable rate of interest equal to 1.8%. In September 2005, we entered into a long-term loan of up to $3.0 million, bearing interest at a rate of one month LIBOR plus 1.75% with a minimum rate equal to 5.6%, with a local lending institution for purposes of acquiring equipment for our remodeled manufacturing facility expansion. At December 31, 2010, $0.4 million was outstanding under this loan bearing a variable rate of interest equal to 5.6%. In October 2005, we entered into a long-term commercial real estate loan of $4.0 million, bearing interest at a rate of one month LIBOR plus 1.53%, with a local lending institution to recapture costs of improvements to our existing real estate facilities and restructure portions of existing working capital debt. This variable rate debt was fixed at 6.6% interest by entering into an interest swap agreement as a cash flow hedge. At December 31, 2010, there was $2.3 million outstanding under this loan.
Our credit facility and other loans contain customary affirmative and negative covenants including certain financial covenants with respect to our consolidated net worth, interest and debt coverage ratios and limits on capital expenditures, dividends, debt incurrence and liens in addition to other restrictions. We were in compliance with such covenants at December 31, 2010.
Other Commitments
At December 31, 2010, we had outstanding commitments for the purchase of inventory, raw materials and supplies of $14.8 million and outstanding commitments for the purchase of capital equipment of $7.3 million. Purchases under our distribution agreements were $8.7 million, $8.9 million, and $7.9 million in 2010, 2009, and 2008, respectively.
41
Table of Contents
As of December 31, 2010, we recorded a contingent liability of $980,000 based on the estimated weighted probability of the outcome of a claim by the State of Florida for sales and use tax, based on the State’s audit of such tax dating back to May 2005, which was assessed by the State of Florida for the value of surgical instruments removed from inventory and capitalized as property and equipment worldwide. In consultation with counsel, management is challenging the assessment; however, there can be no assurances that we will ultimately prevail in our challenge against the assessment. In evaluating the liability, management followed the FASB guidance on contingencies, and concluded that the contingent liability is probable, based on verbal assertions by Florida Department of Revenue personnel, and can be reasonably estimated, however if we are unsuccessful in our challenge against the State of Florida, we could have a maximum potential liability of $2.4 million for the tax period audited through December 31, 2010. Any use tax determined to be due and payable to the Florida Department of Revenue will increase the basis of the surgical instruments and this amount will be amortized over the remaining useful life of the instruments.
Contractual Obligations and Commercial Commitments
The following table sets forth our contractual obligations at December 31, 2010 (in thousands):
|
Payments Due by Period |
||||||||||||||||||||
| Contractual Obligations | Total | 2011 | 2012-2013 | 2014-2015 | Thereafter | |||||||||||||||
| Commercial construction loan |
2,515 | 210 | 420 | 420 | 1,465 | |||||||||||||||
| Commercial equipment loans |
443 | 443 | — | — | — | |||||||||||||||
| Commercial real estate loan |
2,261 | 413 | 912 | 936 | — | |||||||||||||||
| Line of credit |
37,556 | — | 37,556 | — | — | |||||||||||||||
| Interest on long-term debt (1) |
2,235 | 844 | 1,189 | 113 | 89 | |||||||||||||||
| Operating leases |
3,421 | 1,187 | 1,545 | 501 | 188 | |||||||||||||||
| Other long-term obligations(2) |
406 | 67 | 339 | — | — | |||||||||||||||
| Purchase obligations |
22,156 | 22,156 | — | — | — | |||||||||||||||
| $ | 70,993 | $ | 25,320 | $ | 41,961 | $ | 1,970 | $ | 1,742 | |||||||||||
|
|
||||||||||||||||||||
| (1) |
Based on outstanding balances, term dates and interest rates on our variable rate debt at December 31, 2010, we have made certain estimates to forecast our payments of interest on our outstanding debt. We assume relatively stable interest rates, full payment of our debt instruments by due dates, and no additional lending other than under our line of credit. This estimate is subject to uncertainty due to the variable nature of the interest rates and revolving nature of our line of credit. Should interest rates vary significantly, our estimate could be materially different from actual results. | |
| (2) |
Other long-term obligations include long-term liabilities assumed as a part of our acquisitions during 2008. | |
Off-Balance Sheet Arrangements
At December 31, 2010, we did not have any off-balance-sheet financing arrangements or any unconsolidated, special purpose entities.
Critical Accounting Policies and Estimates
Management’s Discussion and Analysis of Financial Condition and Results of Operations contained in this Annual Report on Form 10-K is based on our consolidated financial statements, which have been prepared in accordance with accounting principles generally accepted in the United States of America. The preparation of these financial statements requires management to make estimates and judgments that affect the reported amounts of assets, liabilities, revenues and expenses and related disclosure of contingent assets and liabilities. Our significant accounting policies are discussed in Note 2 of Notes to Consolidated Financial Statements included in this report. In management’s opinion, our critical accounting policies include allowance for doubtful accounts, excess and obsolete inventories, intangible assets, subsidiary consolidation, accrued liabilities, stock-based compensation, and provision for income taxes.
42
Table of Contents
Allowance for Doubtful Accounts and Sales Returns – Our accounts receivable consist primarily of amounts due from hospitals and international distributors. Amounts due from international distributors carry longer payment terms than domestic customers, typically due in 90 days. We typically perform credit evaluations on our customers and generally do not require collateral. We generally invoice sales to international distributors in U.S. dollars and we are not subject to significant currency exchange rate risk on accounts receivable from international distributors although we do have exchange rate risk in receivables of our international subsidiaries. We maintain an allowance for doubtful accounts to estimate the losses due to the inability to collect required payment from our customers for products and services rendered. In calculating the allowance, we utilize a model that ages the accounts receivable and applies a progressively higher allowance percentage, based upon our historical experience with balances written-off as uncollectible, to each tier of receivables past due terms. Should the financial condition of our customers deteriorate, resulting in an impairment of their ability to pay, additional allowances may be required which would affect our future operating results due to increased expenses for the resulting uncollectible bad debt. We grant sales returns on a case by case basis. We calculate an allowance for returns based upon an analysis of our historical sales return experience. At December 31, 2010, our allowance for doubtful accounts was $1.3 million as compared to $669,000 at December 31, 2009, which increased as a result of an allowance for the uncollectible amount of $764,000 of accounts receivable due from our prior Spanish independent distributor. As a percentage of accounts receivable, the allowance increased to 3.3% as compared to 2.0% at the prior year end. At December 31, 2010, our allowance for sales returns was $1.4 million as compared to $166,000 at December 31, 2009, as a result of an estimated sales return, net of cost of goods sold, of $1.3 million related to the nonrenewal of our agreement with our Spanish independent distributor. We cannot give assurances that the transitioning to direct sales outside the U.S. will not result in a larger amount of returned products with a corresponding increase in this allowance.
Revenue Recognition – We recognize revenue on our domestic sales and sales from our international subsidiaries upon notification from our sales agents that a product or service has been implanted in a patient customer. As this implantation represents delivery of our products and services without any right of return, we do not maintain an allowance for sales returns. For sales to international independent distributors, revenue is recognized upon shipment as title, risk and rewards of ownership pass to the buyer and there typically are no contractual rights of return granted or post shipment obligations. We estimate an allowance for sales returns on our international customers based upon an analysis of our prior returns experience. We continually evaluate new and current customers for collectability based on various factors including, past history with the customer, evaluation of their credit worthiness, and current economic conditions.
Excess and Obsolete Inventories – Inventories are valued at the lower of cost or market and include implants consigned to customers and agents. We also provide significant loaned implant inventory to non-distributor customers. The consigned or loaned inventory remains our inventory until we are notified of the implantation. We are also required to maintain substantial levels of inventory as it is necessary to maintain all sizes of each component to fill customer orders. The size of the component to be used for a specific patient is typically not known with certainty until the time of surgery. Due to this uncertainty, a minimum of one of each size of each component in the system to be used must be available to each sales representative at the time of surgery. As a result of the need to maintain substantial levels of inventory, we are subject to the risk of inventory obsolescence. In the event that a substantial portion of our inventory becomes obsolete, it would have a material adverse effect on the company. Charges for obsolete and slow moving inventories are recorded based upon an analysis of specific identification of obsolete inventory items and quantification of slow moving inventory items. For slow moving inventory, this analysis compares the quantity of inventory on hand to the projected sales of such inventory items. As a result of this analysis, we record an estimated charge for slow moving inventory in the form of an inventory impairment that increases cost of goods sold and decreases gross profit. In circumstances, when the obsolete or slow moving inventory subsequently experiences increased sales and inventory that was previously impaired is sold, cost of goods sold is decreased and gross profit is increased. Charges for the years ended December 31, 2010, 2009, and 2008 were $804,000, $219,000, and $1.9 million, respectively. We also test our inventory levels for the amount of inventory that would be sold within one year. At certain times, as we stock new subsidiaries, add consignment locations, and launch new products, the level of inventory can exceed the forecasted level of cost of goods sold for the next twelve
43
Table of Contents
months. As of December 31, 2010, we determined that $9.2 million of inventory should be classified as non-current. As of December 31, 2009, we had no inventory classified as non-current.
Goodwill and Other Intangible Assets – We assess the value of goodwill and other intangibles in accordance with guidance from the Financial Accounting Standards Board, or FASB. Goodwill is not amortized but is evaluated for impairment, as of October 1 each year, or sooner if an event occurs that would more likely than not reduce the fair value of a reporting unit. In testing goodwill for impairment, we compare the carrying value of goodwill to its fair value, using a discounted cash flow method of valuation. In determining the fair value of goodwill, we make assumptions regarding estimated future cash flows based on our estimated future net sales and operating expenses, as well as our estimated growth, as a result of projected market penetration and general economic conditions. We initially allocate goodwill to the reporting units based on estimated future sales of the reporting units. We allocate and test goodwill for impairment on a reporting unit level, which is aligned with our product lines and the way that our management analyzes and reviews the discrete financial information. Changes to these estimates could cause an impairment of goodwill to occur. In assessing the value of other intangible assets, we make assumptions regarding the estimated future cash flows, economic life and other factors to determine fair value of the respective assets. If these estimates or assumptions change in the future, we may be required to record an impairment charge for these assets. We analyze our other intangible assets for impairment issues on a quarterly and annual basis, if required.
Subsidiary Consolidation – Our wholly owned subsidiaries, Exactech Asia, Exactech (UK), Ltd, Exactech Japan, France Medica, Exactech Iberica, Exactech Deutschland, and Exactech Taiwan are fully consolidated after all material intercompany transactions and balances have been eliminated.
Accrued Liabilities – We are subject to various claims, lawsuits, disputes with third parties and actions involving various allegations against us incident to the operation of our business, principally product liability claims. We accrue liabilities for such claims that are deemed to be probable and reasonably estimable based upon our experience with similar past claims, advice of counsel and the best information available. If one or both of these criteria are not met, we disclose the loss contingency if it is reasonably possible that a loss may be incurred. Should the outcome of any pending, threatened, or future litigation have an outcome unfavorable to us, it may affect future operating results due to the resulting increases in operating expenses associated with such litigation. As of December 31, 2010, we have accrued charges of approximately $980,000 for an estimate of the outcome of a claim by the State of Florida for sales and use tax, based on the State’s audit of such tax dating back to May 2005, which was assessed by the State of Florida in December 2010, for the value of surgical instruments removed from inventory and capitalized as property and equipment worldwide.
Provision for Income Taxes – We must use estimates and professional judgment in calculating the provision for income taxes in determining the deductibility and technical merit of the positions taken on our tax returns. In accordance with FASB guidance, we evaluate our tax positions each reporting period to determine if they are more-likely-than-not to be sustained upon examination, and measure the benefit to be recognized in the financial statements. Should any of our tax positions be determined to be uncertain, it may result in an increase in current and/or future taxes due.
The FASB guidance prescribes a recognition threshold and a measurement attribute for the financial statement recognition and measurement of tax positions taken or expected to be taken in a tax return. For those benefits to be recognized, a tax position must be more-likely-than-not to be sustained upon examination by taxing authorities. The amount recognized is measured as the largest amount of benefit that is greater than 50 percent likely of being realized upon ultimate settlement. As of December 31, 2010, we have recorded a contingent liability of $238,000 for management’s estimate of federal and state taxes on an uncertain tax position as to the deductibility of a portion of the payment made for the settlement agreement with the DOJ. Our policy is to recognize interest and penalties accrued on uncertain tax positions as part of income tax expense. For the year ended December 31, 2010, no estimated interest or penalties were recognized for the uncertain tax positions. We file income tax returns in the United States, various states, and foreign jurisdictions. Tax years 2007 and forward remain open to examination under United States statutes of limitation.
44
Table of Contents
Stock-Based Compensation Policies and Estimates – We account for stock-based compensation granted to our directors and employees in accordance with guidance issued by the FASB, which requires companies to measure the cost of employee services received in exchange for an award of equity instruments based on the grant-date fair value of the award. We are required to recognize the compensation cost of the fair value of our stock-based compensation granted to employees and directors. For stock-based compensation granted to non-employees, we re-measure the fair value of stock awards until a measurement date is achieved.
Our Executive Incentive Compensation Plan provides for issuance of stock-based compensation, including the grant of stock, stock appreciation rights, stock options, and other stock-based compensation. Under the plan, the exercise price of option awards equals the market price of our stock on the date of grant. At the discretion of the Compensation Committee of our Board of Directors, option awards granted to employees have typically vested in equal increments over a three to five-year period starting on the first anniversary of the date of grant. An option’s maximum term is ten years. The compensation cost that has been charged against income for the incentive compensation plans was $2.0 million, $1.1 million, and $1.1 million and income tax benefit of $90,000, $154,000, and $142,000 for the years ended December 31, 2010, 2009, and 2008, respectively.
Recent Accounting Pronouncements
See Note 2 of Notes to Consolidated Financial Statements for information concerning recent accounting pronouncements.
45
Table of Contents
ITEM 7A. QUANTITATIVE AND QUALITATIVE DISCLOSURES ABOUT MARKET RISK
We are exposed to market risk from interest rates. For our cash and cash equivalents, a change in interest rates affects the amount of interest income that can be earned. For our debt instruments, changes in interest rates affect the amount of interest expense incurred.
The following table sets forth information about our financial instruments that are sensitive to changes in interest rates. If our variable rates of interest experienced an upward increase of 1%, our debt service would increase approximately $8,000 for 2011. The amounts presented approximate the financial instruments’ fair market value as of December 31, 2010, and the weighted average interest rates are those experienced during the fiscal year ended December 31, 2010 (in thousands, except percentages):
| 2011 | 2012 | 2013 | 2014 | Thereafter | Total | |||||||||||||||||||
| Liabilities |
||||||||||||||||||||||||
| Commercial construction loan at variable interest rate |
$ | 210 | $ | 210 | $ | 210 | $ | 210 | $ | 1,675 | $ | 2,515 | ||||||||||||
| Weighted average interest rate |
1.8 | % | ||||||||||||||||||||||
| Commercial equipment loan at variable interest rate |
443 | — | — | — | — | 443 | ||||||||||||||||||
| Weighted average interest rate |
5.6 | % | ||||||||||||||||||||||
| Commercial real estate loan at fixed rate swap |
413 | 441 | 471 | 503 | 433 | 2,261 | ||||||||||||||||||
| Weighted average interest rate |
6.6 | % | ||||||||||||||||||||||
| Line of credit at variable interest rate |
— | — | 37,556 | — | — | 37,556 | ||||||||||||||||||
| Weighted average interest rate |
1.6 | % | ||||||||||||||||||||||
We are exposed to market risk related to changes in foreign currency exchange rates. The functional currency of substantially all of our international subsidiaries is the local currency. Transactions are translated into U.S. dollars and exchange gains and losses arising from translation are recognized in “Other comprehensive income (loss)”. Fluctuations in exchange rates affect our financial position and results of operations. The majority of our foreign currency exposure is to the Euro (EUR), Pound Sterling (GBP), and Japanese Yen (JPY). During the year ended December 31, 2010, translation losses were $1.1 million, which were primarily due to the fluctuation in exchange rates and the weakening of the EUR in the first half of 2010. During the year ended December 31, 2009, translation losses were $520,000, which were due to the weakening of the dollar and partially offset by our change in the functional currency for our subsidiary in the United Kingdom, Exactech UK, effective January 1, 2009. Due to the expansion of this subsidiary and the predominance of activity in GBP, we revalued the financial assets and liabilities of Exactech UK, and converted their functional currency to their local currency, the GBP. The revaluation resulted in a translation loss adjustment to other comprehensive income (loss) of $736,000 as of January 1, 2009.
In connection with some agreements, we are subject to risk associated with international currency exchange rates on purchases of inventory payable in Euros. At present, we do not hedge our exposure or invest in international currency derivatives. The U.S. dollar is considered our primary currency, and transactions that are completed in an international currency are translated into U.S. dollars and recorded in the financial statements. Foreign currency transaction gains for 2010 and 2009 were $391,000 and $60,000, respectively, primarily due to the effect of our European expansion and the strengthening of the Euro as compared to the U.S. dollar. Foreign currency transaction losses for 2008 were $229,000, primarily due to the strength of the Euro as compared to the U.S. dollar. We do not believe we are currently exposed to any material risk of loss due to exchange rate risk exposure.
46
Table of Contents
ITEM 8. FINANCIAL STATEMENTS AND SUPPLEMENTARY DATA
47
Table of Contents
REPORT OF INDEPENDENT REGISTERED PUBLIC ACCOUNTING FIRM
To the Board of Directors and Shareholders of
Exactech, Inc.
We have audited the consolidated balance sheets of Exactech, Inc. and subsidiaries (the “Company”) as of December 31, 2010 and 2009, and the related consolidated statements of income, changes in shareholders’ equity and comprehensive income, and cash flows for each of the three years in the period ended December 31, 2010. Our audits also included the financial statement schedule of the Company listed in Item 15(e). These financial statements and financial statement schedule are the responsibility of the Company’s management. Our responsibility is to express an opinion on these financial statements based on our audits.
We conducted our audits in accordance with the standards of the Public Company Accounting Oversight Board (United States). Those standards require that we plan and perform the audit to obtain reasonable assurance about whether the financial statements are free of material misstatement. An audit includes examining, on a test basis, evidence supporting the amounts and disclosures in the financial statements. An audit also includes assessing the accounting principles used and significant estimates made by management, as well as evaluating the overall financial statement presentation. We believe that our audits provide a reasonable basis for our opinion.
In our opinion, the consolidated financial statements referred to above present fairly, in all material respects, the financial position of Exactech, Inc. and subsidiaries as of December 31, 2010 and 2009, and the results of their operations and their cash flows for each of the three years ended December 31, 2010, in conformity with U.S. generally accepted accounting principles. Also, in our opinion, the related financial statement schedule, when considered in relation to the basic consolidated financial statements taken as a whole, presents fairly, in all material respects, the information set forth therein.
We have also audited, in accordance with the standards of the Public Company Accounting Oversight Board (United States), the Company’s internal control over financial reporting as of December 31, 2010, based on criteria established in Internal Control—Integrated Framework issued by the Committee of Sponsoring Organizations of the Treadway Commission (COSO) and our report dated March 15, 2011 expressed an unqualified opinion on the effectiveness of the Company’s internal control over financial reporting.
/s/ McGladrey & Pullen, LLP
Charlotte, North Carolina
March 15, 2011
48
Table of Contents
EXACTECH, INC. AND SUBSIDIARIES
CONSOLIDATED BALANCE SHEETS
As of December 31, 2010 and 2009
(in thousands, except share and per share amounts)
| 2010 | 2009 | |||||||
| ASSETS |
||||||||
| CURRENT ASSETS: |
||||||||
| Cash and cash equivalents |
$ | 3,935 | $ | 2,889 | ||||
| Trade receivables, net of allowances of $2,751 and $835 |
39,796 | 33,753 | ||||||
| Prepaid expenses and other assets, net |
3,384 | 2,317 | ||||||
| Income taxes receivable |
1,544 | 389 | ||||||
| Inventories, current |
61,602 | 56,417 | ||||||
| Deferred tax assets |
2,278 | 1,703 | ||||||
| Total current assets |
112,539 | 97,468 | ||||||
| PROPERTY AND EQUIPMENT: |
||||||||
| Land |
2,210 | 1,895 | ||||||
| Machinery and equipment |
27,155 | 24,322 | ||||||
| Surgical instruments |
60,077 | 43,713 | ||||||
| Furniture and fixtures |
3,583 | 3,051 | ||||||
| Facilities |
16,365 | 15,517 | ||||||
| Projects in process |
3,669 | 1,024 | ||||||
| Total property and equipment |
113,059 | 89,522 | ||||||
| Accumulated depreciation |
(44,377 | ) | (37,150 | ) | ||||
| Net property and equipment |
68,682 | 52,372 | ||||||
| OTHER ASSETS: |
||||||||
| Deferred financing and deposits, net |
881 | 1,159 | ||||||
| Non-current inventories |
9,191 | — | ||||||
| Product licenses and designs, net |
11,812 | 6,225 | ||||||
| Patents and trademarks, net |
1,938 | 2,057 | ||||||
| Customer relationships, net |
2,003 | 1,928 | ||||||
| Goodwill |
12,947 | 9,811 | ||||||
| Total other assets |
38,772 | 21,180 | ||||||
| TOTAL ASSETS |
$ | 219,993 | $ | 171,020 | ||||
| LIABILITIES AND SHAREHOLDERS’ EQUITY |
||||||||
| CURRENT LIABILITIES: |
||||||||
| Accounts payable |
$ | 15,855 | $ | 9,306 | ||||
| Income taxes payable |
— | 525 | ||||||
| Accrued expenses |
8,847 | 11,370 | ||||||
| Other current liabilities |
296 | 1,354 | ||||||
| Current portion of long-term debt |
1,066 | 1,190 | ||||||
| Total current liabilities |
26,064 | 23,745 | ||||||
| LONG-TERM LIABILITIES: |
||||||||
| Deferred tax liabilities |
6,175 | 1,989 | ||||||
| Line of credit |
37,556 | 7,794 | ||||||
| Long-term debt, net of current portion |
4,153 | 5,221 | ||||||
| Other long-term liabilities |
629 | 518 | ||||||
| Total long-term liabilities |
48,513 | 15,522 | ||||||
| Total liabilities |
74,577 | 39,267 | ||||||
| COMMITMENTS AND CONTINGENCIES (Notes 5, 9 and 11) |
||||||||
| SHAREHOLDERS’ EQUITY: |
||||||||
| Common stock, $.01 par value; 30,000,000 shares authorized, 13,028,024 and 12,823,778 shares issued and outstanding |
130 | 128 | ||||||
| Additional paid-in capital |
57,735 | 53,475 | ||||||
| Accumulated other comprehensive loss, net of tax |
(2,525 | ) | (1,461 | ) | ||||
| Retained earnings |
90,076 | 79,611 | ||||||
| Total shareholders’ equity |
145,416 | 131,753 | ||||||
| TOTAL LIABILITIES AND SHAREHOLDERS’ EQUITY |
$ | 219,993 | $ | 171,020 | ||||
See notes to consolidated financial statements
49
Table of Contents
EXACTECH, INC. AND SUBSIDIARIES
CONSOLIDATED STATEMENTS OF INCOME
FOR THE YEARS ENDED DECEMBER 31, 2010, 2009 and 2008
(in thousands, except per share amounts)
| 2010 | 2009 | 2008 | ||||||||||
| NET SALES |
$ | 190,483 | $ | 177,310 | $ | 161,730 | ||||||
| COST OF GOODS SOLD |
63,961 | 65,002 | 58,620 | |||||||||
| Gross profit |
126,522 | 112,308 | 103,110 | |||||||||
| OPERATING EXPENSES: |
||||||||||||
| Sales and marketing |
66,123 | 55,318 | 51,263 | |||||||||
| General and administrative |
17,622 | 21,797 | 16,471 | |||||||||
| Research and development |
13,631 | 11,533 | 9,255 | |||||||||
| Depreciation and amortization |
10,744 | 8,930 | 7,569 | |||||||||
| Total operating expenses |
108,120 | 97,578 | 84,558 | |||||||||
| INCOME FROM OPERATIONS |
18,402 | 14,730 | 18,552 | |||||||||
| OTHER INCOME (EXPENSE): |
||||||||||||
| Interest income |
5 | 13 | 14 | |||||||||
| Interest expense |
(641 | ) | (696 | ) | (1,110 | ) | ||||||
| Other income (expense) |
64 | 65 | 485 | |||||||||
| Foreign currency exchange gain (loss) |
391 | 60 | (229 | ) | ||||||||
| Total other expenses |
(181 | ) | (558 | ) | (840 | ) | ||||||
| INCOME BEFORE INCOME TAXES |
18,221 | 14,172 | 17,712 | |||||||||
| PROVISION FOR INCOME TAXES |
||||||||||||
| Current |
5,836 | 5,351 | 4,717 | |||||||||
| Deferred |
1,920 | 494 | 1,804 | |||||||||
| Total provision for income taxes |
7,756 | 5,845 | 6,521 | |||||||||
| INCOME BEFORE EQUITY IN NET LOSS OF OTHER INVESTMENTS |
10,465 | 8,327 | 11,191 | |||||||||
| EQUITY IN NET LOSS OF OTHER INVESTMENTS |
— | — | (98 | ) | ||||||||
| NET INCOME |
$ | 10,465 | $ | 8,327 | $ | 11,093 | ||||||
| BASIC EARNINGS PER SHARE |
$ | 0.81 | $ | 0.65 | $ | 0.90 | ||||||
| DILUTED EARNINGS PER SHARE |
$ | 0.80 | $ | 0.65 | $ | 0.87 | ||||||
See notes to consolidated financial statements
50
Table of Contents
EXACTECH, INC. AND SUBSIDIARIES
CONSOLIDATED STATEMENTS OF CHANGES IN SHAREHOLDERS’ EQUITY
AND COMPREHENSIVE INCOME
FOR THE YEARS ENDED DECEMBER 31, 2010, 2009 and 2008
(in thousands)
| Common Stock | Additional Paid-In |
Retained | Accumulated Other Comprehensive |
Total Shareholders’ |
||||||||||||||||||||
| Shares | Amount | Capital | Earnings | Income (Loss) | Equity | |||||||||||||||||||
| Balance, December 31, 2007 |
11,611 | $ | 116 | $ | 27,388 | $ | 60,191 | $ | (57 | ) | $ | 87,638 | ||||||||||||
|
Exercise of stock options |
70 | 1 | 668 | — | — | 669 | ||||||||||||||||||
| Issuance of common stock for acquisitions |
114 | 1 | 2,540 | — | — | 2,541 | ||||||||||||||||||
| Issuance of common stock upon public offering |
877 | 9 | 18,668 | — | — | 18,677 | ||||||||||||||||||
| Issuance of common stock under Employee Stock Purchase Plan |
29 | — | 484 | — | — | 484 | ||||||||||||||||||
| Compensation cost of stock options |
— | — | 1,088 | — | — | 1,088 | ||||||||||||||||||
| Tax benefit from exercise of stock awards |
— | — | 387 | — | — | 387 | ||||||||||||||||||
| Comprehensive Income: |
||||||||||||||||||||||||
| Net income |
— | — | — | 11,093 | — | 11,093 | ||||||||||||||||||
| Change in fair value of cash flow hedge, net of tax |
— | — | — | — | (157 | ) | (157 | ) | ||||||||||||||||
| Change in currency translation |
— | — | — | — | (805 | ) | (805 | ) | ||||||||||||||||
| Other comprehensive loss |
(962 | ) | ||||||||||||||||||||||
| Comprehensive income |
10,131 | |||||||||||||||||||||||
| Balance, December 31, 2008 |
12,701 | $ | 127 | $ | 51,223 | $ | 71,284 | $ | (1,019 | ) | $ | 121,615 | ||||||||||||
|
Exercise of stock options |
62 | 1 | 395 | — | — | 396 | ||||||||||||||||||
| Issuance of restricted common stock for services |
14 | — | 209 | — | — | 209 | ||||||||||||||||||
| Issuance of common stock under Employee Stock Purchase Plan |
47 | — | 538 | — | — | 538 | ||||||||||||||||||
| Compensation cost of stock options |
— | — | 1,108 | — | — | 1,108 | ||||||||||||||||||
| Tax benefit from exercise of stock awards |
— | — | 2 | — | — | 2 | ||||||||||||||||||
| Comprehensive Income: |
||||||||||||||||||||||||
| Net income |
— | — | — | 8,327 | — | 8,327 | ||||||||||||||||||
| Change in fair value of cash flow hedge, net of tax |
— | — | — | — | 78 | 78 | ||||||||||||||||||
| Change in currency translation |
— | — | — | — | (520 | ) | (520 | ) | ||||||||||||||||
| Other comprehensive loss |
(442 | ) | ||||||||||||||||||||||
| Comprehensive income |
7,885 | |||||||||||||||||||||||
| Balance, December 31, 2009 |
12,824 | $ | 128 | $ | 53,475 | $ | 79,611 | $ | (1,461 | ) | $ | 131,753 | ||||||||||||
|
Exercise of stock options |
157 | 2 | 1,463 | — | — | 1,465 | ||||||||||||||||||
| Issuance of restricted common stock for services |
10 | — | 167 | — | — | 167 | ||||||||||||||||||
| Issuance of common stock under Employee Stock Purchase Plan |
37 | — | 536 | — | — | 536 | ||||||||||||||||||
| Compensation cost of stock options |
— | — | 1,989 | — | — | 1,989 | ||||||||||||||||||
|
Tax benefit from exercise of stock awards |
— | — | 105 | — | — | 105 | ||||||||||||||||||
| Comprehensive Income: |
||||||||||||||||||||||||
| Net income |
— | — | — | 10,465 | — | 10,465 | ||||||||||||||||||
| Change in fair value of cash flow hedge, net of tax |
— | — | — | — | 2 | 2 | ||||||||||||||||||
| Change in currency translation |
— | — | — | — | (1,066 | ) | (1,066 | ) | ||||||||||||||||
| Other comprehensive loss |
(1,064 | ) | ||||||||||||||||||||||
| Comprehensive income |
9,401 | |||||||||||||||||||||||
| Balance, December 31, 2010 |
13,028 | $ | 130 | $ | 57,735 | $ | 90,076 | $ | (2,525 | ) | $ | 145,416 | ||||||||||||
See notes to consolidated financial statements
51
Table of Contents
EXACTECH, INC. AND SUBSIDIARIES
CONSOLIDATED STATEMENTS OF CASH FLOWS
FOR THE YEARS ENDED DECEMBER 31, 2010, 2009 and 2008
(in thousands)
| 2010 | 2009 | 2008 | ||||||||||
| OPERATING ACTIVITIES: |
||||||||||||
| Net income |
$ | 10,465 | $ | 8,327 | $ | 11,093 | ||||||
| Adjustments to reconcile net income to net cash provided by (used in) operating activities: |
||||||||||||
| Provision for allowance for doubtful accounts and sales returns |
1,916 | (171 | ) | 113 | ||||||||
| Inventory allowance |
804 | 219 | 1,860 | |||||||||
| Depreciation and amortization |
12,234 | 10,205 | 8,524 | |||||||||
| Restricted common stock issued for services |
167 | 209 | — | |||||||||
| Compensation cost of stock awards |
1,989 | 1,108 | 1,088 | |||||||||
| Tax benefit from exercise of stock options |
105 | 2 | 387 | |||||||||
| Excess tax benefit from exercise of stock options |
(105 | ) | (2 | ) | (387 | ) | ||||||
| Loss on disposal of equipment |
467 | 336 | 237 | |||||||||
| Loss on impairment |
1,063 | — | — | |||||||||
| Forward currency option gain |
— | — | (485 | ) | ||||||||
| Foreign currency exchange (gain) loss |
(391 | ) | (60 | ) | 229 | |||||||
| Equity in net loss of other investments |
— | — | 98 | |||||||||
| Deferred income taxes |
1,920 | 494 | 1,804 | |||||||||
| Changes in assets and liabilities which provided (used) cash: |
||||||||||||
| Accounts receivable |
(8,922 | ) | (1,927 | ) | (3,151 | ) | ||||||
| Prepaids and other assets |
(1,108 | ) | 442 | (769 | ) | |||||||
| Inventories |
(14,279 | ) | 5,057 | (13,043 | ) | |||||||
| Accounts payable |
7,017 | (4,230 | ) | (209 | ) | |||||||
| Income taxes receivable/payable |
(1,670 | ) | 253 | (193 | ) | |||||||
| Accrued expense and other liabilities |
(5,251 | ) | 6,015 | (2,306 | ) | |||||||
| Net cash provided by operating activities |
6,421 | 26,277 | 4,890 | |||||||||
| INVESTING ACTIVITIES: |
||||||||||||
| Investment in forward currency option |
— | — | 609 | |||||||||
| Investment in license technology |
— | — | (1,372 | ) | ||||||||
| Investment in escrow fund |
— | (23 | ) | (890 | ) | |||||||
| Purchase of product licenses and designs |
(1,486 | ) | (2,127 | ) | (484 | ) | ||||||
| Purchase of spine assets |
(3,078 | ) | — | — | ||||||||
| Purchases of property and equipment |
(24,891 | ) | (15,301 | ) | (16,089 | ) | ||||||
| Cost of patents and trademarks |
(167 | ) | (85 | ) | (21 | ) | ||||||
| Proceeds from sale of property and equipment |
3 | — | 46 | |||||||||
| Acquisitions of subsidiaries, net of cash acquired |
(6,218 | ) | (386 | ) | (12,385 | ) | ||||||
| Net cash used in investing activities |
(35,837 | ) | (17,922 | ) | (30,586 | ) | ||||||
| FINANCING ACTIVITIES: |
||||||||||||
| Net borrowings (repayments) on line of credit |
29,761 | (7,008 | ) | 8,814 | ||||||||
| Principal payments on debt |
(1,191 | ) | (2,614 | ) | (1,646 | ) | ||||||
| Debt issuance costs |
(108 | ) | (76 | ) | (183 | ) | ||||||
| Excess tax benefit from exercise of stock options |
105 | 2 | 387 | |||||||||
| Proceeds from issuance of common stock |
2,001 | 934 | 19,830 | |||||||||
| Net cash provided by (used in) financing activities |
30,568 | (8,762 | ) | 27,202 | ||||||||
| Effect of foreign currency translation on cash and cash equivalents |
(106 | ) | 11 | (259 | ) | |||||||
| NET INCREASE (DECREASE) IN CASH AND CASH EQUIVALENTS |
1,046 | (396 | ) | 1,247 | ||||||||
| CASH AND CASH EQUIVALENTS, BEGINNING OF PERIOD |
2,889 | 3,285 | 2,038 | |||||||||
| CASH AND CASH EQUIVALENTS, END OF PERIOD |
$ | 3,935 | $ | 2,889 | $ | 3,285 | ||||||
| SUPPLEMENTAL DISCLOSURES OF CASH FLOW INFORMATION: |
||||||||||||
| Cash paid during the period for: |
||||||||||||
| Interest |
$ | 499 | $ | 548 | $ | 941 | ||||||
| Income taxes |
8,081 | 5,608 | 4,806 | |||||||||
| Noncash investing and financing activities: |
||||||||||||
| Conversion of note receivable for acquisition |
$ | — | $ | — | $ | 4,394 | ||||||
| Issuance of securities for acquisitions |
— | — | 2,541 | |||||||||
| Purchase price supplement payable |
— | 209 | 402 | |||||||||
| Cash flow hedge, net of tax expense |
2 | 78 | (157 | ) | ||||||||
| Estimated sales and use tax liability |
705 | 275 | — | |||||||||
| Spine assets purchase contingency payable |
300 | — | — | |||||||||
See notes to consolidated financial statements
52
Table of Contents
NOTES TO CONSOLIDATED FINANCIAL STATEMENTS
YEARS ENDED DECEMBER 31, 2010, 2009 AND 2008
1. ORGANIZATION
Exactech, Inc. designs, manufactures, markets and distributes orthopaedic implant devices including knee, hip, and extremity joint replacement systems, bone allograft materials, spinal implant systems, surgical instrumentation, and bone cement and accessories, primarily used by medical specialists for surgical procedures to repair damaged and/or diseased joints. We are headquartered in Gainesville, Florida with our principal market in the United States; however, we distribute our products in more than thirty international markets through a network of independent distributors and wholly owned subsidiaries. In China, we market our products through Exactech Asia, in the United Kingdom through Exactech (UK), Ltd., in Japan through Exactech KK, and in France through France Medica. In 2010, we began direct sales operations in Spain through Exactech Iberica and in Germany through Exactech Deutschland.
2. SUMMARY OF SIGNIFICANT ACCOUNTING POLICIES
Principles of Consolidation – The consolidated financial statements include the accounts of Exactech, Inc. and its subsidiaries. Our subsidiary Exactech Spine, formerly Altiva Corporation, was included in the consolidated financial statements as of its acquisition date, January 2, 2008. Our subsidiary France Medica, has been included in the consolidated financial statements as of its acquisition date, April 1, 2008. Our subsidiary Exactech Iberica, has been included in the consolidated financial statements as of the date of its start-up, January 2010. Our subsidiary Exactech Deutschland, has been included in the consolidated financial statements as of the date of its start-up, April 1, 2010. Our subsidiary Brighton Partners, has been included in the consolidated financial statements as of its acquisition date, May 24, 2010. References in this document to “Exactech”, “the Company”, “us”, “we”, or “our”, refers to Exactech, Inc. and its subsidiaries on a consolidated basis unless the context requires otherwise. All material intercompany transactions and balances have been eliminated in consolidation.
Reclassification – Certain amounts reported for prior periods have been reclassified to be consistent with the current period presentation. No reclassification on the consolidated financial statements had a material impact on the presentation.
Use of Estimates – The preparation of financial statements in conformity with accounting principles generally accepted in the United States of America requires management to make estimates and assumptions that affect the reported amounts of assets and liabilities and disclosure of contingent assets and liabilities at the date of the financial statements and reported amounts of revenue and expenses during the reporting period. Actual results could differ materially from those estimates.
Cash and Cash Equivalents – Cash and cash equivalents consist of cash on deposit in financial institutions, institutional money funds, overnight repurchase agreements and other short-term investments with a maturity of 90 days or less at the time of purchase.
Concentration of Credit Risk – Our cash and cash equivalents are maintained at several financial institutions, and the balances with these financial institutions often exceed the amount of insurance provided on such accounts by the Federal Deposit Insurance Corporation. The cash and cash equivalents generally are maintained with financial institutions with reputable credit, and therefore bear minimal risk. Historically, we have not experienced any losses due to such concentration of credit risk.
53
Table of Contents
Our accounts receivable consist primarily of amounts due from hospitals. Amounts due from international distributors carry longer payment terms than domestic customers, typically due in 90 days. We typically perform credit evaluations on our customers and generally do not require collateral. We generally invoice sales to independent international distributors in U.S. dollars; however, our international subsidiaries mainly invoice sales in their respective functional currencies, which make our accounts receivable subject to currency exchange rate risk. We maintain an allowance for doubtful accounts to estimate the losses due to the inability to collect required payment from our customers for products and services rendered. In calculating the allowance, we utilize a model that ages the accounts receivable and applies a progressively higher allowance percentage, based upon our historical experience with balances written-off as uncollectible, to each tier of past due receivables.
Financial Instruments – Our financial instruments include cash and cash equivalents, trade receivables, debt and cash flow hedges. The carrying amounts of cash and cash equivalents, and trade receivables approximate fair value due to their short maturities. The carrying amount of debt approximates fair value due to the variable rate associated with the debt. The fair values of cash flow hedges are based on dealer quotes.
Inventories – Inventories are valued at the lower of cost or market and include implants consigned to customers and agents. We also provide significant loaned implant inventory to non-distributor customers. The consigned or loaned inventory remains our inventory until we are notified of the implantation. We are also required to maintain substantial levels of inventory as it is necessary to maintain all sizes of each component to fill customer orders. The size of the component to be used for a specific patient is typically not known with certainty until the time of surgery. Due to this uncertainty, a minimum of one of each size of each component in the system to be used must be available to each sales representative at the time of surgery. As a result of the need to maintain substantial levels of inventory, we are subject to the risk of inventory obsolescence. In the event that a substantial portion of our inventory becomes obsolete, it would have a material adverse effect on the company. Charges for obsolete and slow moving inventories are recorded based upon an analysis of specific identification of obsolete inventory items and quantification of slow moving inventory items. For slow moving inventory, this analysis compares the quantity of inventory on hand to the projected sales of such inventory items. As a result of this analysis, we record an estimated charge for slow moving inventory in the form of an inventory impairment that increases cost of goods sold and decreases gross profit. In circumstances, when the obsolete or slow moving inventory subsequently experiences increased sales and inventory that was previously impaired is sold, cost of goods sold is decreased and gross profit is increased. Charges for the years ended December 31, 2010, 2009, and 2008 were $804,000, $219,000, and $1.9 million, respectively. We also test our inventory levels for the amount of inventory that would be sold within one year. At certain times, as we stock new subsidiaries, add consignment locations, and launch new products, the level of inventory can exceed the forecasted level of cost of goods sold for the next twelve months. As of December 31, 2010, we determined that $9.2 million of inventory should be classified as non-current. As of December 31, 2009, we had no inventory classified as non-current.
The following table summarizes inventory classification as of December 31, (in thousands):
| 2010 | 2009 | |||||||||
| Raw materials |
$ | 17,180 | $ | 17,893 | ||||||
| Work in process |
1,192 | 821 | ||||||||
| Finished goods on hand |
24,268 | 13,661 | ||||||||
| Finished goods on loan/consignment |
28,153 | 24,042 | ||||||||
| Inventory total |
70,793 | 56,417 | ||||||||
| Non-current inventories |
9,191 | — | ||||||||
| Inventories, current |
$ | 61,602 | $ | 56,417 | ||||||
54
Table of Contents
Property and Equipment – Property and equipment is stated at cost less accumulated depreciation. Depreciation expense is computed using the straight-line method over estimated useful lives of the related assets: for machinery and equipment, five years, for surgical instrumentation, seven years, for furniture and fixtures, five years, and for facilities, thirty-nine years. Depreciation expense for the years ended December 31, 2010, 2009 and 2008 was $10.9 million, $9.0 million, and $7.7 million, respectively. Included in depreciation expense, is depreciation on manufacturing equipment, which is expensed to cost of goods sold. Depreciation expense on our surgical instruments is for our instruments that we use both internally and loan to our domestic customers for their use, and is expensed as an operating expense. Maintenance and repairs are charged to expense as incurred.
Management reviews property and equipment for impairment on a quarterly basis or whenever events or changes in circumstances indicate that the carrying amount of an asset may not be recoverable. Impairment is measured by comparing the carrying amount of the asset to the sum of expected future cash flows (undiscounted and without interest charges) resulting from use of the asset and its eventual disposition.
Revenue Recognition – For sales through U.S. sales agents and our international subsidiaries, revenue is recognized upon notification from our sales agent that a product or service has been implanted in a patient customer. As this implantation represents delivery of our products and services without any right of return, we recognize the associated revenue accordingly. Our U.S. sales agents are generally present at the time the product is implanted in a patient and are therefore aware of all sales, including the use of products maintained by non-distributor customers. For sales to international independent distributors, revenue is recognized upon shipment as title, risk and rewards of ownership pass to the buyer and there typically are no contractual rights of return granted or post shipment obligations. As sales returns are granted on a case by case basis, we provide for an allowance for returns based upon an analysis of our prior returns experience. At December 31, 2010 and 2009, our allowance for sales returns was $1.4 million and $166,000, respectively. See Note 5 – Exactech Iberica for further discussion on the increase in the sales return allowance. Prices for international sales are fixed, and there are no incentives or contingent discounts offered. Shipping costs are recognized in cost of sales as incurred.
Shipping and Handling Costs – Our shipping and handling costs for shipments of our product to our customers, independent distributors and subsidiaries, are included in cost of goods sold. All shipping and handling charges that are billed to customers are included in net sales. All other shipping and handling costs are included in operating expenses.
Deferred Financing Costs – Deferred financing costs of $271,000 and $274,000 are stated net of amortization of $100,000 and $111,000 at December 31, 2010 and 2009, respectively. These costs are amortized to interest expense over the expected life of the underlying debt using the straight line method, which approximates the effective interest method of amortization.
Goodwill and Other Intangible Assets – We assess the value of goodwill and other intangibles in accordance with guidance from the Financial Accounting Standards Board, or FASB. Goodwill is not amortized but is evaluated for impairment, as of October 1 each year, or sooner if an event occurs that would more likely than not reduce the fair value of a reporting unit. In testing goodwill for impairment, we compare the carrying value of goodwill to its implied fair value, using a discounted cash flow method of valuation. In determining the implied fair value of goodwill, we make assumptions regarding estimated future cash flows based on our estimated future net sales and operating expenses, as well as our estimated growth, as a result of projected market penetration and general economic conditions. We initially allocate goodwill to the reporting units based on estimated future sales of the reporting units. We allocate and test goodwill for impairment on a reporting unit level, which is aligned with our product lines and the way that our management analyzes and reviews the discrete financial information. Changes to these estimates could cause an impairment of goodwill to occur. In assessing the value of other intangible assets, we make assumptions regarding the estimated future cash flows, economic life and other factors to determine fair value of the respective assets. If these estimates or assumptions change in the future, we may be required to record an
55
Table of Contents
impairment charge for these assets. We analyze our other intangible assets for impairment issues on a quarterly and annual basis, if required.
Income Taxes – Deferred income taxes are provided with respect to temporary differences that arise from certain transactions being reported for financial statement purposes in different periods than for income tax purposes. Deferred tax assets and liabilities are recognized using an asset and liability approach and are based on differences between financial statement and tax bases of assets and liabilities using presently enacted tax rates. Deferred tax assets are reduced by a valuation allowance when, in the opinion of management, it is more-likely-than-not that some portion or all of the deferred tax assets will not be realized. Deferred tax assets and liabilities are adjusted for the effects of the changes in tax laws and rates on the date of enactment.
When tax returns are filed, it is highly certain that some positions taken would be sustained upon examination by the taxing authorities, while others are subject to uncertainty about the merits of the position taken or the amount of the position that would be ultimately sustained. The benefit of a tax position is recognized in the financial statements in the period during which, based on all available evidence, management believes it is more-likely-than-not that the position will be sustained upon examination, including the resolution of appeals or litigation processes, if any. Tax positions taken are not offset or aggregated with other positions. Tax positions that meet the more-likely-than-not recognition threshold are measured as the largest amount of tax benefit that is more than 50 percent likely of being realized upon settlement with the applicable taxing authority. The portion of the benefits associated with tax positions taken that exceeds the amount measured as described above is reflected as a liability for unrecognized tax benefits in the accompanying consolidated balance sheets along with any associated interest and penalties that would be payable to the taxing authorities upon examination, if any.
Interest and penalties associated with unrecognized tax benefits are classified as additional income taxes in the consolidated statements of income.
Other Taxes – Taxes assessed by a governmental authority that are imposed concurrent with our revenue transactions with customers are presented on a net basis in our consolidated statements of income.
Accrued Expenses – Accrued expenses as of December 31, 2010 and 2009 consist of the following (in thousands):
|
2010 |
2009 | |||||||||
| Commissions payable |
$ | 3,088 | $ | 3,104 | ||||||
| Compensation payable |
3,254 | 2,878 | ||||||||
| Royalties payable |
1,023 | 1,387 | ||||||||
| Contingencies payable |
1,280 | 209 | ||||||||
| DOJ inquiry related accruals |
— | 3,522 | ||||||||
| Miscellaneous accrued expenses |
202 | 270 | ||||||||
| $ | 8,847 | $ | 11,370 | |||||||
Research and Development – Research and development costs are expensed in the period incurred.
Earnings Per Share – Basic earnings per common share are calculated by dividing net income by the average number of common shares outstanding during the year. Diluted earnings per common share is calculated by adjusting outstanding shares, assuming conversion of all potentially dilutive stock options.
56
Table of Contents
Options and Stock Awards – We account for stock-based compensation granted to our directors and employees in accordance with guidance issued by the FASB. The guidance requires companies to measure the cost of employee services received in exchange for an award of equity instruments based on the grant-date fair value of the award, eliminating the alternative use of the intrinsic value method. The guidance requires the recognition to compensation cost of the fair value of our stock-based compensation granted to employees and directors.
For stock-based compensation granted to non-employees we re-measure the fair value of stock awards until a measurement date is achieved.
Our Executive Incentive Compensation Plan provides for issuance of stock-based compensation, including the grant of stock, stock appreciation rights, stock options, and other stock-based compensation. Under the plan, the exercise price of option awards equals the market price of our stock on the date of grant. At the discretion of the Compensation Committee of our Board of Directors, option awards granted to employees have typically vested in equal increments over a three to five-year period starting on the first anniversary of the date of grant. An option’s maximum term is ten years. See Note 11 – Common Shareholders’ Equity for additional information regarding our stock option awards, including the employee stock purchase plan, or ESPP.
Hedging Activities – Exactech accounts for its derivative hedging activities in accordance with guidance issued by the FASB. The guidance requires that all hedging activities be recognized in the balance sheet as assets or liabilities and be measured at fair value. Gains or losses from the change in fair value of hedging instruments that qualify for hedge accounting are recorded in other comprehensive income or loss. Our policy is to specifically identify the assets, liabilities or future commitments being hedged and monitor the hedge to determine if it continues to be effective. We analyze the effectiveness of our interest rate swap on a quarterly basis, and have determined the interest rate swap to be effective. We do not enter into or hold derivative instruments for trading or speculative purposes. The fair value of our interest rate swap agreement is based on dealer quotes, and includes an adjustment for nonperformance risk. The change in fair value is recorded as accumulated other comprehensive loss in the consolidated balance sheets at $134,000 and $136,000 as of December 31, 2010 and 2009, respectively.
In November 2007, we purchased a forward currency call option, granting us the right to purchase 6.0 million EUR at a strike price of 1.4689. The forward currency call option expired in March 2008. We paid a premium of $196,000, which we recorded as a current asset on our consolidated balance sheets and adjusted to the fair value of the forward option based on dealer quotes. For the year ended December 31, 2007, we recorded a loss of $72,000 on the consolidated statements of income. For the year ended December 31, 2008, we recorded a gain of $485,000. Upon expiration we received proceeds of $609,000 for the forward currency option.
Foreign Currency Translation – We are exposed to market risk related to changes in foreign currency exchange rates. The functional currency of substantially all of our international subsidiaries is the local currency. Transactions are translated into U.S. dollars and exchange gains and losses arising from translation are recognized in “Other comprehensive income (loss)”. Fluctuations in exchange rates affect our financial position and results of operations. The majority of our foreign currency exposure is to the Euro (EUR), British Pound (GBP), and Japanese Yen (JPY). During the year ended December 31, 2010, translation losses were $1.1 million, which were primarily due to the fluctuation in exchange rates and the weakening of the EUR in the first half of 2010. During the year ended December 31, 2009, translation losses were $520,000, which were due to the weakening of the dollar and partially offset by our change in the functional currency for our subsidiary in the United Kingdom, Exactech UK, effective January 1, 2009. Due to the expansion of this subsidiary and the predominance of activity in GBP, we revalued the financial assets and liabilities of Exactech UK, and converted their functional currency to their local currency, the GBP. The revaluation resulted in a translation loss adjustment to other comprehensive income (loss) of $736,000 as of January 1, 2009. We may experience translation gains and losses during the year ending December 31, 2011; however, these gains and losses are not expected to have a material effect on our financial position,
57
Table of Contents
results of operations, or cash flows. Gains and losses resulting from our transactions and our subsidiaries’ transactions, which are made in currencies different from their own, are included in income as they occur and as other income (expense) in the Consolidated Statements of Income. We recognized currency transaction gains of $391,000 and $60,000 for 2010 and 2009, respectively. We recognized a currency transaction loss of $229,000 in 2008.
Other Comprehensive Income (Loss) – Other comprehensive income (loss) is comprised of unrealized gains or losses from the change in fair value of certain derivative instruments that qualify for hedge accounting, and for foreign currency translation effects. The following table provides information on the components of our other comprehensive loss (in thousands):
|
Cash Flow |
Foreign Currency Translation |
Total |
||||||||||||
| Balance December 31, 2008 |
$ | (214 | ) | $ | (805 | ) | $ | (1,019 | ) | |||||
| Currency revaluation |
— | (736 | ) | (736 | ) | |||||||||
| 2009 Adjustments |
78 | 216 | 294 | |||||||||||
| Balance December 31, 2009 |
$ | (136 | ) | $ | (1,325 | ) | $ | (1,461 | ) | |||||
| 2010 Adjustments |
2 | (1,066 | ) | (1,064 | ) | |||||||||
| Balance December 31, 2010 |
$ | (134 | ) | $ | (2,391 | ) | $ | (2,525 | ) | |||||
New Accounting Pronouncements – In February 2010, the FASB, issued changes to the guidance related to subsequent events to alleviate potential conflicts with current Securities and Exchange Commission (SEC) guidance. These changes remove the requirement that an SEC filer disclose the date through which it has evaluated subsequent events. This guidance was effective immediately. The adoption of this guidance did not have a material impact on our financial condition and results of operations.
In January 2010, the FASB issued guidance that requires entities to make new disclosures about recurring or nonrecurring fair value measurements of assets and liabilities, including the amounts and reasons for significant transfers between Level 1 and Level 2 measurements, and disclosures on purchases, sales, issuances and settlements on Level 3 measurements. The FASB also clarified the existing fair-value measurement disclosure guidance about the level of disaggregation of assets and liabilities, and inputs and valuation techniques used in measuring fair-value. Except for certain detailed Level 3 disclosures, which are effective for fiscal years beginning after December 15, 2010 and interim periods within those years, the new guidance became effective for interim reporting periods beginning after December 15, 2009. The adoption of this guidance did not have a material impact on our financial condition and results of operations.
3. FAIR VALUE MEASURES
Our financial instruments include cash and cash equivalents, trade receivables, debt and cash flow hedges. The carrying amounts of cash and cash equivalents, and trade receivables approximate fair value due to their short maturities. The carrying amount of debt approximates fair value due to the variable rate associated with the debt. The fair values of cash flow hedges are based on dealer quotes.
Certain financial assets and liabilities are accounted for at fair value, which is defined as the price that would be received to sell an asset or paid to transfer a liability in an orderly transaction between market participants at the measurement date. The following fair value hierarchy prioritizes the inputs used to measure fair value:
Level 1 – Quoted prices are available in active markets for identical assets or liabilities as of the reporting date. Active markets are those in which transactions for the asset or liability occur in sufficient frequency and volume to provide pricing information on an ongoing basis.
58
Table of Contents
Level 2 – Pricing inputs are other than quoted prices in active markets included in level 1, which are either directly or indirectly observable as of the reporting date. Level 2 includes those financial instruments that are valued using models or other valuation methodologies.
Level 3 – Pricing inputs include significant inputs that are generally less observable from objective sources. These inputs may be used with internally developed methodologies that result in management’s best estimate of fair value from the perspective of a market participant.
The table below provides information on our liabilities that are measured at fair value on a recurring basis:
| (In Thousands) | Total Fair Value | Quoted Prices in Active Markets (Level 1) |
Significant Other Observable Inputs (Level 2) |
Significant Unobservable Inputs (Level 3) |
||||||||||||
| At December 31, 2010 |
||||||||||||||||
| Interest Rate Swap |
$ | 220 | $ | — | $ | 220 | $ | — | ||||||||
| At December 31, 2009 |
||||||||||||||||
| Interest Rate Swap |
$ | 224 | $ | — | $ | 224 | $ | — | ||||||||
The fair value of our interest rate swap agreement is based on dealer quotes, and is recorded as accumulated other comprehensive loss in the consolidated balance sheets. We analyze the effectiveness of our interest rate swap on a quarterly basis, and for the year ended December 31, 2010, we have determined the interest rate swap to be effective.
4. GOODWILL AND OTHER INTANGIBLE ASSETS
Goodwill – The following table provides the changes to the carrying value of goodwill for the years ended December 31, 2010 and 2009 (in thousands):
| Knee | Hip | Biologics and Spine |
Extremities | Other | Total | |||||||||||||||||||
| Balance as of January 1, 2009 |
$ | 926 | $ | 220 | $ | 7,553 | $ | 248 | $ | 609 | $ | 9,556 | ||||||||||||
| Acquired goodwill |
98 | 22 | — | 25 | 70 | 215 | ||||||||||||||||||
| Foreign currency translation effects |
18 | 4 | — | 5 | 13 | 40 | ||||||||||||||||||
| Balance as of December 31, 2009 |
1,042 | 246 | 7,553 | 278 | 692 | 9,811 | ||||||||||||||||||
| Acquired goodwill |
2,606 | 379 | — | 134 | 184 | 3,303 | ||||||||||||||||||
| Foreign currency translation effects |
(76 | ) | (24 | ) | — | (19 | ) | (48 | ) | (167 | ) | |||||||||||||
| Balance as of December 31, 2010 |
$ | 3,572 | $ | 601 | $ | 7,553 | $ | 393 | $ | 828 | $ | 12,947 | ||||||||||||
During the fourth quarter of 2010 we tested goodwill for impairment, and based on our evaluation, we did not identify any impairment in our analysis of the goodwill acquired in our Chinese subsidiary, Exactech Asia, our French subsidiary, France Medica, or Exactech Spine.
59
Table of Contents
Other Intangible Assets – The following tables summarize our carrying values of our other intangible assets at December 31, 2010 and 2009 (in thousands):
| Carrying
Value |
Accumulated
Amortization |
Net Carrying
Value |
Weighted Avg
Amortization Period |
|||||||||||||
| Balance at December 31, 2010 |
||||||||||||||||
| Product licenses and designs |
$ | 13,967 | $ | 2,155 | $ | 11,812 | 10.7 | |||||||||
| Customer relationships |
3,109 | 1,106 | 2,003 | 7.0 | ||||||||||||
| Patents and trademarks |
4,092 | 2,154 | 1,938 | 12.9 | ||||||||||||
| Balance at December 31, 2009 |
||||||||||||||||
| Product licenses and designs |
$ | 7,736 | $ | 1,511 | $ | 6,225 | 9.1 | |||||||||
| Customer relationships |
2,649 | 721 | 1,928 | 7.0 | ||||||||||||
| Patents and trademarks |
3,913 | 1,856 | 2,057 | 13.3 | ||||||||||||
Our Product licenses and designs are amortized on a straight-line basis over their estimated useful lives ranging from five to twenty years. Customer relationships are amortized on a straight-line basis over their estimated useful lives of six to seven years. Patents and trademarks are amortized on a straight-line basis over their estimated useful lives ranging from five to seventeen years. We recognized amortization expense on our intangible assets of $1.4 million, $1.2 million, and $797,000 for the three years ended December 31, 2010, 2009 and 2008, respectively. The following table provides information for the estimated amortization by year for our amortizable intangible assets (in thousands):
|
Year ending December 31, |
||||||||||||||||||||||
| 2011 | 2012 | 2013 | 2014 | 2015 | ||||||||||||||||||
| Product licenses and designs |
$ | 1,406 | $ | 1,374 | $ | 1,307 | $ | 1,170 | $ | 1,084 | ||||||||||||
| Customer relationships |
449 | 449 | 449 | 449 | 115 | |||||||||||||||||
| Patents and trademarks |
314 | 302 | 251 | 234 | 208 | |||||||||||||||||
As a part of our acquisition of Altiva in 2008, we acquired a license in development with NAS medical. In December 2010, we impaired the spine product license for its entire net carrying value of $1.1 million, as a result of an updated analysis of estimated sales that were significantly lower than previous forecasts due to the delay in the commercialization and the lack of an acceptable inventory part resulting from our decision to abandon development of the project during the 4th quarter of 2010. The impairment loss is included in the research and development section of the Consolidated Statements of Income.
5. ACQUISTIONS
Acquisition of Spine Assets
Effective August 27, 2010, we acquired the inventory, instruments and design licenses for several innovative spine product lines from VertiFlex, Inc., a leading developer of minimally invasive and motion preserving spinal surgery technologies. The VertiFlex products were acquired to enhance our current product offering for minimally invasive spinal surgery procedures. We also acquired the customer list related to the acquired products. We initially paid $2.5 million in cash for these assets, with two contingent consideration payments for a potential maximum of an additional $1.0 million payable in cash. See note 9 for further discussion on these contingencies. As part of the acquisition terms of the spine assets acquired from VertiFlex, Inc., two contingent consideration payables were recorded. The first contingent consideration for $500,000 was due upon VertiFlex completing certain regulatory matters prior to the end of the year, which was completed in December 2010 and was paid. The second contingent consideration is for up to an additional $500,000 payable based on our
60
Table of Contents
achieving certain sales targets during the six month period following the date of close. The range of contingent earn-out payment is $150,000 for the minimum US sales and $500,000 for the maximum sales goal. We have recorded $300,000 in contingencies payable based on our estimated probability of completing the earn-out contingency measures. We paid closing fees of approximately $78,000.
Acquisition of Brighton Partners
Effective May 24, 2010, we completed the 100% acquisition of our supplier, Brighton Partners, Inc., the sole source supplier for our net compression molded (NCM) polyethylene bearings for our Optetrak® knee system. We acquired inventory of $167,000 and equipment of $270,000, and assumed $24,000 in current liabilities. Our purchase price at closing was $5.5 million dollars in cash, paid to the shareholders of Brighton in exchange for their shares of common stock in Brighton. We financed the acquisition through our existing line of credit. We acquired cash of approximately $42,000. Accounts payable of $99,000 to Brighton Partners related to our supplier relationship was eliminated at acquisition. Pro forma revenue and earnings for the business combination have not been presented because the effects, both individually and in the aggregate, were not material to our results of operations.
The acquisition of Brighton was accomplished to obtain the technology of the NCM process and to better control the supply of the product. The NCM technology and the resulting bearings are unique and critical to our Optetrak knee system. The NCM process and manufacturing technology is a closely held trade secret, and studies have shown that the product is more durable than other technology available in the market today.
We accounted for the acquisition under the Business Combinations topic of the Accounting Standards Codification. We have expensed acquisition related costs as incurred, as general and administrative expense. We have assessed the acquired assets and assumed liabilities at their estimated fair values based on the highest and best use. We identified and recognized an intangible asset for the technology process, which management has determined to be the principal asset acquired. We recognized a net deferred tax liability related to the differences in the tax treatment of the acquired assets. An independent valuation firm was used to assist management in determining the final appraisal values of the identifiable assets.
The following table summarizes the preliminary purchase price allocation and determination of goodwill, which is not deductible for tax purposes, as of May 2010 (in thousands):
|
Total |
||||
| Consideration: |
||||
| Cash |
$ | 5,500 | ||
| Accounts payable from Exactech at closing |
(99 | ) | ||
| $ | 5,401 | |||
| Acquisition related expenses – included in general and administrative expenses in the condensed consolidated statement of income. |
$ | 52 | ||
| Preliminary identifiable assets acquired and liabilities assumed |
||||
| Current assets acquired |
$ | 209 | ||
| Property and equipment acquired |
270 | |||
| Identifiable intangible assets |
4,781 | |||
| Current liabilities assumed |
(24 | ) | ||
| Deferred tax liability assumed |
(1,883 | ) | ||
| Total identifiable net assets |
3,353 | |||
| Goodwill |
2,048 | |||
| $ | 5,401 | |||
Prior to acquisition, Brighton Partners was deemed to be 24% beneficially owned by Albert H. Burstein, Ph.D., a director of the Company. Additionally, William Petty, Chairman of the Board and
61
Table of Contents
Chief Executive Officer of the Company, and Betty Petty, Secretary of the Company, jointly owned 4.6% of Brighton Partners. Gary J. Miller, Executive Vice President of the Company, beneficially owned 2.8% of Brighton Partners. Other executive officers of the Company owned less than 3% of Brighton Partners, Inc. No member of Exactech’s management had control over, or influenced the operations of, Brighton Partners.
We have an oral consulting agreement with Albert Burstein, Ph.D., to provide services regarding many facets of the orthopaedic industry including product design rationale, manufacturing and development techniques and product sales and marketing. This agreement is terminable at will by either party. Pursuant to this agreement, we paid Dr. Burstein $180,000 each year in 2010, 2009 and 2008, as compensation under the consulting agreement. The consulting agreement continues post acquisition (See Note 8).
Acquisition of Germany Assets
During the first quarter of 2010, we established a distribution subsidiary in Germany, Exactech Deutschland, GmbH. Effective April 1, 2010, we completed the acquisition of certain assets of Tantum AG, our prior independent distributor in Germany. Our purchase price at closing was approximately 1 million EUR, or $1.35 million translated at the March 31, 2010 exchange rate of $1.35 per 1.00 EUR. Consideration paid was in the form of 410,000 EUR in cash and 563,000 EUR in forgiven accounts receivable that were owed to us as of March 31, 2010. We financed the acquisition through our existing line of credit. Pro forma revenue and earnings for the business combination have not been presented because the effects, both individually and in the aggregate, were not material to our results of operations.
The acquisition and establishment of a direct distribution subsidiary in Germany was accomplished to obtain a certain hip product line and to maintain access to a large European market with an established workforce and existing customers.
We accounted for the acquisition under the Business Combinations topic of the Accounting Standards Codification. We have expensed acquisition related costs as incurred, as general and administrative expense. The accounting for the German acquisition is preliminary, pending final valuation assessment of acquired assets based on the highest and best use. We have identified and recognized an intangible asset for the customer relationships acquired.
The following table summarizes the preliminary purchase price allocation and determination of goodwill, which is not deductible for tax purposes, as of April 2010 (in thousands):
|
Total |
||||
| Consideration: |
||||
| Cash |
$ | 556 | ||
| Offset of accounts receivable from Tantum at closing |
760 | |||
| $ | 1,316 | |||
| Acquisition related expenses – included in general and administrative expenses in the condensed consolidated statement of income. |
$ | 62 | ||
| Preliminary identifiable assets acquired and liabilities assumed |
||||
| Current assets acquired |
$ | 101 | ||
| Instrumentation acquired |
327 | |||
| Identifiable intangible assets |
193 | |||
| Total identifiable net assets |
621 | |||
| Goodwill |
695 | |||
| $ | 1,316 | |||
62
Table of Contents
Acquisition of France Medica
Effective April 1, 2008, we completed the acquisition of our French distributor, France Medica. A portion of the purchase price was a contingent purchase price supplement of between 1.2 million EUR and 1.7 million EUR, or $1.8 million and $2.7 million, payable to certain shareholders of France Medica over a two year period, if certain sales results were achieved in each of the annual periods. If the conditional terms are not met, the supplemental payment to some shareholders can be reduced by up to 50%. In July 2008, we paid $1.5 million of the supplement payments. During 2009, we paid an additional $386,000 of supplement payments, of which $234,000 was previously held in escrow. In May 2009 we transferred an additional 180,000 EUR, or $248,000, of supplement payments into an escrow fund in lieu of transferring the funds directly to the former shareholder, which will be used to fulfill the terms of one of the guarantees discussed below. In March 2010, we recorded an additional 153,000 EUR, or $207,000, for the final supplement payment. During April 2010, we paid the final supplement payment of $404,000. In addition to the purchase price supplement, two former shareholders of France Medica made guarantees against future claims for damages resulting from certain events prior to the acquisition date. Under these guarantees, 570,000 EUR, or $890,000, was withheld from the cash purchase price and an escrow fund was established. An additional escrow fund of 180,000 EUR, or $248,000, was established in May 2009 upon disbursement of contingent price supplement funds discussed above. The funds in the escrow agreements will be distributed in three annual installments on July 1, 2009, 2010 and 2011, less any deductions for damages. During 2010 and 2009, we paid the first two installments of the guarantee from the escrow funds for $356,000 and $234,000, respectively. As of December 31, 2010, the escrow funds are recorded at the translated amount of $383,000, based on the exchange rate as of the end of December of $1.31 per 1.00 EUR. The remaining escrow fund is recorded as a long-term asset on our consolidated balance sheets, until the obligation to the former shareholder is determined beyond a reasonable doubt. Amounts paid out under these contingencies were added to the cost of acquisition when they were determinable with certainty.
During 2010, we recorded $563,000 for additional purchase price supplements and guarantee reimbursement payable, offset by a foreign currency translation effect of $147,000, for a 2010 adjustment to goodwill of $416,000. As of December 31, 2010, we have recognized additional goodwill of $1.0 million for the purchase price supplement liability and the guarantee reimbursement, based on terms of the agreement and currency translation effect of $290,000, for adjustment to goodwill of $752,000.
New Distribution Subsidiary
Exactech Iberica
During the first quarter of 2010, we established a distribution subsidiary in Spain, Exactech Iberica, S.A.. (“Exactech Iberica”), and commenced distributing our products directly in the third quarter of 2010. The sales distribution subsidiary, based in Gijon, enables us to directly control our Spanish marketing and distribution operations. We have obtained our import registration to allow Exactech Iberica to import our products for sale in Spain and actively commenced distribution activities during the third quarter. During the first quarter of 2010, we notified our existing independent distributor in Spain of the non-renewal of our distribution agreement. As a result of that non-renewal, our relationship terminated during the third quarter of 2010. We expect a return of product from the former distributor, and as a result we reduced our 2010 reported net sales by $3.2 million, and recorded an additional sales return allowance of $1.3 million against accounts receivable on the consolidated balance sheet.
63
Table of Contents
6. INCOME TAXES
The provision for income taxes consists of the following (in thousands):
| Current: | 2010 | 2009 |
2008 |
|||||||||
| Federal |
$ | 4,281 | $ | 4,172 | $ | 3,556 | ||||||
| State |
1,674 | 1,147 | 919 | |||||||||
| Foreign |
(119 | ) | 32 | 242 | ||||||||
| Total current |
5,836 | 5,351 | 4,717 | |||||||||
| Deferred: |
||||||||||||
| Federal |
2,965 | 511 | 2,066 | |||||||||
| State |
(516 | ) | 138 | 259 | ||||||||
| Foreign |
(529 | ) | (155 | ) | (521 | ) | ||||||
| Total deferred |
1,920 | 494 | 1,804 | |||||||||
| Total provision |
$ | 7,756 | $ | 5,845 | $ | 6,521 | ||||||
The components of income before income taxes were as follows (in thousands):
| 2010 | 2009 |
2008 |
||||||||||
| United States |
$ | 23,380 | $ | 14,908 | $ | 18,151 | ||||||
| Foreign |
(5,159 | ) | (736 | ) | (439 | ) | ||||||
| Total |
$ | 18,221 | $ | 14,172 | $ | 17,712 | ||||||
A reconciliation between the amount of reported income tax provision and the amount computed at the statutory Federal income tax rate for the years ended December 31, 2010, 2009 and 2008 follows:
| 2010 | 2009 |
2008 |
||||||||||
| Statutory Federal rate |
35.0 | % | 35.0 | % | 35.0 | % | ||||||
| State income taxes (net of Federal income tax benefit) |
5.0 | 5.4 | 4.6 | |||||||||
| Department of Justice settlement |
(1.4 | ) | 3.0 | - | ||||||||
| Incentive stock options |
1.5 | 1.3 | 1.6 | |||||||||
| Domestic manufacturer’s deduction |
(2.8 | ) | (2.0 | ) | (1.4 | ) | ||||||
| R&D credit |
(3.1 | ) | (2.8 | ) | (2.3 | ) | ||||||
| Valuation allowance |
5.0 | - | - | |||||||||
| Other |
3.4 | 1.3 | (0.5 | ) | ||||||||
| 42.6 | % | 41.2 | % | 37.0 | % | |||||||
The types of temporary differences and their related tax effects that give rise to deferred tax assets and liabilities at December 31, 2010 and 2009 are as follows (in thousands):
| 2010 |
2009 |
|||||||||
| Deferred tax liabilities: |
||||||||||
| Basis difference in property and equipment |
$ | 11,476 | $ | 8,906 | ||||||
| Basis difference in intangibles |
1,947 | 420 | ||||||||
| Gross deferred tax liabilities
|
|
13,423
|
|
|
9,326
|
|
||||
| Deferred tax assets: |
||||||||||
| Accrued liabilities and reserves not currently deductible |
1,483 | 1,476 | ||||||||
| Inventory basis difference |
2,828 | 2,625 | ||||||||
| Non-qualified stock options |
629 | 546 | ||||||||
| Loss carry forwards |
9,156 | 8,000 | ||||||||
| Valuation allowance |
(4,571 | ) | (3,607 | ) | ||||||
| Gross deferred tax assets |
9,525 | 9,040 | ||||||||
| Net deferred tax liabilities |
$ | 3,898 | $ | 286 | ||||||
64
Table of Contents
At December 31, 2010, net operating loss carry forwards of our foreign and domestic subsidiaries in their federal, state, and local jurisdictions totaled $34.8 million, some of which begin to expire in 2013. For accounting purposes, the estimated tax effect of these net operating loss carry forwards result in a deferred tax asset. This deferred tax asset was $9.2 million and $8.0 million at December 31, 2010 and 2009, respectively. Valuation allowances for net operating loss carry forwards have been established in the amount of $4.6 million and $3.6 million at December 31, 2010 and 2009, respectively. This deferred tax asset and associated valuation allowance have been recorded based on the statutory expiration of the available net operating losses. If we recorded the net operating loss carry forwards and associated valuation allowance based on the amount expected to be ultimately utilized, we would reduce the deferred tax asset and associated valuation allowance by $2.6 million. As part of a previous business combination, $3.4 million of our valuation allowance was established through goodwill.
During the year ended December 31, 2010, the changes in our deferred tax assets and liabilities were primarily the result of book-to-tax differences for non-deductible accrued liabilities and reserves, depreciation of property and equipment, and our stock acquisition of Brighton Partners, Inc. Deferred taxes have not been provided on the unremitted earnings of subsidiaries because such earnings are intended to be permanently reinvested or can be recovered in a tax-free manner.
In December 2010, we reached a settlement with the U.S. government concerning our consulting arrangements with orthopaedic surgeons relating to hip and knee products in the United States (see note 9 – Commitments and Contingencies for further discussion). Under the terms of the settlement, we paid a civil settlement in the amount of $3.0 million. In 2009, we accrued $2.8 million as a contingency for the settlement and established a deferred tax asset for the amount management believed to be deductible.
The following is a tabular reconciliation of the total amounts of unrecognized tax benefits (in thousands):
| 2010 | 2009 | 2008 | ||||||||||
| Balance at January 1 |
$ | - | $ | - | $ | - | ||||||
| Increases related to current period |
238 | - | - | |||||||||
| Balance at December 31 |
$ | 238 | $ | - | $ | - | ||||||
The balance of unrecognized tax benefits at December 31, 2010 are tax benefits that, if recognized, would affect the effective tax rate.
Our policy is to recognize interest and penalties accrued on unrecognized tax benefits as part of income tax expense. For the years ended December 31, 2010 and 2009, no estimated interest or penalties were recognized for uncertain tax positions.
We file income tax returns in the United States, various states, and foreign jurisdictions. With few exceptions, we are no longer subject to U.S. federal, state and local, or non-U.S. income tax examinations by tax authorities for the years before 2007. We do not expect that the net amount of tax liability for unrecognized tax benefits will change in the next twelve months.
65
Table of Contents
7. DEBT
Long-term debt consists of the following as of December 31, (in thousands):
| 2010 | 2009 | |||||||
| Commercial construction loan payable in monthly principal installments of $17.5, plus interest based on adjustable rate as determined by one month LIBOR (1.76% as of December 31, 2010); proceeds used to finance expansion of current facility |
$ | 2,515 | $ | 2,725 | ||||
| Commercial equipment loan payable in monthly principal installments of $49.5, beginning November 2006, plus interest based on adjustable rate as determined by one month LIBOR with a minimum floor of 5.58% (5.59% as of December 31, 2010); proceeds used to finance equipment for production facility expansion |
443 | 1,040 | ||||||
| Commercial real estate loan payable in monthly installments of $46.4, including principal and interest based on an adjustable rate as determined by one month LIBOR, fixed by a swap agreement with the lender at 6.61% as a cash flow hedge. Proceeds used to remodel facilities and restructure portion of debt. |
2,261 | 2,646 | ||||||
| Business line of credit payable on a revolving basis, plus interest based on adjustable rate as determined by one month LIBOR based on the Company’s ratio of funded debt to EBITDA (1.76% as of December 31, 2010). Proceeds used for working capital purposes. |
37,556 | 7,794 | ||||||
| Total debt |
42,775 | 14,205 | ||||||
| Less current portion |
(1,066 | ) | (1,190 | ) | ||||
| $ | 41,709 | $ | 13,015 | |||||
| The following is a schedule of debt maturities as of December 31, 2010: |
||||||
| 2011 |
$ | 1,066 | ||||
| 2012 |
651 | |||||
| 2013 |
38,237 | |||||
| 2014 |
713 | |||||
| 2015 |
643 | |||||
| Thereafter |
1,465 | |||||
| $ | 42,775 | |||||
Commercial Construction Loan Payable
In September 2002, we entered into a commercial construction loan with SunTrust Bank, providing for a loan to be used for the expansion of our existing headquarters facility in Gainesville, Florida. The loan is secured by an irrevocable letter of credit issued by SunTrust Bank. The financing agreement contains financial covenants that must be met on a continuing basis, including debt to equity ratio, current ratio, net worth amount and working capital amount. We were in compliance with all such covenants at December 31, 2010. Due to the variable rate nature of the note, we believe the balance of the note payable approximates fair value.
Commercial Equipment Loans Payable
In February 2003 and September 2005, we entered into commercial equipment loans with Compass Bank, providing for loans to be used for the purchase of furnishings and equipment in connection with the expansion of our existing headquarters facility in Gainesville, Florida, and in the case of the September 2005 loan, the expansion of our existing production facility. The February 2003 loan was
66
Table of Contents
paid in full during 2009, as per terms of the loan. The remaining loan is secured by the purchased equipment. The financing agreement contains financial covenants that must be met on a continuing basis, including debt to equity ratio, current ratio, net worth amount, working capital amount and debt service coverage ratio. We were in compliance with all such covenants at December 31, 2010. Due to the variable rate nature of the note, we believe the balance of the note payable approximates fair value.
Commercial Real Estate Loan Payable
In October 2005, we entered into a commercial real estate loan with SunTrust Bank, providing for loans to recapture costs of improvements to our existing real estate facilities and restructure portions of existing working capital debt. The loan is secured by our real estate and facilities. The variable interest rate instrument has been fixed via a swap agreement with the lender that qualifies for hedge accounting as a cash flow hedge as defined by accounting guidance. The interest rate swap notional amount and terms coincide with the underlying debt terms. The notional amount on the swap agreement amortizes along with the underlying debt such that the notional amount is reduced by the monthly principal payments. We analyze the effectiveness of our interest rate swap and have determined the interest rate swap to be effective, as such there is no ineffectiveness to be recorded. The financing agreement contains financial covenants that must be met on a continuing basis, including debt to equity ratio, current ratio, net worth amount and working capital amount. We were in compliance with all such covenants at December 31, 2010. Due to the variable rate nature of the note, we believe the balance of the note payable approximates fair value.
Line of Credit
On June 13, 2008, we entered into a revolving credit agreement for an aggregate principal amount of $40 million (“Credit Agreement”) with SunTrust Bank, an Alabama banking corporation as administrative agent and swingline lender and other potential lenders. The current credit agreement was originally composed of a revolving credit line in an amount equal to $25 million between us and SunTrust, and a revolving credit line in an amount equal to $15 million between us and Compass Bank, a Georgia banking corporation. Included in the credit agreement is a swingline note for $3 million, whereby excess bank account cash balance is swept into the swingline to reduce the outstanding balance. Interest on the notes consists of annual LIBOR, adjusted monthly, and an applicable margin, ranging from 1.25 % to 2.00%, based on a ratio of funded debt to EBITDA. The Credit Agreement has a five year term and the lending commitments under it terminate on June 13, 2013, with the swingline commitment terminating and all outstanding amounts thereunder due in full one week prior to the revolver note. The obligations under the Credit Agreement have been guaranteed by the domestic subsidiaries of the Company under the terms of a subsidiary guarantee and are secured by a security interest granted in substantially all of the assets of the Company and its domestic subsidiaries to the lenders party to the Credit Agreement. The outstanding balance under the Credit Agreement may be prepaid at any time without premiums or penalties. Upon an event of default the commitment will be terminated, all principal and interest will be payable immediately and begin to accrue interest at a default rate equal to the applicable rate in effect plus five percentage points. The Credit Agreement includes certain covenants and terms that place certain restrictions on our ability to incur additional debt, incur additional liens, engage in certain investments, affect certain mergers, declare or pay dividends, affect certain sales of assets, or engage in certain transactions with affiliates, sale and leaseback transactions, hedging agreements, or capital expenditures. Additionally, there are restrictions against us using the proceeds borrowed under this facility for funding our foreign subsidiaries unless such foreign subsidiaries are included in the facility by virtue of execution of a subsidiary guarantee or pledge of the capital stock of such foreign subsidiary. We are also subject to several financial covenants regarding the ratio of debt to EBITDA and fixed charge coverage ratio.
On November 10, 2010, we entered into an amendment to the Credit Agreement. The amendment provides us with an accordion facility from SunTrust that permits us to increase the revolver commitment available by an amount up to $15 million, provided that aggregate commitments
67
Table of Contents
available under the Credit Agreement may not exceed $55 million. Interest on the accordion facility accrues at an applicable margin between 2.35% and 2.50% above the LIBOR rate at the time of exercising the accordion. Additionally, the amendment amends certain terms of the Credit Agreement in respect to the calculation of the fixed charge coverage ratio as well as covenants relating to the our ability to affect transactions involving our subsidiaries. We paid aggregate closing costs of $172,000 for the Credit Agreement and amendment, which we are expensing over the life of the Credit Agreement. Additional administrative fees will be due and expensed each fiscal quarter based on a percentage of the unused revolver balance.
| 8. | RELATED PARTY TRANSACTIONS |
We have entered into an oral consulting agreement with Albert Burstein, Ph.D., a director of the Company, to provide services regarding many facets of the orthopaedic industry including product design rationale, manufacturing and development techniques, and product sales and marketing. Pursuant to this agreement, we paid Dr. Burstein $180,000 each year in 2010, 2009 and 2008, as compensation under the consulting agreement.
We have entered into consulting agreements with certain of our executive officers, directors and principal shareholders in connection with product design which entitles them to royalty payments aggregating 1% of the Company’s net sales of such products in the United States and less than 1% of the Company’s net sales of such products outside the United States. During each of the years ended December 31, 2010, 2009 and 2008, we paid royalties in aggregate of $300,000, pursuant to these consulting agreements. These royalties were paid to William Petty and Gary J. Miller and pursuant to their employment agreements, each were subject to a ceiling of $150,000 per year.
| 9. | COMMITMENTS AND CONTINGENCIES |
Litigation – There are various claims, lawsuits, and disputes with third parties and pending actions involving various allegations against us incident to the operation of our business, principally product liability cases. We are currently a party to several product liability suits related to the products distributed by us on behalf of RTI Biologics, Inc. (“RTI”). Pursuant to our license and distribution agreement with RTI, we will tender all cases to RTI. While we believe that the various claims are without merit, we are unable to predict the ultimate outcome of such litigation. We therefore maintain insurance, subject to self-insured retention limits, for all such claims, and establish accruals for product liability and other claims based upon our experience with similar past claims, advice of counsel and the best information available. At December 31, 2010, we did not have any accruals for product liability claims. At December 31, 2009, we had $160,000 accrued for product liability claims. These matters are subject to various uncertainties, and it is possible that they may be resolved unfavorably to us. However, while it is not possible to predict with certainty the outcome of the various cases, it is the opinion of management that, upon ultimate resolution, the cases will not have a material adverse effect on our consolidated financial position, results of operations or cash flows.
Our insurance policies covering product liability claims must be renewed annually. Although we have been able to obtain insurance coverage concerning product liability claims at a cost and on other terms and conditions that are acceptable to us, we may not be able to procure acceptable policies in the future.
On December 7, 2010, we entered into a twelve-month Deferred Prosecution Agreement, or DPA, with the United States Attorney’s Office for the District of New Jersey, or the USAO, and a five year Corporate Integrity Agreement, or CIA, with the Office of the Inspector General of the United States Department of Health and Human Services. The foregoing agreements, together with a related settlement agreement, resolve the investigation commenced by the USAO in December 2007 into our consulting arrangements with orthopaedic surgeons relating to our hip and knee products in the United States, which we refer to as the Subject Matter. As set forth in the DPA, the USAO specifically acknowledges that it does not allege that our conduct adversely affected patient health or patient care. Pursuant to the DPA, the USAO has agreed not to prosecute us in connection with the Subject
68
Table of Contents
Matter provided that we comply with our obligations under the DPA during its term. Additionally, pursuant to the DPA, an independent monitor will review and evaluate our compliance with our obligations under the DPA. CIA acknowledges the existence of our corporate compliance program and provides us with certain other compliance-related obligations during the CIA’s term. See “Item 1A — Risk Factors” for more information about our obligations under these agreements. We continue to enhance and apply our corporate compliance program, and we monitor our practices on an ongoing basis to ensure that we have in place proper controls necessary to comply with applicable laws in the jurisdictions in which we do business. Our failure to maintain compliance with U.S. healthcare regulatory laws could expose us to significant liability including, but not limited to, extension of the term of the DPA, exclusion from federal healthcare program participation, including Medicaid and Medicare, civil and criminal fines or penalties, and additional litigation cost and expense. Pursuant to the CSA, we settled civil and administrative claims relating to the matter for a payment of $3.0 million, without any admission by the Company. We previously accrued approximately $3.5 million for an anticipated settlement and legal expenses related to this investigation, and therefore, these agreements did not materially impact our results of operations for the fourth quarter of 2010.
On October 18, 2010, MBA Incorporado, S.L., or MBA, our former distributor in Spain filed an action against Exactech, Inc. and Exactech Ibérica, S.A.U. in the Court of First Instance No. 10 of Gijon, Spain in connection with our termination of the distribution agreement with MBA in July 2010. In the lawsuit, MBA alleges, (i) wrongful solicitation of certain employees of MBA subsequent to the termination of the distribution agreement, (ii) breach of contract with respect to the termination date established by Exactech and Exactech’s alleged failure to follow the termination transitioning protocols set forth in the distribution agreement, and (iii) commercial damages and lost sales and customers due to Exactech’s alleged failure to supply products requested by MBA during the transition period of the distribution agreement termination. In the Complaint 1 filing MBA seeks damages of forty-four million (€44,000,000) Euros compensation for all benefits alleged to be owed by Exactech under the distribution agreement, including alleged loss of clientele, alleged loss of prestige and credibility, alleged loss of client confidence and alleged illegitimate business practices. On December 1, 2010, MBA filed a second action (“Complaint 2”) against Exactech Iberica and two of the former principals of MBA, in the Mercantile Court No. 3 of Gijon, Spain, also in connection with our termination of the distribution agreement with MBA in July 2010, seeking among other things injunctive relief. Both complaints are currently working through the legal proceedings process. While it is not possible to predict with certainty the outcome of the lawsuit, we believe that our termination of the distribution agreement with MBA was proper, all actions taken by us in connection with the termination (including during the transition period) were proper and, accordingly, the claims are without merit and subject to a number of defenses we possess. We intend to vigorously defend ourselves against these claims.
Purchase Commitments – At December 31, 2010, we had outstanding commitments for the purchase of inventory, raw materials and supplies of $14.8 million and outstanding commitments for the purchase of capital equipment of $7.3 million. Purchases under our distribution agreements were $8.7 million, $8.9 million, and $7.9 million in 2010, 2009, and 2008, respectively.
Our Taiwanese subsidiary, Exactech Taiwan, has entered into a license agreement with the Industrial Technology Research Institute (ITRI) and the National Taiwan University Hospital (NTUH) for the rights to technology and patents related to the repair of cartilage lesions. As of December 31, 2010, we have paid approximately $1.5 million for the licenses, patents, equipment related to this license agreement, and prepaid expenses, and we will make royalty payments when the technology becomes marketable. Using the technology, we plan to launch a cartilage repair program that will include a device and method for the treatment and repair of cartilage in the knee joint. It is expected that the project will require us to complete human clinical trials under the guidance of the Food & Drug Administration in order to obtain pre-market approval for the device in the United States. The agreement terms include a license fee based on the achievement of specific, regulatory milestones and a royalty arrangement based on sales once regulatory clearances are established.
69
Table of Contents
Contingencies – As part of the acquisition agreement with France Medica, a contingent purchase price supplement was payable to certain shareholders of France Medica, over a two year period, if certain sales results were achieved in each of the annual periods and employment conditions maintained. The final purchase price supplement contingency was settled during the first half of 2010. In addition, two former shareholders of France Medica made guarantees against future claims for damages resulting from certain events prior to the acquisition date. The funds withheld under these guarantees are in escrow and are being distributed in three annual installments, less any deductions for damages. Amounts paid out under the guarantees will be recognized when they are determinable with certainty. See Note 5 for further discussion on the France Medica acquisition and the related contingencies.
As of December 31, 2010, we recorded a contingent liability of $980,000 based on the estimated weighted probability of the outcome of a claim by the State of Florida for sales and use tax, based on the State’s audit of such tax dating back to May 2005, which was assessed by the State of Florida for the value of surgical instruments removed from inventory and capitalized as property and equipment worldwide. In consultation with counsel, management is challenging the assessment; however, there can be no assurances that we will ultimately prevail in our challenge against the assessment. In evaluating the liability, management followed the FASB guidance on contingencies, and concluded that the contingent liability is probable, based on verbal assertions by Florida Department of Revenue personnel, and can be reasonably estimated, however if we are unsuccessful in our challenge against the State of Florida, we could have a maximum potential liability of $2.4 million for the tax period audited through December 31, 2010. Any use tax determined to be due and payable to the Florida Department of Revenue will increase the basis of the surgical instruments and this amount will be amortized over the remaining useful life of the instruments.
As part of the acquisition terms of the spine assets acquired from VertiFlex, Inc., two contingent consideration payables were originally recorded. The first contingent consideration for $500,000 was due upon VertiFlex completing certain regulatory matters prior to the end of the year, which was completed in December 2010. The second contingent consideration is for up to an additional $500,000 payable based on our achieving certain sales targets during the six month period following the date of close. The range of contingent earn-out payment is $150,000 for the minimum US sales and $500,000 for the maximum sales goal. We have recorded $300,000 in contingencies payable based on our estimated probability of completing the earn-out contingency measures.
10. PENSION PLAN
We currently sponsor a defined contribution plan for our employees. Beginning from 2008, we provide matching contributions of 100% on the first 5% of salary deferral by employees. Prior to 2008, we provided matching contributions of 100% on the first 3% of salary deferral by employees. Our total contributions to this plan during 2010, 2009 and 2008 were $736,000, $775,000 and $678,000, respectively.
70
Table of Contents
11. COMMON SHAREHOLDERS’ EQUITY
Earnings Per Share:
The following is a reconciliation of the numerators and denominators of the basic and diluted EPS computations for net income (in thousands, except per share amounts):
| 2010 | 2009 | 2008 | ||||||||||||||||||||||||||||||||||
| Income (Numer- ator) |
Shares (Denom- inator) |
Per Share |
Income (Numer- ator) |
Shares (Denom- inator) |
Per Share |
Income (Numer- ator) |
Shares (Denom- inator) |
Per Share |
||||||||||||||||||||||||||||
| Net income |
$ | 10,465 | $ | 8,327 | $ | 11,093 | ||||||||||||||||||||||||||||||
| Basic EPS: |
||||||||||||||||||||||||||||||||||||
| Net income |
$ | 10,465 | 12,897 | $ | 0.81 | $ | 8,327 | 12,770 | $ | 0.65 | $ | 11,093 | 12,317 | $ | 0.90 | |||||||||||||||||||||
| Effect of dilutive |
||||||||||||||||||||||||||||||||||||
| securities: |
||||||||||||||||||||||||||||||||||||
| Stock options |
194 | 136 | 418 | |||||||||||||||||||||||||||||||||
| Diluted EPS: |
||||||||||||||||||||||||||||||||||||
| Net income plus assumed conversions |
$ | 10,465 | 13,091 | $ | 0.80 | $ | 8,327 | 12,906 | $ | 0.65 | $ | 11,093 | 12,735 | $ | 0.87 | |||||||||||||||||||||
For the year ended December 31, 2010, weighted average options to purchase 451,553 shares of common stock at exercise prices in the range of $17.82 to $26.43 per share were outstanding but were not included in the computation of diluted EPS because the options were antidilutive under the treasury stock method. For the year ended December 31, 2009, weighted average options to purchase 439,313 shares of common stock at exercise prices in the range of $12.68 to $26.43 per share were outstanding but were not included in the computation of diluted EPS because the options were antidilutive under the treasury stock method. For the year ended December 31, 2008, weighted average options to purchase 89,000 shares of common stock at exercise prices in the range of $19.93 to $26.43 per share were outstanding but were not included in the computation of diluted EPS because the options were antidilutive under the treasury stock method.
Stock-based Compensation Awards:
We sponsor an Executive Incentive Compensation Plan, which provides for the award of stock-based compensation, including options, stock appreciation rights, restricted stock and other stock-based incentive compensation awards to key employees, directors and independent agents and consultants. We implemented an incentive compensation plan upon shareholder approval at our Annual Meeting of Shareholders on May 2, 2003, which we refer to as the 2003 Plan. The maximum number of common shares issuable under the 2003 Plan was 3,000,000 shares. On May 7, 2009, at our Annual Meeting of Shareholders, our shareholders approved a new comprehensive, consolidated incentive compensation plan, referred to as the 2009 Plan, which replaces the 2003 Plan. The maximum number of common shares issuable under the 2009 Plan is 500,000 shares plus any remaining shares issuable under the 2003 Plan. The terms of the 2009 Plan are substantially similar to the terms of the 2003 Plan. Common stock issued upon exercise of stock options is settled with authorized but unissued shares available. Under the plans, the exercise price of option awards equals the market price of our stock on the date of grant, and has a maximum term of ten years. As of December 31, 2010, there were 367,992 total remaining shares issuable under the 2009 Plan. During 2010, there were no stock-based compensation awards granted under the plan other than the options to purchase shares of our common stock and restricted stock awards, as discussed herein.
71
Table of Contents
Stock Options:
A summary of the status of fixed stock option grants under our stock-based compensation plans as of December 31, 2010, 2009 and 2008 and changes during the years then ended is presented below:
|
2010 |
2009 |
2008 |
||||||||||||||||||||||
| Options | Weighted Avg Exercise Price |
Options | Weighted Avg Exercise Price |
Options | Weighted Avg Exercise Price |
|||||||||||||||||||
| Outstanding – January 1 |
1,224,219 | $ | 14.58 | 1,151,529 | $ | 14.33 | 1,209,533 | $ | 13.92 | |||||||||||||||
| Granted |
328,167 | 17.25 | 144,900 | 12.95 | 15,000 | 26.43 | ||||||||||||||||||
| Exercised |
(157,218 | ) | 9.29 | (61,860 | ) | 6.40 | (70,171 | ) | 9.53 | |||||||||||||||
| Expired/Forfeited |
(15,912 | ) | 17.29 | (10,350 | ) | 13.35 | (2,833 | ) | 19.43 | |||||||||||||||
| Outstanding – December 31 |
1,379,256 | $ | 15.79 | 1,224,219 | $ | 14.58 | 1,151,529 | $ | 14.33 | |||||||||||||||
| Options exercisable at year end |
935,919 | $ | 15.50 | 957,170 | $ | 14.34 | 938,272 | $ | 13.46 | |||||||||||||||
| Options vested and expected to vest |
1,324,692 | $ | 15.75 | |||||||||||||||||||||
The following table summarizes additional stock option terms as of December 31, 2010:
| Weighted avg remaining contractual term (years) |
Aggregate intrinsic value |
|||||
| Options outstanding |
3.71 | $ 4,580,000 | ||||
|
Options exercisable |
3.17 | 3,449,000 | ||||
|
Options vested and expected to vest |
3.66 | 4,456,000 | ||||
The aggregate intrinsic value of options exercised during the years ended December 31, 2010, 2009 and 2008 was $1,343,000, $447,000 and $1,148,000, respectively.
Outstanding options, consisting of five-year to ten-year incentive stock options, vest and become exercisable ratably over a three to five year period from the date of grant. The outstanding options expire from five to ten years from the date of grant or upon retirement from Exactech, and are contingent upon continued employment during the applicable option term. The fair value of each option granted to employees and non-employee directors is estimated on the date of grant using the Black-Scholes option-pricing model with the following weighted-average assumptions used for grants:
|
Years ended December 31, |
2010 | 2009 | 2008 | |||||||||
| Options granted |
328,167 | 128,700 | 15,000 | |||||||||
| Dividend yield |
– | – | – | |||||||||
| Expected life |
6 years | 6 years | 5 years | |||||||||
| Expected volatility |
43% | 42% | 39% | |||||||||
| Risk free interest rates |
2.7% | 1.7% | 3.4% | |||||||||
| Weighted average fair value per share of options granted |
$ 7.53 | $ 5.46 | $ 10.32 | |||||||||
During the years ended December 31, 2010 and 2008, no options were granted to non-employee sales agents, consultants and employees of our foreign subsidiaries. During the year ended December 31, 2009, there were 16,200 options granted to non-employee sales agents, consultants
72
Table of Contents
and employees of our foreign subsidiaries, respectively. Options granted to non-employees typically vest ratably over a period of three to five years from the date of grant and expire in seven years or less from the date of grant, or upon termination of the agent or consultant’s contract with us. At December 31, 2010, there were 23,000 of such options outstanding, of which, 16,880 were exercisable.
The compensation cost that has been charged against income for the incentive compensation plans for the years ended December 31 was (in thousands):
|
2010 |
2009 | 2008 | ||||||||||
| Employee stock compensation expense |
$ | 1,961 | $ | 1,049 | $ | 1,066 | ||||||
| Non-employee stock compensation expense |
28 | 59 | 22 | |||||||||
| 1,989 | 1,108 | 1,088 | ||||||||||
| Income tax benefit |
90 | 154 | 142 | |||||||||
| $ | 1,899 | $ | 954 | $ | 946 | |||||||
As of December 31, 2010, total unrecognized compensation cost related to nonvested awards was $919,000 and is expected to be recognized over a weighted-average period of 0.98 years.
Restricted Stock Awards:
Under the plans, we may grant restricted stock awards to eligible employees, directors, and independent agents and consultants. Restrictions on transferability, risk of forfeiture and other restrictions are determined by the Compensation Committee of the Board of Directors (“Committee”) at the time of the award. During December 2009, the Committee approved equity compensation to the five outside members of the Board of Directors for their service on the Board of Directors. The compensation for each director was for either the grant of stock awards to each director with an annual market value of $50,000, payable either in the form of four equal quarterly grants of common stock based on the market price at the dates of grant, or an option to purchase common stock, the choice being at the discretion of each individual director. Pursuant to the approved grant, four of our outside directors chose to receive the restricted stock awards. The first one-third of the compensation was granted on December 1, 2009 and the remaining two-thirds of the compensation was payable during 2010 in four equal quarterly grants. The summary information of the restricted stock grants is presented below:
| Grant date |
|
December 1, 2009 |
|
|
February 26, 2010 |
|
|
May 28, 2010 |
|
|
August 31, 2010 |
|
|
November 30, 2010 |
| |||||
| Aggregate shares of restricted stock granted |
4,192 | 1,716 | 2,564 | 3,065 | 2,494 | |||||||||||||||
| Grant date fair value |
$ 67,000 | $ 33,000 | $ | 44,000 | $ 44,000 | $ 44,000 | ||||||||||||||
| Weighted average fair value per share |
$ 15.89 | $ 19.39 | $ 17.33 | $ 14.51 | $ 17.82 | |||||||||||||||
During February 2009, the Committee approved equity compensation to the five outside members of the Board of Directors for their service on the Board of Directors. The compensation for each director was for either the grant of stock awards to each director with an annual market value of $47,500, payable either in the form of four equal quarterly grants of common stock based on the market price at the dates of grant, or an option to purchase common stock, the choice being at the discretion of each individual director. Pursuant to the approved grant, three of our outside directors chose to receive the restricted stock awards.
73
Table of Contents
The summary information of the restricted stock grants for 2009 is presented below:
| Grant date |
February
27, 2009 |
May
31, 2009 |
August
31, 2009 |
November
30, 2009 |
||||||||||||
| Aggregate shares of restricted stock granted |
2,583 | 2,226 | 2,394 | 2,253 | ||||||||||||
| Grant date fair value |
$ 36,000 | $ 36,000 | $ 36,000 | $ 36,000 | ||||||||||||
| Weighted average fair value per share |
$ 13.78 | $ 16.00 | $ 14.88 | $ 15.80 | ||||||||||||
All of the restricted stock awards in 2010 and 2009 were considered fully vested at each of the grant dates. The restricted stock awards require no service period and thus, no risk or provision for forfeiture. We did not grant any restricted stock awards during 2008.
Employee Stock Purchase Plan:
Under the 1999 Employee Stock Purchase Plan, employees were allowed to purchase shares of the Company’s common stock at a fifteen percent (15%) discount via payroll deduction. There were 250,000 shares reserved for issuance under the plan, and no shares remaining available to purchase as of June 30, 2009. On February 18, 2009, our board of directors adopted the Exactech, Inc. 2009 Employee Stock Purchase Plan, which we refer to as the 2009 ESPP. Our shareholders approved this new 2009 ESPP at our Annual Meeting of Shareholders on May 7, 2009. The 2009 ESPP is similar to our 1999 Employee Stock Purchase Plan, as it allows employees to purchase shares of our common stock at a fifteen percent (15%) discount via payroll deduction, and has four offering periods during an annual period. There are 150,000 shares reserved for issuance under the plan. As of December 31, 2010, 91,905 shares remain available to purchase under this 2009 ESPP. The fair value of the employee’s purchase rights is estimated using the Black-Scholes model. Purchase information and fair value assumptions are presented in the following table:
| Years ended December 31, | 2010 | 2009 | 2008 | |||||||||
| Shares purchased |
37,189 | 46,461 | 28,915 | |||||||||
| Dividend yield |
– | – | – | |||||||||
| Expected life |
1 year | 1 year | 1 year | |||||||||
| Expected volatility |
52% | 62% | 36% | |||||||||
| Risk free interest rates |
3.7% | 2.8% | 3.3% | |||||||||
| Weighted average per share fair value |
$ 4.50 | $ 3.89 | $ 5.22 | |||||||||
74
Table of Contents
12. OPERATING LEASES
The following schedule summarizes our current operating lease agreements as of December 31, 2010
| Facility | Location | Square Feet |
Lease Term Expiration Date |
Annual Rental ($) |
||||||||||
| SE Ohio Sales Office |
Lima, OH | 2,327 | 04/30/2011 | 35,000 | ||||||||||
| Exactech Canada Sales Office |
Mt. Hope, Ontario | 4,200 | 08/31/2013 | 22,000 | ||||||||||
| Instrument Manufacturing Shop |
Sarasota, FL | 13,125 | 06/30/2013 | 117,000 | ||||||||||
| Manufacturing Shop |
Sarasota, FL | 10,000 | 05/31/2012 | 111,000 | (1) | |||||||||
| Research Office |
Hsinchu, Taiwan | 849 | 12/31/2011 | 13,000 | (1) | |||||||||
| Office Space |
Taipei, Taiwan | 270 | 10/15/2011 | 1,000 | (1) | |||||||||
| Sales Office |
Redditch, England | 800 | 03/31/2013 | 13,000 | ||||||||||
| Sales Office |
Tokyo, Japan | 2,239 | 01/31/2012 | 104,000 | (1) | |||||||||
| Sales Office |
Shanghai, PROC | 3,650 | 02/28/2012 | 75,000 | (1) | |||||||||
| Sales Office |
Beijing, PROC | 773 | 02/14/2012 | 15,000 | (1) | |||||||||
| Warehouse (Lille) |
Capinghem, France | 3,714 | 08/14/2016 | 59,000 | (1) | |||||||||
| Office Space |
Illkirch, France | 2,217 | 03/31/2015 | 35,000 | (1) | |||||||||
| Sales Office |
Gijon, Spain | 6,232 | 03/01/2017 | 95,000 | (1) | |||||||||
| Sales Office |
Madrid, Spain | 1,504 | 08/01/2012 | 36,000 | (1) | |||||||||
| Sales Office |
Malaga, Spain | 1,066 | 05/01/2011 | 16,000 | (1) | |||||||||
| Sales Office |
Sevilla, Spain | 677 | 05/01/2011 | 13,000 | (1) | |||||||||
| Sales Office |
Barcelona, Spain | 955 | 06/01/2011 | 23,000 | (1) | |||||||||
| Sales Office |
Valencia, Spain | 269 | 06/01/2011 | 16,000 | (1) | |||||||||
| Sales Office |
Pamplona, Spain | 1,897 | 05/01/2014 | 19,000 | (1) | |||||||||
| Sales Office |
Palma de Mallorca, Spain | 1,346 | 06/01/2011 | 17,000 | (1) | |||||||||
| Sales Office |
Kiel, Germany | 2,002 | 12/31/2017 | 20,000 | (1) | |||||||||
| Automobile Lease |
Capinghem, France | — | 12/31/2011 | 14,000 | (1) | |||||||||
| Automobile Lease |
Kiel, Germany | — | 08/17/2013 | 14,000 | (1) | |||||||||
| Automobile Lease |
Kiel, Germany | — | 12/16/2013 | 11,000 | (1) | |||||||||
| Automobile Lease |
Kiel, Germany | — | 08/30/2014 | 11,000 | (1) | |||||||||
| Automobile Leases |
Gijon, Spain | — | 07/31/2014 | 369,000 | (1) | |||||||||
| (1) | Annual lease amounts are translated into US Dollar using December 31, 2010 exchange rates. |
Rent expense associated with operating leases was $977,000, $530,000 and $524,000 for the years ended December 31, 2010, 2009 and 2008, respectively.
The following is a schedule, by year, of minimum payments due on all non-cancelable operating leases as of December 31, 2010 (in thousands):
|
Year Ending December 31, |
||||
| 2011 |
$ 1,187 | |||
| 2012 |
860 | |||
| 2013 |
685 | |||
| 2014 |
318 | |||
| 2015 |
183 | |||
| Thereafter |
188 | |||
| $ 3,421 | ||||
75
Table of Contents
| 13. | QUARTERLY RESULTS OF OPERATIONS (UNAUDITED) |
Following is a summary of the quarterly results of operations for the years ended December 31, 2010 and 2009. All dollar amounts are in thousands, except per share amounts:
|
Quarter |
||||||||||||||||||||
| First | Second | Third | Fourth | Total | ||||||||||||||||
| 2010 |
||||||||||||||||||||
| Net sales |
$ | 49,100 | $ | 47,570 | $ | 42,023 | $ | 51,790 | $ | 190,483 | ||||||||||
| Gross profit |
31,428 | 31,136 | 28,319 | 35,639 | 126,522 | |||||||||||||||
| Net income |
3,281 | 2,992 | 1,483 | 2,709 | 10,465 | (1) | ||||||||||||||
| Basic EPS |
0.26 | 0.23 | 0.11 | 0.21 | 0.81 | |||||||||||||||
| Diluted EPS |
0.25 | 0.23 | 0.11 | 0.21 | 0.80 | |||||||||||||||
| 2009 |
||||||||||||||||||||
| Net sales |
$ | 43,304 | $ | 43,302 | $ | 42,363 | $ | 48,341 | $ | 177,310 | ||||||||||
| Gross profit |
28,797 | 26,967 | 27,094 | 29,450 | 112,308 | |||||||||||||||
| Net income |
2,465 | 2,628 | 2,740 | 494 | 8,327 | (1) | ||||||||||||||
| Basic EPS |
0.19 | 0.21 | 0.21 | 0.04 | 0.65 | |||||||||||||||
| Diluted EPS
|
|
0.19
|
|
|
0.20
|
|
|
0.21
|
|
|
0.04
|
|
|
0.65
|
| |||||
| (1) | Our Total 2010 net income included a negative impact of $801,000 in expenses, net of tax, related to the DOJ inquiry. Total 2009 net income included a negative impact of $4.9 million in expenses, net of tax, related to the DOJ inquiry, with a fourth quarter impact to net income of $2.8 million. See discussion in Note 9. |
| 14. | SEGMENT INFORMATION |
Exactech evaluates its operating segments by our major product lines: knee implants, hip implants, biologics and spine, extremity implants and other products. The “other products” segment includes miscellaneous sales categories, such as surgical instruments held for sale, bone cement, instrument rental fees, shipping charges, and other implant product lines. Evaluation of the performance of operating segments is based on their respective income from operations before taxes, interest income and expense, and nonrecurring items. Intersegment sales and transfers are not significant. The accounting policies of the reportable segments are the same as those described in Note 2.
Total assets not identified with a specific segment are listed as “corporate” and include cash and cash equivalents, accounts receivable, income taxes receivable, deposits and prepaid expenses, deferred tax assets, land, facilities, office furniture and computer equipment, notes receivable, and other investments. Depreciation and amortization on corporate assets is allocated to the product segments for purposes of evaluating the income (loss) from operations, and capitalized surgical instruments are allocated to the appropriate product line supported by those assets.
Total gross assets held outside the United States as of December 31, 2010 was $26.0 million. Included in these assets is $17.8 million in surgical instrumentation and inventory, stated gross as it is impracticable to account for depreciation on these assets by region.
76
Table of Contents
Summarized information concerning our reportable segments is shown in the following table (in thousands):
| Year ended December 31, | Knee | Hip |
Biologics And Spine |
Extremities | Other | Corporate | Total | |||||||||||||||||||||
| 2010 |
||||||||||||||||||||||||||||
| Net sales |
$ | 76,509 | $ | 28,710 | $ | 27,987 | $ | 30,033 | $ | 27,244 | $ | — | $ | 190,483 | ||||||||||||||
| Segment profit (loss) |
10,340 | 1,375 | 2,602 | 7,359 | (3,274 | ) | (181 | ) | 18,221 | (1) | ||||||||||||||||||
| Total assets, net |
67,273 | 26,423 | 17,605 | 13,564 | 9,418 | 85,710 | 219,993 | |||||||||||||||||||||
| Capital expenditures |
14,382 | 3,353 | 216 | 2,178 | 1,018 | 6,102 | 27,249 | |||||||||||||||||||||
| Depreciation and Amortization |
4,559 | 1,862 | 606 | 774 | 322 | 4,111 | 12,234 | |||||||||||||||||||||
| 2009 |
||||||||||||||||||||||||||||
| Net sales |
$ | 75,833 | $ | 26,826 | $ | 27,440 | $ | 22,829 | $ | 24,382 | $ | — | $ | 177,310 | ||||||||||||||
| Segment profit (loss) |
8,994 | 930 | 1,389 | 5,417 | (2,000 | ) | (558 | ) | 14,172 | (1) | ||||||||||||||||||
| Total assets, net |
41,747 | 24,407 | 19,215 | 9,082 | 5,209 | 71,360 | 171,020 | |||||||||||||||||||||
| Capital expenditures |
6,430 | 2,117 | 596 | 1,717 | 673 | 5,980 | 17,513 | |||||||||||||||||||||
| Depreciation and Amortization |
3,525 | 1,756 | 719 | 637 | 274 | 3,294 | 10,205 | |||||||||||||||||||||
| 2008 |
||||||||||||||||||||||||||||
| Net sales |
$ | 72,629 | $ | 22,777 | $ | 26,453 | $ | 16,844 | $ | 23,027 | $ | — | $ | 161,730 | ||||||||||||||
| Segment profit (loss) |
12,240 | 574 | 2,424 | 4,581 | (1,267 | ) | (840 | ) | 17,712 | (1) | ||||||||||||||||||
| Total assets, net |
41,209 | 25,094 | 19,557 | 7,433 | 8,046 | 66,181 | 167,520 | |||||||||||||||||||||
| Capital expenditures |
5,607 | 2,838 | 262 | 1,623 | 565 | 5,699 | 16,594 | |||||||||||||||||||||
| Depreciation and Amortization |
2,978 | 1,717 | 572 | 501 | 213 | 2,543 | 8,524 | |||||||||||||||||||||
| (1) | The segment profit (loss) for the years ended December 31, 2010, 2009, and 2008, was impacted by $1.3 million, $7.0 million, and $2.6 million, respectively, in pre-tax charges related to the DOJ inquiry. |
Major Customer and International Operations
During the years ended December 31, 2009, and 2008, our distributor in Spain accounted for approximately 7% and 6%, respectively, of our sales. During January 2010, we notified this distributor of our intent not to renew our distribution agreement with them, effective the second half of 2010. During 2010, we established a direct distribution subsidiary in the region. Combined net sales for the independent distributor and our subsidiary in Spain, were 4% of sales for the year ended December 31, 2010. Geographic distribution of our sales is summarized in the following table (in thousands):
| Year ended December 31, |
2010 |
2009 | 2008 | |||||||||||
| Domestic sales |
$ | 132,009 | $ | 122,391 | $ | 112,460 | ||||||||
| International sales |
58,474 | 54,919 | 49,270 | |||||||||||
| Total sales |
$ | 190,483 | $ | 177,310 | $ | 161,730 | ||||||||
| 15. | SUBSEQUENT EVENTS |
During 2010, we established an international sales office in Switzerland, to manage the international sales and marketing efforts for our foreign subsidiaries. In January 2011, we renamed our international sales office to Exactech International Operations, AG (“EIO”), and relocated the office to Bern, Switzerland, as part of a plan to realign our foreign subsidiaries and operations. The equity ownership of our foreign subsidiaries, with the exception of our Chinese operations, was transferred to EIO. EIO also acquired certain licenses to our intangibles to allow the use of our intellectual property outside the U.S. These actions have been undertaken to streamline and consolidate our international operations with the expectation of achieving improved customer service, cost savings, and international tax efficiency.
77
Table of Contents
ITEM 9. CHANGES IN AND DISAGREEMENTS WITH ACCOUNTANTS ON ACCOUNTING AND FINANCIAL DISCLOSURE
None.
ITEM 9A. CONTROLS AND PROCEDURES
Evaluation of Disclosure Controls and Procedures
As of the end of the period covered by this Annual Report on Form 10-K, our management conducted an evaluation, under the supervision and with the participation of our Chief Executive Officer and Chief Financial Officer, of the effectiveness of our disclosure controls and procedures as defined in Exchange Act Rules 13a-15(e) and 15d-15(e) under the Securities Exchange Act of 1934, as amended (the “Exchange Act”). Disclosure controls and procedures are designed to ensure that information required to be disclosed in our reports filed under the Exchange Act is recorded, processed, summarized and reported within the time periods specified in the Securities and Exchange Commission’s rules and forms and that such information is accumulated and communicated to our management, including our Chief Executive Officer and Chief Financial Officer, to allow timely decisions regarding required disclosure. Based on this evaluation, our Chief Executive Officer and Chief Financial Officer concluded that our disclosure controls and procedures were effective as of December 31, 2010.
Management’s Report on Internal Control Over Financial Reporting
Management is responsible for establishing and maintaining adequate internal control over financial reporting. Internal control over financial reporting is a process designed to provide reasonable assurance regarding the reliability of financial reporting and the preparation of financial statements for external purposes in accordance with generally accepted accounting principles. Internal control over financial reporting includes those policies and procedures that: (i) pertain to the maintenance of records that in reasonable detail accurately and fairly reflect the transactions and dispositions of the assets of the company; (ii) provide reasonable assurance that transactions are recorded as necessary to permit preparation of financial statements in accordance with generally accepted accounting principles, and that receipts and expenditures of the company are being made only in accordance with authorizations of management and directors of the company; and (iii) provide reasonable assurance regarding prevention or timely detection of unauthorized acquisition, use, or disposition of the company’s assets that could have a material effect on the financial statements.
Because of its inherent limitations, internal control over financial reporting may not prevent or detect misstatements. Also, projections of any evaluation of effectiveness to future periods are subject to the risk that controls may become inadequate because of changes in conditions, or that the degree of compliance with the policies or procedures may deteriorate.
As of December 31, 2010, pursuant to Section 404 of the Sarbanes-Oxley Act of 2002, management (with the participation of our principal executive officer and principal financial officer) conducted an evaluation of the effectiveness of our internal control over financial reporting based on the framework in Internal Control — Integrated Framework issued by the Committee of Sponsoring Organizations of the Treadway Commission (COSO). Based on this evaluation, management concluded that, as of December 31, 2010, our internal control over financial reporting was effective.
Our independent registered public accounting firm, McGladrey & Pullen, LLP, has audited the effectiveness of the Company’s internal control over financial reporting as of December 31, 2010, and has issued an attestation report on our internal control over financial reporting, which follows.
Changes in Internal Controls
There were no changes in our internal control over financial reporting during our most recent fiscal quarter that have materially affected, or are reasonably likely to materially affect, our internal control over financial reporting.
78
Table of Contents
REPORT OF INDEPENDENT REGISTERED PUBLIC ACCOUNTING FIRM
To the Board of Directors and Shareholders of
Exactech, Inc.
We have audited Exactech, Inc.’s and subsidiaries (the “Company”) internal control over financial reporting as of December 31, 2010, based on criteria established in Internal Control—Integrated Framework issued by the Committee of Sponsoring Organizations of the Treadway Commission (COSO). The Company’s management is responsible for maintaining effective internal control over financial reporting and for its assessment of the effectiveness of internal control over financial reporting included in the accompanying “Management’s Report on Internal Control Over Financial Reporting”. Our responsibility is to express an opinion on the company's internal control over financial reporting based on our audit.
We conducted our audit in accordance with the standards of the Public Company Accounting Oversight Board (United States). Those standards require that we plan and perform the audit to obtain reasonable assurance about whether effective internal control over financial reporting was maintained in all material respects. Our audit included obtaining an understanding of internal control over financial reporting, assessing the risk that a material weakness exists, and testing and evaluating the design and operating effectiveness of internal control based on the assessed risk. Our audit also included performing such other procedures as we considered necessary in the circumstances. We believe that our audit provides a reasonable basis for our opinion.
A company’s internal control over financial reporting is a process designed to provide reasonable assurance regarding the reliability of financial reporting and the preparation of financial statements for external purposes in accordance with generally accepted accounting principles. A company's internal control over financial reporting includes those policies and procedures that (a) pertain to the maintenance of records that, in reasonable detail, accurately and fairly reflect the transactions and dispositions of the assets of the company; (b) provide reasonable assurance that transactions are recorded as necessary to permit preparation of financial statements in accordance with generally accepted accounting principles, and that receipts and expenditures of the company are being made only in accordance with authorizations of management and directors of the company; and (c) provide reasonable assurance regarding prevention or timely detection of unauthorized acquisition, use, or disposition of the company’s assets that could have a material effect on the financial statements.
Because of its inherent limitations, internal control over financial reporting may not prevent or detect misstatements. Also, projections of any evaluation of effectiveness to future periods are subject to the risk that controls may become inadequate because of changes in conditions, or that the degree of compliance with the policies or procedures may deteriorate.
In our opinion, the Company maintained, in all material respects, effective internal control over financial reporting as of December 31, 2010, based on criteria established in Internal Control—Integrated Framework issued by the Committee of Sponsoring Organizations of the Treadway Commission (COSO).
We have also audited, in accordance with the standards of the Public Company Accounting Oversight Board (United States), the consolidated balance sheets as of December 31, 2010 and 2009, and the related consolidated statements of income, changes in shareholders’ equity and comprehensive income, and cash flows for each of the three years in the period ended December 31, 2010. Our audits also included the financial statement schedule of the Company listed in Item 15(e) and our report dated March 15, 2011 expressed an unqualified opinion.
/s/ McGladrey & Pullen, LLP
Charlotte, North Carolina
March 15, 2011
| ITEM 9B. | OTHER INFORMATION |
None.
79
Table of Contents
| ITEM 10. | DIRECTORS AND EXECUTIVE OFFICERS AND CORPORATE GOVERNANCE |
The information set forth under the caption “Management” in our definitive proxy statement to be filed in connection with our 2011 Annual Meeting of Shareholders is incorporated herein by reference.
We have adopted a code of ethics that applies to our principal executive officer, principal financial officer, principal accounting officer, or persons performing similar functions. We have posted our code of ethics on our website (www.exac.com), and it is available to any shareholder upon request. We intend to post any amendments to, or any waivers from, a provision of the code of ethics that applies to the principal executive officer, principal financial officer, principal accounting officer or controller, or any other person performing a similar function, on our website.
| ITEM 11. | EXECUTIVE COMPENSATION |
The information required for this item is incorporated by reference from our definitive proxy statement to be filed in connection with our 2011 Annual Meeting of Shareholders.
| ITEM 12. | SECURITY OWNERSHIP OF CERTAIN BENEFICIAL OWNERS AND MANAGEMENT AND RELATED SHAREHOLDER MATTERS |
The information required for this item is incorporated by reference from our definitive proxy statement to be filed in connection with our 2011 Annual Meeting of Shareholders.
| ITEM 13. | CERTAIN RELATIONSHIPS, RELATED TRANSACTIONS AND DIRECTOR INDEPENDENCE |
The information required for this item is incorporated by reference from our definitive proxy statement to be filed in connection with our 2011 Annual Meeting of Shareholders.
| ITEM 14. | PRINCIPAL ACCOUNTANT FEES AND SERVICES |
The information required for this item is incorporated by reference from our definitive proxy statement to be filed in connection with our 2011 Annual Meeting of Shareholders.
80
Table of Contents
OTHER INFORMATION
| ITEM 15. | EXHIBITS, FINANCIAL STATEMENT SCHEDULES, AND REPORTS ON FORM 8-K |
| (a) | Financial Statements |
The financial statements filed as part of this report are listed under Item 8.
| (b) | Exhibits: |
| Exhibit |
Description | |
| 3.1 |
Articles of Incorporation, as amended(1)(3) | |
| 3.2 |
Registrant's Bylaws(7) | |
| 3.3 |
Forms of Articles of Amendment to Articles of Incorporation(1) | |
| 3.4 |
Forms of Articles of Amendment to Articles of Incorporation(12) | |
| 4.1 |
Specimen Common Stock Certificate(1) | |
| 4.2 |
Shareholders' Agreement, dated as of November 30, 1992, as amended, by and among the Company, William Petty, M.D., Betty Petty, David Petty, Mark Petty and Julie Petty(1) | |
| 4.7 |
Form of Amendment to Shareholder's Agreement, dated as of May 1996, by and among the Company, William Petty, M.D., Betty Petty, David Petty, Mark Petty and Julie Petty(1) | |
| 4.8 |
Common Stock Purchase Rights Agreement(4) | |
| 10.7 |
Amendment to employment agreement between the Company and R. William Petty, M.D. (9)* | |
| 10.8 |
Amendment to employment agreement between the Company and Gary J. Miller, Ph.D. (17)* | |
| 10.9 |
Description of oral consulting agreement between the Company and Dr. Albert Burstein (17) | |
| 10.20 |
Deferred Prosecution Agreement, dated December 7, 2010, between Exactech, Inc. and the United States Attorney’s Office for the District of New Jersey. (19) | |
| 10.21 |
Settlement Agreement, dated December 7, 2010, between Exactech, Inc. and with the United States of America, acting through the United States Department of Justice and on behalf of the Office of Inspector General of the Department of Health and Human Services. (19) | |
| 10.22 |
Corporate Integrity Agreement, dated December 7, 2010, between Exactech, Inc. and the Office of Inspector General of the Department of Health and Human Services. (19) | |
| 10.38 |
License Agreement, dated August 20, 1993, between the Company and The University of Florida, as amended(1) | |
| 10.39 |
Exclusive Sublicense Agreement dated June 30, 1995, between the Company and Sofamor Danek Properties, Inc.(1) | |
| 10.40 |
License Agreement, dated as of January 1, 1996, between the Company and The Hospital for Special Surgery(1) | |
| 10.70 |
Loan Agreement, dated September 20, 2002, between SunTrust Bank, North Central Florida and the Company(2) | |
| 10.71 |
Exactech, Inc. 2009 Executive Incentive Compensation Plan(15) * | |
| 10.72 |
Exactech, Inc. 2009 Employee Stock Purchase Plan (16)* | |
| 10.76 |
Business Loan Agreement, dated as of October 18, 2005, from the Company to SunTrust(5) | |
| 10.77 |
Mortgage and Security Agreement, dated as of October 18, 2005, from the Company to SunTrust.(6) | |
| 10.78 |
Stock Purchase Agreement, dated May 24, 2010, by and among the Company and the Stockholders of Brighton Partners, Inc.(17) | |
| 10.79 |
Form of Registration Rights Agreement, by and among the Company and the Stockholders party thereto.(8) | |
| 10.80 |
Placement Agency Agreement dated May, 8 2008, by and among the Company and certain placement agents (10) | |
| 10.81 |
Revolving Credit Agreement, dated June 13, 2008, by and among Exactech, Inc., the lenders from time to time party hereto, and SunTrust Bank(11) | |
| 10.82 |
Form of Revolving Credit Note (11) | |
| 10.83 |
Form of Swingline Note(11) |
81
Table of Contents
| Exhibit |
Description | |
| 10.84 |
Security Agreement, dated June 13, 2008, by and among the Company, Exactech International, Inc., Altiva Corporation and SunTrust Bank(11) | |
| 10.85 |
Indemnity, Subrogation and Contribution Agreement, dated June 13, 2008, among those subsidiaries listed on Schedule I thereto and SunTrust Bank(11) | |
| 10.86 |
Subsidiary Guarantee Agreement, dated June 13, 2008, among each of the subsidiaries listed on Schedule I thereto and SunTrust Bank (11) | |
| 10.87 |
Employment Agreement between the Company and William Petty, M.D.(13)*. | |
| 10.88 |
Employment Agreement between the Company and David Petty (14)*. | |
| 10.89 |
Employment Agreement between the Company and Betty Petty (14)*. | |
| 10.90 |
Change of Control Plan (14) | |
| 10.91 |
First Amendment to Revolving Credit Agreement, dated November 10, 2010, by and among Exactech, Inc., the lenders from time to time party hereto, and SunTrust Bank , as administrative agent and lender. (18) | |
| 10.92 |
First Amendment to Security Agreement, dated November 10, 2010, by and among Exactech, Inc. and certain of its subsidiaries, and SunTrust Bank, as administrative agent. (18) | |
| 10.93 |
Amendment to Employment Agreement between the Company and William Petty, M.D. (20)* | |
| 14.1 |
Code of Business Conduct and Ethics(5) | |
| 21.1 |
Subsidiaries of the Company | |
| 23.1 |
Independent Auditors’ Consent | |
| 31.1 |
Certification pursuant to Section 302 of the Sarbanes-Oxley Act of 2002. | |
| 31.2 |
Certification pursuant to Section 302 of the Sarbanes-Oxley Act of 2002. | |
| 32.1 |
Certification of Chief Executive Officer pursuant to 18 USC Section 1350. | |
| 32.2 |
Certification of Chief Financial Officer pursuant to 18 USC Section 1350. |
Copies of the exhibits filed with this Annual Report on Form 10-K or incorporated herein by reference do not accompany copies hereof for distribution to shareholders of the Company. The Company will furnish a copy of any of such exhibits to any shareholder requesting the same.
| * | Compensation plan or arrangement |
| (1) | Incorporated by reference to the exhibit of the same number filed with the Company’s Registration Statement on Form S-1 (File No. 333-02980). |
| (2) | Incorporated by reference to Exhibit 10.70 to the Company’s Quarterly Report on Form 10-Q for the quarter ended September 30, 2002. |
| (3) | Incorporated by reference to Exhibit 3.1 filed with the Company’ Quarterly Report on Form 10-Q for the quarter ended March 31, 2003. |
| (4) | Incorporated by reference to Exhibit 4.1 to the Company 's Registration Statement on Form 8-A, filed with the SEC on December 19, 2003. |
| (5) | Incorporated by reference to Exhibit 10.1 to the Company’s Current Report on Form 8-K, filed with the SEC on October 21, 2005. |
| (6) | Incorporated by reference to Exhibit 10.2 to the Company’s Current Report on Form 8-K, filed with the SEC on October 21, 2005. |
| (7) | Incorporated by reference to Exhibit 3.1 to the Company’s Current Report on Form 8-K, filed with the SEC on March 25, 2010. |
| (8) | Incorporated by reference to Exhibit 10.2 to the Company’s Current Report on Form 8-K, filed with the SEC on December 10, 2007. |
| (9) | Incorporated by reference to Exhibit 10.1 to the Company’s Current Report on Form 8-K, filed with the SEC on December 19, 2007. |
| (10) | Incorporated by reference to Exhibit 1.1 filed with the Company’s Current Report on Form 8-K, filed with the SEC on May 9, 2008. |
| (11) | Incorporated by reference to Exhibits 10.80, 10.81, 10.82, 10.83, 10.84, and 10.85, respectively, to the Company’s Current Report on Form 8-K, filed with the SEC on June 19, 2008. |
| (12) | Incorporated by reference to Exhibit 3.1 filed with the Company’s Registration Statement on Form S-3 (File No. 333-150055) on April 2, 2008. |
82
Table of Contents
| (13) | Incorporated by reference to Exhibit 10.1 to the Company’s Current Report on Form 8-K, filed with the SEC on April 4, 2008. |
| (14) | Incorporated by reference to Exhibits 10.1, 10.2, and 10.3, respectively, to the Company’s Current Report on Form 8-K/A, filed with the SEC on May 8, 2008. |
| (15) | Incorporated by reference to Exhibit A filed with the Company’s Definitive Proxy Statement with respect to its 2009 Annual Meeting of Shareholders held on May 7, 2009. |
| (16) | Incorporated by reference to Exhibit B filed with the Company’s Definitive Proxy Statement with respect to its 2009 Annual Meeting of Shareholders held on May 7, 2009. |
| (17) | Incorporated by reference to Exhibits 10.1, 10.2, and 10.3, respectively, to the Company’s Quarterly Report on Form 10-Q, filed with the SEC on November 8, 2010. |
| (18) | Incorporated by reference to Exhibits 10.86 and 10.87, respectively, to the Company’s Current Report on Form 8-K, filed with the SEC on November 17, 2010. |
| (19) | Incorporated by reference to Exhibits 10.1, 10.2, and 10.3, respectively, to the Company’s Current Report on Form 8-K, filed with the SEC on December 10, 2010. |
| (20) | Incorporated by reference to Exhibit 10.2 to the Company’s Current Report on Form 8-K, filed with the SEC on January 14, 2011. |
83
Table of Contents
| (e) | Financial Statement Schedules: |
Schedule II-Valuation and Qualifying Accounts
EXACTECH, INC.
SCHEDULE II - VALUATION AND QUALIFYING ACCOUNTS
THREE YEARS ENDED DECEMBER 31, 2010, 2009 and 2008
(in thousands)
| Balance at
Beginning of Year |
Charged to
Costs and Expenses |
Deductions
(Chargeoffs) |
Balance at
End of Year |
|||||||||||||
| Allowance for doubtful accounts |
||||||||||||||||
| 2008 |
$ | 436 | $ | 433 | (1) | $ | (84 | ) | $ | 785 | ||||||
| 2009 |
785 | 664 | (780 | ) | 669 | |||||||||||
| 2010 |
669 | 668 | (27 | ) | 1,310 | |||||||||||
| Allowance for sales returns |
||||||||||||||||
| 2008 |
$ | 227 | $ | (4 | ) | $ | (2 | ) | $ | 221 | ||||||
| 2009 |
221 | (127 | ) | 72 | 166 | |||||||||||
| 2010 |
166 | 1,303 | (28 | ) | 1,441 | |||||||||||
| Inventory Allowance |
||||||||||||||||
| 2008 |
$ | 2,283 | $ | 3,212 | (1) | $ | — | $ | 5,495 | |||||||
| 2009 |
5,495 | 219 | — | 5,714 | ||||||||||||
| 2010 |
5,714 | 804 | 670 | (1) | 7,188 | |||||||||||
| (1) | Includes balances of allowance accounts acquired in our two acquisitions during each of years 2010 and 2008. |
84
Table of Contents
SIGNATURES
Pursuant to the requirements of Section 13 or 15(d) of the Securities Exchange Act of 1934, the registrant has duly caused this report to be signed on its behalf by the undersigned thereunto duly authorized.
| March 15, 2011 |
EXACTECH, INC. | |||||
| By: | /s/ William Petty | |||||
| William Petty Chief Executive Officer and Chairman of the Board | ||||||
|
Pursuant to the requirements of the Securities Exchange Act of 1934, this report has been signed below by the following persons on behalf of the registrant and in the capacities and on the dates indicated. | ||||||
| March 15, 2011 |
By: | /s/ William Petty | ||||
| William Petty Chief Executive Officer (principal executive officer) and Chairman of the Board | ||||||
| March 14, 2011 |
By: | /s/ David Petty | ||||
| David Petty President and Director | ||||||
| March 15, 2011 |
By: | /s/ Joel C. Phillips | ||||
| Joel C. Phillips Chief Financial Officer (principal financial officer and principal accounting officer) | ||||||
| March 15, 2011 |
By: | /s/ Albert H. Burstein | ||||
| Albert H. Burstein Director | ||||||
| March 14, 2011 |
By: | /s/ R. Wynn Kearney, Jr. | ||||
| R. Wynn Kearney, Jr. Director | ||||||
| March 15, 2011 |
By: | /s/ Paul E. Metts | ||||
| Paul E. Metts Director | ||||||
| March 14, 2011 |
By: | /s/ William B. Locander | ||||
| William B. Locander Director | ||||||
| March 14, 2011 |
By: | /s/ James G. Binch | ||||
| James G. Binch Director | ||||||
| March 15, 2011 |
By: | /s/ Richard C. Smith | ||||
| Richard C. Smith Director | ||||||
85