Attached files
| file | filename |
|---|---|
| 8-K - CURRENT REPORT - CINCINNATI BELL INC | d8k.htm |
 Cincinnati Bell Investor Day
Houston, Texas
March 16, 2011
Exhibit 99.1 |
 2
2
2
Today’s Agenda
Welcome & Introduction
Kim Sheehy, Vice President, Investor Relations and Treasurer
Company & Strategy Overview
Jack Cassidy, President & Chief Executive Officer
Financial Update
Gary Wojtaszek, Chief Financial Officer
Cincinnati Bell Communications
Ted Torbeck, President, Cincinnati Bell Communications
Data Center Strategy
Gary Wojtaszek, Chief Financial Officer
Data Center Colocation
Dave Ferdman, Chief Executive Officer, CyrusOne
Customer Perspective
Ken Braud, Chief Information Officer, Halliburton
Question & Answer
Cincinnati Bell Management Team |
 3
3
3
Safe Harbor
Certain of the statements and predictions contained in this presentation constitute
forward-looking statements within the meaning of the Private Securities
Litigation Reform Act. In particular, statements, projections or
estimates that include or reference the words “believes,”
“anticipates,”
“plans,”
“intends,”
“expects,”
“will,”
or any similar expression fall within the safe harbor for forward-looking
statements contained in the Reform Act. Actual results or outcomes may
differ materially from those indicated or suggested by any such
forward-looking statement for a variety of reasons, including, but not limited to:
changing market conditions and growth rates within the telecommunications industry or
generally within the overall economy; changes in competition in markets in
which the company operates; pressures on the pricing of company products and
services; advances in telecommunications technology; the ability to generate
sufficient cash flow to fund the company’s business plan, repay the company’s debt and interest
obligations, and maintain its networks; the ability to refinance
indebtedness when required on
commercially reasonable terms; changes in the telecommunications
regulatory environment; changes in
the demand for the company’s services and products; the demand for particular
products and services within the overall mix of products sold, as the
company’s products and services have varying profit margins; the
company’s ability to introduce new service and product offerings on a timely and cost
effective basis; work stoppage caused by labor disputes; restrictions imposed under
various credit facilities and debt instruments; the company’s ability to
attract and retain highly qualified employees; the company’s ability to
access capital markets and the successful execution of restructuring
initiatives; changes in the funded status of the company’s retiree
pension and healthcare plans; disruption in operations caused by a health
pandemic, such as the H1N1 influenza virus; changes in the company’s
relationships with current large customers, a small number of whom account for a
significant portion of company revenue; disruption in the company’s
back-office information technology systems, including its billing system;
the company’s ability to integrate successfully the business of Cyrus Networks, LLC with
the company’s existing operations and to achieve the anticipated benefits
of the acquisition of Cyrus
Networks, LLC; and failure of or disruption in the operation of the company’s
data centers. More information on potential risks and uncertainties is
available in recent filings with the Securities and
Exchange Commission, including Cincinnati Bell’s Form 10-K report, Form
10-Q reports and Form 8-K reports. The forward-looking
statements included in this presentation represent company estimates as of
March 16, 2011. Cincinnati Bell anticipates that subsequent events and
developments will cause its estimates to change.
|
 4
4
4
Non GAAP Financial Measures
This presentation contains information about adjusted earnings before interest,
taxes, depreciation and amortization (Adjusted EBITDA), Adjusted
EBITDA margin, free cash flow,
and net debt. These are non-GAAP financial measures used by Cincinnati Bell
management when evaluating results of operations and cash flow. Management
believes these measures also provide users of the financial statements with
additional and useful comparisons of current results of operations and cash
flows with past and future periods. Non-GAAP financial measures should
not be construed as being more important than comparable GAAP measures.
Detailed reconciliations of Adjusted EBITDA, free cash flow (including the
Company’s definition of these terms), and net debt to comparable GAAP
financial measures can be found in the appendix to this presentation.
|
 Jack
Cassidy President and CEO |
 6
6
6
135 year old full-service provider of data and
voice communications services over wireline
and wireless networks in the Greater Cincinnati
and Dayton areas
Provides business customers with outsourced
data center colocation operations in world
class, state-of-the-art data center facilities
Strong brand recognition and
reputation for service
Proven capabilities with track record
of delivering results
Well positioned for growth in the
Data Center industry
2010 Revenue
(1)
$1,377MM
Wireline
IT Services
and Hardware
Wireless
$502MM
Data Center
Colocation
2010 Adjusted EBITDA
(2)
Cincinnati Bell Overview
(1)
Before intercompany eliminations
(2)
Before Corporate expenses |
 7
7
7
Wireline: 674K access lines
Wireless: 509K wireless subscribers
Broadband: 256K high speed internet
subscribers
Entertainment: 28K Fioptics
subscribers
Regional market leader
offering full bundle
of integrated telecommunications services
Successfully
defending
market
share
in
the face of intense competition
Expanding fiber network
to offer digital
television and faster Internet
2010 Communications Revenue Mix
Voice –Business
Data
Long Distance and VoIP
Other
Voice –Consumer
Cincinnati Bell Communications
23%
19%
14%
6%
38% |
 8
8
8
Locations: Cincinnati, Houston, Dallas,
Austin, Chicago, South Bend and London
Square footage: 639K square feet
Utilization: 88% (as of Dec. 31, 2010)
Activity: Signed 45K square feet of DC
space in Q4 2010
Five years of organic data center growth
enhanced by CyrusOne
acquisition in June
2010
Premier regional facilities with growing
national presence
Path forward to become preferred global
provider
of
data
center
colocation
to
Fortune 1000
Cincinnati Bell Data Center Colocation |
 9
9
9
Net Debt / Adjusted EBITDA
4.2x
4.0x
4.1x
4.9x
3.0
4.0
5.0
6.0
Dec-07
Dec-08
Dec-09
Dec-10
(x)
$1,349
$1,403
$1,336
$1,377
1,150
1,300
1,450
2007
2008
2009
2010
Revenue
($MM)
Adjusted EBITDA
$473
$480
$470
$502
400
450
500
550
2007
2008
2009
2010
($MM)
Net Debt
$2,443
$1,942
$1,932
$1,981
0
1,000
2,000
3,000
Dec-07
Dec-08
Dec-09
Dec-10
($MM)
Proven Performance Track Record |
 10
10
10
Consumer
Business
Voice -
Business
Other Wireline
Voice -
Consumer
Wireless
Q4 2010 Customer Channel Mix
Q4 2010 Product Mix by Revenues*
* Before intercompany eliminations
IT Services and
Hardware
Revenue Diversification Strategy
Wireline
Data
Data Center
Colocation
34%
66%
10%
10%
19%
10%
19%
21%
11% |
 11
11
11
Maintain profitability and
cash flow of Communications
through defending core
business and aggressive
cost reduction initiatives
Create Sustainable Shareholder Value
Invest to establish national
then global footprint to
become preferred global
provider to Fortune 1000
customers
Implement fully financed,
disciplined data center
expansion plan and
optimize capital structure
Generate Strong
Operating Cash Flows
Grow Data Center
Colocation
Maintain Financial
Discipline
Clear Strategic Focus |
 Gary Wojtaszek
Chief Financial Officer |
 13
13
13
2010 Highlights –
Solid Performance, Positive Outlook
Adjusted EBITDA
of $502 million is
highest since 2003
CyrusOne
acquisition
generated
62
percent Adjusted EBITDA Margin;
$45 million of revenue; and $28
million of Adjusted EBITDA
(reflects 6 months of operation)
Free
Cash
Flow
of
$149
million
equates to 27 percent yield
Repurchased
4 million shares for
$10 million in Q4 using excess free
cash flow
•
Growth in Revenue and Adjusted
EBITDA; solid contributions from
CyrusOne acquisition in June 2010
•
Revenue, Adjusted EBITDA and
Free Cash Flow exceeded financial
guidance
•
Completed refinancing to
strengthen balance sheet; no
maturities until 2015; 90 percent of
maturities are 2017 and beyond |
 14
14
14
Wireline
•
Solid Adjusted EBITDA margin at 47
percent
•
Fioptics entertainment customers
totaled 28,000 at year-end
•
Fioptics homes passed increased to
79,000 with approximately 30 percent
penetration of homes passed after one
year
Wireless
•
Adjusted EBITDA of $91 million;
highest since 2003
•
Q4 net adds included 2,400
postpaid, 5,500 prepaid, 9,000
postpaid smartphones
•
Full-year postpaid data ARPU up 17
percent
IT Services & Hardware
•
Q4 Revenue up 12 percent to $78 million
•
Q4 Adjusted EBITDA up 16 percent
Data Center Colocation
•
2010 Adjusted EBITDA of $70 million,
up 119 percent year-over-year driven by
CyrusOne acquisition
•
CyrusOne Adjusted EBITDA margin of 62
percent
•
Q4 utilization rate at 88 percent; 45,000 sq ft
of new space contracted in Q4
2010 Segment Highlights |
 15
15
15
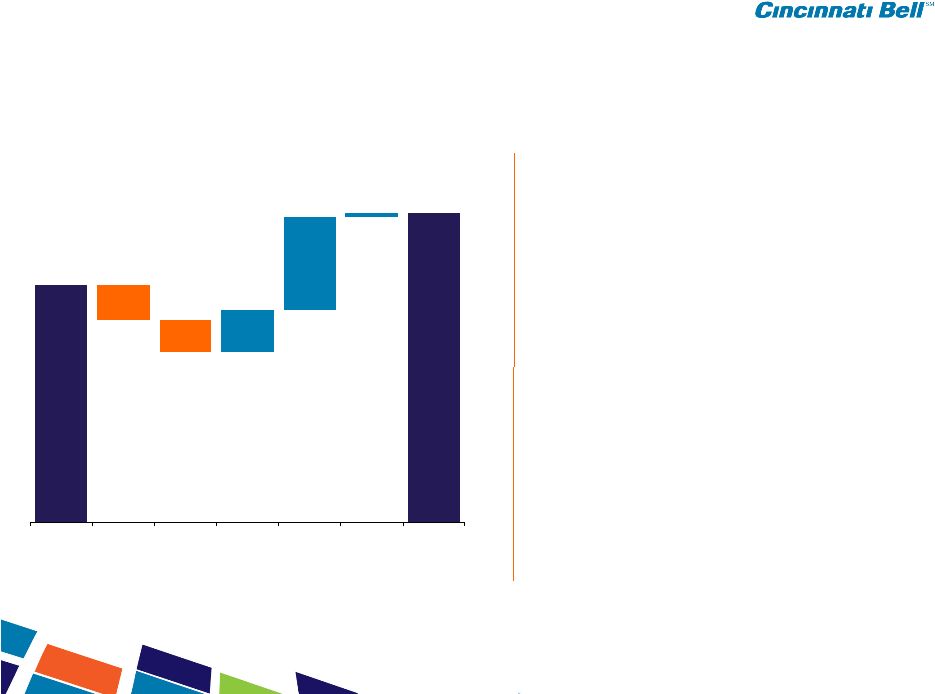
2010 Revenue
$54M increase in Data Center Colocation
•
including $45M from CyrusOne acquisition
$23M increase in IT Services and Hardware
•
$14M / 9% increase in Telecom
and IT equipment
•
$9M increase from Managed &
Professional Services
($18M) decrease in Wireless
•
($14M) decrease in postpaid service
revenue due to fewer subscribers
($21M) decrease in Wireline
•
Access line loss was 7% driving
revenue decline
•
8% LD and VoIP growth
•
Added 13K fiber entertainment subs and
9K high-speed internet subs in 2010
$1,336
($21)
($18)
$23
$54
$3
$1,377
2009
Wireline
Wireless
IT Services &
Hardware
DC
Colocation
Eliminations
2010
($’s in millions) |
 16
16
16
$470
$1
$502
($19)
$14
($3)
$38
2009
Wireline
Wireless
IT Services &
Hardware
DC
Colocation
Corporate
2010
2010 Adjusted EBITDA
$38M increase in Data Center Colocation
•
$28M from CyrusOne acquisition
•
$10M from Cincinnati-based operations
$14M increase in Wireless
•
$10M for renegotiated roaming contracts
•
$3M lower bad debts
•
$7M for lower contract services due to
outsourcing and cost reduction initiatives
•
$9M for reduction in subsidies and handset
costs
•
Partially offset by $15M lower service
revenue
($19M) decrease in Wireline
•
Access line loss was 7% driving Adjusted
EBITDA decline
•
Adjusted EBITDA margin of 47% down
slightly
($3M) decrease in IT Services and Hardware
•
Primarily payroll costs
($’s in millions)
Note: May not foot due to rounding |
 17
17
17
2010 Free Cash Flow
2010 FCF of $149M, decrease of $15M
from 2009
•
$45M lower capital spending
•
$31M increase in Adjusted EBITDA
•
($53M) from higher interest & swap
term payments in 09
•
($23M) sale of wireless towers in 2009
net of pension prepayment
•
($15M) working capital
Free Cash flow yield 27%
$149
($15)
$83
($106)
($53)
$31
$45
$164
YTD 09
Capex
EBITDA
Int Pmts/
09 Swaps
Wireless
Towers Sale
Pension
Post-
Retirement
& other
WC/Other
YTD 10
($’s in millions) |
 18
18
18
Disciplined Investment of Cash Flow
Cash Flow From Operations
2006
$335M
2007
$309M
2008
$404M
2009
$266M
2010
$300M
Fioptics &
Maintenance Capex
Data Center
Expansion
Acquisitions
Debt Buyback/
Share Repurchase |
 19
19
19
2011 Earnings Guidance and Focus
•
Generating strong operating cash flows
•
Growing Data Center Colocation
•
Maintaining financial discipline
2011 Guidance
Revenue
$ 1.4 billion
Adjusted EBITDA*
Approx. $530 million
Free Cash Flow
Approx. $5 million
* Plus or minus 2 percent; reflects 2011 definition of Adjusted EBITDA
|
 Ted
Torbeck President, Cincinnati Bell Communications
|
 21
21
21
Focused on maintaining margin stability in
declining business through aggressive cost
reductions
•
Sourcing initiatives to save more than $10M
•
Other cost-out plans implemented
Access line loss is stable, 6.8% for 2010
Fioptics product suite represents growth area,
28K entertainment subs
•
Up 85% vs. 2009
•
Penetration of homes passed is strong at
approximately 30%
•
Consumer ARPU of $115 in Q4 2010
Positive high-speed Internet net adds in
saturated market
Wireline Performance
($MM)
Access Lines & High-speed Internet Subscribers
(000s)
780
724
674
238
248
256
0
500
1,000
2008
2009
2010
$796
$763
$743
$378
$365
$346
48%
48%
47%
0
500
1,000
2008
2009
2010
Revenue
Adj. EBITDA
Adj. EBITDA Margin
Access Lines
High-Speed Internet
Wireline Overview |
 22
22
22
Disciplined Expense Management
Annualized Cost Reductions ($MM)
Sourcing initiatives
$10 -
$13
Payroll and
employee-related
$10 -
$12
Other cost-out programs
$5 -
$10
Total Cost Reductions
$25 -
$35
Wireline Adjusted EBITDA
margins ranged between 47%
and 48% (2008 –
2010)
•
Annual revenue decline of 3-
4% due to access line loss
•
Wireline headcount reduced
from 2,144 in 2008 to 1,863 in
2010
Margins will be maintained with:
•
Sourcing initiatives
•
Additional headcount
reductions
•
Other cost-out programs |
 23
23
23
Sourcing Initiative
Reducing vendor
count; leveraging
largest suppliers
Renegotiating
supplier agreements
to achieve better
pricing
Adding cost
deflation factors
for multi-year
agreements
Leveraging
suppliers with better
market intelligence
and competition
Structured Sourcing Process
2011 Savings Target: $10 -
13 million
•
$10 million already locked in from
numerous suppliers
•
Focused on further reductions
through multi-year contract negotiations |
 24
24
24
Wireline Cost Discipline
($MM)
$796
$763
$743
23.7%
22.5%
22.8%
0
200
400
600
800
1,000
2008
2009
2010
Wireline Revenue
Payroll/Benefits as
percent of revenue
2011
Savings
Target:
$10
-
12 million
•
Achieved $5 million savings in 2011
from second half of 2010 headcount
reductions
•
Completed majority of 2011
reductions in January and February
providing additional
$5 million savings
•
Started negotiations for union
contract
–
Strong skill sets in union
workforce
–
Compensation plans are above
market
Payroll Initiative |
 25
25
25
Entertainment, high-speed Internet and
voice via fiber to the home and IPTV
•
325 channel line up, including 66 HD
channels, music, local programming
•
Majority of subscribers opt for
bundle of 2 or 3 services
30% penetration of households passed
•
79,000 units passed, more than 10%
of ILEC households
•
28,000 entertainment subs
•
27,000 high-speed Internet subs
•
Consumer monthly ARPU of
approximately $115 in Q4 2010
Consumer
Fioptics
Product
Bundling
Consumer Subscriber Attach Rates
Fioptics Growth
15%
43%
42%
1 Product
2 Products
3 Products
0%
20%
40%
60%
80%
100%
Video
Internet
Voice
81%
88%
58% |
 26
26
26
Unbeatable Bundles
Bundles include DirecTV in areas not
served by Fioptics
•
Churn in a bundle with entertainment
product is reduced by 50 basis points
Fioptics 2011 capital spend of $40
million; will reach 70,000 more homes
•
Construction includes DSL upgrade for
bandwidth to allow IPTV product under
Fioptics brand name |
 27
27
27
2010 Adjusted EBITDA Margin of 31%
•
Highest since 2003
•
Cost reduction initiatives in 2010 were
permanent
•
Expect similar margins for 2011
Postpaid subscribers have decreased
•
Churn consistent at 2.1%
•
Results reflect impact of significant spending
by national carriers to market network and
maintain exclusivity contracts for premium
handsets
Prepaid subscribers have increased
•
Churn improved to 6%
•
Stronger network than competitors
•
Competitive rate plans
Wireless Performance
($MM)
Wireless Customers
(in 000s)
$316
$307
$289
$83
$77
$91
26%
25%
31%
0
100
200
300
400
2008
2009
2010
404
379
351
147
154
158
2008
2009
2010
Revenue
Adj. EBITDA
Adj. EBITDA Margin
Postpaid
Prepaid
Wireless Overview |
 28
28
28
Smartphone subscribers up 24% from
2009 and 144% from 2008
•
Smartphones now represent 27% of all
postpaid phones
•
Consumer smartphones are up to 24%
of postpaid consumers
•
Expect continued increases in
smartphones
Data ARPU up 17% from 2009 and 46%
from 2008 driven by smartphone
penetration gains
Postpaid ARPU
Smartphones and ARPU
Smartphone Customers
(in 000s)
43
83
96
9
2
2008
2009
2010
$40.67
$38.56
$38.10
$8.02
$10.00
$11.69
2008
2009
2010
Postpaid
Prepaid
Voice
Data
$48.69
$48.56
$49.79 |
 29
29
29
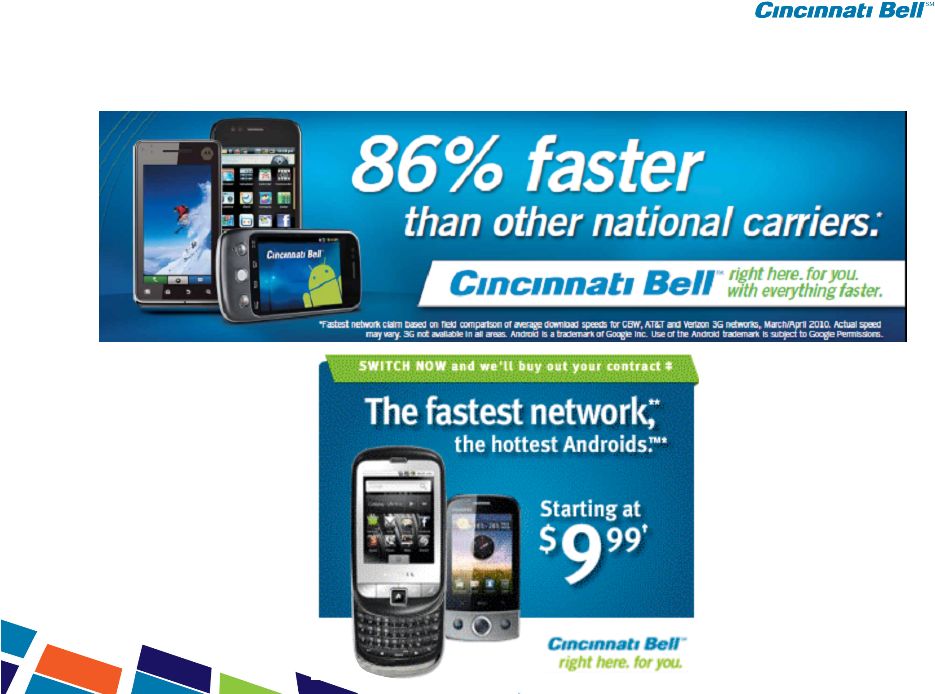
Blaze
9100
Motorola
Milestone
Alcatel 981
Samsung
Behold 2
Android
Windows Mobile
HTC Maple
BlackBerry
Huawei 8100
9700/9780
Pharos
Traveler
137
9300
Growing Smartphone Line Up
Blaze 2.1
Commtiva Tablet |
 30
30
30
Superior Network Speeds |
 31
31
31
Investments made in IT workforce
bench strength
Economy still recovering from 2008
Integration of processes between IT
Services & Hardware with Wireline is
underway
•
Sales teams
•
Technical support
Capital spend focused on data
centers and Fioptics, so IT Services
& Hardware growth will be limited
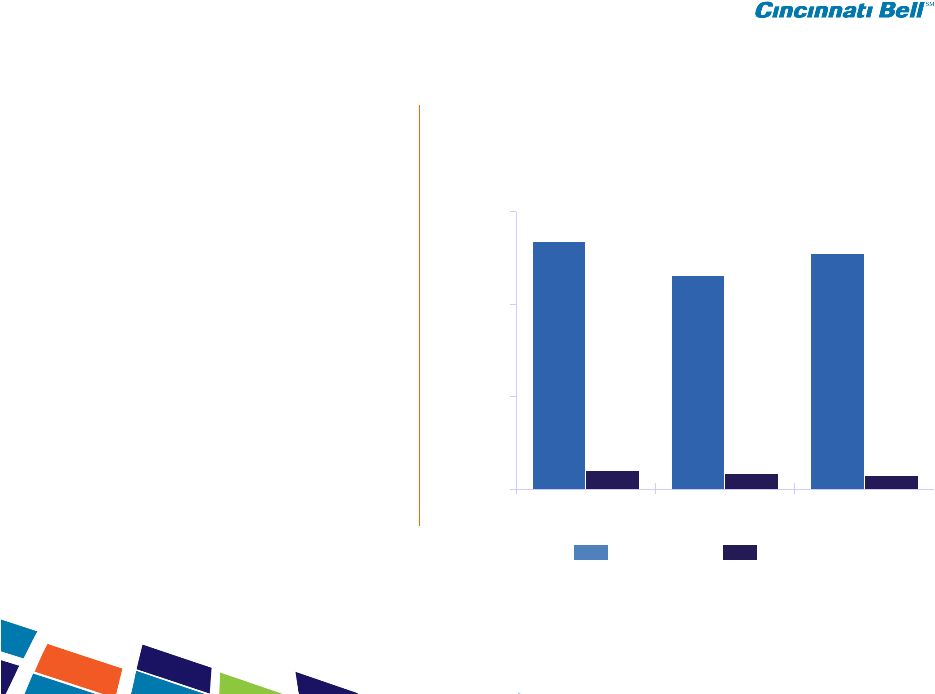
($MM)
$267
$231
$255
$20
$17
$14
$-
$100
$200
$300
2008
2009
2010
Revenue & Adjusted EBITDA
Revenue
Adjusted EBITDA
IT Services and Hardware |
 Gary Wojtaszek
Chief Financial Officer |
 33
33
Evolution of Data Center Landscape
CIO’s need to re-engineer the information grid
Enterprise demand for information is accelerating
Demand for “digital energy”
is growing exponentially
Demand for data centers
Data Centers are purchased as a service |
 34
34
34
Enterprise Demand for Information
2008
2013
39x
5x
4x
3x
Accelerating demand for
information across all
enterprises:
–
Corporate/
Enterprise/Internet
–
Media &
Entertainment
–
Healthcare &
Financial Services
–
Government/
Defense
Growth drivers*…
•
Mobile platform usage up 39x
•
Video, real-time apps up 5x
•
IP traffic up 4x
•
Shift to cloud up 3x**
Source: *CISCO VNI, June 2010
**Gartner, 2009 |
 35
35
Re-engineering the Information Grid –
Reconfiguration
Reconfiguring of information –
digitization
Accessibility, speed, timeliness
Migration to network-centric
computing
Demand for “always on”
power
Corporate data storage and
disaster recovery requirements
Fortune 500 CIO’s have multiple locations
globally, with thousands of applications
running in them, and all are currently being
confronted with the same challenges in
terms of how to manage them. |
 36
36
Email
Collaboration
Re-Engineering the Information Grid –
Accessibility, Speed, Timeliness
Latency Sensitivity
Best Effort
> 100ms
> 2000km
Priority
< 100ms
< 2000km
Real-Time
< 100ms;
< 2000km
Procurement
Analytics
HR/
Finance/
CRM/ERP/
BI
Voice
Virtual
Desktop
Proximity
< 5ms;
< 50km
Cincinnati Bell Data Center Focus
Main Frame
Archive/
DR Apps
Web/HTTP
Collaboration
Video
Trading
Desk
Imaging
Apps
Transactional
Apps
Document
Management |
 37
37
West Coast
CyrusOne
East
Coast
CBB
Product offering must meet
quality standards and
geography
that
customers
require
Four locations around the
country will put CBB within
10 milliseconds or less of
over 90% of the
population of the US
These locations will also
be sufficient to cover over
90% of the applications
run by Fortune 500
companies
Re-Engineering the Information Grid –
Accessibility, Speed, Timeliness |
 38
38
Processor speed
doubling approximately
every two years
Internet network hosts and gross
capacity
of
disk
drives
imply
exponential
relationship
between processing power,
network connectivity, and data creation
Computing
consumes
9
percent
of
total
electric in the U.S.
Demand for “Digital Energy”
Source: Energy
per Instruction
Trends in Intel®
Microprocessors,
Microarchitecture
Research Lab,
Intel Corporation
Power versus Performance
Data is not virtual; requires a physical location
with
“always
on”
power
to
exist
Enterprise data center demand is at inflection
point;
beginning
to
grow
at
increasing
rate
Enterprise users require significant “always
on”
processing & storage capacity
for data
Enterprise
shift
to
digital
grade
power
Data Centers
45
1.2%
PCs & Monitors
235
6.4%
Modems, Routers, etc.
67
1.8%
Phone Network
0.4
0%
Total
347.4
9.4%
Total U.S. Power
(billions, kWh)
3,691
Internet/Computing Infrastructure Power
Billons kWh
% of Total
Source: Lawrence Livermore labs and
Stanford University, 2007 |
 39
39
Data Center is…
large computing warehouse
Electric Utilities
generate electricity
and deliver to the
Data Center
Power is cleaned up
and converted into
“computing”
products
Which is consumed
by people and
businesses
Digital Energy
SAN |
 40
40
Demand for Data Centers
73%
79%
84%
92%
97%
70%
75%
80%
85%
90%
95%
100%
2009
2010
2011
2012
2013
Multi-Tenant Data Center Utilization –
Global
6%
5%
5%
5%
7%
14%
13%
15%
16%
17%
0%
2%
4%
6%
8%
10%
12%
14%
16%
18%
2009A
2009P
2010P
2011P
2012P
Supply Growth
Demand Growth
Supply / Demand Imbalance
Imbalance equates to expected
global data center utilization
increasing from 65% in 2008 to
93% in 2012
Source: Tier 1 Research
Source: Tier 1 Research |
 41
41
Source: Gartner –
Jan 2009
How do you Obtain DC Space?
What is Your Expected Need?
How much Space will you Need?
Gartner DC Customer Poll
Shows Compelling Statistics
Only 10% of market is
outsourced and most will run
out of space in three years
10% of companies have
outsource relationship
84% currently do not
70% of companies
will need at least 1k
Sq Ft of Space –
Mid
Range Companies
30% will need
greater than 3k –
Enterprise Range
Data Center Demand Outlook
67% of companies will
need space within 36
months |
 42
42
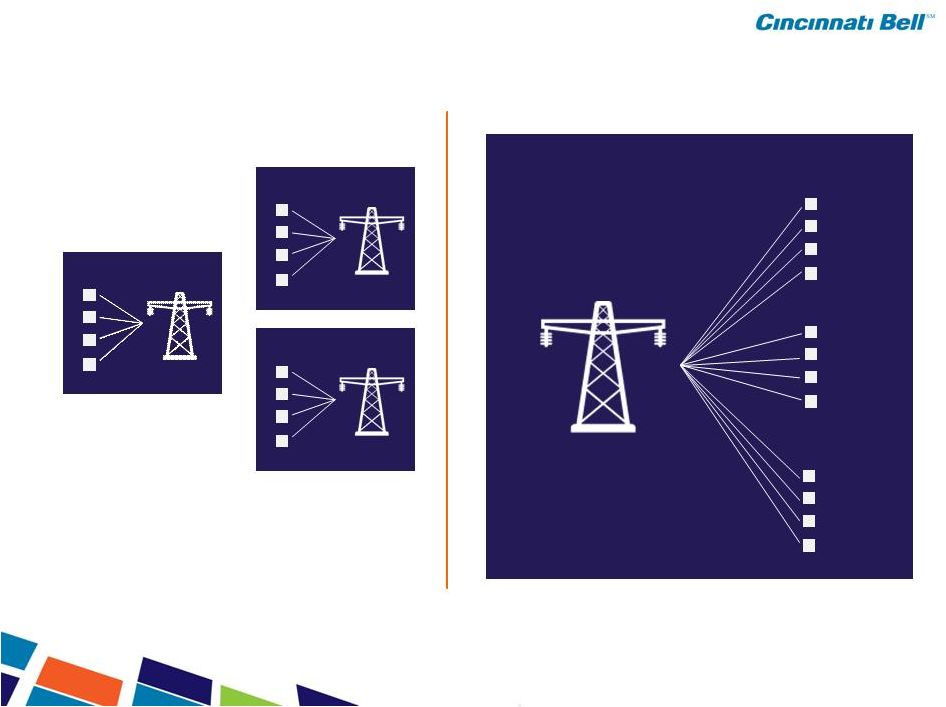
Company A
Company B
Company C
Data Centers are Consumed as a Utility
Situation 1905
Situation 1910
Company A
Company B
Company C
Each company has a “VP of
Electricity”, which is similar to
today’s scenario where each
company has its own data center
In a few years, companies eliminate “VP of
Electricity”
and begin purchasing power
from the utility company, which we believe
will happen in data centers |
 43
43
Data Center Colocation:
Key Financial Highlights
Fundamentally Strong Model
–
Proven Growth
–
Revenue Visibility
–
Diverse Customer Base
–
High Operating Margins
–
Low Cost of Capital
–
Targeted Execution
Creates Sound & Reliable Results
33% Revenue CAGR since 2008;
19% growth in 2010
58% Adjusted EBITDA CAGR since
2008; 36% growth in 2010
LQA Q4 2010 margins are 18 pts
higher than 2008
•
Scale, experience yielding greater
efficiencies
Strong cash Return on Assets |
 44
44
44
Consolidated Pro Forma Results –
Data Center Colocation
MM
$87
$130
$154
$162
$35
$64
$87
$94
40%
49%
56%
58%
30%
35%
40%
45%
50%
55%
60%
$0
$20
$40
$60
$80
$100
$120
$140
$160
$180
2008(*)
2009(*)
2010(**)
LQA Q4 2010
Revenues
Adj. EBITDA
Adj. EBITDA Margin
* CyrusOne results derived from unaudited financial statements and do not include
purchase accounting adjustments ** Prior to June 30, 2010, CyrusOne results derived from proforma unaudited financials and do
not include purchase accounting adjustments. After June
30, 2010, amounts include purchase accounting adjustments |
 45
45
Majority of data center capacity located in the
Top 25 Metropolitan Statistical Areas
Approximately 13,000 firms with more than
500 employees
Space utilization of 88%; 563k sq ft utilized at Q410
versus 389K sq ft utilized at Q409
Sizable Footprint with Significant
Upside Opportunities
Data Center Capacity
Entity
Market
Facilities (#)
Data
Center
Capacity
CBTS
Cincinnati, OH
6
425,000
CyrusOne
Houston, TX
3
118,000
CyrusOne
Dallas, TX
3
57,000
CyrusOne
Austin, TX
1
12,000
CBTS
Chicago, IL
1
14,000
CBTS
Other Markets
3
13,000
17
639,000
387
389
563
25
57
76
0
100
200
300
400
500
600
700
2008
2009
2010
Utilized
Available
Markets Served
94%
88%
87% |
 46
46
46
Return on Data Center Colocation Assets
LQA Q410 Adj. EBITDA of $51M
Opening PP&E of $154M
Cyrus One
Opening
Balance Sheet
Current assets
11
$
Property, Plant, and Equipment
154
Goodwill and Intangibles
407
Total Assets
572
$
Liabilities
46
$
Net Assets Acquired
526
$
MM
Cyrus is generating an approximate 33%
cash return on its investment |
 47
47
($MM)
500
625
775
248
248
0
100
200
300
400
500
600
700
800
900
1000
1100
1200
Bonds
90% of our maturities are
2017 and beyond
Note: Excludes capital lease obligations and unamortized call premiums on
terminated interest rate swaps. No Significant Debt Maturities Until 2017
|
 48
48
48
Implied
Segment
Valuation
Multiples
–
2010
2010A Trading Multiples
Residual
Value
10.0x 2010A
Trading Multiple
67% Implied Discount
CBB
Consol.
Wireline
Wireless
IT Services
and
Hardware
Data Center
Colocation
2010A Adj. EBITDA
520.5
345.6
90.7
14.4
86.6
Trading Multiples
6.0x
6.5x
5.5x
5.0x
3.5x
Valuation
3,123.0
2,246.4
498.9
72.0
305.8
6.0x
6.5x
5.5x
5.0x
3.5x
CBB Consol.
Wireline
Wireless
IT Services and
Hardware
Data Center
Colocation |
 49
49
Considerable Accretion to Equity Investors
Assumes $25M of annual Adj. EBITDA growth in Data Center business at 10x
multiple and 5% annual Adj. EBITDA decline in Legacy CBB at 5x multiple
$0
$500
$1,000
$1,500
$2,000
$2,500
$3,000
$3,500
$4,000
$4,500
2010
2011
2012
2013
2014
2015
2016
2017
2018
Value of Legacy CBB
Value of Data Center
Debt Balance |
 50
50
50
Facing Challenges with Solutions
Challenge
Enterprise class customers are
beginning to embark on an outsourcing
wave
driven by a rationalization of their
existing data centers
Enterprise class companies want to
simplify their supply chains
Enterprise class customers want
suppliers to innovate and make their
lives easier
Solution
Create best-in-class data centers
globally
that will offer our data centers
as an infrastructure or service
Establish global presence with common
processes and procedures
Establish enhanced reporting and
other features
that Fortune 1000
customers want |
 Dave Ferdman
Chief Executive Officer, CyrusOne |
 52
52
“Data
Center
As
A
Service”
–
our
terminology for our offering
Utilized square feet of ~162K
•
Utilization rate of 87%
2010 Adjusted EBITDA up 38% y/y
CyrusOne has performed right on plan
•
Q4 annualized EBITDA implies a
10x purchase price multiple vs.
original 12.8x at acquisition
Executed turn-key data center solution
in London to meet customer demand
•
Space will be ready
for customers in Q2
Data Center Colocation Performance
($MM)
(%)
Data Center Sq. Ft. Growth
Sq. Ft. (000’s)
* Derived from the audited financial statements of CyrusOne
and does not include purchase accounting adjustments
** Prior to June 30, 2010, derived from proforma unaudited
financials and does not include purchase accounting
adjustments. After June 30, 2010, amounts include purchase
accounting adjustments
CyrusOne Colocation Overview
$21
$31
$58
$74
$9
$15
$32
$44
43%
48%
55%
59%
0%
10%
20%
30%
40%
50%
60%
70%
$-
$10
$20
$30
$40
$50
$60
$70
$80
2007 (*)
2008 (*)
2009 (*)
2010 (**)
Revenue
Adj. EBITDA
Adj. EBITDA Margin
53
85
164
187
–
20
40
60
80
100
120
140
160
180
200
2007
2008
2009
2010
Houston
Dallas
Austin |
 53
53
High Touch, High Service Based Model
•
Four Seasons vs. Apartment Tenant
Fortune 1000 Enterprise customers
•
Great logos and top tier credit quality
•
Long-term, contracted recurring
revenue –
over 98% recurring
revenue
•
High operating leverage
Tier III data center campuses
•
Existing customer requirements can
be met
CyrusOne Distinctive Qualities
Superior sales force empowered and
able to own customer relationships
•
Highly structured sales process that
focuses on deep relationship selling
•
Current customers are best sales tool
and also generate over half of
incremental future revenue
Straightforward, simple business model
•
Do one thing (Data Center As A
Service) and do it better than anyone
in the industry
•
Predictable, high growth, great
visibility |
 54
54
Worldwide
customer
base
currently
utilizing
Texas Data Centers As A Service
Premium
Quality
Assets
designed
to
attract
world’s largest companies
Current Space utilization of 87%
Sizable Footprint –
Significant Upside Opportunities
Houston
Dallas
Austin
London
Total
%
Sold Space
106,000
62,000
10,000
-
178,000
44%
Built-out Space (ready for sale)
12,000
14,000
3,000
-
29,000
7%
Space under construction
11,000
47,000
3,500
5,000
66,500
17%
Available for Future Space *
60,000
-
54,000
15,000
129,000
32%
Total Data Center Space
189,000
123,000
70,500
20,000
402,500
100%
* Includes executed build-to-suit leases which are under construction in Austin and Houston;
but excludes all ROFR space Data Center Space (Sq. ft.) as of March 1, 2011
|
 55
55
Recurring revenue with contracted installed base
98% of revenue base is recurring with annual
churn of less than 1%
Large diversification of current industries:
55
Enterprise businesses in the Fortune 1000
Customers looking for highest levels of
quality and service
Top 5 target sub-segments include:
•
Manufacturing
•
Healthcare
•
Oil and Gas
•
Financial services
•
Technology
Current Customer Distribution
Target Customers
Current and Target Customer Profile |
 56
56
Customer Base and Contract Terms
56
Take-or-pay contracts with 3 to 7 year
average contract life and renewal periods
•
High renewal rates with annual
churn of less than 1%
Blue chip customer base
•
Five of the top 10 global companies
High average monthly recurring revenues
per customer.
•
Top 50 customers average
MRR of approximately $120K
Customers are nearly 100% multi-
application, Production Enterprise
Customers
Representative Customers of
Cincinnati Bell’s Colocation business |
 57
57
What Customers Have to Say…
“Working with CyrusOne was the obvious choice.”
“We are now going on two years after making the decision and one year of
being at CyrusOne and to be honest we have to pinch ourselves every now and
then to make sure we are not dreaming.”
“My staff would rate CyrusOne extremely high. It would be our expectation to
renew with them at the end of our agreement.”
57
Highest Levels of Customer Service |
 58
58
58
% of Revenue
Strong revenue growth and
operating leverage have
produced growing EBITDA
margins (69% CAGR ‘07-’10)
Once a data center is established,
rental and most staff costs are
fixed/semi-fixed leading to an
increase in incremental profit
Operating Leverage Leads
to Profitable Growth
0%
10%
20%
30%
40%
50%
60%
70%
80%
90%
100%
2007
2008
2009
2010
Personnel
Property
Other
Power
Adj. EBITDA |
 59
59
Rapid growth in digital
information traffic
•
Worldwide internet IP traffic
grew by an estimated 63% last
year
Increased regulatory &
compliance requirements
•
Sarbanes Oxley, HIPAA, etc.
Cost control and budget
constraints
•
Outsourcing represents an
attractive alternative to capital
intensive in-house solutions
Market Drivers for Data Center as a Service
Prohibitive customer
switching costs
•
Hard and soft switching costs
fuel continued growth by existing
customers
Supply-demand imbalance
•
Global demand continues to
significant outweigh supply |
 60
60
Supply -
Demand Imbalance
6%
5%
5%
7%
14%
13%
15%
16%
17%
5%
–
5%
10%
15%
20%
2008A
2009P
2010P
2011P
2012P
Supply Growth
Demand Growth
65%
70%
77%
93%
84%
–
25%
50%
75%
100%
2008A
2009P
2010P
2011P
2012P
Global Data Center Utilization
Global demand growth over the next four years is expected
to be 16% on average, while average supply growth is
expected to be 6% over the same time period
This imbalance equates to expected global data center
utilization increasing from 65% in 2008 to 93% by 2012
Source: Tier 1 Research |
 61
61
Value Proposition of “Data Center As A Service”
Superior customer experience
Premium facilities and technical
expertise
High availability & power density
Secure “worry free”
environment
Customer flexibility
Financial predictability
Attractive alternative to capital
intensive in-house solutions
(CapEx to OpEx) |
 62
62
62
1
2
3
4
5
6
7
8
Initial
Qualification
Scoping,
Proposal &
Engineering
Negotiations/
Order Creation
Implementations
Accounting
Operations
Account and
Service Delivery
Management
Marketing/
Lead Generation
Go to Market Strategy –
Eight Stage Process |
 63
63
Expanding Distribution Model
Local Sales Model
–
Original Focus
Direct Sales Force
Local Contacts
Specific Advertising in Local Market
63
National Campaign
–
Future Focus
Add Sales Force around the world
–Hire with focus on Enterprise
Market
Web Presence
Email
Social Networking
National Advertising
Trade Shows/Analyst Coverage
–
Gartner
–
IDC
–
Forresters |
 Question & Answer
Management Team |
 Thank you! |
 Appendix |
 Kim Sheehy
VP, Investor Relations & Treasurer
kim.sheehy@cinbell.com
513-397-7862
Contact Information |
 68
68
Adjusted EBITDA Definition
Cincinnati Bell
Reconciliation of Adjusted EBITDA
2010
2011
Adjusted EBITDA, as reported
$502
$510
Pension and OPEB expenses:
Interest cost
32
28
Expected return on assets
(28)
(25)
Amortization of loss
13
17
Adjusted EBITDA, new definition
$519
$530
(in millions) |
 69
69
Non-GAAP Reconciliations
$ in millions
Wireline
Wireless
Data Center
Colocation
IT Services &
Hardware
Corporate
Total
Company
Operating Income (GAAP)
233.5
$
56.3
$
34.2
$
4.3
$
(29.0)
$
299.3
$
Add:
Depreciation and amortization
103.9
33.4
34.6
7.3
0.3
179.5
Restructuring charges
8.2
1.0
1.4
2.8
0.3
13.7
Acquisition costs
-
-
-
-
9.1
9.1
Adjusted EBITDA (Non-GAAP)
345.6
$
90.7
$
70.2
$
14.4
$
(19.3)
$
501.6
$
Wireline
Wireless
Data Center
Colocation*
IT Services &
Hardware*
Corporate
Total
Company
Operating Income (GAAP)
255.6
$
33.0
$
17.0
$
10.7
$
(20.8)
$
295.5
$
Add:
Depreciation and amortization
103.9
39.4
15.0
6.2
0.4
164.9
Restructuring charges and loss on sale of asset
5.0
4.8
-
-
-
9.8
Adjusted EBITDA (Non-GAAP)
364.5
$
77.2
$
32.0
$
16.9
$
(20.4)
$
470.2
$
Wireline
Wireless
Data Center
Colocation*
IT Services &
Hardware*
Corporate
Total
Company
Operating Income (GAAP)
258.4
$
46.8
$
8.0
$
13.4
$
(21.4)
$
305.2
$
Add:
Depreciation and amortization
101.2
35.5
11.2
5.8
0.2
153.9
Restructuring, asset impairment, patent lawsuit
and operating tax settlements
18.1
0.5
-
0.7
1.8
21.1
Adjusted EBITDA (Non-GAAP)
377.7
$
82.8
$
19.2
$
19.9
$
(19.4)
$
480.2
$
*
2008 and 2009 amounts have been revised to split the Technology Solutions
segment into the Data Center Colocation and IT Services and Hardware
segments Twelve Months Ended December 31, 2010
Twelve Months Ended December 31, 2009
Twelve Months Ended December 31, 2008 |
 70
70
Non-GAAP Reconciliations
Twelve Months Ended
December 31, 2007
Total
Company
Operating Income (GAAP)
282.4
$
Add:
Depreciation and amortization
150.8
Restructuring charges
39.8
Adjusted EBITDA (Non-GAAP)
473.0
$
Wireline
Wireless
Data Center
Colocation
IT Services &
Hardware
Corporate
Total
Company
Operating Income (GAAP)
52.5
$
4.1
$
9.2
$
4.0
$
(5.3)
$
64.5
$
Add:
Depreciation and amortization
26.7
8.0
13.0
2.1
-
49.8
Restructuring charges
4.9
1.0
1.4
1.0
0.2
8.5
Adjusted EBITDA (Non-GAAP)
84.1
$
13.1
$
23.6
$
7.1
$
(5.1)
$
122.8
$
Three Months Ended December 31, 2010
$ in millions |
 71
71
Non-GAAP Reconciliations
$ in millions
Twelve Months
Twelve Months
Ended December 31,
Ended December 31,
2010
2009
Reconciliation of GAAP Cash Flow to
Free Cash Flow (as defined by the company)
Net increase (decrease) in cash and cash equivalents
54.3
$
16.3
$
Less adjustments:
Issuance of long-term debt
(2,134.3)
(492.8)
Net change in credit and receivables
facilities with initial maturities less than 90 days
85.9
42.1
Repayment of debt
1,554.5
506.5
Debt issuance costs
42.6
15.3
Common stock
repurchase 10.0
73.2
Acquisitions of businesses
526.7
3.4
Acquisition
costs 9.1
-
Free cash flow (as defined by the company)
148.8
$
164.0
$
|
 72
72
Non-GAAP Reconciliations
2007
2008
2009
2010
Total debt
2,009.7
1,960.7
1,979.1
2,523.6
Less: Interest rate swap adjustment
(2.9)
(22.4)
(14.6)
(3.8)
Less: Cash and cash equivalents
(26.1)
(6.7)
(23.0)
(77.3)
Net debt (as defined by the company)
1,980.7
$
1,931.6
$
1,941.5
$
2,442.5
$
December 31,
2007
2008
2009
2010
CyrusOne Operating Income (GAAP)
4.5
$
8.1
$
24.3
$
22.6
$
Depreciation and amortization
4.0
7.3
7.7
21.5
CyrusOne Adjusted EBITDA (Non-GAAP)
8.5
$
15.4
$
32.0
$
44.1
$
*
2007-2009 amounts were derived from unaudited financial statements and do not
include purchase accounting adjustments. Prior to June 30, 2010, amounts were derived from
proforma unaudited financials and do not include purchase accounting adjustments. After June 30, 2010, amounts
include purchase accounting adjustments.
Twelve Months Ended December 31,
Three Months Ended
December 31, 2010
CyrusOne
CyrusOne Operating Income (GAAP)
4.8
$
Depreciation and amortization
8.0
CyrusOne Adjusted EBITDA (Non-GAAP)
12.8
$
$ in millions |