Attached files
Table of Contents
UNITED STATES
SECURITIES AND EXCHANGE COMMISSION
WASHINGTON, D.C. 20549
FORM 10-K
(Mark One)
| x | Annual report pursuant to section 13 or 15(d) of the Securities Exchange Act of 1934 for the fiscal year ended December 31, 2010 or |
| ¨ | Transition report pursuant to section 13 or 15(d) of the Securities Exchange Act of 1934 for the transition period from to |
Commission file number 000-18217
TRANSCEND SERVICES, INC.
(Exact name of registrant as specified in its charter)
| Delaware | 33-0378756 | |
| (State or other jurisdiction of incorporation or organization) |
(IRS Employer Identification No.) | |
| One Glenlake Parkway, Suite 1325, Atlanta, GA | 30328 | |
| (Address of principal executive offices) | (Zip Code) | |
Registrant’s telephone number, including area code: (678) 808-0600
Securities registered pursuant to Section 12(b) of the Act:
None.
Securities registered pursuant to Section 12(g) of the Act:
Common Stock, $0.05 par value
(Title of class)
Indicate by check mark if the registrant is a well-known seasoned issuer, as defined in Rule 405 of the Securities Act. Yes ¨ No x
Indicate by check mark if the registrant is not required to file reports pursuant to Section 13 or Section 15(d) of the Act. Yes ¨ No x
Indicate by check mark whether the registrant (1) has filed all reports required to be filed by Section 13 or 15(d) of the Securities Exchange Act of 1934 during the preceding 12 months (or for such shorter period that the registrant was required to file such reports), and (2) has been subject to such filing requirements for the past 90 days. Yes x No ¨
Indicate by check mark whether the registrant has submitted electronically and posted on its corporate Web site, if any, every Interactive Data File required to be submitted and posted pursuant to Rule 405 of Regulation S-T during the preceding 12 months (or for such shorter period that the registrant was required to submit and post such files). Yes ¨ No ¨
Indicate by check mark if disclosure of delinquent filers pursuant to Item 405 of Regulation S-K is not contained herein, and will not be contained, to the best of registrant’s knowledge, in definitive proxy or information statements incorporated by reference in Part III of this Form 10-K or any amendment to this Form 10-K. ¨
Indicate by check mark whether the registrant is a large accelerated filer, an accelerated filer, a non-accelerated filer, or a smaller reporting company. (See definitions of “large accelerated filer”, “accelerated filer”, and “smaller reporting company” in Rule 12b-2 of the Exchange Act. (Check one):
| Large accelerated filer ¨ | Accelerated filer x | |
| Non-accelerated filer ¨ | Smaller reporting company ¨ |
Indicate by check mark whether the registrant is a shell company (as defined in Rule 12-b2 of the Act). Yes ¨ No x
The aggregate market value of the registrant’s common stock held by non-affiliates of the registrant as of June 30, 2010 was approximately $141,560,000, based on the price at which the registrant’s common stock was last sold on June 30, 2010.
As of February 28, 2011, the registrant had 10,587,932 shares of common stock, $0.05 par value per share, outstanding.
DOCUMENTS INCORPORATED BY REFERENCE
Portions of the registrant’s Proxy Statement for its 2011 Annual Meeting of Stockholders are incorporated by reference into Part III of this report.
Table of Contents
| Page | ||||||
| Part I | ||||||
| Item 1. |
1 | |||||
| Item 1A. |
12 | |||||
| Item 1B. |
22 | |||||
| Item 2. |
22 | |||||
| Item 3. |
22 | |||||
| Item 4. |
23 | |||||
| Part II | ||||||
| Item 5. |
24 | |||||
| Item 6. |
26 | |||||
| Item 7. |
Management’s Discussion and Analysis of Financial Condition and Results of Operations |
27 | ||||
| Item 7A. |
37 | |||||
| Item 8. |
38 | |||||
| Item 9. |
Changes in and Disagreements with Accountants on Accounting and Financial Disclosure |
70 | ||||
| Item 9A. |
70 | |||||
| Item 9B. |
71 | |||||
| Part III | ||||||
| Item 10. |
72 | |||||
| Item 11. |
72 | |||||
| Item 12. |
Security Ownership of Certain Beneficial Owners and Management and Related Stockholder Matters |
72 | ||||
| Item 13. |
Certain Relationships and Related Transactions, and Director Independence |
72 | ||||
| Item 14. |
72 | |||||
| Part IV | ||||||
| Item 15. |
73 | |||||
| 78 | ||||||
Table of Contents
PART 1.
CAUTIONARY NOTE REGARDING FORWARD LOOKING STATEMENTS
Certain statements in this annual report on Form 10-K, or this Annual Report, including but not limited to Item 7, “Management’s Discussion and Analysis of Financial Condition and Results of Operations” constitute forward-looking statements within the meaning of Section 27A of the Securities Act of 1933, as amended, or the Securities Act, and Section 21E of the Securities Exchange Act of 1934, as amended, or the Exchange Act. Forward-looking statements are based upon current assumptions, expectations and beliefs concerning future developments and their potential effect on our business. These forward-looking statements are not guarantees of future performance and involve risks, uncertainties and assumptions that are difficult to predict. Actual outcomes and results may differ materially from what is expressed or forecast in these forward-looking statements. Factors that might cause or contribute to such differences include, but are not limited to, those referred to in Item 1A, “Risk Factors.” You are cautioned not to place undue reliance on forward-looking statements, which speak only as of the date they were made. The Company undertakes no obligation to publicly update or revise any forward-looking statements, whether as a result of new information, future events or otherwise. Words such as “expects,” “intends,” “plans,” “projects,” “believes,” “estimates,” “anticipates,” and similar expressions are used to identify these forward-looking statements, but their absence does not mean that a statement is not forward-looking. Forward-looking statements in this Annual Report may include, but are not limited to, any statements regarding:
| • | continuing demand for medical transcription services; |
| • | the effects of government regulation; |
| • | outsourcing trends; |
| • | our ability to complete and integrate acquisitions and manage future growth; |
| • | our ability to both retain existing customers and generate new customer accounts; |
| • | our ability to generate new business by working with technology partners; |
| • | our ability to maintain technological leadership; |
| • | our ability to compete successfully against current or future competitors; |
| • | our ability to retain key personnel and to recruit and hire a sufficient number of new or replacement medical language specialists; |
| • | the financial and operations risk inherent to our global operations; |
| • | the adequacy of our capital and the impact of changes to the overall economic environment on our ability to obtain needed capital; and |
| • | the ability to obtain and maintain required technology such as third-party software. |
| ITEM 1. | BUSINESS |
We are the second largest medical transcription services company in the United States based on revenues. We serve approximately 331 hospital customers nationwide plus a number of clinics and physician’s offices. We estimate that our primary target market is approximately $2.5 billion, comprised primarily of approximately 5,000 community-based hospitals (hospitals accessible by the general public) in the United States. Our mission is to provide accurate and timely documentation of the patient/medical provider encounter at a competitive price. Customer service is crucial to our success, and we have consistently been ranked among the top medical transcription service organizations in the industry. Our approximately 2,400 medical language specialists, including 750 based in India, supplemented by our offshore partners, provide high quality medical documents and fast turnaround times, resulting in a high customer retention rate, which has averaged more than 95% (measured by revenues) over the last four years. We develop and utilize an array of technology solutions to support the transcription process, including robust voice capture systems, state-of-the-art speech recognition
1
Table of Contents
technology, our proprietary transcription platforms and various customer-specific systems. We believe we are well-positioned to benefit from the increasing adoption and use of electronic medical records, or EMRs, because the data and narrative content we create comprise key portions of EMRs.
Hospitals have the flexibility of choosing between our two primary service delivery options. Customers with in-house transcription platforms can partner with us to provide medical transcription services directly on their platform. Customers deciding to outsource this function can outsource the entire transcription process to us, in which case we provide our services using our proprietary transcription platforms. We are currently developing a new platform which will provide a third option: a Software as a Service “SaaS” offering for customers with in-house transcription departments that desire to acquire a speech recognition-enabled platform to increase productivity and reduce costs.
Our revenue is recurring in nature, which we believe results from our customers’ ongoing, mission-critical need to document each doctor-patient encounter and our consistently high service levels, resulting in high customer retention rates. Information about revenue, operating profit or loss and total assets is presented in Item 8, “Financial Statements and Supplementary Data” of this Annual Report. Since we are paid directly by hospitals and other providers, we have no direct insurance-related reimbursement risk.
History of the Company
We were originally incorporated in California in 1976 as TriCare, Inc. and reorganized as a Delaware corporation in 1988. As TriCare, we completed our initial public offering in 1990. In 1995, we acquired Transcend Services, Inc. and adopted its name.
Prior to 1999, Transcend operated several businesses, including a medical transcription business. In 1999, we launched a plan to restructure our business to focus on medical transcription using our Internet-based transcription technology. Between 1999 and 2002, we sold three businesses deemed outside our core medical transcription business. Since then, we have operated in one reportable business segment as a provider of medical transcription services to the healthcare industry, and had the following major developments:
| • | In 2004, we introduced our BeyondTXT transcription platform. |
| • | In January, 2005, we acquired Medical Dictation, Inc., or MDI, a Florida-based medical transcription services company for approximately $4.8 million. MDI’s founder, Sue McGrogan, is now our President and Chief Operating Officer. |
| • | In 2005, our field operations were reorganized to form customer-centric teams that are empowered to manage all aspects of production, quality and customer care. |
| • | In December, 2005, we purchased certain assets of the transcription business unit of PracticeXpert, Inc. |
| • | In early 2006, we began processing significant volume through the speech recognition technology integrated into BeyondTXT, and we have steadily increased this volume. In the fourth quarter of 2010, approximately 83% of our BeyondTXT volume was edited using the speech recognition technology integrated into our platform versus transcribed (typed). |
| • | In 2006, we began to process a portion of our work through offshore partners in India. Volume processed offshore has gradually increased to approximately one-third of our total revenue in the fourth quarter of 2010. |
| • | In January, 2007, we purchased certain assets of OTP Technologies, Inc., a Chicago area medical transcription company, for approximately $1.1 million. |
| • | In January, 2009, we purchased certain assets of DeVenture Global Partners, Inc., or DeVenture, a Canton, Ohio-based medical transcription company, for approximately $4.4 million. |
| • | In April, 2009, we acquired the medical transcription business of Transcription Relief Services, or TRS, for approximately $5.6 million. |
2
Table of Contents
| • | In August, 2009, we acquired Medical Dictation Service, Inc., or MDSI, for approximately $15.5 million. |
| • | In December, 2009, we completed a follow-on offering of our common stock, and we raised $26.5 million in net proceeds after underwriters discount and transaction costs. |
| • | In October, 2010, we acquired Spryance Inc. (known as “Heartland”) through a merger of Transcend Acquisition Corporation (a wholly owned subsidiary of Transcend Services, Inc.) into Spryance Inc. The aggregate consideration was approximately $6.5 million. Heartland has extensive operations in India. |
| • | During 2010, we invested significant resources in the development of Encore, our Software as a Service or “SaaS” transcription platform for customers who have in-house transcription departments and desire a speech-recognition enabled platform to improve productivity and reduce costs. We also invested in front-end speech solutions, also known as physician self-edit solutions. These development efforts are expected to continue throughout 2011. |
Industry Overview
According to the U.S. Department of Health and Human Services, spending on healthcare in the United States was approximately $2.5 trillion in 2009, or 18% of GDP. Healthcare spending is projected to grow at a rate of approximately 6% per annum and reach approximately $4.6 trillion, or 20% of GDP, by 2019. Healthcare providers are under increasing pressure to trim costs while continuing to provide quality care, and as a result have increasingly outsourced non-core healthcare functions to improve efficiency, drive down costs and maintain quality patient care.
There is a substantial market for medical transcription services in the United States. Estimates of the total market size vary widely from $5 billion to $12 billion. These estimates include not only hospitals, but also physician’s offices and clinics and also include both the outsourced and the in-house portions of the market. We estimate that our primary target market is approximately $2.5 billion, comprised primarily of approximately 5,000 community-based hospitals (hospitals accessible by the general public) in the United States with a total of approximately 800,000 beds, and which spend over $656 billion per year providing healthcare services according to a 2009 survey by the American Hospital Association. We estimate that the outsourced portion of this market is approximately 50%, although we are not aware of any independent data on the percentage of the hospital market that is outsourced. The market is competitive and highly fragmented, with several thousand transcription services companies nationwide—most of them very small.
The market for transcription services is growing. Demand for medical transcription services grows as the demand for healthcare services increases. Macro-economic trends such as the aging of the baby boomer generation, are projected to significantly increase the demand for healthcare services in general, which we believe will lead to a corresponding increase in the demand for clinical documentation solutions, including medical transcription services. According to the U.S. Census Bureau, the U.S. population over the age of 65 will grow from approximately 40 million in 2010 to 55 million in 2020 and 70 million in 2030.
Demand for outsourced medical transcription services continues to grow as healthcare providers seek to reduce transcription costs. Medical transcription outsourcing is an easy and obvious cost containment strategy. Medical transcription is performed either in-house by hospital personnel or outsourced to local, regional, national or offshore vendors.
Our industry is subject to government regulation. The Health Insurance Portability and Accountability Act, or HIPAA, requires hospitals to maintain adequate security around and the privacy of protected health information. The Health Information Technology for Economic and Clinical Health Act, or HITECH, applies certain HIPAA provisions directly to business associates, such as medical transcription companies, that provide services to entities covered under HIPAA. We believe that the requirements of HITECH will make it more
3
Table of Contents
difficult for smaller transcription companies to compete with us due to the increasing challenges of ensuring compliance with HITECH and HIPAA. This gives us a strategic advantage because we have greater resources and will be able to spread our costs of compliance over a larger number of customers.
We believe we are well positioned to benefit from the increasing adoption and use of EMRs because the data and narrative content we create comprise key portions of EMRs. We believe that our transcription volume could increase if more paper records are dictated so that they can become part of EMRs. For example, physician progress notes are high volume, data rich documents that are often handwritten today, but may be dictated in the future so they can become part of EMRs. Moreover, we believe that our documents are structured in such a way that we can provide enhanced data services directly from the dictated report. However, we also acknowledge that certain EMR vendors are attempting to replace transcription with physician completed templates.
Services
We provide medical transcription services 24 hours per day, seven days per week. Hospitals have the flexibility of choosing between two primary service delivery options we offer:
| • | Customer Platform. Customers with their own transcription platforms can partner with us to provide medical transcription services directly on their platform. The primary advantage to this business model for us is simplicity—there is no transcription system for us to develop, implement and maintain. There is, however, little or no opportunity for us to leverage our technology and platform efficiency to improve profitability. We provide services on numerous platforms. Notable examples include ChartScript (a 3M platform), eScription and Dictaphone (Nuance platforms) and Meditech. Some customers have legacy systems they have developed themselves. Over time, we expect to migrate some customers with older platforms or no current need for their own platform, including certain customers who came to us via our acquisitions, to our platforms. |
| • | Our Platform. Customers with no transcription platform or with no need to continue to support and maintain the platform they have used in the past, can outsource the entire transcription process to us on a turnkey basis. For these customers, we provide our services on our speech recognition-enabled BeyondTXT transcription platform and the Gemstar platform we acquired in the 2010 Heartland merger. |
We believe that our ability to serve customers regardless of platform is an important factor in our success. In the fourth quarter of 2010, approximately 62% of our total volume was processed on our proprietary platforms (including BeyondTXT and Gemstar) and 38% was processed on other platforms.
Our BeyondTXT transcription services consist of three primary phases:
| • | Phase I: Dictation Capture. In this phase, a physician dictates the results of a patient encounter or procedure into a number of different voice capture systems, including hand held devices, dictation capture systems at customer sites and dictation capture systems located in our data center in Atlanta, Georgia. We consolidate these voice files from their various sources at our data center. The result is an electronic voice file that is ready for processing. |
| • | Phase II: Voice to Text. The encrypted digital voice files are securely accessed over the internet by our home-based medical language specialists and offshore partners, who play back voice recordings using headsets and foot pedals, and either transcribe the recorded voice or edit the document created by our integrated speech recognition solution. The percentage of BeyondTXT volume that was edited using speech recognition technology increased from 62% in 2009 to 75% in 2010. The completed electronic documents are then securely returned to our data center over the Internet, where they may be accessed by remote quality assurance personnel. BeyondTXT is an efficient platform for our medical language specialists because of the integrated speech recognition technology and because the formatting of documents occurs automatically after the report is typed or edited. The result is a report that is customer-ready. |
4
Table of Contents
| • | Phase III: Distribution. Completed documents are distributed to end-users in a variety of ways, including interfaces to EMR and hospital information systems, fax machines, printers, or web-based consoles. Contractual turnaround times vary depending on the type of document from as little as two hours to as long as 48 hours, but the most common turnaround time requirement is 12 hours. |
In 2011, we expect to begin offering Encore, our new Software as a Service, or “SaaS” platform. Encore SaaS is designed specifically for hospitals that have their own in-house transcription departments and wish to implement a speech recognition-enabled platform to improve productivity and reduce cost. See “Further Develop Innovative Technology Solutions to Improve Productivity and Meet Customer Needs.” In these situations Transcend or another transcription service provider is available to provide backup service to supplement the in-house staff.
In 2011, we have begun to offer front-end speech solutions (also known as physician self-edit solutions). These solutions allow physicians to dictate, receive a draft immediately and edit the draft themselves. The advantage from the hospital’s perspective is the potential to reduce transcription costs. The challenge is to realize high physician adoption due to the potentially negative impact on physician productivity. If this business line becomes a common method for documenting care, we expect it to generate less revenue per physician than traditional transcription, but at higher profit margins.
Business Strategy
Our primary focus is providing medical transcription services to the healthcare industry. Our strategy is to drive top and bottom line growth by successfully executing five key strategies:
| • | continue to provide unparalleled service to our customers; |
| • | further develop innovative technology solutions to improve productivity and meet customer needs; |
| • | increase market share; |
| • | successfully complete and integrate acquisitions; and |
| • | attract and retain professional staff. |
Continue to Provide Unparalleled Service to Our Customers
The first and foremost key to our success is consistently providing excellent service to our customers. Our year-over-year customer retention rate has averaged more than 95% (measured by revenue) over the last four years, which we believe is superior to most of our competitors. We believe that customers who are consistently receiving high quality documents on time at a competitive price are likely to remain our customers year after year. Satisfied customers provide sales leads and referrals that help us drive new business.
We have an ongoing program to monitor and improve customer satisfaction which includes continuous monitoring of transcription production statistics relative to contracted standards, periodic customer surveys and a dedicated regional operations support organization that maintains regular (often daily) contact with customers. We believe that our regional operations managers provide a competitive advantage in sustaining customer satisfaction. As our regional operations managers typically come from a medical language specialist background, they possess the expertise to continuously improve quality. In addition, they provide customers with a central contact person in the organization who is directly responsible for resource scheduling and quality control and can address issues that arise.
Further Develop Innovative Technology Solutions to Improve Productivity and Meet Customer Needs
We intend to utilize the most effective technologies available to improve the clinical documentation process and believe that the application of advanced technologies will reshape the way patient information is managed
5
Table of Contents
across the healthcare delivery system in the future, as well as provide margin expansion through improved business efficiencies. We plan to develop, acquire and deploy new solutions to broaden the breadth and depth of our services and solutions.
Our most significant initiative is the development of Encore, our new transcription platform that was designed as a Software as a Service “SaaS” offering for customers with in-house transcription departments that desire to acquire a speech recognition-enabled platform to increase productivity and reduce costs. This allows us to market to a large portion of the market that we were previously unable to serve. We expect Encore to be generally available in 2011.
A second technology initiative is BeyondSpeech, our near real-time front-end speech recognition solution, which provides hospitals with an additional documentation option. Used today predominantly in a small percentage of radiology departments, front-end speech solutions allow physicians to dictate, receive a draft document and edit the draft themselves. While we believe this has limited short-term market potential due to the resistance of many physicians to editing their own documents, it may be a viable solution in certain situations. We expect BeyondSpeech to contribute some revenue in 2011, but do not expect it to become a significant percentage of our revenue over the next two years. We expect to develop a comparable front-end speech solution on our Encore platform later in 2011.
Documents processed on our proprietary platforms are created using a standard clinical document architecture and the data within the documents is XML tagged. We plan to take advantage of this structured data within our documents to provide new data services to our customers such as alerts, core measure tracking and data analytics. Our first offering in this area, BeyondAlerts, continuously queries a hospital’s transcribed reports to find certain patterns of data which indicate the need to track a particular patient for core measure reporting purposes. Hospital personnel are alerted via e-mail of patient care situations meeting the query criteria, reducing the time spent combing through records manually each day. Improved core measure tracking can lead to increased reimbursement rates for hospitals.
We work to continually improve our platforms and increase our use of speech recognition technology to improve the productivity of our medical language specialists and improve our profitability. Our platforms provide significant advantages in workflow management and production control. They also provide an excellent and efficient end-user experience, which aids recruiting efforts. We will continue to invest in our platforms, particularly Encore, to drive faster turnaround times, better workflow management and increased productivity.
We have invested heavily in fully integrating speech recognition technology into our platforms. We license the speech recognition engine, natural language processor and various editing tools from MultiModal Technologies, Inc., a leader in the industry, under a September 2006 agreement that expires on August 31, 2011, and can be extended if mutually agreed by both parties. We expect to execute a renewal of this agreement during the first half of 2011. Our speech recognition solution requires no physician training or change in physician work habits. Voice files are collected in the same manner regardless of whether the job will be transcribed (typed) or edited using speech recognition technology. Once a physician’s voice profile is built and meets predicted quality criteria, future work from that physician is edited. When a medical language specialist is presented with a draft document, the specialist listens to the voice file and edits the document as necessary. The edits are fed back into the voice profile, which adjusts over time based on those edits to continuously improve the quality of draft reports.
The use of speech recognition technology in our platforms results in a more efficient transcription process, lower direct costs and higher gross margins. Our medical language specialists earn less per line of text for editing, but their increased productivity generally allows their total compensation to remain unchanged or to increase. After the cost paid to MultiModal Technologies, Inc., we are still able to reduce the average cost per line of text. This is a key defensive strategy against pricing pressure in the industry.
6
Table of Contents
In the fourth quarter of 2010, 83% of our BeyondTXT volume was edited using speech recognition technology and 17% was transcribed (typed). We had similar speech recognition editing rates on the Gemstar platform acquired from Heartland. It is not possible to achieve 100% editing due to factors such as the ongoing addition of new customers and physicians and low volume dictators who do not have well-developed speech profiles.
Part of our strategy is to move as much volume as possible onto our BeyondTXT and Encore platforms so that we can take advantage of their efficiency and speech recognition capabilities. The mix of work on our platforms will vary depending on the types of sales we win and the impact of acquisitions.
We also intend to continue investing in our state-of-the-art data center and disaster recovery sites. Our telecommunications partners provide redundant long distance and local loop solutions into our data centers which help manage the goal of maintaining the maximum possible up-time for the capture of physician dictation.
We incurred research and development expenses of $3,362,000, $432,000 and $148,000 in fiscal 2010, 2009 and 2008, respectively.
Increase Market Share
Our target market is community-based hospitals, typically those with over 100 beds. We plan to increase our market share by leveraging our strong reputation in the market and gradually expanding our sales force. Our sales force will remain focused primarily on new customer sales while our operations management team focuses on increasing revenue at existing customers.
We plan to continue to win business from our competitors. We believe that the level of service provided by many of our competitors can be very inconsistent. As a result, we often replace our competitors in scenarios where the hospital is unhappy with its current service provider. In addition, we believe that smaller competitors are increasingly unable to keep up with advances in technology and lack the capacity to give customers assurance that they can consistently meet turnaround time requirements. As a result, we frequently win new customer accounts from customers who have outgrown the capabilities of their smaller providers.
We estimate that roughly 50% of medical transcription for hospitals is still performed by in-house personnel although we are not aware of any independent data on the percentage of the hospital market that is outsourced. We believe that the trend toward outsourcing will continue. We can often demonstrate cost savings for customers and still generate attractive gross profit margins by improving productivity. Our sales force will focus on first-time outsourcing opportunities whenever possible.
Our focus on individual hospital sales will increasingly include efforts to win business with entire integrated delivery networks and hospital systems and through Group Purchasing Organization (GPO) relationships. We intend to dedicate additional resources to pursuing this strategy in 2011 and beyond.
Many hospitals are members of GPOs, which provide value to their members by pre-screening the best vendors for a particular product or service and pre-negotiating terms and conditions with the vendors. We have signed several agreements with members of GPOs and may attempt to secure additional GPO contracts in the future in order to increase market penetration and accelerate growth.
Successfully Complete and Integrate Acquisitions
We plan to increase revenue and market share through acquisitions. There are many smaller and several sizable medical transcription companies in the United States and opportunities abound to consolidate the industry. We are selective acquirers, completing acquisitions to enhance our organic growth, but not at the expense of losing our focus on providing the best service in the industry to our existing customers. When we do
7
Table of Contents
make acquisitions, we expect to integrate them thoroughly by developing customer relationships, implementing our customer-centric operating model and converting customers to our platforms whenever possible to improve productivity and profitability.
Developments such as voice recognition technology, the need to provide customers with an offshore solution, industry pricing pressure and the impact of government regulation are making it increasingly difficult for smaller medical transcription businesses to compete effectively. As a result, we believe that we will be able to make acquisitions on an opportunistic basis that will enable us to grow the business.
We expect to fund our acquisitions through a combination of cash on hand, debt, and shares of our common or preferred stock. Our management team has extensive acquisition experience and the skills necessary to effectively integrate acquired companies.
Attract and Retain Professional Staff
Our ability to recruit and retain the industry’s best medical language specialists, operations managers, project managers, information technology and other professionals is crucial to our success. We seek to be the best company to work for in the industry by offering competitive pay and benefits and the opportunity to advance in our organization as we grow.
We believe that there will be a shortage of qualified traditional medical language specialists in the future. We believe we can address this issue domestically because workers will be attracted and retained by offering competitive pay and benefits, stable and responsive management, a predictable abundance of work, a stable and efficient platform, career development opportunities and the opportunity to work from home. Furthermore, speech recognition technology should allow us to produce the same volume of work with fewer medical language specialists, and may open the market to a new pool of professionals.
International Operations
In connection with our acquisition of Heartland in 2010 we acquired significant operations in India. As of December 31, 2010, we had 891 employees located in India. In the fourth quarter of 2010, approximately 21% of our transcription volume was subcontracted to providers in India. In addition, another 14% of our transcription volume was transcribed by our operations in India. We are therefore subject to risks inherent in international operations including: (i) the impact of the global economic conditions; (ii) the possibility of currency controls; (iii) currency fluctuations and devaluations; (iv) political, economic and social instability; (v) potential restrictions on investments; (vi) inflation or hyper-inflation; (vii) changes in laws and regulations, including withholding and other tax laws and regulations; (viii) management of a workforce based in India; and (ix) the potential for expropriation or nationalization of enterprises. See “Risk Factors- Our global operations expose us to financial and operations risk.”
Customers
We deliver medical transcription services to approximately 331 hospitals in the United States, in addition to a number of clinics and physicians’ offices. Our contracts are typically three years in duration and most renew automatically for successive one-year periods upon expiration of the initial term. Customers can typically terminate their contracts with 60-120 days notice. Our experience has demonstrated that if we consistently provide excellent service at a competitive price, our customers will remain with us year after year.
In September 2009, we announced that we had entered into a five-year single-source contract to provide medical transcription services to hospitals that are members of Health Management Associates, Inc., or HMA, effective October 1, 2009. Prior to signing this agreement, we had individual contracts with approximately 45 of HMA’s 54 hospitals. The agreement expanded our existing relationship with HMA to include the HMA hospitals
8
Table of Contents
which were using other transcription service providers. As of January 1st, 2011, we had transitioned all of the existing HMA hospitals to Transcend. In addition, pursuant to the terms of the agreement, any future hospitals acquired or managed by HMA will transition to us as soon as practicable.
Revenue attributable to this agreement with HMA comprised 17.0%, 16.9% and 21.8% of our total revenue for the years ended December 31, 2010, 2009 and 2008, respectively. The decrease in percentage in 2010 and 2009 from 2008 is due primarily to the additional revenue from the businesses acquired by Transcend in 2009 and 2010.
Our top 10 customers (hospitals) accounted for approximately 16.5% of our 2010 transcription revenue compared to 16% in 2009 and 27% in 2008. These customers averaged $1.5 million of revenue each in 2010 compared to $1.4 million in 2009 and $1.3 million in 2008. Our average annual revenue per customer was approximately $344,000 in 2010 and $349,000 in 2009 and $316,000 in 2008.
Competition
The medical transcription market is competitive and highly fragmented, with several thousand transcription services companies nationwide. There is one competitor that is larger than us- MedQuist, Inc. Other competitors that are smaller than Transcend in terms of transcription services revenue, but still sizable, include Nuance Communications, Inc. and Webmedx, Inc. Although the industry is characterized by relatively low barriers to entry, we do not believe that new entrants represent a significant threat to our business.
In addition, the medical transcription industry in the United States experiences overseas competition, primarily from India. Offshore quality and turnaround time, which in the past have been problematic, have improved as lower quality firms have exited and the market has matured. Many customers believe that their work should be completed by domestic medical language specialists; others have embraced the cost benefits that offshore personnel can offer.
Medical transcription service providers compete primarily on service quality, turnaround times and price. Pricing pressure in the industry can be intense, particularly in competitive sales to large integrated delivery networks and hospital systems. We do not position ourselves as the low-cost provider. We believe that when we win, it is most often because of a combination of our reputation for service and our competitive price. When we lose, we most often lose due to price or because a decision maker has an existing relationship with a competitor.
We also compete against companies that provide alternative methods for documenting patient care, including large healthcare information technology companies such as Epic Systems Corporation, Cerner Corporation, McKesson Corp and Allscripts Healthcare Solutions, Inc., which have EMR solutions that provide template-based, point and click applications for documenting the patient medical provider encounter.
Sales and Marketing
Our sales team consists of an executive vice president of sales and marketing and four regional sales vice presidents. Sales leads are also generated from personal contacts with senior hospital executives and from client referrals. The regional sales vice presidents are focused primarily on new customer sales. We recognize the importance of relationship selling and referrals. Therefore, the operations management team, especially our president and Vice President of Customer Solutions, as well as the regional operations managers, are responsible for generating incremental business within our customer base.
The team leverages our reputation for service excellence and our consistently high industry rankings to increase awareness and drive new sales. Additional tactics to build visibility and attract leads include targeted public relations, advertising in industry trade publications, direct mailings, attending key industry trade shows, our Internet presence and building upon existing vendor relationships and business partnerships to generate leads and introductions to prospects.
9
Table of Contents
Traditionally, most of our sales have been to individual hospitals. We intend to increase our focus on hospital systems and integrated delivery networks in the belief that medical transcription decisions are increasingly being made at the corporate level.
Employees
As of December 31, 2010, we had 1,955 full-time and 850 part-time employees, 1,914 located in the United States and 891 located in India. This includes 2,399 medical language specialists (1,557 full-time and 842 part-time). In addition, 248 full-time and eight part-time employees work in operations to support and manage customers and medical language specialists. We also had 150 full-time employees that work in sales, research and development, information technology and general administrative functions. Neither we nor our employees are currently a party to any collective bargaining agreement. We have not experienced any strikes or work stoppages, and believe that relations with employees are good.
Government Regulation
Virtually all aspects of the practice of medicine and the provision of healthcare services are regulated by federal or state statutes and regulations, by rules and regulations of state medical boards and state and local boards of health, and by codes established by various medical associations. Healthcare providers continue to come under increased scrutiny from regulators and third-party payers in the areas of quality of care, quality of data, billing compliance and patient privacy. Documentation requirements have increased, resulting in an increase in the need for dictation and transcription of medical encounters.
Healthcare policy is a matter of national importance that receives extensive media attention. Management cannot predict what federal or state legislation may be enacted in the future that will impact us. In general, we believe that increased federal, state and local government involvement or oversight of healthcare providers will necessitate improved record keeping.
HIPAA requires hospitals to maintain adequate security around and privacy of protected health information. The regulations governing the electronic exchange of information established a standard format for the most common healthcare transactions. The regulations also establish national privacy standards for the protection of individually identifiable health information. The regulations may restrict the manner in which certain information is transmitted and used. A substantial part of our activities involves the receipt or delivery of confidential health information concerning patients of customers in connection with the provision of transcription services to participants in the healthcare industry. We have made and will continue to make investments to support HIPAA-compliant systems and processes as a business associate of our customers, including such areas as (1) electronic transactions involving healthcare information, (2) privacy of individually identifiable health information, and (3) security of healthcare information and electronic signatures.
HITECH applies certain HIPAA provisions and non-compliance penalties directly to business associates, such as medical transcription companies, that provide services to entities covered under HIPAA. We believe that the requirements of HITECH will make it more difficult for smaller transcription companies to compete with us due to the increasing challenge of ensuring compliance with HITECH and HIPAA because we have greater resources and will be able to spread our costs of compliance over a larger number of customers. Our President and Chief Operating Officer is designated as our HIPAA Privacy Officer and our Vice President of Information Technology as our HIPAA Security Officer. We have implemented physical, technical, and administrative safeguards related to the access, use, and disclosure of individually identifiable health information to help ensure the privacy and security of this information as required by HIPAA and HITECH. Furthermore, as required by HITECH and the breach notification interim final rule promulgated by the Department of Health and Human Services effective as of September 23, 2009, we intend to notify the appropriate covered entity client in the case of a breach of unsecured protected health information. Finally, because we anticipate additional guidance and clarification from the government regarding HIPAA, HITECH, the notice of proposed rulemaking regarding
10
Table of Contents
HIPAA and HITECH published on July 14, 2010, and the breach notification interim final rule, we will continue to monitor these legal requirements and modify our compliance efforts as needed.
Available Information
We are subject to the informational requirements of the Exchange Act and are required to file annual, quarterly and other reports, proxy statements and other information with the Securities and Exchange Commission, or the Commission. You may inspect and copy these reports and other information at the public reference facilities maintained by the Commission in Washington, D.C., 100 F Street N.E., Washington, D.C. 20549. Copies of such materials can be obtained from the Commission’s public reference section at prescribed rates. You may obtain information on the operation of the public reference rooms by calling the Commission at (800) SEC-0330. Additionally, the Commission maintains an Internet site (http://www.sec.gov) that contains reports, proxy and information statements, and various other information about us. Our common stock is listed and traded on the NASDAQ Global Select Market. You may inspect the information we file with the Commission at NASDAQ’s offices. For further information on obtaining copies of our public filings at the NASDAQ Global Select Market, you should call (212) 401-8700. We also make available free of charge on or through our website at www.transcendservices.com our Form 10-K, 10-Q’s, 8-K’s and amendments as soon as reasonably practical after they are filed with the SEC. The information contained on, or that can be accessed through, our website is not incorporated by reference into this Annual Report. We have included our website address as a factual reference and do not intend it as an active link to our website.
11
Table of Contents
| ITEM 1A. | RISK FACTORS |
Our business, financial condition and operating results can be affected by a number of factors, including those listed below. The risks and uncertainties described below are not the only risks and uncertainties that we face. Additional risks and uncertainties not currently known to us also may impair our financial condition and business operations. If any of the following risks actually occur, our financial condition and results of operations would suffer. The risks discussed below also include forward-looking statements, and our actual results may differ substantially from those discussed in those forward-looking statements.
Risks Related to the Business
Our results of operations may fluctuate significantly from period to period, which may cause our stock price to decline.
Our results of operations have fluctuated in the past and will continue to fluctuate in the future. Given this fluctuation, we believe that quarter to quarter comparisons of results of operations are not necessarily an accurate indicator of future performance. As a result, results of operations may not meet the expectations of securities analysts or investors in the future. If this occurs, the price of our common stock would likely decline. Factors that contribute to fluctuations in our results of operations could include the following:
| • | slowing sales to new and existing customers; |
| • | loss of customers; |
| • | volume, timing and fulfillment of customer contracts; |
| • | unanticipated expenses; |
| • | acquisitions of businesses, including transaction costs, which are expensed in the period incurred; |
| • | introduction of new products or services by us or our competitors; |
| • | failure to renew agreement with MultiModal Technology, Inc.; |
| • | seasonality in revenues; |
| • | downward pricing pressure in response to competition or market conditions; |
| • | impairment charges against goodwill and other intangible assets; |
| • | changes to estimated contingent consideration related to acquisitions; |
| • | write-offs of accounts receivable that are not collectible; |
| • | increased expenditures incurred pursuing acquisitions of businesses and new product or market opportunities; |
| • | general economic trends as they affect revenues; |
| • | higher than anticipated unit costs related to fixed unit price contracts with customers; |
| • | higher than anticipated costs related to regulatory compliance; |
| • | disruptions in, or increases in costs related to, the services provided by offshore partners; |
| • | failure of the telecommunications and technology infrastructure and systems related to receiving, processing and distributing work; and |
| • | changes in government regulations. |
Due to the foregoing factors, among others, our revenue and results of operations may differ from forecasts. Our expense levels are based in significant part on expectations of future revenue, and we may not be able to reduce expenses quickly to respond to a shortfall in projected revenue. Therefore, a failure to meet revenue expectations could have a material adverse effect on our results of operations, financial condition and cash flows.
12
Table of Contents
We have grown, and may continue to grow, through acquisitions, which could dilute existing stockholders and could involve substantial integration risks.
As part of our business strategy, we have in the past acquired, and expect to continue to acquire, other businesses and technologies. We may issue equity securities for future acquisitions, which would dilute existing stockholders, perhaps significantly depending on the terms of the acquisition. We may also incur additional debt in connection with future acquisitions, which may place additional restrictions on the ability to operate the business. Furthermore, prior acquisitions required substantial integration and management efforts. Acquisitions involve a number of risks, including:
| • | difficulty in integrating the operations and personnel of the acquired businesses, including different and complex accounting and financial reporting systems; |
| • | potential disruption of ongoing business and distraction of management; |
| • | potential difficulty in successfully implementing, upgrading and deploying in a timely and effective manner new operational information systems and upgrades of finance and accounting systems; |
| • | difficulty in incorporating acquired technology and rights into products and technology; |
| • | unanticipated expenses and delays in completing acquired development projects and technology integration; |
| • | management of geographically remote offices and operations; |
| • | impairment of relationships with partners and customers; |
| • | customers delaying purchases or seeking concessions pending resolution of integration between existing and newly acquired services or technology platforms; |
| • | entering markets or types of businesses in which management has limited experience; and |
| • | potential loss of customers or key employees of the acquired company. |
As a result of these and other risks, we may not realize anticipated benefits from acquisitions. Any failure to achieve these benefits or failure to successfully integrate acquired businesses and technologies could materially and adversely affect our business and results of operations.
Our ability to sustain and grow profitable operations is dependent upon the ability to retain customers.
Over the past three years, we have maintained high customer retention levels. Customer retention is largely dependent on providing quality service at competitive prices. Customer retention may also be impacted by events outside of our control, such as changes in customer ownership, management, financial condition and competitors’ sales efforts. If we experience a lower than expected rate of customer retention, the resulting loss of business could adversely affect results of operations and financial condition.
Our business is dependent on continuing demand for medical transcription services.
There are alternatives to traditional medical transcription. Some EMR products contain “point-and-click” templates which attempt to reduce the need for transcription. These solutions are most frequently deployed in ambulatory settings (clinics and physician offices) as opposed to acute care settings (hospitals). Although the inherent complexity of documentation in the acute care setting would appear to mitigate the adoption of template-based solutions, there is no guarantee that in the future these products will not be widely adopted in the acute care environment. A second alternative to traditional transcription is to have physician’s document patient encounters and procedures themselves by presenting them with a speech-recognized draft of their dictation and allowing them to self-edit their documents. This approach has been adopted with limited success in radiology departments. Radiologists do not see patients, work at a computer most of the day and have short, repetitive reports, making their work more conducive to self-editing. Nevertheless, we cannot assure you that in the future
13
Table of Contents
self-editing will not become feasible in the acute care setting outside of radiology departments. There also is a risk that we could lose some radiology revenue over time. If these transcription replacement technologies become feasible in the acute care setting and if we are unable to provide solutions based upon such technologies, the ability to sustain and grow profitable operations could be impaired.
We have a past history of operating losses and an investment in our common stock is speculative and involves a high degree of risk.
Although we reported annual net income beginning in 2006 and for the years ended December 31, 2007 thru 2010, we have incurred operating losses in the past. There is no guarantee that we will continue to maintain profitability. If we are unable to maintain profitability, the market price for our common stock may decline, perhaps substantially. Accordingly, an investment in our common stock is speculative in nature and involves a high degree of risk.
We operate in an environment with competitive pricing pressure and can make no assurance that we will be able to compete successfully against current or future competitors on the basis of price.
Some competitors have lower cost structures than we do, particularly if they are small firms or operate primarily offshore. Other competitors may be willing to accept less profitable business in order to grow revenue. Competitors often offer lower prices than we do. We attempt to position ourselves in the industry as a high quality provider at a mid-level price point. Accordingly, we may lose business on the basis of price or be forced to lower prices to win new business. There can be no assurance that we will be able to compete effectively, if at all, against competitors on the basis of price. Competitive pricing pressure could result in loss of market share and lower profit margins.
Our ability to sustain and grow profitable operations is dependent upon the ability to sell transcription services to new customers.
The medical transcription market is highly competitive. If we are not able to sell services to new customers successfully, operations may not be profitable. Failure to grow revenue could adversely impact results of operations and financial condition.
Our ability to obtain funding to sustain and grow profitable operations is dependent upon our continuing ability to raise funds from the sale of our securities, to use our securities as consideration, and to obtain and maintain financing on reasonable terms and to comply with applicable covenants.
To implement our business plan we will depend on cash that may be generated from the sale of our securities, from amounts available under our credit facility and from our operations. We also expect to use our securities as consideration in connection with future acquisitions. While we have an effective shelf registration statement covering certain of our securities that could be used for capital raising purposes, there is no guarantee that there will be a market for our securities at current market prices or at any price or that using our securities as consideration would be acceptable to a potential seller in an acquisition. Therefore there is no guarantee that we will be able to successfully raise additional capital or issue securities as consideration at all or on terms that are favorable or otherwise not dilutive to existing stockholders.
On August 31, 2009, we entered into a credit facility with Regions Bank. The credit facility requires that we abide by certain financial and other covenants. If we are unable to abide by the covenants, we may be in default under the credit facility, may not be able to make acquisitions that could be helpful to the business, and may not have enough resources to repay debt which could be incurred. As of December 31, 2010, we were in compliance with all covenants of the credit facility with the exception of a covenant related to annual lease expense. While Regions Bank has issued a waiver of this covenant and we have amended our credit facility with Regions Bank to increase the maximum annual lease expense allowable, there is no guarantee that we will continue to be in compliance with the financial and other covenants under our credit facility with Regions Bank or that Regions Bank will issue a waiver with respect to any non-compliance.
14
Table of Contents
In addition, the credit facility restricts the ability to complete large acquisitions without Regions Bank’s consent. We may not be able to obtain Regions Bank’s consent to a transaction in a timely manner, or at all, which could impede our ability to consummate an acquisition that our board of directors deems to be in our best interest. The term loan under the credit facility is due and payable on August 31, 2013, and the revolving loan, which provides for up to $5.0 million of loans to fund working capital, general corporate purposes and specified acquisitions, expires on August 31, 2011. Failure to secure acquisition financing would prevent us from executing our acquisition strategy and therefore limit our ability to grow.
A portion of our cash is held in accounts with balances that exceed the amounts insured by the Federal Deposit Insurance Corporation (“FDIC”) or the Securities Investors Protection Company (“SIPC”).
As a result of certain provisions in our credit facility and our receipt of the net proceeds of our public offering in December 2009, we currently maintain significant cash balances in deposit and investment accounts. At December 31, 2010, approximately $1,334,000 of our cash balances exceeded the current FDIC or SIPC insurance limits, and $677,000 of these balances were held in overseas banks for our India operations. In addition, we hold $848,000 of uncollateralized time deposits in India. We are exposed to credit risk on our cash deposits in excess of such insurance limits.
Due to the critical nature of medical transcription to our customers’ operations, potential customers may be reluctant to outsource or change service providers as a result of the cost and potential for disruption in services, which may inhibit our ability to attract new customers.
The up-front costs involved in changing medical transcription service providers or converting from an in-house medical transcription department to an outsourced provider may be significant. Potential customers may prefer to remain with their current service provider or keep their medical transcription in-house rather than incur these costs or risk a disruption in services as a result of changing service providers. Also, as the maintenance of accurate medical records is a critical element of a healthcare provider’s ability to deliver quality care to its patients and to receive proper and timely reimbursement for the services it renders, potential customers may be reluctant to outsource such an important function.
Purchase accounting treatment of acquisitions or impairment of acquired intangible assets could decrease net income in the future, which could have a material and adverse effect on the market value of our common stock.
We account for acquisitions using the purchase method of accounting. Under purchase accounting, the market value of our common stock or other form of consideration issued in connection with the acquisition as the cost of acquiring the company or business is recorded. That cost then is allocated to the individual assets acquired and liabilities assumed, including various identifiable intangible assets, such as acquired technology, acquired trade names and acquired customer relationships, based on their respective fair values. Beginning in 2008, we expensed and we intend in the future to expense direct transaction costs as incurred. Intangible assets generally will be amortized over a five to ten-year period, which might make future acquisitions dilutive to earnings. Changes in the estimated fair value of contingent consideration could have a material impact on results of operations in the period the change is recognized. Goodwill and certain intangible assets with indefinite lives are not subject to amortization but are subject to at least an annual impairment analysis, which may result in an impairment charge if the carrying value exceeds its implied fair value. Factors which could trigger an impairment of such assets include the following:
| • | significant underperformance relative to historical or projected future results of operations; |
| • | significant changes in the manner of or use of the acquired assets or the strategy for the overall business; |
| • | significant negative industry or economic trends; |
| • | significant decline in our common stock price for a sustained period; and |
| • | a decline in our market capitalization below net book value. |
15
Table of Contents
Future adverse changes in these or other unforeseeable factors could result in an impairment charge that would impact the results of operations and financial position in the reporting period identified.
We may not be able to recruit and hire a sufficient number of new or replacement medical language specialists to sustain or grow the current level of revenue.
We cannot provide transcription services to customers within contracted delivery standards unless we have access to an adequate supply of qualified medical language specialists. Medical language specialists are in short supply. There can be no assurance that we will be able to hire and retain a sufficient number of medical language specialists to meet demand. Failure to do so could have a material adverse effect on the ability to undertake additional business or to complete projects in a timely manner, which could adversely affect results of operations and financial condition.
The inability to attract, hire or retain the necessary technical and managerial personnel could hinder our ability to maintain technology platforms and limit our ability to provide services to customers.
We are heavily dependent upon our ability to attract, retain and motivate skilled technical and managerial personnel, especially highly skilled technical, implementation and production management personnel who assist in the development, implementation and production management of the medical transcription services we provide. The market for such individuals is competitive. The medical transcription industry is characterized by a high level of employee mobility and aggressive recruiting of skilled personnel. We cannot assure you that we will be able to retain current personnel, or will be able to attract, assimilate or retain other highly qualified technical and managerial personnel in the future. The inability to attract, hire or retain the necessary technical and managerial personnel could hinder our ability to maintain technology platforms and limit our ability to provide services to customers.
The loss of key personnel could affect business continuity and result in a loss of significant customer relationships and institutional knowledge.
Our success depends in part on the performance of executive officers and key employees. Executive officers do not have employment agreements, nor do we maintain key person life insurance on the lives of any executive officers or key employees. The loss of the services of any executive officer or other key employee could result in a loss of significant customer relationships and institutional knowledge.
Failure to adapt to rapid technological changes could result in a loss of market share.
Our ability to remain competitive in the medical transcription industry is based on our ability to utilize technology in the services provided to customers. Accordingly, we have a substantial ongoing commitment to research and development. In this regard, we are currently investing in the integration of voice recognition and natural language processing technologies to yield faster turnaround times, better workflow management and increased productivity, all of which are essential to remain competitive. If we are unable to identify and implement technological changes in a timely and cost-effective manner, a portion of our market share could be lost, which would adversely affect results of operations. If we must write off the cost of research and development expenses, our operating results for the period could be adversely affected. Additionally, competitors may independently develop technologies that are substantially the same as, or superior to, ours and that do not infringe our rights. In these cases, we would be unable to prevent competitors from utilizing, selling or licensing these similar or superior technologies.
Our reliance on key third-party software could affect our ability to operate competitively.
We have invested heavily in fully integrating speech recognition technology into the BeyondTXT platform. We license the speech recognition engine, natural language processor and various editing tools from MultiModal
16
Table of Contents
Technologies, Inc., a leader in the industry, under a September 2006 agreement that renews annually at our sole option through September 2010, with the last such option period ending August 31, 2011, and thereafter if mutually agreed by both parties. We expect to execute an extension and renewal of this agreement in the second quarter of 2011. The inability to maintain the relationship with MultiModal or to find a suitable replacement for the technology at favorable prices or at all would adversely affect our ability to operate competitively and meet the workload demands of our customer base.
Our operations depend on access to reliable voice and data networks and dictation capture systems. Any failure of these networks or systems, even for a short time, could harm our business.
The majority of our customers depend on the availability of our BeyondTXT and Gemstar platforms, data networks and dictation capture systems to process voice and data files 24 hours per day, seven days per week. If voice and data networks or dictation capture systems are unavailable, the ability to transcribe documents for customers is severely limited. We are heavily dependent on third parties such as telecommunications providers and dictation system vendors. Although there is redundancy across these providers and systems, any failure of these networks or systems, even for a short time, could delay our ability to provide transcription services to our customers. Because the timely delivery of transcription services is vital to customers, any such delay could harm our business.
Failure of our disaster recovery site could adversely affect our ability to provide continuing data processing services.
We expect to be able to use our disaster recovery site to rapidly transfer the processing of data from our main site to the disaster recovery site. We cannot assure you that the disaster recovery site will be effective in the event of a disaster. If our main computer center becomes unavailable and our disaster recovery site fails, we would be forced to either contract for the services of another network provider at costs significantly in excess of current expenses or reconstruct our data processing center, which could take a significant amount of time. The failure of our disaster recovery site could adversely affect our ability to provide continuing operations and meet contractual obligations.
We operate in a competitive market, and we cannot assure you that we will be able to compete successfully against current or future competitors.
The medical transcription services market is competitive and highly fragmented, with several thousand local, regional and national companies competing in the United States alone. In addition, the medical transcription industry in the United States faces competition from overseas competitors and EMR vendors. While we attempt to compete on the basis of fast, predictable turnaround times and consistently high accuracy and document quality, we cannot assure you that we will be able to compete effectively, if at all, against competitors. These competitive forces could result in loss of market share, lower margins and increased technology investments.
Our global operations expose us to financial and operations risk.
With our acquisition of Heartland on October 21, 2010, we now have significant operations in India. In the fourth quarter of 2010, approximately 21% of our transcription volume was subcontracted to providers in India. In addition, another 14% of our transcription volume was transcribed by our operations in India. Risks inherent in international operations include:
| • | the impact of the current global economic downtown and related market uncertainty; |
| • | the possibility of currency controls; |
| • | currency fluctuations and devaluations; |
| • | political, economic and social instability; |
17
Table of Contents
| • | potential restrictions on investments; |
| • | inflation or hyper-inflation; |
| • | management of a geographically disbursed workforce; |
| • | changes of laws and regulations, including withholding and other tax laws and regulations; and |
| • | the potential for expropriation or nationalization of enterprises. |
We plan to fund our Indian operations through transfers of U.S. dollars only as required pursuant to our services agreements with our subsidiaries. To the extent that we need to bring currency to the United States from our global operations, we may be adversely affected by foreign withholding taxes and currency control regulations. We plan to manage our risk of changes in exchange rates through forward currency contracts. However, unfavorable changes in exchange rates in the future could materially impact our results of operations. Additionally, we are subject to transfer pricing tax laws and regulations. Our interpretation of these transfer pricing laws and regulations has been and may from time-to-time be challenged by the Indian income tax authorities and could be subject to audit.
Government authorities may question our tax positions or transfer pricing policies or change their laws in a manner that could increase our effective tax rate or otherwise harm our business.
As a U.S. company doing business in international markets through subsidiaries, we are subject to various tax and intercompany pricing laws, including those relating to the flow of funds between our company and our subsidiaries. From time to time, we are audited by tax regulators in the United States and in our foreign markets. If regulators challenge our tax positions, corporate structure, transfer pricing mechanisms or intercompany transfers, we may be subject to fines and payment of back taxes, our effective tax rate may increase and our operations may be harmed. Tax rates vary from country to country, and, if regulators determine that our profits in one jurisdiction may need to be increased, we may not be able to fully utilize all foreign tax credits that are generated, which will increase our effective tax rate. The various customs, exchange control and transfer pricing laws are continually changing and are subject to the interpretation of government agencies. Despite our efforts to be aware of and comply with such laws and changes to and interpretations thereof, there is a risk that we may not continue to operate in compliance with such laws. We may need to adjust our operating procedures in response to such changes, and as a result, our business may suffer.
Our medical transcription services may be subject to legal claims for failure to comply with laws governing the confidentiality of medical records.
Healthcare professionals who use our medical transcription services deliver private health information, or PHI, about their patients including information that constitutes a record under applicable law that we may store. Numerous federal and state laws and regulations, the common law and contractual obligations govern collection, dissemination, use and confidentiality of patient-identifiable health information, including:
| • | state and federal privacy and confidentiality laws; |
| • | contracts with customers and partners; |
| • | state laws regulating healthcare professionals; |
| • | Medicare and Medicaid laws; and |
| • | HIPAA/HITECH. |
HIPAA establishes elements including, but not limited to, federal privacy and security standards for the use and protection of PHI. We have partners and customers who are covered entities under HIPAA, and HIPAA requires us to use and disclose PHI in a manner consistent with our arrangements with them. Historically, only covered entities were directly subject to potential civil and criminal liability under the HIPAA Privacy and
18
Table of Contents
Security Standards. However, HITECH, which was enacted into law on February 17, 2009, enhances and strengthens the HIPAA Privacy and Security Standards and makes certain provisions applicable to “business associates” of covered entities. HIPAA provisions applicable to business associates now directly apply to us, and we will be directly subject to criminal and civil penalties. In addition, HITECH created security breach notification requirements. The direct applicability of the new HIPAA Privacy and Security provisions requires us to incur additional costs and may restrict our business operations. In addition, these provisions may engender additional regulations and guidance issued by the United States Department of Health and Human Services and will be subject to interpretation by various courts and other governmental authorities, thus creating potentially complex compliance issues for us and our customers.
Although we have systems and policies in place for safeguarding PHI from unauthorized disclosure, these systems and policies may not preclude claims against us for alleged violations of applicable requirements. We cannot assure you that we will not be subject to liability claims. Any liability claims could have a material adverse effect on our business, results of operations and financial condition.
States and foreign jurisdictions in which we or our customers operate have adopted, or may adopt, privacy standards that are similar to or more stringent than the federal HIPAA Privacy and Security Standards. This may lead to different restrictions for handling PHI. As a result, our customers may demand, and we may be required to provide, services and information technology solutions that are adaptable to reflect different and changing regulatory requirements which could increase our labor and development costs. In the future, federal, state or foreign governmental or regulatory authorities or industry bodies may impose new data security standards or additional restrictions on the collection, use, transmission and other disclosures of health information. New regulatory requirements may require substantial operational and systems changes, employee education and resources, there is no guarantee that we will be able to implement these changes adequately or prior to their compliance date, and we cannot predict the potential impact that these future rules may have on our business. Furthermore, the demand for our services may decrease significantly if we are not able to develop and offer services and technology that can address the regulatory challenges and compliance obligations facing us and our customers.
Proposed legislation and possible negative publicity may impede our ability to utilize offshore service capabilities.
Certain state laws that have recently been enacted and bills introduced in recent sessions of the U.S. Congress have sought to restrict the transmission of personally identifiable information regarding a U.S. resident to any foreign affiliate, subcontractor or unaffiliated third party without adequate privacy protections or without providing notice of the transmission and an opportunity to opt out. Some of the proposals would require patient consent. If enacted, these proposed laws would impose liability on healthcare businesses arising from the improper sharing or other misuse of personally identifiable information. Some proposals would create a private civil cause of action that would allow an injured party to recover damages sustained as a result of a violation of the new law. A number of states have also considered, or are in the process of considering, prohibitions or limitations on the disclosure of medical or other information to individuals or entities located outside of the United States. Any such restrictions could have a material adverse effect on our ability to provide offshore transcription services.
Recently enacted health care reform legislation could adversely impact us.
The recently enacted Patient Protection and Affordable Care Act and the Health Care and Education Reconciliation Act completely reform the U.S. healthcare system. Among other things, the legislation significantly increases governmental involvement in healthcare, requires most Americans to carry health insurance coverage, with federal subsidies to help many afford the premiums (insurance companies would be barred from denying coverage to people with medical problems or charging them more); and completely overhauls the environment in which healthcare industry constituents operate. This legislation impacts most
19
Table of Contents
employers, virtually all tax payers and all segments of the healthcare industry. It is impossible to predict the ultimate impact that this new legislation will have on the healthcare industry. Possible outcomes may be that healthcare industry constituents may reduce their expenditures or postpone expenditure decisions, including expenditures for our service offerings. Such a response, and others that we cannot predict or foresee at this time, could have a significant and material adverse impact on our current and future business operations and, thus, our financial condition and results of operations.
If we fail to maintain adequate internal controls over financial reporting, current stockholders and potential investors could lose confidence in our financial reporting, which would harm our business prospects and the trading price of our common stock.
Section 404 of the Sarbanes-Oxley Act of 2002 requires management to evaluate the effectiveness of internal controls over financial reporting as of each year-end. Management has concluded that as of December 31, 2010, 2009 and 2008, internal controls over financial reporting were effective. Management may identify control deficiencies in the future that, individually or in the aggregate, could constitute one or more additional material weaknesses. Effective internal controls are necessary for us to provide reliable financial reports. If we cannot provide reliable financial reports, stockholder and investor confidence in our business and results of operations could be negatively impacted, which could have a negative impact on the trading prices of our common stock and could lead to litigation claims and regulatory proceedings against us. The defense of any such claims or proceedings may cause the diversion of management’s attention and resources, and we may be required to pay damages if any such claims or proceedings are not resolved in our favor. Any litigation or regulatory proceedings, even if resolved in our favor, could result in significant legal and other expenses. Such events could harm the business, negatively affect our ability to raise capital and adversely affect the trading price of our common stock.
Unauthorized use of our proprietary technology and intellectual property could adversely affect our business and results of operations.
Our success and competitive position depend in large part on our ability to obtain and maintain intellectual property rights protecting our services. We rely on a combination of copyrights, trademarks, service marks, trade secrets, confidentiality provisions and licensing arrangements to establish and protect our intellectual property and proprietary rights. Unauthorized parties may attempt to copy aspects of our BeyondTXT or Gemstar platforms or to obtain, license, sell or otherwise use information that management regards as proprietary. Policing unauthorized use of our intellectual property is difficult, and we may not be able to protect technology from unauthorized use. In addition, the laws of some foreign countries do not protect proprietary rights to the same extent as the laws of the United States. Although the source code for our proprietary software is protected both as a trade secret and as a copyrighted work, litigation may be necessary to enforce intellectual property rights, to protect trade secrets, to determine the validity and scope of the proprietary rights of others, or to defend against claims of infringement or invalidity. Litigation, regardless of the outcome, can be very expensive and can divert management efforts, which could adversely affect our business and results of operations.
Third parties may claim that we are infringing on their intellectual property, and we could be exposed to significant litigation or licensing expenses or be prevented from selling our products and services if such claims are successful.
We may be subject to claims of infringement or contributing to the infringement of the intellectual property rights of others. We may be unaware of intellectual property rights of others that may cover some of our technologies. If it appears necessary or desirable, we may seek licenses for these intellectual property rights.
However, we may not be able to obtain licenses from some or all claimants, the terms of any offered licenses may not be acceptable, and we may not be able to resolve disputes without litigation. Any litigation regarding intellectual property could be costly and time-consuming and could divert the attention of management
20
Table of Contents
and key personnel from business operations. In the event of a claim of intellectual property infringement, we may be required to enter into costly royalty or license agreements. Third parties claiming intellectual property infringement may be able to obtain injunctive or other equitable relief that could effectively block the ability to develop technologies and sell services. If we do not prevail in any such disputes, we may be unable to use certain technologies considered to be proprietary, and results of operations, financial position and cash flows could be adversely impacted.
Our technology may have defects, which could result in delayed or lost revenue, expensive correction, liability to customers and claims against us.
Complex software products such as those used by us may contain errors or defects. Defects in the solutions that are developed for our use could require expensive corrections and result in delayed or lost revenue, adverse customer reaction and negative publicity about our services. Customers who are not satisfied with our transcription services due to technological errors or defects may also bring claims against us for damages, which, even if unsuccessful, would likely be time-consuming to defend, and could result in costly litigation and payment of damages. Such claims could harm our reputation, business, financial results and competitive position.
Changes to the overall economic environment could negatively impact results of operations or access to capital.
Although healthcare generally is considered to be a recession-resistant industry, negative changes to the overall economic environment can impact us in a number of ways, including the following:
| • | reduced demand for healthcare services could result in reduced demand for transcription services; |
| • | deterioration in the financial condition of customers could result in our having greater write-offs and reduced future revenue; |
| • | reduced access to capital or deterioration in available terms could result in a decreased ability to fund our growth through acquisitions or increased costs related to funding such growth; |
| • | deterioration in the financial condition of our partners could result in service or product interruptions which could negatively impact our business; and |
| • | changes in tax regulations could negatively affect our results of operations. |
Risks Related to Our Corporate Structure, Organization and Common Stock
Our directors and executive officers beneficially own a significant amount of our common stock and will be able to exercise significant influence on matters requiring stockholder approval.
Our directors and executive officers beneficially own approximately 18% of our common stock as of February 28, 2011. Consequently, directors and executive officers as a group will continue to be able to exert significant influence over the election of directors, the outcome of most corporate actions requiring stockholder approval and our business, which may have the effect of delaying or precluding a third party from acquiring control of us.
The market price for our common stock is volatile, which could cause a loss of a significant portion of investment.
The market price of our common stock could be subject to significant fluctuations in response to certain factors, such as variations in anticipated or actual results of operations, the operating results of other companies in the medical transcription industry, changes in conditions affecting the economy generally, general trends in the healthcare industry, sales of common stock by insiders, as well as other factors unrelated to operating results. Volatility in the market price of our common stock may prevent one from being able to sell shares at or above the
21
Table of Contents
price paid for shares. Moreover, companies that have experienced volatility in the market price of their stock often are subject to securities class action litigation. If we were the subject of such litigation, it could result in substantial costs and divert management’s attention and resources.
We have implemented anti-takeover provisions, which could discourage or prevent a takeover, even if an acquisition would be beneficial to stockholders.
Provisions of our certificate of incorporation, bylaws and Delaware law, as well as other organizational documents could make it more difficult for a third party to acquire us, even if doing so would be beneficial to stockholders. These provisions include:
| • | authorized “blank check” preferred stock; |
| • | limiting the ability of stockholders to call special meetings of stockholders; and |
| • | establishing advance notice requirements for nominations of directors and for stockholder proposals. |
| ITEM 1B. | UNRESOLVED STAFF COMMENTS. |
None.
| ITEM 2. | PROPERTIES. |
We lease 12,441 square feet of space for our principal office in Atlanta, Georgia under a lease that expires January 31, 2015. We also lease space for a regional office in Brooksville, Florida under a lease that was recently renewed through the end of 2011. As a result of our 2009 acquisition of MDSI we assumed an office lease of approximately 2,600 square feet in Gaithersburg, Maryland. As a result of our 2010 acquisition of Heartland, we assumed an office lease of approximately 14,000 square feet located in Toledo, Ohio, and leases for approximately 56,000 square feet for our operations centers in Bangalore, Delhi and Chennai, India. We believe our office space is suitable and adequate for its intended purpose. See Note 11 of the Notes to Consolidated Financial Statements for a summary of lease commitments.
| ITEM 3. | LEGAL PROCEEDINGS. |
From time to time in the normal course of business, we are involved in legal proceedings. We evaluate the need for loss accruals under the requirements of Financial Accounting Standards Board (FASB) Accounting Standards Codification (ASC) 450 Contingencies. We record an estimated loss for any claim, lawsuit, investigation or proceeding when it is probable that a liability has been incurred and the amount of the loss can reasonably be estimated. If the reasonable estimate of a probable loss is a range, and no amount within the range is a better estimate, then we record the minimum amount in the range as our loss accrual. If a loss is not probable or a probable loss cannot be reasonably estimated, no liability is recorded.
On May 6, 2010, Transcription Relief Services, Inc., or TRS, which we acquired in May 2009, filed a civil action against us in the United States District Court for the Middle District of North Carolina. The dispute centers around the contingent consideration payable under the TRS asset purchase agreement. The TRS asset purchase agreement provided for a contingent consideration payment of up to $3.0 million based on TRS fourth quarter 2009 revenue and TRS December 31, 2009 backlog. We calculated a fourth quarter 2009 revenue contingent consideration payment of $1,123,000, which was paid in February 2010. On February 26, 2010, we received notice that TRS disputed our calculation and claimed an additional payment of $1,877,000. We responded on March 10, 2010, stating that TRS’s objections were without merit and asking that the dispute be postponed pending delivery of the backlog contingent payment calculation. TRS agreed to the postponement. On March 30, 2010, we delivered the backlog contingent payment calculation to TRS showing an amount payable of $0. TRS objected to our backlog contingent payment calculation. Under the terms of the asset purchase agreement, in the case of a disagreement over the calculation of the contingent payment, the parties were to select an independent
22
Table of Contents
auditor to review the calculation. In the civil action filed on May 6, 2010, TRS generally alleged that we frustrated their ability to maximize the contingent payment under the TRS asset purchase agreement. TRS seeks compensatory damages of approximately $1,877,000, unspecified damages, attorney’s fees, interest and costs. The lawsuit is in the early procedural stages and the ultimate outcome cannot be determined at this time. We have evaluated this claim and the civil action and believe that no additional payments are due under the calculations outlined in the asset purchase agreement.
| ITEM 4. | (REMOVED AND RESERVED) |
23
Table of Contents
PART II
| ITEM 5. | MARKET FOR REGISTRANT’S COMMON EQUITY, RELATED STOCKHOLDER MATTERS AND ISSUER PURCHASES OF EQUITY SECURITIES |
Market Information
Our common stock is listed on the NASDAQ Global Select Market under the symbol “TRCR”. As of February 28, 2011, there were approximately 225 holders of record of our common stock. The table below sets forth, for the periods indicated, the high and low sales prices of our common stock as reported on the NASDAQ Global Select Market for the periods indicated.
| Price Per Share of Common Stock |
||||||||
| High | Low | |||||||
| Year Ended December 31, 2010 |
||||||||
| Fourth Quarter Ended December 31, 2010 |
$ | 20.48 | $ | 15.01 | ||||
| Third Quarter Ended September 30, 2010 |
$ | 15.54 | $ | 13.31 | ||||
| Second Quarter Ended June 30, 2010 |
$ | 17.54 | $ | 12.00 | ||||
| First Quarter Ended March 31, 2010 |
$ | 21.69 | $ | 15.65 | ||||
| Year Ended December 31, 2009 |
||||||||
| Fourth Quarter Ended December 31, 2009 |
$ | 21.82 | $ | 15.87 | ||||
| Third Quarter Ended September 30, 2009 |
$ | 18.53 | $ | 13.45 | ||||
| Second Quarter Ended June 30, 2009 |
$ | 15.98 | $ | 9.75 | ||||
| First Quarter Ended March 31, 2009 |
$ | 10.84 | $ | 9.05 | ||||
Dividends
On August 31, 2009, we entered into a loan and security agreement with Regions Bank. The covenants of the agreement prohibit us from paying any cash dividend or other cash distribution, direct or indirect, on account of any equity interest issued by us or any of our subsidiaries. See “Liquidity and Capital Resources” in Item 7, “Management’s Discussion and Analysis of Financial Condition and Results of Operations” and Note 7 of the Notes to Consolidated Financial Statements for a more detailed discussion of dividend payment restrictions.
Our policy is to retain earnings for the expansion and development of our business. We do not anticipate paying cash dividends on our common stock in the foreseeable future.
See Note 15 of the Notes to Consolidated Financial Statements for information with respect to our stock-based compensation plans.
24
Table of Contents
Stock Performance Graph
The following performance graph compares the cumulative return of our shares of common stock over the preceding five year periods with that of the broad market (NASDAQ Composite-Total Returns Index) and the NASDAQ Health Services Index. Each Index assumes $100 invested at December 31, 2005 in our common stock and each index and also assumes dividend reinvestment.
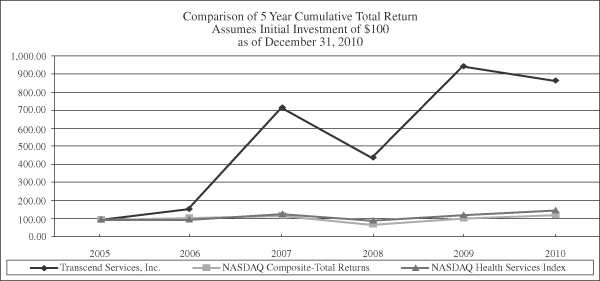
| December 31, | ||||||||||||||||||||||||
| Company / Index |
2005 | 2006 | 2007 | 2008 | 2009 | 2010 | ||||||||||||||||||
| Transcend Services, Inc. |
$ | 100 | $ | 159 | $ | 722 | $ | 444 | $ | 950 | $ | 871 | ||||||||||||
| NASDAQ Composite-Total Returns |
100 | 110 | 122 | 73 | 107 | 126 | ||||||||||||||||||
| NASDAQ Health Services Index |
100 | 100 | 131 | 95 | 126 | 152 | ||||||||||||||||||
25
Table of Contents
| ITEM 6. | SELECTED FINANCIAL DATA |
The following table sets forth selected consolidated financial data for the periods indicated, derived from our consolidated financial statements. This selected financial data should be read in conjunction with the consolidated financial statements, related notes and other financial information included and incorporated by reference in this Form 10-K.
Selected Financial Data
(in thousands, except per share data)
| 2010 | 2009 | 2008 | 2007(1) | 2006 | ||||||||||||||||
| Results of Operations: |
||||||||||||||||||||
| Revenue |
$ | 94,307 | $ | 71,764 | $ | 48,696 | $ | 42,454 | $ | 32,912 | ||||||||||
| Operating income |
$ | 14,469 | $ | 11,083 | $ | 8,947 | $ | 6,487 | $ | 2,047 | ||||||||||
| Net income |
$ | 8,520 | $ | 6,759 | $ | 5,768 | $ | 9,660 | $ | 1,457 | ||||||||||
| Basic earnings per share |
$ | 0.81 | $ | 0.78 | $ | 0.68 | $ | 1.17 | $ | 0.19 | ||||||||||
| Weighted average shares outstanding |
10,495 | 8,613 | 8,448 | 8,262 | 7,874 | |||||||||||||||
| Diluted earnings per share |
$ | 0.79 | $ | 0.76 | $ | 0.65 | $ | 1.10 | $ | 0.18 | ||||||||||
| Diluted weighted average shares outstanding |
10,845 | 8,921 | 8,814 | 8,752 | 7,940 | |||||||||||||||
| Financial Position at Year End: |
||||||||||||||||||||
| Cash and cash equivalents |
$ | 6,207 | $ | 25,732 | $ | 12,282 | $ | 4,996 | $ | 215 | ||||||||||
| Investments |
$ | 20,454 | $ | 2,000 | $ | — | $ | — | $ | — | ||||||||||
| Total assets |
$ | 82,217 | $ | 69,388 | $ | 26,095 | $ | 20,749 | $ | 10,620 | ||||||||||
| Total long term debt |
$ | — | $ | — | $ | 238 | $ | 843 | $ | 3,081 | ||||||||||
| Total stockholders’ equity |
$ | 70,163 | $ | 59,357 | $ | 21,850 | $ | 15,634 | $ | 4,307 | ||||||||||
| (1) | Includes a $6.4 million tax benefit from the reduction in deferred tax valuation allowances related to net operating loss carry-forwards. |
26
Table of Contents
| ITEM 7. | MANAGEMENT’S DISCUSSION AND ANALYSIS OF FINANCIAL CONDITION AND RESULTS OF OPERATIONS |
You should read the following discussion and analysis of our financial condition and results of operations in conjunction with our consolidated financial statements and the related notes included herein and/or incorporated by reference into this Annual Report. This discussion and analysis contains forward-looking statements that involve risks, uncertainties, and assumptions. Our actual results may differ materially from those anticipated in these forward-looking statements as a result of certain factors, including, but not limited to, those set forth under “Risk Factors” and elsewhere in this Annual Report or in documents incorporated by reference into this Annual Report.
Overview
We are the second largest medical transcription services company in the United States based on revenues. We serve approximately 331 hospital customers nationwide plus a number of clinics and physician’s offices. We estimate that our primary target market is approximately $2.5 billion, comprised primarily of approximately 5,000 community-based hospitals (hospitals accessible by the general public) in the United States. Our mission is to provide accurate and timely documentation of the patient/medical provider encounter at a competitive price. Customer service is crucial to our success, and we have consistently been ranked among the top medical transcription service organizations in the industry. Our approximately 2,400 medical language specialists, including 750 based in India, supplemented by our offshore partners, provide high quality medical documents and fast turnaround times, resulting in a high customer retention rate, which has averaged more than 95% (measured by revenues) over the last four years. We develop and utilize an array of technology solutions to support the transcription process, including robust voice capture systems, state-of-the-art speech recognition technology, our proprietary transcription platforms and various customer-specific systems. We believe we are well-positioned to benefit from the increasing adoption and use of electronic medical records, or EMRs, because the data and narrative content we create comprise key portions of EMRs.
Hospitals have the flexibility of choosing between our two primary service delivery options. Customers with in-house transcription platforms can partner with us to provide medical transcription services directly on their platform. Customers deciding to outsource this function can outsource the entire transcription process to us, in which case we provide our services using our proprietary transcription platforms.
Our revenue is recurring in nature, which we believe results from our customers’ ongoing, mission-critical need to document each doctor-patient encounter and our consistently high service levels, resulting in high customer retention rates. Information about revenue, operating profit or loss and total assets is presented in Item 8, “Financial Statements and Supplementary Data” of this Annual Report. Since we are paid directly by hospitals and other providers, we have no direct insurance-related reimbursement risk.
Outlook
The U.S. economy deteriorated significantly in 2008 and 2009, stemming primarily from disruption in the global credit markets. If the economy were to further deteriorate, we could see deterioration in the financial condition of our customers and collection of our accounts receivable. The decrease in availability of consumer credit as well as general unfavorable economic conditions, has caused consumers to reduce their discretionary spending, including spending for medical care. Job losses and the resulting losses of healthcare benefits could further reduce demand for healthcare services. We have not experienced any noticeable deterioration in accounts receivable or transcription volume to date. It is also uncertain what effect the credit crisis may have on the security of the U.S. banking system, and specifically the bank where our cash and cash equivalents are deposited. This could impact our access to and cost of capital. In addition, FDIC insurance does not fully insure our deposits. We had $657,000 of uninsured cash and cash equivalents in the United States at December 31, 2010. We also had $1,525,000 of deposits in India that are not insured by the FDIC. In addition to the impact of the overall economic environment, the following trends and uncertainties could have a material future impact on our financial results:
| • | The aging of the “baby boomers” will create increased demand for healthcare services, which should in turn create increased demand for medical transcription services. Over the next 20 years, the U.S. |
27
Table of Contents
| population over the age of 65 is expected to increase from roughly 40 million to 70 million, according to the U.S. Census Bureau. |
| • | Increased adoption of EMR solutions could result in greater demand for electronic documentation, including transcription of reports that are currently hand-written. Alternatively, EMR solutions could reduce the demand for traditional transcription since physicians could be required to “point and click” to complete a template rather than dictate to document portions of their patient encounters. Management believes that dictation is more efficient and produces a more robust record than using only templates, and we anticipate that in the future, hybrid solutions will become more common. We believe that the pace of change in the healthcare industry has increased, particularly as it relates to adoption of the EMR, and we expect this trend to continue. We are addressing this opportunity and risk by exploring opportunities to make the data in our reports more useful to hospitals and by exploring the opportunity to partner with firms to more deeply integrate our service offering into total documentation solutions for hospitals. |
| • | Increased use of speech recognition technology and offshore resources in the future could result in higher profitability for us. At the same time, competition within the medical transcription industry, combined with use of offshore resources and speech recognition technology by our competitors, could create downward pricing pressure in the industry. The potential net impact of these two trends is difficult to predict with certainty. |
| • | In March 2010, U.S. federal legislation was enacted which is likely to have a significant impact on, among other things, access to and the cost of healthcare in the United States. The legislation provides for extensive health insurance reforms and expands coverage to approximately 32 million Americans which will result in expanded access to healthcare. We believe these changes will benefit our industry by leading to increased utilization of our services. These benefits are expected to be partially offset by provisions of the legislation aimed at reducing the overall cost of healthcare. It is uncertain at this time what additional healthcare reform initiatives, if any, will be implemented, or whether there will be other changes in the administration of governmental healthcare programs or interpretations of governmental policies or other changes affecting the healthcare system. The ultimate content or timing of any future legislation, and its impact on us, is impossible to predict. If significant reforms are made to the healthcare system in the United States, or in other jurisdictions, those reforms may have an adverse effect on our financial condition and results of operations. |
| • | Historically, our new customer sales have predominantly come from replacing incumbent medical transcription firms. A significant portion of medical transcription work in hospitals is still performed by hospital employees. Management sees a trend toward outsourcing medical transcription services that could have a positive impact on our financial results if the trend accelerates and we are able to successfully compete for the business. |
| • | We have not historically had difficulty in staffing to meet demand as we have grown. However, looking at the industry as a whole, we do not expect the domestic labor market for medical transcriptionists to grow fast enough to meet increased demand. We are addressing this challenge by increasing employee productivity through the use of speech recognition technology, utilizing offshore resources and by attempting to develop a reputation as one of the best places to work in the industry. It is possible that in the future a tightening labor market could result in upward pressure on wages, but to date we have not seen evidence of this and we do not anticipate this occurring in the short-term. |
| • | We completed three acquisitions in 2009 and one in October 2010, which have had a material impact on our financial statements. Acquisitions involve significant risk, including integration risk, and it is possible that we will not realize the anticipated benefits of the acquisitions we have made. |
| • | We have experienced annual operating losses in prior years, the most recent occurring in 2005. While we have increased our level of net income in recent years, there can be no assurance that operating losses will not occur in the future. Over the short term, excluding the impact of acquisitions, the variability in our earnings and cash flow is mitigated by the fact that our revenue is recurring in nature and our largest expense, the cost of the transcriptionists, is variable in relation to revenue. |
28
Table of Contents
Critical Accounting Estimates that are Material to Registrant
A critical accounting estimate meets two criteria: (1) it requires assumptions about highly uncertain matters; and (2) there would be a material effect on the financial statements from either using a different, also reasonable, amount within the range of the estimate in the current period or from reasonably likely period-to-period changes in the estimate. The preparation of consolidated financial statements requires that management make estimates and assumptions based on knowledge of current events and actions; however, actual results may ultimately differ from estimates and assumptions. Our critical accounting estimates are as follows:
Allowance for Doubtful Accounts. Accounts receivable are recorded net of an allowance for doubtful accounts established to provide for losses on uncollectible accounts based on management’s evaluation of each account and historical collection experience. We reserve specific accounts once collection appears unlikely and record a general reserve on remaining outstanding receivables. We evaluate the adequacy of the allowance for doubtful accounts quarterly. Accounts outstanding longer than contractual payment terms are considered past due and are reviewed individually for collectibility. Management considers the age of the receivable, the financial health of the customer and payment history to evaluate the collectability of accounts receivable. Accounts receivable are written off once all collection efforts are exhausted.
Goodwill and Intangible Assets. We account for goodwill and other intangible assets in accordance with the provisions of FASB ASC Topic 350—Intangibles-Goodwill and Other. Under the provisions of this Topic, goodwill and intangible assets that have indefinite useful lives are tested at least annually for impairment rather than being amortized like intangible assets with finite useful lives, which are amortized over their useful lives. We had goodwill of $28,246,000 and $23,650,000 at December 31, 2010 and 2009, respectively, and other net intangible assets related to acquisitions of $7,055,000 and $5,685,000 at December 31, 2010 and 2009, respectively. Management reviews goodwill and other intangible assets for impairment annually and whenever events or changes in circumstances indicate that the carrying value may not be recoverable. In testing for impairment, management calculates the fair value of the reporting units to which the goodwill and intangibles relate based on market capitalization of the company as a whole. We have concluded that we operate in one reporting unit—medical transcription services—since all of our revenue is derived from medical transcription services and since we have one organization dedicated to the provision of our service.
In connection with certain of our acquisitions, we allocated a portion of the purchase price to acquired customer relationships, acquired technology and covenants-not-to-compete using appraisals based on discounted cash flow analysis. The estimated fair values attributed to the relationships and covenants are being amortized over a period of five to ten years, which represented the estimated average remaining lives of the contracts and relationships. The estimated fair value attributed to acquired technology is being amortized over a period of two years, which represented the estimated remaining life of the technology. We account for long-lived assets such as purchased intangible assets with finite lives under The Impairment or Disposal of Long-Lived Assets Subsections of Topic 360—Property, Plant and Equipment. This Subtopic requires that such long-lived assets be reviewed for impairment whenever events or changes in circumstances indicate that the carrying amount of an asset may not be recoverable. Recoverability of assets to be held and used is measured by a comparison of the carrying amount of an asset to future undiscounted net cash flows expected to be generated by the asset. If such assets are considered to be impaired, the impairment to be recognized is measured by the amount by which the carrying amount of the assets exceeds the estimated fair value of the assets based on a discounted cash flow approach or, when available and appropriate, to comparable market values. Assets to be disposed of are reported at the lower of the carrying amount or fair value less cost to sell.
There were no impairments recognized to goodwill or intangible assets in the year ended December 31, 2010, 2009 and 2008.
Contingent Consideration Payable. A contingent consideration payment was part of the asset purchase agreement for our acquisition of TRS. We estimated the fair value of this payable as of the purchase date of the
29
Table of Contents
acquisition. FASB ASC, Topic 805—Business Combinations requires that this estimate is re-measured to fair value at each reporting date until the contingency is resolved. These interim changes in estimated fair value, along with any differences in the final settlement, are recognized in operating expense. The purchase date fair value of the TRS contingent consideration was $353,000. As of December 31, 2009, the value was calculated as $1,123,000. The $770,000 difference was recognized as operating expense in the fourth quarter of 2009 and the total amount of $1,123,000 was paid in February 2010.
Deferred Tax Assets and Liabilities. We account for our income taxes in accordance with FASB ASC Topic 740—Income Taxes. Deferred tax assets and liabilities are recognized for the expected tax consequences of temporary differences between the tax basis of assets and liabilities and their reported amounts for financial reporting purposes. As of December 31, 2010, we had net current deferred tax assets of $482,000 and net non-current deferred tax assets of $470,000. Deferred tax assets represent future tax benefits we expect to realize. Our ability to utilize the deferred tax benefits is dependent upon our ability to generate future taxable income. FASB ASC Topic 740—Income Taxes requires us to record a valuation allowance against any deferred income tax benefits that we believe may not be realized. We estimate future taxable income to determine whether a valuation allowance is needed. Projecting our future taxable income requires us to use significant judgment regarding expected future revenues and expenses. In addition, we must assume that tax laws will not change sufficiently to materially impact the expected tax liability associated with our expected taxable income. We have valuation allowances against net operating loss carryforwards in certain states in which future taxable income in those states may not be sufficient to utilize the net operating loss carryforwards in those states prior to their expiration.
With the acquisition of Heartland, we are now subject to income taxes in the United States of America and India. Significant judgment is required in determining our consolidated provision for income taxes and recording the related assets and liabilities. In the ordinary course of our business, there are many transactions and calculations where the ultimate tax determination is uncertain. Although we believe we have appropriate support for the positions taken on our tax returns, we have recorded a liability for our best estimate of the probable loss on certain of these positions. We believe that our accruals for tax liabilities are adequate for all open years, based on our assessment of many factors including past experience and interpretations of tax law applied to the facts of each matter, which matters result primarily from intercompany transfer pricing. Although we believe our recorded assets and liabilities are reasonable, tax regulations are subject to interpretation and tax litigation is inherently uncertain; therefore our assessments can involve both a series of complex judgments about future events and rely heavily on estimates and assumptions. Although we believe the estimates and assumptions supporting our assessments are reasonable, the final determination of tax audits and any related litigation could be materially different than that which is reflected in historical income tax provisions and recorded assets and liabilities. Based on the results of an audit or litigation, a material effect on our income tax provision, net income, or cash flows in the period or periods for which that determination is made could result. Due to the complexity involved, we are not able to estimate the range of reasonably possible losses in excess of amounts recorded.
Self-funded Medical Insurance. In 2010, we moved to a self-funded medical insurance plan for our US based employees. We contracted with a separate administrative service company to supervise and administer the program and act as our representative. We have reduced the risk under this self-funded plan by purchasing stop-loss insurance coverage for claims in excess of prescribed limits. We record estimates for our claim liability based on information provided by the third-party plan administrators, historical claims experience, the life cycle of claims, expected costs of claims incurred but not paid, and expected costs to settle unpaid claims. We monitor our estimated insurance-related liabilities on a monthly basis. As facts change, it may become necessary to make adjustments that could be material to our results of operations and financial condition. This liability is subject to a total limitation that varies based on employee enrollment and factors that are established at each annual contract renewal. Actual claims experience may differ from our estimates. Costs related to the administration of the plan and related claims are expensed as incurred.
Stock-Based Compensation. Our stock-based awards are accounted for under the provisions of FASB ASC Topic 718—Stock Compensation. We measure and recognize stock-based compensation expense based on the
30
Table of Contents
fair value measurement for all stock-based payment awards made to our employees and directors, including stock options and restricted stock awards over the service period for which the awards are expected to vest. We calculate the fair value of each restricted stock award based on our stock price on the date of grant. We calculate the fair value of each stock option award on the date of grant using the Black-Scholes-Merton option pricing model. The determination of fair value of stock option awards on the date of grant using an option-pricing model is affected by our stock price as well as a number of assumptions including expected term, expected volatility, risk-free interest rate and dividend yield. As a result, the future stock-based compensation expense may differ from our historical amounts.
Legal Proceedings. From time to time in the normal course of business, we are involved in legal proceedings. We evaluate the need for loss accruals under the requirements of FASB ASC 450—Contingencies. We record an estimated loss for any claim, lawsuit, investigation or proceeding when it is probable that a liability has been incurred and the amount of the loss can reasonably be estimated. If the reasonable estimate of a probable loss is a range, and no amount within the range is a better estimate, then we record the minimum amount in the range as our loss accrual. If a loss is not probable or a probable loss cannot be reasonably estimated, no liability is recorded.
The table below and the discussions that follow summarize our results of operations for the years ended December 31, 2010, 2009 and 2008.
| Year Ended December 31, | Year Ended December 31, | |||||||||||||||||||||||
| 2010 | 2009 | 2008 | 2010 | 2009 | 2008 | |||||||||||||||||||
| (Dollars in thousands, except per share) | (As a percentage of revenue) | |||||||||||||||||||||||
| Revenue |
$ | 94,307 | $ | 71,764 | $ | 48,696 | 100 | % | 100 | % | 100 | % | ||||||||||||
| Direct costs |
59,680 | 46,443 | 30,852 | 63 | % | 65 | % | 63 | % | |||||||||||||||
| Gross profit |
34,627 | 25,321 | 17,844 | 37 | % | 35 | % | 37 | % | |||||||||||||||
| Operating expenses: |
||||||||||||||||||||||||
| Sales and marketing |
1,928 | 1,651 | 1,130 | 2 | % | 2 | % | 2 | % | |||||||||||||||
| Research and development |
2,073 | 1,507 | 1,065 | 2 | % | 2 | % | 2 | % | |||||||||||||||
| General and administrative |
14,128 | 9,713 | 5,880 | 15 | % | 14 | % | 12 | % | |||||||||||||||
| Depreciation and amortization |
2,029 | 1,367 | 822 | 2 | % | 2 | % | 2 | % | |||||||||||||||
| Total operating expenses |
20,158 | 14,238 | 8,897 | 21 | % | 20 | % | 18 | % | |||||||||||||||
| Operating income |
14,469 | 11,083 | 8,947 | 15 | % | 15 | % | 18 | % | |||||||||||||||
| Net other income (expense) |
(127 | ) | (287 | ) | (3 | ) | 0 | % | 0 | % | 0 | % | ||||||||||||
| Income from operations before income taxes |
14,342 | 10,796 | 8,944 | 15 | % | 15 | % | 18 | % | |||||||||||||||
| Income tax provision |
5,822 | 4,037 | 3,176 | 6 | % | 6 | % | 7 | % | |||||||||||||||
| Net income |
$ | 8,520 | $ | 6,759 | $ | 5,768 | 9 | % | 9 | % | 12 | % | ||||||||||||
| Net income per share: |
||||||||||||||||||||||||
| Basic |
$ | 0.81 | $ | 0.78 | $ | 0.68 | ||||||||||||||||||
| Diluted |
$ | 0.79 | $ | 0.76 | $ | 0.65 | ||||||||||||||||||
31
Table of Contents
Year Ended December 31, 2010 Compared to Year Ended December 31, 2009
Revenue increased $22,543,000, or 31%, to $94,307,000 in 2010, compared to revenue of $71,764,000 in 2009. The $22,543,000 increase in revenue is attributable to revenue contributed by the acquisition of MDSI (in August 2009) of $10,675,000, revenue from the acquisition of Heartland (in October 2010) of $3,722,000, increased revenue from existing customers of $3,871,000, revenue from new customers of $4,309,000 and increased revenue from other services of $194,000 offset by a decrease in revenue of $228,000 from customers who terminated their contracts in 2010.
Direct costs increased $13,237,000, or 29%, to $59,680,000 in 2010, compared to $46,443,000 in 2009. Direct costs attributable to MDSI contributed $8,062,000 of this increase and those attributable to Heartland contributed $2,223,000 of the increase. Direct costs include costs attributable to compensation for transcriptionists, fees paid for speech recognition processing, telephone expenses, recruiting, management, customer service, technical support for operations, and implementation of transcription services. Transcription compensation is a variable cost based on lines transcribed or edited multiplied by specified per-line pay rates that vary by individual as well as type of work. Speech recognition processing is a variable cost based on the minutes of dictation processed. All other direct costs referred to above are semi-variable operations infrastructure costs that periodically change in anticipation of or in response to the overall level of production activity.
As a percentage of revenue, direct costs decreased to 63% in 2010 from 65% in 2009. The decrease in costs as a percentage of revenue was due primarily to an increased utilization of speech recognition technology on our BeyondTXT platform. The percentage of BeyondTXT volume that was edited using speech recognition technology increased from 62% in 2009 to 75% in 2010. Work processed on BeyondTXT has lower costs due to the use of speech recognition technology to produce drafts of reports which are then edited by our medical language specialists. The percentage of transcription work performed by our offshore vendors remained constant at 18% from 2009 to 2010. Excluding the impact of the MDSI and Heartland acquisitions, direct costs decreased to 61% of revenue for 2010 compared to 64% for 2009.
Gross profit increased $9,306,000, or 37%, to $34,627,000 in 2010 compared to $25,321,000 in 2009. Gross profit as a percentage of revenue increased to 37% in 2010 compared to 35% in 2009 primarily as a result of the reductions in direct costs discussed above.
Sales and marketing expenses increased $277,000, or 17%, to $1,928,000 in 2010, compared to $1,651,000 in 2009. Sales and marketing expenses as a percentage of revenue were 2% in both 2010 and 2009. The increase in sales and marketing expense was primarily due to an increase in compensation from the additions to the sales team and increases in marketing and advertising efforts in 2010 mostly related to a large industry trade show that we attended in 2010 and not in 2009.
Research and development expenses increased $566,000, or 38%, to $2,073,000 in 2010, compared to $1,507,000 in 2009. Research and development expenses as a percentage of revenue were 2% in both 2010 and 2009. The increase in expense was primarily due to an increase in compensation-related expenses and telephone expense, partially offset by increased capitalization of software development costs related to the development of our Encore transcription workflow platform. The acquisition of Heartland contributed $81,000 to the increase.
General and administrative expenses increased $4,415,000, or 45%, to $14,128,000 in 2010, compared to $9,713,000 in 2009. General and administrative expenses as a percentage of revenue were 15% in 2010 and 14% in 2009. Heartland and MDSI general and administrative expenses were $683,000 and $395,000, respectively, of the increase. Acquisition related expenses contributed $1,250,000 to the increase, partially offset by the 2009 TRS acquisition related contingent payment of $770,000. Also included in the increase is a $308,000 correction to stock-based compensation expense recorded in 2010 that related to previous years. The balance of the increase was due primarily to increased compensation, contract services and professional fees, employee benefits costs, and stock-based compensation expense. Excluding one-time acquisition-related costs and the stock-based
32
Table of Contents
compensation correction recorded in 2010, general and administrative expenses as a percentage of revenue were 13% in 2010 and 12% in 2009.
Depreciation and amortization expenses increased $662,000, or 48%, to $2,029,000 in 2010, compared to $1,367,000 in 2009. Depreciation and amortization expenses as a percentage of revenue were 2% in both 2010 and 2009. Amortization of intangible assets resulting from the acquisition of MDSI and Heartland contributed $255,000 and $55,000, respectively, of the increase. The remaining $352,000 was due to higher capital expenditures resulting in increased depreciable assets.
Interest and other expense decreased $160,000 to $127,000 in 2010, compared to $287,000 in 2009. The decrease is due primarily to decreases in amortization of prepaid costs related to our credit facility and interest expense, partially offset by an increase in interest income on the proceeds from our December 2009 stock offering.
The income tax provision increased $1,785,000 to $5,822,000 for 2010, compared to $4,037,000 for 2009. The provision increased primarily due to higher pre-tax income and a higher effective tax rate of 40.6% for 2010 compared to 37.4% for 2009. The increased rate in 2010 is primarily due to the permanent difference created by the adjustment for stock-based compensation expense, an increase in our combined state tax rate, the addition of foreign taxes and the impact of non-deductible transaction costs.
Net income increased $1,761,000, or 26%, to $8,520,000 in 2010, compared to $6,759,000 in 2009. Fully diluted earnings per share increased $0.03, to $0.79 for 2010, compared to $0.76 for 2009.
Year Ended December 31, 2009 Compared to Year Ended December 31, 2008
Revenue increased $23,068,000, or 47%, to $71,764,000 in 2009, compared to revenue of $48,696,000 in 2008. The $23,068,000 increase in revenue is attributable to revenue contributed by the acquisitions of $15,395,000 (DeVenture $5,400,000, TRS $4,965,000 and MDSI $5,030,000), increased revenue from existing customers of $6,121,000 and revenue from new customers of $4,023,000, offset by a decrease in revenue of $2,471,000 from customers who terminated their contracts in 2009.
Direct costs increased $15,591,000, or 51%, to $46,443,000 in 2009, compared to $30,852,000 in 2008. Acquisitions in 2009 contributed $10,098,000 of this increase (DeVenture $3,114,000, TRS $3,231,000 and MDSI $3,753,000). Direct costs include costs attributable to compensation for transcriptionists, fees paid for speech recognition processing, telephone expenses, recruiting, management, customer service, technical support for operations, and implementation of transcription services. Transcription compensation is a variable cost based on lines transcribed or edited multiplied by specified per-line pay rates that vary by individual as well as type of work. Speech recognition processing is a variable cost based on the minutes of dictation processed. All other direct costs referred to above are semi-variable operations infrastructure costs that periodically change in anticipation of or in response to the overall level of production activity.
As a percentage of revenue, direct costs increased to 65% in 2009 from 63% in 2008. The increase in costs as a percentage of revenue was due primarily to a decrease in the percentage of work processed on our BeyondTXT transcription platform versus other platforms from 66% in 2008 to 53% in 2009. Work processed on BeyondTXT has lower costs due to the use of speech recognition technology to produce drafts of reports which are then edited by our medical language specialists. The decrease in the percentage of BeyondTXT work is due to the impact of additional non-BeyondTXT work processed for customers from the three acquisitions completed in 2009. Direct costs as a percentage of revenue were also higher for the acquired businesses. In addition, implementation and support costs have grown in order to manage conversion of some acquired customers onto BeyondTXT and to support the larger customer base. With all other factors remaining stable, we believe that direct costs as a percent of revenue should decrease in 2010 as customers from acquisitions are migrated to our BeyondTXT platform.
33
Table of Contents
Approximately 18% of our transcription work was performed offshore during 2009, compared to 19% during 2008. During 2009, approximately 31% of our volume was edited using speech recognition technology on the BeyondTXT platform, compared to 30% during 2008.
Gross profit increased $7,477,000, or 42%, to $25,321,000 in 2009 compared to $17,844,000 in 2008. Gross profit as a percentage of revenue decreased to 35% in 2009 compared to 37% in 2008 (see direct costs discussion).
Sales and marketing expenses increased $521,000, or 46%, to $1,651,000 in 2009, compared to $1,130,000 in 2008. Sales and marketing expenses as a percentage of revenue were 2% in 2009 and 2008. The increase in sales and marketing expense was primarily due to an increase in compensation from the additions to the sales team, increases in commissions on 2009 sales, an increased focus on advertising and marketing and increased fees paid to GPOs.
Research and development expenses increased $442,000, or 42%, to $1,507,000 in 2009, compared to $1,065,000 in 2008. Research and development expenses as a percentage of revenue were 2% in 2009 and 2008. The increase was primarily due to an increase in compensation-related expenses and increases in hardware and software maintenance costs related to information technology initiatives.
General and administrative expenses increased $3,833,000, or 65%, to $9,713,000 in 2009, compared to $5,880,000 in 2008. General and administrative expenses as a percentage of revenue were 14% in 2009 and 12% in 2008. General and administrative expenses for DeVenture, TRS and MDSI collectively contributed $1,408,000 of the increase. We incurred $268,000 of transaction costs related to acquisitions in 2009. We also recognized a net expense of $735,000 due to changes in the fair value of contingent consideration related to the acquisitions of TRS and MDSI. The balance of $1,422,000 of the increase was due primarily to increased compensation, contract services and professional fees, employee benefits costs, and stock-based compensation expense.
Depreciation and amortization expenses increased $545,000, or 66%, to $1,367,000 in 2009, compared to $822,000 in 2008. Depreciation and amortization expenses as a percentage of revenue were 2% in 2009 and 2008. Amortization of intangible assets resulting from the acquisitions of DeVenture, TRS and MDSI contributed $325,000 of the increase. The remaining $220,000 was due to growth in depreciable assets.
Interest and other expense increased $284,000, to $287,000 in 2009, compared to $3,000 in 2008. The increase is due primarily to increases in amortization of prepaid costs related to the credit facility that we entered into with Regions Bank in 2009 and the write-off of $60,000 of prepaid costs related to the early termination of our facility with Healthcare Finance Group, or HFG, and the promissory note payable to Development Corporation of Abilene, Inc., or DCOA, an increase in interest expense and lower interest income on cash due to lower interest rates and cash balances for most of the year.
We reported income tax expense of $4,037,000 in 2009 compared to $3,176,000 in 2008. The provision increased primarily due to higher pre-tax income and a slightly higher effective tax rate of 37.4% for 2009 compared to 35.5% for 2008.
Net income increased $991,000, or 17%, to $6,759,000 in 2009, compared to $5,768,000 in 2008. Fully diluted earnings per share increased $0.11, to $0.76 for 2009, compared to $0.65 for 2008.
OFF-BALANCE SHEET ARRANGEMENTS
We do not have any off-balance sheet arrangements.
We recognize all derivatives as either assets or liabilities at fair value in our consolidated balance sheet.
34
Table of Contents
CONTRACTUAL OBLIGATIONS
We have the following contractual obligations as of December 31, 2010:
| Payments due by period | ||||||||||||||||||||
| Total | Less than 1 year |
1-3 years | 3-5 years | More than 5 years |
||||||||||||||||
| Short-term debt obligations (1) |
$ | 68,000 | $ | 68,000 | $ | — | $ | — | $ | — | ||||||||||
| Capital lease obligations |
— | — | — | — | — | |||||||||||||||
| Operating lease obligations |
3,436,000 | 1,278,000 | 2,039,000 | 119,000 | — | |||||||||||||||
| Purchase obligations |
— | — | — | — | — | |||||||||||||||
| Other long term liabilities |
— | — | — | — | — | |||||||||||||||
| Total |
$ | 3,504,000 | $ | 1,346,000 | $ | 2,039,000 | $ | 119,000 | $ | — | ||||||||||
| (1) | Includes projected interest payments. |
In addition to the obligations in the table above, approximately $5,667,000 of unrecognized tax benefits and interest on those balances have been recorded as liabilities in accordance with ASC 740, Income Taxes and we are uncertain as to if or when such amounts may be settled.
LIQUIDITY AND CAPITAL RESOURCES
As of December 31, 2010, we had cash and cash equivalents of $6,207,000, short-term investments of $20,454,000, working capital of $31,109,000, and availability of approximately $5.0 million on our line of credit based on eligible accounts receivable (see Note 7 of the Notes to Consolidated Financial Statements). We had $67,000 of debt outstanding as of December 31, 2010 and did not utilize our available line of credit in 2010.
The following table summarizes the cash flows for the years ended December 31, 2010, 2009 and 2008:
| For the Year Ended December 31, | ||||||||||||
| 2010 | 2009 | 2008 | ||||||||||
| (in thousands) | ||||||||||||
| Net cash provided by operating activities |
$ | 11,483 | $ | 8,088 | $ | 9,540 | ||||||
| Net cash used in investing activities |
(29,068 | ) | (23,055 | ) | (989 | ) | ||||||
| Cash provided by (used in) financing activities |
(1,940 | ) | 28,417 | (1,265 | ) | |||||||
| Increase (decrease) in cash and cash equivalents |
$ | (19,525 | ) | $ | 13,450 | $ | 7,286 | |||||
Cash provided by operating activities was $11,483,000 for the year ended December 31, 2010 compared to $8,088,000 for the year ended December 31, 2009. The increase was primarily due to an increase in non-cash working capital and improved profitability before income taxes and non-cash items.
Cash used in investing activities was $29,068,000 for the year ended December 31, 2010, compared to $23,055,000 for the year ended December 31, 2009. The outflow in 2010 was due to the $18,454,000 net purchase of short-term investments, $1,825,000 in capital expenditures, $5,761,000 for the acquisition of Heartland, $3,012,000 of capitalized research and development expenditures and a $16,000 adjustment to the purchase price of a previous acquisition. Cash used in investing activities in 2009 was primarily for the purchase of DeVenture, TRS and MDSI.
35
Table of Contents
Cash used in financing activities was $1,940,000 for the year ended December 31, 2010 compared to cash provided by financing activities of $28,417,000 in the same period in 2009. The cash used during 2010 was primarily for the repayment of promissory notes of $2,832,000, offset by cash provided by the tax benefit for share-based payments of $160,000 and the proceeds from the exercise of stock options of $676,000. The cash provided in 2009 was primarily from the net proceeds of $26,507,000 from our follow-on offering in December, 2009.
We maintained a four year credit facility with Healthcare Finance Group, or HFG, that was due to mature on December 31, 2009 and was initially comprised of up to $3.6 million on an accounts receivable-based revolving promissory note and up to $2.0 million of term loans to fund acquisitions. The term loan portion expired on December 31, 2007. On August 31, 2009, we terminated our credit facility with HFG in order to secure new financing from Regions Bank.
On August 31, 2009, Transcend and MDSI entered into a loan and security agreement with Regions Bank. Transcend and MDSI are both “borrowers” under the loan and security agreement, which replaced our credit facility with HFG. The loan and security agreement with Regions Bank includes a one-time term loan of $7.0 million for the costs and expenses of, and to the extent necessary a portion of the purchase price for MDSI. The loan and security agreement also provides for up to $5.0 million in a revolving loan commitment based on eligible accounts receivable. We may use proceeds of the revolving loan only for working capital, general corporate purposes, and for specified acquisitions. The maximum amount of the revolving loan may be increased at the discretion of Regions Bank to $8.0 million. We used $4.0 million of the proceeds from the follow-on offering of our common stock completed in the fourth quarter of 2009 to pay down the term loan. The original revolving loan commitment expired and was renewed for another year in August 2010. Borrowings bear interest at a rate based on the current LIBOR (3.75% as of December 31, 2010), and are secured by substantially all of our assets. The outstanding balance on the four-year term loan was $67,000 as of December 31, 2010 and the balance on the revolver was $0 as of December 31, 2010. We did not draw on the revolver at any time during 2010.
The loan and security agreement contains representations and warranties, as well as affirmative, reporting and negative covenants customary for financings of this type. Among other things, the loan and security agreement restricts the borrowers from incurring certain additional debt, prohibits the borrowers from creating, permitting or allowing certain liens on their property, restricts the payment of dividends, distributions and other specified equity related transactions by us, and prohibits certain borrowings and specified transactions with affiliates. The loan and security agreement also requires the maintenance of a specified minimum fixed charge coverage ratio, tangible net worth, and cash flow leverage, as defined in the agreement. As of December 31, 2010 we were in compliance with all covenants of the agreement with the exception of a covenant related to annual lease expense. With the acquisition of Heartland, our 12 month lease liability exceeded the $600,000 threshold under the agreement. Regions Bank has issued a waiver and we have amended the agreement to increase the amount of annual lease liability to $2.0 million.
We anticipate that cash on hand, together with cash flow from operations, should be sufficient for at least the next twelve months to finance operations, make capital investments in the ordinary course of business and pay indebtedness when due.
Part of our growth strategy is the completion of acquisitions. Management believes that available cash and our credit facility together with other acquisition options, such as seller financing, are only sufficient to complete small to medium-sized acquisitions. Additional financing will be required for larger acquisitions.
IMPACT OF INFLATION
Inflation has not had a material effect on our operations to date. However, the effects of inflation on future operating results will depend in part on our ability to increase prices or lower expenses, or both, in amounts that
36
Table of Contents
offset inflationary cost increases. Contract prices are generally fixed for the duration of the contractual period and typically do not provide for price increases over the term of the contract, which usually extends from one to three years. India is currently experiencing inflation rates in excess of those in the United States. If the India inflation rate remains high, our ability to deliver cost effective services in India could be jeopardized.
| ITEM 7A. | QUANTITATIVE AND QUALITATIVE DISCLOSURE ABOUT MARKET RISK |
Interest Rate Risk
We have a floating rate of interest on our credit facility. As of December 31, 2010, the current balance of the term loan under our credit facility was $67,000 and the current rate was 3.75%. A 10% change in the interest rate would not have a material impact on our interest expense on the credit facility.
Foreign Currency Exchange Rate Risk
We are exposed to foreign currency exchange rate risk in the ordinary course of doing business as we transact or hold a portion of our funds in the Indian rupee. Accordingly, we periodically evaluate the need for hedging strategies, including the use of derivative financial instruments, to mitigate the effect of foreign currency exchange rate fluctuations and expect to continue to use such instruments in the future to reduce foreign currency exposure to appreciation or depreciation in the value of certain foreign currencies. All hedging transactions are authorized and executed pursuant to regularly reviewed policies and procedures.
We have entered into a series of foreign exchange forward contracts that are designated as cash flow hedges of expense payments in India. India converts U.S. dollar receipts from intercompany billings to Indian rupees to fund local expenses, including salaries. These U.S. dollar / Indian rupee hedges are intended to partially offset the impact of movement of exchange rates on future operating costs. We limit the forward contracts operational period to 12 months or less, and we do not enter into foreign exchange forward contracts for trading purposes. As of December 31, 2010, the notional value of these contracts was $4,875,000. The outstanding contracts as of December 31, 2010 are scheduled to mature during 2011. The gain or loss on our foreign exchange forward contracts is marked to market at each reporting period. As of December 31, 2010, the net unrealized gain on our outstanding foreign exchange forward contracts was $238,000, compared to $384,000 as of the Heartland acquisition date. The change in value of $146,000 is reflected as a reduction in pre-tax income in the fourth quarter of 2010. Based upon a sensitivity analysis of our foreign exchange forward contracts at December 31, 2010, which estimates the fair value of the contracts based upon market exchange rate fluctuations, a 10.0% change in the foreign currency exchange rate against the U.S. dollar with all other variables held constant would have resulted in a change in the fair value of approximately $24,000. Our hedges of our foreign currency exposure are not designed to, and, therefore, cannot entirely eliminate the effect of changes in foreign exchange rates on our consolidated financial position, results of operations and cash flows.
37
Table of Contents
| ITEM 8. | FINANCIAL STATEMENTS AND SUPPLEMENTARY DATA |
The following financial statements are filed with this report:
Management’s Report on Internal Control Over Financial Reporting
Report of Independent Registered Public Accounting Firm
Report of Independent Registered Public Accounting Firm on Internal Control Over Financial Reporting
Consolidated Balance Sheets as of December 31, 2010 and 2009
Consolidated Statements of Operations for the years ended December 31, 2010, 2009 and 2008
Consolidated Statements of Cash Flows for the years ended December 31, 2010, 2009 and 2008
Consolidated Statements of Stockholders’ Equity for the years ended December 31, 2010, 2009 and 2008
Notes to Consolidated Financial Statements
38
Table of Contents
MANAGEMENT’S REPORT ON INTERNAL CONTROL OVER FINANCIAL REPORTING
Management is responsible for establishing and maintaining adequate internal control over financial reporting. The Company’s internal control framework and processes are designed to provide reasonable assurance to management and the Board of Directors regarding the reliability of financial reporting and the preparation of the Company’s financial statements in accordance with accounting principles generally accepted in the United States of America.
The Company’s internal control over financial reporting includes those policies and procedures that:
| • | pertain to the maintenance of records that, in reasonable detail, accurately and fairly reflect the transactions of the Company; |
| • | provide reasonable assurance that transactions are recorded properly to allow for the preparation of financial statements in accordance with generally accepted accounting principles, and that receipts and expenditures of the Company are being made only in accordance with authorizations of management and Directors of the Company; |
| • | provide reasonable assurance regarding prevention or timely detection of unauthorized acquisition, use, or disposition of the Company’s assets that could have a material effect on the consolidated financial statements; and |
| • | provide reasonable assurance as to the detection of fraud. |
Because of its inherent limitations, a system of internal control over financial reporting can provide only reasonable assurance that a misstatement of the Company’s financial statements would be prevented or detected. Further, because of changing conditions, effectiveness of internal control over financial reporting may vary over time.
Management, including the Company’s Chief Executive Officer and Chief Financial Officer, assessed the effectiveness of the Company’s internal control over financial reporting as of December 31, 2010 using the criteria established in a report entitled “Internal Control—Integrated Framework” issued by the Committee of Sponsoring Organizations of the Treadway Commission. Based on its assessment, management, including our Chief Executive Officer and Chief Financial Officer, concluded that, as of December 31, 2010, the Company’s internal control over financial reporting was effective.
On October 21, 2010, the Company entered into an Agreement and Plan of Merger with Spryance, Inc. and certain principal stockholders, and acquired Spryance, Inc. (known as “Heartland”) through a merger of Transcend Acquisition Corporation (a wholly-owned subsidiary of Transcend Services, Inc.) into Spryance, Inc.
Refer to Note 2 of the Notes to the Consolidated Financial Statements for additional information regarding this acquisition. However, due to the complexities of the India operations and limited time between the consummation of the acquisition and management’s assessment and as permitted by related SEC Staff interpretive guidance for newly acquired businesses, the Company excluded Heartland from management’s annual assessment of the effectiveness of the Company’s internal control over financial reporting as of December 31, 2010. This acquisition constituted 19% of total assets as of December 31, 2010 and 4% of revenue for the year then ended. This subsidiary will be included in future evaluations of the effectiveness of the Company’s internal control over financial reporting no later than December 31, 2011.
The Company’s independent registered public accounting firm, Grant Thornton LLP, has audited the consolidated financial statements as of and for the year ended December 31, 2010 and has also issued their report on the effectiveness of the Company’s internal control over financial reporting contained in this annual report.
| /s/ LARRY G. GERDES |
/s/ LANCE B. CORNELL | |
| Larry G. Gerdes | Lance B. Cornell | |
| Chief Executive Officer | Chief Financial Officer |
39
Table of Contents
Report of Independent Registered Public Accounting Firm on Consolidated Financial Statements
Board of Directors and Stockholders
Transcend Services, Inc.
We have audited the accompanying consolidated balance sheets of Transcend Services, Inc. (a Delaware corporation) and subsidiaries (the “Company”) as of December 31, 2010 and 2009, and the related consolidated statements of operations, stockholders’ equity, and cash flows for each of the three years in the period ended December 31, 2010. Our audits of the basic consolidated financial statements included the financial statement schedule listed in the index appearing under Item 15. These financial statements and financial statement schedule are the responsibility of the Company’s management. Our responsibility is to express an opinion on these financial statements based on our audits.
We conducted our audits in accordance with the standards of the Public Company Accounting Oversight Board (United States). Those standards require that we plan and perform the audit to obtain reasonable assurance about whether the financial statements are free of material misstatement. An audit includes examining, on a test basis, evidence supporting the amounts and disclosures in the financial statements. An audit also includes assessing the accounting principles used and significant estimates made by management, as well as evaluating the overall financial statement presentation. We believe that our audits provide a reasonable basis for our opinion.
In our opinion, the consolidated financial statements referred to above present fairly, in all material respects, the financial position of the Company as of December 31, 2010 and 2009, and the results of its operations and its cash flows for each of the three years in the period ended December 31, 2010 in conformity with accounting principles generally accepted in the United States of America. Also in our opinion, the related financial statement schedule, when considered in relation to the basic consolidated financial statements taken as a whole, presents fairly, in all material respects, the information set forth therein.
We also have audited, in accordance with the standards of the Public Company Accounting Oversight Board (United States), the Company’s internal control over financial reporting as of December 31, 2010, based on criteria established in Internal Control—Integrated Framework issued by the Committee of Sponsoring Organizations of the Treadway Commission (COSO) and our report dated March 15, 2011 expressed an unqualified opinion.
/s/ Grant Thornton LLP
Atlanta, Georgia
March 15, 2011
40
Table of Contents
Report of Independent Registered Public Accounting Firm on Internal Control Over Financial Reporting
Board of Directors and Stockholders
Transcend Services, Inc.
We have audited Transcend Services, Inc.’s (a Delaware Corporation) (the “Company”) internal control over financial reporting as of December 31, 2010, based on criteria established in Internal Control—Integrated Framework issued by the Committee of Sponsoring Organizations of the Treadway Commission (COSO). The Company’s management is responsible for maintaining effective internal control over financial reporting and for its assessment of the effectiveness of internal control over financial reporting, included in the accompanying Management’s Report on Internal Control Over Financial Reporting (Management’s Report). Our responsibility is to express an opinion on the Company’s internal control over financial reporting based on our audit. Our audit of, and opinion on, the Company’s internal control over financial reporting does not include internal control over financial reporting of Spryance, Inc., a wholly owned subsidiary, whose financial statements reflect total assets and revenues constituting 19 percent and 4 percent, respectively, of the related consolidated financial statement amounts as of and for the year ended December 31, 2010. As indicated in Management’s Report, Spryance, Inc. was acquired during 2010 and therefore, management’s assertion on the effectiveness of Company’s internal control over financial reporting excluded internal control over financial reporting of Spryance, Inc.
We conducted our audit in accordance with the standards of the Public Company Accounting Oversight Board (United States). Those standards require that we plan and perform the audit to obtain reasonable assurance about whether effective internal control over financial reporting was maintained in all material respects. Our audit included obtaining an understanding of internal control over financial reporting, assessing the risk that a material weakness exists, testing and evaluating the design and operating effectiveness of internal control based on the assessed risk, and performing such other procedures as we considered necessary in the circumstances. We believe that our audit provides a reasonable basis for our opinion.
A company’s internal control over financial reporting is a process designed to provide reasonable assurance regarding the reliability of financial reporting and the preparation of financial statements for external purposes in accordance with generally accepted accounting principles. A company’s internal control over financial reporting includes those policies and procedures that (1) pertain to the maintenance of records that, in reasonable detail, accurately and fairly reflect the transactions and dispositions of the assets of the company; (2) provide reasonable assurance that transactions are recorded as necessary to permit preparation of financial statements in accordance with generally accepted accounting principles, and that receipts and expenditures of the company are being made only in accordance with authorizations of management and directors of the company; and (3) provide reasonable assurance regarding prevention or timely detection of unauthorized acquisition, use, or disposition of the company’s assets that could have a material effect on the financial statements.
Because of its inherent limitations, internal control over financial reporting may not prevent or detect misstatements. Also, projections of any evaluation of effectiveness to future periods are subject to the risk that controls may become inadequate because of changes in conditions, or that the degree of compliance with the policies or procedures may deteriorate.
In our opinion, the Company maintained, in all material respects, effective internal control over financial reporting as of December 31, 2010 based on criteria established in Internal Control—Integrated Framework issued by COSO.
We also have audited, in accordance with the standards of the Public Company Accounting Oversight Board (United States), the consolidated balance sheets of the Company as of December 31, 2010 and 2009, and the related consolidated statements of operations, stockholders’ equity, and cash flows for each of the three years in the period ended December 31, 2010, and our report dated March 15, 2011 expressed an unqualified opinion.
/s/ Grant Thornton LLP
Atlanta, Georgia
March 15, 2011
41
Table of Contents
TRANSCEND SERVICES, INC.
CONSOLIDATED BALANCE SHEETS
(Rounded to the nearest thousand)
| December 31, 2010 |
December 31, 2009 |
|||||||
| ASSETS | ||||||||
| Current assets: |
||||||||
| Cash and cash equivalents |
$ | 6,207,000 | $ | 25,732,000 | ||||
| Short-term investments |
20,454,000 | 2,000,000 | ||||||
| Accounts receivable, net of allowance for doubtful accounts of $124,000 at December 31, 2010 and $96,000 at December 31, 2009 |
12,037,000 | 9,500,000 | ||||||
| Deferred income tax, net |
482,000 | 317,000 | ||||||
| Prepaid income tax |
— | 64,000 | ||||||
| Prepaid expenses and other current assets |
688,000 | 252,000 | ||||||
| Total current assets |
39,868,000 | 37,865,000 | ||||||
| Property and equipment: |
||||||||
| Computer equipment |
4,113,000 | 3,095,000 | ||||||
| Software |
4,263,000 | 2,990,000 | ||||||
| Furniture and fixtures |
652,000 | 611,000 | ||||||
| Total property and equipment |
9,028,000 | 6,696,000 | ||||||
| Accumulated depreciation and amortization |
(6,052,000 | ) | (4,857,000 | ) | ||||
| Property and equipment, net |
2,976,000 | 1,839,000 | ||||||
| Capitalized software development costs |
3,188,000 | 176,000 | ||||||
| Intangible assets: |
||||||||
| Goodwill |
28,246,000 | 23,650,000 | ||||||
| Other intangible assets |
8,789,000 | 6,699,000 | ||||||
| Total intangible assets |
37,035,000 | 30,349,000 | ||||||
| Accumulated amortization |
(1,734,000 | ) | (1,014,000 | ) | ||||
| Intangible assets, net |
35,301,000 | 29,335,000 | ||||||
| Deferred income tax, net—noncurrent |
470,000 | — | ||||||
| Other assets |
414,000 | 173,000 | ||||||
| Total assets |
$ | 82,217,000 | $ | 69,388,000 | ||||
| LIABILITIES AND STOCKHOLDERS’ EQUITY | ||||||||
| Current liabilities: |
||||||||
| Accounts payable |
$ | 1,653,000 | $ | 1,384,000 | ||||
| Accrued compensation and benefits |
3,666,000 | 2,296,000 | ||||||
| Promissory note payable to related party |
— | 2,000,000 | ||||||
| Promissory notes payable |
67,000 | 899,000 | ||||||
| Other accrued liabilities |
3,373,000 | 2,210,000 | ||||||
| Total current liabilities |
8,759,000 | 8,789,000 | ||||||
| Long term liabilities: |
||||||||
| Deferred income tax, net |
— | 1,083,000 | ||||||
| Other liabilities |
3,295,000 | 159,000 | ||||||
| Total long term liabilities |
3,295,000 | 1,242,000 | ||||||
| Commitments and contingencies (Note 11) |
— | — | ||||||
| Stockholders’ equity: |
||||||||
| Preferred stock, $0.01 par value; 2,000,000 shares authorized and no shares outstanding at December 31, 2010 and 2009 |
— | — | ||||||
| Common stock, $0.05 par value; 30,000,000 shares authorized at December 31, 2010 and 15,000,000 shares authorized at December 31, 2009; 10,566,000 and 10,477,000 shares issued and outstanding at December 31, 2010 and 2009, respectively |
528,000 | 524,000 | ||||||
| Additional paid-in capital |
63,368,000 | 61,086,000 | ||||||
| Retained earnings (deficit) |
6,267,000 | (2,253,000 | ) | |||||
| Total stockholders’ equity |
70,163,000 | 59,357,000 | ||||||
| Total liabilities and stockholders’ equity |
$ | 82,217,000 | $ | 69,388,000 | ||||
The accompanying notes are an integral part of these consolidated financial statements.
42
Table of Contents
TRANSCEND SERVICES, INC.
CONSOLIDATED STATEMENTS OF OPERATIONS
(Rounded to the nearest thousand, except earnings per share)
| Year ended December 31, | ||||||||||||
| 2010 | 2009 | 2008 | ||||||||||
| Revenue |
$ | 94,307,000 | $ | 71,764,000 | $ | 48,696,000 | ||||||
| Direct costs (exclusive of depreciation and amortization) |
59,680,000 | 46,443,000 | 30,852,000 | |||||||||
| Gross profit |
34,627,000 | 25,321,000 | 17,844,000 | |||||||||
| Operating expenses: |
||||||||||||
| Sales and marketing (exclusive of depreciation and amortization) |
1,928,000 | 1,651,000 | 1,130,000 | |||||||||
| Research and development (exclusive of depreciation and amortization) |
2,073,000 | 1,507,000 | 1,065,000 | |||||||||
| General and administrative (exclusive of depreciation and amortization) |
14,128,000 | 9,713,000 | 5,880,000 | |||||||||
| Depreciation and amortization |
2,029,000 | 1,367,000 | 822,000 | |||||||||
| Total operating expenses |
20,158,000 | 14,238,000 | 8,897,000 | |||||||||
| Operating income |
14,469,000 | 11,083,000 | 8,947,000 | |||||||||
| Interest and other expense: |
||||||||||||
| Interest expense, related party |
67,000 | 33,000 | 6,000 | |||||||||
| Interest (income) |
(48,000 | ) | (17,000 | ) | (148,000 | ) | ||||||
| Interest expense |
63,000 | 271,000 | 145,000 | |||||||||
| Loss on foreign currency transactions, net |
45,000 | — | — | |||||||||
| Total interest and other expense, net |
127,000 | 287,000 | 3,000 | |||||||||
| Income before income taxes |
14,342,000 | 10,796,000 | 8,944,000 | |||||||||
| Income tax provision |
5,822,000 | 4,037,000 | 3,176,000 | |||||||||
| Net income |
$ | 8,520,000 | $ | 6,759,000 | $ | 5,768,000 | ||||||
| Basic earnings per share: |
||||||||||||
| Net earnings per share |
$ | 0.81 | $ | 0.78 | $ | 0.68 | ||||||
| Weighted average shares outstanding |
10,495,000 | 8,613,000 | 8,448,000 | |||||||||
| Diluted earnings per share: |
||||||||||||
| Net earnings per share |
$ | 0.79 | $ | 0.76 | $ | 0.65 | ||||||
| Weighted average shares outstanding |
10,845,000 | 8,921,000 | 8,814,000 | |||||||||
The accompanying notes are an integral part of these consolidated financial statements.
43
Table of Contents
TRANSCEND SERVICES, INC.
CONSOLIDATED STATEMENTS OF CASH FLOWS
(Rounded to the nearest thousand)
| Year Ended December 31, | ||||||||||||
| 2010 | 2009 | 2008 | ||||||||||
| CASH FLOWS FROM OPERATING ACTIVITIES: |
||||||||||||
| Net income |
$ | 8,520,000 | $ | 6,759,000 | $ | 5,768,000 | ||||||
| Adjustments to reconcile net income to cash provided by operating activities: |
||||||||||||
| Deferred income taxes |
415,000 | 611,000 | 2,763,000 | |||||||||
| Depreciation and amortization |
2,029,000 | 1,367,000 | 822,000 | |||||||||
| Share-based compensation |
1,394,000 | 604,000 | 381,000 | |||||||||
| Employment credits—debt forgiveness |
— | — | (124,000 | ) | ||||||||
| Changes in assets and liabilities: |
||||||||||||
| Accounts receivable, net |
82,000 | (987,000 | ) | (837,000 | ) | |||||||
| Prepaid income taxes, excluding tax benefit for share based payments |
224,000 | 1,383,000 | — | |||||||||
| Tax benefit for share based payments |
(160,000 | ) | (1,447,000 | ) | — | |||||||
| Prepaid expenses and other current assets |
188,000 | 94,000 | (43,000 | ) | ||||||||
| Other assets |
706,000 | (87,000 | ) | 208,000 | ||||||||
| Accounts payable |
(38,000 | ) | 149,000 | 356,000 | ||||||||
| Accrued and other liabilities |
(1,877,000 | ) | (358,000 | ) | 246,000 | |||||||
| Total adjustments |
2,963,000 | 1,329,000 | 3,772,000 | |||||||||
| Net cash provided by operating activities |
11,483,000 | 8,088,000 | 9,540,000 | |||||||||
| CASH FLOWS FROM INVESTING ACTIVITIES: |
||||||||||||
| Capital expenditures |
(1,825,000 | ) | (1,118,000 | ) | (949,000 | ) | ||||||
| Purchase of short-term investments |
(73,420,000 | ) | (2,000,000 | ) | — | |||||||
| Sale/maturity of short-term investments |
54,966,000 | — | — | |||||||||
| Capitalized Software Development Cost |
(3,012,000 | ) | — | — | ||||||||
| Purchase of businesses, net of cash acquired |
(5,761,000 | ) | (19,937,000 | ) | — | |||||||
| Adjustment to purchase price for previous acquisition |
(16,000 | ) | — | (40,000 | ) | |||||||
| Net cash used in investing activities |
(29,068,000 | ) | (23,055,000 | ) | (989,000 | ) | ||||||
| CASH FLOWS FROM FINANCING ACTIVITIES: |
||||||||||||
| Proceeds from stock options and other issuances |
676,000 | 283,000 | 67,000 | |||||||||
| Proceeds from common stock offering |
56,000 | 26,507,000 | — | |||||||||
| Tax benefit for share based payments |
160,000 | 1,447,000 | — | |||||||||
| Proceeds from borrowings |
— | 844,000 | — | |||||||||
| Repayment of promissory notes to related parties |
(2,000,000 | ) | — | — | ||||||||
| Repayment of promissory notes |
(832,000 | ) | (660,000 | ) | (1,332,000 | ) | ||||||
| Repayment of revolving promissory note |
— | (4,000 | ) | — | ||||||||
| Net cash provided by (used in) financing activities |
(1,940,000 | ) | 28,417,000 | (1,265,000 | ) | |||||||
| Increase (decrease) in cash and cash equivalents |
(19,525,000 | ) | 13,450,000 | 7,286,000 | ||||||||
| Cash and cash equivalents at beginning of year |
25,732,000 | 12,282,000 | 4,996,000 | |||||||||
| Cash and cash equivalents at end of year |
$ | 6,207,000 | $ | 25,732,000 | $ | 12,282,000 | ||||||
| Supplemental cash flow information: |
||||||||||||
| Cash paid for related party interest |
$ | 100,000 | $ | — | $ | 59,000 | ||||||
| Cash paid for interest |
$ | 20,000 | $ | 97,000 | $ | 62,000 | ||||||
| Cash paid for income taxes |
$ | 4,978,000 | $ | 2,287,000 | $ | 250,000 | ||||||
| Non cash investing and financing activities: |
||||||||||||
| Contingent consideration accrued related to previous acquisition |
$ | — | $ | 1,123,000 | $ | 16,000 | ||||||
| Amounts payable to related party in connection with purchase of MDSI |
$ | — | $ | 2,000,000 | $ | — | ||||||
| Common stock issued in connection with acquisition of MDSI |
$ | — | $ | 1,907,000 | $ | — | ||||||
The accompanying notes are an integral part of these consolidated financial statements.
44
Table of Contents
TRANSCEND SERVICES, INC.
CONSOLIDATED STATEMENTS OF STOCKHOLDERS’ EQUITY
(Rounded to the nearest thousand)
| Number of Shares of Series A Preferred Stock |
Series A Preferred Stock |
Number of Shares of Common Stock |
Common Stock |
Additional Paid- in Capital |
Retained Earnings (Deficit) |
Total Stockholders’ Equity |
||||||||||||||||||||||
| Balance, December 31, 2007 |
— | $ | — | 8,435,000 | $ | 422,000 | $ | 29,992,000 | $ | (14,780,000 | )(1) | $ | 15,634,000 | |||||||||||||||
| Net income |
5,768,000 | 5,768,000 | ||||||||||||||||||||||||||
| Issuance of common stock from stock incentive plans |
24,000 | 1,000 | 66,000 | 67,000 | ||||||||||||||||||||||||
| Share-based compensation expense |
381,000 | 381,000 | ||||||||||||||||||||||||||
| Retirement of Treasury shares |
(8,000 | ) | ||||||||||||||||||||||||||
| Balance, December 31, 2008 |
— | $ | — | 8,451,000 | $ | 423,000 | $ | 30,439,000 | $ | (9,012,000 | ) | $ | 21,850,000 | |||||||||||||||
| Net income |
6,759,000 | 6,759,000 | ||||||||||||||||||||||||||
| Issuance of common stock from stock incentive plans |
181,000 | 9,000 | 274,000 | 283,000 | ||||||||||||||||||||||||
| Issuance of common stock in public offering |
1,725,000 | 86,000 | 26,421,000 | 26,507,000 | ||||||||||||||||||||||||
| Issuance of common stock from purchase of MDSI |
120,000 | 6,000 | 1,901,000 | 1,907,000 | ||||||||||||||||||||||||
| Share-based compensation expense |
604,000 | 604,000 | ||||||||||||||||||||||||||
| Tax benefit for share based payments |
1,447,000 | 1,447,000 | ||||||||||||||||||||||||||
| Balance, December 31, 2009 |
— | $ | — | 10,477,000 | $ | 524,000 | $ | 61,086,000 | $ | (2,253,000 | ) | $ | 59,357,000 | |||||||||||||||
| Net income |
8,520,000 | 8,520,000 | ||||||||||||||||||||||||||
| Issuance of common stock from stock incentive plans |
99,000 | 4,000 | 671,000 | 675,000 | ||||||||||||||||||||||||
| Reduction of capitalizable expenses for public offering |
56,000 | 56,000 | ||||||||||||||||||||||||||
| Cancellation of restricted shares |
(10,000 | ) | 1,000 | 1,000 | ||||||||||||||||||||||||
| Share-based compensation expense |
1,394,000 | 1,394,000 | ||||||||||||||||||||||||||
| Tax benefit for share based payments |
160,000 | 160,000 | ||||||||||||||||||||||||||
| Balance, December 31, 2010 |
— | $ | — | 10,566,000 | 528,000 | 63,368,000 | $ | 6,267,000 | $ | 70,163,000 | ||||||||||||||||||
| (1) | Includes a $6.4 million tax benefit in 2007 from the reduction in deferred tax valuation allowances related to net operating loss carry-forwards. |
The accompanying notes are an integral part of these consolidated financial statements.
45
Table of Contents
TRANSCEND SERVICES, INC.
NOTES TO CONSOLIDATED FINANCIAL STATEMENTS
1. NATURE OF BUSINESS AND SUMMARY OF SIGNIFICANT ACCOUNTING POLICIES
NATURE OF BUSINESS
Transcend Services, Inc., or Transcend, utilizes a combination of its proprietary internet-based voice and data distribution technology, customer based technology and medical language specialists to convert physician voice recordings into electronic clinical documentation of patient encounters. Our medical language specialists in the United States predominantly work from home and those in India work predominantly in our three centers there.
BASIS OF PRESENTATION
The accompanying consolidated financial statements include the accounts of Transcend Services, Inc. and its subsidiary companies (the “Company” or “Transcend”). All intercompany accounts and transactions have been eliminated in consolidation.
ACCOUNTING ESTIMATES
The preparation of the consolidated financial statements requires management to make estimates and assumptions based on knowledge of current events and actions; however, actual results may ultimately differ from estimates and assumptions. The calculations of the allowance for doubtful accounts, the fair value of goodwill and other intangible assets, the amount recognized related to uncertain tax positions and the amount of deferred taxes, for examples, all require the use of estimates and are based on management’s judgment.
RECENT ACCOUNTING PRONOUNCEMENTS
Recently Adopted Accounting Pronouncements
In January 2010, the Financial Accounting Standards Board, or FASB, issued Accounting Standards Update, or ASU, 2010-06 to Topic 820—Fair Value Measurements and Disclosures. This update provided requirements of new disclosures of significant transfers in and out of Levels 1 and 2, and expanded disclosure of activity in Level 3 (see Note 6 of these Notes to Consolidated Financial Statements). This update also clarified existing disclosures around the level of disaggregation of each class of assets and liabilities, and about fair value inputs and valuation techniques for Level 2 and Level 3. This update was effective for interim and annual reporting periods beginning after December 15, 2009. Adoption of this update did not have a material impact on our financial statements.
In February 2010, the FASB issued ASU 2010-09 to Topic 855—Subsequent Events, to amend certain recognition and disclosure requirements related to subsequent events. The new guidance clarifies that management must evaluate, as of each reporting period, events or transactions that occur after the balance sheet date through the date that the financial statements are issued. Management must perform its assessment for both interim and annual financial reporting periods. This update also exempts SEC filers from disclosing the date through which subsequent events have been evaluated. Adoption of this update did not have a material impact on our financial statements.
Recently Issued Accounting Pronouncements Not Yet Adopted
In December 2010, the FASB issued ASU 2010-28 to Topic 350— Intangibles—Goodwill and Other : When to Perform Step 2 of the Goodwill Impairment Test for Reporting Units with Zero or Negative Carrying Amounts. The amendments to the Codification in this update modify Step 1 of the goodwill impairment test for
46
Table of Contents
reporting units with zero or negative carrying amounts. For those reporting units, an entity is required to perform Step 2 of the goodwill impairment test if it is more likely than not that a goodwill impairment exists. Goodwill of a reporting unit is required to be tested for impairment between annual tests if an event occurs or circumstances change that would more likely than not reduce the fair value of a reporting unit below its carrying amount. This update is effective starting in the first quarter of 2011 with early adoption not permitted. Adoption of this update is not expected to have a material impact on our financial statements.
In December 2010, the FASB issued ASU 2010-29 to Topic 805—Business Combinations: Disclosure of Supplementary Pro Forma Information for Business Combinations. The amendments to the Codification in this ASU apply to any public entity that enters into business combinations that are material on an individual or aggregate basis and specify that the entity presents comparative financial statements, the entity should disclose revenue and earnings of the combined entity as though the business combination(s) that occurred during the current year had occurred as of the beginning of the comparable prior annual reporting period only. The update also expand the supplemental pro forma disclosures to include a description of the nature and amount of material, nonrecurring pro forma adjustments directly attributable to the business combination included in the reported pro forma revenue and earnings. The update is effective prospectively for business combinations for which the acquisition date is on or after the beginning of the first annual reporting period beginning in January 2011 with early adoption permitted. We plan to adopt this update for all acquisitions completed beginning in 2011 and provide the appropriate disclosures.
FOREIGN CURRENCY TRANSLATION
Assets and liabilities of our Indian subsidiaries are denominated in the local currency of the subsidiary and are re-measured into U.S. dollars (the functional currency) at period-end exchange rates, except nonmonetary assets and liabilities, which are re-measured at the historical rates of exchange prevailing when acquired. Income and expense items are re-measured at average rates of exchange prevailing during the year. Foreign currency exchange gains or losses from re-measurement are included in income. For the year ended December 31, 2010, we recognized a net loss on foreign currency transactions of $45,000 comprised of a net loss on hedging of $146,000 offset by a net gain of $41,000 on transactions and a net gain of $60,000 on re-measurement.
DERIVATIVE INSTRUMENTS
When deemed appropriate, we use derivatives as a risk management tool to mitigate the potential impact of certain market risks. The primary market risk managed through the use of derivative instruments is foreign currency exchange rate risk. All derivatives are carried at fair value in the consolidated balance sheets in the line items prepaid expenses and other assets or accounts payable and accrued expenses, as applicable.
CASH AND CASH EQUIVALENTS
All highly liquid investments purchased with an original maturity of three months or less are classified as cash equivalents. We invest excess cash in money market deposit accounts and short-term investments. We monitor the financial condition of the institutions in which we have depository accounts and believe the risk of loss is remotely possible but not likely. At December 31, 2010, uninsured cash and cash equivalents were approximately $657,000 in the United States of America and $677,000 in India.
SHORT-TERM INVESTMENTS
Short-term investments consist of government notes and fully insured certificates of deposit in the United States and uninsured time deposits in India. These investments are classified as available-for-sale and carried at fair value based on quoted market prices (Level 1 inputs).
47
Table of Contents
ACCOUNTS RECEIVABLE
Accounts receivable are recorded net of an allowance for doubtful accounts established to provide for losses on uncollectible accounts based on management’s evaluation of each account and historical collection experience. We reserve specific accounts once collection appears unlikely and record a general reserve on remaining outstanding receivables. We evaluate the adequacy of the allowance for doubtful accounts quarterly. Accounts outstanding longer than contractual payment terms are considered past due and are reviewed individually for collectibility. Management considers the age of the receivable, the financial health of the customer and payment history to evaluate the collectability of accounts receivable. Accounts receivable are written off once all collection efforts are exhausted.
Our accounts receivable are subject to credit risk, as collateral is generally not required. Our ability to terminate services can be used to encourage customers to pay amounts due on delinquent accounts and mitigate our risk of loss. The carrying amount of our receivables approximates fair value. Although healthcare is generally considered to be a recession-resistant industry, negative changes to the overall economic environment and availability of credit can impact the financial health of customers and their ability to pay for services. Management has not seen any noticeable deterioration in accounts receivable, but will continue to monitor this area closely.
REVENUE AND COST RECOGNITION
Transcription service fee revenue is recognized as the related transcription work is performed on the basis of the number of lines, reports or characters transcribed times the contracted billing rate. Revenue is recognized for the period the transcription work was performed. Revenue is recognized net of any applicable sales tax. Our transcription revenue is all recurring in nature.
Direct costs include costs attributable to compensation for transcriptionists, fees paid for speech recognition processing, telephone expenses, recruiting, management, customer service, technical support for operations, and implementation of transcription services. Transcription compensation is a variable cost based on lines transcribed or edited multiplied by specified per-line pay rates that vary by individual as well as type of work. Speech recognition processing is a variable cost based on the minutes of dictation processed. All other direct costs referred to above are semi-variable operations infrastructure costs that periodically change in anticipation of or in response to the overall level of production activity.
PROPERTY AND EQUIPMENT
Property and equipment are stated at cost, less accumulated depreciation or amortization. Charges for depreciation and amortization of tangible capital assets are computed generally using the straight-line method over their estimated useful lives, which range from three to seven years. Depreciation and amortization expense for tangible capital assets totaled $1,309,000, $883,000 and $663,000 in 2010, 2009 and 2008, respectively, and is recorded entirely in operating expense.
All costs related to the development of internal use software other than those incurred during the application development stage are expensed as incurred. Costs incurred during the application development stage are capitalized and amortized using the straight-line method over three years beginning when the software goes into operational use. Costs capitalized for the development of internal use software were $250,000, $256,000 and $148,000 in 2010, 2009 and 2008, respectively.
We retired fully depreciated property and equipment totaling $85,000, $0 and $2,400,000 that was no longer in service during 2010, 2009 and 2008, respectively.
Net property and equipment held by our Indian subsidiaries was $175,000 at December 31, 2010.
48
Table of Contents
CAPITALIZED SOFTWARE
We account for computer software development costs for products to be licensed or otherwise marketed to third parties in accordance with FASB ASC Topic 985—Accounting for the Costs of Computer Software to be Sold, Leased or Otherwise Marketed. As such, all costs incurred prior to the product achieving technological feasibility are expensed as research and development costs. Technological feasibility is established upon completion of all planning, designing, and testing activities that are necessary to establish that the product can be produced to meet its design specifications including functions, features, and technical performance requirements. Upon achieving technological feasibility, programming costs are capitalized until the product is made available for general release to customers. The capitalized costs are amortized over the economic useful life of the product. At the end of 2009 we began to capitalize costs associated with the development of Encore, our next generation transcription platform. The product, which we intend to license or otherwise market to third parties, is still in development and thus amortization of capitalized costs has not begun. Costs capitalized for the development of products to be licensed or otherwise marketed were $3,083,000, $176,000 and $0 in 2010, 2009 and 2008, respectively. All additional capitalized software is reported in property and equipment since the software is for internal use only.
OTHER ASSETS
Other assets consist primarily of deferred costs of financing, deposits for leased facilities and income taxes receivable in India (see discussion of Income Taxes below).
GOODWILL AND OTHER INTANGIBLE ASSETS
We account for goodwill and other intangible assets in accordance with the provisions of FASB ASC Topic 350—Intangibles-Goodwill and Other. Under the provisions of this Topic, goodwill and other intangible assets that have indefinite useful lives are tested at least annually for impairment rather than being amortized like intangible assets with finite useful lives, which are amortized over their useful lives. We had goodwill of $28,246,000 and $23,650,000 at December 31, 2010 and 2009, respectively, and other net intangible assets related to acquisitions of $7,055,000 and $5,685,000 at December 31, 2010 and 2009, respectively.
Management reviews goodwill and intangibles for impairment annually and whenever events or changes in circumstances indicate that the carrying value may not be recoverable. In testing for impairment, management calculates the fair value of the reporting units to which the goodwill and intangibles relate based on market capitalization of the company as a whole. We have concluded that we operate in one reporting unit—medical transcription services—since all of our revenue is derived from medical transcription services and since we have one organization dedicated to the provision of our service.
In connection with certain of our acquisitions, we allocated a portion of the purchase price to acquired customer relationships, acquired technology and covenants-not-to-compete using appraisals based on discounted cash flow analysis. The estimated fair values attributed to the relationships and covenants are being amortized over a period of five to ten years, which represents the estimated average remaining lives of the contracts and relationships. The estimated fair value attributed to acquired technology is being amortized over a period of two years, which represents the estimated remaining life of the technology.
We account for long-lived assets such as purchased intangible assets with finite lives under The Impairment or Disposal of Long-Lived Assets Subsections of Topic 360—Property, Plant and Equipment. This Subtopic requires that such long-lived assets be reviewed for impairment whenever events or changes in circumstances indicate that the carrying amount of an asset may not be recoverable. Recoverability of assets to be held and used is measured by a comparison of the carrying amount of an asset to future undiscounted net cash flows expected to be generated by the asset. If such assets are considered to be impaired, the impairment to be recognized is measured by the amount by which the carrying amount of the assets exceeds the estimated fair value of the assets based on a discounted cash flow approach or, when available and appropriate, to comparable market values. Assets to be disposed of are reported at the lower of the carrying amount or fair value less cost to sell.
49
Table of Contents
There were no impairments recognized to goodwill or other intangible assets in the years ended December 31, 2010, 2009 and 2008.
FAIR VALUE OF FINANCIAL INSTRUMENTS
In accordance with FASB ASC Topic 820—Fair Value Measures and Disclosure, the carrying value of short-term debt, which totaled $67,000 as of December 31, 2010 and $2.9 million as of December 31, 2009, was estimated to approximate its fair value. The fair value of long-term debt is estimated based on approximate market interest rates for similar issues. Our other financial instruments including cash and cash equivalents, short-term investments, accounts receivable and accounts payable approximate fair value due to the short-term nature of those assets and liabilities.
SELF FUNDED MEDICAL INSURANCE
In 2010, we moved to a self-funded medical insurance plan for our US based employees. We contracted with a separate administrative service company to supervise and administer the program and act as our representative. We have reduced the risk under this self-funded plan by purchasing stop-loss insurance coverage for claims in excess of prescribed limits. We record estimates for our claim liability based on information provided by the third-party plan administrators, historical claims experience, the life cycle of claims, expected costs of claims incurred but not paid, and expected costs to settle unpaid claims. We monitor our estimated insurance-related liabilities on a monthly basis. As facts change, it may become necessary to make adjustments that could be material to our results of operations and financial condition. This liability is subject to a total limitation that varies based on employee enrollment and factors that are established at each annual contract renewal. Actual claims experience may differ from our estimates. Costs related to the administration of the plan and related claims are expensed as incurred.
CONTINGENT CONSIDERATION PAYABLE
A contingent consideration payment was part of the agreement in connection with the acquisition of Transcription Relief Services (TRS). We estimate the fair value of these payables as of the purchase dates of each acquisition. FASB ASC, Topic 805—Business Combinations requires that these estimates are re-measured to fair value at each reporting date until the contingency is resolved. These interim changes in estimated fair value, along with any differences in the final settlement, are recognized in operating expense. The purchase date fair value of the TRS contingent consideration was $353,000. As of December 31, 2009, the value was calculated as $1,123,000. The $770,000 difference was recognized as operating expense in the fourth quarter of 2009 and the total amount of $1,123,000 was paid in February 2010.
Under the terms of the TRS asset purchase agreement, the seller had until February 28, 2010 to accept or dispute our calculation of the contingent consideration payment. On February 26, 2010, we received notice that the seller disputed our calculation and claimed an additional payment of approximately $1.9 million. We have evaluated this claim and believe that no additional payments are due under the calculations outlined in the asset purchase agreement.
In conjunction with the purchase of Medical Dictation Service, Inc. (MDSI) in 2009, the purchase date fair value of the MDSI contingent consideration was $270,000 in the third quarter of 2009. The contingent consideration in the amount of $235,000 was paid in the fourth quarter of 2009 resulting in a $35,000 reduction to operating expense.
STOCK-BASED COMPENSATION
Our stock-based awards are accounted for under the provisions of FASB ASC Topic 718—Stock Compensation. We measure and recognize stock-based compensation expense based on the fair value measurement for all share-based payment awards made to our employees and directors, including stock options
50
Table of Contents
and restricted stock awards over the service period for which the awards are expected to vest. We calculated the fair value of each restricted stock award based on our stock price on the date of grant. We calculated the fair value of each stock option award on the date of grant using the Black-Scholes-Merton option pricing model. The determination of fair value of stock option awards on the date of grant using an option-pricing model is affected by our stock price as well as a number of complex assumptions including expected life, expected volatility, risk-free interest rate and dividend yield. As a result, the future stock-based compensation expense may differ from our historical amounts.
INCOME TAXES
We account for our income taxes in accordance with FASB ASC Topic 740—Income Taxes. Deferred tax assets and liabilities are recognized for the future tax consequences attributable to differences between the financial statement carrying amounts of existing assets and liabilities, and their respective tax bases. Deferred tax assets and liabilities are measured using enacted tax rates expected to apply to taxable income in the years in which those temporary differences are expected to be recovered or settled. The effect of changes in tax rates on deferred tax assets and liabilities is recognized as income or expense in the period that includes the enactment date. The measurement of deferred tax assets is reduced, if necessary, by a valuation allowance for any tax benefits of which future realization is not more likely than not. Changes in valuation allowance from period to period are reflected in the income statement of the period of change. Deferred taxes are not provided on the undistributed earnings of non-U.S. subsidiaries where it is expected that the earnings of the foreign subsidiary will be indefinitely reinvested. Tax benefits of deductions earned on exercise of employee stock options in excess of compensation charged to earnings are credited to additional paid in capital.
This Topic also contains a two-step approach to recognizing and measuring uncertain tax positions. The first step is to evaluate the tax position for recognition by determining if the weight of available evidence indicates that it is more likely than not that the position will be sustained on audit, including resolution of related appeals or litigation processes, if any. The second step is to measure the tax benefit as the largest amount that is more than 50% likely of being realized upon settlement. The tax years 2006 to 2009 remain open to examination by the major taxing jurisdictions to which we are subject. Additionally, upon inclusion of the net operating loss carryforward tax benefits in future tax returns, the related tax benefit for the period in which the benefit arose may be subject to examination. Management believes that the positions taken in our U.S. federal tax returns can be categorized as “Highly Certain” as defined by Topic 740.
We have provided for potential amounts due in a foreign tax jurisdiction. Judgment is required in determining our worldwide income tax expense provision. In the ordinary course of global business, there are many transactions and calculations where the ultimate tax outcome is uncertain. Some of these uncertainties arise as a consequence of cost reimbursement arrangements among related entities. Although management believes its estimates are reasonable, no assurance can be given that the final tax outcome of these matters will not be different from that which is reflected in our historical income tax provisions and accruals. Such differences could have a material impact on our income tax provision and operating results in the period in which such determination is made. In instances where our Indian subsidiaries have made payments to tax authorities while a tax assessment is under appeal, these amounts are netted against the long term tax liability as a result of the uncertainty regarding the ultimate resolution of the tax assessment. At December 31, 2010 these prepaid amounts totaled $3,027,000. During the year ended December 31, 2010, we made advance tax payments of approximately $83,000.
Our Indian subsidiaries are subject to a Minimum Alternative Tax (“MAT”) since the entities are availing tax holiday benefits and hence the companies taxable profits as computed under normal tax laws are lower than book profits. MAT is paid in the form of advance tax based on estimated book profits for the financial year. Amounts paid can be claimed as a credit in subsequent years upon expiration of the tax holiday period. Given the probable positive earnings of the Indian entities as a result of transfer pricing agreements, we have recorded MAT credit entitlements as non-current assets. During the year ended December 31, 2010, we paid MAT of $0 and the balance at December 31, 2010 was $555,000.
51
Table of Contents
NET EARNINGS PER SHARE
We account for Earnings per Share in accordance with FASB ASC Topic 260—Earnings per Share. Topic 260 requires the disclosure of basic net earnings per share and diluted net earnings per share. Basic net earnings per share is computed by dividing net income available to common shareholders by the weighted average number of common shares outstanding during the period and does not include any other potentially dilutive securities. Diluted net income per share gives effect to all potentially dilutive securities. Our stock options and warrants to purchase common stock are potentially dilutive securities. Stock options with exercise prices that are greater than the average market price are excluded from the calculation of diluted earnings per share because their effect would be anti-dilutive. In fiscal 2010, 2009 and 2008, we excluded 88,000, 152,000 and 269,000 out-of-the-money stock options, respectively, from the diluted earnings per share calculation.
The reconciliations of the numerators and denominators of the basic and diluted EPS calculations are shown below:
| Year Ended December 31, | ||||||||||||
| 2010 | 2009 | 2008 | ||||||||||
| Numerator: |
||||||||||||
| Net income |
$ | 8,520,000 | $ | 6,759,000 | $ | 5,768,000 | ||||||
| Denominator: |
||||||||||||
| Weighted average shares outstanding |
10,495,000 | 8,613,000 | 8,448,000 | |||||||||
| Effect of dilutive securities |
||||||||||||
| Common stock options |
350,000 | 308,000 | 366,000 | |||||||||
| Denominator for diluted calculation |
10,845,000 | 8,921,000 | 8,814,000 | |||||||||
| Basic earnings per share |
$ | 0.81 | $ | 0.78 | $ | 0.68 | ||||||
| Diluted earnings per share |
$ | 0.79 | $ | 0.76 | $ | 0.65 | ||||||
2. ACQUISITIONS
On January 1, 2009, we completed the acquisition of DeVenture Global Partners, Inc. (“DeVenture”) in accordance with the Asset Purchase Agreement entered into on December 26, 2008. We purchased substantially all of the assets and assumed certain liabilities of DeVenture to expand our market share, capitalize on the potential for the acquired business to grow and leverage our fixed overhead costs across a larger revenue base. DeVenture’s debt was not assumed. Including the contingent payment, the total purchase price was $4,375,000. Goodwill of $3,049,000 was recorded for the DeVenture acquisition. Goodwill consisted primarily of the synergies and economies of scale expected from combining the operations of Transcend and DeVenture and the value of the DeVenture assembled workforce.
The following is a detailed list of the fair value of identifiable assets acquired and liabilities assumed in the DeVenture acquisition:
| Accounts receivable |
$ | 560,000 | ||
| Fixed assets |
17,000 | |||
| Other assets |
12,000 | |||
| Total identifiable assets |
589,000 | |||
| Accounts payable |
47,000 | |||
| Other liabilities |
128,000 | |||
| Total identifiable liabilities |
175,000 | |||
| Net identifiable assets |
$ | 414,000 | ||
52
Table of Contents
The fair value of accounts receivable acquired approximated gross contractual amounts receivable. There were no assets or liabilities arising from contingencies that were acquired in the transaction.
We allocated the purchase price between goodwill, customer relationships, the covenant not to compete and net identifiable assets. All goodwill and intangible assets related to the acquisition of the DeVenture assets are expected to be amortizable and deductible for income tax purposes. The purchase price was allocated as follows:
| Net Identifiable assets |
$ | 414,000 | ||
| Customer list |
891,000 | |||
| Covenant not to compete |
21,000 | |||
| Goodwill |
3,049,000 | |||
| Total Purchase price |
$ | 4,375,000 | ||
The intangible assets, except for goodwill, are amortized over their useful lives. The customer list is being amortized over ten years and the covenant not to compete over five years. In 2010 an adjustment was made to increase goodwill $16,500 to reflect a working capital adjustment.
On April 1, 2009, we completed the acquisition of the domestic medical transcription business of Transcription Relief Services, Inc. (“TRS”) in accordance with the Asset Purchase Agreement entered into on March 26, 2009. We purchased the TRS assets and assumed certain liabilities of TRS to expand our market share, capitalize on the potential for the acquired business to grow and leverage our fixed overhead costs across a larger revenue base. TRS’s debt was not assumed. A contingent payment in the amount of $1,123,000 was paid in February 2010 (see Note 11 of these Notes to Consolidated Financial Statements). Including the contingent payment and a working capital adjustment, the purchase price was $5,623,000. Goodwill of $2,773,000 was recorded for the TRS acquisition. This consisted primarily of the synergies and economies of scale expected from combining the operations of Transcend and TRS and the value of the TRS assembled workforce.
A contingent consideration payment was part of the agreement in connection with the acquisition of TRS. We estimated the fair value of this payable as of the purchase date of the acquisition. FASB ASC, Topic 805—Business Combinations requires that this estimate be re-measured to fair value at each reporting date until the contingency is resolved. These interim changes in estimated fair value, along with any differences in the final settlement, are recognized in operating expense. The purchase date fair value of the TRS contingent consideration was $353,000. As of December 31, 2009, the value was calculated as $1,123,000. The $770,000 difference was recognized as operating expense in the fourth quarter of 2009 and the total amount of $1,123,000 was paid in February 2010.
The following is a detailed list of the fair value of identifiable assets acquired and liabilities assumed in the TRS acquisition:
| Accounts receivable |
$ | 760,000 | ||
| Fixed assets |
58,000 | |||
| Other assets |
9,000 | |||
| Total Identifiable assets |
827,000 | |||
| Accounts payable |
22,000 | |||
| Benefits payable |
89,000 | |||
| Other liabilities |
17,000 | |||
| Total identifiable liabilities |
128,000 | |||
| Net identifiable assets |
$ | 699,000 | ||
The fair value of accounts receivable acquired approximated gross contractual amounts receivable. There were no assets or liabilities arising from contingencies that were acquired in the transaction.
53
Table of Contents
We allocated the purchase price between goodwill, customer relationships, the covenant not to compete and net identifiable assets. All goodwill and intangible assets related to the acquisition of the TRS assets are expected to be amortizable and deductible for income tax purposes. The purchase price (including the estimated contingent payment) was allocated as follows:
| Net identifiable assets |
$ | 699,000 | ||
| Customer list |
1,345,000 | |||
| Covenant not to compete |
47,000 | |||
| Goodwill |
2,773,000 | |||
| Total purchase price |
$ | 4,864,000 | ||
Intangible assets, except for goodwill, are amortized over their useful lives. The customer list is being amortized over ten years and the covenant not to compete over five years.
On August 31, 2009, we purchased from the selling shareholder, Dorothy K. Fitzgerald, all issued and outstanding shares of common stock of Medical Dictation Service, Inc., or MDSI. Headquartered in Gaithersburg, Maryland, MDSI was a leading medical transcription company with approximately 450 transcriptionists and employees providing service to approximately 30 customers located predominantly in the Mid-Atlantic region of the United States. We purchased MDSI to capitalize on the potential for the acquired business to grow, leverage our fixed overhead costs across a larger revenue base and increase our presence in the Mid-Atlantic region of the United States. The total purchase price was $15,487,000. Goodwill of $13.1 million was recorded for the MDSI acquisition. This consisted primarily of the synergies and economies of scale expected from combining the operations of Transcend and MDSI and the value of the MDSI assembled workforce.
The following is a detailed list of the fair value of identifiable assets acquired and liabilities assumed in the MDSI acquisition:
| Cash |
$ | 494,000 | ||
| Accounts receivable |
1,264,000 | |||
| Fixed assets |
21,000 | |||
| Deferred tax asset |
336,000 | |||
| Other assets |
33,000 | |||
| Total identifiable assets |
2,148,000 | |||
| Accounts payable |
185,000 | |||
| Salaries and benefits payable |
1,910,000 | |||
| Other liabilities |
14,000 | |||
| Total identifiable liabilities |
2,109,000 | |||
| Net identifiable assets |
$ | 39,000 | ||
The fair value of accounts receivable acquired approximated gross contractual amounts receivable. There were no assets or liabilities arising from contingencies that were acquired in the transaction.
54
Table of Contents
We allocated the purchase price between goodwill, customer relationships and related deferred tax liability, covenant not to compete and net identifiable assets. Since this transaction was a stock purchase, goodwill and intangibles will not be deductible for income tax purposes. As of December 31, 2009, the purchase price was allocated as follows:
| Net identifiable assets |
$ | 39,000 | ||
| Customer list |
3,500,000 | |||
| Covenant not to compete |
100,000 | |||
| Goodwill |
13,146,000 | |||
| Deferred tax liability |
(1,298,000 | ) | ||
| Total purchase price |
$ | 15,487,000 | ||
Intangible assets, except for goodwill, are amortized over their useful lives. The customer list is being amortized over ten years and the covenant not to compete over five years.
During the quarter ended March 31, 2008, we accrued for an additional $39,000 earn-out related to the December 31, 2005 acquisition of PracticeXpert. During the quarter ended December 31, 2009 we reversed the remaining $35,000 accrual for the earn-out since PracticeXpert has discontinued operations and the agreement was not assigned to any successor entity.
On October 21, 2010, we entered into an Agreement and Plan of Merger with Spryance, Inc. and certain principal stockholders, and acquired Spryance, Inc. (known as “Heartland”) through a merger of Transcend Acquisition Corporation (a wholly-owned subsidiary of Transcend Services, Inc.) into Spryance, Inc. The aggregate consideration was $6,492,000, consisting of cash of $5,450,000 plus the pay off at closing of a Heartland note payable in the amount of $1,042,000. In addition, we assumed $831,000 of liabilities (net of U.S. cash acquired) related to Heartland’s transaction-related expenses.
Founded in 1997, Heartland Information Services was acquired in 2006 by Spryance, Inc. The combined company has used the Heartland name since the acquisition. Headquartered in Toledo, Ohio, Heartland was a provider of clinical documentation services that served approximately 55 hospitals plus several clinics and surgery centers nationwide and had a strong relationship with Hospital Corporation of America (HCA). With annual revenue of approximately $18 million and centers in Bangalore, Chennai and Delhi, the company had over 1,500 medical transcription and quality assurance specialists in India and had historically provided most of its services using offshore resources.
We allocated the purchase price to goodwill, customer relationships, covenants not to compete, property and equipment and working capital. We have included the results of Heartland operations in our financial statements from the close date forward.
The following is a detailed list of the fair value of identifiable assets acquired and liabilities assumed in the Heartland acquisition:
| Cash |
$ | 731,000 | ||
| Accounts receivable |
2,619,000 | |||
| Fixed assets |
621,000 | |||
| Deferred tax asset |
2,890,000 | |||
| Other assets |
1,571,000 | |||
| Total identifiable assets |
8,432,000 | |||
| Accounts payable |
307,000 | |||
| Salaries and benefits payable |
4,264,000 | |||
| Other liabilities |
3,282,000 | |||
| Total identifiable liabilities |
7,853,000 | |||
| Net identifiable assets |
$ | 579,000 | ||
55
Table of Contents
The fair value of accounts receivable acquired approximated gross contractual amounts receivable. There were no assets arising from contingencies that were acquired in the transaction. Included in other liabilities acquired is a contingent liability for future tax payments in India related to transfer pricing disputes.
Goodwill of $4.6 million was recorded for the Heartland acquisition. This consisted primarily of the synergies and economies of scale expected from combining the operations of Transcend and Heartland and the value of the Heartland assembled workforce. We have initially allocated the purchase price between goodwill, customer relationships and related deferred tax liability and net identifiable assets. Since this transaction was a stock purchase, goodwill and intangibles will not be deductible for income tax purposes. As permitted, we expect to finalize the purchase price allocation within one year of the purchase date. We do not expect any changes to the purchase price allocation to materially increase or decrease amortization expenses, but there could be an impact on the allocation between goodwill and other intangible assets. As of December 31, 2010, the purchase price was allocated as follows:
| Net Identifiable assets |
$ | 579,000 | ||
| Customer list |
1,900,000 | |||
| Technology |
190,000 | |||
| Goodwill |
4,580,000 | |||
| Deferred tax liability |
(757,000 | ) | ||
| Total purchase price |
$ | 6,492,000 | ||
Intangible assets, except for goodwill, are amortized over their useful lives. The customer list is being amortized over ten years and the technology over two years.
Heartland revenue and net income of $3,722,000 and $235,000 respectively, are included in our Consolidated Statement of Operations for the year ended December 31, 2010.
Unaudited pro forma revenue and net income of the combined entity had the Heartland acquisitions been completed at the beginning of each year presented are as follows:
| SUPPLEMENTAL PRO FORMA INFORMATION | ||||||||
| Year ended December 31, | ||||||||
| 2010 | 2009 | |||||||
| Revenue |
$ | 108,961,000 | $ | 94,119,000 | ||||
| Net Income |
$ | 7,407,000 | $ | 5,876,000 | ||||
3. MAJOR CUSTOMERS
In September 2009, we announced that we had entered into a five-year single-source contract to provide medical transcription services to hospitals that are members of Health Management Associates, Inc., or HMA, effective October 1, 2009. Prior to signing this agreement, we had individual contracts with approximately 45 of HMA’s 54 hospitals. The agreement expanded our existing relationship with HMA to include the HMA hospitals which were using other transcription service providers. As of January 1, 2011, we have transitioned all of the existing HMA hospitals. In addition, pursuant to the terms of the agreement, any future hospitals acquired or managed by HMA will transition to us as soon as practicable.
Revenue attributable to this contract with HMA comprised 17.0%, 16.9% and 21.8% of our total revenue for the years ended December 31, 2010, 2009 and 2008, respectively.
Our top 10 customers (hospitals) accounted for approximately 16.5% of our 2010 transcription revenue compared to 16% in 2009 and 27% in 2008. These customers averaged $1.5 million of revenue each in 2010 compared to $1.4 million in 2009 and $1.3 million in 2008. Our average annual revenue per customer was approximately $344,000 in 2010 and $349,000 in 2009 and $316,000 in 2008.
56
Table of Contents
4. INVESTMENTS
Short-term investments consist of government notes and fully insured certificates of deposit in the United States and uninsured fixed rate bank deposits in India. These investments are classified as available-for-sale and all have a contractual maturity of less than one year. For both dates presented, the difference between the cost and the fair market value of all investments is considered immaterial and thus an adjustment to other comprehensive income has not been presented.
| Description |
December 31, 2010 | December 31, 2009 | ||||||
| Available-for-sale |
||||||||
| Certificates of deposit |
$ | — | $ | 2,000,000 | ||||
| Fixed rate bank deposit |
848,000 | — | ||||||
| U.S. treasury securities |
19,606,000 | — | ||||||
| Total short-term investments |
$ | 20,454,000 | $ | 2,000,000 | ||||
5. GOODWILL AND OTHER INTANGIBLE ASSETS
We account for goodwill and other intangible assets in accordance with the provisions of FASB ASC Topic 350- Intangibles—Goodwill and Other. Under this Topic, goodwill and intangible assets that have indefinite useful lives are tested at least annually for impairment rather than being amortized like intangible assets with finite useful lives, which are amortized over their useful lives. A portion of the respective purchase prices of the acquisitions of MDI and PracticeXpert in 2005, OTP Technologies, Inc. (OTP) in 2007, DeVenture, TRS and MDSI in 2009 and Heartland in 2010 were attributed to goodwill and other intangible assets.
Amortized intangibles assets at December 31, 2010 and 2009 are summarized as follows (in thousands):
| Useful Life in Years |
December 31, 2010 | December 31, 2009 | ||||||||||||||||||||||||||
| Gross Assets |
Accumulated Amortization |
Net Assets |
Gross Assets |
Accumulated Amortization |
Net Assets |
|||||||||||||||||||||||
| Amortized intangible assets: |
||||||||||||||||||||||||||||
| Covenants-not-to-compete |
5 | $ | 218,000 | 101,000 | 117,000 | 218,000 | 67,000 | 151,000 | ||||||||||||||||||||
| Technology |
2 | 190,000 | 19,000 | 171,000 | ||||||||||||||||||||||||
| Customer relationships |
5-10 | 8,381,000 | 1,614,000 | 6,767,000 | 6,481,000 | 947,000 | 5,534,000 | |||||||||||||||||||||
| Total intangible assets |
$ | 8,789,000 | 1,734,000 | 7,055,000 | 6,699,000 | 1,014,000 | 5,685,000 | |||||||||||||||||||||
Amortization expense totaled $720,000, $484,000, and $159,000 for the years ended December 31, 2010, 2009 and 2008, respectively. Estimated amortization expense for the next five fiscal years is as follows:
| Fiscal year ended |
Amount | |||
| 2011 |
$ | 936,000 | ||
| 2012 |
$ | 878,000 | ||
| 2013 |
$ | 797,000 | ||
| 2014 |
$ | 779,000 | ||
| 2015 |
$ | 764,000 | ||
57
Table of Contents
6. FAIR VALUE OF FINANCIAL INSTRUMENTS
FASB ASC Topic 820—Fair Value Measurements and Disclosures, establishes a framework for measuring fair value and expands financial statement disclosures about fair value measurements. Fair value is the price that would be received to sell an asset or paid to transfer a liability in an orderly transaction between market participants at the measurement date. This topic requires that assets and liabilities carried at fair value be classified and disclosed in one of the following three categories:
Level 1: Quoted market prices in active markets for identical assets or liabilities
Level 2: Observable market based inputs or unobservable inputs that are corroborated by market data
Level 3: Unobservable inputs that are not corroborated by market data
In accordance with FASB ASC Topic 825—Financial Instruments, the carrying value of short-term debt, which totaled $67,000 and $2,899,000 as of December 31, 2010 and 2009, respectively, was estimated to approximate its fair value. The fair value of debt is estimated based on approximate market interest rates for similar issues. Our other financial instruments, including cash and cash equivalents, accounts receivable and accounts payable, approximate fair value due to the short-term nature of those assets and liabilities.
At December 31, 2009, our short-term investments consisted of fully-insured certificates of deposits. These investments were valued using Level 1 inputs and carrying value approximated fair value.
At December 31, 2010, our short-term investments consisted of government notes. These investments are classified as available-for-sale and valued using Level 1 inputs and carrying value approximates fair value. The following table summarizes the carrying amounts and fair values of short-term investments at December 31, 2010:
| Description |
December 31, 2010 |
Quoted Prices in Active Markets for Identical Assets (Level 1) |
Significant Other Observable Inputs (Level 2) |
Significant Unobservable Inputs (Level 3) |
||||||||||||
| Available-for-sale |
||||||||||||||||
| Fixed rate bank deposits |
$ | 848,000 | $ | 848,000 | $ | — | $ | — | ||||||||
| U.S. Treasury Securities |
19,606,000 | 19,606,000 | — | — | ||||||||||||
| Total short-term investments |
$ | 20,454,000 | $ | 20,454,000 | $ | — | $ | — | ||||||||
7. BORROWING ARRANGEMENTS
Credit Facility
We maintained a four-year credit facility with Healthcare Finance Group (“HFG”) through August 31, 2009. The HFG facility was due to mature on December 31, 2009 and was comprised of up to $3.6 million on an accounts receivable-based revolving promissory note. On August 31, 2009, we terminated our credit facility with HFG in order to secure new financing from Regions Bank. In the third quarter of 2009, we wrote off the unamortized financing costs related to the HFG facility and incurred an early termination fee of $10,000 that was paid to HFG upon termination. HFG released all claims to our assets held as security for the facility. On August 31, 2009, Transcend and MDSI entered into a loan and security agreement with Regions Bank. Transcend and MDSI are both “borrowers” under the loan and security agreement, which replaced our previous credit facility with HFG. The loan and security agreement includes a one-time, four-year term loan of $7.0 million for the costs and expenses of, and, to the extent necessary, a portion of the purchase price for MDSI. The loan and security agreement also provides for up to $5.0 million in a revolving loan commitment based on eligible accounts receivable. We may use proceeds of the revolving loan only for working capital, general corporate purposes, and for specified acquisitions. The maximum amount of the revolving loan may be increased
58
Table of Contents
at the discretion of Regions Bank to $8.0 million. We used $4.0 million of the proceeds from the follow-on offering of our common stock completed in the fourth quarter of 2009 to pay down the term loan. The original revolving loan commitment expired and was renewed for another year, in August 2010. Borrowings bear interest at a rate based on the current LIBOR (3.75% as of December 31, 2010 and 2009), and are secured by substantially all of our assets. The outstanding balance on the term loan was $67,000 and $844,000 as of December 31, 2010 and 2009 and the balance on the revolver was $0 as of December 31, 2010 and 2009. We did not borrow on the revolving loan during the years ended December 31, 2010 and 2009.
The loan and security agreement contains representations and warranties, as well as affirmative, reporting and negative covenants customary for financings of this type. Among other things, the loan and security agreement restricts us from incurring certain additional debt, prohibits us from creating, permitting or allowing certain liens on our property, restricts the payment of dividends, distributions and other specified equity related transactions, and prohibits certain borrowings and specified transactions with affiliates. The loan and security agreement also requires the maintenance of a specified minimum fixed charge coverage ratio, tangible net worth, and cash flow leverage, as defined in the agreement. As of December 31, 2010 and 2009, we were in compliance with all covenants of the agreement except the one related to annual lease expense. Regions Bank issued a waiver of this covenant as of December 31, 2010 and 2009 and the agreement was amended to increase the maximum annual lease expense allowable.
On April 8, 2010, Transcend and MDSI entered into a commitment letter for a senior secured credit facility in an aggregate principal amount of up to $65 million with Regions Business Capital, Regions Capital Markets and Regions Bank (collectively, “Regions”). We intended to use part of the proceeds from the credit facility to fund our bid for substantially all of the assets of Spheris, Inc. (“Spheris”) and the stock of its subsidiary, Spheris India Private Limited (“Spheris India”). Spheris declared bankruptcy under Chapter 11 and an auction under Section 363 of the United States Bankruptcy Code was held for substantially all of the assets of Spheris and the stock of Spheris India, subject to the terms of a stock and asset purchase agreement. The United States Bankruptcy Court for the District of Delaware established a bid process whereby interested parties, including us, submitted qualified bids on April 8, 2010. Qualified bidders participated in the auction held on April 13, 2010. We were not the successful bidder in the auction and did not enter into the new credit facility. In accordance with the commitment letter, the commitment terminated on May 28, 2010 because the definitive credit agreement and other legal documents related to the senior credit facility were not executed by that date. We expensed approximately $361,000 of costs related to the credit facility in 2010 that would have been capitalized if the credit facility had closed.
OTP Promissory Note
On January 16, 2007, we entered into a three-year $330,000 unsecured promissory note in conjunction with the purchase of OTP. The note bore interest at 5.0% and the principal was repaid as follows: $110,000 on January 16, 2008; $55,000 on July 16, 2008; $55,000 on January 16, 2009; $55,000 on July 16, 2009 and $55,000 on January 16, 2010.
MDSI Promissory Note
On August 31, 2009, we entered into a one-year $2,000,000 unsecured promissory note at 5% interest, payable to Dorothy K. Fitzgerald, in conjunction with the purchase of MDSI. All principal and interest was due and paid at maturity on August 31, 2010.
59
Table of Contents
8. ACCRUED COMPENSATION AND BENEFITS
Accrued compensation and benefits consisted of the following at December 31, 2010 and 2009:
| 2010 | 2009 | |||||||
| Accrued compensation |
$ | 2,905,000 | $ | 1,798,000 | ||||
| Accrued payroll taxes |
654,000 | 366,000 | ||||||
| Other accrued compensation and benefits |
107,000 | 132,000 | ||||||
| Total accrued compensation and benefits |
$ | 3,666,000 | $ | 2,296,000 | ||||
9. OTHER ACCRUED LIABILITIES
Other accrued liabilities consisted of the following at December 31, 2010 and 2009:
| 2010 | 2009 | |||||||
| Vendor expense |
$ | 1,233,000 | $ | 759,000 | ||||
| Contingent consideration |
— | 1,123,000 | ||||||
| Income and other taxes |
1,196,000 | 4,000 | ||||||
| Employee medical insurance claims incurred but not paid |
735,000 | — | ||||||
| Legal expense |
67,000 | 265,000 | ||||||
| Other accrued expenses |
142,000 | 59,000 | ||||||
| Total accrued expenses |
$ | 3,373,000 | $ | 2,210,000 | ||||
10. OTHER LONG-TERM LIABILITIES
Other long-term liabilities consisted of the following at December 31, 2010 and 2009:
| 2010 | 2009 | |||||||
| Transfer pricing tax liability |
$ | 2,606,000 | $ | — | ||||
| Long-term employee benefits |
505,000 | — | ||||||
| Deferred rent |
148,000 | 154,000 | ||||||
| Other long-term liabilities |
36,000 | 5,000 | ||||||
| Total other long-term liabilities |
$ | 3,295,000 | $ | 159,000 | ||||
11. COMMITMENTS AND CONTINGENCIES
Lease Commitments
During 2010, we entered into or acquired lease commitments totaling $2,169,000 for additional operating lease space. During 2009, we entered into or acquired lease commitments totaling $329,000, including $310,000 in additional operating lease space and $19,000 in equipment leases.
Future minimum annual rental obligations under non-cancelable operating leases with initial terms of at least one year as of December 31, 2010 are as follows:
| Fiscal year ended |
Amount | |||
| 2011 |
$ | 1,278,000 | ||
| 2012 |
839,000 | |||
| 2013 |
632,000 | |||
| 2014 |
568,000 | |||
| 2015 |
119,000 | |||
| Thereafter |
— | |||
| $ | 3,436,000 | |||
60
Table of Contents
Rental expense was $956,000, $1,167,000, and $1,134,000 for the years ended December 31, 2010, 2009, and 2008 respectively.
Litigation
From time to time in the normal course of business, we are involved in legal proceedings. We evaluate the need for loss accruals under the requirements of FASB ASC 450—Contingencies. We record an estimated loss for any claim, lawsuit, investigation or proceeding when it is probable that a liability has been incurred and the amount of the loss can reasonably be estimated. If the reasonable estimate of a probable loss is a range, and no amount within the range is a better estimate, then we record the minimum amount in the range as our loss accrual. If a loss is not probable or a probable loss cannot be reasonably estimated, no liability is recorded.
On January 16, 2008, we reached a mediated settlement with Our Lady of the Lakes Hospital, Inc. (“OLOL”) which was finalized on February 21, 2008. Under the settlement, OLOL released all claims, in contract and in tort, which were asserted or could have been asserted in the litigation against Transcend. In return, we agreed to pay $130,000, which was accrued at December 31, 2007 and paid in 2008, to OLOL and released all claims under our counterclaim against OLOL.
On June 10, 2005, we entered into a master equipment lease agreement with Farnam Street Financial, Inc. (“Farnam Street”). On April 22, 2009, we filed a complaint in the United States District Court for the District of Minnesota against Farnam Street, alleging breach of contract, fraud and violation of the Deceptive Trade Practices Act, among other things. Farnam Street answered the complaint and filed a counter-claim against us, alleging breach of contract, among other things. The dispute centered on lease renewal, lease termination and lease buy-out provisions. On May 12, 2010, we finalized a settlement with Farnam Street and paid $720,000 to buy out the equipment leases. The settlement amount was allocated as $540,000 against amounts previously expensed and $182,000 was set up as a fixed asset with a useful life of one year.
The TRS asset purchase agreement provided for a contingent consideration payment of up to $3.0 million based on TRS fourth quarter 2009 revenue and TRS December 31, 2009 backlog. We calculated a fourth quarter 2009 revenue contingent consideration payment of $1,123,000, which was paid in February 2010. On February 26, 2010, we received notice that TRS disputed our calculation and claimed an additional payment of $1,877,000. We responded on March 10, 2010, stating that TRS’s objections were without merit and asking that the dispute be postponed pending delivery of the backlog contingent payment calculation. TRS agreed to the postponement. On March 30, 2010, we delivered the backlog contingent payment calculation to TRS showing an amount payable of $0. TRS objected to our backlog contingent payment calculation. Under the terms of the asset purchase agreement, in the case of a disagreement over the calculation of the contingent payment, the parties were to select an independent auditor to review the calculation. On May 6, 2010, TRS filed a civil action against us in the United States District Court for the Middle District of North Carolina. TRS generally alleges that we frustrated their ability to maximize the contingent payment. TRS seeks compensatory damages of approximately $1,877,000, unspecified damages, attorneys’ fees, interest and costs. The lawsuit is in the early procedural stages and the ultimate outcome cannot be determined at this time. We have evaluated this claim and the civil action and believe that no additional payments are due under the calculations outlined in the asset purchase agreement.
12. RETIREMENT PLAN
We maintain a 401(k) retirement plan that covers all eligible US employees. Employees are eligible to contribute amounts to the plan subject to certain minimum and maximum limitations. We match employee contributions on a discretionary basis as determined by the Board of Directors. We made $235,000, $171,000 and $156,000 of matching cash contributions in 2010, 2009 and 2008, respectively. Going forward, we intend to continue matching 50% of the first 4% of employee’s compensation contributed to the plan, subject to our financial performance.
61
Table of Contents
Eligible employees of our Indian subsidiaries are covered by the Provident Fund (the “Plan”) and the Payment of Gratuity Act (the “Act”). Both the Plan and the Act are unfunded plans. Contributions to the Plan are based on a fixed percentage of eligible employees’ salaries. During the year ended December 31, 2010 we made contributions of $38,000 to cover the estimated benefits provided during the current year which are administered by the Indian government. The Act provides for certain benefits to be paid to eligible employees upon termination of employment. As of December 31, 2010 we had an accrued benefit obligation relating to the Act of $447,000. During the year ended December 31, 2010 we made Act payments of $21,000.
13. TRANSACTIONS WITH RELATED PARTIES
Susan McGrogan is our President and Chief Operating Officer. Ms. McGrogan is also the co-founder of MDI, which was purchased by Transcend on January 31, 2005. In conjunction with the purchase of MDI, we entered into a $3.5 million promissory note payable to Ms. McGrogan. During the first quarter of 2008, we repaid $1.2 million as the final installment on the note plus $59,000 of accrued interest.
We purchased the assets of OTP on January 16, 2007 for a purchase price of $1,070,000, of which $520,000 was payable in cash, $330,000 in a promissory note and $220,000 (60,274 shares) in Transcend unregistered common stock. In addition, we paid $40,000 of additional consideration in January 2008 based on revenue achieved in 2007. The promissory note is payable to OTP. The owners of OTP, James and Sharon Vonderhaar, were employed by us until April 1, 2007 and February 5, 2008, respectively.
On August 31, 2009, we acquired all issued and outstanding shares of MDSI common stock from Dorothy Fitzgerald for an estimated purchase price of $15,487,000. Payment of the purchase price included a $2,000,000 payment due at the delivery of audited financial statements and a $2,000,000 promissory note payable to Ms. Fitzgerald, the terms of which are described in Note 7 “Borrowing Arrangements.” In addition, we entered into a registration rights agreement, dated August 31, 2009, providing Ms. Fitzgerald with “piggyback” registration rights. Ms. Fitzgerald is currently employed by us.
14. STOCKHOLDERS’ EQUITY
On August 31, 2009, we issued 119,940 shares of common stock, $0.05 par value, to Dorothy K. Fitzgerald as a portion of the purchase price paid to her for MDSI. On that date the shares had a market value of $1,907,046 based on a closing price of $15.90.
In December, 2009, we completed a follow-on offering of our common stock, and we issued 1,725,000 shares and raised $26.5 million in net proceeds after underwriters discount and transaction costs.
Subject to the rights of any holder of shares of the our preferred stock, each holder of common stock is entitled to one vote per share for the election of directors as well as other matters, to dividends as and when declared by the Board of Directors, and, upon liquidation, to share in net assets pro rata in accordance with his holdings. Our common stock has no preemptive, redemption, conversion or subscription rights, and all outstanding shares of company common stock are fully paid and non-assessable. The Board of Directors has the power, without further action by the holders of shares of company common stock, to divide any and all shares of company preferred stock into series and to fix and determine the relative rights and preferences of company preferred stock, such as the designation of the series and the number of shares constituting such series, voting rights, dividend rights, redemption and sinking fund provisions, liquidating and dissolution preferences, conversion or exchange rights, if any. Issuances of preferred stock by the Board of Directors may result in such shares having senior dividend and/or liquidation preferences to the holders of shares of company common stock and may dilute the voting rights of such holders.
We had 10,565,932 and 10,477,182 shares of common stock and no shares of preferred stock outstanding as of December 31, 2010 and 2009, respectively.
62
Table of Contents
15. STOCK BASED COMPENSATION
We have six stockholder-approved stock incentive plans (“Plans”), for our key employees, directors and key consultants. The Plans provide for the grant of incentive stock options, nonqualified stock options, restricted stock awards, and, in the case of the plans approved by the shareholders on May 10, 2007 and May 19, 2009, restricted stock units and stock appreciation rights. We intend to grant new awards under only the 2009 Stock Incentive Plan (the “2009 Plan”). The options are granted at fair market value, as defined in the option agreement, on the date of grant. There were 141,674 shares available for issuance at December 31, 2010.
Our stock-based awards are accounted for under the provisions of FASB ASC Topic 718—Stock Compensation. We measure and recognize stock-based compensation expense based on the fair value measurement for all stock-based payment awards made to our employees and directors over the service period for which the awards are expected to vest. We calculated the fair value of each restricted stock award based on our stock price on the date of grant. We calculated the fair value of each stock option award on the date of grant using the Black-Scholes-Merton option pricing model. The determination of fair value of stock option awards on the date of grant using an option-pricing model is affected by our stock price as well as a number of assumptions including expected life, expected volatility, risk-free interest rate and dividend yield. As a result, the future stock-based compensation expense may differ from our historical amounts.
In June 2010, we implemented an equity tracking software system. In the course of that implementation, it came to our attention that we had three issues with our historical expense calculations that we have broken into two categories: (1) cumulative adjustments and (2) first quarter 2010 restricted stock vesting. We concluded that these adjustments should be considered “correction of errors” as opposed to “changes in estimates” based on the definitions set out in FASB ASC Topic 250—Accounting Changes and Error Corrections. We performed an analysis under SAB108—Considering the Effects of Prior Year Misstatements When Quantifying Misstatements in Current Year Financial Statements (SAB108), and used the materiality guidance of SAB99—Materiality (SAB99) to determine whether or not the impact to any one period or the cumulative impact on a given period was material enough to require a restatement to previously filed financial statements.
The cumulative adjustment is the result of netting two offsetting issues. The first issue involved the use of estimated forfeiture rates and the required true-up to actual forfeiture rates for all awards issued between 2006 and 2010, and the second issue was a mathematical error in the calculation of the volatility rate used to establish the grant date fair value of awards issued from 2008 to 2010. Since both adjustments impact the same financial statement item, stock-based compensation expense, we determined that they could be combined into one net adjustment of additional expense of $445,000 ($308,000 of which related to periods prior to 2010). Based on our analysis and the definition of materiality, which require us to assess both qualitative and quantitative factors, it was determined that the adjustment was not material to any prior reporting periods or to the expected annual results for 2010,therefore the entire adjustment was recorded in the second quarter of 2010.
63
Table of Contents
The second category relates to the vesting of certain restricted stock awards in the first quarter of 2010. At the time of vesting in the first quarter of 2010, only $124,000 of the total stock-based compensation expense of $355,000 had been recorded. The difference of $231,000 should have been recorded as additional compensation expense in the first quarter of 2010. Based on our analysis, it was determined that the adjustment was not material to the first quarter and did not require a restatement of our Quarterly Report on Form 10-Q for the first quarter of 2010. In accordance with SAB108, the entry was recorded as a first quarter 2010 adjustment in the Quarterly Report on Form 10-Q for the second quarter of 2010 and will be reflected in any future filing of the financial information for the period ending March 31, 2010 and the year ended December 31, 2010. The following table shows the impact of the adjustment and the revised financial information for the quarter ended March 31, 2010.
| Quarter ended March 31, 2010 as reported |
Adjustment | Quarter ended March 31, 2010 as revised |
||||||||||
| Revenue |
$ | 22,206,000 | $ | $ | 22,206,000 | |||||||
| Gross profit |
7,480,000 | 7,480,000 | ||||||||||
| General and administrative expense |
3,528,000 | 231,000 | 3,759,000 | |||||||||
| Operating expense |
4,805,000 | 231,000 | 5,036,000 | |||||||||
| Operating income |
2,675,000 | (231,000 | ) | 2,444,000 | ||||||||
| Income tax provision |
1,016,000 | (78,000 | ) | 938,000 | ||||||||
| Net income |
1,632,000 | (153,000 | ) | 1,479,000 | ||||||||
| Earnings per share—basic |
0.16 | (0.02 | ) | 0.14 | ||||||||
| Earnings per share—diluted |
0.15 | (0.01 | ) | 0.14 | ||||||||
As of December 31, 2010, the total number of options issued and outstanding, the weighted average exercise price and number of options available for future issuance under approved equity compensation plans was as follows:
| Number of securities to be issued upon exercise |
872,767 | |||
| Weighted average exercise price |
$ | 8.91 | ||
| Number of options available for future issuance |
141,674 |
The fair value of each option grant is estimated on the date of grant using the Black-Scholes-Merton option pricing model that uses the assumptions or range of assumptions noted in the following table. The weighted average grant date fair value of these options was $7.87 in 2010, $4.76 in 2009, and $3.86 in 2008. The risk-free interest rate for the period matching the expected term of the option is based on the U.S. Treasury yield curve in effect at the time of the grant. The dividend yield is the calculated yield on our stock at the time of grant. The expected term of the options represents the period of time that options granted are expected to be outstanding and is derived by analyzing historic exercise behavior along with currently outstanding options. The maximum contractual term of these options is ten years. Expected volatilities are based on historical volatility of our stock. The expected forfeiture rates are based on historical forfeiture rates. In 2010, we began segregating option holders into groups such as Board of Directors, Executive Officers, Management and Other. This enabled us to calculate expected term and forfeiture rate based on the actual experiences within each group. The assumptions used for all options granted for December 31, 2010, 2009 and 2008 are as follows:
| 2010 | 2009 | 2008 | ||||||||||
| Risk-free interest rate |
0.46% to 2.09% | 1.85% to 2.06% | 1.88% to 2.90% | |||||||||
| Expected dividend yield |
0% | 0% | 0% | |||||||||
| Expected term |
1.53 to 5.7 years | 2.00 to 4.00 years | 2.00 to 4.00 years | |||||||||
| Expected volatility |
44.89% to 64.58% | 90.39% to 115.20% | 100.64% to 111.48% | |||||||||
| Expected forfeiture rate |
0% to 20.64% | 50% | 50% | |||||||||
| Exercise price of options issued |
$ | 13.03 to $20.72 | $ | 13.04 to $16.34 | $ | 9.93 to $11.75 | ||||||
64
Table of Contents
Transactions involving our stock options for the years ended December 31, 2008, 2009 and 2010 were as follows:
| Number of Shares Subject to Stock Options |
Share Price Range |
Weighted Average Exercise Price Per Share |
Weighted Average Remaining Contractual Life |
Aggregate Intrinsic Value |
||||||||||||||||
| Outstanding at December 31, 2007 |
626,667 | $ | 0.74 to $19.96 | $ | 4.68 | 7.8 years | $ | 7,251,000 | ||||||||||||
| Granted |
317,000 | $ | 9.93 to $11.75 | $ | 10.91 | |||||||||||||||
| Forfeited |
(6,750 | ) | $ | 2.00 to $14.48 | $ | 4.32 | ||||||||||||||
| Exercised |
(24,650 | ) | $ | 1.10 to $ 4.55 | $ | 2.59 | $ | 188,000 | ||||||||||||
| Outstanding at December 31, 2008 |
912,267 | $ | 0.74 to $19.96 | $ | 6.90 | 7.7 years | $ | 2,817,000 | ||||||||||||
| Granted |
62,500 | $ | 13.04 to $16.34 | $ | 14.76 | |||||||||||||||
| Forfeited |
(19,000 | ) | $ | 3.40 to $16.34 | $ | 12.98 | ||||||||||||||
| Exercised |
(92,250 | ) | $ | 0.74 to $16.69 | $ | 3.07 | $ | 1,114,000 | ||||||||||||
| Outstanding at December 31, 2009 |
863,517 | $ | 1.34 to $19.96 | $ | 7.75 | 7.0 years | $ | 11,761,000 | ||||||||||||
| Granted |
152,500 | $ | 13.03 to $20.72 | $ | 16.24 | |||||||||||||||
| Forfeited |
(52,500 | ) | $ | 3.40 to $20.72 | $ | 12.90 | ||||||||||||||
| Exercised |
(90,750 | ) | $ | 2.00 to $16.34 | $ | 7.56 | $ | 894,000 | ||||||||||||
| Outstanding at December 31, 2010 |
872,767 | $ | 2.00 to $20.72 | $ | 8.91 | 6.6 years | $ | 9,321,000 | ||||||||||||
| Exercisable at December 31, 2010 |
600,761 | $ | 2.00 to $20.72 | $ | 6.66 | 5.6 years | $ | 7,768,000 | ||||||||||||
The following table sets forth the exercise price range, number of shares, weighted average exercise price, and remaining contractual lives by groups of similar prices and grant dates as of December 31, 2010.
| 2010 | ||||||||||||||||||||
| Outstanding Options | Options Exercisable | |||||||||||||||||||
| Actual Range of Exercise Price |
Outstanding at December 31 |
Average Remaining Contractual Life |
Weighted Average Exercise Price |
Exercisable at December 31 |
Weighted Average Exercise Price |
|||||||||||||||
| $2.00 – $3.40 |
277,892 | 5.2 years | $ | 3.00 | 277,892 | $ | 3.00 | |||||||||||||
| $3.41 – $10.00 |
185,500 | 4.9 years | $ | 6.66 | 146,250 | $ | 5.77 | |||||||||||||
| $10.01 – $13.04 |
225,000 | 7.8 years | $ | 11.78 | 123,619 | $ | 11.69 | |||||||||||||
| $13.05 – $20.72 |
184,375 | 8.8 years | $ | 16.60 | 53,000 | $ | 16.59 | |||||||||||||
| $2.00 – $20.72 |
872,767 | 6.6 years | $ | 8.91 | 600,761 | $ | 6.66 | |||||||||||||
65
Table of Contents
In 2009, we issued 87,000 shares of restricted stock to certain participants under the 2009 plan. These shares are performance based and vest in quarter increments each March in 2010 through 2013. In 2010, we issued 45,500 shares of restricted stock to certain participants under the 2009 Plan. These shares are performance based and vest in quarter increments each March in 2012 through 2015. We use the average of the grant date high and low stock price along with an expected forfeiture rate of 0%, to calculate fair value. Transactions involving our Restricted Stock for the year ended December 31, 2010 were as follows:
| Number of Shares |
Weighted Average Grant Date Fair Value |
|||||||
| Non-vested stock outstanding at December 31, 2008 |
— | $ | — | |||||
| Granted |
89,000 | $ | 16.34 | |||||
| Forfeited |
(500 | ) | $ | 13.04 | ||||
| Vested |
(1,500 | ) | $ | 13.04 | ||||
| Non-vested stock outstanding at December 31, 2009 |
87,000 | $ | 16.34 | |||||
| Granted |
45,500 | $ | 16.14 | |||||
| Forfeited |
(11,250 | ) | $ | 16.34 | ||||
| Vested |
(21,750 | ) | $ | 16.34 | ||||
| Non-vested stock outstanding at December 31, 2010 |
99,500 | $ | 16.25 | |||||
We recognized stock-based compensation expense under FASB ASC Topic 718—Compensation-Stock Compensation of approximately $1,394,000, $604,000 and $381,000 for the years ended December 31, 2010, 2009 and 2008, respectively. The 2010 total includes the adjustments to stock-based compensation expense in the first and second quarters of 2010 discussed above. Equity-based compensation expense is recognized as compensation expense in general and administrative expenses. As of December 31, 2010, we had approximately $2,477,000 of future compensation expense which we expect to record in our statements of operations through 2014. The total fair value at grant date of awards which vested during 2010, 2009 and 2008 was $777,000, $720,000 and $283,000, respectively.
16. INCOME TAXES
With the October 21, 2010 acquisition of Heartland, we are now conducting business operations in the U.S. and India. The Indian operations are conducted through both flow-through entities and foreign corporations. We have included the Indian results from operations conducted through the flow-through entities in its current and deferred income tax provision calculation. We have undistributed foreign earnings in the foreign corporations, which we intend to permanently reinvest overseas. We also intend to reinvest future foreign earnings overseas. Therefore, no U.S. corporate income taxes have been provided on undistributed foreign earnings of the foreign corporations.
66
Table of Contents
Current provisions for state income taxes of $516,000, $441,000 and $226,000 were recorded in 2010, 2009 and 2008, respectively, for states in which we pay alternative minimum tax or no net operating loss carryforwards were available. Income tax expense (benefit) was as follows:
| 2010 | 2009 | 2008 | ||||||||||
| Current: |
||||||||||||
| Federal |
$ | 4,758,000 | $ | 2,985,000 | $ | 187,000 | ||||||
| State |
516,000 | 441,000 | 226,000 | |||||||||
| Foreign |
133,000 | |||||||||||
| Total Current |
5,407,000 | 3,426,000 | 413,000 | |||||||||
| Deferred: |
||||||||||||
| Federal |
310,000 | 636,000 | 2,882,000 | |||||||||
| State |
83,000 | (18,000 | ) | 74,000 | ||||||||
| Foreign |
22,000 | |||||||||||
| Valuation allowance |
(7,000 | ) | (193,000 | ) | ||||||||
| Total deferred |
415,000 | 611,000 | 2,763,000 | |||||||||
| Income tax expense (benefit) |
$ | 5,822,000 | $ | 4,037,000 | $ | 3,176,000 | ||||||
A reconciliation between the amount determined by applying the federal statutory rate to income before income taxes and income tax expense (benefit) is as follows:
| 2010 | 2009 | 2008 | ||||||||||||||||||||||
| Amount | Rate | Amount | Rate | Amount | Rate | |||||||||||||||||||
| Income tax expense at federal statutory rate |
$ | 4,881,000 | 34.0 | % | $ | 3,671,000 | 34.0 | % | $ | 3,041,000 | 34.0 | % | ||||||||||||
| State and local tax expense , net of federal benefit |
424,000 | 3.0 | % | 262,000 | 2.4 | % | 235,000 | 2.4 | % | |||||||||||||||
| Stock-based compensation and other permanent items |
209,000 | 1.5 | % | 120,000 | 1.1 | % | 68,000 | 0.8 | % | |||||||||||||||
| Decrease in valuation allowance |
(7,000 | ) | ** | (193,000 | ) | (2.2 | )% | |||||||||||||||||
| Non-deductible transaction costs |
94,000 | 0.7 | % | |||||||||||||||||||||
| Income from foreign flow-through entities |
68,000 | 0.5 | % | |||||||||||||||||||||
| Other |
146,000 | 0.9 | % | (9,000 | ) | ** | 25,000 | 0.3 | % | |||||||||||||||
| Income tax expense (benefit)/effective tax rate |
$ | 5,822,000 | 40.6 | % | $ | 4,037,000 | 37.4 | % | $ | 3,176,000 | 35.5 | % | ||||||||||||
| ** | Less than 0.1%. |
67
Table of Contents
At December 31, 2010 we had a net deferred tax asset of $952,000 as compared to a net deferred tax liability of $766,000 at December 31, 2009. The components of the net deferred tax assets as of December 31, 2010 and 2009 were as follows:
| 2010 | 2009 | |||||||||||||||||||||||
| Current | Long-Term | Total | Current | Long-Term | Total | |||||||||||||||||||
| Deferred tax assets: |
||||||||||||||||||||||||
| Net operating loss carry forward |
$ | 266,000 | $ | 2,325,000 | $ | 2,591,000 | $ | 289,000 | $ | 71,000 | $ | 360,000 | ||||||||||||
| Allowance for bad debts |
45,000 | 45,000 | 28,000 | — | 28,000 | |||||||||||||||||||
| Share based compensation |
238,000 | 238,000 | — | — | — | |||||||||||||||||||
| Compensation accruals |
149,000 | 149,000 | — | — | — | |||||||||||||||||||
| Foreign tax asset |
327,000 | 327,000 | — | — | — | |||||||||||||||||||
| Intangibles |
— | 123,000 | 123,000 | |||||||||||||||||||||
| Deferred rent |
57,000 | 57,000 | — | 63,000 | 63,000 | |||||||||||||||||||
| Other |
22,000 | 55,000 | 77,000 | — | 222,000 | 222,000 | ||||||||||||||||||
| Total |
482,000 | 3,002,000 | 3,484,000 | 317,000 | 479,000 | 796,000 | ||||||||||||||||||
| Deferred tax liabilities: |
||||||||||||||||||||||||
| Intangible assets |
(1,913,000 | ) | (1,913,000 | ) | — | (1,292,000 | ) | (1,292,000 | ) | |||||||||||||||
| Fixed assets |
(252,000 | ) | (252,000 | ) | — | (251,000 | ) | (251,000 | ) | |||||||||||||||
| Other |
(57,000 | ) | (57,000 | ) | — | — | — | |||||||||||||||||
| Total |
(2,222,000 | ) | (2,222,000 | ) | — | (1,543,000 | ) | (1,543,000 | ) | |||||||||||||||
| Total deferred tax asset (liability), net |
482,000 | 780,000 | 1,262,000 | 317,000 | (1,064,000 | ) | (747,000 | ) | ||||||||||||||||
| Valuation allowance |
(310,000 | ) | (310,000 | ) | — | (19,000 | ) | (19,000 | ) | |||||||||||||||
| Net deferred tax asset (liability) |
$ | 482,000 | $ | 470,000 | $ | 952,000 | $ | 317,000 | $ | (1,083,000 | ) | $ | (766,000 | ) | ||||||||||
A valuation allowance is required to be recorded against deferred tax assets if, based on the available evidence, it is more likely than not that such assets will not be realized. When assessing the need for a valuation allowance, appropriate consideration should be given to all positive and negative evidence related to the realization of the deferred tax assets. This evidence includes, among other things, the existence of current and cumulative losses, forecasts of future profitability, the length of statutory carry-forward periods, our experience with loss carry-forwards expiring unused, and available tax planning strategies. As of December 31, 2010 and 2009, we have recorded a valuation allowance of $310,000 and $19,000, respectively, related to expected future utilization of state net operating loss carry-forwards resulting from recent acquisitions. The conclusion to record the valuation allowance is based on the inability to predict, with any degree of certainty, whether we will generate apportionable income to the states in which it has these net operating loss carry-forwards.
As of December 31, 2010, we have recorded a deferred tax asset for federal net operating loss carry-forwards of approximately $6.7 million which relate primarily to losses incurred by Heartland prior to its acquisition. These net operating loss carry-forwards will begin to expire in 2025. As a result of the acquisition of Heartland, future utilization of these net operating loss carry-forwards is subject to the provisions of Section 382 of the Internal Revenue Code of 1986, as amended. Total pre-acquisition net operating loss carry-forwards were approximately $16.7 million, of which we expect $10 million to expire unused as a result of Section 382 limitations and have not established a deferred tax asset. An initial analysis of Section 382 limitations was performed and any change to this estimate would adjust the amount of goodwill recorded. Further, based on historical earnings and expected future taxable income, we believe all of the net operating loss carry-forwards recorded as a deferred tax asset will be fully utilized before expiration. As a result, no valuation allowance has been recorded with respect to these federal net operating loss carry-forwards. As of December 31, 2009, the MDSI net operating loss carry-forwards were $657,000 and were fully utilized in 2010.
68
Table of Contents
With limited exception, we are no longer subject to examination by the U.S. federal or state tax authorities for years prior to 2007. We are currently under examination by the Indian tax authorities for the 2003 through 2010 tax years. We have accrued for potential additional tax liabilities associated with these examinations and do not believe the ultimate resolution will have a material impact on our operations.
Effective January 1, 2007, we adopted the provisions FASB ASC Topic 740—Income Taxes related to the accounting for uncertainty in income taxes recognized in an enterprise’s financial statements and prescribes a recognition threshold of more-likely-than-not to be sustained upon examination. Upon adoption, there was no entry required to retained earnings. As of December 31, 2010 and 2009, the total amount of unrecognized tax benefits was $4,681,000 and $0, respectively, all of which would affect the effective tax rate if recognized. A reconciliation of the beginning and ending amount of unrecognized tax benefits is as follows:
| Balance December 31, 2009 |
$ | — | ||
| Additions based on tax positions related to the current year |
89,000 | |||
| Increase due to business combination |
4,592,000 | |||
| Reductions for tax positions of prior years |
— | |||
| Balance December 31, 2010 (1) |
$ | 4,681,000 | ||
| (1) | This amount is offset on the balance sheet by advance tax payments of $3,027,000. |
We recognize accrued interest and penalties related to gross unrecognized tax benefits in the income tax provision. As of December 31, 2010 and 2009, accrued interest and penalties related to unrecognized tax benefits was $987,000 and $0, respectively. As of December 31, 2010, we do not expect the unrecognized tax benefits to change significantly over the next 12 months.
17. SEGMENT INFORMATION
We operated within one reportable segment for all periods presented. Although we now have operations in India, all revenue and long-lived assets occur in the United States.
18. SELECTED QUARTERLY FINANCIAL DATA (UNAUDITED)
| First Quarter | Second Quarter |
Third Quarter | Fourth Quarter |
|||||||||||||
| 2010 |
||||||||||||||||
| Revenue |
$ | 22,206,000 | $ | 22,209,000 | $ | 22,916,000 | $ | 26,976,000 | ||||||||
| Gross profit |
$ | 7,480,000 | $ | 8,031,000 | $ | 8,671,000 | $ | 10,445,000 | ||||||||
| Operating income |
$ | 2,444,000 | $ | 2,692,000 | $ | 4,270,000 | $ | 5,063,000 | ||||||||
| Net income |
$ | 1,479,000 | $ | 1,568,000 | $ | 2,615,000 | $ | 2,858,000 | ||||||||
| Basic net earnings per share |
$ | 0.14 | $ | 0.15 | $ | 0.25 | $ | 0.27 | ||||||||
| Diluted net earnings per share |
$ | 0.14 | $ | 0.15 | $ | 0.24 | $ | 0.26 | ||||||||
| 2009 |
||||||||||||||||
| Revenue |
$ | 14,930,000 | $ | 16,966,000 | $ | 18,491,000 | $ | 21,377,000 | ||||||||
| Gross profit |
$ | 5,343,000 | $ | 6,115,000 | $ | 6,574,000 | $ | 7,289,000 | ||||||||
| Operating income |
$ | 2,546,000 | $ | 2,822,000 | $ | 2,979,000 | $ | 2,736,000 | ||||||||
| Net income |
$ | 1,578,000 | $ | 1,756,000 | $ | 1,835,000 | $ | 1,590,000 | ||||||||
| Basic net earnings per share |
$ | 0.19 | $ | 0.21 | $ | 0.21 | $ | 0.18 | ||||||||
| Diluted net earnings per share |
$ | 0.18 | $ | 0.20 | $ | 0.20 | $ | 0.17 | ||||||||
69
Table of Contents
19. SUBSEQUENT EVENT
In accordance with FASB ASC Topic 855—Subsequent Events, we evaluated all events or transactions that occurred after December 31, 2010 up through the date these financial statements were issued. During this period, no material recognizable subsequent events occurred although the following nonrecognizable event did occur.
On March 3, 2011, we announced that we are in negotiations to acquire DTS America, Inc. (“DTS”). The transaction is expected to close in April 2011. Founded in 1995 and headquartered in Nashville, Tennessee, DTS is a medical transcription company that serves approximately 30 hospitals plus a number of clinics and surgery centers in 13 states. DTS currently generates approximately $12 million of annual revenue, which is expected to increase our annual revenue run rate (based on 4th quarter 2010 results) to approximately $124 million. Transcend intends to acquire DTS by the merger of DTS and a subsidiary of Transcend. The purchase price is expected to be $7.9 million in cash, plus an earn-out of up to $4.2 million payable in cash (if earned) in 2012. No debt will be assumed. The transaction is expected to have a nominal negative impact on second quarter 2011 earnings per share ($0.00—$0.01 per share) due to transaction costs and to be accretive to earnings per share starting in the third quarter of 2011. The proposed terms are non-binding and may be modified prior to close. Closing is subject to certain pre-closing conditions, including completion of due diligence and negotiation and execution of a definitive purchase agreement.
| ITEM 9. | CHANGES IN AND DISAGREEMENTS WITH ACCOUNTANTS ON ACCOUNTING AND FINANCIAL DISCLOSURE |
None.
| ITEM 9A. | CONTROLS AND PROCEDURES |
Evaluation of Disclosure Controls and Procedures
Disclosure Controls and Procedures
As of the end of the period covered by this report, our management has conducted an evaluation, with the participation of our Chief Executive Officer (CEO) and Chief Financial Officer (CFO), of the effectiveness of our disclosure controls and procedures in accordance with Rules 13a-15 under the Exchange Act. Based on this evaluation as of the end of the period covered by this report, our CEO and our CFO concluded that, as of such date, our disclosure controls and procedures were effective to ensure that information required to be disclosed by us in the reports that we file or submit under the Exchange Act is (i) accumulated and communicated to our management, including our CEO and CFO, as appropriate to allow timely decisions regarding required disclosure, and (ii) recorded, processed, summarized and reported within the time periods specified in the SEC’s rules and forms.
Management believes, however, that a controls system, no matter how well designed and operated, cannot provide absolute assurance that the objectives of the controls system are met, and no evaluation of controls can provide absolute assurance that all controls are working as designed and that instances of fraud, if any, within a company have been detected.
Changes in Internal Control over Financial Reporting
Internal control over financial reporting is a process designed by, or under the supervision of the principal executive officer and principal financial officers and effected by the board of directors, management and other personnel to provide reasonable assurance regarding the reliability of financial reporting and the preparation of our financial statements for external purposes in accordance with GAAP.
To the extent that components of our internal control over financial reporting are included in our disclosure controls, they are included in the scope of the evaluation by the principal executive officer and principal financial officer referenced above.
70
Table of Contents
No change in our internal control over financial reporting occurred during the quarter ended December 31, 2010 that has materially affected, or is reasonably likely to materially affect, our internal control over financial reporting.
Attestation Report of the Registered Public Accounting Firm
Grant Thornton LLP, our independent registered public accounting firm, has issued an attestation report on the effectiveness of our internal control over financial reporting. The report appears in Part II, Item 8 immediately before the Consolidated Financial Statements.
Management’s Report on Internal Control over Financial Reporting
See Part II, Item 8 for Management’s Report on Internal Control over Financial Reporting.
| ITEM 9B. | OTHER INFORMATION |
None.
71
Table of Contents
PART III
| ITEM 10. | DIRECTORS, EXECUTIVE OFFICERS AND CORPORATE GOVERNANCE |
The information required by this Item will appear in the Company’s Proxy Statement for its 2011 Annual Meeting of Stockholders under the captions “Proposal One – Election of Directors,” “Executive Officers,” “Section 16a Beneficial Ownership Reporting Compliance,” “Code of Business Conduct and Ethics Policy,” and “Meetings of the Board of Directors and Committees of the Board,” and the information therein is incorporated herein by reference.
| ITEM 11. | EXECUTIVE COMPENSATION |
The information required by this Item will appear in the Company’s Proxy Statement for its 2011 Annual Meeting of Stockholders under the captions “Executive Compensation,” “Compensation Discussion and Analysis,” “2010 Director Compensation,” “Compensation Committee Interlocks and Insider Participation,” and “Report of the Compensation Committee,” and the information therein is incorporated herein by reference.
| ITEM 12. | SECURITY OWNERSHIP OF CERTAIN BENEFICIAL OWNERS AND MANAGEMENT AND RELATED STOCKHOLDER MATTERS |
The information required by this Item will appear in the Company’s Proxy Statement for its 2011 Annual Meeting of Stockholders under the captions “Equity Compensation Plan Information” and “Security Ownership of Certain Beneficial Owners and Management,” and the information therein is incorporated herein by reference.
| ITEM 13. | CERTAIN RELATIONSHIPS AND RELATED TRANSACTIONS, AND DIRECTOR INDEPENDENCE |
The information required by this Item will appear in the Company’s Proxy Statement for its 2011 Annual Meeting of Stockholders under the captions “Certain Relationships and Related Transactions” and “Meetings of the Board of Directors and Committees of the Board,” and the information therein is incorporated herein by reference.
| ITEM 14. | PRINCIPAL ACCOUNTING FEES AND SERVICES |
The information required by this Item will appear in the Company’s Proxy Statement for its 2011 Annual Meeting of Stockholders under the caption “Audit Committee Disclosure,” and the information therein is incorporated herein by reference.
72
Table of Contents
PART IV
| ITEM 15. | EXHIBITS, FINANCIAL STATEMENT SCHEDULES |
(a) The following documents are filed as a part of this Annual Report for Transcend Services, Inc.:
1. Financial Statements
The Consolidated Financial Statements, the Notes to Consolidated Financial Statements and the Reports of Independent Registered Public Accounting Firms listed below are included in Item 8.
Reports of Independent Registered Public Accounting Firms
Consolidated Balance Sheets as of December 31, 2010 and 2009
Consolidated Statements of Operations for the years ended December 31, 2010, 2009 and 2008
Consolidated Statements of Cash Flows for the years ended December 31, 2010, 2009 and 2008
Consolidated Statements of Stockholders’ Equity for the years ended December 31, 2010, 2009 and 2008
Notes to Consolidated Financial Statements
(b) Exhibits
The following exhibits are filed with or incorporated by reference into this report, as noted.
| Incorporation by Reference | ||||||||||||||
| Exhibit |
Exhibit Description |
Form | File No. | Exhibit | Filing Date | |||||||||
| 1.1 |
Underwriting Agreement, dated December 16, 2009, by and between Transcend Services, Inc., the selling stockholders listed in Schedule II of the Underwriting Agreement and Lazard Capital Markets LLC, as book running manager for the several underwriters listed in Schedule I of the Underwriting Agreement | 8-K | 000-18217 | 1.1 | December 17, 2009 | |||||||||
| 2.1 |
Asset Purchase Agreement, dated December 20, 2008, by and among Transcend Services, Inc., DeVenture Global Partners, Inc. d/b/a DeVenture Health Partners and Michael Deville | 8-K | 000-18217 | 2.0 | December 23, 2008 | |||||||||
| 2.2 |
Asset Purchase Agreement, dated March 26, 2009, by and among Transcend Services, Inc., Transcription Relief Services, LLC and R. Harvey, Inc. | 8-K | 000-18217 | 2.0 | March 27, 2009 | |||||||||
| 2.3 |
Stock Purchase Agreement, dated August 25, 2009, by and between Transcend Services, Inc. and Dorothy K. Fitzgerald | 8-K | 000-18217 | 2.0 | August 28, 2009 | |||||||||
| 2.4 |
Agreement and Plan of Merger by and among Spryance, Inc. the Principal Stockholders listed on the Signature Pages hereto, The Stockholders’ Representative, Transcend Services Inc. and Transcend Acquisition Corporation dated October 21, 2010. | 8-K | 000-18217 | 10.1 | October 26, 2010 | |||||||||
| 3.1 |
Certificate of Incorporation | S-3 | 333-106446 | 4.1 | June 25, 2003 | |||||||||
73
Table of Contents
| Incorporation by Reference | ||||||||||||||
| Exhibit |
Exhibit Description |
Form | File No. | Exhibit | Filing Date | |||||||||
| 3.2 |
Amendment to Certificate of Incorporation | 8-K | 000-18217 | 3.1 | May 8, 2010 | |||||||||
| 3.3 |
Amended and Restated Bylaws | 8-K | 000-18217 | 3.2 | December 19, 2007 | |||||||||
| 4.1 |
Stock Purchase Warrant granted to Premier Holding of Illinois, LLC dated October 27, 2004 | 10-K | 000-18217 | 4.1 | March 9, 2005 | |||||||||
| 4.2 |
Promissory Note Payable dated January 31, 2005 for $3,500,000 in favor of Susan McGrogan | 10-K | 000-18217 | 4.3 | March 9, 2005 | |||||||||
| 4.3 |
Promissory Note dated as of March 1, 2005 between Transcend Services, Inc. and the Development Corporation of Abilene, Inc. | 10-Q | 000-18217 | 4.1 | July 28, 2005 | |||||||||
| 4.4 |
Loan and Security Agreement dated December 30, 2005 between Transcend Services, Inc. and HFG Healthco-4 LLC. | 8-K/A | 000-18217 | 4.1 | January 12, 2006 | |||||||||
| 4.5 |
Acquisition Promissory Note dated December 30, 2005 between Transcend Services, Inc. and HFG Healthco-4 LLC. | 8-K/A | 000-18217 | 4.2 | January 12, 2006 | |||||||||
| 4.6 |
Revolving Promissory Note dated December 30, 2005 between Transcend Services, Inc. and HFG Healthco-4 LLC. | 8-K/A | 000-18217 | 4.3 | January 12, 2006 | |||||||||
| 4.7 |
Form of Indenture | S-3 | 333-162106 | 4.7 | September 24, 2009 | |||||||||
| 10.1* |
1992 Stock Option Plan, as Amended and Restated | S-8 | 333-16213 | 4.1 | November 15, 1996 | |||||||||
| 10.2* |
Form of Incentive Stock Option Agreement under 1992 Stock Option Plan, as Amended and Restated | S-8 | 333-16213 | 4.2 | November 15, 1996 | |||||||||
| 10.3* |
2001 Stock Option Plan | 10-K | 000-18217 | 4.15 | March 6, 2002 | |||||||||
| 10.4* |
2003 Stock Incentive Plan | 10-Q | 000-18217 | 4.3 | July 29, 2004 | |||||||||
| 10.5* |
2004 Employee Stock Purchase Plan | 10-Q | 000-18217 | 4.4 | July 29, 2004 | |||||||||
| 10.6 |
Clinical Documentation Solution Agreement between Transcend Services, Inc. and MultiModal Technologies, Inc. effective September 28, 2004 (Confidential treatment has been requested for certain portions of this exhibit pursuant to Rule 24(b)(2) and accordingly, those portions have been omitted from this exhibit and filed separately with the Commission.) | 10-K | 000-18217 | 10.6 | March 9, 2005 | |||||||||
| 10.7* |
2005 Stock Incentive Plan | 10-Q | 000-18217 | 10.1 | July 28, 2005 | |||||||||
| 10.8 |
Agreement for Financial Assistance dated March 1, 2005 between the Development Corporation of Abilene, Inc. and Transcend Services, Inc. | 10-Q | 000-18217 | 10.1 | April 28, 2005 | |||||||||
74
Table of Contents
| Incorporation by Reference | ||||||||||||||
| Exhibit |
Exhibit Description |
Form | File No. | Exhibit | Filing Date | |||||||||
| 10.9 |
Option Agreement to Purchase Stock dated August 15, 2005 between Susan McGrogan and Transcend Services, Inc. | 10-Q | 000-18217 | 10.2 | October 26, 2005 | |||||||||
| 10.10 |
Transcend Services, Inc. Stock Purchase Warrant to Purchase Shares of Common Stock, $.05 Par Value. | 8-K/A | 000-18217 | 10.1 | February 27, 2006 | |||||||||
| 10.11 |
Amendment to Option Agreement to Purchase Stock between Susan McGrogan and Transcend Services, Inc. dated December 21, 2005. | 10-K | 000-18217 | 10.11 | March 6, 2006 | |||||||||
| 10.12* |
2006 Executive Compensation Plan | 10-K | 000-18217 | 10.12 | March 6, 2006 | |||||||||
| 10.13 |
Lease Agreement by and between Farnam Street Financial and Transcend Services, Inc. dated May 19, 2005. | 10-K | 000-18217 | 10.13 | March 6, 2006 | |||||||||
| 10.14 |
Lease Schedule No. 001R to Lease Agreement by and between Farnam Street Financial and Transcend Services, Inc., dated December 20, 2005. | 10-K | 000-18217 | 10.14 | March 6, 2006 | |||||||||
| 10.15 |
Lease Schedule No. 002R to Lease Agreement by and between Farnam Street Financial and Transcend Services, Inc., dated October 4, 2005. | 10-K | 000-18217 | 10.15 | March 6, 2006 | |||||||||
| 10.16 |
Lease Schedule No. 003R to Lease Agreement by and between Farnam Street Financial and Transcend Services, Inc., dated December 21, 2005. | 10-K | 000-18217 | 10.16 | March 6, 2006 | |||||||||
| 10.17# |
Clinical Documentation Solution Agreement by and between MultiModal Technologies, Inc. and Transcend Services, Inc., effective as of September 1, 2006. | 8-K/A | 000-18217 | 10.1 | March 1, 2007 | |||||||||
| 10.18 |
Promissory Note between Transcend Services. Inc. and Development Corporation of Abilene, Inc. dated December 1, 2008 | 8-K | 000-18217 | 99.1 | January 2, 2009 | |||||||||
| 10.19* |
2007 Stock Incentive Plan | DEF14A | 000-18217 | A | April 12, 2007 | |||||||||
| 10.20* |
2009 Stock Incentive Plan | DEF14A | 000-18217 | A | April 6, 2009 | |||||||||
| 10.21 |
Loan and Security Agreement, dated August 31, 2009, by and between Transcend Services, Inc., Medical Dictation Services, Inc. and Regions Bank | 8-K | 000-18217 | 10.1 | September 3, 2009 | |||||||||
| 10.22 |
Unsecured Promissory Note, dated August 31, 2009, issued by Transcend Services, Inc. to Dorothy K. Fitzgerald | 8-K | 000-18217 | 10.2 | September 3, 2009 | |||||||||
75
Table of Contents
| Incorporation by Reference | ||||||||||||||||||
| Exhibit |
Exhibit Description |
Form | File No. | Exhibit | Filing Date | |||||||||||||
| 10.23 |
Registration Rights Agreement, dated August 31, 2009, between Transcend Services, Inc. and Dorothy K. Fitzgerald | 8-K | 000-18217 | 10.3 | September 3, 2009 | |||||||||||||
| 10.24 |
Transcription Services Agreement between Transcend Services, Inc. and Hospital Management Associates, Inc. | 8-K | 000-18217 | 10.1 | September 17, 2009 | |||||||||||||
| 10.25* |
Form of Officer Restricted Stock Agreement (2010 Grants) | 10-K | 000-18217 | 10.25 | March 3, 2010 | |||||||||||||
| 10.26* |
Form of Officer Restricted Stock Agreement (2009 Grants) | 10-K | 000-18217 | 10.26 | March 3, 2010 | |||||||||||||
| 10.27 |
Amendment to Loan and Security Agreement and Waiver, by and between Transcend Services, Inc., Medical Dictation Services, Inc. and Regions Bank, dated September 21, 2009 | 10-K | 000-18217 | 10.27 | March 3, 2010 | |||||||||||||
| 10.28 |
Amendment to Loan and Security Agreement and Waiver, by and between Transcend Services, Inc., Medical Dictation Services, Inc. and Regions Bank, dated December 1, 2009 | 10-K | 000-18217 | 10.28 | March 3, 2010 | |||||||||||||
| 10.29 |
Amendment to Loan and Security Agreement and Waiver, by and between Transcend Services, Inc., Medical Dictation Services, Inc. and Regions Bank, dated February 15, 2010 | 8-K | 000-18217 | 10.1 | February 19, 2010 | |||||||||||||
| 10.30 |
Amendment to Loan and Security Agreement and Waiver, by and between Transcend Services, Inc. and Regions Bank, dated March 3, 2011 | |||||||||||||||||
| 14.1 |
Transcend Services, Inc. Code of Business Conduct and Ethics Policy | 10-K | 000-18217 | 14.1 | February 12, 2004 | |||||||||||||
| 21.1 |
Subsidiaries of the Registrant | |||||||||||||||||
| 23.1 |
Consent of Grant Thornton LLP | |||||||||||||||||
| +31.1 |
Certification of Chief Executive Officer of the Registrant Pursuant to Rule 13a-14(a) and Rule 15d-14(a), promulgated under the Securities Exchange Act of 1934, as amended | |||||||||||||||||
| +31.2 |
Certification of Chief Financial Officer of the Registrant Pursuant to Rule 13a-14(a) and Rule 15d-14(a), promulgated under the Securities Exchange Act of 1934, as amended | |||||||||||||||||
| +32.1 |
Certification of Chief Executive Officer of the Registrant Pursuant to Section 906 of the Sarbanes-Oxley Act of 2002 | |||||||||||||||||
| +32.2 |
Certification of Chief Financial Officer of the Registrant Pursuant to Section 906 of the Sarbanes-Oxley Act of 2002 | |||||||||||||||||
76
Table of Contents
| * | Denotes management contract or compensatory plan or arrangement |
| # | Confidential treatment has been granted with respect to certain portions of this Exhibit, which portions have been omitted and filed separately with the SEC as part of an application for confidential treatment. |
| + | This certification is furnished to, but not filed with, the Commission. This certification shall not be deemed to be incorporated by reference into any filing under the Securities Act of 1933 or the Securities Exchange Act of 1934, except to the extent that the Registrant specifically incorporates it by reference. |
(c) Financial Statement Schedules.
SCHEDULE II—VALUATION AND QUALIFYING ACCOUNTS
For the Years Ended December 31, 2010, 2009 and 2008
| Balance at Beginning of Period |
Charged to Costs and Expenses |
Net (Deductions) Recoveries |
Balance at End of period |
|||||||||||||
| Year ended December 31, 2010 |
||||||||||||||||
| Allowance for doubtful accounts |
$ | 96,000 | 36,000 | (8,000 | ) | $ | 124,000 | |||||||||
| Deferred tax asset valuation allowance |
$ | 19,000 | 291,000 | $ | 310,000 | |||||||||||
| Year ended December 31, 2009 |
||||||||||||||||
| Allowance for doubtful accounts |
$ | 99,000 | 51,000 | (54,000 | ) | $ | 96,000 | |||||||||
| Deferred tax asset valuation allowance |
$ | 26,000 | (7,000 | ) | $ | 19,000 | ||||||||||
| Year ended December 31, 2008 |
||||||||||||||||
| Allowance for doubtful accounts |
$ | 85,000 | 57,000 | (43,000 | ) | $ | 99,000 | |||||||||
| Deferred tax asset valuation allowance |
$ | 219,000 | (193,000 | ) | $ | 26,000 | ||||||||||
Deductions in the allowance for doubtful accounts principally reflect the write-off of previously reserved accounts net of recoveries. At December 31, 2010, the Company had a $310,000 valuation allowance related to state net operating loss carryforwards.
77
Table of Contents
Pursuant to the requirements of Section 13 or 15(d) of the Securities Exchange Act of 1934, the Registrant has duly caused this report to be signed on its behalf by the undersigned, thereunto duly authorized.
| Transcend Services, Inc. | ||||||||
| By: |
/s/ LARRY G. GERDES | |||||||
| Larry G. Gerdes | ||||||||
| Chief Executive Officer (Principal Executive Officer) | ||||||||
| By: |
/s/ LANCE B. CORNELL | |||||||
| Lance B. Cornell | ||||||||
| Chief Financial Officer (Principal Financial and Accounting Officer) | ||||||||
Dated: March 15, 2011
Pursuant to the requirements of the Securities Exchange Act of 1934, this report has been signed below by the following persons on behalf of the Registrant and in the capacities and on the dates indicated.
| Signature |
Title |
Date | ||
| /S/ LARRY G. GERDES Larry G. Gerdes |
Chairman of the Board and Chief Executive Officer |
March 15, 2011 | ||
| /S/ LANCE B. CORNELL Lance B. Cornell |
Chief Financial Officer |
March 15, 2011 | ||
| /S/ JOSEPH G. BLESER Joseph G. Bleser |
Director | March 15, 2011 | ||
| /s/ JOSEPH P. CLAYTON Joseph P. Clayton |
Director | March 15, 2011 | ||
| /S/ JAMES D. EDWARDS James D. Edwards |
Director | March 15, 2011 | ||
| /S/ WALTER S. HUFF, JR. Walter S. Huff, Jr. |
Director | March 15, 2011 | ||
| /S/ CHARLES E. THOELE Charles E. Thoele |
Director | March 15, 2011 | ||
78