Attached files
Table of Contents
UNITED STATES
SECURITIES AND EXCHANGE COMMISSION
Washington, D.C. 20549
FORM 10-K
| x | ANNUAL REPORT PURSUANT TO SECTION 13 OR 15(d) OF THE SECURITIES EXCHANGE ACT OF 1934 |
For the fiscal year ended December 31, 2010
Commission file number 000-50840
QC HOLDINGS, INC.
(Exact name of registrant as specified in its charter)
| Kansas | 48-1209939 | |
| (State or other jurisdiction of incorporation or organization) | (I.R.S. Employer Identification No.) |
9401 Indian Creek Parkway, Suite 1500
Overland Park, Kansas 66210
913-234-5000
(Address, including zip code, and telephone number of registrant’s principal executive offices)
SECURITIES REGISTERED PURSUANT TO SECTION 12(b) OF THE ACT:
| Title of each class | Name of each exchange on which registered | |
| Common Stock, par value $0.01 per share | NASDAQ Global Market |
SECURITIES REGISTERED PURSUANT TO SECTION 12(g) OF THE ACT:
None
Indicate by check mark if the
registrant is a well-known seasoned issuer, as defined in Rule 405 of the Securities Act.
Yes ¨ No x
Indicate by check mark if the registrant is not required to file reports pursuant to Section 13 or Section 15(d) of the Act. Yes ¨ No x
Indicate by check mark whether the registrant (1) has filed all reports required to be filed by Section 13 or 15(d) of the Securities Exchange Act of 1934 during the preceding 12 months (or for such shorter period that the registrant was required to file such reports), and (2) has been subject to such filing requirements for the past 90 days. Yes x No ¨
Indicate by check mark whether the registrant has submitted electronically and posted on its corporate Web site, if any, every Interactive Data File required to be submitted and posted pursuant to Rule 405 of Regulation S-T (§232.405 of this chapter) during the preceding 12 months (or for such shorter period that the registrant was required to submit and post such files). Yes ¨ No ¨
Indicate by check mark if disclosure of delinquent filers pursuant to Item 405 of Regulation S-K (§229.405) is not contained herein, and will not be contained, to the best of registrant’s knowledge, in definitive proxy or information statements incorporated by reference in Part III of this Form 10-K or any amendments to this Form 10-K. ¨
Indicate by check mark whether the registrant is a large accelerated filer, an accelerated filer, a non-accelerated filer or a smaller reporting company (as defined in Rule 12b-2 of the Exchange Act).
| Large accelerated filer |
¨ | Accelerated filer | ¨ | |||
| Non-accelerated filer |
¨ | Smaller reporting company | x |
Indicate by check mark whether the registrant is a shell company (as defined in Rule 12b-2 of the Exchange Act). Yes ¨ No x
The aggregate market value of the voting and non-voting common equity held by non-affiliates based on the closing sale price on June 30, 2010 was $18.5 million.
Shares outstanding of the registrant’s common stock as of February 28, 2011: 17,148,527
DOCUMENTS INCORPORATED BY REFERENCE: The information required by Part III of Form 10-K is incorporated herein by reference to the registrant’s definitive proxy statement to be filed with the Securities and Exchange Commission pursuant to Regulation 14A not later than 120 days after the end of the fiscal year covered by this report.
Table of Contents
INDEX TO ANNUAL REPORT ON FORM 10-K
For the fiscal year ended December 31, 2010
Table of Contents
FORWARD-LOOKING STATEMENTS
In this report, in other filings with the Securities and Exchange Commission and in press releases and other public statements by our officers throughout the year, QC Holdings, Inc. makes or will make statements that plan for or anticipate the future. These forward-looking statements include statements about our future business plans and strategies, and other statements that are not historical in nature. These forward-looking statements are based on our current expectations and assumptions. Many of these statements are found in the “Business” and “Management’s Discussion and Analysis of Financial Condition and Results of Operations” sections of this report.
Forward-looking statements may be identified by words or phrases such as “believe,” “expect,” “anticipate,” “should,” “planned,” “may,” “intend,” “estimated,” “potential,” “goal,” and “objective.” Section 27A of the Securities Act of 1933, as amended, and Section 21E of the Securities Exchange Act of 1934, as amended, provide a “safe harbor” for forward-looking statements. In order to comply with the terms of the safe harbor, and because forward-looking statements involve future risks and uncertainties, listed herein are a variety of factors that could cause actual results and experience to differ materially from the anticipated results or other expectations expressed in our forward-looking statements. These factors include the risks discussed in “Item 1A. Risk Factors” of this report. We undertake no obligation to update any forward-looking statements contained herein or in future communications to reflect future events or developments.
| ITEM 1. | Business |
Overview
QC Holdings, Inc. and its subsidiaries provide various financial services (primarily payday loans) and sell used vehicles and earn finance charges from the related vehicle financing contracts. References below to “we”, “us” and “our” may refer to QC Holdings, Inc. exclusively or to one or more of our subsidiaries. Originally formed in 1984, we were incorporated in the state of Kansas in 1998 and have provided various retail consumer products and services during our 26-year history.
We operate primarily through our wholly-owned subsidiaries, QC Financial Services, Inc., QC Auto Services, Inc., QC Loan Services, Inc. and QC E-Services, Inc. QC Financial Services, Inc. is the 100% owner of QC Financial Services of California, Inc., QC Financial Services of Texas, Inc., Express Check Advance of South Carolina, LLC, QC Advance, Inc., Financial Services of North Carolina, Inc., Cash Title Loans, Inc. and QC Properties, LLC.
Financial Services
Revenues from our financial services are primarily derived by providing short-term consumer loans, known as payday loans, which represented approximately 70.0% of our total revenues for the year ended December 31, 2010. We earn fees for various other financial services, such as installment loans, credit services, check cashing services, title loans, money transfers and money orders. We operated 523 short-term lending branches in 24 states as of December 31, 2010.
We entered the payday loan industry in 1992, and believe that we were one of the first companies to offer the payday loan product in the United States. We have served the same customer base since 1984, beginning with a rent-to-own business and continuing with check cashing services in 1988. We sold our rent-to-own branches in 1994.
Since 1998, we have been primarily engaged in the business of providing payday loans, with principal values that typically range from $100 to $500. Payday loans provide customers with cash in exchange for a
1
Table of Contents
promissory note with a maturity of generally two to three weeks and supported by that customer’s personal check for the aggregate amount of the cash advanced plus a fee. To repay the cash advance, customers may pay with cash, in which case their personal check is returned to them, or they may allow the check to be presented to the bank for collection. The fee varies from state to state, based on applicable regulations, and generally ranges from $15 to $20 per $100 borrowed, although recent legislation in a few states has capped the fee below $2 per $100 borrowed. Based on the cost structure required to operate a storefront location, we spend approximately $10 to $11 per $100 borrowed, exclusive of loan losses. As a result, in states where a fee cap below that cost level is mandated, without additional fees, we are unable to operate at a profit.
During 1999 and 2000, we tripled our size as a result of several acquisitions. These acquisitions were funded in part by internally generated cash flow and in part by proceeds received from a minority investor in October 1999. From 2001 through June 30, 2004, we focused primarily on de novo growth, using cash flow from operations and borrowings under a revolving credit facility to fund the expenditures required. In the second half of 2004 and 2005, we initiated an aggressive growth plan and opened 219 de novo branches and acquired 39 branches, which were funded by proceeds from our initial public offering and internally generated cash flow.
In response to changes in the overall market and unfavorable legislation in several states, we have dramatically slowed our branch expansion over the past five years and closed a significant number of branches. During this period, we opened 82 de novo branches, acquired 65 branches and closed 156 branches. The following table sets forth our de novo branch openings, branch acquisitions and branch closings since January 1, 2006.
| 2006 | 2007 | 2008 | 2009 | 2010 | ||||||||||||||||
| Beginning branch locations |
532 | 613 | 596 | 585 | 556 | |||||||||||||||
| De novo branches opened during year |
46 | 20 | 12 | 3 | 1 | |||||||||||||||
| Acquired branches during year |
51 | 13 | 1 | |||||||||||||||||
| Branches closed during year(a) |
(16 | ) | (50 | ) | (24 | ) | (32 | ) | (34 | ) | ||||||||||
| Ending branch locations |
613 | 596 | 585 | 556 | 523 | |||||||||||||||
| (a) | The branches closed during 2010 does not include 21 branches that we announced we would close during first half 2011. However, these branches are included as part of discontinued operations in 2010. |
On December 1, 2006, we acquired all the issued and outstanding membership interests in Express Check Advance of South Carolina, LLC (ECA) for approximately $16.3 million, net of cash acquired. As a result of this acquisition, we established a significant presence in South Carolina. The acquisition was funded with a draw on our revolving credit facility.
During March and April 2007, we acquired 13 payday and installment loan branches in Illinois and Missouri. Shortly after the acquisition, we closed six of the payday loan branches that were located near six of our existing branches and transferred the loans receivable to those branches. In the future, we anticipate there could be similar opportunities for consolidation-type acquisitions.
We intend to evaluate opportunities for new branch development to complement existing branches within a given state or market. Additionally, we utilize a disciplined acquisition strategy for both the payday and the buy here, pay here businesses. During 2011, we expect to open approximately 10 branches providing short-term loan products and two to three automotive locations.
Generally, branch closings have been associated with (i) negative changes in the legislative or regulatory environment in a state, (ii) overlapping branch locations (as a result of acquisitions), or (iii) markets where we believed long-term growth potential was minimal. We review the financial metrics of each branch to determine if trends exist with respect to declining loan volumes and revenues that might require the closing of the branch. In
2
Table of Contents
those instances, we evaluate the need to close the branch based on several factors, including the length of time the branch has been open, geographic location, competitive environment, proximity to another one of our branches and long-term market potential.
During 2010, we closed 34 of our lower performing branches in various states and decided that we will close 21 branches primarily in Arizona, Washington and South Carolina during first half 2011 due to unfavorable changes to the payday loan laws in each of those states during 2010. As a result, we recorded approximately $1.8 million in pre-tax charges during 2010 associated with these closings. The charges included $916,000 representing the loss on the disposition of fixed assets, $671,000 for lease terminations and other related occupancy costs, $155,000 in severance and benefit costs and $33,000 for other costs.
During 2009, we closed 32 of our lower performing branches in various states (which included six branches that were consolidated into nearby branches). As a result of these closings, we recorded approximately $1.7 million in pre-tax charges during 2009 to reflect fixed asset write-offs and termination of lease obligations, the majority of which is included in discontinued operations in the consolidated financial statements.
During third quarter 2008, we closed 13 of our 32 branches in Ohio, primarily due to a new law that went into effect on September 1, 2008 that severely restricts the profitability of offering payday loans. In addition, we closed 11 of our lower performing branches in various other states during 2008 by consolidating those branches into nearby branches.
During 2007, we closed 34 of our lower performing branches in various states (the majority of which were consolidated into nearby branches), and we terminated the de novo process on eight branches that were never opened. In addition, a new law went into effect in Oregon that capped the interest rate that may be charged on a payday loan to 36% per annum, which translates to a fee of approximately $1.38 per $100 borrowed. As a result of the new law, we closed our eight branches in Oregon during third quarter 2007.
We will continue to evaluate our branch network to determine the ongoing viability of each branch, particularly in states where legislative and regulatory changes have occurred. To the extent that we close branches during 2011, we would incur certain closing costs, which would include non-cash charges for the write-off of fixed assets and cash charges for the settlement of lease obligations.
Automotive
In September 2007, we entered into the buy here, pay here segment of the used automotive market in connection with ongoing efforts to evaluate alternative products that serve our customer base. In January 2009, we purchased two buy here, pay here locations in Missouri for approximately $4.2 million. As of December 31, 2010, we operated five buy here, pay here lots, three of which are located in Missouri and the other two in Kansas. These locations sell used vehicles and earn finance charges from the related vehicle financing contracts. In May 2009, we opened a service center to provide reconditioning services on our inventory of vehicles and repair services for our customers. During 2011, we expect to open two to three buy here, pay here locations.
Industry Background
Payday Loan Industry
The payday loan industry began its rapid growth in 1996, when there were an estimated 2,000 payday loan branches in the United States. According to the Community Financial Services Association of America (CFSA), industry analysts estimate that the industry has approximately 19,700 payday loan branches in the United States and these branches (exclusive of internet lending) extend approximately $29 billion in short-term credit to millions of middle-class households that experience cash-flow shortfalls between paydays. The growth of the payday loan industry has followed and continues to be significantly affected by payday lending legislation and
3
Table of Contents
regulation in various states and on a national level. We believe that the payday loan industry is fragmented, with the 16 largest companies operating approximately one-half (approximately 9,900 branches) of the total industry branches. After a number of years of growth, the industry has contracted in the past few years, primarily due to changes in laws that govern the payday product. Absent changes in regulations and laws, we do not expect significant fluctuations in the industry’s number of branches.
Payday loan customers typically are middle-income, middle-educated individuals who are a part of a young family. Research studies by the industry and academic economists, as well as information from our customer database, have confirmed the following about payday loan customers:
| • | more than half earn between $25,000 and $50,000 annually; |
| • | the majority are under 45 years old; |
| • | more than half have attended college, and one in five has a bachelor’s degree or higher; |
| • | more than 40% are homeowners, and about half have children in the household; and |
| • | all have steady incomes and all have checking accounts. |
In addition, at least two-thirds of industry customers say they have at least one other alternative to using a payday loan that offers quick access to money, such as overdraft protection, credit cards, credit union loans or savings accounts. We believe that our customers choose the payday loan product because it is quick, convenient and, in many instances, a lower-cost or more suitable alternative for the customer than the other available alternatives.
Buy Here, Pay Here Industry
The market for used car sales in the United States is significant. The used vehicle industry is highly fragmented, with sales typically occurring through one of three channels: (i) the used vehicle retail operations of manufacturers’ franchised new car dealerships, (ii) independent used vehicle dealerships and (iii) individuals who sell used vehicles in private transactions. We operate in the buy here, pay here segment of the independent used car sales and finance market. Buy here, pay here dealers typically sell and finance used vehicles to individuals with limited credit histories or past credit problems. Buy here, pay here dealers are characterized by their sale of older, higher mileage cars; relatively small inventories of vehicles; and their requirements that customers make installment payments weekly or bi-weekly (to coincide with a customer’s payday) in person at the dealership.
The used vehicle financing segment is highly fragmented and is served by a variety of financing sources that include independent finance companies, buy here, pay here dealers, and select traditional lending sources such as banks, savings and loans, credit unions and captive finance subsidiaries of vehicle manufacturers. Many traditional lending sources have historically avoided the sub-prime market due to its relatively high credit risk and the associated collection efforts and costs.
4
Table of Contents
Our Services
Our primary business is offering payday loans through our network of branches. In addition, we offer other consumer financial services, such as installment loans, credit services, check cashing services, title loans, open-end credit, money transfers and money orders. We also operate in the buy here, pay here segment of the used automobile market. The following table sets forth the percentage of total revenue for payday loans and the other services we provide.
| Year Ended December 31, | Year Ended December 31, | |||||||||||||||||||||||
| 2008 | 2009 | 2010 | 2008 | 2009 | 2010 | |||||||||||||||||||
| (in thousands) | (percentage of revenues) | |||||||||||||||||||||||
| Revenues |
||||||||||||||||||||||||
| Payday loan fees |
$ | 166,371 | $ | 152,797 | $ | 131,624 | 79.8 | % | 73.8 | % | 70.0 | % | ||||||||||||
| Automotive sales, interest and fees |
6,120 | 15,293 | 19,914 | 2.9 | % | 7.4 | % | 10.6 | % | |||||||||||||||
| Installment loan fees |
18,220 | 17,107 | 17,326 | 8.7 | % | 8.3 | % | 9.2 | % | |||||||||||||||
| Credit service fees |
6,202 | 6,778 | 7,322 | 3.0 | % | 3.3 | % | 3.9 | % | |||||||||||||||
| Check cashing fees |
5,277 | 5,175 | 4,537 | 2.5 | % | 2.5 | % | 2.4 | % | |||||||||||||||
| Title loan fees |
3,672 | 3,116 | 4,729 | 1.8 | % | 1.5 | % | 2.5 | % | |||||||||||||||
| Open-end credit fees |
32 | 3,694 | 56 | 0.0 | % | 1.8 | % | 0.0 | % | |||||||||||||||
| Other fees |
2,719 | 3,074 | 2,580 | 1.3 | % | 1.4 | % | 1.4 | % | |||||||||||||||
| Total |
$ | 208,613 | $ | 207,034 | $ | 188,088 | 100.0 | % | 100.0 | % | 100.0 | % | ||||||||||||
Payday Loans
To obtain a payday loan from us, a customer must complete a loan application, provide a valid identification, maintain a personal checking account, have a source of income sufficient to loan some amount to the customer, and not otherwise be in default on a loan from us. Upon completion of a loan application, the customer signs a promissory note and provides us with a check for the principal loan amount plus a specified fee, which varies by state. State laws typically limit fees to a range of $15 to $20 per $100 borrowed, although recent legislation in a few states has capped the fee below $2 per $100 borrowed. Loans generally mature in two to three weeks, on or near the date of a customer’s next payday. Our agreement with customers provides that we will not cash their check until the due date of the loan. The customer’s debt to us is satisfied by:
| • | payment of the full amount owed in cash in exchange for return of the customer’s check; |
| • | deposit of the customer’s check with the bank and its successful collection; |
| • | automated clearing house (ACH) payment; or |
| • | where applicable, renewal of the customer’s loan after payment of the original loan fee in cash. |
We offer renewals only in states that allow them, and, subject to more restrictive requirements under state law, we comply with the recommended best practices set forth by the CFSA and offer no more than four consecutive renewals per customer after the initial loan. We also require that the customer sign a new promissory note and provide a new check for each payday loan renewal. If a customer is unable to meet his or her current repayment for a payday loan, the customer may qualify for an extended payment plan (EPP). In most states, the terms of our EPP conform to the CFSA best practices and guidelines. Certain states have specified their own terms and eligibility requirements for an EPP. Generally, a customer may enter into an EPP once every 12 months, and the EPP will call for scheduled payments that coincide with the customer’s next four paydays. In some states, a customer may enter into an EPP more frequently. We will not engage in collection efforts while a customer is enrolled in an EPP. If a customer misses a scheduled payment under the EPP, our personnel may resume normal collection procedures. We do not offer an EPP for our installment loans, nor does the third party lender in Texas offer an EPP to its customers.
5
Table of Contents
During 2010, approximately 89.6% of our payday loan volume was repaid by the customer returning to the branch and settling their obligation by either payment in cash of the full amount owed or by renewal of the payday loan through payment of the original loan fee and signing a new promissory note accompanied by a new check. With respect to the remaining 10.4% of volume, we presented the customer’s check to the bank for payment of the payday loan. Approximately 39.7% of items presented to the bank were collected and approximately 60.3% were returned to us due to insufficient funds in the customer’s account, which equates to gross losses of approximately 6.3% of total loan volume. If a customer’s check is returned to us for insufficient funds or any other reason, we initiate collection efforts. During 2010, our efforts resulted in approximately 54.9% collection of the returned items, which includes cash received totaling $494,000 for the sale of older debt. As a result, our overall provision for loan losses during 2010 was approximately 3.7% of total volume. On average, our overall provision for loan losses has historically ranged from 2% to 5% of total volume based on market factors, average age of our branch base, rate of unit branch growth and effectiveness of our collection efforts.
In 2010, our customers averaged approximately six two-week payday loans (out of a possible 26 two-week loans). The average term of a loan to our customers was 16 days for each of the years ended December 31, 2008 and 2009 and 17 days for the year ended December 31, 2010.
Our business is seasonal due to the fluctuating demand for payday loans during the year. Historically, we have experienced our highest demand for payday loans in January and in the fourth calendar quarter. As a result of the receipt by customers of their income tax refunds, demand for payday loans has historically declined in the balance of the first quarter of each calendar year and the first month of the second quarter. Our loss ratio historically fluctuates with these changes in payday loan demand, with a higher loss ratio in the second and third quarters of each calendar year and a lower loss ratio in the first and fourth quarters of each calendar year.
Other Financial Services
We also offer other consumer financial services, such as installment loans, check cashing services, title loans, credit services, open-end credit, money transfers and money orders. Together, these other financial services constituted 17.3%, 18.8% and 19.4% of our revenues for the years ended December 31, 2008, 2009 and 2010, respectively.
We currently offer installment loans to customers in 89 branches (located in Colorado, Idaho, Illinois, Montana, New Mexico and Utah). The installment loans are payable in monthly installments (principal plus accrued interest) with terms ranging from four months to one year, and all loans are pre-payable at any time without penalty. The fee for an installment loan varies based on the amount borrowed and the term of the loan. Generally, the maximum amount that we advance under an installment loan is $1,000. The average principal amount for installment loans originated during 2010 was approximately $490.
For our locations in Texas, we operate as a credit services organization (CSO) through one of our subsidiaries. As a CSO, we act on behalf of consumers in accordance with Texas laws. We charge the consumer a fee (a CSO fee) for arranging for an unrelated third-party lender to make a loan to the consumer and for providing related services to the consumer, including a guarantee of the consumer’s obligation to the third-party lender. We also service the loan for the lender. The CSO fee is recognized ratably over the term of the loan. We are not involved in the loan approval process or in determining the loan approval procedures or criteria. As a result, loans made by the lender are not included in our loan receivable balance and are not reflected in the consolidated balance sheet. As noted above, however, we absorb all risk of loss through our guarantee of the consumer’s loan from the lender.
We offered check cashing services in 394 of our 523 branches as of December 31, 2010. We primarily cash payroll, government assistance, tax refund, insurance and personal checks. Before cashing a check, we verify the customer’s identification and the validity of the check. Our fees for this service averaged 2.7%, 2.9% and 2.8% of the face amount of the check in 2008, 2009 and 2010, respectively. If a check cashed by us is not paid for any
6
Table of Contents
reason, we record the full face value of the check as a loss in the period when the check was returned unpaid. We then contact the customer to initiate the collection process. Check cashing revenues are typically higher in the first quarter due primarily to customers’ receipt of income tax refund checks.
We also offer title loans, which are short-term consumer loans. Typically, we advance or will loan up to 25% of the estimated value of the underlying vehicle for a term of 30 days, secured by the customer’s vehicle. Generally, if a customer has not repaid a loan after 30 days, we charge the receivable to expense and we initiate collection efforts. Occasionally, we hire an agent to initiate repossession. We offered title loans in 175 branches as of December 31, 2010.
We are also an agent for the transmission and receipt of wire transfers for Western Union. Through this network, our customers can transfer funds electronically to more than 380,000 locations in more than 200 countries and territories throughout the world. Additionally, our branches offer Western Union money orders.
In April 2008, Virginia passed a new law (effective January 1, 2009) that severely restricts our ability to offer payday loans profitably. As a result of the new law, we began offering an open-end credit product to our customers in Virginia beginning in December 2008. The open-end credit product was very similar to a credit card as the customer was granted a grace period of 25 days to repay the loan without incurring any interest. Further, we were responsible for providing the borrower with a monthly statement and we required the borrower to make a monthly payment based on the outstanding balance. In addition to interest earned on the outstanding balance, the open-end credit product also included a monthly membership fee. We discontinued offering the open-end credit product in the second quarter of 2009 so that we could focus exclusively on delivering the payday loan product to our Virginia customers.
Automotive
We had five buy here, pay here car locations as of December 31, 2010. As an operator of buy here, pay here locations, we sell and finance used cars to individuals who may or may not have a bank account, have limited credit histories or past credit problems. We purchase our inventory of vehicles primarily through auctions. The vehicles acquired are carried in inventory at the amount of purchase price plus vehicle reconditioning costs (not to exceed its net realizable value). We provide a limited warranty on most of the vehicles we sell. We provide financing to substantially all of our customers who purchase a vehicle at one of our buy here, pay here locations. Our finance contract typically includes a down payment or a trade-in allowance ranging from $200 to $2,000 and an average term of 33 months. We require payments to be made on a weekly, bi-weekly, semi-monthly or monthly basis to coincide with the customer’s pay date. The average principal amount for buy here, pay here loans originated during 2010 was approximately $9,375.
Our automotive locations experience seasonality as automobile sales peak during the first quarter of each year, primarily as a result of the receipt by customers of their income tax refunds, which are used as down payments for a vehicle. Automobile sales in the final three quarters are generally lower than the first quarter. In addition, vehicle acquisition costs tend to increase in the second half of the year as companies build inventories for the expected first quarter volumes.
7
Table of Contents
Locations
The following table shows the number of short-term lending branches by state that were open as of December 31 from 2006 to 2010 and the current fee rate charged to customers within each state for a $100 advance.
| Fee(a) | 2006 | 2007 | 2008 | 2009 | 2010 | |||||||||||||||||||
| Alabama |
$ | 17.50 | 13 | 12 | 12 | 12 | 12 | |||||||||||||||||
| Arizona |
(b) | 40 | 39 | 39 | 36 | 25 | ||||||||||||||||||
| California |
17.65 | 91 | 82 | 81 | 77 | 76 | ||||||||||||||||||
| Colorado |
(c) | 11 | 11 | 11 | 11 | 11 | ||||||||||||||||||
| Idaho |
20.00 | 14 | 13 | 14 | 15 | 16 | ||||||||||||||||||
| Illinois |
(d) | 22 | 24 | 24 | 24 | 24 | ||||||||||||||||||
| Indiana |
15.00 | 7 | 1 | 1 | 1 | 1 | ||||||||||||||||||
| Kansas |
15.00 | 24 | 23 | 21 | 21 | 21 | ||||||||||||||||||
| Kentucky |
17.65 | 13 | 13 | 13 | 11 | 11 | ||||||||||||||||||
| Louisiana |
20.12 | 4 | 4 | 4 | 4 | 4 | ||||||||||||||||||
| Mississippi |
21.95 | 7 | 7 | 7 | 7 | 7 | ||||||||||||||||||
| Missouri |
20.00 | 97 | 101 | 107 | 105 | 103 | ||||||||||||||||||
| Montana |
(e) | 3 | 3 | 4 | 4 | 1 | ||||||||||||||||||
| Nebraska |
17.65 | 12 | 11 | 9 | 9 | 8 | ||||||||||||||||||
| Nevada |
18.90 | 5 | 9 | 9 | 7 | 7 | ||||||||||||||||||
| New Mexico |
(d) | 21 | 21 | 20 | 18 | 18 | ||||||||||||||||||
| Ohio |
(c) | 31 | 32 | 18 | 18 | 17 | ||||||||||||||||||
| Oklahoma |
15.00 | 24 | 23 | 23 | 20 | 19 | ||||||||||||||||||
| Oregon |
(e) | 11 | ||||||||||||||||||||||
| South Carolina |
15.00 | 62 | 62 | 62 | 62 | 56 | ||||||||||||||||||
| Texas |
(f) | 26 | 27 | 27 | 16 | 16 | ||||||||||||||||||
| Utah |
20.00 | 19 | 19 | 19 | 19 | 19 | ||||||||||||||||||
| Virginia |
(c) | 23 | 23 | 22 | 20 | 18 | ||||||||||||||||||
| Washington |
15.00 | 26 | 29 | 31 | 32 | 26 | ||||||||||||||||||
| Wisconsin |
22.00 | 7 | 7 | 7 | 7 | 7 | ||||||||||||||||||
| Total(g) |
613 | 596 | 585 | 556 | 523 | |||||||||||||||||||
| (a) | Represents the loan fee for the first $100 advance for 14 days as of December 31, 2010. Some states have lower fees for loans in excess of $100. |
| (b) | The payday loan law expired in Arizona on June 30, 2010. We operate under the title loan law, which provides for a fee of $17 per $100 for loans less than $500 and then lower rates for amounts borrowed in excess of $500. |
| (c) | For these states, the loan fee is less than $1.75 per $100 for a 14 day advance. These branches, however, may also earn other fees such as check cashing, origination, documentation and maintenance fees. |
| (d) | In our branches in Illinois and New Mexico, we primarily provide installment loans to customers. The installment loans are payable in monthly installments (principal plus accrued interest) with terms ranging from four months to one year. The fee charged for an installment loan varies based on the amount and term of the loan, but generally approximates $30 per $100 per month. |
| (e) | For these states, the loan fee is less than $1.38 per $100 for a 14 day advance. Because there are no additional fees that may be charged to the customer, we closed or have decided to close our branches located in these states. |
8
Table of Contents
| (f) | In Texas, our CSO charges $20 per $100 for arranging for an unrelated third-party to make a loan to the consumer and for providing related services to the consumer, including a guarantee of the consumer’s obligation to the third-party lender. |
| (g) | For 2010, the total includes 21 branches (primarily in Arizona, Washington and South Carolina) that are scheduled to close during first half of 2011. |
We generally choose branch locations in high traffic areas providing visible signage and easy access for customers. Branches are generally in small strip-malls or stand-alone buildings. We identify de novo branch locations using a combination of market analysis, field surveys and our own site-selection experience.
Our branch interiors are designed to provide a pleasant, friendly environment for customers and employees. Branch hours vary by market based on customer demand, but generally branches are open from 9:00 a.m. to 7:00 p.m., Monday through Friday, with shorter hours on Saturdays. Branches are generally closed on Sundays.
Our branches located in the states of Missouri, California, Kansas and Illinois represented approximately 30%, 15%, 10% and 6%, respectively, of total revenues for the year ended December 31, 2010. Our branches located in the states of Missouri, California, Kansas, Illinois and New Mexico represented approximately 34%, 15%, 10%, 8% and 5%, respectively, of total branch gross profit for the year ended December 31, 2010. We are subject to regulation by federal and state governments that affects the products and services we provide, particularly payday loans. To the extent that laws and regulations are passed that affect our ability to offer payday loans or the manner in which we offer payday loans in any one of those states, our financial position, results of operations and cash flows could be adversely affected. For example, amendments to the South Carolina and Washington law became effective January 1, 2010. Prior to the new laws in Washington and South Carolina, revenues from each state represented approximately 7% and 5%, respectively, of our total revenues. For the year ended December 31, 2010, compared to the same period in 2009, revenues from South Carolina and Washington declined by $6.8 million and $3.7 million, respectively, and gross profit declined by $5.4 million and $2.6 million, respectively. Similarly, the Arizona payday loan statutory authority expired by its terms on June 30, 2010, and the termination of this law has had an adverse effect on our revenues and profitability. For the year ended December 31, 2010, revenues and gross profit from our Arizona branches declined by $6.9 million and $5.4 million, respectively, from the same period in the prior year. A new law becomes effective in Illinois in March 2011 that includes, among other things, limitations on the number of loans a customer may have at one time throughout the state. This type of customer restriction, when passed in other states such as Washington, South Carolina and Kentucky, has resulted in a 30% to 60% decline in annual revenues depending on the types of alternative products that competitors may offer within the state.
9
Table of Contents
Comparable Branches, De Novo Branch Economics and Acquisitions
We evaluate our branches based on revenue growth and branch gross profit, with consideration given to the length of time a branch has been open. The following table summarizes our revenues and average revenue per branch per month for the years ended December 31, 2009 and 2010 based on the year that a branch was opened or acquired. Note the table excludes 21 branches that are scheduled to close during first half of 2011.
| Year Opened/Acquired |
Number of Branches |
Revenues | Average Revenue/Branch/Month | |||||||||||||||||||||
| 2009 | 2010 | % Change | 2009 | 2010 | ||||||||||||||||||||
| (in thousands) | (in thousands) | |||||||||||||||||||||||
| Financial Services: |
||||||||||||||||||||||||
| Pre - 1999 |
33 | $ | 22,845 | $ | 20,917 | (8.4 | )% | $ | 58 | $ | 53 | |||||||||||||
| 1999 |
36 | 18,139 | 16,529 | (8.9 | )% | 42 | 38 | |||||||||||||||||
| 2000 |
45 | 19,617 | 18,843 | (3.9 | )% | 36 | 35 | |||||||||||||||||
| 2001 |
29 | 12,859 | 10,638 | (17.3 | )% | 37 | 31 | |||||||||||||||||
| 2002 |
49 | 19,593 | 16,861 | (13.9 | )% | 33 | 29 | |||||||||||||||||
| 2003 |
39 | 14,612 | 11,423 | (21.8 | )% | 31 | 24 | |||||||||||||||||
| 2004 |
55 | 18,303 | 16,028 | (12.4 | )% | 28 | 24 | |||||||||||||||||
| 2005 |
124 | 38,370 | 36,002 | (6.2 | )% | 26 | 24 | |||||||||||||||||
| 2006 |
64 | 18,865 | 13,332 | (29.3 | )% | 25 | 17 | |||||||||||||||||
| 2007 |
16 | 5,355 | 4,973 | (7.1 | )% | 28 | 26 | |||||||||||||||||
| 2008 |
10 | 2,773 | 2,173 | (21.7 | )% | 23 | 18 | |||||||||||||||||
| 2009 |
1 | 24 | 182 | (b) | 2 | 15 | ||||||||||||||||||
| 2010 |
1 | 148 | (b) | 12 | ||||||||||||||||||||
| Sub-total |
502 | 191,355 | 168,049 | (12.2 | )% | $ | 32 | $ | 28 | |||||||||||||||
| Consolidated branches(a) |
264 | |||||||||||||||||||||||
| Automotive |
15,293 | 19,914 | ||||||||||||||||||||||
| Other |
122 | 125 | ||||||||||||||||||||||
| Total |
$ | 207,034 | $ | 188,088 | (9.2 | )% | ||||||||||||||||||
| (a) | Amounts represent branches that were consolidated into nearby branches and therefore were not reported as discontinued operations. |
| (b) | Not meaningful. |
10
Table of Contents
The following table summarizes our gross profit (loss), gross margin (gross profit as a percentage of revenues) and loss ratio (losses as a percentage of revenues) of branches for the years ended December 31, 2009 and 2010 based on the year that a branch was opened or acquired. Note the table excludes 21 branches that are scheduled to close during first half of 2011.
| Year Opened/Acquired |
Branches | Gross Profit (Loss) | Gross Margin % | Loss Ratio | ||||||||||||||||||||||||
| 2009 | 2010 | 2009 | 2010 | 2009 | 2010 | |||||||||||||||||||||||
| (in thousands) | ||||||||||||||||||||||||||||
| Financial Services: |
||||||||||||||||||||||||||||
| Pre - 1999 |
33 | $ | 11,758 | $ | 10,040 | 51.5 | % | 48.0 | % | 17.6 | % | 18.8 | % | |||||||||||||||
| 1999 |
36 | 7,657 | 6,506 | 42.2 | % | 39.4 | % | 18.1 | % | 17.7 | % | |||||||||||||||||
| 2000 |
45 | 8,175 | 7,885 | 41.7 | % | 41.8 | % | 22.2 | % | 21.8 | % | |||||||||||||||||
| 2001 |
29 | 5,981 | 3,835 | 46.5 | % | 36.1 | % | 18.4 | % | 23.0 | % | |||||||||||||||||
| 2002 |
49 | 7,554 | 6,016 | 38.6 | % | 35.7 | % | 24.0 | % | 21.9 | % | |||||||||||||||||
| 2003 |
39 | 5,359 | 3,576 | 36.7 | % | 31.3 | % | 23.9 | % | 20.2 | % | |||||||||||||||||
| 2004 |
55 | 7,247 | 5,649 | 39.6 | % | 35.2 | % | 16.9 | % | 16.8 | % | |||||||||||||||||
| 2005 |
124 | 12,545 | 10,602 | 32.7 | % | 29.4 | % | 21.9 | % | 21.2 | % | |||||||||||||||||
| 2006 |
64 | 6,128 | 1,833 | 32.5 | % | 13.7 | % | 23.6 | % | 24.4 | % | |||||||||||||||||
| 2007 |
16 | 1,266 | 1,299 | 23.6 | % | 26.1 | % | 31.7 | % | 25.3 | % | |||||||||||||||||
| 2008 |
10 | 819 | 453 | 29.5 | % | 20.9 | % | 22.4 | % | 17.1 | % | |||||||||||||||||
| 2009 |
1 | (45 | ) | 11 | (c) | 6.0 | % | 54.4 | % | 34.3 | % | |||||||||||||||||
| 2010 |
1 | (25 | ) | (34 | ) | (c) | 27.4 | % | ||||||||||||||||||||
| Sub-total |
502 | 74,419 | 57,671 | 38.9 | % | 34.3 | % | 21.2 | % | 20.7 | % | |||||||||||||||||
| Consolidated branches(a) |
(256 | ) | (32 | ) | ||||||||||||||||||||||||
| Automotive |
(252 | ) | 2,891 | (1.6 | )% | 14.5 | % | 36.5 | % | 21.8 | % | |||||||||||||||||
| Other(b) |
2,572 | 3,030 | ||||||||||||||||||||||||||
| Total |
$ | 76,483 | $ | 63,560 | 36.9 | % | 33.8 | % | 21.3 | % | 20.1 | % | ||||||||||||||||
| (a) | Amounts represent branches that were consolidated into nearby branches and therefore were not reported as discontinued operations. |
| (b) | Includes the receipt of cash from the sale of older debt for approximately $972,000 and $494,000 for the years ended December 31, 2009 and 2010, respectively. |
| (c) | Not meaningful. |
Comparable Branches
We define comparable branches as those branches that were open during the full periods for which a comparison is being made. For example, comparable branches for the annual analysis as of December 31, 2010 have been open at least 24 months. As of December 31, 2010, all but two of our branches are comparable branches. We evaluate changes in comparable branch financial metrics on a routine basis to assess operating efficiency. During 2010, our revenues from comparable branches declined by 12.3%. This decrease reflects reduced customer demand across most states.
De Novo Branches
Since 1998, 65% of our growth has occurred through opening 445 de novo branches. De novo growth allows us to leverage our regional, area and branch managers’ knowledge of their local markets to identify strong prospective branch locations and to train managers and employees at the outset on our strategy and procedures. We monitor newer branches for their progress to profitability and loan growth. On average, our newer branches will become cumulatively cash flow positive after 18 to 24 months of operations, with revenues growing to between $250,000 and $300,000 during the second year.
11
Table of Contents
Acquisitions
From 1998 through 2010, we acquired 241 short-term lending branches. We review and evaluate acquisitions as they are presented to us. Because of our position in the industry, potential sellers have offered to sell to us from as few as one branch to groups of 100 branches or more. During 2007, we acquired 13 branches and certain assets for a total of $3.2 million. In connection with an acquisition of eight branches in Missouri, we closed six of the branches acquired and transferred the receivable balances to our existing locations. In December 2006, we acquired all the issued and outstanding membership interests in ECA for approximately $16.3 million, net of cash acquired. As of December 31, 2010, ECA operates 46 payday loan branches in South Carolina.
In September 2007, we purchased certain assets from an automobile retailer and finance company focused exclusively on the buy here, pay here segment of the used vehicle market for a total of $375,000. In January 2009, we purchased two buy here, pay here locations in Missouri for approximately $4.2 million. These locations sell used vehicles and earn finance charges from the related vehicle financing contracts.
We intend to continue to evaluate acquisition opportunities presented to us in the buy here, pay here segment of the used car market.
Advertising and Marketing
Our advertising and marketing efforts are designed to build customer loyalty and introduce new customers to our services. Our corporate marketing function is focused on strategically positioning us as a leader in the payday lending marketplace as well as creating awareness of our Kansas City automotive locations. Our marketing department oversees direct mail offerings to current, former and prospective customers, as well as engages in building and supervising branch-level marketing programs. Branch-level efforts include flyers, coupons, special offers, local direct mail, radio, television or outdoor advertising. In conjunction with marketing partners, we develop promotional materials, and maintain a considerable presence in Yellow Page directories throughout the country. In addition, we spent $1.5 million during 2007 and $686,000 during 2008 as a part of a national public education and awareness program developed by the CFSA to promote responsible borrowing and lending practices.
Technology
We maintain an integrated system of applications and platforms for transaction processing. The systems provide customer service, internal control mechanisms, compliance monitoring, record keeping and reporting. We have one primary point-of-sale system utilized by the majority of our branches as of December 31, 2010. We work closely with our point-of-sale software vendor to enhance and continually update the application. In our Virginia branches, we utilize a second point-of-sale system that can accommodate the open-end credit product. For our buy here, pay here locations, we implemented a separate system that manages the automobile business.
Our systems provide our branches with customer information and history to enable our customer service representatives to perform transactions in an efficient manner. The integration of our systems allows for the accurate and timely reporting of information for corporate and field administrative staff. Information is distributed from our point-of-sale system to our corporate accounting systems to provide for daily reconciliation and exception alerts.
On a daily basis, transaction data is collected at our corporate headquarters and integrated into our management information systems. These systems are designed to provide summary, detailed and exception information to regional, area and branch managers as well as corporate staff. Reporting is separated by areas of operational responsibility and accessible through internet connectivity.
12
Table of Contents
Security
The principal security risks to our operations are theft or improper use of personal consumer data, robbery and employee theft. We have put in place extensive branch security systems, technology security measures, dedicated security personnel and management information systems to address these areas of potential loss.
We store and process large amounts of personally identifiable information, that consists primarily of customer information. We utilize a range of technology solutions and internal controls and procedures, including data encryption, two-factor authentication, secure tunneling and intrusion prevention systems, to protect and restrict access to and use of personal consumer data.
To protect against robbery, the majority of our branch employees work behind bullet-resistant glass and steel partitions, and the back office, safe and computer areas are locked and closed to customers. Our security measures in each branch include safes, electronic alarm systems monitored by third parties, control over entry to customer service representative areas, detection of entry through perimeter openings, walls and ceilings and the tracking of all employee movement in and out of secured areas. Employees use cellular phones to ensure safety and security whenever they are outside the secure customer service representative area. Additional security measures include remote control over alarm systems, arming/disarming and changing user codes and mechanically and electronically controlled time-delay safes.
Because we have high volumes of cash and negotiable instruments at our locations, daily monitoring, unannounced audits and immediate response to irregularities are critical. We have an internal auditing department that, among other things, performs periodic unannounced branch audits and cash counts at randomly selected locations. We self-insure for employee theft and dishonesty at the branch level.
Competition
Payday Loan Industry
We believe that the primary competitive factors in the payday loan industry are branch location and customer service. In addition to storefront payday loan locations, we also currently compete with services such as overdraft protection offered by traditional financial institutions, payday loan-type products offered by some banks and credit unions, and other financial service entities and retail businesses that offer payday loans or other similar financial services, as well as a growing internet-based payday loan segment. Some of our competitors have larger and more established customer bases and substantially greater financial, marketing and other resources than we have.
Buy Here, Pay Here Industry
The used automobile retail industry is highly competitive and fragmented. We compete principally with other independent buy here, pay here dealers, and to a lesser degree with (i) the used vehicle retail operations of franchised automobile dealerships, (ii) independent used vehicle dealers, and (iii) individuals who sell used vehicles in private transactions. We compete for both the purchase and resale of used vehicles.
We believe the principal competitive factors in the sale of used vehicles include (i) the availability of financing to consumers with limited credit histories or past credit problems, (ii) the breadth and quality of vehicle selection, (iii) pricing, (iv) the convenience of a dealership’s location, (v) limited warranty and (vi) customer service. We believe that our buy here, pay here locations are competitive in each of these areas.
Regulations
We are subject to regulation by federal, state and local governments, which affects the products and services we provide. In general, these regulations are designed to protect consumers who deal with us and not to protect our stockholders.
13
Table of Contents
Regulation of Short-term Lending
Our payday lending and other consumer lending activities are subject to regulation and supervision primarily at the state and federal levels. In those jurisdictions where we make consumer loans directly to consumers (currently all states in which we operate other than Texas), we are licensed as a payday, title and installment lender where required and are subject to various state regulations regarding the terms of our payday loans and our policies, procedures and operations relating to those loans. In some states, payday lending is referred to as deferred presentment, deferred deposit or consumer installment loans. Typically, state regulations limit the amount that we may lend to any consumer and, in some cases, the number of loans or transactions that we may make to any consumer at one time or in the course of a year. These state regulations also typically restrict the amount of finance or service charges or fees that we may assess in connection with any loan or transaction and may limit a customer’s ability to renew a loan. We must also comply with the disclosure requirements of the Federal Truth-In-Lending Act and Regulation Z promulgated by the Board of Governors of the Federal Reserve System pursuant to that Act, as well as the disclosure requirements of state statutes (which are usually similar or more extensive then federal disclosure requirements). The state statutes also often specify minimum and maximum maturity dates for payday loans and, in some cases, specify mandatory cooling-off periods between transactions. Our collection activities regarding past due loans may also be subject to consumer protection laws and regulations relating to debt collection practices adopted by the various states, and some states restrict the content of advertising regarding our payday loan activities. Additionally, we are subject to the Equal Credit Opportunity Act, the Gramm-Leach-Bliley Act, and with respect to our credit services agreement with a third-party lender, the Fair Debt Collection Practices Act.
During the last few years, legislation has been introduced in the U.S. Congress and in certain state legislatures, and regulatory authorities have proposed or publicly addressed the possibility of proposing regulations, that would prohibit or severely restrict payday loans. In July 2010, the U.S. Congress enacted the Dodd-Frank Wall Street Reform and Consumer Protection Act. Among other things, this legislation establishes a Bureau of Consumer Financial Protection (CFPB), which will have broad regulatory powers over providers of consumer credit products in the United States such as those offered by us. The provisions of this legislation are in the early stages of implementation, and, to our knowledge, there presently are no CFPB proposed rules and regulations that specifically apply to payday lending. During 2009, payday loan-related legislation that severely restricts customer access to payday loans was passed in South Carolina, Washington, Virginia and Kentucky. These law changes adversely affected our revenues and operating income during 2010. In 2008, Ohio legislators passed a law that placed a 28% cap on payday loans, which is equivalent to a fee of approximately $1.07 per $100 borrowed. Absent additional transaction fees, this law would effectively precludes offering payday loans in Ohio. In October 2007, a new federal law prohibited loans of any type to members of the military and their family with charges in excess of 36% per annum. This federal legislation has the practical effect of banning payday lending to the military. In Oregon, a ballot initiative added a provision to the state constitution that also placed a 36% cap on payday loans, which went into effect July 1, 2007, effectively banning payday loans in Oregon as of that date. Similarly, a ballot initiative in Montana that took effect January 1, 2011, had the practical effect of severely limiting payday loans in that state.
We continue, with others in the payday loan industry, to inform and educate legislators and to oppose legislative or regulatory action that would prohibit or severely restrict payday loans. For example, it requires an approximate cost of $10 to $11 per $100 borrowed to operate a storefront location, exclusive of loan losses. As a result, in states where a 36% or lower cap is mandated, without additional fees, we are unable to operate at a profit. These types of legislative or regulatory actions have had and in the future could have a material adverse effect on our loan-related activities and revenues. Moreover, similar action by states where we are not currently conducting business could result in us having fewer opportunities to expand.
Prior to September 30, 2005, we originated payday loans at all of our locations, except for branches in North Carolina and Texas. In North Carolina, prior to the closure of our North Carolina branches during October and November 2005, we had an arrangement with a Delaware state-chartered bank to originate and service payday loans for that bank in North Carolina. We entered into the arrangement with the bank in April 2003. Under the
14
Table of Contents
terms of the agreement, we marketed and serviced the bank’s loans in North Carolina, and the bank sold to us a pro rata participation in loans that were made to its borrowers. In September 2005, we terminated the arrangement with the bank.
In February 2005, we entered into a separate arrangement with a different Delaware state-chartered bank to originate and service payday loans for that bank in Texas. In September 2005, we terminated the arrangement and began operating as a credit services organization in our Texas branches. The two Delaware banks for which we previously acted as a marketer and servicing provider are subject to supervision and regular examinations by the Delaware Office of the State Bank Commissioner and the FDIC. The decision to close our branches in North Carolina and to terminate our agreement with the Delaware bank offering loans in Texas reflected the difficult operating environment associated with guidelines issued by the FDIC. In July 2003, the FDIC issued guidelines governing permissible arrangements between a state-chartered bank and a marketer and servicing provider of the bank’s payday loans. In March 2005, the FDIC issued revised guidelines. The revised FDIC guidelines also imposed various limitations on bank payday loans, which effectively limited the benefits of the bank agency model in places like North Carolina and Texas. In February 2006, the FDIC reportedly advised FDIC-insured banks that they could no longer offer payday loans through marketing and servicing agents.
As a result of our prior arrangements with the two Delaware banks, our activities regarding loans made by those banks are also subject to examination by the FDIC and the other regulatory authorities to which the banks are subject. To the extent an examination involves review of those loans and related processes, the regulatory authority may require us to provide requested information and to grant access to our pertinent locations, personnel and records.
Regulation of Credit Services Organization
We are subject to regulation in Texas with respect to our CSO under Chapter 393 of the Texas Finance Code, which requires the registration of our CSO with the secretary of state. We are required to update our registration statement on an annual basis. We must also comply with various disclosure requirements, which include providing the consumer with a disclosure statement and contract that detail the services to be performed by the CSO and the total cost of those services along with various other items. In addition, our CSO is required to obtain a credit service organization bond and a third-party collector bond for each branch in Texas in the amount of $10,000 each from a surety company authorized to do business in Texas.
Regulation of Check Cashing
We are subject to regulation in several jurisdictions in which we operate that require the registration or licensing of check cashing companies or regulate the fees that check cashing companies may impose. Some states require fee schedules to be filed with the state, while others require the conspicuous posting of the fees charged for cashing checks at each branch. In other states, check cashing companies are required to meet minimum bonding or capital requirements and are subject to record-keeping requirements. We are licensed in each of the states or jurisdictions in which a license is currently required for us to operate as a check cashing company and have filed our schedule of fees with each of the states or other jurisdictions in which such a filing is required. To the extent those states have adopted ceilings on check cashing fees, the fees we currently charge are at or below the maximum ceiling.
Regulation of Money Transmission and Sale of Money Orders
We are subject to regulation in several jurisdictions in which we operate that (1) require the registration or licensing of money transmission companies or companies that sell money orders and (2) regulate the fees that such companies may impose. In some states, companies engaged in the money transmission business are required to meet minimum bonding or capital requirements, are prohibited from commingling the proceeds from the sale of money orders with other funds and are subject to various record-keeping requirements. We are licensed in
15
Table of Contents
each of the states or jurisdictions in which a license is currently required for us to operate as a money transmitter. In some states we act as agent for Western Union in the sale of money orders. Certain states, including California where we operate 76 branches, have enacted so-called “prompt remittance” statutes, which specify the maximum time for payment of proceeds from the sale of money orders to the recipient of the money orders. These statutes limit the number of days, known as the “float,” that we have use of the money from the sale of a money order.
Buy Here, Pay Here Regulation
Each of our automobile sale locations is licensed to sell automobiles by the state of Kansas or Missouri, as applicable. In addition, state laws limit the maximum interest rate we can charge consumers on the automobile loans. We must also comply with the disclosure requirements of the Federal Truth-In-Lending Act and Regulation Z promulgated by the Board of Governors of the Federal Reserve System pursuant to that Act, as well as the disclosure requirements of certain state statutes (which are usually similar or equivalent to those federal disclosure requirements). Our collection activities regarding past due loans may also be subject to consumer protection laws and regulations relating to debt collection practices adopted by the various states. The limited warranties we provide on most of the used automobiles we sell are subject to federal regulation under the Magnuson-Moss Warranty Act. That law governs the disclosure requirements for warranty coverage and our duties in honoring those warranties.
Currency Reporting Regulation
Regulations promulgated by the United States Department of the Treasury under the Bank Secrecy Act require reporting of transactions involving currency in an amount greater than $10,000. In general, every financial institution must report each deposit, withdrawal, exchange of currency or other payment or transfer that involves currency in an amount greater than $10,000. In addition, multiple currency transactions must be treated as a single transaction if the financial institution has knowledge that the transactions are by, or on behalf of, any one person and result in either cash in or cash out totaling more than $10,000 during any one business day. In addition, the regulations require institutions to maintain information concerning sales of monetary instruments for cash amounts between $3,000 and $10,000. The records maintained must contain certain information about the purchaser, with different requirements for transactions involving customers with deposit accounts and those without deposit accounts. The rule states that no sale may be completed unless the required information is obtained. We believe that our point-of-sale system, employee training programs and internal control processes support our compliance with these regulatory requirements.
Also, money services businesses are required by the Money Laundering Act of 1994 to register with the United States Department of the Treasury. Money services businesses include check cashers and sellers of money orders. Money services businesses must renew their registrations every two years, maintain a list of their agents, update the agent list annually and make the agent list available for examination. In addition, the Bank Secrecy Act requires money services businesses to file a Suspicious Activity Report for any transaction conducted or attempted involving amounts individually or in total equaling $2,000 or greater, when the money services business knows or suspects that the transaction involves funds derived from an illegal activity, the transaction is designed to evade the requirements of the Bank Secrecy Act or the transaction is considered so unusual that there appears to be no reasonable explanation for the transaction.
The USA PATRIOT Act includes a number of anti-money laundering measures designed to prevent the banking system from being used to launder money and to assist in the identification and seizure of funds that may be used to support terrorist activities. The USA PATRIOT Act includes provisions that directly impacts check cashers and other money services businesses. Specifically, the USA PATRIOT Act requires all check cashers to establish certain programs to identify accurately the individual conducting the transaction and to detect and report money-laundering activities to law enforcement. We have established various procedures and continue to monitor and evaluate any such transactions and believe we are in compliance with the USA PATRIOT Act.
16
Table of Contents
Privacy Regulation
We are subject to a variety of federal and state laws and regulations restricting the use and seeking to protect the confidentiality of the customer identity and other personal customer information. We have identified our systems that capture and maintain non-public personal information, as that term is used in the privacy provisions of the Gramm-Leach-Bliley Act and its implementing federal regulations. We disclose our public information policies to our customers as required by that law. We have systems in place intended to safeguard this information as required by the Gramm-Leach-Bliley Act.
Zoning and Other Local Regulation
We are also subject to increasing levels of zoning and other local regulations, such as regulations affecting the granting of business licenses. Certain municipalities have used or are attempting to use these types of regulatory authority to restrict the growth of the payday loan industry. These zoning and similar local regulatory actions can affect our ability to expand in that municipality and may affect a seller’s ability to transfer licenses or leases to us in conjunction with an acquisition.
Employees
On December 31, 2010, we had 1,681 employees, consisting of 1,445 branch personnel, 118 field managers and 118 corporate office employees.
We believe our relationship with our employees is good, and we have not suffered any work stoppages or labor disputes. We do not have any employees that operate under a collective bargaining agreement.
Available Information
We file annual and quarterly reports, proxy statements, and other information with the United States Securities and Exchange Commission, copies of which can be obtained from the SEC’s Public Reference Room at 100 F Street, N.E., Washington, D.C. 20549. Information on the operation of the Public Reference Room can be obtained by calling the SEC at 1-800-SEC-0330.
Reports we file electronically with the SEC via the SEC’s Electronic Data Gathering, Analysis and Retrieval system (EDGAR) may be accessed through the Internet. The SEC maintains an Internet site that contains reports, proxy and information statements, and other information regarding issuers that file electronically with the SEC, at www.sec.gov. We make available free of charge our annual reports on Form 10-K, quarterly reports on Form 10-Q, current reports on Form 8-K, amendments to those reports and our proxy statement on our website at www.qcholdings.com as soon as reasonably practical after each filing has been made with, or furnished to, the SEC. The SEC filings and additional information about QC Holdings, Inc. can be obtained under the “Investment Center” section of our website. The contents of these websites are not incorporated into this report. Further, our references to the URL’s for these websites are intended to be inactive textual references only.
| ITEM 1A. | Risk Factors |
The payday loan industry is highly regulated under state laws. Changes in state laws governing lending practices could negatively affect our business revenues and earnings.
Our business is regulated under numerous state laws and regulations, which are subject to change and which may impose significant costs or limitations on the way we conduct or expand our business. As of December 31, 2010, 34 states and the District of Columbia had legislation permitting or not prohibiting payday loans. The remaining 16 states did not have laws specifically authorizing the payday loan business or have laws that effectively preclude us from offering the payday loan product by capping the interest fee we can earn at an annual percentage rate of 36% or lower, which makes offering the payday product in those states unprofitable. During 2010, we made payday loans directly in 23 of these 34 states. In addition, in Texas we operate as a credit services organization, assisting our customers in Texas in obtaining loans from an unrelated third-party lender.
17
Table of Contents
During the last few years, legislation has been adopted in some states in which we operate or operated that prohibits or severely restricts payday loans. For example, legislation that prohibits or severely restricts payday loans has been adopted in South Carolina (2009), Washington (2009), Kentucky (2009), Ohio (2008), Virginia (2008), New Mexico (2007), Oregon (2006 via a ballot initiative) and Illinois (2005). Some states, including Mississippi and Arizona, which are states in which we operate, have sunset provisions in their payday loan laws that require renewal of the laws by the state legislatures at periodic intervals. The Arizona payday loan statutory authority expired by its terms on June 30, 2010 and the termination of this law had a significant adverse effect on our revenues and profitability for the year ended December 31, 2010. In February 2011, the sunset provision of the Mississippi payday loan law was extended from July 1, 2012 to July 1, 2015.
In recent years, including 2010, more than 200 bills have been introduced in state legislatures nationwide, including bills in virtually every state in which we are doing business, to revise the current law governing payday loans in that state. In certain instances, the bills, if adopted, would effectively prohibit payday loans in that state. In other instances, the bills, if adopted, would amend the payday loan laws in ways that would adversely affect our revenues and earnings in that state. Any of these bills, or future proposed legislation or regulations prohibiting payday loans or making them less profitable or unprofitable, could be passed in any of these states at any time, or existing payday loan laws could expire or be amended. Legislative changes (or failures to extend payday lending laws) have had a significant adverse effect on our business, revenues and earnings in New Mexico, Arizona, Washington, South Carolina, Illinois, Virginia and certain other states in recent years.
In addition, state laws can be changed by ballot initiative or referendum in certain states. Ballot initiatives in Oregon and Montana have precluded payday lending on profitable terms in those states, thus effectively prohibiting payday lending in those states. After those measures were passed, we closed all our branches in those states. Ballot initiatives can also be expensive to oppose and are more susceptible to emotion than deliberations in the normal legislative process. For example, we spent approximately $1.8 million related to ballot initiatives in 2008, including referendums designed to enhance greater consumer choices in certain states.
Changes in state regulations or interpretations of state laws and regulations governing lending practices could negatively affect our business, revenues and earnings, and the costs of regulatory compliance are increasing.
Statutes authorizing payday loans typically provide state agencies that regulate banks and financial institutions with significant regulatory powers to administer and enforce the law. Under statutory authority, state regulators have broad discretionary power and may impose new licensing requirements, interpret or enforce existing regulatory requirements in different ways or issue new administrative rules, even if not contained in state statutes, that affect the way we do business and may force us to terminate or modify our operations in particular states. They may also impose rules that are generally adverse to our industry. Furthermore, to the extent that a state determined that our lack of compliance warranted termination of our license, we would be precluded from operating in that state and may be required to report that license termination to other states pursuant to notification requirements or upon the licensing renewal process in those other states.
States have generally increased their regulatory and compliance requirements for payday loans in recent years, and our branches are subject to examination by state regulators in most states. We have taken or been required to take certain corrective actions as a result of self-audits or state audits of our branches and the level of regulation and compliance costs have increased and we anticipate that they will continue to increase.
Additionally, in many states, the attorney general has scrutinized or continues to scrutinize the payday loan statutes and the interpretations of those statutes. For instance, in September 2005, the New Mexico Attorney General promulgated regulations (later withdrawn) that would have had the practical effect of limiting the fees and interest on payday loans to 54% per annum, thus effectively prohibiting payday lending in New Mexico. Similarly, in December 2009, the Arizona Attorney General filed a lawsuit against us in Arizona state court alleging that we violated various state consumer protection statutes.
18
Table of Contents
Until November 2005, we marketed and serviced payday loans for a lending bank in North Carolina. In November 2005, we ceased marketing those loans and ceased operations in North Carolina. Although we were not a party to the proceeding, the North Carolina Commissioner of Banks issued a Notice of Hearing to Advance America, Cash Advance Centers of North Carolina, Inc. (Advance America) on February 1, 2005. In December 2005, the Commissioner of Banks issued a ruling in this matter in which the Commission determined that Advance America, which marketed, originated, serviced and collected payday loans on behalf of a state-chartered bank located in Kentucky, violated the North Carolina Consumer Finance Act and the North Carolina Check Cashers Act and ordered Advance America to cease further operations of its payday loan stores in North Carolina to the extent they make loans on behalf of a lending bank.
Future interpretations of state law in other jurisdictions or promulgation of regulations or new interpretations, similar to the prior actions in New Mexico or the ruling by the North Carolina Commissioner of Banks, could have an adverse impact on our ability to offer payday loans in those states and an adverse impact on our earnings.
The payday loan industry is regulated under federal law. Changes in federal laws and regulations governing lending practices could negatively affect our business.
In the past few years, the focus of proposed federal legislation has been overall financial services reform, including a particular focus on consumer financial services. In July 2010, the Dodd-Frank Wall Street Reform and Consumer Protection Act was signed into law. Among other things, this act creates a new Bureau of Consumer Financial Protection within the Federal Reserve, which is empowered to promulgate new consumer protection regulations and enforce consumer protection laws. The bureau will have broad rule-making authority for a wide range of consumer protection laws that apply to financial services companies like us, including the authority to prohibit “unfair, deceptive or abusive” acts and practices. Many aspects of the Dodd-Frank Act are subject to rulemaking and will take effect over several years, making it difficult to anticipate the overall financial impact on us. Compliance with this new law and the bureau’s anticipated future regulations will likely result in additional operating costs that could have a material adverse effect on our financial condition and results of operations. Until the bureau has become operational and begins to propose rules and regulations that apply to our activities, it is not possible to predict what effect the bureau will have on our business. Moreover, the Dodd-Frank Act permits states to adopt stricter consumer protection laws and state attorney generals may enforce consumer protection rules issued by the bureau.
Although states provide the primary regulatory framework under which we offer payday loans, certain federal laws (in addition to the Dodd-Frank Act) also affect our business. For example, because payday loans are viewed as extensions of credit, we must comply with the federal Truth-in-Lending Act and Regulation Z adopted under that Act. Additionally, we are subject to the Equal Credit Opportunity Act, the Gramm-Leach-Bliley Act, and with respect to our CSO business in Texas, the Fair Debt Collection Practices Act. These regulations also apply to any lender with which we do business in Texas through our credit services organization business. A failure to comply with any of these federal laws and regulations could have a material adverse effect on our business, results of operations and financial condition.
Additionally, anti-payday loan legislation, including 36% interest rate cap bills that would effectively prohibit payday lending, have been introduced in the U.S. Congress in the past. Earlier federal efforts culminated in federal legislation that limits the interest rate and fees that may be charged on any loans, including payday loans, to any person in the military to 36% per annum, which became effective October 1, 2007 and effectively bans payday lending to members of the military or their families. Future federal legislative or regulatory action that restricts or prohibits payday loans could have a material adverse impact on our business, results of operations and financial condition, and a 36% interest rate cap or similar federal limit, without the inclusion of meaningful fees, would effectively require us to cease our payday loan operations nationally.
19
Table of Contents
Litigation and regulatory actions directed toward our industry and us could adversely affect our operating results, particularly in certain key states.
During the last few years, our industry has been subject to regulatory proceedings, class action lawsuits and other litigation regarding the offering of payday loans, and we could suffer losses from interpretations of state laws in those lawsuits or regulatory proceedings, even if we are not a party to those proceedings. In recent years, we have experienced a higher number of purported class action lawsuits by our customers against us. We presently have pending against us purported class action lawsuits in North Carolina and Missouri, as well as attorney general or regulatory inquiries in Arizona and Ohio, as described under Item 3, “Legal Proceedings.” The consequences of an adverse ruling in any of the current cases or future litigation or proceedings could cause us to have to refund fees or interest collected on payday loans, to refund the principal amount of payday loans, to pay treble or other multiple damages, to pay monetary penalties or to modify or terminate our operations in particular states. We may also be subject to adverse publicity arising out of current or future litigation. Defense of these pending lawsuits is time consuming and expensive, and the defense of these or future lawsuits or proceedings, even if we are successful, could require substantial time and attention of our senior officers and other management personnel that would otherwise be spent on other aspects of our business and could require the expenditure of significant amounts for legal fees and other related costs. Any of these events could have a material adverse effect on our business, results of operations and financial condition.
Additionally, regulatory actions taken with respect to one financial service that we offer could negatively affect our ability to offer other financial services. For example, if we were the subject of regulatory action related to our check cashing, title loans or other products, that regulatory action could adversely affect our ability to maintain our licenses for payday lending. Moreover, the suspension or revocation of our license or other authorization in one state could adversely affect our ability to maintain licenses in other states. Accordingly, a violation of a law or regulation in otherwise unrelated products or jurisdictions could affect other parts of our business and adversely affect our business and operations as a whole.
The goal of our enterprise risk management efforts is not to eliminate all systemic risk.
We have devoted significant time and energy to develop our enterprise risk management program and expect to continue to do so in the future. The goal of enterprise risk management is not to eliminate all risk, but rather to identify, assess and rank risk. Nonetheless, our efforts to identify, monitor and manage risks may not be fully effective. Many of our methods of managing risk and exposures depend upon the implementation of state regulations and other policies or procedures affecting our customers or employees. Management of operational, legal and regulatory risks requires, among other things, policies and procedures, and these policies and procedures may not be fully effective in managing these risks.
While many of the risks that we monitor and manage are described in this Risk Factors section of this report, our business operations could also be affected by additional factors that are not presently described in this section or known to us or that we currently consider immaterial to our operations.
The concentration of our revenues and gross profits in certain states could adversely affect us.
Our branches operate in 24 states. For the year ended December 31, 2010, branches located in Missouri, California, Kansas and Illinois represented approximately 61% of our total revenues and 67% of our total gross profit. Revenues from branches located in Missouri and California represented 30% and 15%, respectively, of our total revenues for the year ended December 31, 2010. Gross profit from branches in Missouri and California represented 34% and 15%, respectively, of our total branch gross profit for the year ended December 31, 2010. While we believe we have a diverse geographic presence, for the near term we expect that significant revenues and gross profit will continue to be generated by certain states, largely due to the currently prevailing economic, demographic, regulatory, competitive and other conditions in those states. Changes to prevailing economic, demographic, regulatory or any other conditions, including the legislative, regulatory or litigation risks discussed above, in the markets in which we operate could lead to a reduction in demand for our payday loans, a decline in our revenues or an increase in our provision for doubtful accounts, any of which could result in a deterioration of
20
Table of Contents
our financial condition. For example, amendments to the South Carolina law and Washington law became effective January 1, 2010. In South Carolina, the maximum loan size was raised but the new law also created a database to enforce a one loan per customer limit. In Washington, amendments to its law became effective January 1, 2010, which created a database to enforce a one loan per customer limit and to place a usage limit on customers at eight loans per year. Prior to these new laws in South Carolina and Washington, revenues from each state were approximately 7% and 5%, respectively, of our total revenues. For the year ended December 31, 2010, revenues from South Carolina and Washington declined by $6.8 million and $3.7 million, respectively, and gross profit declined by $5.4 million and $2.6 million, respectively. Similarly, the Arizona payday loan statutory authority expired by its terms on June 30, 2010, and the termination of this law had a significant adverse effect on our revenues and profitability. For the year ended December 31, 2010, revenues and gross profit from the Arizona branches declined by $6.9 million and $5.4 million, respectively, from the same period in the prior year.
A new law becomes effective in Illinois in March 2011 that includes, among other things, limitations on the number of loans a customer may have at one time throughout the state. This type of customer restriction, when passed in other states such as Washington, South Carolina and Kentucky, has resulted in a 30% to 60% decline in annual revenues depending on the types of alternative products that competitors may offer within the state.
We lack product and business diversification. Accordingly, our future revenues and earnings are more susceptible to fluctuations than a more diversified company.
Our primary business activity is offering and servicing payday loans. We also provide certain related services, such as check cashing, title loans, installment loans, credit services, open-end credit, money transfers and money orders, which accounted for approximately 19.4% of our revenues in 2010. In 2007, we entered the buy here, pay here automobile business, but those revenues accounted for less than 11% of our total revenue in 2010. As noted above, with unfavorable legislative and regulatory changes, the revenues in our payday loan business are declining, which has adversely affected our overall revenues and earnings. Our lack of product and business diversification has and is likely to continue to inhibit the opportunities for growth of our business, revenues and profits.
Our inability to introduce or manage new products efficiently and profitably could have a material adverse effect on our business, results of operations and financial condition.
We continue to explore potential new products and businesses to serve our customers and to diversify our business. For example, in 2006 and 2007, we began offering installment loans in Illinois and New Mexico, respectively; and in October 2007, we opened our first buy here, pay here automobile sales and finance lot. New products in Illinois, New Mexico, as well as in Virginia and other states, have been in response to changes in payday loan laws in those states making payday lending unprofitable, and therefore not economically feasible, under current state law or regulations in those states. We also intend to introduce additional services and products in the future in order to continue to diversify our business. In order to offer new products and to enter into new businesses, we may need to comply with additional regulatory and licensing requirements. Each of these new products and businesses is subject to risk and uncertainty and requires significant investment of time and capital, including additional marketing expenses, legal costs, acquisition costs and other incremental start-up costs. Due to our lack of experience in offering certain new products and businesses, we may not be successful in identifying or introducing any new product or business in a timely or profitable manner. For example, we offered an open-end credit product to our Virginia customers for a brief period in 2008 and 2009, before discontinuing the product, and we have experienced significantly higher than anticipated loan losses associated with the open-end product. Furthermore, we cannot predict the demand for any new product or service. Our failure to introduce a new product or service efficiently and profitably or low customer demand for any of these new products or services, could have a material adverse effect on our business, results of operations and financial condition.
21
Table of Contents
General economic conditions affect our revenues and loan losses, and accordingly, our results of operations have been adversely affected by the general economic slowdown. The effect on our business of the recent credit crisis and ongoing economic recession is still continuing.
Provision for losses is one of our largest operating expenses, constituting 20.1% of total revenues for the year ended December 31, 2010, with payday loan losses constituting most of the losses. During each period, if a customer does not repay a payday loan when due and the check we present for payment is returned, all accrued fees, interest and outstanding principal are charged off as uncollectible. Any changes in economic factors that adversely affect our customers could result in a higher loan loss experience than anticipated, which could adversely affect our loan charge-offs and operating results. For example, we believe our loan losses increased during the second half of 2007 as a result of the turmoil in the sub-prime lending markets and its ripple effect throughout the United States economy. As another example, we believe that our loan loss experience in third quarter 2005 was adversely affected as a result of an increase in customer bankruptcies prior to a significant change in the bankruptcy laws in October 2005. Similar difficult financial and economic markets and conditions could increase our loan losses and adversely affect our results of operations and financial condition.
While our provision for losses in fourth quarter 2010 was less than our provision in fourth quarter 2009, it is difficult to predict the long-term impact of the national credit crisis and economic recession that occurred in late 2008 and the early part of 2009 on our customers and on our business. We experienced lower payday loan demand in 2009 than initially expected, which we believe is attributable in part to the reports nationally of overall consumer efforts to reduce debt. We believe our customers are more sophisticated than portrayed in the media by certain consumer groups and that our customers restrict borrowings in circumstances when risk of non-repayment is increased. We believe this has occurred when gasoline prices have spiked at various times over the last two years and also occurred in fourth quarter 2008 due to the national credit crisis. While the economic crisis of 2008 and 2009 appears to have passed, we believe that the continuing effects of that recession are adversely affecting our customers and their borrowing habits. As discussed under “Item 7, Management’s Discussion and Analysis of Financial Condition and Results of Operations,” we continued to experience lower payday loan volumes in 2010 (even in states that were not adversely affected by regulatory or legislative changes). We believe that this lower customer loan demand is directly related to the continuing effects of the 2008-09 recession in 2010. We believe these adverse economic pressures on our customers are continuing in 2011 and will continue for the foreseeable future, which has had, and is expected to continue to have, an adverse effect on our revenues and earnings.
Continuing disruptions in the credit markets from the national credit crisis are negatively affecting the availability and cost of commercial credit, which could adversely affect our future borrowing ability and costs.
We believe that disruptions in the capital and credit markets in 2008 and 2009 are continuing to adversely affect the availability and cost of commercial credit. In addition, uncertainty as to the economic recovery and changing and increased regulation coming out of the recession, including the Dodd-Frank Act, are additional disruptions to the capital and credit markets. These conditions could adversely affect our ability to refinance our existing revolving and term loan credit facility on favorable terms, if at all. Our current credit facility matures on December 6, 2012. In addition, we may seek to borrow under a new or separate credit facility prior to that maturity date to finance new business ventures, acquisitions or other corporate purposes. The lack of availability under our existing or new credit facilities, or the inability to refinance our current credit facility, could require us to take measures to conserve cash until the markets stabilize or until alternative credit arrangements or other funding for our business needs can be arranged. Such measures could include deferring capital expenditures, including acquisitions, and reducing or eliminating cash dividends on our common stock and our stock repurchase program.
22
Table of Contents
From time to time, we utilize borrowings under our credit facility to fund our liquidity and capital needs, and these borrowings, which increase our leverage and reduce our financial flexibility, are subject to various restrictions and covenants.
On December 7, 2007, we entered into an amended and restated credit agreement with a syndicate of banks, which provides for a term loan of $50 million and a revolving line of credit in the aggregate principal amount of up to $45 million. The maximum borrowings under the amended credit facility may be increased by $25 million pursuant to bank approval in accordance with the terms of the credit facility. The borrowings under the term loan were used to fund a $48.5 million special cash dividend to stockholders on December 27, 2007, which increased our leverage and reduced our financial flexibility. The terms of our credit agreement include provisions that directly or indirectly affect our ability to repurchase our common stock on the open market or in negotiated transactions, our ability to pay cash dividends on our common stock, and our ability to pursue acquisitions or other strategic ventures that would require us to borrow additional amounts.
We typically use substantially all of our available cash generated from our operations to repay borrowings on our revolving credit facility on a current basis and to fund the scheduled amortization repayments under the term loan, and we have limited cash balances (other than cash balances needed at the branch level). We expect that a substantial portion of our liquidity needs, including amounts to pay future cash dividends on our common stock, will be funded primarily from borrowings under our revolving credit facility. As of December 31, 2010, we had approximately $27.8 million available for future borrowings under this facility. Due to the seasonal nature of our business, our borrowings are historically the lowest during the first calendar quarter and increase during the remainder of the year. If our existing sources of liquidity are insufficient to satisfy our financial needs, we may need to raise additional debt or equity in the future. If we were unable to sell equity or raise additional debt our ability to finance our current operations would likely be adversely affected.
Our revolving credit facility contains restrictions and limitations that could significantly affect our ability to operate our business.
Our revolving credit facility contains a number of significant covenants that could adversely affect our business. These covenants restrict our ability, and the ability of our subsidiaries to, among other things:
| • | incur additional debt; |
| • | create liens; |
| • | effect mergers or consolidations; |
| • | make investments, acquisitions or dispositions; |
| • | pay dividends, repurchase stock or make other payments; and |
| • | enter into certain sale and leaseback transactions. |
As a result, our ability to respond to changing business and economic conditions and to secure additional financing, if needed, may be significantly restricted, and we may be prevented from engaging in transactions that might further our corporate strategies. Our obligations under the credit facility are guaranteed by each of our existing and future domestic subsidiaries. The borrowings under the revolving credit facility are secured by substantially all of our assets and the assets of the subsidiary guarantors. In addition, borrowings under the revolving credit facility are secured by a pledge of substantially all of the capital stock, or similar equity interests, of the subsidiary guarantors. In the event of our insolvency, liquidation, dissolution or reorganization, the lenders under our credit facility and any other then existing debt of ours would be entitled to payment in full from our assets before distributions, if any, were made to our stockholders.
The breach of any covenant or obligation in our credit facility will result in a default. If there is an event of default under our credit facility, the lenders could cause all amounts outstanding thereunder to be due and payable. If we are unable to repay, refinance or restructure our indebtedness under our credit facility when it comes due, at maturity or upon acceleration, the lenders could proceed against the collateral securing that indebtedness.
23
Table of Contents
We depend on loans and cash management services from banks to operate our business. If banks decide to stop making loans or providing cash management services to us, it could have a material adverse effect on our business, results of operations and financial condition.
We depend on borrowings under our revolving credit facility to fund loans, capital expenditures, smaller acquisitions, cash dividends and other needs. If consumer banks decide not to lend money to companies in our industry or to us, our ability to borrow at competitive interest rates (or at all), our ability to operate our business and our cash availability would likely be adversely affected.
Certain banks have notified us and other companies in the payday loan and check cashing industries that they will no longer maintain bank accounts for these companies due to reputation risks and increased compliance costs of servicing money services businesses and other cash intensive industries. While none of our primary depository banks has requested that we close our bank accounts or placed other restrictions on how we use their services, if any of our larger current or future depository banks were to take such actions, we could face higher costs of managing our cash and limitations on our ability to grow our business, both of which could have a material adverse effect on our business, results of operations and financial condition.
Media reports and public perception of payday loans as being predatory or abusive could adversely affect our business.
Over the past few years, consumer advocacy groups and certain media reports have advocated governmental action to prohibit or severely restrict payday loans. The consumer groups and media reports typically focus on the cost to a consumer for this type of loan, which is higher than the interest typically charged by credit card issuers. This difference in credit cost is more significant if a consumer does not promptly repay the loan, but renews, or rolls over, that loan for one or more additional short-term periods. The consumer groups and media reports typically characterize these payday loans as predatory or abusive toward consumers. If this negative characterization of our payday loans becomes widely accepted by consumers, demand for our payday loans could significantly decrease, which could adversely affect our results of operations and financial condition. Negative perception of our payday loans or other activities could also result in our industry being subject to more restrictive laws and regulations and greater exposure to litigation.
If estimates of our loan losses are not adequate to absorb actual losses, our financial condition and results of operations may be adversely affected.
We maintain an allowance for loan losses at levels to cover the estimated incurred losses in the collection of our loan portfolio outstanding at the end of each applicable period. Our methodology for estimating the allowance for payday loan loses utilizes a four-step approach, which reflects the short-term nature of the loan portfolio at each period-end, the historical collection experience in the month following each reporting period-end and any fluctuations in recent general economic conditions. We also maintain allowances for loan losses with respect to our installment and automobile finance loans, which are computed using separate methodologies based on historical data, as well as industry and economic factors. Our allowance for loan losses was $7.2 million on December 31, 2010. Our allowance for loan losses is an estimate, and if actual loan losses are materially greater than our allowance for losses, our financial condition and results of operations could be adversely affected.
The payday loan industry is subject to various local rules and regulations. Changes in these local regulations could have a material adverse effect on our business, results of operations and financial condition.
In addition to state and federal laws and regulations, our business is subject to various local rules and regulations such as local zoning regulations and permit licensing. Any actions taken in the future by local zoning boards or other governing bodies to require special use permits for, or impose other restrictions on, payday lenders could impact our growth strategy and have a material adverse effect on our business, results of operations and financial condition.
24
Table of Contents
Any disruption in the availability of our information systems could adversely affect operations at our branches.
We rely upon our information systems to manage and operate our branches and business. Each branch is part of an information network that permits us to maintain adequate cash inventory, reconcile cash balances daily, report revenues and loan losses timely and, in Texas, to access the third-party lender’s loan approval system. Our security measures could fail to prevent a disruption in the availability of our information systems and/or our back-up systems could fail to operate properly. Any disruption in the availability of our information systems could adversely affect our operations and our results of operations.
Our headquarters is currently located at a single location in Overland Park, Kansas. Our information systems and administrative and management processes are primarily provided to our regions and branches from this location, which could be disrupted if a catastrophic event, such as a tornado, power outage or act of terror, destroyed or severely damaged the headquarters. While we maintain redundant facilities in Texas with a third-party vendor, any catastrophic event could nonetheless adversely affect our operations and our results of operations.
Improper disclosure of personal data could result in liability and harm our reputation.
We store and process large amounts of personally identifiable information, that consists primarily of customer information. It is possible that our security controls over personal data, our training of employees, and other practices we follow may not prevent the improper disclosure of personally identifiable information. Such disclosure could harm our reputation and subject us to liability under laws that protect personal data, resulting in increased costs or loss of revenue.
Our quarterly results have fluctuated in the past and may fluctuate in the future. If they fluctuate in the future, the market price of our common stock could also fluctuate significantly.
Our quarterly results have fluctuated in the past and are likely to continue to fluctuate in the future. If they do so, our quarterly revenues and operating results may be difficult to forecast. It is possible that our future quarterly results of operations will not meet the expectations of securities analysts or investors. This could cause a material drop in the market price of our common stock.
Our business will continue to be affected by a number of factors, including the various risk factors set forth in this section, any one of which could substantially affect our results of operations for a particular fiscal quarter. Our quarterly results of operations can vary due to:
| • | fluctuations in payday and installment loan demand as well as changes in the demand for used automobiles; |
| • | fluctuations in our loan loss experience; |
| • | regulatory and legislative activity restricting our business; |
| • | perceptions regarding possible future regulatory or legislative changes to our business; |
| • | the initiation, management and/or resolution of significant legal actions; and |
| • | changes in broad economic factors, such as energy prices, average hourly wage rates, inflation or bankruptcy. |
The market price of our common stock may be volatile even if our quarterly results do not fluctuate significantly.
Even if we report stable or increased earnings, the market price of our common stock may be volatile. There are a number of factors, beyond earnings fluctuations, that can affect the market price of our common stock, including the following:
| • | the introduction, passage or adoption of state or federal legislation or regulation that could adversely affect our business; |
25
Table of Contents
| • | the announcement of court decisions adverse to us or our industry; |
| • | a decrease in market demand for our stock; |
| • | downward revisions in securities analysts’ estimates of our future earnings; |
| • | announcements of new products or services developed or offered by us; |
| • | the degree of customer acceptance of new products or services offered by us; and |
| • | general market conditions and other economic factors. |
The market price of our common stock has been volatile in the past and is likely to be volatile in the future.
When our common stock is a “penny stock,” you may have difficulty selling our common stock in the secondary trading market.
The SEC has adopted regulations that generally define a “penny stock” to be any equity security that has a market price of less than $5.00 per share or with an exercise price of less than $5.00 per share. Additionally, if the equity security is not registered or authorized on a national securities exchange or NASDAQ, the equity security also would constitute a “penny stock.” These regulations require the delivery, prior to certain transactions involving a penny stock, of a risk disclosure schedule explaining the penny stock market and the risks associated with it. Disclosure is also required in certain circumstances regarding compensation payable to both the broker-dealer and the registered representative and current quotations for the securities. In addition, monthly statements are required to be sent disclosing recent price information for the penny stocks. Since December 2008, our common stock has frequently traded below $5.00 per share and has, from time to time, fallen within the definition of penny stock. Any time that our common stock is classified as a “penny stock” for purposes of these regulations, the ability of broker-dealers to sell our common stock and the ability of stockholders to sell our common stock in the secondary market will be limited. As a result, the market liquidity for our common stock may be adversely affected by the application of these penny stock rules.
Competition in the retail financial services industry is intense and could cause us to lose market share and revenues.
We believe that the primary competitive factors in the payday loan industry are branch location and customer service. In addition to storefront payday loan locations, we also currently compete with services, such as overdraft protection offered by traditional financial institutions, payday loan-type products offered by some banks and credit unions, and other financial service entities and retail businesses that offer payday loans or other similar financial services, as well as a growing internet-based payday loan segment. Some of our competitors have larger and more established customer bases and substantially greater financial, marketing and other resources than we have. As a result of competition from our direct competitors and competing products and services, we could lose market share and our revenues could decline, thereby affecting our earnings and potential for growth.
If we lose key managers or are unable to attract and retain the talent required for our business, our operating results could suffer.
Our future success depends to a significant degree upon the members of our senior management, particularly Darrin J. Andersen, our President and Chief Operating Officer. We believe that the loss of the services of Mr. Andersen or any or our other senior officers could adversely affect our business. Our efforts to expand into other businesses and product lines also depend upon our ability to attract and retain additional skilled management personnel for those businesses or product lines. We do not have employment agreements with any of our executive officers. To the extent that we are unable to attract and retain the talent required for our business, our operating results could suffer.
26
Table of Contents
Regular turnover among our branch managers and branch-level employees makes it more difficult for us to operate our branches and increases our costs of operation.
We experience high turnover among our branch managers and our branch-level employees. In 2010, we sustained approximately 29% turnover among our branch managers and approximately 73% turnover among our branch-level employees. Turnover interferes with implementation of branch operating strategies. High turnover in the future would perpetuate these operating pressures and increase our operating costs.
Additionally, high turnover creates challenges for us in maintaining high levels of employee awareness of and compliance with our internal procedures and external regulatory compliance requirements.
Our executive officers, directors and principal stockholders may be able to exert significant control over our strategic direction.
Our directors and executive officers own or have the power to vote approximately 54% of our outstanding common stock as of December 31, 2010. Don Early, our Chairman of the Board and Chief Executive Officer, and Mary Lou Early, our Vice Chairman of the Board, owned approximately 47.3% directly and 1.4% indirectly of our outstanding common stock as of December 31, 2010. The election of each director requires a plurality of the shares voting for directors at a meeting of stockholders at which a quorum is present. Approval of a significant corporate transaction, such as a merger or consolidation of the company, a sale of all or substantially all of its assets or a dissolution of the company, requires the affirmative vote of a majority of the outstanding shares of our common stock. Other actions requiring stockholder approval require the affirmative vote of a majority of the shares of common stock voting on the matter, provided that a quorum is present. A quorum requires the presence of a majority of the shares outstanding. As a result, one or more stockholders owning a relatively low percentage of the outstanding shares of our common stock could, acting together with Mr. and Mrs. Early, control all matters requiring our stockholders’ approval, including the election of directors and approval of significant corporate transactions. As a result, this concentration of ownership may delay, prevent or deter a change in control or change in board composition, could deprive our stockholders of an opportunity to receive a premium for their common stock as part of a sale of the company or its assets and might reduce the market price of our common stock.
Future sales of shares of our common stock in the public market could depress our stock price.
As of December 31, 2010, our officers and directors held approximately 9.5 million shares of common stock, substantially all of which are “restricted securities” under the Securities Act and are eligible for future sale in the public market at prescribed times pursuant to Rule 144 under the Securities Act, or otherwise. In addition, Mr. Early, who directly owns approximately 43.3% of our outstanding shares, has demand registration rights, which permit him to require the company to register all or any part of those shares for resale by Mr. Early. Sales of a significant number of these shares of common stock in the public market could reduce the market price of our common stock. The daily trading volume in our stock, since our initial public offering in July 2004, has been low, and is frequently under 25,000 shares traded in a day.
Accordingly, the sale of even a relatively small number of shares by our officers or directors could reduce the market price of our common stock.
In addition, Mr. Early’s heirs or his estate may be required to sell a significant portion of that stock upon his death. While we maintain $15 million of key man life insurance on Mr. Early, our current credit agreement restricts our ability to use the proceeds of that insurance to repurchase shares from Mr. Early’s heirs or estate without the consent of the lenders. If a substantial block of our common stock were sold by Mr. Early’s heirs or estate, it would likely significantly reduce the market price of our common stock.
27
Table of Contents
Our anti-takeover provisions could prevent or delay a change in control of our company even if the change of control would be beneficial to our stockholders.
Provisions of our articles of incorporation and bylaws as well as provisions of Kansas law could discourage, delay or prevent a merger, acquisition or other change in control of our company, even if the change in control would be beneficial to our stockholders. These provisions include:
| • | authorizing the issuance of “blank check” preferred stock that could be issued by our board of directors without a stockholder vote to increase the number of outstanding shares and thwart a takeover attempt; |
| • | limitations on the ability of stockholders to call special meetings of stockholders; and |
| • | establishing advance notice requirements for nominations for election to the board of directors or for proposing matters that can be acted upon by stockholders at stockholder meetings. |
We can redeem common stock from a stockholder who is or becomes a disqualified person.
Federal and state laws and regulations applicable to providers of payday loans may now, or in the future, restrict direct or indirect ownership or control of providers of payday loan services by disqualified persons (such as convicted felons). Our articles of incorporation provide that we may redeem shares of our common stock to the extent deemed necessary or advisable, in the judgment of our board of directors, to prevent the loss, or to secure the reinstatement or renewal, of any license or permit from any governmental agency that is conditioned upon some or all of the holders of our common stock possessing prescribed qualifications or not possessing prescribed disqualifications. The redemption price will be the average of the daily closing sale prices per share of our common stock for the 30 consecutive trading days immediately prior to the redemption date fixed by our board of directors. At the discretion of our board of directors, the redemption price may be paid in cash, debt or equity securities or a combination of cash and debt or equity securities.
| ITEM 1B. | Unresolved Staff Comments |
None.
| ITEM 2. | Properties |
In February 2005, we entered into a seven-year lease for new corporate headquarters in Overland Park, Kansas, where we lease approximately 39,000 square feet. In the opinion of management, the corporate office space leased is adequate for existing and foreseeable future operating needs. In January 2011, we amended this lease agreement to extend the lease term and modify the lease payments. The lease was extended through October 31, 2017 and includes a renewal option for an additional five years. Prior to April 2005, our corporate headquarters were located in a 10,000 square foot company-owned building located in Kansas City, Kansas, which is presently leased to an unrelated tenant. In addition, we own three branch locations, in St. Louis, Missouri, Grandview, Missouri and Jackson, Mississippi. All our other branch locations are leased. Our average branch size is approximately 1,600 square feet with average rent of approximately $2,300 per month. Leases are generally executed with a minimum initial term of between three to five years with multiple renewal options. We complete all necessary leasehold improvements and required maintenance.
In August 2008, we purchased an auto sales facility in Overland Park, Kansas. The facility includes three buildings (with a total of 7,982 square feet) and parking spaces on approximately 1.6 acres of land.
| ITEM 3. | Legal Proceedings |
Missouri. On October 13, 2006, one of our Missouri customers sued us in the Circuit Court of St. Louis County, Missouri in a purported class action. The lawsuit alleges violations of the Missouri statute pertaining to unsecured loans under $500 and the Missouri Merchandising Practices Act. The lawsuit seeks monetary damages and a declaratory judgment that the arbitration agreement with the plaintiff is not enforceable on a variety of
28
Table of Contents
theories. We moved to compel arbitration of this matter. In December 2007, the court entered an order striking the class action waiver provision in our customer arbitration agreement, ordered the case to arbitration and dismissed the lawsuit filed in Circuit Court. In July 2008, we filed our appeal of the court’s order with the Missouri Court of Appeals. In December 2008, the Court of Appeals affirmed the decision of the trial court. In September 2009, the plaintiff filed her action in arbitration. We have filed our answer, and a three-person arbitration panel has been chosen. Discovery has commenced, and the parties will possibly argue class certification in first half of 2011.
North Carolina. On February 8, 2005, we, two of our subsidiaries, including our subsidiary doing business in North Carolina, and Mr. Don Early, our Chairman of the Board and Chief Executive Officer, were sued in Superior Court of New Hanover County, North Carolina in a putative class action lawsuit filed by James B. Torrence, Sr. and Ben Hubert Cline, who were customers of a Delaware state-chartered bank for whom we provided certain services in connection with the bank’s origination of payday loans in North Carolina, prior to the closing of our North Carolina branches in fourth quarter 2005. The lawsuit alleges that we violated various North Carolina laws, including the North Carolina Consumer Finance Act, the North Carolina Check Cashers Act, the North Carolina Loan Brokers Act, the state unfair trade practices statute and the state usury statute, in connection with payday loans made by the bank to the two plaintiffs through the our retail locations in North Carolina. The lawsuit alleges that we made the payday loans to the plaintiffs in violation of various state statutes, and that if we are not viewed as the “actual lenders or makers” of the payday loans, our services to the bank that made the loans violated various North Carolina statutes. Plaintiffs are seeking certification as a class, unspecified monetary damages, and treble damages and attorneys fees under specified North Carolina statutes. Plaintiffs have not sued the bank in this matter and have specifically stated in the complaint that plaintiffs do not challenge the right of out-of-state banks to enter into loans with North Carolina residents at such rates as the bank’s home state may permit, all as authorized by North Carolina and federal law. This case is in the preliminary stages.
There are three similar purported class action lawsuits filed in North Carolina against three other companies unrelated to us. In December 2005, the judge in those three cases (1) granted the defendants’ motions to stay the purported class action lawsuits and to compel arbitration in accordance with the terms of the arbitration provisions contained in the consumer loan contracts, (2) ruled that the class action waivers in those consumer loan contracts are valid, and (3) denied plaintiffs’ motions for class certifications. The plaintiffs in those three cases, who are represented by the same law firms as the plaintiffs in the case filed against us, appealed that ruling. In January 2007, the North Carolina Court of Appeals heard the appeal in the three companion cases. In May 2008, the appellate court remanded the three companion cases to the state court to review its ruling in light of a recent North Carolina Supreme Court decision. In June 2009, the trial court denied defendants’ motion to compel arbitration and granted each of the respective plaintiffs’ motions for class certification. Defendants appealed those rulings, but by the end of 2010, tentative settlements in each of the three companion cases were reached. However the settlements do not provide reasonable guidance on settlements in our case. We will argue our own issues concerning arbitration and class certification before the trial court in early to mid 2011.
The judge handling the lawsuit against us in North Carolina is the same judge who is handling the three companion cases.
Arizona. In December 2009, the Arizona Attorney General filed a lawsuit against us in Arizona state court. Specifically, the Attorney General contends that we allegedly violated various state consumer protection statutes when we sued non-Pima County customers with delinquent accounts in Pima County. Subsequently, the Attorney General amended its complaint in December 2009, and alleged that our arbitration provision was unconscionable. In January 2010, we moved to dismiss the Attorney General’s complaint. The Attorney General has asked for and received extensions of time to respond to this motion to dismiss. Since then, the parties have reached a tentative agreement to settle the matter for approximately $230,000. It is anticipated that the parties will execute this settlement by end of March 2011.
Ohio. In April 2009, the Ohio Division of Financial Institutions issued a notice of violation challenging the business model used by one of our subsidiaries in that state. In Ohio, we issue short-term loan proceeds to
29
Table of Contents
customers in the form of a check. We offer to cash these checks for a fee. Cashing a check is a voluntary transaction and the underlying short-term loan is not conditioned upon an agreement to cash the customer’s loan proceeds check. The Division of Financial Institutions has claimed that cashing these checks is a violation of the Ohio’s Small Loan Act and has asked us to cease cashing the checks for a fee. We believe that our business practice complies with all applicable laws and continues to conduct business without any changes to its operations. The Division asked for an administrative hearing to determine whether the business model violates state law. A hearing officer determined, however, that our model does not violate state law. The Division, as allowed by law, in early 2011 rejected this finding and issued another cease and desist order to us. As a result, we moved to stay the order and have forced an appeal of the administrative ruling to state district court. In a separate action, we, joined by other short-term lending companies, sued the Division to bar the enforcement of these new proposed rules. In April 2010, the court overseeing the case issued a temporary restraining order against the Division, preventing the enforcement of the rules for the near future.
Other Matters. We are also currently involved in ordinary, routine litigation and administrative proceedings incidental to our business, including customer bankruptcies and employment-related matters from time to time. We believe the likely outcome of any other pending cases and proceedings will not be material to our business or our financial condition.
| ITEM 4. | Reserved |
30
Table of Contents
| ITEM 5. | Market for Registrant’s Common Equity, Related Stockholder Matters and Issuer Purchases of Equity Securities |
Market Information
We completed the public offering of our common stock on July 21, 2004 at an initial offering price of $14.00 per share. Our common stock is traded on the NASDAQ Global Market under the ticker symbol “QCCO.” The following table sets forth the high and low closing prices for each of the completed quarters since January 1, 2009:
| 2010 |
High | Low | ||||||
| First quarter |
$ | 6.23 | $ | 4.64 | ||||
| Second quarter |
5.48 | 3.48 | ||||||
| Third quarter |
4.40 | 3.58 | ||||||
| Fourth quarter |
4.16 | 3.56 | ||||||
| 2009 |
High | Low | ||||||
| First quarter |
$ | 6.17 | $ | 3.87 | ||||
| Second quarter |
7.43 | 5.14 | ||||||
| Third quarter |
7.15 | 5.12 | ||||||
| Fourth quarter |
6.82 | 4.40 | ||||||
The year-end closing prices of our common stock for 2010 and 2009 were $3.74 and $4.81, respectively.
Holders
As of March 3, 2011 there were approximately 179 holders of record and 1,277 beneficial owners of our common stock.
Dividends
The declaration of dividends is subject to the discretion of our board of directors. The future determination as to the payment of cash dividends will depend on our operating results, financial condition, cash and capital requirements and other factors as the board of directors deems relevant.
Our credit agreement requires us to maintain a Fixed Charge Coverage Ratio (computed in accordance with the credit agreement) of not less than 1.25 to 1.00. Under our credit agreement, we are required to subtract any cash dividends paid on our common stock from our Operating Cash Flow amount used in computing our Fixed Charge Coverage Ratio. Thus, our credit agreement may restrict our ability to pay cash dividends in the future.
In November 2008, our board of directors established a regular quarterly dividend of $0.05 per share of our common stock. In addition to regular quarterly dividends, our board of directors has also approved special cash dividends on our common stock from time to time. For the years ended December 31, 2009 and 2010, we paid regular and special cash dividends to our stockholders totaling $5.4 million in each year.
31
Table of Contents
The following table summarizes our cash dividends paid during 2009 and 2010.
| Payment Date |
Type of Dividend |
Amount of Cash per Share |
||||||
| 2010: |
||||||||
| March 8, 2010 |
Regular | $ | 0.05 | |||||
| March 8, 2010 |
Special | 0.10 | ||||||
| June 1, 2010 |
Regular | 0.05 | ||||||
| September 2, 2010 |
Regular | 0.05 | ||||||
| December 1, 2010 |
Regular | 0.05 | ||||||
| Total dividend per share of common stock |
$ | 0.30 | ||||||
| 2009: |
||||||||
| March 9, 2009 |
Regular | $ | 0.05 | |||||
| June 2, 2009 |
Regular | 0.05 | ||||||
| September 1, 2009 |
Regular | 0.05 | ||||||
| December 2, 2009 |
Regular | 0.05 | ||||||
| December 2, 2009 |
Special | 0.10 | ||||||
| Total dividend per share of common stock |
$ | 0.30 | ||||||
Securities Authorized For Issuance Under Equity Compensation Plans
As of December 31, 2010, equity compensation plans approved by security holders include our 1999 Stock Option Plan, our 2004 Equity Incentive Plan and an outstanding option to purchase 126,397 shares of common stock granted to a former officer of the company, which were granted pursuant to a prior consulting agreement with that individual.
In June 2009, at our annual meeting of stockholders, our stockholders approved an amendment to the 2004 Equity Incentive Plan to increase the number of shares of common stock available for issuance under such plan from three million shares to five million shares. The following table sets forth certain information about our securities authorized for issuance under our equity compensation plans as of December 31, 2010.
| A | B | C | ||||||||||
| Plan Category |
Number of securities to be issued upon exercise of outstanding options, warrants and rights |
Weighted average exercise price of outstanding options, warrants and rights |
Number of securities remaining available for future issuance under equity compensation plans (excluding securities reflected in column A) |
|||||||||
| Equity compensation plans approved by security holders |
2,803,479 | $ | 9.50 | 843,571 | ||||||||
| Equity compensation plans not approved by security holders |
N/A | N/A | N/A | |||||||||
| Total |
2,803,479 | $ | 9.50 | 843,571 | ||||||||
Securities remaining available for future issuance under equity compensation plans approved by security holders consist solely of shares available under the 2004 Equity Incentive Plan. Securities remaining available for future issuance under our 2004 Equity Incentive Plan may be issued, in any combination, as incentive stock options, non-qualified stock options, stock appreciation rights, performance share awards, restricted stock or other incentive awards of, or based on, our common stock.
32
Table of Contents
We do not have any equity compensation plans other than the plans approved by our security stockholders.
Recent Sales of Unregistered Securities
Since July 21, 2004, the date of our public offering, we have not made any unregistered sales of securities.
Stock Repurchases
The board of directors has authorized us to repurchase our common stock in the open market or private purchases. The acquired shares may be used for corporate purposes, including shares issued to employees in our stock-based compensation programs. Pursuant to our credit agreement, the maximum amount of our common stock we may repurchase is $60 million.
On June 3, 2009, our board of directors extended our common stock repurchase program through June 30, 2011. The board of directors has previously authorized us to repurchase up to $60 million of our common stock in the open market and through private purchases. During 2010, we repurchased approximately 606,000 shares for approximately $2.6 million. As of December 31, 2010, we have repurchased a total of 5.3 million shares at a total cost of approximately $54.4 million, which leaves approximately $5.6 million that may yet be purchased under the current program.
The following table sets forth certain information about the shares of common stock we repurchased during the fourth quarter of 2010.
| Period |
Total Number of Shares Purchased |
Average Price Paid Per Share |
Total Number of Shares Purchased as Part of Publicly Announced Program |
Maximum Approximate Dollar Value of Shares that May Yet Be Purchased Under the Program |
||||||||||||
| October 1 – October 31 |
27,267 | $ | 3.92 | 27,267 | $ | 5,951,631 | ||||||||||
| November 1 – November 30 |
33,745 | 4.07 | 33,745 | 5,814,245 | ||||||||||||
| December 1 – December 31(a) |
70,617 | 3.83 | 67,388 | 5,555,324 | ||||||||||||
| 131,629 | $ | 3.91 | 128,400 | 5,555,324 | ||||||||||||
| (a) | Stock repurchases of 3,229 shares in December 2010 were made in connection with the funding of employee income tax withholding obligations arising from the vesting of restricted shares. These repurchases are not counted against the dollar value of shares that may be purchased under our stock repurchase program. |
33
Table of Contents
Performance Graph
The following Performance Graph and related information shall not be deemed “soliciting material” or to be “filed” with the Securities and Exchange Commission, nor shall such information be incorporated by reference into any future filing under the Securities Act of 1933 or Securities Exchange Act of 1934, each as amended, except to the extent that we specifically incorporate it by reference into such filing.
The following table compares total stockholder returns on our common stock from December 31, 2005 through December 31, 2010 to the NASDAQ U.S. Index and our peer group assuming a $100 investment made on December 31, 2005 and assumes that all dividends are reinvested. The stock performance shown on the graph below is not necessarily indicative of future price performance. Our peer group consists of Advance America, Cash Advance Centers, Inc., Cash America International, Inc., Dollar Financial Corp., EZCORP, Inc. and First Cash Financial Services, Inc.
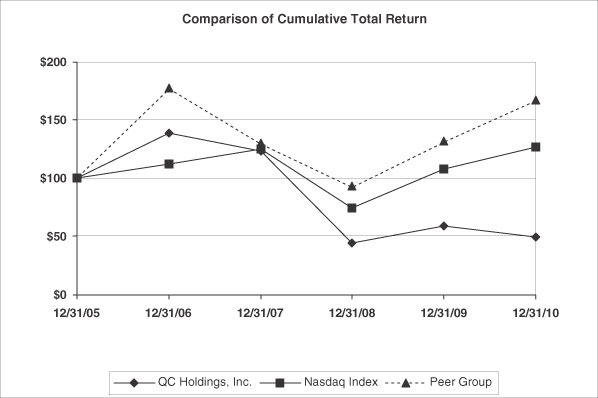
| Company Name / Index |
12/31/05 | 12/31/06 | 12/31/07 | 12/31/08 | 12/31/09 | 12/31/10 | ||||||||||||||||||
| QC Holdings, Inc. |
$ | 100.00 | $ | 138.42 | $ | 122.46 | $ | 43.57 | $ | 58.32 | $ | 49.05 | ||||||||||||
| Nasdaq Index |
100.00 | 111.74 | 124.67 | 73.77 | 107.12 | 125.93 | ||||||||||||||||||
| Peer Group |
100.00 | 176.67 | 129.93 | 92.36 | 131.13 | 166.90 | ||||||||||||||||||
34
Table of Contents
| ITEM 6. | Selected Financial Data |
The following table sets forth our selected consolidated financial data at the dates and for the periods indicated. Selected financial data should be read in conjunction with, and is qualified in its entirety by, “Management’s Discussion and Analysis of Financial Condition and Results of Operations” and our Consolidated Financial Statements and the Notes thereto appearing elsewhere in this report.
| Year Ended December 31, | ||||||||||||||||||||
| 2006 | 2007 | 2008 | 2009 | 2010 | ||||||||||||||||
| (in thousands, except share and per share data) | ||||||||||||||||||||
| Revenues: |
||||||||||||||||||||
| Payday loan fees |
$ | 142,075 | $ | 166,534 | $ | 166,371 | $ | 152,797 | $ | 131,624 | ||||||||||
| Automotive sales, interest and fees |
285 | 6,120 | 15,293 | 19,914 | ||||||||||||||||
| Other |
18,511 | 27,810 | 36,122 | 38,944 | 36,550 | |||||||||||||||
| Total revenues |
160,586 | 194,629 | 208,613 | 207,034 | 188,088 | |||||||||||||||
| Branch expenses: |
||||||||||||||||||||
| Salaries and benefits |
40,100 | 41,793 | 44,243 | 41,980 | 40,432 | |||||||||||||||
| Provision for losses |
33,839 | 46,588 | 51,231 | 44,135 | 37,842 | |||||||||||||||
| Occupancy |
19,965 | 23,737 | 23,539 | 21,651 | 20,665 | |||||||||||||||
| Cost of sales—automotive |
151 | 3,202 | 6,611 | 9,675 | ||||||||||||||||
| Depreciation and amortization |
4,386 | 4,177 | 3,909 | 3,796 | 3,290 | |||||||||||||||
| Other |
13,840 | 13,390 | 13,222 | 12,378 | 12,624 | |||||||||||||||
| Total branch expenses |
112,130 | 129,836 | 139,346 | 130,551 | 124,528 | |||||||||||||||
| Branch gross profit |
48,456 | 64,793 | 69,267 | 76,483 | 63,560 | |||||||||||||||
| Regional expenses |
11,941 | 12,614 | 13,075 | 13,584 | 13,921 | |||||||||||||||
| Corporate expenses |
19,514 | 22,813 | 24,738 | 24,513 | 22,101 | |||||||||||||||
| Depreciation and amortization |
1,379 | 2,399 | 2,931 | 2,969 | 2,653 | |||||||||||||||
| Interest expense |
(324 | ) | 602 | 4,313 | 3,352 | 2,401 | ||||||||||||||
| Other expense, net |
334 | 1,994 | 447 | 193 | 148 | |||||||||||||||
| Income from continuing operations before income taxes |
15,612 | 24,371 | 23,763 | 31,872 | 22,336 | |||||||||||||||
| Provision for income taxes |
6,214 | 9,581 | 10,097 | 12,403 | 8,121 | |||||||||||||||
| Income from continuing operations |
9,398 | 14,790 | 13,666 | 19,469 | 14,215 | |||||||||||||||
| Gain (loss) from discontinued operations, net of income tax |
(189 | ) | (188 | ) | (87 | ) | 360 | (2,272 | ) | |||||||||||
| Net income |
$ | 9,209 | $ | 14,602 | $ | 13,579 | $ | 19,829 | $ | 11,943 | ||||||||||
| Earnings (loss) per share: |
||||||||||||||||||||
| Basic |
||||||||||||||||||||
| Continuing operations |
$ | 0.47 | $ | 0.77 | $ | 0.76 | $ | 1.09 | $ | 0.79 | ||||||||||
| Discontinued operations |
(0.01 | ) | (0.01 | ) | (0.01 | ) | 0.02 | (0.13 | ) | |||||||||||
| Net income |
$ | 0.46 | $ | 0.76 | $ | 0.75 | $ | 1.11 | $ | 0.66 | ||||||||||
| Diluted |
||||||||||||||||||||
| Continuing operations |
$ | 0.45 | $ | 0.75 | $ | 0.75 | $ | 1.08 | $ | 0.79 | ||||||||||
| Discontinued operations |
— | (0.01 | ) | — | 0.02 | (0.13 | ) | |||||||||||||
| Net income |
$ | 0.45 | $ | 0.74 | $ | 0.75 | $ | 1.10 | $ | 0.66 | ||||||||||
| Weighted average number of common shares outstanding: |
||||||||||||||||||||
| Basic |
19,980,884 | 19,282,859 | 17,877,063 | 17,436,714 | 17,258,899 | |||||||||||||||
| Diluted |
20,627,105 | 19,578,285 | 17,983,294 | 17,579,513 | 17,341,092 | |||||||||||||||
| Cash dividends declared per share |
$ | 0.10 | $ | 2.90 | $ | 0.30 | $ | 0.30 | $ | 0.30 | ||||||||||
35
Table of Contents
| Year Ended December 31, | ||||||||||||||||||||
| 2006 | 2007 | 2008 | 2009 | 2010 | ||||||||||||||||
| Operating Data: |
||||||||||||||||||||
| Branches (at end of period) |
613 | 596 | 585 | 556 | 523 | |||||||||||||||
| Percentage change in comparable branch revenues from prior year(a) |
(2.6 | )% | 14.8 | % | 4.0 | % | (5.2 | )% | (12.3 | )% | ||||||||||
| Payday loans: |
||||||||||||||||||||
| Loan volume (in thousands) |
$ | 973,471 | $ | 1,156,044 | $ | 1,175,156 | $ | 1,075,135 | $ | 903,801 | ||||||||||
| Average loan (principal plus fee) |
362.50 | 364.33 | 370.09 | 366.97 | 374.90 | |||||||||||||||
| Average fee |
53.36 | 53.09 | 53.98 | 54.03 | 56.22 | |||||||||||||||
| Installment loans: |
||||||||||||||||||||
| Loan volume (in thousands) |
$ | 6,104 | $ | 20,259 | $ | 31,499 | $ | 28,471 | $ | 29,333 | ||||||||||
| Average loan (principal plus fee) |
538.88 | 524.65 | 511.13 | 499.80 | 489.60 | |||||||||||||||
| Average term (months) |
6 | 6 | 6 | 6 | 6 | |||||||||||||||
| Automotive loans: |
||||||||||||||||||||
| Automotive loan volume (in thousands) |
$ | 262 | $ | 5,182 | $ | 12,656 | $ | 15,835 | ||||||||||||
| Average loan (principal) |
6,901 | 8,622 | 8,753 | 9,375 | ||||||||||||||||
| Average term (months) |
30 | 35 | 31 | 33 | ||||||||||||||||
| Locations, end of period |
1 | 3 | 5 | 5 | ||||||||||||||||
| As of December 31, | ||||||||||||||||||||
| 2006 | 2007 | 2008 | 2009 | 2010 | ||||||||||||||||
| (in thousands) | ||||||||||||||||||||
| Balance Sheet Data: |
||||||||||||||||||||
| Cash and cash equivalents |
$ | 23,446 | $ | 24,145 | $ | 17,314 | $ | 21,151 | $ | 16,288 | ||||||||||
| Loans, interest and fees receivable, less allowance for losses |
66,018 | 72,903 | 73,711 | 74,973 | 70,059 | |||||||||||||||
| Total assets |
142,947 | 149,580 | 143,042 | 148,086 | 138,042 | |||||||||||||||
| Current debt |
16,300 | 28,500 | 33,143 | 30,400 | 28,113 | |||||||||||||||
| Long-term debt |
46,000 | 37,607 | 27,707 | 16,881 | ||||||||||||||||
| Stockholders’ equity |
104,788 | 52,226 | 49,419 | 65,550 | 71,547 | |||||||||||||||
| (a) | Comparable branches are branches that were open during the full periods for which a comparison is being made. For the annual analysis as of December 31, 2010, comparable branches are those that were open for at least 24 months on that date. |
36
Table of Contents
| ITEM 7. | Management’s Discussion and Analysis of Financial Condition and Results of Operations |
The following should be read in conjunction with Item 6 “Selected Financial Data” and our Consolidated Financial Statements and Notes included as Item 8 of this report.
EXECUTIVE SUMMARY
We operate primarily through our wholly-owned subsidiaries, QC Financial Services, Inc., QC Auto Services, Inc., QC Loan Services, Inc. and QC E-Services, Inc. QC Financial Services, Inc. is the 100% owner of QC Financial Services of California, Inc., QC Financial Services of Texas, Inc., Express Check Advance of South Carolina, LLC, QC Advance, Inc., Financial Services of North Carolina, Inc., Cash Title Loans, Inc. and QC Properties, LLC.
We derive our revenues primarily by providing short-term consumer loans, known as payday loans, which represented approximately 70.0% of our total revenues for the year ended December 31, 2010. We earn fees for various other financial services, such as installment loans, credit services, check cashing services, title loans, open-end credit, money transfers and money orders. We operated 523 branches in 24 states at December 31, 2010. In all but one of these states, Texas, we fund our payday loans directly to the customer and receive a fee. Fees charged to customers vary from state to state, generally ranging from $15 to $20 per $100 borrowed, and in most cases, are limited by state law. We also sell used automobiles and finance most of those sales, earning income on the automobile sales and interest on the automobile loans.
We currently offer installment loans to customers in 89 branches (located in Colorado, Idaho, Illinois, Montana, New Mexico and Utah). The installment loans are payable in monthly installments (principal plus accrued interest) with terms ranging from four months to one year, and all loans are pre-payable at any time without penalty. The fee for an installment loan varies based on the amount borrowed and the term of the loan. Generally, the maximum amount that we advance under an installment loan is $1,000. The average principal amount for installment loans originated during 2010 was approximately $490.
In Texas, through one of our subsidiaries, we operate as a credit service organization (CSO) on behalf of consumers in accordance with Texas laws. We charge the consumer a CSO fee for arranging for an unrelated third-party to make a loan to the consumer and for providing related services to the consumer, including a guarantee of the consumer’s obligation to the third-party lender.
In September 2007, we entered into the buy here, pay here segment of the used automotive market in connection with ongoing efforts to evaluate alternative products that serve our customer base. In January 2009, we purchased two buy here, pay here locations in Missouri for approximately $4.2 million. In May 2009, we opened a service center to provide reconditioning services on our inventory of vehicles and repair services for our customers. As of December 31, 2010, we operated five buy here, pay here lots, which are located in Missouri and Kansas. These locations sell used vehicles and earn finance charges from the related vehicle financing contracts. The average principal amount for buy here, pay here loans originated during the year ended December 31, 2010 was approximately $9,375 and the average term of the loan was 33 months.
We have elected to organize and report on our business units as two operating segments (Financial Services and Automotive). The Financial Services segment includes branches that offer payday loans, installment loans, credit services, check cashing services, title loans, money transfers and money orders. The Automotive segment consists of our buy here, pay here operations. We evaluate the performance of our segments based on, among other things, branch gross profit, income from continuing operations before income taxes and return on invested capital.
Our expenses primarily relate to the operations of our branch network. The most significant expenses include salaries and benefits for our branch employees, provisions for losses and occupancy expense for our leased real estate. Regional and corporate expenses, which include compensation of employees, professional fees and equity award charges, are our other primary costs.
37
Table of Contents
We evaluate our branches based on revenue growth, gross profit contributions and loss ratio (which is losses as a percentage of revenues), with consideration given to the length of time the branch has been open and its geographic location. We evaluate changes in comparable branch metrics on a routine basis to assess operating efficiency. We define comparable branches as those branches that are open during the full periods for which a comparison is being made. For example, comparable branches for the annual analysis as of December 31, 2010 have been open at least 24 months on that date. We monitor newer branches for their progress to profitability and rate of loan growth.
With respect to our cost structure, salaries and benefits are one of our largest costs and are generally driven by changes in number of branches and loan volumes. Our provision for losses is also a significant expense. If a customer’s check is returned by the bank as uncollected, we make an immediate charge-off to the provision for losses for the amount of the customer’s loan, which includes accrued fees and interest. Any recoveries on amounts previously charged off are recorded as a reduction to the provision for losses in the period recovered.
We have experienced seasonality in our Financial Services segment, with the first and fourth quarters typically being our strongest periods as a result of broader economic factors, such as holiday spending habits at the end of each year and income tax refunds during the first quarter. Our Automotive locations experience seasonality as automobile sales peak during the first quarter of each year, primarily as a result of the receipt by customers of their income tax refunds, which are used as down payments for a vehicle. Automobile sales in the final three quarters are generally lower than the first quarter. In addition, vehicle acquisition costs tend to increase in the second half of the year as companies build inventories for the expected first quarter volumes.
In response to changes in the overall market, we have dramatically slowed our branch expansion over the past five years and closed a significant number of branches. During this period, we opened 82 de novo branches, acquired 65 branches and closed 156 branches. The following table sets forth our de novo branch openings, branch acquisitions and branch closings since January 1, 2006.
| 2006 | 2007 | 2008 | 2009 | 2010 | ||||||||||||||||
| Beginning branch locations |
532 | 613 | 596 | 585 | 556 | |||||||||||||||
| De novo branches opened during year |
46 | 20 | 12 | 3 | 1 | |||||||||||||||
| Acquired branches during year |
51 | 13 | 1 | |||||||||||||||||
| Branches closed during year(a) |
(16 | ) | (50 | ) | (24 | ) | (32 | ) | (34 | ) | ||||||||||
| Ending branch locations |
613 | 596 | 585 | 556 | 523 | |||||||||||||||
| (a) | The branches closed during 2010 does not include 21 branches that we announced we would close during first half 2011. However, these branches are included as part of discontinued operations in 2010. |
We intend to evaluate opportunities for new branch development to complement existing branches within a given state or market. Additionally, we utilize a disciplined acquisition strategy for both the payday and the buy here, pay here businesses. During 2011, we expect to open approximately 10 branches providing short-term loan products and two to three automotive locations.
The payday loan industry began its rapid growth in 1996, when there were an estimated 2,000 payday loan branches in the United States. According to the Community Financial Services Association of America (CFSA), industry analysts estimate that the industry has approximately 19,700 payday loan branches in the United States and these branches (exclusive of internet lending) extend approximately $29 billion in short-term credit to millions of middle-class households that experience cash-flow shortfalls between paydays. We believe our industry is highly fragmented, with the 16 largest companies operating approximately one-half (approximately 9,900 branches) of the total industry branches. After a number of years of growth, the industry has contracted slightly in the past few years, primarily due to changes in laws that govern the payday product. Absent changes in regulations and laws, we do not expect significant fluctuations in the industry’s number of branches in the foreseeable future.
38
Table of Contents
The payday loan industry has followed, and continues to be significantly affected by, payday lending legislation and regulation in the various states and on a national level. We actively monitor and evaluate legislative and regulatory initiatives in each of the states and nationally, and are closely involved with the efforts of the CFSA. To the extent that states enact legislation or regulations that negatively impacts payday lending, whether through preclusion, fee reduction or loan caps, our business has been adversely affected in the past and could be further adversely affected in the future. Over the past few years certain states have enacted interest rate caps from 28% to 36% per annum on payday lending. A 36% per annum interest rate translates to approximately $1.38 per $100 loaned, which effectively precludes us from offering payday loans in those states.
During 2009, payday loan-related legislation that severely restricts customer access to payday loans was passed in South Carolina, Washington, Virginia and Kentucky. These law changes adversely affected our revenues and operating income during 2010. During 2010, the results from the states in which we have experienced law changes were more negative than we expected, with revenue declines and loss rates exceeding our forecasts. For the year ended December 31, 2010, revenues and gross profit from South Carolina, Washington, Virginia and Kentucky declined by $14.1 million and $9.0 million, respectively, compared to the prior year. In Arizona, the existing payday lending law expired on June 30, 2010. We are currently offering title loans to our Arizona customers. However, our customers in Arizona have not embraced this product as they did the payday loan product. For the year ended December 31, 2010, revenues and gross profit from our Arizona branches declined by $6.9 million and $5.4 million, respectively, from the prior year. In addition, a new law becomes effective in Illinois in March 2011 that includes, among other things, limitations on the number of loans a customer may have at one time throughout the state. This type of customer restriction, when passed in other states such as Washington, South Carolina and Kentucky, has resulted in a 30% to 60% decline in annual revenues depending on the types of alternative products that competitors may offer within the state. Absent other changes in payday lending laws or dramatic fluctuations in the broader economy and markets, we expect the net impact of the Illinois law change as discussed above, as well as the residual effect of Arizona in first half 2011 versus 2010 to reduce revenues by $7.0 million to $10.0 million and to reduce branch gross profit by $5.0 million to $7.0 million during the year ended December 31, 2011 compared to 2010. Improvements in our Automotive division, as well as continued diversification efforts both within our Financial Services branches and external to them, are expected to help offset the declines from the negative legislative changes.
KEY DEVELOPMENTS
Closure of Branches. During the year ended December 31, 2010, we closed 34 of our lower performing branches in various states and we decided to close 21 branches in Arizona, Washington and South Carolina during first half 2011. We recorded approximately $1.8 million in pre-tax charges during the year ended December 31, 2010 associated with these closings. The charges included $916,000 representing the loss on the disposition of fixed assets, $671,000 for lease terminations and other related occupancy costs, $155,000 in severance and benefit costs and $33,000 for other costs.
During year ended December 31, 2009, we closed 32 of our lower performing branches in various states (which included 26 branches reported as discontinued operations and six branches that were consolidated into nearby branches). We recorded approximately $1.7 million in pre-tax charges during the year ended December 31, 2009 associated with these closings, the majority of which were included in discontinued operations. The charges included an $897,000 loss for the disposition of fixed assets, $739,000 for lease terminations and other related occupancy costs, $15,000 in severance and benefit costs and $14,000 for other costs.
During third quarter 2008, we closed 13 of our 32 branches in Ohio during third quarter 2008, primarily due to a new law that went into effect on September 1, 2008 that effectively precludes payday loans. The new law caps interest rates on payday loans at 28% per annum, which is equivalent to $1.07 per $100 borrowed. We recorded approximately $943,000 in pre-tax charges for the year ended December 31, 2008, associated with these closings. The charges included $554,000 loss for the disposition of fixed assets, $342,000 for lease terminations
39
Table of Contents
and other related occupancy costs, $40,000 in severance and benefit costs and $7,000 for other costs. With respect to the branches that remained open in Ohio, we are offering customers an alternative product under a different statute.
Growth of Buy Here, Pay Here Operations. In January 2009, we purchased two buy here, pay here lots located in Missouri. We had a total of five buy here, pay here automobile locations as of December 31, 2010. In May 2009, we opened a service center to provide reconditioning services on our inventory of vehicles and repair services for our customers. As an operator of buy here, pay here locations, we sell and finance used cars to individuals who may not have banking relationships, have limited credit histories or past credit problems. We purchase our inventory of vehicles primarily through auctions. The vehicles acquired are carried in inventory at the amount of purchase price plus vehicle reconditioning costs. We provide financing to substantially all of our customers who purchase a vehicle at one of our buy here, pay here locations. Our finance contract typically includes a down payment or a trade in allowance ranging from $200 to $2,000. We require payments to be made on a weekly, bi-weekly, semi-monthly or monthly basis to coincide with the customer’s pay date. The average principal amount for automobile loans originated during 2010 was approximately $9,375 and the average term of the loan was 33 months. For the year ended December 31, 2010, revenues from our buy here, pay here locations totaled $19.9 million.
Introduction of alternative loan products. In April 2008, Virginia passed a new law (effective January 1, 2009) that severely restricted our ability to offer payday loans profitably. As a result of the new law, we offered an open-end credit product to our customers in Virginia beginning in December 2008. During second quarter 2009, we re-introduced the payday loan product in Virginia and discontinued the open-end product. While our ability to operate profitability offering only the payday loan product will be challenging, we believe the existing payday loan legislation provides the best opportunity for long-term success in Virginia. The open-end credit product was similar to a credit card as the customer was granted a grace period of 25 days to repay the loan without incurring any interest. In addition, we were responsible for providing our customer with a monthly statement and we required the customer to make a monthly payment based on the outstanding balance. In addition to interest earned on the outstanding balance, the open-end credit product also included a monthly membership fee.
DISCUSSION OF CRITICAL ACCOUNTING POLICIES
Our consolidated financial statements and accompanying notes have been prepared in accordance with accounting principles generally accepted in the United States of America applied on a consistent basis. The preparation of these financial statements requires us to make a number of estimates and assumptions that affect the reported amounts of assets and liabilities, the disclosure of contingent assets and liabilities at the date of the financial statements and the reported amounts of revenues and expenses during the reporting periods. We evaluate these estimates and assumptions on an ongoing basis. We base these estimates on the information currently available to us and on various other assumptions that we believe are reasonable under the circumstances. Actual results could vary materially from these estimates under different assumptions or conditions.
We believe that the following critical accounting policies affect the more significant estimates and assumptions used in the preparation of our financial statements.
Revenue Recognition
We record revenue from payday loans and title loans upon issuance. The term of a loan is generally two to three weeks for a payday loan and 30 days for a title loan. At the end of each month, we record an estimate of the unearned revenue, which results in revenues being recognized on a constant-yield basis ratably over the term of each loan.
40
Table of Contents
We record revenues from installment loans using the simple interest method. With respect to our CSO services in Texas, we earn a CSO fee for arranging for an unrelated third-party to make a loan to the consumer and for providing related services to the consumer, including a guarantee of the consumer’s obligation to the third-party lender. We also service the loan for the lender. The CSO fee is recognized ratably over the term of the loan.
We recognize revenue (net of sales tax) from the sale of automobiles at the time the vehicle is delivered to the customer and title has passed. In cases where we finance the vehicles, we originate an installment sale contract and use the simple interest method to recognize interest.
Generally, we recognize revenue for our other consumer financial products and services, which includes check cashing, money transfers and money orders, at the time those services are rendered to the customer, which is generally at the point of sale.
With respect to our open-end product, we earned interest on the outstanding balance and the product also included a monthly non-refundable membership fee. As noted above, we are no longer offering this product in Virginia and have re-introduced the payday product.
Provision for Losses and Returned Item Policy
We record a provision for losses associated with uncollectible loans. For payday loans, all accrued fees, interest and outstanding principal are charged off on the date we receive a returned check, generally within 14 days after the due date of the loan. Accordingly, the majority of payday loans included in our loans receivable balance at any given point in time are typically not older than 30 days. These charge-offs are recorded as expense through the provision for losses. Any recoveries on losses previously charged to expense are recorded as a reduction to the provision for losses in the period recovered. With respect to title loans, no additional fees or interest are charged after the loan has defaulted, which generally occurs after attempts to contact the customer have been unsuccessful. Based on state regulations and operating procedures, we stop accruing interest on installment loans between 60 to 90 days after the last payment. On automotive loans, we stop accruing interest on 60 days after the last payment.
During 2007 and 2008, our customers had to overcome a more challenging credit, financial and economic environment. As the macroeconomic environment deteriorated during 2008, our origination and collection procedures were sufficient to maintain a reasonable loss ratio throughout the year without additional underwriting procedures. In 2009 and 2010, we experienced an improvement in our loss ratio as our customers pulled back from borrowing and focused on paying down their debts. With lower loan volume, our branch personnel focused on limiting the number of returned checks and emphasized the collection of loans.
With respect to the loans receivable at the end of each reporting period, we maintain an aggregate allowance for loan losses (including fees and interest) for payday loans, title loans, installment loans and auto loans at levels estimated to be adequate to absorb estimated incurred losses in the respective outstanding loan portfolios. We do not specifically reserve for any individual loan.
The methodology for estimating the allowance for payday and title loan losses utilizes a four-step approach, which reflects the short-term nature of the loan portfolio at each period-end, the historical collection experience in the month following each reporting period-end and any fluctuations in recent general economic conditions. First, we compute the loss/volume ratio for the last month of each reporting period. The loss/volume ratio represents the percentage of aggregate net payday and title loan charge-offs to total payday and title loan volumes during a given period. Second, we compute an adjustment to this percentage to reflect the collections experience in the month immediately following the reporting period-end. To estimate collections experience, we compute an average of the change in the loss/volume ratio from the last month of each reporting period to the immediate subsequent month-end for each of the last three years (excluding the current year). This change is then
41
Table of Contents
added to, or subtracted from, the loss/volume ratio computed for the last month of the current reporting period to derive an experience-adjusted loss/volume ratio. Third, the period-end gross payday and title loans receivable balance is multiplied by the experience-adjusted loss/volume ratio to determine the initial estimate of the allowance for loan losses. Fourth, we review and evaluate various qualitative factors that may or may not affect the computed initial estimate of the allowance for loan losses, including, among others, known changes in state regulations or laws, changes to our business and operating structure, and geographic or demographic developments. As of December 31, 2009 and 2010, we determined that no qualitative adjustment to the allowance for payday loan losses was necessary.
We maintain an allowance for installment loans at a level we consider sufficient to cover estimated losses in the collection of our installment loans. The allowance calculation for installment loans is based upon historical charge-off experience (primarily a six-month trailing average of charge-offs to total volume) and qualitative factors, with consideration given to recent credit loss trends and economic factors. As of December 31, 2009 and 2010, we determined that no qualitative adjustment to the allowance for installment loan losses was necessary.
The allowance calculation for auto loans is determined on an aggregate basis and is based upon our review of the loan portfolio by period of origination, industry loss experience and qualitative factors, with consideration given to changes in loan characteristics, delinquency levels, collateral values and other general economic conditions. This estimate of probable losses is primarily determined using static pool analyses prepared for various segments of the portfolio using estimated loss experience, adjusted for consideration of any current economic factors. Over the last few years, industry loss rates have generally ranged between 20% and 28% of revenues, with higher ratios during more difficult macroeconomic periods. In 2008 and 2009, the automotive sales industry experienced an increase in delinquencies and, as a result, an increase in losses. Our level of allowance with respect to automotive loans in prior years was higher than levels during 2010 and higher than levels expected in the future due to our relative inexperience in the buy here, pay here business, as well as the age of the new locations and the generally negative industry and macroeconomic environment. During 2010, our loss experience with respect to automotive loans improved significantly due to management and process enhancements. As of December 31, 2009 and December 31, 2010, we reviewed various qualitative factors with respect to our automotive receivables and determined that no qualitative adjustment was needed.
Using this information, we record an adjustment to the allowance for loan losses through the provision for losses. The overall allowance represents our best estimate of probable losses inherent in the outstanding loan portfolios at the end of each reporting period.
The following tables summarize the activity in the allowance for loan losses:
| Year Ended December 31, | ||||||||||||
| 2008 | 2009 | 2010 | ||||||||||
| (in thousands) | ||||||||||||
| Allowance for loan losses |
||||||||||||
| Balance, beginning of year |
$ | 4,442 | $ | 6,648 | $ | 10,803 | ||||||
| Charge-offs |
(100,072 | ) | (83,577 | ) | (77,102 | ) | ||||||
| Recoveries |
47,249 | 41,879 | 36,127 | |||||||||
| Provision for losses |
55,029 | 45,853 | 37,322 | |||||||||
| Balance, end of year |
$ | 6,648 | $ | 10,803 | $ | 7,150 | ||||||
The provision for losses in the Consolidated Statements of Income includes losses associated with the CSO and excludes loss activity related to discontinued operations.
As noted above, to the extent that macroeconomic indicators continue to be negative during 2011 and beyond, our estimates with respect to the allowance for loan losses could be subject to more volatility and could increase as a percentage of total outstanding loans receivable.
42
Table of Contents
Our Financial Services business is seasonal due to fluctuating demand for short-term loans during the year. Historically, we have experienced our highest demand for short-term loans in January and in the fourth calendar quarter. As a result, to the extent that internally generated cash flows are not sufficient to fund the growth in loans receivable, fourth quarter and the month of January are the most likely periods of time for utilization or increase in borrowings under our credit facility. Due to the receipt by customers of their income tax refunds, demand for short-term loans has historically declined in the balance of the first quarter of each calendar year and the first month of the second quarter. Accordingly, this period is typically when any outstanding borrowings under the credit facility would be repaid (exclusive of any other capital-usage activity, such as acquisitions, significant stock repurchases, etc.). Our loss ratio historically fluctuates with these changes in short-term loan demand, with a higher loss ratio in the second and third quarters of each calendar year and a lower loss ratio in the first and fourth quarters of each calendar year. During mid-second quarter through third quarter, periodic utilization of our credit facility is not unusual, based on the level of loan losses and other capital-usage activities. Due to the seasonality of our business, results of operations for any quarter are not necessarily indicative of the results of operations that may be achieved for the full year.
Similarly, our Automotive segment experiences seasonality as automobile sales peak during the first quarter of each year, primarily as a result of the receipt by customers of their income tax refunds, which are used as down payments for a vehicle. Automobile sales in the final three quarters are generally lower than the first quarter. In addition, vehicle acquisition costs tend to increase in the second half of the year as companies build inventories for the expected first quarter volumes.
Accounting for Leases and Leasehold Improvements
Occupancy rent costs are amortized on a straight-line basis over the lease life, which includes reasonably assured lease renewals. Similarly, leasehold improvements are amortized over the shorter of their estimated useful lives or the related lease life including reasonably assured lease renewals. The lease lives plus reasonably assured renewals have generally ranged from 1 to 15 years with an average of 7 years and usually contain cancellation clauses in the event of regulatory changes. For leases with renewal periods at our option, which are included in substantially all of our operating leases for our branches, we believe that most of the renewal options are reasonably assured of being exercised due to the following factors: i) the importance of the branch location to the ultimate success of the branch, ii) the significance of the property to the continuation of service to our customers and to our development of a viable customer-base and iii) the existence of leasehold improvements whose value would be impaired if we vacated or discontinued the use of such property.
Income Taxes
In connection with the preparation of our consolidated financial statements, we are required to estimate our income taxes in each of the jurisdictions in which we operate. This process involves estimating current tax liability, together with assessing the differences between the financial statement and tax bases of assets and liabilities as measured by the tax rates that will be in effect when these differences reverse. These differences result in deferred tax assets and liabilities, which are included in the consolidated balance sheets. As of December 31, 2010, we reported a net deferred tax asset in the consolidated balance sheet. Valuation allowances are established when necessary to reduce deferred tax assets to the amounts expected to be realized.
In the ordinary course of business, many transactions occur for which the ultimate tax outcome is uncertain. In addition, respective tax authorities periodically audit our income tax returns. These audits examine our significant tax filing positions, including the timing and amounts of deductions and the allocation of income among tax jurisdictions. We adjust our income tax provision in the period in which we determine the actual outcomes will likely be different from our estimates. The recognition or derecognition of income tax expense related to uncertain tax positions is determined under the guidance as prescribed by the Financial Accounting Standards Board (FASB). As of December 31, 2009 and December 31, 2010, the accrued liability for unrecognized tax benefits was approximately $50,000 and $253,000, respectively.
43
Table of Contents
Share-Based Compensation
We account for stock-based compensation expense for share-based payment awards to our employees and directors at the estimated fair value on the grant date. The fair value of stock option grants is determined using the Black-Scholes option pricing model, which requires us to make several assumptions including, but not limited to risk free interest rate, expected volatility, dividend yield and expected term of the option. Restricted stock awards are valued on the date of grant and have no purchase price. All share-based compensation is recorded net of an estimated forfeiture rate, which is based upon historical activity.
The following table summarizes the stock-based compensation expense reported in net income for the years ended December 31, 2008, 2009 and 2010:
| Year Ended December 31, | ||||||||||||
| 2008 | 2009 | 2010 | ||||||||||
| (in thousands) | ||||||||||||
| Employee stock-based compensation: |
||||||||||||
| Stock options |
$ | 1,152 | $ | 1,200 | $ | 456 | ||||||
| Restricted stock awards |
859 | 1,349 | 1,489 | |||||||||
| 2,011 | 2,549 | 1,945 | ||||||||||
| Non-employee director stock-based compensation: |
||||||||||||
| Restricted stock awards |
216 | 230 | 225 | |||||||||
| Total stock-based compensation |
$ | 2,227 | $ | 2,779 | $ | 2,170 | ||||||
As of December 31, 2010, there was $615,000 of total unrecognized compensation costs related to outstanding stock options that will be amortized over a weighted average period of 1.6 years. In addition, there was $2.4 million of total unrecognized compensation costs related to restricted stock grants that will be amortized over a weighted average period of 2.5 years.
Accounting for Goodwill and Intangible Assets
As of December 31, 2010, our goodwill and intangible assets totaled $18.4 million. Goodwill and intangible assets require significant management estimates and judgment, including the valuation and life determination in connection with the initial purchase price allocation and the ongoing evaluation for impairment.
In connection with the purchase price allocations of acquisitions, we rely on in-house financial expertise or utilize a third-party expert, if considered necessary. The purchase price allocation process requires management estimates and judgment as to expectations for the acquisition. For example, certain growth rates, discount rates and operating margins were assumed for different acquisitions. If actual growth rates, discount rates or operating margins, among other assumptions, differ from the estimates and judgments used in the purchase price allocation, the amounts recorded in the financial statements for goodwill and intangible assets could be subject to charges for impairment in the future.
We review the recoverability of goodwill and other intangible assets having indefinite useful lives using a fair-value based approach on an annual basis, or more frequently whenever events occur or circumstances indicate that the asset might be impaired. We evaluate the goodwill at the reporting unit level. We have determined that we have two reporting units, which are based on our core lending operations and our automotive operations. For testing purposes, we have elected to aggregate all reporting units of our core lending operations into a single reporting unit, as we believe all our core lending branches have similar economic characteristics and our reporting units are similar with respect to the nature of the products and services, type of customer and the methods used to provide our services. We assess the fair value of our reporting units based on weighted average of valuations based on market multiples and discounted cash flows. The key assumptions used in the discounted
44
Table of Contents
cash flow valuations are discount rates and perpetual growth rates applied to cash flow projections. Also inherent in the discounted cash flow valuation models are past performance, projections and assumptions in current operating plans and revenue growth. These assumptions contemplate business, market and overall economic conditions.
Other factors that are considered important in determining whether an impairment of goodwill or intangible assets might exist include significant continued underperformance compared to peers, significant changes in our business and products, material and ongoing negative industry or economic trends, or other factors specific to each asset being evaluated. Any changes in key assumptions about our business and our prospects, or changes in market conditions or other externalities, could result in an impairment charge and such a charge could have a material adverse effect on our financial condition and results of operations. A detailed evaluation was performed as of December 31, 2010 and the computed fair value of our reporting units was in excess of the carrying amounts. As a result of this evaluation, it was determined that no impairment of goodwill or intangibles existed as of December 31, 2010.
SUMMARY OF FINANCIAL INFORMATION
The following tables set forth our results of operations for the years ended December 31, 2008, 2009 and 2010:
| Year Ended December 31, | Year Ended December 31, | |||||||||||||||||||||||
| 2008 | 2009 | 2010 | 2008 | 2009 | 2010 | |||||||||||||||||||
| (in thousands) | (percentage of revenues) | |||||||||||||||||||||||
| Revenues |
||||||||||||||||||||||||
| Payday loan fees |
$ | 166,371 | $ | 152,797 | $ | 131,624 | 79.8 | % | 73.8 | % | 70.0 | % | ||||||||||||
| Automotive sales, interest and fees |
6,120 | 15,293 | 19,914 | 2.9 | % | 7.4 | % | 10.6 | % | |||||||||||||||
| Other |
36,122 | 38,944 | 36,550 | 17.3 | % | 18.8 | % | 19.4 | % | |||||||||||||||
| Total revenues |
208,613 | 207,034 | 188,088 | 100.0 | % | 100.0 | % | 100.0 | % | |||||||||||||||
| Branch expenses |
||||||||||||||||||||||||
| Salaries and benefits |
44,243 | 41,980 | 40,432 | 21.2 | % | 20.3 | % | 21.5 | % | |||||||||||||||
| Provision for losses |
51,231 | 44,135 | 37,842 | 24.6 | % | 21.3 | % | 20.1 | % | |||||||||||||||
| Occupancy |
23,539 | 21,651 | 20,665 | 11.3 | % | 10.5 | % | 11.0 | % | |||||||||||||||
| Cost of sales—automotive |
3,202 | 6,611 | 9,675 | 1.5 | % | 3.2 | % | 5.1 | % | |||||||||||||||
| Depreciation and amortization |
3,909 | 3,796 | 3,290 | 1.9 | % | 1.8 | % | 1.7 | % | |||||||||||||||
| Other |
13,222 | 12,378 | 12,624 | 6.3 | % | 6.0 | % | 6.8 | % | |||||||||||||||
| Total branch expenses |
139,346 | 130,551 | 124,528 | 66.8 | % | 63.1 | % | 66.2 | % | |||||||||||||||
| Branch gross profit |
69,267 | 76,483 | 63,560 | 33.2 | % | 36.9 | % | 33.8 | % | |||||||||||||||
| Regional expenses |
13,075 | 13,584 | 13,921 | 6.3 | % | 6.6 | % | 7.4 | % | |||||||||||||||
| Corporate expenses |
24,738 | 24,513 | 22,101 | 11.9 | % | 11.8 | % | 11.8 | % | |||||||||||||||
| Depreciation and amortization |
2,931 | 2,969 | 2,653 | 1.4 | % | 1.4 | % | 1.4 | % | |||||||||||||||
| Interest expense |
4,313 | 3,352 | 2,401 | 2.1 | % | 1.6 | % | 1.3 | % | |||||||||||||||
| Other expense, net |
447 | 193 | 148 | 0.1 | % | 0.1 | % | 0.1 | % | |||||||||||||||
| Income from continuing operations before income taxes |
23,763 | 31,872 | 22,336 | 11.4 | % | 15.4 | % | 11.8 | % | |||||||||||||||
| Provision for income taxes |
10,097 | 12,403 | 8,121 | 4.8 | % | 6.0 | % | 4.3 | % | |||||||||||||||
| Income from continuing operations |
13,666 | 19,469 | 14,215 | 6.6 | % | 9.4 | % | 7.5 | % | |||||||||||||||
| Gain (loss) from discontinued operations, net of income tax |
(87 | ) | 360 | (2,272 | ) | (0.1 | )% | 0.2 | % | (1.2 | )% | |||||||||||||
| Net Income |
$ | 13,579 | $ | 19,829 | $ | 11,943 | 6.5 | % | 9.6 | % | 6.3 | % | ||||||||||||
45
Table of Contents
SUMMARY OF OPERATING INFORMATION
The following tables set forth our branch information and other operating information for the years ended December 31, 2008, 2009 and 2010:
| Year Ended December 31, | ||||||||||||
| 2008 | 2009 | 2010 | ||||||||||
| Short-term Lending Branch Information: |
||||||||||||
| Number of branches, beginning of year |
596 | 585 | 556 | |||||||||
| De novo opened |
12 | 3 | 1 | |||||||||
| Acquired |
1 | |||||||||||
| Closed |
(24 | ) | (32 | ) | (34 | ) | ||||||
| Number of branches, end of year |
585 | 556 | 523 | |||||||||
| Average number of branches open during year |
591 | 564 | 543 | |||||||||
| Average number of branches open during year (excluding branches reported as discontinued operations)(a) |
507 | 502 | 502 | |||||||||
| Average revenue per Financial Services branch (in thousands) |
$ | 399 | $ | 382 | $ | 335 | ||||||
| (a) | The average number of branches for each year excludes 21 branches (primarily in Arizona, Washington and South Carolina) that are scheduled to close during first half of 2011. |
| Year Ended December 31, | ||||||||||||
| 2008 | 2009 | 2010 | ||||||||||
| Other Information: |
||||||||||||
| Payday loans |
||||||||||||
| Loan volume (in thousands) |
$ | 1,175,156 | $ | 1,075,135 | $ | 903,801 | ||||||
| Average loan (principal plus fee) |
370.09 | 366.97 | 374.90 | |||||||||
| Average fees per loan |
53.98 | 54.03 | 56.22 | |||||||||
| Installment loans: |
||||||||||||
| Installment loan volume (in thousands) |
$ | 31,499 | $ | 28,471 | $ | 29,333 | ||||||
| Average loan (principal plus fee) |
511.13 | 499.80 | 489.60 | |||||||||
| Average term (days) |
186 | 185 | 172 | |||||||||
| Automotive loans: |
||||||||||||
| Automotive loan volume (in thousands) |
$ | 5,182 | $ | 12,656 | $ | 15,835 | ||||||
| Average loan (principal) |
8,622 | 8,753 | 9,375 | |||||||||
| Average term (months) |
35 | 31 | 33 | |||||||||
| Locations, end of period |
3 | 5 | 5 | |||||||||
| Vehicles sold |
656 | 1,475 | 1,761 | |||||||||
46
Table of Contents
Results of Operations—2010 Compared to 2009
Income from Continuing Operations
For the year ended December 31, 2010, income from continuing operations was $14.2 million compared to $19.5 million in 2009. A discussion of the various components of income from continuing operations follows.
Revenues
Revenues totaled $188.1 million in 2010 compared to $207.0 million in 2009, a decrease of $18.9 million or 9.1%. The decrease in revenues was primarily due to reduced payday and installment loan volumes, partially offset by higher automotive revenues.
Revenues from our payday loan product represent our largest source of revenues and were approximately 70.0% of total revenues for the year ended December 31, 2010. With respect to payday loan volume, we originated approximately $903.8 million in loans during 2010, which was a decline of 15.9% from the $1.1 billion during 2009. This decline is primarily attributable to unfavorable law changes in Washington and South Carolina that restrict customer access to payday loans and the termination of the payday loan law in Arizona on June 30, 2010. The average payday loan (including fee) totaled $374.90 in 2010 versus $366.97 during 2009. Average fees received from customers per loan increased from $54.03 in 2009 to $56.22 in 2010. Our average fee rate per $100 for 2010 was $17.64 compared to $17.26 in 2009. A $4.6 million improvement in automotive sales and interest revenues partially offset the short-term lending revenue declines. We believe this increase is attributable to improved customer demand and an additional year of operating in the same locations.
Revenues from installment loans, credit service fees, check cashing, title loans and other sources totaled $38.9 million and $36.6 million for the years ended December 31, 2009 and 2010, respectively. The decrease was primarily due to the discontinuance of the open-end credit product in Virginia in second quarter 2009 and a decline in check cashing fees, which reflects a decrease in customer demand for this product. These declines were partially offset by an increase in CSO fees due to customer demand and title loan fees as a result of Arizona customers transitioning to the title product from the payday product beginning in July 2010. The following table summarizes other revenues:
| Year Ended December 31, | Year Ended December 31, | |||||||||||||||
| 2009 | 2010 | 2009 | 2010 | |||||||||||||
| (in thousands) | (percentage of revenues) | |||||||||||||||
| Installment loan fees |
$ | 17,107 | $ | 17,326 | 8.3 | % | 9.2 | % | ||||||||
| Credit service fees |
6,778 | 7,322 | 3.3 | % | 3.9 | % | ||||||||||
| Check cashing fees |
5,175 | 4,537 | 2.5 | % | 2.4 | % | ||||||||||
| Title loan fees |
3,116 | 4,729 | 1.5 | % | 2.5 | % | ||||||||||
| Open-end credit fees |
3,694 | 56 | 1.8 | % | 0.0 | % | ||||||||||
| Other fees |
3,074 | 2,580 | 1.4 | % | 1.4 | % | ||||||||||
| Total |
$ | 38,944 | $ | 36,550 | 18.8 | % | 19.4 | % | ||||||||
47
Table of Contents
We evaluate our branches based on revenue growth, with consideration given to the length of time a branch has been open and its geographic location. The following table summarizes our revenues and average revenue per branch per month for the years ended December 31, 2009 and 2010 based on the year that a branch was opened or acquired. Note the table below does not include 21 branches that are scheduled to be closed in the first half of 2011.
| Year Opened/Acquired |
Number
of Branches |
Revenues | Average Revenue/Branch/Month | |||||||||||||||||||||
| 2009 | 2010 | % Change | 2009 | 2010 | ||||||||||||||||||||
| (in thousands) | (in thousands) | |||||||||||||||||||||||
| Financial Services: |
||||||||||||||||||||||||
| Pre - 1999 |
33 | $ | 22,845 | $ | 20,917 | (8.4 | )% | $ | 58 | $ | 53 | |||||||||||||
| 1999 |
36 | 18,139 | 16,529 | (8.9 | )% | 42 | 38 | |||||||||||||||||
| 2000 |
45 | 19,617 | 18,843 | (3.9 | )% | 36 | 35 | |||||||||||||||||
| 2001 |
29 | 12,859 | 10,638 | (17.3 | )% | 37 | 31 | |||||||||||||||||
| 2002 |
49 | 19,593 | 16,861 | (13.9 | )% | 33 | 29 | |||||||||||||||||
| 2003 |
39 | 14,612 | 11,423 | (21.8 | )% | 31 | 24 | |||||||||||||||||
| 2004 |
55 | 18,303 | 16,028 | (12.4 | )% | 28 | 24 | |||||||||||||||||
| 2005 |
124 | 38,370 | 36,002 | (6.2 | )% | 26 | 24 | |||||||||||||||||
| 2006 |
64 | 18,865 | 13,332 | (29.3 | )% | 25 | 17 | |||||||||||||||||
| 2007 |
16 | 5,355 | 4,973 | (7.1 | )% | 28 | 26 | |||||||||||||||||
| 2008 |
10 | 2,773 | 2,173 | (21.7 | )% | 23 | 18 | |||||||||||||||||
| 2009 |
1 | 24 | 182 | (b) | 2 | 15 | ||||||||||||||||||
| 2010 |
1 | 148 | (b) | 12 | ||||||||||||||||||||
| Sub-total |
502 | 191,355 | 168,049 | (12.2 | )% | $ | 32 | $ | 28 | |||||||||||||||
| Consolidated branches(a) |
264 | |||||||||||||||||||||||
| Automotive |
15,293 | 19,914 | ||||||||||||||||||||||
| Other |
122 | 125 | ||||||||||||||||||||||
| Total |
$ | 207,034 | $ | 188,088 | (9.2 | )% | ||||||||||||||||||
| (a) | Amounts represent branches that were consolidated into nearby branches and therefore were not reported as discontinued operations. |
| (b) | Not meaningful. |
As of December 31, 2010, all but two of our branches are comparable branches. Revenues for comparable branches decreased 12.3%, or $23.6 million, to $167.7 million in 2010. This decrease is primarily attributable to reduced customer demand across most states.
We believe the overall decline in our core short-term lending revenues during 2010 was primarily due to legislative changes, as well as the current state of the economy. With high unemployment rates, low consumer spending and negative consumer confidence, we anticipate that customer demand will continue to remain soft during 2011. In addition, although we began offering title loans in our Arizona branches upon the expiration of the Arizona payday lending law on June 30, 2010, our customers have not embraced the title loan product. As a result, our overall revenues in Arizona have declined significantly and will continue to compare unfavorably during the first half of 2011. In addition, a new law becomes effective in Illinois in March 2011 that includes, among other things, limitations on the number of loans a customer may have at one time throughout the state. This type of customer restriction, when passed in other states such as Washington, South Carolina and Kentucky, has resulted in a 30% to 60% decline in annual revenues depending on the types of alternative products that competitors may offer within the state. Absent other changes in payday lending laws or dramatic fluctuations in the broader economy and markets, we expect the net impact of the Illinois law change as noted above, as well as the residual effect of Arizona in first half 2011 versus 2010 to reduce revenues by $7.0 million to $10.0 million and to reduce branch gross profit by $5.0 million to $7.0 million during the year ended December 31, 2011 compared to 2010.
48
Table of Contents
Branch Expense
Total branch expenses were $124.5 million during 2010 compared to $130.6 million in 2009, a decrease of $6.1 million, or 4.7%. In states where we have experienced negative legislative and regulatory changes, we have reduced expenses to core levels to compensate for the significant declines in revenue. For these locations, to reduce expenses any further would require the closure of the branch. Branch operating costs, exclusive of loan losses, increased to $86.7 million during 2010 compared to $86.4 million during 2009. The slight increase was primarily due to higher cost of sales and increased marketing costs in our Automotive segment substantially offset by reduced compensation and occupancy costs in our Financial Services segment. The decline in compensation and occupancy expenses is a result of efforts to minimize costs at branches in states where legislative changes occurred during the last year. Branch-level salaries and benefits decreased by $1.6 million, due to a decline in field personnel and reduced overtime. The total number of field personnel averaged 1,650 during 2010 compared to 1,794 in the prior year.
Our provision for losses decreased from $44.1 million during 2009 to $37.8 million during 2010. Our loss ratio was 20.1% during 2010 versus 21.3% during 2009. The improvement in the loss ratio from 2009 to 2010 was largely due to improvements in the Automotive segment and the poor 2009 loss experience associated with our Virginia open-end credit product. Our charge-offs as a percentage of revenue were 39.0% during 2010 compared to 38.6% during 2009. Our collection rate was 47.7% in 2010 versus 49.3% in 2009. We received cash of approximately $494,000 from selling older debt during 2010 compared to $972,000 during 2009.
Financial Services comparable branches totaled $34.6 million in loan losses during 2010 compared to $40.5 million in loan losses during 2009. In our comparable branches, the loss ratio was 20.7% during 2010 down from 21.2% for the same branches during 2009.
With respect to 2011, we believe that our collections experience will be consistent with historical levels, as customers continue to adapt to the current state of the economy.
Occupancy costs were $20.7 million during 2010, compared to $21.7 million in 2009, a decrease of $1.0 million. Occupancy costs as a percentage of revenues increased from 10.5% in 2009 to 11.0% in 2010.
Branch Gross Profit
Branch gross profit declined by $12.9 million, or 16.9%, from $76.5 million in 2009 to $63.6 million in 2010. Branch gross margin, which is branch gross profit as a percentage of revenues, decreased from 36.9% in 2009 to 33.8% in 2010. The majority of the decrease year to year was attributable to results from regulatory-affected states (Washington, South Carolina, Kentucky, Virginia and Arizona), partially offset by improvements in the Automotive segment. The gross margin for Financial Services comparable branches in 2010 was 34.4% compared to 38.9% in 2009.
49
Table of Contents
The following table summarizes our branch gross profit, gross margin percentage and loss ratio percentage based on the year that a branch was opened or acquired. Note the table below does not include 21 branches that are scheduled to be closed in the first half of 2011.
| Year Opened/Acquired |
Branches | Gross Profit (Loss) | Gross Margin % | Loss Ratio | ||||||||||||||||||||||||
| 2009 | 2010 | 2009 | 2010 | 2009 | 2010 | |||||||||||||||||||||||
| (in thousands) | ||||||||||||||||||||||||||||
| Financial Services: |
||||||||||||||||||||||||||||
| Pre - 1999 |
33 | $ | 11,758 | $ | 10,040 | 51.5 | % | 48.0 | % | 17.6 | % | 18.8 | % | |||||||||||||||
| 1999 |
36 | 7,657 | 6,506 | 42.2 | % | 39.4 | % | 18.1 | % | 17.7 | % | |||||||||||||||||
| 2000 |
45 | 8,175 | 7,885 | 41.7 | % | 41.8 | % | 22.2 | % | 21.8 | % | |||||||||||||||||
| 2001 |
29 | 5,981 | 3,835 | 46.5 | % | 36.1 | % | 18.4 | % | 23.0 | % | |||||||||||||||||
| 2002 |
49 | 7,554 | 6,016 | 38.6 | % | 35.7 | % | 24.0 | % | 21.9 | % | |||||||||||||||||
| 2003 |
39 | 5,359 | 3,576 | 36.7 | % | 31.3 | % | 23.9 | % | 20.2 | % | |||||||||||||||||
| 2004 |
55 | 7,247 | 5,649 | 39.6 | % | 35.2 | % | 16.9 | % | 16.8 | % | |||||||||||||||||
| 2005 |
124 | 12,545 | 10,602 | 32.7 | % | 29.4 | % | 21.9 | % | 21.2 | % | |||||||||||||||||
| 2006 |
64 | 6,128 | 1,833 | 32.5 | % | 13.7 | % | 23.6 | % | 24.4 | % | |||||||||||||||||
| 2007 |
16 | 1,266 | 1,299 | 23.6 | % | 26.1 | % | 31.7 | % | 25.3 | % | |||||||||||||||||
| 2008 |
10 | 819 | 453 | 29.5 | % | 20.9 | % | 22.4 | % | 17.1 | % | |||||||||||||||||
| 2009 |
1 | (45 | ) | 11 | (c) | 6.0 | % | 54.4 | % | 34.3 | % | |||||||||||||||||
| 2010 |
1 | (25 | ) | (34 | ) | (c) | 27.4 | % | ||||||||||||||||||||
| Sub-total |
502 | 74,419 | 57,671 | 38.9 | % | 34.3 | % | 21.2 | % | 20.7 | % | |||||||||||||||||
| Consolidated branches(a) |
(256 | ) | (32 | ) | ||||||||||||||||||||||||
| Automotive |
(252 | ) | 2,891 | (1.6 | )% | 14.5 | % | 36.5 | % | 21.8 | % | |||||||||||||||||
| Other(b) |
2,572 | 3,030 | ||||||||||||||||||||||||||
| Total |
$ | 76,483 | $ | 63,560 | 36.9 | % | 33.8 | % | 21.3 | % | 20.1 | % | ||||||||||||||||
| (a) | Amounts represent branches that were consolidated into nearby branches and therefore were not reported as discontinued operations. |
| (b) | Includes the receipt of cash from the sale of older debt for approximately $972,000 and $494,000 for the years ended December 31, 2009 and 2010, respectively. |
| (c) | Not meaningful. |
Regional and Corporate Expenses
Regional and corporate expenses declined by $2.1 million, from $38.1 million during 2009 to $36.0 million during 2010. This decrease is primarily attributable to reduced performance-based incentive and equity compensation. Together, regional and corporate expenses were approximately 18.4% of revenues in 2009 compared to 19.2% of revenues in 2010.
Interest and Other Expenses
Net interest expense totaled $2.4 million for the year ended December 31, 2010 compared to net interest expense of $3.4 million in 2009 as a result of lower average debt balances.
Income Tax Provision
The effective income tax rate for the year ended December 31, 2010 was 36.4% compared to 38.9% in the prior year. This decline is attributable to provision-to-return adjustments in the current year, largely related to state and employment tax credits. We expect our effective tax rate for 2011 to be in the range of 38.0% to 40.0%.
50
Table of Contents
Results of Operations—2009 Compared to 2008
Income from Continuing Operations
For the year ended December 31, 2009, income from continuing operations was $19.5 million compared to $13.7 million in 2008. A discussion of the various components of income from continuing operations follows.
Revenues
Revenues totaled $207.0 million in 2009 compared to $208.6 million in 2008, a decrease of $1.6 million or 0.8%. The decrease in revenues reflects lower payday and installment loan volume, substantially offset by an increase in automobile sales of approximately $9.2 million primarily due to the addition of two locations in January 2009.
Revenues for comparable branches decreased 5.1%, or $10.2 million, to $188.6 million in 2009. This decrease is primarily attributable to reduced customer demand across most states.
Revenues from our payday loan product were approximately 73.8% of total revenues during 2009. We originated approximately $1.1 billion through payday loans during 2009 compared to $1.2 billion during the prior year. The average payday loan (including fee) totaled $366.97 in 2009 compared to $370.09 in 2008. Average fees received from customers per payday loan increased from $53.98 in 2008 to $54.03 in 2009. Our average fee rate per $100 for 2009 was $17.26 compared to $17.08 in 2008.
Revenues from installment loans, credit service fees, check cashing, title loans and other sources totaled $36.1 million and $38.9 million for the years ended December 31, 2008 and 2009, respectively. The following table summarizes other revenues:
| Year Ended December 31, | Year Ended December 31, | |||||||||||||||
| 2008 | 2009 | 2008 | 2009 | |||||||||||||
| (in thousands) | (percentage of revenues) | |||||||||||||||
| Installment loan fees |
$ | 18,220 | $ | 17,107 | 8.7 | % | 8.3 | % | ||||||||
| Credit service fees |
6,202 | 6,778 | 3.0 | % | 3.3 | % | ||||||||||
| Check cashing fees |
5,277 | 5,175 | 2.5 | % | 2.5 | % | ||||||||||
| Title loan fees |
3,672 | 3,116 | 1.8 | % | 1.5 | % | ||||||||||
| Open-end credit fees |
32 | 3,694 | 0.0 | % | 1.8 | % | ||||||||||
| Other fees |
2,719 | 3,074 | 1.3 | % | 1.4 | % | ||||||||||
| Total |
$ | 36,122 | $ | 38,944 | 17.3 | % | 18.8 | % | ||||||||
The revenues from the open-end credit reflect the introduction of the product in Virginia in late 2008. During late second quarter 2009, we discontinued the open-end product offering in Virginia and re-introduced the payday loan product. The decline in installment loans, check cashing fees and title loan fees reflects a decrease in customer demand for these products.
We believe the overall decline in our core short-term lending revenues during 2009 compared to 2008 was primarily due to efforts by our customers to reduce their overall borrowings, likely by using stimulus checks and refundable tax credits received during 2009.
Branch Expense
Total branch expenses were $130.6 million during 2009 compared to $139.3 million in 2008, a decrease of $8.7 million, or 6.2%. Branch operating costs, exclusive of loan losses, decreased to $86.4 million during 2009 compared to $88.1 million during 2008. The decrease was attributable to a reduction in compensation and occupancy costs, partially offset by higher cost of sales associated with our automotive sales locations.
51
Table of Contents
Branch-level salaries and benefits decreased by $2.2 million to $42.0 million in 2009 versus $44.2 million in 2008, due to a decline in field personnel and reduced overtime. The total number of field personnel averaged 1,794 during 2009 compared to 1,905 in the prior year.
Our provision for losses decreased from $51.2 million during 2008 to $44.1 million during 2009. Our loss ratio was 21.3% during 2009 versus 24.6% during 2008. The improvement in the loss ratio from 2008 to 2009 was a result of fewer returned items and a better collection rate on those returns during 2009. Our charge-offs as a percentage of revenue were 38.6% during 2009 compared to 45.1% during 2008. Our collection rate was 49.3% in 2009 versus 47.5% in 2008. We received cash of approximately $972,000 from selling older debt during the 2009 compared to $624,000 during 2008.
The improvement in 2009 would have been more significant, but was hampered by a higher allowance associated with our open-end credit product in Virginia and our developing automotive sales and finance business. Our historical experience when introducing new products or significantly altering existing products (e.g., due to implementation of customer restrictions due to regulatory changes), shows that our losses are substantially higher during the initial months after launch. The open-end credit product was significantly different from the payday product with respect to timing of payments (monthly versus bi-weekly), interest accumulation (continued accumulation versus a one-time fee) and maximum loan amount ($1,000 versus $500). The transition to this product, and then back to the payday product during second quarter 2009, heightened the collection difficulties during a period where we would already have expected higher losses based on our historical experience. As a result, we recorded a higher allowance for losses with respect to these loans to capture the high likelihood of ultimate non-collection of these receivables.
Financial Services comparable branches totaled $39.9 million in loan losses during 2009 compared to $50.1 million in loan losses during 2008. In our comparable branches, the loss ratio was 21.2% during 2009 down from 25.2% for the same branches during 2008.
Occupancy costs were $21.7 million during 2009, compared to $23.5 million in 2008, a decrease of $1.8 million. Occupancy costs as a percentage of revenues decreased from 11.3% in 2008 to 10.5% in 2009. This decline reflects, among other things, reduced costs associated with consolidated branches, as well as instances of rent reductions due to the challenges in the broader economy.
Branch Gross Profit
Branch gross profit increased by $7.2 million, or 10.4%, from $69.3 million in 2008 to $76.5 million in 2009. Branch gross margin, which is branch gross profit as a percentage of revenues, increased from 33.2% in 2008 to 36.9% in 2009.
The gross margin for comparable branches in 2009 was 39.1% compared to 35.2% in 2008, with the improvement resulting from stronger results in the majority of states, partially offset by reduced gross profit in Virginia as we transitioned to the open-end credit product, and then back to the payday product.
Regional and Corporate Expenses
Regional and corporate expenses increased by $300,000, from $37.8 million during 2008 to $38.1 million during 2009. Together, regional and corporate expenses were approximately 18.2% of revenues in 2008 compared to 18.4% of revenues in 2009. During 2008, we incurred expenses of approximately $1.7 million for ballot initiatives associated with contested states. In Arizona, we joined with other short-term loan companies to support a ballot initiative to remove the sunset provision of the existing payday lending law that expired in 2010 and to put into place a series of consumer friendly reforms. In addition, we joined other short-term loan companies in Ohio to support a referendum effort designed to allow citizens a choice in deciding whether to have access to a regulated payday advance product. Exclusive of these 2008 ballot referendum expenses, regional and
52
Table of Contents
corporate increased by $2.0 million during 2009. The increase in 2009 is attributable to higher performance-based incentive compensation compared to the prior year, as well as an increase in charitable contributions and expenses related to legal matters, partially offset by reduced governmental affairs and public education expenditures and lower travel, entertainment and general office costs.
Interest and Other Expenses
Net interest expense totaled $3.4 million for the year ended December 31, 2009 compared to net interest expense of $4.3 million in 2008 as a result of lower average debt balances and interest rates throughout 2009.
Income Tax Provision
The effective income tax rate for the year ended December 31, 2009 was 38.9% compared to 42.5% in the prior year. The higher rate in 2008 was due to the non-deductible ballot referendum expenditures in Ohio and Arizona discussed above.
Discontinued Operations
During the year ended December 31, 2010, we closed 34 of our lower performing branches in various states and we decided to close 21 branches in Arizona, Washington and South Carolina during first half 2011. We recorded approximately $1.8 million in pre-tax charges during 2010 associated with these closings. The charges included a $916,000 loss for the disposition of fixed assets, $671,000 for lease terminations, $155,000 in severance and benefit costs and other related occupancy costs and $33,000 for other costs.
During the year ended December 31, 2009, we closed 32 of our lower performing branches in various states (which included 26 branches reported as discontinued operations and six branches that were consolidated into nearby branches). We recorded approximately $1.5 million in pre-tax charges during the year ended December 31, 2009 associated with the closings reported as discontinued operations. The charges included a $772,000 loss for the disposition of fixed assets, $681,000 for lease terminations and other related occupancy costs, $15,000 in severance and benefit costs and $10,000 for other costs.
During third quarter 2008, we closed 13 of our 32 branches in Ohio, primarily due to a new law that went into effect on September 1, 2008 that effectively precludes payday loans. We recorded approximately $943,000 in pre-tax charges associated with these closings. The charges included a $554,000 loss for the disposition of fixed assets, $342,000 for lease terminations and other related occupancy costs, $40,000 in severance and benefit costs and $7,000 for other costs.
The operations from the branches we closed during 2008, 2009 and 2010 that were not consolidated into nearby branches, as well as the 21 branches we have decided to close during first half 2011, are reported as discontinued operations. The Consolidated Statements of Income and related disclosures in the accompanying notes present the results of these branches as discontinued operations for all periods presented. With respect to the Consolidated Balance Sheets and related disclosures in the accompanying notes and the Consolidated Statements of Cash Flows, the items associated with the discontinued operations are included with continuing operations for all periods presented.
53
Table of Contents
Summarized financial information for discontinued operations is presented below:
| Year Ended December 31, | ||||||||||||
| 2008 | 2009 | 2010 | ||||||||||
| (in thousands) | ||||||||||||
| Total revenues |
$ | 20,188 | $ | 14,715 | $ | 5,165 | ||||||
| Provision for losses |
7,682 | 4,074 | 1,487 | |||||||||
| Other branch expenses |
11,989 | 9,257 | 6,456 | |||||||||
| Branch gross profit (loss) |
517 | 1,384 | (2,778 | ) | ||||||||
| Other, net |
(660 | ) | (789 | ) | (917 | ) | ||||||
| Gain (loss) before income taxes |
(143 | ) | 595 | (3,695 | ) | |||||||
| Income tax expense (benefit) |
(56 | ) | 235 | (1,423 | ) | |||||||
| Gain (loss) from discontinued operations |
$ | (87 | ) | $ | 360 | $ | (2,272 | ) | ||||
Liquidity and Capital Resources
Summary cash flow data is as follows:
| Year Ended December 31, | ||||||||||||
| 2008 | 2009 | 2010 | ||||||||||
| (in thousands) | ||||||||||||
| Cash flows provided by (used for): |
||||||||||||
| Operating activities |
$ | 19,061 | $ | 28,692 | $ | 19,081 | ||||||
| Investing activities |
(4,619 | ) | (5,675 | ) | (2,422 | ) | ||||||
| Financing activities |
(21,273 | ) | (19,180 | ) | (21,522 | ) | ||||||
| Net increase (decrease) in cash and cash equivalents |
(6,831 | ) | 3,837 | (4,863 | ) | |||||||
| Cash and cash equivalents, beginning of year |
24,145 | 17,314 | 21,151 | |||||||||
| Cash and cash equivalents, end of year |
$ | 17,314 | $ | 21,151 | $16,288 | |||||||
Cash Flow Discussion
Our primary source of liquidity is cash provided by operations. On December 7, 2007, we entered into an amended and restated credit agreement with a syndicate of banks that provides for a term loan of $50 million and a revolving line of credit (including provisions permitting the issuance of letters of credit and swingline loans) in the aggregate principal amount of up to $45 million. The credit facility expires on December 6, 2012. The maximum borrowings under the amended credit facility may be increased by $25 million pursuant to bank approval in accordance with the terms set forth in the credit facility.
In fourth quarter 2008 and throughout 2009, the capital and credit markets became volatile as a result of adverse conditions that have caused the failure or near failure of a number of large financial services companies. To varying degrees, the volatility in credit markets continued in 2010. If the capital and credit markets continue to experience volatility and the availability of funds remains limited, it is possible that our ability to access the capital and credit markets may be limited at a time when we would like or need to do so, which could have an impact on our ability to fund our operations, refinance maturing debt or react to changing economic and business conditions. At this time, we believe that our available short-term and long-term capital resources are sufficient to fund our working capital requirements, scheduled debt payments, interest payments, capital expenditures, income tax obligations, anticipated dividends to our stockholders, and anticipated share repurchases for the foreseeable future.
In accordance with accounting principles generally accepted in the United States of America (GAAP), amounts drawn on our revolving credit facility are shown as debt due within one year. Under the terms of our
54
Table of Contents
credit agreement, however, our revolving credit facility does not mature until December 2012, and no amounts are due thereon prior to the maturity of the credit facility. Accordingly, so long as we are in compliance with our financial and other covenants in the credit facility, we do not face a refinancing risk until the term loan and the revolving credit facility mature in December 2012.
Net cash provided by operating activities was $19.1 million in 2008, $28.7 million in 2009 and $19.9 million in 2010. The decline in operating cash flows from 2009 to 2010 is primarily attributable to a decline in net income partially offset by changes in working capital items, which can vary from period to period based on the timing of cash receipts and cash payments. The increase in operating cash flows from 2008 to 2009 is primarily attributable to higher net income in 2009 and changes in working capital items.
Net cash used by investing activities for the year ended December 31, 2010 was $3.3 million, which included $2.1 million for capital expenditures and $852,000 for purchases of corporate-owned life insurance on certain officers to informally fund the non-qualified deferred compensation plan. The capital expenditures primarily included $1.4 million for renovations and technology upgrades to existing and acquired branches and $512,000 for technology and other furnishings at the corporate office. Net cash used by investing activities for the year ended December 31, 2009 was $5.7 million, which consisted of approximately $4.2 million for the acquisition of two buy here, pay here locations in Missouri and $1.6 million for capital expenditures. The capital expenditures primarily included $776,000 for renovations to existing and acquired branches and $470,000 for technology and other furnishings at the corporate office. Net cash used by investing activities for the year ended December 31, 2008 was $4.6 million, which consisted of approximately $4.4 million for net capital expenditures and approximately $205,000 for acquisition costs. The capital expenditures included $1.6 million for the purchase of an auto sales facility, which included three buildings and approximately 1.6 acres of land, $633,000 to open 12 de novo branches in 2008, $1.5 million for renovations to existing and acquired branches, $396,000 for technology and other furnishings at the corporate office and $409,000 for other expenditures.
Net cash used by financing activities was $21.3 million in 2008, $19.2 million in 2009 and $21.5 million in 2010. The use of cash for financing activities in 2010 consisted of $26.5 million in repayments of indebtedness under the credit facility, $9.9 million in repayments on the term loan, $5.4 million in dividend payments to stockholders and $3.0 million for the repurchase of 674,000 shares of common stock. These items were partially offset by proceeds received from the borrowing of $23.3 million under the credit facility. The use of cash for financing activities in 2009 primarily consisted of $32.0 million in repayments of indebtedness under the credit facility, $8.4 million in repayments on the term loan, $5.4 million in dividend payments to stockholders and $1.3 million for the repurchase of 237,000 shares of common stock. These items were partially offset by proceeds received from the borrowing of $27.8 million under the credit facility. The use of cash for financing activities in 2008 consisted of $29.8 million in repayments of indebtedness under the credit facility, $4.0 million in repayments on the term loan, $5.3 million of dividend payments to stockholders and $12.5 million for the repurchase of 1.6 million shares of common stock. These items were partially offset by proceeds received from borrowing $30.1 million under the credit facility.
Cash Flows from Discontinued Operations
In our statement of cash flows, the cash flows from discontinued operations are combined with the cash flows from continuing operations. During 2008, 2009 and 2010, the absence of cash flows from discontinued operations did not have a material effect on our liquidity and capital resource needs.
Liquidity and Capital Resource Discussion
Credit Facility. As noted above, we entered into an amended and restated credit agreement with a syndicate of banks on December 7, 2007, which provides for a term loan of $50 million and a revolving line of credit (including provisions permitting the issuance of letters of credit and swingline loans) in the aggregate principal amount of up to $45 million. The amended credit agreement contains financial covenants related to EBITDA
55
Table of Contents
(income from continuing operations before interest, provision for income taxes, depreciation and amortization, non-cash equity charges and non-cash gains or losses on disposals of fixed assets), fixed charges, leverage, total indebtedness, current assets to consolidated indebtedness and maximum loss ratio. Our obligations under the amended credit agreement are guaranteed by all of our operating subsidiaries, and are secured by liens on substantially all of our personal property and the personal property of our operating subsidiaries. The lenders may accelerate our obligations under the amended credit agreement if there is a change in control of the company, including an acquisition of 25% or more of our equity securities by any person or group. The credit facility matures on December 6, 2012. In addition to scheduled repayments, the term loan contains mandatory prepayment provisions whereby we are required to reduce the outstanding principal amounts of the term loan based on our excess cash flow (as defined in the agreement) and our leverage ratio as of the most recent completed fiscal year. We have determined that a mandatory excess cash flow prepayment on our term loan (based on 2010 operating results) of $3.9 million is due by April 30, 2011.
Borrowings under the credit agreement are available based on two types of loans, base rate loans or LIBOR rate loans. Base rate loans bear interest at the higher of the prime rate or the federal funds rate plus one-half of one percent (0.50%). LIBOR rate loans bear interest at rates based on the LIBOR rate for the applicable loan period. The loan period for a LIBOR rate loan may be one month, two months, three months or six months and the loan may be renewed upon notice to the agent provided that no default has occurred. The credit facility has a grid that adjusts the borrowing rates for both base rate loans and LIBOR rate loans based upon our leverage ratio. Leverage ratio is defined as the ratio of total debt to EBITDA. The credit facility also includes a non-use fee ranging from 0.25% to 0.375%, which is based upon our leverage ratio. The credit facility improves our flexibility with respect to managing working capital, growth and investment needs. As of December 31, 2010, the maximum amount available under the revolving credit facility for future borrowings was $27.8 million.
On March 7, 2008, we entered into an amendment of our credit agreement, which modified the interest margin on the loans based on various leverage ratios, amended certain definitions and financial covenants and added a covenant regarding the minimum ratio of consolidated current assets to total consolidated debt. The amendment also reduced the accordion feature of the credit agreement to $25 million from $50 million. As a result, the maximum borrowings under the amended credit facility may be increased by $25 million pursuant to bank approval in accordance with the terms set forth in the credit facility.
On September 30, 2010, we entered into a second amendment which further modified the interest margin on the loans based on various leverage ratios and revised the minimum EBITDA covenant.
Short-term Liquidity and Capital Requirements. We believe that our available cash, expected cash flow from operations, and borrowings available under our credit facility will be sufficient to fund our liquidity and capital expenditure requirements during 2011. Expected short-term uses of cash include funding of any increases in payday, installment, title and automotive loans, debt repayments (including the mandatory prepayment discussed above), interest payments on outstanding debt, dividend payments, to the extent approved by the board of directors, repurchases of company stock, and financing of new branch expansion and acquisitions, if any. We expect that the majority of our cash requirements will be satisfied through internally generated cash flows, with any shortfall being funded through borrowing under our revolving credit facility.
In November 2008, our board of directors established a regular quarterly dividend of $0.05 per common share. The declaration of dividends is subject to the discretion of our board of directors and will depend on our operating results, financial condition, cash and capital requirements and other factors that the board of directors deems relevant. On February 1, 2011, our board of directors declared a regular quarterly dividend of $0.05 per common share. The dividend was paid March 7, 2011, to stockholders of record as of February 21, 2011. The total amount of the dividends paid was approximately $900,000.
Our credit agreement requires us to maintain a fixed charge coverage ratio (computed in accordance with the credit agreement) of not less than 1.25 to 1. Under our credit agreement, we are required to subtract any cash
56
Table of Contents
dividends paid on our common stock from our operating cash flow (as defined in the agreement) amount used in computing our fixed charge coverage ratio. Thus, our credit agreement may restrict our ability to pay cash dividends in the future.
Long-term Liquidity and Capital Requirements. The following table summarizes our expected long-term capital requirements as of December 31, 2010. The future capital requirements include indebtedness and payments required for the initial non-cancelable term of our operating leases, as well as any payments for periods of expected renewals provided for in a lease that we consider to be reasonably assured of exercising.
| Total | Less than 1 year |
2-3 years | 4-5 years | More than 5 years |
||||||||||||||||
| (in thousands) | ||||||||||||||||||||
| Non-cancelable operating lease commitments |
$ | 26,779 | $ | 11,835 | $ | 12,142 | $ | 2,802 | $ | — | ||||||||||
| Reasonably assured renewals of operating leases |
52,587 | 1,791 | 12,298 | 16,381 | 22,117 | |||||||||||||||
| Revolving credit facility |
17,250 | 17,250 | ||||||||||||||||||
| Interest on long-term debt(a) |
1,209 | 743 | 466 | |||||||||||||||||
| Long-term debt(b) |
27,744 | 10,863 | 16,881 | |||||||||||||||||
| Total |
$ | 125,569 | $ | 42,482 | $ | 41,787 | $ | 19,183 | $ | 22,117 | ||||||||||
| (a) | Represents estimated interest payments to be made on our long-term debt. All interest payments assume that principal payments are made as originally scheduled and the interest payments are estimated based on the current interest rates. |
| (b) | With respect to the amount due in 2011 for the long-term debt, the $10.9 million includes a mandatory principal prepayment of $3.9 million. |
While the borrowings on our revolving credit facility are classified as short-term obligations on our consolidated balance sheet, the credit facility, by its terms, does not mature until December 6, 2012.
In addition to scheduled debt repayments, our term loan contains mandatory prepayment provisions whereby we are required to reduce the outstanding principal amounts of the term loan based on our excess cash flow (as defined in the agreement) and our leverage ratio as of the most recent completed fiscal year. As a result, an additional debt payment is likely to be required in April 2012.
In February 2005, we entered into a seven-year lease agreement to relocate our corporate headquarters to office space in Overland Park, Kansas. We moved into the new location in the second quarter of 2005. In January 2011, we amended the lease agreement to extend the lease term and modify the lease payments. The lease was extended through October 31, 2017 and includes a renewal option for an additional five years. The rent expense associated with the lease (net of tenant allowances) will be approximately $689,000 per year.
As part of our business strategy, we consider acquisitions and strategic business expansion opportunities from time to time. We believe our current cash position, the availability under the credit facility and our expected cash flow from operations should provide the capital needed to fund internal growth opportunities, assuming no material acquisitions in 2011.
In response to changes in the overall market, over the past three years we have substantially reduced our branch expansion efforts. Since January 1, 2007, we have opened 36 branches with the majority (32) of those opened during 2007 and 2008. The capital costs of opening a de novo branch include leasehold improvements, signage, computer equipment and security systems, and the costs vary depending on the branch size, location and the services being offered. The average cost of capital expenditures for branches opened during 2007 and 2008 was approximately $44,000 per branch. Existing branches require minimal ongoing capital expenditure, with the majority of any expenditures related to discretionary renovation or relocation projects.
57
Table of Contents
As of December 31, 2010, we had five buy here, pay here locations. During the start-up of these operations, capital requirements are not material. As the business grows, however, the business requires ongoing replenishment of automobile inventory. Sales of automobiles are typically completed through a small down payment and an installment loan. As a result, the initial phase of a buy here, pay here operation is cash flow negative. Based on initial information and industry research, it appears that a typical location requires approximately $2.5 million to $3.5 million of capital availability over a two to four year period. As this business progresses, we will evaluate the capital requirements and the associated return on investment. We have the ability to manage the capital needs of the business through reduction of the number of automobiles held at each location, although reduced inventory levels may limit sales because of the appearance of limited vehicle selection for the customer.
Concentration of Risk
Our branches located in the states of Missouri, California, Kansas and Illinois represented approximately 30%, 15%, 10%, and 6%, respectively, of total revenues for the year ended December 31, 2010. Our branches located in the states of Missouri, California, Kansas, Illinois and New Mexico represented approximately 34%, 15%, 10%, 8% and 5%, respectively, of total branch gross profit for the year ended December 31, 2010. To the extent that laws and regulations are passed that affect our ability to offer payday loans or the manner in which we offer payday loans in any one of those states, our financial position, results of operations and cash flows could be adversely affected. For example, amendments to the South Carolina and Washington laws became effective January 1, 2010. Prior to these new laws in South Carolina and Washington, revenues from each state represented approximately 7% and 5%, respectively of our total revenues. For the year ended December 31, 2010, compared to the same period in the prior year, revenues from South Carolina and Washington declined by $6.8 million and $3.7 million, respectively and gross profit declined by $5.4 million and $2.6 million, respectively. Similarly, the Arizona payday loan statutory authority expired by its terms on June 30, 2010, and the termination of this law had a significant adverse effect on the revenues and profitability of the Company. For the year ended December 31, 2010, revenues and gross profit from our Arizona branches declined by $6.9 million and $5.4 million, respectively, from the same period in the prior year.
A new law becomes effective in Illinois in March 2011 that includes, among other things, limitations on the number of loans a customer may have at one time throughout the state. This type of customer restriction, when passed in other states such as Washington, South Carolina and Kentucky, has resulted in a 30% to 60% decline in annual revenues depending on the types of alternative products that competitors may offer within the state.
Impact of Inflation
We do not believe that inflation has a material impact on our income or operations.
Seasonality
Our Financial Services business is seasonal due to fluctuating demand for short-term loans during the year. Historically, we have experienced our highest demand for short-term loans in January and in the fourth calendar quarter. As a result, to the extent that internally generated cash flows are not sufficient to fund the growth in loans receivable, fourth quarter and the month of January are the most likely periods of time for utilization or increase in borrowings under our credit facility. Due to the receipt by customers of their income tax refunds, demand for short-term loans has historically declined in the balance of the first quarter of each calendar year and the first month of the second quarter. Accordingly, this period is typically when any outstanding borrowings under the credit facility would be repaid (exclusive of any other capital-usage activity, such as acquisitions, significant stock repurchases, etc.). Our loss ratio historically fluctuates with these changes in short-term loan demand, with a higher loss ratio in the second and third quarters of each calendar year and a lower loss ratio in the first and fourth quarters of each calendar year. During mid-second quarter through third quarter, periodic utilization of our credit facility is not unusual, based on the level of loan losses and other capital-usage activities. Due to the seasonality of our business, results of operations for any quarter are not necessarily indicative of the results of operations that may be achieved for the full year.
58
Table of Contents
Similarly, our Automotive segment experiences seasonality as automobile sales peak during the first quarter of each year, primarily as a result of the receipt by customers of their income tax refunds, which are used as down payments for a vehicle. Automobile sales in the final three quarters are generally lower than the first quarter. In addition, vehicle acquisition costs tend to increase in the second half of the year as companies build inventories for the expected first quarter volumes.
Impact of Recent Accounting Pronouncements
In December 2010, the FASB updated its guidance related to when to perform step two of the goodwill impairment test for reporting units with zero or negative carrying amounts. The updated guidance requires that for any reporting unit with a zero or negative carrying amount, and entity is required to perform Step 2 of the goodwill impairment test if it is more likely than not that a goodwill impairment exists. In determining whether it is more likely than not that a goodwill impairment exists, an entity should consider whether there are any adverse qualitative factors indicating that an impairment may exist. The updated guidance is effective for fiscal years, and interim periods within those years, beginning after December 15, 2010. We do not expect the adoption to have a material impact on our consolidated financial statements.
In December 2010, the FASB updated its guidance related to disclosure of supplementary pro forma information for business combinations. The updated guidance requires that if comparative financial statements are presented, the pro forma revenue and earnings of the combined entity for the comparable prior reporting period should be reported as though the acquisition date for all business combinations that occurred during the current year had been as of the beginning of the comparable prior annual reporting period only. The updated guidance is effective prospectively for business combinations for which the acquisition date is on or after the beginning of the first annual reporting period beginning on or after December 15, 2010, with early adoption permitted. We have not yet adopted the updated guidance and we do not expect the adoption to have an impact on our consolidated financial statements as the updated guidance only affects disclosures related to future business combinations.
In January 2010, the Financial Accounting Standards Board (FASB) issued guidance to amend the disclosure requirements related to recurring and nonrecurring fair value measurements. The guidance requires new disclosures on the transfers of assets and liabilities between Level 1 (quoted prices in active market for identical assets or liabilities) and Level 2 (significant other observable inputs) of the fair value measurement hierarchy, including the reasons and the timing of the transfers. Additionally, the guidance requires a roll forward of activities on purchases, sales, issuance, and settlements of the assets and liabilities measured using significant unobservable inputs (Level 3 fair value measurements). The Company adopted this guidance on January 1, 2010. The adoption did not have a material effect on the Company’s consolidated financial statements.
In July 2010, FASB issued guidance to improve disclosures that an entity provides about the credit quality of its financing receivables and the related allowance for credit losses. As a result of this guidance, an entity will be required to disaggregate, by portfolio segment or class of financing receivable, certain existing disclosures and provide certain new disclosures about its financing receivables and related allowance for credit losses. For public entities, the disclosures as of the end of a reporting period are effective for interim and annual reporting periods ending on or after December 15, 2010. The disclosures about activity that occurs during a reporting period are effective for interim and annual reporting periods beginning on or after December 15, 2010. This guidance is not expected to have a material impact on the Company’s consolidated financial statements.
Off-Balance Sheet Arrangements
Payday loans are originated at all of our branches, except branches in Texas. For our locations in Texas, we began operating as a CSO, through one of our subsidiaries, in September 2005. As a CSO, we act as a credit service organization on behalf of consumers in accordance with Texas laws. We charge the consumer a fee for arranging for an unrelated third-party to make a loan to the consumer and for providing related services to the
59
Table of Contents
consumer, including a guarantee of the consumer’s obligation to the third-party lender. We also service the loan for the lender. The CSO fee is recognized ratably over the term of the loan. We are not involved in the loan approval process or in determining the loan approval procedures or criteria. As a result, loans made by the lender are not included in our loans receivable balance and are not reflected in the Consolidated Balance Sheets. As noted above, however, we absorb all risk of loss through our guarantee of the consumer’s loan from the lender. As of December 31, 2009 and December 31, 2010, consumers had total loans outstanding with the lender of approximately $2.7 million and $3.0 million, respectively. Because of the economic exposure for potential losses related to the guarantee of these loans, we record a payable at fair value to reflect the anticipated losses related to uncollected loans. The balance of the liability for estimated losses reported in accrued liabilities was approximately $100,000 as of December 31, 2009 and as of December 31, 2010. The following tables summarize the activity in the liability for CSO loan losses during the years ended December 31, 2009 and 2010:
| Year Ended December 31, | ||||||||
| 2009 | 2010 | |||||||
| (in thousands) | ||||||||
| Beginning balance |
$ | 180 | $ | 100 | ||||
| Charge-offs |
(3,272 | ) | (2,798 | ) | ||||
| Recoveries |
837 | 790 | ||||||
| Provision for losses |
2,355 | 2,008 | ||||||
| Ending Balance |
$ | 100 | $ | 100 | ||||
| ITEM 7A. | Quantitative and Qualitative Disclosures About Market Risk |
As of December 31, 2010, we have no material market risk sensitive instruments entered into for trading or other purposes, as defined by accounting principles generally accepted in the United States of America.
Interest rate risk
To the extent we have any, we invest our excess cash balances in short-term investment grade securities including money market accounts that are subject to interest rate risk. The cash and cash equivalents reflected on our balance sheet represents largely uninvested cash in our branches and cash-in-transit. The amount of interest income we earn on these funds will decline with a decline in interest rates. However, due to the short-term nature of short-term investment grade securities and money market accounts, an immediate decline in interest rates would not have a material impact on our financial position, results of operations or cash flows.
We are potentially exposed to interest rate risk on our long-term debt. On December 7, 2007, we entered into an amended and restated credit agreement to replace our existing credit facility. The credit agreement, which includes a $50.0 million five-year term loan and a revolving line of credit (including provisions permitting the issuance of letters of credit and swingline loans) of up to $45.0 million, contains variable rate debt that accrues interest based on the type of loan. Borrowings under the term loan and the credit facility are available based on two types of loans, Base Rate loans or LIBOR Rate loans. Base Rate loans bear interest at the higher of the Prime Rate or the Federal Funds Rate plus one-half of one percent (0.50%). LIBOR Rate loans bear interest at rates based on the LIBOR rate for the applicable loan period. The credit facility has a grid that adjusts the borrowing rates for both Base Rate loans and LIBOR Rate loans based upon our leverage ratio.
On March 31, 2008, we executed an interest rate swap agreement. The swap agreement is designated as a cash flow hedge, and changes the floating rate interest obligation associated with the $50 million term loan into a fixed rate. The swap agreement has a maturity date of December 6, 2012. Under the swap, we pay a fixed interest rate of 3.43% and receive interest at a rate equal to the three-month LIBOR as of the last day of each calendar quarter. As of December 31, 2010, approximately $26.5 million (representing the unpaid principal of the term loan) is subject to the interest rate swap agreement.
60
Table of Contents
We are exposed to interest rate risk on our revolving credit facility, which had a balance of $17.3 million as of December 31, 2010. The weighted average interest rate on our revolving credit facility during 2010 was approximately 2.95%. If prevailing interest rates were to increase 1% over the rates as of December 31, 2010, and the borrowings remained constant, our interest expense would have increased by $173,000 on an annualized basis.
| ITEM 8. | Financial Statements and Supplementary Data |
Our Consolidated Financial Statements and Supplementary Data appear following Item 15 of this report.
| ITEM 9. | Changes in and Disagreements with Accountants on Accounting and Financial Disclosure |
None
| ITEM 9A. | Controls and Procedures |
Evaluation of Disclosure Controls and Procedures
We maintain a system of disclosure controls and procedures that are designed to provide reasonable assurance that information, which is required to be disclosed timely, is accumulated and communicated to management in a timely fashion. A control system, no matter how well conceived and operated, can provide only reasonable, not absolute, assurance that the objectives of the control system are met. Our Chief Executive Officer and Chief Financial Officer, after evaluating the effectiveness of our disclosure controls and procedures (as defined in Rule 13a-15(e) and 15d-15(e) of the Securities Exchange Act of 1934, as amended (the “Exchange Act”)) as of the end of the period covered by this report, have concluded that our disclosure controls and procedures are effective to provide reasonable assurance that information required to be disclosed by us in the reports that we file or submit under the Exchange Act is accumulated and communicated to our management, including our principal executive officer and principal financial officer, as appropriate to allow timely decisions regarding required disclosure and are effective to provide reasonable assurance that such information is recorded, processed, summarized and reported within the time periods specified in the Securities and Exchange Commission’s rules and forms.
Management’s Report on Internal Control Over Financial Reporting
Our management is responsible for establishing and maintaining adequate internal control over financial reporting. As defined in Exchange Act Rule 13a-15(f), internal control over financial reporting is a process designed by, or under the supervision of, our Chief Executive Officer and Chief Financial Officer and effected by our board of directors, management and other personnel, to provide reasonable assurance regarding the reliability of financial reporting and the preparation of financial statements for external purposes in accordance with generally accepted accounting principles.
Under the supervision and with the participation of our management, including our Chief Executive Officer and Chief Financial Officer, we carried out an evaluation of the effectiveness of our internal control over financial reporting as of December 31, 2010 based on the criteria in Internal Control—Integrated Framework issued by the Committee of Sponsoring Organizations of the Treadway Commission (“COSO”). Based upon this evaluation, our management concluded that our internal control over financial reporting was effective as of December 31, 2010.
Grant Thornton LLP, the independent registered public accounting firm that audited our financial statements included in this Annual Report on Form 10-K, has also audited the effectiveness of our internal control over financial reporting as of December 31, 2010 as stated in their report on page 68 of this report.
61
Table of Contents
Changes in Internal Control Over Financial Reporting
Our internal control over financial reporting (as defined in Exchange Act Rules 13a-15(f) and 15d-15 (f)) is designed to provide reasonable assurance regarding the reliability of financial reporting and the preparation of financial statements for external purposes in accordance with generally accepted accounting principles. There were no changes in our internal control over financial reporting that occurred during our most recent fiscal quarter that have materially affected, or are reasonably likely to materially affect, our internal control over financial reporting.
| ITEM 9B. | Other Information |
None
| ITEM 10. | Directors, Executive Officers and Corporate Governance |
Incorporated by reference to our Proxy Statement for our 2011 Annual Meeting of Stockholders to be filed with the Securities and Exchange Commission within 120 days after the close of the year ended December 31, 2010.
| ITEM 11. | Executive Compensation |
Incorporated by reference to our Proxy Statement for our 2011 Annual Meeting of Stockholders to be filed with the Securities and Exchange Commission within 120 days after the close of the year ended December 31, 2010.
| ITEM 12. | Security Ownership of Certain Beneficial Owners and Management and Related Stockholder Matters |
Incorporated by reference to our Proxy Statement for our 2011 Annual Meeting of Stockholders to be filed with the Securities and Exchange Commission within 120 days after the close of the year ended December 31, 2010.
| ITEM 13. | Certain Relationships and Related Transactions, and Director Independence |
Incorporated by reference to our Proxy Statement for our 2011 Annual Meeting of Stockholders to be filed with the Securities and Exchange Commission within 120 days after the close of the year ended December 31, 2010.
| ITEM 14. | Principal Accounting Fees and Services |
Incorporated by reference to our Proxy Statement for our 2011 Annual Meeting of Stockholders to be filed with the Securities and Exchange Commission within 120 days after the close of the year ended December 31, 2010.
62
Table of Contents
| ITEM 15. | Exhibits and Financial Statement Schedules |
The following documents are filed as a part of this report:
| (1) | Financial Statements. The following financial statements, contained on pages 66 to 104 of this report, are filed as part of this report under Item 8—“Financial Statements and Supplementary Data.” |
| (2) | Financial Statement Schedules. All schedules have been omitted because they are not applicable, are insignificant or the required information is shown in the consolidated financial statements or notes thereto. |
| (3) | Exhibits. Exhibits are listed on the Exhibit Index at the end of this report. |
63
Table of Contents
Pursuant to the requirements of Section 13 or 15(d) of the Securities Exchange Act of 1934, as amended, the Company has duly caused this Report to be signed on its behalf by the undersigned, thereunto duly authorized.
| QC HOLDINGS, INC. | ||
| By: | /S/ DON EARLY | |
| Don Early Chairman of the Board and Chief Executive Officer | ||
Dated: March 15, 2011
Pursuant to the requirements of the Securities Exchange Act of 1934, as amended, this Report has been signed below by the following persons on behalf of the Company and in the capacities indicated on March 15, 2011.
| /S/ RICHARD B. CHALKER Richard B. Chalker Director |
/S/ DON EARLY Don Early Chairman of the Board and Chief Executive Officer (Principal Executive Officer) | |
| /S/ GERALD F. LAMBERTI Gerald F. Lamberti Director |
/S/ MARY LOU EARLY Mary Lou Early Vice Chairman, Secretary and Director | |
| /S/ FRANCIS P. LEMERY Francis P. Lemery Director |
/S/ DARRIN J. ANDERSEN Darrin J. Andersen President and Chief Operating Officer | |
| /S/ MARY V. POWELL Mary V. Powell Director |
/S/ DOUGLAS E. NICKERSON Douglas E. Nickerson Chief Financial Officer (Principal Financial and Accounting Officer) | |
| /S/ JACK L. SUTHERLAND Jack L. Sutherland Director |
||
64
Table of Contents
QC Holdings, Inc.
Index to Consolidated Financial Statements
| Page | ||||
| 66 | ||||
| 68 | ||||
| 69 | ||||
| 70 | ||||
| 71 | ||||
| 72 | ||||
65
Table of Contents
REPORT OF INDEPENDENT REGISTERED PUBLIC ACCOUNTING FIRM
The Board of Directors and Stockholders of QC Holdings, Inc. and Subsidiaries:
We have audited the accompanying consolidated balance sheets of QC Holdings, Inc. and Subsidiaries as of December 31, 2010 and 2009, and the related consolidated statements of income, stockholders’ equity, and cash flows for each of the three years in the period ended December 31, 2010. These financial statements are the responsibility of the Company’s management. Our responsibility is to express an opinion on these financial statements based on our audits.
We conducted our audits in accordance with the standards of the Public Company Accounting Oversight Board (United States). Those standards require that we plan and perform the audit to obtain reasonable assurance about whether the financial statements are free of material misstatement. An audit includes examining, on a test basis, evidence supporting the amounts and disclosures in the financial statements. An audit also includes assessing the accounting principles used and significant estimates made by management, as well as evaluating the overall financial statement presentation. We believe that our audits provide a reasonable basis for our opinion.
In our opinion, the consolidated financial statements referred to above present fairly, in all material respects, the financial position of QC Holdings, Inc. and Subsidiaries as of December 31, 2010 and 2009, and the results of its operations and its cash flows for each of the three years in the period ended December 31, 2010, in conformity with accounting principles generally accepted in the United States of America.
We also have audited, in accordance with the standards of the Public Company Accounting Oversight Board (United States), QC Holdings, Inc. and Subsidiaries’ internal control over financial reporting as of December 31, 2010, based on criteria established in Internal Control—Integrated Framework issued by the Committee of Sponsoring Organizations of the Treadway Commission (COSO) and our report dated March 15, 2011, expressed an unqualified opinion thereon.
/s/ GRANT THORNTON LLP
Kansas City, Missouri
March 15, 2011
66
Table of Contents
REPORT OF INDEPENDENT REGISTERED PUBLIC ACCOUNTING FIRM
The Board of Directors and Stockholders of QC Holdings, Inc. and Subsidiaries:
We have audited QC Holdings, Inc. and Subsidiaries’ internal control over financial reporting as of December 31, 2010, based on criteria established in Internal Control—Integrated Framework issued by the Committee of Sponsoring Organizations of the Treadway Commission (COSO). QC Holdings, Inc. and Subsidiaries’ management is responsible for maintaining effective internal control over financial reporting and for its assessment of the effectiveness of internal control over financial reporting, included in the accompanying Management’s Report on Internal Control over Financial Reporting. Our responsibility is to express an opinion on QC Holdings, Inc. and Subsidiaries’ internal control over financial reporting based on our audit.
We conducted our audit in accordance with the standards of the Public Company Accounting Oversight Board (United States). Those standards require that we plan and perform the audit to obtain reasonable assurance about whether effective internal control over financial reporting was maintained in all material respects. Our audit included obtaining an understanding of internal control over financial reporting, assessing the risk that a material weakness exists, testing and evaluating the design and operating effectiveness of internal control based on the assessed risk, and performing such other procedures as we considered necessary in the circumstances. We believe that our audit provides a reasonable basis for our opinion.
A company’s internal control over financial reporting is a process designed to provide reasonable assurance regarding the reliability of financial reporting and the preparation of financial statements for external purposes in accordance with generally accepted accounting principles. A company’s internal control over financial reporting includes those policies and procedures that (1) pertain to the maintenance of records that, in reasonable detail, accurately and fairly reflect the transactions and dispositions of the assets of the company; (2) provide reasonable assurance that transactions are recorded as necessary to permit preparation of financial statements in accordance with generally accepted accounting principles, and that receipts and expenditures of the company are being made only in accordance with authorizations of management and directors of the company; and (3) provide reasonable assurance regarding prevention or timely detection of unauthorized acquisition, use, or disposition of the company’s assets that could have a material effect on the financial statements.
Because of its inherent limitations, internal control over financial reporting may not prevent or detect misstatements. Also, projections of any evaluation of effectiveness to future periods are subject to the risk that controls may become inadequate because of changes in conditions, or that the degree of compliance with the policies or procedures may deteriorate.
In our opinion, QC Holdings, Inc. and Subsidiaries maintained, in all material respects, effective internal control over financial reporting as of December 31, 2010, based on criteria established in Internal Control—Integrated Framework issued by COSO.
We also have audited, in accordance with the standards of the Public Company Accounting Oversight Board (United States), the consolidated balance sheets of QC Holdings, Inc. and Subsidiaries as of December 31, 2010 and 2009, and the related consolidated statements of income, stockholders’ equity, and cash flows for each of the three years in the period ended December 31, 2010, and our report dated March 15, 2011 expressed an unqualified opinion on those financial statements.
/s/ GRANT THORNTON LLP
Kansas City, Missouri
March 15, 2011
67
Table of Contents
QC HOLDINGS, INC. AND SUBSIDIARIES
CONSOLIDATED BALANCE SHEETS
(in thousands, except share and per share amounts)
| December 31, 2009 |
December 31, 2010 |
|||||||
| ASSETS |
||||||||
| Current assets: |
||||||||
| Cash and cash equivalents |
$ | 21,151 | $ | 16,288 | ||||
| Loans, interest and fees receivable, less allowance for losses of $10,803 at December 31, 2009 and $5,300 at December 31, 2010 |
74,973 | 64,319 | ||||||
| Deferred income taxes |
4,419 | 3,706 | ||||||
| Prepaid expenses and other current assets |
5,764 | 9,713 | ||||||
| Total current assets |
106,307 | 94,026 | ||||||
| Property and equipment, net |
18,286 | 14,110 | ||||||
| Goodwill |
16,491 | 16,491 | ||||||
| Deferred income taxes |
1,057 | 1,400 | ||||||
| Other assets, net |
5,945 | 12,015 | ||||||
| Total assets |
$ | 148,086 | $ | 138,042 | ||||
| LIABILITIES AND STOCKHOLDERS’ EQUITY |
||||||||
| Current liabilities: |
||||||||
| Accounts payable |
$ | 162 | $ | 467 | ||||
| Accrued expenses and other current liabilities |
5,075 | 4,200 | ||||||
| Accrued compensation and benefits |
9,210 | 7,606 | ||||||
| Deferred revenue |
5,077 | 4,356 | ||||||
| Revolving credit facility |
20,500 | 17,250 | ||||||
| Current portion of long-term debt |
9,900 | 10,863 | ||||||
| Total current liabilities |
49,924 | 44,742 | ||||||
| Long-term debt |
27,707 | 16,881 | ||||||
| Other non-current liabilities |
4,905 | 4,872 | ||||||
| Total liabilities |
82,536 | 66,495 | ||||||
| Commitments and contingencies |
||||||||
| Stockholders’ equity: |
||||||||
| Common stock, $0.01 par value: 75,000,000 shares authorized; |
207 | 207 | ||||||
| Additional paid-in capital |
67,879 | 67,712 | ||||||
| Retained earnings |
32,182 | 38,710 | ||||||
| Treasury stock, at cost |
(33,981 | ) | (34,590 | ) | ||||
| Accumulated other comprehensive loss |
(737 | ) | (492 | ) | ||||
| Total stockholders’ equity |
65,550 | 71,547 | ||||||
| Total liabilities and stockholders’ equity |
$ | 148,086 | $ | 138,042 | ||||
See accompanying notes to consolidated financial statements.
68
Table of Contents
QC HOLDINGS, INC. AND SUBSIDIARIES
CONSOLIDATED STATEMENTS OF INCOME
(in thousands, except per share amounts)
| Year Ended December 31, | ||||||||||||
| 2008 | 2009 | 2010 | ||||||||||
| Revenues |
||||||||||||
| Payday loan fees |
$ | 166,371 | $ | 152,797 | $ | 131,624 | ||||||
| Automotive sales, interest and fees |
6,120 | 15,293 | 19,914 | |||||||||
| Other |
36,122 | 38,944 | 36,550 | |||||||||
| Total revenues |
208,613 | 207,034 | 188,088 | |||||||||
| Branch expenses |
||||||||||||
| Salaries and benefits |
44,243 | 41,980 | 40,432 | |||||||||
| Provision for losses |
51,231 | 44,135 | 37,842 | |||||||||
| Occupancy |
23,539 | 21,651 | 20,665 | |||||||||
| Costs of sales—automotive |
3,202 | 6,611 | 9,675 | |||||||||
| Depreciation and amortization |
3,909 | 3,796 | 3,290 | |||||||||
| Other |
13,222 | 12,378 | 12,624 | |||||||||
| Total branch expenses |
139,346 | 130,551 | 124,528 | |||||||||
| Branch gross profit |
69,267 | 76,483 | 63,560 | |||||||||
| Regional expenses |
13,075 | 13,584 | 13,921 | |||||||||
| Corporate expenses |
24,738 | 24,513 | 22,101 | |||||||||
| Depreciation and amortization |
2,931 | 2,969 | 2,653 | |||||||||
| Interest expense |
4,313 | 3,352 | 2,401 | |||||||||
| Other expense, net |
447 | 193 | 148 | |||||||||
| Income from continuing operations before income taxes |
23,763 | 31,872 | 22,336 | |||||||||
| Provision for income taxes |
10,097 | 12,403 | 8,121 | |||||||||
| Income from continuing operations |
13,666 | 19,469 | 14,215 | |||||||||
| Gain (loss) from discontinued operations, net of income tax |
(87 | ) | 360 | (2,272 | ) | |||||||
| Net income |
$ | 13,579 | $ | 19,829 | $ | 11,943 | ||||||
| Weighted average number of common shares outstanding: |
||||||||||||
| Basic |
17,877 | 17,437 | 17,259 | |||||||||
| Diluted |
17,983 | 17,580 | 17,341 | |||||||||
| Earnings (loss) per share: |
||||||||||||
| Basic |
||||||||||||
| Continuing operations |
$ | 0.76 | $ | 1.09 | $ | 0.79 | ||||||
| Discontinued operations |
(0.01 | ) | 0.02 | (0.13 | ) | |||||||
| Net Income |
$ | 0.75 | $ | 1.11 | $ | 0.66 | ||||||
| Diluted |
||||||||||||
| Continuing operations |
$ | 0.75 | $ | 1.08 | $ | 0.79 | ||||||
| Discontinued operations |
— | 0.02 | (0.13 | ) | ||||||||
| Net Income |
$ | 0.75 | $ | 1.10 | $ | 0.66 | ||||||
See accompanying notes to consolidated financial statements.
69
Table of Contents
QC HOLDINGS, INC. AND SUBSIDIARIES
CONSOLIDATED STATEMENTS OF CHANGES IN STOCKHOLDERS’ EQUITY
Years Ended December 31, 2008, 2009 and 2010
(in thousands)
| Outstanding shares |
Common stock |
Additional paid-in capital |
Retained earnings |
Treasury stock |
Accumulated other comprehensive loss |
Total stockholders’ equity |
||||||||||||||||||||||
| Balance, December 31, 2007 |
18,787 | $ | 207 | $ | 67,446 | $ | 9,502 | $ | (24,929 | ) | $ | — | $ | 52,226 | ||||||||||||||
| Comprehensive income: |
||||||||||||||||||||||||||||
| Net income |
13,579 | |||||||||||||||||||||||||||
| Unrealized loss on derivative instrument, net of deferred taxes of $666 |
(1,090 | ) | ||||||||||||||||||||||||||
| Total comprehensive income |
12,489 | |||||||||||||||||||||||||||
| Common stock repurchases |
(1,563 | ) | (12,547 | ) | (12,547 | ) | ||||||||||||||||||||||
| Dividends to stockholders |
(5,344 | ) | (5,344 | ) | ||||||||||||||||||||||||
| Issuance of restricted stock awards |
105 | (1,339 | ) | 1,339 | — | |||||||||||||||||||||||
| Stock-based compensation expense |
2,227 | 2,227 | ||||||||||||||||||||||||||
| Stock option exercises |
123 | (1,126 | ) | 1,355 | 229 | |||||||||||||||||||||||
| Tax impact of stock-based compensation |
139 | 139 | ||||||||||||||||||||||||||
| Balance, December 31, 2008 |
17,452 | 207 | 67,347 | 17,737 | (34,782 | ) | (1,090 | ) | 49,419 | |||||||||||||||||||
| Comprehensive income: |
||||||||||||||||||||||||||||
| Net income |
19,829 | |||||||||||||||||||||||||||
| Unrealized gain on derivative instrument, net of deferred taxes of $216 |
353 | |||||||||||||||||||||||||||
| Total comprehensive income |
20,182 | |||||||||||||||||||||||||||
| Common stock repurchases |
(237 | ) | (1,299 | ) | (1,299 | ) | ||||||||||||||||||||||
| Dividends to stockholders |
(5,384 | ) | (5,384 | ) | ||||||||||||||||||||||||
| Issuance of restricted stock awards |
124 | (1,313 | ) | 1,313 | — | |||||||||||||||||||||||
| Stock-based compensation expense |
2,595 | 2,595 | ||||||||||||||||||||||||||
| Stock option exercises |
75 | (641 | ) | 787 | 146 | |||||||||||||||||||||||
| Tax impact of stock-based compensation |
(109 | ) | (109 | ) | ||||||||||||||||||||||||
| Balance, December 31, 2009 |
17,414 | 207 | 67,879 | 32,182 | (33,981 | ) | (737 | ) | 65,550 | |||||||||||||||||||
| Comprehensive income: |
||||||||||||||||||||||||||||
| Net income |
11,943 | |||||||||||||||||||||||||||
| Unrealized gain on derivative instrument, net of deferred taxes of $150 |
245 | |||||||||||||||||||||||||||
| Total comprehensive income |
12,188 | |||||||||||||||||||||||||||
| Common stock repurchases |
(674 | ) | (2,993 | ) | (2,993 | ) | ||||||||||||||||||||||
| Dividends to stockholders |
(5,415 | ) | (5,415 | ) | ||||||||||||||||||||||||
| Issuance of restricted stock awards |
232 | (2,384 | ) | 2,384 | — | |||||||||||||||||||||||
| Stock-based compensation expense |
2,355 | 2,355 | ||||||||||||||||||||||||||
| Tax impact of stock-based compensation |
(138 | ) | (138 | ) | ||||||||||||||||||||||||
| Balance, December 31, 2010 |
16,972 | $ | 207 | $ | 67,712 | $ | 38,710 | $ | (34,590 | ) | $ | (492 | ) | $ | 71,547 | |||||||||||||
See accompanying notes to consolidated financial statements.
70
Table of Contents
QC HOLDINGS, INC. AND SUBSIDIARIES
CONSOLIDATED STATEMENTS OF CASH FLOWS
(in thousands)
| Year Ended December 31, | ||||||||||||
| 2008 | 2009 | 2010 | ||||||||||
| Cash flows from operating activities: |
||||||||||||
| Net income |
$ | 13,579 | $ | 19,829 | $ | 11,943 | ||||||
| Adjustments to reconcile net income to net cash provided by operating activities: |
||||||||||||
| Depreciation and amortization |
7,420 | 7,170 | 6,177 | |||||||||
| Provision for losses |
58,913 | 48,209 | 39,329 | |||||||||
| Deferred income taxes |
(3,303 | ) | (3,666 | ) | 471 | |||||||
| Loss on disposal of property and equipment |
1,002 | 965 | 1,064 | |||||||||
| Stock-based compensation |
2,227 | 2,595 | 2,170 | |||||||||
| Stock option income tax benefits |
(139 | ) | ||||||||||
| Changes in operating assets and liabilities: |
||||||||||||
| Loans, interest and fees receivable, net |
(59,650 | ) | (46,729 | ) | (28,178 | ) | ||||||
| Prepaid expenses and other current assets |
(1,067 | ) | (347 | ) | (2,344 | ) | ||||||
| Other assets |
(78 | ) | (1,121 | ) | (6,358 | ) | ||||||
| Accounts payable |
(1,023 | ) | (136 | ) | 306 | |||||||
| Accrued expenses, other liabilities, accrued compensation and benefits and deferred revenue |
(854 | ) | 2,854 | (2,620 | ) | |||||||
| Income taxes |
439 | (1,453 | ) | (1,791 | ) | |||||||
| Other non-current liabilities |
1,595 | 522 | (236 | ) | ||||||||
| Net operating |
19,061 | 28,692 | 19,933 | |||||||||
| Cash flows from investing activities: |
||||||||||||
| Purchase of property and equipment |
(4,459 | ) | (1,562 | ) | (2,133 | ) | ||||||
| Acquisition costs, net of cash acquired |
(205 | ) | (4,162 | ) | (529 | ) | ||||||
| Other |
45 | 49 | (612 | ) | ||||||||
| Net investing |
(4,619 | ) | (5,675 | ) | (3,274 | ) | ||||||
| Cash flows from financing activities: |
||||||||||||
| Borrowings under credit facility |
30,050 | 27,750 | 23,250 | |||||||||
| Payments on credit facility |
(29,800 | ) | (32,000 | ) | (26,500 | ) | ||||||
| Repayments of long-term debt |
(4,000 | ) | (8,393 | ) | (9,864 | ) | ||||||
| Dividends to stockholders |
(5,344 | ) | (5,384 | ) | (5,415 | ) | ||||||
| Repurchase of common stock |
(12,547 | ) | (1,299 | ) | (2,993 | ) | ||||||
| Exercise of stock options |
229 | 146 | ||||||||||
| Excess tax benefits from stock-based payment arrangements |
139 | |||||||||||
| Net financing |
(21,273 | ) | (19,180 | ) | (21,522 | ) | ||||||
| Cash and cash equivalents: |
||||||||||||
| Net increase (decrease) |
(6,831 | ) | 3,837 | (4,863 | ) | |||||||
| At beginning of year |
24,145 | 17,314 | 21,151 | |||||||||
| At end of year |
$ | 17,314 | $ | 21,151 | $ | 16,288 | ||||||
| Supplementary schedule of cash flow information: |
||||||||||||
| Cash paid during the year for |
||||||||||||
| Income taxes |
$ | 13,028 | $ | 17,804 | $ | 5,781 | ||||||
| Interest |
4,592 | 3,403 | 2,397 | |||||||||
See accompanying notes to consolidated financial statements.
71
Table of Contents
QC HOLDINGS, INC. AND SUBSIDIARIES
NOTES TO CONSOLIDATED FINANCIAL STATEMENTS
NOTE 1—DESCRIPTION OF THE BUSINESS
The accompanying consolidated financial statements include the accounts of QC Holdings, Inc. and its wholly-owned subsidiaries, QC Financial Services, Inc., QC Auto Services, Inc., QC Loan Services, Inc. and QC E-Services, Inc. (collectively the Company). QC Financial Services, Inc. is the 100% owner of QC Financial Services of California, Inc., Financial Services of North Carolina, Inc., QC Financial Services of Texas, Inc., Express Check Advance of South Carolina, LLC, QC Advance, Inc., Cash Title Loans, Inc. and QC Properties, LLC. QC Holdings, Inc., incorporated in 1998 under the laws of the State of Kansas, was founded in 1984, and has provided various retail consumer financial products and services throughout its 26-year history. The Company’s common stock trades on the NASDAQ Global Market exchange under the symbol “QCCO.”
Since 1998, the Company has been primarily engaged in the business of providing short-term consumer loans, known as payday loans, with principal values that typically range from $100 to $500. Payday loans provide customers with cash in exchange for a promissory note with a maturity of generally two to three weeks and supported by that customer’s personal check for the aggregate amount of the cash advanced plus a fee. The fee varies from state to state, based on applicable regulations and generally ranges from $15 to $20 per $100 borrowed. To repay the cash advance, customers may redeem their check by paying cash or they may allow the check to be presented to the bank for collection.
The Company also provides other consumer financial products and services, such as installment loans, credit services, check cashing services, title loans, money transfers and money orders. All of the Company’s loans and other services are subject to state regulation, which vary from state to state, as well as to federal and local regulation, where applicable. As of December 31, 2010, the Company operated 523 branches with locations in Alabama, Arizona, California, Colorado, Idaho, Illinois, Indiana, Kansas, Kentucky, Louisiana, Mississippi, Missouri, Montana, Nebraska, Nevada, New Mexico, Ohio, Oklahoma, South Carolina, Texas, Utah, Virginia, Washington and Wisconsin.
The Company began offering an installment loan product to customers in its Illinois branches during second quarter 2006. As of December 31, 2010, the Company offers the installment loan product to its customers in Colorado, Idaho, Illinois, Montana, New Mexico and Utah. The installment loans are payable in monthly installments (principal plus accrued interest) with terms ranging from four months to one year, and all loans are pre-payable at any time without penalty. The fee for the installment loan varies based on the amount borrowed and the term of the loan. Generally, the maximum amount that the Company advances under an installment loan is $1,000. The average principal amount for installment loans originated during 2008, 2009 and 2010 was approximately $511, $500 and $490, respectively.
During 2010, the Company closed 34 of its lower performing branches in various states and decided it will close an additional 21 branches (primarily located in Arizona, South Carolina and Washington) during first half of 2011. The Company recorded approximately $1.8 million in pre-tax charges during the year ended December 31, 2010 associated with these closings. See additional information in Notes 5 and 6.
During 2009, the Company closed 32 of its lower performing branches in various states (which included six branches that were consolidated into nearby branches). The Company recorded approximately $1.7 million in pre-tax charges during the year ended December 31, 2009 associated with these closings. See additional information in Notes 5 and 6.
During third quarter 2008, the Company closed 13 of its 32 branches in Ohio, primarily due to a new law that went into effect on September 1, 2008 that effectively precludes payday loans. The Company recorded approximately $943,000 in pre-tax charges during 2008 associated with these closings. See additional information in Notes 5 and 6.
72
Table of Contents
QC HOLDINGS, INC. AND SUBSIDIARIES
NOTES TO CONSOLIDATED FINANCIAL STATEMENTS—(Continued)
In September 2007, the Company entered into the buy here, pay here segment of the used automotive market in connection with ongoing efforts to evaluate alternative products that serve the Company’s customer base. In January 2009, the Company purchased two buy here, pay here locations in Missouri for approximately $4.2 million. In May 2009, the Company opened a service center to provide reconditioning services on its inventory of vehicles and repair services for its customers. As of December 31, 2010, the Company operated five buy here, pay here lots, which are located in Missouri and Kansas. These locations sell used vehicles and earn finance charges from the related vehicle financing contracts. The average principal amount for buy here, pay here loans originated during the year ended December 31, 2010 was approximately $9,375 and the average term of the loan was 33 months.
NOTE 2—SUMMARY OF SIGNIFICANT ACCOUNTING POLICIES
Principles of Consolidation. The accompanying consolidated financial statements include the accounts of the Company. All significant intercompany balances and transactions have been eliminated in consolidation.
Accounting reclassifications. Certain reclassifications have been made to prior period financial information to conform to the current presentation. On the Consolidated Statements of Income, all amounts associated with the automotive sales, interest and fees and the cost of sales for the automotive business have been reclassified to separately present these items.
Use of Estimates. In preparing financial statements in conformity with accounting principles generally accepted in the United States of America, management is required to make estimates and assumptions that affect the reported amounts of assets and liabilities, the disclosure of contingent assets and liabilities at the date of the financial statements, and the reported amounts of revenues and expenses during the reporting period. On an on-going basis, management evaluates its estimates and judgments, including those related to allowance for losses on loans, goodwill, long-lived assets, income taxes, contingencies and litigation. Management bases its estimates on historical experience, empirical data and on various other assumptions that are believed to be reasonable under the circumstances, the results of which form the basis for making judgments about the carrying values of assets and liabilities. Actual results could differ from those estimates.
Revenue Recognition. The Company records revenue from loans upon issuance. The term of a loan is generally two to three weeks for a payday loan and 30 days for a title loan. At the end of each month, the Company records an estimate of the unearned revenue, which results in revenues being recognized on a constant-yield basis ratably over the term of each loan.
The Company records revenues from installment loans using the simple interest method. With respect to the Company’s credit service organization (CSO) in Texas, the Company earns a CSO fee for arranging for an unrelated third-party to make a loan to the consumer and for providing related services to the consumer, including a guarantee of the consumer’s obligation to the third-party lender. The Company also services the loan for the lender. The CSO fee is recognized ratably over the term of the loan.
The Company recognizes revenue (net of sales tax) on the sale of automobiles at the time the vehicle is delivered to the customer and title has passed. In cases where the Company finances the vehicles, the Company originates an installment sale contract and uses the simple interest method to recognize interest.
The Company recognizes revenues for its other consumer financial products and services, which includes check cashing, money transfers and money orders, at the time those services are rendered to the customer, which is generally at the point of sale.
73
Table of Contents
QC HOLDINGS, INC. AND SUBSIDIARIES
NOTES TO CONSOLIDATED FINANCIAL STATEMENTS—(Continued)
The components of “Other” revenues as reported in the statements of income are as follows (in thousands):
| Year Ended December 31, | ||||||||||||
| 2008 | 2009 | 2010 | ||||||||||
| Installment loan fees |
$ | 18,220 | $ | 17,107 | $ | 17,326 | ||||||
| Credit service fees |
6,202 | 6,778 | 7,322 | |||||||||
| Check cashing fees |
5,277 | 5,175 | 4,537 | |||||||||
| Title loan fees |
3,672 | 3,116 | 4,729 | |||||||||
| Open-end credit fees (a) |
32 | 3,694 | 56 | |||||||||
| Other fees |
2,719 | 3,074 | 2,580 | |||||||||
| Total |
$ | 36,122 | $ | 38,944 | $ | 36,550 | ||||||
| (a) | The Company offered an open-end credit product in its Virginia locations from late 2008 to mid-2009, at which point the Company ceased offering the open-end credit product and returned to offering only the payday loan product in Virginia. |
Cash and Cash Equivalents. Cash and cash equivalents include cash on hand and short-term investments with original maturities of three months or less. The carrying amount of cash and cash equivalents approximates the estimated fair value at December 31, 2009 and 2010.
Inventory. Inventory primarily consists of vehicles acquired from auctions and trade-ins. Vehicle transportation and reconditioning costs are capitalized as a component of inventory. The cost of vehicle inventory is determined on the specific identification method. Vehicle inventories are stated at the lower of cost or market. Valuation allowances are established when the inventory carrying values are in excess of estimated selling prices, net of direct costs of disposal. As of December 31, 2009 and 2010, the Company had inventory of used vehicles totaling $1.7 million and $3.3 million, respectively, which is included in other current assets in the consolidated balance sheets. Management has determined that a valuation allowance is not necessary as of December 31, 2009 and 2010.
Loans Receivable, Provision for Losses and Allowance for Loan Losses. When the Company enters into a payday loan with a customer, the Company records a loan receivable for the amount loaned to the customer plus the fee charged by the Company, which varies from state to state based on applicable regulations.
The following table summarizes certain data with respect to the Company’s payday loans:
| Year Ended December 31, | ||||||||||||
| 2008 | 2009 | 2010 | ||||||||||
| Average amount of cash provided to customer |
$ | 316.11 | $ | 312.94 | $ | 318.68 | ||||||
| Average fee received by the Company |
$ | 53.98 | $ | 54.03 | $ | 56.22 | ||||||
| Average term of loan (days) |
16 | 16 | 17 | |||||||||
When checks are presented to the bank for payment and returned as uncollected, all accrued fees, interest and outstanding principal are charged-off as uncollectible, generally within 14 days after the due date.
Accordingly, payday loans included in the receivable balance at any given point in time are typically not older than 30 days. These charge-offs are recorded as expense through the provision for losses. Any recoveries on losses previously charged to expense are recorded as a reduction to the provision for losses in the period recovered. With respect to title loans, no additional fees or interest are charged after the loan has defaulted,
74
Table of Contents
QC HOLDINGS, INC. AND SUBSIDIARIES
NOTES TO CONSOLIDATED FINANCIAL STATEMENTS—(Continued)
which generally occurs after attempts to contact the customer have been unsuccessful. Based on state regulations and operating procedures, the Company stops accruing interest on installment loans between 60 to 90 days after the last payment. On automotive loans, the Company stops accruing interest on 60 days after the last payment.
With respect to the loans receivable at the end of each reporting period, the Company maintains an aggregate allowance for loan losses (including fees and interest) for payday loans, title loans, installment loans and auto loans at levels estimated to be adequate to absorb estimated incurred losses in the respective outstanding loan portfolios. The Company does not specifically reserve for any individual loan.
The methodology for estimating the allowance for payday and title loan losses utilizes a four-step approach, which reflects the short-term nature of the loan portfolio at each period-end, the historical collection experience in the month following each reporting period-end and any fluctuations in recent general economic conditions. First, the Company computes the loss/volume ratio for the last month of each reporting period. The loss/volume ratio represents the percentage of aggregate net payday and title loan charge-offs to total payday and title loan volumes during a given period. Second, the Company computes an adjustment to this percentage to reflect the collections experience in the month immediately following the reporting period-end. To estimate collections experience, the Company computes an average of the change in the loss/volume ratio from the last month of each reporting period to the immediate subsequent month-end for each of the last three years (excluding the current year). This change is then added to, or subtracted from, the loss/volume ratio computed for the last month of the current reporting period to derive an experience-adjusted loss/volume ratio. Third, the period-end gross payday and title loans receivable balance is multiplied by the experience-adjusted loss/volume ratio to determine the initial estimate of the allowance for loan losses. Fourth, the Company reviews and evaluates various qualitative factors that may or may not affect the computed initial estimate of the allowance for loan losses, including, among others, known changes in state regulations or laws, changes to the Company’s business and operating structure, and geographic or demographic developments. As of December 31, 2009 and 2010, the Company determined that no qualitative adjustment to the allowance for payday loan losses was necessary.
The Company maintains an allowance for installment loans at a level it considers sufficient to cover estimated losses in the collection of its installment loans. The allowance calculation for installment loans is based upon historical charge-off experience (primarily a six-month trailing average of charge-offs to total volume) and qualitative factors, with consideration given to recent credit loss trends and economic factors. As of December 31, 2009 and 2010, the Company reviewed the qualitative factors and determined that no qualitative adjustment was needed.
The Company recorded an allowance for open-end credit receivables based upon an analysis that gives consideration to payment recency, delinquency levels and other general economic conditions. The Company discontinued offering the open-end credit product to its Virginia customers in the second quarter of 2009. With the discontinuance of the product and the difficulty in collecting on receivable balances, the Company recorded an allowance equal to the balance of open-end credit receivables as of December 31, 2009. During 2010, the Company removed all outstanding open-end credit receivables from its balance sheet and reduced the allowance for open-end credit receivables by a corresponding amount.
The allowance calculation for auto loans is determined on an aggregate basis and is based upon the Company’s review of the loan portfolio by period of origination, industry loss experience and qualitative factors, with consideration given to changes in loan characteristics, delinquency levels, collateral values and other general economic conditions. This estimate of probable losses is primarily determined using static pool analyses prepared for various segments of the portfolio using estimated loss experience, adjusted for consideration of any current economic factors. Over the last few years, industry loss rates have generally ranged between 20% and 28% of revenues, with higher ratios during more difficult macroeconomic periods. In 2008 and 2009, the
75
Table of Contents
QC HOLDINGS, INC. AND SUBSIDIARIES
NOTES TO CONSOLIDATED FINANCIAL STATEMENTS—(Continued)
automotive sales industry experienced an increase in delinquencies and, as a result, an increase in losses. The Company’s level of allowance with respect to automotive loans in prior years was higher than levels during 2010 and higher than levels expected in the future due to the Company’s relative inexperience in the buy here, pay here business, as well as the age of the new locations and the generally negative industry and macroeconomic environment. During 2010, the Company’s loss experience with respect to automotive loans improved significantly due to management and process enhancements. As of December 31, 2009 and December 31, 2010, the Company reviewed various qualitative factors with respect to its automotive loans receivable and determined that no qualitative adjustment was needed.
Based on the information discussed above, the Company records an adjustment to the allowance for loan losses through the provision for losses. The overall allowance represents the Company’s best estimate of probable losses inherent in the outstanding loan portfolio at the end of each reporting period.
During the years ended December 31, 2008, 2009 and 2010, the Company received cash of approximately $624,000, $972,000 and $494,000, respectively from the sales of certain payday loan receivables that the Company had previously charged off. The sales were recorded as a credit to the overall loss provision, which is consistent with the Company’s policy for recording recoveries noted above.
Branch Expenses. The direct costs incurred in operating the Company’s branches have been classified as branch expenses. Branch operating expenses include salaries and benefits of branch employees, rent and other occupancy costs, depreciation and amortization of branch property and equipment, armored car and security costs, automobile costs and other costs incurred by the branches. The provision for losses is also a component of branch expenses.
Property and Equipment. Property and equipment are recorded at cost. Depreciation is charged to operations using the straight-line method over the estimated useful lives of the assets. Buildings are depreciated generally over 39 years. Leasehold improvements are amortized using the straight-line method over the shorter of the lease term (including renewal options that are reasonably assured), which generally ranges from 1 to 15 years with an average of 7 years, or the estimated useful life of the related asset. Furniture and equipment, including data processing equipment, data processing software, and other equipment are generally depreciated from 3 to 7 years. Company-owned vehicles are depreciated over four to five years. Repair and maintenance expenditures that do not significantly extend asset lives are charged to expense as incurred. The cost and related accumulated depreciation and amortization of assets sold or disposed of are removed from the accounts, and the resulting gain or loss is included in income.
Software. Purchased software is recorded at cost and is amortized on a straight-line basis over the estimated useful life. The Company capitalizes costs for the development of internal use software, including coding and software configuration costs and costs of upgrades and enhancements. Computer software and development costs incurred in the preliminary project stage, as well as training and maintenance costs are expensed as incurred. Direct and indirect costs associated with the application development stage of internal use software are capitalized until such time that the software is substantially complete and ready for its intended use. Internal costs capitalized were immaterial for the years ended December 31, 2008, 2009 and 2010.
Advertising Costs. Advertising costs, including related printing and postage, are charged to operations when incurred. Advertising expense was $6.2 million, $2.4 million and $2.4 million for the years ended December 31, 2008, 2009 and 2010, respectively.
Goodwill and Intangible Assets. Goodwill represents the excess of consideration over the fair value of net tangible and identified intangible assets and liabilities assumed of acquired branches using acquisition method of accounting. Intangible assets, which are included in other assets, consist of customer relationships, non-compete agreements, trade names, debt issuance costs and other intangible assets.
76
Table of Contents
QC HOLDINGS, INC. AND SUBSIDIARIES
NOTES TO CONSOLIDATED FINANCIAL STATEMENTS—(Continued)
Goodwill and other intangible assets having indefinite useful lives are tested for impairment on an annual basis, or more frequently if events or changes in circumstances indicate that the assets might be impaired. The Company reviews the recoverability of goodwill and other intangible assets having indefinite useful lives using a fair-value based approach on an annual basis, or more frequently whenever events occur or circumstances indicate that the asset might be impaired. The Company evaluates the goodwill at the reporting unit level. The Company has determined that it has two reporting units, which are based on its core lending operations and its automotive operations. For testing purposes, the Company has elected to aggregate all reporting units of its core lending operations into a single reporting unit, as the Company believes all of its core lending branches have similar economic characteristics and its reporting units are similar with respect to the nature of the products and services, type of customer and the methods used to provide its services. The Company assesses the fair value of its reporting units based on a weighted average of valuations based on market multiples and discounted cash flows. The key assumptions used in the discounted cash flow valuations are discount rates and perpetual growth rates applied to cash flow projections. Also inherent in the discounted cash flow valuation models are past performance, projections and assumptions in current operating plans and revenue growth. These assumptions contemplate business, market and overall economic conditions.
Other factors that are considered important in determining whether an impairment of goodwill or intangible assets might exist include significant continued underperformance compared to peers, significant changes in the Company’s business and products, material and ongoing negative industry or economic trends, or other factors specific to each asset being evaluated. Any changes in key assumptions about the Company’s business and its prospects, or changes in market conditions or other externalities, could result in an impairment charge and such a charge could have a material adverse effect on the Company’s financial condition and results of operations. No goodwill impairment was recognized during 2008, 2009 and 2010 as the computed fair value amount of the reporting unit was in excess of its carrying amount.
Impairment of Long-Lived Assets. The Company evaluates all long-lived assets, including intangible assets that are subject to amortization, for impairment whenever events or changes in circumstances indicate that the carrying amounts may not be recoverable. When the carrying amounts of these assets cannot be recovered by the undiscounted net cash flows they will generate, impairment is recognized in an amount by which the carrying amount of the assets exceeds the fair value.
Earnings per Share. The Company computes basic and diluted earnings per share using a two-class method because the Company has participating securities in the form of unvested share-based payment awards with rights to receive non-forfeitable dividends. Basic and diluted earnings per share are computed by dividing income available to common stockholders by the weighted average number of common shares outstanding during the year. The computation of diluted earnings per share gives effect to all dilutive potential common shares that were outstanding during the year. The effect of stock options and unvested restricted stock represent the only differences between the weighted average shares used for the basic earnings per share computation compared to the diluted earnings per share computation for each period presented. See additional information in Note 16.
Comprehensive Income. The Company’s comprehensive income is presented in the Consolidated Statement of Changes in Stockholders’ Equity and consists of net income and unrealized gains (losses) on an interest rate swap agreement, net of deferred income taxes.
Stock-Based Compensation. The Company recognizes in its financial statements compensation cost relating to share-based payment transactions. The stock-based compensation expense is recognized as expense over the requisite service period, which is the vesting period. See additional information in Note 17.
Income Taxes. Deferred income taxes are recorded to reflect the tax consequences in future years of differences between the tax basis of assets and liabilities and their financial reporting amounts, based on enacted
77
Table of Contents
QC HOLDINGS, INC. AND SUBSIDIARIES
NOTES TO CONSOLIDATED FINANCIAL STATEMENTS—(Continued)
tax laws and statutory tax rates applicable to the periods in which the differences are expected to affect taxable income. Valuation allowances are established when necessary to reduce deferred tax assets to the amounts expected to be realized. Income tax expense represents the tax payable for the current period and the change during the period in deferred tax assets and liabilities.
Tax guidance pertaining to uncertain tax positions issued by the Financial Accounting Standards Board (FASB) clarifies what criteria must be met prior to recognition of the financial statement benefit of a position taken or one that is expected to be taken in a tax return. The provisions of this guidance apply broadly to all tax positions taken by a company, including decisions to not report income in a tax return or to classify a transaction as tax exempt. The prescribed approach is determined through a two-step benefit recognition model. The amount of benefit to recognize is measured as the largest amount of tax benefit that is greater than 50 percent likely of being ultimately realized upon settlement. The tax position must be derecognized when it is no longer more likely than not of being sustained. See additional information in Note 14.
Treasury Stock. The Company’s board of directors periodically authorizes the repurchase of the Company’s common stock. The Company’s repurchases of common stock are recorded as treasury stock and result in a reduction of stockholders’ equity. The shares held in treasury stock may be used for corporate purposes, including shares issued to employees as part of the Company’s stock-based compensation programs. When treasury shares are reissued, the Company uses the average cost method. The Company had 3.3 million and 3.7 million shares of common stock held in treasury at December 31, 2009 and 2010, respectively.
Fair Value of Financial Instruments. The fair value of cash and cash equivalents, short-term loans receivable, borrowings under the credit facility, accounts payable and certain other current liabilities that are short-term in nature approximates carrying value.
The Company estimates the fair value of its automotive loan receivables at what a third party purchaser might be willing to pay. The Company has had discussions with third parties that indicate a 35% discount to face value would be a reasonable fair value in a negotiated third party transaction. Since the Company does not intend to offer the receivables for sale to an outside third party, the expectation is that the carrying value at December 31, 2010, will be ultimately collected. By collecting the accounts internally, the Company expects to realize more than a third party purchaser would expect to collect with a servicing requirement and a profit margin included. As of December 31, 2009 and 2010, the fair value of the automotive loan receivables was $7.7 million and $10.0 million, respectively.
The Company estimates the fair value of long-term debt based upon borrowing rates available at the reporting date for indebtedness with similar terms and average maturities. During December 2007, the Company entered into a $50 million, five-year term loan (as discussed in Note 11). The balance on the term loan was $37.6 million as of December 31, 2009 and $27.7 million as of December 31, 2010. As of December 31, 2009 and 2010, the fair value of the five-year term loan was approximately $35.2 million and $28.5 million, respectively.
Derivative Instruments. The Company does not engage in the trading of derivative financial instruments except where the Company’s objective is to manage the variability of forecasted interest payments attributable to changes in interest rates. In general, the Company enters into derivative transactions in limited situations based on management’s assessment of current market conditions and perceived risks.
On March 31, 2008, the Company entered into an interest rate swap agreement. The swap agreement has been designated as a cash flow hedge and changes the floating rate interest obligation associated with the Company’s $50 million term loan into a fixed rate. The swap agreement has a maturity date of December 6, 2012. Under the swap, the Company pays a fixed interest rate of 3.43% and receives interest at a rate of LIBOR.
78
Table of Contents
QC HOLDINGS, INC. AND SUBSIDIARIES
NOTES TO CONSOLIDATED FINANCIAL STATEMENTS—(Continued)
The swap is considered highly effective and as a result, there will be de minimus income statement variability associated with interest payments while the swap is in effect. Gains or losses on derivatives designated as cash flow hedges, to the extent they are effective, are recorded in other comprehensive income, and subsequently reclassified to earnings as interest expense to offset the impact of the hedged items when they occur. If it becomes probable the forecasted transaction to which a cash flow hedge relates will not occur, the derivative would be terminated and the amount in other comprehensive income would generally be recognized into earnings. As of December 31, 2009 and 2010, the estimated fair value of the interest rate swap was a net liability of $1.2 million and $793,000, respectively, and was included in accrued expenses and other liabilities in the consolidated balance sheets.
NOTE 3—ACCOUNTING DEVELOPMENTS
In December 2010, the FASB updated its guidance related to when to perform step two of the goodwill impairment test for reporting units with zero or negative carrying amounts. The updated guidance requires that for any reporting unit with a zero or negative carrying amount, and entity is required to perform Step 2 of the goodwill impairment test if it is more likely than not that a goodwill impairment exists. In determining whether it is more likely than not that a goodwill impairment exists, an entity should consider whether there are any adverse qualitative factors indicating that an impairment may exist. The updated guidance is effective for fiscal years, and interim periods within those years, beginning after December 15, 2010. The Company does not expect adoption to have a material impact on its consolidated financial statements.
In December 2010, the FASB updated its guidance related to disclosure of supplementary pro forma information for business combinations. The updated guidance requires that if comparative financial statements are presented, the pro forma revenue and earnings of the combined entity for the comparable prior reporting period should be reported as though the acquisition date for all business combinations that occurred during the current year had been as of the beginning of the comparable prior annual reporting period only. The updated guidance is effective prospectively for business combinations for which the acquisition date is on or after the beginning of the first annual reporting period beginning on or after December 15, 2010, with early adoption permitted. The Company has not yet adopted the updated guidance and the Company does not expect adoption to have an impact on its consolidated financial statements as the updated guidance only affects disclosures related to future business combinations.
In January 2010, the Financial Accounting Standards Board (FASB) issued guidance to amend the disclosure requirements related to recurring and nonrecurring fair value measurements. The guidance requires new disclosures on the transfers of assets and liabilities between Level 1 (quoted prices in active market for identical assets or liabilities) and Level 2 (significant other observable inputs) of the fair value measurement hierarchy, including the reasons and the timing of the transfers. Additionally, the guidance requires a roll forward of activities on purchases, sales, issuance, and settlements of the assets and liabilities measured using significant unobservable inputs (Level 3 fair value measurements). The Company adopted this guidance on January 1, 2010. The adoption did not have a material effect on the Company’s consolidated financial statements. See additional information in Note 4.
In July 2010, FASB issued guidance to improve disclosures that an entity provides about the credit quality of its financing receivables and the related allowance for credit losses. As a result of this guidance, an entity will be required to disaggregate, by portfolio segment or class of financing receivable, certain existing disclosures and provide certain new disclosures about its financing receivables and related allowance for credit losses. For public entities, the disclosures as of the end of a reporting period are effective for interim and annual reporting periods ending on or after December 15, 2010. The disclosures about activity that occurs during a reporting period are effective for interim and annual reporting periods beginning on or after December 15, 2010. The adoption did not
79
Table of Contents
QC HOLDINGS, INC. AND SUBSIDIARIES
NOTES TO CONSOLIDATED FINANCIAL STATEMENTS—(Continued)
have a material effect on the Company’s consolidated financial statements. See additional information in Notes 2 and 8.
NOTE 4—FAIR VALUE MEASUREMENTS
Fair Value Hierarchy Tables. The fair value measurement accounting guidance establishes a three-tier fair value hierarchy, which prioritizes the inputs used in measuring fair value. In general, fair values determined by Level 1 inputs utilize quoted prices (unadjusted) in active markets for identical assets or liabilities that the Company has the ability to access. Level 2 inputs include quoted prices for similar assets and liabilities in active markets, and inputs other than quoted prices that are observable for the asset or liability. Level 3 inputs are unobservable inputs for the asset or liability, and include situations where there is little, if any, market activity for the asset or liability. In certain cases, the inputs used to measure fair value may fall into different levels of the fair value hierarchy. In such cases, the level in the fair value hierarchy within which the fair value measurement in its entirety falls has been determined based on the lowest level input that is significant to the fair value measurement in its entirety. The Company’s assessment of the significance of a particular input to the fair value in its entirety requires judgment and considers factors specific to the asset or liability.
The following table presents fair value measurements for recurring financial assets as of December 31, 2010 (in thousands):
| Fair Value Measurements | Liability at fair value |
|||||||||||||||
| Level 1 | Level 2 | Level 3 | ||||||||||||||
| Interest rate swap agreement |
$ | — | $ | 793 | $ | — | $ | 793 | ||||||||
| Total |
$ | — | $ | 793 | $ | — | $ | 793 | ||||||||
The following table presents fair value measurements for recurring financial assets as of December 31, 2009 (in thousands):
| Fair Value Measurements | Liability at fair value |
|||||||||||||||
| Level 1 | Level 2 | Level 3 | ||||||||||||||
| Interest rate swap agreement |
$ | — | $ | 1,187 | $ | — | $ | 1,187 | ||||||||
| Total |
$ | — | $ | 1,187 | $ | — | $ | 1,187 | ||||||||
The Company measures the value of its interest rate swap agreement relying on a mark-to-market valuation based on yield curves using observable market interest rates for the interest rate swap agreement. As of December 31, 2009 and 2010, the fair value of the interest rate swap agreement was a liability of $1.2 million and $793,000, respectively. For the years ended December 31, 2009 and 2010, the Company recorded unrealized gains of $569,000 and $395,000, respectively, on the interest rate swap agreement in other comprehensive income. For additional information on the interest rate swap agreement, see Notes 11 and 12.
Fair Value Measurements on a Non-Recurring Basis. The Company also measures the fair value of certain assets on a non-recurring basis when events or changes in circumstances indicate that the carrying amount of the assets may not be recoverable.
Impaired fixed Assets. During the year ended December 31, 2010, the Company recorded an impairment of $330,000 on impaired fixed assets in connection with the 21 branches the Company has scheduled to close during the first half of 2011. The fair value measurements used to determine the impairments were based on the market approach based on liquidation prices of comparable assets.
80
Table of Contents
QC HOLDINGS, INC. AND SUBSIDIARIES
NOTES TO CONSOLIDATED FINANCIAL STATEMENTS—(Continued)
| Fair Value Measurements | Total gains (losses) |
|||||||||||||||
| Level 1 | Level 2 | Level 3 | ||||||||||||||
| Impaired fixed assets |
$ | — | $ | — | $ | — | $ | (330 | ) | |||||||
| Total |
$ | — | $ | — | $ | — | $ | (330 | ) | |||||||
NOTE 5—SIGNIFICANT BUSINESS TRANSACTIONS
Closure of Branches. During year ended December 31, 2010, the Company closed 34 of its lower performing branches in various states and decided it will close 21 branches in Arizona, Washington and South Carolina during first half 2011. The Company recorded approximately $1.8 million in pre-tax charges during the year ended December 31, 2010 associated with these closings. The charges included $916,000 representing the loss on the disposition of fixed assets, $671,000 for lease terminations and other related occupancy costs, $155,000 in severance and benefit costs and $33,000 for other costs. See additional information in Note 4 regarding fair value of impaired assets and Note 6 regarding discontinued operations.
During year ended December 31, 2009, the Company closed 32 of its lower performing branches in various states (which included six branches that were consolidated into nearby branches). The Company recorded approximately $1.7 million in pre-tax charges during the year ended December 31, 2009 associated with these closings. The charges included an $897,000 loss for the disposition of fixed assets, $739,000 for lease terminations and other related occupancy costs, $15,000 in severance and benefit costs and $14,000 for other costs.
During third quarter 2008, the Company closed 13 of its 32 branches in Ohio, primarily due to a new law that went into effect on September 1, 2008 that effectively precludes payday loans. The Company recorded approximately $943,000 in pre-tax charges during the year ended December 31, 2008 associated with these closings. The charges included a $554,000 loss for the disposition of fixed assets, $342,000 for lease terminations and other related occupancy costs, $40,000 in severance and benefit costs and $7,000 for other costs.
In 2008, the Company also closed eight of its lower performing branches by consolidating those branches into nearby branches. The Company recorded approximately $428,000 in pre-tax charges during the year ended December 31, 2008 associated with these closings. The charges included a $278,000 loss for the disposition of fixed assets, $145,000 for lease terminations and other related occupancy costs and $5,000 for other costs.
With respect to the branch closings in each of 2008, 2009 and 2010, a significant portion of the operations and closing costs are included as discontinued operations (see Note 6). When ceasing operations in Company branches under operating leases, the Company incurs certain lease contract termination costs. Accordingly, in cases where the lease contract specifies a termination fee due to the landlord, the Company records such expense at the time written notice is given to the landlord. In cases where terms, including termination fees, are yet to be negotiated with the landlord or in cases where the landlord does not allow the Company to prematurely exit its lease, but allows for subleasing, the Company estimates the fair value of any assumed sublease income that can be generated from the location and records as an expense the excess of remaining lease payments to the landlord over the projected sublease income at the cease-use date.
81
Table of Contents
QC HOLDINGS, INC. AND SUBSIDIARIES
NOTES TO CONSOLIDATED FINANCIAL STATEMENTS—(Continued)
The following table summarizes the accrued costs associated with the closure of branches and the activity related to those charges as of December 31, 2010 (in thousands):
| Balance at December 31, 2009 |
Additions | Reductions | Balance at December 31, 2010 |
|||||||||||||
| Lease and related occupancy costs (a) |
$ | 299 | $ | 703 | $ | (677 | ) | $ | 325 | |||||||
| Severance |
155 | 155 | ||||||||||||||
| Other |
33 | (33 | ) | |||||||||||||
| Total |
$ | 299 | $ | 891 | $ | (710 | ) | $ | 480 | |||||||
| (a) | The additions include charges of $32,000 during 2010 to increase the lease liabilities for branches that were closed prior to January 1, 2010 and not included in discontinued operations. The increase was primarily due to changes in estimates based on the Company’s ability to sub-lease space in branch locations. |
As of December 31, 2010, the balance of $480,000 for accrued costs associated with the closure of branches is included as a current liability on the Consolidated Balance Sheet as the Company expects that the liabilities for these costs will be settled within one year.
Acquisitions. During 2010, the Company acquired certain payday loan receivables and intangible assets in two separate transactions totaling $529,000. The Company used the acquisition method of accounting. The fair value of the payday loan receivables acquired totaled $497,000 and the intangible assets totaled $32,000, which was recorded by the Company to customer relationships.
In January 2009, the Company purchased two buy here, pay here locations in Missouri for approximately $4.2 million, which included loans receivable of approximately $2.7 million and inventory of $642,000. The Company used the acquisition method of accounting. The intangible assets acquired totaled $765,000. Of this amount, the Company recorded $347,000 to goodwill, $141,000 to customer relationships, $183,000 to non-compete agreements and $94,000 to trade names. The goodwill arising from the acquisition consists largely of the synergies and economies of scale expected from combining the operations of the Company and the acquired locations. The pro forma results of operations have not been presented because the results of operations for the Company would not have been materially different from those reported for the year ended December 31, 2009. The goodwill is deductible for income tax purposes.
During 2008, the Company acquired one branch, certain payday loan receivables and customer lists in three separate transactions totaling $205,000, which included payday loans receivable of approximately $70,000, net book value of depreciable assets of approximately $35,000, customer relationships of $25,000, non-compete agreements of $12,000 and goodwill of $63,000. The goodwill is deductible for income tax purposes.
NOTE 6—DISCONTINUED OPERATIONS
The Company closed 34 branches during 2010 that were not consolidated into nearby branches and decided to close 21 branches in Arizona, Washington and South Carolina during first half 2011. These branches and the 26 branches closed during 2009 that were not consolidated into nearby branches and the Ohio branches that closed during third quarter 2008 are reported as discontinued operations in the Consolidated Statements of Income and related disclosures in the accompanying notes for all periods presented. With respect to the Consolidated Balance Sheets, the Consolidated Statements of Cash Flows and related disclosures in the accompanying notes, the items associated with the discontinued operations are included with the continuing operations for all periods presented.
82
Table of Contents
QC HOLDINGS, INC. AND SUBSIDIARIES
NOTES TO CONSOLIDATED FINANCIAL STATEMENTS—(Continued)
Summarized financial information for discontinued operations is presented below (in thousands):
| Year Ended December 31, | ||||||||||||
| 2008 | 2009 | 2010 | ||||||||||
| Total revenues |
$ | 20,188 | $ | 14,715 | $ | 5,165 | ||||||
| Provision for losses |
7,682 | 4,074 | 1,487 | |||||||||
| Other branch expenses |
11,989 | 9,257 | 6,456 | |||||||||
| Branch gross profit (loss) |
517 | 1,384 | (2,778 | ) | ||||||||
| Other, net |
(660 | ) | (789 | ) | (917 | ) | ||||||
| Income (loss) before income taxes |
(143 | ) | 595 | (3,695 | ) | |||||||
| Income tax expense (benefit) |
(56 | ) | 235 | (1,423 | ) | |||||||
| Gain (loss) from discontinued operations |
$ | (87 | ) | $ | 360 | $ | (2,272 | ) | ||||
NOTE 7—SEGMENT INFORMATION
The Company’s operating business units offer various financial services and sell used vehicles and earn finance charges from the related vehicle financing contracts. The Company has elected to organize and report on these business units as two operating segments (Financial Services and Automotive). The Financial Services segment includes branches that offer payday loans, installment loans, credit services, check cashing services, title loans, money transfers and money orders. The Automotive segment consists of the buy here, pay here operations. The Company evaluates the performance of its segments based on, among other things, branch gross profit, income from continuing operations before income taxes and return on invested capital.
The following tables present summarized financial information for the Company’s segments (in thousands):
| Year Ended December 31, 2010 | ||||||||||||
| Financial Services |
Automotive | Consolidated Total |
||||||||||
| Total revenues |
$ | 168,174 | $ | 19,914 | $ | 188,088 | ||||||
| Provision for losses |
33,505 | 4,337 | 37,842 | |||||||||
| Other branch expenses |
74,014 | 12,672 | 86,686 | |||||||||
| Branch gross profit |
60,655 | 2,905 | 63,560 | |||||||||
| Other, net (a) |
(39,363 | ) | (1,861 | ) | (41,224 | ) | ||||||
| Income from continuing operations before taxes |
$ | 21,292 | $ | 1,044 | $ | 22,336 | ||||||
| Year Ended December 31, 2009 | ||||||||||||
| Financial Services |
Automotive | Consolidated Total |
||||||||||
| Total revenues |
$ | 191,741 | $ | 15,293 | $ | 207,034 | ||||||
| Provision for losses |
38,551 | 5,584 | 44,135 | |||||||||
| Other branch expenses |
76,450 | 9,966 | 86,416 | |||||||||
| Branch gross profit |
76,740 | (257 | ) | 76,483 | ||||||||
| Other, net (a) |
(43,038 | ) | (1,573 | ) | (44,611 | ) | ||||||
| Income (loss) from continuing operations |
$ | 33,702 | $ | (1,830 | ) | $ | 31,872 | |||||
83
Table of Contents
QC HOLDINGS, INC. AND SUBSIDIARIES
NOTES TO CONSOLIDATED FINANCIAL STATEMENTS—(Continued)
| Year Ended December 31, 2008 | ||||||||||||
| Financial Services |
Automotive | Consolidated Total |
||||||||||
| Total revenues |
$ | 202,493 | $ | 6,120 | $ | 208,613 | ||||||
| Provision for losses |
48,958 | 2,273 | 51,231 | |||||||||
| Other branch expenses |
83,698 | 4,417 | 88,115 | |||||||||
| Branch gross profit |
69,837 | (570 | ) | 69,267 | ||||||||
| Other, net (a) |
(45,218 | ) | (286 | ) | (45,504 | ) | ||||||
| Income from continuing operations |
$ | 24,619 | $ | (856 | ) | $ | 23,763 | |||||
| (a) | Represents expenses not associated with branch operations, which includes regional expenses, corporate expenses, depreciation and amortization, interest, other income and other expenses. |
Information concerning total assets by reporting segment is as follows (in thousands):
| December 31, | ||||||||
| 2009 | 2010 | |||||||
| Financial Services |
$ | 135,693 | $ | 120,413 | ||||
| Automotive |
12,393 | 17,629 | ||||||
| Balance at end of year |
$ | 148,086 | $ | 138,042 | ||||
NOTE 8—CUSTOMER RECEIVABLES AND ALLOWANCE FOR LOAN LOSSES
Customer receivables consisted of the following (in thousands):
| Payday and Title Loans |
Automotive Loans |
Installment Loans |
Total | |||||||||||||
| December 31, 2010: |
||||||||||||||||
| Total loans, interest and fees receivable |
$ | 54,148 | $ | 7,776 | $ | 7,695 | $ | 69,619 | ||||||||
| Less: allowance for losses |
(1,760 | ) | (1,890 | ) | (1,650 | ) | (5,300 | ) | ||||||||
| Loans, interest and fees receivable, net of allowance |
$ | 52,388 | $ | 5,886 | $ | 6,045 | $ | 64,319 | ||||||||
Other assets, net on the balance sheet include customer receivables from automotive loans totaling $5.7 million, which is net of allowance for losses of $1.9 million.
Credit quality information. In order to manage the portfolios of consumer loans effectively, the Company utilizes a variety of proprietary underwriting criteria, monitors the performance of the portfolio and maintains either an allowance or accrual for losses on consumer loans (including fees and interest) at a level estimated to be adequate to absorb credit losses inherent in the portfolio. The portfolio includes balances outstanding from all consumer loans, including short-term payday and title loans, automotive loans and multi-payment installment loans. The allowance for losses on consumer loans offsets the outstanding loan amounts in the consolidated balance sheets.
The Company has $5.3 million in automotive loans receivable that are past due as of December 31, 2010 and approximately 3.7% of this amount is more than 60 days past due. In addition, the Company has automotive loans receivable totaling $601,000 that are on non-accrual status as of December 31, 2010. With respect to installment loans, the Company has approximately $1.2 million in installment loans receivable that are past due as of December 31, 2010 and approximately 11.1% of this amount is more that 60 days past due.
84
Table of Contents
QC HOLDINGS, INC. AND SUBSIDIARIES
NOTES TO CONSOLIDATED FINANCIAL STATEMENTS—(Continued)
Allowance for loan losses. The following tables summarize the activity in the allowance for loan losses (in thousands):
| Year Ended December 31, | ||||||||||||
| 2008 | 2009 | 2010 | ||||||||||
| Allowance for loan losses |
||||||||||||
| Balance, beginning of year |
$ | 4,442 | $ | 6,648 | $ | 10,803 | ||||||
| Charge-offs |
(100,072 | ) | (83,577 | ) | (77,102 | ) | ||||||
| Recoveries |
47,249 | 41,879 | 36,127 | |||||||||
| Provision for losses |
55,029 | 45,853 | 37,322 | |||||||||
| Balance, end of year |
$ | 6,648 | $ | 10,803 | $ | 7,150 | ||||||
The provision for losses in the Consolidated Statements of Income includes losses associated with the CSO (see note 13 for additional information) and excludes loss activity related to discontinued operations (see note 6 for additional information).
NOTE 9—PROPERTY AND EQUIPMENT
Property and equipment consisted of the following (in thousands):
| December 31, | ||||||||
| 2009 | 2010 | |||||||
| Buildings |
$ | 3,497 | $ | 3,262 | ||||
| Leasehold improvements |
20,701 | 19,589 | ||||||
| Furniture and equipment |
23,535 | 23,315 | ||||||
| Land |
512 | 512 | ||||||
| Vehicles |
960 | 1,017 | ||||||
| 49,205 | 47,695 | |||||||
| Less: Accumulated depreciation and amortization |
(30,919 | ) | (33,585 | ) | ||||
| Total |
$ | 18,286 | $ | 14,110 | ||||
In August 2008, the Company purchased an auto sales facility in Overland Park, Kansas for approximately $1.6 million. The facility included three buildings and parking spaces on approximately 1.6 acres of land. During October 2008, the Company opened its third buy here, pay here location at this site.
In February 2005, the Company entered into a seven-year lease for a new corporate headquarters in Overland Park, Kansas. As part of the lease agreement, the Company received a tenant allowance from the landlord for leasehold improvements totaling $976,000. The tenant allowance was recorded by the Company as a deferred liability and is being amortized as a reduction of rent expense over the life of the lease. As of December 31, 2009, the balance of the deferred liability was approximately $325,000, which consisted of $186,000 classified as a non-current liability. As of December 31, 2010, the balance of the deferred liability was approximately $185,000, which consisted of $46,000 classified as a non-current liability. In January 2011, the Company amended its lease agreement to extend the lease term and modify the lease payments. The lease was extended through October 31, 2017 and includes a renewal option for an additional five years.
Depreciation and amortization expense for property and equipment totaled $5.7 million, $5.5 million and $4.8 million for the years ended December 31, 2008, 2009 and 2010, respectively.
85
Table of Contents
QC HOLDINGS, INC. AND SUBSIDIARIES
NOTES TO CONSOLIDATED FINANCIAL STATEMENTS—(Continued)
NOTE 10—GOODWILL AND INTANGIBLE ASSETS
Goodwill. The following table summarizes the changes in the carrying amount of goodwill for the years ended December 31, 2009 and 2010 (in thousands):
| December 31, | ||||||||
| 2009 | 2010 | |||||||
| Balance at beginning of year |
$ | 16,144 | $ | 16,491 | ||||
| Acquisitions |
347 | |||||||
| Balance at end of year |
$ | 16,491 | $ | 16,491 | ||||
The Company performed its annual impairment testing of goodwill and has concluded that no impairment existed at December 31, 2009 and 2010.
Intangible Assets. The following table summarizes intangible assets (in thousands):
| December 31, | ||||||||
| 2009 | 2010 | |||||||
| Amortized intangible assets: |
||||||||
| Customer lists |
$ | 2,478 | $ | 2,510 | ||||
| Non-compete agreements |
1,104 | 1,104 | ||||||
| Trade names |
94 | 94 | ||||||
| Debt issue costs |
1,591 | 1,969 | ||||||
| Other |
15 | 15 | ||||||
| 5,282 | 5,692 | |||||||
| Non-amortized intangible assets: |
||||||||
| Trade names |
600 | 600 | ||||||
| Gross carrying amount |
5,882 | 6,292 | ||||||
| Less: Accumulated amortization |
(3,179 | ) | (4,351 | ) | ||||
| Net intangible assets |
$ | 2,703 | $ | 1,941 | ||||
Intangible assets at December 31, 2010 primarily included customer lists, non-compete agreements, trade names and debt issue costs. Customer lists are amortized using the straight-line method over the useful lives ranging from 4 to 15 years. Non-compete agreements are currently amortized using the straight-line method over the term of the agreements, ranging from three to five years. The amount recorded for trade names is typically considered an indefinite life intangible and is not subject to amortization, but is reviewed annually for impairment or if factors indicate. Costs paid to obtain debt financing are amortized over the term of each related debt agreement using the straight-line method, which approximates the effective interest method. During 2010, the Company paid approximately $379,000 in debt issue costs for an amendment to its credit agreement. See additional information in Note 11.
Amortization expense for the years ended December 31, 2008, 2009 and 2010 was $1.1 million, $1.2 million and $1.2 million, respectively. Annual amortization expense for intangible assets recorded as of December 31, 2010 is estimated to be $765,000 for 2011, $535,000 for 2012, $37,000 for 2013 and $4,000 for 2014.
86
Table of Contents
QC HOLDINGS, INC. AND SUBSIDIARIES
NOTES TO CONSOLIDATED FINANCIAL STATEMENTS—(Continued)
NOTE 11—INDEBTEDNESS
The following table summarizes long-term debt at December 31, 2009 and 2010 (in thousands):
| December 31, | ||||||||
| 2009 | 2010 | |||||||
| Term loan |
$ | 37,607 | $ | 27,744 | ||||
| Revolving credit facility |
20,500 | 17,250 | ||||||
| Total debt |
58,107 | 44,994 | ||||||
| Less: debt due within one year |
(30,400 | ) | (28,113 | ) | ||||
| Long-term debt |
$ | 27,707 | $ | 16,881 | ||||
On December 7, 2007, the Company entered into an amended and restated credit agreement with a syndicate of banks to replace its existing line of credit facility. The previous line of credit facility had a total commitment of $45.0 million. The amended credit agreement provides for a five-year term loan of $50.0 million and a revolving line of credit (including provisions permitting the issuance of letters of credit and swingline loans) of up to $45.0 million. The maximum borrowings under the amended credit facility may be increased by $25 million pursuant to bank approval in accordance with the terms set forth in the credit facility. For the year ended December 31, 2010, the weighted average interest rate on the credit facility was 2.95%.
The credit facility is guaranteed by each subsidiary and is secured by all the capital stock of each subsidiary of the Company and all personal property (including all present and future accounts receivable, inventory, property and equipment, general intangibles (including intellectual property), instruments, deposit accounts, investment property and the proceeds thereof). Borrowings under the term loan and the facility are available based on two types of loans, Base Rate loans or LIBOR Rate loans. Base Rate loans bear interest at the higher of the Prime Rate or the Federal Funds Rate plus 0.50%, either of which is then added to a maximum margin of 2.00%. LIBOR Rate loans bear interest at rates based on the LIBOR rate for the applicable loan period with a maximum margin over LIBOR of 4.00%. The loan period for a LIBOR Rate loan may be one month, two months, three months or six months and the loan may be renewed upon notice to the agent provided that no default has occurred. As a result, the revolving credit facility is classified as debt due within one year, although the revolving credit facility, by its terms, does not mature until December 6, 2012. The credit facility has a grid that adjusts the borrowing rates for both Base Rate loans and LIBOR Rate loans based upon the Company’s leverage ratio. Leverage ratio is defined as the ratio of total debt to earnings before interest, taxes, depreciation and amortization (EBITDA). The credit facility also includes a non-use fee ranging from 0.25% to 0.375%, which is based upon the Company’s leverage ratio. Among other provisions, the amended credit agreement contains certain financial covenants related to EBITDA, fixed charges, leverage ratio, working capital ratio, total indebtedness, and maximum loss ratio. On September 30, 2010, we entered into a second amendment which further modified the interest margin on the loans based on various leverage ratios and revised the minimum EBITDA covenant. As of December 31, 2010, the Company is in compliance with all of its debt covenants. The credit facility expires on December 6, 2012.
In addition to scheduled repayments, the term loan contains mandatory prepayment provisions beginning in 2009 whereby the Company is required to reduce the outstanding principal amounts of the term loan based on the Company’s excess cash flow (as defined in the agreement) and the Company’s leverage ratio as of the most recent completed fiscal year. For the year ended December 31, 2010, the Company paid $9.9 million on the term loan, which included $3.9 million required under the mandatory prepayment provisions and $6.0 million in scheduled payments. As of December 31, 2010, the Company completed the mandatory prepayment calculation and determined that a prepayment of approximately $3.9 million will be due on the term note by April 30, 2011.
87
Table of Contents
QC HOLDINGS, INC. AND SUBSIDIARIES
NOTES TO CONSOLIDATED FINANCIAL STATEMENTS—(Continued)
The following table summarizes future principal payments of indebtedness at December 31, 2010 (in thousands):
| December 31, 2010 |
||||
| 2011 (a) |
$ | 28,113 | ||
| 2012 |
16,881 | |||
| Total |
$ | 44,994 | ||
| (a) | Includes mandatory principal prepayment of $3.9 million. |
The Company entered into an interest rate swap agreement during first quarter 2008 as discussed more fully in Note 12.
NOTE 12—DERIVATIVES
Derivative instruments are accounted for at fair value. The accounting for changes in the fair value of a derivative depends on the intended use and designation of the derivative instrument. For a derivative instrument designated as a fair value hedge, the gain or loss on the derivative is recognized in earnings in the period of change in fair value together with the offsetting gain or loss on the hedged item. For a derivative instrument designated as a cash flow hedge, the effective portion of the derivative’s gain or loss is initially reported as a component of Other Comprehensive Income (OCI) and is subsequently recognized in earnings when the hedged exposure affects earnings. The ineffective portion of the gain or loss is recognized in earnings. Gains or losses from changes in fair values of derivatives that are not designated as hedges for accounting purposes are recognized currently in earnings.
The Company is exposed to certain risks relating to adverse changes in interest rates on its long-term debt and manages this risk through the use of a derivative. The Company does not enter into derivative instruments for trading or speculative purposes.
Cash Flow Hedge. The Company entered into an interest rate swap agreement during first quarter 2008 for $49 million of its outstanding debt as a cash flow hedge for interest rate fluctuations under its credit facility. The swap agreement is designated as a cash flow hedge, and effectively changes the floating rate interest obligation associated with the $50 million term loan into a fixed rate. The swap agreement has a maturity date of December 6, 2012. Under the swap, the Company pays a fixed interest rate of 3.43% and receives interest at a rate of LIBOR. As of December 31, 2010, approximately $26.5 million (representing the majority of the unpaid principal of the term loan) is subject to the interest rate swap agreement. The hedge is highly effective and, therefore, the Company reported no net gain or loss during the year ended December 31, 2010. The Company expects approximately $637,000 of losses in other comprehensive income to be reclassified into earnings within the next 12 months.
88
Table of Contents
QC HOLDINGS, INC. AND SUBSIDIARIES
NOTES TO CONSOLIDATED FINANCIAL STATEMENTS—(Continued)
The following table summarizes the fair value and location in the Consolidated Balance Sheet of all derivatives held by the Company as of December 31, 2010 (in thousands):
| Derivatives Designated as Hedging Instruments |
Balance Sheet Classification |
Fair Value | ||||
| Liabilities: |
||||||
| Interest rate swap |
Accrued expenses and other current liabilities | $ | 793 | |||
The following table summarizes the gains (losses) recognized in Other Comprehensive Income (in thousands) related to the interest rate swap agreement for the year ended December 31, 2010:
| Derivatives Designated as Hedging Instruments |
Gain (Loss) Recognized in OCI |
|||
| Cash flow hedges: |
||||
| Loss recognized in other comprehensive income |
$ | (589 | ) | |
| Amount reclassified from accumulated other comprehensive income to interest expense |
984 | |||
| Total |
$ | 395 | ||
NOTE 13—CREDIT SERVICES ORGANIZATION
Payday loans are originated by the Company at all of its branches, except branches in Texas. For its locations in Texas, the Company began operating as a CSO, through one of its subsidiaries, in September 2005. As a CSO, the Company acts as a credit services organization on behalf of consumers in accordance with Texas laws. The Company charges the consumer a fee for arranging for an unrelated third-party to make a loan to the consumer and for providing related services to the consumer, including a guarantee of the consumer’s obligation to the third-party lender. The Company also services the loan for the lender. The CSO fee is recognized ratably over the term of the loan. The Company is not involved in the loan approval process or in determining the loan approval procedures or criteria. As a result, loans made by the lender are not included in the Company’s loans receivable balance and are not reflected in the Consolidated Balance Sheets. As noted above, however, the Company absorbs all risk of loss through its guarantee of the consumer’s loan from the lender. As of December 31, 2009 and December 31, 2010, the consumers had total loans outstanding with the lender of approximately $2.7 million and $3.0 million, respectively. Because of the economic exposure for potential losses related to the guarantee of these loans, the Company records a payable at fair value to reflect the anticipated losses related to uncollected loans. The balance of the liability for estimated losses reported in accrued liabilities was approximately $100,000 as of December 31, 2009 and as of December 31, 2010. The following tables summarize the activity in the CSO liability (in thousands):
| Year Ended December 31, | ||||||||||||
| 2008 | 2009 | 2010 | ||||||||||
| CSO liability |
||||||||||||
| Balance, beginning of year |
$ | 160 | $ | 180 | $ | 100 | ||||||
| Charge-offs |
(4,993 | ) | (3,272 | ) | (2,798 | ) | ||||||
| Recoveries |
1,180 | 837 | 790 | |||||||||
| Provision for losses |
3,833 | 2,355 | 2,008 | |||||||||
| Balance, end of year |
$ | 180 | $ | 100 | $ | 100 | ||||||
89
Table of Contents
QC HOLDINGS, INC. AND SUBSIDIARIES
NOTES TO CONSOLIDATED FINANCIAL STATEMENTS—(Continued)
NOTE 14—INCOME TAXES
The Company’s provision for income taxes from continuing operations is summarized as follows (in thousands):
| Year Ended December 31, | ||||||||||||
| 2008 | 2009 | 2010 | ||||||||||
| Current: |
||||||||||||
| Federal |
$ | 11,751 | $ | 14,168 | $ | 6,944 | ||||||
| State |
1,616 | 1,833 | 879 | |||||||||
| Total Current |
13,367 | 16,001 | 7,823 | |||||||||
| Deferred: |
||||||||||||
| Federal |
(2,882 | ) | (3,171 | ) | 264 | |||||||
| State |
(388 | ) | (427 | ) | 34 | |||||||
| Total Deferred |
(3,270 | ) | (3,598 | ) | 298 | |||||||
| Total provision for income taxes |
$ | 10,097 | $ | 12,403 | $ | 8,121 | ||||||
The sources of deferred income tax assets (liabilities) are summarized as follows (in thousands):
| December 31, | ||||||||
| 2009 | 2010 | |||||||
| Deferred tax assets related to: |
||||||||
| Allowance for loan losses |
$ | 7,773 | $ | 5,705 | ||||
| Accrued rent |
1,452 | 1,093 | ||||||
| Accrued vacation |
533 | 487 | ||||||
| Stock-based compensation |
1,940 | 2,209 | ||||||
| Unrealized loss on derivatives |
450 | 301 | ||||||
| Unused state tax credits |
413 | 428 | ||||||
| Book reserves |
569 | 646 | ||||||
| Deferred compensation |
690 | 939 | ||||||
| Other |
179 | 523 | ||||||
| Total gross deferred tax assets |
13,999 | 12,331 | ||||||
| Less: valuation allowance |
(413 | ) | (428 | ) | ||||
| Net deferred tax assets |
13,586 | $ | 11,903 | |||||
| Deferred tax liabilities related to: |
||||||||
| Property and equipment |
(1,229 | ) | (740 | ) | ||||
| Loans receivable, tax value |
(5,105 | ) | (4,116 | ) | ||||
| Goodwill |
(1,376 | ) | (1,536 | ) | ||||
| Prepaid assets |
(400 | ) | (405 | ) | ||||
| Gross deferred tax liabilities |
(8,110 | ) | (6,797 | ) | ||||
| Net deferred tax asset |
$ | 5,476 | $ | 5,106 | ||||
The Company has state tax credit carry-forwards of approximately $635,000 and 658,000 as of December 31, 2009 and December 31, 2010, respectively. The deferred tax asset, net of federal tax effect, relating to the carry-forwards is approximately $413,000 and $428,000 as of December 31, 2009 and December 31, 2010, respectively. The net change in the total valuation allowance for years ended December 31, 2009 and 2010 was a decrease of
90
Table of Contents
QC HOLDINGS, INC. AND SUBSIDIARIES
NOTES TO CONSOLIDATED FINANCIAL STATEMENTS—(Continued)
$8,000 and an increase of $15,000, respectively. The Company’s ability to utilize a significant portion of the state tax credit carry-forwards is dependent on its ability to meet certain criteria imposed by the state not only for the year in which the credit is generated, but also for all subsequent years in which any portion of the credit is utilized. In addition, the credits can only be utilized against the tax liabilities of specific subsidiaries in those states. During 2010 the Company obtained certification for the utilization of a portion of these credits carry forwards for the 2009 tax year in a particular jurisdiction. Also, additional credit carry forwards were generated for the 2010 tax year. Until certification to utilize these credits is received, management believes that it is not more likely than not that the benefit of these credits will be realized and, accordingly, a valuation allowance in the amount of $413,000 and $428,000 has been established at December 31, 2009 and December 31, 2010, respectively.
Differences between the Company’s effective income tax rate computed for income from continuing operations and the statutory federal income tax rate are as follows (in thousands):
| Year Ended December 31, | ||||||||||||
| 2008 | 2009 | 2010 | ||||||||||
| Income tax expense using the statutory federal rate in effect |
$ | 8,317 | $ | 11,155 | $ | 7,818 | ||||||
| Tax effect of: |
||||||||||||
| State and local income taxes, net of federal benefit |
802 | 915 | 558 | |||||||||
| State ballot initiatives |
579 | |||||||||||
| Other |
399 | 333 | (255 | ) | ||||||||
| Total provision for income taxes |
$ | 10,097 | $ | 12,403 | $ | 8,121 | ||||||
| Effective tax rate |
42.5 | % | 38.9 | % | 36.4 | % | ||||||
| Statutory federal tax rate |
35.0 | % | 35.0 | % | 35.0 | % | ||||||
During 2008, the Company incurred expenses of approximately $1.7 million for ballot initiatives associated with contested states. In Arizona, the Company joined with other short-term loan companies to support a ballot initiative to remove the sunset provision of the existing payday lending law that expired in 2010 and to put into place a series of consumer friendly reforms. In addition, the Company joined other short-term loan companies in Ohio to support a referendum effort designed to allow citizens a choice in deciding whether to have access to a regulated payday advance product.
The effective income tax rate for the year ended December 31, 2010 was 36.4% compared to 38.9% in the prior year. The decrease is primarily related to the realization of certain state tax credits, and an increase in certain federal wage related credits.
Uncertain Tax Positions. A summary of the total amount of unrecognized tax benefits for the years ended December 31, 2009 and 2010 is as follows (in thousands):
| December 31, | ||||||||
| 2009 | 2010 | |||||||
| Balance at beginning of year |
$ | 52 | $ | 50 | ||||
| Increases: |
||||||||
| Tax positions taken during a prior period |
232 | |||||||
| Tax positions taken during the current period |
16 | |||||||
| Decreases: |
||||||||
| Tax positions taken during prior period |
(6 | ) | ||||||
| Lapse of statute of limitations |
(2 | ) | (39 | ) | ||||
| Balance at end of year |
$ | 50 | $ | 253 | ||||
91
Table of Contents
QC HOLDINGS, INC. AND SUBSIDIARIES
NOTES TO CONSOLIDATED FINANCIAL STATEMENTS—(Continued)
Approximately $36,000 of the total unrecognized tax benefits at December 31, 2010, will, if ultimately recognized, impact the Company’s annual effective tax rate.
The Company records accruals for interest and penalties related to unrecognized tax benefits in interest expense and operating expense, respectively. Interest and penalties, and associated accruals, were not material in 2008, 2009 or 2010.
The Company does not anticipate any material changes in the amount of unrecognized tax benefits in the next twelve months.
The Company is subject to income taxes in the U.S. federal jurisdiction and various state jurisdictions. Tax regulations within each jurisdiction are subject to the interpretation of the related tax laws and regulations and require significant judgment to apply. In the ordinary course of business, transactions occur for which the ultimate tax outcome is uncertain. In addition, respective tax authorities periodically audit the Company’s income tax returns. These audits examine the Company’s significant tax filing positions, including the timing and amounts of deductions and the allocation of income among tax jurisdictions. The following table outlines the tax years that generally remain subject to examination as of December 31, 2010:
| Federal | State | |||
| Statute remains open |
2007-2010 | 2006-2010 | ||
| Tax years currently under examination |
N/A | N/A |
NOTE 15—EMPLOYEE BENEFIT PLANS
The Company has established a defined-contribution 401(k) benefit plan that covers substantially all its full-time employees. Under the plan, the Company makes a matching contribution of 50% of each employee’s contribution, up to 6% of the employee’s compensation. The Company’s matching contributions and administrative expenses relating to the 401(k) plan were $454,000, $436,000 and $476,000 during 2008, 2009 and 2010, respectively.
In June 2007, the Company established a non-qualified deferred compensation plan for certain highly compensated employees, which permits participants to defer a portion of their compensation. Under the plan, the Company makes a matching contribution of 50% of each employee’s contribution, up to 6% of the employee’s compensation. The Company’s matching contributions and administrative expenses relating to the plan were $171,000, $170,000, and $201,000 during 2008, 2009 and 2010, respectively. Deferred amounts are credited with deemed gains or losses of the underlying hypothetical investments. For the year ended December 31, 2008, the Company recognized a reduction in compensation expense of approximately $447,000 as a result of deemed losses of the hypothetical investments. For the years ended December 31, 2009 and 2010, the Company recognized compensation expense of approximately $311,000 and $280,000, respectively, as a result of deemed gains on the hypothetical investments. Included in Other Liabilities (non-current) are amounts deferred under this plan of approximately $1.8 million and $2.5 million at December 31, 2009 and 2010, respectively.
The Company purchases corporate-owned life insurance policies on certain officers to informally fund the non-qualified deferred compensation plan. The cash surrender value of the life insurance policies is included in Other Assets (non-current) and totaled approximately $2.4 million and $3.5 million at December 31, 2009 and 2010, respectively. This asset is available to fund the deferred compensation liability, however, the asset is not protected from creditors of the Company. For the year ended December 31, 2008, the Company recognized losses totaling $395,000 on its investments associated with the life insurance policies, reflected in the cash surrender value. For the years ended December 31, 2009 and 2010, the Company recognized gains totaling $408,000 and $340,000, respectively, on its investments associated with the life insurance policies, reflected in the cash surrender value.
92
Table of Contents
QC HOLDINGS, INC. AND SUBSIDIARIES
NOTES TO CONSOLIDATED FINANCIAL STATEMENTS—(Continued)
NOTE 16—STOCKHOLDERS’ EQUITY
Earnings Per Share. The following table presents the computations of basic and diluted earnings per share for the periods presented (in thousands, except per share data):
| Year Ended December 31, | ||||||||||||
| 2008 | 2009 | 2010 | ||||||||||
| Net income from continuing operations |
$ | 13,666 | $ | 19,469 | $ | 14,215 | ||||||
| Gain (loss) from discontinued operations available to common stockholders |
(87 | ) | 360 | (2,272 | ) | |||||||
| Income available to common stockholders |
$ | 13,579 | $ | 19,829 | $ | 11,943 | ||||||
| Weighted average basic common shares outstanding |
17,877 | 17,437 | 17,259 | |||||||||
| Incremental shares from assumed conversion of stock options, unvested restricted shares and unvested performance-based shares |
106 | 143 | 82 | |||||||||
| Weighted average diluted common shares outstanding |
17,983 | 17,580 | 17,341 | |||||||||
| Earnings (loss) per share |
||||||||||||
| Basic |
||||||||||||
| Continuing operations |
$ | 0.76 | $ | 1.09 | $ | 0.79 | ||||||
| Discontinued operations |
(0.01 | ) | .02 | (0.13 | ) | |||||||
| Net income |
$ | 0.75 | $ | 1.11 | $ | 0.66 | ||||||
| Diluted |
||||||||||||
| Continuing operations |
$ | 0.75 | $ | 1.08 | $ | 0.79 | ||||||
| Discontinued operations |
(0.00 | ) | .02 | (0.13 | ) | |||||||
| Net income |
$ | 0.75 | $ | 1.10 | $ | 0.66 | ||||||
The Company had approximately 17.4 million and 17.0 million shares outstanding at December 31, 2009 and 2010, respectively. For financial reporting purposes, however, unvested restricted shares in the amount of approximately 223,000 shares, 501,000 shares and 661,000 shares are excluded from the determination of average common shares outstanding used in the calculation of basic earnings per share in the above table for the years ended December 31, 2008, 2009 and 2010, respectively.
Anti-dilutive securities. Options to purchase approximately 2.3 million shares, 2.1 million shares and 2.7 million shares of common stock were excluded from the diluted earnings per share calculation for the years ended December 31, 2008, 2009 and 2010, respectively because they were anti-dilutive.
Stock Repurchases. The board of directors has authorized the Company to repurchase up to $60 million of its common stock in the open market and through private purchases. The acquired shares may be used for corporate purposes, including shares issued to employees in stock-based compensation programs. Under the announced stock repurchase program, the Company expended $12.3 million for approximately 1.5 million shares, $1.2 million for approximately 200,000 shares, and $2.6 million for approximately 606,000 shares during the years ended December 31, 2008, 2009, and 2010, respectively. As of December 31, 2010, the Company had approximately $5.6 million that may yet be utilized to repurchase shares under the current program. Under the existing credit facility agreement (see Note 11), the Company may not modify the stock repurchase program to provide for repurchases in excess of $60 million. Shares received in exchange for tax withholding obligations arising from the vesting of restricted stock are included in common stock repurchased in the Consolidated Statements of Cash Flows and the Statements of Changes in Stockholders’ Equity.
Dividends. In November 2008, the Company’s board of directors established a regular quarterly cash dividend of $0.05 per share of the Company’s common stock. In addition to regular quarterly dividends, the
93
Table of Contents
QC HOLDINGS, INC. AND SUBSIDIARIES
NOTES TO CONSOLIDATED FINANCIAL STATEMENTS—(Continued)
Company’s board of directors has also approved special cash dividends on the Company’s common stock from time to time. For the years ended December 31, 2008, 2009 and 2010, the Company declared dividends on its common stock of $0.30 per share, in each year.
NOTE 17—STOCK-BASED COMPENSATION
Long-Term Incentive Stock Plans. As of December 31, 2010, the Company’s stock-based compensation plans include the 1999 Stock Option Plan (1999 Plan), the 2004 Equity Incentive Plan (2004 Plan) and an option to purchase 126,397 shares of common stock granted to a former officer of the Company when he was a consultant to the Company. Securities remaining available for future issuance under equity compensation plans approved by security holders consist solely of shares of common stock available under the 2004 Plan. The maximum number of shares of common stock of the Company originally reserved and available for issuance under the 2004 Plan was three million shares. In June 2009, at the annual meeting of the Company’s stockholders, the stockholders approved an amendment to the 2004 Plan to increase the number of shares of common stock available for issuance under such plan from three million shares to five million shares. As of December 31, 2010, there are approximately 844,000 shares of common stock available for future issuance under the 2004 Plan, which may be issued, in any combination, as incentive stock options, non-qualified stock options, stock appreciation rights, performance-based share awards, restricted stock or other incentive awards of, or based on, the Company’s common stock. During 2008, 2009 and 2010, the Company has issued a combination of stock options (non-qualified) and restricted stock to its employees as part of the Company’s long-term equity incentive compensation program.
In accordance with the Company’s stock-based compensation plans, the exercise price of a stock option is equal to the market price of the stock on the date of the grant and the option awards typically vest over four years in 25% increments on the first, second, third and fourth anniversaries of the grant date. Generally, options granted will expire 10 years from the date of grant.
Restricted stock awards and performance-based share awards are valued on the date of grant and have no purchase price. Restricted stock awards typically vest over four years in 25% increments on the first, second, third and fourth anniversaries of the grant date. The vesting period for performance-based share awards is implicitly stated as the time period it will take for the performance condition to be met. Under the 2004 Plan, unvested shares of restricted stock and unvested performance-based share awards may be forfeited upon the termination of employment with the Company, dependent upon the circumstances of termination. Except for restrictions placed on the transferability of restricted stock, holders of unvested restricted stock and holders of unvested performance-based share awards have full stockholder’s rights, including voting rights and the right to receive cash dividends.
Share-Based Compensation. The following table summarizes the stock-based compensation expense reported in net income for the years ended December 31, 2008, 2009 and 2010 (in thousands):
| Year Ended December 31, | ||||||||||||
| 2008 | 2009 | 2010 | ||||||||||
| Employee stock-based compensation: |
||||||||||||
| Stock options |
$ | 1,152 | $ | 1,200 | $ | 456 | ||||||
| Restricted stock awards |
859 | 1,349 | 1,489 | |||||||||
| 2,011 | 2,549 | 1,945 | ||||||||||
| Non-employee director stock-based compensation: |
||||||||||||
| Restricted stock awards |
216 | 230 | 225 | |||||||||
| Total stock-based compensation |
$ | 2,227 | $ | 2,779 | $ | 2,170 | ||||||
94
Table of Contents
QC HOLDINGS, INC. AND SUBSIDIARIES
NOTES TO CONSOLIDATED FINANCIAL STATEMENTS—(Continued)
The related income tax benefit was $845,000, $1.1 million and $779,000 million for the years ended December 31, 2008, 2009 and 2010, respectively.
Stock Options. The Company did not grant stock options during 2010. The Company granted 530,492 stock options during 2009 to certain employees under the 2004 Plan. The grants of stock options vest equally over four years. The Company estimated that the fair value of these option grants was approximately $811,000. The Company granted 263,200 stock options during 2008 to certain employees under the 2004 Plan.
The fair value of option grants was determined on the grant date using a Black-Scholes option-pricing model, which requires the Company to make several assumptions. The risk-free interest rate used was based on the U.S. Treasury yield curve in effect for the expected term of the option at the time of the grant. The dividend yield was calculated based on the current dividend and the market price of the Company’s common stock on the grant date. The expected volatility factor used by the Company was based on the Company’s historical stock trading history. The Company computed the expected term of the option by using the simplified method, which is an average of the vesting term and original contractual term.
The grant date fair value of options granted in 2008 and 2009 were calculated using a Black-Scholes option-pricing model based on the following assumptions:
| Year Ended December 31, | ||||||||
| 2008 | 2009 | |||||||
| Dividend yield |
1.79 to 2.12 | % | 4.56 | % | ||||
| Risk-free interest rate |
2.92% to 3.56 | % | 2.37 | % | ||||
| Expected volatility |
41.49% to 45.84 | % | 53.53 | % | ||||
| Expected life (in years) |
6.25 | 6.25 | ||||||
As of December 31, 2010, there was $615,000 of total unrecognized compensation costs related to outstanding stock options. The Company expects that these costs will be amortized over a weighted average period of 1.6 years.
The weighted-average grant date fair value per share of options granted during the years 2008 and 2009 was $4.70, and $1.53, respectively. The total intrinsic value of options exercised during the years ended December 31, 2008 and 2009 was $804,000 and $225,000, respectively. No options were exercised during the year ended December 31, 2010.
A summary of nonvested stock option activity and related information for the year ended December 31, 2010 is as follows:
| Options | Weighted Average Grant Date Fair Value |
|||||||
| Nonvested balance, January 1, 2010 |
895,183 | $ | 2.75 | |||||
| Granted |
||||||||
| Vested |
(375,064 | ) | 2.69 | |||||
| Forfeited |
(10,000 | ) | 3.75 | |||||
| Nonvested balance, December 31, 2010 |
510,119 | $ | 2.25 | |||||
The total fair value of options vested during 2010 was approximately $1.0 million.
95
Table of Contents
QC HOLDINGS, INC. AND SUBSIDIARIES
NOTES TO CONSOLIDATED FINANCIAL STATEMENTS—(Continued)
A summary of all stock option activity under the equity compensation plans for the year ended December 31, 2010 is as follows:
| Options | Weighted Average Exercise Price |
Weighted Average Remaining Contractual Term (years) |
Aggregate Intrinsic Value |
|||||||||||||
| (in thousands) | ||||||||||||||||
| Outstanding, January 1, 2010 |
2,816,620 | $ | 9.51 | |||||||||||||
| Granted |
||||||||||||||||
| Exercised |
||||||||||||||||
| Forfeited |
(13,141 | ) | 10.38 | |||||||||||||
| Outstanding, December 31, 2010 |
2,803,479 | $ | 9.50 | 5.1 | $ | 257 | ||||||||||
| Exercisable, December 31, 2010 |
2,285,504 | $ | 10.34 | 4.5 | $ | 257 | ||||||||||
The following table summarizes information about options outstanding and exercisable at December 31, 2010:
| Options Outstanding | Options Exercisable | |||||||||||||||||||
| Exercise Price |
Number Outstanding |
Weighted Average Remaining Contractual Life of Outstanding (in years) |
Weighted Average Exercise Price |
Number Exercisable |
Weighted Average Exercise Price |
|||||||||||||||
| $ 1 to $ 5 |
668,795 | 6.7 | $ | 3.87 | 274,676 | $ | 3.12 | |||||||||||||
| $ 5 to $10 |
798,402 | 5.0 | 9.47 | 786,796 | 9.47 | |||||||||||||||
| $10 to $15 |
1,273,432 | 4.4 | 12.21 | 1,161,182 | 12.39 | |||||||||||||||
| $15 to $20 |
62,850 | 4.0 | 15.07 | 62,850 | 15.07 | |||||||||||||||
| 2,803,479 | 5.1 | $ | 9.50 | 2,285,504 | $ | 10.34 | ||||||||||||||
Restricted stock grants. A summary of all restricted stock activity under the equity compensation plans for the year ended December 31, 2010 is as follows:
| Restricted Stock | Weighted Average Grant Date Fair Value |
|||||||
| Nonvested balance, January 1, 2010 |
501,399 | $ | 6.56 | |||||
| Granted |
411,640 | 5.61 | ||||||
| Vested |
(232,451 | ) | 6.24 | |||||
| Forfeited |
(19,292 | ) | 5.90 | |||||
| Nonvested balance, December 31, 2010 |
661,296 | $ | 5.81 | |||||
During 2010, the Company granted 375,840 shares of restricted stock to various employees and non-employee directors under the 2004 Equity Incentive Plan pursuant to restricted stock agreements. The grants consisted of 335,600 shares granted to employees that vest equally over four years and 40,240 shares granted to non-employee directors that vested immediately upon grant subject to an agreed-upon six-month holding period. The Company estimated that the fair market value of these restricted stock grants was approximately $2.1 million. For the year ended December 31, 2010, the Company recognized $653,000 in stock-based compensation expense related to these restricted stock grants. As of December 31, 2010, there was $1.4 million of total unrecognized compensation costs related to these restricted stock grants. The Company expects that these costs will be amortized over a weighted average period of 3.0 years.
96
Table of Contents
QC HOLDINGS, INC. AND SUBSIDIARIES
NOTES TO CONSOLIDATED FINANCIAL STATEMENTS—(Continued)
In December 2009, it was determined that the Company’s executive officers would receive a one-time bonus equal to 10% of their current base salary in lieu of an increase in the base salaries of executive officers for the year ending December 31, 2010. In addition, it was determined that the majority of the executive officers would receive the one-time bonus in Company stock and two executive officers would receive the bonus in cash. As of December 31, 2009, the balance of the liability for the one-time stock bonus in lieu of base salary increases was approximately $185,000. In January 2010, the Company granted 35,800 shares that vested immediately upon grant subject to an agreed-upon six-month holding period.
During 2009, the Company granted 411,744 shares of restricted stock to various employees and non-employee directors pursuant to restricted stock agreements. The grants consisted of 359,464 shares granted to employees that vest equally over four years and 52,280 shares granted to non-employee directors that vested immediately upon grant subject to an agreed-upon six-month holding period. The Company estimated that the fair market value of these restricted stock grants was approximately $1.7 million.
During 2008, the Company granted 161,672 shares of restricted stock to various employees and non-employee directors pursuant to restricted stock agreements. The grants consisted of 140,512 shares granted to employees that vest equally over four years and 21,160 shares granted to non-employee directors that vested immediately upon grant subject to an agreed-upon six-month holding period. The Company estimated that the fair market value of these restricted stock grants was approximately $1.6 million.
As of December 31, 2010, there was $2.4 million of total unrecognized compensation costs related to the nonvested restricted stock grants. The Company estimates that these costs will be amortized over a weighted average period of 2.5 years.
The total fair value of restricted stock vested (at vest date) during the years ended December 31, 2008, 2009 and 2010 was $586,000, $560,000 and $1.1 million, respectively. The Company requires employees to tender a portion of their vested shares to the Company to satisfy the minimum tax withholding obligations of the Company with respect to vesting of the shares. During 2008, 2009 and 2010, the Company repurchased shares from employees totaling approximately 11,500, 26,400, and 68,500, respectively.
NOTE 18—COMMITMENTS AND CONTINGENCIES
Operating Leases. The Company leases certain equipment and buildings under non-cancelable operating leases. The future minimum lease payments include payments required for the initial non-cancelable term of the operating lease plus any payments for periods of expected renewals provided for in the lease that the Company considers to be reasonably assured of exercising. The following table summarizes the future minimum lease payments as of December 31, 2010 (in thousands):
| Non- Cancelable |
Reasonably Assured Renewals |
Total | ||||||||||
| 2011 |
$ | 11,835 | $ | 1,791 | $ | 13,626 | ||||||
| 2012 |
7,844 | 4,861 | 12,705 | |||||||||
| 2013 |
4,298 | 7,437 | 11,735 | |||||||||
| 2014 |
2,083 | 8,411 | 10,494 | |||||||||
| 2015 |
719 | 7,970 | 8,689 | |||||||||
| Thereafter |
22,117 | 22,117 | ||||||||||
| Total |
$ | 26,779 | $ | 52,587 | $ | 79,366 | ||||||
97
Table of Contents
QC HOLDINGS, INC. AND SUBSIDIARIES
NOTES TO CONSOLIDATED FINANCIAL STATEMENTS—(Continued)
Rental expense was $14.5 million, $12.9 million and $12.0 million during the years ended December 31, 2008, 2009 and 2010, respectively.
Other. The Company is self-insured for certain elements of its employee benefits. Self-insurance liabilities are based on claims filed and estimates of claims incurred but not reported.
Under the terms of the Company’s agreement with its third-party lender in Texas, the Company is contractually obligated to reimburse the lender for the full amount of the loans and certain related fees that are not collected from the customers. See additional information in Note 13.
Litigation. The Company is subject to various legal proceedings arising from normal business operations. Although there can be no assurances, based on the information currently available, management believes that it is probable that the ultimate outcome of each of the actions will not have a material adverse effect on the consolidated financial statements. However, an adverse outcome in any of the actions could have a material adverse effect on the financial results of the Company in the period in which it is recorded.
Missouri. On October 13, 2006, one of the Company’s Missouri customers sued the Company in the Circuit Court of St. Louis County, Missouri in a purported class action. The lawsuit alleges violations of the Missouri statute pertaining to unsecured loans under $500 and the Missouri Merchandising Practices Act. The lawsuit seeks monetary damages and a declaratory judgment that the arbitration agreement with the plaintiff is not enforceable on a variety of theories. The Company moved to compel arbitration of this matter. In December 2007, the court entered an order striking the class action waiver provision in the Company’s customer arbitration agreement, ordered the case to arbitration and dismissed the lawsuit filed in Circuit Court. In July 2008, the Company filed its appeal of the court’s order with the Missouri Court of Appeals. In December 2008, the Court of Appeals affirmed the decision of the trial court. In September 2009, the plaintiff filed her action in arbitration. The Company has filed its answer, and a three-person arbitration panel has been chosen. Discovery has commenced, and the parties will possibly argue class certification in early 2011.
North Carolina. On February 8, 2005, the Company, two of its subsidiaries, including its subsidiary doing business in North Carolina, and Mr. Don Early, the Company’s Chairman of the Board and Chief Executive Officer, were sued in Superior Court of New Hanover County, North Carolina in a putative class action lawsuit filed by James B. Torrence, Sr. and Ben Hubert Cline, who were customers of a Delaware state-chartered bank for whom the Company provided certain services in connection with the bank’s origination of payday loans in North Carolina, prior to the closing of the Company’s North Carolina branches in fourth quarter 2005. The lawsuit alleges that the Company violated various North Carolina laws, including the North Carolina Consumer Finance Act, the North Carolina Check Cashers Act, the North Carolina Loan Brokers Act, the state unfair trade practices statute and the state usury statute, in connection with payday loans made by the bank to the two plaintiffs through the Company’s retail locations in North Carolina. The lawsuit alleges that the Company made the payday loans to the plaintiffs in violation of various state statutes, and that if the Company is not viewed as the “actual lenders or makers” of the payday loans, its services to the bank that made the loans violated various North Carolina statutes. Plaintiffs are seeking certification as a class, unspecified monetary damages, and treble damages and attorneys fees under specified North Carolina statutes. Plaintiffs have not sued the bank in this matter and have specifically stated in the complaint that plaintiffs do not challenge the right of out-of-state banks to enter into loans with North Carolina residents at such rates as the bank’s home state may permit, all as authorized by North Carolina and federal law. This case is in the preliminary stages.
There are three similar purported class action lawsuits filed in North Carolina against three other companies unrelated to the Company. In December 2005, the judge in those three cases (1) granted the defendants’ motions to stay the purported class action lawsuits and to compel arbitration in accordance with the terms of the
98
Table of Contents
QC HOLDINGS, INC. AND SUBSIDIARIES
NOTES TO CONSOLIDATED FINANCIAL STATEMENTS—(Continued)
arbitration provisions contained in the consumer loan contracts, (2) ruled that the class action waivers in those consumer loan contracts are valid, and (3) denied plaintiffs’ motions for class certifications. The plaintiffs in those three cases, who are represented by the same law firms as the plaintiffs in the case filed against the Company, appealed that ruling. In January 2007, the North Carolina Court of Appeals heard the appeal in the three companion cases. In May 2008, the appellate court remanded the three companion cases to the state court to review its ruling in light of a recent North Carolina Supreme Court decision. In June 2009, the trial court denied defendants’ motion to compel arbitration and granted each of the respective plaintiffs’ motions for class certification. Defendants appealed those rulings, but by the end of 2010, tentative settlements in each of the three companion cases were reached. However the settlements do not provide reasonable guidance on settlements in the Company’s case. The Company will argue its own issues concerning arbitration and class certification before the trial court in early to mid 2011.
The judge handling the lawsuit against the Company in North Carolina is the same judge who is handling the three companion cases.
Arizona. In December 2009, the Arizona Attorney General filed a lawsuit against the Company in Arizona state court. Specifically, the Attorney General contends that the Company allegedly violated various state consumer protection statutes when the Company sued non-Pima County customers with delinquent accounts in Pima County. Subsequently, the Attorney General amended its complaint in December 2009, and alleged that the Company’s arbitration provision was unconscionable. In January 2010, the Company moved to dismiss the Attorney General’s complaint. The Attorney General has asked for and received extensions of time to respond to this motion to dismiss. Since then, the parties have reached a tentative agreement to settle the matter for approximately $230,000. It is anticipated that the parties will execute this settlement by March 2011.
Ohio. In April 2009, the Ohio Division of Financial Institutions issued a notice of violation challenging the business model used by a subsidiary of the Company in that state. In Ohio, the Company issues short-term loan proceeds to customers in the form of a check. The Company offers to cash these checks for a fee. Cashing a check is a voluntary transaction and the underlying short-term loan is not conditioned upon an agreement to cash the customer’s loan proceeds check. The Division of Financial Institutions has claimed that cashing these checks is a violation of the Ohio’s Small Loan Act and has asked the Company to cease cashing the checks for a fee. The Company believes that its business practice complies with all applicable laws and continues to conduct business without any changes to its operations. The Division asked for an administrative hearing to determine whether the business model violates state law. A hearing officer determined, however, that the Company’s model does not violate state law. The Division, as allowed by law, in early 2011 rejected this finding and issued another cease and desist order to the Company. As a result, the Company moved to stay the order and has forced an appeal of the administrative ruling to state district court. In a separate action, the Company, joined by other short-term lending companies, sued the Division to bar the enforcement of these new proposed rules. In April 2010, the court overseeing the case issued a temporary restraining order against the Division, preventing the enforcement of the rules for the near future.
Other Matters. The Company is also currently involved in ordinary, routine litigation and administrative proceedings incidental to its business, including customer bankruptcies and employment-related matters from time to time. The Company believes the likely outcome of any other pending cases and proceedings will not be material to its business or its financial condition.
NOTE 19—CERTAIN CONCENTRATIONS OF RISK
The Company is subject to regulation by federal and state governments that affect the products and services provided by the Company, particularly payday loans. The Company currently operates in 24 states throughout the
99
Table of Contents
QC HOLDINGS, INC. AND SUBSIDIARIES
NOTES TO CONSOLIDATED FINANCIAL STATEMENTS—(Continued)
United States. The level and type of regulation of payday loans varies greatly from state to state, ranging from states with no regulations or legislation to other states with very strict guidelines and requirements.
Company branches located in the states of Missouri, California, Kansas and Illinois represented approximately 30%, 15%, 10% and 6%, respectively, of total revenues for the year ended December 31, 2010. Company branches located in the states of Missouri, California, Kansas, Illinois and New Mexico represented approximately 34%, 15%, 10%, 8%, and 5%, respectively, of total branch gross profit for the year ended December 31, 2010. To the extent that laws and regulations are passed that affect the Company’s ability to offer loans or the manner in which the Company offers its loans in any one of those states, the Company’s financial position, results of operations and cash flows could be adversely affected. For example, amendments to the South Carolina law and Washington law became effective January 1, 2010. Prior to these new laws in South Carolina and Washington, revenues from each state were approximately 7% and 5%, respectively of total Company revenues. For the year ended December 31, 2010, revenues from South Carolina and Washington declined by $6.8 million and $3.7 million, respectively and gross profit declined by $5.4 million and $2.6 million, respectively. Similarly, the Arizona payday loan statutory authority expired by its terms on June 30, 2010, and the termination of this law had a significant adverse effect on the revenues and profitability of the Company. For the year ended December 31, 2010, revenues and gross profit from the Arizona branches declined by $6.9 million and $5.4 million respectively, from the same period in 2009.
A new law becomes effective in Illinois in March 2011 that includes, among other things, limitations on the number of loans a customer may have at one time throughout the state. This type of customer restriction, when passed in other states such as Washington, South Carolina and Kentucky, has resulted in a 30% to 60% decline in annual revenues depending on the types of alternative products that competitors may offer within the state.
NOTE 20—SELECTED QUARTERLY INFORMATION (Unaudited)
| Year Ended December 31, 2010 | ||||||||||||||||||||
| First Quarter |
Second Quarter |
Third Quarter |
Fourth Quarter |
Total | ||||||||||||||||
| (in thousands, except per share data) | ||||||||||||||||||||
| 2010 |
||||||||||||||||||||
| Total revenues |
$ | 47,037 | $ | 45,139 | $ | 47,490 | $ | 48,422 | $ | 188,088 | ||||||||||
| Branch gross profit |
19,893 | 13,217 | 14,344 | 16,106 | 63,560 | |||||||||||||||
| Income from continuing operations before taxes |
9,191 | 3,001 | 4,307 | 5,837 | 22,336 | |||||||||||||||
| Income from continuing operations, net of tax |
5,642 | 1,791 | 2,600 | 4,182 | 14,215 | |||||||||||||||
| Loss from discontinued operations, net of tax |
(466 | ) | (357 | ) | (560 | ) | (889 | ) | (2,272 | ) | ||||||||||
| Net income |
5,176 | 1,434 | 2,040 | 3,293 | 11,943 | |||||||||||||||
| Earnings (loss) per share(a): |
||||||||||||||||||||
| Basic |
||||||||||||||||||||
| Continuing operations |
$ | 0.31 | $ | 0.10 | $ | 0.14 | $ | 0.24 | $ | 0.79 | ||||||||||
| Discontinued operations |
(0.03 | ) | (0.02 | ) | (0.03 | ) | (0.05 | ) | (0.13 | ) | ||||||||||
| Net income |
$ | 0.28 | $ | 0.08 | $ | 0.11 | $ | 0.19 | $ | 0.66 | ||||||||||
| Diluted |
||||||||||||||||||||
| Continuing operations |
$ | 0.31 | $ | 0.10 | $ | 0.14 | $ | 0.24 | $ | 0.79 | ||||||||||
| Discontinued operations |
(0.03 | ) | (0.02 | ) | (0.03 | ) | (0.05 | ) | (0.13 | ) | ||||||||||
| Net income |
$ | 0.28 | $ | 0.08 | $ | 0.11 | $ | 0.19 | $ | 0.66 | ||||||||||
100
Table of Contents
QC HOLDINGS, INC. AND SUBSIDIARIES
NOTES TO CONSOLIDATED FINANCIAL STATEMENTS—(Continued)
| Year Ended December 31, 2009 | ||||||||||||||||||||
| First Quarter |
Second Quarter |
Third Quarter |
Fourth Quarter |
Total | ||||||||||||||||
| (in thousands, except per share data) | ||||||||||||||||||||
| 2009 |
||||||||||||||||||||
| Total revenues |
$ | 51,567 | $ | 48,644 | $ | 53,349 | $ | 53,474 | $ | 207,034 | ||||||||||
| Branch gross profit |
21,261 | 16,847 | 18,267 | 20,108 | 76,483 | |||||||||||||||
| Income from continuing operations before taxes |
9,939 | 6,585 | 7,090 | 8,258 | 31,872 | |||||||||||||||
| Income from continuing operations, net of tax |
6,061 | 4,102 | 4,400 | 4,906 | 19,469 | |||||||||||||||
| Gain (loss) from discontinued operations, net of tax |
(303 | ) | 155 | 231 | 277 | 360 | ||||||||||||||
| Net income |
5,758 | 4,257 | 4,631 | 5,183 | 19,829 | |||||||||||||||
| Earnings (loss) per share(a): |
||||||||||||||||||||
| Basic |
||||||||||||||||||||
| Continuing operations |
$ | 0.34 | $ | 0.23 | $ | 0.25 | $ | 0.27 | $ | 1.09 | ||||||||||
| Discontinued operations |
(0.02 | ) | 0.01 | 0.01 | 0.02 | 0.02 | ||||||||||||||
| Net income |
$ | 0.32 | $ | 0.24 | $ | 0.26 | $ | 0.29 | $ | 1.11 | ||||||||||
| Diluted |
||||||||||||||||||||
| Continuing operations |
$ | 0.34 | $ | 0.23 | $ | 0.25 | $ | 0.27 | $ | 1.08 | ||||||||||
| Discontinued operations |
(0.02 | ) | 0.01 | 0.01 | 0.02 | 0.02 | ||||||||||||||
| Net income |
$ | 0.32 | $ | 0.24 | $ | 0.26 | $ | 0.29 | $ | 1.10 | ||||||||||
| (a) | The sum of the basic and diluted earnings per share for the four quarters does not equal the full year total for 2010 and 2009, as a result of issuances and repurchases of common stock. |
NOTE 21—SUBSEQUENT EVENTS
Equity Compensation Grants. On February 1, 2011, the Company granted approximately 532,040 restricted shares to various employees and non-employee directors under the 2004 Plan. The total fair market value of the restricted shares under these grants was approximately $2.2 million. The 487,200 restricted shares granted to employees vest equally over four years and had a fair market value on the date of grant of $2.0 million. The 44,840 shares granted to the directors vested immediately upon the date of grant and had a fair market value of approximately $183,000. The Company expects the issuance of the restricted stock will result in an increase in compensation expense of approximately $632,000 (net of estimated forfeitures) for the year ended December 31, 2011.
Dividend. On February 1, 2011, the Company’s board of directors declared a regular quarterly dividend of $0.05 per common share per common share. The dividend was paid on March 7, 2011 to stockholders of record as of February 21, 2011. The Company estimates that the total amount of the dividend will be approximately $900,000.
101
Table of Contents
QC HOLDINGS, INC. AND SUBSIDIARIES
Index to Exhibits
| Exhibit No. |
Description of Document | |
| 3.1 | Amended and Restated Articles of Incorporation. Incorporated by reference and previously filed as an exhibit to the Annual Report on Form 10-K filed with the Securities and Exchange Commission on March 14, 2006. | |
| 3.2 | Amended and Restated Bylaws. Incorporated by reference and previously filed as an exhibit to Current Report on Form 8-K filed with the Securities and Exchange Commission on December 20, 2006. | |
| 4.1 | Specimen Stock Certificate. Incorporated by reference and previously filed as an exhibit to Amendment No. 2 to the Registration Statement on Form S-1 filed with the Securities and Exchange Commission (Registration No. 333-115297) on June 24, 2004. | |
| 4.2 | Reference is made to exhibits 3.1 and 3.2. | |
| 10.1 | QC Holdings, Inc. 1999 Stock Option Plan. Incorporated by reference and previously filed as an exhibit to Registration Statement on Form S-1 filed with the Securities and Exchange Commission (Registration No. 333-115297) on May 7, 2004. | |
| 10.2 | Amended and Restated QC Holdings, Inc. 2004 Equity Incentive Plan. Incorporated by reference and previously filed as an exhibit to Annual Report on Form 10-K filed with the Securities and Exchange Commission on March 13, 2009. | |
| 10.3 | Form of Management Stock Agreement. Incorporated by reference and previously filed as an exhibit to Registration Statement on Form S-1 filed with the Securities and Exchange Commission (Registration No. 333-115297) on May 7, 2004. | |
| 10.4 | Registration Rights Agreement among QC Holdings, Inc., Don Early and Prides Capital Fund I, LP, dated as of April 18, 2006. Incorporated by reference and previously filed as an exhibit to Current Report on Form 8-K filed with the Securities and Exchange Commission on April 21, 2006. | |
| 10.5 | Form of Indemnification Agreement between QC Holdings, Inc. and the indemnified parties. Incorporated by reference and previously filed as an exhibit to Amendment No. 2 to the Registration Statement on Form S-1 filed with the Securities and Exchange Commission (Registration No. 333-115297) on June 24, 2004. | |
| 10.6 | Form of Incentive Stock Option Agreement. Incorporated by reference and previously filed as an exhibit to Annual Report on Form 10-K filed with the Securities and Exchange Commission on March 13, 2009. | |
| 10.7 | Form of Non-Qualified Stock Option Agreement (Director). Incorporated by reference and previously filed as an exhibit to Annual Report on Form 10-K filed with the Securities and Exchange Commission on March 13, 2009. | |
| 10.8 | Form of Non-Qualified Stock Option Agreement (Employee). Incorporated by reference and previously filed as an exhibit to Annual Report on Form 10-K filed with the Securities and Exchange Commission on March 13, 2009. | |
| 10.9 | Form of Restricted Stock Award Agreement (Employee). Incorporated by reference and previously filed as an exhibit to Current Report on Form 8-K filed with the Securities and Exchange Commission on February 12, 2009. | |
| 10.10 | Form of Restricted Stock Award Agreement (Non-Employee Director). Incorporated by reference and previously filed as an exhibit to Annual Report on Form 10-K filed with the Securities and Exchange Commission on March 14, 2007. | |
102
Table of Contents
QC HOLDINGS, INC. AND SUBSIDIARIES
Index to Exhibits—(Continued)
| Exhibit No. |
Description of Document | |
| 10.11 | Amended and Restated Credit Agreement dated as of December 7, 2007, among QC Holdings, Inc., U.S. Bank National Association, as Agent and Arranger, and the Lenders that are parties thereto. Incorporated by reference and previously filed as an exhibit to Current Report on Form 8-K filed with the Securities and Exchange Commission on December 12, 2007. | |
| 10.12 | First Amendment Agreement dated as of March 7, 2008, between QC Holdings, Inc. as Borrower, U.S. Bank National Association, as Agent and Arranger, and the Lenders that are parties thereto. Incorporated by reference and previously filed as an exhibit to Current Report on Form 8-K filed with the Securities and Exchange Commission on March 13, 2008. | |
| 10.13 | Second Amendment Agreement dated as of September 30, 2010, between QC Holdings, Inc. as Borrower, U.S. Bank National Association, as Agent and Arranger, and the Lenders that are parties thereto. Incorporated by reference and previously filed as an exhibit to Current Report on Form 8-K filed with the Securities and Exchange Commission on October 6, 2010. | |
| 10.14 | Security Agreement dated as of January 19, 2006, by QC Holdings, Inc., as Grantor, for the benefit of U.S. Bank National Association, as Agent for each of the Banks. Incorporated by reference and previously filed as an exhibit to Current Report on Form 8-K filed with the Securities and Exchange Commission on January 25, 2006. | |
| 10.15 | Subsidiary Security Agreement dated as of January 19, 2006, by QC Financial Services, Inc.; QC Properties, LLC; QC Financial Services of California, Inc.; QC Advance, Inc.; Cash Title Loans, Inc. and QC Financial Services of Texas, Inc., as Grantors, for the benefit of U.S. Bank National Association, as Agent for each of the Banks. Incorporated by reference and previously filed as an exhibit to Current Report on Form 8-K filed with the Securities and Exchange Commission on January 25, 2006. | |
| 10.16 | Unlimited Continuing Guaranty Agreement dated as of January 19, 2006, by QC Financial Services, Inc.; QC Properties, LLC; QC Financial Services of California, Inc.; QC Advance, Inc.; Cash Title Loans, Inc. and QC Financial Services of Texas, Inc., for the benefit of U.S. Bank National Association, as Agent for each of the Banks. Incorporated by reference and previously filed as an exhibit to Current Report on Form 8-K filed with the Securities and Exchange Commission on January 25, 2006. | |
| 10.17 | Pledge Agreement dated as of January 19, 2006, between QC Holdings, Inc., as Pledgor, and U.S. Bank National Association, Agent, as Secured Party. Incorporated by reference and previously filed as an exhibit to Current Report on Form 8-K filed with the Securities and Exchange Commission on January 25, 2006. | |
| 10.18 | Pledge Agreement dated as of January 19, 2006, between QC Financial Services, Inc., as Pledgor, and U.S. Bank National Association, Agent, as Secured Party. Incorporated by reference and previously filed as an exhibit to Current Report on Form 8-K filed with the Securities and Exchange Commission on January 25, 2006. | |
| 10.19 | First Amendment to Pledge Agreement dated as of December 1, 2006, between QC Financial Services, Inc., as Pledgor, and U.S. Bank National Association, Agent, as Secured Party. Incorporated by reference and previously filed as an exhibit to Annual Report on Form 10-K filed with the Securities and Exchange Commission on March 14, 2007. | |
| 10.20 | Subsidiary Security Agreement dated as of December 1, 2006, by Express Check Advance of South Carolina, LLC, as Grantor, for the benefit of U.S. Bank National Association, as Agent for each of the Banks. Incorporated by reference and previously filed as an exhibit to Annual Report on Form 10-K filed with the Securities and Exchange Commission on March 14, 2007. | |
103
Table of Contents
QC HOLDINGS, INC. AND SUBSIDIARIES
Index to Exhibits—(Continued)
| Exhibit No. |
Description of Document | |
| 10.21 | Unlimited Continuing Guaranty Agreement dated as of December 1, 2006, by Express Check Advance of South Carolina, LLC, as Guarantor, for the benefit of U.S. Bank National Association, as Agent for each of the Banks. Incorporated by reference and previously filed as an exhibit to Annual Report on Form 10-K filed with the Securities and Exchange Commission on March 14, 2007. | |
| 10.22 | Subsidiary Security Agreement dated as of December 7, 2007, by QC E-Services, Inc.; QC Auto Services, Inc.; and QC Loan Services, Inc., as Grantors, for the benefit of U.S. Bank National Association, as Agent for each of the Lenders. Incorporated by reference and previously filed as an exhibit to Current Report on Form 8-K filed with the Securities and Exchange Commission on December 12, 2007. | |
| 10.23 | Unlimited Continuing Guaranty Agreement dated as of December 7, 2007, by QC E-Services, Inc.; QC Auto Services, Inc.; and QC Loan Services, Inc., for the benefit of U.S. Bank National Association, as Agent for each of the Lenders. Incorporated by reference and previously filed as an exhibit to Current Report on Form 8-K filed with the Securities and Exchange Commission on December 12, 2007. | |
| 10.24 | First Amendment to Pledge Agreement dated as of December 7, 2007, between QC Holdings, Inc., as Pledgor, and U.S. Bank National Association, Agent, as Secured Party. Incorporated by reference and previously filed as an exhibit to Current Report on Form 8-K filed with the Securities and Exchange Commission on December 12, 2007. | |
| 10.25 | The Executive Nonqualified Excess Plan Document and Adoption Agreement. Incorporated by reference and previously filed as an exhibit to Annual Report on Form 10-K/A filed with the Securities and Exchange Commission on June 4, 2009. | |
| 10.26 | QC Holdings, Inc. Long-Term Incentive Plan Summary. Incorporated by reference and previously filed as an exhibit to Annual Report on Form 10-K/A filed with the Securities and Exchange Commission on June 4, 2009. | |
| 10.27 | QC Holdings, Inc. Annual Incentive Plan Summary. Incorporated by reference and previously filed as an exhibit to Annual Report on Form 10-K/A filed with the Securities and Exchange Commission on June 4, 2009. | |
| 21.1 | Subsidiaries of the Registrant.* | |
| 23.1 | Consent of Grant Thornton LLP.* | |
| 31.1 | Certifications of Chief Executive Officer of the Company under Rule 13a-14(a), as adopted pursuant to Section 302 of the Sarbanes-Oxley Act of 2002.* | |
| 31.2 | Certifications of Chief Financial Officer of the Company under Rule 13a-14(a), as adopted pursuant to Section 302 of the Sarbanes-Oxley Act of 2002.* | |
| 32.1 | Certifications of Chief Executive Officer and Chief Financial Officer pursuant to 18 U.S.C. Section 1350.* | |
| * | Filed herewith. |
104