Attached files
| file | filename |
|---|---|
| 10-K - FORM 10-K - FIRST FINANCIAL CORP /IN/ | c14020e10vk.htm |
| EX-21 - EXHIBIT 21 - FIRST FINANCIAL CORP /IN/ | c14020exv21.htm |
| EX-10.8 - EXHIBIT 10.8 - FIRST FINANCIAL CORP /IN/ | c14020exv10w8.htm |
| EX-10.9 - EXHIBIT 10.9 - FIRST FINANCIAL CORP /IN/ | c14020exv10w9.htm |
| EX-31.1 - EXHIBIT 31.1 - FIRST FINANCIAL CORP /IN/ | c14020exv31w1.htm |
| EX-31.2 - EXHIBIT 31.2 - FIRST FINANCIAL CORP /IN/ | c14020exv31w2.htm |
| EX-10.1 - EXHIBIT 10.1 - FIRST FINANCIAL CORP /IN/ | c14020exv10w1.htm |
| EX-10.3 - EXHIBIT 10.3 - FIRST FINANCIAL CORP /IN/ | c14020exv10w3.htm |
| EX-32.2 - EXHIBIT 32.2 - FIRST FINANCIAL CORP /IN/ | c14020exv32w2.htm |
| EX-10.4 - EXHIBIT 10.4 - FIRST FINANCIAL CORP /IN/ | c14020exv10w4.htm |
| EX-32.1 - EXHIBIT 32.1 - FIRST FINANCIAL CORP /IN/ | c14020exv32w1.htm |
| EX-10.10 - EXHIBIT 10.10 - FIRST FINANCIAL CORP /IN/ | c14020exv10w10.htm |
Exhibit 13
2010 ANNUAL REPORT
Five Year Comparison of Selected Financial Data
| (Dollar amounts in thousands, except per share amounts) | 2010 | 2009 | 2008 | 2007 | 2006 | |||||||||||||||
BALANCE SHEET DATA |
||||||||||||||||||||
Total assets |
$ | 2,451,095 | $ | 2,518,722 | $ | 2,302,675 | $ | 2,231,562 | $ | 2,175,998 | ||||||||||
Securities |
560,846 | 587,246 | 596,915 | 558,020 | 530,400 | |||||||||||||||
Loans, net of unearned fees* |
1,640,146 | 1,631,764 | 1,471,327 | 1,443,067 | 1,392,755 | |||||||||||||||
Deposits |
1,903,043 | 1,789,701 | 1,563,498 | 1,529,721 | 1,502,682 | |||||||||||||||
Borrowings |
159,899 | 363,173 | 406,653 | 368,616 | 358,008 | |||||||||||||||
Shareholders’ equity |
321,717 | 306,483 | 286,844 | 281,692 | 271,260 | |||||||||||||||
INCOME STATEMENT DATA |
||||||||||||||||||||
Interest income |
123,582 | 126,255 | 133,954 | 137,734 | 130,832 | |||||||||||||||
Interest expense |
26,966 | 39,261 | 52,490 | 62,961 | 57,129 | |||||||||||||||
Net interest income |
96,616 | 86,994 | 81,464 | 74,773 | 73,703 | |||||||||||||||
Provision for loan losses |
9,200 | 11,870 | 7,855 | 6,580 | 6,983 | |||||||||||||||
Other income |
29,797 | 28,532 | 25,410 | 31,497 | 28,826 | |||||||||||||||
Other expenses |
77,202 | 73,381 | 66,447 | 64,726 | 64,656 | |||||||||||||||
Net income |
28,044 | 22,720 | 24,769 | 25,580 | 23,539 | |||||||||||||||
PER SHARE DATA: |
||||||||||||||||||||
Net Income |
2.14 | 1.73 | 1.89 | 1.94 | 1.77 | |||||||||||||||
Cash dividends |
0.92 | 0.90 | 0.89 | 0.87 | 0.85 | |||||||||||||||
PERFORMANCE RATIOS: |
||||||||||||||||||||
Net income to average assets |
1.11 | % | 0.95 | % | 1.09 | % | 1.16 | % | 1.10 | % | ||||||||||
Net income to average
shareholders’ equity |
8.73 | 7.54 | 8.61 | 9.20 | 8.57 | |||||||||||||||
Average total capital
to average assets |
13.56 | 13.25 | 13.28 | 13.35 | 13.56 | |||||||||||||||
Average shareholders’ equity
to average assets |
12.76 | 12.56 | 12.60 | 12.64 | 12.79 | |||||||||||||||
Dividend payout |
43.08 | 51.99 | 47.10 | 44.76 | 44.18 | |||||||||||||||
| * | 2008 and 2007 include $12,800 and $14,068, respectively, of credit card loans that are
held-for-sale |
FIRST FINANCIAL CORPORATION
CONSOLIDATED BALANCE SHEETS
| December 31, | ||||||||
| (Dollar amounts in thousands, except per share data) | 2010 | 2009 | ||||||
ASSETS |
||||||||
Cash and due from banks |
$ | 58,511 | $ | 84,371 | ||||
Federal funds sold |
5,104 | 21,576 | ||||||
Securities available-for-sale |
560,846 | 587,246 | ||||||
Loans, net of allowance of $22,336 in 2010 and $19,437 in 2009 |
1,617,810 | 1,612,327 | ||||||
Restricted Stock |
25,308 | 27,835 | ||||||
Accrued interest receivable |
11,208 | 12,005 | ||||||
Premises and equipment, net |
34,691 | 35,551 | ||||||
Bank-owned life insurance |
66,112 | 64,057 | ||||||
Goodwill |
7,102 | 7,102 | ||||||
Other intangible assets |
4,148 | 4,916 | ||||||
Other real estate owned |
6,325 | 5,885 | ||||||
FDIC Indemnification Asset |
3,977 | 12,124 | ||||||
Other assets |
49,953 | 43,727 | ||||||
TOTAL ASSETS |
$ | 2,451,095 | $ | 2,518,722 | ||||
LIABILITIES AND SHAREHOLDERS’ EQUITY |
||||||||
Deposits: |
||||||||
Non-interest-bearing |
$ | 304,101 | $ | 312,990 | ||||
Interest-bearing: |
||||||||
Certificates of deposit of $100 or more |
215,501 | 238,830 | ||||||
Other interest-bearing deposits |
1,383,441 | 1,237,881 | ||||||
| 1,903,043 | 1,789,701 | |||||||
Short-term borrowings |
34,106 | 30,436 | ||||||
Other borrowings |
125,793 | 332,737 | ||||||
Other liabilities |
66,436 | 59,365 | ||||||
TOTAL LIABILITIES |
2,129,378 | 2,212,239 | ||||||
Shareholders’ equity |
||||||||
Common stock, $.125 stated value per share; |
||||||||
Authorized shares-40,000,000 |
||||||||
Issued shares-14,450,966 |
||||||||
Outstanding shares-13,151,630 in 2010 and 13,129,630 in 2009 |
1,806 | 1,806 | ||||||
Additional paid-in capital |
68,944 | 68,739 | ||||||
Retained earnings |
293,319 | 277,357 | ||||||
Accumulated other comprehensive income (loss) |
(9,369 | ) | (7,904 | ) | ||||
Less: Treasury shares at cost-1,299,336 in 2010 and 1,321,336
in 2009 |
(32,983 | ) | (33,515 | ) | ||||
TOTAL SHAREHOLDERS’ EQUITY |
321,717 | 306,483 | ||||||
TOTAL LIABILITIES AND SHAREHOLDERS’ EQUITY |
$ | 2,451,095 | $ | 2,518,722 | ||||
10
2010 ANNUAL REPORT
CONSOLIDATED STATEMENTS OF INCOME
| Years Ended December 31, | ||||||||||||
| (Dollar amounts in thousands, except per share data) | 2010 | 2009 | 2008 | |||||||||
INTEREST AND DIVIDEND INCOME: |
||||||||||||
Loans, including related fees |
$ | 96,206 | $ | 94,930 | $ | 99,572 | ||||||
Securities: |
||||||||||||
Taxable |
18,597 | 22,755 | 25,303 | |||||||||
Tax-exempt |
6,664 | 6,604 | 6,415 | |||||||||
Other |
2,115 | 1,966 | 2,664 | |||||||||
TOTAL INTEREST AND DIVIDEND INCOME |
123,582 | 126,255 | 133,954 | |||||||||
INTEREST EXPENSE: |
||||||||||||
Deposits |
16,306 | 21,544 | 32,696 | |||||||||
Short-term borrowings |
325 | 541 | 1,068 | |||||||||
Other borrowings |
10,335 | 17,176 | 18,726 | |||||||||
TOTAL INTEREST EXPENSE |
26,966 | 39,261 | 52,490 | |||||||||
NET INTEREST INCOME |
96,616 | 86,994 | 81,464 | |||||||||
Net Provision for loan losses |
9,200 | 11,870 | 7,855 | |||||||||
NET INTEREST INCOME AFTER
PROVISION FOR LOAN LOSSES |
87,416 | 75,124 | 73,609 | |||||||||
NON-INTEREST INCOME: |
||||||||||||
Trust and financial services |
4,547 | 4,197 | 3,993 | |||||||||
Service charges and fees on deposit accounts |
10,342 | 11,082 | 11,889 | |||||||||
Other service charges and fees |
7,759 | 7,026 | 6,050 | |||||||||
Securities gain, net |
1,321 | 4 | 358 | |||||||||
Other-than-temporary loss |
||||||||||||
Total impairment loss |
(4,260 | ) | (18,939 | ) | (6,145 | ) | ||||||
Loss recognized in other comprehensive income |
8,170 | — | ||||||||||
Net impairment loss recognized in earnings |
(4,260 | ) | (10,769 | ) | (6,145 | ) | ||||||
Insurance commissions |
6,759 | 6,464 | 6,688 | |||||||||
Gain on sale of mortgage loans |
2,206 | 2,291 | 817 | |||||||||
Gain on sale of credit card loans |
— | 2,549 | — | |||||||||
Gain on bargain purchase |
— | 5,057 | — | |||||||||
Other |
1,123 | 631 | 1,760 | |||||||||
TOTAL NON-INTEREST INCOME |
29,797 | 28,532 | 25,410 | |||||||||
NON-INTEREST EXPENSES: |
||||||||||||
Salaries and employee benefits |
44,887 | 42,259 | 41,287 | |||||||||
Occupancy expense |
4,707 | 4,534 | 4,182 | |||||||||
Equipment expense |
4,761 | 4,640 | 4,560 | |||||||||
Federal Deposit Insurance |
2,847 | 3,277 | 220 | |||||||||
Other |
20,000 | 18,671 | 16,198 | |||||||||
TOTAL NON-INTEREST EXPENSE |
77,202 | 73,381 | 66,447 | |||||||||
INCOME BEFORE INCOME TAXES |
40,011 | 30,275 | 32,572 | |||||||||
Provision for income taxes |
11,967 | 7,555 | 7,803 | |||||||||
NET INCOME |
$ | 28,044 | $ | 22,720 | $ | 24,769 | ||||||
EARNINGS PER SHARE: |
||||||||||||
BASIC AND DILUTED |
$ | 2.14 | $ | 1.73 | $ | 1.89 | ||||||
Weighted average number of shares outstanding (in
thousands) |
13,120 | 13,119 | 13,110 | |||||||||
11
FIRST FINANCIAL CORPORATION
CONSOLIDATED STATEMENTS OF CHANGES IN SHAREHOLDERS’ EQUITY
| Accumulated | ||||||||||||||||||||||||
| Other | ||||||||||||||||||||||||
| (Dollar amounts in thousands, except | Common | Additional | Retained | Comprehensive | Treasury | |||||||||||||||||||
| per share data) | Stock | Capital | Earnings | Income/(Loss) | Stock | Total | ||||||||||||||||||
Balance, January 1, 2008 |
$ | 1,806 | $ | 68,212 | $ | 250,011 | $ | (5,181 | ) | $ | (33,156 | ) | $ | 281,692 | ||||||||||
Comprehensive income: |
||||||||||||||||||||||||
Net income |
— | — | 24,769 | — | — | 24,769 | ||||||||||||||||||
Other comprehensive loss, net of tax: |
||||||||||||||||||||||||
Change in net unrealized gains/losses
on securities available-for-sale, net |
— | — | — | (8,276 | ) | — | (8,276 | ) | ||||||||||||||||
Change in unrealized gains/losses on
post-retirement benefits |
— | — | — | 511 | — | 511 | ||||||||||||||||||
Total comprehensive income |
17,004 | |||||||||||||||||||||||
Contribution of 33,015 shares to ESOP |
— | 442 | — | — | 835 | 1,277 | ||||||||||||||||||
Treasury stock purchase (52,744 shares) |
— | — | — | — | (1,464 | ) | (1,464 | ) | ||||||||||||||||
Cash Dividends, $.89 per share |
— | — | (11,665 | ) | — | — | (11,665 | ) | ||||||||||||||||
Balance, December 31, 2008 |
1,806 | 68,654 | 263,115 | (12,946 | ) | (33,785 | ) | 286,844 | ||||||||||||||||
Comprehensive income: |
||||||||||||||||||||||||
Net income |
— | — | 22,720 | — | — | 22,720 | ||||||||||||||||||
Other comprehensive loss, net of tax: |
||||||||||||||||||||||||
Change in net unrealized gains/losses
on securities available-for-sale, net |
— | — | — | 10,869 | — | 10,869 | ||||||||||||||||||
Change in unrealized gains/losses on
post-retirement benefits |
— | — | — | (2,494 | ) | — | (2,494 | ) | ||||||||||||||||
Total comprehensive income |
31,095 | |||||||||||||||||||||||
Adjustment for adoption of other-than
temporary impairment guidance,
net of tax (Note 1) |
3,333 | (3,333 | ) | — | ||||||||||||||||||||
Contribution of 35,000 shares to ESOP |
— | 85 | — | — | 886 | 971 | ||||||||||||||||||
Treasury stock purchase (22,000 shares) |
— | — | — | — | (616 | ) | (616 | ) | ||||||||||||||||
Cash Dividends, $.90 per share |
— | — | (11,811 | ) | — | — | (11,811 | ) | ||||||||||||||||
Balance, December 31, 2009 |
1,806 | 68,739 | 277,357 | (7,904 | ) | (33,515 | ) | 306,483 | ||||||||||||||||
Comprehensive income: |
||||||||||||||||||||||||
Net income |
— | — | 28,044 | — | — | 28,044 | ||||||||||||||||||
Change in net unrealized
gains/(losses) on securities
available for-sale |
— | — | — | 449 | — | 449 | ||||||||||||||||||
Change in net unrealized gains/
(losses) on retirement plans |
— | — | — | (1,914 | ) | — | (1,914 | ) | ||||||||||||||||
Total comprehensive income/(loss) |
26,579 | |||||||||||||||||||||||
Contribution of 45,000 shares to ESOP |
— | 205 | — | — | 1,142 | 1,347 | ||||||||||||||||||
Treasury stock purchase (23,000 shares) |
— | — | — | — | (610 | ) | (610 | ) | ||||||||||||||||
Cash Dividends, $.92 per share |
— | — | (12,082 | ) | — | — | (12,082 | ) | ||||||||||||||||
Balance, December 31, 2010 |
$ | 1,806 | $ | 68,944 | $ | 293,319 | $ | (9,369 | ) | $ | (32,983 | ) | $ | 321,717 | ||||||||||
12
2010 ANNUAL REPORT
CONSOLIDATED STATEMENTS OF CASH FLOWS
| Years Ended December 31, | ||||||||||||
| (Dollar amounts in thousands, except per share data) | 2010 | 2009 | 2008 | |||||||||
CASH FLOWS FROM OPERATING ACTIVITIES: |
||||||||||||
Net Income |
$ | 28,044 | $ | 22,720 | $ | 24,769 | ||||||
Adjustments to reconcile net income to net cash
provided by operating activities: |
||||||||||||
Net (accretion) amortization on securities |
(840 | ) | (2,442 | ) | (2,874 | ) | ||||||
Provision for loan losses |
9,200 | 11,870 | 7,855 | |||||||||
Securities impairment loss recognized in earnings |
4,260 | 10,769 | 6,145 | |||||||||
Securities (gains) losses |
(1,321 | ) | (4 | ) | (358 | ) | ||||||
Depreciation and amortization |
4,643 | 4,199 | 3,535 | |||||||||
Provision for deferred income taxes |
(5,940 | ) | (2,043 | ) | (5,147 | ) | ||||||
Net change in accrued interest receivable |
797 | 1,076 | 617 | |||||||||
Contribution of shares to ESOP |
1,347 | 971 | 1,277 | |||||||||
Gain on sale of mortgage loans |
(2,206 | ) | (2,291 | ) | (817 | ) | ||||||
Loss on sale of student loans |
— | 399 | — | |||||||||
Gain on sale of credit card loans |
— | (2,549 | ) | — | ||||||||
Gain on purchase of business unit |
— | (5,057 | ) | — | ||||||||
Loss on sales of other real estate |
283 | 196 | 35 | |||||||||
Other, net |
10,293 | (8,424 | ) | 1,494 | ||||||||
NET CASH FROM OPERATING ACTIVITIES |
48,560 | 29,390 | 36,531 | |||||||||
CASH FLOWS FROM INVESTING ACTIVITIES: |
||||||||||||
Sales of securities available-for-sale |
12,248 | — | 1,063 | |||||||||
Calls, maturities and principal reductions on securities available-for-sale |
223,862 | 128,349 | 95,198 | |||||||||
Purchases of securities available-for-sale |
(211,062 | ) | (88,532 | ) | (151,863 | ) | ||||||
Loans made to customers, net of payments |
(132,997 | ) | (265,976 | ) | (76,216 | ) | ||||||
Net change in federal funds sold |
16,472 | (12,046 | ) | (5,329 | ) | |||||||
Redemption of restricted stock |
2,527 | — | 2,386 | |||||||||
Cash received from sale of mortgage loans |
116,462 | 146,625 | 36,910 | |||||||||
Cash received from sale of student loans |
— | 13,347 | — | |||||||||
Cash received from sale of credit card loans |
— | 14,689 | — | |||||||||
Cash received (disbursed) from purchase of business unit |
(609 | ) | 30,977 | — | ||||||||
Sale of other real estate |
3,727 | 2,448 | 2,357 | |||||||||
Additions to premises and equipment |
(2,406 | ) | (6,655 | ) | (2,623 | ) | ||||||
NET CASH FROM INVESTING ACTIVITIES |
28,224 | (36,774 | ) | (98,117 | ) | |||||||
CASH FLOWS FROM FINANCING ACTIVITIES: |
||||||||||||
Net change in deposits |
113,180 | 80,359 | 33,777 | |||||||||
Net change in other short-term borrowings |
3,670 | 8,936 | (5,831 | ) | ||||||||
Dividends paid |
(11,940 | ) | (11,806 | ) | (11,548 | ) | ||||||
Purchases of treasury stock |
(610 | ) | (616 | ) | (1,464 | ) | ||||||
Proceeds from other borrowings |
2,000 | 120,000 | 408,500 | |||||||||
Repayments on other borrowings |
(208,944 | ) | (172,416 | ) | (364,632 | ) | ||||||
NET CASH FROM FINANCING ACTIVITIES |
(102,644 | ) | 24,457 | 58,802 | ||||||||
NET CHANGE IN CASH AND CASH EQUIVALENTS |
(25,860 | ) | 17,073 | (2,784 | ) | |||||||
CASH AND CASH EQUIVALENTS, BEGINNING OF YEAR |
84,371 | 67,298 | 70,082 | |||||||||
CASH AND CASH EQUIVALENTS, END OF YEAR |
$ | 58,511 | $ | 84,371 | $ | 67,298 | ||||||
SUPPLEMENTAL DISCLOSURES OF CASH FLOW AND NONCASH INFORMATION: |
||||||||||||
Cash paid for the year for: |
||||||||||||
Interest |
$ | 28,051 | $ | 40,005 | $ | 54,168 | ||||||
Income Taxes |
$ | 15,713 | $ | 13,485 | $ | 11,657 | ||||||
13
FIRST FINANCIAL CORPORATION
NOTES TO CONSOLIDATED FINANCIAL STATEMENTS
1. BUSINESS AND SIGNIFICANT ACCOUNTING POLICIES:
BUSINESS
Organization: The consolidated financial statements of First Financial Corporation
and its subsidiaries (the Corporation) include the parent company and its wholly-owned
subsidiaries, First Financial Bank, N.A. of Vigo County, Indiana, The Morris Plan Company of
Terre Haute (Morris Plan), and Forrest Sherer Inc., a full-line insurance agency headquartered
in Terre Haute, Indiana. Inter-company transactions and balances have been eliminated.
First Financial Bank also has two investment subsidiaries, Portfolio Management Specialists A
(Specialists A) and Portfolio Management Specialists B (Specialists B), which were established
to hold and manage certain assets as part of a strategy to better manage various income streams
and provide opportunities for capital creation as needed. Specialists A and Specialists B
subsequently entered into a limited partnership agreement, Global Portfolio Limited Partners.
Portfolio Management Specialists B also owns First Financial Real Estate, LLC. At December 31,
2010, $591.7 million of securities and loans were owned by these subsidiaries. Specialists A,
Specialists B, Global Portfolio Limited Partners and First Financial Real Estate LLC are
included in the consolidated financial statements.
The Corporation, which is headquartered in Terre Haute, Indiana, offers a wide variety of
financial services including commercial, mortgage and consumer lending, lease financing, trust
account services and depositor services through its four subsidiaries. The Corporation’s primary
source of revenue is derived from loans to customers, primarily middle-income individuals, and
investment activities.
The Corporation operates 54 branches in west-central Indiana and east-central Illinois. First
Financial Bank is the largest bank in Vigo County. It operates 13 full-service banking branches
within the county; five in Clay County, Indiana; one in Greene County, Indiana; three in Knox
County, Indiana; five in Parke County, Indiana; one in Putnam County, Indiana; five in Sullivan
County, Indiana; four in Vermillion County, Indiana; one in Clark County, Illinois; one in Coles
County, Illinois; three in Crawford County, Illinois; one in Jasper County, Illinois; two in
Lawrence County, Illinois; two in Richland County, Illinois; six in Vermilion County, Illinois;
and one in Wayne County, Illinois. It also has a main office in downtown Terre Haute and an
operations center/office building in southern Terre Haute.
Regulatory Agencies: First Financial Corporation is a multi-bank holding company and as such is
regulated by various banking agencies. The holding company is regulated by the Seventh District
of the Federal Reserve System. The national bank subsidiary is regulated by the Office of the
Comptroller of the Currency. The state bank subsidiary is jointly regulated by the state banking
organization and the Federal Deposit Insurance Corporation.
SIGNIFICANT ACCOUNTING POLICIES
Use of Estimates: To prepare financial statements in conformity with U.S. generally
accepted accounting principles, management makes estimates and assumptions based on available
information. These estimates and assumptions affect the amounts reported in the financial
statements and disclosures provided, and actual results could differ. The allowance for loan
losses, carrying value of intangible assets, loan servicing rights, other-than-temporary
securities impairment and the fair values of financial instruments are particularly subject to
change.
Cash Flows: Cash and cash equivalents include cash and demand deposits with other financial
institutions. Net cash flows are reported for customer loan and deposit transactions and
short-term borrowings.
Securities: The Corporation classifies all securities as “available for sale.” Securities are
classified as available for sale when they might be sold before maturity. Securities available
for sale are carried at fair value with unrealized holdings gains and losses, net of taxes,
reported in other comprehensive income within shareholders’ equity.
Interest income includes amortization of purchase premium or discount. Premiums and discounts
are amortized on the level yield method without anticipating prepayments. Mortgage-backed
securities are amortized over the expected life. Realized gains and losses on sales are based on
the amortized cost of the security sold. Management evaluates securities for other-than
temporary impairment (OTTI) at least on a quarterly basis, and more frequently when economic or
market conditions warrant such an evaluation.
Loans: Loans that management has the intent and ability to hold for the foreseeable
future until maturity or pay-off are reported at the principal balance outstanding, net of
unearned interest, purchase premiums and discounts, deferred loan fees and costs, and allowance
for loan losses. Loans held for sale are reported at the lower of cost or market, on an
aggregate basis. Interest income is accrued on the unpaid principal balance and includes
amortization of net deferred loan fees and costs over the loan term without anticipating
prepayments. The recorded investment in loans includes accrued interest receivable. Interest
income is not reported when full loan repayment is in doubt, typically when the loan is impaired
or payments are significantly past due. Past-due status is based on the contractual terms of the
loan.
All interest accrued but not received for loans placed on nonaccrual is reversed against
interest income. Interest received on such loans is accounted for on the cash-basis or
cost-recovery method, until qualifying for return to accrual. Loans are returned to accrual
status when all the principal and interest amounts contractually due are brought current and
future payments are reasonably assured. In all cases, loans are placed on non-accrual or
charged-off if collection of principal or interest is considered doubtful.
14
2010 ANNUAL REPORT
NOTES TO CONSOLIDATED FINANCIAL STATEMENTS
Certain Purchased Loans: The Corporation purchases individual loans and groups of loans,
some of which have shown evidence of credit deterioration since origination. These purchased
loans are recorded at the amount paid, such that there is no carryover of the seller’s allowance
for loan losses. After acquisition, losses are recognized by an increase in the allowance for
loan losses. Such purchased loans accounted for individually or aggregated into pools of loans
based on common risk characteristics such as credit score, loan type and date of origination.
The Corporation estimates the amount and timing of expected cash flows for each purchased loan
or pool, and the expected cash flows in excess of amount paid are recorded as
interest income over the remaining life of the loan or pool (accretable yield). The excess of
the loan’s or pool’s contractual principal and interest over expected cash flows is not recorded
(nonaccretable difference).
Over the life of the loan or pool, expected cash flows continue to be estimated. If the present
value of expected cash flows is less than the carrying amount, a provision for loan loss is
recorded. If the present value of expected cash flows is greater than the carrying amount, it is
recognized as part of future interest income.
Concentration of Credit Risk: Most of the Corporation’s business activity is with customers
located within Vigo County. Therefore, the Corporation’s exposure to credit risk is
significantly affected by changes in the economy of the Vigo County area. A major economic
downturn in this area would have a negative effect on the Corporation’s loan portfolio.
Allowance for Loan Losses: The allowance for loan losses is a valuation allowance for probable
incurred credit losses. Loan losses are charged against the allowance when management believes
the uncollectibility of a loan balance is confirmed. Subsequent recoveries, if any, are credited
to the allowance. Management estimates the allowance balance required using past loan loss
experience, the nature and volume of the portfolio, information about specific borrower
situations and estimated collateral values, economic conditions and other factors. Allocations
of the allowance may be made for specific loans, but the entire allowance is available for any
loan that, in management’s judgment, should be charged off. The allowance consists of specific
and general components. The specific component relates to loans that are individually classified
as impaired or loans otherwise classified as substandard or doubtful. The general component
covers non-classified loans and is based on historical loss experience adjusted for current
factors.
A loan is impaired when full payment under the loan terms is not expected. Loans for which the
terms have been modified, and for which the borrower is experiencing financial difficulties, are
considered troubled debt restructurings and classified as impaired. Impairment is evaluated in
total for smaller-balance loans of similar nature such as residential mortgages and consumer
loans, and on an individual basis for other loans. If a loan is impaired, a portion of the
allowance is allocated so that the loan is reported, net, at the present value of estimated
future cash flows, using the loan’s existing rate, or at the fair value of collateral if
repayment is expected solely from the collateral. Large groups of smaller balance homogeneous
loans, such as consumer and residential real estate loans, are collectively evaluated for
impairment and, accordingly, they are not separately identified for impairment disclosures.
The general component covers non-classified loans and is based on historical loss experience
adjusted for current factors. The historical loss experience is based on the actual loss
history experienced over the most recent four years, using a weighted average which places more
emphasis on the more current years within loss history window. This actual loss experience is
supplemented with other current factors based on the risks present for each portfolio segment.
These current factors include consideration of the following: levels of and trends in
delinquent, classified, and impaired loans; levels of and trends in charge-offs and recoveries;
national and local economic trends and conditions; changes in lending policies and procedures;
trends in volume and terms of loans; experience, ability, and depth of lending management and
other relevant staff; credit concentrations; value of underlying collateral for collateral
dependent loans; and other external factors such as competition and legal and regulatory
requirements. The following portfolio segments have been identified: commercial loans,
residential loans and consumer loans. Overall, historical loss rates for the Corporation’s
portfolio segments have remained low during this tough economic cycle. This is primarily
attributable to the Corporation’s conservative lending practices. Local economic conditions,
including elevated unemployment rates, resulted in higher consumer loan delinquencies. For
these reasons, consumer loans have the highest adjustments to the historical loss rate. These
same factors along with declining real estate values resulted in the residential loan portfolio
segment having the next highest level of adjustment to the historical loss rate. The commercial
loan portfolio segment had the lowest level of adjustment to the historical loss rate.
Adjustments were made for the increasing levels of and trends in delinquent, classified and
impaired commercial loans. Commercial loans are generally well secured, which mitigates the
risk of loss and has contributed to the low historical loss rate.
FDIC Indemnification Asset: The FDIC indemnification asset results from the loss
share agreements in the 2009 FDIC-assisted transaction. The asset is measured separately from
the related covered assets as they are not contractually embedded in the assets and are not
transferable with the assets should the Corporation choose to dispose of them. It represents
the acquisition date fair value of expected reimbursements from the FDIC which was determined to
be $12.1 million. Pursuant to the terms of the loss sharing agreement, covered loans and other
real estate are subject to a stated loss threshold whereby the FDIC will reimburse the
Corporation for up to 95% of losses incurred. These expected reimbursements do not include
reimbursable amounts related to future covered expenditures. These cash flows are discounted to
reflect a metric of uncertainty of the timing and receipt of the loss sharing reimbursement from
the FDIC. This asset decreases when losses are realized and claims are paid by the FDIC or when
customers repay their loans in full and expected losses do not occur. This asset also increases
when estimated future losses increase and decreases when estimated future losses decrease. When
estimated future losses increase, the Corporation records a provision for loan losses and
increases its allowance for loan losses accordingly. The related increase in the FDIC
indemnification asset is recorded as an offset to the provision for loan losses. During 2010 and
2009, the provision for loan losses was offset by $1,662 and $0 related to the increases in the
FDIC indemnification asset.
15
FIRST FINANCIAL CORPORATION
NOTES TO CONSOLIDATED FINANCIAL STATEMENTS
Foreclosed Assets: Assets acquired through or instead of loan foreclosures are initially
recorded at fair value less estimated selling costs when acquired, establishing a new cost
basis. If fair value declines, a valuation allowance is recorded through expense. Costs after
acquisition are expensed.
Premises and Equipment: Land is carried at cost. Premises and equipment are stated at cost less
accumulated depreciation. Depreciation is computed over the useful lives of the assets, which
range from 3 to 33 years for furniture and equipment and 5 to 39 years for buildings and
leasehold improvements.
Restricted Stock: Restricted stock includes Federal Home Loan Bank (FHLB) of Indianapolis and
Chicago and Federal Reserve stock. This restricted stock is carried at cost and periodically
evaluated for impairment. Because this stock is viewed as a long-term investment, impairment is
based on ultimate recovery of par value. Both cash and stock dividends are reported as income.
Servicing Rights: Servicing rights are recognized separately when they are acquired through
sales of loans. When mortgage loans are sold, servicing rights are initially recorded at fair
value with the income statement effect recorded in gains on sales of loans. Fair value is based
on market prices for comparable mortgage servicing contracts, when available, or alternatively,
is based on third-party valuations that incorporate assumptions that market participants would
use in estimating future net servicing income,
such as the cost to service, the discount rate, ancillary income, prepayment speeds and default
rates and losses. All classes of servicing assets are subsequently measured using the
amortization method, which requires servicing rights to be amortized into non-interest income in
proportion to, and over the period of, the estimated future net servicing income of the
underlying loans.
Servicing assets are evaluated for impairment based upon the fair value of the rights as
compared to carrying amount. Impairment is determined by stratifying rights into groupings based
on predominant risk characteristics, such as interest rate, loan type and investor type.
Impairment is recognized through a valuation allowance for an individual grouping, to the extent
that fair value is less than the carrying amount. If the Corporation later determines that all
or a portion of the impairment no longer exists for a particular grouping, a reduction of the
allowance may be recorded as an increase to income. Changes in valuation allowances are reported
with Other Service Fees on the income statement. The fair values of servicing rights are subject
to significant fluctuations as a result of changes in estimated and actual prepayment speeds and
default rates and losses.
Servicing fee income, which is included in Other Service Fees on the income statement, is for
fees earned for servicing loans.
The fees are based on a contractual percentage of the outstanding principal or a fixed amount
per loan and are recorded as income when earned. The amortization of mortgage servicing rights
is netted against loan servicing fee income. Servicing fees totaled $1,153 thousand, $958
thousand and $901 thousand for the years ended December 31, 2010, 2009 and 2008. Late fees and
ancillary fees related to loan servicing are not material.
Transfers of Financial Assets: Transfers of financial assets are accounted for as
sales, when control over the assets has been relinquished. Control over transferred assets is
deemed to be surrendered when the assets have been isolated from the Corporation, the transferee
obtains the right (free of conditions that constrain it from taking advantage of that right) to
pledge or exchange the transferred assets, and the Corporation does not maintain effective
control over the transferred assets through an agreement to repurchase them before their
maturity.
Bank-Owned Life Insurance: The Corporation has purchased life insurance policies on certain key
executives. Bank-owned life insurance is recorded at its cash surrender value, or the amount
that can be realized. Income on the investments in life insurance is included in other interest
income.
Goodwill and Other Intangible Assets: Goodwill resulting from business combinations prior to
January 1, 2009 represents the excess of the purchase price over the fair value of the net
assets of businesses acquired. Goodwill resulting from business combinations after January 1,
2009 represents the future economic benefits arising from other assets acquired that are not
individually identified and separately recognized. Goodwill and intangible assets acquired in a
purchase business combination and determined to have an indefinite useful life are not
amortized, but tested for impairment at least annually. The Corporation has selected May 31 as
the date to perform the annual impairment test. Intangible assets with definite useful lives are
amortized over their estimated useful lives to their estimated residual values. Goodwill is the
only intangible asset with an indefinite life on our balance sheet.
Other intangible assets consist of core deposit and acquired customer relationship intangible
assets arising from the whole bank, insurance agency and branch acquisitions. They are initially
measured at fair value and then are amortized on an accelerated basis over their estimated
useful lives, which are 12 and 10 years, respectively.
Long-Term Assets: Premises and equipment and other long-term assets are reviewed for impairment
when events indicate their carrying amount may not be recoverable from future undiscounted cash
flows. If impaired, the assets are recorded at fair value.
Benefit Plans: Pension expense is the net of service and interest cost, return on plan assets
and amortization of gains and losses not immediately recognized. The amount contributed is
determined by a formula as decided by the Board of Directors. Deferred compensation and
supplemental retirement plan expense allocates the benefits over years of service.
Employee Stock Ownership Plan: Shares of treasury stock are issued to the ESOP and compensation
expense is recognized based upon the total market price of shares when contributed.
Deferred Compensation Plan: A deferred compensation plan covers all directors. Under the plan,
the Corporation pays each director, or their beneficiary, the amount of fees deferred plus
interest over 10 years, beginning when the director achieves age 65. A liability is accrued for
the obligation under these plans. The expense incurred for the deferred compensation for each of
the last three years was $183 thousand, $184 thousand and $169 thousand, resulting in a deferred
compensation liability of $2.6 million and $2.5 million as of year-end 2010 and 2009.
Incentive Plans: A long-term incentive plan provides for the payment of incentive rewards as a
15-year annuity to all directors and certain key officers. The plan expired December 31, 2009,
and compensation expense is recognized over the service period. Payments under the plan
generally do not begin until the earlier of January 1, 2015, or the January 1 immediately
following the year in which the participant reaches age 65. There was no compensation expense
related to this plan for 2010 and the compensation expense for 2009
and 2008 was $2.3 million and $2.0 million, resulting in a liability of $15.4 million
and $15.4 million as of year-end 2010 and 2009. In 2010 the Corporation adopted incentive
compensation plans for 2010 that also expired December 31, 2010. These plans are interim with
the intention of more developed plans starting in 2011. The plans were designed to reward key
officers based on certain performance measures. The short-term plans will be paid out within
75 days of December 31, 2010 and the long-term plan vests over a three year period and will
payout within 75 days of December 31, 2013. The compensation related to the three plans in
2010 was $2.2 million and resulted in a liability of $2.2 million at December 31, 2010.
16
2010 ANNUAL REPORT
NOTES TO CONSOLIDATED FINANCIAL STATEMENTS
Income Taxes: Income tax expense is the total of the current year income tax due or
refundable and the change in deferred tax assets and liabilities. Deferred tax assets and
liabilities are the expected future tax amounts for the temporary differences between
carrying amounts and tax bases of assets and liabilities, computed using enacted tax rates. A
valuation allowance, if needed, reduces deferred tax assets to the amount expected to be
realized.
A tax position is recognized as a benefit only if it is “more likely than not” that the tax
position would be sustained in a tax examination, with a tax examination being presumed to
occur. The amount recognized is the largest amount of tax benefit that is greater than 50%
likely of being realized on examination. For tax positions not meeting the “more likely than
not” test, no tax benefit is recorded.
The Corporation recognizes interest and/or penalties related to income tax matters in income
tax expense.
Loan Commitments and Related Financial Instruments: Financial instruments include credit
instruments, such as commitments to make loans and standby letters of credit, issued to meet
customer financing needs. The face amount for these items represents the exposure to loss,
before considering customer collateral or ability to repay. Such financial instruments are
recorded when they are funded.
Earnings Per Share: Earnings per common share is net income divided by the weighted average
number of common shares outstanding during the period. The Corporation does not have any
potentially dilutive securities. Earnings and dividends per share are restated for stock
splits and dividends through the date of issue of the financial statements.
Comprehensive Income: Comprehensive income consists of net income and other comprehensive
income. Other comprehensive income includes unrealized gains and losses on securities
available for sale and changes in the funded status of the retirement plans, which are also
recognized as separate components of equity.
Loss Contingencies: Loss contingencies, including claims and legal actions arising in the
ordinary course of business, are recorded as liabilities when the likelihood of loss is
probable and an amount of range of loss can be reasonably estimated. Management does not
believe there are currently such matters that will have a material effect on the financial
statements.
Dividend Restriction: Banking regulations require maintaining certain capital levels and may
limit the dividends paid by the bank to the holding company or by the holding company to
shareholders.
Fair Value of Financial Instruments: Fair values of financial instruments are estimated using
relevant market information and other assumptions, as more fully disclosed in a separate
note. Fair value estimates involve uncertainties and matters of significant judgment
regarding interest rates, credit risk, prepayments and other factors, especially in the
absence of broad markets for particular items. Changes in assumptions or market conditions
could significantly affect the estimates.
Operating Segment: While the Corporation’s chief decision-makers monitor the revenue streams
of the various products and services, the operating results of significant segments are
similar and operations are managed and financial performance is evaluated on a corporate-wide
basis. Accordingly, all of the Corporation’s financial service operations are considered by
management to be aggregated in one reportable operating segment, which is banking.
Adoption of New Accounting Standards: In April 2009, the FASB issued Staff Position No. 115-2
and No. 124-2, Recognition and Presentation of Other-Than-Temporary Impairments (ASC 320-10),
which amended existing guidance for determining whether impairment is other-than-temporary
for debt securities. The requires an entity to assess whether it intends to sell, or it is
more likely than not that it will be required to sell, a security in an unrealized loss
position before recovery of its amortized cost basis. If either of these criteria is met, the
entire difference between amortized cost and fair value is recognized as impairment through
earnings. For securities that do not meet the aforementioned criteria, the amount of
impairment is split into two components as follows: 1) other-than-temporary impairment (OTTI)
related to other factors, which is recognized in other comprehensive income and 2) OTTI
related to credit loss, which must be recognized in the income statement. The credit loss is
determined as the difference between the present value of the cash flows expected to be
collected and the amortized cost basis. Additionally, disclosures about other-than-temporary
impairments for debt and equity securities were expanded. ASC 320-10 was effective for
interim and annual reporting periods ending June 15, 2009, with early adoption permitted for
periods ending after March 15, 2009. At adoption, the Corporation reversed $3.3 million (net
of tax) of previously recognized impairment charges, representing the non-credit portion.
In April 2009, the FASB issued Staff Position (FSP) No. 157-4, Determining Fair Value When
the Volume and Level of Activity for the Asset and Liability Have Significantly Decreased and
Identifying Transactions That Are Not Orderly (ASC 820-10). This FSP emphasizes that the
objective of a fair value measurement does not change even when market activity for the asset
or liability has decreased significantly. Fair value is the price that would be received for
an asset sold or paid to transfer a liability in an orderly transaction (that is, not a
forced liquidation or distressed sale) between market participants at the measurement date
under current market conditions. When observable transactions or quoted prices are not
considered orderly, then little, if any, weight should be assigned to the indication of the
asset or liability’s fair value. Adjustments to those transactions or prices would be needed
to determine the appropriate fair value. The FSP, which was applied prospectively, was
effective for interim and annual reporting periods ending after June 15, 2009 with early
adoption for periods ending after March 15, 2009. The effect of adopting this new guidance
was not material.
17
FIRST FINANCIAL CORPORATION
NOTES TO CONSOLIDATED FINANCIAL STATEMENTS
2. FAIR VALUES OF FINANCIAL INSTRUMENTS:
Accounting guidance establishes a fair value hierarchy which requires an entity to
maximize the use of observable inputs and minimize the use of unobservable inputs when
measuring fair value. The standard describes three levels of inputs that may be used to measure
fair value:
Level 1: Quoted prices (unadjusted) of identical assets or liabilities in active markets that
the entity has the ability to access as of the measurement date.
Level 2: Significant other observable inputs other than Level 1 prices such as such as quoted
prices for similar assets or liabilities; quoted prices in markets that are not active; or
other inputs that are observable or can be corroborated by observable market data.
Level 3: Significant unobservable inputs that reflect a reporting entity’s own assumptions
about the assumptions that market participants would use in pricing an asset or liability.
The fair value of securities available-for-sale is determined by obtaining quoted prices on
nationally recognized securities exchanges (Level 1 inputs) or matrix pricing, which is a
mathematical technique widely used in the industry to value debt securities without relying
exclusively on quoted prices for the specific securities but rather by relying on the
securities’ relationship to other benchmark quoted securities (Level 2 inputs).
For those securities that cannot be priced using quoted market prices or observable inputs, a
Level 3 valuation is determined. These securities are primarily trust preferred securities and
certain equity securities, which are priced using Level 3 due to current market illiquidity.
The fair value of trust preferred securities is computed based upon discounted cash flows
estimated using payment, default and recovery assumptions. Cash flows are discounted at
appropriate market rates, including consideration of credit spreads and illiquidity discounts.
The fair value of equity securities is derived through consideration of trading activity, if
any, review of financial statements, industry trends and the valuation of comparative issuers.
Due to current market conditions, as well as the limited trading activity of these securities,
the market value of the securities is highly sensitive to assumption changes and market
volatility.
The fair value of derivatives is based on valuation models using observable market data as of
the measurement date (Level 2 inputs).
| December 31, 2010 | ||||||||||||||||
| Fair Value Measurment Using | ||||||||||||||||
| (Dollar amounts in thousands) | Level 1 | Level 2 | Level 3 | Carrying Value | ||||||||||||
U.S. Government entity mortgage-backed
securities |
$ | — | $ | 2,073 | $ | — | $ | 2,073 | ||||||||
Mortgage-backed securities, residential |
— | 302,423 | — | 302,423 | ||||||||||||
Mortgage-backed securities, commercial |
— | 139 | — | 139 | ||||||||||||
Collateralized mortgage obligations |
— | 94,457 | — | 94,457 | ||||||||||||
State and municipal obligations |
— | 157,540 | — | 157,540 | ||||||||||||
Collateralized debt obligations |
— | — | 2,190 | 2,190 | ||||||||||||
Corporate debt securities |
— | — | — | — | ||||||||||||
Equity Securities |
506 | — | 1,518 | 2,024 | ||||||||||||
TOTAL |
$ | 506 | $ | 556,632 | $ | 3,708 | $ | 560,846 | ||||||||
Derivative Assets |
$ | 1,311 | ||||||||||||||
Derivative Liabilities |
(1,311 | ) | ||||||||||||||
| December 31, 2009 | ||||||||||||||||
| Fair Value Measurment Using | ||||||||||||||||
| (Dollar amounts in thousands) | Level 1 | Level 2 | Level 3 | Carrying Value | ||||||||||||
U.S. Government entity mortgage-backed
securities |
$ | — | $ | 4,148 | $ | — | $ | 4,148 | ||||||||
Mortgage-backed securities, residential |
— | 300,184 | — | 300,184 | ||||||||||||
Mortgage-backed securities, commercial |
— | 168 | — | 168 | ||||||||||||
Collateralized mortgage obligations |
— | 119,564 | — | 119,564 | ||||||||||||
State and municipal obligations |
— | 148,733 | — | 148,733 | ||||||||||||
Collateralized debt obligations |
— | — | 1,416 | 1,416 | ||||||||||||
Corporate debt securities |
— | 7,072 | — | 7,072 | ||||||||||||
Equity Securities |
2,600 | — | 3,361 | 5,961 | ||||||||||||
TOTAL |
$ | 2,600 | $ | 579,869 | $ | 4,777 | $ | 587,246 | ||||||||
Derivative Assets |
$ | 889 | ||||||||||||||
Derivative Liabilities |
(889 | ) | ||||||||||||||
18
2010 ANNUAL REPORT
NOTES TO CONSOLIDATED FINANCIAL STATEMENTS
The table below presents a reconciliation and income statement classification of gains
and losses for all assets measured at fair value on a recurring basis using significant
unobservable inputs (Level 3) for the twelve months ended December 31, 2010 and 2009.
| Fair Value Measurments | ||||||||
| Using Significant | ||||||||
| Unobservable Inputs (Level 3) | ||||||||
| 2010 | 2009 | |||||||
Beginning balance, January 1 |
$ | 4,777 | $ | 7,994 | ||||
Total realized/unrealized gains or losses |
||||||||
Included in earnings |
(4,260 | ) | (10,769 | ) | ||||
Included in other comprehensive income |
3,872 | 7,651 | ||||||
Settlements |
(681 | ) | (99 | ) | ||||
Ending balance, December 31 |
$ | 3,708 | $ | 4,777 | ||||
Change in unrealized gains and losses recorded in earnings for the year ended December
31, 2010 for Level 3 assets that are still held at December 31, 2010 was related to fair value
declines recorded as other-than-temporary impairment. Impaired loans disclosed in footnote 7,
which are measured for impairment using the fair value of collateral, are valued at Level 3.
They are carried at a fair value of $31.6 million, net of a valuation allowance of $5.9 million
at December 31, 2010 and at a fair value of $19.3 million, net of a valuation allowance of $5.4
million at December 31, 2009. The impact to the provision for loan losses for the twelve months
ended December 31, 2010 and December 31, 2009 was $750 thousand and $1.7 million, respectively.
Fair value is measured based on the value of the collateral securing those loans and is
determined using several methods. Generally, the fair value of real estate is determined based
on appraisals by qualified licensed appraisers. If an appraisal is not available, the fair
value may be determined by using a cash flow analysis, a broker’s opinion of value, the net
present value of future cash flows, or an observable market price from an active market. Fair
value on non-real estate loans is determined using similar methods. Other real estate owned at
December 31, 2010 with a value of $6.3 million was reduced $353 thousand for fair value
adjustment. At December 31, 2010 other real estate owned was comprised of $3.3 million from
commercial loans and $3.0 million from residential loans. Other real estate owned at December
31, 2009 with a value of $5.9 million was reduced $164 thousand for fair value adjustment.
The following table presents loans identified as impaired by class of loans as of December 31,
2020.
| Allowance | ||||||||||||
| Unpaid | for Loan | |||||||||||
| Principal | Losses | |||||||||||
| (Dollar amounts in thousands) | Balance | Allocated | Fair Value | |||||||||
Commercial |
||||||||||||
Commercial & Industrial |
$ | 19,868 | $ | 1,508 | $ | 18,360 | ||||||
Farmland |
— | — | ||||||||||
Non Farm, Non Residential |
12,397 | 3,255 | 9,142 | |||||||||
Agriculture |
— | |||||||||||
All Other Commercial |
1,577 | 128 | 1,449 | |||||||||
Residential |
||||||||||||
First Liens |
1,910 | 533 | 1,377 | |||||||||
Home Equity |
— | — | ||||||||||
Junior Liens |
1,129 | 443 | 686 | |||||||||
Multifamily |
638 | 638 | ||||||||||
All Other Residential |
— | — | ||||||||||
Consumer |
||||||||||||
Motor Vehicle |
— | — | ||||||||||
All Other Consumer |
— | — | ||||||||||
TOTAL |
$ | 37,519 | $ | 5,867 | $ | 31,652 | ||||||
19
FIRST FINANCIAL CORPORATION
NOTES TO CONSOLIDATED FINANCIAL STATEMENTS
The carrying amounts and estimated fair values of financial instruments are shown below.
Carrying amount is the estimated fair value for cash and due from banks, federal funds sold,
accrued interest receivable and payable, demand deposits, short-term and certain other
borrowings, and variable-rate loans or deposits that reprice frequently and fully. Security fair
values are determined as previously described. It is not practicable to determine the fair value
of Federal Home Loan Bank stock due to restrictions placed on their transferability. For the
FDIC indemnification asset the carrying value is the estimated fair value as it represents
amounts to be received from the FDIC in the near term. For fixed-rate loans or deposits,
variable rate loans or deposits with infrequent repricing or repricing limits, and for
longer-term borrowings, fair value is based on discounted cash flows using current market rates
applied to the estimated life and credit risk. Fair values for impaired loans are estimated
using discounted cash flow analysis or underlying collateral values. Fair value of debt is based
on current rates for similar financing. The fair value of off-balance sheet items is not
considered material.
The carrying amount and estimated fair value of assets and liabilities are presented in the
table below and were determined based on the above assumptions:
| December 31, | ||||||||||||||||
| 2010 | 2009 | |||||||||||||||
| Carrying | Fair | Carrying | Fair | |||||||||||||
| (Dollar amounts in thousands) | Value | Value | Value | Value | ||||||||||||
Cash and due from banks |
$ | 58,511 | $ | 58,511 | $ | 84,371 | $ | 84,371 | ||||||||
Federal funds sold |
5,104 | 5,104 | 21,576 | 21,576 | ||||||||||||
Securities available-for-sale |
560,846 | 560,846 | 587,246 | 587,246 | ||||||||||||
Federal Home Loan Bank stock |
23,654 | N/A | 26,181 | N/A | ||||||||||||
Loans, net |
1,617,810 | 1,607,895 | 1,612,327 | 1,604,412 | ||||||||||||
FDIC Indemnification Asset |
3,977 | 3,977 | 12,124 | 12,124 | ||||||||||||
Accrued interest receivable |
11,208 | 11,208 | 12,005 | 12,005 | ||||||||||||
Deposits |
(1,903,043 | ) | (1,909,874 | ) | (1,789,701 | ) | (1,798,059 | ) | ||||||||
Short-term borrowings |
(34,106 | ) | (34,106 | ) | (30,436 | ) | (30,436 | ) | ||||||||
Federal Home Loan Bank
advances |
(125,793 | ) | (128,881 | ) | (326,137 | ) | (337,847 | ) | ||||||||
Other borrowings |
— | — | (6,600 | ) | (6,600 | ) | ||||||||||
Accrued interest payable |
(2,041 | ) | (2,041 | ) | (3,127 | ) | (3,127 | ) | ||||||||
3. RESTRICTIONS ON CASH AND DUE FROM BANKS:
Certain affiliate banks are required to maintain average reserve balances with the
Federal Reserve Bank that do not earn interest. The amount of those reserve balances was
approximately $9.1 million and $8.2 million at December 31, 2010 and 2009, respectively.
4. SECURITIES:
The fair value of securities available-for-sale and related gross unrealized gains and
losses recognized in accumulated other comprehensive income were as follows:
| December 31, 2010 | ||||||||||||||||
| Amortized | Unrealized | |||||||||||||||
| (Dollar amounts in thousands) | Cost | Gains | Losses | Fair Value | ||||||||||||
U.S. Government entity mortgage-backed
securities |
$ | 2,027 | $ | 46 | $ | — | $ | 2,073 | ||||||||
Mortgage-backed securities, residential |
289,962 | 13,166 | (705 | ) | 302,423 | |||||||||||
Mortgage-backed securities, commercial |
136 | 3 | — | 139 | ||||||||||||
Collateralized mortgage obligations |
92,803 | 2,248 | (594 | ) | 94,457 | |||||||||||
State and municipal obligations |
152,633 | 5,318 | (411 | ) | 157,540 | |||||||||||
Collateralized debt obligations |
15,084 | — | (12,894 | ) | 2,190 | |||||||||||
Equity Securities |
1,729 | 295 | — | 2,024 | ||||||||||||
TOTAL |
$ | 554,374 | $ | 21,076 | $ | (14,604 | ) | $ | 560,846 | |||||||
20
2010 ANNUAL REPORT
NOTES TO CONSOLIDATED FINANCIAL STATEMENTS
| December 31, 2009 | ||||||||||||||||
| Amortized | Unrealized | |||||||||||||||
| (Dollar amounts in thousands) | Cost | Gains | Losses | Fair Value | ||||||||||||
U.S. Government entity mortgage-backed
securities |
$ | 4,103 | $ | 45 | $ | — | $ | 4,148 | ||||||||
Mortgage-backed securities, residential |
285,964 | 14,260 | (40 | ) | 300,184 | |||||||||||
Mortgage-backed securities, commercial |
162 | 6 | — | 168 | ||||||||||||
Collateralized mortgage obligations |
116,330 | 3,334 | (100 | ) | 119,564 | |||||||||||
State and municipal obligations |
143,039 | 5,926 | (232 | ) | 148,733 | |||||||||||
Collateralized debt obligations |
19,253 | — | (17,837 | ) | 1,416 | |||||||||||
Corporate debt securities |
7,004 | 257 | (189 | ) | 7,072 | |||||||||||
Equity Securities |
5,668 | 1,462 | (1,169 | ) | 5,961 | |||||||||||
TOTAL |
$ | 581,523 | $ | 25,290 | $ | (19,567 | ) | $ | 587,246 | |||||||
As of December 31, 2010, the Corporation does not have any securities from any issuer,
other than the U.S. Government, with an aggregate book or fair value that exceeds ten percent
of shareholders’ equity.
Securities with a carrying value of approximately $227.3 million and $200.8 million at
December 31, 2010 and 2009, respectively, were pledged as collateral for short-term borrowings
and for other purposes.
Below is a summary of the gross gains and losses realized by the Corporation on investment
sales during the years ended December 31, 2010, 2009 and 2008, respectively.
| (Dollar amounts in thousands) | 2010 | 2009 | 2008 | |||||||||
Proceeds |
$ | 12,248 | $ | — | $ | 1,063 | ||||||
Gross gains |
1,507 | — | 353 | |||||||||
Gross losses |
(213 | ) | — | — | ||||||||
Additional gains of $27 thousand in 2010, $4 thousand in 2009 and $5 thousand in 2008 resulted
from redemption premiums on called securities.
Contractual maturities of debt securities at year-end 2010 were as follows. Securities not due
at a single maturity or with no maturity date, primarily mortgage-backed and equity
securities, are shown separately.
| Available-for-Sale | ||||||||
| Amortized | Fair | |||||||
| (Dollar amounts in thousands) | Cost | Value | ||||||
Due in one year or less |
$ | 10,243 | $ | 10,437 | ||||
Due after one but within five years |
35,651 | 37,517 | ||||||
Due after five but within ten years |
45,636 | 47,695 | ||||||
Due after ten years |
171,017 | 160,611 | ||||||
| 262,547 | 256,260 | |||||||
Mortgage-backed securities and equities |
291,827 | 304,586 | ||||||
TOTAL |
$ | 554,374 | $ | 560,846 | ||||
21
FIRST FINANCIAL CORPORATION
NOTES TO CONSOLIDATED FINANCIAL STATEMENTS
The following tables show the securities’ gross unrealized losses and fair value,
aggregated by investment category and length of time that individual securities have been in
continuous unrealized loss position, at December 31, 2010 and 2009.
| December 31, 2010 | ||||||||||||||||||||||||
| Less Than 12 Months | More Than 12 Months | Total | ||||||||||||||||||||||
| Unrealized | Unrealized | Unrealized | ||||||||||||||||||||||
| (Dollar amounts in thousands) | Fair Value | Losses | Fair Value | Losses | Fair Value | Losses | ||||||||||||||||||
Mortgage-backed securities,
residential |
$ | 35,024 | $ | (705 | ) | $ | — | $ | — | $ | 35,024 | $ | (705 | ) | ||||||||||
Collateralized mortgage obligations |
25,338 | (594 | ) | — | — | 25,338 | (594 | ) | ||||||||||||||||
State and municipal obligations |
19,372 | (411 | ) | — | — | 19,372 | (411 | ) | ||||||||||||||||
Collateralized debt obligations |
— | — | 2,190 | (12,894 | ) | 2,190 | (12,894 | ) | ||||||||||||||||
Total temporarily impaired
securities |
$ | 79,734 | $ | (1,710 | ) | $ | 2,190 | $ | (12,894 | ) | $ | 81,924 | $ | (14,604 | ) | |||||||||
| December 31, 2009 | ||||||||||||||||||||||||
| Less Than 12 Months | More Than 12 Months | Total | ||||||||||||||||||||||
| Unrealized | Unrealized | Unrealized | ||||||||||||||||||||||
| (Dollar amounts in thousands) | Fair Value | Losses | Fair Value | Losses | Fair Value | Losses | ||||||||||||||||||
Mortgage-backed securities,
residential |
$ | 6,985 | $ | (38 | ) | $ | 47 | $ | (2 | ) | $ | 7,032 | $ | (40 | ) | |||||||||
Collateralized mortgage obligations |
6,094 | (100 | ) | — | — | 6,094 | (100 | ) | ||||||||||||||||
State and municipal obligations |
6,594 | (45 | ) | 4,841 | (187 | ) | 11,435 | (232 | ) | |||||||||||||||
Collateralized debt obligations |
— | — | 1,416 | (17,837 | ) | 1,416 | (17,837 | ) | ||||||||||||||||
Corporate debt securities |
— | — | 811 | (189 | ) | 811 | (189 | ) | ||||||||||||||||
Equity securities |
543 | (280 | ) | 1,150 | (889 | ) | 1,693 | (1,169 | ) | |||||||||||||||
Total temporarily impaired
securities |
$ | 20,216 | $ | (463 | ) | $ | 8,265 | $ | (19,104 | ) | $ | 28,481 | $ | (19,567 | ) | |||||||||
The Corporation held 697 investment securities with an amortized cost greater than fair
value as of December 31, 2010. The unrealized losses on mortgage-backed and state and
municipal obligations represent negative adjustments to market value relative to the rate of
interest paid on the securities and not losses related to the creditworthiness of the issuer.
Management does not intend to sell and it is not more likely than not that management would be
required to sell the securities prior to their anticipated recovery. Management believes the
value will recover as the securities approach maturity or market rates change.
Management evaluates securities for other-than-temporary impairment (“OTTI”) at least on a
quarterly basis, and more frequently when economic or market conditions warrant such an
evaluation. The investment securities portfolio is evaluated for OTTI by segregating the
portfolio into two general segments and applying the appropriate OTTI model.
Investment securities classified as available-for-sale or held-to-maturity are generally
evaluated for OTTI under FASB ASC 320, Investments—Debt and Equity Securities. However,
certain purchased beneficial interests, including non-agency mortgage-backed securities,
asset-backed securities, and collateralized debt obligations, that had credit ratings at the
time of purchase of below AA are evaluated using the model outlined in FASB ASC 325-40,
Beneficial Interests in Securitized Financial Assets.
In determining OTTI under the FASB ASC-320 model, management considers many factors, including:
(1) the length of time and the extent to which the fair value has been less than cost, (2) the
financial condition and near-term prospects of the issuer, (3) whether the market decline was
affected by macroeconomic conditions, and (4) whether the entity has the intent to sell the
security or more likely than not will be required to sell the security before its anticipated
recovery. The assessment of whether an other-than-temporary decline exists involves a high
degree of subjectivity and judgment and is based on the information available to management at
a point in time.
The second segment of the portfolio uses the OTTI guidance provided by FASB ASC-325 that is
specific to purchase beneficial interests that, on the purchase date, were rated below AA.
Under the FASB ASC-325 model, the Corporation compares the present value of the remaining cash
flows as estimated at the preceding evaluation date to the current expected remaining cash
flows. An OTTI is
deemed to have occurred if there has been an adverse change in the remaining expected future
cash flows.
When OTTI occurs under either model, the amount of the OTTI recognized in earnings depends on
whether an entity intends to sell the security or it is more likely than not it will be
required to sell the security before recovery of its amortized cost basis, less any
current-period credit loss. If an entity intends to sell or it is more likely than not it will
be required to sell the security before recovery of its amortized cost basis, less any
current-period credit loss, the OTTI shall be recognized in earnings equal to the entire
difference between the investment’s amortized cost basis and its fair value at the balance
sheet date. If an entity does not intend to sell the security and it is not more likely than
not that the entity will be required to sell the security before recovery of its amortized cost
basis less any current-period loss, the OTTI shall be separated into the amount representing
the credit loss and the amount related to all other factors. The amount of the total OTTI
related to the credit loss is determined based on the present value of cash flows expected to
be collected and is recognized in earnings. The amount of the total OTTI related to other
factors is recognized in other comprehensive income, net of applicable taxes. The previous
amortized cost basis less the OTTI recognized in earnings becomes the new amortized cost basis
of the investment.
22
2010 ANNUAL REPORT
NOTES TO CONSOLIDATED FINANCIAL STATEMENTS
Gross unrealized losses on investment securities were $14.6 million as of December 31,
2010 and $19.6 million as of December 31, 2009. A majority of these losses represent negative
adjustments to fair value relative to the illiquidity in the markets on the securities and not
losses related to the creditworthiness of the issuer.
A significant portion of the total unrealized losses relates to collateralized debt obligations
that were separately evaluated under FASB ASC 325-40, Beneficial Interests in Securitized
Financial Assets. Based upon qualitative considerations, such as a downgrade in credit rating
or further defaults of underlying issuers during the year, and an analysis of expected cash
flows, we determined that four CDOs included in collateralized debt obligations were
other-than-temporarily impaired. Those four CDO’s have a contractual balance of $28.3 million
at December 31, 2010 which has been reduced to $0.7 million by $0.3 million of interest
payments received, $15.1 million of cumulative OTTI charges recorded through earnings to date,
including $3.7 million recorded in 2010 and $12.2 million recorded in other comprehensive
income. The severity of the OTTI recorded varies by security, based on the analysis described
below, and ranges, at December 31, 2010 from 28% to 87%. The OTTI recorded in other
comprehensive income represents OTTI due to factors other than credit loss, mainly current
market illiquidity. These securities are collateralized by trust preferred securities issued
primarily by bank holding companies, but certain pools do include a limited number of insurance
companies. The market for these securities has become very illiquid, there are very few new
issuances of trust preferred securities and the credit spreads implied by current prices have
increased dramatically and remain very high, resulting in significant non-credit related
impairment. The Corporation uses the OTTI evaluation model to compare the present value of
expected cash flows to the previous estimate to determine if there are adverse changes in cash
flows during the year. The OTTI model considers the structure and term of the CDO and the
financial condition of the underlying issuers. Specifically, the model details interest rates,
principal balances of note classes and underlying issuers, the timing and amount of interest
and principal payments of the underlying issuers, and the allocation of the payments to the
note classes. Cash flows are projected using a forward rate LIBOR curve, as these CDOs are
variable-rate instruments. An average rate is then computed using this same forward rate curve
to determine an appropriate discount rate (3 month LIBOR plus margin ranging from 160 to 180
basis points). The current estimate of expected cash flows is based on the most recent trustee
reports and any other relevant market information, including announcements of interest payment
deferrals or defaults of underlying trust preferred securities. Assumptions used in the model
include expected future default rates and prepayments. We assume no recoveries on defaults and
treat all interest payment deferrals as defaults. In addition we use the model to “stress” each
CDO, or make assumptions more severe than expected activity, to determine the degree to which
assumptions could deteriorate before the CDO could no longer fully support repayment of the
Corporation’s note class.
Collateralized debt obligations include one additional investment in a CDO consisting of pooled
trust preferred securties in which the issuers are primarily banks. This CDO, with an amortized
cost of $2.2 million and a fair value of $1.5 million, is currently rated BAA3 and is the
senior tranche, is not in the scope of FASB ASC 325 as it was rated high investment grade at
purchase, and is not considered to be other-than-temporarily impaired based on its credit
quality. Its fair value is negatively impacted by the factors described above.
Management has consistently used Standard & Poors pricing to value these investments. There are
a number of other pricing sources available to determine fair value for these investments.
These sources utilize a variety of methods to determine fair value. The result is a
wide range of estimates of fair value for these securities. The Standard & Poors pricing ranges
from 1.38 to 3.49 while Moody’s Investor Service pricing ranges from 1.30 to 24.56, with others
falling somewhere in between. We recognize that the Standard & Poors pricing utilized is likely
a conservative estimate, but have been consistent in using this source and its estimate of fair
value.
Unrealized losses on equity securities at year end 2009 relate to investments in bank stocks
held at the holding company. Bank stock values have been negatively impacted by the current
economic environment and market pessimism. In 2009 the largest part of this unrealized loss
($753 or 64%) relates to the Corporation’s ownership of stock in Fifth Third Corporation. In
2010 the holdings of this issuer were liquidated along with a majority of the equity holdings
in order to retire debt. $549 thousand of OTTI was recognized on the stock of Fifth Third
Corporation prior to its disposal.
The table below presents a rollforward of the credit losses recognized in earnings for the year
ended December 31, 2010:
| (Dollar amounts in thousands) | 2010 | 2009 | ||||||
Beginning balance, January 1, |
$ | 11,359 | $ | 6,145 | ||||
Amounts
related to credit loss for which other-than-temporary impairment was not previously recognized |
(549 | ) | 5,438 | |||||
Amounts realized for securities sold during the period |
— | — | ||||||
Reductions
for increase in cash flows expected to be collected that are recognized over the remaining life of the security |
— | — | ||||||
Increases to the amount related to the credit loss for which
other-
than-temporary impairment was previously recognized |
4,260 | 5,331 | ||||||
Adoption of new accounting guidance on OTTI |
— | (5,555 | ) | |||||
Ending balance, December 31, |
$ | 15,070 | $ | 11,359 | ||||
23
FIRST FINANCIAL CORPORATION
NOTES TO CONSOLIDATED FINANCIAL STATEMENTS
5. LOANS:
Loans are summarized as follows:
| December 31, | ||||||||
| (Dollar amounts in thousands) | 2010 | 2009 | ||||||
Commercial |
$ | 896,107 | $ | 870,977 | ||||
Residential |
437,576 | 447,379 | ||||||
Consumer |
307,403 | 314,561 | ||||||
Total gross loans |
1,641,086 | 1,632,917 | ||||||
Less: unearned income |
(940 | ) | (1,153 | ) | ||||
Allowance for loan losses |
(22,336 | ) | (19,437 | ) | ||||
TOTAL |
$ | 1,617,810 | $ | 1,612,327 | ||||
Loans in the above summary include loans totaling $46.4 million that are subject to the FDIC
loss share arrangement (“covered loans”) discussed in footnote 6.
The Corporation periodically sells residential mortgage loans it originates based on the
overall loan demand of the Corporation and the outstanding balances in the residential mortgage
portfolio. At December 31, 2010 and 2009, loans held for sale included $3.4 million and $3.3
million, respectively, and are included in the totals above.
In the normal course of business, the Corporation’s subsidiary banks make loans to directors
and executive officers and to their associates. In 2010, the aggregate dollar amount of these
loans to directors and executive officers who held office amounted to $42.0 million at the
beginning of the year. During 2010, advances of $10.5 million, repayments of $15.3 million and
increases of $0.2 million resulting from changes in personnel were made with respect to related
party loans for an aggregate dollar amount outstanding of $37.4 million at December 31, 2010.
Loans serviced for others, which are not reported as assets, total $469.3 million and $460.3
million at year-end 2010 and 2009. Custodial escrow balances maintained in connection with
serviced loans were $1.93 million and $1.47 million at year-end 2010 and 2009.
Activity for capitalized mortgage servicing rights (included in other assets) was as follows:
| December 31, | ||||||||||||
| (Dollar amounts in thousands) | 2010 | 2009 | 2008 | |||||||||
Servicing rights: |
||||||||||||
Beginning of year |
$ | 2,034 | $ | 1,604 | $ | 1,909 | ||||||
Additions |
810 | 1,294 | 332 | |||||||||
Amortized to expense |
(764 | ) | (864 | ) | (637 | ) | ||||||
End of year |
$ | 2,080 | $ | 2,034 | $ | 1,604 | ||||||
Third party valuations are conducted periodically for mortgage servicing rights. Based on these
valuations, fair values were approximately $3.4 million and $3.0 million at year end 2010 and
2009. There was no valuation allowance in 2010 or 2009.
Fair value for 2010 was determined using a discount rate of 9%, prepayment speeds ranging from
160% to 700%, depending on the stratification of the specific right. Fair value at year end
2009 was determined using a discount rate of 9%, prepayment speeds ranging from 213% to 700%,
depending on the stratification of the specific right. Mortgage servicing rights are amortized
over 8 years, the expected life of the sold loans.
6. ACQUISITION AND FDIC INDEMNIFICATION ASSET:
On July 2, 2009, the Bank entered into a purchase and assumption agreement with the
Federal Deposit Insurance Corporation (“FDIC”) to assume all of the deposits (excluding
brokered deposits) and certain assets of The First National Bank of Danville, a full-service
commercial bank headquartered in Danville, Illinois, that had failed and been placed in
receivership with the FDIC. The acquisition consisted of assets worth a fair value of
approximately $151.8 million, including $77.5 million of loans, $24.2 million of investment
securities, $31.0 million of cash and cash equivalents and $146.3 million of liabilities,
including $145.7 million of deposits. A customer related core deposit intangible asset of $4.6
million was also recorded. In addition to the excess of liabilities over assets, the Bank
received approximately$14.6 million in cash from the FDIC. Based upon the acquisition date fair
values of the net assets acquired, no goodwill was recorded. The transaction resulted in a gain
of $5,1 million, which is included in non-interest income in the December 31, 2009 Consolidated
Statement of Operations Under the loss-sharing agreement (“LSA”), the Bank will share in the
losses on assets covered under the agreement (referred to as covered assets). On losses up to
$29 million, the FDIC has agreed to reimburse the Bank for 80 percent of the losses. On losses
exceeding $29 million, the FDIC has agreed to reimburse the Bank for 95 percent of the losses.
The loss-sharing agreement is subject to following servicing procedures as specified in the
agreement with the FDIC. Loans acquired that are subject to the loss-sharing agreement with the
FDIC are referred to as covered loans for disclosure purposes. Since the acquisition date the
Bank has been reimbursed $13.1 million for losses and carrying expenses and currently carries a
balance of $4.0 million. Included in the current balance is the estimate of $1.7 million for
80% of the loans subject to the loss-sharing agreement identified in the allowance for loan
loss evaluation as future potential losses. This $1.7 million flows to the
income statement as a reduction of the provision for loan losses that was allocated to
these loans.
24
2010 ANNUAL REPORT
NOTES TO CONSOLIDATED FINANCIAL STATEMENTS
FASB ASC 310-30, Loans and Debt Securities Acquired with Deteriorated Credit Quality, applies
to a loan with evidence of deterioration of credit quality since origination, acquired by
completion of a transfer for which it is probable, at acquisition, that the investor will be
unable to collect all contractually required payments receivable. FASB ASC 310-30 prohibits
carrying over or creating an allowance for loan losses upon initial recognition. The carrying
amount of covered assets at December 31, 2010 and 2009, consisted of loans accounted for in
accordance with FASB ASC 310-30, loans not subject to FASB ASC 310-30 and other assets as shown
in the following table:
| Non ASC | ||||||||||||||||
| ASC 310-30 | 310-30 | 2010 | ||||||||||||||
| (Dollar amounts in thousands) | Loans | Loans | Other | Total | ||||||||||||
Loans |
$ | 10,948 | $ | 35,485 | $ | — | $ | 46,433 | ||||||||
Foreclosed Assets |
— | — | 2,586 | 2,586 | ||||||||||||
Total Covered Assets |
$ | 10,948 | $ | 35,485 | $ | 2,586 | $ | 49,019 | ||||||||
| Non ASC | ||||||||||||||||
| ASC 310-30 | 310-30 | 2009 | ||||||||||||||
| (Dollar amounts in thousands) | Loans | Loans | Other | Total | ||||||||||||
Loans |
$ | 16,849 | $ | 55,025 | $ | — | $ | 71,874 | ||||||||
Foreclosed Assets |
— | — | 1,256 | 1,256 | ||||||||||||
Total Covered Assets |
$ | 16,849 | $ | 55,025 | $ | 1,256 | $ | 73,130 | ||||||||
The rollforward of the FDIC Indemnification asset is as follows:
| December 31, | ||||||||
| (Dollar amounts in thousands) | 2010 | 2009 | ||||||
Beginning balance |
$ | 12,124 | $ | — | ||||
Assessed value of intial indemnification asset |
— | 12,098 | ||||||
Accretion |
339 | — | ||||||
Net changes in losses and expenses added |
4,570 | 26 | ||||||
Reimbursements from the FDIC |
(13,056 | ) | — | |||||
TOTAL |
$ | 3,977 | $ | 12,124 | ||||
On the acquisition date, the preliminary estimate of the contractually required payments
receivable for all FASB ASC310-30 loans acquired in the acquisition were $31.6 million, the
cash flows expected to be collected were $18.4 million including interest, and the estimated
fair value of the loans was $16.7 million. These amounts were determined based upon the
estimated remaining life of the underlying loans, which include the effects of estimated
prepayments. At December 31, 2010, a majority of these loans were valued based on the
liquidation value of the underlying collateral, because the expected cash flows are primarily
based on the liquidation of underlying collateral and the timing and amount of the cash flows
could not be reasonably estimated. There was a $1.5 million allowance for credit losses related
to these loans at December 31, 2010. On the acquisition date, the preliminary estimate of the
contractually required payments receivable for all non FASB ASC310-30 loans acquired in the
acquisition was $58.4 million and the estimated fair value of the loans was $60.7 million. The
impact to the Corporation from the amortization and accretion of premiums and discounts was
immaterial.
7. ALLOWANCE FOR LOAN LOSSES:
Changes in the allowance for loan losses are summarized as follows:
| December 31, | ||||||||||||
| (Dollar amounts in thousands) | 2010 | 2009 | 2008 | |||||||||
Balance at beginning of year |
$ | 19,437 | $ | 16,280 | $ | 15,351 | ||||||
Provision for loan losses * |
10,862 | 11,870 | 7,855 | |||||||||
Recoveries of loans previously charged off |
4,511 | 2,948 | 2,668 | |||||||||
Loans charged off |
(12,474 | ) | (11,661 | ) | (9,594 | ) | ||||||
BALANCE AT END OF YEAR |
$ | 22,336 | $ | 19,437 | $ | 16,280 | ||||||
| * | Provision before reduction of $1,662 in 2010 for increases in the FDIC indemnification asset. |
25
FIRST FINANCIAL CORPORATION
NOTES TO CONSOLIDATED FINANCIAL STATEMENTS
The following tables present the allocation of the allowance for loan losses and the
recorded investment in loans by portfolio segment and based on impairment method at December 31,
2010:
Allowance for Loan Losses:
| (Dollar amounts in thousands) | Commercial | Residential | Consumer | Unallocated | Total | |||||||||||||||
Individually evaluated for impairment |
$ | 3,893 | $ | 625 | $ | — | $ | — | $ | 4,518 | ||||||||||
Collectively evaluated for impairment |
7,788 | 1,897 | 4,551 | 2,103 | 16,339 | |||||||||||||||
Acquired with deteriorated credit quality |
1,128 | 351 | — | — | 1,479 | |||||||||||||||
BALANCE AT END OF YEAR |
$ | 12,809 | $ | 2,873 | $ | 4,551 | $ | 2,103 | $ | 22,336 | ||||||||||
Loans |
||||||||||||||||||||
| (Dollar amounts in thousands) | Commercial | Residential | Consumer | Total | ||||||||||||||||
Individually evaluated for impairment |
$ | 27,717 | $ | 2,770 | $ | — | $ | 30,487 | ||||||||||||
Collectively evaluated for impairment |
863,790 | 435,231 | 308,903 | 1,607,924 | ||||||||||||||||
Acquired with deteriorated credit quality |
9,938 | 1,113 | 15 | 11,066 | ||||||||||||||||
BALANCE AT END OF YEAR |
$ | 901,445 | $ | 439,114 | $ | 308,918 | $ | 1,649,477 | ||||||||||||
The following table identifies loans classified as impaired.
| December 31, | ||||||||
| (Dollar amounts in thousands) | 2010 | 2009 | ||||||
Year-end loans with no allocated allowance for loan losses |
$ | 11,890 | $ | 5,344 | ||||
Year-end loans with allocated allowance for loan losses |
25,629 | 19,330 | ||||||
TOTAL |
$ | 37,519 | $ | 24,674 | ||||
Amount of the allowance for loan losses allocated |
$ | 5,867 | $ | 5,438 | ||||
26
2010 ANNUAL REPORT
NOTES TO CONSOLIDATED FINANCIAL STATEMENTS
The following table presents loans individually evaluated for impairment by class of loan.
| Allowance | ||||||||||||
| Unpaid | for Loan | |||||||||||
| Principal | Recorded | Losses | ||||||||||
| Balance | Investment | Allocated | ||||||||||
With no related allowance recorded: |
||||||||||||
Commercial |
||||||||||||
Commercial & Industrial |
$ | 8,935 | $ | 8,993 | $ | — | ||||||
Farmland |
— | — | — | |||||||||
Non Farm, Non Residential |
2,955 | 2,955 | — | |||||||||
Agriculture |
— | — | — | |||||||||
All Other Commercial |
— | — | — | |||||||||
Residential |
||||||||||||
First Liens |
— | — | — | |||||||||
Home Equity |
— | — | — | |||||||||
Junior Liens |
— | — | — | |||||||||
Multifamily |
— | — | — | |||||||||
All Other Residential |
— | — | — | |||||||||
Consumer |
||||||||||||
Motor Vehicle |
— | — | — | |||||||||
All Other Consumer |
— | — | — | |||||||||
With an allowance recorded: |
||||||||||||
Commercial |
||||||||||||
Commercial & Industrial |
10,933 | 10,996 | 1,508 | |||||||||
Farmland |
— | — | — | |||||||||
Non Farm, Non Residential |
9,442 | 9,442 | 3,255 | |||||||||
Agriculture |
— | — | — | |||||||||
All Other Commercial |
1,577 | 1,577 | 128 | |||||||||
Residential |
||||||||||||
First Liens |
1,910 | 1,910 | 533 | |||||||||
Home Equity |
— | — | — | |||||||||
Junior Liens |
1,129 | 1,129 | 443 | |||||||||
Multifamily |
638 | 638 | — | |||||||||
All Other Residential |
— | — | — | |||||||||
Consumer |
||||||||||||
Motor Vehicle |
— | — | — | |||||||||
All Other Consumer |
— | — | — | |||||||||
TOTAL |
$ | 37,519 | $ | 37,640 | $ | 5,867 | ||||||
The table below presents non-performing loans.
| December 31, | ||||||||
| (Dollar amounts in thousands) | 2010 | 2009 | ||||||
Nonperforming loans: |
||||||||
Loans past due over 90 days still on accrual |
3,185 | 8,218 | ||||||
Restructured loans |
17,094 | 90 | ||||||
Non-accrual loans |
38,517 | 35,953 | ||||||
Covered loans included in loans past due over 90 days still on accrual are $377 thousand at
December 31, 2010 and $4.4 million at December 31, 2009. Covered loans included in non-accrual
loans are $8.7 million at December 31, 2010 and $7.5 million at December 31, 2009. Covered loans
of $4.3 million are deemed impaired at December 31, 2010 and have allowance for loan loss
allocated to them of $1.3 million. On December 31, 2009 there were $6.1 million of covered loans
deemed impaired that had an allowance for loan loss allocated to them of $82 thousand.
Non-performing loans include both smaller balance homogeneous loans that are collectively
evaluated for impairment and individually classified impaired loans.
27
FIRST FINANCIAL CORPORATION
NOTES TO CONSOLIDATED FINANCIAL STATEMENTS
| (Dollar amounts in thousands) | 2010 | 2009 | 2008 | |||||||||
Average of impaired loans during the year |
$ | 27,772 | $ | 21,731 | $ | 6,531 | ||||||
Interest income recognized during impairment |
660 | 36 | 3 | |||||||||
Cash-basis interest income recognized |
57 | 19 | — | |||||||||
The following table presents the recorded investment in nonperforming loans by class of loans.
| Loans Past | ||||||||||||
| Due Over | ||||||||||||
| 90 Day Still | ||||||||||||
| (Dollar amounts in thousands) | Accruing | Restructured | Nonaccrual | |||||||||
Commercial |
||||||||||||
Commercial & Industrial |
$ | 1,462 | $ | 13,671 | $ | 11,677 | ||||||
Farmland |
— | — | 68 | |||||||||
Non Farm, Non Residential |
506 | — | 13,808 | |||||||||
Agriculture |
— | — | 284 | |||||||||
All Other Commercial |
158 | — | 2,011 | |||||||||
Residential |
||||||||||||
First Liens |
971 | 2,605 | 6,141 | |||||||||
Home Equity |
45 | — | — | |||||||||
Junior Liens |
66 | 928 | 1,454 | |||||||||
Multifamily |
— | — | 990 | |||||||||
All Other Residential |
— | — | 150 | |||||||||
Consumer |
||||||||||||
Motor Vehicle |
91 | — | 259 | |||||||||
All Other Consumer |
4 | — | 1,675 | |||||||||
TOTAL |
$ | 3,303 | $ | 17,204 | $ | 38,517 | ||||||
The Corporation has allocated $657 thousand and $0 of specific reserves to customers whose loan
terms have been modified in troubled debt restructurings as of December 31, 2010 and 2009. The
Corporation has not committed to lend additional amounts as of December 31, 2010 and 2009 to
customers with outstanding loans that are classified as troubled debt restructurings.
The following table presents the aging of the recorded investment in loans by past due category
and class of loans.
| Greater | ||||||||||||||||||||||||
| 30-59 Days | 60-89 Days | than 90 days | Total | |||||||||||||||||||||
| (Dollar amounts in thousands) | Past Due | Past Due | Past Due | Past Due | Current | Total | ||||||||||||||||||
Commercial |
||||||||||||||||||||||||
Commercial & Industrial |
$ | 2,619 | $ | 882 | $ | 3,868 | $ | 7,369 | $ | 405,319 | $ | 412,688 | ||||||||||||
Farmland |
63 | 198 | — | 261 | 71,672 | 71,933 | ||||||||||||||||||
Non Farm, Non Residential |
761 | 1,763 | 4,366 | 6,890 | 260,685 | 267,575 | ||||||||||||||||||
Agriculture |
55 | — | 284 | 339 | 85,275 | 85,614 | ||||||||||||||||||
All Other Commercial |
— | 135 | 283 | 418 | 63,217 | 63,635 | ||||||||||||||||||
Residential |
||||||||||||||||||||||||
First Liens |
5,405 | 1,649 | 3,793 | 10,847 | 310,722 | 321,569 | ||||||||||||||||||
Home Equity |
78 | 11 | 45 | 134 | 38,638 | 38,772 | ||||||||||||||||||
Junior Liens |
287 | 165 | 175 | 627 | 33,394 | 34,021 | ||||||||||||||||||
Multifamily |
706 | — | 352 | 1,058 | 32,605 | 33,663 | ||||||||||||||||||
All Other Residential |
144 | — | — | 144 | 10,945 | 11,089 | ||||||||||||||||||
Consumer |
||||||||||||||||||||||||
Motor Vehicle |
2,994 | 378 | 91 | 3,463 | 279,029 | 282,492 | ||||||||||||||||||
All Other Consumer |
138 | 23 | 6 | 167 | 26,259 | 26,426 | ||||||||||||||||||
TOTAL |
$ | 13,250 | $ | 5,204 | $ | 13,263 | $ | 31,717 | $ | 1,617,760 | $ | 1,649,477 | ||||||||||||
28
2010 ANNUAL REPORT
NOTES TO CONSOLIDATED FINANCIAL STATEMENTS
Credit Quality Indicators:
The Corporation categorizes loans into risk categories based on relevant information about the
ability of borrowers to service their debt such as: current financial information, historical
payment experience, credit documentation, public information, and current economic trends, among
other factors. The Corporation analyzes loans individually by classifying the loans as to
credit risk. This analysis includes non-homogeneous loans, such as commercial loans, with an
outstanding balance greater than $50 thousand. Any consumer loans outstanding to a borrower who
had commercial loans analyzed will be similarly risk rated. This analysis is performed on a
quarterly basis. The Corporation uses the following definitions for risk ratings:
Special Mention: Loans classified as special mention have a potential weakness that deserves
management’s close attention. If left uncorrected, these potential weaknesses may result in
deterioration of the repayment prospects for the loan or of the institution’s credit position at
some future date.
Substandard: Loans classified as substandard are inadequately protected by the current net
worth and debt service capacity of the borrower or of any pledged collateral. These loans have
a well-defined weakness or weaknesses which have clearly jeopardized repayment of principal and
interest as originally intended. They are characterized by the distinct possibility that the
institution will sustain some future loss if the deficiencies are not corrected.
Doubtful: Loans classified as doubtful have all the weaknesses inherent in those graded
substandard, with the added characteristic that the severity of the weaknesses makes collection
or liquidation in full highly questionable or improbable based upon currently existing facts,
conditions, and values.
Furthermore, non-homogeneous loans which were not individually analyzed, but are 90+ days past
due or on non-accrual are classified as substandard. Loans included in homogeneous pools, such
as residential or consumer, may be classified as substandard due to 90+ days delinquency,
non-accrual status, bankruptcy, or loan restructuring.
Loans not meeting the criteria above that are analyzed individually as part of the above
described process are considered to be pass rated loans. Loans listed as not rated are either
less than $50 thousand or are included in groups of homogeneous loans. As of December 31, 2010,
and based on the most recent analysis performed, the risk category of loans by class of loans is
as follows:
| Special | ||||||||||||||||||||||||
| (Dollar amounts in thousands) | Pass | Mention | Substandard | Doubtful | Not Rated | Total | ||||||||||||||||||
Commercial |
||||||||||||||||||||||||
Commercial & Industrial |
$ | 311,258 | $ | 26,956 | $ | 63,334 | $ | 2,910 | $ | 6,977 | $ | 411,435 | ||||||||||||
Farmland |
66,920 | 1,535 | 1,691 | 68 | 109 | 70,323 | ||||||||||||||||||
Non Farm, Non Residential |
208,847 | 29,399 | 24,579 | 3,364 | 544 | 266,733 | ||||||||||||||||||
Agriculture |
82,275 | 602 | 1,008 | 284 | 154 | 84,323 | ||||||||||||||||||
All Other Commercial |
52,704 | 6,188 | 2,799 | 468 | 1,134 | 63,293 | ||||||||||||||||||
Residential |
||||||||||||||||||||||||
First Liens |
93,887 | 6,201 | 7,495 | 2,944 | 209,804 | 320,331 | ||||||||||||||||||
Home Equity |
8,641 | 4,447 | 427 | 23 | 25,200 | 38,738 | ||||||||||||||||||
Junior Liens |
4,796 | 107 | 1,733 | 167 | 27,090 | 33,893 | ||||||||||||||||||
Multifamily |
22,678 | 8,516 | 1,255 | 990 | 127 | 33,566 | ||||||||||||||||||
All Other Residential |
1,349 | — | 26 | — | 9,673 | 11,048 | ||||||||||||||||||
Consumer |
||||||||||||||||||||||||
Motor Vehicle |
12,902 | 331 | 492 | 29 | 267,424 | 281,178 | ||||||||||||||||||
All Other Consumer |
3,945 | 64 | 174 | 42 | 22,000 | 26,225 | ||||||||||||||||||
TOTAL |
$ | 870,202 | $ | 84,346 | $ | 105,013 | $ | 11,289 | $ | 570,236 | $ | 1,641,086 | ||||||||||||
29
FIRST FINANCIAL CORPORATION
NOTES TO CONSOLIDATED FINANCIAL STATEMENTS
8. PREMISES AND EQUIPMENT:
Premises and equipment are summarized as follows:
| December 31, | ||||||||
| (Dollar amounts in thousands) | 2010 | 2009 | ||||||
Land |
$ | 7,581 | $ | 7,305 | ||||
Building and leasehold improvements |
42,367 | 41,964 | ||||||
Furniture and equipment |
34,700 | 33,520 | ||||||
| 84,648 | 82,789 | |||||||
Less accumulated depreciation |
(49,957 | ) | (47,238 | ) | ||||
TOTAL |
$ | 34,691 | $ | 35,551 | ||||
Aggregate depreciation expense was $3.27 million, $3.25 million and $3.11 million for 2010,
2009 and 2008, respectively.
9. GOODWILL AND INTANGIBLE ASSETS:
The Corporation completed its annual impairment testing of goodwill during the second
quarter of 2010 and 2009. Management does not believe any amount of goodwill is impaired.
Intangible assets subject to amortization at December 31, 2010 and 2009 are as follows:
| 2010 | 2009 | |||||||||||||||
| Gross | Accumulated | Gross | Accumulated | |||||||||||||
| (Dollar amounts in thousands) | Amount | Amortization | Amount | Amortization | ||||||||||||
Customer list intangible |
$ | 4,055 | $ | 3,222 | $ | 3,446 | $ | 2,912 | ||||||||
Core deposit intangible |
6,546 | 3,231 | 6,546 | 2,164 | ||||||||||||
| $ | 10,601 | $ | 6,453 | $ | 9,992 | $ | 5,076 | |||||||||
In late December 2010 Forrest Sherer, Inc. paid $609 thousand to acquire an insurance agency.
The only identifiable asset purchased was a customer list intangible of $609.
Aggregate amortization expense was $1.38 million, $950 thousand and $425 thousand for 2010,
2009 and 2008, respectively.
Estimated amortization expense for the next five years is as follows:
| In thousands | ||||
2011 |
$ | 1,059 | ||
2012 |
801 | |||
2013 |
666 | |||
2014 |
468 | |||
2015 |
337 | |||
10. DEPOSITS:
Scheduled maturities of time deposits for the next five years are as follows:
2011 |
$ | 382,466 | ||
2012 |
145,184 | |||
2013 |
69,904 | |||
2014 |
41,782 | |||
2015 |
12,583 |
30
2010 ANNUAL REPORT
NOTES TO CONSOLIDATED FINANCIAL STATEMENTS
11. SHORT-TERM BORROWINGS:
A summary of the carrying value of the Corporation’s short-term borrowings at December
31, 2010 and 2009 is presented below:
| (Dollar amounts in thousands) | 2010 | 2009 | ||||||
Federal funds purchased |
$ | 3,310 | $ | 5,754 | ||||
Repurchase-agreements |
28,936 | 22,578 | ||||||
Other short-term borrowings |
1,860 | 2,104 | ||||||
| $ | 34,106 | $ | 30,436 | |||||
| (Dollar amounts in thousands) | 2010 | 2009 | ||||||
Average amount outstanding |
$ | 39,753 | $ | 53,930 | ||||
Maximum amount outstanding at a month end |
47,209 | 95,568 | ||||||
Average interest rate during year |
0.82 | % | 1.00 | % | ||||
Interest rate at year-end |
0.83 | % | 1.37 | % | ||||
Federal funds purchased are generally due in one day and bear interest at market rates. Other
borrowings, primarily note payable—U.S. government, are due on demand, secured by a pledge of
securities and bear interest at market rates. Substantially all repurchase agreement
liabilities represent amounts advanced by various customers. Securities are pledged to cover
these liabilities, which are not covered by federal deposit insurance. The Corporation
maintains possession of and control over these securities.
12. OTHER BORROWINGS:
Other borrowings at December 31, 2010 and 2009 are summarized as follows:
| (Dollar amounts in thousands) | 2010 | 2009 | ||||||
FHLB advances |
$ | 125,793 | $ | 326,137 | ||||
City of Terre Haute, Indiana economic development revenue bonds |
— | 6,600 | ||||||
TOTAL |
$ | 125,793 | $ | 332,737 | ||||
The aggregate minimum annual retirements of other borrowings are as follows:
2011 |
$ | 2,050 | ||
2012 |
20,000 | |||
2013 |
56,000 | |||
2014 |
45,000 | |||
2015 |
2,000 | |||
Thereafter |
743 | |||
| $ | 125,793 | |||
The Corporation’s subsidiary banks are members of the Federal Home Loan Bank (FHLB) of
Indianapolis and accordingly are permitted to obtain advances. The advances from the FHLB,
aggregating $125.8 million at December 31, 2010, and $326.1 million at December 31, 2009,
accrue interest, payable monthly, at annual rates, primarily fixed, varying from 3.1% to 6.6%
in 2010 and 3.2% to 6.6% in 2009. The advances are due at various dates through August 2017.
FHLB advances are, generally, due in full at maturity. They are secured by eligible securities
totaling $33.1 million at December 31, 2010, and $217.6 million at December 31, 2009, and a
blanket pledge on real estate loan collateral. Based on this collateral and the Corporation’s
holdings of FHLB stock, the Corporation is eligible to borrow up to $227.7 million at year end
2010. Certain advances may be prepaid, without penalty, prior to maturity. The FHLB can adjust
the interest rate from fixed to variable on certain advances, but those advances may then be
prepaid, without penalty.
The economic development revenue bonds (bonds) require periodic interest payments each year
until maturity or redemption. The interest rate, which was 0.27% at December 31, 2009, is
determined by a formula which considers rates for comparable bonds and is adjusted
periodically. The bonds are collateralized by a first mortgage on the Corporation’s
headquarters building. The bonds mature December 1, 2015, but were retired during 2010.
31
FIRST FINANCIAL CORPORATION
NOTES TO CONSOLIDATED FINANCIAL STATEMENTS
13. INCOME TAXES:
Income tax expense is summarized as follows:
| (Dollar amounts in thousands) | 2010 | 2009 | 2008 | |||||||||
Federal: |
||||||||||||
Currently payable |
$ | 15,582 | $ | 8,721 | $ | 12,238 | ||||||
Deferred |
(4,850 | ) | (1,574 | ) | (4,727 | ) | ||||||
| 10,732 | 7,147 | 7,511 | ||||||||||
State: |
||||||||||||
Currently payable |
2,325 | 877 | 712 | |||||||||
Deferred |
(1,090 | ) | (469 | ) | (420 | ) | ||||||
| 1,235 | 408 | 292 | ||||||||||
TOTAL |
$ | 11,967 | $ | 7,555 | $ | 7,803 | ||||||
The reconciliation of income tax expense with the amount computed by applying the statutory
federal income tax rate of 35% to income before income taxes is summarized as follows:
| (Dollar amounts in thousands) | 2010 | 2009 | 2008 | |||||||||
Federal income taxes computed at the statutory rate |
$ | 14,004 | $ | 10,596 | $ | 11,400 | ||||||
Add (deduct) tax effect of: |
||||||||||||
Tax exempt income |
(3,400 | ) | (3,521 | ) | (3,505 | ) | ||||||
State tax, net of federal benefit |
803 | 265 | 189 | |||||||||
Affordable housing credits |
— | — | (30 | ) | ||||||||
Other, net |
560 | 215 | (251 | ) | ||||||||
TOTAL |
$ | 11,967 | $ | 7,555 | $ | 7,803 | ||||||
The tax effects of temporary differences that give rise to significant portions of the deferred
tax assets and liabilities at December 31, 2010 and 2009, are as follows:
| (Dollar amounts in thousands) | 2010 | 2009 | ||||||
Deferred tax assets: |
||||||||
Other than temporary impairment |
$ | 5,995 | $ | 4,486 | ||||
Net unrealized losses on retirement plans |
8,512 | 7,236 | ||||||
Loan losses provision |
9,315 | 7,717 | ||||||
Deferred compensation |
8,035 | 7,118 | ||||||
Compensated absences |
723 | 633 | ||||||
Post-retirement benefits |
1,971 | 1,785 | ||||||
Other |
1,333 | 1,288 | ||||||
GROSS DEFERRED ASSETS |
35,884 | 30,263 | ||||||
Deferred tax liabilities: |
||||||||
Net unrealized gains on securities available-for-sale |
(2,589 | ) | (2,290 | ) | ||||
Depreciation |
(1,578 | ) | (1,496 | ) | ||||
Federal Home Loan Bank stock dividends |
(96 | ) | (456 | ) | ||||
Mortgage servicing rights |
(827 | ) | (807 | ) | ||||
Pensions |
(1,865 | ) | (2,385 | ) | ||||
Deferred gain on acquisition |
(666 | ) | (2,039 | ) | ||||
Other |
(2,260 | ) | (1,704 | ) | ||||
GROSS DEFERRED LIABILITIES |
(9,881 | ) | (11,177 | ) | ||||
NET DEFERRED TAX ASSETS (LIABILITIES) |
$ | 26,003 | $ | 19,086 | ||||
32
2010 ANNUAL REPORT
NOTES TO CONSOLIDATED FINANCIAL STATEMENTS
Unrecognized Tax Benefits — A reconciliation of the beginning and ending amount of
unrecognized tax benefits is as follows:
| (Dollar amounts in thousands) | 2010 | 2009 | 2008 | |||||||||
Balance at January 1 |
$ | 660 | $ | 549 | $ | 803 | ||||||
Additions based on tax positions related to the current year |
113 | 111 | 47 | |||||||||
Additions based on tax positions related to prior years |
181 | |||||||||||
Reductions for tax positions of prior years |
— | — | (291 | ) | ||||||||
Reductions due to the statute of limitations |
(53 | ) | — | — | ||||||||
Settlements |
— | — | (10 | ) | ||||||||
Balance at December 31 |
$ | 901 | $ | 660 | $ | 549 | ||||||
Of this total, $901 represents the amount of unrecognized tax benefits that, if recognized,
would favorably affect the effective income tax rate in future periods. The Corporation does
not expect the total amount of unrecognized tax benefits to significantly increase or decrease
in the next 12 months.
The total amount of interest and penalties recorded in the income statement for the years ended
December 31, 2010, 2009 and 2008 was an expense increase of $43 and $9, and a reduction of $48,
respectively. The amount accrued for interest and penalties at December 31, 2010, 2009 and 2008
was $116, $73 and $64, respectively.
The Corporation and its subsidiaries are subject to U.S. federal income tax as well as income
tax of the states of Indiana and Illinois. The Corporation is no longer subject to examination
by taxing authorities for years before 2007.
14. FINANCIAL INSTRUMENTS WITH OFF-BALANCE-SHEET RISK:
The Corporation is a party to financial instruments with off-balance-sheet risk in the
normal course of business to meet the financing needs of its customers. These financial
instruments include conditional commitments and commercial letters of credit. The financial
instruments involve to varying degrees, elements of credit and interest rate risk in excess of
amounts recognized in the financial statements. The Corporation’s maximum exposure to credit
loss in the event of nonperformance by the other party to the financial instrument for
commitments to make loans is limited generally by the contractual amount of those instruments.
The Corporation follows the same credit policy to make such commitments as is followed for
those loans recorded in the consolidated financial statements.
Commitment and contingent liabilities are summarized as follows at December 31:
| (Dollar amounts in thousands) | 2010 | 2009 | ||||||
Home Equity |
$ | 44,236 | $ | 43,385 | ||||
Commercial Operating Lines |
203,991 | 206,294 | ||||||
Other Commitments |
45,436 | 40,480 | ||||||
TOTAL |
$ | 293,663 | $ | 290,159 | ||||
Commercial letters of credit |
$ | 13,414 | $ | 15,791 | ||||
The majority of commercial operating lines and home equity lines are variable rate, while the
majority of other commitments to fund loans are fixed rate. Since many commitments to make
loans expire without being used, these amounts do not necessarily represent future cash
commitments. Collateral obtained upon exercise of the commitment is determined using
management’s credit evaluation of the borrower, and may include accounts receivable, inventory,
property, land and other items. The approximate duration of these commitments is generally one
year or less.
Derivatives: The Corporation enters into derivative instruments for the benefit of its
customers. At the inception of a derivative contract, the Corporation designates the derivative
as an instrument with no hedging designation (“standalone derivative”). Changes in the fair
value of derivatives are reported currently in earnings as non-interest income. Net cash
settlements on derivatives that do not qualify for hedge accounting are reported in
non-interest income.
First Financial Bank offers clients the ability on certain transactions to enter into interest
rate swaps. Typically, these are pay fixed, receive floating swaps used in conjunction with
commercial loans. These derivative contracts do not qualify for hedge accounting. The Bank
hedges the exposure to these contracts by entering into offsetting contracts with substantially
matching terms. The notional amount of these interest rate swaps was $30.5 and $32.6 million at
December 31, 2010 and 2009. The fair value of these contracts combined was zero, as gains
offset losses. The gross gain and loss associated with these interest rate swaps was $1.3
million and $889 thousand at December 31, 2010 and 2009.
33
FIRST FINANCIAL CORPORATION
NOTES TO CONSOLIDATED FINANCIAL STATEMENTS
15. RETIREMENT PLANS:
Substantially all employees of the Corporation are covered by a retirement program that
consists of a defined benefit plan and an employee stock ownership plan (ESOP). Plan assets
consist primarily of the Corporation’s stock and obligations of U.S. Government agencies.
Benefits under the defined benefit plan are actuarially determined based on an employee’s
service and compensation, as defined, and funded as necessary.
Assets in the ESOP are considered in calculating the funding to the defined benefit plan
required to provide such benefits. Any shortfall of benefits under the ESOP are to be provided
by the defined benefit plan. The ESOP may provide benefits beyond those determined under the
defined benefit plan. Contributions to the ESOP are determined by the Corporation’s Board of
Directors. The Corporation made contributions to the defined benefit plan of $1.30 million,
$1.20 million and $1.73 million in 2010, 2009 and 2008. The Corporation contributed $1.35
million, $971 thousand and $1.28 million to the ESOP in 2010, 2009 and 2008.
The Corporation uses a measurement date of December 31, 2010.
Net periodic benefit cost and other amounts recognized in other comprehensive income included
the following components:
| (Dollar amounts in thousands) | 2010 | 2009 | 2008 | |||||||||
Service cost — benefits earned |
$ | 3,093 | $ | 3,100 | $ | 3,031 | ||||||
Interest cost on projected benefit obligation |
3,313 | 3,296 | 2,908 | |||||||||
Expected return on plan assets |
(3,400 | ) | (3,857 | ) | (3,292 | ) | ||||||
Net amortization and deferral |
964 | 625 | 711 | |||||||||
Net periodic pension cost |
3,970 | 3,164 | 3,358 | |||||||||
Net loss (gain) during the period |
4,466 | 4,762 | — | |||||||||
Amortization of prior service cost |
18 | 29 | 18 | |||||||||
Amortization of unrecognized gain (loss) |
(982 | ) | (353 | ) | (729 | ) | ||||||
Total recognized in other comprehensive income (loss) |
3,502 | 4,438 | (711 | ) | ||||||||
Total recognized net periodic pension cost and
other comprehensive income |
$ | 7,472 | $ | 7,602 | $ | 2,647 | ||||||
The estimated net loss and prior service costs for the defined benefit pension plan that will be
amortized from accumulated other comprehensive income into net periodic benefit cost over the
next fiscal year are $986 thousand and $166 thousand.
The information below sets forth the change in projected benefit obligation, reconciliation of
plan assets, and the funded status of the Corporation’s retirement program. Actuarial present
value of benefits is based on service to date and present pay levels.
| (Dollar amounts in thousands) | 2010 | 2009 | ||||||
Change in benefit obligation: |
||||||||
Benefit obligation at January 1 |
$ | 55,914 | $ | 56,476 | ||||
Service cost |
3,093 | 3,100 | ||||||
Interest cost |
3,313 | 3,296 | ||||||
Amendment |
2,315 | — | ||||||
Actuarial (gain) loss |
4,820 | (4,672 | ) | |||||
Benefits paid |
(2,449 | ) | (2,286 | ) | ||||
Benefit obligation at December 31 |
67,006 | 55,914 | ||||||
Reconciliation of fair value of plan assets: |
||||||||
Fair value of plan assets at January 1 |
42,199 | 47,892 | ||||||
Actual return on plan assets |
6,070 | (5,578 | ) | |||||
Employer contributions |
2,644 | 2,171 | ||||||
Benefits paid |
(2,449 | ) | (2,286 | ) | ||||
Fair value of plan assets at December 31 |
48,464 | 42,199 | ||||||
Funded status at December 31 (plan assets less benefit obligation) |
$ | (18,542 | ) | $ | (13,715 | ) | ||
34
2010 ANNUAL REPORT
NOTES TO CONSOLIDATED FINANCIAL STATEMENTS
Amounts recognized in accumulated other comprehensive income at December 31, 2010 and 2009
consist of:
| (Dollar amounts in thousands) | 2010 | 2009 | ||||||
Net loss (gain) |
$ | 19,164 | $ | 17,994 | ||||
Prior service cost (credit) |
2,259 | (74 | ) | |||||
| $ | 21,423 | $ | 17,920 | |||||
The accumulated benefit obligation for the defined benefit pension plan was $55,304 and $45,964
at year-end
2010 and 2009.
| Principal assumptions used: | 2010 | 2009 | ||||||
Discount rate |
5.54 | % | 5.96 | % | ||||
Rate of increase in compensation levels |
3.75 | 3.75 | ||||||
Expected long-term rate of return on plan assets |
8.00 | 8.00 | ||||||
The expected long-term rate of return was estimated using market benchmarks for equities and
bonds applied to the plan’s target asset allocation. Management estimated the rate by which
plan assets would perform based on historical experience as adjusted for changes in asset
allocations and expectations for future return on equities as compared to past periods.
Plan Assets — The Corporation’s pension plan weighted-average asset allocation for the years
2010 and 2009 by asset category are as follows:
| Pension | ESOP | |||||||||||||||||||||||
| Pension Plan | ESOP | Pecentage of Plan | Pecentage of Plan | |||||||||||||||||||||
| Target Allocation | Target Allocation | Assets at December 31, | Assets at December 31, | |||||||||||||||||||||
| ASSET CATEGORY | 2011 | 2011 | 2010 | 2009 | 2010 | 2009 | ||||||||||||||||||
Equity securities |
61-63 | % | 99-100 | % | 64 | % | 57 | % | 100 | % | 100 | % | ||||||||||||
Debt securities |
33-36 | % | 0-0 | 33 | % | 35 | % | 0 | % | 0 | % | |||||||||||||
Other |
1-6 | % | 0-1 | 3 | % | 8 | % | 0 | % | 0 | % | |||||||||||||
TOTAL |
100 | % | 100 | % | 100 | % | 100 | % | ||||||||||||||||
Fair Value of Plan Assets — Fair value is the exchange price that would be received for
an asset in the principal or most advantageous market for the asset in an orderly transaction
between market participants on the measurement date. It also establishes a fair value hierarchy
which requires an entity to maximize the use of observable inputs and minimize the use of
unobservable inputs when measuring fair value.
The Corporation used the following methods and significant assumptions to estimate the fair
value of each type of financial instrument:
Equity, Debt, Investment Funds and Other Securities — The fair values for investment
securities are determined by quoted market prices, if available (Level 1). For securities where
quoted prices are not available, fair values are calculated based on market prices of similar
securities (Level 2). For securities where quoted prices or market prices of similar securities
are not available, fair values are calculated using discounted cash flows or other market
indicators (Level 3).
The fair value of the plan assets at December 31, 2010 and 2009, by asset category, is as
follows:
| Fair Value Measurments at | ||||||||||||||||
| December 31, 2010 Using: | ||||||||||||||||
| Quoted Prices | Significant | |||||||||||||||
| in Active | Other | Significant | ||||||||||||||
| Markets for | Obsevable | Obsevable | ||||||||||||||
| Carrying | Identical Assets | Inputs | Inputs | |||||||||||||
| (Dollar amounts in thousands) | Value | (Level 1) | (Level 2) | (Level 3) | ||||||||||||
Plan assets |
||||||||||||||||
Equity securities |
$ | 41,405 | $ | 41,405 | $ | — | $ | — | ||||||||
Debt securities |
5,504 | — | 5,504 | — | ||||||||||||
Investment Funds |
1,555 | 1,555 | — | — | ||||||||||||
Total plan assets |
$ | 48,464 | $ | 42,960 | $ | 5,504 | $ | — | ||||||||
35
FIRST FINANCIAL CORPORATION
NOTES TO CONSOLIDATED FINANCIAL STATEMENTS
| Fair Value Measurments at | ||||||||||||||||
| December 31, 2009 Using: | ||||||||||||||||
| Quoted Prices | Significant | |||||||||||||||
| in Active | Other | Significant | ||||||||||||||
| Markets for | Obsevable | Obsevable | ||||||||||||||
| Carrying | Identical Assets | Inputs | Inputs | |||||||||||||
| (Dollar amounts in thousands) | Value | (Level 1) | (Level 2) | (Level 3) | ||||||||||||
Plan assets |
||||||||||||||||
Equity securities |
$ | 32,583 | $ | 32,583 | $ | — | $ | — | ||||||||
Debt securities |
8,133 | — | 8,133 | — | ||||||||||||
Investment Funds |
1,483 | 1,483 | — | — | ||||||||||||
Total plan assets |
$ | 42,199 | $ | 34,066 | $ | 8,133 | $ | — | ||||||||
The investment objective for the retirement program is to maximize total return without exposure
to undue risk. Asset allocation favors equities, with a target allocation of approximately 88%.
This target includes the Corporation’s ESOP, which is 100% invested in corporate stock. Other
investment allocations include fixed income securities and cash.
The plan is prohibited from investing in the following: private placement equity and debt
transactions; letter stock and uncovered options; short-sale margin transactions and other
specialized investment activity; and fixed income or interest rate futures. All other
investments not prohibited by the plan are permitted.
Equity securities include First Financial Corporation common stock in the amount of $29.7
million (61 percent of total plan assets) and $25.3 million (60 percent of total plan assets) at
December 31, 2010 and 2009, respectively. Other equity securities are predominantly stocks in
large cap U.S. companies.
Contributions — The Corporation expects to contribute $4.9 million to its pension plan and
$1.4 million to its ESOP in 2010.
Estimated Future Payments — The following benefit payments, which reflect expected future
service, are expected:
PENSION BENEFITS
(Dollar amounts in thousands)
2011 |
$ | 1,089 | ||
2012 |
1,294 | |||
2013 |
1,351 | |||
2014 |
1,693 | |||
2015 |
1,959 | |||
2016-2020 |
12,887 | |||
Supplemental Executive Retirement Plan — The Corporation has established a Supplemental
Executive Retirement Plan (SERP) for certain executive officers. The provisions of the SERP
allow the Plan’s participants who are also participants in the Corporation’s defined benefit
pension plan to receive supplemental retirement benefits to help recompense for benefits lost
due to the imposition of IRS limitations on benefits under the Corporation’s tax qualified
defined benefit pension plan. Expenses related to the plan were $241 thousand in 2010 and $196
thousand in 2009. The plan is unfunded and has a measurement date of December 31. The amounts
recognized in other comprehensive income in the current year are as follows:
| (Dollar amounts in thousands) | 2010 | 2009 | 2008 | |||||||||
Net loss (gain) during the period |
$ | (90 | ) | $ | — | $ | — | |||||
Amortization of prior service cost |
(74 | ) | (74 | ) | (74 | ) | ||||||
Amortization of unrecognized gain (loss) |
66 | (37 | ) | 5 | ||||||||
Total recognized in other comprehensive income (loss) |
$ | (98 | ) | $ | (111 | ) | $ | (69 | ) | |||
The Corporation has $1.3 million and $1.2 million recognized in the balance sheet as a
liability at December 31, 2010 and 2009. Amounts in accumulated other comprehensive income
consist of $170 thousand net gain and $74 thousand in prior service cost at December 31, 2010
and $146 thousand net gain and $148 thousand in prior service cost at December 31, 2009. The
estimated gain and prior service costs for the SERP that will be amortized from accumulated
other comprehensive income into net periodic benefit cost over the next fiscal year are $39
thousand and $74 thousand.
36
2010 ANNUAL REPORT
NOTES TO CONSOLIDATED FINANCIAL STATEMENTS
Estimated Future Payments — The following benefit payments, which reflect expected
future service, are expected:
SERP BENEFITS
(Dollar amounts on thousands)
2011 |
$ | — | ||
2012 |
131 | |||
2013 |
130 | |||
2014 |
128 | |||
2015 |
126 | |||
2016-2020 |
600 | |||
The Corporation also provides medical benefits to its employees subsequent to their retirement.
The Corporation uses a measurement date of December 31, 2010. Accrued post-retirement benefits
as of December 31, 2010 and 2009 are as follows:
| December 31, | ||||||||
| (Dollar amounts in thousands) | 2010 | 2009 | ||||||
Change in benefit obligation: |
||||||||
Benefit obligation at January 1 |
$ | 4,425 | $ | 4,248 | ||||
Service cost |
63 | 109 | ||||||
Interest cost |
218 | 240 | ||||||
Plan participants’ contributions |
67 | 26 | ||||||
Actuarial (gain) loss |
— | 16 | ||||||
Benefits paid |
(273 | ) | (214 | ) | ||||
Benefit obligation at December 31 |
$ | 4,500 | $ | 4,425 | ||||
Funded status at December 31 |
$ | 4,500 | $ | 4,425 | ||||
Amounts recognized in accumulated other comprehensive income consist of a net loss of $575
thousand and $180 thousand in transition obligation at December 31, 2010 and $410 thousand net
loss and $241 thousand in transition obligation at December 31, 2009. The post-retirement
benefits paid in 2010 and 2009 of $273 thousand and $214 thousand, respectively, were fully
funded by company and participant contributions.
The estimated transition obligation for the post-retirement benefit plan that will be amortized
from accumulated other comprehensive income into net periodic benefit cost over the next fiscal
year is $60 thousand.
Weighted average assumptions at December 31:
| December 31, | ||||||||
| 2010 | 2009 | |||||||
Discount rate |
5.54 | % | 5.25 | % | ||||
Initial weighted health care cost trend rate |
7.50 | 7.50 | ||||||
Ultimate health care cost trend rate |
5.00 | 5.00 | ||||||
Year that the rate is assumed to stabilize and remain unchanged |
2014 | 2013 | ||||||
37
FIRST FINANCIAL CORPORATION
NOTES TO CONSOLIDATED FINANCIAL STATEMENTS
Post-retirement health benefit expense included the following components:
| Years Ended December 31, | ||||||||||||
| (Dollar amounts in thousands) | 2010 | 2009 | 2008 | |||||||||
Service cost |
$ | 64 | $ | 70 | $ | 125 | ||||||
Interest cost |
218 | 240 | 238 | |||||||||
Amortization of transition obligation |
60 | 60 | 60 | |||||||||
Recognized actuarial loss |
12 | — | 11 | |||||||||
Net periodic benefit cost |
$ | 354 | $ | 370 | $ | 434 | ||||||
Net loss (gain) during the period |
$ | — | $ | — | $ | — | ||||||
Amortization of prior service cost |
(60 | ) | (60 | ) | (60 | ) | ||||||
Amortization of unrecognized gain (loss) |
(153 | ) | (110 | ) | (11 | ) | ||||||
Total recognized in other comprehensive income (loss) |
$ | (213 | ) | $ | (170 | ) | $ | (71 | ) | |||
Total recognized net periodic benefit cost and
other comprehensive income |
$ | 141 | $ | 200 | $ | 363 | ||||||
Assumed health care cost trend rates have a significant effect on the amounts reported for the
health care plans. A one-percentage-point change in the assumed health care cost trend rates
would have the following effects:
| 1% Point | 1% Point | |||||||
| (Dollar amounts in thousands) | Increase | Decrease | ||||||
Effect on total of service and interest cost
components |
$ | 51 | $ | (47 | ) | |||
Effect on post-retirement benefit obligation |
4 | (4 | ) | |||||
Contributions — The Corporation expects to contribute $210 thousand to its other
post-retirement benefit plan in 2011.
Estimated Future Payments — The following benefit payments, which reflect expected future
service, are expected:
Post-Retirement Medical Benefits
(Dollar
amounts in thousands)
2011 |
$ | 233 | ||
2012 |
247 | |||
2013 |
249 | |||
2014 |
255 | |||
2015 |
263 | |||
2016-2020 |
1,390 |
38
2010 ANNUAL REPORT
NOTES TO CONSOLIDATED FINANCIAL STATEMENTS
16. OTHER COMPREHENSIVE INCOME (LOSS):
Other comprehensive income (loss) components and related taxes were as follows:
| December 31, | ||||||||||||
| (Dollar amounts in thousands) | 2010 | 2009 | 2008 | |||||||||
Unrealized holding gains and (losses) on securities available-for-sale |
$ | (6,291 | ) | $ | 9,950 | $ | (19,580 | ) | ||||
Change in unrealized gains (losses) on securities available-for-sale
for which a portion of OTTI has been recognized in earnings |
$ | 4,101 | $ | (2,599 | ) | $ | — | |||||
Reclassification adjustments for (gains) and losses later
recognized in income |
2,939 | 10,765 | 5,787 | |||||||||
Reclassification adjustment for prior OTTI charges |
(5,555 | ) | — | |||||||||
Net unrealized gains and (losses) |
749 | 12,561 | (13,793 | ) | ||||||||
Tax effect |
(300 | ) | (5,025 | ) | 5,517 | |||||||
Other comprehensive income (loss) |
$ | 449 | $ | 7,536 | $ | (8,276 | ) | |||||
Unrecognized gains and (losses) on benefit plans |
$ | (4,376 | ) | $ | (4,762 | ) | $ | — | ||||
Amortization of prior service cost included in net periodic pension
cost |
116 | 105 | 116 | |||||||||
Amortization of unrecognized gains (losses) included in net
periodic pension cost |
1,069 | 500 | 735 | |||||||||
Benefit plans, net |
(3,191 | ) | (4,157 | ) | 851 | |||||||
Tax Effect |
1,277 | 1,663 | (340 | ) | ||||||||
Other comprehensive income (loss) |
$ | (1,914 | ) | $ | (2,494 | ) | $ | 511 | ||||
The following is a summary of the accumulated other comprehensive income balances, net of tax:
| Balance | Current | Balance | ||||||||||
| at | Period | at | ||||||||||
| (Dollar amounts in thousands) | 12/31/2009 | Change | 12/31/2010 | |||||||||
Unrealized gains (losses) on
securities available-for-sale |
$ | 3,434 | $ | 449 | $ | 3,883 | ||||||
Unrealized loss on retirement plans |
(11,338 | ) | (1,914 | ) | (13,252 | ) | ||||||
TOTAL |
$ | (7,904 | ) | $ | (1,465 | ) | $ | (9,369 | ) | |||
17. REGULATORY MATTERS:
The Corporation and its bank affiliates are subject to various regulatory capital
requirements administered by the federal banking agencies. Failure to meet minimum capital
requirements can initiate certain mandatory—and possibly additional discretionary—actions by
regulators that, if undertaken, could have a direct material effect on the Corporation’s
financial statements.
Further, the Corporation’s primary source of funds to pay dividends to shareholders is
dividends from its subsidiary banks and compliance with these capital requirements can affect
the ability of the Corporation and its banking affiliates to pay dividends. At December 31,
2010, approximately $27.2 million of undistributed earnings of the subsidiary banks, included
in consolidated retained earnings, were available for distribution to the Corporation without
regulatory approval. Under capital adequacy guidelines and the regulatory framework for prompt
corrective action, the Corporation and Banks must meet specific capital guidelines that involve
quantitative measures of the Corporation’s assets, liabilities, and certain off-balance-sheet
items as calculated under regulatory accounting practices. The Corporation’s and Banks’ capital
amounts and classification are also subject to qualitative judgments by the regulators about
components, risk weightings and other factors.
Quantitative measures established by regulation to ensure capital adequacy require the
Corporation and Banks to maintain minimum amounts and ratios of Total and Tier I Capital to
risk-weighted assets, and of Tier I Capital to average assets. Management believes, as of
December 31, 2010 and 2009, that the Corporation meets all capital adequacy requirements to
which it is subject.
As of December 31, 2010, the most recent notification from the respective regulatory agencies
categorized the subsidiary banks as well capitalized under the regulatory framework for prompt
corrective action. To be categorized as well capitalized, the banks must maintain minimum total
risk-based, Tier I risk-based and Tier I leverage ratios as set forth in the table. There are
no conditions or events since that notification that management believes have changed the
banks’ category.
39
FIRST FINANCIAL CORPORATION
NOTES TO CONSOLIDATED FINANCIAL STATEMENTS
The following table presents the actual and required capital amounts and related ratios
for the Corporation and First Financial Bank, N.A., at year-end 2010 and 2009.
| To Be Well Capitalized | ||||||||||||||||||||||||
| For Capital | Under Promt Corrective | |||||||||||||||||||||||
| Actual | Adequacy Purposes | Action Provisions | ||||||||||||||||||||||
| (Dollar amounts in thousands) | Amount | Ratio | Amount | Ratio | Amount | Ratio | ||||||||||||||||||
Total risk-based capital |
||||||||||||||||||||||||
Corporation – 2010 |
$ | 341,965 | 17.82 | % | $ | 153,497 | 8.00 | % | N/A | N/A | ||||||||||||||
Corporation – 2009 |
$ | 321,604 | 16.44 | % | $ | 156,502 | 8.00 | % | N/A | N/A | ||||||||||||||
First Financial Bank – 2010 |
320,247 | 17.29 | % | 148,185 | 8.00 | % | 185,231 | 10.00 | % | |||||||||||||||
First Financial Bank – 2009 |
305,100 | 16.09 | % | 151,688 | 8.00 | % | 189,611 | 10.00 | % | |||||||||||||||
Tier I risk-based capital |
||||||||||||||||||||||||
Corporation – 2010 |
$ | 319,629 | 16.66 | % | $ | 76,748 | 4.00 | % | N/A | N/A | ||||||||||||||
Corporation – 2009 |
$ | 302,167 | 15.45 | % | $ | 78,251 | 4.00 | % | N/A | N/A | ||||||||||||||
First Financial Bank – 2010 |
301,232 | 16.26 | % | 74,093 | 4.00 | % | 111,139 | 6.00 | % | |||||||||||||||
First Financial Bank – 2009 |
288,791 | 15.23 | % | 75,844 | 4.00 | % | 113,766 | 6.00 | % | |||||||||||||||
Tier I leverage capital |
||||||||||||||||||||||||
Corporation – 2010 |
$ | 319,629 | 12.68 | % | $ | 100,847 | 4.00 | % | N/A | N/A | ||||||||||||||
Corporation – 2009 |
$ | 302,167 | 12.01 | % | $ | 100,630 | 4.00 | % | N/A | N/A | ||||||||||||||
First Financial Bank – 2010 |
301,232 | 12.37 | % | 97,420 | 4.00 | % | 121,776 | 5.00 | % | |||||||||||||||
First Financial Bank – 2009 |
288,791 | 11.86 | % | 97,393 | 4.00 | % | 121,742 | 5.00 | % | |||||||||||||||
18. PARENT COMPANY CONDENSED FINANCIAL STATEMENTS:
The parent company’s condensed balance sheets as of December 31, 2010 and 2009, and the
related condensed statements of income and cash flows for each of the three years in the
period ended December 31, 2010, are as follows:
CONDENSED BALANCE SHEETS
| December 31, | ||||||||
| (Dollar amounts in thousands) | 2010 | 2009 | ||||||
ASSETS |
||||||||
Cash deposits in affiliated banks |
$ | 9,269 | $ | 9,005 | ||||
Investments in subsidiaries |
317,415 | 305,380 | ||||||
Land and headquarters building, net |
5,174 | 5,349 | ||||||
Other |
2,980 | 6,710 | ||||||
Total Assets |
$ | 334,838 | $ | 326,444 | ||||
LIABILITIES AND SHAREHOLDERS’ EQUITY |
||||||||
Liabilities |
||||||||
Borrowings (including $1.0 million from subsidiary) |
$ | — | $ | 7,636 | ||||
Dividends payable |
6,050 | 5,908 | ||||||
Other liabilities |
7,071 | 6,417 | ||||||
TOTAL LIABILITIES |
13,121 | 19,961 | ||||||
Shareholders’ Equity |
321,717 | 306,483 | ||||||
TOTAL LIABILITIES AND SHAREHOLDERS’ EQUITY |
$ | 334,838 | $ | 326,444 | ||||
40
2010 ANNUAL REPORT
NOTES TO CONSOLIDATED FINANCIAL STATEMENTS
CONDENSED STATEMENTS OF INCOME
| Years Ended December 31, | ||||||||||||
| (Dollar amounts in thousands) | 2010 | 2009 | 2008 | |||||||||
Dividends from subsidiaries |
$ | 16,400 | $ | 14,300 | $ | 14,836 | ||||||
Other income |
1,279 | 816 | 1,010 | |||||||||
Interest on borrowings |
(70 | ) | (121 | ) | (362 | ) | ||||||
Other operating expenses |
(4,314 | ) | (3,462 | ) | (3,342 | ) | ||||||
Income before income taxes and equity
in undistributed earnings of subsidiaries |
13,295 | 11,533 | 12,142 | |||||||||
Income tax benefit |
1,248 | 1,092 | 1,124 | |||||||||
Income before equity in undistributed
earnings of subsidiaries |
14,543 | 12,625 | 13,266 | |||||||||
Equity in undistributed earnings of
subsidiaries |
13,501 | 10,095 | 11,503 | |||||||||
Net income |
$ | 28,044 | $ | 22,720 | $ | 24,769 | ||||||
CONDENSED STATEMENTS OF CASH FLOWS
| Years Ended December 31, | ||||||||||||
| (Dollar amounts in thousands) | 2010 | 2009 | 2008 | |||||||||
CASH FLOWS FROM OPERATING ACTIVITIES: |
||||||||||||
Net Income |
$ | 28,044 | $ | 22,720 | $ | 24,769 | ||||||
Adjustments to reconcile net income to net cash
provided by operating activities: |
||||||||||||
Depreciation and amortization |
262 | 250 | 263 | |||||||||
Equity in undistributed earnings |
(13,501 | ) | (10,095 | ) | (11,503 | ) | ||||||
Contribution of shares to ESOP |
1,347 | 971 | 1,277 | |||||||||
Securities impairment loss recognized in earnings |
549 | — | — | |||||||||
Securities (gains) losses |
(1,048 | ) | — | — | ||||||||
Increase (decrease) in other liabilities |
655 | (167 | ) | 638 | ||||||||
(Increase) decrease in other assets |
(832 | ) | 638 | 1,010 | ||||||||
NET CASH FROM OPERATING ACTIVITIES |
15,476 | 14,317 | 16,454 | |||||||||
CASH FLOWS FROM INVESTING ACTIVITIES: |
||||||||||||
Sales of securities available-for-sale |
4,999 | — | — | |||||||||
Purchase of investment securities |
(12 | ) | (19 | ) | (928 | ) | ||||||
Purchase of furniture and fixtures |
(13 | ) | (21 | ) | (4 | ) | ||||||
NET CASH FROM INVESTING ACTIVITIES |
4,974 | (40 | ) | (932 | ) | |||||||
CASH FLOWS FROM FINANCING ACTIVITIES: |
||||||||||||
Principal payments on borrowings |
(7,636 | ) | — | (2,400 | ) | |||||||
Purchase of treasury stock |
(610 | ) | (616 | ) | (1,464 | ) | ||||||
Dividends paid |
(11,940 | ) | (11,806 | ) | (11,548 | ) | ||||||
NET CASH FROM FINANCING ACTIVITES |
(20,186 | ) | (12,422 | ) | (15,412 | ) | ||||||
NET (DECREASE) INCREASE IN CASH |
264 | 1,855 | 110 | |||||||||
CASH, BEGINNING OF YEAR |
9,005 | 7,150 | 7,040 | |||||||||
CASH, END OF YEAR |
$ | 9,269 | $ | 9,005 | $ | 7,150 | ||||||
Supplemental disclosures of cash flow
information: |
||||||||||||
Cash paid during the year for: |
||||||||||||
Interest |
$ | 87 | $ | 124 | $ | 358 | ||||||
Income taxes |
$ | 15,713 | $ | 13,485 | $ | 11,657 | ||||||
41
FIRST FINANCIAL CORPORATION
NOTES TO CONSOLIDATED FINANCIAL STATEMENTS
19. SELECTED QUARTERLY DATA
(UNAUDITED):
| 2010 | ||||||||||||||||||||||||
| Net | Provision | Net | ||||||||||||||||||||||
| Interest | Interest | Interest | For Loan | Net | Income | |||||||||||||||||||
| (Dollar amounts in thousands) | Income | Expense | Income | Losses | Income | Per Share | ||||||||||||||||||
March 31 |
$ | 31,192 | $ | 7,911 | $ | 23,281 | $ | 2,430 | $ | 5,686 | $ | 0.43 | ||||||||||||
June 30 |
$ | 30,980 | $ | 6,899 | $ | 24,081 | $ | 2,190 | $ | 7,713 | $ | 0.59 | ||||||||||||
September 30 |
$ | 31,186 | $ | 6,533 | $ | 24,653 | $ | 2,390 | $ | 6,293 | $ | 0.48 | ||||||||||||
December 31 |
$ | 30,224 | $ | 5,623 | $ | 24,601 | $ | 2,190 | $ | 8,352 | $ | 0.64 | ||||||||||||
| 2009 | ||||||||||||||||||||||||
| Net | Provision | Net | ||||||||||||||||||||||
| Interest | Interest | Interest | For Loan | Net | Income | |||||||||||||||||||
| (Dollar amounts in thousands) | Income | Expense | Income | Losses | Income | Per Share | ||||||||||||||||||
March 31 |
$ | 31,186 | $ | 10,723 | $ | 20,463 | $ | 2,830 | $ | 4,530 | $ | 0.35 | ||||||||||||
June 30 |
$ | 30,658 | $ | 10,082 | $ | 20,576 | $ | 2,860 | $ | 4,621 | $ | 0.35 | ||||||||||||
September 30 |
$ | 32,224 | $ | 9,357 | $ | 22,867 | $ | 3,690 | $ | 7,719 | $ | 0.59 | ||||||||||||
December 31 |
$ | 32,187 | $ | 9,099 | $ | 23,088 | $ | 2,490 | $ | 5,850 | $ | 0.45 | ||||||||||||
42
2010 ANNUAL REPORT
REPORT OF INDEPENDENT REGISTERED PUBLIC ACCOUNTING FIRM
To the Shareholders and Board of Directors of First Financial Corporation:
We have audited the accompanying consolidated balance sheets of First Financial Corporation
as of December 31, 2010 and 2009 and the related consolidated statements of income, changes
in shareholders’ equity, and cash flows for each of the three years in the period ended
December 31, 2010. We also have audited First Financial Corporation’s internal control over
financial reporting as of December 31, 2010, based on criteria established in Internal
Control—Integrated Framework issued by the Committee of Sponsoring Organizations of
the Treadway Commission (COSO). First Financial Corporation’s management is responsible for
these financial statements, for maintaining effective internal control over financial
reporting, and for its assessment of the effectiveness of internal control over financial
reporting, included in the accompanying Management’s Report on Internal Control over
Financial Reporting. Our responsibility is to express an opinion on these financial
statements and an opinion on the company’s internal control over financial reporting based on
our audits.
We conducted our audits in accordance with the standards of the Public Company Accounting
Oversight Board (United States). Those standards require that we plan and perform the audit
to obtain reasonable assurance about whether the financial statements are free of material
misstatement and whether effective internal control over financial reporting was maintained
in all material respects. Our audits of the financial statements included examining, on a
test basis, evidence supporting the amounts and disclosures in the financial statements,
assessing the accounting principles used and significant estimates made by management, and
evaluating the overall financial statement presentation. Our audit of internal control over
financial reporting included obtaining an understanding of internal control over financial
reporting, assessing the risk that a material weakness exists, and testing and evaluating the
design and operating effectiveness of internal control based on the assessed risk. Our audits
also included performing such other procedures as we considered necessary in the
circumstances. We believe that our audits provide a reasonable basis for our opinions.
A company’s internal control over financial reporting is a process designed to provide
reasonable assurance regarding the reliability of financial reporting and the preparation of
financial statements for external purposes in accordance with generally accepted accounting
principles. A company’s internal control over financial reporting includes those policies and
procedures that (1) pertain to the maintenance of records that, in reasonable detail,
accurately and fairly reflect the transactions and dispositions of the assets of the company;
(2) provide reasonable assurance that transactions are recorded as necessary to permit
preparation of financial statements in accordance with generally accepted accounting
principles, and that receipts and expenditures of the company are being made only in
accordance with authorizations of management and directors of the company; and (3) provide
reasonable assurance regarding prevention or timely detection of unauthorized acquisition,
use, or disposition of the company’s assets that could have a material effect on the
financial statements.
Because of its inherent limitations, internal control over financial reporting may not
prevent or detect misstatements. Also, projections of any evaluation of effectiveness to
future periods are subject to the risk that controls may become inadequate because of changes
in conditions, or that the degree of compliance with the policies or procedures may
deteriorate.
In our opinion, the consolidated financial statements referred to above present fairly, in
all material respects, the financial position of First Financial Corporation as of December
31, 2010 and 2009, and the results of its operations and its cash flows for each of the three
years in the period ended December 31, 2010, in conformity with accounting principles
generally accepted in the United States of America. Also in our opinion First Financial
Corporation maintained, in all material respects, effective internal control over financial
reporting as of December 31, 2010, based on criteria established in Internal Control
—Integrated Framework issued by the COSO.

Indianapolis, Indiana March 15, 2011
43
FIRST FINANCIAL CORPORATION
MANAGEMENT’S REPORT ON INTERNAL CONTROL OVER FINANCIAL REPORTING
The management of First Financial Corporation (the “Corporation”) has prepared and is
responsible for the preparation and accuracy of the consolidated financial statements and
related financial information included in the Annual Report.
The management of the Corporation is responsible for establishing and maintaining adequate
internal control over financial reporting as defined in Rules 13a-15(f) and 15d-15(f) under
the Securities Exchange Act of 1934. The Corporation’s internal control over financial
reporting is designed to provide reasonable assurance regarding the reliability of financial
reporting and the preparation of financial statements for external purposes in accordance with
generally accepted accounting principles. The Corporation’s internal control over financial
reporting includes those policies and procedures that: (i) pertain to the maintenance of
records that, in reasonable detail, accurately and fairly reflect the transactions and
dispositions of the assets of the Corporation; (ii) provide reasonable assurance that
transactions are recorded as necessary to permit preparation of financial statements in
accordance with generally accepted accounting principles, and that receipts and expenditures
of the Corporation are being made only in accordance with authorizations of management and
directors of the Corporation; and (iii) provide reasonable assurance regarding prevention or
timely detection of unauthorized acquisition, use or disposition of the Corporation’s assets
that could have a material effect on the financial statements.
Because of its inherent limitations, internal control over financial reporting may not prevent
or detect misstatements. Also, projections of any evaluation of effectiveness to future
periods are subject to the risk that controls may become inadequate because of changes in
conditions, or that the degree of compliance with the policies or procedures may deteriorate.
Management assessed the Corporation’s system of internal control over financial reporting as
of December 31, 2010, in relation to criteria for effective internal control over financial
reporting as described in “Internal Control—Integrated Framework,” issued by the Committee of
Sponsoring Organizations of the Treadway Commission. Based on this assessment, management
concluded that, as of December 31, 2010, its system of internal control over financial
reporting is effective and meets the criteria of the “Internal Control—Integrated Framework.”
Crowe Horwath LLP, independent registered public accounting firm, has issued a report dated
March 15, 2011 on the Corporation’s internal control over financial reporting.
MANAGEMENT’S DISCUSSION AND ANALYSIS
Management’s discussion and analysis reviews the financial condition of First Financial
Corporation at December 31, 2010 and 2009, and the results of its operations for the three
years ended December 31, 2010. Where appropriate, factors that may affect future financial
performance are also discussed. The discussion should be read in conjunction with the
accompanying consolidated financial statements, related footnotes and selected financial data.
A cautionary note about forward-looking statements: In its oral and written communication,
First Financial Corporation from time to time includes forward-looking statements, within the
meaning of the Private Securities Litigation Reform Act of 1995. Such forward-looking
statements can include statements about estimated cost savings, plans and objectives for
future operations and expectations about performance, as well as economic and market
conditions and trends. They often can be identified by the use of words such as “expect,”
“may,” “could,” “intend,” “project,” “estimate,” “believe” or “anticipate.” First Financial
Corporation may include forward-looking statements in filings with the Securities and Exchange
Commission, in other written materials such as this Annual Report and in oral statements made
by senior management to analysts, investors, representatives of the media and others. It is
intended that these forward-looking statements speak only as of the date they are made, and
First Financial Corporation undertakes no obligation to update any forward-looking statement
to reflect events or circumstances after the date on which the forward-looking statement is
made or to reflect the occurrence of unanticipated events.
By their nature, forward-looking statements are based on assumptions and are subject to risks,
uncertainties and other factors. Actual results may differ materially from those contained in
the forward-looking statement. The discussion in this “Management’s Discussion and Analysis of
Results of Operations and Financial Condition” lists some of the factors which could cause
actual results to vary materially from those in any forward-looking statements. Other
uncertainties which could affect First Financial Corporation’s future performance include the
effects of competition, technological changes and regulatory developments; changes in fiscal,
monetary and tax policies; market, economic, operational, liquidity, credit and interest rate
risks associated with First Financial Corporation’s business; inflation; competition in the
financial services industry; changes in general economic conditions, either nationally or
regionally, resulting in, among other things, credit quality deterioration; and changes in
securities markets. Investors should consider these risks, uncertainties and other factors in
addition to those mentioned by First Financial Corporation in its other filings from time to
time when considering any forward-looking statement.
44
2010 ANNUAL REPORT
MANAGEMENT’S DISCUSSION AND ANALYSIS
First Financial Corporation (the Corporation) is a financial services company. The
Corporation, which is headquartered in Terre Haute, Ind., offers a wide variety of financial
services including commercial, mortgage and consumer lending, lease financing, trust account
services, depositor services and insurance services through its three subsidiaries. At the
close of business in 2010 the Corporation and its subsidiaries had 813 full-time equivalent
employees.
First Financial Bank is the largest bank in Vigo County, Ind. It operates 13 full-service
banking branches within the county; five in Clay County, Ind.; one in Greene County, Ind.;
three in Knox County, Ind.; five in Parke County, Ind.; one in Putnam County, Ind., five in
Sullivan County, Ind.; four in Vermillion County, Ind.; one in Clark County, Ill.; one in
Coles County, Ill.; three in Crawford County, Ill.; one in Jasper County, Ill.; two in
Lawrence County, Ill.; two in Richland County, Ill.; six in Vermilion County, Ill.; and
one in Wayne County, Ill. In addition to its branches, it has a main office in downtown Terre
Haute and a 50,000-square-foot commercial building on South Third Street in Terre Haute, which
serves as the Corporation’s operations center and provides additional office space. Morris
Plan has one office and is located in Vigo County.
First Financial Bank and Morris Plan face competition from other financial institutions. These
competitors consist of commercial banks, a mutual savings bank and other financial
institutions, including consumer finance companies, insurance companies, brokerage firms
and credit unions.
The Corporation’s business activities are centered in west-central Indiana and east-central
Illinois. The Corporation has no foreign activities other than periodically investing
available funds in time deposits held in foreign branches of domestic banks. Forrest Sherer
Inc. is a premier regional supplier of insurance, surety and other financial products. The
Forrest Sherer brand is well recognized in the Midwest, with more than 57 professionals and
over 89 years of successful service to both businesses and households in their market area.
The agency has representation agreements with more than 40 regional and national insurers to
market their products of property and casualty insurance, surety bonds, employee benefit
plans, life insurance and annuities.
CRITICAL ACCOUNTING POLICIES AND ESTIMATES
The Management’s Discussion and Analysis of Financial Condition and Results of Operations, as
well as disclosures found elsewhere in this report are based upon First Financial
Corporation’s consolidated financial statements, which have been prepared in accordance with
accounting principles generally accepted in the United States of America. The preparation of
these financial statements requires the Corporation to make estimates and judgments that
affect the reported amounts of assets, liabilities, revenues, and expenses. Material estimates
that are particularly susceptible to significant change in the near term relate to the
determination of the allowance for loan losses, securities valuation and goodwill. Actual
results could differ from those estimates.
Allowance for loan losses. The allowance for loan losses represents management’s estimate of
losses inherent in the existing loan portfolio. The allowance for loan losses is increased by
the provision for loan losses charged to expense and reduced by loans charged off, net of
recoveries. The allowance for loan losses is determined based on management’s assessment of
several factors: reviews and evaluations of specific loans, changes in the nature and volume
of the loan portfolio, current economic and nonperforming loans.Loans are considered impaired
if, based on current information and events, it is probable that the Corporation will be
unable to collect the scheduled payments of principal or interest according to the
contractual terms of the loan agreement. When a loan is deemed impaired, impairment is
measured by using the fair value of underlying collateral, the present value of the future
cash flows discounted at the effective interest rate stipulated in the loan agreement, or the
estimated market value of the loan. In measuring the fair value of the collateral, management
uses assumptions (e.g., discount rate) and methodologies (e.g., comparison to the recent
selling price of similar assets) consistent with those that would be utilized by unrelated
third parties.
Changes in the financial condition of individual borrowers, economic conditions, historical
loss experience, or the condition of the various markets in which collateral may be sold may
affect the required level of the allowance for loan losses and the associated provision for
loan losses. Should cash flow assumptions or market conditions change, a different amount may
be recorded for the allowance for loan losses and the associated provision for loan losses.
Securities valuation. Securities available-for-sale are carried at fair value, with unrealized
holding gains and losses reported separately in accumulated other comprehensive income (loss),
net of tax. The Corporation obtains market values from a third party on a monthly basis in
order to adjust the securities to fair value. Equity securities that do not have readily
determinable fair values are carried at cost. Additionally, all securities are required to be
written down to fair value when a decline in fair value is other than temporary; therefore,
future changes in the fair value of securities could have a significant impact on the
Corporation’s operating results. In determining whether a market value decline is other than
temporary, management considers the reason for the decline, the extent of the decline, the
duration of the decline and whether the Corporation intends to sell a security or is more
likely than not to be required to sell a security before recovery of its amortized cost.
Changes in credit ratings, financial condition of underlying debtors, default experience and
market liquidity affect the conclusions on whether securities are other-than-temporarily
impaired. Additional losses may be recorded through earnings for other than temporary
impairment, should there be an adverse change in the expected cash flows for these
investments.
Goodwill. The carrying value of goodwill requires management to use estimates and assumptions
about the fair value of the reporting unit compared to its book value. An impairment analysis
is prepared on an annual basis. Fair values of the reporting units are determined by an
analysis which considers cash flows streams, profitability and estimated market values of the
reporting unit. The majority of the Corporation’s goodwill is recorded at Forest Sherer, Inc.
Management believes the accounting estimates related to the allowance for loan losses,
valuation of investment securities and the valuation of goodwill are “critical accounting
estimates” because: (1) the estimates are highly susceptible to change from period to period
because they require management to make assumptions concerning, among other factors, the
changes in the types and volumes of the portfolios, valuation assumptions, and economic
conditions, and (2) the impact of recognizing an impairment or loan loss could have a
material effect on the Corporation’s assets reported on the balance sheet as well as net
income.
45
FIRST FINANCIAL CORPORATION
RESULTS OF OPERATIONS — SUMMARY FOR 2010
COMPARISON OF 2010 TO 2009
Net income for 2010 was $28.0 million, or $2.14 per share. This represents a 23.4% increase
in net income and a 23.7% increase in earnings per share, compared to 2009. Return on assets
at December 31, 2010 increased 16.8% to 1.11% compared to 0.95% at December 31, 2009.
NET INTEREST INCOME
The principal source of the Corporation’s earnings is net interest income, which represents
the difference between interest earned on loans and investments and the interest cost
associated with deposits and other sources of funding. Net interest income was increased in
2010 to $96.6 million compared to $87.0 million in 2009. Total average interest earning
assets grew to $2.34 billion in 2010 from $2.24 billion in 2009. The tax-equivalent yield on
these assets decreased to 5.50% in 2010 from 5.88% in 2009. Total average interest-bearing
liabilities increased to $1.84 billion in 2010 from $1.77 billion in 2009. The average cost
of these interest-bearing liabilities decreased to 1.47% in 2010 from 2.22% in 2009.
The net interest margin increased from 4.13% in 2009 to 4.35% in 2010. This increase is
primarily the result of the decreased costs of funding provided by interest-bearing
liabilities. Earning asset yields decreased 38 basis points while the rate on
interest-bearing liabilities decreased by 75 basis points.
The following table sets forth the components of net interest income due to changes in volume
and rate. The table information compares 2010 to 2009 and 2009 to 2008.
| 2010 Compared to 2009 Increase | 2009 Compared to 2008 Increase | |||||||||||||||||||||||||||||||
| (Decrease) Due to | (Decrease) Due to | |||||||||||||||||||||||||||||||
| Volume/ | Volume/ | |||||||||||||||||||||||||||||||
| (Dollar amounts in thousands) | Volume | Rate | Rate | Total | Volume | Rate | Rate | Total | ||||||||||||||||||||||||
Interest earned on
interest-earning assets: |
||||||||||||||||||||||||||||||||
Loans (1) (2) |
$ | 4,473 | $ | (3,340 | ) | $ | (156 | ) | $ | 977 | $ | 7,709 | $ | (11,526 | ) | $ | (884 | ) | $ | (4,701 | ) | |||||||||||
Taxable investment
securities |
(580 | ) | (3,672 | ) | 94 | (4,158 | ) | (154 | ) | (2,408 | ) | 15 | (2,547 | ) | ||||||||||||||||||
Tax-exempt investment
securities (2) |
409 | (149 | ) | (5 | ) | 255 | 256 | (278 | ) | (5 | ) | (27 | ) | |||||||||||||||||||
Federal funds sold |
92 | (7 | ) | (42 | ) | 43 | (352 | ) | (455 | ) | 315 | (492 | ) | |||||||||||||||||||
Total interest income |
$ | 4,394 | $ | (7,168 | ) | $ | (109 | ) | $ | (2,883 | ) | $ | 7,459 | $ | (14,667 | ) | $ | (559 | ) | $ | (7,767 | ) | ||||||||||
Interest paid on
interest-bearing liabilities: |
||||||||||||||||||||||||||||||||
Transaction accounts |
740 | (1,579 | ) | (380 | ) | (1,219 | ) | 306 | (6,679 | ) | (212 | ) | (6,585 | ) | ||||||||||||||||||
Time deposits |
569 | (4,509 | ) | (139 | ) | (4,079 | ) | 1,188 | (5,418 | ) | (279 | ) | (4,509 | ) | ||||||||||||||||||
Short-term borrowings |
(110 | ) | (133 | ) | 27 | (216 | ) | 469 | (692 | ) | (304 | ) | (527 | ) | ||||||||||||||||||
Other borrowings |
(5,817 | ) | (1,549 | ) | 525 | (6,841 | ) | (749 | ) | (835 | ) | 33 | (1,551 | ) | ||||||||||||||||||
Total interest expense |
(4,618 | ) | (7,770 | ) | 33 | (12,355 | ) | 1,214 | (13,624 | ) | (762 | ) | (13,172 | ) | ||||||||||||||||||
Net interest income |
$ | 9,012 | $ | 602 | $ | (142 | ) | $ | 9,472 | $ | 6,245 | $ | (1,043 | ) | $ | 203 | $ | 5,405 | ||||||||||||||
| (1) | For purposes of these computations, nonaccruing loans are included in the
daily average loan amounts outstanding. |
|
| (2) | Interest income includes the effect of tax equivalent adjustments using a
federal tax rate of 35%. |
46
2010 ANNUAL REPORT
RESULTS OF OPERATIONS — SUMMARY FOR 2010
PROVISION FOR LOAN LOSSES
The provision for loan losses charged to expense is based upon credit loss experience and the
results of a detailed analysis estimating an appropriate and adequate allowance for loan
losses. The analysis includes the evaluation of impaired loans as prescribed under Accounting
Standards Codification (ASC-310), pooled loans as prescribed under ASC 450-10, and economic
and other risk factors as outlined in various Joint Interagency Statements issued by the bank
regulatory agencies. For the year ended December 31, 2010, the gross provision for loan
losses was $9.2 million net, a decrease of $2.7 million, or 22.5%, compared to 2009. The 2010
provision was reduced by $1.7 million for the offset of loans identified in the analysis of
potential loan losses that are subject to the loss share agreement with the FDIC. Of those
anticipated losses, 80% can be reimbursed by the FDIC and the FDIC indemnification asset has
a corresponding increase of $1.7 million for those anticipated losses. The decrease was the
result of several components related to the analysis of the Corporation’s Allowance for Loan
and Lease Losses, including decreasing delinquencies.
Net charge-offs for 2010 were $8.0 million as compared to $8.7 million for 2009 and $6.9
million for 2008. Non-accrual loans increased 7.13% to $38.5 million at December 31, 2010
from $36.0 million at December 31, 2009. Loans past due 90 days and still on accrual
decreased 61.2% to $3.2 million compared to $8.2 million at December 31, 2009
NON-INTEREST INCOME
Non-interest income of $29.8 million increased $1.3 million from the $28.5 million earned in
2009. This increase was despite the onetime events in 2009 of the gain on bargain purchase of
$5.1 million and the gain on sale of the credit card portfolio of $2.5 million. They were
offset by a reduction in losses recorded for other-than-temporarily impaired securities of
$6.5 million along with gain from the sale of securities of $1.3 million.
NON-INTEREST EXPENSES
Non-interest expenses increased to $77.2 million for 2010 from $73.4 million for 2009.
Salaries and employee benefits increased 6.2% or $2.6 million. Approximately $1.5 million of
this increase relates to a full year of salary and employee expense related to the First
National Bank of Danville acquisition in 2009 that only reflected half a year of those costs.
Occupancy and equipment expenses increased $294 thousand or 3.2%. Other expenses increased
$1.3 million, with much of the increase related to loan collection costs and expenses
associated with increased usage of electronic banking products.
INCOME TAXES
The Corporation’s federal income tax provision was $12.0 million in 2010 compared to a
provision of $7.6 million in 2009. The overall effective tax rate in 2010 of 29.9% compared
to a 2009 effective rate of 25.0% as nontaxable income declined slightly and taxable income
increased.
COMPARISON OF 2009 TO 2008
Net income for 2009 was $22.7 million or $1.73 per share compared to $24.8 million in 2008 or
$1.89 per share. This reduction in net income was the combination of other-than-temporary
impairment of securities that reduced income $10 8 million before taxes that was reduced by
increased gains from sale of loans of $4.0 million and the gain from the acquisition of a
failed bank from the FDIC of $5.1 million, both also before taxes.
Net interest income increased $5.5 million in 2009 compared to 2008 as total average
interest-earning assets increased $98.3 million and the tax-equivalent net interest margin
increased to 4.13% in 2009 from 4.06% in 2008. This increase was primarily the result of the
cost of funding declining at a faster pace than the decline in the earnings on earning
assets.
The provision for loan losses increased $4.0 million from $7.9 million in 2008 to $11.9
million in 2009 as net charge-offs increased $1.8 million to $8.7 million in 2009 from $6.9
million in 2008. Net non-interest income and expense increased $3.8 million from 2008 to
2009. Non-interest expenses increased $6.9 million while non-interest income increased $3.1
million. The increase in non-interest income resulted primarily from the gain on acquisition
of a failed financial institution from the FDIC of $5.1 million before taxes. The gain on
loan sales was nearly offset by the increase in losses associated with other-than-temporary
impairment of securities.
The provision for income taxes fell $248 thousand million from 2008 to 2009 and the effective
tax rate increased 1% in 2009 from 2008 as there was less tax exempt income.
COMPARISON AND DISCUSSION OF 2010 BALANCE SHEET TO 2009
The Corporation’s total assets decreased 2.7% or $67.6 million at December 31, 2010, from a
year earlier. Available-for-sale securities decreased $26.4 million at December 31, 2010,
from the previous year. Loans, net of unearned income, increased by $8.4 million to $1.64
billion. Deposits increased by $113.3 million while borrowings decreased by $203.3 million.
Total shareholders’ equity increased $15.2 million to $321.7 million at December 31, 2010.
Net income was partially offset by higher dividends and the continued repurchase of corporate
stock. The Corporation increased purchases of treasury stock in 2010, acquiring 23,000 shares
at a cost of $610 thousand compared to 22,000 shares during 2009 at a cost of $616 thousand.
There were also 45,000 shares from the treasury with a value of $1.35 million that were
contributed to the ESOP plan in 2010 compared to 35,000 shares with a value of $971 thousand
in 2009.
Following is an analysis of the components of the Corporation’s balance sheet.
47
FIRST FINANCIAL CORPORATION
FINANCIAL CONDITION — SUMMARY
SECURITIES
The Corporation’s investment strategy seeks to maximize income from the investment portfolio
while using it as a risk management tool and ensuring safety of principal and capital.
During 2010 the portfolio’s balance decreased by 4.5%. The average life of the portfolio
increased from 4.4 years in 2009 to 4.5 years in 2010. The portfolio structure will continue
to provide cash flows to be reinvested during 2010.
| 1 year and less | 1 to 5 years | 5 to 10 years | Over 10 Years | 2010 | ||||||||||||||||||||||||||||||||
| (Dollar amounts in thousands) | Balance | Rate | Balance | Rate | Balance | Rate | Balance | Rate | Total | |||||||||||||||||||||||||||
U.S. government sponsored
entity mortgage-backed
securities and agencies (1) |
$ | 7 | 8.00 | % | $ | 19,780 | 4.25 | % | $ | 89,176 | 4.43 | % | $ | 195,672 | 4.66 | % | $ | 304,635 | ||||||||||||||||||
Collateralized mortgage
obligations (1) |
— | 0.00 | % | — | 0.00 | % | 23 | 9.78 | % | 94,434 | 4.26 | % | 94,457 | |||||||||||||||||||||||
States and political subdivisions |
10,437 | 2.21 | % | 35,444 | 1.82 | % | 47,672 | 3.71 | % | 63,987 | 4.01 | % | 157,540 | |||||||||||||||||||||||
Corporate obligations |
— | 0.00 | % | — | — | 0.00 | % | 2,190 | 0.09 | % | 2,190 | |||||||||||||||||||||||||
Total |
10,444 | 2.21 | % | 55,224 | 2.69 | % | 136,871 | 4.18 | % | 356,283 | 4.41 | % | 558,822 | |||||||||||||||||||||||
Equities |
0.00 | % | 0.00 | % | 0.00 | % | 2,024 | 0.00 | % | 2,024 | ||||||||||||||||||||||||||
TOTAL |
$ | 10,444 | $ | 55,224 | $ | 136,871 | $ | 358,307 | $ | 560,846 | ||||||||||||||||||||||||||
| (1) | Distribution of maturities is based on the estimated life of the asset. |
| 1 year and less | 1 to 5 years | 5 to 10 years | Over 10 Years | 2009 | ||||||||||||||||||||||||||||||||
| (Dollar amounts in thousands) | Balance | Rate | Balance | Rate | Balance | Rate | Balance | Rate | Total | |||||||||||||||||||||||||||
U.S. government sponsored
entity mortgage-backed
securities and agencies (1) |
$ | 2,062 | 0.61 | % | $ | 31,339 | 4.20 | % | $ | 88,652 | 4.53 | % | $ | 182,446 | 5.21 | % | $ | 304,499 | ||||||||||||||||||
Collateralized mortgage
obligations (1) |
— | 0.00 | % | — | 0.00 | % | 27 | 9.80 | % | 119,537 | 4.70 | % | 119,564 | |||||||||||||||||||||||
States and political subdivisions |
7,060 | 7.10 | % | 37,980 | 7.52 | % | 44,066 | 6.54 | % | 59,627 | 6.48 | % | 148,733 | |||||||||||||||||||||||
Corporate obligations |
— | 0.00 | % | 7,072 | 5.60 | % | — | 0.00 | % | 1,416 | 0.09 | % | 8,488 | |||||||||||||||||||||||
Total |
9,122 | 5.63 | % | 76,391 | 5.98 | % | 132,745 | 5.20 | % | 363,026 | 5.23 | % | 581,284 | |||||||||||||||||||||||
Equities |
0.00 | % | 0.00 | % | 0.00 | % | 5,962 | 0.00 | % | 5,962 | ||||||||||||||||||||||||||
TOTAL |
$ | 9,122 | $ | 76,391 | $ | 132,745 | $ | 368,988 | $ | 587,246 | ||||||||||||||||||||||||||
| (1) | Distribution of maturities
is based on the estimated average life of the asset. |
48
2010 ANNUAL REPORT
FINANCIAL
CONDITION — SUMMARY
LOAN PORTFOLIO
Loans outstanding by major category as of December 31 for each of the last five years and the
maturities at year end 2010 are set forth in the following analyses.
| (Dollar amounts in thousands) | 2010 | 2009 | 2008 | 2007 | 2006 | |||||||||||||||
Loan Category |
||||||||||||||||||||
Commercial |
$ | 896,107 | $ | 870,977 | $ | 720,281 | $ | 717,556 | $ | 674,515 | ||||||||||
Residential |
437,576 | 447,379 | 436,388 | 449,554 | 462,556 | |||||||||||||||
Consumer |
307,403 | 314,561 | 303,123 | 263,091 | 257,070 | |||||||||||||||
TOTAL |
$ | 1,641,086 | $ | 1,632,917 | $ | 1,459,792 | $ | 1,430,201 | $ | 1,394,141 | ||||||||||
Credit card loans held-for-sale |
$ | — | $ | — | $ | 12,800 | $ | 14,068 | $ | — | ||||||||||
| After One | ||||||||||||||||
| Within | But Within | After Five | ||||||||||||||
| (Dollar amounts in thousands) | One Year | Five Years | Years | Total | ||||||||||||
MATURITY DISTRIBUTION |
||||||||||||||||
Commercial, financial and agricultural |
$ | 333,925 | $ | 483,890 | $ | 78,292 | $ | 896,107 | ||||||||
TOTAL |
||||||||||||||||
Residential |
437,576 | |||||||||||||||
Consumer |
307,403 | |||||||||||||||
TOTAL |
$ | 1,641,086 | ||||||||||||||
Loans maturing after one year with: |
||||||||||||||||
Fixed interest rates |
$ | 129,750 | $ | 57,242 | ||||||||||||
Variable interest rates |
354,140 | 21,050 | ||||||||||||||
TOTAL |
$ | 483,890 | $ | 78,292 | ||||||||||||
49
FIRST FINANCIAL CORPORATION
FINANCIAL CONDITION — SUMMARY
ALLOWANCE FOR LOAN LOSSES
The activity in the Corporation’s allowance for loan losses is shown in the following
analysis:
| (Dollar amounts in thousands) | 2010 | 2009 | 2008 | 2007 | 2006 | |||||||||||||||
Amount of loans outstanding
at December 31, |
$ | 1,641,086 | $ | 1,632,917 | $ | 1,459,792 | $ | 1,430,201 | $ | 1,394,141 | ||||||||||
Average amount of loans by year |
$ | 1,636,254 | $ | 1,563,274 | $ | 1,451,911 | $ | 1,409,051 | $ | 1,384,138 | ||||||||||
Allowance for loan losses at beginning of
year |
$ | 19,437 | $ | 16,280 | $ | 15,351 | $ | 16,169 | $ | 16,042 | ||||||||||
Loans charged off: |
||||||||||||||||||||
Commercial |
7,099 | 2,997 | 2,406 | 3,438 | 2,066 | |||||||||||||||
Residential |
872 | 1,881 | 1,274 | 1,026 | 1,617 | |||||||||||||||
Consumer |
4,503 | 6,783 | 5,914 | 5,712 | 6,826 | |||||||||||||||
Total loans charged off |
12,474 | 11,661 | 9,594 | 10,176 | 10,509 | |||||||||||||||
Recoveries of loans previously charged off: |
||||||||||||||||||||
Commercial |
2,319 | 574 | 704 | 389 | 1,262 | |||||||||||||||
Residential |
258 | 523 | 101 | 139 | 187 | |||||||||||||||
Consumer |
1,934 | 1,851 | 1,863 | 2,250 | 2,204 | |||||||||||||||
Total recoveries |
4,511 | 2,948 | 2,668 | 2,778 | 3,653 | |||||||||||||||
Net loans charged off |
7,963 | 8,713 | 6,926 | 7,398 | 6,856 | |||||||||||||||
Provision charged to expense * |
10,862 | 11,870 | 7,855 | 6,580 | 6,983 | |||||||||||||||
Balance at end of year |
$ | 22,336 | $ | 19,437 | $ | 16,280 | $ | 15,351 | $ | 16,169 | ||||||||||
Ratio of net charge-offs during period
to average loans outstanding |
0.49 | % | 0.56 | % | 0.48 | % | 0.53 | % | 0.50 | % | ||||||||||
| * | In 2010 the provision charged to expense was reduced by $1,662 for the increase to the FDIC
Indemnification asset. |
The allowance is maintained at an amount management believes sufficient to absorb probable
incurred losses in the loan portfolio. Monitoring loan quality and maintaining an adequate
allowance is an ongoing process overseen by senior management and the loan review function. On
at least a quarterly basis, a formal analysis of the adequacy of the allowance is prepared and
reviewed by management and the Board of Directors. This analysis serves as a point in time
assessment of the level of the allowance and serves as a basis for provisions for loan losses.
The loan quality monitoring process includes assigning loan grades and the use of a watch list
to identify loans of concern.
Included in the $1.6 billion of loans outstanding at December 31, 2010 are $46.4 million of
covered loans.
The analysis of the allowance for loan losses includes the allocation of specific amounts of
the allowance to individual problem loans, generally based on an analysis of the collateral
securing those loans. Portions of the allowance are also allocated to loan portfolios, based
upon a variety of factors including historical loss experience, trends in the type and volume
of the loan portfolios, trends in delinquent and non-performing loans, and economic trends
affecting our market. These components are added together and compared to the balance of our
allowance at the evaluation date. The Corporation’s unallocated allowance position of $2.1
million at December 31, 2010 has increased from $0.6 million at December 31, 2009. Management
has determined the unallocated allowance position to be reasonable based on the trend analysis
of the loan portfolio. Non-performing loans of $58.8 million at December 31, 2010 increased
from $44.3 million at December 31, 2009. Net charge-offs totaled $8.0 million compared to $8.7
million during 2009. While the net charge-off total declined, based on non-performing and
delinquent loan trends, particularly in the residential portfolio, management increased the
unallocated position in the allowance. The table below presents the allocation of the
allowance to the loan portfolios at year-end.
| Years Ended December 31, | ||||||||||||||||||||
| (Dollar amounts in thousands) | 2010 | 2009 | 2008 | 2007 | 2006 | |||||||||||||||
Commercial |
$ | 12,809 | $ | 12,218 | $ | 9,963 | $ | 8,917 | $ | 9,043 | ||||||||||
Residential |
2,873 | 1,546 | 1,485 | 1,233 | 1,364 | |||||||||||||||
Consumer |
4,551 | 5,032 | 4,483 | 4,180 | 5,762 | |||||||||||||||
Unallocated |
2,103 | 641 | 349 | 1,021 | — | |||||||||||||||
TOTAL ALLOWANCE FOR LOAN LOSSES |
$ | 22,336 | $ | 19,437 | $ | 16,280 | $ | 15,351 | $ | 16,169 | ||||||||||
50
2010 ANNUAL REPORT
FINANCIAL CONDITION — SUMMARY
NONPERFORMING LOANS
Management monitors the components and status of nonperforming loans as a part of the
evaluation procedures used in determining the adequacy of the allowance for loan losses. It is
the Corporation’s policy to discontinue the accrual of interest on loans where, in
management’s opinion, serious doubt exists as to collectability. The amounts shown below
represent non-accrual loans, loans which have been restructured to provide for a reduction or
deferral of interest or principal because of deterioration in the financial condition of the
borrower and those loans which are past due more than 90 days where the Corporation continues
to accrue interest. In 2010 the increase in restructured loans mainly is due to five
commercial loans totaling $14.9 million while the remainder is mostly smaller balance
residential loans. The current economic environment has facilitated an tremendous increase in
the use of restructured loans as a means to decrease losses.
| (Dollar amounts in thousands) | 2010 | 2009 | 2008 | 2007 | 2006 | |||||||||||||||
Non-accrual loans |
$ | 38,517 | $ | 35,953 | $ | 12,486 | $ | 7,971 | $ | 9,893 | ||||||||||
Restructured loans |
17,094 | 90 | 98 | 50 | 52 | |||||||||||||||
Accruing loans past due over 90
days |
3,185 | 8,218 | 3,624 | 4,462 | 4,691 | |||||||||||||||
| $ | 58,796 | $ | 44,261 | $ | 16,208 | $ | 12,483 | $ | 14,636 | |||||||||||
The ratio of the allowance for loan losses as a percentage of nonperforming loans was 38% at
December 31, 2010, compared to 44% in 2009. The ratio of nonperforming loans excluding covered
loans was 69% at December 31, 2010 and 60% at December 31, 2009. There were $3.8 million of
covered loans included in restructured loans in 2010. The following loan categories comprise
significant components of the nonperforming loans at December 31, 2010 and 2009:
| (Dollar amounts in thousands) | 2010 | 2009 | ||||||||||||||
Non-accrual loans: |
||||||||||||||||
Commercial loans |
$ | 27,848 | 72 | % | $ | 30,961 | 86 | % | ||||||||
Residential loans |
8,735 | 23 | % | 2,917 | 8 | % | ||||||||||
Consumer loans |
1,934 | 5 | % | 2,075 | 6 | % | ||||||||||
| $ | 38,517 | 100 | % | $ | 35,953 | 100 | % | |||||||||
Past due 90 days or more: |
||||||||||||||||
Commercial loans |
$ | 2,041 | 64 | % | $ | 5,937 | 72 | % | ||||||||
Residential loans |
1,052 | 33 | % | 1,837 | 22 | % | ||||||||||
Consumer loans |
92 | 3 | % | 444 | 5 | % | ||||||||||
| $ | 3,185 | 100 | % | $ | 8,218 | 100 | % | |||||||||
| Covered Loans (also included above) | ||||||||||||||||
| (Dollar amounts in thousands) | 2010 | 2009 | ||||||||||||||
Non-accrual loans: |
||||||||||||||||
Commercial loans |
$ | 7,353 | 84 | % | $ | 7,396 | 98 | % | ||||||||
Residential loans |
1,394 | 16 | % | 168 | 2 | % | ||||||||||
Consumer loans |
— | 0 | % | — | 0 | % | ||||||||||
| $ | 8,747 | 100 | % | $ | 7,564 | 100 | % | |||||||||
Past due 90 days or more: |
||||||||||||||||
Commercial loans |
$ | 313 | 83 | % | $ | 4,113 | 93 | % | ||||||||
Residential loans |
64 | 17 | % | 292 | 7 | % | ||||||||||
Consumer loans |
— | 0 | % | 2 | 0 | % | ||||||||||
| $ | 377 | 100 | % | $ | 4,407 | 100 | % | |||||||||
Management considers the present allowance to be appropriate and adequate to cover losses
inherent in the loan portfolio based on the current economic environment. However, future
economic changes cannot be predicted. Deteriorating economic conditions could result in an
increase in the risk characteristics of the loan portfolio and an increase in the potential
for loan losses.
51
FIRST FINANCIAL CORPORATION
FINANCIAL CONDITION — SUMMARY
DEPOSITS
The information below presents the average amount of deposits and rates paid on those
deposits for 2010, 2009 and 2008.
| 2010 | 2009 | 2008 | ||||||||||||||||||||||
| (Dollar amounts in thousands) | Amount | Rate | Amount | Rate | Amount | Rate | ||||||||||||||||||
Non-interest-bearing
demand deposits |
$ | 300,760 | $ | 280,668 | $ | 236,628 | ||||||||||||||||||
Interest-bearing demand deposits |
330,168 | 0.23 | % | 280,338 | 0.40 | % | 247,017 | 1.11 | % | |||||||||||||||
Savings deposits |
540,370 | 0.20 | % | 421,412 | 0.46 | % | 433,179 | 1.60 | % | |||||||||||||||
Time deposits: |
||||||||||||||||||||||||
$100,000 or more |
214,266 | 1.85 | % | 194,576 | 2.63 | % | 183,664 | 3.67 | % | |||||||||||||||
Other time deposits |
483,294 | 2.17 | % | 482,193 | 2.77 | % | 459,916 | 3.54 | % | |||||||||||||||
TOTAL |
$ | 1,868,858 | $ | 1,659,187 | $ | 1,560,404 | ||||||||||||||||||
The maturities of certificates of deposit of $100 thousand or more outstanding at December
31, 2010, are summarized as follows:
3 months or less |
$ | 50,585 | ||
Over 3 through 6 months |
30,274 | |||
Over 6 through 12 months |
54,879 | |||
Over 12 months |
79,763 | |||
TOTAL |
$ | 215,501 | ||
OTHER BORROWINGS
Advances from the Federal Home Loan Bank decreased to $125.8 million in 2010 compared to
$326.1 million in 2009. The Asset/Liability Committee reviews these investments and funding
sources and considers the related strategies on a weekly basis. See Interest Rate Sensitivity
and Liquidity below for more information.
CAPITAL RESOURCES
Bank regulatory agencies have established capital adequacy standards which are used
extensively in their monitoring and control of the industry. These standards relate capital
to level of risk by assigning different weightings to assets and certain off-balance-sheet
activity. As shown in the footnote to the consolidated financial statements (“Regulatory
Matters”), the Corporation’s capital exceeds the requirements to be considered well
capitalized at December 31, 2010.
First Financial Corporation’s objective continues to be to maintain adequate capital to merit
the confidence of its customers and shareholders. To warrant this confidence, the
Corporation’s management maintains a capital position which they believe is sufficient to
absorb unforeseen financial shocks without unnecessarily restricting dividends to its
shareholders. The Corporation’s dividend payout ratio for 2010 and 2009 was 43.1% and 52.0%,
respectively. The Corporation expects to continue its policy of paying regular cash
dividends, subject to future earnings and regulatory restrictions and capital requirements.
INTEREST RATE SENSITIVITY AND LIQUIDITY
First Financial Corporation has established risk measures, limits and policy guidelines
for managing interest rate risk and liquidity. Responsibility for management of these
functions resides with the Asset/Liability Committee. The primary goal of the Asset/Liability
Committee is to maximize net interest income within the interest rate risk limits approved by
the Board of Directors.
Interest Rate Risk: Management considers interest rate risk to be the Corporation’s most
significant market risk. Interest rate risk is the exposure to changes in net interest income
as a result of changes in interest rates. Consistency in the Corporation’s net interest
income is largely dependent on the effective management of this risk. The Asset/Liability
position is measured using sophisticated risk management tools, including earnings simulation
and market value of equity sensitivity analysis. These tools allow management to quantify and
monitor both short-and long-term exposure to interest rate risk. Simulation modeling measures
the effects of changes in interest rates, changes in the shape of the yield curve and the
effects of embedded options on net interest income. This measure projects earnings in the
various environments over the next three years. It is important to note that measures of
interest rate risk have limitations and are dependent on various assumptions. These
assumptions are inherently uncertain and, as a result, the model cannot precisely predict the
impact of interest rate fluctuations on net interest income. Actual results will differ from
simulated results due to timing, frequency and amount of interest rate changes as well as
overall market conditions. The Committee has performed a thorough analysis of these
assumptions and believes them to be valid and theoretically sound. These assumptions are
continuously monitored for behavioral changes.
The Corporation from time to time utilizes derivatives to manage interest rate risk.
Management continuously evaluates the merits of such interest rate risk products but does not
anticipate the use of such products to become a major part of the Corporation’s risk
management strategy.
52
2010 ANNUAL REPORT
FINANCIAL CONDITION — SUMMARY
The table below shows the Corporation’s estimated sensitivity profile as of December
31, 2010. The change in interest rates assumes a parallel shift in interest rates of 100 and
200 basis points. Given a 100 basis point increase in rates, net interest income would
increase 0.19% over the next 12 months and increase 2.06% over the following 12 months. Given
a 100 basis point decrease in rates, net interest income would decrease 0.92% over the next
12 months and decrease 2.27% over the following 12 months. These estimates assume all rate
changes occur overnight and management takes no action as a result of this change.
| Basis Point | Percentage Change in Net Interest Income | |||||||||||
| Interest Rate Change | 12 months | 24 months | 36 months | |||||||||
Down 200 |
-2.01 | % | -5.29 | % | -7.71 | % | ||||||
Down 100 |
-0.92 | % | -2.27 | % | -3.39 | % | ||||||
Up 100 |
0.19 | % | 2.06 | % | 4.66 | % | ||||||
Up 200 |
2.22 | % | 5.54 | % | 10.65 | % | ||||||
Typical rate shock analysis does not reflect management’s ability to react and thereby reduce
the effects of rate changes, and represents a worst-case scenario.
Liquidity Risk Liquidity is measured by the bank’s ability to raise funds to meet the
obligations of its customers, including deposit withdrawals and credit needs. This is
accomplished primarily by maintaining sufficient liquid assets in the form of investment
securities and core deposits. The Corporation has $9.1 million of investments that mature
throughout the coming 12 months. The Corporation also anticipates $111.3 million of principal
payments from mortgage-backed securities. Given the current rate environment, the Corporation
anticipates $9.8 million in securities to be called within the next 12 months.
CONTRACTUAL OBLIGATIONS, COMMITMENTS, CONTINGENT LIABILITIES AND OFF-BALANCE SHEET
ARRANGEMENTS
The Corporation has various financial obligations, including contractual obligations
and commitments, that may require future cash payments.
Contractual Obligations: The following table presents, as of December 31, 2010, significant
fixed and determinable contractual obligations to third parties by payment date. Further
discussion of the nature of each obligation is included in the referenced note to the
consolidated financial statements.
| Payments Due in | ||||||||||||||||||||||||
| Note | One year | One year | Three to | Over Five | ||||||||||||||||||||
| (Dollar amounts in thousands) | Reference | or less | Three Years | Five Years | Years | Total | ||||||||||||||||||
Deposits without a stated
maturity |
$ | 1,250,931 | $ | — | $ | — | $ | — | $ | 1,250,931 | ||||||||||||||
Consumer certificates of deposit |
382,466 | 215,088 | 54,365 | 193 | 652,112 | |||||||||||||||||||
Short-term borrowings |
10 | 34,106 | — | — | — | 34,106 | ||||||||||||||||||
Other borrowings |
11 | 2,050 | 76,000 | 47,000 | 743 | 125,793 | ||||||||||||||||||
Commitments: The following table details the amount and expected maturities of significant
commitments as of December 31, 2010. Further discussion of these commitments is included in
Note 13 to the consolidated financial statements.
| Total Amount | One year | Over One | ||||||||||
| (Dollar amounts in thousands) | Committed | or less | Year | |||||||||
Commitments to extend credit: |
||||||||||||
Unused loan commitments |
$ | 293,663 | $ | 171,001 | $ | 122,662 | ||||||
Commercial letters of credit |
13,414 | 11,832 | 1,582 | |||||||||
Commitments to extend credit, including loan commitments, standby and commercial letters of
credit do not necessarily represent future cash requirements, in that these commitments often
expire without being drawn upon.
OUTLOOK
The Corporation’s primary market is west-central Indiana and east-central Illinois. The
market is primarily driven by the retail, higher education and health care industries.
Typically, this market does not expand or contract at rates that are experienced by both the
state and national economies. It is not anticipated that labor conditions will improve
dramatically in 2011, although a gradual improvement in both the labor markets and retail
sales is anticipated. The Corporation anticipates limited growth opportunities in 2011.
53
FIRST FINANCIAL CORPORATION
CONSOLIDATED BALANCE SHEET — AVERAGE BALANCES AND INTEREST RATES
| December 31, | ||||||||||||||||||||||||||||||||||||
| 2010 | 2009 | 2008 | ||||||||||||||||||||||||||||||||||
| Average | Yield/ | Average | Yield/ | Average | Yield/ | |||||||||||||||||||||||||||||||
| (Dollar amounts in thousands) | Balance | Interest | Rate | Balance | Interest | Rate | Balance | Interest | Rate | |||||||||||||||||||||||||||
ASSETS |
||||||||||||||||||||||||||||||||||||
Interest-earning assets: |
||||||||||||||||||||||||||||||||||||
Loans (1) (2) |
$ | 1,636,254 | 96,786 | 5.92 | % | $ | 1,563,274 | 95,809 | 6.13 | % | $ | 1,451,911 | 100,510 | 6.92 | % | |||||||||||||||||||||
Taxable investment securities |
469,945 | 18,597 | 3.96 | % | 482,237 | 22,755 | 4.72 | % | 485,194 | 25,303 | 5.22 | % | ||||||||||||||||||||||||
Tax-exempt investments (2) |
194,011 | 13,415 | 6.91 | % | 188,160 | 13,160 | 6.99 | % | 184,574 | 13,188 | 7.15 | % | ||||||||||||||||||||||||
Federal funds sold |
40,934 | 59 | 0.14 | % | 6,047 | 16 | 0.26 | % | 19,729 | 507 | 2.57 | % | ||||||||||||||||||||||||
Total interest-earning assets |
2,341,144 | 128,857 | 5.50 | % | 2,239,718 | 131,740 | 5.88 | % | 2,141,408 | 139,508 | 6.51 | % | ||||||||||||||||||||||||
Non-interest earning assets: |
||||||||||||||||||||||||||||||||||||
Cash and due from banks |
57,940 | 65,069 | 58,676 | |||||||||||||||||||||||||||||||||
Premises and equipment, net |
35,001 | 32,470 | 32,524 | |||||||||||||||||||||||||||||||||
Other assets |
102,780 | 79,419 | 64,952 | |||||||||||||||||||||||||||||||||
Less allowance for loan
losses |
(20,083 | ) | (16,576 | ) | (15,539 | ) | ||||||||||||||||||||||||||||||
TOTALS |
$ | 2,516,782 | $ | 2,400,100 | $ | 2,282,021 | ||||||||||||||||||||||||||||||
LIABILITIES AND SHAREHOLDERS’ EQUITY |
||||||||||||||||||||||||||||||||||||
Interest-bearing liabilities: |
||||||||||||||||||||||||||||||||||||
Transaction accounts |
$ | 870,538 | 1,856 | 0.21 | % | $ | 701,750 | 3,075 | 0.44 | % | $ | 680,196 | 9,660 | 1.42 | % | |||||||||||||||||||||
Time deposits |
697,560 | 14,448 | 2.07 | % | 676,769 | 18,469 | 2.73 | % | 643,580 | 23,036 | 3.58 | % | ||||||||||||||||||||||||
Short-term borrowings |
42,795 | 325 | 0.76 | % | 53,743 | 541 | 1.01 | % | 37,352 | 1,068 | 2.86 | % | ||||||||||||||||||||||||
Other borrowings |
224,501 | 10,335 | 4.60 | % | 339,460 | 17,176 | 5.06 | % | 353,598 | 18,726 | 5.30 | % | ||||||||||||||||||||||||
Total interest-bearing
liabilities: |
1,835,394 | 26,964 | 1.47 | % | 1,771,722 | 39,261 | 2.22 | % | 1,714,726 | 52,490 | 3.06 | % | ||||||||||||||||||||||||
Non interest-bearing
liabilities: |
||||||||||||||||||||||||||||||||||||
Demand deposits |
300,760 | 280,668 | 236,628 | |||||||||||||||||||||||||||||||||
Other |
59,461 | 46,278 | 43,045 | |||||||||||||||||||||||||||||||||
| 2,195,615 | 2,098,668 | 1,994,399 | ||||||||||||||||||||||||||||||||||
Shareholders’ equity |
321,167 | 301,432 | 287,622 | |||||||||||||||||||||||||||||||||
TOTALS |
$ | 2,516,782 | $ | 2,400,100 | $ | 2,282,021 | ||||||||||||||||||||||||||||||
Net interest earnings |
$ | 101,893 | $ | 92,479 | $ | 87,018 | ||||||||||||||||||||||||||||||
Net yield on interest-
earning assets |
4.35 | % | 4.13 | % | 4.06 | % | ||||||||||||||||||||||||||||||
| (1) | For purposes of these computations, nonaccruing loans are included in the
daily average loan amounts outstanding. |
|
| (2) | Interest income includes the effect of tax equivalent adjustments using a
federal tax rate of 35%. |
54
2010 ANNUAL REPORT
MARKET AND DIVIDEND INFORMATION
At year-end 2010 shareholders owned 13,151,630 shares of the Corporation’s common stock. The
stock is traded on the NASDAQ Global Select Market under the symbol “THFF”. On March 8, 2011,
approximately 3,101 shareholders held our common stock.
Historically, the Corporation has paid cash dividends semi-annually and currently expects that
comparable cash dividends will continue to be paid in the future. The following table gives
quarterly high and low trade prices and dividends per share during each quarter for 2010 and
2009.
| 2010 | 2009 | |||||||||||||||||||||||
| Cash | Cash | |||||||||||||||||||||||
| Trade Price | Dividends | Trade Price | Dividends | |||||||||||||||||||||
| Quarter ended | High | Low | Declared | High | Low | Declared | ||||||||||||||||||
March 31 |
$ | 31.02 | $ | 26.00 | $ | 41.16 | $ | 29.76 | ||||||||||||||||
June 30 |
$ | 30.89 | $ | 25.81 | $ | 0.46 | $ | 42.67 | $ | 31.51 | $ | 0.45 | ||||||||||||
September 30 |
$ | 30.42 | $ | 25.31 | $ | 33.52 | $ | 28.57 | ||||||||||||||||
December 31 |
$ | 36.46 | $ | 28.83 | $ | 0.46 | $ | 31.52 | $ | 26.90 | $ | 0.45 | ||||||||||||
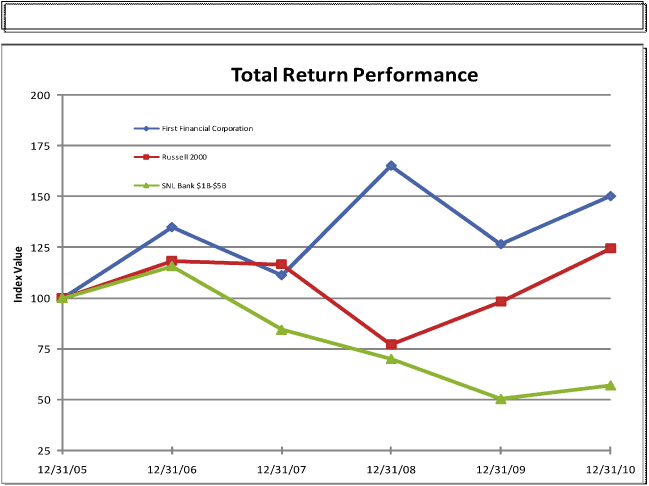
| Period Ending | ||||||||||||||||||||||||
| Index | 12/31/05 | 12/31/06 | 12/31/07 | 12/31/08 | 12/31/09 | 12/31/10 | ||||||||||||||||||
First Financial Corporation |
100.00 | 134.88 | 111.22 | 165.26 | 126.54 | 150.19 | ||||||||||||||||||
Russell 2000 |
100.00 | 118.37 | 116.51 | 77.15 | 98.11 | 124.46 | ||||||||||||||||||
SNL Bank $1B-$5B |
100.00 | 115.72 | 84.29 | 69.91 | 50.11 | 56.81 | ||||||||||||||||||
55