Attached files
| file | filename |
|---|---|
| EX-31.1 - EXHIBIT 31.1 - FBR & Co. | dex311.htm |
| EX-31.2 - EXHIBIT 31.2 - FBR & Co. | dex312.htm |
| EX-32.2 - EXHIBIT 32.2 - FBR & Co. | dex322.htm |
| EX-12.1 - EXHIBIT 12.1 - FBR & Co. | dex121.htm |
| EX-23.1 - EXHIBIT 23.1 - FBR & Co. | dex231.htm |
| EX-21.1 - EXHIBIT 21.1 - FBR & Co. | dex211.htm |
| EX-32.1 - EXHIBIT 32.1 - FBR & Co. | dex321.htm |
Table of Contents
UNITED STATES
SECURITIES AND EXCHANGE COMMISSION
Washington, D.C. 20549
FORM 10-K
(Mark One)
| x | ANNUAL REPORT PURSUANT TO SECTION 13 OR 15(d) OF THE SECURITIES EXCHANGE ACT OF 1934 |
For the fiscal year ended December 31, 2010
OR
| ¨ | TRANSITION REPORT PURSUANT TO SECTION 13 OR 15(d) OF THE SECURITIES EXCHANGE ACT OF 1934 |
For the transition period from to
Commission File Number: 001-33518
FBR CAPITAL MARKETS CORPORATION
(Exact name of registrant as specified in its charter)
| Virginia | 20-5164223 | |
| (State or other jurisdiction of Incorporation or organization) |
(I.R.S. Employer Identification No.) | |
| 1001 Nineteenth Street North, Arlington, VA |
22209 | |
| (Address of principal executive offices) | (Zip Code) | |
(703) 312-9500
(Registrant’s telephone number, including area code)
Securities registered pursuant to section 12(b) of the act:
| Title of Each Class |
Name of Each Exchange on which Registered | |
| Common Stock, Par Value $0.001 | The NASDAQ Stock Market LLC (The NASDAQ Global Select MarketSM) |
Securities registered pursuant to section 12(g) of the act: None
Indicate by check mark if the registrant is a well-known seasoned issuer, as defined in Rule 405 of the Securities Act: Yes ¨ No x
Indicate by check mark if the registrant is not required to file reports pursuant to Section 13 or Section 15(d) of the Act: Yes ¨ No x
Indicate by check mark whether the registrant (1) has filed all reports required to be filed by Section 13 or 15(d) of the Securities Exchange Act of 1934 during the preceding 12 months (or for such shorter period that the registrant was required to file such reports), and (2) has been subject to such filing requirements for the past 90 days: Yes x No ¨
Indicate by check mark whether the registrant has submitted electronically and posted on its corporate Web site, if any, every Interactive Data File required to be submitted and posted pursuant to Rule 405 of Regulation S-T (§232.405 of this chapter) during the preceding 12 months (or for such shorter period that the registrant was required to submit and post such files). Yes ¨ No ¨
Indicate by check mark if disclosure of delinquent filers pursuant to Item 405 of Regulation S-K (§229.405 of this chapter) is not contained herein, and will not be contained, to the best of registrant’s knowledge, in definitive proxy or information statements incorporated by reference in Part III of this Form 10-K or any amendment to this Form 10-K: x
Indicate by check mark whether the registrant is a large accelerated filer, an accelerated filer, a non-accelerated filer, or a smaller reporting company. See definitions of “large accelerated filer,” “accelerated filer” and “smaller reporting company” in Rule 12b-2 of the Exchange Act:
Large Accelerated Filer ¨ Accelerated Filer x Non-Accelerated Filer ¨ Smaller Reporting Company ¨
Indicate by check mark whether the registrant is a shell company (as defined in Rule 12b-2 of the Exchange Act): Yes ¨ No x
The aggregate market value of FBR Capital Markets Corporation’s outstanding common stock held by non-affiliates as of June 30, 2010 was approximately $140.9 million. In determining this figure, the registrant has excluded all shares of common stock beneficially owned by its directors and executive officers and each person who beneficially owns 10% or more of FBR Capital Markets Corporation’s outstanding common stock. By doing so, the registrant does not admit that such persons are affiliates within the meaning of Rule 405 of the Securities Act of 1933, as amended, or for any other purpose.
On February 28, 2011, there were 62,354,677 shares of FBR Capital Markets Corporation common stock outstanding.
DOCUMENTS INCORPORATED BY REFERENCE
| Document |
Where Incorporated | |
| FBR Capital Markets Corporation 2010 Proxy Statement (to be filed with the Securities and Exchange Commission on or before April 30, 2011) |
Part III, Items 10, 11, 12, 13 and 14 |
Table of Contents
| Page | ||||||
| 1 | ||||||
| 2 | ||||||
| PART I |
||||||
| Item 1. |
3 | |||||
| Item 1A. |
11 | |||||
| Item 1B. |
24 | |||||
| Item 2. |
24 | |||||
| Item 3. |
24 | |||||
| Item 4. |
26 | |||||
| PART II |
||||||
| Item 5. |
27 | |||||
| Item 6. |
28 | |||||
| Item 7. |
Management’s Discussion and Analysis of Financial Condition and Results of Operations |
30 | ||||
| Item 7A. |
53 | |||||
| Item 8. |
53 | |||||
| Item 9. |
Changes In and Disagreements with Accountants on Accounting and Financial Disclosure |
53 | ||||
| Item 9A. |
53 | |||||
| Item 9B. |
54 | |||||
| PART III |
||||||
| Item 10. |
55 | |||||
| Item 11. |
55 | |||||
| Item 12. |
Security Ownership of Certain Beneficial Owners and Management and Related Stockholder Matters |
55 | ||||
| Item 13. |
Certain Relationships and Related Transactions, and Director Independence |
55 | ||||
| Item 14. |
55 | |||||
| PART IV |
||||||
| Item 15. |
56 | |||||
| 59 | ||||||
| F-1 | ||||||
Table of Contents
Some of the statements contained in or incorporated by reference in this Form 10-K are forward-looking statements within the meaning of Section 27A of the Securities Act of 1933, as amended (the “Securities Act”), and Section 21E of the Securities Exchange Act of 1934, as amended (the “Exchange Act”). Forward-looking statements are predictive in nature and can be identified by the use of forward-looking words such as “anticipate,” “believe,” “could,” “estimate,” “expect,” “intend,” “may,” “plan,” “goal,” “objective,” “potential,” “project,” “should,” “will” and “would” or the negative of these terms or other comparable terminology. Statements concerning projections, future performance developments, events, revenues, expenses, earnings, run rates, and any other guidance on present or future periods constitute forward-looking statements. Such statements include, but are not limited to, those relating to the effects of growth, our principal investing activities, levels of assets under management and our current equity capital levels. Forward-looking statements involve risks and uncertainties. You should be aware that a number of important factors could cause our actual results to differ materially from those in forward-looking statements. These factors include, but are not limited to:
| • | the risks identified under the section captioned “Risk Factors” in this Form 10-K; |
| • | general volatility of the capital markets and the possibility that an active public trading market for our common stock cannot be sustained; |
| • | deterioration in the business environment in the specific sectors of the economy in which we focus or a decline in the market for securities of companies within these sectors; |
| • | substantial fluctuations in our financial results; |
| • | our ability to retain our senior professionals; |
| • | pricing and other competitive pressures; |
| • | changes in laws and regulations and industry practices that adversely affect our sales and trading business; |
| • | incurrence of losses in the future; |
| • | the singular nature of our capital markets and strategic advisory engagements; |
| • | competition among financial services firms for business and personnel; |
| • | larger and more frequent capital commitments in our trading and underwriting businesses; |
| • | limitations on our access to capital; |
| • | malfunctioning or failure in our operations and infrastructure; |
| • | our entry into new business areas, including entry through strategic investments, acquisitions and joint ventures; |
| • | failure to achieve and maintain effective internal controls; |
| • | declines in the market value of our principal investments; |
| • | the loss of our exemption from registration as an investment company under the Investment Company Act of 1940, as amended (the “1940 Act”); |
| • | the overall environment for interest rates; |
| • | changes in our business strategy; and |
| • | availability, terms and deployment of capital. |
We will not necessarily update the information presented or incorporated by reference in this Form 10-K if any of these forward-looking statements turn out to be inaccurate, and there are no guarantees about our performance. This Form 10-K, including the consolidated financial statements and notes thereto and the documents incorporated by reference, should be read for a complete understanding of our business, an investment in our company and the risks and other uncertainties associated with that business or an investment in our company.
1
Table of Contents
FBR Capital Markets Corporation (“we,” “us,” “our company” or the “Company”) files annual, quarterly and current reports, proxy statements, information statements and other information with the United States Securities and Exchange Commission (the “SEC”). You may read and copy any document we file with the SEC at the SEC’s Public Reference Room at 100 F Street, NE, Washington, DC 20549. You may obtain information on the operation of the Public Reference Room by calling the SEC at 1-800-SEC-0330. The SEC maintains an internet site that contains annual, quarterly and current reports, proxy and information statements and other information regarding issuers that file electronically with the SEC. Our electronic SEC filings are available to the public at http://www.sec.gov.
Our public internet site is http://www.fbr.com. We make available free of charge through our public internet site our annual reports on Form 10-K, quarterly reports on Form 10-Q, current reports on Form 8-K and amendments to those reports filed or furnished pursuant to Section 13(a) or 15(d) of the Exchange Act as soon as reasonably practicable after we electronically file such material with, or furnish it to, the SEC. We also make available through our public internet site statements of beneficial ownership of our equity securities filed by our directors, officers, 10% or greater shareholders and others under Section 16 of the Exchange Act.
We also make available on http://www.fbr.com (i) our Corporate Governance Guidelines, (ii) Statement of Business Principles (our code of business conduct and ethics), including any waivers, if any, therefrom granted to executive officers or directors, and (iii) the charters of the Audit, Compensation, and Nominating and Corporate Governance Committees of our Board of Directors. These documents are also available in print without charge to any person who requests them by writing or telephoning:
FBR Capital Markets Corporation
1001 Nineteenth Street North
Arlington, Virginia 22209
(703) 312-9500
Attention: Corporate Secretary
2
Table of Contents
PART I
| ITEM 1. | BUSINESS |
Overview
FBR Capital Markets Corporation is a full-service investment banking, institutional brokerage and asset management firm with a customer-focused and innovative approach to meeting our clients’ needs. In addition, we make principal investments, including merchant banking investments, with our own capital. We were formed in June 2006, and we completed the initial public offering of our common stock in June 2007. Since the founding of certain predecessor companies, we have grown from a boutique investment bank with primary expertise in financial institutions into a full-service U.S. investment bank for middle-market companies.
Through our principal operating subsidiaries, FBR Capital Markets & Co. (“FBR & Co.”), an SEC-registered broker-dealer, FBR Capital Markets International, Ltd. (“FBRIL”), a broker-dealer registered with the United Kingdom’s Financial Services Authority (“FSA”), and FBR Fund Advisers, Inc. (“FBR Fund Advisers”), an SEC-registered investment adviser, we have focused our business on providing:
| • | capital raising services, including underwriting and placement of public and private equity and debt; |
| • | financial advisory services, including merger and acquisition (“M&A”) advisory, restructuring, liability management, recapitalization and strategic alternative analysis; |
| • | institutional sales and trading services focused on equities, equity-linked securities, listed options, high-yield bonds, senior debt and bank loans; |
| • | research coverage; |
| • | asset management services through a family of mutual funds; and |
| • | principal investment returns to our shareholders through merchant banking and other direct investments that we make utilizing our own capital. |
We focus our capital markets business (investment banking and institutional brokerage) in the following industry sectors—consumer, diversified industrials, energy and natural resources, financial institutions, healthcare, insurance, real estate, and technology, media and telecommunications (“TMT”). We collectively refer to these sectors as our “core sectors.”
Our asset management business manages a family of mutual funds. As of December 31, 2010, we had approximately $1.6 billion in mutual fund assets under management.
We are a Virginia corporation that was initially formed as a consolidated subsidiary of Arlington Asset Investment Corp. (“Arlington Asset”), a separate publicly-traded corporation that invests primarily in mortgage-related assets. In July 2006, Arlington Asset contributed the subsidiaries that had historically conducted its capital markets and asset management business to us and we sold shares of our common stock in a private offering and a concurrent private placement to Crestview Partners (“Crestview”), a New York-based private equity firm. In this Form 10-K, we refer to this private offering and the concurrent private placement to Crestview as our “July 2006 private offering.” Since our July 2006 private offering, we have operated as an independent company with a separate board of directors. We became a publicly-traded company listed on The NASDAQ Global Select MarketSM (NASDAQ: FBCM) in June 2007. In May 2009, we repurchased shares of our common stock from Arlington Asset and, in October 2009, Arlington Asset sold its remaining shares of our common stock in a secondary public offering.
We are headquartered in Arlington, Virginia and also have offices in Boston, Dallas, Houston, Irvine, London, New York and San Francisco. The address of our principal executive offices is 1001 Nineteenth Street North, Arlington, Virginia 22209. Our telephone number is (703) 312-9500.
3
Table of Contents
Business Segments
Our business comprises three separate segments: capital markets, which includes investment banking and institutional brokerage and research; asset management; and principal investing, which includes merchant banking.
Financial information concerning our company for the fiscal years ended December 31, 2010, 2009, and 2008, including the amount of net revenues contributed by each segment in such periods, is set forth in our consolidated financial statements and the notes thereto in Part II, Item 8, of this Form 10-K. Information with respect to our operations by business segment is set forth under the captions “Management’s Discussion and Analysis of Financial Condition and Results of Operations—Executive Overview” in Part II, Item 7, of this Form 10-K and in Note 14 to our consolidated financial statements in Part II, Item 8, of this Form 10-K.
Capital Markets
Our capital markets business is conducted by our investment banking and institutional brokerage professionals through our U.S. and United Kingdom broker-dealer subsidiaries. These professionals provide investment banking services, including capital raising and financial advisory services for our corporate issuer clients, and institutional brokerage services including sales, trading, and research services, to our institutional investor clients. We believe the capital markets transactions sourced by our investment banking professionals create the types of investment opportunities that our institutional brokerage clients seek, while our institutional brokerage clients provide demand for our investment banking clients’ securities issues, thus helping to provide these corporate issuers with the ability to meet their corporate financing needs. Since January 2008, we have reduced our total number of employees and made adjustments to our variable cost structure to better align our overall cost structure with current market conditions, while at the same time adding capabilities in convertible securities sales and trading, loan trading, restructuring and liability management advisory services, and high yield debt and listed options sales and trading.
Investment Banking
Our investment banking professionals, backed by their industry knowledge and our strong distribution platform, seek to establish and maintain relationships with our corporate clients and to provide them with capital raising and financial advisory services. We provide capital raising services in industry specific investment banking teams that operate across our core sectors: consumer, diversified industrials, energy and natural resources, financial institutions, insurance, real estate, healthcare, and TMT. These teams work closely with our equity, equity-linked and debt capital markets personnel in originating and executing capital markets transactions. In addition to our industry specific teams, our financial sponsors investment banking group delivers investment banking products and solutions to the private equity community and their portfolio companies, our M&A investment banking group delivers a broad range financial advisory services to our investment banking clients, and our restructuring finance and advisory group focuses on accessing the debt and equity capital markets to deliver client solutions inside and outside of insolvency proceedings.
As an investment bank with an ability to raise equity in the private capital markets, we are involved with companies early in their formation in order to establish relationships that will provide us with ongoing revenues as these companies’ corporate finance and financial advisory needs grow. We seek to provide our investment banking clients with the financing and advisory services that they will need at all stages of their corporate lifecycle. We have made, and expect to continue making, opportunistic acquisitions to complement our investment banking platform to increase our product offerings and add to the coverage in our core industry groups.
Capital Raising. We have developed a strong market presence, primarily in a book-managing role, as a leading underwriter of equity securities in the United States. We base our decision to underwrite an offering of a client’s securities on company and industry fundamentals, management’s track record, historical financial results, financial projections, and other factors, all backed by extensive due diligence. We offer a wide range of financial
4
Table of Contents
products and services designed to serve the needs of our investment banking clients, including private equity offerings, initial public, follow-on, and secondary offerings of common equity, convertible debt offerings, public and private preferred equity offerings, and high yield debt offerings and bank-loan syndication.
Strategic Advisory Services. Our financial advisory practice builds on our capital markets expertise and focuses on helping our investment banking clients to assess strategic alternatives, including advice on M&A, liability management and financial restructuring, and strategic partnerships. In addition, we provide valuation advice, fairness opinions, market comparable valuation analysis and other corporate finance advice, including advice with respect to dividend policies and evaluations of stock repurchase programs.
Institutional Brokerage and Research
Through our institutional brokerage professionals, we provide research and institutional sales and trading services to institutional investors in North America, Europe and elsewhere. We execute securities transactions for institutional investors such as mutual funds, insurance companies, hedge funds, banks, money managers and pension and profit-sharing plans, and our ability to work on multiple securities classes with clients enhances our overall brokerage relationships with our clients. We currently operate desks that cover the trading of equity securities, convertible securities, high-yield debt securities, loan products and listed options.
Institutional Brokerage. We believe our institutional brokerage professionals are distinguished by their in-depth understanding of the companies and industries in which we focus. Our traders and salespeople are required to develop detailed knowledge and relationships and provide trade execution and sales and trading services to a diverse institutional client base. Many of our institutional clients have been long-standing investors in transactions that our investment banking teams have brought to the capital markets and have continued a close relationship with us as they have grown in size and assets under management.
Our sales professionals work closely with our research analysts and our trading desks to provide the most up-to-date information to our institutional clients. Our sales, trading, and research professionals work together to maintain regular contact with the specialized portfolio managers and buy-side analysts of each institutional client. We make markets in NASDAQ and other securities, we trade listed securities and loan products, and we service the trading desks of major institutions in the United States, Europe and elsewhere.
Research. We understand the importance of research and the role quality research plays in the institutional brokerage process, particularly for accounts that do not maintain a large in-house research team. We seek to differentiate ourselves through originality of perspective, depth of insight, and our ability to uncover industry trends. We believe our unique viewpoint has helped us develop relationships with investor clients in both our primary distribution and secondary trading businesses.
Our research analysts operate under three guiding principles: (i) to provide objective, independent analysis of securities, their issuers, and their place in the capital markets; (ii) to identify attractive investment opportunities in the capital markets; and (iii) to communicate effectively the fundamentals of these investment opportunities to potential investors. To achieve these objectives, we believe that industry specialization is necessary and, as a result, we organize our research staff along industry lines. Each industry team works together to identify and evaluate industry trends and developments. Within industry groups, analysts are further subdivided into specific areas of focus so that they can maintain and apply specific industry knowledge to each investment opportunity they address.
After initiating coverage on a company, our analysts seek to maintain a long-term relationship with that company and a long-term commitment to ensure that new developments are effectively communicated to our sales force and institutional investors. Our research team analyzes major trends, publishes original research on new areas of growth, provides fundamental, company-specific coverage and works with our institutional clients to identify and evaluate public equity investment opportunities.
5
Table of Contents
Asset Management
Our SEC registered investment adviser subsidiaries principally manage a family of mutual funds. We are focused on expanding our asset management business and strive to utilize our intellectual capital, relationships and other resources, to achieve this goal. As of December 31, 2010, we had $1.6 billion in assets under management.
At December 31, 2010, we managed client assets through our ten mutual fund product lines that cover a range of sectors and asset classes. Through strict attention to relative valuation and careful security selection, our actively managed mutual funds strive both to participate in rising markets and preserve capital in down markets.
Principal Investing
Our principal investing activity consists primarily of investments in merchant banking investments, investments in publicly traded companies, and investments in short-term liquid instruments. We have historically made merchant banking investments in selected transactions that our investment banking group underwrites. This strategy involves putting our capital to work alongside the capital of our institutional clients.
Accounting, Administration and Operations
Our accounting, administration and operations personnel are responsible for financial controls, internal and external financial reporting, human resources and personnel services, office operations, information technology and telecommunications systems, the processing of securities transactions, and corporate communications. With the exception of payroll processing, which is performed by an outside service bureau, and customer account processing, which is performed by our clearing brokers, most data processing functions are performed internally. We believe that future growth will require implementation of new and enhanced communications and information systems and training of our personnel to operate such systems.
Compliance, Legal, and Risk Management
Our compliance, legal and risk management personnel (together with other appropriate personnel) are responsible for our compliance procedures with regard to the legal and regulatory requirements of our company and for our procedures with regard to our exposure to market, credit, operations, liquidity, compliance, legal, reputational and equity ownership risk. In addition, compliance personnel test for compliance by our personnel with our policies and procedures. Our legal personnel also provide legal service throughout our company, including advice on managing legal risk. The supervisory personnel in these areas have direct access to, and meet regularly with, our executive management and with the Audit Committee of our Board of Directors to ensure their independence in performing these functions. In addition to our internal compliance, legal, and risk management personnel, we outsource particular functions to outside consultants and attorneys for their particular expertise.
Competition
From 2008-2010, the financial services industry underwent a dramatic reshaping, as several major financial institutions consolidated, were forced to merge, declared bankruptcy, received substantial government assistance or were placed into conservatorship, all of which has resulted in significant upheaval in the competitive environment. These events accelerated a longstanding trend toward consolidation among companies in the financial services industry and created an environment of uncertainty among financial services firms of all sizes. As a full-service investment banking, institutional brokerage and asset management firm, all aspects of our business are intensely competitive. Our competitors are other traditional and online brokerage firms, investment banking firms, merchant banks and financial advisory firms. Some of our competitors have fundamentally changed their respective business models over the past two years, including, in certain cases, becoming
6
Table of Contents
commercial banks, and there has been significant movement of personnel, both among firms as well as out of the industry altogether. We compete with some of our competitors nationally and with others on a regional, product or business line basis. Many of our competitors have substantially greater capital and resources than we do and offer a broader range of financial products and services, and recent developments could result in our remaining competitors gaining even greater capital and other resources. We believe that the principal factors that allow us to compete effectively include the strength and extent of our client relationships, our reputation, the abilities of our professionals, our market focus and the relative quality and price of our services and products.
We have experienced intense price competition in some areas of our capital markets businesses, in particular, discounts in large block trades and trading commissions and spreads. The ability to execute trades electronically, through the Internet and through other alternative trading systems, has increased the pressure on trading commissions and spreads. We believe that this trend toward alternative trading systems will continue. We may experience competitive pressures in these and other areas in the future as some of our competitors seek to increase market share by reducing prices.
In our asset management business, we compete with many of the same firms as we do in the investment banking and brokerage businesses as well as with venture capital firms, large mutual fund companies, commercial banks and smaller niche players, including private hedge funds.
Competition is also intense for the recruitment and retention of qualified professionals. The performance of our business is in a large part dependent on the skills, expertise and performance of our employees. Our ability to continue to compete effectively in our businesses will depend upon our continued ability to attract new professionals and retain and motivate our existing professionals.
Risk Management
In conducting our business, we are exposed to a range of risks including, without limitation:
| • | Market risk. Market risk is the risk that a change in the level of one or more market prices, rates, indices, or other market factors, such as market liquidity, will result in losses for a position or portfolio. |
| • | Credit risk. Credit risk is the risk of loss due to an individual customer’s or institutional counterparty’s unwillingness or inability to pay its obligations. |
| • | Operations risk. Operations risk is the risk of loss resulting from systems failure, inadequate controls, human error, fraud or unforeseen catastrophes. |
| • | Liquidity risk. Liquidity risk is the risk that we may be unable to meet our obligations as they come due because of our inability to liquidate assets or obtain funding. Liquidity risk also includes the risk of having to sell assets at a loss to generate liquid funds. |
| • | Regulatory risk. Regulatory risk is the risk of loss, including fines, penalties or restrictions in our activities, from failing to comply with federal, state or local laws, rules and regulations pertaining to financial services activities. |
| • | Legal risk. Legal risk is the risk of loss, disruption or other negative effect on our operations or condition that arises from unenforceable contracts, lawsuits, adverse judgments, or adverse governmental or regulatory proceedings, or the threat thereof. |
| • | Reputational risk. Reputational risk is the risk that negative publicity regarding our practices, whether true or not, will cause a decline in the customer base, resulting in costly litigation, or reduce our revenues. |
We monitor market and business risk, including credit risk, operations, liquidity, regulatory, legal, and reputational risk through a number of control procedures designed to identify and evaluate the various risks to which our businesses and investments are exposed. We have established various committees to assess and
7
Table of Contents
manage risk associated with our investment banking, merchant banking and other activities. We review, among other things, business and transactional risks associated with investment banking potential clients and engagements. We seek to manage the risks associated with our investment banking and merchant banking activities by review and approval of transactions by the relevant committee, prior to accepting an engagement or pursuing a material investment transaction. Although we believe that our risk management program and our internal controls are appropriately designed to address the risks to which we are exposed, we cannot provide assurance that our risk management program or our internal controls will prevent or reduce such risks.
Insurance
We maintain insurance in types and amounts and with deductibles that management believes are customary for companies of similar size and engaged in similar businesses. However, the insurance market is volatile, and there can be no assurance that any particular coverage will be available in the future on terms acceptable to us.
Employees
As of December 31, 2010, we had 501 employees, in comparison to the 595 employees we had as of December 31, 2009. Our employees are not subject to any collective bargaining agreement and we consider our relationship with our employees to be good.
Regulation
Our business, as well as the financial services industry generally, is subject to extensive regulation in the United States and elsewhere. As a matter of public policy, regulatory bodies in the United States and the rest of the world are charged with safeguarding the integrity of the securities and other financial markets and with protecting the interests of customers participating in those markets. In light of current conditions in the financial markets and the economy, regulators have increased their focus on the regulation of the financial services industry. Proposals for legislation that could substantially intensify the regulation of the financial services industry are expected to be introduced in the U.S. Congress, in state legislatures and around the world. In the U.S., the SEC is the federal agency responsible for the administration of the federal securities laws. FBR & Co. and FBR Investment Services, Inc (“FBRIS”) are registered as broker-dealers with the SEC and the Financial Industry Regulatory Authority, Inc. (“FINRA”), a self-regulatory organization, and in all 50 states, Puerto Rico and the District of Columbia. Accordingly, FBR & Co. and FBRIS are subject to regulation and oversight by the SEC and FINRA, which is itself subject to oversight by the SEC and which adopts and enforces rules governing the conduct, and examines the activities, of its member firms, including FBR & Co. and FBRIS, and their registered representatives. State securities regulators also have regulatory or oversight authority over FBR & Co. and FBRIS. Our business may also be subject to regulation by non-U.S. governmental and regulatory bodies and self-regulatory authorities in other countries where we operate.
FBR Fund Advisers and FBR Investment Management, Inc. (“FBRIM”) are SEC-registered investment advisers. Registered investment advisers are subject to regulations under the Investment Advisers Act of 1940, as amended. Regulations under the Investment Advisers Act of 1940 relate to, among other things, recordkeeping and reporting requirements, disclosure requirements, limitations on agency cross and principal transactions between an adviser and advisory clients, as well as general anti-fraud prohibitions. In addition, certain investment funds that we manage are registered investment companies under the Investment Company Act of 1940, as amended. Those funds and the entities that serve as the funds’ investment advisers are subject to that act and the rules and regulations promulgated by the SEC under that act, which, among other things, regulate the relationship between a registered investment company and its investment adviser and prohibit or severely restrict principal transactions and joint transactions.
8
Table of Contents
Broker-dealers are subject to regulations that cover all aspects of the securities business, including sales methods, trade practices among broker-dealers, use and safekeeping of customers’ funds and securities, capital structure, record-keeping, the financing of customers’ purchases and the conduct and qualifications of directors, officers and employees. In particular, as a registered broker-dealer and member of various self-regulatory organizations, FBR & Co. and FBRIS are subject to the SEC’s uniform net capital rule, Rule 15c3-1. Rule 15c3-1 specifies the minimum level of net capital a broker-dealer must maintain and also requires that a significant part of its assets be kept in relatively liquid form. The SEC and various self-regulatory organizations impose rules that require notification when net capital falls below certain predefined criteria, limit the ratio of subordinated debt to equity in the regulatory capital composition of a broker-dealer and constrain the ability of a broker-dealer to expand its business under certain circumstances. Additionally, the SEC’s uniform net capital rule imposes certain requirements that may have the effect of prohibiting a broker-dealer from distributing or withdrawing capital and requiring prior notice to the SEC for certain withdrawals of capital.
Compliance with regulatory net capital requirements could limit those operations that require the intensive use of capital, such as underwriting and trading activities, and also could restrict our ability to withdraw capital from our affiliated broker-dealers, which in turn could limit our ability to pay dividends, repay debt and redeem or repurchase shares of our outstanding capital stock.
We believe that at all times FBR & Co. and FBRIS have been in compliance in all material respects with the applicable minimum net capital rules of the SEC and FINRA. A failure of a U.S. broker-dealer to maintain its minimum required net capital would require it to cease executing customer transactions until it came back into compliance, and could cause it to lose its FINRA membership, its registration with the SEC or require its liquidation. Further, the decline in any of our broker-dealer subsidiaries’ net capital below certain early warning levels, even though above minimum net capital requirements, could cause material adverse consequences to us and to our broker-dealer subsidiary.
FBR & Co. and FBRIS also are subject to “Risk Assessment Rules” imposed by the SEC which require, among other things, that certain broker-dealers maintain and preserve certain information, describe risk management policies and procedures and report on the financial condition of certain affiliates whose financial and securities activities are reasonably likely to have a material impact on the financial and operational condition of the broker-dealer. Certain “material associated persons” (as defined in the Risk Assessment Rules) of the broker-dealer and the activities conducted by such material associated persons may also be subject to regulation by the SEC. In addition, the possibility exists that, on the basis of the information it obtains under the Risk Assessment Rules, the SEC could seek authority over our unregulated subsidiaries either directly or through its existing authority over our regulated subsidiaries.
The research areas of investment banks have been and remain the subject of increased regulatory scrutiny. In 2002 and 2003, acting in part pursuant to a mandate contained in the Sarbanes-Oxley Act of 2002, the SEC, the NYSE and the NASD (now FINRA) adopted rules imposing heightened restrictions on the interaction between equity research analysts and investment banking personnel at member securities firms. In addition, in 2003 and 2004, several securities firms in the United States reached a settlement with certain federal and state securities regulators and self-regulatory organizations to resolve investigations into their equity research analysts’ alleged conflicts of interest. Under this settlement, the firms have been subject to certain restrictions and undertakings. As part of this settlement, restrictions have been imposed on the interaction between research and investment banking departments, and these securities firms are required to fund the provision of independent research to their customers. In connection with the research settlement, we have also subscribed to a voluntary initiative imposing restrictions on the allocation of shares in initial public offerings to executives and directors of public companies.
The effort to combat money laundering and terrorist financing is a priority in governmental policy with respect to financial institutions. The USA PATRIOT Act of 2001, as amended (the “PATRIOT Act”), contains anti-money laundering and financial transparency laws and mandates the implementation of various new
9
Table of Contents
regulations applicable to broker-dealers and other financial services companies, including standards for verifying client identification at account opening, and obligations to monitor client transactions and report suspicious activities. Through these and other provisions, the PATRIOT Act seeks to promote the identification of parties that may be involved in terrorism or money laundering. Anti-money laundering laws outside the United States contain some similar provisions. The obligation of financial institutions, including us, to identify their customers, watch for and report suspicious transactions, respond to requests for information by regulatory authorities and law enforcement agencies, and share information with other financial institutions, has required the implementation and maintenance of internal practices, procedures and controls which have increased, and may continue to increase, our costs, and any failure with respect to our programs in this area could subject us to serious regulatory consequences, including substantial fines, and potentially other liabilities.
Certain of our businesses are subject to compliance with laws and regulations of U.S. federal and state governments, non-U.S. governments, their respective agencies and/or various self-regulatory organizations or exchanges relating to the privacy of client information, and any failure to comply with these regulations could expose us to liability and/or reputational damage.
Additional legislation, changes in rules promulgated by the SEC and self-regulatory organizations or changes in the interpretation or enforcement of existing laws and rules, either in the United States or elsewhere, may directly affect the mode of our operation and profitability.
Our broker-dealer business is also subject to regulation by various foreign governments and regulatory bodies. FBR & Co. is registered with and subject to regulation by the Ontario Securities Commission in Canada. FBRIL, our United Kingdom brokerage subsidiary, is subject to regulation by FSA in the United Kingdom pursuant to the United Kingdom Financial Services and Markets Act of 2000 (as amended). Foreign regulation may govern all aspects of the investment business, including regulatory capital, sales and trading practices, conflicts of interest, research, use and safekeeping of customer funds and securities, record-keeping, margin practices and procedures, registration standards for individuals, periodic reporting and settlement procedures. The FSA has been pursuing an increased focus on the capital and liquidity strength of regulated firms, and has also expressed its intention to focus on management structures and the culture of supervisory responsibility within firms. It has also set out its views on best practice in the area of position valuation and risk control following a number of mis-marking incidents across the industry.
Many of the investment services that are subject to authorization and regulation by the FSA under the Financial Services and Markets Act of 2000 (as amended) are also subject to certain European Union (“EU”) directives covering, among other things, the organizational requirements and operating conditions for investment firms including customer protection requirements and conduct of business rules. These standards, requirements and rules are similarly implemented, under the same directives, throughout the EU and are broadly comparable in scope and purpose to the customer protection requirements imposed under SEC rules. Where such investment services fall outside the scope of these EU directives, local regulation in each jurisdiction, including those in which we operate, may still apply and in some cases may be more restrictive than the requirements of such directives.
The U.S. and non-U.S. government agencies and self-regulatory organizations, as well as state securities commissions in the United States, are empowered to conduct administrative proceedings that can result in censure, fine, the issuance of cease-and-desist orders or the suspension or expulsion of a broker-dealer or its directors, officers or employees. Occasionally, FBR & Co. has been subject to investigations and proceedings, and sanctions have been imposed for infractions of various regulations relating to its activities.
The Dodd-Frank Wall Street Reform and Consumer Protection Act (Dodd-Frank Act) was enacted on July 21, 2010. Among other things, the legislation expands the authority of our existing regulators; broadens the reporting and regulation of executive compensation; and expand the standards for market participants in dealing with clients and customers. The specific impact of the Dodd-Frank Act on our businesses, our clients and the markets in which we operate will depend on the manner in which the relevant agencies develop and implement the required rules and the reaction of market participants to these regulatory developments over the next several years.
10
Table of Contents
| ITEM 1A. | RISK FACTORS |
You should carefully consider the following risks and all of the other information contained in this Form 10-K, including the consolidated financial statements and the notes thereto included in Part II, Item 8, of this Form 10-K. If any of the risks, uncertainties, events or developments described below occurs, our business, financial condition or results of operation could be negatively impacted. In connection with the forward-looking statements that appear in this Form 10-K, you should also carefully review the cautionary statements included under the caption “Forward-Looking Statements.”
Risks Related to Adverse Market Conditions
Our businesses have been and may in the future be materially and adversely affected by financial market conditions and economic conditions generally.
As an investment bank, risk is an inherent part of our business. Our businesses are materially affected by conditions in the financial markets and economic conditions generally. Although market valuations recovered strongly in 2010, the liquidity seen in the markets prior to 2008 has not yet returned. Lower levels of liquidity continue to have a negative effect on trading volumes, particularly in the equity market, which has a direct negative impact on our cash equities trading business.
Our financial performance is highly dependent on the environment in which our businesses operate. A favorable business environment is generally characterized by, among other factors, high global gross domestic product growth, stable geopolitical conditions, transparent and efficient capital markets, liquid markets with active investors, low inflation, high business and consumer confidence and strong business earnings. Slowing growth, contraction of credit, increasing energy prices, declines in business or investor confidence or risk tolerance, increases in inflation, higher unemployment, outbreaks of hostilities or other geopolitical instability, corporate, political or other scandals that reduce investor confidence in capital markets and natural disasters, among other things, can affect the global financial markets. In addition, economic or political pressures in a country or region may cause local market disruptions and currency devaluations, which may also affect markets generally. In the event of changes in market conditions, such as interest or foreign exchange rates, equity, fixed income, commodity or real estate valuations, liquidity, availability of credit or volatility, our businesses could be adversely affected in many ways.
Our investment banking revenues are directly related to the number and size of the transactions in which we participate. Future market downturns that affect the size and number of capital raising transactions will likely have a similar negative impact on our investment banking business. Sustained market downturns and credit market dislocations and liquidity issues in the future would also likely lead to a decline in the volume of secondary market trading that we execute for our institutional brokerage clients and, therefore, to a decline in the revenues we receive from commissions and spreads earned from the trades we execute for our clients. In addition, because the fees that we charge for managing our mutual fund product lines are based on the value of assets under management, a market downturn that reduces the value of assets under management would reduce the revenues we receive from our asset management business. Heightened risk aversion among investors may cause them to shift their trading activity to higher quality and more liquid products, which are generally somewhat less profitable for us.
Risks Related to Our Business
Our financial results may fluctuate substantially from quarter to quarter.
We have experienced, and expect to experience in the future, significant quarterly variations in our revenues and results of operations. These variations may be attributed in part to the fact that our investment banking revenues are typically earned upon the successful completion of a transaction, the timing of which is uncertain and beyond our control. In most cases, we receive little or no payment for investment banking engagements that do not result in
11
Table of Contents
the successful completion of a transaction. As a result, our business is highly dependent on market conditions as well as the decisions and actions of our clients and interested third parties. For example, a client’s securities offering may be delayed or terminated because of adverse market conditions, failure to obtain necessary regulatory approvals or unexpected financial or other problems in the client’s business. If the parties fail to complete an offering in which we are participating as an underwriter or placement agent, we will earn little or no revenue from the transaction. This risk may be intensified by our focus on early-stage companies in certain sectors, as the market for securities of these companies may experience significant variations in the number and size of equity offerings as well as the after-market trading volume and prices of newly issued securities. More companies initiating the process of an initial public offering are simultaneously exploring M&A exit opportunities. Our investment banking revenues would be adversely affected in the event that an initial public offering for which we are acting as an underwriter is preempted by the company’s sale if we are not engaged as a strategic advisor in such sale. As a result, we are unlikely to achieve steady and predictable earnings on a quarterly basis.
We are dependent on our executive management team, and we may not be able to execute our business plan in the event that members of our executive management team are no longer available to us and we are unable to find suitable replacements for them or the members of our executive management team do not dedicate a sufficient amount of their professional time to our endeavors.
Certain members of our executive management team do not have employment agreements with us. We have no assurance that the services of our executive management team will continue to be available to the full extent of our needs. We believe that our success depends to a significant extent upon the experience of our executive management team, whose continued service is not guaranteed. If certain members of our executive management team leave our company or are otherwise no longer available to us or are not available to the full extent of our needs, we may not be able to replace them with suitable management and may be unable to execute our business plan.
We encounter intense competition for qualified professionals from other investment banking firms and from businesses outside the investment banking industry, such as hedge, private equity and venture capital funds, and our failure to hire qualified professionals and retain our existing professionals may materially impede the success and growth of our business.
Our people are our most valuable resource. Our ability to secure and maintain investment banking engagements depends upon the reputation, judgment, business generation capabilities and project execution skills of our professionals. Our professionals’ reputations and relationships with our clients are a critical element in obtaining and executing client engagements. Generally, we do not have employment or non-competition agreements with any of our professionals. We encounter intense competition for qualified professionals from other companies in the investment banking industry and from businesses outside the investment banking industry, such as hedge, private equity and venture capital funds. We may experience losses of investment banking, brokerage, research and other professionals and our failure to hire qualified professionals and retain our existing professionals may materially impede our success and growth. The departure or other loss of our key professionals who manage substantial client relationships or who possess substantial experience and expertise could impair our ability to secure or successfully complete engagements, which could materially adversely affect our business and results of operations. In addition, if any of our investment bankers or members of our executive management team were to join an existing competitor or form a competing company, some of our clients could choose to use the services of that competitor instead of our services. We may not be able to prevent our investment bankers or the members of our executive management team from resigning to join our competitors or from forming a competing company.
We depend on relatively few industries to generate a significant percentage of our revenue, which may limit our revenues and net income and may adversely affect our operating results.
We are dependent on revenues related to securities issued by companies in specific industry sectors. The diversified industrials, energy and natural resources, and financial institutions sectors account for the majority of
12
Table of Contents
our investment banking, asset management, institutional trading and research activities. Therefore, any downturn in the market for the securities of companies in these industry sectors, or factors affecting such companies, could adversely affect our operating results and financial condition. Additionally, the frequency and size of securities offerings can vary significantly from industry to industry due to economic, legislative, regulatory and political factors.
Underwriting and other capital raising transactions, strategic advisory engagements and related trading activities in our core sectors represent a significant portion of our businesses. This concentration of activity exposes us to the risk of substantial declines in revenues in the event of downturns in our core sectors. Future downturns in our core sectors could result in a decrease in the size or number of transactions we complete, which would reduce our investment banking revenues.
We also derive a significant portion of our revenues from institutional sales and trading transactions related to the securities of companies in these sectors. Our revenues from such institutional sales and trading transactions may decline when underwriting activities in these industry sectors decline, the volume of trading on the NASDAQ, the New York Stock Exchange (“NYSE”) or any other securities market or exchange declines, or when industry sectors or individual companies report results below investors’ expectations.
We have incurred losses in recent periods and may incur losses in the future.
We have incurred losses in recent periods. For the year ended December 31, 2010, we had a net loss of $37.6 million. We may incur losses in future periods. If we are unable to fund future losses, those losses may have a significant effect on our liquidity as well as our ability to operate.
In addition, we may incur significant expenses in connection with any expansion of our capital markets and asset management businesses or in connection with strategic acquisitions and investments. Accordingly, we will need to increase our revenues at a rate greater than our expenses to achieve and maintain profitability. If our revenues do not increase sufficiently, or even if our revenues increase but we are unable to manage our expenses, we will not achieve and maintain profitability in future periods.
Our failure to integrate and develop recently added capital markets capabilities or to expand our asset management business could negatively affect the growth of our business.
Our ability to develop our capital markets business depends upon expanding and enhancing the investment banking services we presently offer. We have recently added capabilities in restructuring, convertible securities sales and trading, bank loan syndication and trading, high yield debt sales and trading and listed options sales and trading. We intend to incur increased costs to support these capabilities. Our failure to successfully integrate these capabilities into our business could have an adverse impact on our business. Furthermore, our failure to develop these capabilities to satisfy anticipated near-term demand in our core sectors may harm our growth prospects.
Our ability to expand our asset management business depends on a variety of factors, including but not limited to our ability to identify traditional and/or alternative asset managers and strategies, within our company and externally, and our ability to deploy capital into investments in this area. We cannot guarantee that we will be able to successfully identify alternative asset managers and strategies or invest our own capital in alternative asset managers or strategies. Our inability to expand our asset management business could harm our growth prospects and could negatively impact the value of our common stock.
Pricing and other competitive pressures may impair the revenues and profitability of our institutional brokerage business.
We derive a significant portion of our revenues from our institutional brokerage business. Along with other firms, we have experienced intense price competition in this business in recent years. In particular, the ability to
13
Table of Contents
execute trades electronically and through alternative trading systems has increased the pressure on trading commissions and spreads. We expect pricing pressures in the business to continue. Decimalization in securities trading, introduced in 2000, has also reduced revenues and lowered margins within the equity sales and trading divisions of many firms, including ours. We believe we may experience competitive pressures in these and other areas in the future as some of our competitors seek to obtain market share by competing on the basis of price or use their own capital to facilitate client trading activities. In addition, we face pressure from our larger competitors, which may be better able to offer a broader range of complementary products and services to clients in order to win their trading business. If we are unable to compete effectively in these areas, the revenues from our sales and trading business may decline, and our business and results of operations may be adversely affected. Our research and institutional brokerage business also may be adversely affected by changes in laws and regulations and industry practices.
Our institutional brokerage revenues may decline due to competition from alternative trading systems.
Securities and futures transactions are now being conducted through the internet and other alternative, non-traditional trading systems, and it appears that the trend toward alternative trading systems will continue and probably accelerate. A dramatic increase in computer-based or other electronic trading may adversely affect our institutional brokerage revenues. The NYSE’s adoption of its hybrid market for trading securities may increase pressure on our institutional brokerage business as customers execute more of their NYSE-related trades electronically. Even if we were to develop our own electronic trading systems, we cannot assure you that the revenues generated by these systems will yield an adequate return on our investment, particularly given the relatively lower commissions arising from electronic trades. As a result, our institutional brokerage revenues could decline in the future, which would negatively impact our cash flows and the value of our common stock.
We face strong competition from larger firms, some of which have greater resources and name recognition, which may impede our ability to grow our business.
The brokerage and investment banking industries are intensely competitive and we expect them to remain so. We compete on the basis of a number of factors, including client relationships, reputation, the abilities of our professionals, market focus and the relative quality and price of our services and products. We have experienced intense price competition in some of our businesses, in particular discounts in large block trades and trading commissions and spreads. In addition, pricing and other competitive pressures in investment banking, including the trends toward increased focus by many larger investment banking companies on institutional equity offerings pursuant to Rule 144A, multiple book runners, co-managers and multiple financial advisors handling transactions, have continued and could adversely affect our revenues, even as the volume and number of investment banking transactions have started to increase. We believe we may experience competitive pressures in these and other areas in the future as some of our competitors seek to obtain market share by competing on the basis of price.
Many of our competitors in the brokerage and investment banking industries have a broader range of products and services, greater financial and marketing resources, larger customer bases, greater name recognition, more senior professionals to serve their clients’ needs, greater global reach and more established relationships with clients than we have. These larger and better capitalized competitors may be better able to respond to changes in the brokerage and investment banking industries, to compete for skilled professionals, to finance acquisitions, to fund internal growth and to compete for market share generally.
The scale of our competitors has increased in recent years as a result of substantial consolidation among companies in the brokerage and investment banking industries. In addition, a number of large commercial banks, insurance companies and other broad-based financial services firms have established or acquired underwriting or financial advisory practices and broker-dealers or have merged with other financial institutions. These firms have the ability to offer a wider range of products than we do, which may enhance their competitive position. They also have the ability to support investment banking with commercial banking, insurance and other financial services in an effort to gain market share, which has resulted, and could further result, in pricing pressure in our
14
Table of Contents
businesses. In particular, the ability to provide financing has become an important advantage for some of our larger competitors and, because we do not provide such financing, we may be unable to compete as effectively for clients in a significant part of the brokerage and investment banking market.
If we are unable to compete effectively with our competitors, our business, financial condition and results of operations will be adversely affected.
Our capital markets and strategic advisory engagements are singular in nature and our failure to obtain new engagements may harm our operating results.
Our investment banking clients generally retain us on a short-term, engagement-by-engagement basis in connection with specific capital markets or M&A transactions, rather than on a recurring basis under long-term contracts. As these transactions are typically singular in nature and our engagements with these clients may not recur, we must continuously seek out new engagements when our current engagements are successfully completed or are terminated. As a result, high activity levels in any period are not necessarily indicative of continued high levels of activity in any subsequent period. If we are unable to generate a substantial number of new engagements that generate fees from the successful completion of transactions, our business and results of operations would likely be adversely affected.
Larger and more frequent capital commitments in our trading and underwriting business increase the potential for us to incur significant losses.
We commit our capital to maintain trading positions in the equity, convertible securities, debt and listed options markets. We may enter into large transactions in which we commit our own capital as part of our client trading activities. The number and size of these large transactions may materially affect our results of operations in a given period. We may also incur significant losses from our trading activities due to market fluctuations and volatility in our results of operations. To the extent that we own assets, i.e., have long positions, in any of those markets, a downturn in the value of those assets or in those markets could result in losses. Conversely, to the extent we have sold assets we do not own, i.e., have short positions, in any of those markets, an upturn in those markets could expose us to potentially large losses as we attempt to cover our short positions by acquiring assets in a rising market.
We use a number of quantitative measures to manage our exposure to market risk, including inventory position limits, scenario analysis, and value at risk, or VaR. VaR is a model that quantifies potential losses using historical data. Because the historical market prices used in our VaR analysis may not be an accurate measure of future market events and conditions, especially in highly stressful market environments, and because our VaR model measures the risk of a current net trading position and does not take into account future position changes arising from transaction and/or hedging activity, we could incur losses that are materially greater than our reported VaR, and our business, financial condition and results of operations could be adversely affected.
Before the recent turmoil in the financial markets, there had been a trend toward larger and more frequent commitments of capital by financial services firms in many of their activities. For example, in order to win business investment banks had increasingly been committing to purchase large blocks of stock from publicly traded issuers or significant shareholders, instead of the more traditional marketed underwriting process, in which marketing is typically completed before an investment bank commits to purchase securities for resale. We may undertake more block trades in the future. As a result, we will be subject to increased risk as we commit greater amounts of capital to facilitate primarily client-driven business and, therefore, may suffer losses even when economic and market conditions are generally favorable for others in the industry.
Limitations on our access to capital could impair our liquidity and our ability to conduct our businesses.
Liquidity, or ready access to funds, is essential to financial services firms. Failures of financial institutions have often been attributable in large part to insufficient liquidity. Liquidity is of particular importance to our
15
Table of Contents
trading business and perceived liquidity issues may affect our clients’ and counterparties’ willingness to engage in brokerage transactions with us. Our liquidity could be impaired due to circumstances that we may be unable to control, such as a general market disruption or an operational problem that affects our trading clients, third parties or us. Further, our ability to sell assets may be impaired if other market participants are seeking to sell similar assets at the same time.
FBR & Co. and FBRIS, which are domestic registered broker-dealers, are subject to the net capital requirements of the SEC and various self-regulatory organizations of which they are members. These requirements typically specify the minimum level of net capital a broker-dealer must maintain and also mandate that a significant part of its assets be kept in relatively liquid form. FBRIL, which is a registered broker-dealer in the United Kingdom, is also subject to the capital requirements of the FSA. Any failure to comply with these net capital requirements could impair our ability to conduct our core business as a brokerage firm.
Furthermore, FBR & Co., FBRIS and FBRIL are subject to laws that authorize regulatory bodies to block or reduce the flow of funds from them to us. As a holding company, we will depend on dividends, distributions and other payments from our subsidiaries to fund our obligations, including debt obligations. As a result, regulatory actions could impede access to funds that we need to make payments on our obligations, including debt obligations.
We are highly dependent on communications, information and other systems and third parties, and any systems failures could significantly disrupt our business.
Our business is highly dependent on communications, information and other systems, including systems provided by our clearing broker and by and for other third parties. Any failure or interruption of our systems, the systems of our clearing broker or third-party trading or information systems could cause delays or other problems in our securities trading activities, which could have a material adverse effect on our operating results and negatively affect the market price of our common stock.
In addition, our clearing broker provides elements of our principal disaster recovery system. We cannot assure you that we or our clearing broker will not suffer any systems failure or interruption, including one caused by a hurricane, earthquake, fire, other natural disaster, power or telecommunications failure, act of God, act of war, terrorist attack, pandemic or other emergency situation, or that our or our clearing broker’s back-up procedures and capabilities in the event of any such failure or interruption will be adequate. The occurrence of any failures or interruptions could significantly harm our business.
Our risk management policies and procedures may leave us exposed to unidentified or unanticipated risk, which could harm our business.
We have devoted significant resources to develop our risk management strategies and techniques and expect to continue to do so in the future. However, our risk management strategies and techniques may not be fully effective in mitigating our risk exposure in all market environments or against all types of risk, including risks that are unidentified or unanticipated.
We are exposed to the risk that third parties that owe us money, securities or other assets will not perform their obligations. These parties may default on their obligations to us due to bankruptcy, lack of liquidity, operational failure, breach of contract or other reasons. We are also subject to the risk that our rights against third parties may not be enforceable in all circumstances. Although we regularly review credit exposures to specific clients and counterparties and to specific industries and regions that we believe may present credit concerns, default risk may arise from events or circumstances that are difficult to detect or foresee. In addition, concerns about, or a default by, one institution could lead to significant liquidity problems, losses or defaults by other institutions, which in turn could adversely affect us. If any of the variety of instruments, processes and strategies we utilize to manage our exposure to various types of risk are not effective, we may incur losses.
16
Table of Contents
Strategic investments or acquisitions and joint ventures may result in additional risks and uncertainties in our business.
We intend to grow our core businesses through both internal expansion and through strategic investments, acquisitions or joint ventures. To the extent we make strategic investments or acquisitions or enter into joint ventures, we face numerous risks and uncertainties combining or integrating the relevant businesses and systems, including the need to combine accounting and data processing systems and management controls and to integrate relationships with customers and business partners. In the case of joint ventures, we are subject to additional risks and uncertainties in that we may be dependent upon, and subject to liability, losses or reputational damage relating to, systems, controls and personnel that are not under our control. In addition, conflicts or disagreements between us and our joint venture partners may negatively impact our businesses.
To the extent that we pursue business opportunities outside the United States, we will be subject to political, economic, legal, operational and other risks that are inherent in operating in a foreign country, including risks of possible nationalization, expropriation, price controls, capital controls, exchange controls and other restrictive governmental actions, as well as the outbreak of hostilities. In many countries, the laws and regulations applicable to the securities and financial services industries are uncertain and evolving, and it may be difficult for us to determine the exact requirements of local laws in every market. Our inability to remain in compliance with local laws in a particular foreign market could have a significant and negative effect not only on our businesses in that market but also on our reputation generally. We are also subject to the enhanced risk that transactions we structure might not be legally enforceable in the relevant jurisdictions.
Our due diligence may not reveal all of a portfolio company’s liabilities and may not reveal other weaknesses in a portfolio company’s business.
Before we make merchant banking investments, we assess the strength and skills of an entity’s management and other factors that we believe will determine the success of the investment. In making the assessment and otherwise conducting customary due diligence, we rely on the resources available to us and, in some cases, an investigation by third parties. This process is particularly important and subjective with respect to newly-organized entities because there may be little or no information publicly available about the company. We cannot assure you that our due diligence processes will uncover all relevant facts or risks about a company in which we make a merchant banking investment, or that any such investment will be successful. Any unsuccessful merchant banking investments may have a material adverse effect on our financial condition and results of operation.
In any potential merchant banking investment, we depend on management and have limited ability to influence management of portfolio companies.
We generally do not control the management, investment decisions or operations of the enterprises in which we make merchant banking investments. Management of those enterprises may decide to change the nature of their assets or business plan, or management may otherwise change in a manner that is not satisfactory to us. We typically have no ability to affect these management decisions, and as noted below, may have only limited ability to dispose of these investments.
We may make merchant banking investments that have limited liquidity, which may reduce the return on those investments to our stockholders.
The equity securities of a new publicly-held or privately-held entity in which we make a merchant banking investment are likely to be restricted as to resale and may otherwise be highly illiquid. We expect that there will be restrictions on our ability to resell the securities of any private or newly-public company that we acquire for a period of at least one year after we acquire those securities. Thereafter, a public market sale may be subject to volume limitations or dependent upon securing a registration statement for a secondary offering of the securities.
17
Table of Contents
The securities of newly-public entities may trade less frequently and in smaller volume than securities of companies that are more widely held and have more established trading patterns. Sales of these securities may cause their values to fluctuate more sharply. Because we have made and expect to make merchant banking investments through an affiliate of FBR & Co., a registered broker-dealer in the U.S., and FBRIL, a registered broker-dealer in the United Kingdom, our ability to invest in companies may be constrained by applicable securities laws and regulations and the rules of FINRA and similar self-regulatory organizations. FBR & Co.’s investment and trading activities are regulated by the SEC, FINRA and other governmental authorities, and FBRIL’s investment and trading activities are regulated by similar regulatory authorities in the United Kingdom, including the FSA. As a result, the rules of the SEC, FINRA, FSA and other governmental authorities and self-regulatory organizations may limit our ability to invest in the securities of companies whose securities are underwritten or privately placed by our broker-dealer affiliates.
Prices of the equity securities of new entities in which we make merchant banking investments may be volatile. We may make merchant banking investments that are significant relative to the portfolio company’s overall capitalization, and resales of significant amounts of these securities might adversely affect the market and the sales price for the securities.
The disposition value of our merchant banking investments is dependent upon general and specific market conditions which could result in a decline of the value of these investments.
Even if we make an appropriate investment decision based on the intrinsic value of an enterprise, we cannot assure you that the market value of the investment will not decline, perhaps materially, as a result of general market conditions. For example, an increase in interest rates, a general decline in the stock markets, or other market conditions adverse to companies of the type in which we invest could result in a decline in the value of our investments.
Our capital markets business is dependent on cash inflows to the mutual fund industry and other pooled investment vehicles, which could result in our experiencing operating losses if cash flows slow.
A slowdown or reversal of cash inflows to the mutual fund industry and other pooled investment vehicles could lead to lower capital markets revenues for us since mutual funds and other pooled investment vehicles purchase a significant portion of the securities offered in public offerings underwritten by our broker-dealer subsidiaries and subsequently traded in the secondary markets. Demand for new equity offerings has been driven in part by institutional investors, particularly large mutual funds and hedge funds, seeking to invest on behalf of their investors. The public may redeem mutual funds as a result of a decline in the market generally or as a result of a decline in mutual fund net asset values. To the extent that a decline in cash inflows into mutual funds reduces demand by fund managers for initial public or secondary offerings, our capital markets business and results of operations could be materially adversely affected. Moreover, a slowdown in investment activity by mutual funds may have an adverse effect on the securities markets generally.
Declines in the market values of our investments may adversely affect periodic reported results and credit availability, which may reduce earnings.
We make merchant banking and principal investments that are classified for accounting purposes as “available-for-sale.” Changes in the market values of those assets will be directly charged or credited to stockholders’ equity. As a result, a further decline in market value of our investment securities may further reduce the book value of our assets. Moreover, if the decline in value of an available-for-sale security is other-than-temporary, such decline will reduce earnings, as will a decline in the value of securities not classified as available-for-sale for accounting purposes.
A decline in the market value of our assets may adversely affect us particularly in instances where we have borrowed money based on the market value of those assets. If the market value of those assets declines, the
18
Table of Contents
lender may require us to post additional collateral to support the loan. If we were unable to post the additional collateral, we would have to sell the assets at a time when we might not otherwise choose to do so. A reduction in credit available may reduce our earnings.
Changes in interest rates could negatively affect the value of investments we make with our excess capital, which could result in reduced earnings or losses.
We invest our excess capital from time to time in highly liquid investments. Investments that are sensitive to interest rate fluctuations will decline in value if long-term interest rates increase. Declines in market value may ultimately reduce earnings or result in losses to us.
In addition, changes in interest rates may impact some of our merchant banking and/or principal equity investments in companies whose business models are sensitive to interest rates.
If we become subject to the registration requirements of the 1940 Act as a result of our principal investing activities, our ability to operate our business as contemplated would be impaired, our operating results would be adversely affected.
The 1940 Act and the rules thereunder contain detailed parameters for the organization and operations of investment companies. Among other things, the 1940 Act and the rules thereunder limit or prohibit transactions with affiliates, impose limitations on the issuance of debt and equity securities, prohibit the issuance of stock options, and impose certain governance requirements. We intend to conduct our operations so that we will not be deemed to be an investment company under 1940 Act. However, if anything were to happen which would cause us to be deemed to be an investment company under the 1940 Act, requirements imposed by the 1940 Act, including limitations on our capital structure, ability to transact business with affiliates and ability to compensate key employees, could make it impractical for us to continue our business as currently conducted, impair the agreements and arrangements between and among us and our subsidiary, FBR & Co., and materially adversely affect our business, financial condition and results of operations.
We are a holding company and are dependent on our subsidiaries for funds.
Since we are a holding company, our cash flow and consequent ability to pay dividends and satisfy our obligations under securities we issue are dependent upon the earnings of our subsidiaries and the distribution of those earnings as dividends or loans or other payments by those subsidiaries to us. Our broker-dealer subsidiaries are subject to various capital adequacy requirements promulgated by the regulatory and other authorities of the countries in which they operate. These regulatory rules may restrict our ability to withdraw capital from our subsidiaries by dividends, loans or other payments. Additionally, our ability to participate as an equity holder in any distribution of assets of any subsidiary upon liquidation is generally subordinate to the claims of creditors of the subsidiary.
Our exposure to legal liability is significant, and damages that we may be required to pay and the reputational harm that could result from legal action against us could materially adversely affect our businesses.
We face significant legal risks in our businesses and, in recent years, the volume of claims and amount of damages sought in litigation and regulatory proceedings against financial institutions have been increasing. These risks include potential liability under securities or other laws for materially false or misleading statements made in connection with securities offerings and other transactions, potential liability for “fairness opinions” and other advice we provide to participants in strategic transactions and disputes over the terms and conditions of complex trading arrangements. We are also subject to claims arising from disputes with employees for alleged discrimination or harassment, among other things.
19
Table of Contents
As a brokerage and investment banking firm, we depend to a large extent on our reputation for integrity and high-caliber professional services to attract and retain clients. As a result, if a client is not satisfied with our services, it may be more damaging in our business than in other businesses. Moreover, our role as advisor to our clients on important underwriting or M&A transactions involves complex analysis and the exercise of professional judgment, including rendering “fairness opinions” in connection with mergers and other transactions. Therefore, our activities may subject us to the risk of significant legal liabilities to our clients and aggrieved third parties, including stockholders of our clients who could bring securities class actions against us. Our investment banking engagements typically include broad indemnities from our clients and provisions to limit our exposure to legal claims relating to our services, but these provisions may not protect us or may not be enforceable in all cases. Furthermore, there is no assurance that an investment banking client will be able to satisfy its indemnity or contribution obligations when due. As a result, we may incur significant legal and other expenses in defending against litigation and may be required to pay substantial damages for settlements and adverse judgments. Substantial legal liability or significant regulatory action against us could have a material adverse effect on our results of operations or cause us significant reputational harm, which could seriously harm our business and prospects.
FBR & Co. has been named as a defendant in a small number of securities claims involving investment banking clients of FBR & Co. as a result of FBR & Co.’s role as an underwriter. While these cases are at a preliminary stage, based on management’s review with counsel and present information currently known by management, resolution of these matters is not expected to have a material adverse effect on our financial condition, results of operations or liquidity, although the outcome of these matters could be material to our operating results and cash flows for a particular future period, depending on, among other things, the level of our revenues or income for such period. These cases include the following:
In May 2008, the lead plaintiff in a previously filed and consolidated action filed an amended consolidated class action complaint that, for the first time, named Friedman, Billings, Ramsey & Co., Inc. (now FBR & Co.) and eight other underwriters as defendants. The lawsuit, styled In Re Thornburg Mortgage, Inc. Securities Litigation and pending in the United States District Court for the District of New Mexico, was originally filed in August 2007 against Thornburg Mortgage, Inc. (“TMI”), and certain of its officers and directors, alleging material misrepresentations and omissions about, inter alia, the financial position of TMI. The amended complaint now includes claims under Sections 11 and 12 of the Securities Act against nine underwriters relating to five separate offerings (May 2007, June 2007, September 2007 and two offerings in January 2008). The allegations against FBR & Co. relate only to its role as underwriter or member of the syndicate that underwrote TMI’s total of three offerings in September 2007 and January 2008—each of which occurred after the filing of the original complaint—with an aggregate offering price of approximately $818 million. The plaintiffs seek restitution, unspecified compensatory damages and reimbursement of certain costs and expenses. Although FBR & Co. is contractually entitled to be indemnified by TMI in connection with this lawsuit, TMI filed for bankruptcy on May 1, 2009 and this likely will decrease or eliminate the value of the indemnity that FBR & Co. receives from TMI. On September 22, 2008, FBR & Co. filed a motion to dismiss the consolidated class action complaint as to FBR & Co. The District Court granted that motion on January 27, 2010. Plaintiffs were granted leave by the District court to file a motion for leave to amend the complaint and a motion for reconsideration of the Court’s order dismissing the amended complaint. FBR & Co. opposed those motions; briefing is complete and the motions were argued on November 3, 2010. The District Court’s decision is still pending.
FBR & Co. has been named as a defendant in a case relating to its role as an underwriter in residential mortgage-backed securities (“RMBS”) offerings. FBR & Co. is among dozens of underwriter, securitization trust and depositor defendants in an individual action filed by Cambridge Place Investment Management, Inc. in Massachusetts state court (Cambridge Place Investment Management Inc. v. Morgan Stanley et al). Cambridge’s complaint relates to the more than $2.4 billion in RMBS purchases it made in numerous underwritten offerings (of which the claims concerning FBR & Co. are limited to Cambridge’s purchases of a combined $22 million of RMBS in two separate offerings) and alleges that each of the defendants made misrepresentations and omissions relating to, among other things, loan-to-value ratios, appraisals, and underwriting standards, in violation of state
20
Table of Contents
securities laws. FBR & Co. has contractual indemnification claims against the RMBS issuers and contribution claims against co-underwriters involved in the two offerings for which claims have been made against it.
Because we intend to actively defend such litigation, significant legal expenses could be incurred. While it is not possible to predict the outcome of litigation, management believes that there are meritorious defenses to the claims asserted and that this action should not have a material adverse effect on our consolidated financial position, results of operations or cash flows. However, an adverse resolution of this litigation could materially affect our financial condition, operating results and liquidity.
Our ability to use net capital loss carryovers to reduce our taxable income may be limited.
On October 22, 2009, as a result of the sale by Arlington Asset of all of the remaining shares of our common stock then beneficially owned by it, we had an “ownership change” as defined in Internal Revenue Code section 382. Section 382 limits tax deductions for net operating losses (“NOL”), net capital losses (“NCL”) and net unrealized built-in losses after there is a substantial change in ownership in a corporation’s stock involving a 50 percentage point increase in ownership by 5% or larger stockholders over the relevant testing period.
Under the provisions of Section 13 of the Worker, Homeownership, and Business Act of 2009, enacted on November 6, 2009, we elected to use a five year carryback period for the domestic federal NOL incurred in 2008. As a result, we do not have any domestic federal NOL carryover that would be subject to limitations of section 382. As of the end of 2010, we had NCL carryovers and certain built-in losses that would be subject to an annual section 382 limitation.
The Section 382 limitation is equal to the fair market value of our stock immediately prior to the ownership change multiplied by the long-term tax-exempt rate applicable to the calendar month of the ownership change. In general, the “long-term tax-exempt rate” is a rate determined monthly by the Internal Revenue Service that approximates the yield on a tax-exempt bond that would be equivalent to the market yield on long-term U.S. Treasury securities. The long-term tax-exempt rate for an ownership change occurring in October 2009 was 4.48%. Any NCLs that exceed the Section 382 limitation in any year will continue to be allowed as carryforwards for the remainder of the carryforward period and such losses can be used to offset taxable income for years within the carryforward period subject to the Section 382 limitation (and other applicable limitations) in each year. However, if the carryforward period for any NCL were to expire before that loss had been fully utilized, the unused portion of that loss would be lost. The carryforward period for NCLs is five years from the year in which the losses giving rise to the NCL were incurred. Our use of new NOLs or NCLs arising after the date of the ownership change would not be affected by the Section 382 limitation, unless another ownership change were to occur after those new losses arose.
Risks Related to Use of Estimates and Valuations
We make various estimates that affect reported amounts and disclosures.
We make various estimates that affect reported amounts and disclosures. Broadly, those estimates are used in measuring fair value of certain financial instruments, accounting for identifiable intangible assets, establishing provisions for potential losses that may arise from litigation, regulatory proceedings and tax examinations, assessing our ability to realize deferred taxes and valuing equity-based compensation awards. Estimates are based on available information and judgment. Therefore, actual results could differ from our estimates and that difference could have a material effect on our consolidated financial statements.
See Part II, Item 7, “Management’s Discussion and Analysis of Financial Condition and Results of Operations—Critical Accounting Policies and Estimates” and Note 2 to our consolidated financial statements in Part II, Item 8, of this Form 10-K for additional information concerning our use of estimates and valuation methodologies.
21
Table of Contents
Risks Related to Our Relationship with Crestview
Pursuant to the Amended and Restated Voting Agreement (as defined below) among Arlington Asset, FBR TRS Holdings, Crestview and us, Crestview has the right to designate two representatives to serve on our board of directors and therefore has the ability to influence any action taken or recommended by our board of directors. If the interests of Crestview are in conflict with the interests of our other stockholders, Crestview’s ability to influence our board of directors could result in a conflict of interest for members of our board.
In connection with the Repurchase Agreement, we entered into the Amended and Restated Voting Agreement with Arlington Asset, FBR TRS Holdings and Crestview (the “Amended and Restated Voting Agreement”) that provides Crestview, among other things, with the right to designate two representatives for election to our board of directors. Subject to certain conditions, Crestview also has the right to designate one representative to serve on each of the committees of our board of directors, to the extent permitted by law and the applicable regulations of the NASDAQ Global Select Market (or, if not so permitted, such designee(s) will have certain observation rights). Accordingly, Crestview may have the ability to influence any action taken or recommended by our board of directors. If the interests of Crestview are in conflict with the interests of our other stockholders, the ability of Crestview to influence our board of directors could result in a conflict of interest for members of our board.
Crestview has certain registration rights with respect to the shares of our common stock owned by it and the exercise of these rights could affect the trading market for our common stock.
As of December 31, 2010, Crestview, directly and indirectly, beneficially owned approximately 17% of the outstanding shares of our common stock, including stock options issued to them. We entered into a registration rights agreement with Crestview, dated as of July 20, 2006, with respect to the shares of our common stock beneficially owned by Crestview. The registration rights agreement contains certain demand and piggyback registration rights.
If Crestview exercises its registration rights with respect to some or all of its shares of our common stock, this could have an adverse effect on the market price of our common stock. Crestview could sell its stake in us to one or more third parties that may not be favorable to our stockholders. In addition, the existence of these rights may make it more difficult to effect a business combination or increase the cost of a target business in the event that we are unable to complete a business combination solely with cash, as the stockholders of a particular target business may be discouraged from entering into a business combination with us or will request a higher price for their securities as a result of these registration rights and the potential future effect their exercise may have on the trading market for our common stock.
We may not be successful in capturing the benefit of our ongoing strategic advisory relationship with an affiliate of Crestview which may impede our growth and negatively impact our operating results.
We have agreed, subject to the modification described below, to pay Crestview Advisors, L.L.C., an affiliate of Crestview, a $1.0 million annual strategic advisory fee and reimburse Crestview Advisors, L.L.C. for reasonable out-of-pocket expenses in exchange for ongoing strategic advice and assistance. This fee is payable for as long as Crestview beneficially owns at least 50% of the shares of our common stock that the Crestview affiliates purchased in our 2006 private offering. In September 2008, we granted Crestview Advisors, L.L.C. options to purchase 502,268 shares of our common stock at a price of $5.30 per share in lieu of cash payments for the strategic advisory fee for the period from October 1, 2008 through December 31, 2009. In June 2010, the Company and Crestview agreed to amend the professional services agreement to allow Crestview the ability to elect to receive a portion of their fee in restricted stock and/or options to purchase shares of the Company’s common stock. Based on Crestview’s election, in June 2010, the Company issued 153,846 such options to Crestview Advisors, L.L.C. valued at $0.2 million. The remaining $0.8 million of the 2010 strategic advisory fee will be payable in cash. Crestview Advisors, L.L.C. is not required to provide specified services to us or our affiliates, and we cannot assure you that this agreement will result in increased opportunities for any of our
22
Table of Contents
businesses or in the establishment of new relationships with potential clients or investors. To the extent that we do not capture the anticipated benefit of these services, our payment obligations under this agreement may impede our growth and negatively impact our operating results.
Risks Related to Our Industry
Significantly expanded corporate governance and public disclosure requirements may result in fewer initial public offerings and distract existing public companies from engaging in capital market transactions which may reduce the number of investment banking opportunities available to pursue.
Highly-publicized financial scandals in recent years have led to investor concerns over the integrity of the U.S. financial markets, and have prompted the United States Congress, the SEC, the NYSE and NASDAQ to significantly expand corporate governance and public disclosure requirements. To the extent that private companies, in order to avoid becoming subject to these new requirements, decide to forgo initial public offerings, our equity underwriting business may be adversely affected. In addition, provisions of the Sarbanes-Oxley Act of 2002 and the corporate governance rules imposed by self-regulatory organizations have diverted many companies’ attention away from capital market transactions, including securities offerings and acquisition and disposition transactions. In particular, companies that are or are planning to be public are incurring significant expenses in complying with the SEC and accounting standards relating to internal control over financial reporting, and companies that disclose material weaknesses in such controls under the new standards may have greater difficulty accessing the capital markets. These factors, in addition to adopted or proposed accounting and disclosure changes, may have an adverse effect on our business.
Financial services firms have been subject to increased scrutiny over the last several years, increasing the risk of financial liability and reputational harm resulting from adverse regulatory actions.
As a participant in the financial services industry, we are subject to extensive regulation under federal and state laws in the U.S. and under the laws of other countries in which we do business. We are also regulated by a number of self-regulatory organizations. The industry has experienced increased scrutiny from a variety of regulators, including the SEC, NYSE, FINRA, FSA and state attorneys general. Penalties and fines sought by regulatory authorities have increased substantially over the last several years. This regulatory and enforcement environment has created uncertainty with respect to a number of transactions that had historically been entered into by financial services firms and that were generally believed to be permissible and appropriate. We may be adversely affected by changes in the interpretation or enforcement of existing laws and rules by these governmental authorities and self-regulatory organizations. The specific impact of the Dodd-Frank Act on our businesses, our clients and the markets in which we operate will depend on the manner in which the relevant agencies develop and implement the required rules and the reaction of market participants to these regulatory developments over the next several years. We also may be adversely affected as a result of new or revised legislation or regulations imposed by the SEC, other United States or foreign governmental regulatory authorities or self-regulatory organizations that supervise the financial markets, including FINRA. Among other things, we could be fined, prohibited from engaging in some of our business activities or subject to limitations or conditions on our business activities. Substantial legal liability or significant regulatory action against us could have material adverse financial effects or cause significant reputational harm to us, which could seriously harm our business prospects.
In addition, financial services firms are subject to numerous conflicts of interests or perceived conflicts. The SEC and other federal and state regulators have increased their scrutiny of potential conflicts of interest. We have adopted various policies, controls and procedures to address or limit actual or perceived conflicts and regularly seek to review and update our policies, controls and procedures. However, appropriately dealing with conflicts of interest is complex and difficult and our reputation could be damaged if we fail, or appear to fail, to deal appropriately with conflicts of interest. Our policies and procedures to address or limit actual or perceived
23
Table of Contents
conflicts may also result in increased costs, additional operational personnel and increased regulatory risk. Failure to adhere to these policies and procedures may result in regulatory sanctions or client litigation. For example, the research areas of investment banks have been and remain the subject of heightened regulatory scrutiny which has led to increased restrictions on the interaction between equity research analysts and investment banking personnel at securities firms.
Employee misconduct could harm us and is difficult to detect and deter.
Our reputation is critical in maintaining our relationship with clients, investors, regulators and the general public and is a key focus in our risk management efforts. In recent years, there have been a number of highly publicized cases involving fraud, conflicts of interest or other misconduct by employees in the financial services industry, and we run the risk that employee misconduct could occur at our company. For example, misconduct by employees could involve the improper use or disclosure of confidential information, which could result in regulatory sanctions and serious reputational or financial harm. Misconduct by employees could include binding us to transactions that exceed authorized limits or present unacceptable risks, or hiding from us unauthorized or unsuccessful activities, which, in either case, may result in unknown and unmanaged risks or losses. Employee misconduct could also involve the improper use or disclosure of confidential information, which could result in regulatory sanctions and serious reputational or financial harm. It is not always possible to deter employee misconduct, and the precautions we take to detect and prevent this activity may not be effective in all cases. As a result, we could suffer significant reputational harm for any misconduct by our employee. In addition, in certain circumstances our reputation could be damaged by activities of our clients or of hedge funds or other entities in which we invest, over which we have little or no control.
| ITEM 1B. | UNRESOLVED STAFF COMMENTS |
None.
| ITEM 2. | PROPERTIES |
Our principal executive offices are located at Potomac Tower, 1001 Nineteenth Street North, Arlington, Virginia 22209. We carry out all aspects of our operations related to our capital markets, asset management and principal investing segments at that location. We lease with our affiliates six floors of our headquarters building in Arlington, Virginia. We also lease office space with our affiliates in the following locations where we conduct certain portions of our operations as indicated: Boston, Massachusetts (capital markets and asset management); Dallas, Texas (capital markets); Houston, Texas (capital markets); Irvine, California (capital markets); New York, New York (capital markets); San Francisco, California (capital markets); and London, England (capital markets). We believe that the present facilities, together with current options to extend lease terms and occupy additional space, are adequate for our current and presently projected needs.
| ITEM 3. | LEGAL PROCEEDINGS |
Many aspects of the Company’s business involve substantial risks of liability and litigation. Underwriters, broker-dealers and investment advisers are exposed to liability under Federal and state securities laws, other Federal and state laws and court decisions, including decisions with respect to underwriters’ liability and limitations on indemnification, as well as with respect to the handling of customer accounts. For example, underwriters may be held liable for material misstatements or omissions of fact in a prospectus used in connection with the securities being offered and broker-dealers may be held liable for statements made by their securities analysts or other personnel. FBR & Co. has been named as a defendant in a small number of securities claims involving investment banking clients of FBR & Co. as a result of FBR & Co.’s role as an underwriter. In these cases, the underwriting agreement provides, subject to certain conditions, that the investment banking client is required to indemnify FBR & Co. against certain claims or liabilities, including claims or liabilities under the Securities Act of 1933, as amended (the “Securities Act”), or contribute to payments which FBR & Co. is
24
Table of Contents
required to make as a result of the litigation. There can be no assurance that such indemnification or contribution will ultimately be available to the Company or that an investment banking client will be able to satisfy its indemnity or contribution obligations when due.
Except as described below, the Company was neither a defendant nor plaintiff in any lawsuits or arbitrations nor involved in any governmental or self-regulatory organization matters that are expected to have a material adverse effect on its financial condition, results of operations or liquidity. The Company has been named as a defendant in a small number of civil lawsuits and arbitrations relating to its various businesses. In addition, the Company is subject to various reviews, examinations, investigations and other inquiries by governmental agencies and self regulatory organizations. There can be no assurance that these matters individually or in aggregate will not have a material adverse effect on the Company’s financial condition or results of operations in a future period. However, based on management’s review with counsel, resolution of these matters is not expected to have a material adverse effect on the Company’s financial condition, results of operations or liquidity.
In May 2008, the lead plaintiff in a previously filed and consolidated action filed an amended consolidated class action complaint that, for the first time, named Friedman, Billings, Ramsey & Co., Inc. (now FBR & Co.) and eight other underwriters as defendants. The lawsuit, styled In Re Thornburg Mortgage, Inc. Securities Litigation and pending in the United States District Court for the District of New Mexico, was originally filed in August 2007 against Thornburg Mortgage, Inc. (“TMI”), and certain of its officers and directors, alleging material misrepresentations and omissions about, inter alia, the financial position of TMI. The amended complaint now includes claims under Sections 11 and 12 of the Securities Act against nine underwriters relating to five separate offerings (May 2007, June 2007, September 2007 and two offerings in January 2008). The allegations against FBR & Co. relate only to its role as underwriter or member of the syndicate that underwrote TMI’s total of three offerings in September 2007 and January 2008—each of which occurred after the filing of the original complaint—with an aggregate offering price of approximately $818,000. The plaintiffs seek restitution, unspecified compensatory damages and reimbursement of certain costs and expenses. Although FBR & Co. is contractually entitled to be indemnified by TMI in connection with this lawsuit, TMI filed for bankruptcy on May 1, 2009 and this likely will decrease or eliminate the value of the indemnity that FBR & Co. receives from TMI. On September 22, 2008, FBR & Co. filed a motion to dismiss the consolidated class action complaint as to FBR & Co. The District Court granted that motion on January 27, 2010. Plaintiffs were granted leave by the District court to file a motion for leave to amend the complaint and a motion for reconsideration of the Court’s order dismissing the amended complaint. FBR & Co. opposed those motions; briefing is complete and the motions were argued on November 3, 2010. The District Court’s decision is still pending.
FBR & Co. has been named as a defendant in a case relating to its role as an underwriter in residential mortgage-backed securities (“RMBS”) offerings. FBR & Co. is among dozens of underwriter, securitization trust and depositor defendants in an individual action filed by Cambridge Place Investment Management, Inc. in Massachusetts state court (Cambridge Place Investment Management Inc. v. Morgan Stanley et al). Cambridge’s complaint relates to the more than $2.4 billion in RMBS purchases it made in numerous underwritten offerings (of which the claims concerning FBR & Co. are limited to Cambridge’s purchases of a combined $22 million of RMBS in two separate offerings) and alleges that each of the defendants made misrepresentations and omissions relating to, among other things, loan-to-value ratios, appraisals, and underwriting standards, in violation of state securities laws. FBR & Co. has contractual indemnification claims against the RMBS issuers and contribution claims against co-underwriters involved in the two offerings for which claims have been made against it.
Although these cases involving FBR & Co. are at a preliminary stage, based on management’s review with counsel and present information currently known by management, resolution of such matters is not expected to have a material effect on the Company’s financial condition, results of operations, or liquidity.
In certain circumstances, broker-dealers and asset managers may also be held liable by customers and clients for losses sustained on investments. In recent years, there has been an increasing incidence of litigation and actions by government agencies and self regulatory organizations involving the securities industry, including
25
Table of Contents
class actions that seek substantial damages. The Company is also subject to the risk of litigation, including litigation that may be without merit. As the Company intends to actively defend such litigation, significant legal expenses could be incurred. An adverse resolution of any future litigation against the Company could materially affect its financial condition, operating results and liquidity.
| ITEM 4. | Reserved |
26
Table of Contents
PART II
| ITEM 5. | MARKET FOR REGISTRANT’S COMMON EQUITY, RELATED STOCKHOLDER MATTERS AND ISSUER PURCHASES OF EQUITY SECURITIES. |
Price Range of Common Stock
Our common stock has been listed on The NASDAQ Global Select MarketSM under the symbol “FBCM” since our initial public offering on June 7, 2007 and traded on this exchange since June 8, 2007. As of February 28, 2011, there were 62,354,677 shares of our common stock outstanding and approximately 33 holders of record. The table below shows the high and low sales prices for our common stock on The NASDAQ Global Select MarketSM for the periods indicated.
| Price Range of Common Stock |
||||||||
| High | Low | |||||||
| Year Ended December 31, 2010: |
||||||||
| Fourth Quarter |
$ | 4.10 | $ | 3.14 | ||||
| Third Quarter |
3.76 | 3.13 | ||||||
| Second Quarter |
4.80 | 3.33 | ||||||
| First Quarter |
6.65 | 4.43 | ||||||
| Price Range of Common Stock |
||||||||
| High | Low | |||||||
| Year Ended December 31, 2009: |
||||||||
| Fourth Quarter |
$ | 7.26 | $ | 5.60 | ||||
| Third Quarter |
6.10 | 4.60 | ||||||
| Second Quarter |
6.40 | 3.19 | ||||||
| First Quarter |
5.15 | 1.98 | ||||||
Dividends
Our board of directors has not authorized and we have not declared or paid any cash dividends on our common stock. We do not anticipate that we will pay any cash dividends on our common stock in the foreseeable future as we currently intend to retain all available funds and any future earnings to fund the development and growth of our business and, where appropriate, repurchase shares.
Share Repurchases
The following table provides information on the Company’s share repurchases during the fourth quarter of 2010:
| Total Number of Shares Purchased |
Average Price Paid per Share |
Total Number of Shares Purchased as Part of Publicly Announced Plans or Programs(1) |
Maximum Number of Shares that May Yet Be Purchased Under the Plans or Programs |
|||||||||||||
| October 1 to October 31, 2010 |
— | $ | — | — | 5,650,500 | |||||||||||
| November 1 to November 30, 2010 |
73,689 | 3.70 | 73,689 | 5,576,811 | ||||||||||||
| December 1 to December 31, 2010 |
355,300 | 3.82 | 355,300 | 5,221,511 | ||||||||||||
| Total |
428,989 | $ | 3.80 | 428,989 | 5,221,511 | |||||||||||
| (1) | On July 27, 2010, the Board of Directors of the Company approved a 5,000,000 share increase to the number shares of common stock that the Company is authorized to repurchase. This directive increased the total number of shares authorized to repurchase to 5,650,500 shares of which 5,221,511 remains as authorized to be repurchased. |
27
Table of Contents
| ITEM 6. | SELECTED FINANCIAL DATA |
| Year Ended December 31, | ||||||||||||||||||||
| 2010 | 2009 | 2008 | 2007 | 2006 | ||||||||||||||||
| Consolidated Statements of Operations (dollars in thousands, except per share amounts): |
||||||||||||||||||||
| Revenues: |
||||||||||||||||||||
| Investment banking: |
||||||||||||||||||||
| Capital raising |
$ | 98,768 | $ | 121,007 | $ | 76,377 | $ | 289,545 | $ | 190,576 | ||||||||||
| Advisory |
19,505 | 17,716 | 20,573 | 34,063 | 24,148 | |||||||||||||||
| Institutional brokerage: |
||||||||||||||||||||
| Principal transactions |
22,227 | 40,271 | 20,261 | 10,152 | 5,814 | |||||||||||||||
| Agency commissions |
77,864 | 92,864 | 118,314 | 104,633 | 100,855 | |||||||||||||||
| Mortgage trading interest income |
— | — | — | — | 51,148 | |||||||||||||||
| Mortgage trading net investment loss |
— | — | — | — | (3,298 | ) | ||||||||||||||
| Asset management fees |
14,097 | 13,244 | 15,883 | 23,950 | 21,198 | |||||||||||||||
| Net investment income (loss) |
9,218 | 1,577 | (81,335 | ) | (4,497 | ) | 3,372 | |||||||||||||
| Interest, dividends & other |
4,908 | 5,806 | 24,292 | 27,050 | 24,826 | |||||||||||||||
| Total revenues |
246,587 | 292,485 | 194,365 | 484,896 | 418,639 | |||||||||||||||
| Interest expense |
— | 252 | 12,457 | 5,337 | 54,543 | |||||||||||||||
| Revenue, net of interest expense |
246,587 | 292,233 | 181,908 | 479,559 | 364,096 | |||||||||||||||
| Non-interest expenses: |
||||||||||||||||||||
| Compensation and benefits |
182,430 | 193,017 | 227,114 | 287,752 | 225,712 | |||||||||||||||
| Professional services |
18,529 | 23,971 | 34,895 | 45,303 | 43,712 | |||||||||||||||
| Business development |
14,936 | 13,770 | 30,057 | 37,356 | 33,772 | |||||||||||||||
| Clearing and brokerage fees |
13,129 | 13,945 | 14,010 | 12,373 | 11,715 | |||||||||||||||
| Occupancy and equipment |
25,595 | 33,655 | 33,244 | 33,197 | 30,039 | |||||||||||||||
| Communications |
20,067 | 21,304 | 24,183 | 22,434 | 20,039 | |||||||||||||||
| Impairment of intangible assets |
— | 5,350 | — | — | — | |||||||||||||||
| Other operating expenses |
13,563 | 16,210 | 16,625 | 15,868 | 12,219 | |||||||||||||||
| Total non-interest expenses |
288,249 | 321,222 | 380,128 | 454,283 | 377,208 | |||||||||||||||
| (Loss) income before income taxes |
(41,662 | ) | (28,989 | ) | (198,220 | ) | 25,276 | (13,112 | ) | |||||||||||
| Income tax (benefit) provision |
(4,104 | ) | (1,338 | ) | (3,490 | ) | 20,032 | (3,271 | ) | |||||||||||
| Net (loss) income |
$ | (37,558 | ) | $ | (27,651 | ) | $ | (194,730 | ) | $ | 5,244 | $ | (9,841 | ) | ||||||
| Basic and diluted (loss) earnings per share |
$ | (0.59 | ) | $ | (0.46 | ) | $ | (3.09 | ) | $ | 0.08 | $ | (0.18 | ) | ||||||
| Weighted-average shares (in thousands):(1) |
||||||||||||||||||||
| Basic |
63,546 | 60,094 | 63,056 | 64,123 | 54,137 | |||||||||||||||
| Diluted |
63,546 | 60,094 | 63,056 | 64,187 | 54,137 | |||||||||||||||
| (1) | The weighted average shares outstanding used in the calculation of earnings per share for the year ended December 31, 2006, is presented assuming the issuance of 1,000 shares associated with our formation and 45,999,000 shares associated with the contribution transaction prior to our July 2006 private offering as of January 1, 2006 and the effect of 18,000,000 shares issued in our July 2006 private offering. |
28
Table of Contents
| As of December 31, | ||||||||||||||||||||
| 2010 | 2009 | 2008 | 2007 | 2006 | ||||||||||||||||
| Consolidated Balance Sheet Data (in thousands): |
||||||||||||||||||||
| Assets: |
||||||||||||||||||||
| Cash and cash equivalents |
$ | 236,077 | $ | 275,506 | $ | 207,801 | $ | 383,558 | $ | 151,417 | ||||||||||
| Mortgage-backed securities, at fair value |
— | — | 454,339 | — | 415,391 | |||||||||||||||
| Financial instruments owned, at fair value |
86,400 | 104,124 | 31,209 | 57,496 | 45,416 | |||||||||||||||
| Other investment, at cost |
45,224 | 33,974 | 27,919 | 45,637 | 5,107 | |||||||||||||||
| Due from brokers, dealers, and clearing organizations |
15,463 | 96,477 | — | — | 28,691 | |||||||||||||||
| Other |
48,303 | 46,244 | 79,101 | 122,041 | 113,397 | |||||||||||||||
| Total assets |
$ | 431,467 | $ | 556,325 | $ | 800,369 | $ | 608,732 | $ | 759,419 | ||||||||||
| Liabilities: |
||||||||||||||||||||
| Securities sold but not yet purchased, at fair value |
$ | 55,444 | $ | 51,669 | $ | 8,325 | $ | 206 | $ | 202 | ||||||||||
| Repurchase agreements |
— | — | 416,037 | — | 189,155 | |||||||||||||||
| Accounts payable and other liabilities |
77,209 | 94,989 | 69,271 | 94,274 | 85,674 | |||||||||||||||
| Due to brokers, dealers, and clearing organizations |
7,323 | 90,168 | 3,009 | 7,512 | — | |||||||||||||||
| Total liabilities |
139,976 | 236,826 | 496,642 | 101,992 | 275,031 | |||||||||||||||
| Shareholders’ equity |
291,491 | 319,499 | 303,727 | 506,740 | 484,388 | |||||||||||||||
| Total liabilities and shareholders’ equity |
$ | 431,467 | $ | 556,325 | $ | 800,369 | $ | 608,732 | $ | 759,419 | ||||||||||
| Year ended December 31, | ||||||||||||||||||||
| 2010 | 2009 | 2008 | 2007 | 2006 | ||||||||||||||||
| Statistical Data: |
||||||||||||||||||||
| Total employees(1) |
501 | 595 | 568 | 758 | 702 | |||||||||||||||
| Net revenue per employee(2) |
$ | 450 | $ | 503 | $ | 274 | $ | 657 | $ | 498 | ||||||||||
| Pre-tax (loss) return on average equity |
(14 | )% | (9 | )% | (49 | )% | 5 | % | (4 | )% | ||||||||||
| Compensation and benefits expense as a percentage of net revenues |
74 | % | 66 | % | 125 | % | 60 | % | 62 | % | ||||||||||
| (1) | As of end of the period reported |
| (2) | Based on average of employees as of the end of each quarter. |
29
Table of Contents
| ITEM 7. | MANAGEMENT’S DISCUSSION AND ANALYSIS OF FINANCIAL CONDITION AND RESULTS OF OPERATIONS |
Overview
We are a full-service investment banking, institutional brokerage and asset management firm with a customer-focused and innovative approach to meeting our clients’ needs. In addition, we make principal investments, including merchant banking investments, with our own capital. We were formed in June 2006, and we completed the initial public offering of our common stock in June 2007. Since the founding of certain predecessor companies, we have grown from a boutique investment bank with primary expertise in financial institutions into a full-service U.S. investment bank for middle-market companies.
Through our principal operating subsidiaries, FBR Capital Markets & Co. (“FBR & Co.”), an SEC-registered broker-dealer, FBR Capital Markets International, Ltd. (“FBRIL”), a broker-dealer registered with the United Kingdom’s FSA, and FBR Fund Advisers, Inc. (“FBR Fund Advisers”), an SEC-registered investment adviser, we have focused our business on providing:
| • | capital raising services, including underwriting and placement of public and private equity and debt; |
| • | financial advisory services, including merger and acquisition (“M&A”), advisory, restructuring, liability management, recapitalization and strategic alternative analysis; |
| • | institutional sales and trading services focused on equity, equity-linked securities, high-yield bonds, senior debt and bank loans; |
| • | research coverage, and; |
| • | asset management services through a family of mutual funds; and |
| • | principal investment returns to our shareholders through merchant banking and other direct investments that we make utilizing our own capital. |
We focus our capital markets business (investment banking and institutional brokerage) in the following industry sectors—consumer, diversified industrials, energy and natural resources, financial institutions, healthcare, insurance, real estate, and technology, media and telecommunications (“TMT”). We collectively refer to these sectors as our “core sectors.”
On the asset management side of our business, through FBR Fund Advisers, we provide clients with a range of investment choices through The FBR Funds, a family of mutual funds. As of December 31, 2010, we had $1.6 billion in mutual fund assets under management.
Our business is comprised of three separate segments: capital markets, which includes investment banking and institutional brokerage (including institutional sales and trading and research); asset management; and principal investing (including merchant banking).
Business Environment
The environment for both equity and debt securities continued to improve throughout 2010. Valuations trended up throughout the year across most sectors as capital returned to the market. The performance of the credit markets was particularly strong as investors were attracted to high current returns offered in both high yield debt and bank loan markets. While the environment steadily improved for investors, the market continued to be impacted by elevated fears of event risk. This fear was exhibited clearly during the “flash crash” in May when major market indices fell by 9-10% intraday before recovering to finish down about 3%, in a significant one day drop. This event impacted investor confidence and the new issue markets for several weeks before the market’s appetite for risk began to return.
30
Table of Contents
Despite the strong recovery in valuations in 2010, the market has yet to recapture the high level of liquidity it enjoyed prior to 2008. This lack of liquidity is a function of a number of factors, including the overall deleveraging that is a continuing impact of the severe market stress encountered in 2008 and early 2009. Lower levels of liquidity are negatively impacting trading volumes in the equity market, in particular, which has a direct negative impact on our cash equities trading business.
The recovery in securities markets and the continued quantitative easing by the Federal Reserve has led the overall U.S. economy to continue on its path to recovery. Thus far, the economic recovery has not been sufficient in magnitude or duration to lead to significant job growth and high levels of unemployment continue to be a risk to the economy’s ability to achieve a self-sustaining recovery. Despite historically low mortgage rates, a depressed housing market continues to be an added headwind to achieving consistent economic growth.
As we look forward into 2011, we expect the markets to continue to perform well during the Fed’s quantitative easing phase. In particular, we expect risk assets (equities and high yield debt) to benefit from historically low current yields offered as an alternative in the Treasury market and the related concern of potential losses should rates increase as the Federal Reserve ceases its purchases of Treasury debt as planned in the middle of this year. The outlook for late 2011 and 2012 is less clear and, we believe, is marked by specific risks, including: the end of the Fed purchases of U.S. Treasuries, continued high levels of unemployment, the continued overhang of foreclosed and unsold homes, the high cost of oil, world-wide sovereign debt challenges, political unrest in the Middle East, and, importantly, the ultimate deleveraging of the Federal Reserve balance sheet.
Despite the numerous issues confronting the financial markets and the economy, we believe that 2011 will present opportunities for issuers to access capital to meet refinancing and growth objectives at costs consistent with these objectives. We also expect the trading environment to continue be challenging, however we expect liquidity to slowly return to the equity markets as capital flows move away from fixed income and into equities. We continue to be cautious in our outlook because of both the fragility of the economic recovery in the U.S. and the heightened risks mentioned previously as markets continue to recover from a historic dislocation.
Executive Summary
For the year ended December 31, 2010, our total revenues, net of interest expense, were $246.6 million with a net loss of $37.6 million, compared to total net revenues of $292.2 million and a net loss of $27.7 million for the year ended December 31, 2009. For the year ended December 31, 2008, our total revenues, net of interest expense, were $181.9 million and our net loss was $194.7 million. The increase in our 2010 net loss as compared to 2009 is primarily the result of the decrease in our capital markets segment revenue from $272.7 million in 2009 to $220.5 million during 2010. Specifically, our investment banking revenue in 2010 decreased due to the fact that we raised less capital in sole book run transactions in 2010 as compared to 2009 and our institutional brokerage revenue in 2010 decreased due to an industry-wide decrease in equity and convertible trading volumes for the year.
Our results for the year ended December 31, 2010 include the effects of steps taken during the second half of the year to better position our cost structure for future periods. Specifically, we incurred severance charges of $6.5 million as a result of headcount reductions and incurred $1.1 million of impairment charges related to reductions in our leased office space. As a result of these and other actions, we have reduced our fixed costs by more than $20 million on an annualized basis as compared to the second quarter of 2010.
While we have reduced our overall headcount, we have added professionals that have expanded our capabilities in areas that we believe will provide additional revenues. Such capabilities, including restructuring, convertible debt, high yield debt, and bank loan syndication and trading, allow us to provide services to clients throughout their corporate lifecycle. In addition, as of December 31, 2010, we maintained a strong and liquid balance sheet with over $236 million of cash and no debt providing us with flexibility to continue to make investments in our businesses as opportunities present themselves.
31
Table of Contents
The following is an analysis of our operating results by segment for the years ended December 31, 2010, 2009 and 2008.
Capital Markets
Our capital markets segment includes investment banking and institutional sales, trading and research. These business units operate as a single integrated segment to deliver capital raising, advisory and sales and trading services to corporate and institutional clients. Our investment banking and institutional brokerage businesses are focused on the consumer, diversified industrials, energy and natural resources, financial institutions, healthcare, insurance, real estate and TMT sectors. By their nature, our capital markets business activities are highly competitive and are subject to market conditions as well as to the conditions affecting the companies and markets in our areas of focus. As a result, our capital markets revenues and profits are subject to significant volatility from period to period. The following table provides a summary of our results within the capital markets segment (dollars in thousands).
| For the year ended December 31, | ||||||||||||
| 2010 | 2009 | 2008 | ||||||||||
| Revenues, net of interest expense: |
||||||||||||
| Investment banking |
$ | 118,273 | $ | 138,723 | $ | 96,950 | ||||||
| Institutional brokerage |
100,091 | 132,629 | 137,263 | |||||||||
| Net interest income, dividends, and other |
2,102 | 1,358 | 1,795 | |||||||||
| Total |
220,466 | 272,710 | 236,008 | |||||||||
| Operating Expenses: |
||||||||||||
| Variable |
95,429 | 116,159 | 121,270 | |||||||||
| Fixed |
173,354 | 176,103 | 224,789 | |||||||||
| Total |
268,783 | 292,262 | 346,059 | |||||||||
| Pre-tax loss |
$ | (48,317 | ) | $ | (19,552 | ) | $ | (110,051 | ) | |||
The pre-tax loss from our capital markets segment increased to $48.3 million in 2010 from $19.6 million in 2009. This increase is primarily attributable to a decrease in institutional brokerage and investment banking revenues offset partially by decreases in both variable and fixed costs. Institutional brokerage sales and trading revenues decreased $32.5 million as a result of reduced trading volumes industry-wide in equity and convertible markets during 2010.
Our investment banking revenues decreased to $118.3 million in 2010 as compared to $138.7 million in 2009, which is primarily attributable to our completion of a lower volume of sole-managed private placements in 2010 as compared to 2009. Our results for 2010 include the realization of $16.1 million of contingent revenue related to two capital raising transactions completed in 2009. During 2009, we completed three significant sole-managed private placement transactions raising approximately $2.0 billion for our clients associated with the recapitalization of the banking industry. While banking recapitalization transactions decreased during 2010, we partially offset this decrease by completing private placement transactions in the airline leasing, energy and diversified industrials industries.
Variable expenses in our capital markets segment decreased $20.7 million, or 17.8% in 2010, as a result of a comparable decrease in net revenues. This decrease is comprised primarily of a decrease in variable compensation of $21.4 million as well as clearing costs related to the decrease in trading volume. This decrease was partially offset by an increase in investment banking transaction costs due to the nature of certain transactions executed during the current year. Fixed expenses decreased $2.7 million, or 1.6% in 2010, which is attributable to a reduction in non-compensation costs of $12.6 million resulting from cost reduction initiatives including a decrease in leased office space and other costs directly attributable to the number of employees. These decreases were partially offset by severance charges of $6.0 million and a $1.1 million impairment charge related to leasehold improvements for office space that had been subleased to a third party.
32
Table of Contents
The pre-tax loss from our capital markets segment decreased to $19.6 million for 2009 from $110.1 million for 2008. This decrease is primarily attributable to a $41.8 million increase in investment banking revenues during 2009, reflecting a higher volume of capital raising activity, and a $53.8 million reduction in operating expenses. Our institutional brokerage sales and trading revenues decreased to $132.6 million for 2009 as compared to $137.3 million for the year ended 2008. This decrease is primarily attributable to higher trading volume during the fourth quarter of 2008 as a result of significant volatility in the market partially offset by increased revenue from our convertible securities, credit, and listed option trading businesses in 2009. Fixed expenses decreased $48.7 million, or 21.7% in 2009, which is attributable to non-compensation cost reduction initiatives, a reduction in average employees, and a decrease in business development activities. The reduction in fixed costs reflects our actions during 2009 to size our business and cost structure to the current operating environment. Variable expenses decreased $5.1 million, or 4.2% in 2009, in contrast to a 15.6% increase in net revenues, reflecting initiatives undertaken to reduce compensation expense and costs associated with investment banking transactions.
Asset Management
Our asset management segment consists primarily of the management of The FBR Funds, a family of mutual funds. Our mutual fund assets under management increased 23.1% to $1.6 billion at December 31, 2010 from $1.3 billion at December 31, 2009. The increase in mutual fund assets under management is primarily the result of a 17% increase in market value, as well as net inflows of $44.0 million, which included the addition of assets from the acquisition of mutual fund operations of the Armed Forces Benefits Association 5 Star Funds. Our remaining assets under management are related to private investment and hedge funds that are in the process of being closed. These assets decreased to $4.3 million at December 31, 2010 from $9.3 million at December 31, 2009. The following tables provide a summary of our results within the asset management segment (dollars in thousands).
| For the year ended December 31, | ||||||||||||
| 2010 | 2009 | 2008 | ||||||||||
| Revenues, net of interest expense: |
||||||||||||
| Asset management fees |
$ | 14,097 | $ | 13,244 | $ | 15,883 | ||||||
| Net interest income and other |
88 | 525 | 1,390 | |||||||||
| Total |
14,185 | 13,769 | 17,273 | |||||||||
| Operating Expenses: |
||||||||||||
| Variable |
7,118 | 8,839 | 11,304 | |||||||||
| Fixed |
9,908 | 13,027 | 20,880 | |||||||||
| Impairment of intangible assets |
— | 5,350 | — | |||||||||
| Total |
17,026 | 27,216 | 32,184 | |||||||||
| Pre-tax loss |
$ | (2,841 | ) | $ | (13,447 | ) | $ | (14,911 | ) | |||
The pre-tax loss from our asset management segment decreased to $2.8 million in 2010 compared to a pre-tax loss of $13.4 million in 2009. This decrease is primarily attributable to a $5.4 million impairment of an intangible asset related to the management contract for a money market mutual fund in 2009. The decrease in pre-tax loss is also a result of decreases in both fixed and variable expenses, as well as increased asset management fees. The decreases in fixed and variable expenses were the result of cost reduction initiatives, which included the decision to terminate a sub-advisory agreement related to the FBR Focus Fund in August 2009 and a reduction in employees associated with the elimination of our private client group in May 2009. Fixed expenses for 2010 include $0.4 million of severance. The increase in asset management fees was a direct result of an increase in our average assets under management for year ended December 31, 2010 compared to prior year.
The pre-tax loss from our asset management segment decreased to $13.4 million in 2009 compared to $14.9 million in 2008. Our results for 2009 include a $5.4 million impairment of an intangible asset related to the
33
Table of Contents
management contract for a money market mutual fund noted above. The impairment was the result of factors such as significantly reduced yields on short-term government investments and the requirement for us to both waive our management fees and reimburse certain expenses of the fund resulting in the management contract becoming unprofitable for us in the period. We also considered the cost structure of this fund, a forecasted continuation of a low rate environment for the fund’s investments and the forecasted ongoing waiver of our management fee in recognizing this impairment charge. Despite this impairment charge, we were able to decrease the pre-tax loss for this segment due to a decrease in fixed expenses as a result of cost reduction initiatives in non-compensation expenses and a reduction in employees.
The following provides details relating to our assets under management (dollars in millions):
| December 31, 2010 | December 31, 2009 | |||||||||||||||
| Gross(1) | Net(2) | Gross(1) | Net(2) | |||||||||||||
| Mutual funds: |
||||||||||||||||
| Equity |
$ | 1,478.6 | $ | 1,470.6 | $ | 1,325.9 | $ | 1,317.9 | ||||||||
| Balanced and fixed income |
113.0 | 112.1 | — | — | ||||||||||||
| Private equity and hedge funds |
5.3 | 4.3 | 10.1 | 9.3 | ||||||||||||
| Total |
$ | 1,596.9 | $ | 1,587.0 | $ | 1,336.0 | $ | 1,327.2 | ||||||||
| (1) | Gross assets under management represent the amount of actual gross assets of our mutual funds and proprietary investment partnerships, including leverage. |
| (2) | Net assets under management represent gross assets under management, net of any repurchase agreement debt, margin loans, securities sold but not yet purchased, lines of credit, and any other liabilities. |
Our asset management revenues and net income (loss) are subject to fluctuations due to a variety of factors that are unpredictable, including the overall condition of the economy and the securities markets as a whole. These conditions can have a material effect on the inflows and outflows of assets under management, and the performance of our asset management funds.
Principal Investing
As of December 31, 2010, our principal investing activity consists of investments in merchant banking and other equity investments and investment funds. The following tables provide a summary of our results within the principal investing segment (dollars in thousands):
| For the year ended December 31, |
||||||||||||
| 2010 | 2009 | 2008 | ||||||||||
| Revenues, net of interest expense: |
||||||||||||
| Net investment income (loss) |
$ | 9,162 | $ | 1,577 | $ | (79,551 | ) | |||||
| Net interest income, dividends, and other |
2,774 | 4,177 | 8,178 | |||||||||
| Total |
11,936 | 5,754 | (71,373 | ) | ||||||||
| Operating Expenses: |
||||||||||||
| Variable |
276 | 109 | 55 | |||||||||
| Fixed |
2,164 | 1,635 | 1,830 | |||||||||
| Total |
2,440 | 1,744 | 1,885 | |||||||||
| Pre-tax income (loss) |
$ | 9,496 | $ | 4,010 | $ | (73,258 | ) | |||||
34
Table of Contents
The following table details the components of net investment income/loss for the periods (dollars in thousands):
| For the year ended December 31, |
||||||||||||
| 2010 | 2009 | 2008 | ||||||||||
| Income (loss) on merchant banking and other equity investments and investment funds |
$ | 9,162 | $ | 3,079 | $ | (5,066 | ) | |||||
| Other-than-temporary impairment losses on merchant banking and other equity investments |
— | — | (41,458 | ) | ||||||||
| Realized loss on sales of mortgage-backed securities |
— | (1,502 | ) | (21,853 | ) | |||||||
| Other-than-temporary impairment losses on mortgage-backed securities |
— | — | (11,174 | ) | ||||||||
| Total |
$ | 9,162 | $ | 1,577 | $ | (79,551 | ) | |||||
The pre-tax income from our principal investing activities increased to $9.5 million for 2010 as compared to $4.0 million in 2009. This increase is primarily attributable to $9.2 million of net investment income during 2010 as compared to $1.6 million of net investment income for 2009, partially offset by a decrease in net interest income and dividends. For the year ended December 31, 2010, our net investment income consisted primarily of realized gains from the sales of equity investments.
The pre-tax income from our principal investing activities increased to $4.0 million in 2009 as compared to a pre-tax loss of $73.3 million in 2008. This change is primarily attributable to a $79.6 million net investment loss incurred during 2008 as compared to $1.6 million of net investment income in 2009 partially offset by a decrease in net interest income. The net investment loss in 2008 includes other-than-temporary impairment charges related to merchant banking and other equity investments and mortgage-backed securities that aren’t comparable to 2009.
For the year ended December 31, 2009, we generated income on equity investments and investment funds, consisting primarily of realized gains on sales and increases in the fair value of our seed investments in our mutual funds, of $3.1 million. This compares to losses on investment funds of $5.1 million as a result of market conditions during 2008.
The other-than-temporary impairment losses recorded for the year ended December 31, 2008 related to merchant banking and other equity investments reflect our assessment of the severity and duration of unrealized losses related to various securities. The recognition of these other-than-temporary impairment losses during 2008 was a result of economic and market conditions during that period and our assessment of these conditions, as well as other company-specific factors, relative to the various investments. Based on our consideration of comparable factors, there were no other-than-temporary impairment losses recorded for the years ended December 31, 2010 and 2009. In addition, during 2008 we realized losses of $21.9 million and recognized other-than-temporary impairment losses of $11.2 million associated with the actual and planned disposition of mortgage-backed securities held during the year. This compares to $1.5 million of realized losses related to the disposition during the first quarter of 2009 of the remaining mortgage-backed securities held at December 31, 2008.
Investments
The total value of our investment portfolio was $49.4 million as of December 31, 2010. Of this total, $45.2 million was held in non-public investments recorded at cost associated with our merchant banking portfolio, $3.6 million of marketable equity securities and $0.6 million was held in investment funds.
35
Table of Contents
The following table provides additional detail regarding our merchant banking and other long-term investments as of December 31, 2010 (dollars in thousands):
Merchant Banking and Other Investments
| December 31, 2010 | ||||||||||||
| Number of Shares |
Cost Basis | Carrying Value/ Fair Value |
||||||||||
| Merchant banking—non-public securities: |
||||||||||||
| Air Lease Corporation(1) |
253,907 | $ | 5,074 | $ | 5,074 | |||||||
| Cohen & Company, Inc (Note)(2) |
n/a | 317 | 317 | |||||||||
| Diana Containerships, Inc(2) |
1,073,830 | 15,469 | 15,469 | |||||||||
| NBH Holdings, Inc(1) |
1,049,906 | 20,472 | 20,472 | |||||||||
| North American Financial Holdings, Inc.(1) |
194,614 | 3,892 | 3,892 | |||||||||
| Total |
$ | 45,224 | $ | 45,224 | ||||||||
| Marketable equity securities, at fair value |
3,623 | |||||||||||
| Investment funds |
555 | |||||||||||
| Total investments |
$ | 49,402 | ||||||||||
| (1) | As of December 31, 2010, the sale of these shares was subject to restrictive covenants. |
| (2) | As of December 31, 2010, these shares cannot be traded in a public market (e.g., NYSE or NASDAQ) but may be sold in private transactions. As of January 19, 2011, shares of Diana Containerships, Inc. are tradable in a public market as a result of the shares listing on NASDAQ. |
Results of Operations
Revenues
Our revenues consist primarily of capital raising and advisory fees in investment banking; agency commissions, principal transactions, including trading gains and losses, in institutional brokerage; base management fees and 12b-1 fees in asset management, and with respect to principal investing activities, net investment income, including realized gains or losses, and dividends from merchant banking investments, earnings from investment funds, and net interest income from principal investing activities.
Revenue from capital raising transactions is substantially dependent on the market for public and private offerings of equity and debt securities within the core sectors in which we focus. Agency commissions are dependent on the level of overall market trading volume and penetration of our institutional client base by our research, sales, and trading staff. Principal brokerage transactions are dependent on these same factors and on trading volume and spreads in the securities of such companies; net trading gains and losses are dependent on the market performance of securities held, as well as our decisions as to the level of market exposure we accept in these securities. Asset management revenues are dependent on the level of the capital on which our base management fees are calculated. Our asset management vehicles are subject to market risk in the markets in which they would seek to sell or buy financial instruments. Accordingly, our revenues in these areas have fluctuated in the past, and we anticipate that they are likely to continue to fluctuate in the future, based on these factors.
In our principal investing activities, merchant banking and other investments are subject to market risk, as well as, any number of specific additional risks related to each investment. As a result, net investment income and dividends generated from these investments will vary and cannot be accurately predicted. Also, during the year ended December 31, 2008 and for the quarter ended March 31, 2009, our principal investing revenues included the results of mortgage-backed securities that were financed by repurchase agreement borrowings were subject to market risk and risks related to the terms and conditions of the financing agreements. During the first quarter of 2009, we sold our remaining leveraged mortgage-backed securities and retired the related repurchase agreement borrowings used to finance these securities.
36
Table of Contents
Investment Banking
Capital raising revenue consists of underwriting discounts, selling concessions, management fees and reimbursed expenses associated with underwriting activities and private equity placements. We act in varying capacities in our capital raising activities, which, based on the underlying economics of each transaction, determine our ultimate revenues from these activities. When we are engaged as lead-manager of an underwriting, we generally bear more risk and earn higher revenues than if engaged as a co-manager, an underwriter (syndicate member) or a broker-dealer included in the selling group.
Advisory revenue consists primarily of advisory fees and reimbursed expenses associated with such activities. Advisory fees have fluctuated in the past, and are likely to continue to fluctuate, based on the number and size of our completed transactions.
Institutional Brokerage
Principal transactions consist of a portion of dealer spreads attributed to our securities trading activities as principal in listed and other equity securities, convertible debt securities, listed options and various credit-related instruments and are primarily derived from our customer trading activities. Trading gains and losses on equity securities, convertible debt securities and other instruments are combined and reported on a net basis as part of principal transactions. Gains and losses result primarily from market price fluctuations that occur while holding positions in our trading security inventory.
Agency commissions consist of revenue resulting from the execution of exchange-listed securities and other transactions as agent.
Asset Management
We receive asset management revenue in our capacity as the investment manager to advisory clients, including our mutual funds, as general partner of certain hedge, private equity and venture capital investment partnerships and as administrator to mutual funds. In addition, we include revenues for 12b-1 fees related to the distribution of our mutual funds.
Net Investment Income
Net investment income includes net realized gains or losses on sale of equity securities and mortgage-backed securities, impairment losses related to investments in marketable and non-public equity securities and mortgage-backed securities, realized and unrealized gains and losses on investments held at broker-dealer subsidiaries and other investments designated as trading as well as income from investment funds.
We record in net investment income in our statements of operations changes in the net asset value of mutual, hedge, private equity and venture funds and other partnerships in which we have made investments.
Interest, Dividends & Other Income
Interest income and dividends includes interest earned on treasury management investments, which includes interest income earned on interest-bearing accounts and securities and dividends on merchant banking and other equity investments. Other income primarily includes other miscellaneous fees generated from non-core business activities.
Expenses
Interest expense includes the costs of repurchase agreement borrowings, as well as costs of subordinated credit lines, margin financing and other financings.
37
Table of Contents
Compensation and benefits expense includes base salaries, non-cash expenses associated with all stock-based awards granted to employees, and incentive compensation. Incentive compensation varies primarily based on revenue production. Salaries, payroll taxes and employee benefits are relatively fixed in nature. In addition, from time-to-time, severance charges related to reductions in our workforce will be included in this amount.
Professional services expenses include legal and consulting fees, recruiting fees, and asset management sub-advisory fees. Many of these expenses, such as legal fees associated with investment banking transactions and sub-advisory fees are, to a large extent, variable with revenue.
Business development expenses include travel and entertainment expenses related to investment banking transactions, costs of investor conferences, sponsorships and advertising. Expenses that are directly related to investment banking transactions are variable with revenue.
Clearing and brokerage fees include trade processing expenses that we pay to our clearing broker, and execution fees that we pay to floor brokers and electronic communication networks. These expenses are almost entirely variable based on our revenue.
Occupancy and equipment includes rental costs for our facilities, depreciation and amortization of equipment, software and leasehold improvements and expenses. These expenses are largely fixed in nature.
Communications expenses include voice, data and Internet service fees, and data processing costs. While variable in nature, these do not tend to vary with revenue.
Other operating expenses include professional liability and property insurance, amortization of certain intangible assets, printing and copying, business licenses and taxes, offices supplies, interest related to taxes, penalties and fees, charitable contributions and other miscellaneous office expenses.
38
Table of Contents
The following table sets forth financial data as a percentage of net revenues. For the year ended December 31, 2008, revenues, net of interest expense, includes a net investment loss of $81.3 million. This net investment loss has a significant impact on the comparability of the 2008 data to other periods.
| For the Year Ended December 31, |
||||||||||||
| 2010 | 2009 | 2008 | ||||||||||
| Revenues: |
||||||||||||
| Investment banking: |
||||||||||||
| Capital raising |
40.1 | % | 41.4 | % | 42.0 | % | ||||||
| Advisory |
7.9 | % | 6.1 | % | 11.3 | % | ||||||
| Subtotal |
48.0 | % | 47.5 | % | 53.3 | % | ||||||
| Institutional brokerage: |
||||||||||||
| Principal transactions |
9.0 | % | 13.8 | % | 11.1 | % | ||||||
| Agency commissions |
31.6 | % | 31.8 | % | 65.0 | % | ||||||
| Subtotal |
40.6 | % | 45.6 | % | 76.1 | % | ||||||
| Asset management fees |
5.7 | % | 4.5 | % | 8.6 | % | ||||||
| Net investment income (loss) |
3.7 | % | 0.5 | % | (44.7 | )% | ||||||
| Interest, dividends & other |
2.0 | % | 2.0 | % | 13.5 | % | ||||||
| Total revenues |
100.0 | % | 100.1 | % | 106.8 | % | ||||||
| Interest expense |
— | 0.1 | % | 6.8 | % | |||||||
| Revenues, net of interest expense |
100.0 | % | 100.0 | % | 100.0 | % | ||||||
| Non-interest expenses: |
||||||||||||
| Compensation and benefits |
74.0 | % | 66.0 | % | 124.9 | % | ||||||
| Professional services |
7.5 | % | 8.2 | % | 19.2 | % | ||||||
| Business development |
6.1 | % | 4.7 | % | 16.5 | % | ||||||
| Clearing and brokerage fees |
5.3 | % | 4.8 | % | 7.7 | % | ||||||
| Occupancy and equipment |
10.4 | % | 11.5 | % | 18.3 | % | ||||||
| Communications |
8.1 | % | 7.3 | % | 13.3 | % | ||||||
| Impairment of intangible assets |
— | 1.8 | % | — | ||||||||
| Other operating expenses |
5.5 | % | 5.6 | % | 9.1 | % | ||||||
| Total non-interest expenses |
116.9 | % | 109.9 | % | 209.0 | % | ||||||
| Loss before income taxes |
(16.9 | )% | (9.9 | )% | (109.0 | )% | ||||||
Comparison of the Years Ended December 31, 2010 and 2009
Net loss increased to $37.6 million in 2010 from $27.7 million in 2009. Income tax benefit increased to $4.1 million in 2010 from $1.3 million tax benefit in 2009 due to the change in pre-tax income and impact of the valuation allowance related to tax benefits attributable to losses that are not realizable through loss carrybacks.
Our pre-tax loss increased to $41.7 million in 2010 from $29.0 million in 2009. Pre-tax loss from our capital markets segment increased to $48.3 million in 2010 from $19.6 million in 2009 due to decreases in our institutional brokerage and investment banking revenues, partially offset by decreases in our operating expenses due to the impact of decreased revenues on variable costs and cost reduction initiatives. The pre-tax loss in our asset management segment decreased to $2.8 million in 2010 from $13.4 million in 2009 due to a $5.4 million impairment of an intangible asset related to a money market mutual fund management contract in 2009 that is not comparable to 2010, as well as increased management fee revenues and reductions in operating expenses. Pre-tax income from our principal investing segment increased to $9.5 million in 2010 from $4.0 million in 2009, reflecting an increase in net investment income, partially offset by a decrease in dividend income.
39
Table of Contents
Revenues
Our net revenues decreased 15.6% to $246.6 million in 2010 from $292.2 million in 2009 due to the changes in revenues and interest expense discussed below.
Capital raising revenues decreased 18.3% to $98.8 million in 2010 from $121.0 million in 2009. Our revenues from private placements in 2010 were $79.6 million compared to $100.5 million in 2009. Our results for 2010 include the realization of $16.1 million of contingent revenue related to two transactions completed in 2009. During 2009, we completed three significant sole-managed private placement transactions raising approximately $2.0 billion for our clients associated with the recapitalization of the banking industry. While banking recapitalization transactions decreased during 2010, we partially offset this decrease by completing private placement transactions in the airline leasing, energy and diversified industrials industries.
Advisory revenues increased 10.2% to $19.5 million in 2010 from $17.7 million in 2009. We completed 20 assignments in 2010 as compared to 19 assignments in 2009.
Institutional brokerage revenues from agency commissions and principal transactions decreased 24.8% to $100.1 million in 2010 from $133.1 million in 2009. The decrease is primarily attributable to a reduction in revenues from our convertible securities and equities trading desks in 2010 partially offset by increased revenues from our listed-options trading desk in 2010 following the launch of this business during the second half of 2009. The decrease in our brokerage revenues was primarily the result of reduced trading volumes industry-wide in the equity and convertible markets during 2010.
Asset management fees increased 6.8% to $14.1 million in 2010 from $13.2 million in 2009. The increase is primarily attributable to an increase in average mutual fund assets under management. The increase in average assets under management was attributable to the overall performance of the funds and the addition of assets from the acquisition of mutual fund operations of the Armed Forces Benefits Association 5 Star Funds in the first quarter of 2010.
Net investment income was $9.2 million in 2010 compared to $1.6 million in 2009. Net investment income for 2010 includes gains related to sale of certain merchant banking investments and income from investment funds due to fund performance, partially offset by losses on short positions in certain exchange-traded funds that are intended to hedge the fund investments. Net investment income for 2009 includes income from investment funds as a result of fund performance and gains from the sale of certain merchant banking investments.
Net interest income, dividends and other revenues decreased to $4.9 million in 2010 from $5.6 million in 2009. This decrease is primarily attributable to decreased dividend income from certain merchant banking investments that declared lower dividends per share in 2010, offset partially by increased interest income from our convertible and credit trading positions.
Expenses
Total non-interest expenses decreased 10.3% to $288.2 million in 2010 from $321.2 million in 2009. This decrease was caused by the changes in non-interest expenses described below.
Compensation and benefits expenses decreased 5.5% to $182.4 million in 2010 from $193.0 million in 2009. This decrease is primarily attributable to a decrease in variable compensation of $20.6 million as a result of a decrease in net revenues in our capital markets segment. This decrease is partially offset by severance costs of $6.5 million relating to headcount reductions which will reduce our annual fixed compensation run rate and better position our cost structure for future periods.
40
Table of Contents
Professional services expenses decreased 22.9% to $18.5 million in 2010 from $24.0 million in 2009 primarily due to decreased expenses related to corporate legal costs and consultant fees. Also contributing to the decrease, is the reduction in sub-advisory fees related to our management of mutual funds as a result of our termination of the sub-advisory agreement related to the FBR Focus Fund in August 2009. Partially offsetting these decreases was an increase in expenses related to investment banking transactions in 2010 as compared to 2009 due to the nature of certain transactions executed during the current year.
Business development expenses increased 8.0% to $14.9 million in 2010 from $13.8 million in 2009. This increase is primarily the result of increased costs associated with the development of new client relationships and our investment banking transactions, partially offset by a decrease in costs associated with our golf event sponsorship in 2009.
Clearing and brokerage fees decreased 5.8% to $13.1 million in 2010 from $13.9 million in 2009. This decrease is primarily the result of decreased equity trading volumes, offset partially by the initiation of non-exchange traded product lines with higher clearing costs during the second half of 2009.
Occupancy and equipment expenses decreased 24.0% to $25.6 million in 2010 from $33.7 million in 2009. The decrease in occupancy costs is a result of reductions in our leased office space along with other cost reduction initiatives. We incurred charges of $1.2 million in 2010 associated with lease terminations and the subleasing of certain office space compared to $3.0 million of similar charges in 2009.
Communications expenses decreased 5.6% to $20.1 million in 2010 from $21.3 million in 2009. The decrease in these expenses is primarily due to the effects of cost reduction initiatives over the past year and decreased costs related to market data and customer trading services.
During 2009, we recognized a $5.4 million impairment of an intangible asset related to a money market fund managed by us. The impairment was the result of factors such as significantly reduced yields on short-term government investments and the requirement for us to both waive our management fees and reimburse certain expenses of the fund resulting in the management contract becoming unprofitable for us in the period.
Other operating expenses decreased 16.0% to $13.6 million in 2010 from $16.2 million in 2009. The decrease in expenses is primarily due to a decrease in corporate insurance costs as well as a decrease in intangible asset amortization.
The income tax benefit increased to $4.1 million in 2010 from $1.3 million in 2009 due to the change in pre-tax income and impact of the valuation allowance related to tax benefits attributable to losses that are not realizable through loss carrybacks. The income tax benefits for 2010 and 2009, include the benefit for federal net operating losses utilized as a result of carryback of $3.2 million and $6.9 million, respectively. Our effective tax rate was 9.8% in 2010 as compared to 4.6% in 2009. In addition to the effects of the valuation allowance, our effective tax rates during these periods differed from statutory rates primarily due to the discrete period reporting of the tax effects of restricted stock vesting, as required under Financial Accounting Standards Board’s (“FASB”) Accounting Standard Codification (“ASC”) 718, “Compensation-Stock Compensation” (“ASC 718”) as restricted stock awards vested at share prices lower than original grant date prices as well as the effect of permanent differences in relation to our operating results. The effective tax rate for 2009 also differed from the statutory rate due to the expected tax liability related to domestic operations. Without these and other discrete items, our effective income tax rate would have been 36.4% and 33.2%, respectively, for the years ended December 31, 2010 and 2009.
At December 31, 2010, our net deferred tax assets totaled $88.4 million. We have established a full valuation allowance against these deferred tax assets based on the criteria in the ASC 740, “Income Taxes” (“ASC 740”). We reflect a net deferred tax liability of $0.2 million related to an indefinite-lived intangible which cannot serve as a source of future income for determination of our valuation allowance.
41
Table of Contents
Comparison of the Years Ended December 31, 2009 and 2008
Net loss decreased to $27.7 million in 2009 from $194.7 million in 2008. Income tax benefit decreased to $1.3 million in 2009 from $3.5 million tax benefit in 2008 due to the change in pre-tax income and impact of the valuation allowance related to tax benefits attributable to losses that are not realizable through loss carrybacks.
Our pre-tax loss decreased to $29.0 million in 2009 from $198.2 million in 2008. The decrease in pre-tax loss was primarily the result of the performance of our capital markets segment where, due to the increase in capital raising revenues, pre-tax loss decreased to $19.6 million during 2009 from $110.1 million during 2008. In addition, pre-tax income from our principal investing segment increased to pre-tax income of $4.0 million during 2009 from a pre-tax loss of $73.3 million during 2008, reflecting the effects of other-than-temporary impairments related to certain of our merchant banking investments, realized losses from sales and other-than-temporary impairments of mortgage-backed securities, and losses from investment funds in 2008 that are not comparable to 2009. The pre-tax loss from our asset management segment decreased to $13.4 million during 2009 from $14.9 million during 2008 as a result of decreased fixed costs partially offset by an impairment loss on a management contract intangible asset attributed to this segment of $5.4 million.
Revenues
Our net revenues increased 60.6% to $292.2 million during 2009 from $181.9 million during 2008 due to the changes in revenues and interest expense discussed below.
Capital raising revenues increased 58.4% to $121.0 million in 2009 from $76.4 million in 2008. Our revenues from 10 private placements completed during 2009 totaled $100.5 million as compared to $60.0 million in revenues from four private placements completed in 2008. Our 2009 capital raising revenues include $68.1 million from our completion of two large private placements. Also, our aggregate transaction value on lead- or co-lead-managed public offerings increased from 2008 to 2009.
Advisory revenues decreased 14.1% to $17.7 million generated in 2009 from $20.6 million in 2008. We completed 19 M&A and advisory assignments in 2009 as compared to 15 M&A and advisory assignments in 2008.
Institutional brokerage revenues from agency commissions and principal transactions decreased 4.0% to $133.1 million in 2009 from $138.6 million in 2008 as a result of decreases in overall trading volume and decreased volatility in the equity markets, partially offset by increased revenues from the integration of our convertible securities, credit, and listed-options trading platforms beginning in September 2008 and continuing throughout 2009.
Asset management fees decreased 17.0% to $13.2 million in 2009 from $15.9 million in 2008. The decrease is primarily attributable to the decrease in average mutual fund assets under management during 2009 partially offset by increased revenues related to 12b-1 fees associated with our acquisition of a mutual fund distribution business in the third quarter of 2008.
Net investment income was $1.6 million in 2009 compared to net investment loss of $81.3 million in 2008. This change is primarily attributable to income from investment funds as a result of fund performance and net gains from the sale of certain merchant banking investments and mortgage-backed securities in 2009 as compared to realized losses on sales and other-than-temporary impairment losses on mortgage-backed securities of $21.9 million and $11.2 million, respectively, and other-than-temporary impairment losses of $41.5 million on certain merchant banking and long-term investments during 2008.
Net interest, dividends and other revenues decreased 52.5% to $5.6 million in 2009 from $11.8 million in 2008. This decrease is primarily attributable to a reduction in net interest income as a result of the sale of our mortgage-backed securities positions in the first quarter of 2009, partially offset by increases in dividends received on certain merchant banking investments in 2009.
42
Table of Contents
Expenses
Total non-interest expenses decreased 15.5% to $321.2 million in 2009 from $380.1 million in 2008. This decrease was caused by the changes in non-interest expenses described below.
Compensation and benefits expenses decreased 15.0% to $193.0 million in 2009 from $227.1 million in 2008. This decrease is primarily due to a $15.1 million decrease in fixed compensation and benefits due to a 22% reduction in average employees since the beginning of 2008 along with a $16.8 million decrease in severance costs in 2009 as compared to 2008.
Professional services expenses decreased 31.2% to $24.0 million in 2009 from $34.9 million in 2008 primarily due to decreased costs related to consultants, primarily associated with our cost reduction initiatives, a reduction in investment banking transaction costs, and a reduction in sub-advisory fees related to our management of mutual funds. The reduction in sub-advisory fees was the result of lower average mutual fund assets under management in 2009 compared to 2008 and our termination of the sub-advisory agreement related to the FBR Focus Fund in August 2009.
Business development expenses decreased 54.2% to $13.8 million in 2009 from $30.1 million in 2008. This decrease reflects the effects of our cost reduction initiatives and is primarily due to a decrease in costs associated with investor conferences and our involvement in what had been known as the PGA Tour’s FBR Open as well as an overall reduction in the costs associated with our investment banking transactions.
Clearing and brokerage fees decreased 0.7% to $13.9 million in 2009 from $14.0 million in 2008. The decrease is due to decreased equity trading volumes.
Occupancy and equipment expenses increased 1.5% to $33.7 million in 2009 from $33.2 million in 2008. The increase is due to charges of $3.0 million associated with lease terminations and the subleasing of certain office space. An overall decrease in occupancy costs as a result of these reductions in leased office space along with other cost reduction initiatives over the past two years partially offset the termination charges incurred in 2009.
Communications expenses decreased 12.0% to $21.3 million in 2009 from $24.2 million in 2008. The decrease in expenses is primarily due to the effects of cost reduction initiatives over the past two years including decreased costs related to market data and customer trading services.
For the year ended December 31 2009, we recognized a $5.4 million impairment of an intangible asset related to a money market mutual fund managed by us. The impairment was the result of factors such as significantly reduced yields on short term government investments and the requirement for us to both waive our management fees and reimburse certain expenses of the fund resulting in the management contract becoming unprofitable for us in the period. We also considered the cost structure of this fund, a forecasted continuation of the low rate environment for the fund’s investments and the forecasted ongoing waiver of our management fee in recognizing this impairment charge.
Other operating expenses decreased 2.4% to $16.2 million in 2009 from $16.6 million in 2008 due primarily to a decrease in corporate insurance costs partially offset by an increase in 12b-1 fees.
The income tax benefit decreased to $1.3 million in 2009 from $3.5 million in 2008 due to the change in pre-tax income and impact of the valuation allowance related to tax benefits attributable to losses that are not realizable through loss carrybacks. The income tax benefits for 2009 and 2008, include a benefit for federal net operating losses utilized as a result of carryback of $6.9 million and $17.8 million, respectively. Our effective tax rate was 4.6% in 2009 as compared to 1.8% in 2008. In addition to the effects of the valuation allowance, our effective tax rates during these periods differed from statutory rates primarily due to the discrete period reporting
43
Table of Contents
of the tax effects of restricted stock vesting, as required under ASC 718 as restricted stock awards vested at share prices lower than original grant date prices as well as the effect of permanent differences in relation to our operating results. The effective tax rate for 2009 also differed from the statutory rate due to the expected tax liability related to domestic operations. Without these and other discrete items, our effective income tax rate would have been 33.2% and 39.6%, respectively, for the years ended December 31, 2009 and 2008.
At December 31, 2009, our net deferred tax assets totaled $82.3 million. We have established a full valuation allowance against these deferred tax assets based on the criteria in the ASC 740. We reflect a net deferred tax liability of $0.1 million related to an indefinite-lived intangible which cannot serve as a source of future income for determination of our valuation allowance.
Liquidity and Capital Resources
Liquidity is a measurement of our ability to meet potential cash requirements, including ongoing funding for investments, and for other general business purposes. Regulatory requirements applicable to our broker-dealer subsidiaries require minimum capital levels for these entities. The primary sources of funds for liquidity consist of existing cash balances (i.e., available liquid capital not invested in our operating businesses), proceeds from sales of securities, internally generated funds, dividends on equity securities, equity capital contributions, and credit provided by margin accounts, banks, clearing brokers, and affiliates of our principal clearing broker. Potential future sources of liquidity for us include internally generated funds, borrowing capacity through margin accounts, corporate lines of credit and other credit facilities which we may enter into in the future, and future issuances of common stock, preferred stock or debt securities.
Cash Flows
As of December 31, 2010, our cash and cash equivalents totaled $236.1 million representing a net decrease of $39.4 million for the year ended December 31, 2010. The decrease is primarily attributable cash used in operating activities of $33.4 million, which includes a cash operating loss of $31.0 million and $2.4 million of net changes in operating assets and liabilities. Cash used in financing activities of $13.7 million, primarily associated with the repurchase of our common stock, was partially offset by $7.7 million of cash provided by investing activities. Due to the cyclical nature of our industry and the industries in which we provide services, we maintain liquid capital to cover potential cash outflows in periods of decreased revenues and earnings.
Net cash used in operating activities of $33.4 million during 2010, compares to net cash provided by operating activities of $9.3 million during 2009. The cash used in operating activities for 2010 reflects net operating losses and our payment of previously accrued compensation associated with prior year operating results partially offset by decreased capital investment in our trading businesses.
Net cash used in financing activities of $13.7 million during 2010 compares to $397.6 million used during 2009. The 2010 activity primarily represents the repurchase of 3.2 million shares of our common stock for $15.9 million. The 2009 activity reflects the sale of mortgage-backed securities and repayment of related repurchase agreement financings, as well as the net effects of repurchasing 16.7 million shares of our common stock for $72.5 million from Arlington Asset, our former majority owner, and completing a follow-on offering of 20.0 million shares of our common stock for $90.1 million.
Net cash provided by investing activities of $7.7 million during 2010 compares to $456.0 million provided during 2009. The 2010 activity reflects the purchase and sale of certain merchant banking investments while the 2009 activity reflects the sale of the remaining mortgage-backed securities held as of December 31, 2008.
As of December 31, 2009, our cash and cash equivalents totaled $275.5 million representing a net increase of $67.7 million for the year ended December 31, 2009. The increase is primarily attributable to $456.0 million of cash provided by investing activities offset by $397.6 million of cash used in financing activities. Cash
44
Table of Contents
provided by operating activities of $9.3 million includes cash operating income of $9.4 million partially offset by $0.1 million of net changes in operating assets and liabilities. Due to the cyclical nature of our industry and the industries in which we provide services, we maintain liquid capital to cover potential cash outflows in periods of decreased revenues and earnings.
Net cash provided by our operating activities of $9.3 million during 2009, compares to $78.9 million of cash used in operating activities during 2008. This increase in operating cash flows reflects the effects of the increase in capital raising revenues during 2009 as compared to 2008 as well as the effects of cost reduction initiatives implemented over both of those years.
Net cash provided by investing activities of $456.0 million during 2009 compares to net cash used in investing activities of $479.7 million during 2008, reflecting the difference in investing activity during the periods. The activity during 2008 reflects the net purchase of mortgage-backed securities, which were partially financed with repurchase agreement borrowings, while the 2009 activity reflects the sale of the remaining mortgage-backed securities held at December 31, 2008 (see further discussion below under “Assets”).
Similarly, the primary difference between the net cash used in financing activities of $397.6 million during 2009, as compared to net cash provided by financing activities of $382.9 million during 2008, relates to the partial financing of the mortgage-backed securities in 2008, as compared to sales of mortgage-backed securities and repayment of related repurchase agreement financings during 2009. Also, during 2009, we received net inflows of $18.4 million primarily as a result of our public, follow-on offering of common shares for $90.1 million offset partially by a repurchase of 16.7 million shares of our common stock for $72.5 million from Arlington Asset, our former majority owner.
Sources of Funding
We believe that our existing cash and cash equivalents balances (totaling $236.1 million at December 31, 2010), cash flows from operations, borrowing capacity, other sources of liquidity and execution of our financing strategies will be sufficient to meet our cash requirements. We have obtained, and believe we will be able to continue to obtain, short-term financing, such as margin financing and temporary subordinated financing, in amounts and at interest rates consistent with our financing objectives. We may, however, seek debt or equity financings, in public or private transactions, to provide capital for corporate purposes and/or strategic business opportunities, including possible acquisitions, joint ventures, alliances or other business arrangements which could require substantial capital outlays. Our policy is to evaluate strategic business opportunities, including acquisitions and divestitures, as they arise. There can be no assurance that we will be able to generate sufficient funds from future operations, or raise sufficient debt or equity on acceptable terms, to take advantage of investment opportunities that become available. Should our needs ever exceed these sources of liquidity, we believe that most of our investments could be sold, in most circumstances, to provide cash.
We monitor and manage our leverage and liquidity risk through various committees and processes we have established. We assess our leverage and liquidity risk based on considerations and assumptions of market factors, as well as factors specific to us, including the amount of our available liquid capital (i.e., the amount of our cash and cash equivalents not invested in our operating business). At December 31, 2010, we had $236.1 million of available liquid capital and no outstanding borrowings.
Assets
As of December 31, 2010, our principal assets consist of cash and cash equivalents, receivables, trading securities and investments. As of December 31, 2010 and 2009, liquid assets consisted primarily of cash and cash equivalents of $236.1 million and $275.5 million, respectively.
45
Table of Contents
The decrease in our total assets to $431.5 million as of December 31, 2010 compared to $556.3 million as of December 31, 2009, is primarily the result of an $81.0 million reduction in receivables from brokers, dealers and clearing organizations and a $39.4 million decrease in cash and cash equivalents discussed above. Our due from and to brokers, dealers, and clearing organizations balances primarily represent unsettled trades associated with our credit sales and trading platform. These transactions include corporate bond and syndicated loan trades. A decrease in unsettled trades outstanding associated with these activities was the primary reason for the decrease in the receivable from and corresponding payable to brokers, dealers and clearing organization. The total amount of outstanding unsettled trade receivables and payables related to these instruments was $11.4 million and $7.3 million, respectively, as of December 31, 2010 compared $92.5 million and $90.2 million, respectively, as of December 31, 2009. Due to the extended settlement nature of most par and distressed bank loan transactions, we are subject to certain market and counterparty credit risks. See our discussion related to these risks included in the Quantitative and Qualitative Disclosures about Market Risk. The remaining components of the due from and to brokers, dealers, and clearing organizations includes receivables related to commissions and receivables and payables related to unsettled trades that are settled on a regular basis.
As of December 31, 2010, our $49.4 million of investments primarily consist of investments in non-public equity securities, marketable equity securities and investment funds. These investments are funded in cash and are not financed with debt. Accordingly, a decline in value of these assets, should it occur, would impact our return on our investment, however, it would not impact our current liquidity requirements.
Regulatory Capital
FBR & Co., our principal U.S. broker-dealer, is registered with the SEC and is a member of FINRA. Additionally, FBRIL, our U.K. broker-dealer, is registered with the FSA of the United Kingdom. As such, they are subject to the minimum net capital requirements promulgated by the SEC and FSA, respectively. As of December 31, 2010, FBR & Co. had total regulatory net capital of $59.0 million, which exceeded its required net capital of $4.6 million by $54.4 million. In addition, FBRIL had regulatory capital as defined in excess of required amounts. Regulatory net capital requirements increase when the broker-dealers are involved in underwriting activities based upon a percentage of the amount being underwritten.
Equity Transactions
During 2010, we repurchased 3.2 million shares of our common stock in open market transactions at a weighted average share price of $4.97 per share for a total cost of $15.9 million. In July 2010, the Board of Directors approved a 5.0 million share increase to the number of shares of our common stock that we are authorized to repurchase. As of December 31, 2010, the Company has remaining authority to repurchase up to 5.2 million additional shares.
In October 2009, Arlington Asset and related affiliates, our former majority shareholder, sold 14.8 million shares of our common stock in an underwritten public offering. This transaction represented the sale of the remainder of their ownership position in us.
In May 2009, we repurchased 16.7 million shares of our common stock from Arlington Asset at $4.35 per share, for a total cost of $72.5 million. In June 2009, we completed a follow-on public offering in which we sold 20.0 million shares, at $4.65 per share, which raised $90.1 million in new capital and in which Arlington Asset sold 1.5 million shares of our common stock at the same price. Together, these two transactions along with a subsequent exercise of an overallotment in July 2009, in which an additional 411 thousand shares owned by Arlington Asset were sold, reduced Arlington Asset’s ownership stake to approximately 23% at that time.
46
Table of Contents
Contractual Obligations
We have contractual obligations to make future payments in connection with non-cancelable lease agreements and other contractual commitments as well as uncalled capital commitments to an investment partnership that may be called over the next ten years. The following table sets forth these contractual obligations by fiscal year (dollars in thousands):
| 2011 | 2012 | 2013 | 2014 | 2015 | Thereafter | Total | ||||||||||||||||||||||
| Minimum rental commitments(1) |
$ | 10,246 | $ | 9,135 | $ | 9,026 | $ | 8,242 | $ | 1,908 | $ | 3,509 | $ | 42,066 | ||||||||||||||
| Capital commitments and other(2) |
150 | — | — | — | — | — | 150 | |||||||||||||||||||||
| Total Contractual Obligations |
$ | 10,396 | $ | 9,135 | $ | 9,026 | $ | 8,242 | $ | 1,908 | $ | 3,509 | $ | 42,216 | ||||||||||||||
| (1) | These commitments are for operating leases of the Company. The Company currently has no commitments associated with capital leases. |
| (2) | The table above excludes $0.4 million of uncalled capital commitments to an investment partnership that may be called over the next five years. This amount was excluded because the Company cannot currently determine when, if ever, the commitments will be called. Also, the table above does not include reserves for income taxes of $2.1 million that are not contractual obligations by nature. We cannot determine, with any degree of certainty, the amount that would be payable or the period of cash settlement to the respective taxing jurisdiction. |
Quantitative and Qualitative Disclosures about Market Risk
Overall Risk Management
We monitor market and business risk, including credit risk, operations, liquidity, compliance, legal, and reputational risk through a number of control procedures designed to identify and evaluate the various risks to which our business and investments are exposed. We have established various committees and processes to assess and to manage risk associated with our investment banking, trading, and merchant banking activities. We review, among other things, business and transactional risks associated with potential investment banking clients and engagements as well as our capital subjected to risk through our trading activities. We seek to manage the risks associated with our investment banking and merchant banking activities by review and approval of transactions by the relevant committee, prior to accepting an engagement or pursuing a material investment transaction.
Market Risk
Market risk is the risk that a change in the level of one or more market prices, rates, indices, or other market factors, such as market liquidity, will result in losses for a position or portfolio. Our activities as an underwriter, market maker and principal investor, as well as our activities as a financial intermediary in customer trading transactions, expose us to market risk.
We use a number of quantitative measures to manage our exposure to market risk in our trading businesses. These measures include:
Inventory position limits—we establish inventory position limits on gross and net positions, at both the trading desk and individual position level, and we monitor exposures against limits on a daily basis.
Scenario analysis—we apply stress tests and scenario analysis to estimate the potential impact on our trading revenues of highly stressful market environments in both the credit and equity markets.
Value at Risk—we utilize a statistical measure of potential trading loss, called Value at Risk (“VaR”), to estimate the potential loss from adverse market moves in an ordinary market environment. We also establish VaR limits, as appropriate.
47
Table of Contents
Value at Risk. We calculate VaR for our trading businesses using a historical simulation model that isolates various risk elements associated with each of our trading positions over a one-day time horizon and at a 95% confidence level. The simulation is based on data for the previous twelve months. This approach assumes that historical changes in market values are representative of future changes.
Using the results of this simulation, VaR measures the potential gains and losses on net trading positions at a 95% confidence level over a one-day time horizon. A 95% confidence level implies that, on average, we anticipate that 5% of the time we may realize trading losses in excess of our VaR amount. Our one-day 95% VaR at December 31, 2010 was approximately $323 thousand.
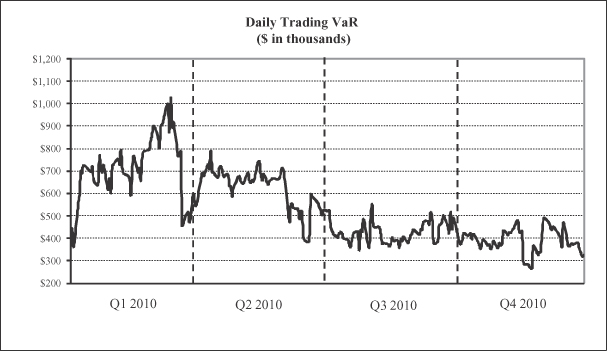
VaR is a model that quantifies potential losses using historical data. We could incur losses greater than the reported VaR because the historical market prices used may not be an accurate measure of future market events and conditions, especially in highly stressful market environments. In addition, the VaR model measures the risk of the current net trading positions and does not take into account future position changes arising from transaction and/or hedging activity. Our VaR includes positions actively managed and held by our trading desks and does not include positions associated with investment banking transactions that may be held on our trading desk in order to facilitate distribution. In most instances, these positions are held only for a short period and sold at or above our costs. To the extent we hold these positions on a long-term basis, they are reflected as long-term investments and risk related to these positions are discussed below under Equity Price Risk.
48
Table of Contents
The comparison of actual daily trading revenue fluctuations with a daily VaR estimate is the primary method used to test the reasonableness of the VaR measure. The following table provides the distribution of daily trading revenues and losses during the year ended December 31, 2010. The table shows data reflecting that the actual lowest 5 percentile daily trading revenues during the year ended December 31, 2010 was $146 thousand. Over the same period, the worst one-day trading revenues were $105 thousand which is below the $526 thousand daily trading loss implied by the average one-day VaR for 2010.
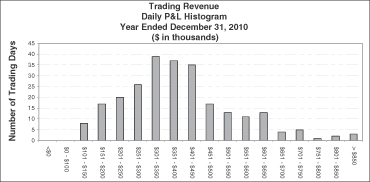
Equity Price Risk. Equity price risk represents the potential loss in value of a position due to adverse changes in the level or volatility of equity prices. We generally attempt to limit exposure to equity price risk on securities held as a result of our daily equity trading activities by limiting our intra-day and overnight inventory of trading securities to that needed to provide the appropriate level of liquidity in the securities for which we are a market maker. We also seek to manage these risks by diversifying exposures, controlling position sizes, and establishing economic hedges in related securities, principally through short sale transactions.
While it is impossible to project exactly what factors may affect the prices of equity securities and how much the effect might be, the impact of a ten percent increase and a ten percent decrease in the price of equities held by us would be as follows as of December 31, 2010. The fair value of the $14.2 million of trading equity securities held at our broker-dealer subsidiaries would increase or decrease to $15.6 million and $12.8 million, respectively, and the fair value of the $49.8 million of other equity investments would increase or decrease to $54.8 million and $44.8 million, respectively.
Except to the extent that we sell our equity securities designated as available-for-sale or our other equity investments, or a decrease in their fair value is deemed to be other-than-temporary, an increase or decrease in the fair value of those assets will not directly affect our earnings. However, an increase or decrease in the value of trading securities held by broker-dealer subsidiaries, investment securities designated as trading, or investment funds will directly affect our earnings.
Credit Risk. Our broker-dealer subsidiaries clear all of their securities transactions through a clearing broker on a fully disclosed basis. Pursuant to the terms of the agreements between our broker-dealer subsidiaries and the clearing broker, the clearing broker has the right to charge us for losses that result from a counterparty’s failure to fulfill its contractual obligations. As the right to charge us has no maximum amount and applies to all trades executed through the clearing broker, we believe there is no maximum amount assignable to this right. At December 31, 2010 and 2009, we have recorded no liabilities with regard to this right. During the years ended December 31, 2010, 2009 and 2008, we did not incur any significant costs, with regard to this right. In addition, we have the right to pursue collection of performance from the counterparties who do not perform under their contractual obligations. We monitor the credit standing of the clearing broker and all counterparties with which we conduct business.
We attempt to limit our credit spread risk by offsetting long or short positions in various related securities, but may also hedge credit risk exposure through the use of credit derivatives such as credit default swaps.
49
Table of Contents
Our due from and to brokers, dealers, and clearing organizations balances primarily represent unsettled trades associated with our credit sales and trading platform. These transactions include corporate bonds and syndicated loan trades. As part of this activity, we incur market and counterparty credit risk due to the extended settlement nature of most par and distressed bank loan transactions. Par loan and distressed loan trades have extended settlement periods due to the administrative and legal requirements associated with transferring title of such instruments. During this period whereby a trade has been executed but not settled, we are at risk if one of our counterparties defaults on a trade obligation and we have to meet this obligation at market prices that are adverse relative to the original trade. We manage this exposure by calculating the current and potential default exposure on each trade and by maintaining risk limits for each counterparty with whom we have outstanding bank loan trades.
The securities industry is subject to numerous risks, including the risk of loss associated with the underwriting, ownership, and trading of securities, and the risk of reduced revenues in periods of reduced demand for security offerings and activity in secondary trading markets. Changing economic and market trends may negatively impact the liquidity and value of our investments and the level of security offerings underwritten by us, which may adversely affect our revenues and profitability.
Our equity and debt investments include non-investment grade securities of privately held issuers with no ready markets. The concentration and illiquidity of these investments expose us to a higher degree of risk than associated with readily marketable securities.
Interest Rate Risk. Interest rate risk represents the potential loss in value of a position or portfolio from adverse changes in market interest rates. We are exposed to interest rate risk through our trading activities in convertible and fixed income securities, however, based on our daily monitoring of this risk, we believe we currently have limited exposure to interest rate risk in these activities.
Off-Balance Sheet Arrangements
Through indemnification provisions in agreements with clearing organizations, customer activities may expose us to off-balance sheet credit risk. Financial instruments may have to be purchased or sold at prevailing market prices in the event a customer fails to settle on a trade on its original terms or in the event cash and securities in customer margin accounts are not sufficient to fully cover customer obligations. We seek to manage the risks associated with customer activities through customer screening and selection procedures as well as through requirements on customers to maintain margin collateral in compliance with various regulations and clearing organization policies.
Critical Accounting Policies and Estimates
Our financial statements are prepared in conformity with U.S. Generally Accepted Accounting Principles (“GAAP”) and follow general practices within the industries in which we operate. The preparation of our financial statements requires us to make estimates and assumptions. These estimates and assumptions affect the reported amounts of assets and liabilities at the date of the financial statements and the reported amounts of revenues and expenses during the reporting period. Although we base our estimates and assumptions on historical experience, when available, market information, and on various other factors that we believe to be reasonable under the circumstances, management exercises significant judgment in the final determination of our estimates. Actual results may differ from these estimates.
Our significant accounting policies are presented in Note 2 to our consolidated financial statements. Our most critical policies that are both very important to the portrayal of our financial condition and results of operations and require management’s most difficult, subjective or complex judgments or estimates are discussed below.
50
Table of Contents
Fair Value of Financial Instruments
ASC 820 “Fair Value Measurements and Disclosures” (“ASC 820”) defines fair value as the price that would be received to sell an asset or paid to transfer a liability in an orderly transaction between market participants at the measurement date, not adjusted for transaction costs. ASC 820 also establishes a fair value hierarchy that prioritizes the inputs to valuation techniques used to measure fair value into three broad levels giving the highest priority to quoted prices in active markets for identical assets or liabilities (Level 1) and the lowest priority to unobservable inputs (Level 3) as described below:
Level 1 Inputs—Unadjusted quoted prices in active markets for identical assets or liabilities that are accessible by us;
Level 2 Inputs—Quoted prices in markets that are not active or financial instruments for which all significant inputs are observable, either directly or indirectly;
Level 3 Inputs—Unobservable inputs for the asset or liability, including significant assumptions by us and other market participants.
The Company determines fair values for the following assets and liabilities:
Equity securities, listed options, and exchange-traded funds—We classify marketable equity securities, listed options, and exchange-traded funds within Level 1 of the fair value hierarchy because quoted market prices are used to value these securities. Non-public equity securities are classified within Level 3 of the fair value hierarchy if enterprise values are used to value these securities. In determining the enterprise value, we analyze various financial, performance and market factors to estimate the value, including where applicable market trading activity, which may be reported by The PORTAL MarketSM, a subsidiary of The NASDAQ Stock Market, Inc.
Convertible and fixed income debt instruments—We classify convertible and fixed income debt instruments within Level 2 of the fair value hierarchy as they are valued using quoted market prices provided by a broker or dealer, or alternative pricing services that provide reasonable levels of price transparency.
Other—We invest in proprietary investment funds that are valued at NAV determined by the fund administrator. Investments in mutual funds are classified within Level 1 of the fair value hierarchy because investments within the funds are primarily exchange-traded securities and no restrictions exist on the redemption of the amounts invested by us. For investments in non-registered investment companies (private equity and fund of funds), we classify these investment within Level 3 as the underlying securities held by these investment companies are primarily private-equity securities and restrictions exist on the redemption of amounts invested by us. As a practical expedient, we rely on the NAV of these investments as their fair value. The NAVs that have been provided by investees are derived from the fair values of the underlying investments as of the reporting date.
Securities and Principal Investments
Trading securities and investments owned by our broker-dealer subsidiaries and securities sold but not yet purchased are recorded on a trade-date basis and carried at fair value. Realized and unrealized gains and losses from trading securities are reflected in principal transactions in the statements of operations. Realized and unrealized losses from such other investments are reflected in net investment income in the statements of operations.
Marketable equity, debt, and asset-backed securities held for investment purposes at non-broker-dealer subsidiaries are designated as either available-for-sale or trading investments pursuant to ASC 320, “Investments—Debt and Equity Securities” (“ASC 320”). These investments are carried at fair value with resulting unrealized gains and losses on available-for-sale securities reflected in accumulated other comprehensive income (loss) in the balance sheets and unrealized gains and losses on trading securities reflected in net investment income in the statements of operations. Investments in equity securities of non-public companies that are held in non-broker dealer subsidiaries are carried at cost.
51
Table of Contents
We evaluate available-for-sale securities and investments in securities of non-public companies carried at cost for other-than-temporary impairment at least on a quarterly basis, and more frequently when economic or market concerns warrant such evaluation. The value of our investments in marketable equity securities designated as available-for-sale can fluctuate significantly. The value of our investments in securities of non-public companies can also fluctuate significantly. Such values may be based on unobservable inputs, including significant assumptions by us and consideration of the liquidity and size of our position. In evaluating these investments for other-than-temporary impairment, consideration is given to (1) the length of time and the extent to which the fair value has been lower than carrying value, (2) the severity of the decline in fair value, (3) the financial condition and near-term prospects of the issuer, and (4) our intent and ability to retain our investment in the issuer for a period of time sufficient to allow for any anticipated recovery in fair value. If it is determined that an investment impairment is other-than-temporary then the amount that the fair value is below its current basis is recorded as an impairment charge and recorded through earnings in net investment income (loss) in the statement of operations.
For unrealized losses that are determined to be temporary, we continue to evaluate these at each reporting date. If we determine at a future date that an impairment of a marketable equity security is other-than-temporary, the applicable unrealized loss will be reclassified from accumulated other comprehensive income and recognized as an other-than-temporary impairment loss at the time the determination is made.
Realized gains and losses on sales of non-asset-backed securities are determined using the specific identification method. The Company held mortgage-backed securities for the year ended December 31, 2008 and through the period ended February 2009, realized gains and losses on these mortgage-backed securities transactions were determined based on average cost.
As of December 31, 2010, we held $3.6 million of investments in marketable equity securities accounted for under ASC 320 and $45.2 million of non-public equity securities held in non-broker dealer subsidiaries. As of December 31, 2010, we evaluated our portfolio of available-for-sale securities and investments in securities of non-public companies carried at cost for other-than-temporary impairments. Based on this evaluation, we do not consider any of our investments in loss positions to be other than temporarily impaired.
Accounting for Income Taxes
Deferred tax assets and liabilities represent the differences between the financial statement and income tax bases of assets and liabilities using enacted tax rates. The measurement of net deferred tax assets is adjusted by a valuation allowance if, based on our evaluation and our consideration of the guidance in ASC 740, it is more likely than not that they will not be realized. Our 2010 tax benefit reflects a full valuation allowance on tax benefits attributable to losses that are not realizable through loss carrybacks. At December 31, 2010, our net deferred tax assets totaled $88.4 million offset by a full valuation allowance. In addition, we have a $0.2 million net deferred tax liability due to the existence of a deferred tax liability on an indefinite-lived intangible which cannot serve as a source of future income for determination of our valuation allowance.
Intangible Assets
Our intangible assets consist of goodwill from a business combination and intangible assets with finite useful lives. Goodwill is not amortized but is tested annually for impairment (during the fourth quarter) or more frequently if an adverse event occurs that may indicate impairment. The assessment of goodwill is performed at the reporting unit level. The values of the intangible assets with finite useful lives are amortized in proportion to their expected economic benefit over their estimated useful life or straight-line if the economic benefit cannot be reliably determined. These intangible assets are periodically tested for impairment by comparing expected future gross cash flows to the asset’s carrying amount. If the expected gross cash flows are less than the carrying amount, the asset is impaired and is written-down to its fair value. The carrying value of goodwill and intangible assets with finite useful lives was $5.9 million and $2.6 million, respectively, as of December 31, 2010. As of December 31, 2010, there were no significant indicators of impairment relating to these assets.
52
Table of Contents
Recently Issued Accounting Pronouncements
See Note 2. Summary of Significant Accounting Policies—Recent Accounting Pronouncements included in our financial statements attached to this Form 10-K.
| ITEM 7A. | QUANTITATIVE AND QUALITATIVE DISCLOSURES ABOUT MARKET RISK |
See Part II, Item 7, of this Form 10-K “Management’s Discussion and Analysis of Financial Condition and Results of Operations—Quantitative and Qualitative Disclosures about Market Risk.”
| ITEM 8. | FINANCIAL STATEMENTS AND SUPPLEMENTARY DATA |
The information required by Part II, Item 8, of this Form 10-K appears in a subsequent section of this report. See “Index to Audited Consolidated Financial Statements of FBR Capital Markets Corporation” on page F-1.
| ITEM 9. | CHANGES IN AND DISAGREEMENTS WITH ACCOUNTANTS ON ACCOUNTING AND FINANCIAL DISCLOSURE |
None.
| ITEM 9A. | CONTROLS AND PROCEDURES |
Evaluation of Disclosure Controls and Procedures
As of the end of the period covered by this report on Form 10-K, our management carried out an evaluation, with the participation of our Chief Executive Officer, Richard J. Hendrix, and our Chief Financial Officer, Bradley J. Wright, of the effectiveness of our disclosure controls and procedures (as defined under Rule 13a-15(e) of the Securities Exchange Act of 1934, as amended (the “Exchange Act”)) pursuant to Rule 13a-15(b) of the Exchange Act. Based upon that evaluation, our Chief Executive Officer and our Chief Financial Officer concluded that our disclosure controls and procedures, as of December 31, 2010, are effective to ensure that information required to be disclosed by us in the reports that we file or submit under the Exchange Act is recorded, processed, summarized and reported, within the time periods specified in the SEC’s rules and forms, and that such information is accumulated and communicated to our management, including our Chief Executive Officer and Chief Financial Officer, as appropriate, to allow timely decisions regarding disclosure.
Management’s Annual Report on Internal Control Over Financial Reporting
The Company’s management is responsible for establishing and maintaining adequate internal control over financial reporting (as defined in Rule 13a-15(f) of the Exchange Act). The Company’s internal control over financial reporting is designed under the supervision of the firm’s Chief Executive Officer and Chief Financial Officer to provide reasonable assurance regarding the reliability of financial reporting and the preparation of the Company’s financial statements for external purposes in accordance with generally accepted accounting principles.
The Company’s internal control over financial reporting includes policies and procedures that pertain to the maintenance of records that, in reasonable detail, accurately and fairly reflect transactions and dispositions of assets; provide reasonable assurance that transactions are recorded as necessary to permit preparation of financial statements in accordance with generally accepted accounting principles, and that receipts and expenditures are being made only in accordance with authorizations of management and the directors; and provide reasonable assurance regarding prevention or timely detection of unauthorized acquisitions, use or disposition of the Company’s assets that could have a material effect on our financial statements.
Because of its inherent limitations, internal control over financial reporting may not prevent or detect misstatements. Also, projections of any evaluation of effectiveness to future periods are subject to the risk that controls may become inadequate because of changes in conditions, or that the degree of compliance with the policies and procedures may deteriorate.
53
Table of Contents
As of December 31, 2010, management conducted an assessment of the effectiveness of the Company’s internal control over financial reporting based on the framework established in Internal Control—Integrated Framework issued by the Committee of Sponsoring Organizations of the Treadway Commission (COSO). Based on this assessment, management has concluded that the Company maintained effective internal control over financial reporting as of December 31, 2010.
The effectiveness of the Company’s internal control over financial reporting as of December 31, 2010 has been audited by PricewaterhouseCoopers LLP, an independent registered public accounting firm, as stated in their report appearing on page F-2, which expresses an unqualified opinion on the effectiveness of the Company’s internal control over financial reporting as of December 31, 2010.
Changes in Internal Control Over Financial Reporting
There has been no change in our internal control over financial reporting during the quarter ended December 31, 2010 that has materially affected, or is reasonably likely to materially affect, our company’s internal control over financial reporting.
| ITEM 9B. | OTHER INFORMATION |
None.
54
Table of Contents
PART III
| ITEM 10. | DIRECTORS, EXECUTIVE OFFICERS AND CORPORATE GOVERNANCE |
The information required by Part III, Item 10, of this report on Form 10-K will be provided in our 2010 Proxy Statement and is hereby incorporated by reference.
| ITEM 11. | EXECUTIVE COMPENSATION |
The information required by Part III, Item 11, of this report on Form 10-K will be provided in our 2010 Proxy Statement and is hereby incorporated by reference.
| ITEM 12. | SECURITY OWNERSHIP OF CERTAIN BENEFICIAL OWNERS AND MANAGEMENT AND RELATED SHAREHOLDER MATTERS |
The information required by Part III, Item 12, of this report on Form 10-K will be provided in our 2010 Proxy Statement and is hereby incorporated by reference.
| ITEM 13. | CERTAIN RELATIONSHIPS AND RELATED TRANSACTIONS, AND DIRECTOR INDEPENDENCE |
The information required by Part III, Item 13, of this report on Form 10-K will be provided in our 2010 Proxy Statement and is hereby incorporated by reference.
| ITEM 14. | PRINCIPAL ACCOUNTANT FEES AND SERVICES |
The information required by Part III, Item 14, of this report on Form 10-K will be provided in our 2010 Proxy Statement and is hereby incorporated by reference.
55
Table of Contents
PART IV
| ITEM 15. | EXHIBITS AND FINANCIAL STATEMENT SCHEDULES |
We have filed the following documents as part of this report on Form 10-K:
1. Financial Statements. The audited consolidated financial statements of FBR Capital Markets Corporation required by Part II, Item 8, of this report on Form 10-K, which are listed on page F-1 of this report on Form 10-K, including the notes thereto and the report of PricewaterhouseCoopers LLP, our independent registered public accounting firm, thereon.
2. Financial Statement Schedules. We have not filed any financial statement schedules as part of this report on Form 10-K because these schedules are not required or because the information required to be included in these schedules has been included in the audited consolidated financial statements of FBR Capital Markets Corporation or the notes thereto.
3. Exhibits. The following exhibits have been filed as part of or incorporated by reference in this report on Form 10-K:
| Exhibit Number |
Description | |
| 3.1 | Amended and Restated Articles of Incorporation of the Registrant.(1) | |
| 3.2 | Amended and Restated Bylaws of the Registrant.(1) | |
| 4.1 | Form of Certificate for Common Stock.(3) | |
| 4.2 | Registration Rights Agreement, dated as of July 20, 2006, between the Registrant, Forest Holdings LLC and Forest Holdings (ERISA) LLC.(1) | |
| 4.3 | Registration Rights Agreement, dated January 26, 2009, between the Registrant and Friedman, Billings, Ramsey Group, Inc.(8) | |
| 4.4 | Form of Amended and Restated Voting Agreement, dated as of May 20, 2009, between Friedman, Billings, Ramsey Group, Inc., FBR TRS Holdings, Inc., FBR Capital Markets Corporation, Forest Holdings LLC and Forest Holdings (ERISA) LLC.(9) | |
| 4.5 | Form of Senior Indenture.(11) | |
| 4.6 | Form of Subordinated Indenture.(11) | |
| 4.7 | Form of Subscription Agreement by and between FBR Capital Markets Corporation and purchasers of common stock of FBR Capital Markets Corporation in connection with the closing of the transactions contemplated by the Watch Hill Purchase Agreement.(12) | |
| 10.1 | 2006 Long-Term Incentive Plan (as Amended and Restated Effective June 3, 2010).(13)† | |
| 10.2 | Form of Incentive Stock Option Agreement.(1)† | |
| 10.3 | Form of Non-Qualified Stock Option Agreement.(1)† | |
| 10.4 | Tax Sharing Agreement, dated as of July 20, 2006, between FBR TRS Holdings, Inc. and the Registrant.(1) | |
| 10.5 | Investment Agreement, dated as of July 19, 2006, among the Registrant, Forest Holdings LLC and Forest Holdings (ERISA) LLC.(1) | |
| 10.6 | Option Agreement, dated as of July 20, 2006, between the Registrant and Forest Holdings LLC.(1) | |
| 10.7 | Option Agreement, dated as of July 20, 2006, between the Registrant and Forest Holdings (ERISA) LLC.(1) | |
| 10.8 | Professional Services Agreement, dated as of July 20, 2006, between the Registrant and Crestview Advisors, L.L.C.(1) | |
56
Table of Contents
| Exhibit Number |
Description | |
| 10.9 | Amendment No. 2 to Professional Services Agreement, dated June 14, 2010, between Registrant and Crestview Advisors, L.L.C.(14) | |
| 10.10 | Form of Subscription Agreement with respect to the Registrant’s Director Stock Purchase Plan.(2)† | |
| 10.11 | 2007 Employee Stock Purchase Plan, amended as of April 23, 2007.(2)† | |
| 10.12 | Form of resolution of the Registrant’s Board of Directors with respect to the Registrant’s Director Stock Purchase Plan.(2)† | |
| 10.13 | Description of the Registrant’s 2008 Incentive Compensation Program.(4)† | |
| 10.14 | Retention Incentive Agreement, dated April 30, 2008, by and between the Registrant and Richard J. Hendrix.(5)† | |
| 10.15 | Employment Agreement, dated April 30, 2008, by and between the Registrant and Richard J. Hendrix.(5)† | |
| 10.16 | Form of Amendment to Original 2008 Performance RSU Award Agreement.(6)† | |
| 10.17 | Form of August 2008 Performance RSU Award Agreement.(6)† | |
| 10.18 | Form of Stock Option Agreement.(6)† | |
| 10.19 | Form of Restrictive Covenant Agreement.(6)† | |
| 10.20 | Retirement Agreement between the Registrant and Eric F. Billings, dated December 21, 2008.(7)† | |
| 10.21 | Director Agreement between the Registrant and Eric F. Billings, dated December 21, 2008.(7)† | |
| 10.22 | Stock Repurchase Agreement, dated as of May 18, 2009, by and among the Registrant, Friedman, Billings, Ramsey Group, Inc. (d/b/a Arlington Asset Investment Corp.), and FBR TRS Holdings, Inc.(9) | |
| 10.23 | Form of Transition Services Agreement by and between the Registrant and Friedman, Billings, Ramsey Group, Inc. (d/b/a Arlington Asset Investment Corp.).(9) | |
| 10.24 | Form of Assignment and Assumption Agreement by and between the Registrant and Friedman, Billings, Ramsey Group, Inc. (d/b/a Arlington Asset Investment Corp.).(9) | |
| 10.25 | Form of Trademark and Copyright Assignment by and between the Registrant and Friedman, Billings, Ramsey Group, Inc. (d/b/a Arlington Asset Investment Corp.).(9) | |
| 10.26 | Form of Domain Name Assignment by and between the Registrant and Friedman, Billings, Ramsey Group, Inc. (d/b/a Arlington Asset Investment Corp.).(9) | |
| 10.27 | Form of Trademark License Agreement by and between the Registrant and Friedman, Billings, Ramsey Group, Inc. (d/b/a Arlington Asset Investment Corp.).(9) | |
| 10.28 | Form of LTIP RSU Award Agreement.(10)† | |
| 10.29 | RSU Award Agreement, dated February 9, 2010, between the Registrant and Richard J. Hendrix.(10)† | |
| 10.30 | Stock Option Agreement, dated February 9, 2010, between the Registrant and Richard J. Hendrix.(10)† | |
| 10.31 | FBR Capital Markets Corporation 2010 Partner Leveraged Stock Purchase Program, as amended and restated.(10)† | |
57
Table of Contents
| Exhibit Number |
Description | |
| 12.1 | Statement regarding Computation of Ratio of Earnings to Fixed Charges.* | |
| 21.1 | Subsidiaries of the Registrant.* | |
| 23.1 | Consent of PricewaterhouseCoopers LLP.* | |
| 31.1 | Certification of Chief Executive Officer pursuant to Rule 13a-14(a)/15d-14(a), as adopted pursuant to Section 302 of the Sarbanes-Oxley Act of 2002.* | |
| 31.2 | Certification of Chief Financial Officer pursuant to Rule 13a-14(a)/15d-14(a), as adopted pursuant to Section 302 of the Sarbanes-Oxley Act of 2002.* | |
| 32.1 | Certification of Chief Executive Officer pursuant to 18 U.S.C. Section 1350, as adopted pursuant to Section 906 of the Sarbanes-Oxley Act of 2002.* | |
| 32.2 | Certification of Chief Financial Officer pursuant to 18 U.S.C. Section 1350, as adopted pursuant to Section 906 of the Sarbanes-Oxley Act of 2002.* | |
| (1) | Previously filed as an exhibit to the Registrant’s Registration Statement on Form S-1 (Registration No. 333-138824), which was filed with the SEC on November 17, 2006, and incorporated by reference herein. |
| (2) | Previously filed as an exhibit to Pre-Effective Amendment No. 1 to the Registrant’s Registration Statement on Form S-1/A (Registration No. 333-141987), which was filed with the SEC on May 10, 2007, and incorporated by reference herein. |
| (3) | Previously filed as an exhibit to Pre-Effective Amendment No. 2 to the Registrant’s Registration Statement on Form S-1/A (Registration No. 333-141987), which was filed with the SEC on May 21, 2007, and incorporated by reference herein. |
| (4) | Incorporated herein by reference to the description of such program included in Item 5.02 of the Registrant’s Current Report on Form 8-K, which was filed with the SEC on February 26, 2008. |
| (5) | Previously filed as an exhibit to the Registrant’s Quarterly Report on Form 10-Q for the quarterly period ended March 31, 2008, which was filed with the SEC on May 12, 2008, and incorporated herein by reference. |
| (6) | Previously filed as an exhibit to the Registrant’s Current Report on Form 8-K, which was filed with the SEC on August 21, 2008, and incorporated herein by reference. |
| (7) | Previously filed as an exhibit to the Registrant’s Current Report on Form 8-K, which was filed with the SEC on December 22, 2008, and incorporated herein by reference. |
| (8) | Previously filed as an exhibit to the Registrant’s Quarterly Report on Form 10-Q for the quarterly period ended March 31, 2009, which was filed with the SEC on May 8, 2009, and incorporated herein by reference. |
| (9) | Previously filed as an exhibit to the Registrant’s Current Report on Form 8-K, which was filed with the SEC on May 19, 2009, and incorporated herein by reference. |
| (10) | Previously filed as an exhibit to the Registrant’s Current Report on Form 8-K, which was filed with the SEC on February 16, 2010, and incorporated herein by reference. |
| (11) | Previously filed as an exhibit to Amendment No. 1 to the Registrant’s Registration Statement on Form S-3/A (Registration No. 333-159415), which was initially filed with the SEC on May 22, 2009, and incorporated herein by reference. |
| (12) | Previously filed as an exhibit to Amendment No. 1 to the Registrant’s Registration Statement on Form S-3/A (Registration No. 333-161416), which was initially filed with the SEC on August 18, 2009, as amended, and incorporated herein by reference. |
| (13) | Previously filed as an exhibit to the Registrant’s Current Report on Form 8-K, which was filed with the SEC on June 8, 2010, and incorporated herein by reference. |
| (14) | Previously filed as an exhibit to the Registrant’s Current Report on Form 8-K, which was filed with the SEC on June 14, 2010, and incorporated herein by reference. |
| * | Filed herewith. |
| † | Management contract or compensatory plan or arrangement. |
58
Table of Contents
Pursuant to the requirements of Section 13 or 15(d) of the Securities Exchange Act of 1934, the Registrant has duly caused this report to be signed on its behalf by the undersigned, thereunto duly authorized.
| FBR CAPITAL MARKETS CORPORATION | ||||||
| Date: March 15, 2011 | By: | /S/ RICHARD J. HENDRIX | ||||
| Richard J. Hendrix | ||||||
| Chief Executive Officer | ||||||
Pursuant to the requirements of the Securities Exchange Act of 1934, this report has been signed below by the following persons on behalf of the Registrant and in the capacities and on the dates indicated.
| SIGNATURE |
TITLE |
DATE | ||
| /S/ RICHARD J. HENDRIX RICHARD J. HENDRIX |
Chief Executive Officer and Director (principal executive officer) |
March 15, 2011 | ||
| /S/ BRADLEY J. WRIGHT BRADLEY J. WRIGHT |
Executive Vice President, Chief Financial Officer and Chief Administrative Officer (principal financial officer) |
March 15, 2011 | ||
| /S/ ROBERT J. KIERNAN ROBERT J. KIERNAN |
Senior Vice President, Controller and Chief Accounting Officer (principal accounting officer) | March 15, 2011 | ||
| /S/ ERIC F. BILLINGS ERIC F. BILLINGS |
Chairman and Director | March 15, 2011 | ||
| /S/ THOMAS J. HYNES, JR. THOMAS J. HYNES, JR. |
Director | March 15, 2011 | ||
| /S/ ADAM J. KLEIN ADAM J. KLEIN |
Director | March 15, 2011 | ||
| /S/ RICHARD A. KRAEMER RICHARD A. KRAEMER |
Director | March 15, 2011 | ||
| /S/ RALPH S. MICHAEL, III RALPH S. MICHAEL, III |
Director | March 15, 2011 | ||
| /S/ THOMAS S. MURPHY, JR. THOMAS S. MURPHY, JR. |
Director | March 15, 2011 | ||
| /S/ ARTHUR J. REIMERS ARTHUR J. REIMERS |
Director | March 15, 2011 | ||
59
Table of Contents
FBR CAPITAL MARKETS CORPORATION
INDEX TO AUDITED CONSOLIDATED FINANCIAL STATEMENTS
F-1
Table of Contents
Report of Independent Registered Public Accounting Firm
To The Board of Directors and Shareholders of
FBR Capital Markets Corporation:
In our opinion, the accompanying consolidated balance sheets and the related consolidated statements of operations, of changes in shareholders’ equity and of cash flows present fairly, in all material respects, the financial position of FBR Capital Markets Corporation and its subsidiaries (the “Company”) at December 31, 2010 and 2009, and the results of their operations and their cash flows for each of the three years in the period ended December 31, 2010, in conformity with accounting principles generally accepted in the United States of America. Also in our opinion, the Company maintained, in all material respects, effective internal control over financial reporting as of December 31, 2010, based on criteria established in Internal Control—Integrated Framework issued by the Committee of Sponsoring Organizations of the Treadway Commission (COSO). The Company’s management is responsible for these financial statements, for maintaining effective internal control over financial reporting and for its assessment of the effectiveness of internal control over financial reporting, included in Management’s Report on Internal Control over Financial Reporting appearing under Item 9A. Our responsibility is to express opinions on these financial statements and on the Company’s internal control over financial reporting based on our integrated audits. We conducted our audits in accordance with the standards of the Public Company Accounting Oversight Board (United States). Those standards require that we plan and perform the audits to obtain reasonable assurance about whether the financial statements are free of material misstatement and whether effective internal control over financial reporting was maintained in all material respects. Our audits of the financial statements included examining, on a test basis, evidence supporting the amounts and disclosures in the financial statements, assessing the accounting principles used and significant estimates made by management, and evaluating the overall financial statement presentation. Our audit of internal control over financial reporting included obtaining an understanding of internal control over financial reporting, assessing the risk that a material weakness exists, and testing and evaluating the design and operating effectiveness of internal control based on the assessed risk. Our audits also included performing such other procedures as we considered necessary in the circumstances. We believe that our audits provide a reasonable basis for our opinions.
A company’s internal control over financial reporting is a process designed to provide reasonable assurance regarding the reliability of financial reporting and the preparation of financial statements for external purposes in accordance with generally accepted accounting principles. A company’s internal control over financial reporting includes those policies and procedures that (i) pertain to the maintenance of records that, in reasonable detail, accurately and fairly reflect the transactions and dispositions of the assets of the company; (ii) provide reasonable assurance that transactions are recorded as necessary to permit preparation of financial statements in accordance with generally accepted accounting principles, and that receipts and expenditures of the company are being made only in accordance with authorizations of management and directors of the company; and (iii) provide reasonable assurance regarding prevention or timely detection of unauthorized acquisition, use, or disposition of the company’s assets that could have a material effect on the financial statements.
Because of its inherent limitations, internal control over financial reporting may not prevent or detect misstatements. Also, projections of any evaluation of effectiveness to future periods are subject to the risk that controls may become inadequate because of changes in conditions, or that the degree of compliance with the policies or procedures may deteriorate.
/s/ PricewaterhouseCoopers LLP
McLean, Virginia
March 15, 2011
F-2
Table of Contents
FBR CAPITAL MARKETS CORPORATION
Consolidated Balance Sheets
(Dollars in thousands)
| December 31, | ||||||||
| 2010 | 2009 | |||||||
| Assets |
||||||||
| Cash and cash equivalents |
$ | 236,077 | $ | 275,506 | ||||
| Receivables: |
||||||||
| Due from brokers, dealers and clearing organizations |
15,463 | 96,477 | ||||||
| Customers |
10,280 | 6,425 | ||||||
| Due from affiliates |
701 | 567 | ||||||
| Other |
10,934 | 8,759 | ||||||
| Financial instruments owned, at fair value |
86,400 | 104,124 | ||||||
| Other investments, at cost |
45,224 | 33,974 | ||||||
| Goodwill |
5,882 | 5,882 | ||||||
| Intangible assets, net |
2,583 | 2,542 | ||||||
| Furniture, equipment, software, and leasehold improvements, net of accumulated depreciation and amortization |
9,741 | 15,172 | ||||||
| Prepaid expenses and other assets |
8,182 | 6,897 | ||||||
| Total assets |
$ | 431,467 | $ | 556,325 | ||||
| Liabilities and Shareholders’ Equity |
||||||||
| Liabilities |
||||||||
| Securities sold but not yet purchased, at fair value |
$ | 55,444 | $ | 51,669 | ||||
| Accrued compensation and benefits |
53,305 | 72,537 | ||||||
| Accounts payable, accrued expenses and other liabilities |
23,904 | 22,452 | ||||||
| Due to brokers, dealers and clearing organizations |
7,323 | 90,168 | ||||||
| Total liabilities |
139,976 | 236,826 | ||||||
| Commitments and Contingencies (Note 11) |
||||||||
| Shareholders’ equity |
||||||||
| Preferred Stock, $0.001 par value 100,000,000 authorized, none issued and outstanding |
— | — | ||||||
| Common stock, $0.001 par value, 300,000,000 shares authorized, 61,717,837 and 64,064,784 shares issued and outstanding, respectively |
62 | 64 | ||||||
| Additional paid-in capital |
424,641 | 429,052 | ||||||
| Employee stock loan receivable, including accrued interest (115,950 and 57,500 shares, respectively) |
(706 | ) | (391 | ) | ||||
| Restricted stock units |
34,239 | 19,979 | ||||||
| Accumulated other comprehensive loss, net of taxes |
(53 | ) | (71 | ) | ||||
| Accumulated deficit |
(166,692 | ) | (129,134 | ) | ||||
| Total shareholders’ equity |
291,491 | 319,499 | ||||||
| Total liabilities and shareholders’ equity |
$ | 431,467 | $ | 556,325 | ||||
The accompanying notes are an integral part of these consolidated financial statements.
F-3
Table of Contents
FBR CAPITAL MARKETS CORPORATION
Consolidated Statements of Operations
(Dollars in thousands except per share amounts)
| Year Ended December 31, | ||||||||||||
| 2010 | 2009 | 2008 | ||||||||||
| Revenues: |
||||||||||||
| Investment banking: |
||||||||||||
| Capital raising |
$ | 98,768 | $ | 121,007 | $ | 76,377 | ||||||
| Advisory |
19,505 | 17,716 | 20,573 | |||||||||
| Institutional brokerage: |
||||||||||||
| Principal transactions |
22,227 | 40,271 | 20,261 | |||||||||
| Agency commissions |
77,864 | 92,864 | 118,314 | |||||||||
| Asset management fees |
14,097 | 13,244 | 15,883 | |||||||||
| Net investment income (loss) |
9,218 | 1,577 | (81,335 | ) | ||||||||
| Interest income, dividends, and other |
4,908 | 5,806 | 24,292 | |||||||||
| Total revenues |
246,587 | 292,485 | 194,365 | |||||||||
| Interest expense |
— | 252 | 12,457 | |||||||||
| Revenues, net of interest expense |
246,587 | 292,233 | 181,908 | |||||||||
| Non-Interest Expenses: |
||||||||||||
| Compensation and benefits |
182,430 | 193,017 | 227,114 | |||||||||
| Professional services |
18,529 | 23,971 | 34,895 | |||||||||
| Business development |
14,936 | 13,770 | 30,057 | |||||||||
| Clearing and brokerage fees |
13,129 | 13,945 | 14,010 | |||||||||
| Occupancy and equipment |
25,595 | 33,655 | 33,244 | |||||||||
| Communications |
20,067 | 21,304 | 24,183 | |||||||||
| Impairment of intangible assets |
— | 5,350 | — | |||||||||
| Other operating expenses |
13,563 | 16,210 | 16,625 | |||||||||
| Total non-interest expenses |
288,249 | 321,222 | 380,128 | |||||||||
| Loss before income taxes |
(41,662 | ) | (28,989 | ) | (198,220 | ) | ||||||
| Income tax benefit |
(4,104 | ) | (1,338 | ) | (3,490 | ) | ||||||
| Net loss |
$ | (37,558 | ) | $ | (27,651 | ) | $ | (194,730 | ) | |||
| Basic and diluted loss per share |
$ | (0.59 | ) | $ | (0.46 | ) | $ | (3.09 | ) | |||
| Basic weighted average shares outstanding (in thousands) |
63,546 | 60,094 | 63,056 | |||||||||
| Diluted weighted average shares outstanding (in thousands) |
63,546 | 60,094 | 63,056 | |||||||||
The accompanying notes are an integral part of these consolidated financial statements.
F-4
Table of Contents
FBR CAPITAL MARKETS CORPORATION
Consolidated Statements of Changes in Shareholders’ Equity
(Dollars and shares in thousands)
| Common Stock Shares |
Common Stock Amount |
Additional Paid-in Capital |
Restricted Stock Units |
Employee Stock Loan Receivable |
Accumulated Other Comprehensive Income (Loss) |
Retained Earnings (Accumulated Deficit) |
Total | Comprehensive Loss |
||||||||||||||||||||||||||||
| Balances at December 31, 2007 |
66,003 | $ | 66 | $ | 412,805 | $ | — | $ | — | $ | 622 | $ | 93,247 | $ | 506,740 | |||||||||||||||||||||
| Net loss |
— | — | — | — | — | — | (194,730 | ) | (194,730 | ) | $ | (194,730 | ) | |||||||||||||||||||||||
| Reimbursement to affiliates |
— | — | (183 | ) | — | — | — | — | (183 | ) | ||||||||||||||||||||||||||
| Issuance of common stock, net of forfeitures |
538 | 1 | 11,453 | — | — | — | — | 11,454 | ||||||||||||||||||||||||||||
| Repurchase of common stock |
(6,749 | ) | (7 | ) | (33,893 | ) | — | — | — | — | (33,900 | ) | ||||||||||||||||||||||||
| Stock compensation expense for options granted to purchase common stock |
— | — | 5,877 | — | — | — | — | 5,877 | ||||||||||||||||||||||||||||
| Issuance of restricted stock units |
— | — | — | 9,309 | — | — | — | 9,309 | ||||||||||||||||||||||||||||
| Other comprehensive income (loss): |
||||||||||||||||||||||||||||||||||||
| Change in unrealized gain (loss) on available-for-sale investment securities, net of taxes |
— | — | — | — | — | (840 | ) | — | (840 | ) | (840 | ) | ||||||||||||||||||||||||
| Comprehensive loss |
$ | (195,570 | ) | |||||||||||||||||||||||||||||||||
| Balances at December 31, 2008 |
59,792 | $ | 60 | $ | 396,059 | $ | 9,309 | $ | — | $ | (218 | ) | $ | (101,483 | ) | $ | 303,727 | |||||||||||||||||||
| Net loss |
— | — | — | — | — | — | (27,651 | ) | (27,651 | ) | $ | (27,651 | ) | |||||||||||||||||||||||
| Contribution from FBR TRS Holdings, Inc. |
— | — | 34 | — | — | — | — | 34 | ||||||||||||||||||||||||||||
| Issuance of common stock, net of forfeitures |
20,940 | 21 | 100,852 | (1,540 | ) | (391 | ) | — | — | 98,942 | ||||||||||||||||||||||||||
| Repurchase of common stock |
(16,667 | ) | (17 | ) | (73,455 | ) | — | — | — | — | (73,472 | ) | ||||||||||||||||||||||||
| Stock compensation expense for options granted to purchase common stock |
— | — | 5,562 | — | — | — | — | 5,562 | ||||||||||||||||||||||||||||
| Issuance of restricted stock units |
— | — | — | 12,210 | — | — | — | 12,210 | ||||||||||||||||||||||||||||
| Other comprehensive income (loss): |
||||||||||||||||||||||||||||||||||||
| Change in unrealized gain (loss) on available-for-sale investment securities, net of taxes |
— | — | — | — | — | 147 | — | 147 | 147 | |||||||||||||||||||||||||||
| Comprehensive loss |
$ | (27,504 | ) | |||||||||||||||||||||||||||||||||
| Balances at December 31, 2009 |
64,065 | $ | 64 | $ | 429,052 | $ | 19,979 | $ | (391 | ) | $ | (71 | ) | $ | (129,134 | ) | $ | 319,499 | ||||||||||||||||||
| Net loss |
— | — | — | — | — | — | (37,558 | ) | (37,558 | ) | $ | (37,558 | ) | |||||||||||||||||||||||
| Issuance of common stock, net of forfeitures |
850 | 1 | 6,655 | (4,453 | ) | (315 | ) | — | — | 1,888 | ||||||||||||||||||||||||||
| Repurchase of common stock |
(3,197 | ) | (3 | ) | (15,902 | ) | — | — | — | — | (15,905 | ) | ||||||||||||||||||||||||
| Stock compensation expense for options granted to purchase common stock |
— | — | 4,836 | — | — | — | — | 4,836 | ||||||||||||||||||||||||||||
| Issuance of restricted stock units |
— | — | — | 18,713 | — | — | — | 18,713 | ||||||||||||||||||||||||||||
| Other comprehensive income (loss): |
||||||||||||||||||||||||||||||||||||
| Change in unrealized gain (loss) on available-for-sale investment securities, net of taxes |
— | — | — | — | — | 18 | — | 18 | 18 | |||||||||||||||||||||||||||
| Comprehensive loss |
$ | (37,540 | ) | |||||||||||||||||||||||||||||||||
| Balances at December 31, 2010 |
61,718 | $ | 62 | $ | 424,641 | $ | 34,239 | $ | (706 | ) | $ | (53 | ) | $ | (166,692 | ) | $ | 291,491 | ||||||||||||||||||
The accompanying notes are an integral part of these consolidated financial statements.
F-5
Table of Contents
FBR CAPITAL MARKETS CORPORATION
Consolidated Statements of Cash Flows
(Dollars in thousands)
| Year Ended December 31, | ||||||||||||
| 2010 | 2009 | 2008 | ||||||||||
| Cash flows from operating activities |
||||||||||||
| Net loss |
$ | (37,558 | ) | $ | (27,651 | ) | $ | (194,730 | ) | |||
| Adjustments to reconcile net loss to net cash (used in) provided by operating activities |
||||||||||||
| Depreciation and amortization |
7,471 | 10,983 | 10,814 | |||||||||
| Income tax provision—deferred |
149 | 356 | 17,698 | |||||||||
| Net investment (income) loss from investments and mortgage-backed securities. |
(9,218 | ) | (1,577 | ) | 81,335 | |||||||
| Stock compensation |
20,237 | 20,200 | 18,953 | |||||||||
| Impairment of intangible assets |
— | 5,350 | — | |||||||||
| Securities received in lieu of cash |
(14,068 | ) | — | — | ||||||||
| Other |
1,955 | 1,704 | 451 | |||||||||
| Changes in operating assets |
||||||||||||
| Receivables |
||||||||||||
| Brokers, dealers and clearing organizations |
81,014 | (96,476 | ) | — | ||||||||
| Customers |
(4,821 | ) | (3,573 | ) | (5,352 | ) | ||||||
| Affiliates |
36 | 2,506 | 3,493 | |||||||||
| Interest, dividends and other |
(2,137 | ) | 17,108 | (7,607 | ) | |||||||
| Trading account securities |
12,708 | (76,525 | ) | (10,067 | ) | |||||||
| Prepaid expenses and other assets |
(1,434 | ) | 7,167 | 2,502 | ||||||||
| Changes in operating liabilities |
||||||||||||
| Trading account securities sold but not yet purchased |
11,331 | 35,788 | 8,118 | |||||||||
| Accounts payable, accrued expenses and other liabilities |
(1,488 | ) | (4,495 | ) | (5,288 | ) | ||||||
| Accrued compensation and benefits |
(14,770 | ) | 31,282 | 4,785 | ||||||||
| Brokers, dealers and clearing organizations |
(82,845 | ) | 87,159 | (3,988 | ) | |||||||
| Net cash (used in) provided by operating activities |
(33,438 | ) | 9,306 | (78,883 | ) | |||||||
| Cash flows from investing activities |
||||||||||||
| Purchases of investment securities and other investments |
(32,855 | ) | (10,150 | ) | (6,748 | ) | ||||||
| Proceeds from sales of and distributions from investments |
51,672 | 12,009 | 16,894 | |||||||||
| Securities sold but not yet purchased, net |
(7,812 | ) | 5,933 | — | ||||||||
| Purchases of furniture, equipment, software, and leasehold improvements |
(2,777 | ) | (1,336 | ) | (4,780 | ) | ||||||
| Acquisition of net assets |
(488 | ) | (3,311 | ) | (461 | ) | ||||||
| Purchases of mortgage-backed securities |
— | — | (899,953 | ) | ||||||||
| Receipt of principal payments on mortgage-backed securities |
— | 2,441 | 54,380 | |||||||||
| Proceeds from sales of mortgage-backed securities |
— | 450,396 | 360,930 | |||||||||
| Net cash provided by (used in) investing activities |
7,740 | 455,982 | (479,738 | ) | ||||||||
| Cash flows from financing activities |
||||||||||||
| Repurchases of common stock |
(15,905 | ) | (73,472 | ) | (33,900 | ) | ||||||
| Proceeds from sales of common stock |
2,140 | 91,926 | 791 | |||||||||
| Proceeds from repayment of employee stock purchase plan. |
34 | — | — | |||||||||
| Decrease in due to affiliates, net |
— | — | (64 | ) | ||||||||
| (Repayment of) proceeds from repurchase agreements, net |
— | (416,037 | ) | 416,037 | ||||||||
| Net cash (used in) provided by financing activities |
(13,731 | ) | (397,583 | ) | 382,864 | |||||||
| Cash and cash equivalents |
||||||||||||
| Net (decrease) increase in cash and cash equivalents |
(39,429 | ) | 67,705 | (175,757 | ) | |||||||
| Cash and cash equivalents, beginning of period |
275,506 | 207,801 | 383,558 | |||||||||
| Cash and cash equivalents, end of period |
$ | 236,077 | $ | 275,506 | $ | 207,801 | ||||||
| Supplemental cash flows disclosures |
||||||||||||
| Income tax payments |
$ | 5,077 | $ | 25 | $ | 563 | ||||||
| Interest payments |
— | 255 | 12,384 | |||||||||
| Non-cash operating activities |
||||||||||||
| Securities received in exchange for services provided, fair value at receipt date |
$ | 14,068 | $ | — | $ | 5,000 | ||||||
The accompanying notes are an integral part of these consolidated financial statements.
F-6
Table of Contents
FBR CAPITAL MARKETS CORPORATION
Notes to Consolidated Financial Statements
(Dollars in thousands, except per share amounts)
Note 1. Organization and Nature of Operations:
Organization
FBR Capital Markets Corporation (the “Company”), a Virginia corporation, is a holding Company of which the principal operating companies are FBR Capital Markets & Co. (“FBR & Co”), FBR Capital Markets International, Ltd. (“FBRIL”), FBR Capital Markets LT, Inc. (“FBRLT”), FBR Fund Advisers, Inc. (“FBRFA”), FBR Investment Services, Inc. (“FBRIS”) and FBR Capital Markets PT, Inc. (“FBRPT”).
FBR & Co. is an SEC-registered broker-dealer and member of Financial Industry Regulatory Authority Inc. (“FINRA”). FBR & Co. acts as an introducing broker and forwards all transactions to clearing brokers on a fully disclosed basis. FBR & Co. does not hold funds or securities for, nor owe funds or securities to, customers. In addition, FBR & Co. provides capital raising and advisory services. FBRIL, headquartered in United Kingdom, is an introducing broker-dealer registered with the Financial Services Authority (“FSA”) of the United Kingdom. The Company conducts its syndicated loan trading activity at FBRLT.
FBRFA is an SEC-registered investment adviser that manages The FBR Funds, a family of mutual funds. FBRIS, an SEC-registered broker-dealer and member of FINRA, is the Distributor of The FBR Funds.
FBRPT holds and manages the Company’s portfolio of investments which includes certain merchant banking investments.
Prior to May 2009, the Company was a majority-owned subsidiary of Arlington Asset Investment Corp. (“Arlington Asset”), a separate publicly-traded corporation (NYSE:AI). In May 2009, the Company repurchased 16,667,000 of its common stock at a share price of $4.35 from Arlington Asset. Subsequent to this share repurchase, Arlington Asset was no longer the majority-owner of the Company.
In October 2009, Arlington Asset sold its remaining 14,755,017 shares of the Company’s common stock at $6.00 per share in a secondary public offering. As a result of the repurchase and secondary offering of shares of the Company’s common stock, Arlington Asset no longer maintains any ownership interest in the Company.
Nature of Operations
The Company’s principal business activities, including capital raising, securities sales and trading, merger, acquisition and advisory services, proprietary investments, and other asset management services, are all linked to the capital markets.
The Company’s investment banking and institutional brokerage business activities are primarily focused on small- and mid-cap stocks in the following industry sectors: consumer, diversified industrials, energy and natural resources, financial institutions, healthcare, insurance, real estate, and technology, media and telecommunications (“TMT”) sectors. By their nature, the Company’s business activities are conducted in markets which are highly competitive and are subject to general market conditions, volatile trading markets and fluctuations in the volume of market activity, as well as conditions affecting the companies and markets in the Company’s areas of focus.
The Company’s revenues from investment banking and fees from asset management are subject to substantial fluctuations due to a variety of factors that cannot be predicted with great certainty, including the overall condition of the economy and the securities markets as a whole and of the sectors on which the Company
F-7
Table of Contents
focuses. Fluctuations also occur due to the level of market activity, which, among other things, affects the flow of investment dollars and the size, number and timing of transactions. As a result, net income and revenues may vary significantly from period to period and year-to-year.
Concentration of Risk
A substantial portion of the Company’s investment banking revenues may be derived from a small number of transactions or issues or may be concentrated in a particular industry. For the years ended December 31, 2010, 2009 and 2008 investment banking revenue accounted for 48.0%, 47.5% and 53.3%, respectively, of the Company’s revenues, net of interest expense. For the year ended December 31, 2008, revenues net of interest expense includes a net investment loss of $81,335. This net investment loss has a significant impact on the comparability of the 2008 percentage to other years.
Note 2. Summary of Significant Accounting Policies:
Principles of Consolidated Financial Statements
The consolidated financial statements include the accounts of the Company and its wholly-owned subsidiaries. All significant intercompany accounts and transactions have been eliminated.
Certain reclassifications have been made to previously reported balances on the balance sheet to conform to the current presentation. These reclassifications had no impact on total assets, liabilities, or shareholders’ equity as of December 31, 2010 and 2009.
Use of Estimates
The preparation of the Company’s financial statements, in conformity with accounting principles generally accepted in the United States of America, requires us to make estimates and assumptions affecting the reported amounts of assets and liabilities at the date of the financial statements and the reported amounts of revenues and expenses during the reporting period. Although we base our estimates and assumptions on historical experience and market information (when available) and on various other factors that we believe to be reasonable under the circumstances, management exercises significant judgment in the final determination of our estimates. Actual results may differ from these estimates.
Cash Equivalents
Cash equivalents include demand deposits with banks, money market accounts and highly liquid investments with original maturities of three months or less that are not held for sale in the ordinary course of business. As of December 31, 2010 and 2009, approximately 38% and 74%, respectively, of the Company’s cash equivalents were invested in money market funds that invest primarily in U.S. Treasuries and other securities backed by the U.S. government.
Fair Value of Financial Instruments
ASC 820 “Fair Value Measurements and Disclosures” (“ASC 820”) defines fair value as the price that would be received to sell an asset or paid to transfer a liability in an orderly transaction between market participants at the measurement date, not adjusted for transaction costs. ASC 820 also establishes a fair value hierarchy that prioritizes the inputs to valuation techniques used to measure fair value into three broad levels giving the highest priority to quoted prices in active markets for identical assets or liabilities (Level 1) and the lowest priority to unobservable inputs (Level 3) as described below:
Level 1 Inputs—Unadjusted quoted prices in active markets for identical assets or liabilities that are accessible by the Company;
F-8
Table of Contents
Level 2 Inputs—Quoted prices in markets that are not active or financial instruments for which all significant inputs are observable, either directly or indirectly;
Level 3 Inputs—Unobservable inputs for the asset or liability, including significant assumptions of the company and other market participants.
The Company determines fair values for the following assets and liabilities:
Equity, listed option, and exchange-traded fund securities—The Company classifies marketable equity securities, listed options, and exchange-traded funds within Level 1 of the fair value hierarchy because quoted market prices are used to value these securities. Non-public equity securities are classified within Level 3 of the fair value hierarchy if enterprise values are used to value these securities. In determining the enterprise value, the Company analyzes various financial, performance and market factors to estimate the value, including where applicable market trading activity, which may be reported by The PORTAL MarketSM, a subsidiary of The NASDAQ Stock Market, Inc.
Convertible and fixed income debt instruments—The Company classifies convertible and fixed income debt instruments within Level 2 of the fair value hierarchy as they are valued using quoted market prices provided by a broker or dealer, or alternative pricing services that provide reasonable levels of price transparency.
Other—The Company invests in proprietary investment funds that are valued at net asset value (“NAV”) determined by the fund administrator. Investments in mutual funds are classified within Level 1 of the fair value hierarchy because investments within the funds are primarily exchange-traded securities and no restrictions exist on the redemption of the amounts invested by the Company. For investments in non-registered investment companies (private equity and fund of funds), the Company classifies these investment within Level 3 as the underlying securities held by these investment companies are primarily private-equity securities and restrictions exist on the redemption of amounts invested by the Company.
As a practical expedient, the Company relies on the NAV of these investments as their fair value. The NAVs that have been provided by investees are derived from the fair values of the underlying investments as of the reporting date.
The estimated fair values of the Company’s financial instruments are as follows:
| December 31, 2010 | December 31, 2009 | |||||||||||||||
| Carrying Amount |
Estimated Fair Value |
Carrying Amount |
Estimated Fair Value |
|||||||||||||
| Financial assets |
||||||||||||||||
| Cash and cash equivalents |
$ | 236,077 | $ | 236,077 | $ | 275,506 | $ | 275,506 | ||||||||
| Non-interest bearing receivables |
21,915 | 21,915 | 15,751 | 15,751 | ||||||||||||
| Financial instruments owned, at fair value |
86,400 | 86,400 | 104,124 | 104,124 | ||||||||||||
| Other investments, at cost |
45,224 | 45,224 | 33,974 | 33,974 | ||||||||||||
| Financial liabilities |
||||||||||||||||
| Securities sold but not yet purchased, at fair value |
55,444 | 55,444 | 51,669 | 51,669 | ||||||||||||
Securities and Principal Investments
Trading securities and investments owned by the Company’s broker-dealer subsidiaries and securities sold but not yet purchased are recorded on a trade-date basis and carried at fair value. Realized and unrealized gains and losses from trading securities are reflected in principal transactions in the statements of operations. Realized and unrealized losses from such long term investments are reflected in net investment income in the statements of operations.
F-9
Table of Contents
Marketable equity, debt, and asset-backed securities held for investment purposes at non-broker-dealer subsidiaries are designated as either available-for-sale or trading investments pursuant to Accounting Standards Codification (“ASC”) 320 “Investments—Debt and Equity Securities” (“ASC 320”). These investments are carried at fair value with resulting unrealized gains and losses on available-for-sale securities reflected in accumulated other comprehensive income (loss) in the balance sheets and unrealized gains and losses on trading securities reflected in net investment income in the statements of operations. Investments in equity securities of non-public companies that are held in non-broker dealer subsidiaries are carried at cost.
The Company evaluates available-for-sale securities and investments in securities of non-public companies carried at cost for other-than-temporary impairment at least on a quarterly basis, and more frequently when economic or market concerns warrant such evaluation. The value of our investments in marketable equity securities designated as available-for-sale can fluctuate significantly. The value of our investments in securities of non-public companies can also fluctuate significantly. Such values may be based on unobservable inputs, including significant assumptions of the Company and consideration of the liquidity and size of the Company’s position. In evaluating these investments for other-than-temporary impairment, consideration is given to (1) the length of time and the extent to which the fair value has been lower than carrying value, (2) the severity of the decline in fair value, (3) the financial condition and near-term prospects of the issuer, and (4) our intent and ability to retain our investment in the issuer for a period of time sufficient to allow for any anticipated recovery in fair value. If it is determined that an investment impairment is other-than-temporary then the amount that the fair value is below its current basis is recorded as an impairment charge and recorded through earnings in net investment income (loss) in the statement of operations.
For unrealized losses that are determined to be temporary, we continue to evaluate these at each reporting date. If we determine at a future date that an impairment of a marketable equity security is other-than-temporary, the applicable unrealized loss will be reclassified from accumulated other comprehensive income and recognized as an other-than-temporary impairment loss at the time the determination is made.
Realized gains and losses on sales of equity securities are determined using the specific identification method. The Company held mortgage-backed securities for the year ended December 31, 2008 and through the period ended February 2009, realized gains and losses on these mortgage-backed securities transactions were determined based on average cost.
For restricted shares, including private company shares, these investments by their nature have limited or no price transparency. Adjustments to carrying value may be based on third-party transactions evidencing a change in value and output from the Company’s valuation models and estimates of fair value. In reaching that determination, the Company may consider factors such as, but not limited to, the financial performance of the companies relative to projections, trends within sectors, underlying business models and expected exit timing and strategy.
The Company’s investments in proprietary investment funds includes mutual funds, private equity and fund of funds. These investments are comprised of registered and non-registered investment companies that report a net asset value or equivalent (“NAV”) to investors representing the fair value of the underlying investments held by the funds. The Company reflects the increase/decrease in NAV (including realized and unrealized gains and losses) in net investment income in the statements of operations.
The private investment funds are non-registered investment companies that record their investments in securities at fair value. Certain investments consist of equity investments in securities of development-stage and early-stage privately and publicly held companies. The disposition of these investments may be restricted due to the lack of a ready market or due to contractual or regulatory restrictions on disposition. In addition, these securities may represent significant portions of the issuer’s equity and carry special contractual privileges not available to other security holders. As a result of these factors, precise valuation for the restricted public securities and private company securities is a matter of judgment, and the determination of fair value must be
F-10
Table of Contents
considered only an approximation and may vary significantly from the amounts that could be realized if the investment were sold or from the value that would have been used had a ready market existed for the securities and those differences could be material.
Due from/to Brokers, Dealers, and Clearing Organizations
The Company clears all of its proprietary and customer transactions through another broker-dealer on a fully disclosed basis. Based on the terms and conditions of the Company’s agreements with its clearing broker, the amount receivable from the clearing broker represents proceeds from unsettled securities sold and less amounts payable for unsettled securities purchased by the Company. The amounts payable are collateralized by securities owned by the Company. In addition, these balances include unsettled trades associated with our credit sales and trading platform. These transactions include trades in certain sectors of the corporate bond and syndicated loan markets.
Intangible Assets
The Company’s intangible assets consist of goodwill and intangible assets with finite useful lives. Goodwill is not amortized but is tested annually for impairment (during the fourth quarter) or more frequently if an adverse event occurs that may indicate impairment. The assessment of goodwill is performed at the reporting unit level. The values of the intangible assets with finite useful lives are amortized in proportion to their expected economic benefit over their estimated useful life or straight-line if the economic benefit cannot be reliably determined. These intangible assets are periodically tested for impairment by comparing expected future gross cash flows to the asset’s carrying amount. If the expected gross cash flows are less than the carrying amount, the asset is impaired and is written-down to its fair value.
Furniture, Equipment, Software and Leasehold Improvements
Furniture and equipment are depreciated using the straight-line method over their estimated useful lives of three to five years. Amortization of purchased software is recorded over the estimated useful lives of three to five years. Leasehold improvements are amortized using the straight-line method over the shorter of the useful life or lease term.
Investment Banking Revenues
Capital raising revenues represent fees earned from private placements and from public offerings of securities in which the Company acts as placement agent or underwriter. These revenues are comprised of selling concessions, underwriting fees, and management fees. Advisory revenues represent fees earned from mergers and acquisitions, mutual conversions, financial restructuring and other advisory services provided to clients. Capital raising revenues are recorded as revenue at the time the private placement or underwriting is completed. Advisory fees are recorded as revenue when the related service has been rendered and the client is contractually obligated to pay. Certain fees received in advance of services rendered are deferred and recognized as revenue over the service period.
Institutional Brokerage Agency and Principal Revenues
Agency commissions consist of commissions earned from executing the trade of stock exchange-listed securities and other transactions as an agent and principal transactions consist of sales credits and trading gains or losses from securities transactions. Revenues generated from securities transactions and related commission income and expenses are recorded on a trade-date basis.
F-11
Table of Contents
Asset Management Revenues
The Company receives fees for the management, administration, and distribution of mutual funds based upon the amount of assets under management. This revenue is recognized over the period in which services are performed and is recorded in asset management fees in the Company’s statements of operations.
Compensation and Benefits
Compensation and benefits includes base salaries, incentive compensation, stock-based compensation, employee benefit costs, and employer taxes. Incentive compensation is a significant component of compensation expense and is accrued based on the contribution of key business units using certain pre-defined formulas. The Company’s compensation accruals are reviewed and evaluated on a quarterly basis. The Company recognizes stock-based compensation expense in the income statement based on the grant-date fair value of awards of equity instruments issued to employees. The expense is recognized over the period during which employees are required to provide service. The expense is recorded using an estimated forfeiture rate for awards on the date of grant.
Income Taxes
Deferred tax assets and liabilities represent the differences between the financial statement and income tax bases of assets and liabilities using enacted tax rates. The measurement of net deferred tax assets is adjusted by a valuation allowance if, based on our evaluation and our consideration of the criteria in ASC 740, “Income Taxes” (“ASC 740”), it is more likely than not that they will not be realized. The Company’s policy for recording interest and penalties associated with uncertain tax positions is to record such items as a component of other operating expenses in the statement of operations.
Other Comprehensive Income
Comprehensive income includes net income as currently reported by the Company on the consolidated statements of operations adjusted for other comprehensive income. Other comprehensive income for the Company represents changes in unrealized gains and losses related to the Company’s investment securities accounted for as available-for-sale with changes in fair value recorded through shareholders’ equity.
Earnings Per Share
Basic earnings per share includes no dilution and is computed by dividing net income or loss available to common shareholders by the weighted average number of common shares outstanding for the period. Diluted earnings per share includes the impact of dilutive securities such as stock options, unvested shares of restricted stock and restricted stock units (“RSUs”), all of which are subject to forfeiture. Due to the Company’s reported net loss for the years ended December 31, 2010, 2009 and 2008, all stock options, unvested shares of restricted stock and unvested RSUs were considered anti-dilutive for these periods. The following table presents the computations of basic and diluted earnings per share for the periods indicated:
| Year Ended December 31, 2010 |
Year Ended December 31, 2009 |
Year Ended December 31, 2008 |
||||||||||||||||||||||
| Basic | Diluted | Basic | Diluted | Basic | Diluted | |||||||||||||||||||
| Weighted average shares outstanding: |
||||||||||||||||||||||||
| Common stock (in thousands) |
63,546 | 63,546 | 60,094 | 60,094 | 63,056 | 63,056 | ||||||||||||||||||
| Stock options, unvested restricted stock and RSUs (in thousands) |
— | — | — | — | — | — | ||||||||||||||||||
| Weighted average common and common equivalent shares outstanding (in thousands) |
63,546 | 63,546 | 60,094 | 60,094 | 63,056 | 63,056 | ||||||||||||||||||
| Net loss applicable to common stock |
$ | (37,558 | ) | $ | (37,558 | ) | $ | (27,651 | ) | $ | (27,651 | ) | $ | (194,730 | ) | $ | (194,730 | ) | ||||||
| Loss per common share |
$ | (0.59 | ) | $ | (0.59 | ) | $ | (0.46 | ) | $ | (0.46 | ) | $ | (3.09 | ) | $ | (3.09 | ) | ||||||
F-12
Table of Contents
The following table present the number of antidilutive stock options, unvested restricted stock and RSUs for the periods indicated:
| Year Ended December 31, | ||||||||||||
| 2010 | 2009 | 2008 | ||||||||||
| Stock Options—Employees and directors |
7,979 | 7,477 | 5,912 | |||||||||
| Stock Options—Non-employee |
3,256 | 3,102 | 3,102 | |||||||||
| Restricted Stock, unvested |
658 | 1,361 | 1,626 | |||||||||
| Restricted Stock Units, unvested |
8,231 | 7,338 | 5,580 | |||||||||
| Total |
20,124 | 19,278 | 16,220 | |||||||||
Recent Accounting Pronouncements
In January 2010, the Financial Accounting Standards Board (“FASB”) required additional disclosure requirements for fair value measurements under ASC 820. The new pronouncement requires a reporting entity to disclose the amounts of significant transfers in and out of Level 1 and Level 2 fair value measurements and describe the reasons for the transfers. In addition, the reconciliation for fair value measurements using significant unobservable inputs (Level 3) should present separately information about purchases, sales, issuances and settlements. Previous disclosure requirements allowed for the net presentation of these activities within a single item on the reconciliation. These changes were effective for reporting periods beginning after December 15, 2009. The adoption did not have a material impact on the Company’s financial statements.
In June 2009, the FASB issued changes to the guidance for accounting for transfers of financial assets. These changes improve the relevance, representational faithfulness, and comparability of the information that a reporting entity provides in its financial reports about a transfer of financial assets; the effects of a transfer on its financial position, financial performance, and cash flows; and a transferor’s continuing involvement in transferred financial assets. These changes are effective as of the beginning of each reporting entity’s first annual reporting period that begins after November 15, 2009, for interim periods within that first annual reporting period, and for interim and annual reporting periods thereafter. Earlier application is prohibited. The recognition and measurement provisions of these changes shall be applied to transfers that occur on or after the effective date. The adoption of these changes did not have a material impact on the Company’s financial statements.
In June 2009, the FASB issued changes to the guidance for variable interest entities. These changes are to improve financial reporting by enterprises involved with variable interest entities and to provide more relevant and reliable information to users of financial statements. These changes are effective as of the beginning of each reporting entity’s first annual reporting period that begins after November 15, 2009, for interim periods within that first annual reporting period, and for interim and annual reporting periods thereafter. Earlier application is prohibited. In January 2010, the FASB issued a deferral of these requirements for asset managers that are not obligated to fund significant losses incurred by the variable interest entities. The adoption of these changes did not have a material impact on the Company’s financial statements.
Note 3. Related-Party Transactions:
In July 2006, the Company entered into various inter-company and other contractual arrangements with Arlington Asset and Crestview Partners, L.P., a New York-based private equity firm (“Crestview”), including a professional services agreement and other related party contractual arrangements.
In May 2009, the Company entered into a stock repurchase agreement with Arlington Asset (“Repurchase Agreement”) pursuant to which, among other things, the Company repurchased 16,667,000 shares of its common stock at a share price of $4.35. As a result of this transaction, Arlington Asset ceased being the majority shareholder of the Company. Concurrently, the Company and Arlington Asset agreed to terminate various inter-company and other contractual arrangements between them.
F-13
Table of Contents
In October 2009, Arlington Asset and related affiliates (collectively, the Company’s former majority shareholder), sold 14,755,017 shares of the Company’s common stock in an underwritten public offering. As a result of this sale, Arlington Asset no longer maintains an ownership interest in the Company. Subsequent to this sale, the Company’s relationship with Arlington Asset has been limited to subleasing certain office space to Arlington Asset at a market rate. The paragraphs that follow provide additional detail regarding our historical relationship with Arlington Asset, including amounts reflected in our 2009 and 2008 financial statements.
Services Agreement
Under the services agreement with Arlington Asset, the Company was to provide or cause one or more of its subsidiaries to provide to Arlington Asset certain services, including various corporate overhead services, for fees based on costs incurred by the Company and its subsidiaries in providing the services. Similarly, Arlington Asset was to provide to the Company and its subsidiaries under the same services agreement certain services, including certain asset management services, for fees based on costs incurred by Arlington Asset in providing the services. The costs being allocated under each of these agreements primarily consisted of total compensation and benefits of the employees providing the services, professional services, including consulting and legal fees, and facility costs for the employees providing the services.
This services agreement was terminated in connection with the Repurchase Agreement in May 2009 and replaced by a transition services agreement pursuant to which the Company agreed to provide Arlington Asset certain services for a fixed dollar amount. The services that the Company agreed to provide included the following: employee benefit services, human resources and financial related services, data and network services and infrastructure, and facilities services, in each case subject to reductions in services (and associated costs) as requested by Arlington Asset. Arlington Asset agreed to use all commercially reasonable efforts to transition away from the services provided by the Company as soon as practicable and, in any event, no later than one year after the date of agreement. As of December 31, 2009, all such services had been transitioned between the entities.
In connection with the services agreement and the transition services agreement, during the years ended December 31, 2009 and 2008, the Company’s operating expenses are reported net of $370 and $2,134, respectively, representing overhead costs allocated to affiliates.
Corporate Agreement
Under the corporate agreement with Arlington Asset, Arlington Asset agreed to indemnify the Company against claims related to the businesses contributed to the Company prior to the contribution of those businesses in July 2006 and that arose out of actions or events that occurred prior to the contribution. During the years ended December 31, 2009 and 2008, Arlington Asset incurred/(recovered) costs of $34 and $(183), respectively, net of taxes pursuant to these indemnification provisions. The Company includes such amounts in its consolidated statements of operations and reflects a corresponding capital contribution from or (reimbursement to) Arlington Asset. This agreement was terminated in connection with the Repurchase Agreement.
Professional Services Agreement
Under the professional services agreement with Crestview, the Company agreed to pay Crestview Advisors, L.L.C. a $1,000 annual strategic advisory fee plus reimbursement of reasonable out-of-pocket expenses as long as Crestview continues to own at least 50% of the shares purchased by certain Crestview affiliates in our 2006 private offering. In June 2010, the Company and Crestview agreed to amend the professional services agreement to allow Crestview the ability to elect to receive a portion of their fee in restricted stock and/or options to purchase shares of the Company’s common stock. If elected, stock options would be issued with a strike price equal to the prevailing market price per share as of the grant date and with an expiration of 4 years. Based on Crestview’s election, in June 2010, the Company issued 153,846 such options to Crestview Advisors, L.L.C. valued at $200. The remaining $800 of the 2010 strategic advisory fee was paid in cash. During the year ended December 31, 2010, the Company recognized $1,000 of expense associated with this agreement.
F-14
Table of Contents
In September 2008, the Company and Crestview agreed to issue 502,268 options to purchase common shares of the Company to Crestview Advisors L.L.C. in lieu of cash payments for the strategic advisory fee for the period beginning October 1, 2008 through December 31, 2009. During the year ended December 31, 2009, the Company recognized $944 of non-cash expense associated with these options.
Receivables and Payables
From time to time, the Company has made advances to affiliates that were used for general operating purposes and are settled in cash on a regular basis. Receivables from affiliates totaled $701 and $567 as of December 31, 2010 and 2009, respectively.
Capital Markets Activity
In October 2009, Arlington Asset and related affiliates, the Company’s former majority shareholder, sold 14,755,017 shares of the Company’s common stock in an underwritten public offering. FBR & Co. acted as a book-running manager for this offering and earned investment banking revenues of $2,735. As a result of this sale, Arlington Asset, the Company’s former majority shareholder, no longer maintains an ownership interest in the Company.
In May 2009, Arlington Asset and related affiliates sold 1,500,000 shares of the Company’s common stock in an underwritten public offering. FBR & Co. acted as a book-running manager for this offering and earned investment banking revenues of $349.
Note 4. Investments:
Fair Value Hierarchy
The following tables set forth, by level within the fair value hierarchy, financial instruments and long-term investments accounted for under ASC 820 as of December 31, 2010 and 2009, respectively. As required by ASC 820, assets and liabilities that are measured at fair value are classified in their entirety based on the lowest level of input that is significant to the fair value measurement.
F-15
Table of Contents
Items Measured at Fair Value on a Recurring Basis
| December 31, 2010 |
Level 1 | Level 2 | Level 3 | |||||||||||||
| Financial instruments owned, at fair value: |
||||||||||||||||
| Financial instruments held for trading activities at broker-dealer subsidiaries: |
||||||||||||||||
| Marketable and non-public equity securities |
$ | 14,165 | $ | 9,703 | $ | — | $ | 4,462 | ||||||||
| Listed options |
2,474 | 2,474 | — | — | ||||||||||||
| Convertible and fixed income debt instruments |
65,215 | — | 65,215 | — | ||||||||||||
| 81,854 | 12,177 | 65,215 | 4,462 | |||||||||||||
| Financial instruments held for investment activities: |
||||||||||||||||
| Designated as trading: |
||||||||||||||||
| Corporate equity securities |
3,484 | 3,484 | — | — | ||||||||||||
| Designated as available-for-sale: |
||||||||||||||||
| Corporate equity securities |
139 | 139 | — | — | ||||||||||||
| 3,623 | 3,623 | — | — | |||||||||||||
| Other |
923 | 368 | — | 555 | ||||||||||||
| Total |
$ | 86,400 | $ | 16,168 | $ | 65,215 | $ | 5,017 | ||||||||
| Securities sold but not yet purchased, at fair value: |
||||||||||||||||
| Marketable equity securities |
$ | 34,448 | $ | 34,448 | $ | — | $ | — | ||||||||
| Listed options |
887 | 887 | — | — | ||||||||||||
| Convertible and fixed income debt instruments |
20,109 | — | 20,109 | — | ||||||||||||
| Total |
$ | 55,444 | $ | 35,335 | $ | 20,109 | $ | — | ||||||||
As of December 31, 2010, financial assets measured and reported at fair value on a recurring basis and classified within Level 3 were $5,017 or 1.2% of the Company’s total assets at that date.
| December 31, 2009 |
Level 1 | Level 2 | Level 3 | |||||||||||||
| Financial instruments owned, at fair value: |
||||||||||||||||
| Financial instruments held for trading activities at broker-dealer subsidiaries: |
||||||||||||||||
| Marketable and non-public equity securities |
$ | 35,941 | $ | 20,463 | $ | — | $ | 15,478 | ||||||||
| Listed options |
4,086 | 4,086 | — | — | ||||||||||||
| Convertible and fixed income debt instruments |
54,451 | — | 54,448 | 3 | ||||||||||||
| 94,478 | 24,549 | 54,448 | 15,481 | |||||||||||||
| Financial instruments held for investment activities: |
||||||||||||||||
| Designated as available-for-sale: |
||||||||||||||||
| Corporate equity securities |
317 | 317 | — | — | ||||||||||||
| Other |
9,329 | 8,415 | — | 914 | ||||||||||||
| Total |
$ | 104,124 | $ | 33,281 | $ | 54,448 | $ | 16,395 | ||||||||
| Securities sold but not yet purchased, at fair value: |
||||||||||||||||
| Marketable equity securities and exchange-traded funds |
$ | 35,530 | $ | 35,530 | $ | — | $ | — | ||||||||
| Listed options |
1,098 | 1,098 | — | — | ||||||||||||
| Convertible and fixed income debt instruments |
15,041 | — | 15,041 | — | ||||||||||||
| Total |
$ | 51,669 | $ | 36,628 | $ | 15,041 | $ | — | ||||||||
F-16
Table of Contents
As of December 31, 2009, financial assets measured and reported at fair value on a recurring basis and classified within Level 3 were $16,395, or 2.9% of the Company’s total assets at that date.
Level 3 Gains and Losses
The tables below set forth a summary of changes in the fair value of the Company’s Level 3 financial assets that are measured at fair value on a recurring basis for the years ended December 31, 2010 and 2009. As of December 31, 2010 and 2009, the Company did not have any net unrealized gains (losses) included in accumulated other comprehensive income on Level 3 financial assets.
| Trading Securities |
Other | Total | ||||||||||
| Beginning balance, January 1, 2010 |
$ | 15,481 | $ | 914 | $ | 16,395 | ||||||
| Total net losses (realized/unrealized) |
||||||||||||
| Included in earnings |
42 | (19 | ) | 23 | ||||||||
| Included in other comprehensive income |
— | — | — | |||||||||
| Purchases |
215,466 | — | 215,466 | |||||||||
| Sales/Distributions |
(225,011 | ) | (340 | ) | (225,351 | ) | ||||||
| Transfers out of Level 3 |
(1,516 | ) | — | (1,516 | ) | |||||||
| Ending balance, December 31, 2010 |
$ | 4,462 | $ | 555 | $ | 5,017 | ||||||
| The amount of total gains or losses for the period included in earnings attributable to the change in unrealized gains or losses relating to assets still held at the reporting date |
$ | 50 | $ | (19 | ) | $ | 31 | |||||
| Trading Securities |
Other | Total | ||||||||||
| Beginning balance, January 1, 2009 |
$ | 3,207 | $ | 4,219 | $ | 7,426 | ||||||
| Total net losses (realized/unrealized) |
||||||||||||
| Included in earnings |
55 | 192 | 247 | |||||||||
| Included in other comprehensive income |
— | — | — | |||||||||
| Purchases |
143,646 | 150 | 143,796 | |||||||||
| Sales/Distributions |
(131,427 | ) | (3,647 | ) | (135,074 | ) | ||||||
| Ending balance, December 31, 2009 |
$ | 15,481 | $ | 914 | $ | 16,395 | ||||||
| The amount of total gains or losses for the period included in earnings attributable to the change in unrealized gains or losses relating to assets still held at the reporting date |
$ | 363 | $ | 163 | $ | 526 | ||||||
There were no transfers of securities in to, or out of, Level 3 financial assets during the year ended December 31, 2009.
Gains and losses from Level 3 financial assets that are measured at fair value on a recurring basis, that are included in earnings for the years ended December 31, 2010, 2009, and 2008, are reported in the following line descriptions on the Company’s statements of operations:
| Year ended December 31, | ||||||||||||
| 2010 | 2009 | 2008 | ||||||||||
| Total gains and losses included in earnings for the period: |
||||||||||||
| Principal transactions |
$ | 42 | $ | 55 | $ | (4,003 | ) | |||||
| Net investment income (loss) |
(19 | ) | 192 | (3,241 | ) | |||||||
| Change in unrealized gains or losses relating to assets still held at the end of the respective period: |
||||||||||||
| Principal transactions |
$ | 50 | $ | 363 | $ | (2,274 | ) | |||||
| Net investment income (loss) |
(19 | ) | 163 | (1,872 | ) | |||||||
F-17
Table of Contents
Items Measured at Fair Value on a Non-Recurring Basis
In addition, the Company also measures certain financial assets and other assets at fair value on a non-recurring basis. Adjustments to the fair value of these assets usually result from the application of lower-of-cost-or-market accounting or impairments of individual assets. Due to the nature of these assets, unobservable inputs are used to value these assets. In determining the fair value, the Company analyzes various financial, performance and market factors to estimate the fair value, including where applicable, market activity. As a result, these assets are classified within Level 3 of the fair value hierarchy.
The following table presents the change in carrying value of those assets measured at fair value on a non-recurring basis, for which a change in fair value was recognized in 2010:
| December 31, 2010 |
Level 1 | Level 2 | Level 3 | Year Ended December 31, 2010 |
||||||||||||||||
| Gains (Losses) | ||||||||||||||||||||
| Leasehold improvements |
$ | — | $ | — | $ | — | $ | — | $ | (1,135 | ) | |||||||||
In assessing certain leasehold improvements as of December 31, 2010, as discussed in Note 5, the Company determined that as a result of the Company executing a new lease agreement in December 2010 for its office located in London, UK, including a sublease of its existing office space, that a fair value assessment of its leasehold improvements located at the current office space was required. Based on that assessment, the Company determined that the asset was fully impaired.
The following tables present the change in carrying value of those assets measured at fair value on a non-recurring basis, for which a change in fair value was recognized in 2009:
| December 31, 2009 |
Level 1 | Level 2 | Level 3 | Year Ended December 31, 2009 |
||||||||||||||||
| Gains (Losses) | ||||||||||||||||||||
| Intangible assets |
$ | — | $ | — | $ | — | $ | — | $ | (5,350 | ) | |||||||||
In assessing the management contract intangible assets as of June 30, 2009, as discussed in Note 7, the Company determined that adverse market conditions had resulted in a triggering event requiring assessment of the fair value of the intangible asset related to a money market mutual fund managed by the Company that is included in the Company’s asset management segment.
Financial Instruments Held for Investment—Designated as Trading
As of December 31, 2010, the Company has certain investments in marketable equity securities held by other than the Company’s broker-dealer subsidiaries that are classified as trading securities. These investments are designated as trading based on the Company’s intent at the time of designation. In accordance with ASC 320, these securities are carried at fair value with resulting realized and unrealized gains and losses reflected as net investment income (loss) in the statements of operations. Net gains and losses on these securities as of the dates indicated were as follows:
| Year ended December 31, | ||||||||||||
| 2010 | 2009 | 2008 | ||||||||||
| Net gains (losses) recognized on trading securities |
$ | 10,018 | $ | — | $ | — | ||||||
| Less: Net (gains) losses recognized on trading securities sold during the period |
(8,884 | ) | — | — | ||||||||
| Unrealized gains (losses) recognized on trading securities still held at the reporting |
$ | 1,134 | $ | — | $ | — | ||||||
During the years ended December 31, 2009 and 2008, the Company did not hold financial instruments held for investment that were designated as trading securities.
F-18
Table of Contents
Financial Instruments Held for Investment—Designated as Available-for-Sale
As of December 31, 2010 and 2009, the Company has certain investments in marketable equity securities held by other than the Company’s broker-dealer subsidiaries that are classified as available-for-sale securities. These investments are designated as available-for-sale due to the Company’s intent at the time of designation to hold these securities for investment purposes over an extended period, however, are available to be sold should economic conditions warrant such a transaction. In accordance with ASC 320, these securities are carried at fair value with resulting unrealized gains and losses reflected as other comprehensive income or loss. Gross unrealized gains and losses on these securities as of the dates indicated were as follows:
| December 31, 2010 | ||||||||||||||||
| Cost Basis |
Unrealized | Fair Value | ||||||||||||||
| Gains | Losses(1) | |||||||||||||||
| Marketable equity securities |
$ | 192 | $ | — | $ | (53 | ) | $ | 139 | |||||||
| December 31, 2009 | ||||||||||||||||
| Cost Basis |
Unrealized | Fair Value | ||||||||||||||
| Gains | Losses(1) | |||||||||||||||
| Marketable equity securities |
$ | 388 | $ | — | $ | (71 | ) | $ | 317 | |||||||
| (1) | Duration of unrealized losses is less than 12 months |
The following provides detail of the amounts included in accumulated other comprehensive income and reclassified to earnings during the specified periods.
| Year ended December 31, | ||||||||||||
| 2010 | 2009 | 2008 | ||||||||||
| Beginning balance |
$ | (71 | ) | $ | (218 | ) | $ | 622 | ||||
| Net unrealized investment gains (losses) during the period: |
||||||||||||
| Unrealized holding gains (losses), net of taxes |
(18 | ) | (71 | ) | (34,691 | ) | ||||||
| Reclassification adjustment for recognized (gains) losses included in net income, net of taxes |
36 | 218 | 33,851 | |||||||||
| Ending balance |
$ | (53 | ) | $ | (71 | ) | $ | (218 | ) | |||
The Company evaluates its portfolio of marketable equity securities for impairment as of each reporting date. For the securities with unrealized losses, the Company will review the underlying cause for the impairments, as well as the severity and duration of the impairments. If the impairment is determined to be other-than-temporary, the Company will recognize an other-than-temporary impairment loss in its statement of operations. During the years ended December 31, 2010, 2009 and 2008, the Company recorded other-than-temporary impairment losses of $-0-, $-0-, and $1,537, respectively, in the statements of operations relating to marketable equity securities. As of December 31, 2010, the Company held one marketable equity security in an unrealized loss position, and based on the partial recovery of the value subsequent to year end combined with the limited duration of the loss, the Company does not consider this investment to be other than temporarily impaired.
During the years ended December 31, 2010, 2009, and 2008, the Company received $206, $1,084, and $12,281, respectively, from sales of marketable equity securities resulting in gross gains of $9, $116, and $911, respectively, and gross losses of $-0-, $-0-, and $239, respectively.
During the year ended December 31, 2008, the Company had invested a portion of its excess liquid capital in agency mortgage-backed securities. The Company originally deployed this capital into these investments based on its available liquidity and its assessment of its ability and intent to hold these securities to withstand interim market value fluctuations due to market and interest rate risks. The Company had continually assessed its
F-19
Table of Contents
leverage and liquidity risk relevant to its ability and intent to hold these securities. However, based on the unprecedented severity of market conditions during the fourth quarter of 2008 related to the liquidity and value of these assets, including conditions related to the available financing the Company determined that the risks to it associated with continuing to hold these investments exceeded the potential benefits. As such, in December 2008, the Company sold its investment in mortgage-backed securities to reduce its exposure. Accordingly, in evaluating the Company’s investments in mortgage-backed securities for other-than-temporary impairments as of December 31, 2008, as a result of its change in intent, the Company recognized other-than-temporary impairment losses of $11,174 relating to mortgage-backed securities held as of December 31, 2008.
During the year ended December 31, 2009, the Company received $450,396 from sales of mortgage-backed securities, which had been previously impaired as of December 31, 2008, resulting in additional gross losses of $1,502. During the year ended December 31, 2008, the Company received $360,930 from sales of mortgage-backed securities resulting in gross losses of $21,853.
Other Investments, at Cost
Other investments consisted of the following as of the dates indicated:
| December 31, 2010 |
December 31, 2009 |
|||||||
| Non-public equity securities |
$ | 44,907 | $ | 33,662 | ||||
| Note receivable |
317 | 312 | ||||||
| $ | 45,224 | $ | 33,974 | |||||
The Company evaluates its portfolio of non-public equity securities, carried at cost, for impairment as of each reporting date. Based on its evaluations, including consideration of the severity and duration of factors affecting the fair values of the Company’s investments in non-public equity securities, the Company recorded no impairment losses during the years ended December 31, 2010 and 2009. During the year ended December 31, 2008, the Company recorded other-than-temporary impairment losses of $36,116 relating to investments in non-public equity securities. Also, based on its evaluations of its one non-public debt security, including consideration of the diminishment in the credit quality of the underlying issuer, the Company recorded an other-than-temporary impairment loss of $3,899 during the year ended December 31, 2008.
During 2010, the Company received $11,916 from sales of, or distributions from, non-public equity securities, resulting in gross gains and losses of $286 and $963, respectively. During 2009, the Company received $5,278 from sales of, or distributions from, non-public equity securities, resulting in gross gains of $1,805. During 2008, the Company received $1,543 of distributions from non-public equity and debt securities, resulting in no gains or losses.
Note 5. Furniture, Equipment, Software and Leasehold Improvements:
Furniture, equipment, software and leasehold improvements, summarized by major classification, were:
| December 31, | ||||||||
| 2010 | 2009 | |||||||
| Furniture and equipment |
$ | 21,031 | $ | 21,787 | ||||
| Software |
15,276 | 14,878 | ||||||
| Leasehold improvements |
21,575 | 23,193 | ||||||
| 57,882 | 59,858 | |||||||
| Less: Accumulated depreciation and amortization |
(48,141 | ) | (44,686 | ) | ||||
| $ | 9,741 | $ | 15,172 | |||||
F-20
Table of Contents
For the years ended December 31, 2010, 2009 and 2008, depreciation expense was $7,024, $9,227 and $9,320, respectively. For the years ended December 31, 2010, 2009 and 2008, the Company incurred losses of $1,135, $1,370, and $-0-, respectively, related to the write-off of leasehold improvements as a result of lease terminations. For the year ended December 31, 2010, the charge represents the impairment of certain leasehold improvements related to office space that had been subleased to a third party effective in February 2011. Based on the lack of transferability of these assets and no anticipated salvage value of the assets, the Company assessed the fair value of these assets as $-0- as of December 31, 2010. As a result of this assessment, the Company incurred an impairment charge of $1,135 for the year ended December 31, 2010. For the year ended December 31, 2009, the charge of $1,370 represents the write-off of certain leasehold improvements related to office space that was subleased during the year in which the sublease covers the remaining period of the Company’s original lease agreement.
Note 6. Acquisitions:
On August 31, 2009, the Company acquired Watch Hill Partners, LLC (“Watch Hill”) for a total purchase price of $6,419. The purchase price was comprised of $3,368 of cash and the issuance of 563,685 shares of the Company’s common stock with a fair value of $3,051. Through the acquisition of Watch Hill, the Company added 14 professional employees specializing in corporate advisory services. The allocation of purchase price based on the fair value of net assets acquired is as follows:
| Purchase Price: |
||||||||
| Cash paid |
$ | 3,368 | ||||||
| Fair value of common shares issued |
3,051 | |||||||
| Total |
$ | 6,419 | ||||||
| Fair Value of Assets Acquired: |
||||||||
| Cash |
$ | 57 | ||||||
| Accounts receivable |
245 | |||||||
| Intangible assets related to a pipeline of engagements |
705 | |||||||
| Total |
$ | 1,007 | ||||||
| Fair Value of Liabilities Assumed: |
||||||||
| Accounts payable and accrued expenses |
$ | 134 | ||||||
| Excess of current lease commitment over market rates |
336 | |||||||
| Total |
$ | 470 | ||||||
| Net assets acquired (Total fair value of assets acquired less total fair value of liabilities assumed) |
$ | 537 | ||||||
| Remaining purchase price allocated to goodwill (Total purchase price less net assets acquired) |
$ | 5,882 | ||||||
The goodwill balance of $5,882 is included in the Company’s capital markets segment. Of this balance, $5,546 of goodwill is expected to be deductible for tax purposes. As part of the acquisition, the Company acquired certain intangible assets related to engagements initiated by Watch Hill, all of which have been fully amortized as of December 31, 2009. The Company expensed $604 in transaction costs associated with the acquisition for the year ended December 31, 2009.
F-21
Table of Contents
Goodwill
The changes in the carrying amount of goodwill for the years ended December 31, 2010 and 2009 are as follows:
| Year ended December 31, |
||||||||
| 2010 | 2009 | |||||||
| Balance as of January 1: |
||||||||
| Goodwill |
$ | 5,882 | $ | — | ||||
| Accumulated impairment losses |
— | — | ||||||
| 5,882 | — | |||||||
| Goodwill acquired during year |
— | 5,882 | ||||||
| Impairment losses |
— | — | ||||||
| Balance as of December 31: |
||||||||
| Goodwill |
5,882 | 5,882 | ||||||
| Accumulated impairment losses |
— | — | ||||||
| $ | 5,882 | $ | 5,882 | |||||
The Company performed its annual assessment of goodwill impairment during the fourth quarters of 2010 and 2009. Based on this assessment, no impairment charges were recognized during the years ended December 31, 2010 and 2009. Management’s assessment process includes determining the fair value of its reporting units (considered its business segments) based on current market information, including relevant recent mergers and acquisitions, and comparing such fair value to the carrying value of the respective reporting units. In addition, the Company compares the sum of the fair values of its reporting units to its total market capitalization. With regard to the capital markets segment, the only segment with goodwill, the Company determined that the fair value of the segment significantly exceeded its carrying value.
Note 7. Intangible Assets:
The following table reflects the components of intangible assets as of the dates indicated:
| December 31, 2010 |
December 31, 2009 |
|||||||
| Management contracts and customer relationships associated with asset management activities |
$ | 6,144 | $ | 5,656 | ||||
| Accumulated amortization |
(3,561 | ) | (3,114 | ) | ||||
| Net |
$ | 2,583 | $ | 2,542 | ||||
For the years ended December 31, 2010, 2009 and 2008, amortization expense recognized was $447, $1,756 and $1,495, respectively.
Estimated amortization expense for each of the next five years is as follows:
| Amount | ||||
| 2011 |
$ | 462 | ||
| 2012 |
462 | |||
| 2013 |
462 | |||
| 2014 |
462 | |||
| 2015 |
462 | |||
F-22
Table of Contents
During the years ended December 31, 2010, 2009 and 2008, the Company recognized impairment charges of $-0-, $5,350, and $-0-, respectively, in the statement of operations relating to the management contracts and customer relationships associated with the asset management segment.
For the impairment charge of $5,350 recognized during the year ended December 31, 2009, factors such as significantly reduced yields on short term government investments and the requirement for the Company to both waive its management fees and reimburse certain expenses of a money market fund resulted in one of its management contracts becoming unprofitable for the Company during the first half of 2009. In determining the fair value of this intangible asset, the Company concluded that based on the cost structure of the money market fund, a forecasted continuation of a low rate environment for short term government investments and the forecasted ongoing waiver of its management fees and the resulting negative cash flows of these conditions, the intangible asset should be valued at zero as of June 30, 2009.
Note 8. Borrowings:
Repurchase Agreements
Prior to February 2009, the Company had entered into repurchase agreements with various financial institutions that had been used in conjunction with the Company’s investments in agency mortgage-backed securities. As of December 31, 2010 and 2009, there were no outstanding repurchase agreement borrowings.
During the years ended December 31, 2010, 2009 and 2008, interest expense related to repurchase agreement borrowings totaled $-0-, $252 and $12,428, respectively.
In January and February 2009, the Company sold its remaining mortgage-backed securities and related interest-rate caps held as of December 31, 2008. Concurrent with the sale of these securities, the Company repaid all outstanding repurchase agreements used to finance these securities.
Note 9. Income Taxes:
The (benefit) provision for income taxes consists of the following for the years ended December 31, 2010, 2009 and 2008:
| 2010 | 2009 | 2008 | ||||||||||
| Federal |
$ | (3,884 | ) | $ | (3,169 | ) | $ | (3,675 | ) | |||
| State |
(198 | ) | 1,711 | 276 | ||||||||
| Foreign |
(22 | ) | 120 | (91 | ) | |||||||
| $ | (4,104 | ) | $ | (1,338 | ) | $ | (3,490 | ) | ||||
| Current |
$ | (4,253 | ) | $ | (1,694 | ) | $ | (21,188 | ) | |||
| Deferred |
149 | 356 | 17,698 | |||||||||
| $ | (4,104 | ) | $ | (1,338 | ) | $ | (3,490 | ) | ||||
The federal tax benefit includes a benefit for domestic federal net operating losses of $3,233, $6,862 and $17,764 for the years ended December 31, 2010, 2009 and 2008, respectively. The benefits of these net operating losses were realized through carryback of losses to offset income in prior years.
On November 6, 2009, the opportunity to elect an extended carryback period for net operating losses was added by Section 13 of the Worker, Homeownership, and Business Act of 2009. The provision allowed taxpayers to elect to carry back an applicable net operating loss for a period of three, four or five years. The provision also suspended the 90-percent alternative minimum tax credit limitation for the carried back net operating loss. As a result of this provision, the Company utilized all of its losses generated in 2008 to offset prior year taxable
F-23
Table of Contents
income without paying alternative minimum tax respective to the carryback years and therefore, reflected an additional federal tax benefit of $6,862 in tax year ended December 31, 2009. During 2010, the Company filed claims to carry back its losses from tax year 2008 to prior periods including periods in which it was part of the FBR TRS Holdings, Inc.’s consolidated group and received the incremental benefit of the net operating loss carryback, pursuant to its tax sharing agreement with FBR TRS Holdings, Inc.
Deferred tax assets and liabilities consisted of the following as of December 31, 2010 and 2009:
| 2010 | 2009 | |||||||
| Unrealized investment gains, recorded in accumulated other comprehensive income |
$ | 21 | $ | 28 | ||||
| Stock-based compensation |
29,334 | 29,774 | ||||||
| Depreciation and amortization |
7,327 | 7,010 | ||||||
| Other-than-temporary investment write downs |
5,662 | 14,754 | ||||||
| Capital loss carry forward |
26,221 | 20,114 | ||||||
| Other, net |
655 | 962 | ||||||
| Net operating loss |
19,185 | 9,719 | ||||||
| Total deferred tax asset |
88,405 | 82,361 | ||||||
| Valuation allowance |
(88,405 | ) | (82,361 | ) | ||||
| Goodwill amortization |
(213 | ) | (64 | ) | ||||
| Net deferred tax liability |
$ | (213 | ) | $ | (64 | ) | ||
The net deferred tax liability is included in other liabilities in the consolidated balance sheet.
At December 31, 2010, the Company’s net deferred tax assets totaled $88,405. The Company has established a full valuation allowance against these assets since the Company believes that, based on the criteria in ASC 740, it is more likely than not that the benefits of these assets will not be realized in the future. The company reflects a net deferred tax liability related to an indefinite-lived intangible which cannot serve as a source of future income for determination of the Company’s valuation allowance. During the years ended December 31, 2010 and 2009, the Company’s valuation allowance increased by $6,044 and $5,665, respectively.
As of December 31, 2010, the company has federal net operating losses of $20,064 which include tax windfalls of $774 resulting from stock vestings. The tax benefits of the net operating losses related to these windfalls will be recognized as additional paid-in capital when the losses are utilized in the future. The Company has state net operating loss carryovers of $8,192 on a tax effected basis, excluding the effect of federal offset. The state net operating losses include $79 of tax benefit related to windfalls from stock vestings which will be recognized as additional paid-in capital when these losses are utilized in the future. The federal net operating losses will expire in 2030 and the state net operating losses begin to expire in 2013.
As of December 31, 2010, the Company’s net operating losses related to FBRIL and its operations in the United Kingdom are $26,554, including $34 of benefits related to windfalls from stock vestings which will be recognized as additional paid in capital when these losses are utilized in the future. These net operating losses may be carried forward indefinitely to offset future income of FBRIL.
As of December 31, 2010, the Company has pre-tax capital loss carryovers of $20,911, $31,634, and $14,750 which will expire in years 2013, 2014, and 2015, respectively.
Internal Revenue Code Section 382 limits tax deductions for net operating losses, capital losses and net unrealized built-in losses after there is a substantial change in ownership in a corporation’s stock involving a 50 percentage point increase in ownership by 5% or larger stockholders. On October 22, 2009 as a result of the sale by Arlington Asset of the Company’s stock, the Company incurred an ownership change as defined in Section 382. The ownership change will cause the future utilization of capital losses incurred before the change date to be subject to an annual limitation of $17,201.
F-24
Table of Contents
The Company’s effective tax rate for the years ended December 31, 2010, 2009 and 2008 was 9.85%, 4.62% and 1.76% respectively. The provision for income taxes results in effective tax rates that differ from the Federal statutory rates. The reconciliation of the Company’s reported amount of income tax (benefit) provision attributable to continuing operations to the amount of income tax expense that would result from applying domestic federal statutory tax rates to income from continuing operations was:
| For the year ended December 31, | ||||||||||||
| 2010 | 2009 | 2008 | ||||||||||
| Federal income tax benefit, at statutory rate |
$ | (14,591 | ) | $ | (10,146 | ) | $ | (69,377 | ) | |||
| State income taxes benefit, net of Federal benefit |
(1,383 | ) | (261 | ) | (11,339 | ) | ||||||
| Effect of rates different than statutory |
923 | 428 | 978 | |||||||||
| Nondeductible expenses |
797 | 972 | 1,657 | |||||||||
| Effect of stock-based compensation |
4,296 | 2,748 | 2,327 | |||||||||
| Gain on warrants |
— | — | (3,783 | ) | ||||||||
| Investment write-down |
— | — | 722 | |||||||||
| Partnership deferred tax asset |
— | (1,192 | ) | — | ||||||||
| Other, net |
(190 | ) | 448 | 249 | ||||||||
| Valuation allowance |
6,044 | 5,665 | 75,076 | |||||||||
| Effective income tax benefit |
$ | (4,104 | ) | $ | (1,338 | ) | $ | (3,490 | ) | |||
The components of losses before income taxes were as follows:
| For the year ended December 31, | ||||||||||||
| 2010 | 2009 | 2008 | ||||||||||
| United States |
$ | (35,642 | ) | $ | (22,482 | ) | $ | (184,263 | ) | |||
| United Kingdom |
(6,020 | ) | (6,507 | ) | (13,957 | ) | ||||||
| $ | (41,662 | ) | $ | (28,989 | ) | $ | (198,220 | ) | ||||
The following table displays the change in unrecognized tax benefits for the years ended December 31, 2010 and 2009:
| For the year ended December 31, |
||||||||
| 2010 | 2009 | |||||||
| Balance at beginning of period |
$ | (1,989 | ) | $ | (1,301 | ) | ||
| Increases to tax positions for prior years |
(162 | ) | (769 | ) | ||||
| Decreases to tax positions for prior years |
21 | 81 | ||||||
| Balance at end of period |
$ | (2,130 | ) | $ | (1,989 | ) | ||
The amount of unrecognized tax benefits that would provide a benefit to the effective tax rate, if recognized, is $1,175. In addition, if the Company continues to maintain in a full valuation allowance against its net deferred tax assets, the recognition of $699 of temporary tax differences that are unrecognized tax benefits would provide a benefit to the effective rate indirectly through the release of the related valuation allowance.
The Company records interest and penalties in other operating expenses and other revenue respectively in the consolidated statements of operations. The total amount of interest related to tax uncertainties recognized in the statement of operations for the periods ended December 31, 2010 and December 31, 2009 was $147 and $51, respectively. The total amount of accrued interest related to uncertain tax positions was $239 and $93 as of December 31, 2010 and December 31, 2009, respectively.
F-25
Table of Contents
As of December 31, 2010, tax years subsequent to December 31, 2005 remain open under the federal statute of limitations, as well as for the Company’s significant state jurisdictions of California, Massachusetts, New York, Virginia and Texas. The IRS is currently examining tax years 2006 to 2008 and has completed the fieldwork for these years. The net proposed adjustments to date would not have an adverse effect on the Company.
It is reasonably possible that the Company could have a significant decrease in unrecognized tax benefits in the next 12 months as the years in which the unrecognized tax benefits arose are currently being examined by the IRS.
Note 10. Regulatory Capital Requirements:
FBR & Co. is registered with the SEC and is a member of FINRA. Additionally, FBRIL is registered with the FSA of the United Kingdom. As such, they are subject to the minimum net capital requirements promulgated by the SEC and FSA. As of December 31, 2010 and 2009, FBR & Co. had net capital of $58,951 and $54,577, respectively, that was $54,387 and $49,338, respectively, in excess of its required net capital of $4,564 and $5,239, respectively. As of December 31, 2010 and 2009, FBRIL had net capital in excess of required amounts.
Note 11. Commitments and Contingencies:
Contractual Obligations
The Company has contractual obligations to make future payments in connection with non-cancelable lease agreements and other contractual commitments as well as an uncalled capital commitment to an investment partnership that may be called over the next ten years. The following table sets forth these contractual obligations by fiscal year:
| 2011 | 2012 | 2013 | 2014 | 2015 | Thereafter | Total | ||||||||||||||||||||||
| Minimum rental commitments(1) |
$ | 10,246 | $ | 9,135 | $ | 9,026 | $ | 8,242 | $ | 1,908 | $ | 3,509 | $ | 42,066 | ||||||||||||||
| Capital commitments(2) |
150 | — | — | — | — | — | 150 | |||||||||||||||||||||
| Total Contractual Obligations |
$ | 10,396 | $ | 9,135 | $ | 9,026 | $ | 8,242 | $ | 1,908 | $ | 3,509 | $ | 42,216 | ||||||||||||||
| (1) | These commitments are for operating leases of the Company. The Company currently has no commitments associated with capital leases. Equipment and office rent expense for the years ended December 31, 2010, 2009 and 2008 were $9,314, $13,935 and $13,843, respectively. |
| (2) | The table above excludes a $400 uncalled capital commitment to an investment partnership that may be called over the next five years. This amount was excluded because the Company cannot currently determine when, if ever, the commitment will be called. |
Clearing Broker
Our broker-dealer subsidiaries clear all of their securities transactions through a clearing broker on a fully disclosed basis. Pursuant to the terms of the agreements between our broker-dealer subsidiaries and their respective clearing brokers, the clearing broker has the right to charge our broker-dealer subsidiaries for losses that result from a counterparty’s failure to fulfill its contractual obligations.
As the right to charge our broker-dealer subsidiaries has no maximum amount and applies to all trades executed through the clearing broker, the Company believes there is no maximum amount assignable to this right. At December 31, 2010 and 2009, the Company has recorded no liabilities, and during the years ended December 31, 2010, 2009 and 2008, the Company did not incur any significant costs, with regard to this right.
Litigation
As of December 31, 2010, except as described below, the Company was neither a defendant nor plaintiff in any lawsuits or arbitrations nor involved in any governmental or self-regulatory organization matters that are
F-26
Table of Contents
expected to have a material adverse effect on its financial condition, results of operations or liquidity. The Company has been named as a defendant in a small number of civil lawsuits and arbitrations relating to its various businesses. In addition, the Company is subject to various reviews, examinations, investigations and other inquiries by governmental agencies and self regulatory organizations. There can be no assurance that these matters individually or in aggregate will not have a material adverse effect on the Company’s financial condition or results of operations in a future period. However, based on management’s review with counsel, resolution of these matters is not expected to have a material adverse effect on the Company’s financial condition, results of operations or liquidity.
Many aspects of the Company’s business involve substantial risks of liability and litigation. Underwriters, broker-dealers and investment advisers are exposed to liability under Federal and state securities laws, other Federal and state laws and court decisions, including decisions with respect to underwriters’ liability and limitations on indemnification, as well as with respect to the handling of customer accounts. For example, underwriters may be held liable for material misstatements or omissions of fact in a prospectus used in connection with the securities being offered and broker-dealers may be held liable for statements made by their securities analysts or other personnel. FBR & Co. has been named as a defendant in a small number of securities claims involving investment banking clients of FBR & Co. as a result of FBR & Co.’s role as an underwriter. In these cases, the underwriting agreement provides, subject to certain conditions, that the investment banking client is required to indemnify FBR & Co. against certain claims or liabilities, including claims or liabilities under the Securities Act of 1933, as amended (the “Securities Act”), or contribute to payments which FBR & Co. is required to make as a result of the litigation. There can be no assurance that such indemnification or contribution will ultimately be available to the Company or that an investment banking client will be able to satisfy its indemnity or contribution obligations when due.
In May 2008, the lead plaintiff in a previously filed and consolidated action filed an amended consolidated class action complaint that, for the first time, named Friedman, Billings, Ramsey & Co., Inc. (now FBR & Co.) and eight other underwriters as defendants. The lawsuit, styled In Re Thornburg Mortgage, Inc. Securities Litigation and pending in the United States District Court for the District of New Mexico, was originally filed in August 2007 against Thornburg Mortgage, Inc. (“TMI”), and certain of its officers and directors, alleging material misrepresentations and omissions about, inter alia, the financial position of TMI. The amended complaint now includes claims under Sections 11 and 12 of the Securities Act against nine underwriters relating to five separate offerings (May 2007, June 2007, September 2007 and two offerings in January 2008). The allegations against FBR & Co. relate only to its role as underwriter or member of the syndicate that underwrote TMI’s total of three offerings in September 2007 and January 2008—each of which occurred after the filing of the original complaint—with an aggregate offering price of approximately $818,000. The plaintiffs seek restitution, unspecified compensatory damages and reimbursement of certain costs and expenses. Although FBR & Co. is contractually entitled to be indemnified by TMI in connection with this lawsuit, TMI filed for bankruptcy on May 1, 2009 and this likely will decrease or eliminate the value of the indemnity that FBR & Co. receives from TMI. On September 22, 2008, FBR & Co. filed a motion to dismiss the consolidated class action complaint as to FBR & Co. The District Court granted that motion on January 27, 2010. Plaintiffs were granted leave by the District court to file a motion for leave to amend the complaint and a motion for reconsideration of the Court’s order dismissing the amended complaint. FBR & Co. opposed those motions; briefing is complete and the motions were argued on November 3, 2010. The District Court’s decision is still pending.
FBR & Co. has been named as a defendant in a case relating to its role as an underwriter in residential mortgage-backed securities (“RMBS”) offerings. FBR & Co. is among dozens of underwriter, securitization trust and depositor defendants in an individual action filed by Cambridge Place Investment Management, Inc. in Massachusetts state court (Cambridge Place Investment Management Inc. v. Morgan Stanley et al). Cambridge’s complaint relates to the more than $2.4 billion in RMBS purchases it made in numerous underwritten offerings (of which the claims concerning FBR & Co. are limited to Cambridge’s purchases of a combined $22 million of RMBS in two separate offerings) and alleges that each of the defendants made misrepresentations and omissions relating to, among other things, loan-to-value ratios, appraisals, and underwriting standards, in violation of state
F-27
Table of Contents
securities laws. FBR & Co. has contractual indemnification claims against the RMBS issuers and contribution claims against co-underwriters involved in the two offerings for which claims have been made against it.
Although these cases involving FBR & Co. are at a preliminary stage, based on management’s review with counsel and present information currently known by management, resolution of such matters is not expected to have a material effect on the Company’s financial condition, results of operations, or liquidity.
In certain circumstances, broker-dealers and asset managers may also be held liable by customers and clients for losses sustained on investments. In recent years, there has been an increasing incidence of litigation and actions by government agencies and self regulatory organizations involving the securities industry, including class actions that seek substantial damages. The Company is also subject to the risk of litigation, including litigation that may be without merit. As the Company intends to actively defend such litigation, significant legal expenses could be incurred. An adverse resolution of any future litigation against the Company could materially affect its financial condition, operating results and liquidity.
Note 12. Shareholders’ Equity:
Equity Offering
In June 2009, the Company completed a public follow-on equity offering of 20,000,000 shares of its common stock at a per share price of $4.65. As result of the offering, the Company received proceeds of $90,143, net of $2,857 in transaction costs.
Share Repurchases
As of January 1, 2010, the Company had authority to repurchase up to 3,418,885 shares of common stock. In July 2010, the Board of Directors of the Company approved a 5,000,000 share increase to the number of shares of the Company’s common stock that the Company is authorized to repurchase. During the year ended December 31, 2010, the Company repurchased 3,197,374 shares, of its common stock in open market transactions at a weighted average share price of $4.97 per share, for a total cost of $15,905. The remaining repurchase authority is 5,221,511 shares as of December 31, 2010.
In May 2009, the Company entered into a Repurchase Agreement with Arlington Asset and Arlington Asset’s direct, wholly-owned subsidiary, FBR TRS Holdings, Inc., pursuant to which, among other things, the Company repurchased 16,667,000 shares of its common stock at a share price of $4.35 for a total cost of $72,501 plus transaction-related expenses of $971. Along with this agreement, the companies agreed to terminate all of the agreements then in place between Arlington Asset and the Company, other than a Voting Agreement, dated as of July 20, 2006, by and among the Company and certain of its subsidiaries, Arlington Asset and certain of its subsidiaries, and certain affiliates of Crestview, which agreement was amended and restated. At the same time, the Company entered into the following agreements with Arlington Asset: a Transition Services Agreement, an Assignment and Assumption Agreement, a Trademark and Copyright Assignment, a Domain Name Assignment and a Trademark License Agreement.
In October 2008, the Company’s Board of Directors approved an increase in the number of shares of the Company’s common stock that the Company is authorized to repurchase to 10,000,000 shares. During the year ended December 31, 2008, the Company repurchased a total of 6,748,546 shares of common stock at a weighted average price of $5.02 per share. These repurchases included the repurchase by the Company on behalf of itself and one of its subsidiaries of a total of 6,565,405 shares of common stock directly from Passport Capital LLC’s Global Master Fund SPC LTD for and on behalf of Portfolio A—Global Strategy (“Passport”) on October 7, 2008. The repurchase from Passport was a privately negotiated transaction at a purchase price of $5.00 per share. No repurchases were made during the year ended December 31, 2009 under this authorization.
F-28
Table of Contents
Employee Stock Purchase Plan
Under the Employee Stock Purchase Plan (“Purchase Plan”), eligible employees may purchase common stock through payroll deductions at a price that is 85% of the lower of the market value of the common stock on the first day of the offering period or the last day of the offering period. In accordance with the provisions of ASC 718, the Company is required to recognize compensation expense relating to shares offered under the Purchase Plan. For the years ended December 31, 2010, 2009 and 2008, the Company recognized compensation expense of $378, $465, and $376, respectively, related to the Purchase Plan.
Partner Leveraged Stock Purchase Program
The Company initiated the Partner Leveraged Stock Purchase Program (“PLSPP”) in December 2009. Under the PLSPP, non-executive officer employees who are members of the Company’s Partnership Group as well as the Company’s Chief Financial Officer and General Counsel were granted the right to purchase shares of the Company’s common stock on four specific offering dates during the fourth quarter of 2009 and the first half of 2010. Each participant was initially granted the right to purchase up to either 25,000 shares or 50,000 shares. The Company offered to provide a full recourse loan at market rates and terms to each non-executive officer participant for up to 50% of the aggregate purchase price, collateralized by the shares purchased, bearing interest at market rates, and maturing three years from the date of issuance. For each share purchased by the participant, the Company would grant two options (three options in the case of each of the Company’s Chief Financial Officer and General Counsel) to purchase the Company’s common stock under the FBR Capital Markets Long-Term Incentive Plan (described below) that are subject to a 3-year cliff vesting requirement. For the years ended December 31, 2010 and 2009, participants purchased 264,535 and 210,500, respectively, for an aggregate purchase price of $1,286 and $1,431, respectively. As of December 31, 2010 and 2009, the Company had loans outstanding to participants of $706 and $391, respectively. The employee stock loan receivable balance is included in shareholders’ equity on the balance sheet.
Stock Compensation Plans
FBR Capital Markets Corporation 2006 Long-Term Incentive Plan (FBR Capital Markets Long-Term Incentive Plan)
Under the FBR Capital Markets Long-Term Incentive Plan, as amended, the Company may grant options to purchase stock, stock appreciation rights, performance awards, restricted and unrestricted stock and RSUs for up to an aggregate of 22,069,985 shares of common stock, subject to increase under certain provisions of the plan, to eligible participants. Participants include employees, officers and directors of the Company and its subsidiaries. The FBR Capital Markets Long-Term Incentive Plan has a term of 10 years and options granted may have an exercise period of up to 10 years. Options may be incentive stock options, as defined by Section 422 of the Internal Revenue Code, or nonqualified stock options.
The Company grants options to purchase stock, restricted shares of common stock and RSUs to employees that vest based on meeting specified service conditions of three to five years and in certain cases achievement of specified market conditions. The following table presents compensation expense related to these awards for the periods indicated:
| Year Ended December 31, | ||||||||||||
| 2010 | 2009 | 2008 | ||||||||||
| Stock Options |
$ | 3,937 | $ | 5,096 | $ | 4,116 | ||||||
| Restricted shares |
2,939 | 5,153 | 6,373 | |||||||||
| RSUs |
11,749 | 9,088 | 8,063 | |||||||||
The fair value of each option grant is estimated on the date of grant using the Black-Scholes option-pricing model. Due to the relatively short period in which the Company has been publicly-traded, the Company has not
F-29
Table of Contents
based its volatility assumption solely on historical data. The Company has used a combination of its historical volatility, historical industry comparisons, and other market data in order to determine the volatility assumption. The risk-free interest rate is based on the rates of the U.S. Treasury with similar maturities as the expected life of the award. The expected life of the awards is based on the length of time from the grant date to the midpoint of the vesting date and the contractual expiration date of the award. The Company uses this methodology for determining expected life as the Company does not have sufficient historical data to estimate an expected life as a majority of the initial stock options issued by the Company since its inception became exercisable in the current year. The dividend yield is based on the expected dividend payout over the expected life of the award. The following weighted average assumptions used for options granted for the periods indicated:
| Year Ended December 31, | ||||||||||||
| 2010 | 2009 | 2008 | ||||||||||
| Volatility |
45.0 | % | 56.8 | % | 56.6 | % | ||||||
| Risk-free interest rate |
2.5 | % | 2.3 | % | 3.0 | % | ||||||
| Expected life (years) |
5.1 | 5.1 | 5.5 | |||||||||
| Dividend yield |
— | — | — | |||||||||
| Weighted average fair value |
$ | 2.19 | $ | 2.55 | $ | 2.99 | ||||||
The fair value of each RSU with a market condition is estimated on the date of grant using a lattice-pricing model. The methodology for determining the assumptions used for these valuations is similar to those described above for stock options. The assumptions used for 76,000 RSUs with a market condition granted during the year ended December 31, 2010 were a volatility of 45.0%, risk-free interest rate of 1.4% and an expected term based on the applicable service condition. The assumptions used for RSUs with a market condition granted during years ended December 31, 2009 and 2008 were a volatility of 56.8%, risk-free interest rates between 1.9% – 3.0% and an expected term based on the applicable service condition.
The following table presents the unrecognized compensation related to unvested options to purchase stock, restricted shares of common stock, and RSUs and the weighted average vesting period in which the expense will be recognized:
| As of December 31, 2010 | ||||||||||||
| Stock Options |
Restricted Shares |
RSUs | ||||||||||
| Unrecognized compensation |
$ | 5,881 | $ | 1,938 | $ | 18,398 | ||||||
| Unvested awards |
5,088,862 | 658,204 | 8,230,665 | |||||||||
| Weighted average vesting period |
2.7 years | 1.4 years | 2.8 years | |||||||||
F-30
Table of Contents
Stock Options
A summary of option activity under the FBR Capital Markets Long Term Incentive Plan as of December 31, 2010, and changes during the years ended December 31, 2010, 2009, and 2008 are presented below:
| Number of Shares |
Weighted-average Exercise Prices |
Weighted-average Remaining Contractual Life |
||||||||||
| Share Balance as of December 31, 2007 |
4,432,754 | $ | 15.03 | 5.0 | ||||||||
| Granted |
2,525,169 | 5.60 | ||||||||||
| Forfeitures |
(1,045,963 | ) | 14.90 | |||||||||
| Share Balance as of December 31, 2008 |
5,911,960 | $ | 11.03 | 5.2 | ||||||||
| Granted |
2,589,026 | 5.16 | ||||||||||
| Forfeitures |
(1,023,833 | ) | 14.47 | |||||||||
| Share Balance as of December 31, 2009 |
7,477,153 | $ | 8.52 | 5.1 | ||||||||
| Granted |
1,513,530 | 5.14 | ||||||||||
| Forfeitures |
(1,011,500 | ) | 8.16 | |||||||||
| Share Balance as of December 31, 2010 |
7,979,183 | $ | 7.93 | 4.3 | ||||||||
| Options Exercisable as of December 31, 2010 |
2,890,321 | $ | 12.50 | 2.4 | ||||||||
Restricted Stock
A summary of unvested restricted stock awards as of December 31, 2010, and changes during the years ended December 31, 2010, 2009, and 2008 are presented below:
| Number of Shares |
Weighted-average Grant-date Fair Value |
Weighted-average Remaining Vested Period |
||||||||||
| Share Balance as of December 31, 2007 |
1,943,863 | $ | 16.29 | 3.9 | ||||||||
| Granted |
295,989 | 6.85 | ||||||||||
| Vestings |
(84,892 | ) | 15.01 | |||||||||
| Forfeitures |
(529,191 | ) | 15.87 | |||||||||
| Share Balance as of December 31, 2008 |
1,625,769 | $ | 14.68 | 2.9 | ||||||||
| Granted |
— | — | ||||||||||
| Vestings |
(110,040 | ) | 12.49 | |||||||||
| Forfeitures |
(154,897 | ) | 15.63 | |||||||||
| Share Balance as of December 31, 2009 |
1,360,832 | $ | 14.86 | 1.9 | ||||||||
| Granted |
— | — | ||||||||||
| Vestings |
(613,835 | ) | 15.65 | |||||||||
| Forfeitures |
(88,793 | ) | 16.08 | |||||||||
| Share Balance as of December 31, 2010 |
658,204 | $ | 13.96 | 1.4 | ||||||||
RSUs
In August 2008, the Company’s Board of Directors approved the modification of certain RSUs with a market condition issued in February 2008 to 45 employees and outstanding as of the modification date. A total of 4,285,000 RSUs with a market condition issued in February 2008 were modified as part of this action by the Board of Directors. The modifications included (i) the modification of 1,142,666 RSUs to require a service period only and (ii) the replacement of 3,142,334 RSUs with 1,142,666 RSUs with a revised market condition and 2,258,668 options to purchase the Company’s common stock. In accordance with ASC 718, the Company
F-31
Table of Contents
has accounted for both of the changes as a modification to the original award and has determined the compensation expense based on the total of unrecognized compensation of the original awards plus the incremental increase in fair value of the new award compared to the fair value of the original award as of the modification date. The incremental cost of the modified awards totaled $9,890. The Company has included the modified awards in the issuance balances for RSUs and stock options for the year ended December 31, 2008.
A summary of unvested restricted stock units as of December 31, 2010, and changes during the years ended December 31, 2010, 2009, and 2008 are presented below:
| Number of Shares |
Weighted-average Grant-date Fair Value |
Weighted-average Remaining Vested Period |
||||||||||
| Share Balance as of December 31, 2007 |
— | $ | — | — | ||||||||
| Granted |
9,455,725 | 5.65 | ||||||||||
| Vestings |
(3 | ) | 8.21 | |||||||||
| Forfeitures |
(733,844 | ) | 3.71 | |||||||||
| Cancellations |
(3,142,334 | ) | 2.10 | |||||||||
| Share Balance as of December 31, 2008 |
5,579,544 | $ | 5.61 | 4.1 | ||||||||
| Granted |
2,203,388 | 4.85 | ||||||||||
| Vestings |
(171,005 | ) | 5.20 | |||||||||
| Forfeitures |
(274,242 | ) | 5.35 | |||||||||
| Share Balance as of December 31, 2009 |
7,337,685 | $ | 5.38 | 3.5 | ||||||||
| Granted |
2,778,592 | 5.27 | ||||||||||
| Vestings |
(417,123 | ) | 5.48 | |||||||||
| Forfeitures |
(1,468,489 | ) | 5.35 | |||||||||
| Share Balance as of December 31, 2010(1) |
8,230,665 | $ | 5.34 | 2.8 | ||||||||
| (1) | As of December 31, 2010, 1,060,000 RSUs had vesting requirements that were subject to a market condition in which the Company does not believe will be achieved. |
Deferred Compensation Awards
In addition, as part of the Company’s satisfaction of incentive compensation earned for past service under the Company’s variable compensation programs, employees may receive restricted shares of common stock or RSUs in lieu of cash payments. These shares and RSUs are issued to an irrevocable trust for the benefit of the employees and are not returnable to the Company. For the years ended December 31, 2010, 2009, and 2008, the Company granted such stock-based awards with an aggregate fair value upon grant date of $6,975, $3,048, and $6,434, respectively. A summary of restricted stock irrevocable trust awards as of December 31, 2010, and changes during the years ended December 31, 2010, 2009, and 2008 are presented below:
| Number of Shares |
Weighted-average Grant-date Fair Value |
Weighted-average Remaining Vested Period |
||||||||||
| Share Balance as of December 31, 2007 |
727,964 | $ | 13.35 | 2.6 | ||||||||
| Granted |
700,374 | 7.30 | ||||||||||
| Vestings |
(253,313 | ) | 12.73 | |||||||||
| Cancelled and reissued as RSUs |
(5,691 | ) | 13.33 | |||||||||
| Share Balance as of December 31, 2008 |
1,169,334 | $ | 9.86 | 1.9 | ||||||||
| Granted |
— | — | ||||||||||
| Vestings |
(412,806 | ) | 10.29 | |||||||||
| Share Balance as of December 31, 2009 |
756,528 | $ | 9.64 | 0.9 | ||||||||
| Granted |
— | — | ||||||||||
| Vestings |
(413,600 | ) | 10.35 | |||||||||
| Share Balance as of December 31, 2010 |
342,928 | $ | 8.77 | 0.7 | ||||||||
F-32
Table of Contents
A summary of restricted stock unit awards held in the irrevocable trust as of December 31, 2010, and changes during the years ended December 31, 2010, 2009, and 2008 are presented below:
| Number of Shares |
Weighted-average Grant-date Fair Value |
Weighted-average Remaining Vested Period |
||||||||||
| Share Balance as of December 31, 2007 |
— | $ | — | — | ||||||||
| Granted |
227,377 | 5.81 | ||||||||||
| Vestings |
(8,427 | ) | 9.36 | |||||||||
| Share Balance as of December 31, 2008 |
218,950 | $ | 5.67 | 2.6 | ||||||||
| Granted |
888,569 | 3.43 | ||||||||||
| Vestings |
(113,127 | ) | 5.07 | |||||||||
| Share Balance as of December 31, 2009 |
994,392 | $ | 3.74 | 2.1 | ||||||||
| Granted |
1,238,881 | 5.63 | ||||||||||
| Vestings |
(513,587 | ) | 4.26 | |||||||||
| Share Balance as of December 31, 2010 |
1,719,686 | $ | 4.94 | 1.8 | ||||||||
Note 13. Financial Instruments with Off-Balance-Sheet Risk and Credit Risk:
Financial Instruments
The Company’s trading and investment activities include equity securities, convertible debt securities, corporate debt securities, bank loans, and listed equity options that are primarily traded in United States markets. The Company previously invested in mortgage-backed securities and partially funded its investments through repurchase agreement borrowings. Accordingly, the Company was subject to leverage and interest rate risk prior to the sale of its remaining mortgage-backed securities and repayment of the related repurchase agreements in the first quarter of 2009.
The Company’s investment funds that are advised by our asset management subsidiaries trade and invest in public and non-public securities. As of December 31, 2010 and 2009, the Company had not entered into any transactions involving financial instruments that would expose the Company to significant related off-balance-sheet risk.
In addition, as part of its market making activities, the Company sells equity and debt securities it does not currently own (securities sold, not yet purchased—see Note 4). When the Company sells a security short and borrows the security to make a delivery, a gain, limited to the price at which the Company sold the security short, or a loss, unlimited in size, will be realized upon the termination of the short sale.
Market Risk
The securities industry is subject to numerous risks, including the risk of loss associated with the underwriting, ownership, and trading of securities, and the risk of reduced revenues in periods of reduced demand for security offerings and activity in secondary trading markets. Changing economic and market trends may negatively impact the liquidity and value of the Company’s investments and the level of security offerings underwritten by the Company, which may adversely affect the Company’s revenues and profitability.
Market risk is primarily caused by movements in market prices of the Company’s trading and investment account securities and changes in value of the underlying securities of the investment funds in which the Company invests. The Company’s trading securities and investments are also subject to interest rate volatility and possible illiquidity in markets in which the Company trades or invests. The Company seeks to manage market risk through monitoring procedures. The Company’s principal transactions are primarily long and short equity and convertible debt transactions.
F-33
Table of Contents
Positions taken and commitments made by the Company, including those made in connection with investment banking activities, may result in substantial amounts of exposure to individual issuers and businesses, including non-investment grade issuers, securities with low trading volumes and those not readily marketable. These issuers and securities may expose the Company to a higher degree of risk than associated with investment grade instruments.
Credit Risk
The Company’s broker-dealer subsidiaries function as introducing brokers that place and execute customer orders. The orders are then settled by an unrelated clearing organization that maintains custody of customers’ securities and provides financing to customers.
The Company’s broker-dealer subsidiaries clear all of their securities transactions through a clearing broker on a fully disclosed basis. Pursuant to the terms of the agreements between the Company’s broker-dealer subsidiaries and the clearing broker, the clearing broker has the right to charge the Company for losses that result from a counterparty’s failure to fulfill its contractual obligations. As the right to charge our broker-dealer subsidiaries has no maximum amount and applies to all trades executed through the clearing broker, the Company believes there is no maximum amount assignable to this right. At December 31, 2010 and 2009, the Company has recorded no liabilities, and during the years ended December 31, 2010, 2009 and 2008, the Company did not incur any significant costs, with regard to this right.
The due from and to brokers, dealers, and clearing organizations balances primarily represent unsettled trades associated with the Company’s credit sales and trading platform. These transactions include corporate bonds and syndicated loan trades. As part of this activity, the Company incurs counterparty credit risk due to the extended settlement nature of most par and distressed bank loan transactions. Par loan and distressed loan trades have extended settlement periods due to the administrative and legal requirements associated with transferring title of such instruments. During this period whereby a trade has been executed but not settled, the Company is at risk if one of its counterparties defaults on a trade obligation and the Company has to meet this obligation at market prices that are adverse relative to the original trade. The Company manages this exposure by calculating the current and potential default exposure on each trade and by maintaining risk limits for each counterparty with whom it has outstanding bank loan trades.
In addition, the Company has the right to pursue collection of performance from the counterparties who do not perform under their contractual obligations. The Company monitors the credit standing of the clearing broker and all counterparties with which it conducts business.
We attempt to limit our credit spread risk by offsetting long or short positions in various related securities, but from time to time may also hedge credit risk exposure through the use of credit derivatives such as credit default swaps.
Through indemnification provisions in agreements with clearing organizations, customer activities may expose the Company to off-balance-sheet credit risk. Financial instruments may have to be purchased or sold at prevailing market prices in the event a customer fails to settle a trade on its original terms or in the event cash and securities in customer margin accounts are not sufficient to fully cover customer obligations. The Company seeks to manage the risks associated with customer activities through customer screening and selection procedures as well as through requirements on customers to maintain margin collateral in compliance with various regulations and clearing organization policies.
The Company’s equity and debt securities held for trading and investment purposes include non-investment grade securities of privately held issuers with no ready markets. The concentration and illiquidity of these investments expose the Company to a higher degree of risk than associated with readily marketable securities.
F-34
Table of Contents
Note 14. Segment Information:
The Company considers its capital markets, asset management and principal investing operations to be separate reportable segments. The capital markets segment includes the Company’s investment banking and institutional sales, trading and research operations. These businesses operate as a single integrated unit to deliver capital raising, advisory and sales and trading services to corporate and institutional clients. Asset management includes the Company’s fee-based asset management operations. Principal investing includes investments in merchant banking and other investments.
The Company has developed systems and methodologies to allocate overhead costs to its business units and, accordingly, presents segment information consistent with internal management reporting. Revenue generating transactions between the individual segments have been included in the net revenue and pre-tax income of each segment. The Company’s revenues from foreign operations totaled $9,331, $12,233, and $18,069 for the years ended December 31, 2010, 2009 and 2008, respectively. The following tables illustrate the financial information for the Company’s segments for the periods indicated.
| For year ended December 31, 2010 | ||||||||||||||||
| Capital Markets |
Asset Management |
Principal Investing |
Total | |||||||||||||
| Revenues, net of interest expense: |
||||||||||||||||
| Investment banking |
$ | 118,273 | $ | — | $ | — | $ | 118,273 | ||||||||
| Institutional brokerage |
100,091 | — | — | 100,091 | ||||||||||||
| Asset management fees |
— | 14,097 | — | 14,097 | ||||||||||||
| Net investment income |
— | 56 | 9,162 | 9,218 | ||||||||||||
| Net interest income, dividends, and other |
2,102 | 32 | 2,774 | 4,908 | ||||||||||||
| Total |
220,466 | 14,185 | 11,936 | 246,587 | ||||||||||||
| Operating Expenses: |
||||||||||||||||
| Variable |
95,429 | 7,118 | 276 | 102,823 | ||||||||||||
| Fixed |
173,354 | 9,908 | 2,164 | 185,426 | ||||||||||||
| Total |
268,783 | 17,026 | 2,440 | 288,249 | ||||||||||||
| Pre-tax (loss) income |
$ | (48,317 | ) | $ | (2,841 | ) | $ | 9,496 | $ | (41,662 | ) | |||||
| Compensation and benefits: |
||||||||||||||||
| Variable |
$ | 68,040 | $ | 3,697 | $ | 244 | $ | 71,981 | ||||||||
| Fixed |
103,886 | 5,268 | 1,295 | 110,449 | ||||||||||||
| Total |
$ | 171,926 | $ | 8,965 | $ | 1,539 | $ | 182,430 | ||||||||
| Total assets |
$ | 277,601 | $ | 17,321 | $ | 136,545 | $ | 431,467 | ||||||||
| Total net assets |
$ | 139,914 | $ | 15,315 | $ | 136,262 | $ | 291,491 | ||||||||
F-35
Table of Contents
| For year ended December 31, 2009 | ||||||||||||||||
| Capital Markets |
Asset Management |
Principal Investing |
Total | |||||||||||||
| Revenues, net of interest expense: |
||||||||||||||||
| Investment banking |
$ | 138,723 | $ | — | $ | — | $ | 138,723 | ||||||||
| Institutional brokerage |
132,629 | — | — | 132,629 | ||||||||||||
| Asset management fees |
— | 13,244 | — | 13,244 | ||||||||||||
| Net investment income |
— | — | 1,577 | 1,577 | ||||||||||||
| Net interest income, dividends, and other |
1,358 | 525 | 4,177 | 6,060 | ||||||||||||
| Total |
272,710 | 13,769 | 5,754 | 292,233 | ||||||||||||
| Operating Expenses: |
||||||||||||||||
| Variable |
116,159 | 8,839 | 109 | 125,107 | ||||||||||||
| Fixed |
176,103 | 13,027 | 1,635 | 190,765 | ||||||||||||
| Impairment of intangible assets |
— | 5,350 | — | 5,350 | ||||||||||||
| Total |
292,262 | 27,216 | 1,744 | 321,222 | ||||||||||||
| Pre-tax (loss) income |
$ | (19,552 | ) | $ | (13,447 | ) | $ | 4,010 | $ | (28,989 | ) | |||||
| Compensation and benefits: |
||||||||||||||||
| Variable |
$ | 89,404 | $ | 3,128 | $ | 97 | $ | 92,629 | ||||||||
| Fixed |
94,046 | 5,815 | 527 | 100,388 | ||||||||||||
| Total |
$ | 183,450 | $ | 8,943 | $ | 624 | $ | 193,017 | ||||||||
| Total assets |
$ | 369,739 | $ | 20,689 | $ | 165,897 | $ | 556,325 | ||||||||
| Total net assets |
$ | 142,917 | $ | 18,241 | $ | 158,341 | $ | 319,499 | ||||||||
| For year ended December 31, 2008 | ||||||||||||||||
| Capital Markets |
Asset Management |
Principal Investing |
Total | |||||||||||||
| Revenues, net of interest expense: |
||||||||||||||||
| Investment banking |
$ | 96,950 | $ | — | $ | — | $ | 96,950 | ||||||||
| Institutional brokerage |
137,263 | — | — | 137,263 | ||||||||||||
| Asset management fees |
— | 15,883 | — | 15,883 | ||||||||||||
| Net investment loss |
— | — | (79,551 | ) | (79,551 | ) | ||||||||||
| Net interest income, dividends, and other |
1,795 | 1,390 | 8,178 | 11,363 | ||||||||||||
| Total |
236,008 | 17,273 | (71,373 | ) | 181,908 | |||||||||||
| Operating Expenses: |
||||||||||||||||
| Variable |
121,270 | 11,304 | 55 | 132,629 | ||||||||||||
| Fixed |
224,789 | 20,880 | 1,830 | 247,499 | ||||||||||||
| Total |
346,059 | 32,184 | 1,885 | 380,128 | ||||||||||||
| Pre-tax loss |
$ | (110,051 | ) | $ | (14,911 | ) | $ | (73,258 | ) | $ | (198,220 | ) | ||||
| Compensation and benefits: |
||||||||||||||||
| Variable |
$ | 90,810 | $ | 4,042 | $ | 4 | $ | 94,856 | ||||||||
| Fixed |
122,970 | 9,053 | 235 | 132,258 | ||||||||||||
| Total |
$ | 213,780 | $ | 13,095 | $ | 239 | $ | 227,114 | ||||||||
| Total assets |
$ | 218,574 | $ | 34,607 | $ | 547,188 | $ | 800,369 | ||||||||
| Total net assets |
$ | 144,428 | $ | 30,789 | $ | 128,510 | $ | 303,727 | ||||||||
F-36
Table of Contents
Note 15. Quarterly Data (Unaudited):
The following tables set forth selected information for each of the fiscal quarters during the years ended December 31, 2010 and 2009. The selected quarterly data is derived from unaudited financial statements of the Company and has been prepared on the same basis as the annual, audited financial statements to include, in the opinion of management, all adjustments (consisting of only normal recurring adjustments) necessary for fair statement of the results for such periods.
Note: The sum of quarterly earnings per share amounts may not equal full year earnings per share amounts due to differing average outstanding shares amounts for the respective periods.
| Total Revenues |
Net (Loss) Income Before Income Taxes |
Net (Loss) Income |
Basic (Loss) Earnings Per Share |
Diluted (Loss) Earnings Per Share |
||||||||||||||||
| 2010 |
||||||||||||||||||||
| First Quarter |
$ | 44,217 | $ | (24,541 | ) | $ | (8,262 | ) | $ | (0.13 | ) | $ | (0.13 | ) | ||||||
| Second Quarter |
69,706 | (12,155 | ) | (25,767 | ) | (0.41 | ) | (0.41 | ) | |||||||||||
| Third Quarter |
57,394 | (7,593 | ) | (6,611 | ) | (0.10 | ) | (0.10 | ) | |||||||||||
| Fourth Quarter |
75,270 | 2,627 | 3,082 | 0.05 | 0.05 | |||||||||||||||
| Total Year |
$ | 246,587 | $ | (41,662 | ) | $ | (37,558 | ) | $ | (0.59 | ) | $ | (0.59 | ) | ||||||
| 2009 |
||||||||||||||||||||
| First Quarter |
$ | 49,903 | $ | (15,558 | ) | $ | (16,167 | ) | $ | (0.27 | ) | $ | (0.27 | ) | ||||||
| Second Quarter |
47,328 | (21,640 | ) | (21,744 | ) | (0.40 | ) | (0.40 | ) | |||||||||||
| Third Quarter |
71,440 | (6,958 | ) | (6,970 | ) | (0.11 | ) | (0.11 | ) | |||||||||||
| Fourth Quarter |
123,814 | 15,167 | 17,230 | 0.27 | 0.26 | |||||||||||||||
| Total Year |
$ | 292,485 | $ | (28,989 | ) | $ | (27,651 | ) | $ | (0.46 | ) | $ | (0.46 | ) | ||||||
F-37
Table of Contents
EXHIBIT INDEX
| Exhibit Number |
Description | |
| 3.1 | Amended and Restated Articles of Incorporation of the Registrant.(1) | |
| 3.2 | Amended and Restated Bylaws of the Registrant.(1) | |
| 4.1 | Form of Certificate for Common Stock.(3) | |
| 4.2 | Registration Rights Agreement, dated as of July 20, 2006, between the Registrant, Forest Holdings LLC and Forest Holdings (ERISA) LLC.(1) | |
| 4.3 | Registration Rights Agreement, dated January 26, 2009, between the Registrant and Friedman, Billings, Ramsey Group, Inc.(8) | |
| 4.4 | Form of Amended and Restated Voting Agreement, dated as of May 20, 2009, between Friedman, Billings, Ramsey Group, Inc., FBR TRS Holdings, Inc., FBR Capital Markets Corporation, Forest Holdings LLC and Forest Holdings (ERISA) LLC.(9) | |
| 4.5 | Form of Senior Indenture.(11) | |
| 4.6 | Form of Subordinated Indenture.(11) | |
| 4.7 | Form of Subscription Agreement by and between FBR Capital Markets Corporation and purchasers of common stock of FBR Capital Markets Corporation in connection with the closing of the transactions contemplated by the Watch Hill Purchase Agreement.(12) | |
| 10.1 | 2006 Long-Term Incentive Plan (as Amended and Restated Effective June 3, 2010).(13)† | |
| 10.2 | Form of Incentive Stock Option Agreement.(1)† | |
| 10.3 | Form of Non-Qualified Stock Option Agreement.(1)† | |
| 10.4 | Tax Sharing Agreement, dated as of July 20, 2006, between FBR TRS Holdings, Inc. and the Registrant.(1) | |
| 10.5 | Investment Agreement, dated as of July 19, 2006, among the Registrant, Forest Holdings LLC and Forest Holdings (ERISA) LLC.(1) | |
| 10.6 | Option Agreement, dated as of July 20, 2006, between the Registrant and Forest Holdings LLC.(1) | |
| 10.7 | Option Agreement, dated as of July 20, 2006, between the Registrant and Forest Holdings (ERISA) LLC.(1) | |
| 10.8 | Professional Services Agreement, dated as of July 20, 2006, between the Registrant and Crestview Advisors, L.L.C.(1) | |
| 10.9 | Amendment No. 2 to Professional Services Agreement, dated June 14, 2010, between the Registrant and Crestview Advisors, L.L.C.(14) | |
| 10.10 | Form of Subscription Agreement with respect to the Registrant’s Director Stock Purchase Plan.(2)† | |
| 10.11 | 2007 Employee Stock Purchase Plan, amended as of April 23, 2007.(2)† | |
| 10.12 | Form of resolution of the Registrant’s Board of Directors with respect to the Registrant’s Director Stock Purchase Plan.(2)† | |
| 10.13 | Description of the Registrant’s 2008 Incentive Compensation Program.(4)† | |
| 10.14 | Retention Incentive Agreement, dated April 30, 2008, by and between the Registrant and Richard J. Hendrix.(5)† | |
| 10.15 | Employment Agreement, dated April 30, 2008, by and between the Registrant and Richard J. Hendrix.(5)† | |
Table of Contents
| Exhibit Number |
Description | |
| 10.16 | Form of Amendment to Original 2008 Performance RSU Award Agreement.(6)† | |
| 10.17 | Form of August 2008 Performance RSU Award Agreement.(6)† | |
| 10.18 | Form of Stock Option Agreement.(6)† | |
| 10.19 | Form of Restrictive Covenant Agreement.(6)† | |
| 10.20 | Retirement Agreement between the Registrant and Eric F. Billings, dated December 21, 2008.(7)† | |
| 10.21 | Director Agreement between the Registrant and Eric F. Billings, dated December 21, 2008.(7)† | |
| 10.22 | Stock Repurchase Agreement, dated as of May 18, 2009, by and among the Registrant, Friedman, Billings, Ramsey Group, Inc. (d/b/a Arlington Asset Investment Corp.), and FBR TRS Holdings, Inc.(9) | |
| 10.23 | Form of Transition Services Agreement by and between the Registrant and Friedman, Billings, Ramsey Group, Inc. (d/b/a Arlington Asset Investment Corp.).(9) | |
| 10.24 | Form of Assignment and Assumption Agreement by and between the Registrant and Friedman, Billings, Ramsey Group, Inc. (d/b/a Arlington Asset Investment Corp.).(9) | |
| 10.25 | Form of Trademark and Copyright Assignment by and between the Registrant and Friedman, Billings, Ramsey Group, Inc. (d/b/a Arlington Asset Investment Corp.).(9) | |
| 10.26 | Form of Domain Name Assignment by and between the Registrant and Friedman, Billings, Ramsey Group, Inc. (d/b/a Arlington Asset Investment Corp.).(9) | |
| 10.27 | Form of Trademark License Agreement by and between the Registrant and Friedman, Billings, Ramsey Group, Inc. (d/b/a Arlington Asset Investment Corp.).(9) | |
| 10.28 | Form of LTIP RSU Award Agreement.(10)† | |
| 10.29 | RSU Award Agreement, dated February 9, 2010, between the Registrant and Richard J. Hendrix.(10)† | |
| 10.30 | Stock Option Agreement, dated February 9, 2010, between the Registrant and Richard J. Hendrix.(10)† | |
| 10.31 | FBR Capital Markets Corporation 2010 Partner Leveraged Stock Purchase Program, as amended and restated.(10)† | |
| 12.1 | Statement regarding Computation of Ratio of Earnings to Fixed Charges.* | |
| 21.1 | Subsidiaries of the Registrant.* | |
| 23.1 | Consent of PricewaterhouseCoopers LLP.* | |
| 31.1 | Certification of Chief Executive Officer pursuant to Rule 13a-14(a)/15d-14(a), as adopted pursuant to Section 302 of the Sarbanes-Oxley Act of 2002.* | |
| 31.2 | Certification of Chief Financial Officer pursuant to Rule 13a-14(a)/15d-14(a), as adopted pursuant to Section 302 of the Sarbanes-Oxley Act of 2002.* | |
| 32.1 | Certification of Chief Executive Officer pursuant to 18 U.S.C. Section 1350, as adopted pursuant to Section 906 of the Sarbanes-Oxley Act of 2002.* | |
| 32.2 | Certification of Chief Financial Officer pursuant to 18 U.S.C. Section 1350, as adopted pursuant to Section 906 of the Sarbanes-Oxley Act of 2002.* | |
Table of Contents
| (1) | Previously filed as an exhibit to the Registrant’s Registration Statement on Form S-1 (Registration No. 333-138824), which was filed with the SEC on November 17, 2006, and incorporated by reference herein. |
| (2) | Previously filed as an exhibit to Pre-Effective Amendment No. 1 to the Registrant’s Registration Statement on Form S-1/A (Registration No. 333-141987), which was filed with the SEC on May 10, 2007, and incorporated by reference herein. |
| (3) | Previously filed as an exhibit to Pre-Effective Amendment No. 2 to the Registrant’s Registration Statement on Form S-1/A (Registration No. 333-141987), which was filed with the SEC on May 21, 2007, and incorporated by reference herein. |
| (4) | Incorporated herein by reference to the description of such program included in Item 5.02 of the Registrant’s Current Report on Form 8-K, which was filed with the SEC on February 26, 2008. |
| (5) | Previously filed as an exhibit to the Registrant’s Quarterly Report on Form 10-Q for the quarterly period ended March 31, 2008, which was filed with the SEC on May 12, 2008, and incorporated herein by reference. |
| (6) | Previously filed as an exhibit to the Registrant’s Current Report on Form 8-K, which was filed with the SEC on August 21, 2008, and incorporated herein by reference. |
| (7) | Previously filed as an exhibit to the Registrant’s Current Report on Form 8-K, which was filed with the SEC on December 22, 2008, and incorporated herein by reference. |
| (8) | Previously filed as an exhibit to the Registrant’s Quarterly Report on Form 10-Q for the quarterly period ended March 31, 2009, which was filed with the SEC on May 8, 2009, and incorporated herein by reference. |
| (9) | Previously filed as an exhibit to the Registrant’s Current Report on Form 8-K, which was filed with the SEC on May 19, 2009, and incorporated herein by reference. |
| (10) | Previously filed as an exhibit to the Registrant’s Current Report on Form 8-K, which was filed with the SEC on February 16, 2010, and incorporated herein by reference. |
| (11) | Previously filed as an exhibit to Amendment No. 1 to the Registrant’s Registration Statement on Form S-3/A (Registration No. 333-159415), which was initially filed with the SEC on May 22, 2009, and incorporated herein by reference. |
| (12) | Previously filed as an exhibit to Amendment No. 1 to the Registrant’s Registration Statement on Form S-3/A (Registration No. 333-161416), which was initially filed with the SEC on August 18, 2009, as amended, and incorporated herein by reference. |
| (13) | Previously filed as an exhibit to the Registrant’s Current Report on Form 8-K, which was filed with the SEC on June 8, 2010, and incorporated herein by reference. |
| (14) | Previously filed as an exhibit to the Registrant’s Current Report on Form 8-K, which was filed with the SEC on June 14, 2010, and incorporated herein by reference. |
| * | Filed herewith. |
| † | Management contract or compensatory plan or arrangement. |