Attached files
Table of Contents
UNITED STATES
SECURITIES AND EXCHANGE COMMISSION
Washington, D.C. 20549
FORM 10-K
(Mark One):
| x | ANNUAL REPORT PURSUANT TO SECTION 13 OR 15(d) OF THE SECURITIES EXCHANGE ACT OF 1934 |
For the fiscal year ended December 28, 2010
OR
| ¨ | TRANSITION REPORT UNDER SECTION 13 OR 15(d) OF THE SECURITIES EXCHANGE ACT OF 1934 |
For the transition period from to
Commission File Number 001-33515
EINSTEIN NOAH RESTAURANT GROUP, INC.
(Exact Name of Registrant as Specified in its Charter)
| Delaware | 13-3690261 | |
| (State or other jurisdiction of incorporation or organization) |
(I.R.S. Employer Identification No.) | |
| 555 Zang Street, Suite 300, Lakewood, Colorado | 80228 | |
| (Address of principal executive offices) | (Zip Code) |
Registrant’s telephone number, including area code: (303) 568-8000
Securities registered pursuant to Section 12(b) of the Act:
| Title of each class: |
Name of each exchange on which registered: | |
| Common Stock, $.001 par value |
The NASDAQ Global Market | |
|
Securities registered pursuant to Section 12(g) of the Act: |
None |
Indicate by check mark if the registrant is a well-known seasoned issuer, as defined in Rule 405 of the Securities Act. Yes ¨ No x
Indicate by check mark if the registrant is not required to file reports pursuant to Section 13 or Section 15(d) of the Act. Yes ¨ No x
Indicate by check mark whether the registrant: (1) has filed all reports required to be filed by Section 13 or 15(d) of the Securities Exchange Act of 1934 during the preceding 12 months (or for such shorter period that the registrant was required to file such reports), and (2) has been subject to such filing requirements for the past 90 days. Yes x No ¨
Indicate by check mark whether the registrant has submitted electronically and posted on its corporate Web site, if any, every Interactive Data File required to be submitted and posted pursuant to Rule 405 of Regulation S-T (§232.405 of this chapter) during the preceding 12 months (or for such shorter period that the registrant was required to submit and post such files). Yes ¨ No ¨
Indicate by check mark if disclosure of delinquent filers pursuant to Item 405 of Regulation S-K is not contained herein, and will not be contained, to the best of the registrant’s knowledge, in definitive proxy or information statements incorporated by reference in Part III of this Form 10-K or any amendments of this Form 10-K. x
Indicate by check mark whether the registrant is large accelerated filer, an accelerated filer, a non-accelerated filer, or a smaller reporting company. See the definitions of “large accelerated filer,” “accelerated filer” and “smaller reporting company” in Rule 12b-2 of the Exchange Act.
| Large accelerated filer | ¨ | Accelerated filer | ¨ | |||||
| Non-accelerated filer | x (Do not check if a smaller reporting company) | Smaller reporting company | ¨ |
Indicate by check mark whether the registrant is a shell company (as defined in Rule 12b-2 of the Exchange Act). Yes ¨ No x
The aggregate market value of the voting common equity held by non-affiliates of the registrant as of the last business day of the second fiscal quarter, June 29, 2010 was $62,454,390 (computed by reference to the closing sale price as reported on the NASDAQ Global Market). As of March 11, 2011 there were 16,687,215 shares of the registrant’s Common Stock, par value of $0.001 per share outstanding.
DOCUMENTS INCORPORATED BY REFERENCE
The information required by Part III is incorporated herein by reference from the registrant’s definitive proxy statement for the 2011 annual meeting of stockholders, which will be filed with the SEC within 120 days after the close of the 2010 fiscal year.
Table of Contents
EINSTEIN NOAH RESTAURANT GROUP, INC.
FORM 10-K
TABLE OF CONTENTS
| PART I | ||||||
| ITEM 1. | 2 | |||||
| ITEM 1A. | 9 | |||||
| ITEM 1B. | 17 | |||||
| ITEM 2. | 18 | |||||
| ITEM 3. | 19 | |||||
| ITEM 4. | 19 | |||||
| PART II | ||||||
| ITEM 5. | 20 | |||||
| ITEM 6. | 22 | |||||
| ITEM 7. | MANAGEMENT’S DISCUSSION AND ANALYSIS OF FINANCIAL CONDITION AND RESULTS OF OPERATIONS |
24 | ||||
| ITEM 7A. | 47 | |||||
| ITEM 8. | 48 | |||||
| ITEM 9. | CHANGES IN AND DISAGREEMENTS WITH ACCOUNTANTS ON ACCOUNTING AND FINANCIAL DISCLOSURE |
100 | ||||
| ITEM 9A. | 100 | |||||
| ITEM 9B. | 101 | |||||
| PART III | ||||||
| ITEM 10. | 102 | |||||
| ITEM 11. | 102 | |||||
| ITEM 12. | SECURITY OWNERSHIP OF CERTAIN BENEFICIAL OWNERS AND MANAGEMENT AND RELATED STOCKHOLDER MATTERS |
102 | ||||
| ITEM 13. | CERTAIN RELATIONSHIPS AND RELATED TRANSACTIONS, AND DIRECTOR INDEPENDENCE |
102 | ||||
| ITEM 14. | 102 | |||||
| PART IV | ||||||
| ITEM 15. | 103 | |||||
1
Table of Contents
EXPLANATORY NOTE
On February 22, 2011, Company management determined, after discussion with the Audit Committee of our Board of Directors, that previously issued financial statements for the fiscal years 2008 and 2009, each of the four quarters of fiscal 2008 and fiscal 2009 and selected financial data for the fiscal years 2006, 2007, 2008 and 2009 should be restated in order to revise our accounting for the provision for income taxes. These matters are described in more detail in Note 3 and Note 20 to our consolidated financial statements included in Item 8 of this Annual Report. The restated consolidated balance sheet as of December 29, 2009 and the related restated consolidated statements of operations, stockholders’ equity and cash flows for the years ended December 29, 2009 and December 30, 2008 are included in this Annual Report. The selected financial data for those fiscal years, as well as fiscal years 2006 and 2007 in this Annual Report, have also been restated because of these matters. The accompanying Management’s Discussion and Analysis of Financial Condition and Results of Operations section gives effect to these restatements and a detailed discussion follows.
We have not amended our reports previously filed under the Securities Exchange Act of 1934, and therefore the financial statements and related financial information contained in those reports should no longer be relied upon and are superseded by the financial statements and financial information in this Annual Report on Form 10-K.
PART I
| ITEM 1. | BUSINESS |
General development of our Company:
Einstein Noah Restaurant Group, Inc. (the “Company” or “we”) operates primarily under the Einstein Bros. Bagels (“Einstein Bros.”), Noah’s New York Bagels (“Noah’s”) and Manhattan Bagel Company (“Manhattan Bagel”) brands. We commenced operations as an operator and franchisor of coffee cafes in 1993. Substantial growth in our restaurant counts occurred through a series of acquisitions. Our largest acquisition was in 2001 when we acquired substantially all the assets of Einstein/Noah Bagel Corp. Since then, we have grown organically by opening company-owned restaurants, working with franchisees on development agreements, and promoting the licensing of our brand.
Financial information about segments:
We operate three business segments plus a corporate support unit:
| • | The company-owned restaurants segment includes our Einstein Bros. and Noah’s brands, which have similar investment criteria and economic and operating characteristics. |
| • | The franchise and license segment earns royalties and other fees from the use of trademarks and operating systems developed for the Einstein Bros., Noah’s and Manhattan Bagel brands. |
| • | The manufacturing and commissary segment produces and distributes bagel dough and other products to our company-owned restaurants, licensees and franchisees and other third parties. |
| • | The corporate support unit consists of overhead and other activities related to the three key business segments, as well as interest on our debt and depreciation on our assets. |
See Note 19 to the consolidated financial statements included in Item 8 of this 10-K for the financial results by segment for fiscal years 2008 (as restated), 2009 (as restated) and 2010.
Narrative description of business:
We are the largest owner/operator, franchisor and licensor of bagel specialty restaurants in the United States. As of December 28, 2010, we had 733 restaurants in 39 states and in the District of Columbia. As a
2
Table of Contents
leading fast-casual restaurant chain, our restaurants specialize in high-quality foods for breakfast, lunch and afternoon snacks in a bakery-café atmosphere with a neighborhood emphasis. Collectively, our concepts span the nation with Einstein Bros. restaurants in 38 states and in the District of Columbia, Noah’s restaurants in three states on the west coast and Manhattan Bagel restaurants concentrated in eight states in the Northeast. Currently, our Einstein Bros. and Noah’s restaurants are predominantly company-owned or licensed, while Manhattan Bagel restaurants are franchised except for one company-owned location.
Our product offerings include fresh-baked bagels and other bakery items baked on-site, made-to-order breakfast and lunch sandwiches on a variety of bagels, breads or wraps, gourmet soups and salads, assorted pastries, premium coffees and an assortment of snacks. Our manufacturing and commissary operations prepare and assemble consistent, high-quality ingredients that are delivered fresh to our restaurants through our network of independent distributors. We seek to create an inviting atmosphere which enables us to attract a diverse guest base of women and men, approximately 64% women and 36% men and in the middle to upper-middle income brackets within our breakfast traffic.
We believe controlling the development, sourcing, manufacturing and distribution of our key products is an important element in ensuring both quality and profitability. To support this strategy, we have developed proprietary recipes, invested in processing technology and manufacturing capacity, and aligned ourselves with strategic suppliers.
Franchising and licensing our brands allows us to increase our geographic footprint and brand recognition. This allows us to generate additional revenues without incurring significant additional expense, capital commitments and avoid many of the other risks associated with opening new company-owned restaurants.
As of December 28, 2010, the Company had 6,796 associates, of whom 211 were corporate personnel, 145 were manufacturing and commissary personnel and 6,440 were restaurant personnel. Most restaurant personnel work part-time and are paid on an hourly basis. We have never experienced a work stoppage and our associates are not represented by a labor organization.
Company-owned restaurants
We generated approximately 91% of our 2010 total revenue from restaurant sales at our Einstein Bros. and Noah’s company-owned restaurants. For the year ended December 28, 2010, approximately 66% of our revenues were generated from restaurant sales during the breakfast hours.
| • | Principal products and services sold: Einstein Bros. offers a menu that specializes in high-quality foods for breakfast and lunch, including fresh-baked bagels and hot breakfast sandwiches, freshly prepared lunch sandwiches, cream cheese and other spreads, specialty coffees and teas, soups, salads and other unique menu offerings. During fiscal years 2008, 2009 and 2010, Einstein Bros. company-owned restaurants generated approximately 80% of our total company-owned restaurant sales. |
Noah’s is a neighborhood-based, New York City inspired bakery/deli restaurant that serves fresh-baked bagels, hot breakfast sandwiches, made-to-order deli-style sandwiches, cream cheese and other spreads, specialty coffees and teas, soups, salads and other unique menu offerings. During fiscal years 2008, 2009 and 2010, Noah’s company-owned restaurants generated approximately 20% of our total company-owned restaurant sales.
Manhattan Bagel provides a traditional New York City style boil and baked bagel. Manhattan Bagel also serves a variety of grilled sandwiches, freshly made deli sandwiches, freshly prepared breakfast sandwiches, soups, and a variety of other fresh-baked sweets. Similar to Einstein Bros. and Noah’s, Manhattan Bagel also features a full line of fresh brewed coffees and specialty coffee/espresso beverages. In late 2007, we acquired a location from one of our franchisees, which made it our only company-owned Manhattan Bagel restaurant. We use this location for employee and manager training, and to test out new products and services before they are rolled out system-wide.
3
Table of Contents
| • | Status of products/services: We are planning to open new company-owned restaurants under the Einstein Bros. brand within existing markets. Our expansion plans are intended to increase penetration of our restaurants in our most attractive markets. In 2010, we opened six new company-owned restaurants. In 2011, we plan to open 10 to 14 new company-owned restaurants and relocate 10 to 14 of our existing restaurants. We define a relocation as moving a restaurant within its current trade area. |
Throughout most of our Einstein Bros. restaurants, we have implemented an improved kitchen display ordering system (“KDS”) that reduces the time our guests wait in line before they receive their food. We believe that this system improves production accuracy compared to the paper tickets process and helps to reduce waste. In 2010, we continued to roll out KDS across our system and it is now in 82% of our company-owned restaurants.
We believe catering is an effective way to generate incremental sales, drive trial and expose more people to our food and our brands. We recognize that an effective catering program requires different skills for effectively selling to businesses that frequently utilize catering. In 2009, we implemented a new software program and on-line ordering capabilities which helped us to establish a new process to generate, fulfill and deliver catering sales. This change has reduced the cost of our catering program considerably in 2010 while at the same time providing a more robust method of attracting new customers and increasing the order frequency of existing customers. Catering accounted for approximately 6% of our company-owned restaurant sales in 2010.
| • | Product Supply: Our purchasing programs provide our company-owned restaurants and our franchised and licensed restaurants with high quality ingredients at competitive prices from reliable sources. Consistent product specifications, as well as purchasing guidelines, help to ensure freshness and quality. Because we utilize fresh ingredients in most of our menu offerings, inventory at our distributors and company-owned restaurants is maintained at modest levels. We negotiate price agreements and contracts depending on supply and demand for our products and commodity trends. These agreements can range in duration from six months to five years. |
| • | Trademarks and service marks: Our rights in our trademarks and service marks are a significant part of all segments of our business. We are the owners of the federal registration rights to the “Einstein Bros.”, “Noah’s New York Bagels” and “Manhattan Bagel” marks, as well as several related word marks and word and design marks related to our core brands. We license the rights to use certain trademarks we own or license to our franchisees and licensees in connection with their operations. Many of our core brand trademarks are also registered in numerous foreign countries. We are party to a co-existence agreement with the Hebrew University of Jerusalem (“HUJ”), which sets forth the terms under which we can use the name Einstein Bros. and the terms and restrictions under which HUJ could license the name and likenesses associated with the Estate of Albert Einstein to a business that competes with the Company. We also own numerous other trademarks and service marks related to our other brands. We are aware of a number of companies that use various combinations of words in our marks, some of which may have senior rights to ours for such use, but we do not consider any of these uses, either individually or in the aggregate, to materially impair the use of our marks. It is our policy to defend our marks and their associated goodwill against encroachment by others. |
| • | Seasonality: Our business is subject to seasonal fluctuations. Because of the seasonality of the business and the industry, results for any quarter are not necessarily indicative of the results that may be achieved for any other quarter or the full fiscal year. |
| • | Government Regulation: Each of our restaurants is subject to licensing and regulation by a number of governmental authorities, which include health, safety, labor, sanitation, building and fire agencies in the state, county, or municipality in which the restaurant is located. A failure to comply with one or more regulations could result in the imposition of sanctions, including the closing of restaurants for an indeterminate period of time, fines or third party litigation. |
4
Table of Contents
| • | Competition: The restaurant industry is intensely competitive. The industry is often affected by changes in demographics, consumers’ eating habits and preferences, local and national economic conditions affecting consumer spending habits, population trends, and local traffic patterns. |
We experience competition from numerous sources in our trade areas. Our restaurants compete based on guests’ needs for breakfast, lunch and afternoon snacks. Our competitors are different for each daypart. The competitive factors include brand awareness, advertising effectiveness, location and attractiveness of facilities, hospitality, environment, quality and speed of guest service and the price/value of products offered. We compete in the fast-casual segment of the restaurant industry, but we also consider other restaurants in the fast-food, specialty food and full-service segments to be our competitors.
Manufacturing and Commissaries:
We generated approximately 7% of our 2010 total revenue from our manufacturing and commissary operations.
| • | Manufacturing: We currently operate a bagel dough manufacturing facility in Whittier, California and have a supply contract with two suppliers to produce bagel dough and sweets to our specifications. These facilities provide frozen dough and partially-baked frozen bagels and fully baked sweets for our company-owned restaurants, franchisees and licensees. We use excess capacity to produce bagels for sale to third party resellers. We also sell frozen dough in the U.S. to a third party foreign entity who sells that product under our Einstein Bros. brand in Asia. |
| • | Commissaries: Currently we operate five commissaries geographically located to best serve our existing company-owned, franchised and licensed restaurants. These operations primarily provide our restaurants with critical food products such as sliced meats, cheeses, and pre-portioned kits that create our various salads. Our commissaries assure consistent quality, supply fresh products and improve efficiencies by reducing labor and inventory requirements at the restaurants. We distribute commissary products primarily through our regional distribution partners. |
| • | Product supply: We have developed or use proprietary recipes and production processes for our bagel dough, cream cheese and coffee to help ensure product consistency. We believe this system provides a variety of consistent, superior quality products at competitive market prices to our company-owned, franchised and licensed restaurants. |
Frozen, or partially baked and frozen, bagel dough is shipped to all of our company-owned, franchised and licensed restaurants and baked on-site. Our significant know-how and technical expertise for manufacturing and freezing mass quantities of raw dough produces a high-quality product more commonly associated with smaller bakeries.
Our cream cheese is manufactured to our specifications utilizing proprietary recipes. Our cream cheese and certain other cheese products are purchased from one supplier under a contract that has been extended through the end of 2013. We also have developed proprietary coffee blends for sale at our company-owned, franchised and licensed restaurants.
We purchase other ingredients used in our restaurants, such as meat, lettuce, tomatoes and condiments, from a select group of third party suppliers. Our chicken products come from naturally cage-free raised chickens that are cared for in strict accordance with established animal care guidelines and without the use of growth accelerators such as steroids or hormones. Our roast beef is United States Department of Agriculture (“USDA”) Choice, Grade A, and comes only from corn-fed, domestic cattle. Where available, we buy high quality fruits, vegetables and specialty produce from a nationally recognized group of third party suppliers and distributors.
| • | Government regulation: Our manufacturing and commissary facilities are licensed and subject to regulation by either federal, state or local health and fire codes. We are subject to the regulations of keeping our commissaries USDA compliant. Additionally, we are also subject to federal and state environmental regulations. |
5
Table of Contents
| • | Competition: Our manufacturing and commissary operations are primarily ancillary and support our company-owned restaurant operations as well as our franchisees and licensees. Our competition is from several large bakeries and from local bakeries in the states in which we operate. |
Franchise and Licensing
Approximately 2% of our 2010 total revenue was generated by our franchise and license operations.
| • | Einstein Bros. franchising: We offer Einstein Bros. franchises to qualified area developers. As of December 28, 2010, we were registered to offer Einstein Bros. franchises in 49 states and the District of Columbia. During 2010, we continued to actively market the Einstein Bros. brand franchise rights to sign multi-location deals. As of December 28, 2010, we have 20 development agreements in place for 104 total restaurants, 19 of which have already opened. Based upon the development agreements, we expect the remaining 85 new restaurants will open on various dates through 2017. |
We utilize a franchise area development model for the Einstein Bros. brand in which we assign franchise rights to develop restaurants within a defined geographic region within a specified period of time. We are targeting potential franchisees who have the existing infrastructure, operational experience and financial strength to develop several restaurants in a designated market. The franchise agreement requires an up-front fee of $35,000 per restaurant and a 5% royalty based on net sales. Our Einstein Bros. franchise restaurants that have been open for one year generally have average unit volumes of approximately $988,000.
| • | Manhattan Bagel franchising: We currently have a franchise base in our Manhattan Bagel brand that generates a recurring revenue stream through royalty fee payments and revenue from the sale to our franchisees of products made from our proprietary recipes. The typical Manhattan Bagel franchise agreement requires an up-front fee of $25,000 per restaurant and a 5% royalty based on net sales. Our Manhattan Bagel franchise base provides us with the ability to grow this brand with minimal commitment of capital by us, and creates a built-in customer base for our manufacturing operations. Our Manhattan Bagel franchise restaurants that have been open for one year generally have average unit volumes of approximately $551,000. |
| • | Licensing: We have license relationships that include Aramark, Sodexho, AAFES, HMS Host, Compass, and SSP. Our licensees are located primarily in colleges and universities, hospitals, airports and military bases. Our license agreements vary by venue, but typically have a five-year term and provide that the licensee pays us an up-front license fee of $12,500 and a weighted average royalty fee of 6.2%. Our license restaurants generally have average unit volumes of approximately $489,000, reflecting the predominance of college campus locations with a profitable but condensed selling season. |
| • | Status of development plans or expansion: We are planning to expand our presence through a significant expansion of franchise and license restaurants. We are continuously signing new franchise development agreements and there could be the potential to sell existing company-owned restaurants to prospective franchisees. This strategy allows us to generate additional revenues without incurring significant additional expense, capital commitments or many of the other risks associated with opening new company-owned restaurants. In 2010 we opened 14 franchised locations and 35 licensed locations and sold one company-owned restaurant to a franchisee. We are currently planning to open 20 to 26 franchise restaurants and 45 to 50 license restaurants in 2011. In support of our strategy to only license the Einstein Bros. brand, we recently converted our final Noah’s licensed restaurant to the Einstein Bros. brand in 2010. |
| • | Product supply: Our franchisees and licensees are required to purchase proprietary products through our designated suppliers or directly from us. Our Manhattan Bagel franchisees are not required to buy all of their non-proprietary products directly from us, but rather their product sources must be approved by us. |
6
Table of Contents
| • | Seasonality: This segment is subject to the same seasonal fluctuations as our company-owned restaurant segment. Additionally, as many of our license locations are on college and university campuses, they are impacted by school schedules which typically include a summer break and the December holiday season. Because of the seasonality of the business and the industry, results for any quarter are not necessarily indicative of the results that may be achieved for any other quarter or the full fiscal year. |
| • | Government regulation: Our franchise operations are subject to Federal Trade Commission (the “FTC”) regulation and various state laws which regulate the offer and sale of franchises. Several state laws also regulate substantive aspects of the franchisor/franchisee relationship. The FTC requires us to furnish to prospective franchisees a franchise disclosure document containing prescribed information. A number of states in which we might consider franchising also regulate the sale of franchises and require registration of the disclosure document with state authorities. Our ability to sell franchises in those states is dependent upon obtaining approval of our disclosure document by those authorities. |
| • | Competition: We compete against similar fast-casual and quick-casual restaurants which franchise and license their brands in the states in which we operate. |
Corporate Support
| • | Principal products/services sold: The support center is not a profit center and is designed to manage and support all of our company-owned restaurants, the manufacturing facility and commissaries and support our franchisees and licensees as well as general corporate governance. |
Financial information about geographic areas:
Our manufacturing operations sell bagels to a wholesaler and a distributor who take possession in the United States and sell outside of the United States. As the product is shipped FOB domestic dock, and invoiced and paid in U.S. dollars, there are no international risks of loss or foreign exchange currency issues. Sales shipped internationally are included in manufacturing and commissary revenue, and were approximately $4.8 million, $5.3 million and $5.3 million for 2008, 2009 and 2010, respectively. All other revenues were from external customers domiciled in the United States of America.
Available Information:
We are subject to the informational requirements of the Securities Exchange Act of 1934, as amended. We therefore file periodic reports, proxy statements and other information with the Securities Exchange Commission (the “SEC”). Such reports may be obtained by visiting the Public Reference Room of the SEC at 100 F Street, N.E., Washington, D.C. 20549, or by calling the SEC at 1-800-SEC-0330. In addition, the SEC maintains an internet site (www.sec.gov) that contains reports, proxy and information statements and other information regarding issuers that file electronically.
Additionally, copies of our reports on Forms 10-K, 10-Q and 8-K and any amendments to such reports are available for viewing and copying through our internet site (www.einsteinnoah.com), free of charge, as soon as reasonably practicable after filing such material with, or furnishing it to the SEC. We typically post information about the Company on our website under the Financials & Media tab.
We also make available on our website and in print to any stockholder who requests it, the Charters for our Audit and Compensation Committees, as well as the Code of Conduct that applies to all directors, officers, and associates of our company. Amendments to these documents or waivers related to the Code of Conduct will be made available on our website as soon as reasonably practicable after their execution.
7
Table of Contents
Executive Officers:
| Name |
Age | Position | ||||
| Jeffery J. O’Neill |
54 | President, Chief Executive Officer and Director | ||||
| Daniel J. Dominguez |
65 | Chief Operating Officer | ||||
| Emanuel P.N. Hilario |
43 | Chief Financial Officer | ||||
| James P. O’Reilly |
44 | Chief Concept Officer | ||||
| Rhonda J. Parish |
54 | Chief Legal Officer and Secretary | ||||
Jeffrey J. O’Neill. Mr. O’Neill joined us in December 2008 when he was appointed President and Chief Executive Officer. Previously, Mr. O’Neill worked for Priszm Income Fund from April 2005 to November 2008. Priszm is a publicly traded Canadian restaurant income trust with a portfolio of popular brands such as Pizza Hut and Taco Bell and is one of the largest independent KFC franchisees in the world. Mr. O’Neill joined Priszm as President and Chief Operating Officer and was promoted to Chief Executive Officer in January 2008. Mr. O’Neill began his career in Brand Marketing with The Quaker Oats Company. In April 1999, he joined PepsiCo as the President of Pepsi Cola Canada. In 2002, PepsiCo acquired the Quaker Oats Company and in January 2003, Mr. O’Neill returned to his old company in Chicago to help lead the integration of the Quaker Oats/Gatorade acquisition. Mr. O’Neill has an Honors Bachelor of Business degree from the University of Ottawa.
Daniel J. Dominguez. Mr. Dominguez was appointed Chief Operating Officer in December 2005. Mr. Dominguez joined us in November 1995 and served as Senior Vice President of Operations for Noah’s New York Bagels from April 1998 to December 2005. From 1995 to April 1998, Mr. Dominguez served as the Director of Operations for Einstein Bros. for the Midwest. Prior to joining us, Mr. Dominguez was Executive Vice President of JB Patt America, Beverly Hills, CA, dba Koo Koo Roo Restaurants, from July 1994 to October 1995. From May 1987 to July 1994, he was the Divisional Vice President of Food Services for Carter Hawley Hale in San Francisco, California. From November 1976 to May 1987 he was the Vice President of Operations for Bakers Square Restaurants in California.
Emanuel P.N. Hilario. Mr. Hilario joined us in May 2010 as Chief Financial Officer. Previously, Mr. Hilario served as the Founder and Managing Director of Koios Path, LLC, a management advisory and consulting services company from May 2009 until May 2010. Prior to that, he served as Chief Financial Officer of McCormick & Schmick’s Seafood Restaurants, Inc. from April 2004 until May 2009 and was elected to their Board of Directors in May 2007 where he served as a Director until July 2009. From April 2000 to April 2004, Mr. Hilario served as Vice President and Chief Financial Officer of Angelo and Maxie’s, Inc., which was formerly known as Chart House Enterprises, Inc. Mr. Hilario began his career at McDonald’s Corporation. Mr. Hilario holds a B.S. degree in Commerce and Accounting from Santa Clara University.
James P. O’Reilly. Mr. O’Reilly joined us in April 2009 as our Chief Concept Officer after consulting with us from January 2009 to March 2009. Previously, Mr. O’Reilly worked at Yum! Brands, Inc. from November 1996 until January 2009. He joined Yum! as a Director of Marketing, worked internationally in Canada, Latin America and the United Kingdom before returning to the United States in June 2008 as Vice President, U.S. Marketing and becoming Chief Marketing Officer of KFC U.S. Mr. O’Reilly received a B.S. degree from McMaster University and holds an MBA from York University.
Rhonda J. Parish. Ms. Parish joined us in January 2010 as Chief Legal Officer. Before joining us, she took a personal sabbatical from August 2008 to December 2009. Ms. Parish worked for Denny’s Corporation from January 1995 to July 2008. She joined Denny’s Corporation as Senior Vice President and General Counsel and was promoted to Executive Vice President/Chief Legal Officer and Secretary of Denny’s Corporation in July 1998. Ms. Parish received a B.S. degree in Political Science from the University of Central Arkansas and her J.D. degree from the University of Arkansas School of Law.
8
Table of Contents
| ITEM 1A. | RISK FACTORS |
Cautionary Note Regarding Forward-Looking Statements:
We wish to caution our readers that this report, including the Management’s Discussion and Analysis of Financial Conditions and Results of Operations (“MD&A”), contains forward-looking statements within the meaning of the federal securities laws. All such statements are qualified by this cautionary note, which is provided pursuant to the safe harbor provisions of Section 27A of the Securities Act of 1933, as amended (“1933 Act”). The following important factors, among others, could cause the actual results to differ materially from those indicated by forward-looking statements made in this report and from time to time in news releases, reports, proxy statements, registration statements and other written communications, as well as verbal forward-looking statements made from time to time by representatives of the Company. Such forward-looking statements involve risks and uncertainties that may cause our actual results, performance or achievements to be materially different from any future performance or achievements expressed or implied by these forward-looking statements. Our financial condition and results of operations are sensitive to, and may be adversely affected by, a number of factors, many of which are largely outside the Company’s control. Factors that might cause actual events or results to differ materially from those indicated by these forward-looking statements may include matters such as future economic performance, restaurant openings or closings, operating margins, the availability of acceptable real estate locations, the sufficiency of our cash balances and cash generated from operating and financing activities for our future liquidity and capital resource needs, the impact on our business as a result of the Dodd-Frank Wall Street Reform and Consumer Protection Act of 2010 (“Dodd-Frank Act”) and the rules promulgated thereunder, and other matters, and are generally accompanied by words such as: believes, anticipates, plans, intends, estimates, predicts, targets, expects, contemplates and similar expressions that convey the uncertainty of future events or outcomes. We do not undertake any obligation to update or revise any forward-looking statements to reflect events or circumstances after the date of this report or to reflect the occurrence of unanticipated events, except as may be required under applicable law. An expanded discussion of some of these risk factors follows. The list of risk factors below is not exhaustive.
Risk Factors Relating to Our Business and Our Industry
General economic conditions, including continuing effects from the recent recession, have affected, and could continue to affect, discretionary consumer spending, particularly spending for meals prepared away from home.
We, together with the rest of the restaurant industry, depend upon consumer discretionary spending. The recent recession, coupled with lay-offs, high unemployment rates, and other economic impacts has affected consumers’ ability and willingness to spend discretionary dollars. In recent years, restaurants industry-wide have been adversely affected as a result of reduced consumer spending due to these and other factors. If the weak economy continues for a prolonged period of time or worsens, it could further reduce discretionary consumer spending which in turn could reduce our guest traffic or average check. Adverse changes in consumer discretionary spending, which could be affected by many different factors that are out of our control, including international, national and local economic conditions, could harm our business prospects, financial condition, operating results and cash flows. Our success will depend in part upon our ability to anticipate, identify and respond to changing economic and other conditions.
Failure to protect food supplies and adhere to food safety standards could result in food-borne illnesses and adversely affect our business.
We believe that food safety and reputation for quality is a significant risk to any company that, like us, operates in the restaurant industry. Food safety is a focus of increased government regulatory initiatives at the local, state and federal levels.
Failure to protect our food supply or enforce food safety policies, such as proper food temperatures and adherence to shelf life dates, could result in food-borne illnesses and/or injuries to our guests. Also, our reputation of providing high quality food is an important factor in choosing our restaurants. Instances of food borne illness, or other food safety issues, including food tampering and food contamination, whether or not
9
Table of Contents
traced to our restaurants, could reduce demand for our menu offerings. If any of our guests become ill from consuming our products, the affected restaurants may be forced to close and we may be subject to legal liability. An instance of food contamination originating from one of our restaurants, our commissaries or suppliers, or our manufacturing plant could have far-reaching effects, as the contamination, or the perception of contamination could affect substantially all of our restaurants. Publicity related to either product contamination or recalls may also injure our brand and may affect the selection of our restaurants by guests, franchisees and licensees based on fear of such illnesses. In addition, the occurrence of food-borne illnesses or food safety issues could also adversely affect the price and availability of affected ingredients, which could result in disruptions in our supply chain and/or lower margins for us and our franchisees and licensees.
Increases in commodity prices would adversely affect our results of operations.
Global demand for commodities such as wheat, coffee and dairy products has resulted, and could in the future result, in higher prices which would increase our costs. The prices of our main ingredients are directly associated with the changing weather conditions as well as economic factors such as supply and demand of certain commodities within the United States and other countries. Our ability to forecast and manage our commodities could significantly affect our gross margins. Any increase in the prices of the ingredients most critical to our products could adversely affect our operating results.
Additionally, in the event of destruction of products such as tomatoes, peppers or massive culling of specific animals such as chickens or turkeys to prevent the spread of disease, the supply and availability of ingredients may become limited. This could dramatically increase the price of certain menu items which could decrease sales of those items or could force us to eliminate those items from our menus entirely. All of these factors could adversely affect our business, reputation and financial results.
Any material failure, inadequacy, interruption or security failure of information technology could harm our ability to effectively operate our business.
We rely on information technology systems across our operations, including for management of supply chain, point-of-sale processing in our restaurants, and various other processes and transactions. Our ability to effectively manage our business and coordinate the production, distribution and sale of products depends on the reliability and capacity of these systems. The failure of these systems to operate effectively, problems with transitioning to upgraded or replacement systems, or a breach in security of these systems could cause delays in product sales and reduced efficiency of the Company’s operations, and significant capital investments could be required to remediate the problem.
Credit and debit card data loss, litigation and/or liability could significantly harm our reputation and adversely impact our business.
In connection with credit and debit card sales, we transmit confidential credit and debit card information securely over public networks. Third parties may have the technology or know-how to breach the security of this customer information, and our security measures may not effectively prohibit others from obtaining improper access to this information. If a person is able to circumvent our security measures, he or she could destroy or steal valuable information or disrupt our operations. Any security breach could expose us to risks of data loss, litigation and liability and could seriously disrupt our operations and any resulting negative publicity could significantly harm our reputation.
Unsuccessful implementation of any or all of the initiatives of our business strategy could negatively impact our operations.
Our success depends in part on our ability to understand and satisfy the needs of our guests, franchisees and licensees. Our key strategies are:
| • | drive comparable store sales growth; |
| • | enhance corporate margins; and |
| • | accelerate unit growth. |
10
Table of Contents
Our ability to achieve any or all of these initiatives is uncertain. Our success in expanding sales at company-owned restaurants through various sub-initiatives including: promoting and offering value to our customers through marketing, discounts, coupons and new menu offerings and broadening our offerings across multiple dayparts, improving our ordering and production systems, expanding our catering program and upgrading our restaurants is dependent in part on our ability to offer value to consumers, attract new customers, predict and satisfy consumer preferences and as mentioned above, consumers’ ability to respond positively in a challenging economic environment. Our success in growing our business through opening new company-owned restaurants is dependent on a number of factors, including our ability to: find suitable locations, reach acceptable lease terms, have adequate capital, find acceptable contractors, obtain licenses and permits, recruit and train appropriate staff and properly manage the new restaurant. Our success in opening new franchise and license restaurants is dependent upon, among other factors, our ability to: attract quality businesses with the interest and desire to invest/purchase in our core brands, maintain the effectiveness of our franchise disclosure documents in target states, offer restaurant solutions for a variety of location types and the ability of our franchisees and licensees to: find suitable locations, reach acceptable lease terms, have adequate capital, secure reasonable financing, find available contractors, obtain licenses and permits, locate and train staff appropriately and properly manage the new restaurants. Our success in expanding our franchise business is dependent upon signing additional development agreements along with the refranchising our company-owned restaurants. If we are not successful in implementing any or all of the initiatives of our business strategy, it could have a material adverse effect on our business, results of operations, and financial condition.
Competition in the restaurant industry is intense.
Our industry is highly competitive and there are many well-established competitors. While we operate in the fast-casual segment of the restaurant industry, we also consider restaurants in the fast-food and full-service segments as competitors. Several fast-casual and fast-food chains are focusing more on breakfast offerings and expanding their coffee offerings. This could further increase competition in the breakfast daypart. In addition to current competitors, one or more new major competitors with substantially greater financial, marketing and operating resources could enter the market at any time and compete directly against us. Also, in virtually every major metropolitan area in which we operate or expect to enter, local or regional competitors already exist. This may make it more difficult to attract and retain guests and potential franchisees and licensees.
Numerous factors including changes in consumer tastes and preferences often affect restaurants. Shifts in consumer preferences away from our type of cuisine and/or the fast-casual style could have a material effect on our results of operations. Dietary trends, such as the consumption of food low in carbohydrate content have, in the past, and may, in the future, negatively impact our sales. Changes in our guests’ spending habits and preferences could have a material adverse effect on our sales. Our results will depend on our ability to respond to changing consumer preferences and tastes. In addition, recent local and state regulations mandating prominent disclosure of nutritional and calorie information may result in reduced demand for some of our products which could be viewed as containing too much fat or too many calories.
We occupy our company-owned restaurants under long-term non-cancelable leases, and we may be unable to renew leases at the end of their lease periods or obtain new leases on acceptable terms.
We do not own any real property, and all of our company-owned restaurants are located in leased premises. Many of our current leases are non-cancelable and typically have terms ranging from five to ten years with two three- to five-year renewal options. We believe leases that we enter into in the future likely will also be long-term and non-cancelable and have similar renewal options. Most of our leases provide that the landlord may increase the rent over the term of the lease, and require us to pay our proportionate share of the cost of insurance, taxes, maintenance and utilities. If we close a restaurant, we generally remain committed to perform our obligations under the applicable lease, which would include, among other things, payment of the base rent for the balance of the lease term. In some instances, we may be unable to close an underperforming restaurant due to continuous operation clauses in our lease agreements. Our obligation to continue making rental payments in respect of leases for closed or underperforming restaurants could have an adverse effect on our business and results of operations.
11
Table of Contents
If we are unable to renew our restaurant leases, we may be forced to close or relocate a restaurant, which could subject us to construction and other costs and risks, and could have a material adverse effect on our business and results of operations. For example, closing a restaurant, even during the time of relocation, will reduce the sales that the restaurant would have contributed to our revenues. Additionally, the revenue and profit, if any, generated at a relocated restaurant may not equal the revenue and profit generated at the prior location. We also face competition from both restaurants and other retailers for suitable sites for new restaurants.
Our operations may be negatively impacted by seasonality, adverse weather conditions, natural disasters or acts of terror.
Our business is subject to seasonal fluctuations, as well as adverse weather conditions and natural disasters that may at times affect regions in which our company-owned, franchised and licensed restaurants are located, regions that produce raw ingredients for our restaurants, or locations of our distribution network. As a result of the seasonality of our business and our industry, our quarterly and yearly results have varied in the past, and we believe that our quarterly operating results will vary in the future. In addition, if adverse weather conditions or natural disasters such as fires and hurricanes affect our restaurants, we could experience closures, repair and restoration costs, food spoilage, and other significant reopening costs as well as increased food costs and delayed supply shipments, any of which would adversely affect our business. We could also experience shortages or delayed shipments at our restaurants if adverse weather or natural disasters affect our distribution network, which could adversely affect our restaurants and our business as a whole. Additionally, during periods of extreme temperatures (either hot or cold) or precipitation, many individuals choose to stay indoors. This impacts transaction counts in our restaurants and could adversely affect our business and results of operations.
The effects of hurricanes, fires, snowstorms, freezes and other adverse weather conditions are likely to affect supply of and costs for raw ingredients and natural resources, near-term construction costs for our new restaurants as well as sales in our restaurants going forward. If we do not anticipate or react to changing costs of food and other raw materials by adjusting our purchasing practices or menu prices, our operating margins would likely deteriorate.
The impact on our business from terrorism (including cyber-terrorism or efforts to tamper with food supplies) could have an adverse impact on our brand and results of operations.
We have single suppliers and vendors for many of our key products and services and the failure of any of these suppliers or vendors to perform could harm our business.
We currently purchase our raw materials from various suppliers; however, we have only one supplier for many of our key products. We purchase all of our cream cheese from a single source. Also, we purchase a majority of our frozen bagel dough from one supplier, who uses our proprietary processes and on whom we are dependent in the short-term. All of our remaining frozen bagel dough is produced at our dough manufacturing facility in Whittier, California or by a second supplier. Although to date we have not experienced significant difficulties with our suppliers, our reliance on a single supplier for most of our key ingredients subjects us to a number of risks, including possible delays or interruption in supplies, diminished control over quality and a potential lack of adequate raw material capacity. Any disruption in the supply or degradation in the quality of the materials provided by our suppliers could have a material adverse effect on our business, operating results and financial condition. In addition, any such disruptions in supply or degradations in quality could have a long-term detrimental impact on our efforts to maintain a strong brand identity and a loyal consumer base. Additionally, we rely upon a single vendor for various services crucial to our business operations. Any loss or disruption in these services could detrimentally impact our business.
Distribution disruptions or other distribution issues could adversely affect our business and reputation.
We depend on our network of independent regional distributors to distribute frozen bagel dough and other products and materials to our company-owned, franchised and licensed restaurants. Any failure by one or more
12
Table of Contents
of our distributors to perform as anticipated, or any disruption in any of our distribution relationships for any reason, would subject us to a number of risks, including inadequate products delivered to our restaurants, diminished control over quality of products delivered, and increased operating costs to prevent delays in deliveries. Any of these events could harm our relationships with our franchisees or licensees, or diminish the reputation of our menu offerings or our brands in the marketplace. In addition, a negative change in the volume of products ordered from our distributors by our company-owned, franchised and licensed restaurants could increase our distribution costs. These risks could have a material adverse effect on our business, financial condition and results of operations.
Additionally, increased costs and distribution issues related to fuel and utilities could also materially impact our business and results of operations.
Increasing labor costs or labor discord could adversely affect our results of operations and cash flows.
We depend upon an available labor pool of associates, many of whom are hourly employees whose wages may be affected by increases in the federal, state or municipal “living wage” rates. Numerous increases have been made on federal, state and local levels to increase minimum wage levels. Increases in the federal minimum hourly wage rate became effective in mid-2009. Additionally, many states have increased their minimum hourly wage rate above that of the 2009 federal rate with adjustments to many state rates effective in 2011. Increases in the minimum wage may create pressure to increase the pay scale for our associates, which would increase our labor costs and those of our franchisees and licensees.
A shortage in the labor pool or other general inflationary pressures or changes could also increase labor costs. Changes in the labor laws, reclassifications of associates from management to hourly employees, or the potential impact of union organizing efforts could affect our labor cost. An increase in labor costs could have a material adverse effect on our income from operations and decrease our profitability and cash flows if we are unable to recover these increases by raising the prices we charge our guests.
We may not be able to comply with certain debt covenants or generate sufficient cash flow to make payments on our debt or to pay dividends to our stockholders in the future.
Our current credit facility contains certain covenants, which, among others, include certain financial covenants such as limitations on capital expenditures, maintenance of the business, use of proceeds from sales of assets and consolidated leverage and fixed charge coverage ratios as defined in the agreements. We are subject to multiple economic, financial, competitive, legal and other risks that are beyond our control and could harm our future financial results. Any adverse effect on our business or financial results could affect our ability to maintain compliance with our debt covenants, and any failure by us to comply with these covenants could result in an event of default. If we were to default under our covenants and such default were not cured or waived, our indebtedness could become immediately due and payable, which could render us insolvent.
We have $87.7 million in debt as of December 28, 2010. In addition, we may, subject to certain restrictions, incur substantial additional indebtedness in the future. Our debt, among other things, could:
| • | make it difficult for us to satisfy our obligations under our indebtedness; |
| • | limit our ability to obtain additional financing for working capital, capital expenditures, acquisitions and general corporate purposes; |
| • | increase our vulnerability to downturns in our business or the economy generally; |
| • | increase our vulnerability to volatility in interest rates; and |
| • | limit our ability to withstand competitive pressures from our less leveraged competitors. |
Economic, financial, competitive, legislative and other factors beyond our control may affect our ability to generate cash flow from operations to make payments on our indebtedness, to fund necessary working capital or
13
Table of Contents
to pay dividends to our stockholders in the future. A significant reduction in operating cash flow would likely increase the need for alternative sources of liquidity. If we are unable to generate sufficient cash flow to make payments on our debt, we will have to pursue one or more alternatives, such as reducing or delaying capital expenditures, refinancing our debt on terms that are not favorable to us, selling assets or issuing additional equity securities. We may not be able to accomplish any of these alternatives on satisfactory terms, if at all, and even if accomplished, they may not yield sufficient funds to service our debt.
We face the risk of adverse publicity and litigation in connection with our operations.
We are from time to time the subject of complaints or litigation from our consumers alleging illness, injury or other food quality, health or operational concerns. Adverse publicity resulting from these allegations may materially adversely affect us and our brand, regardless of whether the allegations are valid or whether we are liable. In addition, employee claims against us based on, among other things, discrimination, harassment or wrongful termination, or labor code violations may divert financial and management resources that would otherwise be used to benefit our future performance. For example, in 2008 we settled two class actions in California and made payments of $1.9 million during 2009 in connection with such settlements. There is also a risk of litigation from our franchisees and licensees. We have been subject to a variety of these and other claims from time to time and a significant increase in the number of these claims or the number that are successful could materially adversely affect our business, prospects, financial condition, operating results or cash flows.
A regional or global health pandemic could severely affect our business.
A health pandemic is a disease that spreads rapidly and widely by infection and affects many individuals in an area or population at the same time. If a regional or global health pandemic were to occur, depending upon its duration and severity, our business could be severely affected. We have positioned ourselves as a “neighborhood atmosphere” between home and work where people can gather for human connection and high quality food. Customers might avoid public gathering places in the event of a health pandemic, and local, regional or national governments might limit or ban public gatherings to halt or delay the spread of disease. A regional or global pandemic might also adversely impact our business by disrupting or delaying production and delivery of products and materials in our supply chain and causing staff shortages in our restaurants. The impact of a health pandemic might be disproportionately greater on us than on other companies that depend less on the gathering of people in a neighborhood atmosphere.
Approximately 43% of our restaurants are concentrated in five main states and, as a result, we are sensitive to economic and other trends and developments in these states.
As of December 28, 2010, a total of 318, or 43.4%, of all restaurants were located in five states (California, Colorado, Florida, Illinois and Texas). As a result, we are particularly susceptible to adverse trends and economic conditions in these states, including their labor markets. In addition, given our geographic concentration, negative publicity regarding any of our restaurants in these states could have a material adverse effect on our business and operations, as could other regional occurrences such as local labor strikes, energy shortages or increases in energy prices, droughts, earthquakes, fires, or other natural disasters.
Our franchisees and licensees may not help us develop our business as we expect, or could take actions that harm our business.
We rely in part on our franchisees and licensees and the manner in which they operate their restaurants to develop and promote our business. Franchisees and licensees are independent operators and are not our employees. As we offer and grant franchises for our Einstein Bros. and Manhattan Bagel brands, our reliance on our franchisees is expected to increase in proportion to growth of the franchisee base. With respect to franchising our Einstein Bros. brand, we may not be able to identify franchisees that meet our criteria, or to enter into franchise area development agreements with prospective franchisee candidates that we identify. As a result, our franchise program for the Einstein Bros. brand may not grow at the rate we currently expect, or at all.
14
Table of Contents
Although we have developed criteria to evaluate and screen prospective candidates, we are limited in the amount of control we can exercise over our franchisees and licensees, and the quality of franchised and licensed restaurant operations may be diminished by any number of factors beyond our control. Franchisees and licensees may not have the business acumen or financial resources necessary to operate successful restaurants in a manner consistent with our standards and requirements and may not hire and train qualified managers and other restaurant personnel. Poor restaurant operations may affect each restaurant’s sales. Our image and reputation, and the image and reputation of other franchisees and licensees, may suffer materially and system-wide sales could significantly decline if our franchisees do not operate successfully. In addition, franchisees and licensees are subject to business risks similar to those we face such as competition, consumer acceptance, fluctuations in the cost, availability and quality of raw ingredients, increasing labor costs and difficultly obtaining proper financing as a result of the downturn in the credit markets. The failure of franchisees and licensees to meet their development obligations or to operate successfully could have a material adverse effect on us, our reputation, our ability to collect royalties, our brands and our ability to attract prospective candidates.
Our restaurants and products are subject to numerous and changing government regulations. Failure to comply with or substantial changes in government regulations could negatively affect our sales, increase our costs or result in fines or other penalties against us.
Each of our restaurants is subject to licensing and regulation by the health, sanitation, safety, labor, building and fire agencies of the respective states, counties, cities and municipalities in which it is located. A failure to comply with one or more regulations could result in the imposition of sanctions, including the closing of facilities for an indeterminate period of time, or third party litigation, any of which could have a material adverse effect on us and our results of operations.
Recently, many government bodies have begun to legislate or regulate high-fat and high sodium foods and require disclosure of nutritional information as a way of combating concerns about obesity and health. In addition to the phase-out of artificial trans-fats, public interest groups have focused attention on the marketing of high-fat and high-sodium foods to children in a stated effort to combat childhood obesity. Some cities and states have recently adopted or are considering regulations requiring disclosure of nutritional facts, including calorie information, on menus and/or menu boards. Additional cities or states may propose or adopt similar regulations. The cost of complying with these regulations could increase our expenses and the possible negative publicity arising from such legislative initiatives could reduce our future sales.
Our franchising operations are subject to regulation by the Federal Trade Commission. We must also comply with state franchising laws and a wide range of other state and local rules and regulations applicable to our business. In addition, the Dodd-Frank Act and the rules promulgated thereunder may affect us. The failure to comply with or substantial changes in federal, state and local rules and regulations would have an adverse effect on us.
Under various federal, state and local laws, an owner or operator of real estate may be liable for the costs of removal or remediation of certain hazardous or toxic substances on or in such property. Such liability may be imposed without regard to whether the owner or operator knew of, or was responsible for, the presence of such hazardous or toxic substances. Although we are not aware of any environmental conditions that require remediation by us under federal, state or local law at our properties, we have not conducted a comprehensive environmental review of our properties or operations. We may not have identified all of the potential environmental liabilities at our properties, and any such liabilities that are identified in the future may have a material adverse effect on our financial condition.
We may not be able to protect our brands, trademarks, service marks and other proprietary rights.
Our brands, which include our trademarks, service marks and other proprietary rights, are important to our success and our competitive position. Accordingly, we devote substantial resources to the establishment and
15
Table of Contents
protection of our brands. However, the actions we take may be inadequate to prevent imitation of our products and concepts by others, to prevent various challenges to our registrations or applications or denials of applications for the registration of trademarks, service marks and proprietary rights in the U.S. or other countries, or to prevent others from claiming violations of their trademarks and proprietary marks. In addition, others may assert rights in our trademarks, service marks and other proprietary rights.
The loss of key personnel or difficulties recruiting and retaining qualified personnel could adversely affect our business and financial results.
Our success depends substantially on the contributions and abilities of key executives and other employees, and on our ability to recruit and retain high quality employees to work in and manage our restaurants. We must continue to recruit, retain and motivate management and other employees sufficient to maintain our current business and support our projected growth. A loss of key employees or a significant shortage of high quality restaurant employees to maintain our current business and support our projected growth could adversely affect our business and financial results.
Our ability to use net operating loss carryforwards to offset future taxable income for U.S. federal income tax purposes is subject to limitation.
In general, under Section 382 of the Internal Revenue Code, a corporation that undergoes an “ownership change” is subject to limitations on its ability to utilize its pre-change net operating loss (“NOL”) carryforwards to offset future taxable income. A corporation generally undergoes an “ownership change” when the stock ownership percentage (by value) of its “5 percent stockholders” increases by more than 50 percentage points over any three-year testing period.
Due to transactions involving the sale or other transfer of our stock from the date of our last ownership change through the date of the secondary public offering of our common stock, and changes in the value of our stock during that period, any new offerings may result in an additional ownership change for purposes of Section 382 or will significantly increase the likelihood that we will undergo an additional ownership change in the future (which could occur as a result of transactions involving our stock that are outside of our control). In either event, the occurrence of an additional ownership change would limit our ability to utilize a portion of our NOL carryforwards that are not currently subject to limitation, and could further limit our ability to utilize our remaining NOL carryforwards and possibly other tax attributes. Limitations imposed on our ability to use NOL carryforwards and other tax attributes to offset future taxable income could cause us to pay U.S. federal income taxes earlier than we otherwise would if such limitations were not in effect, and could cause such NOL carryforwards and other tax attributes to expire unused, in each case reducing or eliminating the benefit of such NOL carryforwards and other tax attributes to us and adversely affecting our future cash flow. Similar rules and limitations may apply for state income tax purposes as well.
Failure of our internal controls over financial reporting could harm our business and financial results.
Our management is responsible for establishing and maintaining effective internal control over financial reporting. Internal control over financial reporting is a process to provide reasonable assurance regarding the reliability of financial reporting for external purposes in accordance with accounting principles generally accepted in the United States. Because of its inherent limitations, internal control over financial reporting is not intended to provide absolute assurance that we would prevent or detect a misstatement of our financial statements or fraud. Any failure to maintain an effective system of internal control over financial reporting could limit our ability to report our financial results accurately and timely or to detect and prevent fraud. A significant financial reporting failure or material weakness in internal control over financial reporting could cause a loss of investor confidence and decline in the market price of our stock.
16
Table of Contents
Risk Factors Relating to Our Common Stock
We have a majority stockholder and are a “controlled company”.
Greenlight Capital, L.L.C. and its affiliates (“Greenlight”) beneficially own approximately 64% of our common stock as of December 28, 2010. As a result, Greenlight has sufficient voting power, without the vote of any other stockholders, to determine what matters will be submitted for approval by our stockholders to elect all of the members of our board of directors, and to determine whether a change in control of the Company occurs. Greenlight’s interests on matters submitted to stockholders may be different from those of other stockholders. Greenlight has voted its shares to elect our current board of directors, and the chairman of our board of directors was an employee of Greenlight as of December 28, 2010. Subsequent to December 28, 2010, the chairman of our board retired from Greenlight.
We have listed our common stock on the NASDAQ Global Market. NASDAQ rules require us to have an audit committee consisting entirely of independent directors. However, under NASDAQ rules, if a single stockholder holds more than 50% of the voting power of a listed company, that company is considered a “controlled company”, and is exempt from several other corporate governance rules, including the requirement that companies have a majority of independent directors and independent director involvement in the selection of director nominees and in the determination of executive compensation. As a result, our stockholders do not have, and may never have, the protections that these rules are intended to provide. The Company currently has a majority of independent directors on the board of directors and an audit committee and a compensation committee that each consist entirely of independent directors. The Company does not have a nominating committee and all directors participate in the consideration of director nominees.
Future sales of shares of our common stock by our stockholders could cause our stock price to fall.
If a substantial number of shares of our common stock are sold in the public market, the market price of our common stock could fall. The perception among investors that these sales will occur could also produce this effect. Sales of our common stock by our majority stockholder, Greenlight, or a perception that Greenlight will sell their shares could cause a decrease in the market price of our common stock.
| ITEM 1B. | UNRESOLVED STAFF COMMENTS |
None
17
Table of Contents
| ITEM 2. | PROPERTIES |
Our Properties
Our headquarters, manufacturing and commissary facilities and all of our restaurants are located on leased premises. Lease terms are usually five to 10 years, with two or three five-year renewal option periods, for total lease terms that average approximately 10 to 20 years. The average company-owned restaurant is approximately 1,800 to 2,500 square feet in size with approximately 30—40 seats and is generally located in a neighborhood or regional shopping center. As of December 28, 2010, leases for approximately 70 restaurants are set to expire within the next 12 months and most of these leases contain a renewal option, usually with modified pricing terms to reflect current market rents. We estimate closing approximately six to ten company-owned restaurants over the next three years as their leases expire and they cannot be relocated.
Information with respect to our headquarters, production and commissary facilities is presented below:
| Location |
Facility |
Square Feet |
Lease Expiration |
|||||||
| Lakewood, Colorado |
Headquarters, Support Center, Test Kitchen | 44,574 | 5/31/2017 | |||||||
| Whittier, California |
Manufacturing Facility and USDA Approved Commissary | 54,640 | 11/30/2013 | |||||||
| Walnut Creek, California |
Administration Office-Noah’s | 1,672 | 3/31/2013 | |||||||
| Carrolton, Texas |
USDA Approved Commissary | 26,820 | 7/31/2011 | |||||||
| Orlando, Florida |
USDA Approved Commissary | 7,422 | 10/31/2012 | |||||||
| Denver, Colorado |
USDA Approved Commissary | 9,200 | 10/14/2013 | |||||||
| Grove City, Ohio |
USDA Approved Commissary | 20,644 | 8/31/2012 | |||||||
Our Current Restaurants
As of December 28, 2010, we owned and operated, franchised or licensed 733 restaurants. Our current base of company-owned restaurants under our core brands includes 358 Einstein Bros. restaurants, 72 Noah’s restaurants and one Manhattan Bagel restaurant. Also, we franchise 73 Manhattan Bagel restaurants and 19 Einstein Bros. restaurants, and license 210 Einstein Bros. restaurants. In support of our strategy to only license the Einstein Bros. brand, in 2010, we converted our final Noah’s licensed restaurant to the Einstein Bros. brand. In addition, we had one company-owned restaurant which we owned and operated under another brand, which we closed during the first quarter of 2010 and one company-owned restaurant that we sold to a franchisee during the third quarter of 2010. We also closed one company-owned Einstein Bros. location in the second quarter of 2010.
The following table details our restaurant openings and closings for each respective fiscal year:
| 52 weeks ended December 29, 2009 | 52 weeks ended December 28, 2010 | |||||||||||||||||||||||||||||||
| Company Owned |
Franchised* | Licensed* | Total | Company Owned |
Franchised* | Licensed* | Total | |||||||||||||||||||||||||
| Consolidated Total |
||||||||||||||||||||||||||||||||
| Total beginning |
426 | 71 | 152 | 649 | 428 | 77 | 178 | 683 | ||||||||||||||||||||||||
| Opened restaurants |
7 | 7 | 31 | 45 | 6 | 14 | 35 | 55 | ||||||||||||||||||||||||
| Closed restaurants |
(5 | ) | (1 | ) | (5 | ) | (11 | ) | (2 | ) | — | (3 | ) | (5 | ) | |||||||||||||||||
| Refranchised restaurants |
— | — | — | — | (1 | ) | 1 | — | — | |||||||||||||||||||||||
| Total ending |
428 | 77 | 178 | 683 | 431 | 92 | 210 | 733 | ||||||||||||||||||||||||
| * | We use franchise agreements to contract with qualified disadvantaged business enterprises, non-profit and other entities, either as licensees, fractional franchisees, or franchisees under a traditional franchise agreement, who do not meet the fractional franchise exemption to open restaurants in our traditional licensee venues. As of December 29, 2009 and December 28, 2010, we had six and four franchisees, respectively, operating Einstein Bros. restaurants in such license locations which operationally fall under our licensing group. |
18
Table of Contents
As of December 28, 2010, our company-owned facilities, franchisees and licensees operated in various states and in the District of Columbia as follows:
| Location |
Company Owned |
Franchised | Licensed | Total | ||||||||||||
| Alabama |
— | — | 4 | 4 | ||||||||||||
| Arizona |
27 | — | 5 | 32 | ||||||||||||
| Arkansas |
— | 1 | — | 1 | ||||||||||||
| California |
79 | 7 | 11 | 97 | ||||||||||||
| Colorado |
33 | 1 | 8 | 42 | ||||||||||||
| Connecticut |
1 | — | 1 | 2 | ||||||||||||
| Delaware |
1 | 1 | — | 2 | ||||||||||||
| District of Columbia |
1 | — | 4 | 5 | ||||||||||||
| Florida |
51 | 4 | 20 | 75 | ||||||||||||
| Georgia |
17 | 1 | 14 | 32 | ||||||||||||
| Idaho |
— | — | 1 | 1 | ||||||||||||
| Illinois |
32 | 3 | 9 | 44 | ||||||||||||
| Indiana |
10 | — | 1 | 11 | ||||||||||||
| Kansas |
6 | — | 2 | 8 | ||||||||||||
| Kentucky |
— | — | 7 | 7 | ||||||||||||
| Louisiana |
— | — | 5 | 5 | ||||||||||||
| Maryland |
12 | — | 4 | 16 | ||||||||||||
| Massachusetts |
2 | — | 3 | 5 | ||||||||||||
| Michigan |
15 | — | 8 | 23 | ||||||||||||
| Minnesota |
5 | — | 3 | 8 | ||||||||||||
| Mississippi |
— | — | 3 | 3 | ||||||||||||
| Missouri |
12 | 1 | 8 | 21 | ||||||||||||
| Nevada |
14 | 1 | 3 | 18 | ||||||||||||
| New Hampshire |
1 | — | — | 1 | ||||||||||||
| New Jersey |
5 | 28 | 2 | 35 | ||||||||||||
| New Mexico |
5 | — | — | 5 | ||||||||||||
| New York |
— | 7 | — | 7 | ||||||||||||
| North Carolina |
2 | 1 | 7 | 10 | ||||||||||||
| Ohio |
9 | — | 11 | 20 | ||||||||||||
| Oklahoma |
— | — | 1 | 1 | ||||||||||||
| Oregon |
8 | — | 1 | 9 | ||||||||||||
| Pennsylvania |
9 | 23 | 8 | 40 | ||||||||||||
| South Carolina |
— | — | 7 | 7 | ||||||||||||
| South Dakota |
— | — | 1 | 1 | ||||||||||||
| Tennessee |
— | 1 | 12 | 13 | ||||||||||||
| Texas |
30 | 7 | 23 | 60 | ||||||||||||
| Utah |
18 | — | — | 18 | ||||||||||||
| Virginia |
10 | 5 | 9 | 24 | ||||||||||||
| Washington |
6 | — | 2 | 8 | ||||||||||||
| Wisconsin |
10 | — | 2 | 12 | ||||||||||||
| Total |
431 | 92 | 210 | 733 | ||||||||||||
| ITEM 3. | LEGAL PROCEEDINGS |
We are subject to claims and legal actions in the ordinary course of business, including claims by or against our franchisees, licensees and employees or former employees and/or contract disputes. We do not believe any currently pending or threatened matter would have a material adverse effect on our business, results of operations or financial condition.
| ITEM 4. | REMOVED AND RESERVED |
19
Table of Contents
PART II
| ITEM 5. | MARKET FOR REGISTRANT’S COMMON EQUITY, RELATED STOCKHOLDER MATTERS AND ISSUER PURCHASES OF EQUITY SECURITIES |
Our common stock is traded on the NASDAQ Global Market under the symbol “BAGL”. The following table sets forth the high and low sale prices for our common stock for each fiscal quarter during the periods indicated.
| High | Low | |||||||
| Year ended December 28, 2010 (fiscal 2010): |
||||||||
| First Quarter |
$ | 12.59 | $ | 9.74 | ||||
| Second Quarter |
$ | 13.32 | $ | 11.01 | ||||
| Third Quarter |
$ | 11.79 | $ | 9.66 | ||||
| Fourth Quarter |
$ | 13.77 | $ | 10.55 | ||||
| High | Low | |||||||
| Year ended December 29, 2009 (fiscal 2009): |
||||||||
| First Quarter |
$ | 7.56 | $ | 4.24 | ||||
| Second Quarter |
$ | 11.37 | $ | 5.74 | ||||
| Third Quarter |
$ | 14.24 | $ | 8.70 | ||||
| Fourth Quarter |
$ | 13.31 | $ | 8.69 | ||||
As of March 11, 2011, there were 16,687,215 holders of record of our common stock. This number does not include individual stockholders who own common stock registered in the name of a nominee under nominee security listings.
As permitted by our new credit facility in 2010, described in further detail in Item 7, our Board of Directors declared the following dividend in 2010:
| Date Declared |
Record Date | Dividend Per Share |
Total Amount | Payment Date | ||||||||||||
| (in thousands) | ||||||||||||||||
| December 20, 2010 |
March 1, 2011 | $ | 0.125 | $ | 2,081 | April 15, 2011 | ||||||||||
It is the current expectation of our Board of Directors that we will continue to pay a quarterly cash dividend, at the discretion of the Board of Directors, dependent on a variety of factors, including available cash and the overall financial condition of the Company. In addition, like other companies that are incorporated in Delaware, we are also limited by Delaware law as to the payment of dividends.
Previously, we had not declared or paid any cash dividends on our common stock since our inception as we were precluded from paying cash dividends under our financing agreements.
20
Table of Contents
Performance Graph
The included performance graph covers the fiscal five-year period from January 3, 2006 through December 28, 2010. The graph compares the total return of our common stock (BAGL) to our current peer group of companies (PGI) and the NASDAQ Composite Index. The PGI was selected representing our competitive peer group, comprised of multi-concept companies and/or companies with a similar organizational structure. The companies selected are participants of the restaurant industry with a sufficient period of operating history for continuous inclusion in the Index.
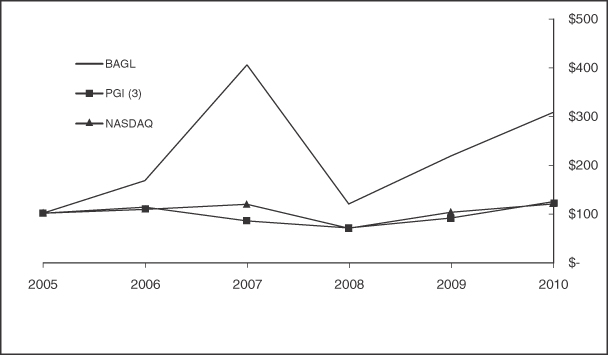
| Measurement period - five years (1) (2) | ||||||||||||||||||||||||
| Fiscal 2005 |
Fiscal 2006 |
Fiscal 2007 |
Fiscal 2008 |
Fiscal 2009 |
Fiscal 2010 |
|||||||||||||||||||
| BAGL |
$ | 100.00 | $ | 166.67 | $ | 403.33 | $ | 118.67 | $ | 216.89 | $ | 305.56 | ||||||||||||
| PGI (3) |
$ | 100.00 | $ | 112.29 | $ | 84.32 | $ | 69.75 | $ | 89.71 | $ | 123.24 | ||||||||||||
| NASDAQ |
$ | 100.00 | $ | 107.65 | $ | 118.21 | $ | 69.11 | $ | 101.99 | $ | 118.47 | ||||||||||||
| (1) | Assumes all distributions to stockholders are reinvested on the payment dates. |
| (2) | Assumes $100 initial investment on January 3, 2006 in BAGL, the PGI, and the NASDAQ Composite Index. |
| (3) | The PGI is a price-weighted index. The index includes: |
| • | Panera Bread Company |
| • | Starbucks Corporation |
| • | Sonic Corporation |
| • | Jack in the Box Incorporated |
| • | AFC Enterprises Incorporated (Popeyes Chicken and Biscuits restaurant chain) |
| • | YUM! Brands, Incorporated (A&W, KFC, Long John Silver’s, Pizza Hut and Taco Bell restaurant chains) |
| • | Wendy’s |
21
Table of Contents
| ITEM 6. | SELECTED FINANCIAL DATA |
The following selected financial data for each fiscal year was extracted or derived from our consolidated financial statements and has been restated to reflect adjustments to the financial data that is further discussed in the “Restatement of Financial Information” section in “Management’s Discussion and Analysis of Financial Condition and Results of Operations” and in Note 3 in the Notes to Consolidated Financial Statements.
| Fiscal years ended: | ||||||||||||||||||||
| January 2, 2007 (52 weeks) |
January 1, 2008 (52 weeks) |
December 30, 2008 (52 weeks) |
December 29, 2009 (52 weeks) |
December 28, 2010 (52 weeks) |
||||||||||||||||
| (As Restated (4)) | (As Restated (4)) | (As Restated (4)) | (As Restated (4)) | |||||||||||||||||
| (in thousands of dollars, except per share data and as otherwise indicated) | ||||||||||||||||||||
| Selected Statements of Operations Data: |
||||||||||||||||||||
| Revenues |
$ | 389,962 | $ | 402,902 | $ | 413,450 | $ | 408,562 | $ | 411,711 | ||||||||||
| Cost of goods sold |
107,849 | 110,397 | 112,675 | 108,052 | 106,035 | |||||||||||||||
| Labor costs |
108,274 | 111,453 | 112,007 | 113,665 | 109,005 | |||||||||||||||
| Rent and related expenses |
34,690 | 36,289 | 38,389 | 40,517 | 39,731 | |||||||||||||||
| Other operating costs |
34,867 | 35,786 | 37,781 | 37,426 | 37,732 | |||||||||||||||
| Marketing costs |
4,496 | 3,255 | 2,264 | 4,597 | 9,854 | |||||||||||||||
| Manufacturing and commissary costs |
21,154 | 24,792 | 28,566 | 26,573 | 25,566 | |||||||||||||||
| General and administrative expenses |
37,484 | 40,635 | 36,356 | 35,463 | 38,502 | |||||||||||||||
| California wage and hour settlements |
— | — | 1,900 | — | — | |||||||||||||||
| Senior management transition costs |
— | — | 1,335 | — | — | |||||||||||||||
| Restructuring expenses |
— | — | — | — | 477 | |||||||||||||||
| Depreciation and amortization |
16,949 | 11,192 | 14,100 | 16,627 | 17,769 | |||||||||||||||
| Loss/(gain) on sale, disposal or abandonment of assets, net of gains |
493 | 601 | 198 | (93 | ) | (531 | ) | |||||||||||||
| Impairment charges and other related costs |
2,268 | 236 | 263 | 818 | — | |||||||||||||||
| Income from operations |
21,438 | 28,266 | 27,616 | 24,917 | 27,571 | |||||||||||||||
| Interest expense, net (1) |
19,555 | 12,387 | 5,439 | 6,114 | 5,135 | |||||||||||||||
| Write-off of debt issuance costs upon redemption of term loan |
3,956 | 2,071 | — | — | 966 | |||||||||||||||
| Adjustment for Series Z Modification |
— | — | — | — | 929 | |||||||||||||||
| (Loss) income before income taxes |
(6,868 | ) | 13,040 | 22,177 | 18,803 | 20,541 | ||||||||||||||
| Provision (benefit) for income taxes |
1,484 | 2,499 | 2,468 | (71,560 | ) | 9,918 | ||||||||||||||
| Net (loss) income |
$ | (8,352 | ) | $ | 10,541 | $ | 19,709 | $ | 90,363 | $ | 10,623 | |||||||||
| Net (loss) income |
$ | (8,352 | ) | $ | 10,541 | $ | 19,709 | $ | 90,363 | $ | 10,623 | |||||||||
| Less: Additional redemption on temporary equity |
— | — | — | — | (387 | ) | ||||||||||||||
| Add: Accretion of premium on Series Z preferred stock |
— | — | — | — | 1,072 | |||||||||||||||
| Net (loss) income available to common stockholders |
$ | (8,352 | ) | $ | 10,541 | $ | 19,709 | $ | 90,363 | $ | 11,308 | |||||||||
| Per share data: |
||||||||||||||||||||
| Weighted average number of common shares outstanding— |
||||||||||||||||||||
| Basic |
10,356,415 | 13,497,841 | 15,934,796 | 16,175,391 | 16,532,420 | |||||||||||||||
| Diluted |
10,356,415 | 14,235,625 | 16,378,965 | 16,526,869 | 16,804,726 | |||||||||||||||
| Net (loss) income available to common stockholders per share— |
||||||||||||||||||||
| Basic |
$ | (0.81 | ) | $ | 0.78 | $ | 1.24 | $ | 5.59 | $ | 0.68 | |||||||||
| Diluted |
$ | (0.81 | ) | $ | 0.74 | $ | 1.20 | $ | 5.47 | $ | 0.67 | |||||||||
| Cash dividend declared per common share |
$ | — | $ | — | $ | — | $ | — | $ | 0.125 | ||||||||||
| Other Data: |
||||||||||||||||||||
| Capital expenditures (2) |
$ | 13,172 | $ | 25,869 | $ | 26,690 | $ | 16,898 | $ | 16,597 | ||||||||||
| Percent increase (decrease) in system-wide comparable store sales (3) |
4.7 | % | 4.0 | % | 1.4 | % | (2.4 | %) | 0.3 | % | ||||||||||
| Percent increase (decrease) in company owned restaurant comparable store sales (3) |
4.5 | % | 3.7 | % | (0.1 | %) | (3.4 | %) | (0.4 | %) | ||||||||||
| (1) | Net interest expense is comprised of interest paid or payable in cash, Series Z Additional Redemption amounts, and non-cash interest expense resulting from the amortization of debt discount, notes paid-in-kind, debt issuance costs and the amortization of warrants issued in connection with debt financings and interest income from our money market cash accounts. |
| (2) | Excludes fixed asset purchases for which payment had not occurred as of each year end. |
22
Table of Contents
| (3) | Comparable store sales represent sales at restaurants open for one full year that have not been closed during the current year. Comparable store sales include company-owned restaurants only and represent the change in period-over-period sales for the comparable restaurant base. A restaurant becomes comparable in its 13th full month of operation. |
| (4) | See “Restatement of Financial Information” in “Management’s Discussion and Analysis of Financial Condition and Results of Operations” and in Note 3 in the Notes to Consolidated Financial Statements. |
| As of fiscal year ended: | ||||||||||||||||||||
| January 2, 2007 |
January 1, 2008 |
December 30, 2008 |
December 29, 2009 |
December 28, 2010 |
||||||||||||||||
| (As Restated (4)) | (As Restated (4)) | (As Restated (4)) | (As Restated (4)) | |||||||||||||||||
| (in thousands of dollars, except per share data and as otherwise indicated) | ||||||||||||||||||||
| Selected Balance Sheet Data: |
||||||||||||||||||||
| Cash and cash equivalents |
$ | 5,477 | $ | 9,436 | $ | 24,216 | $ | 9,885 | $ | 11,768 | ||||||||||
| Property, plant and equipment, net |
33,889 | 47,714 | 59,747 | 58,682 | 56,663 | |||||||||||||||
| Total assets |
133,154 | 148,562 | 172,929 | 213,258 | 205,067 | |||||||||||||||
| Short-term debt, capital leases and current portion of long-term debt |
3,681 | 1,035 | 8,149 | 5,256 | 7,517 | |||||||||||||||
| Mandatorily redeemable Series Z preferred stock, $.001 par value, $1,000 per share liquidation value |
57,000 | 57,000 | 57,000 | 32,194 | — | |||||||||||||||
| Senior notes, capital leases and other long-term debt, net of discount |
166,680 | 88,942 | 79,825 | 74,572 | 80,213 | |||||||||||||||
| Total stockholders' (deficit) equity |
(145,149 | ) | (48,570 | ) | (29,982 | ) | 64,323 | 77,386 | ||||||||||||
| Other Data: |
||||||||||||||||||||
| Number of locations at end of period |
598 | 612 | 649 | 683 | 733 | |||||||||||||||
| Franchised and licensed |
182 | 196 | 223 | 255 | 302 | |||||||||||||||
| Company-owned and operated |
416 | 416 | 426 | 428 | 431 | |||||||||||||||
| (4) | See “Restatement of Financial Information” in “Management’s Discussion and Analysis of Financial Condition and Results of Operations” and in Note 3 in the Notes to Consolidated Financial Statements. |
23
Table of Contents
| ITEM 7. | MANAGEMENT’S DISCUSSION AND ANALYSIS OF FINANCIAL CONDITION AND RESULTS OF OPERATIONS |
General
We have a 52/53-week fiscal year ending on the Tuesday closest to December 31. Fiscal years 2008, 2009 and 2010 ended on December 30, 2008, December 29, 2009 and December 28, 2010, respectively, and each contained 52 weeks. Our next 53-week fiscal year is 2011 which ends on January 3, 2012.
Overview
We are the largest owner/operator, franchisor and licensor of bagel specialty restaurants in the United States. As a leading fast-casual restaurant chain, our restaurants specialize in high-quality foods for breakfast, lunch and afternoon snacks in a bakery-café atmosphere with a neighborhood emphasis. Our product offerings include fresh bagels and other bakery items baked on-site, made-to-order breakfast and lunch sandwiches on a variety of bagels, breads or wraps, gourmet soups and salads, assorted pastries, premium coffees and an assortment of snacks. Our manufacturing and commissary operations prepare and assemble consistent, high-quality ingredients that are delivered fresh to our restaurants through our network of independent distributors.
Restatement of Financial Information
On February 22, 2011, management, after discussion with the Audit Committee of our Board of Directors, determined that previously issued financial statements for the fiscal years 2006, 2007, 2008 and 2009 and each of the four quarters of fiscal 2009 and fiscal 2008 should be restated in order to revise our accounting for the provision for income taxes. These matters are described in more detail in Note 3 and Note 20 to our Consolidated Financial Statements included in this Annual Report. The restated consolidated balance sheet as of December 29, 2009 and the related restated consolidated statements of operations, stockholders’ equity and cash flows for the years ended December 29, 2009 and December 30, 2008 are included in this Annual Report. The selected financial data for those fiscal years, as well as fiscal years 2006 and 2007 in this Annual Report, have also been restated because of these matters. The accompanying Management’s Discussion and Analysis of Financial Condition and Results of Operations section gives effect to these restatements and a detailed discussion follows.
We have not amended our reports previously filed under the Securities Exchange Act of 1934, and therefore the financial statements and related financial information contained in those reports should no longer be relied upon and are superseded by the financial statements and financial information in this Annual Report on Form 10-K.
During the year end close process, the Company identified two types of errors while preparing its income tax provision. These errors only impact the provision for income taxes and resulted in errors to the Company’s income tax provisions, net income (loss) amounts and earnings per share amounts for 2001 through 2009. The errors do not impact income from operations for 2001 through 2009.
The first error relates to the incorrect netting of deferred tax liabilities (“DTL”) against deferred tax assets (“DTA”). This relates to the cost basis under Generally Accepted Accounting Principles (“GAAP”) versus the cost basis for tax purposes for amortization of indefinite-lived intangibles that do not amortize for GAAP. This DTL should not be a source of future taxable income in calculating a valuation allowance or assessing whether deferred tax assets are more likely than not to be realized. The Company maintained a full valuation allowance against its net deferred tax assets from 2000 through the third quarter of 2009. However, the Company’s valuation allowance became understated over the years 2001 through 2008 by a cumulative $16.3 million as a result of offsetting this DTL against its DTAs in calculating its valuation allowance and its annual tax expense.
This DTL should have been presented as a DTL on the Company’s balance sheet. Likewise, as a result of understating its provision for income taxes in each of these years, cumulative losses for these years and the Company’s accumulated deficit were understated by $16.3 million as of the end of fiscal 2008. The Company’s
24
Table of Contents
income tax expense was understated by $1.4 million in 2008 giving rise to an overstatement of net income in 2008 of $1.4 million. Correction of this item did not change income (loss) before income taxes for any year from 2001 through 2009. Correction for this item would increase income tax expense by a total of $7.5 million (an average of $1.1 million per year) from 2002 through 2008 with an initial increase in income tax expense of approximately $8.9 million in 2001. As a result of the Company reversing the valuation allowance in 2009, the impact to 2009 is that the Company understated its tax benefit by $16.3 million for this item. As of the end of fiscal 2009, this error had no further impact on the Company’s financial statements.
The second error was due to improper recognition of certain deferred tax assets and liabilities relating to years prior to 2009 totaling approximately $2.0 million and includes the following:
| • | An incorrect state income tax rate was applied to the state tax loss carry forwards for the calculation of the related deferred tax asset (a $1.6 million expense); |
| • | Deferred tax asset recognition for workers compensation (a $1.8 million benefit) and deferred rent (a $0.6 million benefit); |
| • | An Alternative Minimum Tax (“AMT”) credit carryover from 1997 had not been previously recognized (a $0.3 million benefit); |
| • | A net true-up in the GAAP versus tax cost basis (a $0.6 million benefit) for property, plant and equipment, and intangibles; and |
| • | Other miscellaneous benefits of $0.3 million. |
The Company maintained a full valuation allowance against its net deferred tax assets from 2000 through the third quarter of 2009. Thus, any incremental changes in income tax expense/benefit arising out of these items in its DTAs and DTLs were offset by a commensurate change in the Company’s valuation allowance against its deferred tax assets. The impact of this error is an increased tax benefit of approximately $2.0 million to be recorded in the third quarter of 2009 when the valuation allowance was reversed.
The combined $18.4 million impact of these errors will increase the income tax benefit and net income by $18.4 million in 2009. Restated net income is $90.4 million for 2009 from the previously reported $72.0 million.
2010 Highlights and Trends
During 2010, we focused on our key strategies and resetting the financial levers within our balance sheet and focused on regaining momentum in comparable store sales with an emphasis on building transaction growth. Our key strategies are:
| • | Drive comparable store sales growth, |
| • | Enhance corporate margins, and |
| • | Accelerate unit growth. |
While our 2010 system-wide comparable store sales were positive, the more important trend that we focused on was an improvement in system-wide comparable transactions in the third quarter and then the fourth quarter. System-wide comparable transactions improved to 1.2% for the second half of 2010 compared to minus 1.3% for the first half of 2010 – a positive change in trend of 2.5%. Approximately 51.0% of our 2010 system-wide comparable transactions occurred in third and fourth quarters. We saw a very similar change in trend for comparable transactions at our company-owned restaurants. For 2010, our system-wide comparable store sales were positive 0.3% with flat transactions and an increase of 0.3% in average check.
| System-wide Comparable Store Components | ||||||||||||||||||||||||||||
| 2009 | Q1 10 | Q2 10 | Q3 10 | Q4 10 | 2010 | Change | ||||||||||||||||||||||
| Transactions |
-2.3 | % | -1.3 | % | -1.2 | % | 0.7 | % | 1.7 | % | 0.0 | % | 2.3 | % | ||||||||||||||
| Check |
-0.1 | % | 1.4 | % | 0.1 | % | 0.0 | % | -0.1 | % | 0.3 | % | 0.4 | % | ||||||||||||||
| Sales |
-2.4 | % | 0.1 | % | -1.1 | % | 0.7 | % | 1.6 | % | 0.3 | % | 2.7 | % | ||||||||||||||
25
Table of Contents
The below table represents our system-wide comparable store sales percentages, average check percentages and transaction percentages since 2008.
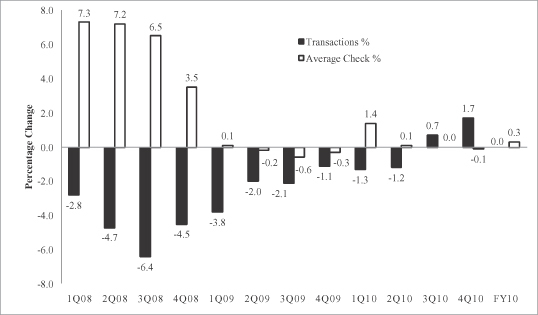
| 1Q 08 | 2Q 08 | 3Q 08 | 4Q 08 | 1Q 09 | 2Q 09 | 3Q 09 | 4Q 09 | 1Q 10 | 2Q 10 | 3Q 10 | 4Q 10 | |||||||||||||||||||||||||||||||||||||
| Sales % |
4.5 | 2.5 | 0.1 | -1.0 | -3.7 | -2.2 | -2.7 | -1.4 | 0.1 | -1.1 | 0.7 | 1.6 | ||||||||||||||||||||||||||||||||||||
We grew our base bagel business, which is made up of single bagel sales, by approximately 5.2% over 2009 as well as accelerated revenue growth in breakfast sandwiches in the fourth quarter to a positive 13.9%. Our catering business grew by approximately 9.2% with our focus on the roll-out of our online ordering system. We increased our marketing initiatives, concentrating primarily on the breakfast daypart, with increased efforts aimed at the lunch daypart. We continued to expand our company-owned restaurants in 2010 as well as our franchise and license locations. We targeted our marketing investments at coupons and print and radio advertising. In the second quarter we launched our Bagel Thin lunch sandwiches which helped bolster the lunch daypart.
From an operational standpoint, we continued our initiatives aimed at reducing our cost structure. These targeted initiatives focused on efficient labor utilization and scheduling, consistency in our product standards and portion control, and other programs aimed at restoring margins in outlier restaurants. Additionally, we successfully completed renegotiations with several of our major vendors resulting in lower primary food costs.
We added 50 net locations in 2010 compared to 34 net additions in 2009. 46 of these net additions were in our franchise and license segment as we continue to intensely focus on expansion in this area.
We strengthened our balance sheet by refinancing our debt and redeeming all remaining outstanding shares of the Series Z preferred stock. We entered into a new senior $125 million credit facility with a syndicate of banks. The new senior credit facility has a five-year term expiring December 20, 2015, with a term loan of up to $75 million and a revolving credit facility of up to $50 million. The loans will bear interest at LIBOR, plus an applicable margin ranging from 2.5% to 3.0% and or Prime, plus an applicable margin ranging from 1.5% to 2.0%. In addition, the new facility provides flexibility to make share repurchases and pay dividends to shareholders, subject to certain limits. Our capital structure has been simplified to include only this new bank facility and common stock. We redeemed all remaining outstanding shares of the Company’s Series Z preferred
26
Table of Contents
stock with Halpern Denny III, L.P., the holder of the Series Z. Excluding the related additional redemption amounts, we redeemed $32.2 million in 2010 and $57 million over the last two years.
2011 Outlook
During 2011, we plan to intensely execute around our key strategies which are as follows:
To drive comparable store sales growth, we will seek to build traffic by leveraging our strengths in core bagels, breakfast and healthy innovation; drive average check increases through innovation, beverage incidence, catering, modest price increases, and additional premium sandwiches, as well as build brand awareness by leveraging learnings from our 2010 mass marketing tests. We will reinforce our product differentiation in terms of “Fresh Baked Goodness” combined with quality ingredients and innovation. Initiatives to increase our average check include bundled “combos” and additional snack items in the breakfast and lunch dayparts, and a repositioning of our coffee offering to include dedicated baristas and specialty coffee. If we expand our coffee offering to all locations, it will be an additional cost of $8.0 million to $9.0 million in 2011. Based on results from our 2010 mass marketing tests, we plan to regionally expand our broadcast radio and outdoor advertisements.
To enhance corporate margins, we will focus on manufacturing efficiencies and commodity purchasing enhancements, utilize technology to drive sustainable cost advantage, and improve restaurant level operating efficiency through targeted initiatives around product costs and labor.
To accelerate unit growth of our company-owned restaurants, our Board of Directors has approved the expansion of our capital expenditure budget by $11.0 million to a projected $28.0 million to $30.0 million in 2011. This capital expenditure budget includes the opening of 10 to 14 new company-owned restaurants and the relocation of an additional 10 to 14 company-owned restaurants, along with the continued roll-out of the new coffee program. The new units will primarily be in our more developed markets, such as Denver, Baltimore, Washington D.C. and Texas. We also intend to deploy our capital into areas such as installing drive-thru lanes and adding new exterior signage.
As we move into 2011, we have a robust pipeline of existing franchise development agreements and new license locations. We will continue to host discovery days for potential franchisees as well as expand our license footprint. We plan to open 20 to 26 franchise locations in 2011 in markets that have already been established and have shown a strong following. We plan to open 45 to 50 license restaurants in 2011, primarily in colleges and universities, hospitals, airports and military bases.
Subsequent to December 28, 2010, the Company extended an offer to sell two company-owned restaurants to a franchisee for approximately $0.8 million and has received a deposit from the franchisee. This purchase is expected to close in the first half of 2011. Further, the Company extended an offer to buy back one franchised restaurant from a franchisee for approximately $0.6 million. This buy back deal is expected to close in the first half of 2011.
Results of Operations for 2010 as compared to 2009
Financial Highlights
| • | Operating income increased 10.7% to $27.6 million in 2010 from $24.9 million in 2009. |
| • | Consolidated earnings before interest, taxes, depreciation, amortization, and other operating expenses (“Adjusted EBITDA”), a non-GAAP measure, which is calculated starting with net income, increased $3.0 million, or 7.1%, to $45.3 million in 2010 from $42.3 million in 2009. |
| • | Earnings per share (“EPS”) decreased to $0.67 per share on a dilutive basis in 2010 compared to $5.47 per share on a dilutive basis in 2009, as restated. This decrease was primarily due to the benefit from |
27
Table of Contents
| income taxes that we recognized related to the reversal of substantially all of our valuation allowance of $79.3 million on our deferred tax assets, which had an impact of $4.80 per share on a dilutive basis in 2009, as restated. |
| • | Adjusted earnings per share (“Adjusted EPS”), a non-GAAP measure, was $0.75 on a dilutive basis in 2010 compared to $0.67 on a dilutive basis in 2009. |
| • | Our net cash from operating activities increased by 29.8% to $43.8 million from $33.7 million. |
Use of Non-GAAP Financial Information
In addition to the results reported in accordance with accounting principles generally accepted in the United States of America (“GAAP”) included in this filing, the Company has provided certain non-GAAP financial information, including adjusted earnings before interest, taxes, depreciation, amortization, adjustment for Series Z modification, restructuring expenses, write-off of debt issuance costs, and other operating expenses/income (“adjusted EBITDA”); net income adjusted for changes in our tax valuation allowance, all adjustments related to the Series Z modification, restructuring expenses, write-off of debt issuance costs, and the reversing effect of residual amount in other comprehensive income related to cash flow hedge (“adjusted net income”); earnings per share adjusted for changes in our tax valuation allowance, all adjustments related to the Series Z modification, restructuring expenses, write-off of debt issuance costs, and the reversing effect of residual amount in other comprehensive income related to cash flow hedge (“adjusted EPS”) and free cash flow, or net cash provided by operating activities less net cash used in investing activities. Management believes that the presentation of this non-GAAP financial information provides useful information to investors because this information may allow investors to better evaluate ongoing business performance and certain components of the Company’s results. In addition, the Company’s Board of Directors uses this non-GAAP financial information to evaluate the performance of the Company and the management team. This information should be considered in addition to the results presented in accordance with GAAP, and should not be considered a substitute for the GAAP results. The Company has reconciled the non-GAAP financial information to the nearest GAAP measure on pages 33-34.
We include in this report information on company-owned, franchise and license and system-wide comparable store sales percentages. Comparable store sales percentages refer to changes in sales of our restaurants, whether operated by the company or by franchisees and licensees, in operation at least thirteen months including those restaurants temporarily closed for an immaterial amount of time. Some of the reasons restaurants may be temporarily closed include remodeling, road construction, rebuilding related to site-specific catastrophes and natural disasters. Franchise and license comparable store sales percentages are based on sales of franchised and licensed restaurants, as reported by franchisees and licensees. System-wide sales include sales at all restaurants, whether operated by the Company, franchisees or licensees. Management reviews the increase or decrease in comparable store sales to assess business trends. Comparable store sales exclude closed locations.
We use company-owned store sales, franchise and license sales and the resulting system-wide sales information internally in connection with restaurant development decisions, planning, and budgeting analyses. We believe system-wide comparable store sales information is useful in assessing consumer acceptance of our brands; facilitates an understanding of our financial performance and the overall direction and trends of sales and operating income; helps us appreciate the effectiveness of our advertising and marketing initiatives; and provides information that is relevant for comparison within the industry.
System-wide comparable store sales percentages are non-GAAP financial measures, which should not be considered in isolation or as a substitute for other measures of performance prepared in accordance with GAAP, and may not be equivalent to comparable store sales as defined or used by other companies. We do not record franchise or license restaurant sales as revenues. However, royalty revenues are calculated based on a percentage of franchise and license restaurant sales, as reported by the franchisees or licensees.
28
Table of Contents
Consolidated Results
| 52 weeks ended | ||||||||||||||||||||
| (dollars in thousands) | Increase/ (Decrease) |
Percentage of total revenues |
||||||||||||||||||
| December 29, 2009 |
December 28, 2010 |
2010 vs. 2009 |
December 29, 2009 |
December 28, 2010 |
||||||||||||||||
| (As Restated) | (As Restated) | |||||||||||||||||||
| Revenues |
$ | 408,562 | $ | 411,711 | 0.8 | % | ||||||||||||||
| Cost of sales |
330,830 | 327,923 | (0.9 | %) | 81.0 | % | 79.6 | % | ||||||||||||
| Operating expenses |
52,815 | 56,217 | 6.4 | % | 12.9 | % | 13.7 | % | ||||||||||||
| Income from operations |
24,917 | 27,571 | 10.7 | % | 6.1 | % | 6.7 | % | ||||||||||||
| Interest expense, net |
6,114 | 5,135 | (16.0 | %) | 1.5 | % | 1.2 | % | ||||||||||||
| Adjustment for Series Z modification* |
— | 929 | * | * | 0.0 | % | 0.2 | % | ||||||||||||
| Write-off of debt issuance costs upon redemption of term loan |
— | 966 | * | * | 0.0 | % | 0.2 | % | ||||||||||||
| Income before income taxes |
18,803 | 20,541 | 9.2 | % | 4.6 | % | 5.0 | % | ||||||||||||
| Total (benefit) provision for income tax |
(71,560 | ) | 9,918 | * | * | (17.5 | %) | 2.4 | % | |||||||||||
| Net income |
$ | 90,363 | $ | 10,623 | (88.2 | %) | 22.1 | % | 2.6 | % | ||||||||||
| Adjustments to net income: |
||||||||||||||||||||
| Interest expense, net |
6,114 | 5,135 | (16.0 | %) | ||||||||||||||||
| (Benefit) provision for income taxes |
(71,560 | ) | 9,918 | * | * | |||||||||||||||
| Depreciation and amortization |
16,627 | 17,769 | 6.9 | % | ||||||||||||||||
| Write-off of debt issuance costs |
— | 966 | * | * | ||||||||||||||||
| Series Z modification |
— | 929 | * | * | ||||||||||||||||
| Restructuring expense |
— | 477 | * | * | ||||||||||||||||
| Other operating expenses (income) |
725 | (531 | ) | * | * | |||||||||||||||
| Adjusted EBITDA |
$ | 42,269 | $ | 45,286 | 7.1 | % | 10.3 | % | 11.0 | % | ||||||||||
| * | As a result of the March 17, 2010 agreement modifying our Series Z, we recognized a non-cash loss of $0.9 million on the extinguishment of debt, recorded additional redemption within stockholders’ equity and recorded a discount within interest expense. |
| ** | Not meaningful |
Our income from operations improved by $2.6 million in 2010 to $27.6 million as a result of higher revenues and lower cost of sales offset by an increase in operating expenses.
Total revenues increased by $3.1 million to $411.7 million as a result of increases in company-owned restaurant sales and franchise and license related revenues. Our catering business saw an increase of 9.2% over 2009. System-wide comparable store sales were 0.3% due to a turnaround in our transactions trend from -2.3% in 2009 to flat in 2010 and an increase in average check of 0.3%. We achieved this by growing our base bagel sales and by turning around breakfast sales. Total costs in our company-owned restaurants and manufacturing and commissaries segments decreased $2.9 million. The combination of this increase in revenues and decrease in total cost of sales resulted in an increase of $6.0 million in contribution margin.
Our operating expense increased by $3.4 million as a result of a $3.0 million increase in general and administrative expenses, a $1.1 million increase in depreciation and amortization expense and $0.5 million in severance expense offset by a net improvement in other operating items of $1.2 million.
Income before income taxes improved by $1.7 million in 2010 to $20.5 million. This comparative of 2010 to 2009 is $0.9 million lower than the improvement in our income from operations as a result of the non-cash
29
Table of Contents
charges of $1.9 million for an adjustment for our Series Z modification and the write-off of debt issuance costs offset by a $1.0 million decrease in interest expense. Our interest expense declined primarily due to lower additional redemption on our Series Z as a result of the impact of the significant Series Z redemptions we have made since 2009 as well as the expiration of our interest rate swap in August of 2010.
Company-Owned Restaurant Operations
Our company-owned restaurants vary in their unit volume, profitability and recent comparable store sales performance. As of December 28, 2010, we had 107 restaurants that generated an average unit volume in excess of $1.0 million. These 107 restaurants had an average unit volume of approximately $1.2 million. In the aggregate, these restaurants contribute approximately 35% of total restaurant sales and 48% of total restaurant operating profit.
Company-owned restaurant sales for 2010 increased $1.8 million, which was primarily due to three net new company-owned restaurants. Additionally, restaurant sales for 2010 benefited from $0.4 million in gift certificate breakage. We do not expect any benefit from gift certificate breakage in the future as this gift certificate program has ceased to exist.
| 52 weeks ended | ||||||||||||||||||||
| (dollars in thousands) | Increase/ (Decrease) |
Percentage of company- owned restaurant sales |
||||||||||||||||||
| December 29, 2009 |
December 28, 2010 |
2010 vs. 2009 |
December 29, 2009 |
December 28, 2010 |
||||||||||||||||
| Company-owned restaurant sales |
$ | 370,412 | $ | 372,191 | 0.5 | % | ||||||||||||||
| Percent of total revenues |
90.7 | % | 90.4 | % | ||||||||||||||||
| Cost of sales: |
||||||||||||||||||||
| Cost of goods sold |
$ | 108,052 | $ | 106,035 | (1.9 | %) | 29.2 | % | 28.5 | % | ||||||||||
| Labor costs |
113,665 | 109,005 | (4.1 | %) | 30.7 | % | 29.3 | % | ||||||||||||
| Rent and related expenses |
40,517 | 39,731 | (1.9 | %) | 10.9 | % | 10.7 | % | ||||||||||||
| Other operating costs |
37,426 | 37,732 | 0.8 | % | 10.1 | % | 10.1 | % | ||||||||||||
| Marketing costs |
4,597 | 9,854 | 114.4 | % | 1.2 | % | 2.6 | % | ||||||||||||
| Total company-owned restaurant costs |
$ | 304,257 | $ | 302,357 | (0.6 | %) | 82.1 | % | 81.2 | % | ||||||||||
| Total company-owned restaurant gross profit |
$ | 66,155 | $ | 69,834 | 5.6 | % | 17.9 | % | 18.8 | % | ||||||||||
Comparable store sales for our company-owned restaurants for each quarter in 2009 and 2010 were as follows:
| Fiscal 2009 | Fiscal 2010 | Change | ||||||||||
| First Quarter |
-5.7 | % | -0.2 | % | 5.5 | % | ||||||
| Second Quarter |
-3.2 | % | -2.2 | % | 1.0 | % | ||||||
| Third Quarter |
-3.1 | % | -0.2 | % | 2.9 | % | ||||||
| Fourth Quarter |
-1.7 | % | 1.0 | % | 2.7 | % | ||||||
| Annual |
-3.4 | % | -0.4 | % | 3.0 | % | ||||||
Our company-owned restaurant gross profit increased $3.7 million, or 5.6%, in 2010 primarily due to an increase in sales combined with the success of our operations initiatives. Company-owned restaurant sales increased $1.8 million, or 0.5%, to $372.2 million. Comparable store sales declined 0.4% with transactions declining by 0.8% offset by an increase in average check of 0.3%.
The total costs for company-owned restaurants declined by $1.9 million with our cost of goods sold and labor costs declining by a combined $6.7 million, or 3.0%, from 2009. This decline in our costs was substantially offset in part by an increase of $5.3 million in our marketing costs.
30
Table of Contents
We were able to control and lower our variable cost of goods sold by 1.9% causing our cost of goods sold to decline from 29.2% to 28.5% as a percent of company-owned restaurant revenues. We renegotiated agreements with several of our suppliers in early 2010 that will further decrease our costs for certain products over the next several years. Most of our commodity-based food costs decreased in 2010. Wheat represents the most significant raw ingredient we purchase at approximately 8.0% of our cost of goods sold. To mitigate the risk of increasing market prices, similar to 2009, we utilized a third party advisor to manage our wheat purchases for our company-owned manufacturing facility. As a result of this relationship, our wheat costs declined throughout 2010. We will continue to work with our third party advisor to strategically source our wheat purchases. However, there can be no assurance that we will benefit from a decline in the cost of any of the commodity-based products that we purchase. Further, we benefited from our successful implementation our food waste management initiatives as well as the benefits from our on-site restaurant cameras.
Total labor costs decreased 1.4% as a percentage of company-owned restaurant sales in 2010 due to our labor initiatives in 2010 and lower health care benefit costs that were incurred.
During 2010, we more than doubled our investment in marketing to $9.9 million from $4.6 million in 2009. The increase was principally attributable to increased media marketing including billboard advertising and radio spots. We intend to expand on this media marketing in 2011 as we believe the increased marketing creates awareness of our brand which will help facilitate the trial of our products with new customers and increase loyalty and frequency of our guests’ visits.
Manufacturing and Commissary Operations
| 52 weeks ended | ||||||||||||||||||||
| (dollars in thousands) | Increase/ (Decrease) |
Percentage of manufacturing and commissary revenues |
||||||||||||||||||
| December 29, 2009 |
December 28, 2010 |
2010 vs. 2009 |
December 29, 2009 |
December 28, 2010 |
||||||||||||||||
| Manufacturing and commissary revenues |
$ | 30,638 | $ | 30,405 | (0.8 | %) | ||||||||||||||
| Percent of total revenues |
7.5 | % | 7.4 | % | ||||||||||||||||
| Manufacturing and commissary costs |
$ | 26,573 | $ | 25,566 | (3.8 | %) | 86.7 | % | 84.1 | % | ||||||||||
| Total manufacturing and commissary gross profit |
$ | 4,065 | $ | 4,839 | 19.0 | % | 13.3 | % | 15.9 | % | ||||||||||
Manufacturing and commissary revenues for 2010 decreased $0.2 million compared to 2009. The modest decline was due to a decrease in third party domestic bagel sales, partially offset by a slight increase in international bagel sales as well as growth in sales to our franchise and license locations. Manufacturing and commissary costs decreased substantially in 2010 as a result of lower raw ingredient costs coupled with savings due to lower use taxes, maintenance and insurance costs for manufacturing and commissary locations, and continued efficiency improvements in our bagel manufacturing facility.
Franchise and License Operations
| 52 weeks ended | ||||||||||||
| (dollars in thousands) | Increase/ (Decrease) |
|||||||||||
| December 29, 2009 |
December 28, 2010 |
2010 vs. 2009 |
||||||||||
| Franchise and license related revenues |
$ | 7,512 | $ | 9,115 | 21.3 | % | ||||||
| Percent of total revenues |
1.8 | % | 2.2 | % | ||||||||
| Number of franchise and license restaurants |
255 | 302 | ||||||||||
31
Table of Contents
Overall, franchise and license revenue improvement of 21.3% from 2009 was driven by strong royalty streams that were a result of the net opening of 32 license locations and 15 franchise locations over the last twelve months. For the fifty-two weeks ended December 28, 2010, franchise and license comparable store sales were a positive 2.7%.
Corporate Support
| 52 weeks ended | ||||||||||||||||||||
| (dollars in thousands) | Increase/ (Decrease) |
Percentage of total revenues | ||||||||||||||||||
| December 29, 2009 |
December 28, 2010 |
2010 vs. 2009 |
December 29, 2009 |
December 28, 2010 |
||||||||||||||||
| (As Restated) | (As Restated) | |||||||||||||||||||
| General and administrative expenses |
$ | 35,463 | $ | 38,502 | 8.6 | % | 8.7 | % | 9.4 | % | ||||||||||
| Depreciation and amortization |
16,627 | 17,769 | 6.9 | % | 4.1 | % | 4.3 | % | ||||||||||||
| Restructuring expenses |
— | 477 | * | * | 0.0 | % | 0.1 | % | ||||||||||||
| Other operating expense (income) |
725 | (531 | ) | (173.2 | %) | 0.2 | % | (0.1 | %) | |||||||||||
| Total operating expenses |
$ | 52,815 | $ | 56,217 | 6.4 | % | 12.9 | % | 13.7 | % | ||||||||||
| Interest expense, net |
6,114 | 5,135 | (16.0 | %) | 1.5 | % | 1.2 | % | ||||||||||||
| Adjustment for Series Z modification |
— | 929 | * | * | 0.0 | % | 0.2 | % | ||||||||||||
| Write-off of debt issuance costs upon redemption of term loan |
— | 966 | * | * | 0.0 | % | 0.2 | % | ||||||||||||
| (Benefit) provision for income tax |
(71,560 | ) | 9,918 | * | * | (17.5 | %) | 2.4 | % | |||||||||||
| ** | Not meaningful |
Our general and administrative expenses increased $3.0 million in 2010 compared to 2009 due to an increase of $1.8 million in incentive compensation as a result of the achievement of performance targets in 2010 and $0.6 million in stock based compensation. We also incurred $0.5 million in severance expense related to a restructuring plan which was implemented late in 2010. We approved a plan to reorganize the organization to align with our franchise growth model. This reorganization included eliminating certain duplicate positions and reducing headcount. We expect general and administrative expenses for 2011 to be approximately $10.0 million per quarter.
Depreciation and amortization expenses increased $1.1 million or 6.9% in 2010 compared to 2009 due to additional assets invested in the company-owned restaurants that were added or upgraded in 2010. We expect depreciation expense for 2011 to be in the range of approximately $19 million to $21 million.
Interest expense, net decreased in 2010 primarily due to the expiration of the swap in August 2010 and a decrease in the Series Z additional redemption amounts of $0.4 million.
The components of our provision for income taxes are as follows:
| December 29, 2009 |
December 28, 2010 |
|||||||
| (As Restated) | ||||||||
| (in thousands) | ||||||||
| Current |
||||||||
| Total current income tax provision |
$ | 198 | $ | 194 | ||||
| Deferred |
||||||||
| Total deferred income tax provision |
7,563 | 9,862 | ||||||
| Change in valuation allowance |
(79,321 | ) | (138 | ) | ||||
| Total deferred income tax (benefit) provision |
(71,758 | ) | 9,724 | |||||
| Total income tax (benefit) provision |
$ | (71,560 | ) | $ | 9,918 | |||
32
Table of Contents
In 2009, we recorded a net deferred tax benefit of $71.8 million as restated, comprised of a $79.3 million reversal of substantially all of our valuation allowance as restated, partially offset by deferred tax expense of $7.6 million as restated. In the third quarter of 2009, we reduced our $84.3 million valuation allowance by $79.3 million, as restated, to $4.9 million after concluding the likelihood for realization of the benefits of our deferred tax assets is more likely than not. As discussed under “Restatement of Financial Information” above, the impact of the restatement on these items is $18.4 million in additional tax benefit recorded in 2009.
Reconciliation of Non-GAAP Measures to GAAP Measures
| 52 weeks ended | ||||||||
| December 29, 2009 |
December 28, 2010 |
|||||||
| (As Restated) | ||||||||
| (dollars in thousands) | ||||||||
| Net income |
$ | 90,363 | $ | 10,623 | ||||
| Adjustments to net income: |
||||||||
| Interest expense, net |
6,114 | 5,135 | ||||||
| Provision (benefit) for income taxes |
(71,560 | ) | 9,918 | |||||
| Depreciation and amortization |
16,627 | 17,769 | ||||||
| Write-off of debt issuance costs upon redemption of term loan |
— | 966 | ||||||
| Adjustment for Series Z modification |
— | 929 | ||||||
| Restructuring expense |
— | 477 | ||||||
| Other operating expenses (income) |
725 | (531 | ) | |||||
| Adjusted EBITDA |
$ | 42,269 | $ | 45,286 | ||||
33
Table of Contents
EINSTEIN NOAH RESTAURANT GROUP, INC.
NON-GAAP FINANCIAL INFORMATION
| 52 weeks ended | ||||||||
| December 29, 2009 |
December 28, 2010 |
|||||||
| (As Restated) | ||||||||
| (in thousands, except earnings per share and related share information) |
||||||||
| Net income available to common stockholders |
$ | 90,363 | $ | 11,308 | ||||
| Adjustments for: |
||||||||
| Less: Change in tax valuation allowance |
(79,321 | ) | — | |||||
| Add: Reversing effect of residual tax amount in other comprehensive income related to cash flow hedge |
— | 500 | ||||||
| Add: Write-off of debt issuance costs upon redemption of term loan |
— | 966 | ||||||
| Add: Restructuring expenses |
— | 477 | ||||||
| Less: Tax effects related to debt issuance costs and restructuring expenses |
— | (564 | ) | |||||
| Add: Adjustment for Series Z modification |
— | 929 | ||||||
| Less: Accretion of premium on Series Z preferred stock |
— | (1,072 | ) | |||||
| Less: Amortization of discount on Series Z preferred stock |
— | 143 | ||||||
| Adjusted net income |
$ | 11,042 | $ | 12,687 | ||||
| Weighted average number of common shares outstanding: |
||||||||
| Basic |
16,175,391 | 16,532,420 | ||||||
| Diluted |
16,526,869 | 16,804,726 | ||||||
| Net income per share available to common stockholders—Basic |
$ | 5.59 | $ | 0.68 | ||||
| Adjustments for: |
||||||||
| Less: Change in tax valuation allowance |
$ | (4.91 | ) | $ | — | |||
| Add: Reversing effect of residual tax amount in other comprehensive income related to cash flow hedge |
$ | — | $ | 0.03 | ||||
| Add: Write-off of debt issuance costs upon redemption of term loan |
$ | — | $ | 0.06 | ||||
| Add: Restructuring expenses |
$ | — | $ | 0.02 | ||||
| Less: Tax effects related to debt issuance costs and restructuring expenses |
$ | — | $ | (0.03 | ) | |||
| Add: Adjustment for Series Z modification |
$ | — | $ | 0.06 | ||||
| Less: Accretion of premium on Series Z preferred stock |
$ | — | $ | (0.06 | ) | |||
| Less: Amortization of discount on Series Z preferred stock |
$ | — | $ | 0.01 | ||||
| Adjusted net income per common share—Basic |
$ | 0.68 | $ | 0.77 | ||||
| Net income per share available to common stockholders—Diluted |
$ | 5.47 | $ | 0.67 | ||||
| Adjustments for: |
||||||||
| Less: Change in tax valuation allowance |
$ | (4.80 | ) | $ | — | |||
| Add: Reversing effect of residual tax amount in other comprehensive income related to cash flow hedge |
$ | — | $ | 0.02 | ||||
| Add: Write-off of debt issuance costs upon redemption of term loan |
$ | — | $ | 0.06 | ||||
| Add: Restructuring expenses |
$ | — | $ | 0.02 | ||||
| Less: Tax effects related to debt issuance costs and restructuring expenses |
$ | — | $ | (0.04 | ) | |||
| Add: Adjustment for Series Z modification |
$ | — | $ | 0.06 | ||||
| Less: Accretion of premium on Series Z preferred stock |
$ | — | $ | (0.05 | ) | |||
| Less: Amortization of discount on Series Z preferred stock |
$ | — | $ | 0.01 | ||||
| Adjusted net income per common share—Diluted |
$ | 0.67 | $ | 0.75 | ||||
34
Table of Contents
Results of Operations for 2009 as compared to 2008
Consolidated Results
| 52 weeks ended | ||||||||||||||||||||
| (dollars in thousands) | Increase/ (Decrease) |
Percentage of total revenues |
||||||||||||||||||
| December 30, 2008 |
December 29, 2009 |
2009 vs. 2008 |
December 30, 2008 |
December 29, 2009 |
||||||||||||||||
| (As Restated) | (As Restated) | (As Restated) | (As Restated) | |||||||||||||||||
| Revenues |
$ | 413,450 | $ | 408,562 | (1.2 | %) | ||||||||||||||
| Cost of sales |
331,682 | 330,830 | (0.3 | %) | 80.2 | % | 81.0 | % | ||||||||||||
| Total gross profit |
81,768 | 77,732 | (4.9 | %) | 19.8 | % | 19.0 | % | ||||||||||||
| Operating expenses |
54,152 | 52,815 | (2.5 | %) | 13.1 | % | 12.9 | % | ||||||||||||
| Income from operations |
27,616 | 24,917 | (9.8 | %) | 6.7 | % | 6.1 | % | ||||||||||||
| Interest expense |
5,439 | 6,114 | 12.4 | % | 1.3 | % | 1.5 | % | ||||||||||||
| Income before income taxes |
22,177 | 18,803 | (15.2 | %) | 5.4 | % | 4.6 | % | ||||||||||||
| Total provision (benefit) for income tax |
2,468 | (71,560 | ) | * | * | 0.6 | % | (17.5 | %) | |||||||||||
| Net income |
$ | 19,709 | $ | 90,363 | * | * | 4.8 | % | 22.1 | % | ||||||||||
| Adjustments to net income: |
||||||||||||||||||||
| Interest expense, net |
5,439 | 6,114 | 12.4 | % | ||||||||||||||||
| Provision (benefit) for income taxes |
2,468 | (71,560 | ) | * | * | |||||||||||||||
| Depreciation and amortization |
14,100 | 16,627 | 17.9 | % | ||||||||||||||||
| Other operating expenses |
461 | 725 | 57.3 | % | ||||||||||||||||
| Earnings before interest, taxes, deprecation, amortization and other operating expenses—Adjusted EBITDA |
$ | 42,177 | $ | 42,269 | 0.2 | % | 10.2 | % | 10.3 | % | ||||||||||
| ** | not meaningful |
System-wide comparable store sales decreased 2.4% in 2009. When the year began, we had negative 3.4% system-wide comparable store sales comprised of negative 8.1% in transactions and positive 5.2% for the average check related to a prior year price increase. By December of 2009 our system-wide comparable store sales were virtually flat at a negative 0.4% and negative 0.2% in both transactions and average check. We achieved this improvement through our increased marketing initiatives, focused around our core breakfast product offerings as well as other value-oriented initiatives aimed at increasing transactions and the frequency of guest visits. We believe that the difficult economic climate also put pressure on our catering sales as demand from our business customers declined.
Our gross profit margins in 2009 were pressured due primarily to the unfavorable deleveraging of certain operating expenses, higher health care benefit costs and the impact of increased investments in marketing initiatives. During periods of lower sales, we typically experience deleveraging in those cost elements that are not fully variable to changes in sales. These costs include other operating expenses, rent and related costs, and to a lesser extent, labor costs. Our health care benefit costs increased $1.9 million in 2009. We also continued to support our focus around our core breakfast offerings and other value-oriented initiatives by increasing our investments in marketing by $2.3 million in 2009.
While our revenues declined in 2009 and our cost of sales reflected a $1.9 million increase in health care benefit costs, our focus on our cost initiatives resulted in our Adjusted EBITDA being virtually flat in 2009 compared to 2008.
35
Table of Contents
Company-Owned Restaurant Operations
Our company-owned restaurants vary in their unit volume, profitability and recent comparable store sales performance. As of December 29, 2009, we had 110 restaurants that generated an average unit volume in excess of $1 million. These 110 restaurants had an average unit volume of approximately $1.2 million. In the aggregate, these restaurants contribute approximately 36% of total restaurant sales.
Company-owned restaurant sales for 2009 decreased, which was primarily related to the decline in our 2009 company-owned restaurant comparable store sales to a negative 3.4%. This was due to a decrease in the number of transactions, and a slight decrease in our average check mostly due to greater coupon redemptions associated with our initiatives and a slightly unfavorable change in the mix of products sold. This was partially offset by the modest price increases in 2009 at our Einstein Bros. and Noah’s company-owned restaurants, compared to the price increases taken during 2008 and, on average, the company-owned restaurants that were opened since late in 2008 until the end of 2009 had higher volumes than those that were closed over the same period, which positively contributed to our sales.
| 52 weeks ended | ||||||||||||||||||||
| (dollars in thousands) | Increase/ (Decrease) |
Percentage of
company-owned restaurant sales |
||||||||||||||||||
| December 30, 2008 |
December 29, 2009 |
2009 vs. 2008 |
December 30, 2008 |
December 29, 2009 |
||||||||||||||||
| Company-owned restaurant sales |
$ | 376,664 | $ | 370,412 | (1.7 | %) | ||||||||||||||
| Percent of total revenues |
91.1 | % | 90.7 | % | ||||||||||||||||
| Cost of sales: |
||||||||||||||||||||
| Cost of goods sold |
$ | 112,675 | $ | 108,052 | (4.1 | %) | 29.9 | % | 29.2 | % | ||||||||||
| Labor costs |
112,007 | 113,665 | 1.5 | % | 29.7 | % | 30.7 | % | ||||||||||||
| Rent and related expenses |
38,389 | 40,517 | ||||||||||||||||||
| Other operating costs |
37,781 | 37,426 | (0.9 | %) | 10.0 | % | 10.1 | % | ||||||||||||
| Marketing costs |
2,264 | 4,597 | 103.0 | % | 0.6 | % | 1.2 | % | ||||||||||||
| Total company-owned restaurant cost of sales |
$ | 303,116 | $ | 304,257 | 0.4 | % | 80.5 | % | 82.1 | % | ||||||||||
| Total company-owned restaurant gross profit |
$ | 73,548 | $ | 66,155 | (10.1 | %) | 19.5 | % | 17.9 | % | ||||||||||
Comparable store sales for our company-owned restaurants for each quarter in 2008 and 2009, compared to the same periods in the previous year were as follows:
| Fiscal 2008 | Fiscal 2009 | Change | ||||||||||
| First Quarter |
3.6 | % | -5.7 | % | -9.3 | % | ||||||
| Second Quarter |
1.0 | % | -3.2 | % | -4.2 | % | ||||||
| Third Quarter |
-1.7 | % | -3.1 | % | -1.4 | % | ||||||
| Fourth Quarter |
-3.3 | % | -1.7 | % | 1.6 | % | ||||||
| Annual |
-0.1 | % | -3.4 | % | -3.3 | % | ||||||
Although we had a 1.7% decrease in company-owned revenues, we were able to control and lower our variable cost of goods sold by 4.1% to cause our cost of goods sold to decline from 29.9% to 29.2% as a percent of company-owned restaurant revenues.
Most of our commodity-based food costs decreased in 2009. Wheat represents the most significant raw ingredient we purchase. To mitigate the risk of increasing market prices, we have utilized a third party advisor to manage our wheat purchases for our company-owned manufacturing facility. As a result of this relationship, our wheat costs declined throughout 2009. We will continue to work with our third party advisor to strategically
36
Table of Contents
source our wheat purchases. However, there can be no assurance that we will benefit from a decline in the cost of any of the commodity-based products that we purchase.
Although our staffing costs declined in response to decreased traffic, our health care benefit costs increased and we added new catering personnel throughout 2009. In the fourth quarter of 2009 we implemented a new on-line ordering system which allowed us to reduce our catering sales force at the end of the year. Total labor costs increased 1.0% as a percentage of company-owned restaurant sales in 2009.
During 2009, we doubled our investment in marketing to $4.6 million from $2.3 million in 2008. The increase was principally attributable to an investment in our marketing initiatives that we started early in 2009, which were aimed at increasing transactions and launching of our new products.
In 2009 we had additional rent expense associated with the net opening of two restaurants over the last twelve months and the eight new restaurants that opened towards the end of 2008. During the year, we negotiated more favorable lease terms with many of our landlords. These lease modifications will result in lower future rent expense compared to the prior terms.
Manufacturing and Commissary Operations
| 52 weeks ended | ||||||||||||||||||||
| (dollars in thousands) | Increase/ (Decrease) |
Percentage of manufacturing and commissary revenues |
||||||||||||||||||
| December 30, 2008 |
December 29, 2009 |
2009 vs. 2008 |
December 30, 2008 |
December 29, 2009 |
||||||||||||||||
| Manufacturing and commissary revenues |
$ | 30,369 | $ | 30,638 | 0.9 | % | ||||||||||||||
| Percent of total revenues |
7.3 | % | 7.5 | % | ||||||||||||||||
| Manufacturing and commissary costs |
$ | 28,566 | $ | 26,573 | (7.0 | %) | 94.1 | % | 86.7 | % | ||||||||||
| Total manufacturing and commissary gross profit |
$ | 1,803 | $ | 4,065 | 125.5 | % | 5.9 | % | 13.3 | % | ||||||||||
Manufacturing and commissary revenues for 2009 were relatively flat compared to 2008. Manufacturing and commissary costs decreased substantially in 2009 as a result of substantial productivity improvements in 2009 at our bagel manufacturing facility. In addition, we experienced lower prices of our raw ingredient costs as a result of the decrease of most of our commodity-based food costs.
Franchise and License Operations
| 52 weeks ended | ||||||||||||
| (dollars in thousands) | Increase/ (Decrease) |
|||||||||||
| December 30, 2008 |
December 29, 2009 |
2009 vs. 2008 |
||||||||||
| Franchise and license related revenues |
$ | 6,417 | $ | 7,512 | 17.1 | % | ||||||
| Percent of total revenues |
1.6 | % | 1.8 | % | ||||||||
| Franchise and license gross margin |
100.0 | % | 100.0 | % | ||||||||
| Number of franchise and license restaurants |
223 | 255 | ||||||||||
Overall, franchise and license revenue improvement was driven by strong royalty streams resulting from the net opening of 26 license locations and six franchise locations over the last twelve months. Comparable store sales for the franchisees and licensees of the Manhattan Bagel and Einstein Bros. brands increased 1.1% in 2009.
During 2009 we revised a development agreement with one of our franchisees to modify the number of franchise restaurants to be built under the development agreement from 21 to four.
37
Table of Contents
Corporate Support
| 52 weeks ended | ||||||||||||||||||||
| (dollars in thousands) | Increase/ (Decrease) |
Percentage of total revenues |
||||||||||||||||||
| December 30, 2008 |
December 29, 2009 |
2009 vs. 2008 |
December 30, 2008 |
December 29, 2009 |
||||||||||||||||
| (As Restated) | (As Restated) | (As Restated) | (As Restated) | |||||||||||||||||
| General and administrative expenses |
$ | 36,356 | $ | 35,463 | (2.5 | %) | 8.8 | % | 8.7 | % | ||||||||||
| California wage and hour settlements |
1,900 | — | (100.0 | %) | 0.5 | % | 0.0 | % | ||||||||||||
| Senior management transition costs |
1,335 | — | (100.0 | %) | 0.3 | % | 0.0 | % | ||||||||||||
| Depreciation and amortization |
14,100 | 16,627 | 17.9 | % | 3.4 | % | 4.1 | % | ||||||||||||
| Other operating expenses |
461 | 725 | 57.3 | % | 0.1 | % | 0.2 | % | ||||||||||||
| Total operating expenses |
$ | 54,152 | $ | 52,815 | (2.5 | %) | 13.1 | % | 12.9 | % | ||||||||||
| Interest expense, net |
5,439 | 6,114 | 12.4 | % | 1.3 | % | 1.5 | % | ||||||||||||
| Provision (benefit) for income tax |
2,468 | (71,560 | ) | * | * | 0.6 | % | (17.5 | %) | |||||||||||
| ** | not meaningful |
Our general and administrative expenses decreased $0.9 million in 2009 compared to 2008 as a result of our cost reduction initiatives that were put into place throughout the year.
In 2008, we recorded $1.9 million in operating expenses to satisfy two California wage and hour settlements. These were fully paid in the second quarter of 2009. Late in 2008 we also experienced turnover at the senior management level, and hired our new CEO, which resulted in $0.9 million in severance charges and $0.4 million in recruiting and other costs.
Depreciation and amortization expenses increased 17.9% in 2009 compared to 2008 due to the additional assets invested in the company-owned restaurants that were added or upgraded in late 2008 and in 2009.
Interest expense, net increased in 2009 primarily due to the additional redemption amounts on our Series Z included in interest expense for the period of July 1 through December 29, 2009, partially offset by lower interest rates on our credit facility, inclusive of our interest rate swap.
We recorded current income tax expense of $1.1 million and $0.2 million in 2008 and 2009, respectively. Utilization of our net operating loss carryforwards reduced our federal and state income tax liability incurred in 2008 and 2009. Additionally, we completed several studies related to the timing and deductibility of property and equipment costs. The new estimates of the timing and deductibility of our property and equipment costs have reduced the expected current expense and the related liability for 2009.
The components of our income tax provision are as follows:
| December 30, 2008 |
December 29, 2009 |
|||||||
| (As Restated) | (As Restated) | |||||||
| (in thousands) | ||||||||
| Current |
||||||||
| Total current income tax provision |
$ | 1,100 | $ | 198 | ||||
| Deferred |
||||||||
| Total deferred income tax provision |
8,388 | 7,563 | ||||||
| Change in valuation allowance |
(7,020 | ) | (79,321 | ) | ||||
| Total deferred income tax provision (benefit) |
1,368 | (71,758 | ) | |||||
| Total income tax provision (benefit) |
$ | 2,468 | $ | (71,560 | ) | |||
38
Table of Contents
In 2009, we had recorded a net deferred tax benefit of $71.8 million, as restated, comprised of a $79.3 million reversal of substantially all of our valuation allowance, as restated, partially offset by deferred tax expense of $7.6 million. In the third quarter of 2009, we reduced our $84.3 million valuation allowance by $79.3 million, as restated, to $4.9 million after concluding the likelihood for realization of the benefits of our deferred tax assets is more likely than not.
Contractual Obligations
The following table summarizes the amounts of payments due under specified contractual obligations as of December 28, 2010:
| Payments Due by Fiscal Period | ||||||||||||||||||||
| 2011 | 2012 to 2013 | 2014 to 2015 | 2016 and thereafter |
Total | ||||||||||||||||
| (in thousands of dollars) | ||||||||||||||||||||
| Accounts payable and accrued expenses |
$ | 27,916 | $ | — | $ | — | $ | — | $ | 27,916 | ||||||||||
| Debt |
7,500 | 16,875 | 63,325 | — | 87,700 | |||||||||||||||
| Estimated interest expense on our credit facility (a) |
3,076 | 5,291 | 3,248 | — | 11,615 | |||||||||||||||
| Minimum lease payments under capital leases |
19 | 14 | — | — | 33 | |||||||||||||||
| Minimum lease payments under operating leases (b) |
30,485 | 43,588 | 29,928 | 21,096 | 125,097 | |||||||||||||||
| Purchase obligations (c) |
11,170 | 236 | — | — | 11,406 | |||||||||||||||
| Other long-term obligations (d) |
— | 1,336 | 1,194 | 3,929 | 6,459 | |||||||||||||||
| Total |
$ | 80,166 | $ | 67,340 | $ | 97,695 | $ | 25,025 | $ | 270,226 | ||||||||||
| (a) | Calculated as of December 28, 2010, using the fixed rate from the debt associated with the interest rate swap, and the variable LIBOR and U.S. Prime rates, plus the applicable margin in effect for the remainder. Because the interest rates on the first lien term loan facility and the revolving credit facility are variable, actual payments could differ materially. |
| (b) | Amounts represent cash payments and do not include potential renewal options. |
| (c) | Purchase obligations consist of non-cancelable minimum purchases of frozen dough and certain other raw ingredients that are used in our products. |
| (d) | Other long-term obligations primarily consist of the remaining liability related to minimum future purchase commitments with a supplier that advanced us $10.0 million in 1996. |
Financial Condition, Liquidity and Capital Resources
The restaurant industry is predominantly a cash business where cash is received at the time of the transaction. Our inventory turns frequently and our investment in inventory is minimal. Our accounts payable are on terms that we believe are consistent with those of other companies within the industry.
The primary driver of our operating cash flow is our restaurant operations, specifically the gross margin from our company-owned restaurants. Therefore, we focus on the elements of those operations including comparable store sales and cash flows to ensure a steady stream of operating profits that enable us to meet our cash obligations.
Excluding tenant improvement allowances that we typically receive from the landlord, the average cost of a new restaurant was approximately $0.5 million in 2010, depending on square footage, layout and location. The cost includes equipment, leasehold improvements, furniture and fixtures, and other related capital. This average cost does not include any pre-opening expenses or capitalized internal development costs. Starting in 2010, we reduced the size of our new restaurants and we renegotiated other costs that resulted in a $30,000 decrease in the average cost of each restaurant. We anticipate that our tenant improvement allowances will average
39
Table of Contents
approximately $50,000 per restaurant which also reduces the cash cost of our restaurants. However, the amount of the allowance can vary widely depending on the location of the restaurant and other terms of the lease. In 2011, we are planning to deploy our capital into specific areas of the business such as adding drive-thru lanes to restaurants, adding new exterior signage, the continued roll-out of our new coffee program and continuing with our kitchen display ordering system (“KDS”) installations. In 2010, we continued to roll out KDS and it is now in 82% of our company-owned restaurants. We believe that this system improves production accuracy compared to the paper tickets process and helps to reduce waste.
We anticipate that the majority of our capital expenditures for 2011 will be focused on the addition of 10 to 14 new company-owned restaurants and the relocation of an additional 10 to 14 restaurants.
The following is information on our restaurant economics as of December 28, 2010 and represents the average company-owned restaurant that has been open longer than one year:
| Unit Economics |
||||
| December 28, 2010 |
||||
| (dollars in thousands) | ||||
| A) Last 12 months average restaurant sales (1) |
$ | 869 | ||
| B) Restaurant operating profit (1) |
$ | 165 | ||
| C) Margin (1) (B/A) |
19 | % | ||
| D) Cash investment cost (2) |
$ | 460 | ||
| E) Cash on cash return (B/D) |
36 | % | ||
| F) Restaurant-level earnings before interest, taxes, depreciation, amortization and rent (3) |
$ | 237 | ||
| G) Fully capitalized investment (4) |
$ | 1,036 | ||
| H) Fully capitalized cash on cash return (F/G) |
23 | % | ||
| (1) | Only includes restaurants open greater than one year. |
| (2) | Amount excludes pre-opening expenses. |
| (3) | Restaurant operating profit $165 thousand plus 2010 average restaurant rent expense of $72 thousand per year. |
| (4) | Average rent expense capitalized at 8 times plus cash investment cost of $460 thousand. |
| Cash Flow Through On A Per Store Basis 52 weeks ended December 28, 2010 |
||||||||||||
| Company-Owned | Licensed | Franchised | ||||||||||
| (dollars in thousands) | ||||||||||||
| Average unit volume |
$ | 869 | $ | 489 | $ | 988 | ||||||
| Contribution margin % (1) (2) |
19.0 | % | 6.7 | % | 5.0 | % | ||||||
| Contribution margin |
$ | 165 | $ | 32 | $ | 50 | ||||||
| Cash investment |
$ | 460 | $ | — | $ | — | ||||||
| Upfront fee |
$ | — | $ | 12.5 | $ | 35 | ||||||
| (1) | Reflects contribution margin for company-owned restaurants open for greater than one year and weighted average royalty rate of system for license and franchise. |
| (2) | Franchisees also contribute 4.0% of sales for marketing activities which equates to an average of $40 thousand per location. |
Mandatorily redeemable Series Z Preferred Stock (“Series Z”)
On May 28, 2009, the Company and the Halpern Denny Fund III, L.P. (“Halpern Denny”) agreed that the Company would redeem Halpern Denny’s remaining shares of Series Z in accordance with a designated schedule
40
Table of Contents
with the final payment occurring June 30, 2010. The first payment was made on June 30, 2009. All subsequent redemption payments included an additional redemption price per share based on a rate that was 250 bps higher than the highest rate paid on the Company’s funded indebtedness, as provided in the Certificate of Designations for the Series Z.
As of December 29, 2009, the Company had redeemed $24.8 million of Series Z and incurred $0.2 million of additional redemption expense. As of December 29, 2009, $1.3 million of additional redemption was included in accrued expenses and other liabilities on the balance sheet and included within interest expense on the statements of operations. The fair value of the Series Z was estimated to be $31.0 million as of December 29, 2009.
On March 17, 2010, the Company and Halpern Denny amended their previous agreement dated May 28, 2009 to extend the redemption date to June 30, 2011, and allow the Company to redeem any amount of Series Z at any time through that date. In addition, beginning July 1, 2010, Halpern Denny received a one year option to exchange up to $7.0 million of the outstanding Series Z and accrued additional redemption amounts for shares of freely tradable common stock at a price of $11.50 per share. All additional redemption amounts that accrue after June 30, 2010 would be waived with respect to the shares of Series Z exchanged, if any. To the extent that Halpern Denny’s exchange option remained unexercised, the Company had the right to redeem the shares subject to the exchange option after the Company redeemed the shares of the Series Z that were not subject to the exchange option.
The Company recorded this agreement on its balance sheet at fair value during the first quarter of 2010. The fair value was recorded at a premium with a non-cash charge to our net income of $0.9 million.
On October 25, 2010, the Company redeemed an additional 3,240 shares of Series Z for $3.6 million, including accrued additional redemption amounts. Halpern Denny did not exercise its exchange option and pursuant to the terms of the agreement, the exchange option expired. After this redemption, 3,240 shares of Series Z remained outstanding. On December 20, 2010, the Company redeemed all remaining outstanding shares of the Company’s Series Z preferred stock for $3.6 million in cash.
During fiscal year 2010, the Company redeemed $32.2 million of Series Z shares and accrued additional redemption amounts of approximately $2.6 million.
New senior credit facility
In December 2010, we entered into a new senior $125 million credit facility with Bank of America, N.A., as administrative agent (the “Administrative Agent”) and other lenders party thereto (the “New Credit Facility”).
Our New Credit Facility consists of a:
| • | $50.0 million revolving credit facility maturing on December 20, 2015 (“revolver”); and |
| • | $75.0 million first lien term loan maturing December 20, 2015. |
A portion of the revolver remains available, subject to certain conditions, to finance our ongoing working capital, capital expenditure and general corporate needs. In addition, all of the revolver is available for letters of credit, which reduce the availability on the line. As of December 28, 2010, our availability under the revolver was $30.0 million.
We may prepay amounts outstanding under the credit facility and may terminate commitments in whole at any time without penalty or premium upon prior written notice.
Working Capital
Our working capital position improved by $30.9 million in 2010. We began 2010 with a deficit of $25.3 million and we ended 2010 with a working capital surplus of $5.6 million.
41
Table of Contents
Our working capital position improved in 2010 due primarily to the generation of $28.0 million in free cash flow, or net cash provided by operating activities less net cash used in investing activities, and the redemption payment of $32.2 million relating to the Series Z. We began 2010 with $9.9 million of unrestricted cash. We generated $43.8 million in cash from operating activities and received $1.0 million from the exercise of stock options. We used a portion of this aggregate $54.7 million in cash to invest $16.6 million in property and equipment, and to redeem $32.2 million of our Series Z and $2.6 million of accrued additional redemption. As of December 28, 2010, we had unrestricted cash of $11.8 million, representing an increase in unrestricted cash of $1.9 million during 2010. In addition to changes in unrestricted cash, and redemption payments on our Series Z, other elements of working capital fluctuated in the normal course of business.
Our working capital position improved by $25.9 million in 2009. We began 2009 with a deficit of $51.2 million and we ended 2009 with a deficit of $25.3 million.
Our working capital deficit position improved in 2009 by $25.9 million due primarily to the generation of $16.8 million in free cash flow, or net cash provided by operating activities less net cash used in investing activities, and the recognition of $9.6 million in current deferred tax assets. We began 2009 with $24.2 million of unrestricted cash and generated $33.7 million in cash from operating activities and received $1.8 million from the exercise of stock options. We used a portion of this aggregate $59.7 million in cash to invest $16.9 million in property and equipment, to redeem $24.8 million of our Series Z, to repay $8.1 million of debt and to pay $3.2 million for the two California wage and hour settlements and the payment of senior management transition costs. As of December 29, 2009, we had unrestricted cash of $9.9 million, representing a decline in unrestricted cash of $14.3 million during 2009. In addition to changes in unrestricted cash, current deferred tax assets, current maturities of our Series Z and our debt, and the payment of $3.2 million of certain accrued liabilities, other elements of working capital fluctuated in the normal course of business.
Based upon our projections for 2011, we believe our various sources of capital, including availability under our existing credit facility, and cash flow from operating activities of continuing operations, are adequate to finance operations and capital expenditures as well as to satisfy the repayment of current debt obligations.
| 52 weeks ended | ||||||||
| December 29, 2009 |
December 28, 2010 |
|||||||
| (dollars in thousands) | ||||||||
| Net cash provided by operating activities |
$ | 33,700 | $ | 43,769 | ||||
| Net cash used in investing activities |
(16,896 | ) | (15,737 | ) | ||||
| Free cash flow |
16,804 | 28,032 | ||||||
| Net cash used in financing activities |
(31,135 | ) | (26,149 | ) | ||||
| Net (decrease) increase in cash and cash equivalents |
(14,331 | ) | 1,883 | |||||
| Cash and cash equivalents, beginning of period |
24,216 | 9,885 | ||||||
| Cash and cash equivalents, end of period |
$ | 9,885 | $ | 11,768 | ||||
Net Cash Provided by Operating Activities
Our company-owned restaurant sales and franchise and license related revenue increased overall in 2010 compared to 2009. Our interest expense declined primarily due to lower additional redemption on our Series Z as a result of the impact of the significant Series Z redemptions we have made since 2009 as well as the expiration of our interest rate swap in August of 2010. Net cash generated by operating activities was $43.8 million for 2010 compared to $33.7 million for 2009, a 29.9% increase.
42
Table of Contents
Cash Used in Investing Activities
During 2010, we used approximately $16.6 million of cash to purchase additional property and equipment as follows and we also received $0.9 million in proceeds from the sale of one company-owned restaurant to a franchisee and sales of equipment:
| • | $7.8 million to open new restaurants and upgrade existing restaurants in 2009 and 2010; |
| • | $6.7 million for replacement of equipment at our existing company-owned restaurants and at our manufacturing operations; and |
| • | $2.1 million for general corporate purposes. |
During 2009, we used approximately $16.9 million of cash to purchase additional property and equipment as follows:
| • | $9.5 million to open new restaurants and upgrade existing restaurants in 2008 and 2009; |
| • | $5.9 million for replacement of equipment at our existing company-owned restaurants and at our manufacturing operations; and |
| • | $1.5 million for general corporate purposes. |
Cash Used in Financing Activities
During 2010, we made payments on our June 2007 credit facility totaling $79.8 million on the term loan and $11.0 million on the line of credit. We also redeemed $32.2 million of our Series Z.
In connection with our New Credit Facility, we had borrowings of $75.0 million on the term loan, received $12.7 million in proceeds from the line of credit and incurred $2.3 million in debt issuance costs which were capitalized. We received $1.0 million in proceeds from stock option exercises primarily from former employees.
During 2009, we made payments on our debt totaling $8.1 million and redeemed $24.8 million of our Series Z. We received $1.8 million in proceeds from stock option exercises primarily from former employees.
Off-Balance Sheet Arrangements
Guarantees
Prior to 2001, we would occasionally guarantee leases for the benefit of certain of our franchisees. None of the guarantees have been modified since their inception and we have since discontinued this practice. Current franchisees are the primary lessees under the vast majority of these leases. Under the lease guarantees, we may be required by the lessor to make all of the remaining monthly rental payments or property tax and common area maintenance payments if the franchisee does not make the required payments in a timely manner. However, we believe that most, if not all, of the franchised restaurants could be subleased to third parties, reducing our potential exposure. Additionally, we have indemnification agreements with our franchisees under which the franchisees would be obligated to reimburse us for any amounts paid under such guarantees. Historically, we have not been required to make such payments in significant amounts. As of December 28, 2010, we do not have a liability recorded for our exposure, following a probability related approach. Minimum future rental payments for all remaining guaranteed leases that expire on various dates through July 2012 were approximately $0.2 million as of December 28, 2010. We believe the ultimate disposition of these matters will not have a material adverse effect on our financial position or results of operations.
Letters of Credit
We have $7.3 million in letters of credit outstanding under our New Credit Facility with Bank of America. The letters of credit expire on various dates during 2011, are generally automatically renewable for one additional year and are payable upon demand in the event that we fail to pay the underlying obligation.
43
Table of Contents
Economic Environment and Commodity Volatility
Economic Environment
Our results depend on discretionary consumer spending, which is influenced by consumer confidence and disposable income. In particular, the effects of changing energy and food costs, and increasing interest rates, among other things, may impact discretionary consumer spending in restaurants. Accordingly, we believe we experience declines in comparable store sales during economic downturns or during periods of economic uncertainty. Any material decline in the amount of discretionary spending could have a material adverse effect on our sales and income.
We have experienced only a modest impact from inflation. However, the impact of inflation on labor, food and occupancy costs could, in the future, affect our operations. We pay many of our associates based on hourly rates slightly above the applicable minimum federal, state or municipal “living wage” rates. Recent changes in minimum wage laws may create pressure to increase the pay scale for our associates, which would increase our labor costs. Costs for construction, taxes, repairs, maintenance and insurance all impact our occupancy costs. We believe our current strategy, which is to seek to maintain operating margins through a combination of menu price increases, cost controls, efficient purchasing practices and careful evaluation of property and equipment needs, has been an effective tool for dealing with inflation.
Impact of Agricultural Commodities
Our cost of sales consist of cost of goods sold, which is made up of food and product costs, compensation costs and other operating costs. Wheat, butter and cheese are our primary agricultural commodities and in addition, coffee, chicken and turkey are the other major agricultural commodities which are included in our cost of goods sold. For the last few years, cost increases in one or more of our agricultural commodities were generally modest in relation to our total cost of sales.
Recent Accounting Pronouncements
In January 2010, the Financial Accounting Standards Board (“FASB”) issued Accounting Standards Update (“ASU”) No. 2010-06, Fair Value Measurements and Disclosures (Topic 820): Improving Disclosures about Fair Value Measurements. ASU 2010-06 revises two disclosure requirements concerning fair value measurements and clarifies two others. It requires separate presentation of significant transfers into and out of Levels 1 and 2 of the fair value hierarchy and disclosure of the reasons for such transfers. It will also require the presentation of purchases, sales, issuances and settlements within Level 3 on a gross basis rather than a net basis. The amendments also clarify that disclosures should be disaggregated by class of asset or liability and that disclosures about inputs and valuation techniques should be provided for both recurring and non-recurring fair value measurements. The Company’s disclosures about fair value measurements, including the new disclosures which were applicable to the Company beginning in 2010, are presented in Note 2 and Note 9. The disclosures concerning gross presentation of Level 3 activity are effective for fiscal years beginning after December 15, 2010 and the Company does not anticipate an impact on its consolidated financial statements.
Critical Accounting Estimates
The discussion and analysis of our financial condition and results of operations are based upon our consolidated financial statements, which have been prepared in accordance with accounting principles generally accepted in the United States of America (“GAAP”). The preparation of these consolidated financial statements requires us to make estimates and judgments that affect the reported amounts of assets, liabilities, revenues and expenses. On an on-going basis, we evaluate our estimates based on historical experience and on various other assumptions that are believed to be reasonable under the circumstances, the results of which form the basis for making judgments about the carrying value of assets and liabilities that are not readily apparent from other sources. Actual results may differ from these estimates under different assumptions or conditions. Additionally, any estimates for contingent liabilities that arise as result of any legal proceedings are discussed in Item 3 of this report.
44
Table of Contents
Our significant accounting policies are discussed in Note 2 to our consolidated financial statements set forth in Item 8 of this report.
Income Taxes
We recognize deferred tax assets and liabilities based on the differences between the financial statement carrying amounts and the respective tax bases of our assets and liabilities. Deferred tax assets and liabilities are measured using current enacted tax rates expected to apply to taxable income in the years in which we expect the temporary differences to reverse. We routinely evaluate the likelihood of realizing the benefit of our deferred tax assets and may record a valuation allowance if, based on all available evidence, we determine that some portion of the tax benefit will not be realized.
In addition, our income tax returns are periodically audited by federal and state tax authorities. These audits include questions regarding our tax filing positions, including the timing and amount of deductions taken and the allocation of income among various tax jurisdictions. We evaluate our exposures associated with our various tax filing positions and record a related liability. We adjust our liability for unrecognized tax benefits and income tax provision in the period in which an uncertain tax position is effectively settled, the statute of limitations expires for the relevant taxing authority to examine the tax position, or when more information becomes available.
Deferred tax asset valuation allowances and our liability for unrecognized tax benefits require significant management judgment regarding applicable statutes and their related interpretation, the status of various income tax audits, and our particular facts and circumstances. We believe that our estimates are reasonable; however, actual results could differ from these estimates.
Impairment of Long-Lived Assets
We review property and equipment and amortizing intangible assets for impairment when events or circumstances indicate that the carrying amount of a restaurant’s assets may not be recoverable. We test for impairment using historical cash flows and other relevant facts and circumstances as the primary basis for our estimate of future cash flows. Relevant facts and circumstances may include, but are not limited to, local competition in the area, the ability of existing restaurant management, the necessity of tiered pricing structures and the impact that upgrading our restaurants may have on our estimates. Recoverability of a restaurant’s assets is measured by a comparison of the carrying amount of the assets to the estimated undiscounted future cash flows expected to be generated by the restaurant. This process requires the use of estimates and assumptions, which are subject to a high degree of judgment. If the carrying amount of a restaurant’s assets exceeds its estimated undiscounted future cash flows, an impairment charge is recognized as the amount by which the carrying amount of the assets exceeds its fair value. Absent other available information, we use discounted future cash flows as an estimate of fair value. During 2010, we did not record an impairment charge related to our company-owned restaurants. During 2009, we recorded an impairment charge of $0.8 million related to seven of our company-owned restaurants.
At least annually, we assess the recoverability of goodwill and other intangible assets not subject to amortization related to our restaurant concepts. These impairment tests require us to estimate the fair values of our restaurant concepts by making assumptions regarding future profits and cash flows, expected growth rates, terminal values, discount rates and other factors. As of December 28, 2010, the fair value of goodwill and other intangible assets not subject to amortization sufficiently exceeded the carrying values. The assumptions used in the estimate of fair value are generally consistent with the past performance of each reporting unit and other intangible assets and are also consistent with the projections and assumptions that are used in current operating plans. These assumptions are subject to change as a result of changing economic and competitive conditions. In the event that these assumptions change in the future, we may be required to record impairment charges for these assets.
45
Table of Contents
Insurance Liabilities
The Company uses a combination of insurance and self-insurance mechanisms to provide for the potential liabilities for workers’ compensation, general liability and healthcare benefits. The insurance liabilities represent an estimate of the ultimate cost of claims incurred and unpaid as of the balance sheet date. The estimated liabilities are established and are not discounted, with the exception of the workers’ compensation, which is discounted at 10% based upon analysis of historical data and actuarial estimates, and they are reviewed on a quarterly basis to ensure that the liabilities are appropriate. If actual trends, including the severity or frequency of claims differ from our estimates, our financial results could be favorably or unfavorably impacted.
Stock-Based Compensation
We use the Black-Scholes model to estimate the fair value of our option awards. The Black-Scholes model requires estimates of the expected term of the option, as well as future volatility and the risk-free interest rate. Our stock options generally vest over a period of 6 months to 3 years and have contractual terms to exercise of 5 to 10 years. The expected term of options is based upon evaluations of historical and expected future exercise behavior. The risk-free interest rate is based on the U.S. Treasury rates at the date of grant with maturity dates approximately equal to the expected life at the grant date. Implied volatility is based on the mean reverting average of our stock’s historical volatility and that of an industry peer group. The use of mean reversion is supported by evidence of a correlation between stock price volatility and a company’s leverage combined with the effects mandatory principal payments will have on our capital structure, as defined under our new credit facility. We have not historically paid any dividends and were precluded from doing so under our old debt covenants. We anticipate paying dividends in the future.
There is a risk that our estimates of the fair values of our share-based compensation awards on the grant dates may differ from the actual values realized upon the exercise, expiration, early termination or forfeiture of those share-based payments in the future. Certain share-based payments, such as employee stock options, may expire worthless or otherwise result in zero intrinsic value as compared to the fair values originally estimated on the grant date and reported in our financial statements. Alternatively, value may be realized from these instruments that are significantly in excess of the fair values originally estimated on the grant date and reported in our financial statements. Although the fair value of our share-based awards is determined in accordance with GAAP and the Securities and Exchange Commission’s Staff Accounting Bulletin No. 107 using an option-pricing model, the value calculated may not be indicative of the fair value observed in a willing buyer / willing seller market transaction.
Estimates of share-based compensation expenses do have an impact on our financial statements, but these expenses are based on the aforementioned option valuation model and will never result in the payment of cash by us. For this reason, and because we do not view share-based compensation as being related to our operational performance, we exclude estimated share-based compensation expense when evaluating our performance.
Gift Card Breakage
Proceeds from the sale of gift cards are recorded as deferred revenue and recognized as income when redeemed by the holder. While we will continue to honor all gift cards presented for payment, we may determine the likelihood of redemption to be remote for certain gift card balances due to the age of the unredeemed balance. In these circumstances, to the extent we determine there is no requirement for remitting balances to government agencies under unclaimed property laws, gift card balances may be recognized as gift card breakage and recorded as a reduction to deferred revenue and an increase to company-owned restaurant revenues. For 2009 and 2010, we recognized $0.2 million in gift card breakage in each year. The Company also recognized $0.4 million in revenue in 2010 related to gift certificate breakage from a gift certificate program that is no longer in place. While these gift certificates will continue to be honored, the Company has determined the likelihood to be remote for redemption of these gift certificates due to their age and the fact that the program is no longer in place.
46
Table of Contents
| ITEM 7A. | QUANTITATIVE AND QUALITATIVE DISCLOSURES ABOUT MARKET RISK |
During 2009 and 2010, our results of operations, financial position and cash flows have not been materially affected by changes in the relative values of non-U.S. currencies to the U.S. dollar. We do not use derivative financial instruments to limit our foreign currency risk exposure since virtually all of our business is conducted in the United States. Our manufacturing operations sell bagels to a wholesaler and a distributor who take possession in the United States and sell outside of the United States. As the product is shipped FOB domestic dock, and invoiced and paid in U.S. dollars, there are no international risks of loss or foreign exchange currency issues.
Our debt as of December 28, 2010 was composed of the New Credit Facility. For fixed rate debt, interest rate changes affect the fair market value of such debt but do not impact earnings or cash flows. Conversely, for variable rate debt, including borrowings under our New Credit Facility, interest rate changes generally do not affect the fair market value of such debt, but do impact future earnings and cash flows, assuming other factors are held constant.
On May 7, 2008, we entered into an interest rate swap agreement, to fix our rate on $60 million of our debt to 3.52% plus an applicable margin for the next two years, effective August 2008. This agreement expired in August 2010 and was not renewed.
Assuming no change in the size or composition of debt as of December 28, 2010, and presuming the utilization of our accumulated net operating losses would minimize the tax implications for the next several years, a 100 basis point increase in short-term effective interest rates would increase our interest expense on our New Credit Facility by approximately $0.9 million annually. Currently, the interest rates on our New Credit Facility are predominantly at LIBOR rates plus an applicable margin through short-term fixed rate financing. The estimated increase in interest expense incorporates the fixed interest financing into its assumptions.
On an annual basis, we purchase a substantial amount of agricultural products that are subject to fluctuations in price based upon market conditions. Our purchase arrangements may contain contractual features that limit the price paid by establishing certain price floors or caps. We do not use financial instruments to hedge commodity prices. We have utilized a third party advisor to manage our wheat purchases for our company-owned production facility. In addition to wheat, we have established contracts and entered into commitments with our vendors for turkey, butter, cheese and coffee.
This market risk discussion contains forward-looking statements. Actual results may differ materially from this discussion based upon general market conditions and changes in domestic and global financial markets, among other factors.
47
Table of Contents
| ITEM 8. | FINANCIAL STATEMENTS AND SUPPLEMENTARY DATA |
| Page | ||||
| Audited Annual Financial Statements |
||||
| 49 | ||||
| Consolidated Balance Sheets as of December 29, 2009 (As Restated, See Note 3) and December 28, 2010 |
52 | |||
| 53 | ||||
| 54 | ||||
| 55 | ||||
| 56 | ||||
48
Table of Contents
REPORT OF INDEPENDENT REGISTERED PUBLIC ACCOUNTING FIRM
Board of Directors and Stockholders
Einstein Noah Restaurant Group, Inc.
We have audited the accompanying consolidated balance sheets of Einstein Noah Restaurant Group, Inc. and subsidiaries (collectively, “Einstein Noah”) (a Delaware corporation) as of December 28, 2010 and December 29, 2009, and the related consolidated statements of operations, stockholders’(deficit) equity, and cash flows for each of the three years in the period ended December 28, 2010. Our audits of the basic financial statements include the financial statement schedule listing in the index appearing under Item 15(2). These financial statements and financial statement schedule are the responsibility of Einstein Noah’s management. Our responsibility is to express an opinion on these financial statements and financial statement schedule based on our audits.
We conducted our audits in accordance with the standards of the Public Company Accounting Oversight Board (United States). Those standards require that we plan and perform the audit to obtain reasonable assurance about whether the financial statements are free of material misstatement. An audit includes examining, on a test basis, evidence supporting the amounts and disclosures in the financial statements. An audit also includes assessing the accounting principles used and significant estimates made by management, as well as evaluating the overall financial statement presentation. We believe that our audits provide a reasonable basis for our opinion.
In our opinion, the consolidated financial statements referred to above present fairly, in all material respects, the financial position of Einstein Noah as of December 28, 2010 and December 29, 2009, and the results of their operations and their cash flows for each of the three years in the period ended December 28, 2010 in conformity with accounting principles generally accepted in the United States of America. Also in our opinion, the related financial statement schedule, when considered in relation to the basic consolidated financial statements taken as a whole, presents fairly, in all material respects, the information set forth therein.
As discussed in Note 3 to the consolidated financial statements, the Company has restated its consolidated financial statements as of December 29, 2009 and for the years ended December 29, 2009 and December 30, 2008 due to errors in its income taxes.
We also have audited, in accordance with the standards of the Public Company Accounting Oversight Board (United States), Einstein Noah’s internal control over financial reporting as of December 28, 2010, based on criteria established in Internal Control—Integrated Framework issued by the Committee of Sponsoring Organizations of the Treadway Commission (COSO) and our report dated March 15, 2011 expressed an adverse opinion.
/s/ GRANT THORNTON LLP
Denver, Colorado
March 15, 2011
49
Table of Contents
REPORT OF INDEPENDENT REGISTERED PUBLIC ACCOUNTING FIRM
Board of Directors and Stockholders
Einstein Noah Restaurant Group, Inc.
We have audited Einstein Noah Restaurant Group, Inc. and subsidiaries (collectively, “Einstein Noah”) (a Delaware Corporation) internal control over financial reporting as of December 28, 2010, based on criteria established in Internal Control—Integrated Framework issued by the Committee of Sponsoring Organizations of the Treadway Commission (COSO). Einstein Noah’s management is responsible for maintaining effective internal control over financial reporting and for its assessment of the effectiveness of internal control over financial reporting, included in the accompanying Management’s Annual Report on Internal Control Over Financial Reporting. Our responsibility is to express an opinion on Einstein Noah’s internal control over financial reporting based on our audit.
We conducted our audit in accordance with the standards of the Public Company Accounting Oversight Board (United States). Those standards require that we plan and perform the audit to obtain reasonable assurance about whether effective internal control over financial reporting was maintained in all material respects. Our audit included obtaining an understanding of internal control over financial reporting, assessing the risk that a material weakness exists, testing and evaluating the design and operating effectiveness of internal control based on the assessed risk, and performing such other procedures as we considered necessary in the circumstances. We believe that our audit provides a reasonable basis for our opinion.
A company’s internal control over financial reporting is a process designed to provide reasonable assurance regarding the reliability of financial reporting and the preparation of financial statements for external purposes in accordance with generally accepted accounting principles. A company’s internal control over financial reporting includes those policies and procedures that (1) pertain to the maintenance of records that, in reasonable detail, accurately and fairly reflect the transactions and dispositions of the assets of the company; (2) provide reasonable assurance that transactions are recorded as necessary to permit preparation of financial statements in accordance with generally accepted accounting principles, and that receipts and expenditures of the company are being made only in accordance with authorizations of management and directors of the company; and (3) provide reasonable assurance regarding prevention or timely detection of unauthorized acquisition, use, or disposition of the company’s assets that could have a material effect on the financial statements.
Because of its inherent limitations, internal control over financial reporting may not prevent or detect misstatements. Also, projections of any evaluation of effectiveness to future periods are subject to the risk that controls may become inadequate because of changes in conditions, or that the degree of compliance with the policies or procedures may deteriorate.
A material weakness is a deficiency, or combination of control deficiencies, in internal control over financial reporting, such that there is a reasonable possibility that a material misstatement of the company’s annual or interim financial statements will not be prevented or detected on a timely basis.
The following material weakness has been identified and included in management’s assessment.
The Company’s controls related to financial reporting were not effective to ensure that amounts related to certain deferred tax balances and deferred income tax expense were recorded in accordance with U.S. generally accepted accounting principles. Specifically, the Company did not maintain effective controls over the preparation and review of the income tax provision. Control activities related to the income tax provision were not properly designed and operating effectively related to indefinite lived intangible assets when establishing a valuation allowance on deferred tax assets, as well as properly recognizing certain deferred tax assets and liabilities related to state income tax rates, workers compensation, deferred rent and an alternative minimum tax credit carryover. As a result, there was a material error in the aforementioned tax accounts in the preliminary consolidated financial statements that was corrected prior to issuance of the Company’s consolidated financial statements.
50
Table of Contents
In our opinion, because of the effect of the material weakness described above on the achievement of the objectives of the control criteria, Einstein Noah has not maintained effective internal control over financial reporting as of December 28, 2010, based on criteria established in Internal Control—Integrated Framework issued by COSO.
We also have audited, in accordance with the standards of the Public Company Accounting Oversight Board (United States), the consolidated balance sheets of Einstein Noah as of December 28, 2010 and December 29, 2009, and the related consolidated statements of operations, stockholders’(deficit) equity, and cash flows for each of the three years in the period ended December 28, 2010. The material weakness identified above was considered in determining the nature, timing, and extent of audit tests applied in our audit of the 2010 financial statements, and this report does not affect our report dated March 15, 2011, which expressed an unqualified opinion on those financial statements.
/s/ GRANT THORNTON LLP
Denver, Colorado
March 15, 2011
51
Table of Contents
EINSTEIN NOAH RESTAURANT GROUP, INC.
CONSOLIDATED BALANCE SHEETS
(in thousands, except share information)
| December 29, 2009 |
December 28, 2010 |
|||||||
| (As Restated, See Note 3) |
||||||||
| ASSETS |
||||||||
| Current assets: |
||||||||
| Cash and cash equivalents |
$ | 9,885 | $ | 11,768 | ||||
| Restricted cash |
508 | 709 | ||||||
| Accounts receivable |
5,629 | 5,841 | ||||||
| Inventories |
5,513 | 5,585 | ||||||
| Current deferred income tax assets, net |
9,682 | 11,149 | ||||||
| Prepaid expenses |
5,682 | 5,955 | ||||||
| Other current assets |
73 | 72 | ||||||
| Total current assets |
36,972 | 41,079 | ||||||
| Property, plant and equipment, net |
58,682 | 56,663 | ||||||
| Trademarks and other intangibles, net |
63,831 | 63,831 | ||||||
| Goodwill |
4,981 | 4,981 | ||||||
| Long-term deferred income tax assets, net |
45,745 | 34,554 | ||||||
| Debt issuance costs and other assets, net |
3,047 | 3,959 | ||||||
| Total assets |
$ | 213,258 | $ | 205,067 | ||||
| LIABILITIES AND STOCKHOLDERS’ EQUITY |
||||||||
| Current liabilities: |
||||||||
| Accounts payable |
$ | 4,147 | $ | 7,445 | ||||
| Accrued expenses and other current liabilities |
20,633 | 20,471 | ||||||
| Current portion of long-term debt |
5,234 | 7,500 | ||||||
| Current portion of obligations under capital leases |
22 | 17 | ||||||
| Mandatorily redeemable, Series Z Preferred Stock, $.001 par value, $1,000 per share liquidation value; 57,000 shares authorized; 32,194 and 0 shares outstanding |
32,194 | — | ||||||
| Total current liabilities |
62,230 | 35,433 | ||||||
| Long-term debt |
74,553 | 80,200 | ||||||
| Long-term obligations under capital leases |
19 | 13 | ||||||
| Other liabilities |
12,133 | 12,035 | ||||||
| Total liabilities |
148,935 | 127,681 | ||||||
| Commitments and contingencies (Note 17) |
||||||||
| Stockholders’ equity: |
||||||||
| Series A junior participating preferred stock, 700,000 shares authorized; no shares issued and outstanding |
— | — | ||||||
| Common stock, $.001 par value; 25,000,000 shares authorized; 16,461,123 and 16,655,474 shares issued and outstanding |
16 | 17 | ||||||
| Additional paid-in capital |
266,928 | 270,171 | ||||||
| Accumulated other comprehensive loss, net of income tax |
(1,277 | ) | — | |||||
| Accumulated deficit |
(201,344 | ) | (192,802 | ) | ||||
| Total stockholders’ equity |
64,323 | 77,386 | ||||||
| Total liabilities and stockholders’ equity |
$ | 213,258 | $ | 205,067 | ||||
The accompanying notes are an integral part of these consolidated financial statements.
52
Table of Contents
EINSTEIN NOAH RESTAURANT GROUP, INC.
CONSOLIDATED STATEMENTS OF OPERATIONS
(in thousands, except earnings per share and related share information)
| 52 weeks ended | ||||||||||||
| December 30, 2008 |
December 29, 2009 |
December 28, 2010 |
||||||||||
| (As Restated, See Note 3) |
(As Restated, See Note 3) |
|||||||||||
| Revenues: |
||||||||||||
| Company-owned restaurant sales |
$ | 376,664 | $ | 370,412 | $ | 372,191 | ||||||
| Manufacturing and commissary revenues |
30,369 | 30,638 | 30,405 | |||||||||
| Franchise and license related revenues |
6,417 | 7,512 | 9,115 | |||||||||
| Total revenues |
413,450 | 408,562 | 411,711 | |||||||||
| Cost of sales (exclusive of depreciation and amortization shown separately below): |
||||||||||||
| Company-owned restaurant costs |
||||||||||||
| Cost of goods sold |
112,675 | 108,052 | 106,035 | |||||||||
| Labor costs |
112,007 | 113,665 | 109,005 | |||||||||
| Rent and related expenses |
38,389 | 40,517 | 39,731 | |||||||||
| Other operating costs |
37,781 | 37,426 | 37,732 | |||||||||
| Marketing costs |
2,264 | 4,597 | 9,854 | |||||||||
| Total company-owned restaurant costs |
303,116 | 304,257 | 302,357 | |||||||||
| Manufacturing and commissary costs |
28,566 | 26,573 | 25,566 | |||||||||
| General and administrative expenses |
36,356 | 35,463 | 38,502 | |||||||||
| California wage and hour settlements |
1,900 | — | — | |||||||||
| Senior management transition costs |
1,335 | — | — | |||||||||
| Depreciation and amortization |
14,100 | 16,627 | 17,769 | |||||||||
| Restructuring expenses |
— | — | 477 | |||||||||
| Other operating expenses (income) |
461 | 725 | (531 | ) | ||||||||
| Total costs and expenses |
385,834 | 383,645 | 384,140 | |||||||||
| Income from operations |
27,616 | 24,917 | 27,571 | |||||||||
| Other expense: |
||||||||||||
| Interest expense, net |
5,439 | 6,114 | 5,135 | |||||||||
| Adjustment for Series Z modification |
— | — | 929 | |||||||||
| Write-off of debt issuance costs upon redemption of term loan |
— | — | 966 | |||||||||
| Income before income taxes |
22,177 | 18,803 | 20,541 | |||||||||
| Provision (benefit) for income tax |
2,468 | (71,560 | ) | 9,918 | ||||||||
| Net income |
$ | 19,709 | $ | 90,363 | $ | 10,623 | ||||||
| Less: Additional redemption on temporary equity |
— | — | (387 | ) | ||||||||
| Add: Accretion of premium on Series Z preferred stock |
— | — | 1,072 | |||||||||
| Net income available to common stockholders |
$ | 19,709 | $ | 90,363 | $ | 11,308 | ||||||
| Net income available to common stockholders per share—Basic |
$ | 1.24 | $ | 5.59 | $ | 0.68 | ||||||
| Net income available to common stockholders per share—Diluted |
$ | 1.20 | $ | 5.47 | $ | 0.67 | ||||||
| Cash dividend declared per common share |
$ | — | $ | — | $ | 0.125 | ||||||
| Weighted average number of common shares outstanding: |
||||||||||||
| Basic |
15,934,796 | 16,175,391 | 16,532,420 | |||||||||
| Diluted |
16,378,965 | 16,526,869 | 16,804,726 | |||||||||
The accompanying notes are an integral part of these consolidated financial statements.
53
Table of Contents
EINSTEIN NOAH RESTAURANT GROUP, INC.
CONSOLIDATED STATEMENT OF CHANGES IN STOCKHOLDERS' (DEFICIT) EQUITY
(in thousands, except share information)
| Common Stock | Additional Paid In Capital |
Accumulated Other Comprehensive Loss |
Accumulated Deficit |
Total | ||||||||||||||||||||
| Shares | Amount | |||||||||||||||||||||||
| Balance, January 1, 2008, as previously reported |
15,878,811 | $ | 16 | $ | 262,830 | $ | — | $ | (296,453 | ) | $ | (33,607 | ) | |||||||||||
| Aggregate impact of restatement adjustments (Note 3) |
— | — | — | — | (14,963 | ) | (14,963 | ) | ||||||||||||||||
| Balance, January 1, 2008 (as Restated, see Note 3) |
15,878,811 | $ | 16 | $ | 262,830 | $ | — | $ | (311,416 | ) | $ | (48,570 | ) | |||||||||||
| Net income (as Restated, see Note 3) |
— | — | — | — | 19,709 | 19,709 | ||||||||||||||||||
| Common stock issued upon stock option exercise |
97,526 | — | 404 | — | — | 404 | ||||||||||||||||||
| Restricted stock forfeited |
(7,334 | ) | — | — | — | — | — | |||||||||||||||||
| Common stock issued upon stock appreciation right exercise |
164 | — | — | — | — | — | ||||||||||||||||||
| Stock based compensation expense |
— | — | 945 | — | — | 945 | ||||||||||||||||||
| Unrealized loss on derivative securities, net of income tax |
— | — | — | (2,470 | ) | — | (2,470 | ) | ||||||||||||||||
| Balance, December 30, 2008 (as Restated, see Note 3) |
15,969,167 | $ | 16 | $ | 264,179 | $ | (2,470 | ) | $ | (291,707 | ) | $ | (29,982 | ) | ||||||||||
| Net income (as Restated, see Note 3) |
— | — | — | — | 90,363 | 90,363 | ||||||||||||||||||
| Common stock issued upon restricted stock awards |
63,776 | — | — | — | — | — | ||||||||||||||||||
| Common stock issued upon stock option exercise |
427,777 | — | 1,808 | — | — | 1,808 | ||||||||||||||||||
| Common stock issued upon stock appreciation right exercise |
403 | — | — | — | — | — | ||||||||||||||||||
| Stock based compensation expense |
— | — | 941 | — | — | 941 | ||||||||||||||||||
| Net change in unrealized loss on derivative securities, net of income tax |
— | — | — | 1,193 | — | 1,193 | ||||||||||||||||||
| Balance, December 29, 2009 (as Restated, see Note 3) |
16,461,123 | $ | 16 | $ | 266,928 | $ | (1,277 | ) | $ | (201,344 | ) | $ | 64,323 | |||||||||||
| Net income |
— | — | — | — | 10,623 | 10,623 | ||||||||||||||||||
| Common stock issued upon stock option exercise |
193,163 | 1 | 1,026 | — | — | 1,027 | ||||||||||||||||||
| Common stock issued upon stock appreciation right exercise |
1,188 | — | — | — | — | — | ||||||||||||||||||
| Stock based compensation expense |
— | — | 1,532 | — | — | 1,532 | ||||||||||||||||||
| Additional redemption on temporary equity |
— | — | (387 | ) | — | — | (387 | ) | ||||||||||||||||
| Accretion of premium on Series Z Preferred Stock |
— | — | 1,072 | — | — | 1,072 | ||||||||||||||||||
| Dividend declared |
— | — | — | — | (2,081 | ) | (2,081 | ) | ||||||||||||||||
| Net change in unrealized loss on derivative securities, net of income tax |
— | — | — | 1,277 | — | 1,277 | ||||||||||||||||||
| Balance, December 28, 2010 |
16,655,474 | $ | 17 | $ | 270,171 | $ | — | $ | (192,802 | ) | $ | 77,386 | ||||||||||||
The accompanying notes are an integral part of these consolidated financial statements.
54
Table of Contents
EINSTEIN NOAH RESTAURANT GROUP, INC.
CONSOLIDATED STATEMENTS OF CASH FLOWS
(in thousands)
| 52 weeks ended | ||||||||||||
| December 30, 2008 |
December 29, 2009 |
December 28, 2010 |
||||||||||
| (As Restated, See Note 3) |
(As Restated, See Note 3) |
|||||||||||
| OPERATING ACTIVITIES: |
||||||||||||
| Net income |
$ | 19,709 | $ | 90,363 | $ | 10,623 | ||||||
| Adjustments to reconcile net income to net cash provided by operating activities: |
||||||||||||
| Depreciation and amortization |
14,100 | 16,627 | 17,769 | |||||||||
| Deferred income tax expense (benefit) |
1,368 | (71,758 | ) | 9,724 | ||||||||
| Stock-based compensation expense |
945 | 941 | 1,532 | |||||||||
| Loss (gain) on disposal of assets |
198 | 212 | (531 | ) | ||||||||
| Impairment charges and other related costs |
263 | 818 | — | |||||||||
| Adjustment for Series Z Modification |
— | — | 929 | |||||||||
| Provision for losses on accounts receivable |
157 | 206 | 167 | |||||||||
| Amortization of debt issuance and debt discount costs |
487 | 574 | 530 | |||||||||
| Write-off of debt issuance costs |
— | — | 966 | |||||||||
| Changes in operating assets and liabilities: |
||||||||||||
| Restricted cash |
677 | 18 | (201 | ) | ||||||||
| Accounts receivable |
1,191 | 624 | (212 | ) | ||||||||
| Accounts payable and accrued expenses |
3,297 | (1,015 | ) | 3,008 | ||||||||
| Other assets and liabilities |
703 | (3,910 | ) | (535 | ) | |||||||
| Net cash provided by operating activities |
43,095 | 33,700 | 43,769 | |||||||||
| INVESTING ACTIVITIES: |
||||||||||||
| Purchase of property and equipment |
(26,690 | ) | (16,898 | ) | (16,597 | ) | ||||||
| Proceeds from the sale of property, plant and equipment |
17 | 2 | 860 | |||||||||
| Acquisition of restaurant assets |
(7 | ) | — | — | ||||||||
| Net cash used in investing activities |
(26,680 | ) | (16,896 | ) | (15,737 | ) | ||||||
| FINANCING ACTIVITIES: |
||||||||||||
| Proceeds from line of credit |
— | — | 23,700 | |||||||||
| Repayments on line of credit |
— | — | (11,000 | ) | ||||||||
| Payments under capital lease obligations |
(84 | ) | (49 | ) | (11 | ) | ||||||
| Repayments of other borrowings |
(280 | ) | — | — | ||||||||
| Repayments under the term loan |
(1,675 | ) | (8,088 | ) | (79,787 | ) | ||||||
| Borrowings under the new term loan |
— | — | 75,000 | |||||||||
| Redemptions under mandatorily redeemable Series Z Preferred Stock |
— | (24,806 | ) | (32,194 | ) | |||||||
| Additional redemption payments on Series Z Preferred Stock |
— | — | (568 | ) | ||||||||
| Debt issuance costs |
— | — | (2,315 | ) | ||||||||
| Proceeds upon stock option exercises |
404 | 1,808 | 1,026 | |||||||||
| Net cash used in financing activities |
(1,635 | ) | (31,135 | ) | (26,149 | ) | ||||||
| Net increase (decrease) in cash and cash equivalents |
14,780 | (14,331 | ) | 1,883 | ||||||||
| Cash and cash equivalents, beginning of period |
9,436 | 24,216 | 9,885 | |||||||||
| Cash and cash equivalents, end of period |
$ | 24,216 | $ | 9,885 | $ | 11,768 | ||||||
The accompanying notes are an integral part of these consolidated financial statements.
55
Table of Contents
EINSTEIN NOAH RESTAURANT GROUP, INC. AND SUBSIDIARIES
Notes to Consolidated Financial Statements
| 1. | DESCRIPTION OF BUSINESS AND BASIS OF PRESENTATION |
The consolidated financial statements of Einstein Noah Restaurant Group, Inc. and its wholly-owned subsidiaries (collectively, the “Company”) have been prepared in conformity with accounting principles generally accepted in the United States of America. All inter-company accounts and transactions have been eliminated in consolidation. As of December 28, 2010, the Company-owned, franchised or licensed various restaurant concepts under the brand names of Einstein Bros. Bagels (“Einstein Bros.”), Noah’s New York Bagels (“Noah’s”), and Manhattan Bagel Company (“Manhattan Bagel”).
The Company has a 52/53-week fiscal year ending on the Tuesday closest to December 31. Fiscal years 2008, 2009 and 2010 which ended on December 30, 2008, December 29, 2009 and December 28, 2010 respectively, contained 52 weeks. The next 53-week fiscal year is 2011 which ends on January 3, 2012.
Certain immaterial reclassifications have been made to conform previously reported data to the current presentation. These reclassifications have no effect on net income or financial position as previously reported.
| 2. | SUMMARY OF SIGNIFICANT ACCOUNTING POLICIES |
Use of Estimates
The preparation of the consolidated financial statements in conformity with accounting principles generally accepted in the United States of America (“GAAP”) requires the Company to make estimates and assumptions that affect reported amounts of assets and liabilities, disclosure of contingent assets and liabilities at the date of the financial statements, and the reported amounts of revenues, costs and expenses during the reporting period. Actual results could differ from the estimates.
Revenue Recognition
Company-owned restaurant sales—The Company records revenue from the sale of food, beverage and retail items as products are sold. Sales tax amounts collected from customers that are remitted to governmental authorities are excluded from net revenue.
Manufacturing and commissary revenues—Manufacturing revenues are recorded at the time of shipment to customers. The Company’s manufacturing operations sell bagels to a wholesaler and a distributor who take possession in the United States and sells outside of the United States. As the product is shipped FOB domestic dock, and invoiced and paid in U.S. dollars, there are no international risks of loss or foreign exchange currency issues. Approximately $4.8 million, $5.3 million and $5.3 million of sales shipped internationally are included in manufacturing revenues for fiscal years ended 2008, 2009 and 2010, respectively.
Franchise and license related revenues—Initial fees received from a franchisee or licensee to establish a new location are recognized as income when the Company has performed its obligations required to assist the franchisee or licensee in opening a new location, which is generally at the time the franchisee or licensee commences operations. The initial franchise and license fees that were recognized in 2010 were $0.6 million and $0.4 million, respectively. Continuing royalties, which are a percentage of the net sales of franchised and licensed locations, are accrued as income each month. In 2010, the Company recognized approximately $0.1 million relating to deposits on a franchise development agreements that were terminated.
Gift Cards—Proceeds from the sale of gift cards are recorded as deferred revenue within accrued expenses, and recognized as income when redeemed by the holder. The deferred revenue balance represents the Company’s liability for gift cards that have been sold, but not yet redeemed. There are no expiration dates on the Company’s gift cards, nor does the Company charge any service fees that decrease customer balances.
56
Table of Contents
EINSTEIN NOAH RESTAURANT GROUP, INC. AND SUBSIDIARIES
Notes to Consolidated Financial Statements
While the Company will continue to honor all gift cards presented for payment, it may determine the likelihood to be remote for certain gift card balances due to the age of the unredeemed balance. In these circumstances, to the extent the Company determines there is no requirement for remitting balances to government agencies under unclaimed property laws, gift card balances may be recognized as gift card breakage in revenue. Gift card breakage is included in revenue within company-owned restaurant sales in the consolidated statements of operations.
For the fiscal years ended December 29, 2009 and December 28, 2010, income from gift card breakage was $0.2 and $0.2 million, respectively. The Company’s estimate of gift card breakage is based upon reasonable and reliable company-specific historical information that the Company believes is predictive of the future and relates to a large pool of homogenous gift card transactions over a sufficient time frame. The Company also recognized $0.4 million in revenue in 2010 related to gift certificate breakage from a gift certificate program that ceased to exist. While these gift certificates will continue to be honored, the Company has determined the likelihood to be remote for redemption of these gift certificates due to their age and the fact that the program is no longer in place.
Allowance for doubtful accounts—The majority of the Company’s receivables are due from licensees, franchisees, distributors and trade customers. The Company determines the allowance by considering a number of factors, including the length of time trade accounts receivable are past due, previous loss and payment history, the customer’s current ability to pay its obligation to the Company and the condition of the general economy and the industry as a whole. The Company writes off accounts receivable when they become uncollectible, and payments subsequently received on such receivables are credited to the allowance for doubtful accounts.
Cash and Cash Equivalents, and Restricted Cash
Cash and cash equivalents consist of cash on hand and highly liquid instruments with original maturities of three months or less when purchased. Amounts in-transit from credit card processors are also considered cash equivalents because they are both short-term and highly liquid in nature and are typically converted to cash within three days of the sales transaction. Restricted cash consists of funds paid by franchisees that are earmarked as advertising fund contributions, monies set aside for the lease on the Company’s corporate office and restricted cash accounts for the benefit of taxing and other government authorities. The Company maintains cash and cash equivalent balances with financial institutions that exceed federally insured limits. The Company has not experienced any losses related to these balances and management believes its credit risk to be minimal.
Property, Plant and Equipment
Property, plant and equipment are recorded at cost. Furniture and equipment are depreciated using the straight-line method over the estimated useful life of the asset, which ranges from 3 to 12 years. Leasehold improvements are amortized using the straight-line method. The depreciable lives for leasehold improvements are limited to the lesser of the useful life or the non-cancelable lease term. In circumstances where the Company would incur an economic penalty by not exercising one or more option periods, we include one or more option periods when determining the depreciation period. In either circumstance, the Company’s policy requires consistency when calculating the depreciation period, in classifying the lease and in computing straight-line rent expense. Costs incurred to repair and maintain the Company’s facilities and equipment are expensed as incurred.
In the first quarter of 2008, the Company reviewed the depreciable lives of the assets and determined that the economic useful life for leasehold improvements on new restaurants should be the shorter of 10 years or the life of the lease, which is typically 10 years. The Company also determined that the economic useful lives of restaurant upgrades should be the shorter of 5 years or the life of the lease. However, as the Company approves restaurants to be upgraded, it simultaneously reviews the lease, and typically only upgrades those locations where
57
Table of Contents
EINSTEIN NOAH RESTAURANT GROUP, INC. AND SUBSIDIARIES
Notes to Consolidated Financial Statements
the lease has a renewal option and the Company is reasonably assured that the lease will be renewed. For 2008, the effect on both income from operations and net income was a reduction of $0.9 million in depreciation expense, which increased both basic and diluted earnings per share by $0.05.
In accordance with GAAP, impairment losses are recorded on long-lived assets on a restaurant-by-restaurant basis whenever impairment indicators are determined to be present. The Company considers a history of cash flow losses to be the primary indicator of potential impairment for individual restaurant locations. The Company determines whether a restaurant location is impaired based on expected undiscounted future cash flows, considering location, local competition, current restaurant management performance, existing pricing structure and alternatives available for the site. If impairment exists, the amount of impairment is measured as the excess of the carrying amount of the asset over its fair value as determined utilizing the estimated discounted future cash flows or the expected proceeds, net of costs to sell, upon sale of the asset.
During fiscal years ended 2008 and 2009, the Company recorded approximately $0.3 million and $0.8 million, respectively, in impairment charges related to underperforming restaurants. The Company did not record an impairment charge in 2010.
Inventory
Inventories, which consist of food, beverage, paper supplies and bagel ingredients, are stated at the lower of cost or market, with cost being determined by the first-in, first-out method.
Leases and Deferred Rent Payable
The Company leases all of its restaurant properties. Leases are evaluated and classified as operating or capital leases for financial reporting purposes.
For a lease that contains rent escalations, the Company records the total rent payable during the lease term on a straight-line basis over the term of the lease and record the difference between rent paid and the straight-line rent expense as deferred rent payable. Incentive payments received from landlords are recorded as landlord incentives and are amortized on a straight-line basis over the lease term as a reduction of rent.
Internal Development Costs and Abandoned Site Costs
The Company capitalizes direct costs associated with the site acquisition and construction of a company-owned restaurant on that site, including direct internal payroll and payroll-related costs. Only those site-specific costs incurred subsequent to the time that the site acquisition is considered probable are capitalized. If the Company subsequently makes a determination that a site for which internal development costs have been capitalized will not be acquired or developed, any previously capitalized internal development costs are expensed and included in general and administrative expenses.
Goodwill, Trademarks and Other Intangibles
Intangible assets include both goodwill and identifiable intangibles arising from the allocation of the purchase prices of assets acquired. Goodwill represents the excess of cost over fair value of net assets acquired in the acquisition of Manhattan Bagel. Other intangibles consist mainly of trademarks, trade secrets and patents.
Goodwill and other intangible assets with indefinite lives are not subject to amortization, but are tested for impairment annually or more frequently if events or changes in circumstances indicate that the asset might be
58
Table of Contents
EINSTEIN NOAH RESTAURANT GROUP, INC. AND SUBSIDIARIES
Notes to Consolidated Financial Statements
impaired. In accordance with GAAP, the Company follows a two-step approach for testing impairment. For goodwill, the fair value of each reporting unit is compared to its carrying value to determine whether an indication of impairment exists. If impairment is indicated, the fair value of the reporting unit’s goodwill is determined by allocating the unit’s fair value to its assets and liabilities (including any unrecognized intangible assets) as if the reporting unit had been acquired in a business combination. For intangibles with indefinite lives, the fair value is compared to the carrying value. The amount of impairment for goodwill and other intangible assets is measured as the excess of its carrying amount over its fair value. Intangible assets not subject to amortization consist primarily of the Einstein Bros. and Manhattan Bagel trademarks.
As of December 30, 2008, December 29, 2009 and December 28, 2010, the Company performed an impairment analysis of the goodwill and indefinite lived intangible assets related to the Einstein Bros. and Manhattan Bagel brands. For the fiscal years ended 2008, 2009, and 2010 there was no indication of impairment in the goodwill and indefinite lived intangible assets.
Insurance Reserves
The Company uses a combination of insurance and self-insurance mechanisms to provide for the potential liabilities for workers’ compensation, general liability and healthcare benefits. The Company maintains coverage with third party insurers which limit the total exposure from medical, workers’ compensation and general liability claims. The self-insurance medical liability and insured workers’ compensation and general liability represent an estimate of the ultimate cost of claims incurred and unpaid as of the balance sheet date. The estimated liabilities are established based upon analysis of historical data to ensure that the liability is appropriate. If actual claims differ from estimates, the Company’s financial results could be impacted. The estimated workers’ compensation liability is established based on actuarial estimates, is discounted at 10% based upon a discrete analysis of actual claims and historical data and is reviewed on a quarterly basis to ensure that the liability is appropriate. These estimated liabilities are included in accrued expenses in the consolidated balance sheets.
Guarantees
Prior to 2001, the Company would occasionally guarantee leases for the benefit of certain franchisees. None of the guarantees have been modified since their inception and the Company has since discontinued this practice. Current franchisees are the primary lessees under the vast majority of these leases. Under the lease guarantees, the Company may be required by the lessor to make all of the remaining monthly rental payments or property tax and common area maintenance payments if the franchisee does not make the required payments in a timely manner. However, the Company believes most, if not all, of the franchised locations could be subleased to third parties, reducing the potential exposure. Additionally, the Company has indemnification agreements with the franchisees under which the franchisees would be obligated to reimburse the Company for any amounts paid under such guarantees. Historically, the Company has not been required to make such payments in significant amounts. The Company records a liability for the exposure under the guarantees in accordance with GAAP. In the event that trends change in the future, the Company’s financial results could be impacted. As of December 28, 2010, the Company had outstanding guarantees of indebtedness under certain leases of approximately $0.2 million and no liability has been recorded.
Fair Value of Financial Instruments
As of December 29, 2009 and December 28, 2010, the Company’s financial instruments consist of cash equivalents, accounts receivable, accounts payable and debt. The fair value of accounts receivable and accounts payable approximate their carrying value, due to their short-term maturities. As of December 29, 2009 and
59
Table of Contents
EINSTEIN NOAH RESTAURANT GROUP, INC. AND SUBSIDIARIES
Notes to Consolidated Financial Statements
December 28, 2010, total debt under the senior secured credit facility was $79.8 million and $87.7 million, respectively and had a fair value of $64.6 million and $87.7 million, respectively due to the changing credit markets. The fair value of the Company’s debt was estimated based on the current rates found in the market place for debt with the same remaining maturities.
The Mandatorily Redeemable Series Z Preferred Stock (“Series Z”) was recorded in the accompanying consolidated balance sheets at its full face value of $32.2 million as of December 29, 2009. This balance represented the total required future cash payment. The Series Z was redeemed in full in the fourth quarter of 2010 and therefore the balance as of December 28, 2010 was $0. The fair value of the Series Z, which was determined by using the remaining term of the Series Z and the effective dividend rate from the Certificate of Designation, was estimated to be $31.0 million as of December 29, 2009.
Concentrations of Risk
The Company purchases a majority of its frozen bagel dough from a single supplier who utilizes the Company’s proprietary processes and on whom the Company is dependent in the short-term. Additionally, the Company purchases all of its cream cheese from a single source. Historically, the Company has not experienced significant difficulties with its suppliers but its reliance on a limited number of suppliers subjects the Company to a number of risks, including possible delays or interruption in supplies, diminished control over quality and a potential lack of adequate raw material capacity. Any disruption in the supply or degradation in the quality of the materials provided by the suppliers could have a material adverse effect on the Company’s business, operating results and financial condition. In addition, any such disruptions in supply or degradations in quality could have a long-term detrimental impact on the Company’s efforts to develop a strong brand identity and a loyal consumer base.
Advertising Costs
The Company expenses advertising costs as incurred except for expenses related to the development of a major commercial or media campaign which are charged to income during the period in which the advertisement or campaign is first presented by the media. Advertising costs were $2.3 million, $4.6 million, and $9.9 million for the fiscal years ended 2008, 2009 and 2010, respectively, and are included in company-owned restaurant costs in the consolidated statements of operations.
Company Operations and Segments
The Company operates three business segments: company-owned restaurants, manufacturing and commissaries, and franchising and licensing. The corporate support unit facilitates all of the company-owned restaurants, the manufacturing facility and commissaries, supports the franchisees and licensees and handles general corporate governance. The company-owned restaurants segment includes the Einstein Bros. and Noah’s brands, which have similar investment criteria and economic and operating characteristics. The manufacturing segment produces and distributes bagel dough and other products to the restaurants, licensees, franchisees and other third parties. Inter-company sales to company-owned restaurants have been eliminated during consolidation. The franchise and license segment earns royalties and other fees from the use of trademarks and operating systems developed for the Einstein Bros., Noah’s and Manhattan Bagel brands.
Information regarding revenue and costs of sales for each business segment has been reported in the consolidated statements of operations for the years ended December 30, 2008, December 29, 2009 and December 28, 2010. The Company’s president and chief executive officer and the senior management team manage the business and allocate resources via a combination of restaurant sales reports and gross profit information related
60
Table of Contents
EINSTEIN NOAH RESTAURANT GROUP, INC. AND SUBSIDIARIES
Notes to Consolidated Financial Statements
to the Company’s three sources of revenue, which are presented in their entirety within the consolidated statements of operations. While the Company does review balance sheet and other asset information on a consolidated basis, it is not reviewed on a business segment basis as the Company bases its resource allocation decisions on sales and gross profit information. Due to the immateriality of all other financial information in relation to the restaurant segment, including but not limited to assets, capital expenditures, depreciation and amortization and general and administrative expenses, senior management does not regularly review any additional information for purposes of making decisions about allocating resources and assessing performance for each business segment.
The Company’s manufacturing operations, which include the bagel dough manufacturing facility and the United States Department of Agriculture inspected commissaries, are ancillary and support the Company’s restaurant operations through the production and distribution of bagel dough and other products to restaurants, licensees, franchisees and other third parties. These operations reduce costs via vertical integration, enable the Company to control the quality and consistency of ingredients delivered to its restaurants, manage inventory levels and expose the Company’s brands to new product channels. Although the primary focus of the manufacturing and commissary operations is to produce and distribute products to the restaurants, the Company’s third party revenues have increased over time. The overall results of operations of the manufacturing operations historically have not and currently do not have a material impact on the Company’s operating profit. The Company reports the results of its manufacturing segment associated with third party sales separately on its consolidated statements of operations. The product costs associated with internal “sales” to the Company’s restaurants are included in restaurant costs.
The Company’s franchise and license operations complement its restaurant operations by expanding the awareness of its brands. The Company reports royalties and other fees earned from the use of trademarks and operating systems developed for the Manhattan Bagel, Einstein Bros. and Noah’s brands separately on its consolidated statements of operations. The overall results of operations of the franchise and license operations historically have not and currently do not have a material impact on the Company’s operating profit.
Income Taxes
The Company computes income taxes using the asset and liability method, under which deferred income taxes are provided for the temporary difference between the financial statement carrying amounts and the tax basis of its assets and liabilities. The Company records income tax liabilities utilizing known obligations and estimates of potential obligations. A deferred tax asset or liability is recognized whenever there are future tax effects from existing temporary differences and operating loss and tax credit carry forwards. The Company records a valuation allowance to reduce deferred tax assets to the balance that is more likely than not to be realized. In evaluating the need for a valuation allowance, the Company must make judgments and estimates related to future taxable income and feasible tax planning strategies and consider existing facts and circumstances. When the Company determines that deferred tax assets could be realized in greater or lesser amounts than recorded, the assets’ recorded amount is adjusted and the income statement is either credited or charged, respectively, in the period during which the determination is made. The Company believes that the valuation allowance recorded at December 28, 2010 is adequate for the circumstances. However, subsequent changes in facts and circumstances that affect the Company’s judgments or estimates in determining the proper deferred tax assets or liabilities could materially affect the recorded balances.
The Company’s accounting for uncertainty in income taxes prescribes a recognition threshold and a measurement attribute for the financial statement recognition and measurement of tax positions taken or expected to be taken in a tax return. For those benefits to be recognized, a tax position must be more-likely-than-not to be sustained upon examination by taxing authorities. The amount recognized is measured as the largest amount of benefit that has a greater than 50% likelihood of being realized upon ultimate settlement. In the event the
61
Table of Contents
EINSTEIN NOAH RESTAURANT GROUP, INC. AND SUBSIDIARIES
Notes to Consolidated Financial Statements
Company derecognizes a tax position taken or expected to be taken in a tax return, it is the Company’s policy to record any applicable interest and penalties within the provision for income tax.
Net Income per Common Share
The Company computes basic net income per common share by dividing the net income available to common stockholders for the period by the weighted-average number of shares of common stock outstanding during the period.
Diluted net income per share is computed by dividing the net income available to common stockholders for the period by the weighted-average number of shares of common stock and potential common stock equivalents outstanding during the period using the treasury stock method. Potential common stock equivalents include incremental shares of common stock issuable upon the exercise of stock options and warrants. Potential common stock equivalents are excluded from the computation of diluted net income per share when their effect is anti-dilutive.
The following table summarizes the weighted-average number of common shares outstanding, as well as sets forth the computation of basic and diluted net income per common share for the periods:
| 52 weeks ended | ||||||||||||
| December 30, 2008 |
December 29, 2009 |
December 28, 2010 |
||||||||||
| (As Restated, See Note 3) |
(As Restated, See Note 3) |
|||||||||||
| (in thousands, except earnings per share and related share information) |
||||||||||||
| Net income |
$ | 19,709 | $ | 90,363 | $ | 10,623 | ||||||
| Less: Additional redemption on temporary equity |
— | — | (387 | ) | ||||||||
| Add: Accretion of premium on Series Z preferred stock |
— | — | 1,072 | |||||||||
| Net income available to common stockholders (a) |
$ | 19,709 | $ | 90,363 | $ | 11,308 | ||||||
| Basic weighted average shares outstanding (b) |
15,934,796 | 16,175,391 | 16,532,420 | |||||||||
| Dilutive effect of stock options and SARs |
444,169 | 351,478 | 272,306 | |||||||||
| Diluted weighted average shares outstanding (c) |
16,378,965 | 16,526,869 | 16,804,726 | |||||||||
| Net income available to common stockholders per share—Basic (a)/(b) |
$ | 1.24 | $ | 5.59 | $ | 0.68 | ||||||
| Net income available to common stockholders per share—Diluted (a)/(c) |
$ | 1.20 | $ | 5.47 | $ | 0.67 | ||||||
| Anti-dilutive stock options and SARs |
262,414 | 407,539 | 236,275 | |||||||||
Stock-Based Compensation
The Company’s stock-based compensation cost for the years ended December 30, 2008, December 29, 2009 and December 28, 2010 was $0.9 million, $0.9 million and $1.5 million, respectively, and has been included in general and administrative expenses.
The fair value of stock options is estimated using the Black-Scholes option-pricing model with the following weighted-average assumptions:
| December 30, 2008 |
December 29, 2009 |
December 28, 2010 | ||||
| Expected life of options and SARs from date of grant |
3.25 - 6.0 years | 2.75 - 6.0 years | 2.75 - 6.0 years | |||
| Risk-free interest rate |
1.30 - 2.92% | 1.13 - 2.80% | 0.67 - 2.74% | |||
| Volatility |
31.0% - 38.0% | 40.0% - 42.0% | 42.0% - 43.0% | |||
| Assumed dividend yield |
0.0% | 0.0% | 0.0% |
62
Table of Contents
EINSTEIN NOAH RESTAURANT GROUP, INC. AND SUBSIDIARIES
Notes to Consolidated Financial Statements
The expected term of options is based upon evaluations of historical and expected future exercise behavior. The risk-free interest rate is based on the U.S. Treasury rates at the date of grant with maturity dates approximately equal to the expected life at the grant date. The Company’s implied volatility is based on the mean reverting average of the Company’s historical stock volatility and that of an industry peer group. The use of mean reversion is supported by evidence of a correlation between stock price volatility and a company’s leverage combined with the effects mandatory principal payments will have on the Company’s capital structure, as defined under its debt facility. The Company has not historically paid any dividends but did declare a dividend on December 20, 2010 and anticipates paying dividends in the future, at the discretion of the Board of Directors (“BOD”), dependent on a variety of factors, including available cash and the overall financial condition of the Company.
As of December 28, 2010, the Company has approximately $1.2 million of total unrecognized compensation cost related to non-vested awards granted under its option and SARs plans, which are expected to be recognized over a weighted-average period of 1.46 years. As of December 28, 2010, the Company has approximately $45 thousand of total unrecognized compensation cost related to its restricted stock plan, which is expected to be recognized over a weighted-average period of one year.
Recent Accounting Pronouncements
In January 2010, the Financial Accounting Standards Board (“FASB”) issued Accounting Standards Update (“ASU”) No. 2010-06, Fair Value Measurements and Disclosures (Topic 820): Improving Disclosures about Fair Value Measurements. ASU 2010-06 revises two disclosure requirements concerning fair value measurements and clarifies two others. It requires separate presentation of significant transfers into and out of Levels 1 and 2 of the fair value hierarchy and disclosure of the reasons for such transfers. It will also require the presentation of purchases, sales, issuances and settlements within Level 3 on a gross basis rather than a net basis. The amendments also clarify that disclosures should be disaggregated by class of asset or liability and that disclosures about inputs and valuation techniques should be provided for both recurring and non-recurring fair value measurements. The Company’s disclosures about fair value measurements, including the new disclosures which were applicable to the Company beginning in 2010, are presented in Note 2 and Note 9. The disclosures concerning gross presentation of Level 3 activity are effective for fiscal years beginning after December 15, 2010 and the Company does not anticipate an impact on its consolidated financial statements.
The Company has considered all other recently issued accounting pronouncements and does not believe the adoption of such pronouncements will have a material impact on its consolidated financial statements.
| 3. | RESTATEMENT |
The Company has restated its consolidated financial statements as of December 29, 2009 and for the years ended December 29, 2009 and December 30, 2008 for the items discussed below. In 2011, the Company discovered two separate types of errors to its previously issued financial statements.
The first error was related to improper netting of deferred tax liabilities (“DTL”) against deferred tax assets (“DTA”) related to the book versus tax treatment of tax amortization of indefinite-lived intangibles that do not amortize under GAAP. This DTL should not be a source of future taxable income in calculating a valuation allowance or assessing whether deferred tax assets are more likely than not to be realized. The Company maintained a full valuation allowance against its net deferred tax assets from 2000 through the third quarter of 2009. The Company’s valuation allowance had been improperly understated over years 2001 through 2008 by $16.3 million as a result of offsetting this DTL against its DTAs in calculating its valuation allowance and its annual tax expense.
63
Table of Contents
EINSTEIN NOAH RESTAURANT GROUP, INC. AND SUBSIDIARIES
Notes to Consolidated Financial Statements
This DTL should have been presented as a DTL on the Company’s previous balance sheet. Likewise, as a result of understating its provision for income taxes in each of these years, cumulative losses for these years and the Company’s accumulated deficit were understated by $16.3 million as of the end of fiscal 2008. As a result of the Company reversing its valuation allowance in 2009, the impact to 2009 is that the Company understated its tax benefit by $16.3 million. As of the end of fiscal 2009, this error had no further impact on the Company’s financial statements.
The second error was due to improper recognition of certain deferred tax assets and liabilities totaling a benefit of approximately $2.0 million including the following:
| • | An incorrect state income tax rate was applied to the state tax loss carry forwards for the calculation of the related deferred tax asset (a $1.6 million expense); |
| • | Deferred tax asset recognition for workers compensation (a $1.8 million benefit), deferred rent (a $0.6 million benefit); |
| • | An Alternative Minimum Tax (“AMT”) credit carryover from 1997 had not been properly recognized (a $0.3 million benefit); |
| • | A net true-up in the book and tax cost basis (a $0.6 million benefit) for property, plant, and equipment and intangible assets; and |
| • | Other miscellaneous benefits of $0.3 million. |
The Company maintained a full valuation allowance against its net deferred tax assets from 2000 through the third quarter of 2009. Thus, any incremental change in income tax expense/benefit arising out of these errors in its DTAs and DTLs were offset by a commensurate change in the Company’s valuation allowance against its deferred tax assets and therefore did not affect any period prior to the third quarter of 2009 when the valuation allowance was reversed. The impact of this error was an increased tax benefit of approximately $2.0 million to be recorded in the third quarter of 2009.
The combined $18.4 million impact of these errors increased the income tax benefit and net income by $18.4 million in 2009. Restated net income is $90.4 million for 2009 from the previously reported $72.0 million. The aggregate impact of the restatement adjustments to the opening balance in the consolidated statement of changes in stockholders’ (deficit) equity as of January 1, 2008 was $15.0 million.
The following is a summary of the effects of the restatement on the Company’s financial statements for 2008 and 2009. For a summary of the effects of the restatement on the Company’s quarterly consolidated financial statements, see Note 20.
| As Reported | As Restated | Difference | ||||||||||
| December 30, 2008 |
December 30, 2008 |
December 30, 2008 |
||||||||||
| (in thousands) | ||||||||||||
| Consolidated Balance Sheet |
||||||||||||
| Deferred income tax liabilities |
$ | — | $ | 16,331 | $ | 16,331 | ||||||
| Total liabilities |
186,580 | 202,911 | 16,331 | |||||||||
| Accumulated deficit |
(275,376 | ) | (291,707 | ) | (16,331 | ) | ||||||
| Total stockholders’ deficit |
(13,651 | ) | (29,982 | ) | (16,331 | ) | ||||||
| Total liabilities and stockholders’ deficit |
172,929 | 172,929 | — | |||||||||
64
Table of Contents
EINSTEIN NOAH RESTAURANT GROUP, INC. AND SUBSIDIARIES
Notes to Consolidated Financial Statements
| As Reported | As Restated | Difference | ||||||||||
| 52 weeks ended December 30, 2008 |
52 weeks ended December 30, 2008 |
52 weeks ended December 30, 2008 |
||||||||||
| (in thousands, except earnings per share information) |
||||||||||||
| Consolidated Statement of Operations |
||||||||||||
| Provision for income tax |
$ | 1,100 | $ | 2,468 | $ | 1,368 | ||||||
| Net income |
21,077 | 19,709 | (1,368 | ) | ||||||||
| Net income available to common stockholders per share—Basic |
$ | 1.32 | $ | 1.24 | $ | (0.08 | ) | |||||
| Net income available to common stockholders per share—Diluted |
$ | 1.29 | $ | 1.20 | $ | (0.09 | ) | |||||
| As Reported | As Restated | Difference | ||||||||||
| December 30, 2008 |
December 30, 2008 |
December 30, 2008 |
||||||||||
| (in thousands) | ||||||||||||
| Consolidated Statement of Changes in Stockholders’ Deficit |
||||||||||||
| Accumulated deficit |
$ | (275,376 | ) | $ | (291,707 | ) | $ | (16,331 | ) | |||
| Total stockholders’ deficit |
(13,651 | ) | (29,982 | ) | (16,331 | ) | ||||||
| As Reported | As Restated | Difference | ||||||||||
| 52 weeks ended December 30, 2008 |
52 weeks ended December 30, 2008 |
52 weeks ended December 30, 2008 |
||||||||||
| (in thousands) | ||||||||||||
| Consolidated Statement of Cash Flows |
||||||||||||
| Net income |
$ | 21,077 | $ | 19,709 | $ | (1,368 | ) | |||||
| Deferred income tax expense |
— | 1,368 | 1,368 | |||||||||
| Net cash provided by operating activities |
43,095 | 43,095 | — | |||||||||
| As Reported | As Restated | Difference | ||||||||||
| December 29, 2009 |
December 29, 2009 |
December 29, 2009 |
||||||||||
| (in thousands) | ||||||||||||
| Consolidated Balance Sheet |
||||||||||||
| Current deferred income tax assets, net |
$ | 7,184 | $ | 9,682 | $ | 2,498 | ||||||
| Long-term deferred income tax assets, net |
46,206 | 45,745 | (461 | ) | ||||||||
| Total assets |
211,221 | 213,258 | 2,037 | |||||||||
| Accumulated deficit |
(203,381 | ) | (201,344 | ) | 2,037 | |||||||
| Total stockholders’ equity |
62,286 | 64,323 | 2,037 | |||||||||
| Total liabilities and stockholders’ equity |
211,221 | 213,258 | 2,037 | |||||||||
| As Reported | As Restated | Difference | ||||||||||
| 52 weeks ended December 29, 2009 |
52 weeks ended December 29, 2009 |
52 weeks ended December 29, 2009 |
||||||||||
| (in thousands, except earnings per share information) |
||||||||||||
| Consolidated Statement of Operations |
||||||||||||
| Benefit for income tax |
$ | (53,192 | ) | $ | (71,560 | ) | $ | (18,368 | ) | |||
| Net income |
71,995 | 90,363 | 18,368 | |||||||||
| Net income available to common stockholders per share—Basic |
$ | 4.45 | $ | 5.59 | $ | 1.14 | ||||||
| Net income available to common stockholders per share—Diluted |
$ | 4.36 | $ | 5.47 | $ | 1.11 | ||||||
65
Table of Contents
EINSTEIN NOAH RESTAURANT GROUP, INC. AND SUBSIDIARIES
Notes to Consolidated Financial Statements
| As Reported | As Restated | Difference | ||||||||||
| December 29, 2009 |
December 29, 2009 |
December 29, 2009 |
||||||||||
| (in thousands) | ||||||||||||
| Consolidated Statements of Changes in Stockholders’ (Deficit) Equity |
||||||||||||
| Accumulated deficit |
$ | (203,381 | ) | $ | (201,344 | ) | $ | 2,037 | ||||
| Total stockholders’ equity |
62,286 | 64,323 | 2,037 | |||||||||
| As Reported | As Restated | Difference | ||||||||||
| 52 weeks ended December 29, 2009 |
52 weeks ended December 29, 2009 |
52 weeks ended December 29, 2009 |
||||||||||
| (in thousands) | ||||||||||||
| Consolidated Statement of Cash Flows |
||||||||||||
| Net income |
$ | 71,995 | $ | 90,363 | $ | 18,368 | ||||||
| Deferred income tax benefit |
(53,390 | ) | (71,758 | ) | (18,368 | ) | ||||||
| Net cash provided by operating activities |
33,700 | 33,700 | — | |||||||||
| 4. | INVENTORIES |
Inventories consist of the following as of:
| December 29, 2009 |
December 28, 2010 |
|||||||
| (in thousands of dollars) | ||||||||
| Finished goods |
$ | 4,100 | $ | 4,205 | ||||
| Raw materials |
1,413 | 1,380 | ||||||
| Total inventories |
$ | 5,513 | $ | 5,585 | ||||
| 5. | PROPERTY, PLANT AND EQUIPMENT |
Property, plant and equipment consist of the following as of:
| December 29, 2009 |
December 28, 2010 |
|||||||
| (in thousands of dollars) | ||||||||
| Leasehold improvements |
$ | 98,112 | $ | 104,452 | ||||
| Store and manufacturing equipment |
82,143 | 88,630 | ||||||
| Furniture and fixtures |
1,323 | 1,320 | ||||||
| Office and computer equipment |
17,998 | 18,274 | ||||||
| Vehicles |
41 | 41 | ||||||
| Property, plant and equipment |
199,617 | 212,717 | ||||||
| Less accumulated depreciation |
140,935 | 156,054 | ||||||
| Property, plant and equipment, net |
$ | 58,682 | $ | 56,663 | ||||
Included in operating expenses is depreciation expense, which was $14.1 million, $16.6 million and $17.8 million for the fiscal years ended 2008, 2009 and 2010, respectively. There is no depreciation expense included in cost of sales.
66
Table of Contents
EINSTEIN NOAH RESTAURANT GROUP, INC. AND SUBSIDIARIES
Notes to Consolidated Financial Statements
| 6. | GOODWILL, TRADEMARKS AND OTHER INTANGIBLES |
The Company’s goodwill was $5.0 million for both fiscal years 2009 and 2010. The Company’s trademarks and other intangibles consist of amortizing intangibles that have been fully amortized and non-amortizing intangibles. The Company’s non-amortizing intangibles were $63.8 million for both fiscal years 2009 and 2010.
| 7. | ACCRUED EXPENSES AND OTHER CURRENT LIABILITIES |
Accrued expenses and other current liabilities consist of the following as of:
| December 29, 2009 |
December 28, 2010 |
|||||||
| (in thousands of dollars) | ||||||||
| Payroll and labor related expense |
$ | 9,488 | $ | 11,580 | ||||
| Sales, use and property tax expense |
2,251 | 2,708 | ||||||
| Accrued expenses |
5,649 | 2,215 | ||||||
| Dividends payable |
— | 2,081 | ||||||
| Deferred gift card revenue |
1,377 | 1,039 | ||||||
| Deferred franchise and license revenue |
237 | 279 | ||||||
| Other current liabilities |
1,631 | 569 | ||||||
| Total accrued expenses and other current liabilities |
$ | 20,633 | $ | 20,471 | ||||
Long-term deferred franchise and license revenue is included in other liabilities on the balance sheet and was $0.5 million and $0.6 million as of December 29, 2009 and December 28, 2010, respectively.
| 8. | LONG-TERM DEBT |
New Credit Facility
On December 20, 2010, the Company entered into a new senior $125 million credit facility with Bank of America, N.A., as administrative agent (the “Administrative Agent”) and other lenders party thereto (the “New Credit Facility”).
The New Credit Facility has a commitment of up to $125 million, including a term loan of up to $75 million (the “Term Loan”) and a revolving credit facility of up to $50 million (the “Revolving Facility”). Borrowings under the New Credit Facility bear interest at a rate equal to an applicable margin plus, at the Company’s option, either a variable base rate or a Eurodollar rate. The applicable margin for Eurodollar rate loans ranges from 2.5% to 3.0% and for base rate loans ranges from 1.5% to 2.0%, depending on the level of the Company’s consolidated leverage ratio (as defined in the New Credit Facility). Upon the occurrence of a payment event of default which is continuing, all amounts due under the New Credit Facility will bear interest at 2.0% above the interest rate otherwise applicable.
The New Credit Facility matures on December 20, 2015 (the “Maturity Date”). The Term Loan must be repaid in consecutive quarterly principal installments, increasing from $1,875,000 to $2,812,500 over the term of the New Credit Facility, commencing on March 31, 2011, and continuing thereafter on the last day of each calendar quarter, with any remaining amounts due and payable on the Maturity Date. The Term Loan also requires mandatory prepayments of:
| • | 100% of net cash proceeds of asset sales and insurance and condemnation proceeds above a threshold and subject to the ability to reinvest under certain circumstances; and |
| • | 100% of net cash proceeds of any debt issued by the Company, subject to certain exceptions. |
67
Table of Contents
EINSTEIN NOAH RESTAURANT GROUP, INC. AND SUBSIDIARIES
Notes to Consolidated Financial Statements
The New Credit Facility contains a number of negative covenants that will limit the Company from taking certain actions. In addition, the Company is required to maintain:
| • | a minimum consolidated fixed charge coverage ratio ranging from 1.25x to 1.35x; and |
| • | a maximum consolidated leverage ratio ranging from 2.00x to 2.75x. |
The New Credit Facility contains limitations on annual capital expenditures of $20.0 million in 2010, $35.0 million in 2011 and $32.0 million thereafter, but allows, subject to certain conditions, for a percentage of any unused portion of the capital expenditure limit to be carried forward into the following year.
The New Credit Facility contains customary events of default. In addition, the New Credit Facility provides for (i) an incremental term loan (the “Incremental Term Loan”) and (ii) an increase in the Revolving Facility (the “Revolving Facility Increase” and together with the Incremental Term Loan, the “Incremental Facilities”) of up to $50 million to be used by the Company, if needed, solely for the purpose of making acquisitions permitted under the New Credit Facility. If the Company chooses to draw down the Incremental Facilities, the outstanding amount of the Incremental Facilities must be repaid in equal quarterly installments on the last day of each calendar quarter, with any remaining amounts due and payable on the Maturity Date. Borrowings under the Incremental Facilities, if any, will bear interest at the same rate schedule as other borrowings under the New Credit Facility. Availability of the Incremental Facilities is subject to customary borrowing conditions, including absence of any default or material adverse change, and to a requirement of advanced successful syndication of the Incremental Facilities.
As of December 28, 2010, the Company had $7.3 million in letters of credit outstanding on its New Credit Facility with Bank of America. The letters of credit expire on various dates during 2011, are generally automatically renewable for one additional year and are payable upon demand in the event that the Company fails to pay the underlying obligation. Letters of credit reduce the Company’s availability under its Revolving Facility, which was $30.0 million as of December 28, 2010.
During the term of the New Credit Facility, and subject to pro forma compliance the fixed charge coverage ratio covenant and with certain consolidated leverage ratio requirements, and having specified excess availability under the Revolving Facility, the Company is permitted to repurchase up to $20.0 million of its common stock and make dividends of up to $10.0 million. In addition, starting in 2012, and subject to pro forma compliance with the fixed charge coverage ratio covenant and with certain consolidated leverage ratio requirements, and having specified excess availability under the Revolving Facility, the Company may make additional dividends and repurchases of its common stock using excess cash flow (as defined in the New Credit Facility).
The Company may prepay amounts outstanding under the New Credit Facility and may terminate commitments in whole at any time without penalty or premium upon prior written notice.
On December 20, 2010, as a condition to the effectiveness of the New Credit Facility, the Company and its material subsidiaries entered into a guaranty and security agreement with the Administrative Agent (the “Guaranty”). The Guaranty is secured by a first priority security interest in all the assets of the Company and its material subsidiaries, including a pledge of 100% of the Company’s interest in all shares of capital stock (or other ownership or equity interests) of each material subsidiary.
Debt issuance costs were capitalized as part of the credit agreement and are being amortized over a period of five years on a straight-line basis for the Revolving Facility and on the effective interest rate method for the Term Loan. In the event that the debt is retired prior to the maturity date, debt issuance costs will be expensed in the period that the debt is retired.
68
Table of Contents
EINSTEIN NOAH RESTAURANT GROUP, INC. AND SUBSIDIARIES
Notes to Consolidated Financial Statements
In conjunction with the entry into the New Credit Facility, the Company terminated its prior credit facility with Wells Fargo Foothill, Inc. as administrative agent dated February 28, 2006, as amended June 28, 2007. The Company pre-paid the outstanding balance of $85.6 million and no early termination or prepayment penalties were incurred. In conjunction with this prepayment, during the fourth quarter of 2010, the Company recorded a charge of approximately $1.0 million in unamortized debt issuance costs.
As of December 28, 2010, the weighted-average interest rate under the New Credit Facility was 3.3%. As of December 28, 2010, the Company was in compliance with all financial and operating covenants.
The Company’s obligations on its New Credit Facility for the five years following December 28, 2010 are as follows:
| Fiscal year (in thousands of dollars): |
||||
| 2011 |
$ | 7,500 | ||
| 2012 |
$ | 7,500 | ||
| 2013 |
$ | 9,375 | ||
| 2014 |
$ | 8,438 | ||
| Thereafter |
$ | 54,887 | ||
| $ | 87,700 | |||
June 2007 Credit Facility
The Company’s June 2007 Credit Facility was composed of a credit facility that had an original principal amount of $90 million term loan and a $20 million revolver. The credit facility had a five-year term and was secured by substantially all of the Company’s assets and guaranteed by its subsidiaries. Borrowings under this credit facility bore interest at a rate equal to an applicable margin plus, at the Company’s option, either a variable base rate or a Eurodollar rate. As of December 29, 2009, the weighted-average interest rate under the credit facility was 2.24%. The credit facility contained usual and customary covenants including consolidated leverage ratios, fixed charge coverage ratios, limitations on capital expenditures, etc. As of December 29, 2009, the Company was in compliance with all financial and operating covenants. As of December 29, 2009, the Company had $7.2 million in letters of credit outstanding under this facility. The Company’s availability under the revolver was $12.8 million as of December 29, 2009.
In the first quarter of 2010, the Company made a $4.3 million prepayment related to the excess cash flow provision in its debt agreement in place at that time.
Debt Issuance Costs
As of December 29, 2009 and December 28, 2010, debt issuance costs, net of amortization of approximately $1.5 million and $2.3 million, respectively, have been capitalized in other assets for the credit facilities. The amortization of debt issuance costs of $0.5 million, $0.6 million and $0.5 million for the fiscal years ended 2008, 2009, and 2010, respectively, is included in interest expense in the consolidated statements of operations.
| 9. | INTEREST RATE SWAP AND OTHER COMPREHENSIVE INCOME |
On May 7, 2008, the Company entered into an interest rate swap agreement relating to its term loan for two years, effective August 2008. This agreement expired in August 2010. The Company was required to make payments based on a fixed interest rate of 3.52% calculated on an initial notional amount of $60 million. In exchange, the Company received interest on $60 million of notional amount at a variable rate. The variable rate
69
Table of Contents
EINSTEIN NOAH RESTAURANT GROUP, INC. AND SUBSIDIARIES
Notes to Consolidated Financial Statements
interest the Company received was based on the one-month London InterBank Offered Rate (“LIBOR”). The net effect of the swap was to fix the interest rate on $60 million of the Company’s First Lien Term Loan at 3.52% plus an applicable margin. As of December 29, 2009, the weighted-average interest rate under the term loan including this swap was 4.71%.
The interest rate swap agreement qualified as a cash flow hedge. The fair value of the interest rate swap agreement, which was adjusted regularly, was recorded in the Company’s balance sheet as an asset or liability, as necessary, with a corresponding adjustment to accumulated other comprehensive loss within stockholders’ equity.
GAAP requires fair value measurement to be classified and disclosed in one of the following three categories:
| • | Level 1: Unadjusted quoted prices in active markets that are accessible at the measurement date for identical, unrestricted assets or liabilities. |
| • | Level 2: Quoted prices in markets that are not active or inputs which are observable, either directly or indirectly, for substantially the full term of the asset or liability. |
| • | Level 3: Prices or valuation techniques that require inputs that are both significant to the fair value measurement and unobservable (i.e., supported by little or no market activity). |
The interest rate swap discussed above fell into the Level 2 category. The fair market value of the interest rate swap as of December 28, 2010 was $0 million. As of December 29, 2009 and December 28, 2010, the change in unrealized (loss) gain associated with this cash flow hedging instrument is recorded in accumulated other comprehensive (loss) gain within stockholders’ equity.
Comprehensive income consisted of the following:
| 52 weeks ended | ||||||||||||
| December 30, 2008 |
December 29, 2009 |
December 28, 2010 |
||||||||||
| (As Restated, See Note 3) |
(As Restated, See Note 3) |
|||||||||||
| (in thousands of dollars) | ||||||||||||
| Net income available to common stockholders |
$ | 19,709 | $ | 90,363 | $ | 11,308 | ||||||
| Change in unrealized (loss) gain on cash flow hedge |
(2,470 | ) | 1,193 | 1,277 | ||||||||
| Total comprehensive income |
$ | 17,239 | $ | 91,556 | $ | 12,585 | ||||||
| 10. | MANDATORILY REDEEMABLE SERIES Z PREFERRED STOCK |
In September 2003, the Company completed an equity recapitalization with its preferred stockholders, who held a substantial portion of the Company’s common stock. Among other things, the Halpern Denny Fund III, L.P. (“Halpern Denny”) interest in the Company’s Mandatorily Redeemable Series F Preferred Stock (“Series F”) was converted into 57,000 shares of Series Z Mandatorily Redeemable Preferred Stock (“Series Z”).
The Series Z was recorded in the accompanying consolidated balance sheets at its full face value of $32.2 million as of December 29, 2009 which represented the total cash payable upon redemption. In December of 2010, the final redemption payment was made reducing the balance to $0.
On May 28, 2009, the Company and Halpern Denny agreed that the Company would redeem shares in accordance with a designated schedule with the final payment occurring June 30, 2010. The first redemption payment
70
Table of Contents
EINSTEIN NOAH RESTAURANT GROUP, INC. AND SUBSIDIARIES
Notes to Consolidated Financial Statements
was made on June 30, 2009. All subsequent redemption payments included additional redemption price per share based on a rate that was 250 bps higher than the highest rate paid on the Company’s funded indebtedness, as provided in the Certificate of Designations (“Certificate”) for the Series Z.
As of December 29, 2009, the Company had redeemed $24.8 million of Series Z and incurred $0.2 million of additional redemption expense and $1.3 million of additional redemption amount was included in accrued expenses and other liabilities on the balance sheet and included within interest expense on the statements of operations.
On March 17, 2010, the Company and Halpern Denny amended their previous agreement dated May 28, 2009 to extend the redemption date to June 30, 2011, and allowed the Company to redeem any amount of Series Z at any time through that date. In addition, beginning July 1, 2010, Halpern Denny received a one year option to exchange up to $7.0 million of the outstanding Series Z and accrued additional redemption amounts for shares of the Company’s freely tradable common stock at a price of $11.50 per share. All additional redemption amounts that accrue after June 30, 2010 would be waived with respect to the shares of Series Z exchanged, if any. To the extent that Halpern Denny’s exchange option remained unexercised, the Company had the right to redeem the shares subject to the exchange option after the Company redeemed the shares of the Series Z that were not subject to the exchange option.
The Company recorded this agreement on its balance sheet at fair value during the first quarter of 2010. The fair value was recorded at a premium with a non-cash charge to net income of $0.9 million. The fair value of the Series Z was estimated to be $31.0 million as of December 29, 2009.
On October 25, 2010, the Company redeemed an additional 3,240 shares of Series Z for $3.6 million, including accrued additional redemption amounts. Halpern Denny did not exercise its exchange option and pursuant to the terms of the agreement, the exchange option expired. After this redemption, 3,240 shares of Series Z remain outstanding. On December 20, 2010, the Company redeemed all remaining outstanding shares of the Company’s Series Z preferred stock for $3.6 million in cash.
During fiscal year 2010, the Company redeemed $32.2 million of Series Z shares and accrued additional redemption amount of approximately $2.6 million.
| 11. | STOCKHOLDERS’ EQUITY |
Common Stock
The Company is authorized to issue up to 25 million shares of common stock, par value $0.001 per share. As of December 29, 2009 and December 28, 2010, there were 16,461,123 and 16,655,474 shares outstanding, respectively.
The Company announced on December 20, 2010 that the Board of Directors has declared an initial cash dividend on the Company’s common stock in the amount of $0.125 per share, payable on April 15, 2011 to shareholders of record as of March 1, 2011. The Company intends to pay a regular quarterly dividend going forward, at the discretion of the Board of Directors, dependent on a variety of factors, including available cash and the overall financial condition of the Company and subject to legal restrictions on the ability to pay dividends and the terms of the Company’s senior credit facility.
The Company also announced the authorization by the Board of Directors of up to $20 million in share repurchases of the Company’s common stock. The amount and timing of the share repurchases in the open market or in privately negotiated transactions will be subject to an assessment of market conditions and other economic factors. This authorization expires in two years and is subject to compliance with applicable laws and the terms of the Company’s senior credit facility.
71
Table of Contents
EINSTEIN NOAH RESTAURANT GROUP, INC. AND SUBSIDIARIES
Notes to Consolidated Financial Statements
Series A Junior Participating Preferred Stock
In June 1999, the Company’s Board of Directors authorized the issuance of a Series A junior participating preferred stock in the amount of 700,000 shares. This authorization was made in accordance with the Stockholder Protection Rights Plan discussed below. There are currently no issued shares.
Stockholder Protection Rights Plan
Prior to June 2009, the Company maintained a Stockholder Protection Rights Plan (the “Plan”). Upon implementation of the Plan in June 1999, the BOD declared a dividend distribution of one right on each outstanding share of common stock, as well as on each share later issued. Each right would allow stockholders to buy Series A junior participating preferred stock. The rights would have become exercisable or convertible if a group or individual acquired, or announced a tender offer, of 15% or more of the Company’s common stock. If the Company were acquired in a merger or other business combination transaction, each right would entitle its holder to purchase a number of the acquiring company’s common shares. This Plan expired in June 2009.
| 12. | STOCK OPTION AND WARRANT PLANS |
1995 Directors’ Stock Option Plan
The Company’s 1995 Directors’ Stock Option Plan (the “Directors’ Option Plan”) provided for the automatic grant of non-statutory stock options to non-employee directors of the Company. On December 19, 2003, the BOD terminated the authority to issue any additional options under the Directors’ Option Plan. As of December 28, 2010, options to purchase 996 shares of common stock at a weighted-average exercise price of $10.23 per share and a weighted-average remaining contractual life of 2.74 years remained outstanding under this plan.
2003 Executive Employee Incentive Plan
On November 21, 2003, the BOD adopted the Executive Employee Incentive Plan, as amended on December 19, 2003, March 1, 2005, February 28, 2007 and April 24, 2007 (the “2003 Plan”). The 2003 Plan provides for granting incentive stock options to employees and granting non-statutory stock options to employees and consultants. Unless terminated sooner, the 2003 Plan will terminate automatically in December 2013. The BOD has the authority to amend, modify or terminate the 2003 Plan, subject to any required approval by the Company’s stockholders under applicable law or upon advice of counsel. No such action may affect any options previously granted under the 2003 Plan without the consent of the holders. There are 2,000,000 shares reserved for issuance pursuant to options granted under the 2003 Plan. Options generally are granted with an exercise price equal to the fair market value on the date of grant, have a contractual life of ten years and typically vest over a three-year service period. Generally, 50% of options granted vest upon service. The Company recognizes compensation costs for these awards using a graded vesting attribution method over the requisite service period. The remaining 50% of options granted vest based on service and financial performance. Options that do not vest due to the failure to achieve specific financial performance criteria are canceled. As of December 28, 2010, options to purchase approximately 29,959 shares of common stock, which are not yet exercisable, are subject to future financial performance conditions. The Company recognizes compensation costs for performance based options over the requisite service period when conditions for achievement become probable. For fiscal years 2009 and 2010, 71,901 and 15,862 shares, respectively, were canceled as the Company did not meet certain financial goals and the related compensation expense that had been recorded during the year was reversed. As of December 28, 2010, there were 274,815 shares reserved for future issuance under the 2003 Plan.
2004 Stock Option Plan for Independent Directors
On December 19, 2003, the BOD adopted the Stock Option Plan for Independent Directors, effective January 1, 2004, as amended on March 1, 2005, February 28, 2007 and May 5, 2009 (the “2004 Directors’
72
Table of Contents
EINSTEIN NOAH RESTAURANT GROUP, INC. AND SUBSIDIARIES
Notes to Consolidated Financial Statements
Plan”). The BOD may amend, suspend, or terminate the 2004 Directors’ Plan at any time, provided, however, that no such action may adversely affect any outstanding option without the option holder’s consent. A total of 500,000 shares of common stock have been reserved for issuance under the 2004 Directors’ Plan. The 2004 Directors’ Plan provides for the automatic grant of non-statutory stock options to independent directors on January 1 of each year and a prorated grant of options for any director elected during the year. Options are granted with an exercise price equal to the fair market value on the date of grant, become exercisable six months after the grant date and are exercisable for five years from the date of grant unless earlier terminated. As of December 28, 2010, there were 213,836 shares reserved for future issuance under the 2004 Directors’ Plan.
Stock Appreciation Rights Plan
On February 17, 2007, the BOD adopted the Stock Appreciation Rights Plan (the “SAR Plan”). The SAR Plan provides for granting stock appreciation rights to employees. Unless terminated sooner, the SAR Plan will terminate automatically on March 31, 2012. The BOD has the authority to amend, modify or terminate the SAR Plan, subject to any required approval by stockholders under applicable law or upon advice of counsel, provided that, with limited exception, no modification will adversely affect outstanding rights. There are 150,000 shares issuable pursuant to stock appreciation rights under the SAR Plan.
The value of a share from which appreciation is determined is 100% of the fair market value of a share on the date of grant and will be paid in stock when they are exercised by the employee. The rights expire upon the earlier of the termination date of the SAR Plan or termination of employment, and typically vest over a two-year service period, and have a contractual life of five years. Generally, 50% of rights granted vest based solely upon the passage of time. The Company recognizes compensation costs for these awards using a graded vesting attribution method over the requisite service period. The remaining 50% of rights granted vest based on financial performance. As of December 28, 2010, rights to approximately 0 shares of the Company’s common stock, which are not yet exercisable, are subject to financial performance conditions. The Company will recognize compensation costs for performance based stock appreciation rights over the requisite service period when conditions for achievement become probable. For fiscal years 2009 and 2010, 1,561 and 200 shares, respectively, were canceled as the Company did not meet certain financial goals and the related compensation expense that had been recorded during the year was reversed. Rights that do not vest are forfeited and are entered back into the pool of shares to be distributed. As of December 28, 2010, there were 60,535 shares reserved for future issuance under the SAR Plan.
Restricted Stock
On January 9, 2009, the Company’s Compensation Committee granted 63,776 shares of restricted stock with a value of $375,000 in connection with Mr. O’Neill’s appointment as President and Chief Executive Officer. The forfeiture restrictions on 21,259 shares will lapse on the first and second anniversaries of the grant, and the forfeiture restriction on 21,258 shares will lapse on the third anniversary of the grant provided that Mr. O’Neill remains employed by the Company. The Company recognized compensation costs for these awards using a graded vesting attribution method over the requisite service period. Included in total stock-based compensation expense for fiscal years ended 2009 and 2010 was $0.2 million and $0.1 million, respectively related to this agreement.
73
Table of Contents
EINSTEIN NOAH RESTAURANT GROUP, INC. AND SUBSIDIARIES
Notes to Consolidated Financial Statements
Stock Option Activity
Transactions for the 1995 Directors’ Stock Option Plan, the 2003 Plan, the 2004 Directors’ Plan and the Stock Award Plan during fiscal years ended 2008, 2009 and 2010 were as follows:
| Number of Options | Weighted-Average Exercise Price | |||||||||||||||||||||||
| 2008 | 2009 | 2010 | 2008 | 2009 | 2010 | |||||||||||||||||||
| Outstanding, beginning of year |
1,108,361 | 1,201,442 | 910,377 | $ | 8.06 | $ | 8.04 | $ | 8.63 | |||||||||||||||
| Granted |
391,738 | 287,000 | 462,750 | 10.55 | 5.27 | 11.60 | ||||||||||||||||||
| Exercised |
(97,526 | ) | (427,777 | ) | (193,163 | ) | 4.14 | 4.23 | 5.31 | |||||||||||||||
| Forfeited |
(201,131 | ) | (130,288 | ) | (171,237 | ) | 14.92 | 10.98 | 11.22 | |||||||||||||||
| Cancelled |
— | (20,000 | ) | (23,061 | ) | — | 3.40 | 18.22 | ||||||||||||||||
| Outstanding, ending of year |
1,201,442 | 910,377 | 985,666 | $ | 8.04 | $ | 8.63 | $ | 10.00 | |||||||||||||||
| Exercisable and vested, end of year |
730,033 | 447,017 | 410,725 | $ | 6.37 | $ | 9.35 | $ | 9.84 | |||||||||||||||
The aggregate intrinsic value of options exercised during 2008, 2009 and 2010 was $0.8 million, $3.0 million and $1.4 million, respectively.
| Number of Options |
Weighted- Average Grant Date Fair Value |
|||||||
| Non-vested shares, December 29, 2009 |
463,360 | $ | 2.83 | |||||
| Granted |
462,750 | 5.01 | ||||||
| Vested |
(211,505 | ) | 3.10 | |||||
| Forfeited |
(139,664 | ) | 4.16 | |||||
| Non-vested shares, December 28, 2010 |
574,941 | $ | 4.16 | |||||
The weighted-average fair value of options granted during the years ended December 30, 2008 and December 29, 2009 was $3.86 and $2.11, respectively.
As of December 30, 2008, the weighted-average remaining life of total outstanding options, and exercisable and vested options was 5.84 years and 3.67 years, respectively, and the aggregate intrinsic value of outstanding options, and exercisable and vested options was $0.9 million and $0.8 million, respectively.
As of December 29, 2009, the weighted-average remaining life of total outstanding options, and exercisable and vested options was 7.1 years and 5.3 years, respectively, and the aggregate intrinsic value of outstanding options, and exercisable and vested options was $2.6 million and $1.2 million, respectively.
As of December 28, 2010, the weighted-average remaining life of total outstanding options, and exercisable and vested options was 7.4 years and 5.4 years, respectively, and the aggregate intrinsic value of outstanding options, and exercisable and vested options was $4.2 million and $2.0 million, respectively.
74
Table of Contents
EINSTEIN NOAH RESTAURANT GROUP, INC. AND SUBSIDIARIES
Notes to Consolidated Financial Statements
The following table summarizes information about stock options outstanding at December 28, 2010:
| Options Outstanding | Options Exercisable | |||||||||||||||||||
| Range of Exercise Prices |
Number of Options |
Wt.Avg. Exercise Price |
Wt.Avg. Remaining Life (Years) |
Number of Options |
Wt.Avg. Exercise Price |
|||||||||||||||
| $0.00 - $4.00 |
14,063 | $ | 3.72 | 3.15 | 14,063 | $ | 3.72 | |||||||||||||
| $4.01 - $8.00 |
358,237 | 5.54 | 6.67 | 210,244 | 5.89 | |||||||||||||||
| $8.01 - $15.00 |
482,120 | 11.48 | 8.55 | 72,505 | 10.30 | |||||||||||||||
| $15.01 - $20.00 |
131,246 | 17.39 | 5.35 | 113,913 | 17.57 | |||||||||||||||
| 985,666 | $ | 10.00 | 7.36 | 410,725 | $ | 9.84 | ||||||||||||||
Stock Appreciation Rights Plan Activity
Transactions for fiscal years ended 2008, 2009 and 2010 were as follows:
| Number of SARs | Weighted-Average Exercise Price | |||||||||||||||||||||||
| 2008 | 2009 | 2010 | 2008 | 2009 | 2010 | |||||||||||||||||||
| Outstanding, beginning of year |
76,913 | 46,377 | 67,553 | $ | 11.69 | $ | 11.89 | $ | 11.05 | |||||||||||||||
| Granted |
7,452 | 31,000 | 29,500 | 12.51 | 10.37 | 12.00 | ||||||||||||||||||
| Exercised |
(388 | ) | (1,224 | ) | (3,700 | ) | 8.00 | 8.00 | 8.04 | |||||||||||||||
| Forfeited |
(37,600 | ) | (8,600 | ) | (9,200 | ) | 11.65 | 13.17 | 12.19 | |||||||||||||||
| Outstanding, ending of year |
46,377 | 67,553 | 84,153 | $ | 11.89 | $ | 11.05 | $ | 11.39 | |||||||||||||||
| Exercisable and vested, end of year |
19,563 | 34,741 | 44,403 | $ | 11.52 | $ | 11.53 | $ | 11.33 | |||||||||||||||
The aggregate intrinsic value of SARs exercised during 2010 was negligible.
| Number of SARs |
Weighted- Average Grant Date Fair Value |
|||||||
| Non-vested SARs, December 29, 2009 |
32,812 | $ | 3.25 | |||||
| Granted |
29,500 | 3.72 | ||||||
| Vested |
(17,012 | ) | 3.29 | |||||
| Forfeited |
(5,550 | ) | 3.50 | |||||
| Non-vested SARs, December 28, 2010 |
39,750 | $ | 3.55 | |||||
The weighted-average fair value of SARs granted during the years ended December 28, 2008 and December 29, 2009 was $3.22 and $3.25, respectively.
As of December 30, 2008, the weighted-average remaining life of total outstanding SARs, and exercisable and vested SARs was 3.41 years and 3.25 years, respectively, and the aggregate intrinsic value for both the outstanding SARs, and exercisable and vested SARs was negligible.
As of December 29, 2009, the weighted-average remaining life of total outstanding SARs, and exercisable and vested SARs was 3.4 years and 2.3 years, respectively, and the aggregate intrinsic value for both the outstanding SARs, and exercisable and vested SARs was negligible.
As of December 28, 2010, the weighted-average remaining life of total outstanding SARs, and exercisable and vested SARs was 3.1 years and 2.0 years, respectively, and the aggregate intrinsic value for both the outstanding SARs, and exercisable and vested SARs was $0.3 million and $0.2 million, respectively.
75
Table of Contents
EINSTEIN NOAH RESTAURANT GROUP, INC. AND SUBSIDIARIES
Notes to Consolidated Financial Statements
The following table summarizes information about stock SARs outstanding at December 28, 2010:
| SARs Outstanding | SARs Exercisable | |||||||||||||||||||
| Range of Exercise Prices |
Number of SARs |
Wt.Avg. Exercise Price |
Wt.Avg. Remaining Life (Years) |
Number of SARs |
Wt.Avg. Exercise Price |
|||||||||||||||
| $0.00 - $10.00 |
27,901 | $ | 8.02 | 1.89 | 23,401 | $ | 8.00 | |||||||||||||
| $10.01 - $20.00 |
55,727 | 12.96 | 3.65 | 20,477 | 14.82 | |||||||||||||||
| $20.01 - $30.00 |
525 | 23.70 | 1.86 | 525 | 23.70 | |||||||||||||||
| 84,153 | $ | 11.39 | 3.05 | 44,403 | $ | 11.33 | ||||||||||||||
| 13. | SAVINGS PLAN |
The Company sponsors a qualified defined contribution retirement plan covering eligible employees of Einstein Noah Restaurant Group (the “401(k) Plan”). Employees, excluding officers, are eligible to participate in the 401(k) Plan if they meet certain eligibility requirements. The 401(k) Plan allows participating employees to defer the receipt of a portion of their compensation and contribute such amount to one or more investment options. The Company did not accrue a discretionary match for fiscal years ended 2008, 2009 or 2010. Employer contributions vest at the rate of 100% after three years of service.
The Company established the Einstein Noah Restaurant Group, Inc. Nonqualified Deferred Compensation Plan (the “DC Plan”) in June of 2007 for key employees, generally officers of the Company. The DC Plan allows an eligible employee to defer up to 80% of the participant’s base salary and bonus. In lieu of payments of the deferred amounts to the participant, the payments are to be invested with The Charles Schwab Trust Company under investment criteria directed by the participant.
| 14. | INCOME TAXES |
Utilization of the Company’s net operating loss (“NOL”) carryforwards reduced the federal and state income tax liability incurred. As of December 29, 2009 and December 28, 2010, the Company had $1.0 million of federal and state income tax overpayments, respectively, within prepaid expenses on the balance sheet. The provision for income taxes consists of the following:
| December 30, 2008 |
December 29, 2009 |
December 28, 2010 |
||||||||||
| (As Restated, see Note 3) |
(As Restated, see Note 3) |
|||||||||||
| (in thousands) | ||||||||||||
| Current |
||||||||||||
| Federal |
$ | 359 | $ | — | $ | (491 | ) | |||||
| State |
741 | 198 | 685 | |||||||||
| Total current income tax provision |
1,100 | 198 | 194 | |||||||||
| Deferred |
||||||||||||
| Federal |
7,587 | 6,755 | 8,162 | |||||||||
| State |
801 | 808 | 1,700 | |||||||||
| Total deferred income tax provision |
8,388 | 7,563 | 9,862 | |||||||||
| Change in valuation allowance |
(7,020 | ) | (79,321 | ) | (138 | ) | ||||||
| Total deferred income tax provision (benefit) |
1,368 | (71,758 | ) | 9,724 | ||||||||
| Total income tax provision (benefit) |
$ | 2,468 | $ | (71,560 | ) | $ | 9,918 | |||||
76
Table of Contents
EINSTEIN NOAH RESTAURANT GROUP, INC. AND SUBSIDIARIES
Notes to Consolidated Financial Statements
The Company continuously assesses the likelihood of realization of the benefits of its deferred tax assets. The Company considers many qualitative and quantitative factors, including:
| • | the level of historical taxable income and projections of future taxable income over periods in which the deferred tax assets would be deductible; |
| • | accumulation of income (loss) before taxes utilizing a look-back period of at least three fiscal years; |
| • | events within the restaurant industry; |
| • | the cyclical nature of our business; |
| • | the health of the economy; and |
| • | historical trending. |
In the third quarter of 2009, after again assessing the existing qualitative and quantitative data, including the wide-spread consensus that the economic climate was beginning to improve, the Company reduced its $84.3 million valuation allowance by $79.3 million, as restated, to $4.9 million after consideration the following factors:
| • | the Company’s continued profitability through September 29, 2009 resulting in nine consecutive quarters of pretax profitability; |
| • | the Company’s cumulative income before taxes of $41.5 million over the last fifteen quarters through September 29, 2009; |
| • | the Company’s cumulative income from operations of $94.7 million over the last fifteen quarters through September 29, 2009; and |
| • | the favorable ruling received from the Internal Revenue Service (“IRS”) on September 24, 2009 regarding the Company’s methodology for determining ownership changes in accordance with Internal Revenue Code Section 382. |
As of December 28, 2010, NOL carryforwards of $115.7 million were available to be utilized against future taxable income for years through fiscal 2029, subject in part to annual limitations and excluding approximately $12.2 million of NOL carryforwards that will expire prior to utilization. Accordingly, we have provided a full valuation allowance of $4.8 million related to this portion of our deferred tax assets. Our ability to utilize our NOLs could be further limited if we experience an “ownership change” as defined by Section 382 of the Internal Revenue Code. The occurrence of an additional ownership change would limit our ability to utilize approximately $100.3 million of our NOL carryforwards that are not currently subject to limitation, and could further limit our ability to utilize our remaining NOL carryforwards and possibly other tax attributes. Approximately $15.4 million of our NOLs are currently subject to limitation. On December 30, 2008, we filed a request with the IRS to review our methodology for determining ownership changes in accordance with Internal Revenue Code Section 382. On September 24, 2009, we received a favorable ruling from the IRS agreeing with our methodology.
We recognize the financial statement benefit of a tax position only after determining that the relevant tax authority would more likely than not sustain the position following an audit. For tax positions meeting the more-likely-than-not threshold, the amount recognized in the financial statements is the largest benefit that has a greater than 50% likelihood of being realized upon ultimate settlement with the relevant tax authority.
77
Table of Contents
EINSTEIN NOAH RESTAURANT GROUP, INC. AND SUBSIDIARIES
Notes to Consolidated Financial Statements
The following table summarizes the activity related to our unrecognized tax benefits (in thousands):
| December 30, 2008 |
December 29, 2009 |
December 28, 2010 |
||||||||||
| (As Restated, see Note 3) |
(As Restated, see Note 3) |
|||||||||||
| (in thousands) | ||||||||||||
| Balance, beginning of fiscal year |
$ | 618 | $ | 1,115 | $ | 826 | ||||||
| Increase related to prior period positions |
106 | — | — | |||||||||
| Increase related to current year positions |
391 | — | 455 | |||||||||
| Decrease related to prior period positions |
— | (289 | ) | (134 | ) | |||||||
| Decrease related to change in prior year estimate |
— | — | — | |||||||||
| Balance, end of fiscal year |
$ | 1,115 | $ | 826 | $ | 1,147 | ||||||
At December 30, 2008, December 29, 2009 and December 28, 2010 we had cumulative unrecognized tax benefits of approximately $1.1 million, $0.8 million, and $1.1 million respectively. The amounts recorded, if recognized, will have no impact on the effective tax rate due to the existence of net operating loss carryforwards. It is reasonably possible that part of our unrecognized tax benefit attributable to certain accrued liabilities will change as a result of an ongoing audit of our December 30, 2008 Federal Income Tax Return. The range of reasonably possible change is from $0.7 million to $1.1 million. Due to net operating losses and other tax attributes going forward, we are currently open to audit by the IRS for the years ending December 31, 1994 through December 28, 2010. With few exceptions our state tax returns are open to audit for the years ended December 31, 1997 through December 28, 2010.
We are subject to income taxes in the U.S. federal jurisdiction, and various states and local jurisdictions. Tax regulations within each jurisdiction are subject to the interpretation of the related tax laws and regulations and require significant judgment to apply. We remain subject to examination by U.S. federal, state and local tax authorities for tax years 2007 through 2009 and with certain state and local authorities for tax years 2006 through 2009. In the third quarter of 2010, the IRS notified the Company that its 2008 federal tax return has been selected for examination. With a few exceptions, we are no longer subject to U.S. federal, state or local examinations by tax authorities for the tax year 2005 and prior.
The amount of the deferred tax asset considered realizable could be reduced if estimates of future taxable income during the carryforward periods are reduced. As of December 28, 2010, the Company’s net operating loss carryforwards for U.S. federal income tax purposes that are expected to be utilized were subject to the following expiration schedule:
| Net Operating Loss Carryforwards |
||||
| Expiration Date |
Amount | |||
| (in thousands) | ||||
| December 31, 2012 |
$ | 6,431 | ||
| December 31, 2018 |
863 | |||
| December 31, 2020 |
5,205 | |||
| December 31, 2021 |
2,856 | |||
| December 31, 2022 |
29,330 | |||
| December 31, 2023 |
42,362 | |||
| December 31, 2024 |
12,003 | |||
| December 31, 2025 |
5,413 | |||
| December 31, 2026 |
4,900 | |||
| December 31, 2029 |
6,330 | |||
| $ | 115,693 | |||
78
Table of Contents
EINSTEIN NOAH RESTAURANT GROUP, INC. AND SUBSIDIARIES
Notes to Consolidated Financial Statements
The reconciliation of income taxes calculated at the U.S. federal tax statutory rate to the Company’s effective tax rate is set forth below:
| December 30, 2008 |
December 29, 2009 |
December 28, 2010 |
||||||||||
| (As Restated, see Note 3) |
(As Restated, see Note 3) |
|||||||||||
| U.S. Federal statutory rate |
35.0 | % | 35.0 | % | 35.0 | % | ||||||
| State income tax rate, net of Federal tax (benefit) |
6.2 | % | 5.1 | % | 6.6 | % | ||||||
| Other, net |
-4.0 | % | 2.1 | % | 4.8 | % | ||||||
| Effect of change in tax rate |
5.6 | % | -3.7 | % | 0.7 | % | ||||||
| Series Z |
0.0 | % | 2.8 | % | 1.9 | % | ||||||
| 42.8 | % | 41.3 | % | 49.0 | % | |||||||
| Change in valuation allowance |
-31.7 | % | -421.9 | % | -0.7 | % | ||||||
| Effective income tax rate |
11.1 | % | -380.6 | % | 48.3 | % | ||||||
Excess tax benefits related to stock option exercises were not recorded for each of the three fiscal years ended 2008, 2009 and 2010, due to the Company’s NOL carryforward position. The following represents a reconciliation of the Company’s unrecognized tax benefits for the year ended December 28, 2010:
| Unrecognized tax benefits |
||||
| (in thousands) | ||||
| Balance—December 30, 2008 |
$ | 3,892 | ||
| Additions based on 2009 stock option exercises |
2,338 | |||
| Balance—December 29, 2009 |
$ | 6,230 | ||
| Additions based on 2010 stockpot exercises |
719 | |||
| Balance—December 28, 2010 |
$ | 6,949 | ||
Approximately $6.2 million and $6.9 million in 2009 and 2010, respectively, of the gross federal net operating losses are not included in the deferred tax asset due to the limitation regarding recognition of this tax benefit. If the $6.9 million of unrecognized tax benefits currently not recognized on the balance sheet is recognized in the future, the entire balance will impact the Company’s effective tax rate.
The Company records deferred tax assets and liabilities based on the difference between the financial statement and income tax basis of assets and liabilities using the enacted statutory tax rate in effect for the year differences are expected to be taxable or refunded. Deferred income tax expenses or credits are based on the changes in the asset or liability from period to period.
The Company’s total deferred tax assets and liabilities are as follows:
| December 29, 2009 |
December 28, 2010 |
|||||||
| (As Restated, see Note 3) |
||||||||
| (in thousands) | ||||||||
| Deferred tax assets |
$ | 72,239 | $ | 64,501 | ||||
| Deferred tax liabilities |
(11,903 | ) | (14,027 | ) | ||||
| 60,336 | 50,474 | |||||||
| Valuation allowance |
(4,909 | ) | (4,771 | ) | ||||
| Total deferred tax assets, net |
$ | 55,427 | $ | 45,703 | ||||
79
Table of Contents
EINSTEIN NOAH RESTAURANT GROUP, INC. AND SUBSIDIARIES
Notes to Consolidated Financial Statements
The income tax effects of temporary differences that give rise to significant portions of deferred tax assets and liabilities are as follows:
| December 29, 2009 |
December 28, 2010 |
|||||||
| (As Restated, see Note 3) |
||||||||
| (in thousands) | ||||||||
| Current deferred tax assets and liabilities, net |
||||||||
| Operating loss carryforwards |
$ | 7,664 | $ | 9,650 | ||||
| Senior management transition costs |
72 | — | ||||||
| Allowance for doubtful accounts |
56 | 19 | ||||||
| Deferred revenue |
122 | 109 | ||||||
| §481(a) tax accounting method change |
(354 | ) | — | |||||
| Interest rate swap |
500 | — | ||||||
| Accrued expenses, net |
2,357 | 2,262 | ||||||
| Total gross current deferred tax assets, net of liabilities |
10,417 | 12,040 | ||||||
| Valuation allowance |
(735 | ) | (891 | ) | ||||
| Total current deferred tax assets, net |
9,682 | 11,149 | ||||||
| Long-term deferred tax assets and liabilities, net |
||||||||
| Operating loss carryforwards, net of unrecognized tax benefits |
43,926 | 34,922 | ||||||
| Property, plant and equipment |
13,954 | 13,992 | ||||||
| Intangible assets |
(11,479 | ) | (13,994 | ) | ||||
| Deferred rent |
1,144 | 1,761 | ||||||
| Deferred rent for uncertain tax positions |
407 | — | ||||||
| Stock-based compensation |
1,143 | 1,433 | ||||||
| Alternative minimum tax |
824 | 320 | ||||||
| Total gross long-term deferred tax assets, net of liabilities |
49,919 | 38,434 | ||||||
| Valuation allowance |
(4,174 | ) | (3,880 | ) | ||||
| Total long-term deferred tax assets, net |
45,745 | 34,554 | ||||||
| Total deferred tax assets, net |
$ | 55,427 | $ | 45,703 | ||||
| 15. | SUPPLEMENTAL CASH FLOW INFORMATION |
| 52 weeks ended | ||||||||||||
| December 30, 2008 |
December 29, 2009 |
December 28, 2010 |
||||||||||
| (in thousands) | ||||||||||||
| Cash paid during the year to date period ended: |
||||||||||||
| Interest related to: |
||||||||||||
| Term Loans |
$ | 5,477 | $ | 3,910 | $ | 3,032 | ||||||
| Series Z |
— | 194 | 1,677 | |||||||||
| Other |
226 | 250 | 458 | |||||||||
| Income taxes |
$ | 1,092 | $ | 1,225 | $ | 223 | ||||||
| Non-cash investing activities: |
||||||||||||
| Non-cash purchase of equipment through capital leasing |
$ | 36 | $ | 14 | $ | — | ||||||
| Change in accrued expenses for purchases of property and equipment |
$ | (115 | ) | $ | (295 | ) | $ | (351 | ) | |||
80
Table of Contents
EINSTEIN NOAH RESTAURANT GROUP, INC. AND SUBSIDIARIES
Notes to Consolidated Financial Statements
| 16. | RELATED PARTY TRANSACTIONS |
E. Nelson Heumann is the chairman of the BOD and was an employee of Greenlight Capital, L.L.C. (“Greenlight”) as of December 28, 2010. Subsequent to December 28, 2010, Mr. Heumann retired from Greenlight. Greenlight and its affiliates beneficially owned approximately 64 percent of the Company’s common stock as of December 28, 2010. As a result, Greenlight has sufficient voting power without the vote of any other stockholders to determine what matters will be submitted for approval by the Company’s stockholders, to elect all of the BOD, and among other things, to determine whether a change in control of the Company occurs.
| 17. | COMMITMENTS AND CONTINGENCIES |
Letters of Credit and Line of Credit
As of December 28, 2010, the Company had $7.3 million in letters of credit outstanding on its New Credit Facility with Bank of America. The letters of credit expire on various dates during 2011, are generally automatically renewable for one additional year and are payable upon demand in the event that the Company fails to pay the underlying obligation. Letters of credit reduce the Company’s availability under its revolver, which was $30.0 million as of December 28, 2010.
Capital Leases
The Company leases certain equipment under capital leases. Included in property, plant and equipment are the asset values of $98,000 and $112,000 and the related accumulated amortization of $66,000 and $85,000 as of December 29, 2009 and December 28, 2010, respectively. Amortization of assets under capital leases is included in depreciation and amortization expense.
Operating Leases
The Company leases office space, restaurant space and certain equipment under operating leases having terms that expire at various dates through the fiscal year ended 2021. The restaurant leases have renewal clauses of 1 to 20 years at the Company’s option and, in some cases, have provisions for contingent rent based upon a percentage of gross sales, as defined in the leases. Rent expense for fiscal years ended 2008, 2009 and 2010 was $29.3 million, $31.0 million and $31.1 million, respectively. Contingent rent included in rent expense for fiscal years ended 2008, 2009 and 2010 was approximately $0.1 million, $0.2 million and $0.1 million, respectively. The Company subleases out a portion of its restaurant space on leases where it did not need the entire space for its operations. The Company’s sublease income was $0.5 million, $0.4 million and $0.4 million for fiscal years ended 2008, 2009 and 2010, respectively.
81
Table of Contents
EINSTEIN NOAH RESTAURANT GROUP, INC. AND SUBSIDIARIES
Notes to Consolidated Financial Statements
Future Minimum Lease Payments
As of December 28, 2010, future minimum lease payments under capital and operating leases were as follows:
| Fiscal year: |
Capital Leases |
Operating Leases |
||||||
| (in thousands of dollars) | ||||||||
| 2011 |
$ | 19 | $ | 30,485 | ||||
| 2012 |
8 | 24,214 | ||||||
| 2013 |
6 | 19,374 | ||||||
| 2014 |
— | 16,526 | ||||||
| 2015 |
— | 13,402 | ||||||
| 2016 and thereafter |
— | 21,096 | ||||||
| Total minimum lease payments |
33 | $ | 125,097 | |||||
| Less imputed interest (average rate of 4.75%) |
3 | |||||||
| Present value of minimum lease payments |
30 | |||||||
| Less current portion of obligations under capital leases |
17 | |||||||
| Obligations under capital leases, long-term |
$ | 13 | ||||||
In addition, the total of minimum sublease rentals to be received in the future under non-cancelable subleases as of December 28, 2010 was $1.1 million.
Purchase Commitments
The Company has obligations with certain of its major suppliers of raw materials (primarily frozen bagel dough) for minimum purchases both in terms of quantity and pricing on an annual basis. Furthermore, from time to time, the Company will commit to the purchase price of certain commodities that are related to the ingredients used for the production of its bagels. On a periodic basis, the Company reviews the relationship of these purchase commitments to its business plan, general market trends and its assumptions in its operating plans. If these commitments are deemed to be in excess of the market, the Company will expense the excess purchase commitment to cost of sales in the period in which the shortfall is determined. The total of the Company’s future purchase obligations as of December 28, 2010 was approximately $11.4 million.
Litigation
The Company is subject to claims and legal actions in the ordinary course of business, including claims by or against franchisees, licensees and employees or former employees and/or contract disputes. The Company does not believe any currently pending or threatened matter would have a material adverse effect on its business, results of operations or financial condition.
| 18. | RESTRUCTURING EXPENSE |
During the fourth quarter of fiscal 2010, Company management approved a plan to restructure the organization to align with its franchise growth model. This restructuring included eliminating certain duplicate positions and reducing headcount. The Company recorded $0.5 million in 2010 in severance expense. Any amounts not paid out within 2010 have been accrued for and are included in accrued expenses and other current liabilities in our consolidated balance sheets.
82
Table of Contents
EINSTEIN NOAH RESTAURANT GROUP, INC. AND SUBSIDIARIES
Notes to Consolidated Financial Statements
| 19. | SEGMENTS |
Financial results for fiscal years 2008, 2009 and 2010 are as follows:
| Segments | Corporate support |
Consolidated | ||||||||||||||||||
| Fiscal 2008: | Company-owned restaurants |
Manufacturing and commissary |
Franchise and license |
|||||||||||||||||
| (As Restated, See Note 3) | ||||||||||||||||||||
| (in thousands of dollars) | ||||||||||||||||||||
| Revenues: |
||||||||||||||||||||
| Company-owned restaurant sales |
$ | 376,664 | $ | — | $ | — | $ | — | $ | 376,664 | ||||||||||
| Manufacturing and commissary revenues |
— | 30,369 | — | — | 30,369 | |||||||||||||||
| Franchise and license related revenues |
— | — | 6,417 | — | 6,417 | |||||||||||||||
| Total revenues |
376,664 | 30,369 | 6,417 | — | 413,450 | |||||||||||||||
| Cost of sales: |
||||||||||||||||||||
| Company-owned restaurant costs |
303,116 | — | — | — | 303,116 | |||||||||||||||
| Manufacturing and commissary costs |
— | 28,566 | — | — | 28,566 | |||||||||||||||
| Franchise and license related costs |
— | — | — | — | — | |||||||||||||||
| Total cost of sales |
303,116 | 28,566 | — | — | 331,682 | |||||||||||||||
| Operating expenses |
— | — | — | 54,152 | 54,152 | |||||||||||||||
| Other expenses |
— | — | — | 5,439 | 5,439 | |||||||||||||||
| Provision for income taxes |
— | — | — | 2,468 | 2,468 | |||||||||||||||
| Net income (loss) |
$ | 73,548 | $ | 1,803 | $ | 6,417 | $ | (62,059 | ) | $ | 19,709 | |||||||||
| Total assets |
$ | — | $ | — | $ | — | $ | 172,929 | $ | 172,929 | ||||||||||
| Segments | Corporate support |
Consolidated | ||||||||||||||||||
| Fiscal 2009: | Company-owned restaurants |
Manufacturing and commissary |
Franchise and license |
|||||||||||||||||
| (As Restated, See Note 3) | ||||||||||||||||||||
| (in thousands of dollars) | ||||||||||||||||||||
| Revenues: |
||||||||||||||||||||
| Company-owned restaurant sales |
$ | 370,412 | $ | — | $ | — | $ | — | $ | 370,412 | ||||||||||
| Manufacturing and commissary revenues |
— | 30,638 | — | — | 30,638 | |||||||||||||||
| Franchise and license related revenues |
— | — | 7,512 | — | 7,512 | |||||||||||||||
| Total revenues |
370,412 | 30,638 | 7,512 | — | 408,562 | |||||||||||||||
| Cost of sales: |
||||||||||||||||||||
| Company-owned restaurant costs |
304,257 | — | — | — | 304,257 | |||||||||||||||
| Manufacturing and commissary costs |
— | 26,573 | — | — | 26,573 | |||||||||||||||
| Franchise and license related costs |
— | — | — | — | — | |||||||||||||||
| Total cost of sales |
304,257 | 26,573 | — | — | 330,830 | |||||||||||||||
| Operating expenses |
— | — | — | 52,815 | 52,815 | |||||||||||||||
| Other expenses |
— | — | — | 6,114 | 6,114 | |||||||||||||||
| Benefit for income taxes |
— | — | — | (71,560 | ) | (71,560 | ) | |||||||||||||
| Net income |
$ | 66,155 | $ | 4,065 | $ | 7,512 | $ | 12,631 | $ | 90,363 | ||||||||||
| Total assets |
$ | — | $ | — | $ | — | $ | 213,258 | $ | 213,258 | ||||||||||
83
Table of Contents
EINSTEIN NOAH RESTAURANT GROUP, INC. AND SUBSIDIARIES
Notes to Consolidated Financial Statements
| Segments | Corporate support |
Consolidated | ||||||||||||||||||
| Fiscal 2010: | Company-owned restaurants |
Manufacturing and commissary |
Franchise and license |
|||||||||||||||||
| (in thousands of dollars) | ||||||||||||||||||||
| Revenues: |
||||||||||||||||||||
| Company-owned restaurant sales |
$ | 372,191 | $ | — | $ | — | $ | — | $ | 372,191 | ||||||||||
| Manufacturing and commissary revenues |
— | 30,405 | — | — | 30,405 | |||||||||||||||
| Franchise and license related revenues |
— | — | 9,115 | — | 9,115 | |||||||||||||||
| Total revenues |
372,191 | 30,405 | 9,115 | — | 411,711 | |||||||||||||||
| Cost of sales: |
||||||||||||||||||||
| Company-owned restaurant costs |
302,357 | — | — | — | 302,357 | |||||||||||||||
| Manufacturing and commissary costs |
— | 25,566 | — | — | 25,566 | |||||||||||||||
| Franchise and license related costs |
— | — | — | — | — | |||||||||||||||
| Total cost of sales |
302,357 | 25,566 | — | — | 327,923 | |||||||||||||||
| Operating expenses |
— | — | — | 56,217 | 56,217 | |||||||||||||||
| Other expenses |
— | — | — | 7,030 | 7,030 | |||||||||||||||
| Provision for income taxes |
— | — | — | 9,918 | 9,918 | |||||||||||||||
| Net income (loss) |
$ | 69,834 | $ | 4,839 | $ | 9,115 | $ | (73,165 | ) | $ | 10,623 | |||||||||
| Total assets |
$ | — | $ | — | $ | — | $ | 205,067 | $ | 205,067 | ||||||||||
| 20. | QUARTERLY RESULTS OF OPERATIONS (UNAUDITED) |
The following table summarizes the unaudited consolidated quarterly results of operations for fiscal years ended 2008, 2009 and 2010:
| Fiscal year 2008: | ||||||||||||||||
| 1st Quarter (13 wks) |
2nd Quarter (13 wks) |
3rd Quarter (13 wks) |
4th Quarter (13 wks) |
|||||||||||||
| (As Restated, See Note 3) |
(As Restated, See Note 3) |
(As Restated, See Note 3) |
(As Restated, See Note 3) |
|||||||||||||
| (in thousands, except earnings per share and related share information) |
||||||||||||||||
| Revenue |
$ | 103,264 | $ | 105,414 | $ | 100,895 | $ | 103,877 | ||||||||
| Income from operations |
5,563 | 8,540 | 5,997 | 7,516 | ||||||||||||
| Net income |
3,500 | 6,572 | 4,195 | 5,442 | ||||||||||||
| Net income per common share—Basic |
$ | 0.22 | $ | 0.41 | $ | 0.26 | $ | 0.34 | ||||||||
| Net income per common share—Diluted |
$ | 0.21 | $ | 0.40 | $ | 0.26 | $ | 0.34 | ||||||||
| Weighted average number of common shares outstanding: |
||||||||||||||||
| Basic |
15,890,879 | 15,925,876 | 15,948,180 | 15,974,248 | ||||||||||||
| Diluted |
16,451,556 | 16,398,822 | 16,412,748 | 16,179,269 | ||||||||||||
84
Table of Contents
EINSTEIN NOAH RESTAURANT GROUP, INC. AND SUBSIDIARIES
Notes to Consolidated Financial Statements
| Fiscal year 2009: | ||||||||||||||||
| 1st Quarter (13 wks) |
2nd Quarter (13 wks) |
3rd Quarter (13 wks) |
4th Quarter (13 wks) |
|||||||||||||
| (As Restated, See Note 3) |
(As Restated, See Note 3) |
(As Restated, See Note 3) |
||||||||||||||
| (in thousands, except earnings per share and related share information) |
||||||||||||||||
| Revenue |
$ | 100,423 | $ | 104,358 | $ | 100,046 | $ | 103,735 | ||||||||
| Income from operations |
3,117 | 8,015 | 6,213 | 7,572 | ||||||||||||
| Net income (a) |
1,470 | 6,086 | 79,989 | 2,818 | ||||||||||||
| Net income per common share—Basic |
$ | 0.10 | $ | 0.38 | $ | 4.93 | $ | 0.17 | ||||||||
| Net income per common share—Diluted |
$ | 0.09 | $ | 0.37 | $ | 4.80 | $ | 0.17 | ||||||||
| Weighted average number of common shares outstanding: |
||||||||||||||||
| Basic |
16,025,935 | 16,047,305 | 16,236,271 | 16,392,052 | ||||||||||||
| Diluted |
16,216,152 | 16,412,363 | 16,693,843 | 16,730,940 | ||||||||||||
| Fiscal year 2010: | ||||||||||||||||
| 1st Quarter (13 wks) |
2nd Quarter (13 wks) |
3rd Quarter (13 wks) |
4th Quarter (13 wks) |
|||||||||||||
| (in thousands, except earnings per share and related share information) |
||||||||||||||||
| Revenue |
$ | 100,812 | $ | 103,473 | $ | 101,361 | $ | 106,065 | ||||||||
| Income from operations |
4,458 | 7,166 | 7,044 | 8,902 | ||||||||||||
| Net income (b) |
620 | 3,248 | 3,400 | 3,354 | ||||||||||||
| Less: Additional redemption on temporary equity |
(50 | ) | (191 | ) | (124 | ) | (22 | ) | ||||||||
| Less: Beneficial conversion feature on temporary equity |
— | — | 169 | (169 | ) | |||||||||||
| Add: Accretion of premium on Series Z preferred stock |
— | 499 | 138 | 435 | ||||||||||||
| Net income available to common stockholders |
$ | 570 | $ | 3,556 | $ | 3,583 | $ | 3,598 | ||||||||
| Net income available to common stockholders per share—Basic |
$ | 0.03 | $ | 0.22 | $ | 0.22 | $ | 0.22 | ||||||||
| Net income available to common stockholders per share—Diluted |
$ | 0.03 | $ | 0.21 | $ | 0.21 | $ | 0.21 | ||||||||
| Cash dividend declared |
$ | — | $ | — | $ | — | $ | 0.125 | ||||||||
| Weighted average number of common shares outstanding: |
||||||||||||||||
| Basic |
16,467,072 | 16,496,118 | 16,565,771 | 16,600,719 | ||||||||||||
| Diluted |
16,765,609 | 16,813,355 | 16,791,275 | 16,853,782 | ||||||||||||
| (a) | In the third quarter of 2009, the Company reduced its $84.3 million valuation allowance by $79.3 million to $4.9 million, as restated. |
| (b) | In connection with the debt redemption and the Company’s New Credit Facility, the Company wrote off $1.0 million of debt issuance costs during the fourth quarter ended 2010. |
85
Table of Contents
EINSTEIN NOAH RESTAURANT GROUP, INC. AND SUBSIDIARIES
Notes to Consolidated Financial Statements
The following sets forth the effects of the restatement (see Note 3) to the Company’s Consolidated Balance Sheets as of April 1, 2008, July 1, 2008 and September 30, 2008 and to the Company’s Consolidated Statements of Operations for the quarterly periods then ended.
CONSOLIDATED BALANCE SHEETS
(in thousands, except share information)
(Unaudited)
| April 1, 2008 | July 1, 2008 | September 30, 2008 | ||||||||||||||||||||||
| As reported | As restated | As reported | As restated | As reported | As restated | |||||||||||||||||||
| ASSETS |
||||||||||||||||||||||||
| Current assets: |
||||||||||||||||||||||||
| Cash and cash equivalents |
$ | 13,945 | $ | 13,945 | $ | 18,416 | $ | 18,416 | $ | 22,150 | $ | 22,150 | ||||||||||||
| Restricted cash |
1,170 | 1,170 | 876 | 876 | 887 | 887 | ||||||||||||||||||
| Franchise and other receivables, net of allowance of $582, $278 and $278, respectively |
7,808 | 7,808 | 6,498 | 6,498 | 7,207 | 7,207 | ||||||||||||||||||
| Inventories |
5,042 | 5,042 | 4,917 | 4,917 | 5,033 | 5,033 | ||||||||||||||||||
| Prepaid expenses and other current assets |
4,791 | 4,791 | 5,036 | 5,036 | 4,684 | 4,684 | ||||||||||||||||||
| Total current assets |
32,756 | 32,756 | 35,743 | 35,743 | 39,961 | 39,961 | ||||||||||||||||||
| Property, plant and equipment, net |
49,599 | 49,599 | 52,532 | 52,532 | 56,180 | 56,180 | ||||||||||||||||||
| Trademarks and other intangibles, net |
63,831 | 63,831 | 63,831 | 63,831 | 63,831 | 63,831 | ||||||||||||||||||
| Goodwill |
4,981 | 4,981 | 4,981 | 4,981 | 4,981 | 4,981 | ||||||||||||||||||
| Debt issuance costs and other assets, net |
2,992 | 2,992 | 2,881 | 2,881 | 2,769 | 2,769 | ||||||||||||||||||
| Total assets |
$ | 154,159 | $ | 154,159 | $ | 159,968 | $ | 159,968 | $ | 167,722 | $ | 167,722 | ||||||||||||
| LIABILITIES AND STOCKHOLDERS’ DEFICIT |
||||||||||||||||||||||||
| Current liabilities: |
||||||||||||||||||||||||
| Accounts payable |
$ | 4,481 | $ | 4,481 | $ | 5,472 | $ | 5,472 | $ | 4,976 | $ | 4,976 | ||||||||||||
| Accrued expenses and other current liabilities |
22,068 | 22,068 | 19,795 | 19,795 | 23,375 | 23,375 | ||||||||||||||||||
| Short term debt and current portion of long-term debt |
1,180 | 1,180 | 1,180 | 1,180 | 9,180 | 9,180 | ||||||||||||||||||
| Current portion of obligations under capital leases |
79 | 79 | 79 | 79 | 86 | 86 | ||||||||||||||||||
| Mandatorily redeemable, Series Z Preferred Stock, $.001 par value, $1,000 per share liquidation value; 57,000 shares authorized; 57,000 shares issued and outstanding as of July 1, 2008 and September 30, 2008 |
— | — | 57,000 | 57,000 | 57,000 | 57,000 | ||||||||||||||||||
| Total current liabilities |
27,808 | 27,808 | 83,526 | 83,526 | 94,617 | 94,617 | ||||||||||||||||||
| Senior notes and other long-term debt |
87,425 | 87,425 | 87,200 | 87,200 | 78,975 | 78,975 | ||||||||||||||||||
| Long-term obligations under capital leases |
48 | 48 | 29 | 29 | 72 | 72 | ||||||||||||||||||
| Long-term deferred income tax liabilities |
— | 15,305 | — | 15,647 | — | 15,989 | ||||||||||||||||||
| Other liabilities |
10,953 | 10,953 | 11,034 | 11,034 | 11,386 | 11,386 | ||||||||||||||||||
| Mandatorily redeemable, Series Z Preferred Stock, $.001 par value, $1,000 per share liquidation value; 57,000 shares authorized; 57,000 shares issued and outstanding as of April 1, 2008 |
57,000 | 57,000 | — | — | — | — | ||||||||||||||||||
| Total liabilities |
183,234 | 198,539 | 181,789 | 197,436 | 185,050 | 201,039 | ||||||||||||||||||
| Commitments and contingencies |
||||||||||||||||||||||||
| Stockholders’ deficit: |
||||||||||||||||||||||||
| Series A junior participating preferred stock, 700,000 shares authorized; no shares issued and outstanding |
||||||||||||||||||||||||
| Common stock, $.001 par value; 25,000,000 shares authorized; 15,923,227, 15,932,856 and 15,975,251 shares issued and outstanding |
16 | 16 | 16 | 16 | 16 | 16 | ||||||||||||||||||
| Additional paid-in capital |
263,520 | 263,520 | 263,860 | 263,860 | 264,105 | 264,105 | ||||||||||||||||||
| Accumulated other comprehensive loss |
— | — | — | — | (289 | ) | (289 | ) | ||||||||||||||||
| Accumulated deficit |
(292,611 | ) | (307,916 | ) | (285,697 | ) | (301,344 | ) | (281,160 | ) | (297,149 | ) | ||||||||||||
| Total stockholders’ deficit |
(29,075 | ) | (44,380 | ) | (21,821 | ) | (37,468 | ) | (17,328 | ) | (33,317 | ) | ||||||||||||
| Total liabilities and stockholders’ deficit |
$ | 154,159 | $ | 154,159 | $ | 159,968 | $ | 159,968 | $ | 167,722 | $ | 167,722 | ||||||||||||
86
Table of Contents
EINSTEIN NOAH RESTAURANT GROUP, INC. AND SUBSIDIARIES
Notes to Consolidated Financial Statements
CONSOLIDATED STATEMENTS OF OPERATIONS
(in thousands, except earnings per share and related share information)
(unaudited)
| Thirteen weeks ended | ||||||||||||||||||||||||
| April 1, 2008 | July 1, 2008 | September 30, 2008 | ||||||||||||||||||||||
| As reported | As restated | As reported | As restated | As reported | As restated | |||||||||||||||||||
| Revenues: |
||||||||||||||||||||||||
| Company-owned restaurant sales |
$ | 93,610 | $ | 93,610 | $ | 96,321 | $ | 96,321 | $ | 92,400 | $ | 92,400 | ||||||||||||
| Manufacturing and commissary revenues |
8,088 | 8,088 | 7,640 | 7,640 | 6,991 | 6,991 | ||||||||||||||||||
| Franchise and license related revenues |
1,566 | 1,566 | 1,453 | 1,453 | 1,504 | 1,504 | ||||||||||||||||||
| Total revenues |
103,264 | 103,264 | 105,414 | 105,414 | 100,895 | 100,895 | ||||||||||||||||||
| Cost of sales: |
||||||||||||||||||||||||
| Company-owned restaurant costs |
75,825 | 75,825 | 76,648 | 76,648 | 75,189 | 75,189 | ||||||||||||||||||
| Manufacturing and commissary costs |
7,860 | 7,860 | 7,224 | 7,224 | 6,523 | 6,523 | ||||||||||||||||||
| Total cost of sales |
83,685 | 83,685 | 83,872 | 83,872 | 81,712 | 81,712 | ||||||||||||||||||
| Gross profit |
19,579 | 19,579 | 21,542 | 21,542 | 19,183 | 19,183 | ||||||||||||||||||
| Operating expenses: |
||||||||||||||||||||||||
| General and administrative expenses |
10,743 | 10,743 | 9,540 | 9,540 | 7,652 | 7,652 | ||||||||||||||||||
| California wage and hour settlements |
— | — | — | — | 1,900 | 1,900 | ||||||||||||||||||
| Depreciation and amortization |
3,204 | 3,204 | 3,345 | 3,345 | 3,644 | 3,644 | ||||||||||||||||||
| Loss on sale, disposal or abandonment of assets, net |
69 | 69 | 63 | 63 | (10 | ) | (10 | ) | ||||||||||||||||
| Impairment charges and other related costs |
— | — | 54 | 54 | — | — | ||||||||||||||||||
| Income from operations |
5,563 | 5,563 | 8,540 | 8,540 | 5,997 | 5,997 | ||||||||||||||||||
| Other expense: |
||||||||||||||||||||||||
| Interest expense, net |
1,579 | 1,579 | 1,328 | 1,328 | 1,250 | 1,250 | ||||||||||||||||||
| Income before income taxes |
3,984 | 3,984 | 7,212 | 7,212 | 4,747 | 4,747 | ||||||||||||||||||
| Provision for income taxes |
142 | 484 | 298 | 640 | 210 | 552 | ||||||||||||||||||
| Net income |
$ | 3,842 | $ | 3,500 | $ | 6,914 | $ | 6,572 | $ | 4,537 | $ | 4,195 | ||||||||||||
| Net income per common share— |
$ | 0.24 | $ | 0.22 | $ | 0.43 | $ | 0.41 | $ | 0.28 | $ | 0.26 | ||||||||||||
| Net income per common share— Diluted |
$ | 0.23 | $ | 0.21 | $ | 0.42 | $ | 0.40 | $ | 0.28 | $ | 0.26 | ||||||||||||
| Weighted average number of common shares outstanding: |
||||||||||||||||||||||||
| Basic |
15,890,879 | 15,890,879 | 15,925,876 | 15,925,876 | 15,948,180 | 15,948,180 | ||||||||||||||||||
| Diluted |
16,451,556 | 16,451,556 | 16,398,822 | 16,398,822 | 16,412,748 | 16,412,748 | ||||||||||||||||||
87
Table of Contents
EINSTEIN NOAH RESTAURANT GROUP, INC. AND SUBSIDIARIES
Notes to Consolidated Financial Statements
The following sets forth the effects of the restatement to the Company’s Consolidated Balance Sheets as of March 31, 2009, June 30, 2009 and September 29, 2009 and to the Company’s Consolidated Statements of Operations for the quarterly periods then ended.
CONSOLIDATED BALANCE SHEETS
(in thousands, except share information)
(Unaudited)
| March 31, 2009 | June 30, 2009 | September 29, 2009 | ||||||||||||||||||||||
| As reported | As restated | As reported | As restated | As reported | As restated | |||||||||||||||||||
| ASSETS |
||||||||||||||||||||||||
| Current assets: |
||||||||||||||||||||||||
| Cash and cash equivalents |
$ | 21,359 | $ | 21,359 | $ | 3,215 | $ | 3,215 | $ | 11,103 | $ | 11,103 | ||||||||||||
| Restricted cash |
472 | 472 | 386 | 386 | 447 | 447 | ||||||||||||||||||
| Accounts receivable, net of allowance for doubtful accounts of $230, $179 and $181, respectively |
6,461 | 6,461 | 6,212 | 6,212 | 6,177 | 6,177 | ||||||||||||||||||
| Inventories |
5,061 | 5,061 | 5,073 | 5,073 | 4,948 | 4,948 | ||||||||||||||||||
| Current deferred income tax assets |
— | — | — | — | 8,221 | 8,221 | ||||||||||||||||||
| Prepaid expenses and other current assets |
4,927 | 4,927 | 5,293 | 5,293 | 5,366 | 5,366 | ||||||||||||||||||
| Total current assets |
38,280 | 38,280 | 20,179 | 20,179 | 36,262 | 36,262 | ||||||||||||||||||
| Property, plant and equipment, net |
58,564 | 58,564 | 57,827 | 57,827 | 57,070 | 57,070 | ||||||||||||||||||
| Trademarks and other intangibles, net |
63,831 | 63,831 | 63,831 | 63,831 | 63,831 | 63,831 | ||||||||||||||||||
| Goodwill |
4,981 | 4,981 | 4,981 | 4,981 | 4,981 | 4,981 | ||||||||||||||||||
| Long-term deferred income tax assets, net |
— | — | — | — | 48,462 | 50,499 | ||||||||||||||||||
| Debt issuance costs and other assets, net |
2,982 | 2,982 | 3,285 | 3,285 | 3,186 | 3,186 | ||||||||||||||||||
| Total assets |
$ | 168,638 | $ | 168,638 | $ | 150,103 | $ | 150,103 | $ | 213,792 | $ | 215,829 | ||||||||||||
| LIABILITIES AND STOCKHOLDERS’ DEFICIT |
||||||||||||||||||||||||
| Current liabilities: |
||||||||||||||||||||||||
| Accounts payable |
$ | 5,649 | $ | 5,649 | $ | 4,925 | $ | 4,925 | $ | 4,270 | $ | 4,270 | ||||||||||||
| Accrued expenses and other current liabilities |
22,807 | 22,807 | 18,513 | 18,513 | 22,255 | 22,255 | ||||||||||||||||||
| Current portion of long-term debt |
5,752 | 5,752 | 6,786 | 6,786 | 6,407 | 6,407 | ||||||||||||||||||
| Current portion of obligations under capital leases |
42 | 42 | 27 | 27 | 24 | 24 | ||||||||||||||||||
| Mandatorily redeemable, Series Z Preferred Stock, $.001 par value, $1,000 per share liquidation value; 57,000 shares authorized; 57,000, 37,000 and 37,000 shares issued and outstanding, respectively |
57,000 | 57,000 | 37,000 | 37,000 | 37,000 | 37,000 | ||||||||||||||||||
| Total current liabilities |
91,250 | 91,250 | 67,251 | 67,251 | 69,956 | 69,956 | ||||||||||||||||||
| Long-term debt |
74,485 | 74,485 | 73,226 | 73,226 | 73,605 | 73,605 | ||||||||||||||||||
| Long-term deferred income tax liabilities |
— | 16,711 | — | 17,091 | — | — | ||||||||||||||||||
| Long-term obligations under capital leases |
35 | 35 | 30 | 30 | 24 | 24 | ||||||||||||||||||
| Other liabilities |
14,216 | 14,216 | 13,789 | 13,789 | 11,909 | 11,909 | ||||||||||||||||||
| Total liabilities |
179,986 | 196,697 | 154,296 | 171,387 | 155,494 | 155,494 | ||||||||||||||||||
| Commitments and contingencies |
||||||||||||||||||||||||
| Stockholders’ deficit: |
||||||||||||||||||||||||
| Series A junior participating preferred stock, 700,000 shares authorized; no shares issued and outstanding |
||||||||||||||||||||||||
| Common stock, $.001 par value; 25,000,000 shares authorized; 16,032,943, 16,057,595 and 16,355,679 shares issued and outstanding, respectively |
16 | 16 | 16 | 16 | 16 | 16 | ||||||||||||||||||
| Additional paid-in capital |
264,434 | 264,434 | 264,777 | 264,777 | 266,268 | 266,268 | ||||||||||||||||||
| Accumulated other comprehensive loss |
(2,272 | ) | (2,272 | ) | (1,926 | ) | (1,926 | ) | (1,787 | ) | (1,787 | ) | ||||||||||||
| Accumulated deficit |
(273,526 | ) | (290,237 | ) | (267,060 | ) | (284,151 | ) | (206,199 | ) | (204,162 | ) | ||||||||||||
| Total stockholders’ (deficit)/equity |
(11,348 | ) | (28,059 | ) | (4,193 | ) | (21,284 | ) | 58,298 | 60,335 | ||||||||||||||
| Total liabilities and stockholders’ deficit |
$ | 168,638 | $ | 168,638 | $ | 150,103 | $ | 150,103 | $ | 213,792 | $ | 215,829 | ||||||||||||
88
Table of Contents
EINSTEIN NOAH RESTAURANT GROUP, INC. AND SUBSIDIARIES
Notes to Consolidated Financial Statements
CONSOLIDATED STATEMENTS OF OPERATIONS
(in thousands, except earnings per share and related share information)
(unaudited)
| Thirteen weeks ended | ||||||||||||||||||||||||
| March 31, 2009 | June 30, 2009 | September 29, 2009 | ||||||||||||||||||||||
| As reported | As restated | As reported | As restated | As reported | As restated | |||||||||||||||||||
| Revenues: |
||||||||||||||||||||||||
| Company-owned restaurant sales |
$ | 90,454 | $ | 90,454 | $ | 95,052 | $ | 95,052 | $ | 91,237 | $ | 91,237 | ||||||||||||
| Manufacturing and commissary revenues |
8,127 | 8,127 | 7,613 | 7,613 | 7,050 | 7,050 | ||||||||||||||||||
| Franchise and license related revenues |
1,842 | 1,842 | 1,693 | 1,693 | 1,759 | 1,759 | ||||||||||||||||||
| Total revenues |
100,423 | 100,423 | 104,358 | 104,358 | 100,046 | 100,046 | ||||||||||||||||||
| Cost of sales: |
||||||||||||||||||||||||
| Company-owned restaurant costs |
76,997 | 76,997 | 76,844 | 76,844 | 75,232 | 75,232 | ||||||||||||||||||
| Manufacturing and commissary costs |
6,997 | 6,997 | 6,635 | 6,635 | 6,187 | 6,187 | ||||||||||||||||||
| Total cost of sales |
83,994 | 83,994 | 83,479 | 83,479 | 81,419 | 81,419 | ||||||||||||||||||
| Gross profit |
16,429 | 16,429 | 20,879 | 20,879 | 18,627 | 18,627 | ||||||||||||||||||
| Operating expenses: |
||||||||||||||||||||||||
| General and administrative expenses |
9,280 | 9,280 | 8,993 | 8,993 | 8,100 | 8,100 | ||||||||||||||||||
| Depreciation and amortization |
4,033 | 4,033 | 4,106 | 4,106 | 4,222 | 4,222 | ||||||||||||||||||
| Net loss (gain) on disposal of assets |
(1 | ) | (1 | ) | (235 | ) | (235 | ) | 92 | 92 | ||||||||||||||
| Income from operations |
3,117 | 3,117 | 8,015 | 8,015 | 6,213 | 6,213 | ||||||||||||||||||
| Other expense: |
||||||||||||||||||||||||
| Interest expense, net |
1,190 | 1,190 | 1,156 | 1,156 | 1,894 | 1,894 | ||||||||||||||||||
| Income before income taxes |
1,927 | 1,927 | 6,859 | 6,859 | 4,319 | 4,319 | ||||||||||||||||||
| Provision (benefit) for income tax |
77 | 457 | 393 | 773 | (56,542 | ) | (75,670 | ) | ||||||||||||||||
| Net income |
$ | 1,850 | $ | 1,470 | $ | 6,466 | $ | 6,086 | $ | 60,861 | $ | 79,989 | ||||||||||||
| Net income per common share—Basic |
$ | 0.12 | $ | 0.10 | $ | 0.40 | $ | 0.38 | $ | 3.75 | $ | 4.93 | ||||||||||||
| Net income per common share—Diluted |
$ | 0.11 | $ | 0.09 | $ | 0.39 | $ | 0.37 | $ | 3.65 | $ | 4.80 | ||||||||||||
| Weighted average number of common shares outstanding: |
||||||||||||||||||||||||
| Basic |
16,025,935 | 16,025,935 | 16,047,305 | 16,047,305 | 16,236,271 | 16,236,271 | ||||||||||||||||||
| Diluted |
16,216,152 | 16,216,152 | 16,412,363 | 16,412,363 | 16,693,843 | 16,693,843 | ||||||||||||||||||
89
Table of Contents
EINSTEIN NOAH RESTAURANT GROUP, INC. AND SUBSIDIARIES
Notes to Consolidated Financial Statements
The following sets forth the effects of the restatement to the Company’s Consolidated Balance Sheets as of March 30, 2010, June 29, 2010 and September 28, 2010.
CONSOLIDATED BALANCE SHEETS
(in thousands, except share information)
(Unaudited)
| March 30, 2010 | June 29, 2010 | September 28, 2010 | ||||||||||||||||||||||
| As reported | As restated | As reported | As restated | reported | As restated | |||||||||||||||||||
| ASSETS |
||||||||||||||||||||||||
| Current assets: |
||||||||||||||||||||||||
| Cash and cash equivalents |
$ | 10,766 | $ | 10,766 | $ | 9,363 | $ | 9,363 | $ | 12,447 | $ | 12,447 | ||||||||||||
| Restricted cash |
547 | 547 | 446 | 446 | 586 | 586 | ||||||||||||||||||
| Accounts receivable |
5,674 | 5,674 | 4,422 | 4,422 | 6,114 | 6,114 | ||||||||||||||||||
| Inventories |
5,003 | 5,003 | 5,117 | 5,117 | 5,231 | 5,231 | ||||||||||||||||||
| Current deferred income tax assets |
7,029 | 7,304 | 5,856 | 6,094 | 4,814 | 5,017 | ||||||||||||||||||
| Prepaid expenses |
6,903 | 6,903 | 6,331 | 6,331 | 6,632 | 6,632 | ||||||||||||||||||
| Other current assets |
73 | 73 | 122 | 122 | 66 | 66 | ||||||||||||||||||
| Total current assets |
35,995 | 36,270 | 31,657 | 31,895 | 35,890 | 36,093 | ||||||||||||||||||
| Property, plant and equipment, net |
58,616 | 58,616 | 58,071 | 58,071 | 55,757 | 55,757 | ||||||||||||||||||
| Trademarks and other intangibles, net |
63,831 | 63,831 | 63,831 | 63,831 | 63,831 | 63,831 | ||||||||||||||||||
| Goodwill |
4,981 | 4,981 | 4,981 | 4,981 | 4,981 | 4,981 | ||||||||||||||||||
| Long-term deferred income tax assets |
45,209 | 46,971 | 43,983 | 45,782 | 43,608 | 45,442 | ||||||||||||||||||
| Debt issuance costs and other assets, net |
2,900 | 2,900 | 2,844 | 2,844 | 2,701 | 2,701 | ||||||||||||||||||
| Total assets |
$ | 211,532 | $ | 213,569 | $ | 205,367 | $ | 207,404 | $ | 206,768 | $ | 208,805 | ||||||||||||
| LIABILITIES AND STOCKHOLDERS’ EQUITY |
||||||||||||||||||||||||
| Current liabilities: |
||||||||||||||||||||||||
| Accounts payable |
$ | 6,138 | $ | 6,138 | $ | 5,994 | $ | 5,994 | $ | 6,581 | $ | 6,581 | ||||||||||||
| Accrued expenses and other current liabilities |
23,170 | 23,170 | 18,207 | 18,207 | 21,675 | 21,675 | ||||||||||||||||||
| Current portion of long-term debt |
11,900 | 11,900 | 11,900 | 11,900 | 11,900 | 11,900 | ||||||||||||||||||
| Current portion of obligations under capital leases |
20 | 20 | 18 | 18 | 20 | 20 | ||||||||||||||||||
| Mandatorily redeemable, Series Z Preferred Stock, $.001 par value, $1,000 per share liquidation value; 57,000 shares authorized; 9,495, 6,481 and 0 shares outstanding |
9,352 | 9,352 | 6,404 | 6,404 | — | — | ||||||||||||||||||
| Total current liabilities |
50,580 | 50,580 | 42,523 | 42,523 | 40,176 | 40,176 | ||||||||||||||||||
| Long-term debt |
74,328 | 74,328 | 74,103 | 74,103 | 73,878 | 73,878 | ||||||||||||||||||
| Long-term obligations under capital leases |
15 | 15 | 12 | 12 | 16 | 16 | ||||||||||||||||||
| Other liabilities |
12,328 | 12,328 | 12,565 | 12,565 | 12,252 | 12,252 | ||||||||||||||||||
| Total liabilities |
137,251 | 137,251 | 129,203 | 129,203 | 126,322 | 126,322 | ||||||||||||||||||
| Commitments and contingencies |
||||||||||||||||||||||||
| Series Z Preferred Stock, $.001 par value, $1,000 per share liquidation value; 9,494, 6,480 and 6,480 shares outstanding, respectively |
10,566 | 10,566 | 7,571 | 7,571 | 7,388 | 7,388 | ||||||||||||||||||
| Stockholders’ equity: |
||||||||||||||||||||||||
| Series A junior participating preferred stock, 700,000 shares authorized; no shares issued and outstanding |
— | — | — | — | — | — | ||||||||||||||||||
| Common stock, $.001 par value; 25,000,000 shares authorized; |
||||||||||||||||||||||||
| 16,470,719, 16,551,221 and 16,578,109 shares issued and outstanding, respectively |
16 | 16 | 17 | 17 | 17 | 17 | ||||||||||||||||||
| Additional paid-in capital |
267,293 | 267,293 | 268,427 | 268,427 | 269,154 | 269,154 | ||||||||||||||||||
| Accumulated other comprehensive loss, net of income tax |
(833 | ) | (833 | ) | (338 | ) | (338 | ) | — | — | ||||||||||||||
| Accumulated deficit |
(202,761 | ) | (200,724 | ) | (199,513 | ) | (197,476 | ) | (196,113 | ) | (194,076 | ) | ||||||||||||
| Total stockholders’ equity |
63,715 | 65,752 | 68,593 | 70,630 | 73,058 | 75,095 | ||||||||||||||||||
| Total liabilities and stockholders’ equity |
$ | 211,532 | $ | 213,569 | $ | 205,367 | $ | 207,404 | $ | 206,768 | $ | 208,805 | ||||||||||||
90
Table of Contents
EINSTEIN NOAH RESTAURANT GROUP, INC. AND SUBSIDIARIES
Notes to Consolidated Financial Statements
The following tables summarize the unaudited consolidated quarterly results on the Company’s Consolidated Balance Sheets as of and for fiscal years ended 2008 and 2009 and the related 13 week periods for each Consolidated Statement of Operations presented as well as the 13, 26, 39 and 52 weeks ended for the Consolidated Statements of Cash Flows presented:
| As Reported | ||||||||||||||||
| Fiscal Year Ended 2008: | April 1, 2008 |
July 1, 2008 |
September 30, 2008 |
December 30, 2008 |
||||||||||||
| (in thousands) | ||||||||||||||||
| Consolidated Balance Sheets |
||||||||||||||||
| Deferred income tax liabilities |
$ | — | $ | — | $ | — | $ | — | ||||||||
| Total liabilities |
183,234 | 181,789 | 185,050 | 186,580 | ||||||||||||
| Accumulated deficit |
(292,611 | ) | (285,697 | ) | (281,160 | ) | (275,376 | ) | ||||||||
| Total stockholders’ deficit |
(29,075 | ) | (21,821 | ) | (17,328 | ) | (13,651 | ) | ||||||||
| Total liabilities and stockholders’ deficit |
154,159 | 159,968 | 167,722 | 172,929 | ||||||||||||
| As Restated | ||||||||||||||||
| April 1, 2008 |
July 1, 2008 |
September 30, 2008 |
December 30, 2008 |
|||||||||||||
| (in thousands) | ||||||||||||||||
| Consolidated Balance Sheets |
||||||||||||||||
| Deferred income tax liabilities |
$ | 15,305 | $ | 15,647 | $ | 15,989 | $ | 16,331 | ||||||||
| Total liabilities |
198,539 | 197,436 | 201,039 | 202,911 | ||||||||||||
| Accumulated deficit |
(307,916 | ) | (301,344 | ) | (297,149 | ) | (291,707 | ) | ||||||||
| Total stockholders’ deficit |
(44,380 | ) | (37,468 | ) | (33,317 | ) | (29,982 | ) | ||||||||
| Total liabilities and stockholders’ deficit |
154,159 | 159,968 | 167,722 | 172,929 | ||||||||||||
| Difference | ||||||||||||||||
| April 1, 2008 |
July 1, 2008 |
September 30, 2008 |
December 30, 2008 |
|||||||||||||
| (in thousands) | ||||||||||||||||
| Consolidated Balance Sheets |
||||||||||||||||
| Deferred income tax liabilities |
$ | 15,305 | $ | 15,647 | $ | 15,989 | $ | 16,331 | ||||||||
| Total liabilities |
15,305 | 15,647 | 15,989 | 16,331 | ||||||||||||
| Accumulated deficit |
(15,305 | ) | (15,647 | ) | (15,989 | ) | (16,331 | ) | ||||||||
| Total stockholders’ deficit |
(15,305 | ) | (15,647 | ) | (15,989 | ) | (16,331 | ) | ||||||||
| Total liabilities and stockholders’ deficit |
— | — | — | — | ||||||||||||
91
Table of Contents
EINSTEIN NOAH RESTAURANT GROUP, INC. AND SUBSIDIARIES
Notes to Consolidated Financial Statements
| As Reported | ||||||||||||||||
| April 1, 2008 |
July 1, 2008 |
September 30, 2008 |
December 30, 2008 |
|||||||||||||
| (in thousands, except earnings per share information) | ||||||||||||||||
| Consolidated Statements of Operations |
||||||||||||||||
| Provision for income tax |
$ | 142 | $ | 298 | $ | 210 | $ | 450 | ||||||||
| Net income |
3,842 | 6,914 | 4,537 | 5,784 | ||||||||||||
| Net income available to common stockholders per share—Basic |
$ | 0.24 | $ | 0.43 | $ | 0.28 | $ | 0.36 | ||||||||
| Net income available to common stockholders per share—Diluted |
$ | 0.23 | $ | 0.42 | $ | 0.28 | $ | 0.36 | ||||||||
| As Restated | ||||||||||||||||
| April 1, 2008 |
July 1, 2008 |
September 30, 2008 |
December 30, 2008 |
|||||||||||||
| (in thousands, except earnings per share information) | ||||||||||||||||
| Consolidated Statements of Operations |
||||||||||||||||
| Provision for income tax |
$ | 484 | $ | 640 | $ | 552 | $ | 792 | ||||||||
| Net income |
3,500 | 6,572 | 4,195 | 5,442 | ||||||||||||
| Net income available to common stockholders per share—Basic |
$ | 0.22 | $ | 0.41 | $ | 0.26 | $ | 0.34 | ||||||||
| Net income available to common stockholders per share—Diluted |
$ | 0.21 | $ | 0.40 | $ | 0.26 | $ | 0.34 | ||||||||
| Difference | ||||||||||||||||
| April 1, 2008 |
July 1, 2008 |
September 30, 2008 |
December 30, 2008 |
|||||||||||||
| (in thousands, except earnings per share information) | ||||||||||||||||
| Consolidated Statements of Operations |
||||||||||||||||
| Provision for income tax |
$ | 342 | $ | 342 | $ | 342 | $ | 342 | ||||||||
| Net income |
(342 | ) | (342 | ) | (342 | ) | (342 | ) | ||||||||
| Net income available to common stockholders per share—Basic |
$ | (0.02 | ) | $ | (0.02 | ) | $ | (0.02 | ) | $ | (0.02 | ) | ||||
| Net income available to common stockholders per share—Diluted |
$ | (0.02 | ) | $ | (0.02 | ) | $ | (0.02 | ) | $ | (0.02 | ) | ||||
92
Table of Contents
EINSTEIN NOAH RESTAURANT GROUP, INC. AND SUBSIDIARIES
Notes to Consolidated Financial Statements
| As Reported | ||||||||||||||||
| April 1, 2008 |
July 1, 2008 |
September 30, 2008 |
December 30, 2008 |
|||||||||||||
| (in thousands) | ||||||||||||||||
| Consolidated Statements of Changes in Stockholders’ Deficit |
||||||||||||||||
| Accumulated deficit |
$ | (292,611 | ) | $ | (285,697 | ) | $ | (281,160 | ) | $ | (275,376 | ) | ||||
| Total stockholders’ deficit |
(29,075 | ) | (21,821 | ) | (17,328 | ) | (13,651 | ) | ||||||||
| As Restated | ||||||||||||||||
| April 1, 2008 |
July 1, 2008 |
September 30, 2008 |
December 30, 2008 |
|||||||||||||
| (in thousands) | ||||||||||||||||
| Consolidated Statements of Changes in Stockholders’ Deficit |
||||||||||||||||
| Accumulated deficit |
$ | (307,916 | ) | $ | (301,344 | ) | $ | (297,149 | ) | $ | (291,707 | ) | ||||
| Total stockholders’ deficit |
(44,380 | ) | (37,468 | ) | (33,317 | ) | (29,982 | ) | ||||||||
| Difference | ||||||||||||||||
| April 1, 2008 |
July 1, 2008 |
September 30, 2008 |
December 30, 2008 |
|||||||||||||
| (in thousands) | ||||||||||||||||
| Consolidated Statements of Changes in Stockholders’ Deficit |
||||||||||||||||
| Accumulated deficit |
$ | (15,305 | ) | $ | (15,647 | ) | $ | (15,989 | ) | $ | (16,331 | ) | ||||
| Total stockholders’ deficit |
(15,305 | ) | (15,647 | ) | (15,989 | ) | (16,331 | ) | ||||||||
93
Table of Contents
EINSTEIN NOAH RESTAURANT GROUP, INC. AND SUBSIDIARIES
Notes to Consolidated Financial Statements
| As Reported | ||||||||||||||||
| April 1, 2008 |
July 1, 2008 |
September 30, 2008 |
December 30, 2008 |
|||||||||||||
| (in thousands) | ||||||||||||||||
| Consolidated Statements of Cash Flows |
||||||||||||||||
| Net income |
$ | 3,842 | $ | 10,756 | $ | 15,293 | $ | 21,077 | ||||||||
| Deferred income tax expense |
— | — | — | — | ||||||||||||
| Net cash provided by operating activities |
11,315 | 22,727 | 33,695 | 43,095 | ||||||||||||
| As Restated | ||||||||||||||||
| April 1, 2008 |
July 1, 2008 |
September 30, 2008 |
December 30, 2008 |
|||||||||||||
| (in thousands) | ||||||||||||||||
| Consolidated Statements of Cash Flows |
||||||||||||||||
| Net income |
$ | 3,500 | $ | 10,072 | $ | 14,267 | $ | 19,709 | ||||||||
| Deferred income tax expense |
342 | 684 | 1,026 | 1,368 | ||||||||||||
| Net cash provided by operating activities |
11,315 | 22,727 | 33,695 | 43,095 | ||||||||||||
| Difference | ||||||||||||||||
| April 1, 2008 |
July 1, 2008 |
September 30, 2008 |
December 30, 2008 |
|||||||||||||
| (in thousands) | ||||||||||||||||
| Consolidated Statements of Cash Flows |
||||||||||||||||
| Net (loss) income |
$ | (342 | ) | $ | (684 | ) | $ | (1,026 | ) | $ | (1,368 | ) | ||||
| Deferred income tax expense |
342 | 684 | 1,026 | 1,368 | ||||||||||||
| Net cash provided by operating activities |
— | — | — | — | ||||||||||||
94
Table of Contents
EINSTEIN NOAH RESTAURANT GROUP, INC. AND SUBSIDIARIES
Notes to Consolidated Financial Statements
| As Reported | ||||||||||||||||
| Fiscal Year Ended December 29, 2009: | March 31, 2009 |
June 30, 2009 |
September 29, 2009 |
December 29, 2009 |
||||||||||||
| (in thousands) | ||||||||||||||||
| Consolidated Balance Sheets |
||||||||||||||||
| Current deferred income tax assets, net |
$ | — | $ | — | $ | 8,221 | $ | 7,184 | ||||||||
| Long-term deferred income tax assets, net |
— | — | 48,462 | 46,206 | ||||||||||||
| Total assets |
168,638 | 150,103 | 213,792 | 211,221 | ||||||||||||
| Long-term deferred income tax liabilities |
— | — | — | — | ||||||||||||
| Total liabilities |
179,986 | 154,296 | 155,494 | 148,935 | ||||||||||||
| Accumulated deficit |
(273,526 | ) | (267,060 | ) | (206,199 | ) | (203,381 | ) | ||||||||
| Total stockholders’ (deficit) equity |
(11,348 | ) | (4,193 | ) | 58,298 | 62,286 | ||||||||||
| Total liabilities and stockholders’ equity |
168,638 | 150,103 | 213,792 | 211,221 | ||||||||||||
| As Restated | ||||||||||||||||
| March 31, 2009 |
June 30, 2009 |
September 29, 2009 |
December 29, 2009 |
|||||||||||||
| (in thousands) | ||||||||||||||||
| Consolidated Balance Sheets |
||||||||||||||||
| Current deferred income tax assets, net |
$ | — | $ | — | $ | 8,221 | $ | 9,682 | ||||||||
| Long-term deferred income tax assets, net |
— | — | 50,499 | 45,745 | ||||||||||||
| Total assets |
168,638 | 150,103 | 215,829 | 213,258 | ||||||||||||
| Long-term deferred income tax liabilities |
16,711 | 17,091 | — | — | ||||||||||||
| Total liabilities |
196,697 | 171,387 | 155,494 | 148,935 | ||||||||||||
| Accumulated deficit |
(290,237 | ) | (284,151 | ) | (204,162 | ) | (201,344 | ) | ||||||||
| Total stockholders’ (deficit) equity |
(28,059 | ) | (21,284 | ) | 60,335 | 64,323 | ||||||||||
| Total liabilities and stockholders’ equity |
168,638 | 150,103 | 215,829 | 213,258 | ||||||||||||
| Difference | ||||||||||||||||
| March 31, 2009 |
June 30, 2009 |
September 29, 2009 |
December 29, 2009 |
|||||||||||||
| (in thousands) | ||||||||||||||||
| Consolidated Balance Sheets |
||||||||||||||||
| Current deferred income tax assets, net |
$ | — | $ | — | $ | — | $ | 2,498 | ||||||||
| Long-term deferred income tax assets, net |
— | — | 2,037 | (368 | ) | |||||||||||
| Total assets |
— | — | 2,037 | 2,037 | ||||||||||||
| Long-term deferred income tax liabilities |
16,711 | 17,091 | — | — | ||||||||||||
| Total liabilities |
16,711 | 17,091 | — | — | ||||||||||||
| Accumulated deficit |
(16,711 | ) | (17,091 | ) | 2,037 | 2,037 | ||||||||||
| Total stockholders’ (deficit) equity |
(16,711 | ) | (17,091 | ) | 2,037 | 2,037 | ||||||||||
| Total liabilities and stockholders’ equity |
— | — | 2,037 | 2,037 | ||||||||||||
95
Table of Contents
EINSTEIN NOAH RESTAURANT GROUP, INC. AND SUBSIDIARIES
Notes to Consolidated Financial Statements
| As Reported | ||||||||||||||||
| March 31, 2009 |
June 30, 2009 |
September 29, 2009 |
December 29, 2009 |
|||||||||||||
| (in thousands, except earnings per share information) | ||||||||||||||||
| Consolidated Statements of Operations |
||||||||||||||||
| Provision (benefit) for income tax |
$ | 77 | $ | 393 | $ | (56,542 | ) | $ | 2,880 | |||||||
| Net income |
1,850 | 6,466 | 60,861 | 2,818 | ||||||||||||
| Net income available to common stockholders per share—Basic |
$ | 0.12 | $ | 0.40 | $ | 3.75 | $ | 0.17 | ||||||||
| Net income available to common stockholders per share—Diluted |
$ | 0.11 | $ | 0.39 | $ | 3.65 | $ | 0.17 | ||||||||
| As Restated | ||||||||||||||||
| March 31, 2009 |
June 30, 2009 |
September 29, 2009 |
December 29, 2009 |
|||||||||||||
| (in thousands, except earnings per share information) | ||||||||||||||||
| Consolidated Statements of Operations |
||||||||||||||||
| Provision (benefit) for income tax |
$ | 457 | $ | 773 | $ | (75,670 | ) | $ | 2,880 | |||||||
| Net income |
1,470 | 6,086 | 79,989 | 2,818 | ||||||||||||
| Net income available to common stockholders per share—Basic |
$ | 0.10 | $ | 0.38 | $ | 4.93 | $ | 0.17 | ||||||||
| Net income available to common stockholders per share—Diluted |
$ | 0.09 | $ | 0.37 | $ | 4.80 | $ | 0.17 | ||||||||
| Difference | ||||||||||||||||
| March 31, 2009 |
June 30, 2009 |
September 29, 2009 |
December 29, 2009 |
|||||||||||||
| (in thousands, except earnings per share information) | ||||||||||||||||
| Consolidated Statements of Operations |
||||||||||||||||
| Provision (benefit) for income tax |
$ | 380 | $ | 380 | $ | (19,128 | ) | $ | — | |||||||
| Net income |
(380 | ) | (380 | ) | 19,128 | — | ||||||||||
| Net income available to common stockholders per share—Basic |
$ | (0.02 | ) | $ | (0.02 | ) | $ | 1.18 | $ | — | ||||||
| Net income available to common stockholders per share—Diluted |
$ | (0.02 | ) | $ | (0.02 | ) | $ | 1.15 | $ | — | ||||||
96
Table of Contents
EINSTEIN NOAH RESTAURANT GROUP, INC. AND SUBSIDIARIES
Notes to Consolidated Financial Statements
| As Reported | ||||||||||||||||
| March 31, 2009 |
June 30, 2009 |
September 29, 2009 |
December 29, 2009 |
|||||||||||||
| (in thousands) | ||||||||||||||||
| Consolidated Statements of Changes in Stockholders’ (Deficit) Equity |
||||||||||||||||
| Accumulated deficit |
$ | (273,526 | ) | $ | (267,060 | ) | $ | (206,199 | ) | $ | (203,381 | ) | ||||
| Total stockholders’ (deficit) equity |
(11,348 | ) | (4,193 | ) | 58,298 | 62,286 | ||||||||||
| As Restated | ||||||||||||||||
| March 31, 2009 |
June 30, 2009 |
September 29, 2009 |
December 29, 2009 |
|||||||||||||
| (in thousands) | ||||||||||||||||
| Consolidated Statements of Changes in Stockholders’ (Deficit) Equity |
||||||||||||||||
| Accumulated deficit |
$ | (290,237 | ) | $ | (284,151 | ) | $ | (204,162 | ) | $ | (201,344 | ) | ||||
| Total stockholders’ (deficit) equity |
(28,059 | ) | (21,284 | ) | 60,335 | 64,323 | ||||||||||
| Difference | ||||||||||||||||
| March 31, 2009 |
June 30, 2009 |
September 29, 2009 |
December 29, 2009 |
|||||||||||||
| (in thousands) | ||||||||||||||||
| Consolidated Statements of Changes in Stockholders’ (Deficit) Equity |
||||||||||||||||
| (Accumulated deficit) retained earnings |
$ | (16,711 | ) | $ | (17,091 | ) | $ | 2,037 | $ | 2,037 | ||||||
| Total stockholders’ (deficit) equity |
(16,711 | ) | (17,091 | ) | 2,037 | 2,037 | ||||||||||
| As Reported | ||||||||||||||||
| March 31, 2009 |
June 30, 2009 |
September 29, 2009 |
December 29, 2009 |
|||||||||||||
| (in thousands) | ||||||||||||||||
| Consolidated Statements of Cash Flows |
||||||||||||||||
| Net income |
$ | 1,850 | $ | 8,316 | $ | 69,177 | $ | 71,995 | ||||||||
| Deferred income tax benefit |
— | — | (56,772 | ) | (53,390 | ) | ||||||||||
| Net cash provided by operating activities |
8,502 | 13,997 | 24,169 | 33,700 | ||||||||||||
| As Restated | ||||||||||||||||
| March 31, 2009 |
June 30, 2009 |
September 29, 2009 |
December 29, 2009 |
|||||||||||||
| (in thousands) | ||||||||||||||||
| Consolidated Statements of Cash Flows |
||||||||||||||||
| Net income |
$ | 1,470 | $ | 7,556 | $ | 87,545 | $ | 90,363 | ||||||||
| Deferred income tax expense (benefit) |
380 | 760 | (75,140 | ) | (71,758 | ) | ||||||||||
| Net cash provided by operating activities |
8,502 | 13,997 | 24,169 | 33,700 | ||||||||||||
| Difference | ||||||||||||||||
| March 31, 2009 |
June 30, 2009 |
September 29, 2009 |
December 29, 2009 |
|||||||||||||
| (in thousands) | ||||||||||||||||
| Consolidated Statements of Cash Flows |
||||||||||||||||
| Net income |
$ | (380 | ) | $ | (760 | ) | $ | 18,368 | $ | 18,368 | ||||||
| Deferred income tax expense (benefit) |
380 | 760 | (18,368 | ) | (18,368 | ) | ||||||||||
| Net cash provided by operating activities |
— | — | — | — | ||||||||||||
97
Table of Contents
EINSTEIN NOAH RESTAURANT GROUP, INC. AND SUBSIDIARIES
Notes to Consolidated Financial Statements
| 21. | SUBSEQUENT EVENTS |
Subsequent to December 28, 2010, the Company extended an offer to sell two company-owned restaurants to a franchisee for approximately $0.8 million and has received a deposit from the franchisee. This purchase is expected to close in the first half of 2011. Further, the Company extended an offer to buy back one franchised restaurant from a franchisee for approximately $0.6 million. This buy back deal is expected to close in the first half of 2011. The Company has evaluated subsequent events and there were no other material subsequent events that have occurred since December 28, 2010 that required recognition or disclosure in these financial statements.
98
Table of Contents
EINSTEIN NOAH RESTAURANT GROUP, INC.
Schedule II—Valuation and Qualifying Accounts
| Balance at beginning of period |
Additions (a) | Deductions (b) | Balance at end of period |
|||||||||||||
| (In thousands of dollars) | ||||||||||||||||
| For the fiscal year ended December 30, 2008 (as restated, see Note 3): |
||||||||||||||||
| Allowance for doubtful accounts |
$ | 606 | 157 | (547 | ) | $ | 216 | |||||||||
| Valuation allowance for deferred taxes |
$ | 90,284 | — | (6,054 | ) | $ | 84,230 | |||||||||
| For the fiscal year ended December 29, 2009 (as restated, see Note 3): |
||||||||||||||||
| Allowance for doubtful accounts |
$ | 216 | 206 | (281 | ) | $ | 141 | |||||||||
| Valuation allowance for deferred taxes |
$ | 84,230 | — | (79,321 | ) | $ | 4,909 | |||||||||
| For the fiscal year ended December 28, 2010: |
||||||||||||||||
| Allowance for doubtful accounts |
$ | 141 | 167 | (259 | ) | $ | 49 | |||||||||
| Valuation allowance for deferred taxes |
$ | 4,909 | — | (138 | ) | $ | 4,771 | |||||||||
| Notes: |
| (a) Amounts | charged to costs and expenses. |
| (b) Bad | debt write-offs and charges to reserves. |
See accompanying report of independent registered public accounting firm
99
Table of Contents
| ITEM 9. | CHANGES IN AND DISAGREEMENTS WITH ACCOUNTANTS ON ACCOUNTING AND FINANCIAL DISCLOSURE |
None
| ITEM 9A. CONTROLS | AND PROCEDURES |
Disclosure Controls and Procedures
The Company carried out an evaluation, under the supervision and with the participation of the Company’s management including the Company’s President and Chief Executive Officer and the Company’s Chief Financial Officer, of the effectiveness of the design and operation of the Company’s disclosure controls and procedures as of December 28, 2010 pursuant to Securities Exchange Act Rule 13a-15(e) and 15d-15(e). Based upon that evaluation, the Company’s President and Chief Executive Officer and Chief Financial Officer concluded that, due to a material weakness described below in Management’s Report on Internal Control Over Financial Reporting, the Company’s disclosure controls and procedures were not effective in timely alerting them to material information relating to the Company (including its consolidated subsidiaries) required to be included in the Company’s periodic SEC filings.
Disclosure controls and procedures are controls and other procedures that are designed to ensure that information required to be disclosed by us in the reports that we file or submit under the Securities Exchange Act is recorded, processed, summarized and reported within the time periods specified in SEC’s rules and forms. Disclosure controls and procedures include, without limitation, controls and procedures designed to ensure information required to be disclosed by us in the reports we file under the Securities Exchange Act is accumulated and communicated to our management, including our President and Chief Executive Officer and our Chief Financial Officer, as appropriate to allow timely decisions regarding required disclosure.
Notwithstanding the material weakness as described below, the Company’s President and Chief Executive Officer and the Chief Financial Officer have certified that, based on their knowledge, the consolidated financial statements included in this report fairly present in all material respects our financial condition, results of operations and cash flows for each of the periods presented in this report.
Management’s Annual Report on Internal Control over Financial Reporting
The Company’s management is responsible for establishing and maintaining adequate internal control over financial reporting. The Company’s internal control over financial reporting is a process designed under the supervision of the Company’s President and Chief Executive Officer and Chief Financial Officer to provide reasonable assurance regarding the reliability of financial reporting and the preparation of the Company’s financial statements for external reporting purposes in accordance with accounting principles generally accepted in the United States of America.
As of December 28, 2010, management conducted an assessment of the effectiveness of the Company’s internal control over financial reporting based on the framework established in Internal Control—Integrated Framework issued by the Committee of Sponsoring Organizations of the Treadway Commission (“COSO”). Based on this assessment, management has determined that the Company’s internal control over financial reporting was not effective as of December 28, 2010.
Our internal control over financial reporting includes policies and procedures that pertain to the maintenance of records that, in reasonable detail, accurately and fairly reflect transactions and dispositions of assets; provide reasonable assurances that transactions are recorded as necessary to permit preparation of financial statements in accordance with accounting principles generally accepted in the United States of America; receipts and expenditures are being made only in accordance with authorizations of management and the directors of the Company; and provide reasonable assurance regarding prevention or timely detection of unauthorized acquisition, use or disposition of the Company’s assets that could have a material effect on our financial statements.
100
Table of Contents
The Company’s controls related to financial reporting were not effective to ensure that amounts related to certain deferred tax balances and deferred income tax expense were recorded in accordance with U.S. generally accepted accounting principles. Specifically, the Company did not maintain effective controls over the preparation and review of the income tax provision. Control activities related to the income tax provision were not properly designed and operating effectively related to indefinite lived intangible assets when establishing a valuation allowance on deferred tax assets, as well as properly recognizing certain deferred tax assets and liabilities related to state income tax rates, workers compensation, deferred rent and an alternative minimum tax credit carryover. As a result, there was a material error in the aforementioned tax accounts in the preliminary consolidated financial statements that was corrected prior to issuance of the Company’s consolidated financial statements.
The effectiveness of the Company’s internal control over financial reporting as of December 28, 2010 has been audited by Grant Thornton LLP, an independent registered public accounting firm, as stated in their report dated March 15, 2011, appearing under the heading “Report of Independent Registered Public Accounting Firm,” in Part II, Item 8 of this report.
Changes in Internal Control over Financial Reporting
During the fourth quarter of 2010 no change in the Company’s internal control over financial reporting was identified in connection with this evaluation that has materially affected or is reasonably likely to materially affect the Company’s internal control over financial reporting.
Remediation Plan for Material Weakness in Internal Control over Financial Reporting
In response to the identified material weakness, management has identified several enhancements to the Company’s internal control over financial reporting to remediate the material weakness described above. These ongoing efforts include implementing additional monitoring and oversight controls over the income tax accounting process and improving the process documentation for income taxes to ensure conformity with generally accepted accounting principles.
We anticipate the actions described above and resulting improvements in controls will strengthen our internal control over financial reporting and will, over time, address the related material weakness that we identified as of December 28, 2010. As part of our 2011 assessment of internal control over financial reporting, our management will test and evaluate these additional controls to assess whether they are operating effectively.
| ITEM 9B. OTHER | INFORMATION |
None
101
Table of Contents
PART III
| ITEM 10. DIRECTORS, | EXECUTIVE OFFICERS AND CORPORATE GOVERNANCE |
Information relating to directors required by Item 10 will be included in our 2011 Proxy Statement, which will be filed within 120 days after the close of the 2010 fiscal year, and is hereby incorporated by reference.
Information relating to compliance with Section 16(a) required by Item 10 will included in our 2011 Proxy Statement, which will be filed within 120 days after the close of the 2010 fiscal year, and is hereby incorporated by reference.
Information regarding executive officers is included in Part I of this Form 10-K, as permitted by General Instruction G(3).
The Company adopted a Code of Conduct applicable to its chief executive officer, chief financial officer, controller and other finance leaders, which is a “code of ethics” as defined by applicable rules of the SEC. This code is publicly available on the Company’s website. If the Company makes any amendments to this code other than technical, administrative or other non-substantive amendments, or grants any waivers, including implicit waivers, from a provision of this code to the Company’s chief executive officer, chief financial officer or controller, the Company will disclose the nature of the amendment or waiver, its effective date and to whom it applies on its website or in a report on Form 8-K filed with the SEC.
| ITEM 11. EXECUTIVE | COMPENSATION |
This information will be included in our 2011 Proxy Statement, which will be filed within 120 days after the close of the 2010 fiscal year, and is hereby incorporated by reference.
| ITEM 12. SECURITY | OWNERSHIP OF CERTAIN BENEFICIAL OWNERS AND MANAGEMENT AND RELATED STOCKHOLDER MATTERS |
This information will be included in our 2011 Proxy Statement, which will be filed within 120 days after the close of the 2010 fiscal year, and is hereby incorporated by reference.
| ITEM 13. CERTAIN | RELATIONSHIPS AND RELATED TRANSACTIONS, AND DIRECTOR INDEPENDENCE |
This information will be included in our 2011 Proxy Statement, which will be filed within 120 days after the close of the 2010 fiscal year, and is hereby incorporated by reference.
| ITEM 14. PRINCIPAL | ACCOUNTANT FEES AND SERVICES |
This information will be included in our 2011 Proxy Statement, which will be filed within 120 days after the close of the 2010 fiscal year, and is hereby incorporated by reference.
102
Table of Contents
PART IV
| ITEM 15. | EXHIBITS AND FINANCIAL STATEMENT SCHEDULES |
| (1) | Financial Statements |
See the Index to Consolidated Financial Statements included in Part II, Item 8 for a list of the financial statements included in this Form 10-K.
| (2) | Financial Statement Schedules |
See the end of Part II, Item 8 for Schedule II—Valuation and Qualifying Accounts. All other financial statement schedules are omitted because they are not required or are not applicable.
| (3) | Exhibits |
| Exhibit |
Description | |
| 3.1 | Restated Certificate of Incorporation (16) | |
| 3.2 | Third Amended By-laws (1) | |
| 3.3 | Amendments to By-laws (2) | |
| 4.2 | New World Restaurant Group, Inc. Certificate of Designation, Preferences and Rights of Series Z Preferred Stock (3) | |
| 10.1 | 1994 Stock Plan (1)+ | |
| 10.2 | Directors’ Option Plan (1)+ | |
| 10.3 | Executive Employee Incentive Plan (4)+ | |
| 10.4 | Second Amendment to Executive Employee Incentive Plan (5)+ | |
| 10.5 | Third Amendment to the New World Restaurant Group, Inc. 2004 Executive Employee Incentive Plan (11)+ | |
| 10.6 | Stock Option Plan for Independent Directors (6)+ | |
| 10.7 | Amendment to Stock Option Plan for Independent Directors (7)+ | |
| 10.8 | Second Amendment to the New World Restaurant Group Inc. Stock Option Plan for (Non-Employee) Independent Directors (10)+ | |
| 10.9 | Approved Supplier Agreement dated as of November 30, 2006, by and among New World Restaurant Group, Inc., Einstein and Noah Corp., Manhattan Bagel Company, Inc., and Harlan Bagel Supply Company, LLC, and Harlan Bakeries, Inc. (Certain information contained in this exhibit has been omitted and filed separately with the Commission pursuant to a confidential treatment request under Rule 24b-2) (9) | |
| 10.10 | Amended and Restated Credit Agreement dated June 28, 2007, among the Registrant, Bear, Stearns & Co. Inc. (“Bear Stearns”), as sole lead arranger, Wells Fargo Foothill, Inc., as administrative agent and the other lenders from time to time parties thereto (12) | |
| 10.11 | New World Restaurant Group, Inc. Stock Appreciation Rights Plan (8)+ | |
| 10.12 | Einstein Noah Restaurant Group, Inc. Nonqualified Deferred Compensation Plan (13)+ | |
| 10.13 | Paul J.B. Murphy, III Executive Separation Agreement dated December 3, 2008 (14)+ | |
| 10.14 | Jeffrey J. O’Neill Offer of Employment dated December 3, 2008 (14)+ | |
103
Table of Contents
| Exhibit |
Description | |
| 10.15 | James Hood Employee Separation Agreement dated February 2, 2009 (15) | |
| 10.16 | James O’Reilly Offer of Employment dated March 24, 2009 (15)+ | |
| 10.17 | Amendment No. 1 to Amended and Restated Credit Agreement (15) | |
| 10.18 | Letter Agreement with Halpern Denny III L.P. regarding the Redemption of Series Z preferred stock (16) | |
| 10.19 | Amendment No. 2 of Amended and Restated Credit Agreement (16) | |
| 10.20 | March 17, 2010 Amendment to Letter Agreement Dated May 27, 2009 with Halpern Denny III, L.P. Regarding Redemption of Series Z Preferred Stock (17) | |
| 10.21 | Emanuel P.N. Hilario Offer of Employment dated May 5, 2010 (18)+ | |
| 10.22 | Credit Agreement dated as of December 20, 2010, by and among the Registrant, with Bank of America, N.A., as Administrative Agent, and the Lenders named therein* | |
| 10.23 | Guaranty and Security Agreement, dated as of December 20, 2010, by and among the Registrant, the Guarantors named therein and Bank of America, N.A.* | |
| 10.24 | Rhonda J. Parish Offer of Employment dated January 13, 2010*+ | |
| 21.1 | List of Subsidiaries* | |
| 23.1 | Consent of Grant Thornton LLP* | |
| 31.1 | Certification of Chief Executive Officer of the Registrant pursuant to Section 302 of the Sarbanes-Oxley Act of 2002, with respect to the Registrant’s Annual Report on Form 10-K for the year ended December 28, 2010* | |
| 31.2 | Certification of Chief Financial Officer of the Registrant pursuant to Section 302 of the Sarbanes-Oxley Act of 2002, with respect to the Registrant’s Annual Report on Form 10-K for the year ended December 28, 2010* | |
| 32.1 | Certification of Chief Executive Officer pursuant to 18 U.S.C. Section 1350, as adopted pursuant to Section 906 of the Sarbanes-Oxley Act** | |
| 32.2 | Certification of Chief Financial Officer pursuant to 18 U.S.C. Section 1350, as adopted pursuant to Section 906 of the Sarbanes-Oxley Act** | |
| 32.3 | Certification of Principal Accounting Officer pursuant to 18 U.S.C. Section 1350, as adopted pursuant to Section 906 of the Sarbanes-Oxley Act** | |
| * | Filed herewith. |
| ** | Furnished herewith. |
| + | Management contract. |
| (1) | Incorporated by reference from Registrant’s Registration Statement on Form SB-2 (33-95764). |
| (2) | Incorporated by reference from Registrant’s Annual Report on Form 10-K for the Fiscal Year Ended December 31, 2002, filed on May 14, 2003. |
| (3) | Incorporated by reference from Registrant’s Schedule 14A, filed on September 10, 2003 included as schedule 1 to annex B. |
| (4) | Incorporated by reference from Registrant’s Schedule 14A, filed on April 29, 2005 included as annex A. |
| (5) | Incorporated by reference from Registrant’s Schedule 14A, filed on April 29, 2005 included as annex B. |
| (6) | Incorporated by reference from Registrant’s Schedule 14A, filed on April 29, 2005 included as annex C. |
| (7) | Incorporated by reference from Registrant’s Schedule 14A, filed on April 29, 2005 included as annex D. |
| (8) | Incorporated by reference from Registrant’s Registration Statement on Form S-8, filed on February 20, 2007. |
104
Table of Contents
| (9) | Incorporated by reference from Registrant’s Annual Report on Form 10-K, filed on March 7, 2007. |
| (10) | Incorporated by reference from Registrant’s Schedule 14A, filed on April 4, 2007 included as Annex B. |
| (11) | Incorporated by reference from Registrant’s Schedule 14A, filed on April 4, 2007 included as Annex D. |
| (12) | Incorporated by reference from Registrant’s Current Report on Form 8-K, filed on July 5, 2007. |
| (13) | Incorporated by reference from Registrant’s Annual Report on Form 10-K for the Fiscal Year Ended January 1, 2008, filed on March 3, 2008. |
| (14) | Incorporated by reference from Registrant’s Annual Report on Form 10-K for the Fiscal Year Ended December 30, 2008, filed on March 2, 2009. |
| (15) | Incorporated by reference from Registrant’s Quarterly Report on Form 10-Q for the Quarterly Period Ended March 31, 2009, filed on May 7, 2009. |
| (16) | Incorporated by reference from Registrant’s Current Report on Form 8-K dated June 2, 2009. |
| (17) | Incorporated by reference from Registrant’s Current Report on Form 8-K dated March 17, 2010. |
| (18) | Incorporated by reference from Registrant’s Current Report on Form 8-K dated May 5, 2010. |
105
Table of Contents
SIGNATURES
Pursuant to the requirements of Section 13 or 15(d) of the Securities Exchange Act of 1934, the registrant has duly caused this report to be signed on its behalf by the undersigned, thereunto duly authorized.
| EINSTEIN NOAH RESTAURANT GROUP, INC. | ||||
| Date: March 15, 2011 | By: | /S/ JEFFREY J. O’NEILL | ||
| Jeffrey J. O’Neill President and Chief Executive Officer | ||||
Pursuant to the requirements of the Securities Exchange Act of 1934, this report has been signed below by the following persons on behalf of the registrant and in the capacities indicated on March 15, 2011.
| Signature |
Title | |
| /S/ JEFFREY J. O’NEILL Jeffrey J. O’Neill |
President, Chief Executive Officer and Director (Principal Executive Officer) | |
| /S/ EMANUEL P.N. HILARIO Emanuel P.N. Hilario |
Chief Financial Officer (Principal Financial Officer) | |
| /S/ ROBERT E. GOWDY, JR. Robert E. Gowdy, Jr. |
Controller and Chief Accounting Officer (Principal Accounting Officer) | |
| /S/ MICHAEL W. ARTHUR Michael W. Arthur |
Director | |
| /S/ E. NELSON HEUMANN E. Nelson Heumann |
Director | |
| /S/ FRANK C. MEYER Frank C. Meyer |
Director | |
| /S/ S. GARRETT STONEHOUSE, JR. S. Garrett Stonehouse, Jr. |
Director | |
| /S/ THOMAS J. MUELLER Thomas J. Mueller |
Director | |
106