Attached files
| file | filename |
|---|---|
| 8-K - FORM 8-K - Diamond Foods Inc | f58585e8vk.htm |
Exhibit 99.1

| Investing for a Strong Future March 2011 |

| Important Information This document contains forward-looking statements as defined by the Private Securities Litigation Reform Act of 1995, including projections of Diamond's results. The words "anticipate," "expect," "believe," "goal," "plan," "intend," "estimate," "may," "will," "would" and similar expressions and variations thereof are intended to identify forward-looking statements, but are not the exclusive means of identifying such statements. Forward-looking statements necessarily depend on assumptions, data or methods that may be incorrect or imprecise and are subject to risks and uncertainties. Actual results could differ materially from projections made in this release. Some factors that could cause actual results to differ from our expectations include risks of integrating acquired businesses and entering markets in which we have limited experience, availability and pricing of raw materials, loss of key customers and an increase in competition. A more extensive list of factors that could materially affect our results can be found in Diamond's periodic filings with the Securities and Exchange Commission. They are available publicly and on request from Diamond's Investor Relations Department. |

| Focused on Building, Acquiring and Energizing Brands |

| Broader Presence Across the Store Cereal Aisle Checkout Baking Aisle Produce Department Natural Foods Snack Aisle Multiple Points of Contact with Shoppers More Meaningful Partner to Retailer Deli Counter |

| Large Addressable Markets Culinary Nuts Category total 30.4 Snack 15.6 $46B+ Total 0.9 1.5 2.9 0.9 9.4 $0.9B $1.5B $9.4B $15.6B U.S. Snack and Culinary Addressable Market* $2.9B *Includes $3.1B for U.K. Chip Market $0.9B Produce Snacks Snack Nuts Microwave Popcorn Potato Chips (U.S. & U.K.) |

| Continue to Expand Kettle's Distribution Beyond Core U.S. and U.K. Markets Opportunity to Leverage Distribution Across Brands Enhanced International Growth Platform Source: Euromonitor International Sales 2009 ~10% 2011 >20% |

| Double-Digit Retail Sales Growth $ Millions 2003 153.8 2004 187.5 2005 228.5 2006 274.9 2007 333.1 2008 370.4 2009 465.1 2010 570.476 +21% CAGR 22 of 24 Quarters with Year-Over-Year Growth |

| Building Profitable Retail Business Total Sales 2005 2010 non-retail 234 110 culinary 207 249 snack 41 321 $463 Snack Culinary Non-Retail $680 Snack Culinary Non-Retail $ Millions Optimizing Product Mix Expanding Distribution Strategic Acquisitions Leveraging Scale 87%1 Gross Margin 10.5% 23.7% +1320 bps 49% 1H1 2011 Note: Culinary segment includes sales of In-shell (retail) segment |

| Margin Expansion Opportunity Gross Margin 1st Qtr 2005 0.105 2006 0.143 2007 0.15 2008 0.166 2009 0.237 2010 0.237 H1'11 0.264 Fiscal Year Operating Margin 1st Qtr 2005 -0.014 2006 0.028 2007 0.03 2008 0.045 2009 0.08 2010 0.095 H1'11 0.127 Fiscal Year Note: 2005 Results Pre-IPO (1) Fiscal Year 2009. Average Includes Conagra, General Mills, Hain Celestial, J.M. Smucker, Kellogg, Kraft, McCormick and PepsiCo 14% Industry Average (1) 36% Industry Average (1) |
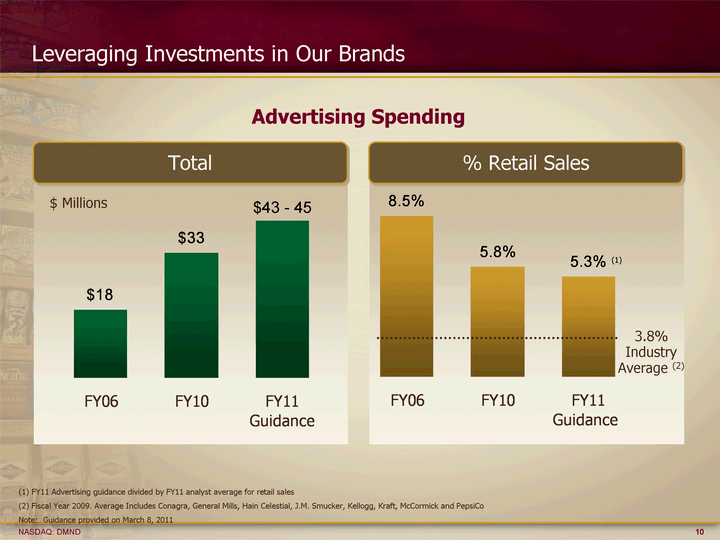
| Leveraging Investments in Our Brands Total Advertising Spending % Retail Sales FY06 FY10 FY11 Guidance 18 32.96 41.5 FY06 FY10 FY11 Guidance 0.085 0.058 0.053 $ Millions 3.8% Industry Average (2) (1) FY11 Advertising guidance divided by FY11 analyst average for retail sales (2) Fiscal Year 2009. Average Includes Conagra, General Mills, Hain Celestial, J.M. Smucker, Kellogg, Kraft, McCormick and PepsiCo Note: Guidance provided on March 8, 2011 (1) $43 - 45 |
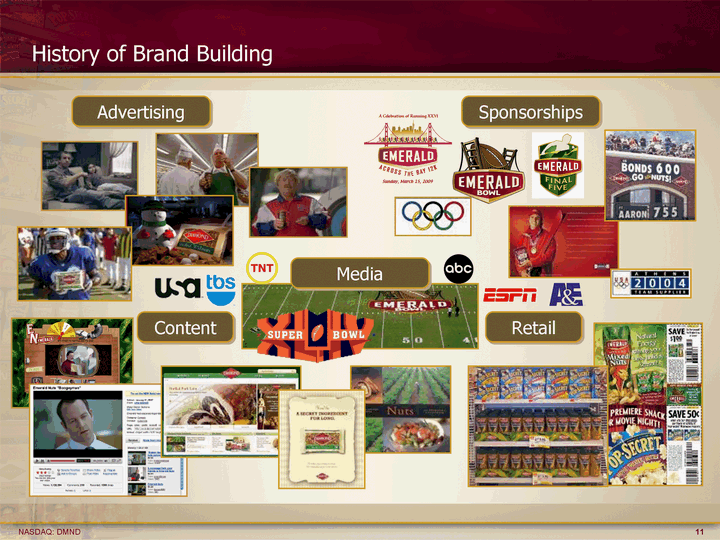
| Advertising Media Sponsorships Retail Content History of Brand Building |

| Model for Innovation and Building Brands Differentiation Brand Affinity Advertising Media Content Relevant Brand Positioning Expanding Presence Distribution Merchandising Shelf Placement Retail Activation Brands Consumers and Retailers Can't Live Without Sustainable Growth Quality Flavor Innovative Products and Packaging |

| Culture of Product Innovation Jumbo Kernels Patented Salt Application Patent-Pending Cocoa Roast Process First to Market with High Quality Mix Patented Glazed Process Krinkle Cut Chips Nut Toppings Sweet & Salty Magic Colors |

| Product Innovation: Better-for-You Platform 100 Calorie Pop 100 Calorie Packs Reduced Fat and Baked |

| Expanding Brand Equity into New Segments: All Natural Kettle TIAS! Tortilla Chips |
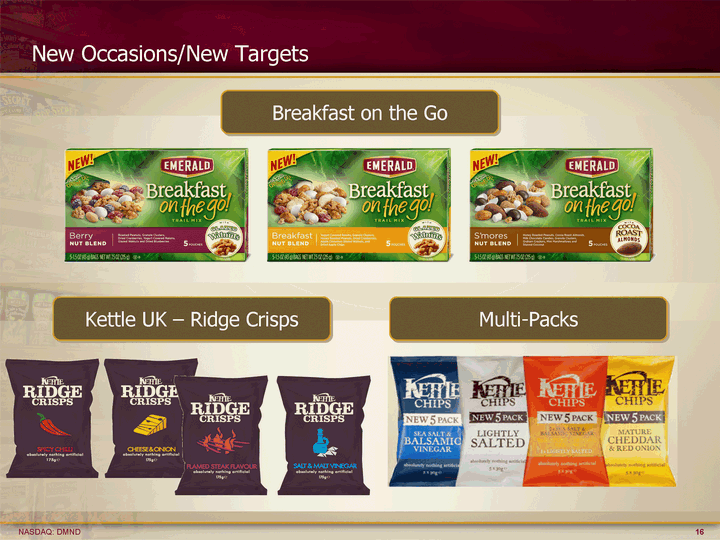
| Breakfast on the Go Kettle UK - Ridge Crisps New Occasions/New Targets Multi-Packs |

| Leveraging Our Scale at Retail Labels for Education Super Bowl Feed Your Fingers March Madness 2010 2011 |

| Focus on Value-Add Base Commodity Cost as % of Total COGS Diamond Foods Base Commodity as % of COGS Non-Retail Culinary Nuts Snack Nuts & Trail Mix Microwave Popcorn Potato Chips 85 65 45 20 20 70-90% 60-70% <20% <20% 30-40% 2005 2011E 75 50 75% ~45% |

| Multiple Levers to Mitigate Commodity Risk Focus on Value-Add Base commodities as percent of COGS from 75% in 2005 to ~45% in 2011 Managing Commodities Buying long; hedging; scale Productivity/Cost Reduction Agricultural and processing productivity; automation Brand Investment Ability to raise price |

| Track Record of Growth Revenue Adjusted EBITDA & Margin 2006 477.2 2007 522.585 2008 531.492 2009 570.9 2010 680.2 2011 Guidance 930 $ Millions 2006 22.667 2007 29.1 2008 37.2 2009 61.1 2010 84.9 2011 Guidance 135 $ Millions 5% 6% 11% Note: Fiscal year end 7/31 13% 5-Year CAGR*: 43% 5-Year CAGR*: 14% 7% $925-950 $135-140 *Assumes midpoint of guidance range Note: 2011 Guidance provided on March 8, 2011 |
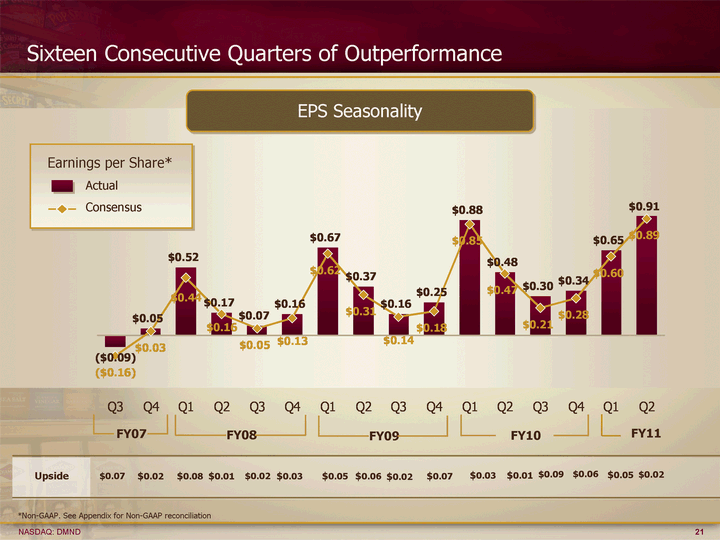
| Earnings per Share* Actual Consensus Sixteen Consecutive Quarters of Outperformance EPS Seasonality Actual Consensus Q3 -0.09 -0.16 Q4 0.05 0.03 Q1 0.52 0.44 Q2 0.17 0.16 Q3 0.07 0.05 Q4 0.16 0.13 Q1 0.67 0.62 Q2 0.37 0.31 Q3 0.16 0.14 Q4 0.25 0.18 Q1 0.88 0.85 Q2 0.48 0.47 Q3 0.3 0.21 Q4 0.34 0.28 Q1 0.65 0.6 Q2 0.91 0.89 FY07 FY08 FY09 FY10 *Non-GAAP. See Appendix for Non-GAAP reconciliation Upside $0.07 $0.02 $0.08 $0.01 $0.02 $0.03 $0.05 $0.06 $0.03 $0.02 $0.07 $0.06 $0.01 $0.09 FY11 $0.05 $0.02 |

| EPS Earnings per Share Growth and Valuation Potential 2005 2006 2007 2008 2009 2010 2011e eps 0 0.47 0.53 0.91 1.47 1.91 2.45 $/Share N.A. $0.47 $0.53 $0.91 $1.91 Valuation Share Price PEG $50 0.6 $60 0.8 $70 0.9 $80 1.0 Industry Average 2.0 $1.47 1Guidance provided on March 8, 2011 PEG based on First Call Consensus for FY11 $2.45-$2.511 |
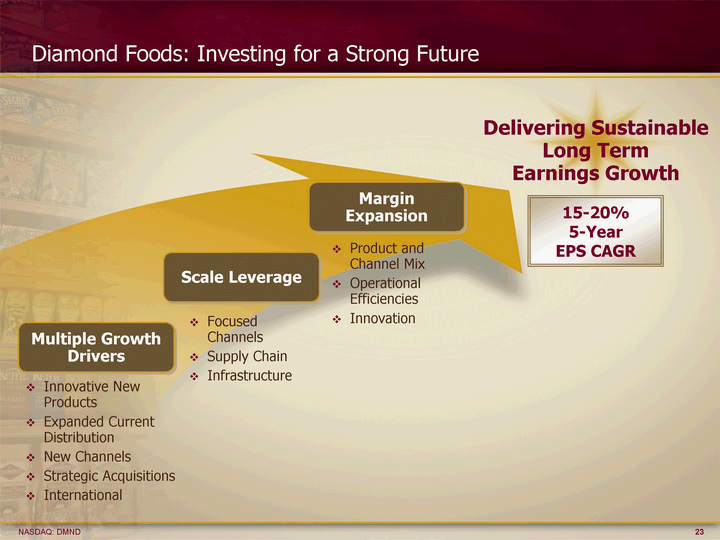
| Diamond Foods: Investing for a Strong Future Multiple Growth Drivers Innovative New Products Expanded Current Distribution New Channels Strategic Acquisitions International Scale Leverage Focused Channels Supply Chain Infrastructure Margin Expansion Product and Channel Mix Operational Efficiencies Innovation Delivering Sustainable Long Term Earnings Growth 15-20% 5-Year EPS CAGR |

| Long Term Financial Targets $ Millions, Except per Share and % 2009 2010 2011 Guidance1 2010 - 20152 Total Net Sales $571M $680.2M $925-$950M 8 - 10% CAGR Snack Sales $189M $321.4M $545-$560M 15 - 20% CAGR Gross Margin 23.7% 23.7% 25.7% - 26.7% Operating Margin 8.0% 9.5% 11.0% - 12.0% 13 - 15% in 2015 EPS $1.47 $1.91 $2.45 - $2.51 >$4.00 in 2015 Fiscal Year Ending July 31 15-20% EPS CAGR 1Guidance provided on March 8, 2011 2Guidance provided on September 7, 2010 |

| Investing for a Strong Future |

| Non-GAAP Reconciliation Q2'11 2010 2009 2008 2007 GAAP Net Sales GAAP Net Sales GAAP Net Sales $257,592 $680,162 $570,940 $531,492 $522,585 GAAP Cost of Sales GAAP Cost of Sales GAAP Cost of Sales $186,736 $519,161 $435,344 $443,490 $443,945 Adjustment for Acquired Inventory ($312) Non-GAAP Cost of Sales Non-GAAP Cost of Sales Non-GAAP Cost of Sales $186,736 $518,849 $435,344 $443,490 $443,945 GAAP Operating Expense GAAP Operating Expense GAAP Operating Expense $34,916 $108,771 $89,756 $64,121 $66,025 Adjustment for Acquisition, Integration and Loss on Termination of Defined Benefit Plan ($937) ($11,983) ($3,039) Non-GAAP Operating Expense Non-GAAP Operating Expense Non-GAAP Operating Expense $33,979 $96,788 $89,756 $64,121 $62,986 GAAP Interest and Other Non-Operating Expense GAAP Interest and Other Non-Operating Expense GAAP Interest and Other Non-Operating Expense $5,992 $12,029 $7,153 $1,040 $1,389 Debt Prepayment Penalty Less Sale of Emission Resource Credits ($1,849) ($898) Non-GAAP Interest and Other Non-Operating Expense Non-GAAP Interest and Other Non-Operating Expense Non-GAAP Interest and Other Non-Operating Expense $5,992 $10,180 $6,255 $1,040 $1,389 GAAP Income Tax Expense GAAP Income Tax Expense GAAP Income Tax Expense $10,228 $13,990 $14,944 $8,085 $2,793 Net Income Tax Adjustments (36) $3,574 $366 $2,625 Non-GAAP Income Tax Expense Non-GAAP Income Tax Expense Non-GAAP Income Tax Expense $10,192 $17,564 $15,310 $8,085 $5,418 GAAP Net Income GAAP Net Income GAAP Net Income $26,211 $23,743 $14,756 $8,433 Non-GAAP Net Income Non-GAAP Net Income Non-GAAP Net Income $20,693 $36,781 $24,275 $14,756 $8,847 GAAP EPS Diluted GAAP EPS Diluted GAAP EPS Diluted $0.87 $1.36 $1.44 $0.91 $0.53 Non-GAAP EPS Diluted Non-GAAP EPS Diluted Non-GAAP EPS Diluted $0.91 $1.91 $1.45 $0.91 $0.56 ($000) |
