Attached files
Table of Contents
UNITED STATES
SECURITIES AND EXCHANGE COMMISSION
Washington, D.C. 20549
Form 10-K
| x | ANNUAL REPORT PURSUANT TO SECTION 13 OR 15(d) OF THE SECURITIES EXCHANGE ACT OF 1934 |
For the fiscal year ended December 31, 2010
or
| ¨ | TRANSITION REPORT PURSUANT TO SECTION 13 OR 15(d) OF THE SECURITIES EXCHANGE ACT OF 1934 |
For the transition period from to
Commission File Number: 0-27596
CONCEPTUS, INC.
(Exact name of Registrant as specified in its charter)
| Delaware | 94-3170244 | |
| (State or other jurisdiction of | (I.R.S. Employer | |
| incorporation or organization) | Identification No.) |
331 East Evelyn
Mountain View, CA 94041
(Address of principal executive offices)
Registrant’s telephone number, including area code: (650) 962-4000
Securities registered pursuant to Section 12(b) of the Act:
| Title of each class: |
Name of each exchange on which registered: | |
| Common Stock, par value $0.003 per share | The NASDAQ Stock Market LLC |
Securities registered pursuant to Section 12(g) of the Act: None
Indicate by check mark if the registrant is a well-known seasoned issuer, as defined by Rule 405 of the Securities Act. Yes ¨ No x
Indicate by check mark if the registrant is not required to file reports pursuant to Section 13 or Section 15(d) of the Act. Yes ¨ No x
Indicate by check mark whether the registrant (1) has filed all reports required to be filed by Section 13 or 15(d) of the Securities Exchange Act of 1934 during the preceding 12 months (or for such shorter period that the registrant was required to file such reports), and (2) has been subject to such filing requirements for the past 90 days. Yes x No ¨
Indicate by check mark whether the registrant has submitted electronically and posted on its corporate Web site, if any, every Interactive Data File required to be submitted and posted pursuant to Rule 405 of Regulation S-T (§ 232.405 of this chapter) during the preceding 12 months (or for such shorter period that the registrant was required to submit and post such files). Yes ¨ No ¨
Indicate by check mark if disclosure of delinquent filers pursuant to Item 405 of Regulation S-K is not contained herein, and will not be contained, to the best of registrant’s knowledge, in definitive proxy or information statements incorporated by reference in Part III of this Form 10-K or any amendment to this Form 10-K. x
Indicate by check mark whether the registrant is a large accelerated filer, an accelerated filer, a non accelerated filer or a smaller reporting company. See the definitions of “large accelerated filer,” “accelerated filer,” and “smaller reporting company” in Rule 12b-2 of the Exchange Act.
| Large accelerated filer ¨ | Accelerated filer x | |
| Non accelerated filer ¨ (Do not check if a smaller reporting company) | Smaller reporting company ¨ | |
Indicate by check mark whether the Registrant is a shell company (as defined in Rule 12b-2 of the Act) Yes ¨ No x
The aggregate market value of the shares of common stock of the registrant held by non-affiliates as of June 30, 2010 was $143,185,045 based upon the closing price of the common stock on the Nasdaq Global Select Market SM on June 30, 2010. Shares of Common Stock held by each officer and director and by each person who owns 5% or more of the outstanding Common Stock have been excluded in that such persons may be deemed to be affiliates. This determination of affiliate status is not necessarily a conclusive determination for other purposes.
There were 31,163,635 shares of registrant’s Common Stock issued and outstanding as of February 28, 2011.
DOCUMENTS INCORPORATED BY REFERENCE
Portions of the Proxy Statement for the registrant’s 2011 Annual Meeting of Stockholders are incorporated by reference in Part III of this Form 10-K.
Table of Contents
FORM 10-K
FOR THE FISCAL YEAR ENDED DECEMBER 31, 2010
2
Table of Contents
The following information should be read in conjunction with the Consolidated Financial Statements and the notes thereto located elsewhere in this Annual Report on Form 10-K. This report, and in particular the Management’s Discussion and Analysis of Financial Condition and Results of Operations, contains “forward-looking statements” within the meaning of the Private Securities Litigation Reform Act of 1995. In this report, the words “believes,” “anticipates,” “intends,” “expects,” “plans,” “should,” “will,” “seeks” and words of similar import identify forward-looking statements. Such forward-looking statements involve known and unknown risks, uncertainties and other factors that may cause our actual results, performance or achievements to be materially different from any future results, performance or achievements expressed or implied by such forward-looking statements. Such factors include, among others, the following: our dependence on a single product; intense competition in the medical device industry and in our market; the uncertainty of market acceptance of our product; expense and outcome of litigation; dependence on obtaining and maintaining reimbursement; effectiveness and safety of our product over the long-term; our ability to obtain and maintain the necessary governmental clearances or approvals to market our product; our ability to develop and maintain proprietary aspects of our technology; our ability to manage our expansion or any acquisition; our dependence on suppliers;; our ability to sustain profitable operations; the inherent risk of exposure to product liability claims and product recalls and other factors referenced in “Risk Factors” and other sections of this report. Given these uncertainties, you are cautioned not to place undue reliance on such forward-looking statements. We assume no obligation to update these forward-looking statements to reflect actual results or changes in factors or assumptions affecting such forward-looking statements.
Market, Ranking and Other Data
This Annual Report on Form 10-K contains various estimates related to the women’s healthcare, contraception and medical device markets. Some of these estimates have been included in studies published by government agencies and market research firms and some are our estimates and are based on our knowledge and experience in the markets in which we operate. Additionally, other estimates have been produced by industry analysts based on trends to date, their knowledge of technologies and markets and customer research, but these are forecasts only and are thus subject to inherent uncertainty. Our estimates have been based on information provided by customers, suppliers, trade and business organizations and other contacts in the markets in which we operate. We believe these estimates to be accurate as of the date of this report. However, this information may prove to be inaccurate because of the method by which we obtain some of the data for our estimates or because this information cannot always be verified with complete certainty due to the limits on the availability and reliability of raw data, the voluntary nature of the data gathering process and other limitations and uncertainties inherent in a survey of market size. As a result, you should be aware that market, ranking and other similar data included in this report, and estimates and beliefs based on that data, may not be reliable.
3
Table of Contents
| ITEM 1. | BUSINESS |
Overview
We are a leader in the design, development, marketing and promotion of innovative solutions in women’s healthcare. Our flagship product is the proprietary Essure® permanent birth control system, which is the most effective non-surgical permanent birth control system available. The Essure system delivers a soft and flexible insert into a woman’s fallopian tubes, causing a benign tissue in-growth which blocks the fallopian tubes. Successfully placed Essure micro-inserts and the subsequent tissue growth around and through the micro-inserts prohibits the egg from traveling through the fallopian tube, preventing conception. The effectiveness rate of the Essure procedure determined in our clinical study is 99.8% after four years of follow-up. We obtained approval to market Essure in the European Union in February 2001 and obtained the U.S. Food and Drug Administration, or FDA, approval for Essure in November 2002. Nearly 500,000 women worldwide have undergone the Essure procedure and we sold the Essure system in 31 countries in 2010.
We sell Essure directly in France through our wholly owned subsidiary, Conceptus SAS (“SAS”), as well as indirectly through a network of distributors throughout the rest of Europe. Our wholly owned subsidiary in the United Kingdom, Conceptus Medical Limited (“CML”), serves as our direct sales office in the United Kingdom.
In 2009 we received a positive review from the National Institute for Health and Clinical Excellence in the United Kingdom and an approval for the Essure procedure from the Brazilian National Health Service.
During the first quarter of 2011 we began to promote GYNECARE THERMACHOICE® Uterine Balloon Therapy System in U.S. OB/GYN physician offices. GYNECARE THERMACHOICE® is a global endometrial ablation product that is used to treat excessive uterine bleeding (menorrhagia). The product is manufactured for and marketed by ETHICON™ Women’s Health & Urology, a division of Ethicon, Inc.
Net sales information based on segments and geographic regions is provided in Note 2 – Summary of Significant Accounting Policies in the Notes to Consolidated Financial Statements.
We were incorporated in the state of Delaware on September 18, 1992. Our mailing address and executive offices are located at 331 East Evelyn, Mountain View, California 94041, and our telephone number is (650) 962-4000. We are subject to the information and periodic reporting requirements of the Securities Exchange Act of 1934, or Exchange Act, and, in accordance therewith, file periodic reports, proxy statements and other information with the Securities and Exchange Commission, or SEC. Such periodic reports, proxy statements and other information is available for inspection and copying at the SEC’s Public Reference Room at 100 F Street, NE., Washington, DC 20549 or may be obtained by calling the SEC at 1-800-SEC-0330. In addition, the SEC maintains a Web site at http://www.sec.gov that contains reports, proxy statements and other information regarding issuers that file electronically with the SEC. We maintain three websites located at www.conceptus.com, www.essuremd.com and www.essure.com. We make available, free of charge, on or through our websites, our annual reports on Form 10-K, our quarterly reports on Form 10-Q, current reports on Form 8-K and amendments to those reports filed or furnished pursuant to Section 13(a) or 15(d) of the Exchange Act as soon as reasonably practicable after we electronically file or furnish such material to the Securities and Exchange Commission (SEC). Posted on the “About Conceptus” page of our www.conceptus.com website are links to our Code of Business Conduct and Ethics, Whistleblower Policy, Corporate Governance Guidelines, Corporate Risk Policy, Disclosure Policy Statement, and the charters of each of our Audit, Compensation and Nominating and Corporate Governance committees of our Board of Directors. Information contained on our websites is not incorporated by reference into and does not form a part of this Form 10-K. You can also obtain copies of these documents free of charge by writing to us at: Corporate Secretary, Conceptus, Inc., 331 East Evelyn, Mountain View, California 94041.
4
Table of Contents
The Essure Procedure Benefits
With 99.8% effectiveness based on four years of follow up, the Essure procedure is the most effective form of permanent contraception on the market based on a comparison of four-year clinical trial data. We developed the Essure procedure in response to the market need for a less invasive and more cost effective solution for women whose families are complete. The Essure procedure is typically performed in a physician office setting without general anesthesia and women typically can return to their daily activities within one day. Other permanent birth control procedures, such as tubal ligation or vasectomy, are done in a hospital setting, entail general anesthesia and require additional recovery time. These and other benefits of the Essure procedure compared to other traditional permanent birth control procedures are highlighted below.
Benefits for the patients:
| • | Proven four-year effectiveness rate of 99.8%; |
| • | Procedures performed in the comfort of the doctor’s office in less than 10 minutes; |
| • | No risks associated with incisions, general anesthesia or radiofrequency energy (common in other permanent birth control procedures); |
| • | No hormones; |
| • | Short recovery time most women are discharged within 45 minutes and they return to normal activities within 24 hours; |
| • | Confirmation – a three month follow-up test provides visible confirmation for women with reassurance that they are protected against unplanned pregnancy; and |
| • | Convenience – no recurring management of contraception usage after the confirmation test, which is performed three months after the initial procedure. |
Benefits to the physician and healthcare system:
| • | More cost effective and efficient solution due to savings related to cost and time such as the elimination of overhead, indirect and procedural costs related to anesthesia and post-operative care and hospital stays associated with tubal ligations; |
| • | Short procedure time and relative ease of performing the procedure; |
| • | Ability to visually confirm proper placement of radiopaque micro-insert during the procedure; |
| • | No risks associated with incisions, general anesthesia, thermal injuries, bowel injuries or dilutional hyponatremia, induced by hypotonic solutions such as glycine; and |
| • | Less resource-intensive environment – while Essure procedures may be performed in various settings including the physician office, hospital operating room and an ambulatory surgery center, the majority of Essure procedures take place in physicians’ offices. |
Benefits to the payers:
| • | Lower cost procedure due to reduced use of general or regional anesthesia and reduced number of post-operative hospital stays; |
| • | Elimination of costs – no operating room expenses because the procedure can be performed in the physician’s office; |
| • | Cost savings resulting from the potential reduction of unplanned pregnancies; and |
| • | Most effective form of permanent birth control available, based on four years of clinical studies. |
5
Table of Contents
The Essure Procedure
The Essure micro-insert is designed to be placed into each fallopian tube during a single procedure using a hysteroscope, an instrument that allows visual examination of the cervix and uterine cavity, and our minimally invasive delivery system. The delivery system consists of a disposable plastic handle connected to our proprietary guidewire and catheter system. The micro-insert is constructed of a stainless steel inner coil, a dynamic outer coil made from a nickel titanium alloy called Nitinol, which is commonly used in many medical devices and permanent implants, and a layer of polyethylene terephthalate, or polyester fibers, wound between the inner coils. Using the hysteroscope for guidance, the delivery catheter is guided through the uterus and into the opening of the fallopian tube. Once the physician has properly positioned the delivery system in the fallopian tube, the physician releases the micro-insert. When released, the micro-insert automatically expands to the contours of the fallopian tube and anchors itself in place. Over a three-month time frame, the polyester fibers within the micro-insert elicit a localized, benign tissue in-growth that occludes, or blocks, the fallopian tubes, thereby preventing conception.
Currently, local anesthesia is used as the predominant method of controlling discomfort during the Essure procedure. General anesthesia is not typically used unless required by hospital protocol, if requested by the patient, or based on the experience and comfort level of the physician. The Essure procedure can be performed in the comfort of a physician’s office in less than ten minutes (average hysteroscopic time) without hormones, cutting, burning or the risks associated with general anesthesia or tubal ligation. A patient is typically discharged approximately 45 minutes after the Essure procedure. No overnight hospital stay is required. Furthermore, the Essure procedure is effective without drugs or hormones. There is a three-month waiting period after the Essure procedure is completed during which the patient must continue to use her current form of birth control or an alternative form while tissue in-growth occurs. After three months, U.S. patients complete a confirmation test called a hysterosalpingogram, or HSG, which provides confirmation to both the doctor and the patient of both the placement of the inserts and the occlusion of the fallopian tubes. Outside of the United States, the confirmation test entails a standard flat plate pelvic X-ray conducted three months after completion of the procedure, with a subsequent HSG if device location on the initial radiographic image appears suspicious. In February 2011, we received CE (Conformité Européenne) Mark approval to use Transvaginal Ultrasound, or TVU, to confirm proper placement of Essure micro-inserts three months following the Essure procedure. TVU is an alternative confirmation test to the standard flat plate pelvic X-ray, and both tests will be included in the European Physicians’ Instruction for Use.
We did not conduct a clinical trial to compare the Essure procedure to laparoscopic tubal ligation and compared to the Collaborative Review of Sterilization or CREST study results, as a historical control. We believe, however, based on current data from our Pivotal trial and published reports on laparoscopic tubal ligation, that the Essure placement procedure has clear key advantages over laparoscopic tubal ligation:
| Essure Procedure | Tubal Ligation | |||
| Procedure |
Transcervical g Non- incisional |
Incisional g Abdominal incision or puncture | ||
| Typical anesthesia |
Local or IV sedation | General | ||
| Average post-op recovery time |
45 minutes | 4-5 hours | ||
| Procedure location |
Outpatient / hospital, surgi- center or doctor’s office |
Inpatient / hospital or surgi-center | ||
| Average return to regular activities* |
typically 24 hours | 4-6 days |
| * | Excluding the day of procedure |
6
Table of Contents
Physician Penetration
We require physicians to be preceptored for between 3 and 5 cases by a certified trainer before being able to perform the procedure independently. We continue to see an increase in the number of physicians becoming trained or who are in the process of training to perform the Essure procedure. The level of sales for the Essure system is highly dependent on the number of physicians trained to perform the procedure. However, we understand that a strong base of trained physicians does not necessarily correlate to an increase in revenue proportionately. Furthermore, there are no revenues associated with the training activities. We do not charge a fee for the activity and no commitment arises for the physician from the preceptorship.
We partnered with VirtaMed AG in 2009 to develop a highly-realistic simulator called EssureSim™ that provides virtual reality training of the hysteroscopic procedure that deploys Essure. The training helps refine physicians’ skills to enhance patient outcomes. In September 2010, we entered into a mutually exclusive agreement with VirtaMed AG for EssureSim™, which enables us to be the only company in the field of hysteroscopic permanent birth control with a photorealistic, high fidelity VirtaMed training simulator.
Our Clinical Progress
Since our phase II clinical trial of Essure in 1998, we have made improvements with each new model of Essure in terms of bilateral placement rate and/or hysteroscopic procedure time. Our third generation device, ESS305, has a successful bilateral placement rate of 96.9% and a procedure time of less than 10 minutes. The following chart sets forth bilateral placement rate and hysteroscopic procedure time for each of the identified trial or Essure model.
| Phase II | Pivotal | ESS 205 | ESS 305 | |||||
| Bilateral Placement Rate |
86.0% | 86.0% | 94.6% | 96.9% | ||||
| Hysteroscopic Procedure Time |
18 minutes | 13 minutes | 17 minutes | less than 10 minutes |
As the first commercialized method of hysteroscopic sterilization, Essure required numerous clinical studies to prove that it was a safe procedure that would be effective in preventing pregnancy. The following chart summarizes our clinical studies and notes the key study endpoints.
| November 1998 |
Phase II clinical study of safety and preliminary effectiveness of the Essure procedure commences. | The number of women in whom at least one of two Essure micro-inserts was placed totaled 682 between the two clinical trials. At three month follow-up, 647 women began relying on the Essure device as a method of permanent birth control. Based on clinical data, the Essure procedure has been demonstrated to be 99.8% effective after four years of follow-up. The Essure procedure has proven to have high patient satisfaction in our clinical trials. Clinical data submitted to the FDA in our Annual Reports show that Phase II study patients’ tolerance to wearing the Essure device up to five years was rated as “good” to “excellent” in 99% of women at all visits. Among women from our Pivotal trial who have worn the micro-inserts up to five years, at least 99% reported their comfort with the Essure device as “good” to “excellent” at all visits. | ||
| May 2000 |
Pivotal (Phase III) clinical trail commences. The clinical endpoints of the study include safety, effectiveness and patient satisfaction. |
7
Table of Contents
| February 2001 |
Approval to affix CE Mark for the European markets. | |||
| April 2002 |
PMA application submitted to the FDA for approval. | |||
| November 2002 |
Approval from FDA to market Essure procedure in the United States. | |||
| March 2005 |
ESS 205 Post Approval Study completed and final report submitted to FDA for approval. | Based on the ESS 205 post-approval study, the Essure procedure has a 94.6% first procedure bilateral placement rate. The bilateral placement rate is based on the number of women who are able to have two Essure micro-inserts successfully placed in their fallopian tubes at the time of their initial procedure. Three months later, the Essure Confirmation Test documents whether they can rely on Essure for contraception. | ||
| June 2007 |
FDA approved a PMA supplement for a modified delivery system, ESS305. | |||
| June 2009 |
ESS 305 Post Approval Study completed and final reports submitted to FDA. | Based on the ESS305 post-approval study, the Essure procedure has a 96.9% first procedure bilateral placement rate | ||
| Note: ESS 205 and ESS 305 are collectively called Essure. | ||||
Data from our clinical trials are undergoing analysis, and the clinical trial statistics presented may change as longer term follow-up data from the women participating in the trials is gathered, audited and analyzed, or if the FDA requests that calculations be performed in a different manner than presented in our PMA, application.
Other investigators are also conducting studies on Essure. As of February 2011, we are aware of more than 250 clinical publications including peer-reviewed articles, abstracts submitted to scientific meetings and journal supplements, related to Essure and hysteroscopic sterilization.
Our Market
Birth control use in the United States is prevalent among a majority of women of reproductive age, defined as 15-44 years of age. The National Survey of Family Growth, or NSFG, is a periodic survey that provides statistics on reproductive health in the United States and is conducted by the Centers for Disease Control and Prevention, National Center for Health Statistics. In 2010 NSFG published it most recent study entitled Use of Contraception in the United States: 1982–2008, which includes data for 2006-2008. According to the NSFG for 2006-2008, of the 61.9 million women of reproductive age in the United States, 38.2 million use some form of birth control and 9.3 million women who use temporary contraception do not intend to have more children. We view this as our primary market.
The 2006-2008 NSFG estimated that 37% of U.S. women rely on sterilization for birth control, including tubal ligation and vasectomy, making permanent birth control the most common method of contraception in the United States. Data published in 2010 estimated that approximately 643,000 tubal ligation procedures are performed each year in the United States, and the prevalence increases with age and number of children. According to the 2006-2008 NSFG, approximately 90% of women in the United States who have chosen female sterilization, which includes tubal ligation, have birthed two or more children. According to the same source, among the women in the United States who have chosen female sterilization, which includes tubal ligation, approximately 89% are between the ages of 30 and 44, which is Essure’s primary target market.
The 2006-2008 NSFG estimated that approximately 24.1 million women in the United States use temporary methods of birth control, such as oral contraceptives, condoms, implants and injectables. Of the women using
8
Table of Contents
temporary birth control, 28% choose oral contraceptives and 16% choose the male condom. Included in the group using temporary birth control, according to the same source, are approximately 7.8 million women who have two or more children. It is our belief that by making these women aware of the benefits a minimally invasive procedure offers, they will consider Essure in their continuum of family planning and opt for permanent birth control rather than their current temporary method.
Based on data from the 2006-2008 NSFG, the following chart summarizes birth control methods used by women using contraception in the United States:
| Age 30-34 | Age 35-39 | Age 40-44 | ||||||||||
| Method: |
||||||||||||
| Tubal ligation |
29 | % | 38 | % | 50 | % | ||||||
| Pill |
25 | % | 19 | % | 11 | % | ||||||
| Condom |
17 | % | 11 | % | 9 | % | ||||||
| Vasectomy |
8 | % | 17 | % | 20 | % | ||||||
| All others |
21 | % | 15 | % | 10 | % | ||||||
Worldwide, there is a larger market for permanent birth control. According to the United Nations World Contraceptive Use 2009, a report on birth control methods used by reproductive couples worldwide, 63% of women aged 15-49 years were using a form of contraception. The report indicated that female sterilization which includes tubal ligation and is the leading birth control method worldwide, was used by 20% of those women, followed by intrauterine devices, or IUDs, at 14%, and oral contraceptives at 9%.
Additional Products
During the first quarter of 2011, we began to promote GYNECARE THERMACHOICE® Uterine Balloon Therapy System in U.S. OB/GYN physician offices. GYNECARE THERMACHOICE® is a global endometrial ablation (“GEA”) product that is used to treat excessive uterine bleeding (menorrhagia). The product is manufactured for and marketed by ETHICON™ Women’s Health & Urology, a division of Ethicon, Inc.
Essure and GYNECARE THERMACHOICE® are compatible technologies that we believe are well-suited for the OB/GYN physician in-office setting. We believe this strategic partnership will ultimately drive Essure sales because patients who have had an endometrial ablation procedure are strongly advised not to get pregnant; thus it becomes a medical and practical necessity for a woman to obtain permanent birth control before having a GEA procedure. To date, GYNECARE THERMACHOICE® has been sold primarily in the hospital setting. We intend to leverage our U.S. sales channel to sell GYNECARE THERMACHOICE® to OB/GYN physician offices, and ultimately increase physician utilization of the Essure procedure.
Sales and Marketing
Our sales and marketing strategy has two components: to educate, train and certify physicians for the Essure procedure, and to increase awareness of the Essure procedure among women and physicians.
In training physicians, our strategy in the near term is to focus on moving physicians through three stages of usage: preceptorship, certification and certified in-office.
We believe a physician’s office is the best site of service for the Essure procedure because of the numerous benefits to patients, physicians and insurance payers. Compared to a hospital setting, the patient is typically more comfortable in an office setting, the physician is more economically and logistically efficient, and the payer or state incurs lower costs.
Additionally, we have a robust publication profile of more than 250 clinical publications including peer-reviewed articles, abstracts submitted to scientific meetings and journal supplements, related to Essure and
9
Table of Contents
hysteroscopic sterilization. We continue to attend and present new data at key scientific meetings including the American Association of Gynecologic Laparoscopists, American College of Obstetricians and Gynecologists and women’s healthcare societies.
Through the use of public relations and targeted direct-to-consumer advertising, we intend to continue increasing awareness of the Essure procedure among consumers. A variety of mediums are being used and tested to ensure that women are aware of the Essure procedure as they move through the continuum of birth control during each stage of their family planning.
We are distributing the Essure procedure in the United States through our direct sales force. To better align resources, we expanded the number of sales territories and increased the size of our direct sales force from approximately 80 to approximately 120 representatives, primarily by promoting from within our field sales team. By the end of 2010, there were approximately 170 sales personnel in the field, including approximately 120 direct representatives. Our sales representatives’ primary goals are to increase penetration within the physician base and grow the number of Essure procedures performed by Essure providers, facilitate an increase in the number of Essure procedures performed in the physician’s office, and to defend our existing market share against competitive methods of permanent birth control.
Internationally, we sell the Essure device through a combination of direct sales forces and distribution networks.
Reimbursement
Market acceptance of the Essure system depends in part upon the availability of reimbursement within prevailing healthcare payment systems. We believe that physician advocacy of our product will be required to continue to obtain reimbursement. In the United States, as of February 28, 2011, we have received positive coverage decisions for the Essure procedure from most private insurers and from all of the 51 Medicaid programs and favorable office reimbursements (defined as $1,700 or more) in 35 states. We continue to receive positive responses relating to reimbursement, which we believe will help increase the adoption of the Essure device by doctors and patients. We intend to continue our effort to educate payers of the cost-effectiveness of our product and to establish further programs to help physicians to navigate reimbursement issues. As with all healthcare plans, coverage will vary and is dependent upon the individual’s specific benefit plan.
Effective January 1, 2011, the Centers for Medicare and Medicaid Service, or CMS, the Medicare Physician Fee Schedule national average payment for hysteroscopic sterilization is $428 when performed in a hospital (facility) and $1,925 (non-facility) when performed in a physician’s office. The Current Procedural Terminology or CPT code for hysteroscopic sterilization is 58565. The 2011 Medicare national average payment for hospital outpatient reimbursement amounts for CPT 58565 is $3,126, which also includes the cost of the implant. In 2011, the Medicare national average payment for CPT 58565 in the ambulatory surgery center is $1,758 which also includes the cost of the implant.
Reimbursement systems vary significantly by country and sometimes by region, and reimbursement approvals must be obtained on a country-by-country basis. Many international markets have government-managed healthcare systems that determine reimbursement for new devices and procedures. In most markets, there are private insurance systems as well as government-managed systems.
In Europe, we are developing a strategic plan to obtain reimbursement in a number of European countries. In France, we have obtained official reimbursement with recommendation from Haute Autorité de Santé for the Essure procedure. Until, October 2010 the Essure procedure was covered in France for all age-appropriate women, regardless of their medical status. The Economic Committee for Healthcare Devices in France ruled in November 2007 that the reimbursement for the Essure device would remain at the then current levels of 663 Euros, net of value added tax, for the next five years. However, the French authorities have began to implement cost cutting measures that are effecting reimbursement for medical devices and procedures, and specifically have changed the reimbursement of hysteroscopic occlusion for women aged 40 and under.
10
Table of Contents
Manufacturing
We have a manufacturing facility at our headquarters in Mountain View, California, which we use for research and development, clinical and pilot-line manufacturing. We have two third-party original equipment manufacturers, or OEMs, which manufacture Essure devices at their manufacturing facilities. Both of these manufacturing facilities are located in Mexico.
Our agreements with our OEMs provide that they will continue to use our qualified suppliers of materials and components, unless we agree otherwise. We conduct periodic quality audits of our key suppliers. Most components, including nickel titanium alloy, delivery wires, the inner release catheter tubing and stainless steel wires, are available from more than one source and we intend to have at least two sources qualified for certain components. Currently, the key single source supplier component is the polyester fiber. The polyester fiber causes the necessary tissue in-growth, is made to our specifications and currently has only one qualified source supplier. However, we have accumulated a quantity of this material that exceeds our anticipated production needs for the next several years. We are in the process of qualifying a second source supplier for this fiber.
Our manufacturing facility and our OEM’s manufacturing facilities are subject to periodic inspection by regulatory authorities. Our quality management system is subject to FDA 21 CFR Part 820 – Quality System Regulations. These regulations require that we conduct our product design, testing, manufacturing and quality control activities in conformance with these regulations and that we maintain our documentation and records of these activities in a prescribed manner. Our manufacturing facility is licensed by the California Department of Health Services, Food and Drug Branch and is registered with the FDA. In addition our manufacturing facility has received EN/ISO 13485 Quality Management Systems certification and our quality system is in compliance with the European Union Medical Device Directive 93/42/EEC, allowing us to affix the CE Mark to our products after assembling appropriate documentation. EN/ISO 13485 Quality Management Systems standards have been developed to harmonize standards for the design, manufacturing and distribution of medical devices. Quality operations have been developed to comply with worldwide regulatory requirements that companies know the standards of quality on a worldwide basis.
Research and Development
Our research and development activities are performed by our product development, process engineering, intellectual property and regulatory and clinical research staff. Research and development expenses for 2010, 2009 and 2008 were approximately $6.9 million, $7.1 million and $6.8 million, respectively. We intend to continue to focus our research and development efforts on the development of new or alternative product designs and enhancements.
Intellectual Property
Our policy is to protect our proprietary position aggressively by, among other things, filing U.S. and foreign patent applications to protect technology, inventions and improvements that are important to the development of our business. In addition to the patent protection we have obtained in our license from Target Therapeutics, a division of Boston Scientific Corporation, we have filed device and method patents for the use of our product in new clinical applications and have pursued patents for several of our other inventions and developments. As of February 28, 2011, we had 37 U.S. patent applications pending, 35 U.S. issued patents, 44 foreign and/or international patent applications pending and 42 issued foreign patents with 15 EP patents resulting in 105 nationalized patents in Europe and Hong Kong. These issued patents, having been filed at various times, have different expiration dates. Our issued patents include claims relevant to transcervical fallopian tube occlusion devices and methods, guidewire manipulation, guidewire design, fallopian tube visualization, electrosurgical instruments and a delivery mechanism for a tubal occlusion device. The pending applications describe various aspects of our proprietary tubal access platform technology, including claims specific to our Essure tubal occlusion device.
11
Table of Contents
We obtained an exclusive license in the field of reproductive physiology to technology developed by Target Therapeutics. In addition, we have granted to Target Therapeutics an exclusive license to our technology in certain fields of interventional medicine outside of reproductive physiology. Our exclusive license of Target Therapeutics’ technology encompasses certain technology developed by Target Therapeutics as of February 1, 1996. We do not have any preferential rights to technology developed by Target Therapeutics after that date. The license from Target Therapeutics includes patents which relate to the design of its micro-catheters (the initial patent for which expired in June 2006), certain aspects of guidewire design and other important aspects of micro-catheter, guidewire and micro-coil technologies. In addition, should any of our Target Therapeutics technology be found to infringe upon a third party’s patent rights, it may affect our ability to develop, market and sell additional products in the future. Finally, Target Therapeutics has the right to terminate our license if we materially breach the terms of the license. If the Target Therapeutics license were terminated, it might affect our ability to develop, market and sell additional products in the future.
We believe that we are free to make and sell our product, and that our product and its intended use does not infringe any valid patent rights of any other party. During the third quarter of 2009, we acquired the intellectual property assets, including patents and licenses of Ovion Inc., a wholly owned subsidiary of American Medical Systems, Inc., or AMS. In connection with the purchase, AMS and Ovion released us from any and all current and future domestic and international royalty obligations under such licenses, including the obligations under a previous patent infringement settlement agreement with Ovion that had required us to pay 3.25% of the accumulative revenue derived from sale of the Essure system in excess of $75.0 million as royalty for a period of ten years starting from October 23, 2003, the date we entered into that settlement agreement. We believe the acquisition of these intellectual property assets secured complete ownership over the use and further development of the Essure system and we also believe it enabled us to expand our gross profit margins.
Government Regulations
The research, development, manufacture, labeling and distribution of medical diagnostic and surgical devices and pharmaceutical products intended for commercial use are subject to extensive governmental regulation by the FDA in the United States and by a variety of regulatory agencies in other countries. Under the Federal Food, Drug and Cosmetic Act, known as the FD&C Act, manufacturers of medical products and devices must comply with certain regulations governing the design, testing, manufacturing, packaging, servicing and marketing of medical products.
United States Regulation
The manufacture and sale of our product are subject to extensive regulation by numerous governmental authorities, principally the FDA as well as state agencies. In particular, the FDA regulates the research, clinical testing, manufacturing, safety, labeling, storage, record keeping, advertising, distribution, sale and promotion of medical devices in the United States. The FDA requires that all medical devices introduced to the market either be preceded by a pre-market notification clearance under Section 510(k) of the FD&C Act, or an approved PMA application. A PMA application is approved when the FDA has determined that the clinical trial data and manufacturing quality assurance information proves a product is safe and effective for its labeled indications, or for devices that are not of the same type or substantially equivalent to a device in commercial distribution prior to 1976. FDA enforcement policy strictly prohibits the promotion of approved medical devices for uses other than those for which the device is specifically approved by the FDA. Ongoing compliance with the Quality Systems Regulations and other applicable regulatory requirements is monitored through periodic inspections by federal and state agencies, including the FDA and the California Department of Health Services.
The Essure procedure received FDA PMA approval for commercialization in the United States on November 6, 2002. FDA had reviewed our PMA submission on an expedited basis because as stated by FDA “it offers significant advantages over existing approved alternatives for permanent birth control.” We received approval to commercialize the latest model of our Essure procedure on June 15, 2007. For the newest model of
12
Table of Contents
the Essure system, we were also required to conduct a post approval study in the United States to evaluate placement rates. We are required to provide information to the FDA on death or serious injuries which our medical devices have allegedly caused or with which they have been associated, as well as product malfunctions that would likely cause or contribute to death or serious injury if the malfunction were to recur. If the FDA believes that a company is not in compliance with the law or regulations, it can institute proceedings to detain or seize products, issue a recall, enjoin future violations and assess civil and criminal penalties against the company, its officers and its employees.
Our Mountain View, California facility underwent an International Organization for Standardization (“ISO”) inspection in August 2010 which resulted in continuing approval and ISO certification through May of 2013. In December 2010 we underwent a routine FDA audit which is currently under review.
We and our OEMs are required to adhere to applicable FDA and other regulations, including testing, control and documentation requirements. If we or our OEMs do not comply with applicable regulatory requirements, we may be subject to warning letters, fines, injunctions, civil penalties, recall or seizure of products, total or partial suspension of production, withdrawal of approvals and criminal prosecution, among other penalties.
We are also subject to regulation by the U.S. Occupational Safety and Health Administration and by other government entities. Regulations regarding the manufacture and sale of our product are subject to change. We cannot predict what impact, if any, such changes might have on our future ability to manufacture market and distribute the Essure system.
International Regulation
Sales of medical devices outside of the United States are subject to international regulatory requirements that vary widely from country to country. The time required to obtain clearance required by foreign countries may be longer or shorter than that required for FDA clearance, and requirements for licensing may differ significantly from FDA requirements. No assurance can be given that such foreign regulatory approvals will be granted on a timely basis, or at all. Some countries in which we currently operate or contemplate to operate either do not currently regulate medical devices or have minimal registration requirements. However, these countries may develop more extensive regulations in the future that could delay or prevent us from marketing the Essure system in these countries.
In addition, there can be no assurance that we will meet the FDA’s export requirements or receive FDA export approval when such approval is necessary, or that countries to which the devices are to be exported will approve the devices for import. Our failure to meet the FDA’s export requirements or obtain FDA export approval when required to do so, or to obtain approval for importation into various countries, could have a material adverse effect on our business, financial condition and results of operations.
The European Union has promulgated rules which require manufacturers of medical products to obtain the right to affix to their products the CE Mark, an international symbol of adherence to quality assurance standards and compliance with applicable European Union Medical Device Directives. In some markets, approval to distribute is subject to compliance with local regulations such as registration with health ministries and/or particular requirements regarding labeling or distribution.
The Ministry of Health in France has implemented cost-cutting measures that may affect reimbursement for procedures and medical devices. Effective October 1, 2010, the French Ministry of Health changed physician reimbursement of hysteroscopic occlusion procedure for women under the age of 40, which could have an impact on our business in France. We expect further cost-cutting measures by the Ministry of Health to affect reimbursements for medical devices. We are working to overturn this change, but are unable to predict whether our efforts will be successful.
During 2009 we received a positive review from the National Institute for Health and Clinical Excellence in the United Kingdom and an approval for the Essure procedure from the Brazilian National Health Service.
13
Table of Contents
Competition
The medical device industry is highly competitive and is characterized by rapid and significant technological change. To compete successfully, we need to continue to demonstrate the advantages of our Essure products and technologies compared to both well-established and new alternative procedures, products and technologies, and convince physicians and other healthcare decision makers of the advantages of our products and technologies. As we commercialize and market the Essure system, we expect to compete with:
| • | other methods of permanent contraception; |
| • | other methods of non-permanent contraception, including devices such as intrauterine devices, or IUDs, vaginal rings, condoms and prescription drugs such as the birth control pill, injectable and implantable contraceptives and patches; and |
| • | other companies developing permanent contraception devices, if any, that are similar to or otherwise compete with the Essure procedure. |
We compete against other surgical procedures for permanent birth control, mechanical devices and other contraceptive methods, including existing methods of reversible birth control for both women and men.
The Essure procedure faces direct competition from Adiana, a hysteroscopic sterilization method that is manufactured and sold by Hologic, Inc. in Europe and the United States. We believe the Essure procedure has significant advantages over this competitor’s product which include:
| • | a higher effectiveness rate; |
| • | the avoidance of risk associated with radiofrequency energy which the Adiana device delivers to tubal tissue; and |
| • | radio-opaque micro-inserts that permit the physician to visually confirm proper placement in the fallopian tubes, unlike the non-radio-opaque material used in the Adiana device. |
Many of our competitors have access to greater resources required to develop and market a competitive product than we do. In addition, new competition and products may arise due to consolidation within the industry and other companies may develop products that could compete with the Essure system. Our competitive position also depends on:
| • | widespread awareness, acceptance and adoption of our Essure system; |
| • | our ability to respond promptly to medical and technological changes through the development and commercialization of new products; |
| • | availability of coverage and reimbursement from third-party payors, insurance companies and others for the Essure procedure; |
| • | the manufacture and delivery of our products in sufficient volumes on time, and accurately predicting and controlling costs associated with manufacturing, installation, warranty and maintenance of the products; |
| • | our ability to attract and retain qualified personnel; |
| • | the extent of our patent protection or our ability to otherwise develop proprietary products and processes; and |
| • | securing sufficient capital resources to expand our sales and marketing efforts. |
These and other competitive factors may render the Essure system obsolete or noncompetitive or reduce demand for the Essure system.
14
Table of Contents
Product Liability and Insurance
The manufacture and sale of medical products involve an inherent risk of exposure to product liability claims and product recalls. We currently maintain product liability insurance with coverage limits of $10.0 million per occurrence and an annual aggregate maximum of $10.0 million, which we believe is comparable to that maintained by other companies of similar size serving similar markets. However, there can be no assurance that product liability claims in connection with clinical trials or sale of our product will not exceed such insurance coverage limits, which could have a material adverse effect on us, or that such insurance will continue to be available on commercially reasonable terms or at all. Insurance is expensive and in the future may not be available on acceptable terms, if at all. A successful product liability claim or series of claims brought against us in excess of our insurance coverage or a recall of our product could have a material adverse effect on our business, financial condition and results of operations.
Employees
As of December 31, 2010, we have 304 full-time employees, consisting of 30 in manufacturing and quality assurance and engineering, 14 in research and development, 213 in sales and marketing and 47 in general and administrative functions worldwide. We generally depend on a number of key management, sales and marketing and technical personnel. The loss of the services of one or more key employees could delay the achievement of our strategic objectives. Our success will also depend on our ability to attract and retain additional highly qualified management, sales and marketing and technical personnel to meet our growth goals. We face intense competition for qualified personnel, many of whom are often subject to competing employment offers, and we do not know whether we will be able to attract and retain such personnel.
None of our employees are represented by a labor union or covered by a collective bargaining agreement, and we believe our employee relations are good.
15
Table of Contents
| ITEM 1A. | RISK FACTORS |
In addition to the other information in this Form 10-K, the following factors should be considered carefully in evaluating Conceptus and our business. The risks and uncertainties described below are those that we currently believe may materially affect us. Other risks and uncertainties that we do not presently consider to be material or of which we are not presently aware, may become important factors that affect us in the future. You should not consider this list to be a complete statement of all potential risks and uncertainties.
We are dependent on the Essure system, which is currently our primary commercial product. If Essure fails to gain market acceptance, our business will suffer.
We are dependent on the Essure system, which is currently our primary commercial product and constitutes nearly all of our sales revenues. Since receiving FDA approval to market the Essure system in November 2002, the Essure system has gained market share in the contraception market, especially in the permanent birth control market. However, the contraception market remains dominated by procedures that are well established among physicians and patients and are routinely taught to new physicians. As a result, we believe that recommendations and endorsements by physicians continue to be essential for market acceptance of our product. Physicians and patients may not accept our product and we may not be able to obtain their recommendations or endorsements in sufficient amounts to sustain profitability. Physicians are traditionally slow to adopt new products and treatment practices, partly because of perceived liability risks. If the Essure system does not achieve significant market acceptance among physicians, patients and healthcare payers, even if reimbursement levels are sufficient and necessary U.S. and international regulatory approvals are maintained, we may fail to achieve significant revenues or sustain profitability. Moreover, without additional product offering our business may be negatively impacted.
If we are unable to compete effectively, demand for the Essure system may be reduced.
The medical device industry is highly competitive and is characterized by rapid and significant technological change. To compete successfully, we need to continue to demonstrate the advantages of our Essure products and technologies over both new and well-established alternative procedures, products and technologies, and convince physicians and other healthcare decision makers of the advantages of our products and technology. As we market the Essure system, we compete with:
| • | other methods of birth control, in particular tubal ligation; |
| • | other companies that have developed or may be developing birth control devices that are similar to or otherwise compete with the Essure system; |
| • | other methods of non-permanent birth control, including devices such as intrauterine devices, or IUDs, vaginal rings, condoms and prescription drugs such as the birth control pill, injectable and implantable contraceptives and patches; and |
| • | other surgical procedures for permanent birth control, mechanical devices and other contraceptive methods, including existing methods of reversible birth control for both women and men. |
The Essure procedure faces direct competition from Adiana, a hysteroscopic sterilization method that is manufactured and sold by Hologic, Inc. in Europe and the United States. We believe the Essure procedure has significant advantages over its competitor such as its higher effectiveness rate, no risks from the use of radiofrequency energy and the fact that the micro-inserts are radio-opaque, which enables the physician to visually confirm that the micro-inserts have been properly placed in the fallopian tubes.
Many of our competitors have access to greater resources to develop and market a competitive product than we do. In addition, new competition and products may arise due to consolidation within the industry and other companies may develop products that could compete with the Essure system. Our competitive position also depends on:
| • | widespread awareness, acceptance and adoption of our Essure product; |
| • | our ability to respond promptly to medical and technological changes through the development and commercialization of new products; |
16
Table of Contents
| • | availability of coverage and reimbursement from third-party payers, insurance companies and others for the Essure procedure; |
| • | the manufacture and delivery of our products in sufficient volumes on time, and accurately predicting and controlling costs associated with manufacturing, installation, warranty and maintenance of the products; |
| • | our ability to attract and retain qualified personnel; |
| • | the extent of our patent protection or our ability to otherwise develop proprietary products and processes; and |
| • | securing sufficient capital resources to expand our sales and marketing efforts. |
These and other competitive factors may render the Essure system obsolete or noncompetitive or reduce demand for the Essure system.
The fluctuation of our quarterly results may adversely affect the trading price of our common stock.
Our revenues and results of operations have in the past and will likely vary in the future from quarter to quarter due to a number of factors, many of which are outside of our control and any of which may cause our stock price to fluctuate. The primary factors that may affect us include the following:
| • | the extent to which the Essure system gains market acceptance; |
| • | the rate at which physicians are trained to perform the Essure procedure; |
| • | our ability to increase physician utilization rates of the Essure procedure; |
| • | our ability to successfully promote GYNECARE THERMACHOICE® in U.S. physician offices; |
| • | the timing of sales of our products and services; |
| • | actions relating to reimbursement matters; |
| • | increases in sales and marketing, product development or administration expenses; |
| • | the rate at which we establish U.S. and international distribution or marketing partners and the degree of their success; |
| • | the introduction and marketing of competitive products; |
| • | costs related to acquisitions of technology or businesses; |
| • | trends in OB/GYN physician office visits; and |
| • | foreign exchange fluctuations. |
You should not rely on quarter-to-quarter comparisons of our results of operations as an indication of our future performance. It is likely that in some future quarters, our results of operations may be below the expectations of public market analysts and investors. In this event, the price of our common stock may fall.
Our marketing and advertising programs may not be successful.
Our marketing and advertising programs, which are aimed at increasing physician and consumer awareness for our Essure system, are generally costly and may have limited success. Consumer campaigns require consumers to make contact with an Essure trained physician, be preauthorized for insurance reimbursement and then be scheduled for the procedure. Many of these steps are not within our control, and the advertising programs may not result in revenue generation commensurate with their costs. Physicians are busy and have little time to spend with their patients. Our marketing and advertising programs directed at physicians may not be effective at encouraging the physicians to discuss the Essure procedure with their patients and thus may not be cost effective.
17
Table of Contents
We may experience disruption in supply due to our dependence on our contract manufacturers to supply our commercial product requirements and our inability to obtain suppliers of certain components for our products.
Our suppliers may encounter problems during manufacturing due to a variety of reasons, including failure to follow specific protocols and procedures, failure to comply with applicable regulations, equipment malfunctions, labor shortages or environmental factors. For example, although it has not resulted in a supply shortage, in the fourth quarter of 2010, our subcontractor FlexMed, formerly named Avail Medical experienced manufacturing disruptions related to the final assembly of the device which resulted in non-conforming product. In addition, we and our third party manufacturers purchase both raw materials used in our product and finished goods from various suppliers, and we rely on a single source supplier for certain components of our product. Although we anticipate that we have adequate sources of supply and/or inventory of these components to handle our production needs for the foreseeable future, if we or our contract manufacturers are unable to secure on a timely basis sufficient quantities of the materials we depend on to manufacture our products, if we encounter delays or contractual or other difficulties in our relationships with these suppliers, or if we cannot find alternate suppliers at an acceptable cost, then the manufacture of our products may be disrupted, which could increase our costs and have a material adverse effect on our business.
Our intellectual property rights may not provide meaningful commercial protection for Essure, which could enable third parties to use our technology, or very similar technology, and could impair our ability to compete in the market.
We rely on patent, copyright, trade secret and trademark laws to limit the ability of others to compete with us using the same or similar technology in the United States and other countries. However, as described below, these laws afford only limited protection and may not adequately protect our rights to the extent necessary to sustain any competitive advantage we may have. The laws of some foreign countries do not protect proprietary rights to the same extent as the laws of the United States, and many companies have encountered significant problems in protecting their proprietary rights abroad. These problems can be caused by the absence of rules and methods for defending intellectual property rights.
We will be able to protect our technology from unauthorized use by third parties only to the extent that they are covered by valid and enforceable patents or are effectively maintained as trade secrets. The patent positions of companies developing medical devices, including our patent position, generally are uncertain and involve complex legal and factual questions concerning the enforceability of such patents against alleged infringement. Recent judicial decisions have established new case law and a reinterpretation of previous patent case law, and other cases are pending before the United States Supreme Court and consequently we cannot assure you that historical legal standards surrounding the questions of infringement and validity will be applied in future cases. In addition, legislation has been pending in United States Congress that, if enacted in its present form, may limit the ability of medical device manufacturers in the future to obtain patents on surgical and medical procedures that are not performed by, or as a part of, devices or compositions that are themselves patentable. Our ability to protect our proprietary methods and procedures may be compromised by the enactment of this legislation or any other limitation or reduction in the patentability of medical and surgical methods and procedures. Changes in either the patent laws or in interpretations of patent laws in the United States and other countries may therefore diminish the value of our intellectual property.
We own, or control through licenses, a variety of issued patents and pending patent applications. However, the patents on which we rely may be challenged and invalidated, and our patent applications may not result in issued patents. Moreover, our patents and patent applications may not be sufficiently broad to prevent others from practicing our technologies or from developing competing products. We also face the risk that others may independently develop similar or alternative technologies or design around our patented technologies.
We have taken security measures to protect our proprietary information, especially proprietary information that is not covered by patents or patent applications. These measures, however, may not provide adequate
18
Table of Contents
protection of our trade secrets or other proprietary information. We seek to protect our proprietary information by entering into confidentiality agreements with employees, collaborators and consultants. Nevertheless, employees, collaborators or consultants could still disclose our proprietary information and we may not be able to protect our trade secrets in a meaningful way. If we lose any employees, we may not be able to prevent the unauthorized disclosure or use of our technical knowledge or other trade secrets by those former employees despite the existence of a nondisclosure and confidentiality agreement and other contractual restrictions designed and intended to protect our proprietary technology. In addition, others may independently develop substantially equivalent proprietary information or techniques or otherwise gain access to our trade secrets.
Our ability to compete effectively will depend substantially on our ability to develop and maintain proprietary aspects of our technology. Our issued patents, any future patents that may be issued as a result of our United States or foreign patent applications, or the patents under which we have license rights may not offer any degree of protection against competitive products. Any patents that may be issued or licensed to us or any of our patent applications could be challenged, invalidated or circumvented in the future.
If we cannot operate our business without infringing third-party intellectual property rights, our prospects will suffer.
Our success will depend in part on our ability to operate without infringing or misappropriating the proprietary rights of others. We may be exposed to future litigation by third parties based on claims that our product infringes the intellectual property rights of others. There are numerous issued patents in the medical device industry and, as described in the next risk factor, the validity and breadth of medical device patents involve complex legal and factual questions for which important legal principles remain unresolved. Our competitors may assert that our product and the methods we employ may be covered by United States or foreign patents held by them. In addition, because patent applications can take many years to issue, there may be currently pending patent applications of which we are unaware that may later result in issued patents that our product may infringe. There could also be existing patents of which we are unaware that our product may inadvertently infringe. If we lose a patent infringement lawsuit, we could be prevented from selling our product unless we can obtain a license to use technology or ideas covered by that patent or are able to redesign the product to avoid infringement. A license may not be available to us on terms acceptable to us, or at all, and we may not be able to redesign our product to avoid any infringement. If we are not successful in obtaining a license or redesigning our product, we may be unable to sell our product and our business would suffer.
We are currently a party to patent litigation, which is costly and diverts our management’s attention, and we may be subject to additional patent litigation in the future.
The medical device industry has been characterized by extensive litigation regarding patents and other intellectual property rights, and companies in the industry have used intellectual property litigation to gain a competitive advantage. We currently are and may in the future become a party to patent infringement claims and litigation or interference proceedings declared by the U.S. Patent and Trademark Office, or PTO, to determine the priority of inventions. The defense and prosecution of these matters are both costly and time consuming. We have commenced and may need to commence proceedings against others to enforce our patents, to protect our trade secrets or know-how or to determine the enforceability, scope and validity of the proprietary rights of others. These proceedings have and would result in substantial expense to us and significant diversion of effort by our technical and management personnel.
An adverse determination in existing or new litigation or interference proceedings to which we may become a party could subject us to significant liabilities to third parties or require us to seek licenses from third parties. Although patent and intellectual property disputes in the medical device area have often been settled through licensing or similar arrangements, costs associated with such arrangements may be substantial and could include ongoing royalties. We may be unable to obtain necessary licenses on satisfactory terms, if at all. Adverse determinations in a judicial or administrative proceeding or failure to obtain necessary licenses could prevent us from manufacturing and selling the Essure system.
19
Table of Contents
On May 22, 2009, we filed a lawsuit in the United States District Court, Northern District of California against Hologic, Inc., seeking declaratory judgment by the Court that Hologic’s planned importation, use, sale or offer to sell of its forthcoming Adiana Permanent Contraception system will infringe several U.S. patents owned by us, and an injunction prohibiting Hologic from importing, using, selling or offering to sell its Adiana system in the United States. Upon FDA approval of the Adiana Permanent Contraception system, we filed an Amended Complaint in July 2009 seeking a judgment that Hologic’s importation, use, sale and/or offer to sell the system infringes our patents and requested an injunction against such activity. Please see “Item 3. Legal Proceedings” which are documented elsewhere in this report, for information regarding the procedural status of this litigation.
If we fail to manage any expansion or acquisition, our business could be impaired.
We may in the future acquire one or more technologies, products or companies that complement our business. We may not be able to effectively integrate these into our business and any such acquisition or expansion could bring additional risks, exposures and challenges to our company. In addition, acquisitions may dilute our earnings per share, disrupt our ongoing business, distract our management and employees, increase our expenses, subject us to liabilities and increase our risk of litigation, all of which could harm our business. If we use cash to acquire technologies, products, companies or expand operations, it may divert resources otherwise available for other purposes. If we use our common stock to acquire technologies, products or companies, our stockholders may experience substantial dilution. If we fail to manage any expansion or acquisition, our business could be impaired.
We have a limited history of operation with the Essure system, and have only recently achieved profitability. We may again incur operating losses and we may not sustain profitability.
We have a limited history of operation with the Essure system and since our inception in 1992, we have incurred operating losses until we experienced our first operating profit in Fiscal 2008. We may again incur operating losses as we continue sales and marketing efforts worldwide and in the United States, particularly on a quarterly basis. Our operating loss may continue until sufficient revenues can be generated to offset expenses. Losses have caused and may continue to cause our stockholders’ equity and net current assets to decrease. Our failure to sustain profitability would likely negatively impact the market price of our common stock and our ability to satisfy our obligations in the future.
Current worldwide economic uncertainty may adversely affect our business and prospects.
Market acceptance of the Essure system and GYNECARE THERMACHOICE® in the United States and other countries is dependent upon the medical device purchasing practices of our customers, patient demand for our products and procedures and the reimbursement of patient’s medical expenses by government healthcare programs and third-party payors. The continuing uncertainty surrounding the global economy has caused and may continue to cause the purchasers of medical devices to decrease their medical device purchasing activities. Economic uncertainty has and may result in cost-conscious consumers making fewer elective trips to their physicians and specialists, which in turn would adversely affect demand for our products and procedures. Furthermore, governments and other third party payors around the world facing tightening budgets could move to further reduce the reimbursement rates or the scope of coverage offered, which could adversely affect sales of our products. If the current adverse economic conditions continue, our business and prospects may be adversely affected.
Our stock price is volatile.
The market price of our common stock has been, and may continue to be volatile. We believe that a variety of factors could cause the price of our common stock to fluctuate, perhaps substantially, including:
| • | announcements and rumors of developments related to our business, including changes in reimbursement rates or regulatory requirements, proposed and completed acquisitions, or the industry in which we compete: |
20
Table of Contents
| • | published studies and reports relating to the comparative efficacy of products and markets in which we participate; |
| • | published studies and reports relating to market share of our product compared to competitor products; |
| • | quarterly fluctuations in our actual or anticipated operating results and order levels; |
| • | general conditions in the worldwide economy; |
| • | announcements of technological innovations: |
| • | new products or product enhancements by us or our competitors; |
| • | developments in patents or other intellectual property rights and litigation; and |
| • | developments in relationships with our customers and suppliers. |
In addition, the stock market in general and the markets for shares of “high-tech” companies have experienced extreme price fluctuations which have often been unrelated to the operating performance of affected companies. Any such fluctuations in the future could adversely affect the market price of our common stock, and the market price of our common stock may decline.
Our future liquidity and capital requirements are uncertain.
As we market the Essure system on a wide scale basis, we may require additional financing and therefore, may in the future seek to raise additional funds through bank facilities, debt or equity offerings or other sources of capital. Any additional equity or debt financing may be dilutive to stockholders, and debt financing, if available, may involve restrictive covenants and interest expenses that will affect our financial results. Additional funding may not be available when needed or on terms acceptable to us. If we are unable to obtain additional capital, we may be required to delay, reduce the scope of or eliminate our selling and marketing activities. Our future liquidity and capital requirements will depend upon many factors, including, among others:
| • | the rate of product adoption by doctors and patients; |
| • | obtaining government and third-party reimbursement for the Essure procedure; |
| • | the liquidity of private insurance systems, as well as the timeliness of payments of government management reimbursement systems; |
| • | our ability to maintain our days sales outstanding; |
| • | the resources devoted to increasing manufacturing capacity to meet commercial demands; |
| • | mergers and acquisitions activity, if any; |
| • | the resources devoted to developing and conducting sales and marketing and distribution programs; and |
| • | the progress and cost of product development programs. |
Our liquidity could be negatively impacted by adverse conditions in the financial markets.
At December 31, 2010, we had cash and cash equivalents of $18.4 million. This available cash and cash equivalents are held in accounts at financial institutions and consist of invested cash and cash in our operating accounts. The invested cash is invested in interest bearing money market funds managed by third party financial institutions. These funds invest in direct obligations of the government of the United States and traditional money market funds. We can provide no assurances that access to our invested cash and cash equivalents will not be impacted by adverse conditions in the financial markets.
We maintain an investment portfolio of various holdings, types, and maturities. These securities are classified as available-for-sale. As of December 31, 2010 we had short and long-term investments of $72.5 million recorded at fair value. Our portfolio includes time deposits, U.S. treasury bills, U.S. government bonds,
21
Table of Contents
commercial paper and corporate bonds, the values of which are subject to market price volatility. If such investments suffer market significant price declines, we may recognize in earnings the decline in the fair value of our investments below their cost basis when the decline is judged to be other than temporary. For information regarding the sensitivity of and risks associated with the market value of portfolio investments and interest rates refer to the section titled “Quantitative and Qualitative Disclosures About Market Risk.”
All of our cash and cash equivalents in our operating accounts are with third-party financial institutions. These balances exceed the Federal Deposit Insurance Corporation insurance limits. While we monitor the cash balances in our operating accounts and adjust the cash balances as appropriate, these cash balances could be impacted if the underlying financial institutions fail or are subject to other adverse conditions in the financial markets. To date we have experienced no loss or lack of access to cash in our operating accounts.
If the effectiveness and safety of Essure are not supported by long-term data, we may not achieve or sustain market acceptance and we could be subject to liability.
The Essure procedure has undergone two clinical studies, Phase II and Pivotal Trials, which have evaluated its safety and effectiveness. Current labeling includes Essure’s four year effectiveness rate of 99.8%; data beyond four years have been collected and are currently undergoing analysis. Two additional studies have evaluated safety and bilateral placement in the commercial environment. In 2010, the third generation of the Essure procedure, or ESS305, received FDA approval for an improved bilateral placement rate of 96.9% from 94.6% and an improved hysteroscopic time of less than 10 minutes from 13 minutes. If long-term studies or clinical experience indicate that the Essure system is less effective or less safe than our current data suggest, we may not achieve or sustain market acceptance and/or we could be subject to significant liability.
If we lose FDA approval or fail to comply with existing or future regulatory requirements in the United States or internationally, it would delay or prevent us from generating further product revenues.
Sales of medical devices outside of the United States are subject to international regulatory requirements that vary widely from country to country. The time required to obtain clearance required by foreign countries may be longer or shorter than that required for FDA clearance, and requirements for licensing may differ significantly from FDA requirements. Many countries in which we currently market or intend to market the Essure system either do not currently regulate medical devices or have minimal registration requirements; however, these countries may develop more extensive regulations in the future, which could delay or prevent us from marketing the Essure system in these countries.
The FDA and certain foreign regulatory authorities impose numerous requirements with which medical device manufacturers must comply in order to maintain regulatory approvals. FDA enforcement policy strictly prohibits the promotion of approved medical devices for uses other than those for which the device is specifically approved by the FDA. We are required to adhere to applicable FDA regulations, such as Quality System Regulation, or QSR, and similar regulations in other countries, which include testing, control and documentation requirements. Ongoing compliance with QSR and other applicable regulatory requirements are monitored through periodic inspections by federal and state agencies, including the FDA and the California Department of Health Services, and by comparable agencies in other countries.
If we fail to comply with applicable regulatory requirements, we may be subject to, among other things, warning letters, fines, injunctions, civil penalties, recall or seizure of products, total or partial suspension of production, refusal of the government to grant pre-market clearance or pre-market approval for devices, withdrawal of approvals and criminal prosecution, any of which could negatively impact our business.
22
Table of Contents
We may not maintain regulatory approvals for the Essure system, which would delay or prevent us from generating product revenues and would harm our business and force us to curtail or cease operations.
Numerous government authorities, both in the United States and internationally, regulate the manufacture and sale of medical devices, including the Essure system. In the United States, the principal regulatory authority is the FDA. The process of obtaining and maintaining required regulatory clearances is lengthy, expensive and uncertain.
The adoption of healthcare reform in the United States and the uncertainty surrounding the implementation of these reforms could harm our business and prospects.
In recent years, the healthcare industry has undergone significant change driven by various efforts to reduce costs, trends toward managed care, cuts in Medicare, consolidation of healthcare distribution companies and collective purchasing arrangements by office-based healthcare practitioners. The effect of the implementation of the new U.S. health care reform law adopted in March 2010 on our business is uncertain. Among other things, the law requires the medical device industry to subsidize healthcare reform in the form of a 2.3% excise tax on U.S. sales of certain medical devices beginning in 2013. We expect that this excise tax will apply to our products. U.S. net product sales represented 78% and 79% of our worldwide net product sales in fiscal 2010 and 2009, respectively. Various healthcare reform proposals have also emerged at the state level. The new law and these proposals could reduce medical procedure volumes and impact the demand for our products or the prices at which we sell our products. In addition, the excise tax will increase our costs of doing business. The impact of this law and these proposals could have a material adverse effect on our business, results of operations and/or financial condition. Public debate of these issues will likely continue in the future. Healthcare reform proposals and medical cost containment measures in the United States and in many foreign countries could:
| • | limit the use of our products and treatments; |
| • | reduce reimbursement available for such use; |
| • | further tax the sale or use of our products; or |
| • | adversely affect the use of new therapies for which our products may be targeted. |
These reforms, cost containment measures and new taxes, including the uncertainty in the medical community regarding their nature and effect, could have an adverse effect on our customers’ purchasing decisions regarding our products and treatments and could harm our business, results of operations, financial condition and prospects.
Changes in laws affecting the healthcare industry could adversely affect our revenues and profitability.
We operate in a highly regulated industry. As a result, governmental actions may adversely affect our business, operations or financial condition, including:
| • | new laws, regulations or judicial decisions, or new interpretations of existing laws, regulations or decisions, related to health care availability, method of delivery and payment for health care products and services; |
| • | changes in the FDA and foreign regulatory approval processes that may delay or prevent the approval of new products and treatments and result in lost market opportunity; |
| • | changes in FDA and foreign regulations that may require additional safety monitoring, labeling changes, restrictions on product distribution or use, or other measures after the introduction of our products and treatments to market, which could increase our costs of doing business, adversely affect the future permitted uses of approved products or treatments, or otherwise adversely affect the market for our products and treatments; and |
| • | new laws, regulations and judicial decisions affecting pricing or marketing practices. |
23
Table of Contents
We anticipate that the government will continue to scrutinize our industry closely and that additional regulation by governmental authorities may increase compliance costs, exposure to litigation and other adverse effects to our operations.
We, our contract manufacturers and our subcontractors may not meet regulatory quality standards applicable to our manufacturing processes, which could have an adverse effect on our business.
As a medical device manufacturer, we are required to register with the FDA and are subject to periodic inspection by the FDA for compliance with the FDA’s QSR requirements, which require manufacturers of medical devices to adhere to certain good manufacturing practice regulations, including testing, quality control and documentation procedures. In addition, the federal Medical Device Reporting regulations require us to provide information to the FDA whenever there is evidence that reasonably suggests that a device may have caused or contributed to a death or serious injury or, if a malfunction were to occur, could cause or contribute to a death or serious injury. Compliance with applicable regulatory requirements is subject to continual review and is rigorously monitored through periodic inspections by the FDA. Our contract manufacturers, component suppliers and other subcontractors are also required to meet certain standards applicable to their manufacturing processes.
We have two third-party subcontractor manufacturers in Mexico for the Essure system. In April 2004, we received FDA approval to begin manufacturing the Essure product at Accellent, Inc., or Accellent, formerly named Venusa. In September 2009, we received FDA approval to begin manufacturing the Essure system at FlexMed, formerly named Avail Medical, as a second subcontractor manufacturing site in Mexico. During the last quarter of 2010, we experienced manufacturing disruptions at the FlexMed manufacturing site, and our other subcontractor manufacturer increased production of the Essure product to maintain our production requirements.
We cannot assure you that we, our contract manufacturers, component suppliers or other subcontractors will be able to maintain compliance with all regulatory requirements. The failure by us or our contract manufacturers, component suppliers or other subcontractors to achieve or maintain compliance with these requirements or quality standards may disrupt our ability to supply products sufficient to meet demand until compliance is achieved or, in the case of our contract manufacturers, component supplier or subcontractor, until a new manufacturer, supplier or subcontractor has been identified and evaluated. In addition, our failure to comply with applicable regulations could result in sanctions being imposed on us, including fines, injunctions, civil penalties, failure of regulatory authorities to grant marketing approval of our products, delays, suspension or withdrawal of approvals, license revocation, seizures or recalls of products, operating restrictions and criminal prosecutions, any of which could harm our business. Furthermore, we cannot assure you that if we find it necessary to engage new manufacturers, suppliers or subcontractors to satisfy our business requirements that we will be able to locate new manufacturers, suppliers or contractors who are in compliance with regulatory requirements. Our failure to do so could have a material adverse effect on our business.
We utilize distributors for a portion of our sales, the loss of which could harm our revenues in the territory serviced by these distributors.
We have strategic relationships with a number of key distributors for sales and service of our products, principally in foreign countries. If these strategic relationships are terminated and not replaced, our revenues and/or ability to service our products in the territories serviced by these distributors could be adversely affected.
Government or third party reimbursement for the Essure procedure may not be available or may be inadequate, which could adversely affect consumer demand, limit our future product revenues and adversely affect our profitability.
Market acceptance of the Essure system in the United States and in international markets will depend in part upon the availability of reimbursement within prevailing healthcare payment systems. Reimbursement systems in international markets vary significantly by country and sometimes by region, and reimbursement approvals must
24
Table of Contents
be obtained on a country-by-country basis. Many international markets have government managed healthcare systems that determine reimbursement for new devices and procedures. In most markets, there are private insurance systems as well as government managed systems. Regardless of the type of reimbursement system, we believe that physician advocacy of our product will be required to obtain reimbursement.
Availability and extent of continued reimbursement will depend, at least in part, on the clinical and cost effectiveness of our product. We cannot ensure that reimbursement for our product will continue to be available in the United States or in international markets under either government or private reimbursement systems, or that those physicians will support and advocate reimbursement for use of our product for all indications intended by us. We may be unable to obtain or maintain reimbursement in any country within a particular time frame, for a particular amount or at all, which would limit our future product revenues and delay or prevent our profitability.
The Ministry of Health in France is implementing cost-cutting measures that may affect reimbursement for procedures and medical devices. Effective October 1, 2010, the French Ministry of Health limited physician reimbursement of hysteroscopic occlusion procedure for women under the age of 40, which could have an impact on our business in France. We expect further cost-cutting measures by the Ministry of Health to affect reimbursements for medical devices. We are working to overturn this change, but are unable to predict whether our efforts will be successful. If we are unsuccessful, our results of operations could be adversely affected.
Currency exchange rate fluctuations will impact our financial performance.
Although a majority of our revenue and operating expenses is denominated in U.S. dollars, and we prepare our financial statements in U.S. dollars in accordance with U.S. Generally Accepted Accounting Principles (“GAAP’), a portion of our revenue and operating expenses is in foreign currencies. As a result, we are subject to currency risks that could adversely affect our operations, including:
| • | risks resulting from changes in currency exchange rates and the implementation of exchange controls; and |
| • | limitations on our ability to reinvest earnings from operations in one country to fund the capital needs of our operations in other countries. |
Changes in exchange rates will result in increases or decreases in our costs and earnings, and may also affect the book value of our assets located outside the United States and the amount of our equity. Although we have taken steps to minimize our currency exposure by engaging in hedging transactions where we deem it appropriate, we do not know whether our efforts will be successful.
Our international operations expose us to additional operational challenges that we might not otherwise face.
We are subject to a number of additional risks and expenses due to our international operations. Any of these risks or expenses could have a material adverse effect on our operating results. These risks and expenses include:
| • | difficulties in staffing and managing operations in multiple locations as a result of, among other things, distance, language and cultural differences; |
| • | shipping delays; |
| • | protectionist laws and business practices that favor local companies; |
| • | difficulties in enforcing agreements with and collecting receivables from customers outside the United States; |
| • | difficulties and expenses related to implementing internal controls over financial reporting and disclosure controls and procedures; |
25
Table of Contents
| • | expenses associated with customizing products for clients in foreign countries; |
| • | possible adverse tax consequences; |
| • | the inability to obtain favorable third-party reimbursements; |
| • | the inability to obtain required regulatory approvals; |
| • | governmental currency controls; |
| • | changes in foreign regulatory laws governing sales of medical devices; |
| • | failure of local laws to provide the same degree of protection against infringement of our intellectual property; |
| • | clone or “knock off” products; |
| • | political and economic changes and disruptions; |
| • | contractual provisions governed by foreign laws and various trade restrictions, including U.S. prohibitions and restrictions on exports of certain products and technologies to certain nations; and |
| • | build up of excess inventory at foreign distributor locations. |
We may be subject, directly or indirectly, to federal and state healthcare fraud and abuse laws and regulations and, if we are unable to fully comply with such laws, could face substantial penalties.
Our operations may be directly or indirectly affected by various broad state and federal healthcare fraud and abuse laws. Such laws include the federal Anti-Kickback Statute and related state anti-kickback laws, which prohibit any person from knowingly and willfully offering, paying, soliciting or receiving remuneration, directly or indirectly, to induce or reward either the referral of an individual, or the furnishing, purchasing, leasing or ordering of, or arranging for or recommending the furnishing, purchasing, leasing or ordering of an item or service, for which payment may be made under federal healthcare programs, such as Medicaid programs. The federal Stark law and self-referral prohibitions under analogous state laws restrict referrals by physicians and, in some instances, other healthcare providers, practitioners and professionals, to entities with which they have indirect or direct financial relationships for furnishing of designated health services. These healthcare fraud and abuse laws are subject to evolving interpretations by various state and federal enforcement and regulatory authorities. Under current interpretations of the federal false claims act and certain similar state laws, some of these laws may also be subject to enforcement in a qui tam lawsuit brought by a private party “whistleblower,” with or without the intervention of the government.
If our past or present operations are found to be in violation of these laws and not protected under a statutory exception or regulatory safe harbor provision to the applicable fraud and abuse laws, we, our officers or our employees may be subject to civil or criminal penalties, including large monetary penalties, damages, fines, imprisonment and exclusion from federal healthcare program participation, including the exclusion of our products from use in treatment of Medicaid or other federal healthcare program patients. If federal or state investigations or enforcement actions were to occur, our business and financial condition would be harmed.
We may be exposed to product liability claims, and we have limited insurance coverage.
The manufacture and sale of medical products involve an inherent risk of exposure to product liability claims and product recalls. We currently maintain product liability insurance with coverage limits of $10.0 million per occurrence and an annual aggregate maximum of $10.0 million, which we believe is comparable to that maintained by other companies of similar size serving similar markets. However, we cannot assure you that product liability claims in connection with clinical trials or commercial sales of the Essure system will not exceed such insurance coverage limits or that such insurance will continue to be available on commercially reasonable terms, or at all. Insurance is expensive and in the future may not be available on acceptable terms, if at all. A successful product liability claim or series of claims brought against us in excess of our insurance coverage, or a recall of our product, could cause our stock price to fall.
26
Table of Contents
We may not be able to attract and retain additional key management, sales and marketing and technical personnel, or we may lose existing key management, sales and marketing or technical personnel, which may delay our development and marketing efforts.
We depend on a number of key management, sales and marketing and technical personnel. The loss of the services of one or more key employees could delay the achievement of our development and marketing objectives. Our success will also depend on our ability to attract and retain additional highly qualified management, sales and marketing and technical personnel to meet our growth goals. We face intense competition for qualified personnel, many of whom are often subject to competing employment offers, and we do not know whether we will be able to attract and retain such personnel.
Our 2.25% convertible senior notes present certain liquidity and other risks.
In February 2007, we issued an aggregate principal amount of $86,250,000 of our 2.25% convertible senior notes due 2027. The net share settlement feature of the notes may reduce our liquidity. If the notes are convertible, then upon conversion, holders will receive cash and, if applicable, shares of our common stock based on an initial conversion rate, subject to adjustment, of 35.8616 shares per $1,000 principal amount of notes (which represents an initial conversion price of $27.89 per share), in certain circumstances. We must settle at least a portion of our conversion obligation in cash; however we may not have sufficient funds to pay in full the cash obligation upon such conversion. The convertible senior notes are classified as current liabilities at December 31, 2010 as the notes are convertible at the option of the holder from the period beginning December 15, 2011 and ending February 15, 2012.
On each of February 15, 2012, February 15, 2017 and February 15, 2022, holders of the notes may require us to purchase, for cash, all or a portion of their notes at 100% of their principal amount, plus any accrued and unpaid interest to, but excluding, that date. If a fundamental change occurs (as defined in the indenture governing the notes), holders of the notes may require us to repurchase, for cash, all or a portion of their notes. In addition, upon conversion of the notes, we must pay the principal return in cash. We may not have sufficient funds to pay the interest, purchase price, repurchase price or principal return when due. In addition, the terms of any borrowing agreements which we may enter into from time to time may require early repayment of borrowings under circumstances similar to those constituting a fundamental change. These agreements may also make our repurchase of notes, or the cash payment due upon conversion of the notes, an event of default under the agreements. If we fail to pay interest on the notes, to repurchase the notes or to pay the cash payment due upon conversion when required, we will be in default under the indenture for the notes. The indenture for the notes will not restrict our ability to incur in additional indebtedness. Our level of indebtedness could have important consequences on our future operations, including:
| • | making it more difficult for us to meet our payment and other obligations under the notes and our other outstanding debt; |
| • | resulting in an event of default if we fail to comply with the financial and other restrictive covenants contained in any debt agreements that we may have, which could result in all of our debt becoming immediately due and payable; |
| • | reducing the availability of our cash flow to fund working capital, capital expenditures, acquisitions and other general corporate purposes, and limiting our ability to obtain additional financing for these purposes; |
| • | limiting our flexibility in planning for, or reacting to, and increasing our vulnerability to, changes in our business, the industry in which we operate and the general economy; and |
| • | placing us at a competitive disadvantage compared to our competitors that have less debt or are less leveraged. |
27
Table of Contents
Provisions in our charter documents, Delaware law and the indenture for our 2.25% convertible senior notes due 2027 could discourage an acquisition of us by a third party, even if the acquisition would be favorable to shareholders.
Protections against unsolicited takeovers in our rights plan, charter and bylaws may reduce or eliminate our stockholders’ ability to resell their shares at a premium over market price. We have a stockholders rights plan which expires on February 27, 2012. Our rights plan may prevent an unsolicited change of control of our company. Our rights plan may adversely affect the market price of our common stock or the ability of stockholders to participate in a transaction in which they might otherwise receive a premium for their shares. In addition, the issuance of preferred stock or common stock upon exercise of rights issued under the plan could dilute the voting, liquidation and other economic rights of our stockholders and make it more difficult for a third party to acquire us.
Our charter and bylaws contain provisions relating to issuance of preferred stock, special meetings of stockholders and advance notification procedures for stockholder proposals that could have the effect of discouraging, delaying or preventing an unsolicited change in the control of our company. Our charter provides for our board of directors to be divided into three classes of directors, serving staggered three-year terms. The classified board provision could have the effect of discouraging a third party from making a tender offer or attempting to obtain control of us.
In addition, we are subject to Section 203 of the Delaware General Corporation Law, which prohibits a Delaware corporation from engaging in any business combination with any interested stockholder for a period of three years after the date that such stockholder became an interested stockholder, unless certain conditions are met. Section 203 may discourage, delay or prevent an acquisition of our company even at a price our stockholders may find attractive.
If a “fundamental change” (as defined in the indenture governing the 2.25% convertible senior notes due 2007), occurs, holders of the notes will have the right, at their option, to require us to repurchase all or a portion of their notes. In the event of a “make-whole fundamental change (as defined in the indenture governing the notes),” we also may be required to increase the conversion rate applicable to the notes surrendered for conversion in connection with that make-whole fundamental change. In addition, the indenture for the notes prohibits us from engaging in certain mergers or acquisitions unless, among other things, the surviving entity assumes our obligations under the notes. These and other provisions, including the provisions of our charter documents and Delaware law, could prevent or deter a third party from acquiring us even where the acquisition could be beneficial to our security holders.
Our effective tax rate may fluctuate and we may incur obligations in tax jurisdictions in excess of amounts that have been accrued.
We are subject to income taxes in both the United States and various foreign jurisdictions. We take certain income tax positions on our tax returns for which we reserve additional taxes if it is more likely than not, they will not withstand challenge by tax authorities. We are subject to the potential for tax audits in various jurisdictions, including the United States, and tax authorities may disagree with certain positions we have taken and assess additional taxes. We regularly evaluate the likely outcomes of these audits in order to determine the appropriateness of our tax provision and tax reserves. However, there can be no assurance that we will accurately predict the outcomes of these audits, and the actual outcomes could have a material impact on our net income and financial condition. In addition, our effective tax rate may be lower or higher than experienced in the past due to numerous factors, including a change in the mix of our profitability from country to country and changes in tax laws. Any of these factors could cause us to experience an effective tax rate significantly different from previous periods or our current expectations, which could have an adverse effect on our business and results of operations.
28
Table of Contents
Changes in accounting standards issued by the Financial Accounting Standards Board (“FASB”) or other standard-setting bodies may adversely affect our financial statements.
Our financial statements are subject to the application of GAAP in the United States, which are periodically revised and/or expanded. Accordingly, from time to time we are required to adopt new or revised accounting standards issued by recognized authoritative bodies, including the FASB. It is possible that future accounting standards we are required to adopt could change the current accounting treatment that we apply to our consolidated financial statements and that such changes could have a material adverse effect on our results of operations and financial condition.
A change in accounting standards or practices or a change in existing taxation rules or practices can have a significant effect on our reported results and may even affect our reporting of transactions completed before the change is effective. New accounting pronouncements and taxation rules and varying interpretations of accounting pronouncements and taxation practice have occurred and may occur in the future. Changes to existing rules or the questioning of current practices may adversely affect our reported financial results or the way we conduct our business.
In particular, changes in tax laws or tax rulings could materially impact our effective tax rate. There are several proposals to reform U.S. tax rules being considered by U.S. law makers, including proposals that may reduce or eliminate the deferral of U.S. income tax on our unrepatriated earnings, potentially requiring those earnings to be taxed at the U.S. federal income tax rate, reduce or eliminate our ability to claim foreign tax credits, and eliminate various tax deductions until foreign earnings are repatriated to the U.S. Our future reported financial results may be adversely affected by tax rule changes which restrict or eliminate our ability to claim foreign tax credits or deduct expenses attributable to foreign earnings, or otherwise affect the treatment of our unrepatriated earnings.
The FASB and International Accounting Standards Board (“IASB”) have announced their commitment to achieving a single set of high-quality global accounting standards, and the SEC continues to encourage the convergence of U.S. GAAP and International Financial Reporting Standards (“IFRS”) in order to narrow the differences between the two sets of standards. In 2010, the SEC announced a Work Plan, the results of which will aid the Commission in its evaluation of the impact that the use of IFRS by U.S. companies would have on the U.S. securities market. Included in this Work Plan is consideration of IFRS, as it exists today and after the completion of various convergence projects currently underway between U.S. and international accounting standards-setters. In October 2010, the SEC issued its first progress report on the Work Plan, summarizing the objectives as well as the efforts and preliminary observations as of that time. In addition to considering the information obtained through execution of the Work Plan, the SEC will assess the progress on the FASB’s and IASB’s current convergence projects before deciding in 2011 on whether to incorporate IFRS into the U.S. financial reporting system, and if so, when and how. If the SEC determines in 2011 to incorporate IFRS into the U.S. financial reporting system, the first time that U.S. companies would report under such a system would be no earlier than 2015. The adoption of IFRS and/or the effects of accounting standards convergence could significantly alter the presentation of our financial position and results of operations in our financial statements.
| ITEM 1B. | UNRESOLVED STAFF COMMENTS. |
Not applicable.
| ITEM 2. | PROPERTIES |
We are headquartered in Mountain View, California, where we lease a building occupying approximately 58,242 square feet of office, research and development and manufacturing space. This lease commenced in July 2009 and will terminate in July 2013.
With the acquisition of SAS in January 2008, we assumed a lease of 1,938 square foot sales office located in Versailles, France. This lease expires in March 2011. During 2010 we subleased this property to a third party on
29
Table of Contents
a month to month basis. In February 2009, we entered into a new lease agreement for a 4,703 square foot office space in Versailles, France for SAS, and moved into this new building. The lease for the new building at SAS will expire in February 2018.
| ITEM 3. | LEGAL PROCEEDINGS |
On May 22, 2009, we filed a lawsuit in the United States District Court, Northern District of California against Hologic seeking declaratory judgment by the Court that Hologic’s planned importation, use, sale or offer to sell of its forthcoming Adiana Permanent Contraception system will infringe several U.S. patents owned by us including U.S. Patent Nos. 6,634,361, 6,709,667, 7,237,552, 7,428,904 and 7,506,650, and an injunction prohibiting Hologic from importing, using, selling or offering to sell its Adiana system in the United States. Upon FDA approval of the Adiana Permanent Contraception system, we filed an Amended Complaint in July 2009 seeking a judgment that Hologic’s importation, use, sale and/or offer to sell the system infringes the same patents mentioned above and requested an injunction against such activity. On August 13, 2009, we filed a motion for preliminary injunction, requesting the Court to enjoin the Adiana system in the United States pending final judgment in the action. On August 25, 2009, Hologic filed its answer and asserted counterclaims against us that we were violating the Lanham Act and the California Statutory Unfair Competition Law. On October 14, 2009, we answered with our own counterclaims asserting that Hologic was violating the Lanham Act and the California Statutory Unfair Competition Law through its selling practices. A hearing was held on that motion on November 4, 2009 and an order denying the motion was issued on November 6, 2009, upon stipulation of the parties. On January 19, 2010, all claims relating to three of the five asserted patents were dismissed with prejudice. A claim construction hearing was held on March 10, 2010. The Claim Construction Order was issued on March 24, 2010 with all but one of five terms favorably construed to us. On April 21, 2010, the Court issued an order denying our Motion to Compel and granted our Motion to Amend our Complaint to assert counterclaims against Hologic that Hologic had engaged in unfair competition against us and had violated the Lanham Act. On August 10, 2010, the parties reached agreement to settle all the unfair competition claims of both parties with prejudice. The terms of the agreement are confidential. The parties filed cross–motions for summary judgment on October 28, 2010, which were heard on December 9, 2010. On December 16, 2010, the Court issued an order denying Hologic’s motions for summary judgment of non-infringement and invalidity of the asserted claims, granting our motion for summary judgment as to non-infringing substitutes and the hypothetical negotiation date, and denying our motion for summary judgment of infringement. A trial on the two remaining patent claims that was originally scheduled to begin February 28, 2011 was postponed until after June 30, 2011.
On August 10, 2010 Hologic filed a lawsuit in the United States District Court for the District of Massachusetts alleging that two of the twelve U.S. patents marked on our packaging, instructions for use, and marketing materials for our Essure product do not cover the Essure product. On October 12, 2010 we made a Motion to Transfer to the United States District Court, Northern District of California and a Motion to Dismiss the action. On December 13, 2010, the Court denied the Motion to Transfer without prejudice to reconsideration upon submission of additional information about likely witnesses. The Court deferred ruling on the Motion to Dismiss until the United States Department of Justice, or DOJ, files as brief on the issues we have raised.
From time to time, we are involved in legal proceedings arising in the ordinary course of business. We believe there is no litigation pending other than that described above that could have, individually or in the aggregate, a material adverse effect on our financial position, results of operations or cash flows.
| ITEM 4. | REMOVED AND RESERVED |
30
Table of Contents
| ITEM 5. | MARKET FOR THE REGISTRANT’S COMMON EQUITY, RELATED STOCKHOLDER MATTERS AND ISSUER PURCHASES OF EQUITY SECURITIES |
Our common stock has been traded on the Nasdaq Global Select Market SM under the symbol CPTS since the effective date of our initial public offering on February 1, 1996. The following table presents the high and low sale prices for our common stock as reported on the Nasdaq Global Select Market SM for the period indicated.
| High | Low | |||||||
| Year Ended December 31, 2010: |
||||||||
| Fourth Quarter |
$ | 15.78 | $ | 13.01 | ||||
| Third Quarter |
$ | 16.38 | $ | 12.25 | ||||
| Second Quarter |
$ | 20.09 | $ | 15.53 | ||||
| First Quarter |
$ | 22.44 | $ | 17.89 | ||||
| Year Ended December 31, 2009 |
||||||||
| Fourth Quarter |
$ | 20.00 | $ | 16.41 | ||||
| Third Quarter |
$ | 19.30 | $ | 15.90 | ||||
| Second Quarter |
$ | 17.25 | $ | 10.80 | ||||
| First Quarter |
$ | 16.00 | $ | 10.26 | ||||
As of March 7, 2011, there were 106 stockholders of record and the last reported sale price of our common stock was $13.71.
We have never paid cash dividends on our common stock and do not anticipate paying cash dividends in the foreseeable future. We intend to retain any future earnings for reinvestment in our business. Any future determination to pay cash dividends will be at the discretion of the board of directors and will be dependent upon our financial condition, results of operations, capital requirements and such other factors as the board of directors deems relevant.
The information under the caption “Security Ownership of Certain Beneficial Owners and Management and Related Stockholder Matters” in Part III, Item 12 of this Annual Report on Form 10-K is incorporated herein by reference.
31
Table of Contents
Performance Graph
The following graph compares the five year cumulative total stockholder return for the Company’s common stock, assuming reinvestment of all dividends, for the period from December 31, 2005 to December 31, 2010 to that of the Nasdaq Stock Market – U.S. Index and the Nasdaq Medical Equipment Index for the same period. The graph assumes that $100 was invested on December 31, 2005 in the Company’s common stock and in each of the comparative indices.
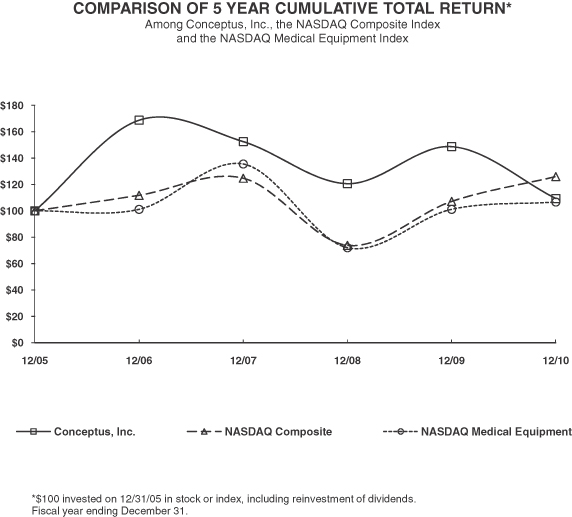
32
Table of Contents
| ITEM 6. | SELECTED CONSOLIDATED FINANCIAL DATA |
The following table presents our selected consolidated financial data. This historical data should be read in conjunction with the attached consolidated financial statements and the related notes thereto and “Management’s Discussion and Analysis of Financial Condition and Results of Operations” appearing in Item 7 of this report. The selected consolidated statement of operations data for the years ended December 31, 2010, 2009, and 2008 and the consolidated balance sheet data as of December 31, 2010 and 2009 are derived from our audited consolidated financial statements and the related notes, which are included elsewhere in this report. The selected consolidated statement of operations data for the years ended December 31, 2007 and 2006 and the consolidated balance sheet data as of December 31, 2008, 2007 and 2006 are derived from our audited consolidated financial statements and the related notes, which are not included in this report.
| Years Ended December 31, | ||||||||||||||||||||
| 2010 | 2009 | 2008 (1) | 2007 (1) | 2006 | ||||||||||||||||
| (in thousands, except per share data) | ||||||||||||||||||||
| Consolidated Statement of Operations Data: |
||||||||||||||||||||
| Net sales |
$ | 140,660 | $ | 131,407 | $ | 101,977 | $ | 64,442 | $ | 41,900 | ||||||||||
| Cost of goods sold |
26,851 | 24,048 | 21,650 | 16,682 | 14,027 | |||||||||||||||
| Gross profit |
113,809 | 107,359 | 80,327 | 47,760 | 27,873 | |||||||||||||||
| Operating expenses: |
||||||||||||||||||||
| Research and development |
6,895 | 7,080 | 6,788 | 5,875 | 4,366 | |||||||||||||||
| Selling, general and administrative |
97,365 | 85,636 | 72,685 | 56,084 | 43,318 | |||||||||||||||
| Total operating expenses |
104,260 | 92,716 | 79,473 | 61,959 | 47,684 | |||||||||||||||
| Operating profit (loss) |
9,549 | 14,643 | 854 | (14,199 | ) | (19,811 | ) | |||||||||||||
| Total interest and other income (expense), net |
(6,250 | ) | (6,340 | ) | (4,764 | ) | (583 | ) | 1,324 | |||||||||||
| Income (loss) before income tax provision |
3,299 | 8,303 | (3,910 | ) | (14,782 | ) | (18,487 | ) | ||||||||||||
| Provision (benefit) for income taxes |
(78,692 | ) | 358 | (24 | ) | — | — | |||||||||||||
| Net income (loss) |
$ | 81,991 | $ | 7,945 | $ | (3,886 | ) | $ | (14,782 | ) | $ | (18,487 | ) | |||||||
| Basic income (loss) per share: |
||||||||||||||||||||
| Net income (loss) |
$ | 2.64 | $ | 0.26 | $ | (0.13 | ) | $ | (0.50 | ) | $ | (0.64 | ) | |||||||
| Shares used in per share amounts |
31,031 | 30,572 | 30,216 | 29,463 | 28,993 | |||||||||||||||
| Diluted income (loss) per share: |
||||||||||||||||||||
| Net income (loss) |
$ | 2.59 | $ | 0.25 | $ | (0.13 | ) | $ | (0.50 | ) | $ | (0.64 | ) | |||||||
| Shares used in per share amounts |
31,682 | 31,252 | 30,216 | 29,463 | 28,993 | |||||||||||||||
| (1) | Adjusted for the retrospective adoption of ASC 470-20 Debt with Conversion and Other Options, or ASC 470-20. See Note 9 – Convertible Senior Notes in the Notes to Consolidated Financial Statements. |
| December 31, | ||||||||||||||||||||
| 2010 | 2009 | 2008 (2) | 2007 (2) | 2006 | ||||||||||||||||
| (in thousands) | ||||||||||||||||||||
| Consolidated Balance Sheet Data: |
||||||||||||||||||||
| Cash, cash equivalents |
$ | 18,383 | $ | 61,658 | $ | 54,720 | $ | 28,450 | $ | 3,238 | ||||||||||
| Short-term investments |
59,398 | 40,626 | — | 16,700 | 22,600 | |||||||||||||||
| Long-term investments |
13,104 | — | 43,177 | 48,800 | — | |||||||||||||||
| Short and long-term deferred tax assets |
78,754 | 35 | — | — | — | |||||||||||||||
| Put option |
— | 2,933 | 5,144 | — | — | |||||||||||||||
| Working capital |
16,421 | 83,539 | 36,848 | 50,484 | 26,079 | |||||||||||||||
| Total assets (3) |
250,746 | 187,139 | 163,221 | 120,036 | 39,751 | |||||||||||||||
| Notes payable (4) |
80,960 | 76,531 | 72,344 | 68,387 | — | |||||||||||||||
| Accumulated deficit |
(152,349 | ) | (234,340 | ) | (242,285 | ) | (238,399 | ) | (223,617 | ) | ||||||||||
| Total stockholders’ equity |
151,586 | 60,858 | 43,868 | 39,151 | 31,014 | |||||||||||||||
33
Table of Contents
| (2) | Adjusted for the retrospective adoption of ASC 470-20. See Note 9 – Convertible Senior Notes in the Notes to Consolidated Financial Statements. |
| (3) | Includes restricted cash of $367 thousand at December 31, 2010, $360 thousand at December 31, 2009 and $351 thousand at December 31, 2008. |
| (4) | The convertible senior notes are classified as current liabilities at December 31, 2010 as the notes are convertible at the option of the holder during the period beginning December 15, 2011 and ending February 15, 2012. |
34
Table of Contents
| ITEM 7. | MANAGEMENT’S DISCUSSION AND ANALYSIS OF FINANCIAL CONDITION AND RESULTS OF OPERATIONS |
The following discussion of our financial condition and results of operations should be read in conjunction with our consolidated financial statements and related notes thereto located elsewhere in this report.
Overview
We are a leader in the design, development, marketing and promotion of innovative solutions in women’s healthcare. Our flagship product is the proprietary Essure® permanent birth control system, which is the most effective non-surgical permanent birth control system available. The Essure system delivers a soft and flexible insert into a woman’s fallopian tubes, causing a benign tissue in-growth which blocks the fallopian tubes. Successfully placed Essure micro-inserts and the subsequent tissue growth around and through the micro-inserts prohibits the egg from traveling through the fallopian tube, preventing conception. The effectiveness rate of the Essure procedure determined in our clinical study is 99.8% after four years of follow-up. We obtained approval to market Essure in the European Union in February 2001 and obtained the U.S. Food and Drug Administration, or FDA, approval for Essure in November 2002. Nearly 500,000 women worldwide have undergone the Essure procedure and we sold the Essure system in 31 countries in 2010.
We sell Essure directly in France through our wholly owned subsidiary, Conceptus SAS (“SAS”), as well as indirectly through a network of distributors throughout the rest of Europe. Our wholly owned subsidiary in the United Kingdom, Conceptus Medical Limited (“CML”), serves as our direct sales office in the United Kingdom.
In 2009 we received a positive review from the National Institute for Health and Clinical Excellence in the United Kingdom and an approval for the Essure procedure from the Brazilian National Health Service.
During the first quarter of 2011 we began to promote GYNECARE THERMACHOICE® Uterine Balloon Therapy System in U.S. OB/GYN physician offices. GYNECARE THERMACHOICE is a global endometrial ablation product that is used to treat excessive uterine bleeding (menorrhagia). The product is manufactured for and marketed by ETHICON™ Women’s Health & Urology, a division of Ethicon, Inc.
Net sales information based on segments and geographic regions is provided in Note 2 – Summary of Significant Accounting Policies in the Notes to Consolidated Financial Statements.
Critical Accounting Estimates and Policies
We follow accounting principles generally accepted in the United States of America, or GAAP, in preparing our financial statements. As part of this work, we must make many estimates and judgments about future events. These affect the value of the assets and liabilities, contingent assets and liabilities and revenues and expenses reported in our financial statements. We believe these estimates and judgments are reasonable and we make them in accordance with policies based on information available at the time. However, actual results could differ from our estimates and could require us to record adjustments to expenses or revenues material to our financial position and results of operations in future periods. We believe our most critical accounting policies, estimates and judgments include the following:
| • | Revenue Recognition; |
| • | Stock-Based Compensation; |
| • | Allowance for Doubtful Accounts; |
| • | Income Taxes; |
| • | Cash, Cash Equivalents, and Investments; |
| • | Warranty; |
35
Table of Contents
| • | Impairment of Long-Lived Assets; |
| • | Goodwill and Other Intangible Assets; |
| • | Debt; and |
| • | Contingent Liabilities. |
Revenue Recognition
Our revenue is primarily comprised of the sale of our Essure system. We recognize revenue in accordance with Accounting Standards Codification (“ASC”) ASC 605 Revenue Recognition. Under this standard, the following four criteria must be met in order to recognize revenue:
| • | Persuasive evidence of an arrangement exists; |
| • | Delivery has occurred; |
| • | Our selling price is fixed or determinable; and |
| • | Collectability is reasonably assured. |
The four revenue recognition criteria are applied to our sales as described in the following paragraphs.
We recognize revenues from our Essure system when title to the product and the risk of loss transfers to an external customer. We do not accept returns of the Essure system. We obtain written authorizations from our customers for a specified amount of product at a specified price and the price is not dependent on actual Essure procedures performed.
For sales through distributors we recognize revenues from our Essure system when title to the product and the risk of loss transfers to the distributor. Our distributors are responsible for all marketing, sales, training and warranty for the Essure system in their respective territories. Our standard terms and conditions do not provide price protection or stock rotation rights to any of our distributors. In addition, our distributor agreements do not allow the distributor to return or exchange the Essure system and the distributor is obligated to pay us for the sale regardless of their ability to resell the product.
Additionally, we require physicians to be preceptored between 3 and 5 cases by a certified trainer before being able to perform the procedure independently. There are no revenues associated with the training activities. We do not charge a fee for the activity and no commitment arises for the physician from the preceptorship. Physician training is provided upfront and we have no obligation subsequent to the initial training. Training obligations have not been significant from inception to-date.
We assess the credit worthiness of all customers in connection with their purchases. We only recognize revenue when collectability is reasonably assured.
Certain sales of our Essure system may include delivery of additional items. These obligations may be fulfilled after shipment of the Essure system, and in these cases, we recognize revenue in accordance with the multiple element accounting guidance set forth in ASC 605-25 Revenue – Multiple- Element Arrangements. When we have objective and reliable evidence of fair value of the undelivered elements we defer revenue attributable to the post-shipment obligations and recognize such revenue when the obligation is fulfilled. Otherwise we defer all revenue until all elements are delivered.
Stock-Based Compensation
Effective January 1, 2006, we adopted the provisions of ASC 718 Compensation – Stock Compensation (“ASC 718”), using the modified prospective transition method. Accordingly, stock-based compensation cost is measured on the grant date, based on the fair value of the award which is computed using the Black-Scholes
36
Table of Contents
option valuation model, and is recognized as expense over the employee requisite service period. We previously applied Accounting Principles Board, or APB, Opinion No. 25, Accounting for Stock Issued to Employees, and related Interpretations and provided the required pro forma disclosures of SFAS No. 123, Accounting for Stock-Based Compensation.
The fair value of each option award is estimated on the date of grant using the Black-Scholes option valuation model with the weighted average assumptions shown in Note 2 – Summary of Significant Accounting Policies in the Notes to Consolidated Financial Statements. The Black-Scholes option valuation model requires the input of highly subjective assumptions, including the expected life of the stock-based award and the stock-price volatility. The assumptions used in calculating the fair value of share-based compensation represent management’s best estimates, but these estimates involve inherent uncertainties and the application of management’s judgment. As a result, if other assumptions had been used, our stock-based compensation expense could have been materially different. In addition, we are required to estimate the expected forfeiture rate and only recognize expense for those shares expected to vest. If our actual forfeiture rate is materially different from our estimate, the share-based compensation expense could be materially different.
The expected term of the options granted is derived from historical data on employee exercise and post-vesting employment termination behavior. The risk-free interest rate for periods equal to the estimated life of the option is based on the U.S. Treasury yield curve in effect at the time of grant. Expected volatility is based on historical volatility of our stock.
Allowance for Doubtful Accounts
We assess the credit worthiness of our customers on an ongoing basis in order to mitigate the risk of loss from customers not paying us. However, we account for the possibility that certain customers may not pay us by maintaining an allowance for doubtful accounts. We perform ongoing credit evaluations of our customers and adjust credit limits based upon payment history and the customer’s current credit worthiness, as determined by our review of their current credit information. We monitor collections and payments from our customers and maintain our allowance for doubtful accounts based upon our historical experience and any specific customer collection issues that we have identified. Our exposure to credit losses may change as we increase our receivables. Changes in customer type and mix, as well as domestic and international economic climate, will also impact potential credit losses. Despite the significant amount of analysis used to compute the required allowance, if the financial condition of our customers were to deteriorate, resulting in an impairment of our ability to make payments, additional allowances may be required. In addition, our increase in sales may result in a higher accounts receivable balance, which may require a higher balance in the allowance. As of December 31, 2010 and 2009, our allowance for doubtful accounts totaled approximately $0.8 million and $0.6 million, respectively.
Income Taxes
In preparing our consolidated financial statements we are required to estimate our income taxes in each of the jurisdictions in which we operate. This process involves us estimating our actual current tax exposure together with assessing temporary differences resulting from differing treatment of items for tax and accounting purposes. These differences result in deferred tax assets and liabilities, which are included within our consolidated balance sheet. We must then assess the likelihood that our deferred tax assets will be recovered from future taxable income and to the extent we believe that recovery is not likely, we must establish a valuation allowance. To the extent we establish a valuation allowance or increase this allowance in a period, we must include an expense within the tax provision in the statement of operations.
As of December 31, 2010, we had total net deferred tax assets of $77.7 million consisting primarily of favorable temporary differences and net operating loss carryforwards. In the fourth quarter of 2010, we released our valuation allowance associated with our U.S. Federal deferred tax assets and a portion of our state deferred tax assets which resulted in an income tax benefit of $80.7 million in our results of operations for this period.
37
Table of Contents
We believe that our US operations had achieved a sufficient level of profitability and will sustain a sufficient level of profitability in 2011 and beyond to support the release of the valuation allowance based on current facts and circumstances. However, if our assumptions on the future performance for our U.S. operations prove to be incorrect and we are not able to sustain a sufficient level of profitability to support the associated deferred tax assets on our balance sheet, we will have to impair our deferred tax assets through an additional valuation allowance, which would impact our financial position and results of operations in the period such a determination is made.
Our remaining valuation allowance as of December 31, 2010 relates to California net operating loss carryforwards that are projected to expire prior to utilization. If we release our remaining valuation allowance, it will have an impact to our financial position and results of operations in the periods such determination is made. We will continue to assess the need for our valuation allowances in the future.
Cash, Cash Equivalents, and Investments
We consider all highly liquid investments with maturity from date of purchase of three months or less to be cash equivalents. We maintain deposits with four financial institutions and invest our excess cash primarily in money market funds, commercial paper, corporate notes, time deposits, U.S. treasury bills, U.S. government bonds and corporate bonds which bear minimal risk. Our cash and cash equivalents in our operating and investment accounts are with third party financial institutions. At times, these balances exceed the Federal Deposit Insurance Corporation insurance limits. While we monitor the cash balances in our operating and investment accounts and adjust the cash balances as appropriate, these cash balances could be impacted if the underlying financial institutions fail or are subject to other adverse conditions in the financial markets. To date we have experienced no loss or lack of access to cash in our operating and investment accounts.
During 2010, our investments included Auction Rate Securities (“ARS”) which were short-term debt instruments backed by student loans, a substantial portion of which were guaranteed by the United States government. Prior to 2008, our ARS were highly liquid, using a Dutch auction process that resets the applicable interest rate at predetermined intervals, typically every 20-30 days, to provide liquidity at par. We had experienced failed auctions since 2008 on most of our ARS. The failures of these auctions did not affect the value of the collateral underlying the ARS, and we continued to earn and receive interest on our ARS at a pre-determined formula with spreads tied to particular interest rate indexes.
In November 2008, we accepted an offer from UBS AG, providing us with rights related to our ARS (the “Rights”). The Rights permitted us to require UBS to purchase our ARS at par value, which is defined as the price equal to the liquidation preference of the ARS plus accrued but unpaid dividends or interest, at any time during the period of July 2010 through July 2012. Conversely, UBS had the right, in its discretion, to purchase or sell our ARS at any time until July 2012, so long as we received payment at par value upon any sale or disposition. So long as we held our ARS, they continued to accrue interest as determined by the auction process or the terms of the ARS if the auction process failed.
Prior to accepting the UBS offer, we recorded our ARS as available-for-sale investments. We recorded unrealized gains and losses on our available-for-sale securities in accumulated other comprehensive income (loss) in the stockholders’ equity section of our balance sheets. Such unrealized gains and losses did not change net income (loss) for the applicable accounting period. In connection with obtaining the put option, we transferred our ARS from available-for-sale to trading securities in accordance with ASC 320 Investments – Debt and Equity Securities. The transfer to trading securities reflected our intent to exercise our put option during the third quarter of 2010. Prior to our agreement with UBS, our intent was to hold our ARS until we realized the par value.
In July 2010, we exercised our put option to require UBS to repurchase our outstanding ARS at full par value. Accordingly, we had redemptions of our ARS in 2010 of $43.6 million. In addition, we recorded a gain in 2010 of $2.9 million, which represented the increase in the fair value of the ARS. As of December 31, 2010, we no longer hold these types of investments.
38
Table of Contents
We have accounted for the Rights as a freestanding financial instrument and elected to record the value of the Rights under the fair value option of ASC 825 Financial Instruments. As a result of our election to record the Rights at fair value, unrealized gains and losses have been included in earnings. We estimated the fair value of the Rights using the expected value that we would receive from UBS which was calculated as the difference between the anticipated recognized loss and par value of the ARS as of the option exercise date. This value was discounted by using a UBS credit default rate to account for the consideration of UBS credit risk. In 2010, we recorded an additional loss of $2.9 million, which represents the decrease in the fair value of the put option. Due to the exercise of the put option in July 2010 and the resulting redemption of the ARS the balance of Rights as of December 31, 2010 is zero.
As of December 31, 2010 we had short and long-term investments of $72.5 million recorded at fair value. Our investments consist of time deposits, U.S. treasury bills, U.S. government bonds, commercial paper and corporate bonds. We will sell certain or all investments as needed to meet the cash flow needs of our business. Hence our investments are classified as available-for-sale securities in accordance with ASC 320 Investments – Debt and Equity Securities. Investments are classified as short-term or long-term based on the underlying investments maturity date. See Note 3 – Investments in the Notes to Consolidated Financial Statements.
Warranty
We provide for the estimated cost of our product warranties at the time revenue is recognized. We record a liability for the estimated future costs associated with warranty claims, which is based upon historical experiences and our estimate of the level of future costs. Warranty costs are reflected in the statement of operations as a cost of goods sold. We expect that warranty expense will increase as and if we increase our net sales. Warranty reserve rates may change if we change the manufacturing process or change our third-party manufacturing contractors. Should actual costs differ from historical experience, increases in warranty expense may be required. Warranty reserves as of December 31, 2010 and 2009 were approximately $0.3 million.
Impairment of Long-Lived Assets
We account for the impairment of long-lived assets in accordance with ASC 360 Property, Plant and Equipment. We evaluate the carrying value of our long-lived assets, consisting primarily of our property and equipment, the patents acquired in connection with our purchase of the intellectual property assets of Ovion Inc. in 2009, and intangible assets acquired in connection with our acquisition of SAS in 2008, whenever certain events or changes in circumstances indicate that the carrying amount of the assets may not be recoverable. (See Note 5 – Goodwill and Intangible Assets in the Notes to Consolidated Financial Statements.) Such events or circumstances include a prolonged industry downturn, a significant decline in our market value or significant reductions in projected future cash flows.
Significant judgments and assumptions are required in the forecast of future operating results used in the preparation of the estimated future cash flows, including profit margins, long-term forecasts of the amounts and timing of overall market growth and our percentage of that market, groupings of assets, discount rates and terminal growth rates. In addition, significant estimates and assumptions are required in the determination of the fair value of our tangible long-lived assets, including replacement cost, economic obsolescence, and the value that could be realized in orderly liquidation. Changes in these estimates could have a material adverse effect on the assessment of our long-lived assets, thereby requiring us to write down the assets. Our net long-lived assets as of December 31, 2010 and 2009 included property and equipment of $10.1 million and $9.8 million, respectively, and other identifiable intangible assets of $24.1 million and $27.7million, respectively.
Goodwill and Other Intangible Assets
Goodwill represents the excess of the purchase price paid over the fair value of tangible and identifiable intangible net assets acquired in business combinations. We have recorded goodwill in connection with our acquisition of SAS in 2008. Under ASC 350 Intangibles – Goodwill and Other, goodwill and other intangible
39
Table of Contents
assets with indefinite lives are not amortized, but are assigned to reporting units and tested for impairment annually, or whenever there is an impairment indicator. We assess goodwill impairment indicators quarterly, or more frequently, if a change in circumstances or the occurrence of events suggests the remaining value may not be recoverable. Intangible assets that are not deemed to have an indefinite life are amortized over their estimated useful lives.
The first step of the impairment test for goodwill compares the fair value of a reporting unit with its book value, including goodwill and other indefinite lived intangible assets. If the fair value is less than the book value, the second step determines the amount of the impairment by comparing the implied fair value of the goodwill with the book value of that goodwill. An impairment charge is recognized only when the calculated fair value of a reporting unit, including goodwill and indefinite lived intangible assets, is less than its book value.
We have one segment as operating results are reviewed by our Chief Operating Decision Maker, who is our Chief Executive Officer. He allocates resources and assesses performance at the consolidated level. In addition, we do not provide discrete financial information for the SAS business in regards to overall financial performance review. We have recorded the goodwill on the books of SAS as part of purchase accounting. We evaluated the impairment of goodwill at the SAS entity level and concluded that no impairment exists.
Other intangible assets include patents, customer relationships, license agreements and non-compete agreements. The patents include the patents acquired in connection with our purchase of the intellectual property assets of Ovion Inc. They are amortized using the straight-line method over their respective estimated useful lives. (See Note 5 – Goodwill and Intangible Assets in the Notes to Consolidated Financial Statements).
Debt
We account for our convertible senior notes in accordance with ASC 815 Derivative and Hedging (“ASC 815”). In this regard, our convertible debt and net share settlement feature does not fall under the category of a derivative, and consequently, we classify our long term debt as a liability in our consolidated balance sheet. Our convertible hedge and our outstanding warrants are accounted as set forth by ASC 815, through which we record the convertible hedge transaction and the warrants in additional paid in capital. Subsequent changes in fair value of the agreement are not recognized.
In addition, we account for the cost issuance of debt in accordance with ASC 835-30 Interest (“ASC 835-30”). Consequently, these costs were recognized as an asset and are amortized by periodic charges to income.
ASC 470-20 Debt with Conversion and Other Options (“ASC 470-20”) clarifies the accounting for convertible debt instruments that may be settled in cash upon conversion, including partial cash settlement. ASC 470-20 specifies that an issuer of such instruments should separately account for the liability and equity components of the instruments in a manner that reflect the issuer’s non-convertible debt borrowing rate which interest costs are recognized in subsequent periods. ASC 470-20 is effective for fiscal years beginning after December 15, 2008, and retrospective application is required for all periods presented. We adopted ASC 470-20 in the first quarter of fiscal 2009.
The convertible senior notes are classified as current liabilities at December 31, 2010 as the notes are convertible at the option of the holder during the period beginning December 15, 2011 and ending February 15, 2012.
Contingent Liabilities
We account for contingencies in accordance with ASC 450 Contingencies (“ASC 450”). ASC 450 requires that an estimated loss from a loss contingency shall be accrued when information available prior to issuance of the financial statements indicates that it is probable that an asset has been impaired or a liability has been
40
Table of Contents
incurred at the date of the financial statements and when the amount of the loss can be reasonably estimated. Accounting for contingencies such as legal and income tax matters requires us to use our judgment. We believe that our accruals for these matters are adequate. Nevertheless, the actual loss from a loss contingency might differ from our estimates.
RESULTS OF OPERATIONS
2010 results compared to 2009 (in thousands, except percentages)
| Years Ended December 31, | ||||||||||||||||||||
| 2010 | 2009 | 2010 - % |
||||||||||||||||||
| Amount | % (a) | Amount | % (a) | |||||||||||||||||
| Net sales |
$ | 140,660 | 100 | % | $ | 131,407 | 100 | % | 7 | % | ||||||||||
| Gross profit |
113,809 | 81 | % | 107,359 | 82 | % | 6 | % | ||||||||||||
| Research and development expenses |
6,895 | 5 | % | 7,080 | 5 | % | -3 | % | ||||||||||||
| Selling, general and administrative expenses |
97,365 | 69 | % | 85,636 | 65 | % | 14 | % | ||||||||||||
| Total interest and other income (expense), net |
(6,250 | ) | 4 | % | (6,340 | ) | 5 | % | -1 | % | ||||||||||
| Net income (b) |
81,991 | 58 | % | 7,945 | 6 | % | 932 | % | ||||||||||||
| (a) | Expressed as a percentage of total net sales. |
| (b) | 2010 net income contains $78.7 million of net income tax benefit primarily due to recognition of deferred tax assets associated with our U.S. operations. |
Net Sales
Net sales were $140.7 million for 2010 as compared to $131.4 million for 2009, representing an increase of approximately $9.3 million or 7%. The increase in net sales is the result of continued commercialization and marketing of the Essure system worldwide and reflects the increasing numbers of physicians entering and completing training in the use of the procedure. This increase was negatively impacted by continuing macroeconomic pressures that have contributed to reductions in patient visits to OB/GYN physician offices, as well as ongoing competitive product trialing.
International sales comprised 22% of our total sales in 2010 and 21% of our total sales in 2009. Revenue from international sales increased 15% in 2010 as compared to 2009. The increases in international sales reflect our continued focus on growing our current markets and the expansion into new markets. International sales were negatively impacted by a stronger U.S. Dollar in 2010 compared to 2009.
Net sales by geographic region, based on shipping location of our customer, are as follows (in thousands, except percentages):
| Years Ended December 31, | ||||||||
| 2010 | 2009 | |||||||
| Net sales (in thousands) |
$ | 140,660 | $ | 131,407 | ||||
| United States of America |
78 | % | 79 | % | ||||
| France |
13 | % | 13 | % | ||||
| Europe (other than France) |
7 | % | 7 | % | ||||
| Other |
2 | % | 1 | % | ||||
For the years ended December 31, 2010 and 2009, we had no customers that accounted for greater than 10% of our net sales. No customers had an outstanding accounts receivable balance greater than 10% of our total gross outstanding accounts receivable as of December 31, 2010. One customer accounted for 11% of our total gross outstanding accounts receivable as of December 31, 2009.
41
Table of Contents
We expect our net sales for 2011 to be in the range of approximately $135.0 million to $150.0 million, which would represent approximately -4.1% to 6.6% change from net sales in 2010. We will continue to increase our direct sales force domestically. We believe our net sales growth in 2011 and beyond will be significantly influenced by trends in macro-economic conditions both in the United States and abroad, the number of physicians entering and completing training, the improvement in physician utilization rates of the Essure procedure, the extent of additional favorable insurance coverage and reimbursement decisions, and our success in achieving patient awareness objectives. However, as we have noted in “Risk Factors” and elsewhere in this report, our expected revenue projections involves many risks, many of which are not entirely within our control.
Gross Profit
Cost of goods sold increased by approximately $2.9 million or 12% to $26.9 million in 2010 as compared to $24.0 million in 2009. This increase was caused by higher volumes of sales. Gross margin in 2010 was 81% which represents a slight decrease from 82% gross margin in 2009. The decrease in gross margin was due to a change in channel mix characterized by greater international sales with lower average selling prices. The decrease in gross margin was further impacted due to the acquisition of intellectual property assets, including patents and licenses, of Ovion. In connection with the purchase, AMS and Ovion released us from any and all current and future domestic and international royalty obligations under such licenses. As a result, we released approximately $1.5 million of accrued international royalty obligations that resulted in our gross margins increasing by approximately 400 basis points in the third quarter of 2009.
Our gross profit margin will vary as our sales mix changes. Increases in sales of our devices through distributors in international markets will tend to decrease our overall gross profit margin.
Research and Development
Research and development expenses were $6.9 million in 2010 as compared to $7.1 million in 2009, which represents a decrease of approximately $0.2 million or 3%. As a percentage of revenues, research and development expenses for each of 2010 and 2009 were 5%.
Research and development expenses, which include expenditures related to product development, clinical research and regulatory affairs, are substantially related to the ongoing development and associated regulatory approvals of our technology. Our goal is to continue our product enhancements over the coming years, which are intended to result in improved ease of use and clinical performance. We expect that these expenses will increase as we seek to maintain our leading position in the market for non-surgical permanent female birth control.
Selling, General and Administrative
Selling, general and administrative expenses for 2010 were $97.4 million as compared to $85.6 million for 2009, which represents an increase of approximately $11.8 million or 14%. As a percentage of revenues, selling, general and administrative expenses for 2010 and 2009 were 69% and 65%, respectively.
The increase was the result of (i) payroll related, stock compensation, consulting and recruiting related expenses of approximately $4.0 million, primarily due to the expansion of the U.S. field sales force, (ii) an increase of approximately $6.9 million due to increased personnel and legal fees, (iii) an increase of approximately $0.4 million in travel related expenses and (iv) an increase of approximately $0.6 million in advertising expenditures primarily for our consumer-awareness campaign offset by a decrease of approximately $0.2 million related to market research.
We expect selling, general and administrative expenses in 2011 to be comparable to the current year due to comparable recurring expenses offset by increased spending for hiring additional sales professionals to focus on our sales efforts.
42
Table of Contents
Total interest and other income (expense), net
Total interest and other income (expense), net for both 2010 and 2009 was a net expense of approximately $6.3 million.
Interest income for 2010 was slightly lower compared to 2009, primarily as a result of lower yields on our invested cash. The lower interest income was offset by a lower interest expense in 2010 as compared to 2009 primarily due to the termination of our revolving credit line with UBS. See Note 10 – Credit Line in the Notes to Consolidated Financial Statements. In addition we incurred higher foreign exchange losses in 2009.
Provision (benefit) for income taxes
For the year ended December 31, 2010, we recorded $78.7 million of net income tax benefits primarily due to recognition of deferred tax assets associated with our U.S. operations. As of December 31, 2010, we had a total valuation allowance of $2.8 million against our state deferred tax assets, which is attributable to a portion of California net operating losses that are projected to expire prior to utilization. If the remaining valuation allowance is released in a future period, it will impact our results of operations in the periods such a determination is made. We have not paid any significant cash income taxes in the United States since inception and we do not expect to pay any significant cash income taxes during 2011 in the United States. Going forward, primarily as a result of the recognition of our U.S. deferred tax assets, we will commence the recording of income tax expense at the effective federal and state blended tax rates.
We adopted the provisions of ASC 740, on January 1, 2007. We have not been audited by the Internal Revenue Service or any state income or franchise tax agency. As of December 31, 2010, our federal returns for the years ended 2006 through the current period and most state returns for the years ended 2005 through the current period are still open to examination. The tax returns of SAS for the years ended 2005 to 2007 were examined and closed by the French tax authorities in 2008. In addition, all of the net operating losses and research and development credit carryforwards that may be used in future years are still subject to inquiry given that the statute of limitation for these items would begin in the year of the utilization.
The amount of unrecognized tax benefits at December 31, 2010 was approximately $3.2 million, of which, if ultimately recognized, approximately $2.7 million would decrease the effective tax rate in the period in which the benefit is recognized. The remaining amount would be offset by the reversal of related deferred tax assets on which a valuation allowance is placed.
We do not expect our unrecognized tax benefits to change significantly over the next 12 months. In connection with the adoption of ASC 740, we recognize interest and penalties accrued on any unrecognized tax benefits as a component of income tax expense.
2009 results compared to 2008 (in thousands, except percentages)
| Years Ended December 31, | ||||||||||||||||||||
| 2009 | 2008 (a) | 2009- % |
||||||||||||||||||
| Amount | % (b) | Amount | % (b) | |||||||||||||||||
| Net sales |
$ | 131,407 | 100 | % | $ | 101,977 | 100 | % | 29 | % | ||||||||||
| Gross profit |
107,359 | 82 | % | 80,327 | 79 | % | 34 | % | ||||||||||||
| Research and development expenses |
7,080 | 5 | % | 6,788 | 7 | % | 4 | % | ||||||||||||
| Selling, general and administrative expenses |
85,636 | 65 | % | 72,685 | 71 | % | 18 | % | ||||||||||||
| Total interest and other income (expense), net |
(6,340 | ) | 5 | % | (4,764 | ) | 5 | % | 33 | % | ||||||||||
| Net income (loss) |
7,945 | 6 | % | (3,886 | ) | -4 | % | 304 | % | |||||||||||
43
Table of Contents
| (a) | Adjusted for retrospective adoption of ASC 470-20. See Note 9: Convertible Senior Notes in the Notes to the Consolidated Financial Statements. |
| (b) | Expressed as a percentage of total net sales. |
Net Sales
Net sales were $131.4 million for 2009 as compared to $102.0 million for 2008, which represented an increase of approximately $29.4 million or 29%. The increase was primarily the result of continued commercialization and marketing of the Essure procedure worldwide and reflected the increased number of physicians who have entered and completed training in the use of the procedure. The increase also reflected the continuation of our programs aimed at raising consumer awareness of the Essure procedure, such as radio, print and television advertising.
International sales comprised 21% of our total sales in 2009 and 2008. Revenue from international sales increased 25% in 2009 as compared to 2008. The increase reflected continued growth at SAS and the establishment of CML in the United Kingdom. In addition, international sales were positively impacted by the increased number of global distributors in 2009.
Net sales by geographic region, based on shipping location of our customer, were as follows (in thousands, except percentages):
| Years Ended December 31, | ||||||||
| 2009 | 2008 | |||||||
| Net sales (in thousands) |
$ | 131,407 | $ | 101,977 | ||||
| United States of America |
79 | % | 79 | % | ||||
| France |
13 | % | 13 | % | ||||
| Europe (other than France) |
7 | % | 7 | % | ||||
| Other |
1 | % | 1 | % | ||||
For the years ended December 31, 2009 and 2008, no customers accounted for greater than 10% of our net sales. One customer accounted for 11% of our total gross outstanding accounts receivable as of December 31, 2009. No customers had an outstanding accounts receivable balance greater than 10% of our total gross outstanding accounts receivable as of December 31, 2008.
Gross Profit
Cost of goods sold increased by approximately $2.4 million to $24.1 million in 2009 as compared to $21.7 million in 2008. This increase was caused by higher volumes of sales. The gross profit margin was 82% for 2009 compared with 79% for 2008. The year-over-year increase in gross margin was related to lower manufacturing costs associated with higher unit volume and a domestic price increase which was implemented during the first quarter of 2009.
Additionally, during the third quarter of 2009, we acquired the intellectual property assets, including patents and licenses from Ovion. In connection with the purchase, AMS and Ovion released us from any and all current and future domestic and international royalty obligations under such licenses. As a result, we released approximately $1.5 million of accrued international royalty obligations that resulted in our gross margins increasing by approximately 400 basis points in the third quarter of 2009. The acquisition of these intellectual property assets secured complete ownership over the use and further development of the Essure system.
44
Table of Contents
Research and Development
Research and development expenses were $7.1 million in 2009 as compared to $6.8 million in 2008, which represented an increase of approximately $0.3 million or 4%. As a percentage of revenues, research and development expenses for 2009 and 2008 represented 5% and 7%, respectively.
The primary reason for the increase were higher costs resulted to develop and test prototypes for the next generation devices, increased cost for tools and supplies, and higher clinical trials related expenses of approximately $0.8 million. This increase was partially offset by a $0.5 million decreases related to payroll, stock compensation and consulting expenses.
Selling, General and Administrative
Selling, general and administrative expenses for 2009 were $85.6 million as compared to $72.7 million for 2008, which represented an increase of 18%. As a percentage of revenues, selling, general and administrative expenses for 2009 and 2008 were 65% and 71%, respectively.
The increase was the result of payroll, consulting personnel expenses, and stock compensation expenditures of approximately $6.2 million. Advertising expenditures increased by approximately $3.7 million primarily for our consumer-awareness campaigns. The increase also reflected the following: increased rent, insurance and sales taxes related expenses of approximately $1.1 million; increased costs related to marketing materials and research of approximately $0.8 million; increased banking fees of approximately $0.2 million; increased audit and tax related fees of approximately $0.2 million; increased travel related expenses of approximately $0.4 million; an increase in bad debt expense of approximately $0.1 million; and increased supplies, freight and maintenance of approximately $0.2 million.
Total interest and other income (expense), net
Total interest and other income (expense), net for 2009 was a net expense of $6.3 million as compared to a net expense of $4.8 million for 2008, which represented an increase of approximately $1.6 million or 33%. Interest income for 2009 was lower by $1.3 million compared to 2008, primarily as a result of lower interest rates on our investment portfolio, which consisted of auction rate securities and money market funds that were earning lower interest rates compared to 2008.
Interest expense in 2009 was $0.5 million higher than 2008, primarily due to the interest on our revolving credit line with UBS. See Note 10 – Credit Line in the Notes to Consolidated Financial Statements.
In May 2008, FASB issued ASC 470-20, which clarified the accounting for convertible debt instruments that may be settled in cash upon conversion, including partial cash settlement. ASC 470-20 specified that an issuer of such instruments should separately account for the liability and equity components of the instruments in a manner that reflect the issuer’s non-convertible debt borrowing rate which interest costs are recognized in subsequent periods. ASC 470-20 was effective for fiscal years beginning after December 15, 2008 and retrospective application was required for all periods presented. We adopted ASC 470-20 as of our first quarter of fiscal 2009. The adoption resulted in non-cash interest expense of $4.2 million and $4.0 million for 2009 and 2008, respectively. See Note 9 – Convertible Senior Notes in the Notes to Consolidated Financial Statements.
Provision (benefit) for income taxes
We adopted the provisions of ASC 740, on January 1, 2007. The adoption of ASC 740 with respect to uncertain tax positions did not have a material impact on our financial position and results of operations. We had not been audited by the Internal Revenue Service or any state income or franchise tax agency. As of December 31, 2009, our federal returns for the years ended 2006 through then-current period and most state returns for the years ended 2005 through then-current period were still open to examination. The tax returns of
45
Table of Contents
SAS for the years ended 2005 to 2007 were examined and closed by the French tax authorities in 2008. In addition, all of the net operating losses and research and development credit carryforwards that may be used in future years were still subject to inquiry given that the statute of limitation for these items would begin in the year of the utilization.
In 2009 we had recorded a provision for income taxes of $0.4 million. Our effective tax rate was 4% for 2009.
The amount of unrecognized tax benefits at December 31, 2009 was approximately $2.4 million, of which, if ultimately recognized, approximately $0.6 million would decrease the effective tax rate in the period in which the benefit is recognized. The remaining amount would be offset by the reversal of related deferred tax assets on which a valuation allowance is placed.
In connection with the adoption of ASC 740, we recognized interest and penalties accrued on any unrecognized tax benefits as a component of income tax expense.
Recent accounting pronouncements
In October 2009, the FASB amended the accounting standards for revenue recognition to remove tangible products containing software components and non-software components that function together to deliver the product’s essential functionality from the scope of the software revenue recognition guidance. The software revenue recognition guidance was issued to address factors that entities should consider when determining whether the software and non-software components of a product function together to deliver the product’s essential functionality. The software revenue recognition updates to the Codification will allow revenue arrangements in which software and non-software components deliver together a product’s essential functionality to follow the multiple-deliverable revenue recognition criteria as opposed to the criteria applicable to software revenue recognition.
In addition, the FASB also amended the accounting standards for multiple deliverable revenue arrangements to:
| • | provide updated guidance on whether multiple deliverables exist, how the deliverables in an arrangement should be separated, and how the consideration should be allocated; |
| • | require an entity to allocate revenue in an arrangement using estimated selling price (ESP) of deliverables if a vendor does not first have vendor-specific objective evidence (VSOE) of selling price or secondly does not have third-party evidence (TPE) of selling price; and |
| • | eliminate the use of the residual method and require an entity to allocate revenue using the relative selling price method. |
Multiple-element arrangements. A multiple-element arrangement includes the sale of one or more tangible product offerings with one or more associated services offerings, each of which are individually considered separate units of accounting. The determination of our units of accounting did not change with the adoption of the new revenue recognition guidance and as such we allocate revenue to each element in a multiple-element arrangement based upon the relative selling price of each deliverable. When applying the relative selling price method, we determine the selling price for each deliverable using VSOE of selling price, if it exists, or TPE of selling price. If neither VSOE nor TPE of selling price exist for a deliverable, we use its best estimate of selling price for that deliverable. Revenue allocated to each element is then recognized when the other revenue recognition criteria are met for each element.
Both the above mentioned updates are effective for us from January 1, 2011 and we have elected to apply them prospectively to new or materially modified revenue arrangements after its effective date. We do not expect the adoption of this guidance to have a material impact on its Consolidated Financial Statements and results of operations.
46
Table of Contents
In January 2010, the Financial Accounting Standards Board (FASB) issued Accounting Standards Update (ASU) No. 2010-06, ASC 820 Fair Value Measurements and Disclosure Requirements, which updated guidance related to fair value measurements and disclosures, and requires a reporting entity to disclose separately the amounts of significant transfers in and out of Level 1 and Level 2 fair value measurements and describe the reasons for the transfers. In addition, in the reconciliation for fair value measurements using significant unobservable inputs, or Level 3, a reporting entity should disclose separately information about purchases, sales, issuances and settlements (that is, on a gross basis rather than one net number). The updated guidance also requires that and entity should provide fair value measurement disclosures for each class of assets and liabilities and disclosures about the valuation techniques and inputs used to measure fair value for both recurring and non-recurring fair value measurements for Level 2 and Level 3 fair value measurements. The updated guidance is effective for interim or annual financial reporting periods beginning after December 15, 2009, except for the disclosures about purchases, sales, issuances and settlements in the roll forward activity in Level 3 fair value measurements, which are effective for fiscal years beginning after December 15, 2010 and for interim periods within those fiscal years. We have adopted this guidance in the first quarter of 2010. See Note 4 – Fair Value Measurement in the Notes to Consolidated Financial Statements.
In February 2010, the FASB issued ASU 2010-09, ASC 855 Amendments to Certain Recognition and Disclosure Requirements, which amended guidance on subsequent events. Under this amended guidance, SEC filers are no longer required to disclose the date through which subsequent events have been evaluated in originally issued and revised financial statements. We adopted this guidance in the first quarter of fiscal 2010 and the adoption did not have a material impact on our financial condition, results of operations, or cash flows.
During 2010, the FASB has issued several ASUs – ASU No. 2010-01 through ASU No. 2010-29. Except for ASUs discussed above, the ASUs entail technical corrections to existing guidance or affect guidance related to specialized industries or entities and therefore have minimal, if any, impact on us.
LIQUIDITY AND CAPITAL RESOURCES
We have experienced significant cumulative operating losses since inception and, as of December 31, 2010, had an accumulated deficit of $152.3 million. Although we were profitable in 2010 and 2009, we experienced a net loss in 2008. We believe that our U.S. operations have achieved a sufficient level of profitability and will sustain a sufficient level of profitability in 2011 and beyond. We will continue to expend substantial resources in research and development, and the selling and marketing of the Essure system worldwide. We will remain in an accumulated deficit position unless sufficient net sales can be generated to offset expenses.
In July 2010, we exercised our put option with UBS to purchase the underlying ARS of $22.2 million at full par value. Accordingly, in 2010 we had redeemed our ARS in the aggregate amount of $43.6 million at full par value and our balance as of December 31, 2010 is zero.
During 2010, we invested $120.2 million in time deposits, U.S. treasury bills, U.S. government bonds, commercial paper and corporate bonds. We will sell certain or all investments as needed to meet the cash flow needs of our business. Hence our investments in time deposits, U.S. treasury bills, U.S. government bonds and corporate bonds are classified as available-for-sale securities in accordance with ASC 320 Investments – Debt and Equity Securities. Investments are classified as short-term or long-term based on the underlying investments maturity date. As of December 31, 2010 we had $59.4 million classified as short-term investments and $13.1 million classified as long-term investments. See Note 3 – Investments in the Notes to Condensed Consolidated Financial Statements.
The successful achievement of our business objectives may require additional financing and therefore, we may in the future seek to raise additional funds through bank facilities, debt or equity offerings or other sources of capital. Any additional equity financing may be dilutive to stockholders, and debt financing, if available, may involve restrictive covenants. Additional funding may not be available when needed or on terms acceptable to us.
47
Table of Contents
If we are unable to obtain additional capital, we may be required to delay, reduce the scope of or eliminate our sales and marketing activities. Our future liquidity and capital requirements will depend upon many factors, including, among others:
| • | resources devoted to establish sales, marketing and distribution capabilities; |
| • | the rate of product adoption by doctors and patients; |
| • | our determination to acquire or invest in other products, technologies and businesses; |
| • | the market price of our common stock as it affects the exercise of stock options and the conversion terms of our convertible debt; |
| • | the insurance payer community’s acceptance of and reimbursement for the Essure system; and |
| • | the effect on our business due to competition. |
As of December 31, 2010, we had cash and cash equivalents of $18.4 million, compared to $61.7 million at December 31, 2009. The decrease of approximately $43.3 million of cash and cash equivalents is primarily due to cash used in investing activities to purchase and sell investments and cash used in financing activities for the net repayment of the line of credit, with an offset from cash provided by operating activities. We had short-term and long-term investments of $72.5 million as of December 31, 2010, compared to $40.6 million of short-term investments at December 31, 2009.
Our convertible senior notes are classified as current liabilities at December 31, 2010 as the note is convertible at the option of the holder during the period beginning December 15, 2011 and ending February 15, 2012.
We believe that our existing cash and cash equivalents will be sufficient to meet our cash requirements and current liabilities for the next twelve months.
Sources and Uses of Cash
Our cash flows for 2010, 2009 and 2008 are summarized as follows:
| Year ended December 31, | ||||||||||||
| 2010 | 2009 | 2008 (a) | ||||||||||
| Net cash provided by operating activities |
$ | 18,641 | $ | 28,497 | $ | 4,742 | ||||||
| Net cash used in investing activities |
(35,317 | ) | (23,716 | ) | (12,060 | ) | ||||||
| Net cash provided by (used in) financing activities |
(26,471 | ) | 2,091 | 33,736 | ||||||||
| Effect of exchange rate changes on cash and cash equivalents |
(128 | ) | 66 | (148 | ) | |||||||
| Net increase (decrease) in cash and cash equivalents |
$ | (43,275 | ) | $ | 6,938 | $ | 26,270 | |||||
| (a) | Adjusted for retrospective adoption of ASC 470-20. See Note 9: Convertible Senior Notes in the Notes to the Consolidated Financial Statements. |
Operating Activities
Net cash provided by operating activities in 2010 was primarily related to $82.0 million net income, adjusted for:
| • | An increase in deferred tax assets of $78.7 million due to the release of our valuation allowance; |
| • | Non-cash related items of $21.2 million corresponding to the accretion of notes payable, stock based compensation, depreciation and amortization of fixed assets, debt issuance costs, intangible amortization and amortization and accretion of discount and premium on investments; |
| • | Increase in accounts receivable of $3.6 million as a result of our increase in sales; |
48
Table of Contents
| • | A decrease in inventories of $2.2 million; |
| • | An increase in prepaids and other current assets of $2.8 million primarily due to interest receivable from available-for-sale investments, and higher prepaid balances due to timing; |
| • | An increase in accounts payable of $0.3 million primarily related to timing of payments; and |
| • | A decrease in accrued compensation of $2.0 million primarily for the 2010 incentive plans and lower paid time off balances for 2010. |
Net cash provided by operating activities in 2009 was primarily related to $7.9 million net income, adjusted for:
| • | Non-cash related items of $16.4 million increase corresponding to the accretion of notes payable, stock based compensation, depreciation and amortization of fixed assets, debt issuance costs and intangible amortization; |
| • | Increase in accounts receivable of $2.7 million as a result of our increased sales; |
| • | Net decrease of other assets and other current assets of $5.6 million primarily due to the amortization of prepayments for our advertising; |
| • | An increase in inventories of $1.4 million; |
| • | An increase in accounts payable of $1.2 million primarily related to the timing of payments; and |
| • | An increase in accrued compensation of $1.4 million primarily for 2009 incentive plans. |
We monitor our accounts receivable turnover closely to ensure that receivables are collected timely and have established a credit and collection policy to facilitate our collection process and reduce our credit loss exposure. We expect to grow our business and increase our revenues and to continue to use cash received from collection of outstanding receivables to fund our operations.
Investing Activities
Net cash used in investing activities for 2010 was $35.3 million, primarily due to investments purchases of $120.2 million and capital expenditures primarily related to purchases of additional hysteroscopy equipment of $5.0 million. These were offset by the redemption of our ARS for $43.6 million at full par value and additional sales of short-term and long-term investments for an additional $46.3 million during 2010.
Net cash used in investing activities for 2009 was $23.7 million, primarily due to the Ovion asset acquisition of $23.7 million and capital expenditures primarily related to purchases of additional hysteroscopy equipment of $4.9 million. These were offset by the settlements of our ARS for $4.9 million at full par value during 2009.
Financing Activities
Net cash used in financing activities for 2010 was $26.5 million. This was due to a $35.8 million repayment of our UBS line of credit, offset by $2.7 million from the issuance of common stock from our stock programs and $6.6 million from borrowings under our UBS line of credit. In July 2010, we exercised our put option requiring UBS to purchase the underlying ARS at full par value and used the proceeds to repay the remaining balance and terminated the line of credit. See Note 10 – Credit Line in the Notes to Consolidated Financial Statements.
Net cash provided by financing activities in 2009 was $2.1 million resulting from $3.0 million in proceeds from the issuance of common stock under our employee stock plans and $4.4 million in proceeds from our UBS line of credit, offset by repayment of our UBS line of credit of $5.3 million.
Cash Requirements, Contractual Obligations and Commitments
We have operating lease obligations on our current building facilities and automobiles used primarily by our sales personnel worldwide.
49
Table of Contents
The following table discloses aggregate information about our contractual obligations and the periods in which payments are due as of December 31, 2010 (in thousands):
| Payments due by period | ||||||||||||||||||||
| Total | Less than 1 year |
1-3 years | 3-5 years | More than 5 years |
||||||||||||||||
| Convertible senior notes (1) |
$ | 86,250 | $ | — | $ | — | $ | — | $ | 86,250 | ||||||||||
| Operating lease obligations |
5,537 | 1,903 | 2,932 | 356 | 346 | |||||||||||||||
| Interest on our convertible senior notes |
32,020 | 1,941 | 3,881 | 3,881 | 22,317 | |||||||||||||||
| Total |
$ | 123,807 | $ | 3,844 | $ | 6,813 | $ | 4,237 | $ | 108,913 | ||||||||||
| (1) | Our convertible senior notes have a maturity of February 15, 2027, unless earlier redeemed, repurchased or purchased by us or converted and thus the principal of the convertible senior notes is included in the “more than 5 years” column in the table above. Holders of our convertible senior notes may require us to purchase all or a portion of their convertible senior notes for cash on February 15, 2012, February 15, 2017 and February 15, 2022. The convertible senior notes are classified as current liabilities at December 31, 2010 as the notes are convertible at the option of the holder during the period beginning December 15, 2011 and ending February 15, 2012. |
Debt
2.25% Convertible Senior Notes due 2027
In February 2007, we issued and sold an aggregate principal amount of $86,250,000 of our 2.25% convertible senior notes due 2027. These notes bear a 2.25% interest per annum on the principal amount, payable semiannually in arrears on February 15 and August 15 of each year, beginning on August 15, 2007. Interest accrual on the notes commenced on February 12, 2007. The notes will mature on February 15, 2027, unless earlier redeemed, repurchased or purchased by us or converted.
The notes are convertible into cash and, if applicable, shares of our common stock based on an initial conversion rate, subject to adjustment, of 35.8616 shares per $1,000 principal amount of notes (which represents an initial conversion price of approximately $27.89 per share), in certain circumstances. Upon conversion, a holder would receive cash up to the principal amount of the note and our common stock in respect of such note’s conversion value in excess of such principal amount. We may repurchase such securities from time to time.
The notes are convertible only in the following circumstances: (1) during any calendar quarter after the quarter ended March 31, 2007 if the closing sale price of our common stock for each of 20 or more trading days in a period of 30 consecutive trading days ending on the last trading day of the immediately preceding calendar quarter exceeds 120% of the conversion price; (2) during the five consecutive business days immediately after any five consecutive trading day period if the average trading price per $1,000 principal amount of the notes is less than or equal to 97% of the average conversion value of the notes during such five-day period; (3) upon the occurrence of specified corporate transactions; (4) if we call the notes for redemption and (5) at anytime on or after December 15, 2011 up to and including February 15, 2012 and anytime on or after February 15, 2025. Upon a change in control or termination of trading, holders of the notes may require us to repurchase all or a portion of their notes for cash at a repurchase price equal to 100% of the principal amount, plus any accrued and unpaid interest.
In addition, in connection with the issuance of the notes, we entered into separate convertible note hedge transactions and separate warrant transactions to reduce the potential dilution upon conversion of the notes (“Call Spread Transactions”). As a result of the Call Spread Transactions, we do not anticipate experiencing an increase in the total shares outstanding from the conversion of the notes unless the price of our common stock appreciates above $36.47 per share, effectively increasing the conversion premium to us to $36.47. We purchased call
50
Table of Contents
options to cover approximately 3.1 million shares of our common stock, which is the number of shares underlying the notes. In addition, we sold warrants permitting the purchasers to acquire up to approximately 3.1 million shares of our common stock. The convertible senior notes are classified as current liabilities at December 31, 2010 as the notes are convertible at the option of the holder during the period beginning December 15, 2011 and ending February 15, 2012. See Note 4 – Fair Value Measurement and Note 9 – Convertible Senior Notes in the Notes to Consolidated Financial Statements.
UBS Line of Credit
In November 2008, we entered into a revolving credit line agreement with UBS, payable on demand, in an amount equal to 75% of the fair value of our ARS at a net no cost, meaning that the interest we paid on the credit line did not exceed the interest that we received on the ARS that we pledged as security for the credit line. In July 2010, we exercised our put option to require UBS to purchase the underlying ARS at full par value and used the proceeds to repay the remaining balance of $14.2 million and terminated the line of credit. During 2010 we borrowed an additional $6.6 million, and repaid $35.8 million under this line of credit. Our loan balance as of December 31, 2010 and 2009 was zero and $29.2 million, respectively. The line of credit was terminated in the third quarter of 2010. See Note 10 – Credit Line in the Notes to Consolidated Financial Statements.
Off-Balance Sheet Arrangements
We do not have any off-balance sheet arrangements that have or are reasonably likely to have a current or future material effect on our financial condition, changes in our financial condition, revenues or expenses, results of operations, liquidity, capital expenditures or capital resources as of December 31, 2010.
51
Table of Contents
| ITEM 7A. | QUANTITATIVE AND QUALITATIVE DISCLOSURES ABOUT MARKET RISK |
The following discusses our exposure to market risk related to changes in interest rates and foreign currency exchange rates. These exposures may change over time as business practices evolve and could have a material adverse impact on our financial results.
Interest Rate Risk: We maintain an investment portfolio of various holdings, types, and maturities. The values of our investments are subject to market price volatility. Our primary objective for holding investments is to achieve an appropriate investment return consistent with preserving principal and managing risk. As of December 31, 2010 we had short and long-term available-for-sale investments of $72.5 million recorded at fair value.
At any time, a sharp rise in interest rates could have a material adverse impact on the fair value of our investment portfolio, specifically investments in corporate bonds and U.S. government bonds. We had no outstanding hedging instruments for our investments as of December 31, 2010. We monitor our interest rate and credit risks, including our credit exposures to specific rating categories and to individual issuers. We monitor our investment portfolio to ensure it is compliant with our internal investments policy. We believe the overall credit quality of our portfolio is strong. There were no impairment charges on our investments for the year ended December 31, 2010. As of December 31, 2010, a hypothetical 100 basis point change in interest rates would not have a material impact on the fair value of our available-for-sale investments. See Note 3 – Investments in the Notes to Consolidated Financial Statements.
Foreign Currency Exchange Risk: A portion of our net sales are denominated in the Euro and the British Pound. To date the foreign currency exchange risk related to British Pounds has been minimal due to the relative size of Conceptus Medical Limited.
We are exposed to foreign exchange rate fluctuations as we translate the financial statements of our foreign subsidiaries into U.S. Dollars in consolidation. If there is a change in foreign currency exchange rates, the translation of the foreign subsidiaries’ financial statements into U.S. Dollars will lead to translation gains or losses which are recorded net as a component of accumulated other comprehensive income (loss). We seek to manage our foreign exchange risk through operational means, including managing same currency revenues in relation to same currency expenses, and same currency assets in relation to same currency liabilities. Periodically, during 2010 we entered into forward contracts to buy U.S dollars at fixed intervals in the retail market in an over-the-counter environment. As of December 31, 2010, we had foreign currency forward contracts to sell 4.4 million Euros in exchange for $5.9 million maturing in January 2011 through March 2011. As of December 31, 2010 these forward contracts are recorded at their fair value of $0.2 million in other current assets on our condensed consolidated balance sheet. We have outstanding short-term intercompany receivables of $5.9 million as of December 31, 2010. We expect the changes in the fair value of the intercompany receivables to be materially offset by the changes in the fair value of the forward contracts. As of December 31, 2010, a potential loss in fair value resulting from a hypothetical 10 percent strengthening in the value of the U.S. Dollar/Euro would be approximately $0.6 million.
The purpose of these forward contracts is to minimize the risk associated with foreign exchange rate fluctuations. We have developed a foreign exchange policy to govern our forward contracts. These foreign currency forward contracts do not qualify as cash flow hedges and all changes in fair value are reported in earnings as part of other income and expenses. We have not entered into any other types of derivative financial instruments for trading or speculative purpose. Our foreign currency forward contract valuation inputs are based on quoted prices and quoted pricing intervals from public data and do not involve management judgment.
| ITEM 8. | CONSOLIDATED FINANCIAL STATEMENTS AND SUPPLEMENTARY DATA |
Our consolidated financial statements are set forth in this Annual Report on Form 10-K beginning on page 59.
52
Table of Contents
| ITEM 9. | CHANGES IN AND DISAGREEMENTS WITH ACCOUNTANTS ON ACCOUNTING AND FINANCIAL DISCLOSURE |
None.
| ITEM 9A. | CONTROLS AND PROCEDURES |
(a) Evaluation of Disclosure Controls and Procedures:
We maintain disclosure controls and procedures that are designed to ensure that information required to be disclosed in our Exchange Act reports is recorded, processed, summarized and reported within the time periods specified in the Securities and Exchange Commission’s rules and forms and that such information is accumulated and communicated to our management, including our Chief Executive Officer and Chief Financial Officer, as appropriate, to allow for timely decisions regarding required disclosure. In designing and evaluating the disclosure controls and procedures, management recognizes that any controls and procedures, no matter how well designed and operated, can provide only reasonable assurance of achieving the desired control objectives, and in reaching a reasonable level of assurance, management is required to apply its judgment in evaluating the cost-benefit relationship of possible controls and procedures.
As of December 31, 2010, the end of the period covered by this report, we carried out an evaluation, under the supervision and with the participation of our management, including our Chief Executive Officer and our Chief Financial Officer, of the effectiveness of the design and operation of our disclosure controls and procedures. Based on the foregoing, our Chief Executive Officer and Chief Financial Officer concluded that our disclosure controls and procedures were effective at the reasonable assurance level.
(b) Management’s Annual Report on Internal Control Over Financial Reporting:
Management is responsible for establishing and maintaining adequate internal control over our financial reporting.
Internal control over financial reporting refers to the process designed by, or under the supervision of, our Chief Executive Officer and Chief Financial Officer, and effected by management and other personnel, to provide reasonable assurance regarding the reliability of financial reporting and the preparation of financial statements for external purposes in accordance with generally accepted accounting principles, and includes those policies and procedures that:
(1) Pertain to the maintenance of records that in reasonable detail accurately and fairly reflect the transactions and dispositions of the assets of the company;
(2) Provide reasonable assurance that transactions are recorded as necessary to permit preparation of financial statements in accordance with generally accepted accounting principles, and that receipts and expenditures of the company are being made only in accordance with authorizations of management and directors of the company; and
(3) Provide reasonable assurance regarding prevention or timely detection of unauthorized acquisition, use or disposition of the company’s assets that could have a material effect on the financial statements.
Under the supervision and with the participation of our management, including our Chief Executive Officer and Chief Financial Officer, we conducted an evaluation of the effectiveness of our internal control over financial reporting as of December 31, 2010 based on the framework in Internal Control – Integrated Framework issued by the Committee of Sponsoring Organizations of the Treadway Commission, or COSO. Based on that evaluation, our management concluded that our internal control over financial reporting was effective as of December 31, 2010.
PricewaterhouseCoopers LLP, the independent registered public accounting firm who audited our consolidated financial statements, has issued an attestation report on our internal control over financial reporting, which report is included elsewhere herein.
53
Table of Contents
(c) Changes in Internal Control Over Financial Reporting:
There has been no change in the company’s internal control over financial reporting during our most recent fiscal quarter that has materially affected, or is reasonably likely to materially affect, our internal controls over financial reporting.
Inherent Limitations of Internal Controls
Internal control over financial reporting cannot provide absolute assurance of achieving financial reporting objectives because of its inherent limitations. Internal control over financial reporting is a process that involves human diligence and compliance and is subject to lapses in judgment and breakdowns resulting from human failures. Internal control over financial reporting also can be circumvented by collusion or improper management override. Because of such limitations, there is a risk that material misstatements may not be prevented or detected on a timely basis by internal control over financial reporting. However, these inherent limitations are known features of the financial reporting process. Therefore, it is possible to design into the process safeguards to reduce, though not eliminate, this risk.
| ITEM 9B. | OTHER INFORMATION |
Not applicable.
54
Table of Contents
Certain information required by Part III is incorporated by reference from our definitive proxy statement (or Proxy Statement), for our annual meeting of stockholders to be held on May 25, 2011, which will be filed within 120 days after the end of our fiscal year pursuant to Regulation 14A, and the information included therein is incorporated by reference to the extent detailed below.
| ITEM 10. | DIRECTORS, EXECUTIVE OFFICERS AND CORPORATE GOVERNANCE |
Information required by this item, insofar as it relates to directors and officers, will be contained in our Proxy Statement in connection with our 2011 Annual Meeting of Stockholders, which we anticipate will be filed no later than 120 days after the end of our fiscal year pursuant to Regulation 14A, under the captions “Election of Directors” and “Management.” Information required by this item as to compliance with Section 16(a) of the Securities Exchange Act of 1934 will be contained in the our Proxy Statement under the caption “Section 16(a) Beneficial Owner Reporting Compliance,” and is hereby incorporated by reference into this report.
We have a written code of ethics that applies to all of our employees and to our Board of Directors. A copy of the code is available on our website at www.conceptus.com.
| ITEM 11. | EXECUTIVE COMPENSATION |
The information required by this item is incorporated by reference from the information under the caption “Executive Compensation” in our Proxy Statement.
| ITEM 12. | SECURITY OWNERSHIP OF CERTAIN BENEFICIAL OWNERS AND MANAGEMENT AND RELATED STOCKHOLDER MATTERS |
The information required by this item is incorporated by reference from the information under the captions “Security Ownership of Certain Beneficial Owners and Management” and “Securities Authorized for Issuance Under Equity Compensation Plans” in our Proxy Statement.
| ITEM 13. | CERTAIN RELATIONSHIPS AND RELATED TRANSACTIONS, AND DIRECTOR INDEPENDENCE |
The information required by this item is incorporated by reference from the information under the caption[s] “Certain Relationships and Related Transactions” and “Director Independence” in our Proxy Statement.
| ITEM 14. | PRINCIPAL ACCOUNTANT FEES AND SERVICES |
The information required by this item is incorporated by reference from the information under the caption “Principal Accountant Fees and Services” in our Proxy Statement.
55
Table of Contents
| ITEM 15. | EXHIBITS AND FINANCIAL STATEMENT SCHEDULES |
(a) The following documents are filed as part of this Report:
(1) Report of Independent Registered Public Accounting Firm
Consolidated Balance Sheets at December 31, 2010 and 2009
Consolidated Statements of Operations for the Years Ended December 31, 2010, 2009, and 2008
Consolidated Statements of Stockholders’ Equity for the Years Ended December 31, 2010, 2009,
and 2008
Consolidated Statements of Cash Flows for the Years Ended December 31, 2010, 2009, and 2008
Notes to Consolidated Financial Statements
(2) Financial Statement Schedule
The financial statement schedule of Conceptus, Inc. for the years ended December 31, 2010, 2009, and 2008 is filed as part of this Form 10-K and should be read in conjunction with Conceptus, Inc.’s Consolidated Financial Statements.
Schedule II – Valuation and Qualifying Accounts
Other schedules have been omitted because the information required to be set forth therein is not
applicable or is shown in the financial statements or notes thereto.
(3) Exhibits (numbered in accordance with Item 601 of Regulation S-K).
| Exhibit |
Description | |
| 3.1 | Amended and Restated Certificate of Incorporation of Registrant. Incorporated by reference to the Registrant’s Registration Statement on Form SB-2, as amended (File No. 33-99890-LA), which became effective on February 1, 1996. | |
| 3.2 | Certificate of Amendment to Amended and Restated Certificate of Incorporation of Registrant. Incorporated by reference to the Registrant’s Registration Statement on Form S-3 (File No. 333-89266) filed on June 4, 2002. | |
| 3.3 | Amended and Restated Bylaws of Registrant. Incorporated by reference to Exhibit 3.1 of the Registrant’s Form 8-K filed on December 18, 2008. | |
| 3.4 | Certificate of Amendment No. 1 to the Amended and Restated By-Laws of Conceptus, Inc. Incorporated by reference to Exhibit 3.1 of the Registrant’s Form 8-K filed on March 2, 2009. | |
| 4.1 | Indenture between Conceptus, Inc. and Wells Fargo, National Association, dated February 12, 2007. Incorporated by reference to Exhibit 4.1 to the Registrant’s Form 8-K filed on February 12, 2007. | |
| 4.2 | Supplemental Indenture No. 1, including the Form of 2.25% Convertible Senior Notes due 2027, between Conceptus, Inc. and Wells Fargo, National Association, dated February 12, 2007. Incorporated by reference to Exhibit 4.2 to the Registrant’s Form 8-K filed on February 12, 2007. | |
| 10.1 | Form of Indemnification Agreement for directors and officers. Incorporated by reference to Exhibit 10.1 of the Registrant’s Annual Report on Form 10-K for the year ended December 31, 2008. | |
| 10.2* | Amended and Restated 1993 Stock Plan. Incorporated by reference to Exhibit 10.31 of the Registrant’s Quarterly Report on Form 10-Q for the quarter ended March 31, 2000. | |
| 10.3* | 1995 Employee Stock Purchase Plan. Incorporated by reference to the Registrant’s Registration Statement on Form SB-2, as amended (File No. 33-99890-LA), which became effective on February 1, 1996. | |
| 10.4* | Amended and Restated 2002 Non-Qualified Stock Option Plan. Incorporated by reference to Exhibit 10.7 of the Registrant’s Annual Report on Form 10-K for the year ended December 31, 2002. |
56
Table of Contents
| Exhibit |
Description | |
| 10.5* | Form of Senior Management Amended and Restated Change of Control Agreement. Incorporated by reference to Exhibit 10.7 of the Registrant’s Report on Form 10-K for the year ended December 31, 2004. | |
| 10.6* | Amended and Restated Change in Control Agreement, dated January 1, 2009, between the Company and Kathryn Tunstall. Incorporated by reference to Exhibit 10.2 of the Registrant’s Quarterly Report on Form 10-Q for the quarter ended June 30, 2009. | |
| 10.7 | License Agreement dated December 28, 1992 between the Registrant and Target Therapeutics Inc. Incorporated by reference to the Registrant’s Registration Statement on Form SB-2, as amended (File No. 33-99890-LA), which became effective on February 1, 1996. | |
| 10.8 | Amended and Restated Preferred Shares Rights Agreement, dated as of February 26, 2007, between the Registrant and Mellon Shareholder Services, L.L.C., including the Certificate of Designation of Rights, Preferences and Privileges of Series A Participating Preferred Stock, the form of Rights Certificate and the Summary of Rights attached thereto as Exhibits A, B and C, respectively. Incorporated by reference to Exhibit 10.1 of the Registrant’s Report on Form 8-K filed on February 23, 2007. | |
| 10.9+ | Exclusive U.S. Co-Promotion Agreement, dated as of October 30, 2003, by and between the Registrant and Gynecare Worldwide Division of Ethicon, Inc. Incorporated by reference to Exhibit 10.1 of the Registrant’s Report on Form 8-K filed on March 1, 2004. | |
| 10.10+ | Supply Agreement, dated June 1, 2009, between Accellent Inc. and Conceptus Incorporated. Incorporated by reference to Exhibit 10.1 of the Registrant’s Quarterly Report on Form 10-Q for the quarter ended June 30, 2009. | |
| 10.11* | Letter Agreement by and between the Company and Gregory E. Lichtwardt dated November 12, 2003. Incorporated by reference to Exhibit 10.29 of the Registrant’s Annual Report on Form 10-K for the year ended December 31, 2003. | |
| 10.12* | Amended and Restated Employment Agreement between the Company and Mark M. Sieczarek dated December 24, 2008. Incorporated by reference to Exhibit 10.1 of the Registrant’s Quarterly Report on Form 10-Q for the quarter ended March 31, 2009. | |
| 10.13* | Letter Agreement between Ulric Cote and Conceptus, Inc. executed March 25, 2004. Incorporated by reference to Exhibit 10.2 of the Registrant’s Quarterly Report on 10-Q for the Quarter Ended March 31, 2004. | |
| 10.14* | Employment Commencement Nonstatutory Stock Option Agreement between Ric Cote and Conceptus, Inc. executed April 5, 2004. Incorporated by reference to Exhibit 4.2 of the Registrant’s Registration Statement on Form S-8 filed on June 29, 2004. | |
| 10.15* | Stand-Alone Restricted Stock Purchase Agreement between Ric Cote and Conceptus, Inc. executed April 5, 2004. Incorporated by reference to Exhibit 4.3 of the Registrant’s Registration Statement on Form S-8 filed on June 29, 2004. | |
| 10.16* | Relocation Expense Agreement dated October 28, 2005 between the Registrant and Ulric Cote. Incorporated by reference to Exhibit 10.40 of the Registrant’s Annual Report on Form 10-K for the year ended December 31, 2005. | |
| 10.17* | Form of Stock Appreciation Right Agreement under Conceptus, Inc. Amended and Restated 2001 Equity Incentive Plan. Incorporated by reference to Exhibit 10.1 to the Registrant’s Form 8-K filed on February 6, 2007. | |
| 10.18* | Form of Restricted Stock Unit Award Grant Notice and Restricted Stock Unit Award Agreement under Conceptus, Inc. Amended and Restated 2001 Equity Incentive Plan. Incorporated by reference to Exhibit 10.2 to the Registrant’s Form 8-K filed on February 6, 2007. | |
| 10.19 | Confirmation of Convertible Bond Hedge Transaction, dated February 6, 2007, by and between the Registrant and UBS AG, London Branch. Incorporated by reference to Exhibit 10.1 to the Registrant’s Form 8-K filed on February 12, 2007. |
57
Table of Contents
| Exhibit |
Description | |
| 10.20 | Confirmation of Convertible Bond Hedge Transaction, dated February 6, 2007, by and between the Registrant and Societe Generale. Incorporated by reference to Exhibit 10.2 to the Registrant’s Form 8-K filed on February 12, 2007. | |
| 10.21 | Confirmation of Issuer Warrant Transaction, dated February 6, 2007, by and between the Registrant and UBS AG, London Branch. Incorporated by reference to Exhibit 10.3 to the Registrant’s Form 8-K filed on February 12, 2007. | |
| 10.22 | Confirmation of Issuer Warrant Transaction, dated February 6, 2007, by and between the Registrant and Societe Generale. Incorporated by reference to Exhibit 10.4 to the Registrant’s Form 8-K filed on February 12, 2007. | |
| 10.23* | Stock Appreciation Right Agreement, by and between the Registrant and Spencer Roeck, dated October 10, 2007. Incorporated by reference to Exhibit 10.1 to the Registrant’s Form S-8 filed on December 4, 2007. | |
| 10.24 | Lease Agreement for the premises located at 331 East Evelyn, Mountain View, California. Incorporated by reference to Exhibit 10.35 to the Registrant’s Annual Report on Form 10-K for the year ended December 31, 2008. | |
| 10.25 | Credit Line Account Application and Agreement for Organization and Business and Addendum, by and between Conceptus, Inc. and UBS Bank USA. Incorporated by reference to Exhibit 10.36 to the Registrant’s Annual Report on Form 10-K for the year ended December 31, 2008. | |
| 10.26 | Share Purchase Agreement by and among Conceptus, Inc., Conceptus SAS and the Sellers party thereto, dated January 7, 2008. Incorporated by reference to Exhibit 10.1 to the Registrant’s Form 8-K filed on January 11, 2008. | |
| 10.27 | Asset Purchase Agreement, dated September 30, 2009, between American Medical Systems, Inc. and Conceptus Incorporated. Incorporated by reference to Exhibit 10.1 of the Registrant’s Quarterly Report on Form 10-Q for the quarter ended September 30, 2009. | |
| 10.28* | Employment Agreement, dated November 2, between Julie Brooks and Conceptus Incorporated. Incorporated by reference to Exhibit 10.2 of the Registrant’s Quarterly Report on Form 10-Q for the quarter ended September 30, 2009. | |
| 10.29* | 2010 Equity Incentive Award Plan. Incorporated by reference to Exhibit 10.1 of the Registrant’s Form 8-K filed on June 16, 2010. | |
| 10.30* | Fifth Amendment to 1995 Employee Stock Purchase Plan. Incorporated by reference to Exhibit 10.2 of the Registrant’s Form 8-K filed on June 16, 2010. | |
| 10.31* | Employment Agreement dated December 20, 2010 between Sam Trujillo and Conceptus Inc. as disclosed in the Registrant’s Form 8K filed on January 6, 2011. | |
| 10.32 | Amended Exhibit E to the Avail Manufacturing Contract dated July 28, 2010 | |
| 14.1 | Code of Ethics. Incorporated by reference to Exhibit 14.1 of the Registrant’s Form 8K filed on October 5, 2010. | |
| 21.0 | List of Conceptus subsidiaries. | |
| 23.1 | Consent of Independent Registered Public Accounting Firm. | |
| 24.1 | Power of Attorney (See signature page to this Report). | |
| 31.1 | Certification of Chief Executive Officer Pursuant to Section 302 of the Sarbanes-Oxley Act of 2002. | |
| 31.2 | Certification of Chief Financial Officer Pursuant to Section 302 of the Sarbanes-Oxley Act of 2002. | |
| 32.1 | Certification of Chief Executive Officer Pursuant to Section 906 of the Sarbanes-Oxley Act of 2002. | |
| 32.2 | Certification of Chief Financial Officer Pursuant to Section 906 of the Sarbanes-Oxley Act of 2002. |
| * | Management contract or compensatory plan or arrangement. |
| + | Confidential treatment has been granted with respect to certain portions of this Exhibit by order from the Securities and Exchange Commission. |
58
Table of Contents
CONCEPTUS, INC.
INDEX TO CONSOLIDATED FINANCIAL STATEMENTS
59
Table of Contents
Report of Independent Registered Public Accounting Firm
To the Board of Directors and Stockholders of Conceptus, Inc.
In our opinion, the accompanying consolidated financial statements listed in the index under Item 15(a) (1) present fairly, in all material respects, the financial position of Conceptus, Inc. and its subsidiaries at December 31, 2010 and December 31, 2009, and the results of their operations and their cash flows for each of the three years in the period ended December 31, 2010 in conformity with accounting principles generally accepted in the United States of America. In addition, in our opinion, the financial statement schedule listed in the index appearing under Item 15(a)(2) presents fairly, in all material respects, the information set forth therein when read in conjunction with the related consolidated financial statements. Also in our opinion, the Company maintained, in all material respects, effective internal control over financial reporting as of December 31, 2010, based on criteria established in Internal Control—Integrated Framework issued by the Committee of Sponsoring Organizations of the Treadway Commission (COSO). The Company’s management is responsible for these financial statements and financial statement schedule, for maintaining effective internal control over financial reporting and for its assessment of the effectiveness of internal control over financial reporting, included in Management’s Report on Internal Control over Financial Reporting, appearing under Item 9A. Our responsibility is to express opinions on these financial statements, on the financial statement schedule and on the Company’s internal control over financial reporting based on our integrated audits. We conducted our audits in accordance with the standards of the Public Company Accounting Oversight Board (United States). Those standards require that we plan and perform the audits to obtain reasonable assurance about whether the financial statements are free of material misstatement and whether effective internal control over financial reporting was maintained in all material respects. Our audits of the financial statements included examining, on a test basis, evidence supporting the amounts and disclosures in the financial statements, assessing the accounting principles used and significant estimates made by management, and evaluating the overall financial statement presentation. Our audit of internal control over financial reporting included obtaining an understanding of internal control over financial reporting, assessing the risk that a material weakness exists, and testing and evaluating the design and operating effectiveness of internal control based on the assessed risk. Our audits also included performing such other procedures as we considered necessary in the circumstances. We believe that our audits provide a reasonable basis for our opinions.
A company’s internal control over financial reporting is a process designed to provide reasonable assurance regarding the reliability of financial reporting and the preparation of financial statements for external purposes in accordance with generally accepted accounting principles. A company’s internal control over financial reporting includes those policies and procedures that (i) pertain to the maintenance of records that, in reasonable detail, accurately and fairly reflect the transactions and dispositions of the assets of the company; (ii) provide reasonable assurance that transactions are recorded as necessary to permit preparation of financial statements in accordance with generally accepted accounting principles, and that receipts and expenditures of the company are being made only in accordance with authorizations of management and directors of the company; and (iii) provide reasonable assurance regarding prevention or timely detection of unauthorized acquisition, use, or disposition of the company’s assets that could have a material effect on the financial statements.
Because of its inherent limitations, internal control over financial reporting may not prevent or detect misstatements. Also, projections of any evaluation of effectiveness to future periods are subject to the risk that controls may become inadequate because of changes in conditions, or that the degree of compliance with the policies or procedures may deteriorate.
/s/ PRICEWATERHOUSECOOPERS LLP
San Jose, California
March 15, 2011
60
Table of Contents
| ITEM 1. | CONSOLIDATED FINANCIAL STATEMENTS |
CONCEPTUS, INC.
(In thousands, except share and per share amounts)
| 2010 | 2009 | |||||||
| Assets |
||||||||
| Current assets: |
||||||||
| Cash and cash equivalents |
$ | 18,383 | $ | 61,658 | ||||
| Short-term investments |
59,398 | 40,626 | ||||||
| Put option |
— | 2,933 | ||||||
| Accounts receivable, net of allowance for doubtful accounts of $752 and $600 at December 31, 2010 and 2009, respectively |
20,451 | 17,315 | ||||||
| Inventories |
2,915 | 4,908 | ||||||
| Prepaids |
3,457 | 1,897 | ||||||
| Short-term deferred tax asset |
5,058 | 35 | ||||||
| Other current assets |
3,546 | 1,505 | ||||||
| Total current assets |
113,208 | 130,877 | ||||||
| Property and equipment, net |
10,062 | 9,782 | ||||||
| Intangible assets, net |
24,145 | 27,687 | ||||||
| Long-term investments |
13,104 | — | ||||||
| Restricted cash |
367 | 360 | ||||||
| Goodwill |
16,013 | 17,318 | ||||||
| Long-term deferred tax asset |
73,696 | — | ||||||
| Other assets |
151 | 1,115 | ||||||
| Total assets |
$ | 250,746 | $ | 187,139 | ||||
| Liabilities and stockholders’ equity |
||||||||
| Current liabilities: |
||||||||
| Accounts payable |
$ | 5,921 | $ | 5,878 | ||||
| Accrued compensation |
6,170 | 8,208 | ||||||
| Line of credit |
— | 29,240 | ||||||
| Notes payable |
80,960 | — | ||||||
| Other accrued liabilities |
3,736 | 4,012 | ||||||
| Total current liabilities |
96,787 | 47,338 | ||||||
| Deferred tax liability |
1,007 | 1,277 | ||||||
| Notes payable |
— | 76,531 | ||||||
| Other accrued liabilities |
1,366 | 1,135 | ||||||
| Total liabilities |
99,160 | 126,281 | ||||||
| Commitments and contingencies (Note 8) |
||||||||
| Stockholders’ equity: |
||||||||
| Preferred stock: |
||||||||
| $0.003 par value, authorized 3,000,000 shares; no shares issued or outstanding at December 31, 2010 and 2009 |
— | — | ||||||
| Common stock and additional paid-in capital: |
||||||||
| $0.003 par value, 53,000,000 shares authorized, 31,201,645 and 30,855,722 shares issued and 31,123,782 and 30,777,859 shares outstanding at December 31, 2010 and 2009, respectively |
306,276 | 296,191 | ||||||
| Accumulated other comprehensive loss |
(2,341 | ) | (993 | ) | ||||
| Accumulated deficit |
(152,349 | ) | (234,340 | ) | ||||
| Treasury Stock, 77,863 shares, at cost, at December 31, 2010 and 2009, respectively |
— | — | ||||||
| Total stockholders’ equity |
151,586 | 60,858 | ||||||
| Total liabilities and stockholders’ equity |
$ | 250,746 | $ | 187,139 | ||||
The accompanying notes are an integral part of these consolidated financial statements
61
Table of Contents
CONCEPTUS, INC.
CONSOLIDATED STATEMENTS OF OPERATIONS
(In thousands, except per share amounts)
| Years Ended December 31, | ||||||||||||
| 2010 | 2009 | 2008 (a) | ||||||||||
| Net sales |
$ | 140,660 | $ | 131,407 | $ | 101,977 | ||||||
| Cost of goods sold |
26,851 | 24,048 | 21,650 | |||||||||
| Gross profit |
113,809 | 107,359 | 80,327 | |||||||||
| Operating expenses: |
||||||||||||
| Research and development |
6,895 | 7,080 | 6,788 | |||||||||
| Selling, general and administrative |
97,365 | 85,636 | 72,685 | |||||||||
| Total operating expenses |
104,260 | 92,716 | 79,473 | |||||||||
| Operating profit |
9,549 | 14,643 | 854 | |||||||||
| Interest and other income (expense), net: |
||||||||||||
| Interest income |
768 | 822 | 2,150 | |||||||||
| Interest expense |
(6,983 | ) | (7,013 | ) | (6,543 | ) | ||||||
| Other expense, net |
(35 | ) | (149 | ) | (371 | ) | ||||||
| Total interest and other income (expense), net |
(6,250 | ) | (6,340 | ) | (4,764 | ) | ||||||
| Income (loss) before provision (benefit) for income taxes |
3,299 | 8,303 | (3,910 | ) | ||||||||
| Provision (benefit) for income taxes |
(78,692 | ) | 358 | (24 | ) | |||||||
| Net income (loss) |
$ | 81,991 | $ | 7,945 | $ | (3,886 | ) | |||||
| Basic income (loss) per share: |
||||||||||||
| Net income (loss) |
$ | 2.64 | $ | 0.26 | $ | (0.13 | ) | |||||
| Shares used in per share amounts |
31,031 | 30,572 | 30,216 | |||||||||
| Diluted income (loss) per share: |
||||||||||||
| Net income (loss) |
$ | 2.59 | $ | 0.25 | $ | (0.13 | ) | |||||
| Shares used in per share amounts |
31,682 | 31,252 | 30,216 | |||||||||
| (a) | Adjusted for the retrospective adoption of ASC 470-20, see Note 9 – Convertible Senior Notes. |
The accompanying notes are an integral part of these consolidated financial statements
62
Table of Contents
CONCEPTUS, INC.
CONSOLIDATED STATEMENTS OF STOCKHOLDERS’ EQUITY
(In thousands, except share amounts)
| Common Stock & Additional Paid-In Capital |
Deferred Stock-Based Compensation |
Accumulated Other Comprehensive Loss |
Accumulated Deficit |
Total Stockholders’ Equity |
||||||||||||||||||||
| Shares | Amount | |||||||||||||||||||||||
| Balances as of December 31, 2007 (a) |
29,838,780 | $ | 277,551 | $ | — | $ | — | $ | (238,399 | ) | $ | 39,152 | ||||||||||||
| Issuance of common stock for cash upon exercise of options |
378,267 | 3,100 | — | — | — | 3,100 | ||||||||||||||||||
| Issuance of common stock for cash from employee stock purchase plan |
61,144 | 871 | — | — | — | 871 | ||||||||||||||||||
| Issuance of common stock upon exercise of SAR’s |
5,253 | (9 | ) | — | — | — | (9 | ) | ||||||||||||||||
| Stock-based compensation for consultants’ services |
— | 183 | — | — | — | 183 | ||||||||||||||||||
| Stock-based compensation related to restricted stock, restricted stock units, SAR’s and stock option grants |
— | 5,145 | — | — | — | 5,145 | ||||||||||||||||||
| Stock-based compensation related to employee stock purchase plan |
— | 280 | 280 | |||||||||||||||||||||
| Issuance of common stock from restricted stock awards |
133,379 | (170 | ) | — | — | — | (170 | ) | ||||||||||||||||
| Accumulated other comprehensive loss |
— | — | — | (798 | ) | — | (798 | ) | ||||||||||||||||
| Retroactive adjustment on adoption of ASC 470-20 (a) |
— | — | — | — | — | |||||||||||||||||||
| Net loss (a) |
— | — | — | — | (3,886 | ) | (3,886 | ) | ||||||||||||||||
| Balances as of December 31, 2008 (a) |
30,416,823 | 286,951 | — | (798 | ) | (242,285 | ) | 43,868 | ||||||||||||||||
| Issuance of common stock for cash upon exercise of options |
265,819 | 2,186 | — | — | — | 2,186 | ||||||||||||||||||
| Issuance of common stock for cash from employee stock purchase plan |
66,970 | 904 | — | — | — | 904 | ||||||||||||||||||
| Issuance of common stock upon exercise of SAR’s |
1,524 | (16 | ) | — | — | — | (16 | ) | ||||||||||||||||
| Stock-based compensation for consultants’ services |
— | 70 | — | — | — | 70 | ||||||||||||||||||
| Stock-based compensation related to restricted stock, restricted stock units, SAR’s and stock option grants |
— | 5,762 | — | — | — | 5,762 | ||||||||||||||||||
| Stock-based compensation related to employee stock purchase plan |
— | 370 | 370 | |||||||||||||||||||||
| Issuance of stock appreciation rights |
— | 66 | — | — | — | 66 | ||||||||||||||||||
| Tax benefit from stock based compensation |
— | 18 | — | — | — | 18 | ||||||||||||||||||
| Issuance of common stock from restricted stock awards |
26,723 | (120 | ) | — | — | — | (120 | ) | ||||||||||||||||
| Accumulated other comprehensive loss |
— | — | — | (195 | ) | — | (195 | ) | ||||||||||||||||
| Net income |
— | — | — | — | 7,945 | 7,945 | ||||||||||||||||||
| Balances as of December 31, 2009 |
30,777,859 | 296,191 | — | (993 | ) | (234,340 | ) | 60,858 | ||||||||||||||||
| Issuance of common stock for cash upon exercise of options |
214,214 | 2,210 | — | — | — | 2,210 | ||||||||||||||||||
| Issuance of common stock for cash from employee stock purchase plan |
69,964 | 875 | — | — | — | 875 | ||||||||||||||||||
| Issuance of common stock upon exercise of SAR’s |
15,158 | (111 | ) | — | — | — | (111 | ) | ||||||||||||||||
| Stock-based compensation for consultants’ services |
— | 65 | — | — | — | 65 | ||||||||||||||||||
| Stock-based compensation related to restricted stock, restricted stock units, SAR’s and stock option grants |
— | 6,882 | — | — | — | 6,882 | ||||||||||||||||||
| Stock-based compensation related to employee stock purchase plan |
— | 299 | 299 | |||||||||||||||||||||
| Issuance of stock appreciation rights |
— | 70 | — | — | — | 70 | ||||||||||||||||||
| Issuance of common stock from restricted stock awards |
46,587 | (205 | ) | — | — | — | (205 | ) | ||||||||||||||||
| Accumulated other comprehensive loss |
— | — | — | (1,348 | ) | — | (1,348 | ) | ||||||||||||||||
| Net income |
— | — | — | — | 81,991 | 81,991 | ||||||||||||||||||
| Balances as of December 31, 2010 |
31,123,782 | $ | 306,276 | $ | — | $ | (2,341 | ) | $ | (152,349 | ) | $ | 151,586 | |||||||||||
| (a) | Adjusted for the retrospective adoption of ASC 470-20, see Note 9 – Convertible Senior Notes. |
The accompanying notes are an integral part of these consolidated financial statements
63
Table of Contents
CONCEPTUS, INC.
CONSOLIDATED STATEMENTS OF CASH FLOWS
(In thousands)
| Years Ended December 31, | ||||||||||||
| 2010 | 2009 | 2008 (a) | ||||||||||
| Cash flows from operating activities |
||||||||||||
| Net income (loss) |
$ | 81,991 | $ | 7,945 | $ | (3,886 | ) | |||||
| Adjustments to reconcile net income (loss) to net cash provided by operating activities: |
||||||||||||
| Depreciation and amortization of property, plant and equipment |
4,701 | 4,101 | 2,939 | |||||||||
| Amortization of debt issuance costs |
464 | 465 | 464 | |||||||||
| Accretion of notes payable |
4,429 | 4,187 | 3,958 | |||||||||
| Amortization of intangibles |
3,254 | 1,387 | 782 | |||||||||
| Amortization and accretion of discount and premium on investments |
1,111 | — | — | |||||||||
| Loss (gain) on put option |
2,933 | 2,211 | (5,144 | ) | ||||||||
| Loss (gain) on trading securities |
(2,949 | ) | (2,324 | ) | 5,273 | |||||||
| Stock-based compensation expense |
7,246 | 6,282 | 5,667 | |||||||||
| Loss on disposal of property and equipment |
61 | 12 | 48 | |||||||||
| Tax benefit from stock-based compensation |
— | 18 | — | |||||||||
| Excess tax benefit from stock-based compensation |
— | (18 | ) | — | ||||||||
| Changes in operating assets and liabilities: |
||||||||||||
| Accounts receivable, net |
(3,581 | ) | (2,661 | ) | (1,673 | ) | ||||||
| Inventories |
2,232 | (1,398 | ) | 559 | ||||||||
| Prepaid and other assets |
(2,807 | ) | 5,566 | (5,096 | ) | |||||||
| Deferred tax asset |
(78,722 | ) | — | — | ||||||||
| Accounts payable |
303 | 1,168 | (1,735 | ) | ||||||||
| Accrued compensation |
(1,876 | ) | 1,350 | 1,333 | ||||||||
| Deferred tax liability |
(174 | ) | (165 | ) | (417 | ) | ||||||
| Other accrued and long term liabilities |
25 | 371 | 1,670 | |||||||||
| Net cash provided by operating activities |
18,641 | 28,497 | 4,742 | |||||||||
| Cash flows from investing activities |
||||||||||||
| Purchase of Conceptus SAS, net of cash acquired |
— | — | (22,978 | ) | ||||||||
| Sales & maturities of investments |
89,943 | 4,875 | 22,050 | |||||||||
| Purchase of investments |
(120,290 | ) | — | (5,000 | ) | |||||||
| Restricted cash |
(7 | ) | (9 | ) | (351 | ) | ||||||
| Purchase of intellectual property assets from Ovion, Inc |
— | (23,729 | ) | — | ||||||||
| Purchase of property and equipment |
(4,963 | ) | (4,853 | ) | (5,781 | ) | ||||||
| Net cash used in investing activities |
(35,317 | ) | (23,716 | ) | (12,060 | ) | ||||||
| Cash flows from financing activities |
||||||||||||
| Proceeds from line of credit |
6,615 | 4,357 | 30,000 | |||||||||
| Repayment of line of credit |
(35,855 | ) | (5,303 | ) | (56 | ) | ||||||
| Excess tax benefit from stock-based compensation |
— | 18 | — | |||||||||
| Proceeds from issuance of common stock |
2,769 | 3,019 | 3,792 | |||||||||
| Net cash provided by (used in) financing activities |
(26,471 | ) | 2,091 | 33,736 | ||||||||
| Effect of exchange rate changes on cash and cash equivalents |
(128 | ) | 66 | (148 | ) | |||||||
| Net increase (decrease) in cash and cash equivalents |
(43,275 | ) | 6,938 | 26,270 | ||||||||
| Cash and cash equivalents at beginning of year |
61,658 | 54,720 | 28,450 | |||||||||
| Cash and cash equivalents at end of year |
$ | 18,383 | $ | 61,658 | $ | 54,720 | ||||||
| Supplemental information: |
||||||||||||
| Cash paid for: |
||||||||||||
| Interest on convertible debt |
$ | 1,941 | $ | 1,941 | $ | 1,941 | ||||||
| Income taxes |
$ | 556 | $ | 184 | $ | 46 | ||||||
| (a) | Adjusted for the retrospective adoption of ASC 470-20, see Note 9 – Convertible Senior Notes. |
The accompanying notes are an integral part of these consolidated financial statements
64
Table of Contents
CONCEPTUS, INC.
NOTES TO CONSOLIDATED FINANCIAL STATEMENTS
1. Organization, Ownership and Business
Conceptus, Inc. (“we” or “us” or “our”) was incorporated in the state of Delaware on September 18, 1992 to design, develop and market minimally invasive devices for reproductive medical applications. Our mailing address and executive offices are located at 331 East Evelyn, Mountain View, California 94041, and our telephone number is (650) 962-4000.
We design, develop, market and promote innovative solutions in women’s healthcare. Our flagship product is the proprietary Essure® permanent birth control system, which is the most effective non-surgical permanent birth control system available. The Essure system delivers a soft and flexible insert into a woman’s fallopian tubes, causing a benign tissue in-growth which blocks the fallopian tubes. Successfully placed Essure micro-inserts and the subsequent tissue growth around and through the micro-inserts prohibits the egg from traveling through the fallopian tube, preventing conception. The effectiveness rate of the Essure procedure determined in our clinical study is 99.8% after four years of follow-up. We obtained approval to market Essure in the European Union in February 2001 and obtained the U.S. Food and Drug Administration, or FDA, approval for Essure in November 2002. Nearly 500,000 women worldwide have undergone the Essure procedure and we sold the Essure system in 31 countries in 2010.
We sell Essure directly in France through our wholly owned subsidiary, Conceptus SAS (“SAS”), as well as indirectly through a network of distributors throughout the rest of Europe. Our wholly owned subsidiary in the United Kingdom, Conceptus Medical Limited (“CML”), serves as our direct sales office in the United Kingdom.
In 2009 we received a positive review from the National Institute for Health and Clinical Excellence in the United Kingdom and an approval for the Essure procedure from the Brazilian National Health Service.
During the first quarter of 2011 we began to promote GYNECARE THERMACHOICE® Uterine Balloon Therapy System in U.S. OB/GYN physician offices. GYNECARE THERMACHOICE is a global endometrial ablation product that is used to treat excessive uterine bleeding (menorrhagia). The product is manufactured for and marketed by ETHICON™ Women’s Health & Urology, a division of Ethicon, Inc.
We have a limited history of operations with the Essure system and since our inception in 1992, we have incurred operating losses until we experienced our first operating profit in Fiscal 2008. In December 2006, we filed a Registration Statement on Form S-3, through which we may sell from time to time any combination of debt securities, common stock, preferred stock and warrants, in one or more offerings, with an initial offering price not to exceed $150,000,000. In February 2007, we issued an aggregate principal amount of $86,250,000 of our 2.25% convertible senior notes due 2027. If the notes are converted, then upon conversion (“net shares settlement”), holders will receive cash and in certain circumstances, shares of our common stock based on an initial conversion rate, subject to adjustment, of 35.8616 shares per $1,000 principal amount of notes (which represents an initial conversion price of $27.89 per share). Upon conversion, a holder would receive cash up to the principal amount of the note and our common stock in respect of such note’s conversion value in excess of such principal amount. This net share settlement feature of the notes would reduce our liquidity, and we may not have sufficient funds to pay in full the cash obligation upon such conversion. In the future, depending upon a variety of factors, we may need to raise additional funds through bank facilities, debt or equity offerings or other sources of capital. Any additional equity financing may be dilutive to stockholders, and debt financing, if available, may involve covenants that restrict us. Additional funding may not be available when needed or on terms acceptable to us. If we are unable to obtain additional capital, we may be required to delay, reduce the scope of or eliminate our research and development programs or reduce our sales and marketing activities. The convertible senior notes are classified as current liabilities at December 31, 2010 as the notes are convertible at the option of the holder from the period beginning December 15, 2011 and ending February 15, 2012. See Note 9 – Convertible Senior Notes.
65
Table of Contents
2. Summary of Significant Accounting Policies
Use of Estimates
The preparation of financial statements in conformity with accounting principles generally accepted in the United States requires us to make estimates and assumptions that affect the reported amounts of assets and liabilities and disclosure of contingent assets and liabilities at the date of the financial statements and the reported amounts of revenues and expenses during the reporting period. The primary estimates underlying our financial statements include the write-off of obsolete and slow moving inventory, allowance for doubtful accounts receivable, product warranty, assumptions regarding variables used in calculating the fair value of our equity awards, impairment of goodwill, intangibles and other long-lived assets, income taxes and contingent liabilities. Actual results could differ from those estimates.
Principles of Consolidation
The consolidated financial statements include the accounts of the Company and its wholly-owned subsidiaries. All significant intercompany accounts and transactions have been eliminated.
Functional Currency
In January 2008, we acquired SAS, which sells to customers throughout Europe. Sales by SAS are denominated in Euros. In December 2008, we incorporated CML as our United Kingdom subsidiary. In preparing our consolidated financial statements, we are required to translate the financial statements of SAS and CML from the currency in which they keep their accounting records into U.S. Dollars. SAS and CML both maintain their accounting records in the functional currency which is also their local currency. The functional currency of CML is the British Pound and the functional currency of SAS is the Euro. The functional currency is determined based on management’s judgment and involves consideration of all relevant economic facts and circumstances affecting the subsidiary. Generally, the currency in which the subsidiary transacts a majority of its transactions, including billing, financing, payroll and other expenditures would be considered the functional currency, but any dependency upon the parent and the nature of the subsidiary’s operations must also be considered. Since the functional currency of SAS and CML has been determined to be their local currency, any gain or loss associated with the translation of SAS’s and CML’s financial statements into U.S. Dollars is included as a component of stockholders’ equity, in accumulated other comprehensive loss. If in the future we determine that there has been a change in the functional currency of SAS or CML from its local currency to the U.S. Dollar, any translation gains or losses arising after the date of change would be included within our statement of operations.
Goodwill and Other Intangible Assets
Goodwill represents the excess of the purchase price paid over the fair value of tangible and identifiable intangible net assets acquired in business combinations. Under Accounting Standards Codification (“ASC”) ASC 350 Intangibles – Goodwill and Other, goodwill and other intangible assets with indefinite lives are not amortized, but are assigned to reporting units and tested for impairment annually, or whenever there is an impairment indicator. We assess goodwill impairment indicators annually or more frequently, if a change in circumstances or the occurrence of events suggests the remaining value may not be recoverable. Intangible assets that are not deemed to have an indefinite life are amortized over their estimated useful lives.
The first step of the impairment test for goodwill compares the fair value of a reporting unit with its book value, including goodwill and other indefinite lived intangible assets. If the fair value is less than the book value, the second step determines the amount of the impairment by comparing the implied fair value of the goodwill with the book value of that goodwill. An impairment charge is recognized only when the calculated fair value of a reporting unit, including goodwill and indefinite lived intangible assets, is less than its book value.
66
Table of Contents
We have one segment as operating results are reviewed by our Chief Operating Decision Maker, who is our Chief Executive Officer. He allocates resources and assesses performance at the consolidated level. In addition, we do not provide discrete financial information for the SAS business in regards to overall financial performance review. We have recorded the goodwill on the books of SAS as part of purchase accounting. We evaluated the impairment of goodwill at the SAS entity level and concluded that no impairment exists. (See Note 5 – Goodwill and Intangible Assets.)
Other intangible assets include patents, customer relationships, license agreements and non-compete agreements. The patents include the patents acquired in 2009 in connection with our purchase of intellectual property assets from Ovion Inc. They are amortized using the straight-line method over their respective estimated useful lives.
Impairment of Long-Lived Assets
We account for the impairment of long-lived assets in accordance with ASC 360 Property, Plant and Equipment. We evaluate the carrying value of our long-lived assets, consisting primarily of our property and equipment, the patents acquired in connection with our purchase of the intellectual property assets from Ovion Inc, and intangible assets acquired in connection with our acquisition of SAS, whenever certain events or changes in circumstances indicate that the carrying amount of the assets may not be recoverable (see Note 5 – Goodwill and Intangible Assets). Such events or circumstances include a prolonged industry downturn, a significant decline in our market value or significant reductions in projected future cash flows.
Significant judgments and assumptions are required in the forecast of future operating results used in the preparation of the estimated future cash flows, including profit margins, long-term forecasts of the amounts and timing of overall market growth and our percentage of that market, groupings of assets, discount rates and terminal growth rates. In addition, significant estimates and assumptions are required in the determination of the fair value of our tangible long-lived assets, including replacement cost, economic obsolescence, and the value that could be realized in orderly liquidation. Changes in these estimates could have a material adverse effect on the assessment of our long-lived assets, thereby requiring us to write down the assets. Our net long-lived assets as of December 31, 2010 and 2009 included property and equipment of $10.1 million, and $9.8 million, respectively, and other identifiable intangible assets of $24.1 million, and $27.7 million, respectively.
Concentration of Credit Risk and Other Risks and Uncertainties
Our net sales to date are primarily comprised of the sale of our Essure system and consist mainly of product revenues from physicians, hospitals and distributors located worldwide. We do not require collateral and provide for estimated credit losses based on customer credit assessment.
We assess the credit worthiness of our customers on an ongoing basis in order to mitigate the risk of loss from customers not paying us. However, we account for the possibility that certain customers may not pay us by maintaining an allowance for doubtful accounts. We perform ongoing credit evaluations of our customers and adjust credit limits based upon payment history and the customer’s current credit worthiness, as determined by our review of their current credit information. We monitor collections and payments from our customers and maintain our allowance for doubtful accounts based upon our historical experience and any specific customer collection issues that we have identified. As of December 31, 2010 and 2009, our allowance for doubtful accounts totaled approximately $0.8 million and $0.6 million, respectively.
For the years ended December 31, 2010, 2009 and 2008 we had no customers that accounted for greater than 10% of our net sales. No customers had an outstanding accounts receivable balance greater than 10% of our total gross outstanding accounts receivable as of December 31, 2010. One customer accounted for 11% of our total gross outstanding accounts receivable as of December 31, 2009.
67
Table of Contents
We currently use one manufacturer for our product. This manufacturer has significant access capacity to accommodate increased manufacturing needs of the Essure product. Our manufacturer may encounter problems during manufacturing due to variety of reasons. The inability to obtain products as required or to develop alternative manufacturing sources, if and as required in the future, could result in delays or reductions in product shipments, which could have a material adverse effect on our business, financial condition, results of operations and cash flows.
We are subject to risks characteristic of the medical device industry, including but not limited to uncertainty of market acceptance of products, reimbursement from insurance carriers and government agencies, compliance with government regulations and protection of proprietary technology, product liability and the need to obtain additional financing. Certain components that meet our requirements are available only from a limited number of suppliers. The rapid rate of technological change and the necessity of developing and manufacturing products with short life cycles may intensify these risks. The inability to obtain components as required or to develop alternative sources, if and as required in the future, could result in delays or reductions in product shipments, which could have a material adverse effect on our business, financial condition, results of operations and cash flows.
Cash, Cash Equivalents, and Investments
We consider all highly liquid investments with maturity from date of purchase of three months or less to be cash equivalents. We maintain deposits with four financial institutions and invest our excess cash primarily in money market funds, commercial paper, corporate notes, time deposits, U.S. treasury bills, U.S. government bonds and corporate bonds which bear minimal risk. Our cash and cash equivalents in our operating and investment accounts are with third party financial institutions. At times, these balances exceed the Federal Deposit Insurance Corporation insurance limits. While we monitor the cash balances in our operating and investment accounts and adjust the cash balances as appropriate, these cash balances could be impacted if the underlying financial institutions fail or are subject to other adverse conditions in the financial markets. To date we have experienced no loss or lack of access to cash in our operating and investments accounts. At December 31, 2010 we had short and long-term investments of $72.5 million recorded at fair value. In addition we had cash and cash equivalents of $18.4 million at December 31, 2010. At December 31, 2010 we held no auction rate securities, or (“ARS”). See Note 3 – Investment.
At December 31, 2009 we had held $43.6 million (par value) in ARS, backed by federal and state student loans which were variable rate debt instruments and bear interest rates that reset approximately every 20-30 days. These ARS had a contractual maturity ranging from 2028 through 2047. Our ARS were short-term debt instruments backed by student loans, a substantial portion of which were guaranteed by the United States government.
Inventories
Inventories are stated at the lower of cost or market. Cost is based on actual costs computed on a first-in, first-out basis. Write-offs for potentially excess and obsolete inventory are made based on our analysis of inventory levels and future sales forecast.
Property and Equipment
Property and equipment are stated at cost less accumulated depreciation and amortization. Depreciation and amortization of property and equipment are calculated using the straight-line method over the estimated useful lives of the respective assets as follows: certain computer equipment over 2 years; computer, software, office furniture, machinery and tooling are over 3 years; rental equipment and other equipment are over 5 years. Leasehold improvements are amortized over the lesser of the lease term or 5 years.
68
Table of Contents
Fair Value of Financial Instruments
For financial instruments consisting of cash and cash equivalents, short and long-term investments, accounts receivable, accounts payable, and accrued liabilities included in our financial statements, the carrying amounts approximate fair value due to their respective maturities.
Warranty
We offer warranties on our product and record a liability for the estimated future costs associated with warranty claims, which is based upon historical experience and our estimate of the level of future costs. Warranty costs are reflected in the statement of operations as a cost of goods sold. A reconciliation of the changes in our warranty liability for the years ended December 31, 2010 and 2009 (in thousands):
| As of December 31, |
||||||||
| 2010 | 2009 | |||||||
| Balance at the beginning of the period |
$ | 277 | $ | 272 | ||||
| Accruals for warranties issued during the period |
667 | 478 | ||||||
| Settlements made in kind during the period |
(611 | ) | (473 | ) | ||||
| Balance at the end of the period |
$ | 333 | $ | 277 | ||||
Revenue Recognition
Our revenue is primarily comprised of the sale of our Essure system. We recognize revenue in accordance with ASC 605 Revenue Recognition. Under this standard, the following four criteria must be met in order to recognize revenue:
| • | Persuasive evidence of an arrangement exists; |
| • | Delivery has occurred; |
| • | Our selling price is fixed or determinable; and |
| • | Collectability is reasonably assured. |
The four revenue recognition criteria are applied to our sales as described in the following paragraphs.
We recognize revenues from our Essure system when title to the product and the risk of loss transfers to an external customer. We do not accept returns of the Essure system. We obtain written authorizations from our customers for a specified amount of product at a specified price and the price is not dependent on actual Essure procedures performed.
For sales through distributors we recognize revenues from our Essure system when title to the product and the risk of loss transfers to the distributor. Our distributors are responsible for all marketing, sales, training and warranty for the Essure system in their respective territories. Our standard terms and conditions do not provide price protection or stock rotation rights to any of our distributors. In addition, our distributor agreements do not allow the distributor to return or exchange the Essure system and the distributor is obligated to pay us for the sale regardless of their ability to resell the product.
Additionally, we require physicians to be preceptored between 3 and 5 cases by a certified trainer before being able to perform the procedure independently. There are no revenues associated with the training activities. We do not charge a fee for the activity and no commitment arises for the physician from the preceptorship. Physician training is provided upfront and we have no obligation subsequent to the initial training. Training obligations have not been significant from inception to-date.
69
Table of Contents
We assess the credit worthiness of all customers in connection with their purchases. We only recognize revenue when collectability is reasonably assured.
Certain sales of our Essure system may include delivery of additional items. These obligations may be fulfilled after shipment of the Essure system, and in these cases, we recognize revenue in accordance with the multiple element accounting guidance set forth in ASC 605-25 Revenue – Multiple- Element Arrangements. When we have objective and reliable evidence of fair value of the undelivered elements we defer revenue attributable to the post-shipment obligations and recognize such revenue when the obligation is fulfilled. Otherwise we defer all revenue until all elements are delivered.
Research and Development
Research and development expenses reflect clinical expenditures and product development, which are substantially related to the ongoing development and associated regulatory approvals of our technology. Research and development costs are expensed as incurred.
Advertising Costs
Advertising production costs are recorded as expense as incurred. Costs of communicating advertising are recorded as expense as advertising space or airtime is used. All other advertising costs are expensed as incurred. Total advertising expenses were approximately $9.9 million, $10.4 million, and $7.2 million in the years ended December 31, 2010, 2009, and 2008, respectively.
Reclassifications
Certain amounts in prior fiscal years have been reclassified to conform with the presentation adopted in the current fiscal year.
Stock-Based Compensation
Net income (loss) for the years ended December 31, 2010, 2009, and 2008 included stock-based compensation expense of approximately $7.2 million, $6.3 million, and $5.7 million, respectively.
Approximately $6.0 million, $5.4 million, and $4.8 million, respectively, of stock based compensation expense under ASC 718, Compensation – Stock Compensation (“ASC 718”) relates to employee stock options, employee stock purchase plan and stock appreciation rights. In addition, approximately $1.1 million, $0.8 million, and $0.7 million, respectively, of stock based compensation expense relates to employee restricted stock and restricted stock units. Stock-based compensation cost is measured at grant date, based on the fair value of the award, and is recognized on a straight line basis as expense over the employee requisite service period, which is generally the vesting period. In addition we recorded stock based compensation expense for awards to consultants as described in the following paragraph.
Awards to consultants: During the fiscal year ended December 31, 2010 and 2008, we did not grant stock awards to consultants. During the fiscal year ended December 31, 2009, we granted a total of 30,000 stock appreciation rights to two consultants. Stock-based compensation arrangements to non-employees are accounted for in accordance with ASC 505-50 Equity Based Payments to Non-Employees, which requires that these equity instruments are recorded at their fair value on the measurement date. The measurement of stock-based compensation is subject to adjustment as the underlying equity instruments vest. We re-measure the fair value of the options as they vest and recognize changes in fair value as expense in the period. We recorded stock based compensation expense of approximately $0.1 million during each of the years ended December 31, 2010 and 2009, and approximately $0.2 million during the year ended December 31, 2008 in connection with our grants to consultants.
70
Table of Contents
We recorded zero, $18 thousand, and zero, respectively for tax benefit from stock-based compensation in 2010, 2009 and 2008.
Stock Options and Stock Appreciation Rights: During the year ended December 31, 2010, we granted 497,500 stock appreciation rights to employees, with an estimated total grant-date fair value of approximately $4.1 million and a grant date weighted-average fair value of $8.31 per share.
As of December 31, 2010, there was $9.0 million of unrecognized stock-based compensation cost related to stock options and stock appreciation rights. This cost is expected to be recognized over a weighted-average remaining amortization period of 2.4 years.
During the year ended December 31, 2009, we granted 1,300,653 stock appreciation rights to employees, with an estimated total grant-date fair value of approximately $7.6 million and a grant date weighted-average fair value of $5.85 per share.
Employee Stock Purchase Plan (ESPP): The compensation cost in connection with the ESPP for the year ended December 31, 2010 was approximately $0.3 million. The grant date weighted-average fair value was $5.00 per share. The compensation cost in connection with the ESPP for the year ended December 31, 2009 was approximately $0.4 million. The grant date weighted-average fair value was $5.51 per share.
Restricted Stock Units: During the year ended December 31, 2010 we granted 170,186 restricted stock units, with an estimated total grant date fair value of approximately $3.0 million and a grant date weighted average fair value of $17.84. During the year ended December 31, 2009 we granted 84,634 restricted stock units, with an estimated total grant date fair value of approximately $1.0 million and a grant date weighted average fair value of $12.15. This stock compensation is being recorded as compensation expense on a straight-line basis over the vesting periods of the underlying stock awards.
As of December 31, 2010, there was $2.8 million of unrecognized stock-based compensation related to nonvested restricted stock awards and restricted stock units. This cost is expected to be recognized over a weighted-average amortization period of 3.1 years.
The following table sets forth the total stock-based compensation expense resulting from stock options, stock awards, non-employee stock options, stock appreciation rights and the Employee Stock Purchase Plan included in the Consolidated Statements of Operations (in thousands):
| Years Ended December 31, | ||||||||||||
| 2010 | 2009 | 2008 | ||||||||||
| Cost of goods sold |
$ | 86 | $ | 61 | $ | 46 | ||||||
| Research and development |
357 | 217 | 238 | |||||||||
| Selling, general and administrative |
6,803 | 6,004 | 5,383 | |||||||||
| Total stock-based compensation expense |
$ | 7,246 | $ | 6,282 | $ | 5,667 | ||||||
71
Table of Contents
Valuation assumptions
The fair value of stock-based awards was estimated using the Black-Scholes model with the following weighted-average assumptions for the years ended December 31, 2010, 2009 and 2008:
| 2010 | Years Ended December
31, 2009 |
2008 | ||||||||||||||||||||||
| Stock Option and Stock Appreciation Right Plans |
Employee Stock Purchase Plan |
Stock Option and Stock Appreciation Right Plans |
Employee Stock Purchase Plan |
Stock Option and Stock Appreciation Right Plans |
Employee Stock Purchase Plan |
|||||||||||||||||||
| Expected term (in years) |
4.15 | 0.50 | 4.34 | 0.72 | 4.55 | 0.50 | ||||||||||||||||||
| Average risk-free interest rate |
1.97 | % | 0.23 | % | 1.76 | % | 0.41 | % | 2.73 | % | 2.01 | % | ||||||||||||
| Average volatility factor |
51.4 | % | 50.9 | % | 51.8 | % | 71.0 | % | 47.3 | % | 42.7 | % | ||||||||||||
| Dividend yield |
— | — | — | — | — | — | ||||||||||||||||||
Expected Term: Our expected term represents the period for which our stock-based awards are expected to be outstanding and was determined based on historical experience of similar awards, giving consideration to the contractual terms of the stock-based awards and vesting schedules.
Expected Volatility: We used historical volatility based on the expected term of the awards, which is consistent with our assessment that the historical volatility for such period is more representative of future stock price trends than any other type of volatility.
Expected Dividends: We have not paid and do not anticipate paying any dividends in the near future.
Risk-Free Interest Rate: We base the risk-free interest rate on the U.S. Treasury yield curve in effect at the time of grant based on the expected term of the underlying option.
As stock-based compensation expense recognized in the Consolidated Statement of Operations is based on awards ultimately expected to vest, it has been reduced for estimated forfeitures. ASC 718 requires forfeitures to be estimated at the time of grant and revised, if necessary, in subsequent periods if actual forfeitures differ from those estimates. Forfeitures were estimated based on historical experience.
Refer to Note 11 – Incentive and Stock Plans, for a description of our awards.
Income Taxes
In preparing our consolidated financial statements we are required to estimate our income taxes in each of the jurisdictions in which we operate. This process involves us estimating our actual current tax exposure together with assessing temporary differences resulting from differing treatment of items for tax and accounting purposes. These differences result in deferred tax assets and liabilities, which are included within our consolidated balance sheet. We must then assess the likelihood that our deferred tax assets will be recovered from future taxable income and the extent we believe that recovery is not likely, we must establish a valuation allowance. To the extent we establish a valuation allowance or increase this allowance in a period, we must include an expense within the tax provision in the statement of operations.
As of December 31, 2010, we had total net deferred tax assets of $77.7 million consisting primarily of favorable temporary differences and net operating loss carryforwards. In the fourth quarter of 2010, based on historical cumulative and expected levels of profitability, we released our valuation allowance associated with our US Federal deferred tax assets and a portion of our state deferred tax assets which resulted in an income tax benefit of $80.7 million in our results of operations for this period.
We believe that our U.S. operations had achieved a sufficient level of profitability and will sustain a sufficient level of profitability in 2011 and beyond to support the release of the valuation allowance based on
72
Table of Contents
current facts and circumstances. However, if our assumptions on the future performance for our U.S. operations prove to be incorrect and was not able to sustain a sufficient level of profitability to support the associated deferred tax assets on our balance sheet, we will have to impair our deferred tax assets through an additional valuation allowance, which would impact our financial position and results of operations in the period such a determination is made.
Our remaining valuation allowance as of December 31, 2010 relates to California net operating loss carryforwards that are projected to expire prior to utilization. If we release our remaining valuation allowance, it will have an impact to our financial position and results of operations in the periods such determination is made. We will continue to assess the need for our valuation allowances in the future.
Net Income (Loss) per Share
Basic net income (loss) per share excludes any potential dilutive effects of options, unvested restricted shares and restricted stock units and common stock shares subject to repurchase. Diluted net income per share includes the impact of potentially dilutive securities. In net loss periods presented, basic and diluted net loss per share are both computed using the weighted average number of common shares outstanding.
The following table provides a reconciliation of weighted-average number of common shares outstanding to the weighted-average number of common shares outstanding used in computing basic and diluted net income (loss) per common share (in thousands):
| 2010 | 2009 | 2008 (a) | ||||||||||
| Numerator: |
||||||||||||
| Numerator for diluted earnings per share - |
||||||||||||
| Net income (loss) available to common stockholders |
$ | 81,991 | $ | 7,945 | $ | (3,886 | ) | |||||
| Denominator: |
||||||||||||
| Denominator for basic earnings per share - |
||||||||||||
| Weighted-average number of common shares outstanding |
31,031 | 30,574 | 30,226 | |||||||||
| Less: weighted-average unvested restricted common shares |
— | 2 | 10 | |||||||||
| Weighted-average number common shares outstanding used in share computing basic net income (loss) per common share |
31,031 | 30,572 | 30,216 | |||||||||
| Effect of dilutive securities: |
||||||||||||
| Diluted options and stock appreciation rights |
612 | 642 | — | |||||||||
| Diluted stock awards |
39 | 38 | — | |||||||||
| Weighted-average number of common shares outstanding used in computing basic and dilutive net income (loss) per common share |
31,682 | 31,252 | 30,216 | |||||||||
| (a) | Adjusted for the retrospective adoption of ASC 470-20. |
The following outstanding equity awards and securities, which could potentially dilute basic net income (loss) per share in the future were excluded from the computation of diluted net income (loss) per share, as their effect would have been antidilutive (in thousands):
| At December 31, | ||||||||||||
| 2010 | 2009 | 2008 | ||||||||||
| Outstanding options and SARs |
2,540 | 1,944 | 4,234 | |||||||||
| Restricted stock |
— | — | 4 | |||||||||
| Restricted stock units |
— | — | 102 | |||||||||
| Warrants issued in connection with our convertible notes |
3,093 | 3,093 | 3,093 | |||||||||
| 5,633 | 5,037 | 7,433 | ||||||||||
73
Table of Contents
Our senior convertible notes were excluded from the diluted net income (loss) per share calculation in 2010, 2009 and 2008 because the conversion price was greater than the average market price of our stock during the period.
Segment Information and Sales by Geographic Region
We operate in one business segment, which encompasses all geographical regions. We use one measurement of profitability and do not segregate our business for internal reporting.
Net sales by geographic region, based on shipping location of our customer, are as follows (in thousands, except percentages):
| Years Ended December 31, | ||||||||||||
| 2010 | 2009 | 2008 | ||||||||||
| Net sales (in thousands) |
$ | 140,660 | $ | 131,407 | $ | 101,977 | ||||||
| United States of America |
78 | % | 79 | % | 79 | % | ||||||
| France |
13 | % | 13 | % | 13 | % | ||||||
| Europe |
7 | % | 7 | % | 7 | % | ||||||
| Other |
2 | % | 1 | % | 1 | % | ||||||
Comprehensive Income (Loss)
Comprehensive income (loss) generally represents all changes in stockholders’ equity except those resulting from investments or contributions by stockholders. Our comprehensive income (loss) consists of cumulative translation adjustments. A summary of the comprehensive income (loss) for the periods indicated is as follows (in thousands):
| Years Ended December 31 | ||||||||||||
| 2010 | 2009 | 2008 (a) | ||||||||||
| Net income (loss) |
$ | 81,991 | $ | 7,945 | $ | (3,886 | ) | |||||
| Other comprehensive loss |
||||||||||||
| Unrealized gain on investments |
61 | — | — | |||||||||
| Foreign currency translation adjustment, net of tax |
(1,409 | ) | (195 | ) | (798 | ) | ||||||
| Comprehensive income (loss) |
$ | 80,643 | $ | 7,750 | $ | (4,684 | ) | |||||
| (a) | Adjusted for the retrospective adoption of ASC 470-20. |
The balances of each component of accumulated other comprehensive income (loss), net of taxes, as of December 31, 2010, 2009 and 2008 consist of the following (in thousands):
| Unrealized Gain on Investments |
Foreign Currency Translation |
Accumulated Other Comprehensive Loss |
||||||||||
| Balance as of December 31, 2008 |
$ | — | $ | (798 | ) | $ | (798 | ) | ||||
| Net change during the twelve month period |
— | (195 | ) | (195 | ) | |||||||
| Balance as of December 31, 2009 |
— | (993 | ) | (993 | ) | |||||||
| Net change during the twelve month period |
61 | (1,409 | ) | (1,348 | ) | |||||||
| Balance as of December 31, 2010 |
$ | 61 | $ | (2,402 | ) | $ | (2,341 | ) | ||||
74
Table of Contents
Recent Accounting Pronouncements
In October 2009, the FASB amended the accounting standards for revenue recognition to remove tangible products containing software components and non-software components that function together to deliver the product’s essential functionality from the scope of the software revenue recognition guidance. The software revenue recognition guidance was issued to address factors that entities should consider when determining whether the software and non-software components of a product function together to deliver the product’s essential functionality. The software revenue recognition updates to the Codification will allow revenue arrangements in which software and non-software components deliver together a product’s essential functionality to follow the multiple-deliverable revenue recognition criteria as opposed to the criteria applicable to software revenue recognition.
In addition, the FASB also amended the accounting standards for multiple deliverable revenue arrangements to:
| • | provide updated guidance on whether multiple deliverables exist, how the deliverables in an arrangement should be separated, and how the consideration should be allocated; |
| • | require an entity to allocate revenue in an arrangement using estimated selling price (ESP) of deliverables if a vendor does not first have vendor-specific objective evidence (VSOE) of selling price or secondly does not have third-party evidence (TPE) of selling price; and |
| • | eliminate the use of the residual method and require an entity to allocate revenue using the relative selling price method. |
Multiple-element arrangements. A multiple-element arrangement includes the sale of one or more tangible product offerings with one or more associated services offerings, each of which are individually considered separate units of accounting. The determination of our units of accounting did not change with the adoption of the new revenue recognition guidance and as such we allocate revenue to each element in a multiple-element arrangement based upon the relative selling price of each deliverable. When applying the relative selling price method, we determine the selling price for each deliverable using VSOE of selling price, if it exists, or TPE of selling price. If neither VSOE nor TPE of selling price exist for a deliverable, we use its best estimate of selling price for that deliverable. Revenue allocated to each element is then recognized when the other revenue recognition criteria are met for each element.
Both the above mentioned updates are effective for us from January 1, 2011 and we have elected to apply them prospectively to new or materially modified revenue arrangements after its effective date. We do not expect the adoption of this guidance to have a material impact on its Consolidated Financial Statements and results of operations.
In January 2010, the Financial Accounting Standards Board (FASB) issued Accounting Standards Update (ASU) No. 2010-06, ASC 820 Fair Value Measurements and Disclosure Requirements, which updated guidance related to fair value measurements and disclosures, and requires a reporting entity to disclose separately the amounts of significant transfers in and out of Level 1 and Level 2 fair value measurements and describe the reasons for the transfers. In addition, in the reconciliation for fair value measurements using significant unobservable inputs, or Level 3, a reporting entity should disclose separately information about purchases, sales, issuances and settlements (that is, on a gross basis rather than one net number). The updated guidance also requires that and entity should provide fair value measurement disclosures for each class of assets and liabilities and disclosures about the valuation techniques and inputs used to measure fair value for both recurring and non-recurring fair value measurements for Level 2 and Level 3 fair value measurements. The updated guidance is effective for interim or annual financial reporting periods beginning after December 15, 2009, except for the disclosures about purchases, sales, issuances and settlements in the roll forward activity in Level 3 fair value measurements, which are effective for fiscal years beginning after December 15, 2010 and for interim periods within those fiscal years. We have adopted this guidance in the first quarter of 2010. See Note 4 – Fair Value Measurement in the Notes to Consolidated Financial Statements.
75
Table of Contents
In February 2010, the FASB issued ASU 2010-09, ASC 855 Amendments to Certain Recognition and Disclosure Requirements, which amended guidance on subsequent events. Under this amended guidance, SEC filers are no longer required to disclose the date through which subsequent events have been evaluated in originally issued and revised financial statements. We adopted this guidance in the first quarter of fiscal 2010 and the adoption did not have a material impact on our financial condition, results of operations, or cash flows.
During 2010, the FASB has issued several ASUs – ASU No. 2010-01 through ASU No. 2010-29. Except for ASUs discussed above, the ASUs entail technical corrections to existing guidance or affect guidance related to specialized industries or entities and therefore have minimal, if any, impact on us.
3. Investments
As of December 31, 2010 we had short and long-term investments of $72.5 million recorded at fair value. Our investments consist of time deposits, U.S. treasury bills, U.S. government bonds, commercial paper and corporate bonds. We will sell certain or all investments as needed to meet the cash flow needs of our business. Hence our investments are classified as available-for-sale securities in accordance with ASC 320 Investments – Debt and Equity Securities. Investments are classified as short-term or long-term based on the underlying investments maturity date.
During 2010, our investments included Auction Rate Securities (“ARS”) which were short-term debt instruments backed by student loans, a substantial portion of which were guaranteed by the United States government. Prior to 2008, our ARS were highly liquid, using a Dutch auction process that resets the applicable interest rate at predetermined intervals, typically every 20-30 days, to provide liquidity at par. We had experienced failed auctions since 2008 on most of our ARS. The failures of these auctions did not affect the value of the collateral underlying the ARS, and we continued to earn and receive interest on our ARS at a pre-determined formula with spreads tied to particular interest rate indexes.
In November 2008, we accepted an offer from UBS AG, providing us with rights related to our ARS (“the Rights”). The Rights permitted us to require UBS to purchase our ARS at par value, which is defined as the price equal to the liquidation preference of the ARS plus accrued but unpaid dividends or interest, at any time during the period of July 2010 through July 2012. Conversely, UBS had the right, in its discretion, to purchase or sell our ARS at any time until July 2012, so long as we received payment at par value upon any sale or disposition. So long as we held our ARS, they continued to accrue interest as determined by the auction process or the terms of the ARS if the auction process failed.
Prior to accepting the UBS offer, we recorded our ARS as available-for-sale investments. We recorded unrealized gains and losses on our available-for-sale securities in accumulated other comprehensive income (loss) in the stockholders’ equity section of our balance sheets. Such unrealized gains and losses did not change net income (loss) for the applicable accounting period. In connection with obtaining the put option, we transferred our ARS from available-for-sale to trading securities in accordance with ASC 320 Investments – Debt and Equity Securities. The transfer to trading securities reflected our intent to exercise our put option during the third quarter of 2010. Prior to our agreement with UBS, our intent was to hold our ARS until we realized the par value.
In July 2010, we exercised our put option to require UBS to repurchase our outstanding ARS at full par value. Accordingly, we had aggregate redemptions of our ARS in 2010 of $43.6 million. In addition, we recorded a gain in 2010 of $2.9 million, which represented the increase in the fair value of the ARS. As of December 31, 2010, we no longer hold these types of investments.
We have accounted for the Rights as a freestanding financial instrument and elected to record the value of the Rights under the fair value option of ASC 825 Financial Instruments. As a result of our election to record the Rights at fair value, unrealized gains and losses have been included in earnings. We estimated the fair value of
76
Table of Contents
the Rights using the expected value that we receive from UBS which was calculated as the difference between the anticipated recognized loss and par value of the ARS as of the option exercise date. This value was discounted by using a UBS credit default rate to account for the consideration of UBS credit risk. In 2010, we recorded an additional loss of $2.9 million, which represent the decrease in the fair value of the put option. Due to the exercise of the put option in July 2010 and the resulting redemption of the ARS the balance of Rights as of December 31, 2010 is zero.
The following table summarizes our amortized cost, unrealized gains and loss, and the fair value of our available-for-sale investments, as of December 31, 2010 (in thousands):
| Amortized Cost |
Unrealized Gain |
Unrealized Loss |
Fair Value | |||||||||||||
| Investments: |
||||||||||||||||
| Corporate bonds |
$ | 38,642 | $ | 96 | $ | (39 | ) | $ | 38,699 | |||||||
| U.S. treasury bills |
13,989 | 6 | — | 13,995 | ||||||||||||
| Commercial paper |
11,989 | — | — | 11,989 | ||||||||||||
| U.S. government bonds |
4,549 | 20 | (1 | ) | 4,568 | |||||||||||
| Time deposits |
3,273 | — | (22 | ) | 3,251 | |||||||||||
| Total |
$ | 72,442 | $ | 122 | $ | (62 | ) | $ | 72,502 | |||||||
| Reported as: |
||||||||||||||||
| Short-term investments |
$ | 59,366 | $ | 58 | $ | (26 | ) | $ | 59,398 | |||||||
| Long-term investments |
13,076 | 64 | (36 | ) | 13,104 | |||||||||||
| Total |
$ | 72,442 | $ | 122 | $ | (62 | ) | $ | 72,502 | |||||||
We had no such available-for-sale investments in 2009.
We had investments that were in an unrealized loss position as of December 31, 2010. We have determined that (i) we do not have the intent to sell any of these investments, and (ii) it is more likely than not that we will not be required to sell any of these investments before recovery of the entire amortized cost basis. We review our investments to identify and evaluate investments that have an indication of possible impairment. As of December 31, 2010, we anticipate that we will recover the entire carrying value of such investments and have determined that no other-than-temporary impairments associated with credit losses were required to be recognized during the twelve months ended December 31, 2010.
As of December 31, 2010 the weighted average number of days to maturity for our available-for-sale securities was 204 days, with the longest maturity date being December 2012.
The following table presents our available-for-sale investments that are in an unrealized loss position as of December 31, 2010 (in thousands):
| Less than 12 Months | 12 Months or Greater | Total | ||||||||||||||||||||||
| Fair Value |
Unrealized Loss |
Fair Value |
Unrealized Loss |
Fair Value |
Unrealized Loss |
|||||||||||||||||||
| Corporate bonds |
$ | 16,009 | $ | (24 | ) | $ | 1,838 | $ | (15 | ) | $ | 17,847 | $ | (39 | ) | |||||||||
| Time deposits |
1,244 | (1 | ) | 2,007 | (21 | ) | 3,251 | (22 | ) | |||||||||||||||
| U.S. government bonds |
504 | (1 | ) | — | — | 504 | (1 | ) | ||||||||||||||||
| $ | 17,757 | $ | (26 | ) | $ | 3,845 | $ | (36 | ) | $ | 21,602 | $ | (62 | ) | ||||||||||
77
Table of Contents
4. Fair Value Measurements
On January 1, 2008, we adopted the methods of fair value as described in ASC 820 Fair Value Measurement and Disclosure (“ASC 820”) to value our financial assets and liabilities. As defined in ASC 820, fair value is based on the price that would be received to sell an asset or paid to transfer a liability in an orderly transaction between market participants at the measurement date. In order to increase consistency and comparability in fair value measurements, ASC 820 establishes a fair value hierarchy that prioritizes observable and unobservable inputs used to measure fair value into three broad levels, which are described below:
Level 1: Quoted prices in active markets that are accessible at the measurement date for identical assets or liabilities. The fair value hierarchy gives the highest priority to Level 1 inputs.
Level 2: Observable prices that are based on inputs not quoted on active markets, but corroborated by market data.
Level 3: Unobservable inputs are used when little or no market data is available. The fair value hierarchy gives the lowest priority to Level 3 inputs.
Fair Value of Assets
Our cash and cash equivalents and investments are classified within Level 1 of the fair value hierarchy because they are valued using quoted market prices, broker or dealer quotations, or alternative pricing sources with a reasonable level of price transparency. As of December 31, 2010, our Level 1 instruments were investments in time deposits, money market funds, U.S. treasury bills, U.S. government bonds and corporate bonds.
Periodically, during the twelve months ended December 31, 2010 we entered into forward contracts to buy U.S dollars at fixed intervals in the retail market in an over-the-counter environment. As of December 31, 2010, we had foreign currency forward contracts to sell 4.4 million Euros in exchange for $5.9 million maturing in January 2011 through March 2011. As of December 31, 2010, these forward contracts are recorded at their fair value of $0.2 million in other current assets on our condensed consolidated balance sheet. We have outstanding short-term intercompany receivables of $5.9 million as of December 31, 2010. We expect the changes in the fair value of the intercompany receivables to be materially offset by the changes in the fair value of the forward contracts.
The purpose of these forward contracts is to minimize the risk associated with foreign exchange rate fluctuations. We have developed a foreign currency exchange policy to govern our forward contracts. These foreign currency forward contracts do not qualify as cash flow hedges and all changes in fair value are reported in earnings as part of other income and expenses. We have not entered into any other types of derivative financial instruments for trading or speculative purpose. Our foreign currency forward contracts valuation inputs are based on quoted prices and quoted pricing intervals from public data and do not involve management judgment. Accordingly, we have classified our outstanding foreign currency forward contracts within Level 2 of the fair value hierarchy and have recorded the fair value of the contracts in other current assets on our condensed consolidated balance sheet as of December 31, 2010.
78
Table of Contents
Assets measured at fair value on a recurring basis at December 31, 2010 are as follows (in thousands):
| Fair Value Measurements at Reporting Data | ||||||||||||||||
| December 31 2010 |
Quoted Price in Active Markets for Identical Instruments Level 1 |
Significant Other Observable Inputs Level 2 |
Significant Unobservable Inputs Level 3 |
|||||||||||||
| Assets: |
||||||||||||||||
| Cash equivalents: |
||||||||||||||||
| U.S. government bonds |
$ | 2,000 | $ | 2,000 | $ | — | $ | — | ||||||||
| Commercial paper |
2,000 | 2,000 | — | — | ||||||||||||
| Money market funds |
1,368 | 1,368 | — | — | ||||||||||||
| Available-for-sale investments: |
||||||||||||||||
| Corporate bonds |
38,699 | 38,699 | — | — | ||||||||||||
| U.S. treasury bills |
13,995 | 13,995 | — | — | ||||||||||||
| Commercial paper |
11,989 | — | 11,989 | — | ||||||||||||
| U.S. & Int’l government bonds |
4,568 | 4,568 | — | — | ||||||||||||
| Time deposits |
3,251 | 3,251 | — | — | ||||||||||||
| Foreign currency forward contract |
182 | — | 182 | — | ||||||||||||
| Total assets |
$ | 78,052 | $ | 65,881 | $ | 12,171 | $ | — | ||||||||
Assets measured at fair value on a recurring basis at December 31, 2009 are as follows (in thousands):
| Fair Value Measurements at Reporting Data | ||||||||||||||||
| December 31 2009 |
Quoted Price in Active Markets for Identical Instruments Level 1 |
Significant Other Observable Inputs Level 2 |
Significant Unobservable Inputs Level 3 |
|||||||||||||
| Assets: |
||||||||||||||||
| Money market funds |
$ | 54,884 | $ | 54,884 | $ | — | $ | — | ||||||||
| Auction rate securities |
40,626 | — | — | 40,626 | ||||||||||||
| Put option |
2,933 | — | — | 2,933 | ||||||||||||
| Foreign currency forward contract |
145 | — | 145 | — | ||||||||||||
| Total assets |
$ | 98,588 | $ | 54,884 | $ | 145 | $ | 43,559 | ||||||||
The following table presents a reconciliation of all assets and liabilities measured at fair value on a recurring basis, using significant unobservable inputs (Level 3) as of December 31, 2010 (in thousands):
| Put Option | Auction Rate Securities |
Total | ||||||||||
| Balance at December 31, 2008 |
$ | 5,144 | $ | 43,177 | $ | 48,321 | ||||||
| Sales of auction rate securities, at par value |
— | (4,875 | ) | (4,875 | ) | |||||||
| Gain on auction rate securities |
— | 2,324 | 2,324 | |||||||||
| Loss on put option |
(2,211 | ) | — | (2,211 | ) | |||||||
| Balance at December 31, 2009 |
$ | 2,933 | $ | 40,626 | $ | 43,559 | ||||||
| Sales of auction rate securities, at par value |
— | (43,575 | ) | (43,575 | ) | |||||||
| Gain on auction rate securities |
— | 2,949 | 2,949 | |||||||||
| Loss on put option |
(2,933 | ) | — | (2,933 | ) | |||||||
| Balance at December 31, 2010 |
$ | — | $ | — | $ | — | ||||||
79
Table of Contents
For more information regarding our auction rate securities, see Note 3 – Investments.
Fair Value of Liabilities
The fair value of the Convertible Senior Notes (see Note 9 – Convertible Senior Notes) was estimated using quoted market prices. Accordingly, we have classified our convertible senior notes within Level 1 of the fair value hierarchy and have recorded the carrying value of the notes in current liabilities on our condensed consolidated balance sheet as of December 31, 2010 and as long-term liabilities as of December 31, 2009.
The following table summarizes the principal outstanding and estimated fair values of our debt (in thousands):
| December 31, 2010 | December 31, 2009 | |||||||||||||||
| Carrying Value | Fair Value | Carrying Value | Fair Value | |||||||||||||
| Convertible senior notes |
$ | 80,960 | $ | 85,086 | $ | 76,531 | $ | 81,075 | ||||||||
The convertible senior notes are classified as current liabilities at December 31, 2010 as the note is convertible at the option of the holder starting December 15, 2011.
5. Goodwill and Intangible Assets
In January, 2008, we acquired all of the outstanding shares of SAS. Our consolidated financial statements include the financial results of SAS beginning from the acquisition date of January 7, 2008.
In September 2009, we entered into an Asset Purchase Agreement (the “Purchase Agreement”) with American Medical Systems, Inc. (“AMS”) pursuant to which we acquired the intangible intellectual property assets, including patents and licenses, (“the assets”) of Ovion Inc. (“Ovion”), a wholly owned subsidiary of AMS. In connection with this purchase, we were released from any and all current and future royalty obligations under such licenses.
As consideration for the assets acquired in the purchase agreement, we paid to AMS $23.6 million in cash plus $0.1 million in direct cost to acquire the assets. The purchase agreement contains customary representations, warranties and covenants, as well as a covenant from AMS that it will not compete with us in the field of permanent female sterilization for a period of five years and that it will not engage in the research, development, manufacture or sale of permanent female sterilization products consisting of a stent-like device delivered transcervically using a catheter for an additional four-year period. The purchase agreement also contains mutual indemnification obligations for, among other things, breach of any representation, warranty or covenant in the purchase agreement. We did not acquire any employees, tangible assets or processes from AMS. These assets do not represent a purchase of a business but rather, a purchase of intangible assets. These assets are capitalized and are being amortized over a period of nine years, the estimated useful life of the intangible assets.
We have one segment as operating results are reviewed by our Chief Operating Decision Maker, who is our Chief Executive Officer. He allocates resources and assesses performance at the consolidated level. In addition, we do not provide discrete financial information for the SAS business in regards to overall financial performance review. We have recorded the goodwill on the books of SAS as part of purchase accounting. We evaluated the impairment of goodwill at the SAS entity level and concluded that no impairment exists.
ASC 350-20 states that the fair value of an asset is the amount at which the asset could be bought or sold in a current transaction between willing parties, other than in a forced liquidation sale.
The fair value of the SAS entity was determined by using the “Income Approach”, specifically a discounted cash flow analysis (“DCF”), and the key assumptions that drive the fair value in this model are the weighted
80
Table of Contents
average cost of capital (“WACC”), terminal values, growth rates, and the amount and timing of the estimated future cash flows. If the current economic environment were to deteriorate, this would likely result in a higher WACC because market participants would require a higher rate of return. In the DCF as the WACC increases, the fair value decreases. The other significant factor is the DCF in the projected financial information (for example, amount and timing of estimated future cash flows and growth rates) and if these assumptions were to be adversely impacted, this could result in a reduction of the fair value of SAS. We calculated the fair value of SAS at December 31, 2010 to significantly exceed book value.
The book value of SAS (including Euro 12.1 million of Goodwill) at December 31, 2010 was Euro 14.1 million. In addition we concluded that no other assets of SAS, under applicable GAAP, would be considered impaired so we used the full book value. Additionally, we do not believe we have encountered a “triggering event” during 2010 that would lead us to believe that we have impairment issues.
At December 31, 2010 the fair value was greater than the book value of SAS; hence no impairment charges were recorded.
The changes in carrying amount of goodwill for the twelve months ended December 31, 2010 and 2009 are as follows (in thousands):
| Years Ended December 31, | ||||||||
| (in thousands) |
2010 | 2009 | ||||||
| Goodwill, beginning of period |
$ | 17,318 | $ | 17,105 | ||||
| Effect of currency translation |
(1,305 | ) | 213 | |||||
| Goodwill, end of period |
$ | 16,013 | $ | 17,318 | ||||
The following table provides additional information concerning intangible assets (in thousands):
| December 31, 2010 | ||||||||||||||||||||
| (in thousands) |
Weighted avg remaining life (years) |
Gross carrying amount |
Accumulated amortization |
Effect of currency translation |
Net book value |
|||||||||||||||
| Patents and Licenses |
7.7 | $ | 25,750 | $ | (4,625 | ) | $ | — | $ | 21,125 | ||||||||||
| Customer relationships |
6.0 | 5,024 | (1,587 | ) | (417 | ) | 3,020 | |||||||||||||
| Covenant not to compete |
0.0 | 71 | (67 | ) | (4 | ) | — | |||||||||||||
| Total intangibles |
$ | 30,845 | $ | (6,279 | ) | $ | (421 | ) | $ | 24,145 | ||||||||||
| December 31, 2009 | ||||||||||||||||||||
| (in thousands) |
Weighted avg remaining life (years) |
Gross carrying amount |
Accumulated amortization |
Effect of currency translation |
Net book value |
|||||||||||||||
| Patents and Licenses |
8.7 | $ | 25,750 | $ | (1,896 | ) | $ | — | $ | 23,854 | ||||||||||
| Customer relationships |
7.0 | 5,024 | (1,084 | ) | (131 | ) | 3,809 | |||||||||||||
| Covenant not to compete |
1.0 | 71 | (45 | ) | (2 | ) | 24 | |||||||||||||
| Total intangibles |
$ | 30,845 | $ | (3,025 | ) | $ | (133 | ) | $ | 27,687 | ||||||||||
Intangible assets are being amortized over straight-line periods ranging from 3 to 9 years.
81
Table of Contents
The following discloses expected aggregate amortization expense for currently-owned intangible assets (in thousands) for 2011 through 2018:
| Year |
Expected | |||
| 2011 |
$ | 3,231 | ||
| 2012 |
3,227 | |||
| 2013 |
3,227 | |||
| 2014 |
3,227 | |||
| 2015 |
3,227 | |||
| Thereafter |
8,006 | |||
6. Inventories
The components of inventories consist of the following (in thousands):
| December 31, | ||||||||
| 2010 | 2009 | |||||||
| Raw materials |
$ | 5 | $ | 92 | ||||
| Work-in-progress |
795 | 1,577 | ||||||
| Finished goods |
2,115 | 3,239 | ||||||
| Total |
$ | 2,915 | $ | 4,908 | ||||
7. Property and Equipment
The components of property and equipment consist of the following (in thousands):
| December 31, | ||||||||
| 2010 | 2009 | |||||||
| Equipment, tooling, furniture and fixtures |
$ | 14,679 | $ | 13,199 | ||||
| Software |
$ | 3,312 | 2,680 | |||||
| Leasehold improvements |
$ | 1,415 | 1,281 | |||||
| Machinery |
$ | 2,389 | 1,390 | |||||
| $ | 21,795 | 18,550 | ||||||
| Less: accumulated depreciation and amortization |
$ | (11,733 | ) | (8,768 | ) | |||
| Property and equipment, net |
$ | 10,062 | $ | 9,782 | ||||
Property and equipment depreciation and amortization expenses for the years 2010, 2009 and 2008 were approximately $4.7 million, $4.1 million and $2.9 million, respectively.
8. Commitments and Contingencies
Leases
We are headquartered in Mountain View, California where we lease a building occupying approximately 58,242 square feet of office, research and development and manufacturing space. This lease commenced in July 2009 and will terminate in July 2013. We are recognizing the rent expense on a straight-line basis over the life of the lease. In connection with this lease we were required to open a long term restricted CD account for $0.4 million, which is classified as “restricted cash” on our balance sheet. This restricted cash account earns a nominal interest rate.
With the acquisition of SAS on January 2008 we assumed a lease of 1,938 square foot sales office located in Versailles, France. This lease expires on March 2011. On February 2009 we entered into a new lease agreement
82
Table of Contents
for a 4,703 square foot office space in Versailles, France for SAS, and moved into this new building. The lease for the new building at SAS will expire on February 2018. During 2010 we subleased the vacated property to a third party on a month to month basis.
In addition to the lease agreements for facilities we have certain operating leases on automobiles and copiers worldwide. These leases have terms expiring from January 2011 through February 2018. Expenses for all leases were approximately $3.5 million, $2.9 million and $2.3 million for the years ended December 31, 2010, 2009, and 2008 respectively.
Aggregate future minimum annual lease commitments under all leases are as follows (in thousands):
| 2011 |
$ | 1,903 | ||
| 2012 |
1,798 | |||
| 2013 |
1,133 | |||
| 2014 |
204 | |||
| 2015 |
153 | |||
| Thereafter |
346 | |||
| Total operating lease obligations |
$ | 5,537 | ||
Commitments
We enter into standard indemnification arrangements in the ordinary course of business. Pursuant to these arrangements, we indemnify, hold harmless and agree to reimburse the indemnified parties for losses suffered or incurred by the indemnified party, generally the business partners or customers, in connection with any trade secret, copyright, patent or other intellectual property infringement claim by any third party with respect to our products. The term of these indemnification agreements is generally perpetual after the execution of the agreement. The maximum potential amount of future payments we could be required to make under these agreements is not determinable. We have never incurred costs to defend lawsuits or settle claims related to these indemnification agreements. As a result, we believe the estimated fair value of these agreements is minimal.
We have entered into indemnification agreements with our directors and officers that may require us to indemnify our directors and officers against liabilities that may arise by reason of their status or service as directors or officers, other than liabilities arising from willful misconduct of a culpable nature; to advance their expenses incurred as a result of any proceeding against them as to which they could be indemnified; and to make good faith determination whether or not it is practicable for us to obtain directors and officers insurance. We currently have directors and officers insurance. At December 31, 2010 we had no material outstanding commitments.
Contingencies
From time to time, we may have certain contingent liabilities that arise in the ordinary course of our business activities. We account for contingent liabilities when it is probable that future expenditures will be made and such expenditures can be reasonable estimated. At December 31, 2010 we had no material outstanding contingencies.
9. Convertible Senior Notes
In February 2007, we issued an aggregate principal amount of $86.3 million of our 2.25% convertible senior notes due 2027. These notes bear a 2.25% interest per annum on the principal amount, payable semiannually in arrears on February 15 and August 15 of each year, beginning on August 15, 2007.
83
Table of Contents
The notes will mature on February 15, 2027, unless earlier redeemed, repurchased or purchased by us or converted, and are convertible into cash and, if applicable, shares of our common stock based on an initial conversion rate, subject to adjustment, of 35.8616 shares per $1,000 principal amount of notes (which represents an initial conversion price of approximately $27.89 per share), in certain circumstances. Upon conversion, a holder would receive cash up to the principal amount of the note and our common stock in respect of such note’s conversion value in excess of such principal amount. The notes are convertible only in the following circumstances: (1) if the closing sale price of our common stock exceeds 120% of the conversion price during a period as defined in the indenture; (2) if the average trading price per $1,000 principal amount of the notes is less than or equal to 97% of the average conversion value of the notes during a period as defined in the indenture; (3) upon the occurrence of specified corporate transactions; (4) if we call the notes for redemption and (5) at any time on or after December 15, 2011 up to and including February 15, 2012 and anytime on or after February 15, 2025. Upon a change in control or termination of trading, holders of the notes may require us to repurchase all or a portion of their notes for cash at a repurchase price equal to 100% of the principal amount, plus any accrued and unpaid interest. We may not have sufficient funds to pay the interest, purchase price, repurchase price or principal return when conversion is triggered or a note becomes payable under the above terms.
On or after February 15, 2012 we may redeem the notes in whole or in part at a redemption price in cash equal to 100% of the principal amount of the notes we redeem, plus any accrued and unpaid interest. On each of February 15, 2012, February 15, 2017 and February 15, 2022 holders may require us to purchase all or a portion of their notes at a purchase price in cash equal to 100% of the principal amount of the notes to be purchased, plus any accrued and unpaid interest. The convertible senior notes are classified as current liabilities at December 31, 2010 as the notes are convertible at the option of the holder during the period beginning December 15, 2011 and ending February 15, 2012.
We concluded that the embedded stock conversion option is not considered a derivative under ASC 815 Derivative and Hedging (“ASC 815”), because the embedded stock conversion option would be recorded in stockholders’ equity if it were a freestanding instrument.
In connection with the offering, we entered into convertible note hedge transactions with affiliates of the initial purchasers. These transactions are intended to reduce the potential dilution to our Company’s stockholders upon any future conversion of the notes. The call options, which cost an aggregate $19.4 million, were recorded as a reduction of additional paid-in capital. We also entered into warrant transactions concurrently with the offering, pursuant to which we sold warrants to purchase approximately 3.1 million shares of our common stock to the same counterparties that entered into the convertible note hedge transactions. The convertible note hedge and warrant transactions effectively increased the conversion price of the convertible notes to approximately $36.47 per share of our common stock. Proceeds received from the issuance of the warrants totaled approximately $10.7 million and were recorded as an addition to additional paid-in capital.
ASC 815 provides that contracts are initially classified as equity if (1) the contract requires physical settlement or net-share settlement, or (2) the contract gives the company a choice of net-cash settlement or settlement in its own shares (physical settlement or net-share settlement). The settlement terms of our purchased call options and sold warrant contracts require net-share settlement. Based on the guidance in ASC 815, the purchased call option contracts were recorded as a reduction of equity and the warrants were recorded as an addition to equity as of the trade date. ASC 815 states that a reporting entity shall not consider contracts to be derivative instruments if the contract issued or held by the reporting entity is both indexed to its own stock and classified in stockholders’ equity in its statement of financial position. We concluded the purchased call option contracts and the warrant contracts should be accounted for in stockholders’ equity.
Adoption of ASC 470-20
ASC 470-20 Debt with Conversion and Other Options (“ASC 470-20”), clarifies the accounting for convertible debt instruments that may be settled in cash upon conversion, including partial cash settlement. ASC 470-20 specifies that an issuer of such instruments should separately account for the liability and equity
84
Table of Contents
components of the instruments in a manner that reflect the issuer’s non-convertible debt borrowing rate which interest costs are recognized in subsequent periods. ASC 470-20 is effective for fiscal years beginning after December 15, 2008, and retrospective application is required for all periods presented. We adopted ASC 470-20 in the first quarter of fiscal 2009.
The effect of the adoption of ASC 470-20 was to bifurcate the debt and equity components of our convertible notes. The note payable principal balance at the date of issuance of $86.3 million in February 2007 was bifurcated into the debt component of $65.1 million and the equity component of $21.2 million. The difference between the note payable principal balance of $86.3 million and the $65.1 million value of the debt component is being accreted to interest expense over a period of 5 years, which is the expected term of our notes payable. We reclassified $0.8 million of debt issuance costs to additional paid in capital. The debt component was recognized at the present value of its cash flows discounted using a 5.51% discount rate, our borrowing rate at the date of the issuance of the Debenture for a similar debt instrument without the conversion feature.
Interest expense associated with the Convertible Senior Notes consisted of the following (in thousands):
| Years Ended December 31, | ||||||||||||
| 2010 | 2009 | 2008 (a) | ||||||||||
| Contractual coupon rate of interest |
$ | 1,941 | $ | 1,941 | 1,941 | |||||||
| Accretion of note payable |
4,429 | 4,187 | 3,958 | |||||||||
| Interest expense – convertible senior notes |
$ | 6,370 | $ | 6,128 | $ | 5,899 | ||||||
| (a) | Adjusted for the retrospective adoption of ASC 470-20. |
Amounts comprising the carrying amount of the Convertible Senior Notes are as follows (in thousands):
| December 31, 2010 |
December 31, 2009 |
|||||||
| Beginning carrying amount |
$ | 76,531 | $ | 72,344 | ||||
| Accretion of note payable |
4,429 | 4,187 | ||||||
| Carrying amount |
$ | 80,960 | $ | 76,531 | ||||
The impact of the adoption of ASC 470-20 on the Consolidated Statement of Operations (in thousands, except per share amount) is as follows:
| Year Ended December 31, 2008 |
||||||||||||
| As Previously Reported |
Incremental Impact of Adoption of ASC 470-20 |
As Adjusted |
||||||||||
| Total interest and other income (expense), net |
$ | (961 | ) | $ | (3,803 | ) | $ | (4,764 | ) | |||
| Net loss |
(83 | ) | (3,803 | ) | (3,886 | ) | ||||||
| Basic and diluted net loss per share |
0.00 | (0.13 | ) | (0.13 | ) | |||||||
The impact of the adoption of ASC 470-20 on the Consolidated Statement of Cash Flows (in thousands) is as follows:
| Year Ended December 31, 2008 |
||||||||||||
| As Originally Reported |
Incremental Impact of Adoption of ASC 470-20 |
As Adjusted |
||||||||||
| Net loss |
$ | (83 | ) | $ | (3,803 | ) | $ | (3,886 | ) | |||
| Amortization of debt issuance costs |
619 | (155 | ) | $ | 464 | |||||||
| Accretion of note payable |
— | 3,958 | $ | 3,958 | ||||||||
85
Table of Contents
10. Credit Line
In November 2008, we entered into a revolving credit line agreement with UBS, payable on demand, in an amount equal to 75% of the fair value of our ARS at a net no cost, meaning that the interest we paid on the credit line did not exceed the interest that we received on the ARS that we pledged as security for the credit line (Note 3—Investments). In July 2010, we exercised our put option to require UBS to purchase the underlying ARS at full par value, used the proceeds to repay the remaining balance of $14.2 million and terminated the line of credit. During the twelve months ended December 31, 2010 we borrowed an additional $6.6 million, and repaid $35.8 million under this line of credit. Our loan balance as of December 31, 2010 and 2009 was zero and $29.2 million, respectively. The line of credit was terminated in July 2010.
11. Incentive and Stock Plans
Employee Stock Purchase Plan
In November 1995, the Board of Directors adopted the Employee Stock Purchase Plan (“ESPP”). The ESPP became effective November 29, 1995. At that time, 200,000 shares were reserved for issuance under the ESPP. The ESPP permits participants to purchase common stock through payroll deductions of up to 10% of an employee’s annual base earnings. The purchase price per share is equal to 85% of the fair market value per share on the participant’s entry date into the offering period or, if lower, 85% of the fair market value per share on the semi-annual purchase date. In March 2004, the Board of Directors approved an amendment to the ESPP to increase the number of shares of common stock reserved for issuance by 150,000 shares. The stockholders approved this amendment in June 2004, to be effective July 1, 2004. In March 2006, the Board of Directors approved an amendment to the ESPP to increase the number of shares of common stock reserved for issuance by 160,000 shares. This amendment was approved by the stockholders in June 2006. In April 2008, the Board of Directors approved an amendment to the ESPP to increase the number of shares of common stock reserved for issuance by 150,000 shares. This amendment was approved by the stockholders in June 2008. In April 2010, the Board of Directors approved an amendment to the ESPP to increase the number of shares of common stock reserved for issuance by 200,000 shares. This amendment was approved by the stockholders in June 2010. As of December 31, 2010, 623,575 shares had been issued under the ESPP and 236,425 shares were available for future issuance.
Company Stock Option Plans
In August 2002, the Board of Directors approved the 2002 Non-Qualified Stock Option Plan (“2002 Plan”) and amendments to the 2002 Plan were approved by the Board in March 2003. Under the Amended and Restated 2002 Plan, non-qualified stock options and stock purchase rights may be granted only to the following classes of persons: (i) except as provided in (ii) below, consultants and employees who are not our officers or directors, and (ii) newly hired employees (including employees who will become our officers or directors) and who have not previously been employed by us and with respect to whom options are to be granted as an inducement essential to such employees’ entering into employment contracts with us. The 2002 Plan was enacted to address the increased hiring done during the second half of 2002, primarily in our U.S. sales, professional education and marketing functions. The maximum aggregate number of shares that may be issued upon exercise of options or stock purchase rights is 1,500,000 shares. In December 2005, the Board of Directors approved an amendment and restatement of the 2002 Plan to provide a fair market value established upon the closing price on the day of the grant rather than the previous trading day. This amendment became effective immediately after approval and did not require stockholder approval.
Under the terms of the 2002 Plan, options may be granted with different vesting terms from time to time and all options under the 2002 Plan expire ten years after grant. The options may include provisions permitting exercise of the option prior to full vesting. In 2010, there were no shares that were exercised prior to full vesting.
In March 2001, the Board of Directors approved the 2001 Equity Incentive Plan (“2001 Plan”) allowing granting of stock options and restricted stock to employees, directors and consultants. The 2001 Plan provides for
86
Table of Contents
the grant of options, restricted stock, stock appreciation rights, performance share awards, dividend equivalents awards, stock payment awards, stock purchase rights and restricted stock unit awards to our employees, directors and consultants. The 2001 Plan was originally adopted by the Board of Directors on March 21, 2001 with a total of 1,000,000 shares of common stock reserved for issuance thereunder, and was approved by the stockholders in May 2001. In March 2002, the Board of Directors approved an amendment and restatement of the 2001 Plan to increase the shares reserved for issuance thereunder by an additional 1,000,000 shares, bringing the aggregate number reserved for issuance to 2,000,000 shares of common stock, and to provide for automatic grants of non-qualified stock options to non-employee directors as had been provided under the 1995 Director’s Stock Option Plan. The stockholders approved this amendment and restatement in May 2002. In April 2003, the Board of Directors approved the Second Amended and Restated 2001 Plan to increase the size of the formula grants to non-employee directors and to prohibit repricing. The stockholders approved this amendment and restatement in June 2003. In March 2004, the Board of Directors approved the Third Amended and Restated 2001 Plan to reduce the size of the automatic grants of stock options to non-employee directors and to provide for automatic grants of restricted stock to non-employee directors and to increase the shares of Common Stock reserved for issuance thereunder by an additional 500,000 shares, bringing the aggregate number reserved for issuance to 2,500,000 shares of common stock. The stockholders approved this amendment and restatement in June 2004. In November 2004, the Board of Directors approved the Fourth Amended and Restated 2001 Plan to provide for the grant of restricted stock units and stock appreciation rights. In January 2005, the Board of Directors approved the Fifth Amended and Restated 2001 Plan to provide for a change in the number of shares to be automatically granted to non-employee directors under the plan. In December 2005, the Board of Directors approved the Sixth Amended and Restated 2001 Plan to establish that the price of future grants be based on the closing price of our stock on the date of grant, rather than the previous trading day. In February 2006, the Board of Directors approved the Seventh Amended and Restated 2001 Plan to provide for the increase the annual grant of restricted stock for directors from 2,000 shares to 2,500 shares. In April 2006, the Board of Directors approved the amendment to the Eighth Amended and Restated 2001 Plan to increase the shares of Common Stock reserved for issuance thereunder by an additional 1,500,000 shares, bringing the aggregate number reserved for issuance to 4,000,000 shares of Common Stock. This amendment was approved by the stockholders in June 2006. In June 2008, the Board of Directors approved the Tenth Amended and Restated 2001 Plan to provide for the increase the number of shares of Common Stock reserved for issuance thereunder by an additional 1,500,000 shares, bringing the aggregate number reserved for issuance to 5,500,000 shares of common stock. This amendment was approved by the stockholders in June 2008.
Under the terms of the 2001 Plan, incentive stock options may be granted only to employees with exercise prices not less than the fair market value of the common stock on the date of grant. Stock options and stock appreciation rights may be granted with different vesting terms from time to time but generally provide for vesting of at least 20% of the total number of shares per year. All options and stock appreciation rights under the 2001 Plan expire ten years after grant, and five years in the case of a grant to a 10% stockholder. Stock appreciation rights are to be settled in stock. Stock options may include provisions permitting exercise of the option prior to full vesting. To the extent that the aggregate fair market value of the shares subject to a holder’s incentive stock options exceeds $100,000, the excess options will be treated as non-qualified stock options.
On November 29, 1995, the Board of Directors approved the 1995 Director’s Stock Option Plan (the “Directors’ Plan”), which allows the granting of options for up to 100,000 shares of common stock to outside directors. Stock options may be granted to outside directors with exercise prices of not less than fair market value. The options expire ten years from date of grant. Options granted under the Directors’ Plan vest over one or three years. The options are only exercisable while the outside director remains a director.
In July 1993, the Board of Directors adopted the 1993 Stock Plan (the “1993 Plan”), and amendments to the 1993 Plan were adopted by the Board of Directors in March 1994, May 1995, October 1995, February 1997 and April 2000 and approved by the stockholders in March 1994, January 1996, May 1997 and May 2000 to allow granting of options up to 3,075,000 shares of common stock in the aggregate. Stock options granted under the 1993 Plan may be either incentive stock options or non-qualified stock options and can be granted to employees,
87
Table of Contents
distributors, consultants and directors. Incentive stock options may be granted to employees with exercise prices of no less than the fair market value and non-qualified options may be granted at exercise prices of no less than 85% of the fair market value of the common stock on the date of grant, as determined by the Board of Directors. The options expire no more than 10 years after the date of grant. Options may be granted with different vesting terms from time to time but generally provide for vesting of at least 25% of the total number of shares per year. The options may include provisions permitting exercise of the option prior to full vesting. Any unvested shares so purchased shall be subject to repurchase by us at the original exercise price of the option. Such repurchase rights generally lapse at a minimum rate of 25% per year from the date the option was granted. As of December 31, 2010 there were no shares that are subject to repurchase.
In April 2004, the Board of Directors approved a nonqualified stock option grant for 125,000 shares of our common stock and a grant of 36,000 shares of restricted stock for Mr. Ulric E. Cote as a stand-alone inducement grant in connection with his initial commencement of employment with us as Executive Vice President, Global Sales and Business Development. In October 2007, the Board of Directors approved a stock appreciation right grant of 100,000 shares of our common stock for Mr. Spencer Roeck as a stand-alone inducement grant in connection with his initial commencement of employment with us as Vice President of International. In March 2008, the Board of Directors approved a stock appreciation right grant of 100,000 shares of our common stock for Mr. Todd Sloan as a stand-alone inducement grant in connection with his initial commencement of employment with us as Vice President of Strategic and Professional Marketing. Stockholder approval was not required for any of these grants.
Our stockholders approved the 2010 Equity Incentive Award Plan (the “2010 Plan”) and the reservation of an aggregate of 3,000,000 shares of Common Stock for issuance pursuant to the 2010 Plan during our annual meeting of stockholders which was held on June 14, 2010. The 2010 Plan is intended to replace our 2001Plan and our 2002 Plan, which terminated pursuant to their terms on March 21, 2011 and August 8, 2012, respectively. No new awards were made under the 2001 Plan or 2002 Plan after June 2010. However, the shares of Common Stock that remained available for issuance under the 2001 Plan and the 2002 Plan as of March 31, 2010 were added to the shares reserved for issuance under the 2010 Plan. In addition, shares of Common Stock subject to awards already granted under the 2001Plan and the 2002 Plan as of March 31, 2010 that terminate expire or lapse become available for issuance under the 2010 Plan.
The 2010 Plan provides for the grant of stock options (both incentive stock options and nonqualified stock options), restricted stock, SARs, performance shares, performance stock units, dividend equivalents, stock payments, deferred stock, RSUs, performance bonus awards and performance-based awards to eligible participants.
The aggregate number of shares of Common Stock that may be issued or transferred under the 2010 Plan is 3,000,000 plus the number of shares which, as of March 31, 2010, remain available for issuance under the 2001 Plan and 2002 Plan or shares subject to awards already granted under the 2001 Plan and the 2002 Plan as of March 31, 2010 that terminate, expire or lapse will become available for issuance under the 2010 Plan, provided that the aggregate number of shares of Common Stock available for issuance under the 2010 Plan is reduced by 2.5 shares for each share of Common Stock delivered in settlement of any award other than a stock option or SAR. In addition, no more than 13,280,364 shares of Common Stock may be issued upon the exercise of incentive stock options. On the effective date of the 2010 Plan, the 2001 Plan and 2002 Plan terminated and any awards outstanding thereunder remained outstanding pursuant to their terms. The shares of Common Stock covered by the 2010 Plan may be treasury shares, authorized but unissued shares, or shares purchased in the open market.
Generally, shares of Common Stock subject to an award under the 2010 Plan, 2001 Plan or 2002 Plan that terminates, expires or lapses for any reason are made available for issuance again under the 2010 Plan, except that each share subject to an award other than a stock option or SAR that terminates, expires, or lapses for any reason will increase the number of shares that can be issued under the 2010 Plan by 2.5 shares. Shares of Common Stock tendered or withheld to satisfy the grant or exercise price or tax withholding obligation pursuant
88
Table of Contents
to any award and shares of Common Stock that were subject to a stock-settled SAR that are not issued upon exercise of the SAR will not be available for issuance again under the 2010 Plan. The payment of dividend equivalents in cash in conjunction with outstanding awards will not be counted against the shares available for issuance under the 2010 Plan.
The maximum number of shares of Common Stock that may be subject to one or more awards granted to any one participant pursuant to the 2010 Plan during any calendar year is 800,000, or 300,000 with respect to any awards other than stock options and SARs and the maximum amount that may be paid in cash during any calendar year with respect to any performance-based award is $2,000,000.
As of December 31, 2010, 2,985,924 shares remained as available for grant under the 2010 Plan. A summary of the activity of all our Plans and stand alone grant activity is as follows:
| Awards Outstanding | ||||||||||||
| Shares Available For Grant |
Awards Outstanding |
Weighted- Average Exercise Price |
||||||||||
| Balance at December 31, 2007 |
1,010,550 | 4,186,190 | 11.60 | |||||||||
| Additional authorized (a) |
1,600,000 | — | — | |||||||||
| Options granted (a) |
(1,026,910 | ) | 1,026,910 | 17.47 | ||||||||
| Restricted stock awards and restricted stock units granted |
(61,710 | ) | 61,710 | — | ||||||||
| Restricted stock units issued |
— | (142,789 | ) | — | ||||||||
| Options exercised |
— | (378,267 | ) | 8.20 | ||||||||
| Stock appreciation rights exercised |
8,571 | (52,025 | ) | 17.30 | ||||||||
| Options cancelled and expired (b) |
260,453 | (357,932 | ) | 17.21 | ||||||||
| Restricted stock awards and restricted stock units cancelled |
11,514 | (7,625 | ) | — | ||||||||
| Balance at December 31, 2008 |
1,802,468 | 4,336,172 | 12.62 | |||||||||
| Stock appreciation rights and options granted |
(1,335,653 | ) | 1,335,653 | 13.66 | ||||||||
| Restricted stock units granted |
(84,634 | ) | 84,634 | — | ||||||||
| Restricted stock units issued |
— | (40,448 | ) | — | ||||||||
| Options exercised |
— | (265,819 | ) | 8.22 | ||||||||
| Stock appreciation rights exercised |
— | (8,915 | ) | 13.39 | ||||||||
| Options cancelled and expired |
302,632 | (302,632 | ) | 16.14 | ||||||||
| Restricted stock units cancelled |
1,687 | (1,687 | ) | — | ||||||||
| Balance at December 31, 2009 |
686,500 | 5,136,958 | $ | 13.53 | ||||||||
| Additional authorized |
3,000,000 | — | — | |||||||||
| Stock appreciation rights and options granted |
(497,500 | ) | 497,500 | 19.62 | ||||||||
| Restricted stock units granted |
(295,815 | ) | 170,186 | — | ||||||||
| Restricted stock units issued |
— | (56,221 | ) | — | ||||||||
| Options exercised |
— | (212,432 | ) | 10.41 | ||||||||
| Stock appreciation rights exercised |
— | (64,354 | ) | 12.85 | ||||||||
| Options expired |
— | (5,000 | ) | 7.06 | ||||||||
| Stock appreciation rights cancelled and expired |
84,344 | (84,344 | ) | 18.25 | ||||||||
| Restricted stock units cancelled |
8,395 | (5,433 | ) | — | ||||||||
| Balance at December 31, 2010 |
2,985,924 | 5,376,860 | $ | 14.38 | ||||||||
| (a) | Includes stand-alone inducement grants of stock appreciation rights of 100,000 shares. |
| (b) | Includes stand-alone inducement plan cancellation of 93,750 shares. |
89
Table of Contents
A summary of the activity for the year ended December 31, 2010 of stock options and stock appreciation rights is as follows:
| Options and Stock Appreciation Rights Outstanding |
Weighted- Average Exercise Price |
Aggregate Intrinsic Value |
||||||||||
| Balance outstanding at December 31, 2009 |
4,992,606 | $ | 14.24 | $ | 22,941,171 | |||||||
| Grants |
497,500 | 19.62 | ||||||||||
| Exercises |
(276,786 | ) | 10.97 | |||||||||
| Cancelled and expired |
(89,344 | ) | 17.63 | |||||||||
| Balance outstanding at December 31, 2010 |
5,123,976 | $ | 14.86 | $ | 6,236,022 | |||||||
| Exercisable at December 31, 2010 |
3,728,246 | $ | 14.38 | $ | 5,163,731 | |||||||
The following table summarizes information about stock options outstanding and exercisable at December 31, 2010:
| Options Outstanding | Options Vested and Exercisable | |||||||||||||||||||
| Range of Exercise Prices |
Options Outstanding |
Weighted Average Contractual Remaining Life (years) |
Weighted Average Exercise Price |
Options Vested and Exercisable |
Weighted Average Exercise Price |
|||||||||||||||
| $ 5.65 - $ 9.95 |
812,960 | 2.98 | $ | 9.23 | 812,960 | $ | 9.23 | |||||||||||||
| $ 9.96 - $11.03 |
80,600 | 4.91 | $ | 10.47 | 67,600 | $ | 10.36 | |||||||||||||
| $11.35 - $11.35 |
737,557 | 8.16 | $ | 11.35 | 324,802 | $ | 11.35 | |||||||||||||
| $11.47 - $13.51 |
549,240 | 3.61 | $ | 12.99 | 523,365 | $ | 12.99 | |||||||||||||
| $13.74 - $16.31 |
512,159 | 5.03 | $ | 14.97 | 459,898 | $ | 14.85 | |||||||||||||
| $16.38 - $17.74 |
894,887 | 7.28 | $ | 17.35 | 560,168 | $ | 17.36 | |||||||||||||
| $17.97 - $18.25 |
540,724 | 6.50 | $ | 18.07 | 483,946 | $ | 18.06 | |||||||||||||
| $18.40 - $19.57 |
807,417 | 7.94 | $ | 19.16 | 347,344 | $ | 18.95 | |||||||||||||
| $19.99 - $21.80 |
185,932 | 6.06 | $ | 20.54 | 145,768 | $ | 20.54 | |||||||||||||
| $22.61 - $22.61 |
2,500 | 6.09 | $ | 22.61 | 2,395 | $ | 22.61 | |||||||||||||
| $5.65 $22.61 |
5,123,976 | 6.05 | $ | 14.86 | 3,728,246 | $ | 14.38 | |||||||||||||
Restricted Stock
Restricted stock award and restricted stock unit activity for the year ended December 31, 2010, is as follows:
| Shares and Units |
Weighted- Average Grant Date Fair Value |
|||||||
| Nonvested stock outstanding at December 31, 2009 |
144,352 | $ | 14.04 | |||||
| Grants |
170,186 | 17.84 | ||||||
| Vested |
(56,221 | ) | 20.42 | |||||
| Cancellations |
(5,433 | ) | 12.77 | |||||
| Nonvested stock outstanding at December 31, 2010 |
252,884 | $ | 16.28 | |||||
90
Table of Contents
Retirement Savings Plan
Under our retirement savings plan (“401K Plan”), employees may elect to defer up to 15% of their total compensation, not to exceed the amount allowed by applicable Internal Revenue Service regulations. We started a matching program for participants, effective April 1, 2010. For every dollar contributed to the 401K plan, we match twenty-five cents, up to the first 6% contributed. For the year ended 2010, we contributed $0.2 million. There were no employer contributions to the 401K Plan for the years ended 2009 and 2008.
12. Stockholder’s Equity
Pursuant to our certificate of incorporation, the Board of Directors will have the authority, without further action by the stockholders, to issue up to 3,000,000 shares of preferred stock, in one or more series. Our Board of Directors shall determine the rights, preferences, privileges and restrictions of the preferred stock, including dividend rights, conversion rights, voting rights, terms of redemption, liquidation preferences, sinking fund terms and the number of shares constituting any series or the designation of any series.
We have repurchased 91,752 shares of restricted common stock at par value in accordance with the terms of restricted stock agreements. Net of treasury stock issuances of 13,889 shares, 77,863 shares remain as treasury stock. We recorded zero, $18 thousand, and zero, respectively for tax benefits from stock-based compensation in 2010, 2009 and 2008.
13. Income Taxes
For financial reporting purposes, income before income taxes includes the following components (in thousands):
| Years Ended December 31, | ||||||||||||
| 2010 | 2009 | 2008 (a) | ||||||||||
| United States |
$ | 3,676 | $ | 9,424 | $ | (1,012 | ) | |||||
| Foreign |
(377 | ) | (1,121 | ) | (2,898 | ) | ||||||
| Income (loss) before provision (benefit) for income taxes |
$ | 3,299 | $ | 8,303 | $ | (3,910 | ) | |||||
| (a) | Adjusted for the retrospective adoption of ASC 470-20. |
The provision for income taxes consists of the following (in thousands):
| Years Ended December 31, | ||||||||||||
| 2010 | 2009 | 2008 | ||||||||||
| Current |
||||||||||||
| U.S. Federal |
$ | (39 | ) | $ | (138 | ) | $ | — | ||||
| State & local |
90 | 257 | — | |||||||||
| Foreign |
729 | 133 | 393 | |||||||||
| 780 | 252 | 393 | ||||||||||
| Deferred |
||||||||||||
| U.S. Federal |
(71,885 | ) | — | — | ||||||||
| State & local |
(7,365 | ) | — | — | ||||||||
| Foreign |
(222 | ) | 106 | (417 | ) | |||||||
| $ | (79,472 | ) | $ | 106 | $ | (417 | ) | |||||
| Income tax expense (benefit) |
$ | (78,692 | ) | $ | 358 | $ | (24 | ) | ||||
As of December 31, 2010, we had net operating loss carryforwards for federal and state income tax purposes of approximately $198.1 million and $105.4 million respectively. The federal net operating loss carryforwards includes $26.0 million which relates to stock option deductions that will be recognized through additional paid in
91
Table of Contents
capital when utilized. The California net operating loss carryforwards includes approximately $10.8 million which relates to stock option deductions that will be recognized through additional paid in capital when utilized. As such, these deductions are not reflected in our deferred tax assets. If not utilized, these carryforwards will begin to expire starting in 2011. In addition, at December 31, 2010 we had both federal and state research credit carryforwards of approximately $1.6 million and $1.9 million, respectively. If not utilized the federal tax carryforward will begin to expire in 2011 while the California credit can be carried forward indefinitely. Utilization of the tax attributes is largely dependent on the generation of profits in future years, in the event that the Company fails to generate profits a valuation allowance would need to be established to offset the attributes.
We account for income taxes under the asset and liability method set forth by ASC 740 Accounting for Income Taxes, or (“ASC 740”) which requires the recognition of deferred tax assets and liabilities for the expected future tax consequences of events that have been included in the financial statements. Under the liability method, deferred method, deferred tax assets and liabilities are determined based on differences between the financial statements and tax bases of assets and liabilities.
Significant components of our deferred tax assets and liabilities as of December 31, 2010 and December 31, 2009 are as follows (in thousands):
| Years Ended December 31, |
||||||||
| 2010 | 2009 | |||||||
| Deferred income tax assets: |
||||||||
| Reserves, accruals and other |
$ | 2,129 | $ | 3,309 | ||||
| Stock-based compensation expense |
7,505 | 3,451 | ||||||
| Net operating loss carryforwards |
65,479 | 71,025 | ||||||
| Research credits |
2,714 | 2,339 | ||||||
| Capitalized research and development |
3,771 | 4,874 | ||||||
| Gross deferred income tax assets |
81,598 | 84,998 | ||||||
| Less: valuation allowance |
(2,844 | ) | (84,963 | ) | ||||
| Net deferred income tax assets |
$ | 78,754 | $ | 35 | ||||
| Deferred income tax liabilities: |
||||||||
| Intangible assets |
$ | (1,007 | ) | $ | (1,277 | ) | ||
| Deferred income tax liabilities |
(1,007 | ) | (1,277 | ) | ||||
| Net income tax assets |
$ | 77,747 | $ | (1,242 | ) | |||
The decrease in the valuation allowance was approximately $82.1 million, $12.8 million and $1.8 million during 2010, 2009 and 2008, respectively.
We account for deferred taxes under ASC 740-10 which involves weighing positive and negative evidence concerning the realizability of the Company’s deferred tax assets in each jurisdiction. After considering evidence such as current and cumulative financial reporting incomes, the sources of future taxable income and tax planning strategies, management concluded that a valuation allowance is not required for the US Federal deferred tax assets and a significant portion of our state deferred tax assets. Therefore, the Company released the valuation allowance against the US Federal deferred tax assets at the end of the fiscal year 2010. As of the end of the year, the U.S. operations have generated cumulative income for the three-year period including 2010. Based on historical profits and expectations of future results, the Company determined that there was sufficient positive evidence to support the release of the valuation allowance against its U.S. Federal deferred tax assets and a portion of the state deferred tax assets in the fourth quarter of 2010. The release of the valuation allowance for the year ended December 31, 2010 resulted in a tax benefit of $80.7 million.
92
Table of Contents
The reconciliation between our effective tax rate on income from continuing operations and the statutory tax rate is as follows (in thousands):
| Years Ended December 31, | ||||||||||||
| 2010 | 2009 | 2008 | ||||||||||
| U.S. federal statutory income tax rate |
$ | 1,155 | $ | 2,823 | $ | (36 | ) | |||||
| Foreign tax |
522 | 620 | 731 | |||||||||
| State tax |
43 | — | — | |||||||||
| Permanent items |
209 | 164 | 129 | |||||||||
| Stock based compensation |
167 | 307 | (6 | ) | ||||||||
| Research and development credit |
(88 | ) | (138 | ) | — | |||||||
| Other |
(39 | ) | — | — | ||||||||
| Valuation allowance |
(80,661 | ) | (3,418 | ) | (842 | ) | ||||||
| Income tax expense (benefit) |
$ | (78,692 | ) | $ | 358 | $ | (24 | ) | ||||
We adopted the provisions of ASC 740-10 on January 1, 2007. We file income tax returns in the U.S. and in various state jurisdictions with varying statutes of limitations. We have not been audited by the Internal Revenue Service or any state income or franchise tax agency. As of December 31, 2010, our federal returns for the years ended 2007 through the current period and most state returns for the years ended 2006 through the current period are still open to examination. In addition, all of the net operating losses and research and development credit carryforwards that may be used in future years are still subject to adjustment. The tax returns for our French subsidiary for the years ended 2005 to 2007 were examined and closed by the French tax authorities. As of December 31, 2010, we also recorded approximately $2.7 million of income tax expense related to uncertain tax position attributable to our French subsidiary.
A reconciliation of the change in our unrecognized tax benefits (“UTB”) is as follows (in thousands):
| Unrecognized Income Tax Benefits |
||||
| Balance at January 1, 2007 |
$ | — | ||
| Increases for tax positions during 2007 |
2,271 | |||
| Balance at January 1, 2008 |
2,271 | |||
| Increases for tax positions during 2008 |
393 | |||
| Decreases related to expiration/lapse of statute of limitations during 2008 |
(46 | ) | ||
| Balance at December 31, 2008 |
2,618 | |||
| Increases for tax positions during 2009 |
367 | |||
| Decrease for tax positions related to prior years during 2009 |
(149 | ) | ||
| Decreases related to expiration/lapse of statute of limitations during 2009 |
(77 | ) | ||
| Balance at December 31, 2009 |
2,758 | |||
| Increases for tax positions related to current year |
297 | |||
| Decrease for tax positions related to prior years |
95 | |||
| Decreases related to expiration/lapse of statute of limitations |
— | |||
| Balance at December 31, 2010 |
$ | 3,151 | ||
If the $3.2 million of unrecognized income tax benefits is recognized, approximately $2.7 million would decrease the effective tax rate in the period in which each of the benefits is recognized.
We do not expect our unrecognized tax benefits to change significantly over the next 12 months. In connection with the adoption of ASC 740-10, the Company recognizes interest and penalties accrued on any unrecognized tax benefits as a component of income tax expense.
93
Table of Contents
14. Legal Proceedings
On May 22, 2009, we filed a lawsuit in the United States District Court, Northern District of California against Hologic, Inc. seeking declaratory judgment by the Court that Hologic’s planned importation, use, sale or offer to sell of its forthcoming Adiana Permanent Contraception system will infringe several U.S. patents owned by us including U.S. Patent Nos. 6,634,361, 6,709,667, 7,237,552, 7,428,904 and 7,506,650, and an injunction prohibiting Hologic from importing, using, selling or offering to sell its Adiana system in the United States. Upon FDA approval of the Adiana Permanent Contraception system, we filed an Amended Complaint in July 2009 seeking a judgment that Hologic’s importation, use, sale and/or offer to sell the system infringes the same patents mentioned above and requested an injunction against such activity. On August 13, 2009, we filed a motion for preliminary injunction, requesting the Court to enjoin the Adiana system in the United States pending final judgment in the action. On August 25, 2009, Hologic filed its answer and asserted counterclaims against us that we were violating the Lanham Act and the California Statutory Unfair Competition Law. On October 14, 2009, we answered with our own counterclaims asserting that Hologic was violating the Lanham Act and the California Statutory Unfair Competition Law through its selling practices. A hearing was held on that motion on November 4, 2009 and an order denying the motion was issued on November 6, 2009, upon stipulation of the parties, on January 19, 2010, all claims relating to three of the five asserted patents were dismissed with prejudice. A claim construction hearing was held on March 10, 2010. The Claim Construction Order was issued on March 24, 2010 with all but one of five terms favorably construed to us. On April 21, 2010 the Court issued an order denying our Motion to Compel and granted our Motion to Amend our Complaint to assert counterclaims against Hologic that Hologic had engaged in unfair competition against us and had violated the Lanham Act. On August 10, 2010, the parties reached agreement to settle all the unfair competition claims of both parties with prejudice. The terms of the agreement are confidential. The parties filed cross –motions for summary judgment on October 28 , 2010, which were heard on December 9, 2010. On December 16, 2010, the Court issued an order denying Hologic’s motions for summary judgment of non-infringement and invalidity of the asserted claims, granting our motion for summary judgment as to non-infringing substitutes and the hypothetical negotiation date, and denying our motion for summary judgment of infringement. A trial on the two remaining patent claims that was originally scheduled to begin February 28, 2011 was postponed until after June 30, 2011.
On August 10, 2010 Hologic filed a lawsuit in the United States District Court for the District of Massachusetts alleging that two of the twelve U.S. patents marked on our packaging, instructions for use, and marketing materials for our Essure® product do not cover the Essure® product. On October 12, 2010 we made a Motion to Transfer to the United States District Court, Northern District of California and a Motion to Dismiss the action. On December 13, 2010, the Court denied the Motion to Transfer without prejudice to reconsideration upon submission of additional information about likely witnesses. The Court deferred ruling on the Motion to Dismiss until the United States Department of Justice, or DOJ, files as brief on the issues we have raised.
From time to time, we are involved in legal proceedings arising in the ordinary course of business. We believe there is no litigation pending that could have, individually or in the aggregate, a material adverse effect on our financial position, result of operations or cash flows.
94
Table of Contents
15. Quarterly Information (unaudited)
Supplementary Data
Quarterly Results of Operations (Unaudited)
| Three Months Ended | ||||||||||||||||||||||||||||||||
| December 31, 2010 |
September 30, 2010 |
June 30, 2010 |
March 31, 2010 |
December 31, 2009 |
September 30, 2009 |
June 30, 2009 |
March 31, 2009 |
|||||||||||||||||||||||||
| Net Sales |
36,573 | $ | 33,882 | $ | 36,847 | $ | 33,358 | $ | 36,960 | $ | 34,247 | $ | 33,049 | $ | 27,151 | |||||||||||||||||
| Cost of goods sold |
6,613 | 6,562 | 7,285 | 6,391 | 6,577 | 5,044 | 6,671 | 5,756 | ||||||||||||||||||||||||
| Gross profit |
29,960 | 27,320 | 29,562 | 26,967 | 30,383 | 29,203 | 26,378 | 21,395 | ||||||||||||||||||||||||
| Operating expenses: |
||||||||||||||||||||||||||||||||
| Research and development |
1,724 | 1,610 | 1,815 | 1,746 | 1,931 | 1,734 | 2,008 | 1,407 | ||||||||||||||||||||||||
| Selling, general and administrative |
22,088 | 22,968 | 26,330 | 25,979 | 20,257 | 19,472 | 23,337 | 22,570 | ||||||||||||||||||||||||
| Total operating expenses |
23,812 | 24,578 | 28,145 | 27,725 | 22,188 | 21,206 | 25,345 | 23,977 | ||||||||||||||||||||||||
| Operating income (loss) |
6,148 | 2,742 | 1,417 | (758 | ) | 8,195 | 7,997 | 1,033 | (2,582 | ) | ||||||||||||||||||||||
| Total interest and other income (expense), net |
(1,645 | ) | (1,561 | ) | (1,585 | ) | (1,459 | ) | (1,607 | ) | (1,615 | ) | (1,506 | ) | (1,612 | ) | ||||||||||||||||
| Net income (loss) before provision for income taxes |
4,503 | 1,181 | (168 | ) | (2,217 | ) | 6,588 | 6,382 | (473 | ) | (4,194 | ) | ||||||||||||||||||||
| Provision (benefit) for income taxes |
(79,154 | ) | 205 | 123 | 134 | (15 | ) | 150 | 82 | 141 | ||||||||||||||||||||||
| Net income (loss) |
83,657 | 976 | (291 | ) | (2,351 | ) | 6,603 | 6,232 | (555 | ) | (4,335 | ) | ||||||||||||||||||||
| Basic income (loss) per share |
$ | 2.69 | $ | 0.03 | ($ | 0.01 | ) | ($ | 0.08 | ) | $ | 0.21 | $ | 0.20 | ($ | 0.02 | ) | ($ | 0.14 | ) | ||||||||||||
| Diluted income (loss) per share |
$ | 2.66 | $ | 0.03 | ($ | 0.01 | ) | ($ | 0.08 | ) | $ | 0.21 | $ | 0.20 | ($ | 0.02 | ) | ($ | 0.14 | ) | ||||||||||||
| Weighted average shares used in computing basic net income (loss) per share |
31,082 | 31,072 | 31,032 | 30,930 | 30,728 | 30,599 | 30,518 | 30,438 | ||||||||||||||||||||||||
| Weighted average shares used in computing diluted net income (loss) per share |
31,443 | 31,413 | 31,032 | 30,930 | 31,661 | 31,503 | 30,518 | 30,438 | ||||||||||||||||||||||||
95
Table of Contents
Conceptus, Inc.
Schedule II
Schedule of Valuation and Qualifying Accounts
(In thousands)
| Balance at Beginning of Period |
Additions | Deductions | Balance at End of Period |
|||||||||||||
| Allowance for doubtful accounts: |
||||||||||||||||
| Year ended December 31, 2008 |
$ | 431 | $ | 74 | $ | 27 | $ | 478 | ||||||||
| Year ended December 31, 2009 |
$ | 478 | $ | 165 | $ | 43 | $ | 600 | ||||||||
| Year ended December 31, 2010 |
$ | 600 | $ | 443 | $ | 291 | $ | 752 | ||||||||
96
Table of Contents
Pursuant to the requirements of Section 13 or 15(d) of the Securities Exchange Act of 1934, the Registrant has duly caused this Report to be signed on its behalf by the undersigned, thereunto duly authorized in the City of Mountain View, California on this 15th day of March 2011.
| CONCEPTUS, INC. | ||
| By: |
/s/ MARK M. SIECZKAREK, | |
| Mark M. Sieczkarek | ||
| President and Chief Executive Officer | ||
POWER OF ATTORNEY
KNOW ALL PERSONS BY THESE PRESENTS, that each person whose signature appears below constitutes and appoints Mark Sieczkarek and Gregory E. Lichtwardt, his or her attorney-in-fact, each with the power of substitution, for him in any and all capacities, to sign any amendments to this Report on Form 10-K, and to file the same, with exhibits thereto and other documents in connection therewith with the Securities and Exchange Commission, hereby ratifying and confirming all that said attorney-in-fact, or his substitute or substitutes may do or cause to be done by virtue hereof. Pursuant to the requirements of the Securities Exchange Act of 1934, this Report has been signed below by the following persons in the capacities and on the dates indicated.
| Signature |
Title |
Date | ||
| /S/ MARK M. SIECZKAREK (Mark M. Sieczkarek) |
President, Chief Executive Officer and Director (Principal Executive Officer) | March 15, 2011 | ||
| /S/ GREGORY E. LICHTWARDT (Gregory E. Lichtwardt) |
Executive Vice President, Treasurer and Chief Financial Officer | March 15, 2011 | ||
| /S/ JOHN BISHOP (John Bishop) |
Director | March 15, 2011 | ||
| /S/ THOMAS F. BONADIO (Thomas F. Bonadio) |
Director | March 15, 2011 | ||
| /S/ PAUL A. LAVIOLETTE (Paul A. Laviolette) |
Director | March 15, 2011 | ||
| /S/ ROBERT V. TONI (Robert V. Toni) |
Director | March 15, 2011 | ||
| /S/ KATHRYN A. TUNSTALL (Kathryn A. Tunstall) |
Director | March 15, 2011 | ||
| /S/ PETER L. WILSON (Peter L. Wilson) |
Director | March 15, 2011 | ||
97
Table of Contents
EXHIBIT INDEX
| Exhibit |
Description | |
| 10.31 | Employment Agreement dated December 20, 2010 between Sam Trujillo and Conceptus Inc. as disclosed in the Registrant’s Form 8K filed on January 6, 2011. | |
| 10.32 | Amended Exhibit E to the Avail Manufacturing Contract dated July 28, 2010 | |
| 21.0 | List of Conceptus subsidiaries. | |
| 23.1 | Consent of Independent Registered Public Accounting Firm. | |
| 24.1 | Power of Attorney (See Page 97 of this Report). | |
| 31.1 | Certification of Chief Executive Officer Pursuant to Section 302 of the Sarbanes-Oxley Act of 2002. | |
| 31.2 | Certification of Chief Financial Officer Pursuant to Section 302 of the Sarbanes-Oxley Act of 2002. | |
| 32.1 | Certification of Chief Executive Officer Pursuant to Section 906 of the Sarbanes-Oxley Act of 2002. | |
| 32.2 | Certification of Chief Financial Officer Pursuant to Section 906 of the Sarbanes-Oxley Act of 2002. | |
98