Attached files
Table of Contents
UNITED STATES
SECURITIES AND EXCHANGE COMMISSION
Washington, D.C. 20549
FORM 10-K
(Mark One)
| x | ANNUAL REPORT PURSUANT TO SECTION 13 OR 15(d) OF THE SECURITIES EXCHANGE ACT OF 1934 |
For the fiscal year ended December 31, 2010
OR
| ¨ | TRANSITION REPORT PURSUANT TO SECTION 13 OR 15(d) OF THE SECURITIES EXCHANGE ACT OF 1934 FOR THE TRANSITION PERIOD FROM TO |
Commission File Number 0-511
COBRA ELECTRONICS CORPORATION
(Exact name of Registrant as specified in its Charter)
| DELAWARE | 36-2479991 | |
| (State of incorporation) |
(I.R.S. Employer Identification No.) | |
| 6500 WEST CORTLAND STREET CHICAGO, ILLINOIS |
60707 | |
| (Address of principal executive offices) |
(Zip Code) |
Registrant’s telephone number, including area code: (773) 889-8870
Securities registered pursuant to Section 12(b) of the Act: Common Stock, Par Value $.33 1/3 Per Share; Common stock traded on the NASDAQ stock market
Securities registered pursuant to Section 12(g) of the Act: None
Indicate by check mark if the Registrant is a well-known seasoned issuer, as defined in Rule 405 of the Securities Act. YES ¨ NO x
Indicate by check mark if the Registrant is not required to file reports pursuant to Section 13 or 15(d) of the Act. YES ¨ NO x
Indicate by check mark whether the Registrant: (1) has filed all reports required to be filed by Section 13 or 15(d) of the Securities Exchange Act of 1934 during the preceding 12 months (or for such shorter period that the Registrant was required to file such reports), and (2) has been subject to such filing requirements for the past 90 days. YES x NO ¨
Indicate by check mark whether the registrant has submitted electronically and posted on its corporate Web site, if any, every Interactive Data File required to be submitted and posted pursuant to Rule 405 of Regulation S-T (§232.405 of this chapter) during the preceding 12 months (or for such shorter period that the registrant was required to submit and post such files). YES ¨ NO ¨
Indicate by check mark if disclosure of delinquent filers pursuant to Item 405 of Regulation S-K is not contained herein, and will not be contained, to the best of Registrant’s knowledge, in definitive proxy or information statements incorporated by reference in Part III of this Form 10-K or any amendment to this Form 10-K. x
Indicate by check mark whether the Registrant is a large accelerated filer, an accelerated filer, a non-accelerated filer, or a smaller reporting company. See definition of “large accelerated filer”, “accelerated filer”, and “smaller reporting company” in Rule 12b-2 of the Exchange Act. (Check one):
| Large accelerated filer ¨ | Accelerated filer ¨ | Non-accelerated filer ¨ | Smaller reporting company x | |||
| (Do not check if a smaller reporting company) |
Indicate by check mark whether the Registrant is a shell company (as defined in Rule 12b-2 of the Exchange Act). YES ¨ NO x
The aggregate market value of the voting and non-voting common equity held by non-affiliates of the Registrant, based on the closing price of the shares of common stock on The NASDAQ Stock Market on June 30, 2010, was $13,136,698.
The number of shares of Registrant’s Common Stock outstanding as of March 9, 2011 was 6,539,580.
Portions of the Registrant’s Definitive Proxy Statement relating to the Annual Meeting of Shareholders, scheduled to be held on May 10, 2011, are incorporated by reference into Part III of this Report.
Table of Contents
Table of Contents
Cobra Electronics Corporation (the “Company”), incorporated in Delaware in 1961, is traded on The NASDAQ Stock Market under the symbol “COBR”. The Company is a leading designer and marketer of two-way mobile communications and mobile navigation products in the United States, Canada and Europe, holding the number one or strong number two position in each of its longstanding product lines and targeting a similar position for marine VHF radios, photo-enforcement detection and mobile navigation for professional drivers. The Company has a 49-year track record of innovation and the development of award-winning products and is an industry leader in developing technology applications that serve consumers’ needs in the following product lines:
| Ÿ | Radar detection |
| Ÿ | Photo-enforcement and safety detection |
| Ÿ | Mobile navigation for professional drivers |
| Ÿ | Citizens Band radios |
| Ÿ | Power inverters and jumpstarters |
| Ÿ | Two-way radios |
| Ÿ | Marine electronics |
Management believes that the Company’s future success depends upon its ability to predict and respond in a timely and effective manner to changes in the markets it serves. Product performance, reliability, price, availability and service are the main competitive factors. The Company’s sales are dependent upon timely introduction of new products, which incorporate new features desired by consumers, at competitive prices. Cobra® is a leading brand in Citizens Band radios, radar detectors, speed camera detection, truck navigation and two-way radios.
Performance Products Limited (“PPL”), a UK-based designer and marketer of mobile navigation and photo-enforcement detection products, was acquired in 2006. PPL products are primarily marketed under the Snooper® brand. Additionally, PPL developed and markets the AURA™ database of photo-enforcement locations in the UK and elsewhere in Europe, providing drivers equipped with Snooper mobile navigation and detection devices with advance warning of speed cameras and hazardous conditions. The AURA database was expanded to include the United States and Canada and provides warnings of photo-enforcement locations and other road hazards to users of certain Cobra products.
Innovation remains the hallmark of the Company’s success, as demonstrated by just a few of its recent product introductions and other recent developments. The Company expects to continue attracting new customers with innovative product extensions and new product categories. Launched in the fourth quarter of 2010, the Cobra iRadar TM system combines industry-leading radar/laser gun and speed/red light camera technology with the iPhone® to create a revolutionary detection system. A Cobra iRadar system for AndroidTM applications will follow in the first quarter of 2011. Later in 2011, there will be a new crowdsourced database enhancement to the Cobra iRadar app, which will bring a social media-like user community aspect to the iRadar system by combining a powerful database of known driving hazards with the reach and real-time intelligence of the community of iRadar users. The Company’s all new detection lineup for 2011 featuring the Formula Series models will debut in the first quarter of 2011.
The Cobra PhoneLynx TM system, launched in the fourth quarter of 2010, allows users to make and receive cell phone calls on any phone in a home or small office and eliminates the need for landline phone services. A GPS trucker navigation system with a 5 inch screen and a retail selling price under $300 will be introduced in the first quarter of 2011. Eco-friendly packaging will be available on selected 2011 inverter products. Lastly in 2011, PPL will launch an in-car device, Laser Pod, which can be linked to a satellite navigation unit to provide alerts to laser guns with coverage throughout Western Europe.
The Company’s 2011 product line will include the following new products:
Cobra Segment
| Ÿ | iRadar radar/laser/safety camera detector |
| Ÿ | Formula R Series detectors XRS 9670 and 9770 |
| Ÿ | Formula S Series detectors XRS 9370, 9470 and 9570 |
1
Table of Contents
| Ÿ | Trucker navigation 7750 Platinum and 5550 PRO |
| Ÿ | PhoneLynx |
| Ÿ | Citizens Band radio 29 LX |
PPL Segment
| Ÿ | Laser Pod |
| Ÿ | S5000 TruckmateTM and VenturaTM |
| Ÿ | Low cost golf GPS |
| Ÿ | AVN Double Din units |
Demand for consumer electronics products tends to be seasonal and varies according to channel of distribution. Historically, sales in the last half of the year are significantly greater than in the first half, reflecting increasing purchases by retailers for various promotional activities that begin mainly in the third quarter and culminate with the holiday selling season. Also, because mass retail accounts make up a significant portion of the Company’s business, orders in the fourth quarter are generally stronger than orders in the third quarter.
One of the Company’s fundamental strengths is its product sourcing ability. Substantially all of the Company’s products are manufactured to its specifications and engineering designs by a number of suppliers, primarily in China, Hong Kong and South Korea. The Company utilizes multiple manufacturers for its products whenever practical, however certain products are dependent on a single manufacturer. The Company maintains control over the design and production quality of its products through its wholly owned subsidiary in Hong Kong, which seeks out new suppliers, monitors technological changes, performs source inspection of key suppliers, provides selected engineering services and expedites shipments from suppliers.
Over a period of years, the Company has developed a network of suppliers for its products. To maintain flexibility in product sourcing, all of the Company’s contracts with its suppliers can be terminated by the Company “at will”. While it is the Company’s goal to maintain strong relationships with its current suppliers, management believes that, if necessary, alternate suppliers could be found. The extent to which a change in a supplier would have an adverse effect on the Company’s business depends upon the timing of the change, the product or products that the supplier produces for the Company and the volume of that production. The Company also maintains insurance coverage that would, under certain limited circumstances, reimburse the Company for lost profits resulting from a supplier’s inability to fulfill its commitments to the Company. The Company historically has negotiated substantially all of its purchases in U.S. dollars and, in the case of PPL, uses forward contracts on occasion to purchase dollars at a fixed exchange rate to the British pound sterling. The Company considers opportunities to make purchases in other currencies, such as the euro, to the extent that doing so would be advantageous in light of currency fluctuations involving the U.S. dollar and other currencies.
Research and product development expenditures, as well as non-capitalized engineering costs, are expensed as incurred and amounted to $1.6 million in 2010, $1.8 million in 2009 and $2.2 million in 2008.
Patents and Intellectual Property
Patents and other intellectual property can be important marketing and merchandising tools across a broad range of products, but particularly for the Company’s newer products such as the Cobra iRadar, AURA and Bluetooth® products as well as a design patent for the 29 LX Citizens Band radio. Whenever the Company develops a unique design or technology, patents are applied for to preserve exclusivity.
The Company’s two-way radios, detectors, Citizens Band radios, HighGear™ accessories, GPS receivers, marine products and mobile navigation devices are marketed globally under the Cobra brand name. The Cobra trademark is registered in the United States, most European countries as well as in other jurisdictions. The Company believes the Cobra trademark, which is indefinitely renewable, is a significant factor in the successful marketing of its products.
Personal navigation devices, GPS locators and other products designed and marketed by PPL are marketed in the United Kingdom and Europe under the Snooper brand name. The Snooper trademark is registered in the United Kingdom and Europe and is a significant factor to successful marketing of PPL products in the United Kingdom and Europe.
Major competitors in the Cobra business segment are Motorola and Midland (two-way radios); Whistler and Escort/Beltronics (detection); Uniden and Midland (Citizens Band radios); Icom, Uniden and Standard Radio (marine products); and Garmin and Rand McNally (mobile navigation for professional drivers).
2
Table of Contents
Competitors in the PPL segment include Garmin, Tom Tom and Navman for personal navigation devices, and Coyote and Road Angel for GPS products.
The Company’s main competitive factors are product performance, reliability, price, availability, timely introduction of new products and service.
As of December 31, 2010, the Company employed 111 persons in the United States and 41 persons in its international operations. None of the Company’s employees are a member of a union.
Information by Segment and Geographic Area
The consolidated entity consists of Cobra Electronics Corporation and its subsidiaries in Hong Kong, Ireland and United Kingdom. The Company segregates and reports its operating results into the Cobra Consumer Electronics (“Cobra”) business segment, which sells under the COBRA brand name, and the Performance Products Limited (“PPL”) business segment, which sells under the SNOOPER brand name. The Cobra segment is comprised of Cobra Electronics Corporation, Cobra Electronics (HK) Limited (“CHK”) and Cobra Electronics Europe Limited (“CEEL”).
Long–lived assets located outside of the United States totaled $7.2 million and $8.0 million at December 31, 2010 and 2009, respectively. International sales, primarily in Canada and Europe (including those of PPL), were $29.1 million, $25.5 million and $35.1 million in 2010, 2009 and 2008, respectively. For additional financial information about business segment and geographic areas, see Note 4 to the Consolidated Financial Statements included in Item 8 of this Annual Report on Form 10-K.
Principal products marketed under the Cobra tradename include:
| Ÿ | Radar detection |
| Ÿ | Photo-enforcement and safety detection |
| Ÿ | Mobile navigation for professional drivers |
| Ÿ | Citizens Band radios |
| Ÿ | Power inverters and jumpstarters |
| Ÿ | Two-way radios |
| Ÿ | Marine electronics |
In the United States, Cobra competes primarily with various manufacturers and distributors of consumer electronics products, principally on the basis of product features and consumer value, and expects the market for its products to remain highly competitive. Cobra also markets its products in over 80 countries through distributors.
Cobra’s products are distributed through a strong, well-established network of nearly 300 retailers and distributors located primarily in the United States, representing nearly 40,000 storefronts where Cobra products can be purchased. Approximately 60 percent of the Company’s sales are made directly to retailers, such as mass marketers, consumer electronics specialty stores, large department store chains, warehouse clubs, television home-shopping and internet retailers, direct-response merchandisers, home centers, specialty stores and a major travel center. Most of the remaining sales are through two-step wholesale distributors that carry Cobra products to fill orders for travel centers, small department stores and appliance dealers, duty-free shops on cruise lines and for export and marine products. Cobra’s primary sales force is composed of independent sales representatives who work on a straight commission basis. The sales representatives do not sell competing products of other companies. In both Canada and Europe, as well as elsewhere throughout the world, the Company utilizes distributors, which sell primarily to retailers. Cobra’s return policies and payment terms are similar to those of other companies serving the consumer electronics market. Cobra products generally must be shipped within a short time after an order is received and, as a result, order backlog is not significant.
Wal-Mart is the only customer that exceeded 10.0 percent of consolidated net sales in any one of the past three years, with net sales of 11.1 percent in 2010, 15.4 percent in 2009 and 11.2 percent in 2008.
Radar Detection
Cobra is the number one brand in the domestic market for integrated radar/laser detectors. Cobra commands the number one market share by offering innovative products with the latest technology. Cobra detectors feature Voice AlertTM Technology, 360 degree detection, Strobe AlertTM Technology, a photo enforcement database and the choice of 6, 9, 14, or 15 Bands. The 2009 detection products featured IntelliMute Pro, which, provided radar-detector-detector (RDD) immunity; Intelliscope, which provided detailed location of photo enforcement cameras; and IntelliView, which provided locations of photo enforcement cameras and radar/laser detection warnings.
3
Table of Contents
The 2010 detection products were the XRS 9550G, XRS 9965 and XRS 9970G. The XRS 9550G is the first radar detector with GPS-enabled photo-enforcement detection that retails for under $200 and includes free lifetime updates to the AURA database, while the XRS 9965 is the first touch screen radar detector and the XRS 9970G is a touch screen radar detector with free lifetime updates to the AURA database. The 2010 detection products feature the following innovations: full color 1.5 inch touchscreen OLED display, 15-Band technology, battery voltage meter, Voice-Alert™, IntelliShield™, Intelliview, Intelliview Pro™, Intellimute Pro, 8 point GPS compass and AURA database. Cobra iRadarTM, launched in the fourth quarter of 2010, uses Bluetooth wireless technology to connect the iPhone or iPod Touch ® with the detector and allows the driver to control the detector’s settings and access to the AURA redlight and speed camera database utilizing the power of the iPhone. Cobra iRadar received three awards in 2010 from the Specialty Equipment Market Association (“SEMA”), a 2011 design and innovation award from the Consumer Electronics Show (“CES”) and a 2011 Mac/Life innovation award.
The Cobra iRadar system for Android users will be available in the first quarter of 2011. Location-based crowd sourcing database capabilities that store location-based signals from the Cobra iRadar user community and allow sharing of information with other users will be offered as an enhancement later in 2011. The re-engineered Formula R and S Series detectors for 2011 feature a sleek and compact profile (30 percent smaller than previous models), stunning visual design, advanced technology, decorative badges and affordable price-points. The ultra performance Formula R Series XRS 9670 and XRS 9770 feature 15 band detection, Intellishield Tri-Level City mode, Smart Power, advanced DigiView data display and an 8-point compass at price points starting at less than $160. The high performance Formula S Series XRS 9370, XRS 9470 and XRS 9570 feature 14 band detection, city/highway selector, auto-mute, LaserEye TM 360 laser detection and voice alerts at price points starting at less than $90.
Photo-Enforcement and Safety Detection
In 2008, Cobra began marketing in North America a database of photo-enforcement locations as a feature of its high-end radar detectors, drawing on the experience of PPL and its success in the UK and throughout Europe. Based on consumer response, Cobra rolled out the AURA database, the only verified photo-enforcement database in North America, in January 2009. In addition to providing a unique feature offering for the Company’s top-selling line of radar detectors and its mobile navigation products for the professional driver, the AURA database will be marketed separately with photo-enforcement detection devices and may be licensed to other companies. The SL 3, introduced in 2009, is a speed camera and red-light detector that uses the AURA database.
In January 2010, the Company announced its AURA camera and driving hazard database would be included in Motorola GPS navigation systems in North America and Europe. This marks the first time consumer personal navigation devices, other than those offered by Cobra, will feature speed and redlight camera detection, as well as speed traps and dangerous intersection alerts, as standard features on a GPS device. Consumers will be offered a trial period and then be required to purchase a subscription to continue having access to the data.
Mobile Navigation For Professional Drivers
The Company’s mobile navigation strategy is to pursue niche products based on the PPL platform, which offers overall lower development costs. Accordingly, in 2009, Cobra extended its focus on the professional driver and introduced the 7700 PRO. It is a GPS navigation system for professional drivers and includes the following features: 7 inch screen, AURA database, ability to customize by truck type, size and load, truck-specific routing and over 33,000 trucker points of interest. The 7700 PRO includes points of interest from the ProMiles® database and commercial vehicle service and support information powered by TruckDown™. The 7750 PLT introduced in August 2010 featured enhanced graphics, junction view with lane assist, state mileage log and hours-of-service log in addition to the features of the predecessor 7700 PRO. The 7750 PLT was selected as an Innovations 2011 Design and Engineering Award honoree by the Consumer Electronics Association (“CEA”). A GPS trucker navigation system with a 5 inch screen and a retail selling price under $300 will debut in the first quarter of 2011.
Citizens Band Radios
Cobra is the leading brand in the domestic Citizens Band radio market. Most of this market is for mobile Citizens Band radios purchased primarily by professional truck drivers. The remaining part of the domestic market is for hand-held Citizens Band radios used for sport and recreational activities. Cobra has a history of being the technology leader in this market, Cobra Citizens Band radios feature NOAA all hazard alert radio, SoundTrackerTM noise reduction, NightWatchTM illumination, and Bluetooth technology.
Cobra looks for opportunities to introduce limited edition Citizens Band radios that are intended to drive incremental sales. Historically, Cobra has licensed Harley-Davidson®, Dale Earnhardt® and Dale Earnhardt Jr.® trademarks for this purpose. In 2007, Cobra offered a limited edition chrome model and followed up with a black chrome limited edition model in 2008. The Army Strong® model (29 LTD Army) was introduced in 2009 and a limited edition 50th anniversary 29 LX LE model was introduced in 2010.
The 29 LX LE product introduced as a limited edition anniversary model in 2010 will be continued in 2011 as the 29 LX. The 29 LX LE features a revolutionary patented design, four-color LCD display, an ergonomic microphone, a weather alert scan and an industry first, Radio Check Diagnostic, which allows drivers to monitor RF output, SWR setting and battery voltage. The 29 LX will have the same features as the 29 LX LE as well as new features such as an alarm clock and duty timer.
4
Table of Contents
Power Inverters
In 1997, the Company introduced its first line of power inverters, which permit users to power devices requiring 120-volt AC power, such as computers, video games and appliances, using the 12-volt outlet in a vehicle. Cobra’s broad range of products extends from low power 130 watt requirements to applications that draw as much as 2,500 watts. For example, the CPI 150 micro size inverter includes a USB port for an iPod®, Blackberry®, mobile phones, laptops and many more USB devices and is available for sale at most major airports in the United States. The CPI 2500 is used by many professional drivers and can power microwaves, refrigerators and other small appliances. All inverter models offered include USB output and provide Pentagon™ protection, which includes reverse polarity, low voltage, over voltage, temperature and low voltage alarm. Eco-friendly packaging will be featured on selected inverter products in 2011.
Two-Way Radios
Cobra two-way radios feature the smallest high-powered radios, VibrAlertTM silent vibrating alert, lithium battery power and Rewind Say-AgainTM to differentiate from competitors. In 2009, all products were lead-free products, in accordance with RoHS standards, and featured smaller eco-friendly packaging. In 2010, the clamshell packaging design was replaced by a paperboard package, reducing plastic use by 50 percent and the overall packaging footprint by 10 percent. The current product line offers four conventional battery units (CXT 105/125/225/425) and four lithium ion units (CXR 725/825/920/925). All products feature smaller and environmentally friendly packaging, longer ranges (except for the CXR 920) and ultra-clear, high performance reception. In addition, the CXR 725/825/920/925 includes the patented VibrAlert® technology while the CXR 725/825/925 includes the Rewind-Say-Again™ feature. Although this market has matured and continued category sales declines are expected, the Company expects to maintain a leading market position.
Marine Electronics
Cobra marine products feature the largest illuminated LCD display, Rewind Say-AgainTM, combination VHF/GMRS radio, combo speaker –microphone, and a marine Bluetooth microphone. The Company entered into an agreement with Sea Tow in 2009 to provide Cobra VHF radio products to Sea Tow Command. Sea Tow is an international marine assistance organization with over 110 locations that offers 24 hour support to its 160,000 members in the recreational boating community. Also late in 2009, the Company announced a long-term agreement to distribute the popular European C-pod Security System, provided by Seakey AB in Sweden, and serve as the exclusive U.S. distributor of C-pod©.
In 2010, two floating handheld VHF radios were introduced with a bright orange core, making these floating radios highly visible to facilitate retrieval by the boater. The MR HH 330 features a 6-watt VHF with NOAA weather channels. The MR HH475 features a 6-watt VHF, NOAA weather channels and Bluetooth technology that allows the answering of cell phones.
Other Products
Cobra introduced four jumpstarter models (CJS 50, CJI 150, CJIC 250 and CJIC 350) in 2009. These products offer consumers a safe and convenient means to start their vehicle if the battery is low, and each model will hold a charge while stored in the vehicle for up to three months. The jumpstarter models offer the following features: 12V DC output, 120V AC outlet, LED worklight, USB power port and safety switch. Additionally, the CJIC 250 and 350 models include an air compressor and gauge and can be used to inflate a flat tire.
Cobra PhoneLynx system, introduced in November 2010, allows users to make and receive cell phone calls on any phone, thereby eliminating the need for landline phone services. ClearCallTM noise cancelling technology allows PhoneLynx to deliver exceptional call clarity. PhoneLynx requires no connection other than an electrical outlet and involves no fees of any kind. Other products that promise to eliminate the need for a landline require an internet connection and many charge a monthly or annual service fee. PhoneLynx received two CES awards for design and innovation in 2011.
Products marketed by PPL include personal navigation devices, marketed under the trade name of Snooper Truckmate, Snooper Ventura, Snooper Sapphire Plus, and others, and GPS-enabled speed camera location detectors, marketed under the trade names of Snooper My Speed and Snooper 3 Zero, among others. PPL also markets under the AURA brand, a global database of speed camera locations and other driving hazards, such as high-accident zones, for driver safety.
Sales are primarily in the UK, however European sales, increased 1.4 percent in 2010 from 2009 and represented 29.8 percent of net sales in 2010 compared to 37.1 percent in 2009. Sales are made through a network of approximately 1,500 retailers and distributors and PPL’s website.
Principal products marketed by PPL include:
| Ÿ | Personal navigation |
| Ÿ | Speed camera locators |
5
Table of Contents
| Ÿ | Outdoor leisure products |
| Ÿ | AURA database |
Personal Navigation
Snooper portable satellite navigation systems include the very best street level mapping from a global supplier of digital maps and Snooper’s market leading speed camera detector technology. Portable satellite navigation systems from Snooper are award winning, utilizing TMC traffic information technology, Bluetooth hands free and multi routing technology.
The Snooper Truckmate is a personal navigation device with dedicated routing within the UK and Europe for trucks, buses, motor homes and other large vehicles. Information available includes low bridges, weight restrictions and width limitations. Entering specific vehicle information enables the device to select the most appropriate route. In 2010, the product line was expanded to include the following:
| Ÿ | S6000 Truckmate/ S6000 Ventura – 7 inch screen version of the S2000 Truckmate/ S2000 Ventura products, also incorporating TMC traffic information technology and Bluetooth connectivity. |
| Ÿ | AVN S7000 Truckmate/ AVN S7000 Ventura – the S7000 unit which includes a motorized screen designed to be installed into a vehicle using a single din slot. In addition to the standard S7000 Truckmate/ S7000 Ventura features the AVN unit also includes a DVD/CD player, radio tuner plus iPod connectivity. |
In November 2010, the Snooper Truckmate S7000 was recognized by Trucking Magazine with a Trucking Test Winner Award and a 5-star rating.
Speed Camera Locators
PPL markets speed camera detection devices, including the Snooper Sapphire and the Snooper Evolution, which use GPS location technology and the AURA database to alert drivers to upcoming speed camera and hazard locations. In the first quarter of 2010, the Snooper MySpeed GPS detector was introduced. This unit uses the latest GPS technology to allow an end user to be continually advised of the speed limit of the road he or she is travelling on. The MySpeed unit can also be upgraded to a MySpeed AURA, which allows an end user to be advised of all new speed camera and other hazards by linking to the AURA database.
Outdoor Leisure Products
In 2010, the S430 Shotsaver golf unit was launched. The unit incorporates a super-bright 3.5 inch OLED screen making it easy to read in all conditions. The unit features a built in rechargeable battery capable of running for 12 hours and is fully waterproof, ensuring it functions in all types of weather conditions. The unit can be purchased with or without satellite navigation capabilities and offers a complete golf course management tool for over 4,500 golf courses in the UK and Western Europe and includes distance calculations.
The Shotsaver S400 Laser range finder was added to the range of golf products in 2010 and allows golfers to accurately determine their distance to various targets from a range of up to 250 yards utilizing the most up to date laser technology available.
The A3500 Adventurer, an outdoor GPS portable navigation system with complete coverage of Great Britain using Ordnance Survey® Landranger® 1:50,000 scale maps, was launched in the fourth quarter of 2010. The unit features a 3.5 inch OLED screen to give much better screen definition, and it can also be purchased with Snooper’s in-car satellite navigation, featuring turn by turn navigation and AURA speed camera detection technology.
AURA Database
PPL markets a proprietary AURA database that provides drivers with advance notice of upcoming speed camera and hazard locations. The database provides a competitive advantage because unlike database capabilities of competitors, the AURA database is updated on a daily basis and makes information available to its subscribers 24 hours a day, 7 days a week, thereby making new speed camera locations readily available to customers.
Other Products
In 2010 PPL expanded its product range to other areas where management considered there was a potential market. These products included the following:
| Ÿ | E-Bike – a compact, lightweight folding electric bike, ideal for either commuting or outdoor leisure use. It has a top speed of 15 mph and a maximum range of 50 miles before requiring re-charging. |
| Ÿ | WPT250M tracker – The WPT250 is a tracking device that uses GPS, GPRS and GSM technology to monitor the location of any boat, vehicle, pet or individual with an accuracy of 2.5 meters. By using the MyTrack LIVE web tracking service, any item can be tracked in real time, and can even be used on mobile phones which have internet access. |
6
Table of Contents
The Company’s website address is “www.cobra.com”. The Company’s annual report on Form 10-K, quarterly reports on Form 10-Q, current reports on Form 8-K, and all amendments to those reports filed or furnished pursuant to Section 13(a) or 15(d) of the Exchange Act are available free of charge through our website, as soon as reasonably practicable after such material is electronically filed with or furnished to the Securities and Exchange Commission (the “SEC”). We include our website address in this annual report on Form 10-K only as an inactive textual reference and do not intend it to be an active lead to our website.
Executive Officers of the Registrant
As of the date of this filing, the executive officers of the Company are as follows:
| Name, Age and Present Position |
Has Held Present Position Since |
Prior Business Experience In Past
Five | ||||
| James R. Bazet, 63 |
Sept. 2008 | President and Chief Executive Officer, 1998 to 2008. | ||||
| Chairman of the Board, President and Chief Executive Officer* |
||||||
| Sally A. Washlow, 40 |
July 2010 | Vice President Product Development and Marketing, 2007 to 2010, Vice President Marketing and Consumer Products, 2006 to 2007. | ||||
| Senior Vice President Marketing and Sales |
||||||
| Robert J. Ben, 46 |
Jan. 2011 | Vice President - Corporate Controller, 2007 to 2010, Senior Corporate Controller, 2006 to 2007. | ||||
| Vice President - Corporate Controller and Interim Chief Financial Officer |
||||||
| Gerald M. Laures, 63 |
March 1994 | Vice President - Finance and Corporate Secretary, 1994 to present. | ||||
| Vice President - Finance and Corporate Secretary |
||||||
| * | Also a director |
7
Table of Contents
This section identifies certain risks and uncertainties that the Company faces. If the Company is unable to appropriately address these and other circumstances that could have a negative effect on its business, the Company’s business may suffer. Negative events may decrease revenues, increase costs, negatively affect financial results and decrease financial strength, thereby, causing the price of the Company’s stock to decline.
Business, financial condition or results of operation could be adversely affected by the inability to enhance existing products or introduce new products to meet consumer preferences, including timely introductions as new consumer technologies are introduced.
Management believes that the Company’s future success depends upon its ability to predict and respond in a timely and effective manner to changes in the markets it serves. Consequently, the Company strives to introduce distinctive new products that anticipate changing consumer demands and capitalize upon emerging technologies. If the Company fails to introduce or suffers delays in introducing new products, misinterprets consumer preferences or fails to respond to changes in the marketplace, consumer demand for our products could decrease and our brand image could suffer. In addition, competitors may introduce new designs or technologies, undermining our products’ desirability. If any of the foregoing occurs, our business, financial condition or results of operations could be materially harmed.
Failure to maintain relationships with key customers and failure by key customers to purchase expected quantities of our products could have an adverse effect on our business.
Cobra products are distributed through a network of nearly 300 retailers and distributors in the United States and 38 distributors in Europe and elsewhere around the world. PPL products are sold through a network of 1,500 retailers and distributors in Europe. The Company’s success is dependent upon the ability to retain an existing base of customers to sell the Company’s products. Loss of customers means loss of product placement and, consequently, a possible reduction in sales volume.
Certain of the Company’s customers account for a large portion of the Company’s net sales. For instance, in 2010 sales to Wal-Mart were 11.1 percent of net sales. We anticipate that Wal-Mart will continue to account for a significant portion of our net sales in the foreseeable future. Customers are not obligated by any firm, long-term purchase commitments for our products. As a result, customers may cancel purchase commitments or reduce or delay orders on relatively short notice. The loss of sales to or a material delay in orders from, our key customers could materially harm our business, financial condition and results of operations.
If the Company is unable to obtain sufficient amounts of high quality products on a timely basis, customer needs may not be met and reduced sales may result.
Substantially all products are manufactured by third party manufacturers located outside of the United States, primarily in China, Hong Kong and South Korea. The ability to meet customers’ needs depends on the ability to maintain an uninterrupted supply of products from multiple third party manufacturers. While the Company purchases most products from multiple third party manufacturers, business, financial condition or results of operations could be adversely affected if any of the principal third party manufacturers experience production problems, lack of capacity or transportation disruptions. The Company utilizes multiple manufacturers for its products whenever practical, however certain products are dependent on a single manufacturer. Additionally, certain of our third party manufacturers serve other customers, a number of which have greater production requirements than we do. As a result, third party manufacturers could determine to prioritize production capacity for other customers or reduce or eliminate services for us on short notice. The extent to which changes in third party manufacturers would have an adverse effect on the Company’s business depends upon the timing of the changes, the product or products that the third party manufacturers produce and the volume of production.
Dependence on third party manufacturers for products subjects the Company to the risk of supplier failure and customer dissatisfaction with the quality or performance of such products. Quality or performance failures by third party manufacturers or changes in their financial or business condition, which affects their production, could disrupt the ability to supply quality products to customers and thereby materially harm our business, financial condition and results of operations.
Shortages of components and materials may disrupt the supply of products.
The inability of third party manufacturers to obtain sufficient quantities of components and other materials used in our products could disrupt the supply of products or increase costs. Materials and components for some products may not be available in sufficient quantities to satisfy sales requirements as a result of supply shortages. Supply interruptions relating to products could result in lost sales opportunities which may harm our business, financial condition and results of operations.
Impact of higher commodity prices and increased labor costs overseas.
Substantially all products are manufactured by third party manufacturers in China, Hong Kong and South Korea. Labor costs, particularly in China, are rising as are the costs of certain components used in our products because of higher commodity prices. To the extent we are not able to increase the prices of our products to offset these increased labor and component costs, our profitability and cash flow may be adversely affected.
8
Table of Contents
Reliance on retailers and third party distributors to sell our products.
Cobra products are sold through a network of nearly 300 retailers and distributors in the United States and 38 distributors in Europe and elsewhere around the world. PPL products are sold through a network of 1,500 retailers and distributors in Europe. Certain distributors market competitors’ products. The loss, termination or failure of one or more of the distributors to effectively promote our products could affect the Company’s ability to bring its products to market and could reduce sales. Changes in the financial or business condition of these distributors and retailers could also affect the level of their purchases of our products which could materially harm our business, financial condition and results of operations.
The Company competes with a large number of companies in the consumer electronics business, and if we are unable to compete effectively, our business, financial condition and results of operations may be materially affected.
The Company encounters strong competition from a number of companies in the consumer electronics business. Some of our current and potential competitors have longer operating histories, larger customer bases, greater brand recognition and significantly greater financial resources than we do. Competition is based principally on the introduction of new products and pricing. Competitors may have greater resources and operating and financial flexibility to introduce new products and withstand changes in pricing. To compete for sales, the Company may have to lower its prices or increase its investment in development of new technologies, which could reduce gross margin and adversely affect our business, financial condition and results of operations. There is no assurance that the Company will continue to compete effectively against existing and new competitors that may enter our markets.
A downturn in global economic and market conditions could negatively impact our business, financial condition and results of operations.
The consumer electronics products sold by the Company are generally discretionary purchases for consumers. Consumer spending is affected by many factors, including consumer confidence levels, interest rates, tax rates, employment levels and prospects and other general economic conditions. The current economic slowdown and recession in the United States and worldwide economies has and could continue to decrease the demand for products and adversely affect sales. Since economic and market conditions vary within the Company’s business segments, the Company’s future performance by business segment will accordingly vary. In addition, deteriorating or weak economic conditions, or the forecast or perception of the same, may trigger changes in inventory levels at our retail customers, including a reduction in product offerings and out of stock situations, which may adversely affect our results of operations. Also, the cash surrender value of life insurance policies owned by the Company for the purpose of recovering the costs of deferred compensation programs for several current and former officers of the Company is affected by the market value of the underlying investments. Adverse market conditions may result in a decline in the cash surrender value of these life insurance policies, which would result in a non-cash expense that reduces our net income and would also reduce the collateral base available for our secured credit facility.
International markets expose us to political and economic risks in foreign countries, as well as to risks relating to currency values and import/export policies.
Substantially all of our products are manufactured to our specifications and engineering designs by suppliers located primarily in China, Hong Kong and South Korea. In addition, international sales, primarily in Canada and Europe, represent a significant portion of our total sales. International activities pose risks not faced by companies that limit themselves to the United States market. These risks include:
| Ÿ | changes in foreign currency exchange rates; |
| Ÿ | exchange controls; |
| Ÿ | changes in a specific country’s or region’s political or economic conditions; |
| Ÿ | issues affecting health and safety in specific countries or regions; |
| Ÿ | tariffs, quotas, trade barriers, other trade protection measures in the United States or foreign countries and import or export licensing requirements; |
| Ÿ | increased shipping costs, disruptions in shipping or reduced availability of freight transportation; |
| Ÿ | difficulties in enforcing remedies in foreign jurisdictions and compliance with applicable foreign laws; |
| Ÿ | difficulties to recover inventory and equipment from vendors seeking protection pursuant to local bankruptcy laws; |
| Ÿ | potentially negative consequences from changes in tax laws; and |
| Ÿ | different regulatory structures and unexpected changes in regulatory requirements. |
Revenues and purchases are predominately in U.S. dollars; however, a portion of revenue is collectible in other currencies, principally euros and British pound sterling. The Company historically has negotiated substantially all of its purchases in U.S. dollars and, in the case of PPL, occasionally uses forward contracts to purchase dollars at a fixed exchange rate to the British pound sterling. The Company considers
9
Table of Contents
opportunities to make purchases in other currencies, such as the euro, to the extent that doing so would be advantageous in light of currency fluctuations involving the U.S. dollar and other currencies. As sales expand in international markets, customers may increasingly make payments in currencies other than U.S. dollars, which could have a considerable effect on margins. The Company frequently hedges foreign currency fluctuations; however, it may not be able to fully hedge against the risks of such fluctuations and future exchange rate fluctuations could materially affect our operating results.
The Company is subject to various governmental regulations that could adversely affect the business.
The Company’s operations are subject to various federal, state and local regulatory requirements, including those relating to environmental, health and safety matters. The Company could become subject to liabilities as a result of a failure to comply with applicable laws and could incur substantial costs to comply with existing or new, more stringent regulations. In addition, the use of the Company’s products is also governed by a variety of federal, state and local regulations, including the regulations of the Federal Communications Commission, and changes in such regulations may affect demand for our products.
The Company is subject to governmental regulation in the countries in which it operates.
The Company’s business is subject to governmental regulations in the countries in which it operates. From time to time, such governments may consider proposed legislation relating to the regulation of products that we or our subsidiaries sell. The loss of sales as a result of any such regulations and any similar legislation could materially harm our business, financial condition and results of operations.
Mobile navigation devices and other GPS-enabled products depend upon a network of satellites maintained by the United States Department of Defense. If these satellites become inoperable or the policies of the United States regarding civilian use of the GPS system change, there would be a material effect on our business.
The global positioning system capabilities of our products function through a network of satellites launched, operated and maintained by the United States Department of Defense. Should the satellites or underlying support systems become inoperable or if the United States government were to choose to degrade the quality of signals available to civilians, GPS products will not function as designed and there would likely be an adverse effect on demand for these products. Additionally, the Department of Defense does not currently charge users for access to the signals used by these devices and any move to do so could affect the economics of our business.
If we are unable to enforce or defend our rights with respect to intellectual property, our business may be adversely affected.
The Cobra trademark is a key factor in the marketing of our products. Trademark protection with respect to the Cobra trademark in the United States could be subject to challenge in some product areas. In addition, the Company may not be able to obtain trademark protection for the Cobra trademark in each country in which it sells products. If we are unable to use the Cobra trademark with respect to some products or in some markets, our results of operations could be adversely affected.
The Snooper trademark is a well-known trademark in the United Kingdom and Europe and contributes to the success of PPL. If we are unable to use the Snooper trademark in the United Kingdom or in other areas where PPL is expanding its business, our results of operations could be adversely affected.
The Company licenses patents for use in certain of our products, particularly navigation products. If the patents are challenged, or third parties claim that products infringe upon the intellectual property rights of others, the Company may incur significant costs to defend its intellectual property rights and may not ultimately be successful. If any of our products are determined to have infringed upon the intellectual property rights of others, the Company may face substantial damages as well as injunctive relief which could effectively block our ability to market these products in the United States and abroad. Such a judgment could materially harm our business, financial condition and results of operations.
We may be required to record impairment charges for intangible assets in future periods.
The carrying value of intangible assets totaled $9.3 million at December 31, 2010. We test for impairment whenever evidence of impairment exists. Impairment charges, which will reduce net income and may have material adverse effect on financial results, will be recorded when warranted by our financial performance or market conditions.
Our profitability and financial condition depend on our ability to collect on amounts due from customers.
We have significant accounts receivable due from customers. It is not uncommon for a customer to suspend payments of amounts due if the customer experiences operational difficulties. A customer experiencing severe operational difficulties may file for bankruptcy. In these cases, we may be unable to collect on that customer’s outstanding accounts receivable balance. The failure of our customers to pay amounts due could negatively affect our business, financial condition and results of operations.
10
Table of Contents
Our secured credit facility contains restrictive covenants and our failure to comply with those restrictions could result in a default, which could have a material adverse effect on our business, financial condition and results of operations.
Our secured credit facility is our principal source of available liquidity, other than cash generated by operations. As of December 31, 2010, we had $18.0 million of outstanding indebtedness under our credit facility. On July 16, 2010, the Company entered into the Credit Agreement (the “Credit Agreement”) among the Company, Harris N.A., as administrative agent, and the lenders party thereto from time to time. The Credit Agreement provides for a $25.0 million revolving loan facility, which will mature on July 16, 2013. The Credit Agreement contains customary covenants, including but not limited to financial covenants requiring the Company to maintain a Fixed Charge Coverage Ratio (as defined in the Credit Agreement) of 1.10 to 1.00 for the periods set forth in the Credit Agreement and annual capital expenditures cannot exceed $3.5 million. Our credit facility contains a number of significant restrictions that limit our ability to, among other things, do the following:
| Ÿ | incur additional indebtedness; |
| Ÿ | grant liens on assets; |
| Ÿ | merge, consolidate or dispose of our assets; or |
| Ÿ | pay dividends to shareholders in 2011 in excess of $1,250,000. |
The secured credit facility also requires compliance with certain financial covenants. A breach of the covenants contained in the credit facility could result in any outstanding indebtedness under the credit facility becoming immediately due and payable and in our inability to borrow additional funds under the credit facility, either of which could adversely affect our business, financial condition and results of operations.
Our inability to secure credit that we may require in the future may negatively impact liquidity.
In the current credit environment it is increasingly difficult for businesses to secure financing. If we require additional financing in the future, we may be unable to secure financing or may only be able to secure financing on terms which could have a material adverse effect on our business, financial condition or results of operations.
Economic conditions may limit the access to credit needed by our customers and suppliers.
Our business may be adversely impacted by the availability of credit and consumer spending rates. Recent deterioration of national and global economic conditions and its impact on the credit environment could materially adversely impact our business, financial condition or results of operations. The financial stability of our customers or suppliers may be compromised, which could result in additional bad debts for the Company or non-performance by suppliers. Uncertainty about current global economic conditions and the higher costs or unavailability of credit may cause consumers of our products to postpone spending in response to tighter credit, negative financial news and/or declines in income or asset values. In some cases our customers or suppliers may be unable to stay in business. This could have a material adverse impact on the demand for our products and on our business, financial condition and operating results.
Sales of our products are subject to seasonal variations and, as a result, our quarterly operating results may fluctuate and may not be a reliable indicator of our future performance.
Because mass retail accounts make up an increasing portion of the business, sales orders in the fourth quarter frequently are stronger than orders in first, second and third quarters. Consequently, our results of operations during any particular quarter should not be relied upon as an indication of our results for a full year or any other quarter. In addition, if investors inaccurately estimate our results of operations in one or more future quarters and our operating results fall below expectations, our stock price may decline.
The price of our common stock may be subject to sudden decreases due to the inherent volatility of operating and competitive factors.
The market price of the Company’s common stock may be highly volatile and subject to wide fluctuations in response to various factors. We have experienced extreme price and volume fluctuations with respect to the Company’s common stock. The market price of our common stock is dependent upon, but not limited to:
| Ÿ | press releases or publicity relating to the Company or its competitors or relating to trends in the consumer electronics industry; |
| Ÿ | changes in the legal or regulatory environment affecting our business; |
| Ÿ | changes in expectations as to future financial performance, including financial estimates by securities analysts and investors; |
| Ÿ | the operating and stock performance of other companies that investors may deem comparable; |
11
Table of Contents
| Ÿ | developments affecting us, customers or suppliers; and |
| Ÿ | general domestic or international economic, market and political conditions. |
These factors may adversely affect the trading price of our common stock, regardless of our actual operating performance, and could prevent our stockholders from selling their common stock at or above the price at which they purchased it. In addition, the stock markets from time to time experience extreme price and volume fluctuations that may be unrelated or disproportionate to the operating performance of companies. In the past, some stockholders have brought securities class action lawsuits against companies following periods of volatility in the market price of their securities. We may in the future be the target of similar litigation. Securities litigation, regardless of whether we are ultimately successful, could result in substantial costs and divert management’s attention and resources.
The loss of key members of our management and technical team may adversely affect our business.
The Company’s success depends on the performance of key management, sales, technical and other critical personnel and our ability to continue to attract, motivate and retain management and highly qualified key personnel. Failure to do so could disrupt our operations, adversely affect customer relationships and impair the ability to successfully implement and complete Company initiatives. The loss of any services of any key management or technical personnel could make it more difficult to successfully pursue business goals. In addition, the Company may not be as successful as its competitors at recruiting, assimilating and retaining key personnel.
Our performance depends on favorable relations with our employees and our ability to attract and retain them. Any deterioration of those relations, increase in labor costs or inability to attract and retain employees could adversely affect our business, financial condition and results of operations.
Any significant deterioration in employee relations increases in labor costs or shortages of labor at any facility could have a material adverse effect on our business, financial condition and results of operations. As of December 31, 2010, none of our employees were covered by collective bargaining agreements. A slowdown or work stoppage at one facility that lasts for a significant period of time could cause lost sales and increased costs and could adversely affect the Company’s ability to meet customers’ needs.
Business could be adversely affected by a disruption to our Chicago, Illinois and Runcorn, UK facilities.
Our Chicago, Illinois facility accounts for 81 percent of the total space utilized by the Company or 92 percent of the space utilized by the Cobra segment. The Runcorn, UK facility accounts for 12 percent of the total space utilized by the Company or 100 percent of the space utilized by the PPL segment. Therefore, any disruption to our operations at either of these facilities could adversely impact our performance and impair our ability to deliver products and services to customers on a timely basis. Operations at the Chicago, Illinois and Runcorn, United Kingdom facilities could be disrupted in the event of:
| Ÿ | damage to, or inoperability of, its warehouse; |
| Ÿ | a hardware or software error, failure or crash; |
| Ÿ | a power or telecommunications failure; or |
| Ÿ | fire, flood or other natural disaster. |
Any disruption could damage the Company’s reputation and cause customers to cease purchasing products from the Company. The Company could be subject to claims or litigation with respect to these losses. The Company’s property and business interruption insurance may not adequately compensate us for all of the losses that we may incur.
Damage to or disruptions in the operations of our computer infrastructure and software systems could harm our business, financial condition and results of operations.
The unavailability of any of our information management systems for any significant period of time could have a material adverse effect on our operations. In particular, our ability to deliver products to our customers when needed, collect receivables and manage inventory levels successfully largely depends on the efficient operation of our computer hardware and software systems. Our information management systems are potentially vulnerable to damage or interruption from a variety of sources, including but not limited to computer viruses, security breaches, energy blackouts, natural disasters, terrorism, war and telecommunication failures. There also may be system or network disruptions if new or upgraded business management systems are defective or are not installed properly. Any system failure or security breach could negatively impact our business and results of operations. In addition, we may incur additional costs to remedy the damages caused by these system failures or security breaches.
Our internal controls over financial reporting may not be considered effective, which could result in possible regulatory sanctions and a decline in our stock price.
Section 404 of the Sarbanes-Oxley Act of 2002 requires us to furnish annually a report on our internal controls over financial reporting. The internal control report must contain an assessment by our management of the effectiveness of our internal controls over financial reporting
12
Table of Contents
(including the disclosure of any material weakness). The Sarbanes-Oxley Act requires, among other things, that we maintain effective disclosure controls and procedures and internal controls over financial reporting. In order for management to evaluate our internal controls, the Company must regularly review and document its internal control processes and procedures and test such controls. Ultimately, the Company could conclude that our internal control over financial reporting may not be effective if, among other things:
| Ÿ | any material weakness in our internal controls over financial reporting exist; or |
| Ÿ | assessed deficiencies are not remediated. |
Due to the number of controls to be examined, the complexity of the project, and the subjectivity involved in determining the effectiveness of controls, we cannot be certain that, in the future, all of our controls will be considered effective by management.
If, as required by the Sarbanes-Oxley Act, the Company is unable to assert that its internal control over financial reporting is effective, the Company could be subject to regulatory sanctions or lose investor confidence in the accuracy and completeness of the financial reports, either of which could have an adverse effect on the market price for the Company’s common stock.
The Company may be unable to successfully consolidate and integrate the operations of acquired businesses, such as PPL, which may adversely affect the Company’s stock price, operating results and financial condition.
The Company must consolidate and integrate the operations of acquired businesses with our business. In 2006, the Company completed the acquisition of PPL, a consumer electronics company based in the United Kingdom. The success of any acquisition, including the acquisition of PPL, will depend on our ability to integrate assets acquired and personnel in these transactions. Integration efforts often take a significant amount of time, place a significant strain on our managerial, operational and financial resources and could prove to be more difficult and expensive than we predicted. The diversion of our management’s attention and any delays or difficulties encountered in connection with any acquisitions, including the acquisition of PPL, and any future acquisitions that may be consummated, could result in the disruption of our ongoing business or inconsistencies in standards, controls, procedures and policies that could negatively affect our ability to maintain relationships with customers, suppliers, employees and others with whom the Company has business dealings.
Effects of climate change on the Company’s business.
Global warming could result in a significant reduction in demand for certain of the Company’s products, such as radar detectors and Citizens Band radios, as surface transportation is constrained by flooding of coastal areas making roads and highways impassable.
13
Table of Contents
Item 1B. Unresolved Staff Comments
None.
The Company’s office and warehouse facilities in the United States, Hong Kong and Europe are as follows:
| Segment |
Location |
Owned or |
Utilization | |||
| Cobra |
Chicago, Illinois | Owned | Office and warehouse space | |||
| Cobra |
Kowloon, Hong Kong | Leased | Office space | |||
| Cobra |
Dublin, Ireland | Leased | Office space | |||
| Cobra |
Gent, Belgium | Leased | Warehouse space | |||
| PPL |
Runcorn, United Kingdom | Leased | Office and warehouse space |
The Company is subject to various unresolved legal actions and proceedings, which arise in the normal course of its business. None of these actions is expected to have a material adverse effect on the Company’s financial condition or results of operations.
14
Table of Contents
Item 5. Market for the Registrant’s Common Equity, Related Shareholder Matters and Issuer Purchases of Equity Securities
The Company’s common stock trades on The NASDAQ Stock Market under the symbol COBR. As of March 4, 2011, the Company had approximately 461 shareholders of record and approximately 770 shareholders for whom securities firms acted as nominees. The Company’s common stock is the only class of equity securities outstanding.
| STOCK PRICE RANGE AND DIVIDENDS | ||||||||||||||||||||||||
| 2010 | 2009 | |||||||||||||||||||||||
| Quarter |
High | Low | Dividends Declared |
High | Low | Dividends Declared |
||||||||||||||||||
| First |
$ | 3.02 | $ | 1.51 | $ | - | $ | 1.46 | $ | 0.81 | $ | - | ||||||||||||
| Second |
3.02 | 2.01 | - | 1.90 | 0.86 | - | ||||||||||||||||||
| Third |
2.75 | 1.60 | - | 1.82 | 1.03 | - | ||||||||||||||||||
| Fourth |
3.30 | 1.96 | - | 1.80 | 1.27 | - | ||||||||||||||||||
| Year |
3.30 | 1.51 | - | 1.90 | 0.81 | - | ||||||||||||||||||
Note: Stock price data compiled from The NASDAQ Stock Market Monthly Summary of Activity Reports.
The Company’s credit facility permits the Company to pay cash dividends subject to the limitations set forth therein.
Refer to Item 12 of Part III of this Annual Report for information with respect to compensation plans under which equity securities of the Company are authorized for issuance.
15
Table of Contents
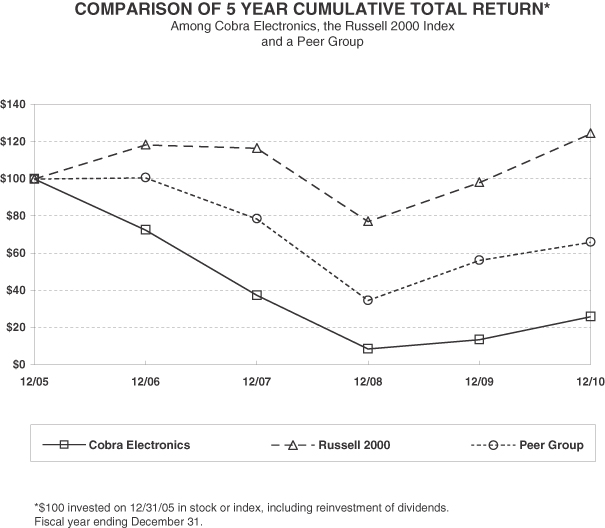
Performance Graph
The following Performance Graph compares the yearly percentage change in the Company’s cumulative total shareholder return on the Company’s Common Stock for the five-year period, December 31, 2005 to December 31, 2010, with the percentage change in the cumulative total return for the Russell 2000 Index and a peer group of companies selected by the Company.
Peer Group consists of Emerson Radio Corporation, Koss Corporation and Audiovox Corporation. In selecting companies for the peer groups, the Company focused on publicly traded companies that design and market electronics products, which have characteristics similar to that of the Company’s in terms of one or more of the following: type of product, end market, distribution channels, sourcing or sales volume. The returns of each of the companies in the peer groups have been weighted according to their respective stock market capitalizations at the beginning of each period for which a return is indicated.
16
Table of Contents
Item 6. Selected Financial Data
The following table sets forth the Company’s selected financial data for each of the past five years. Read this information together with the consolidated financial statements and notes to those statements included in Item 8 of this Annual Report on Form 10-K and the information set forth under the caption Management’s Discussion and Analysis of Financial Condition and Results of Operations in Item 7 of this Annual Report on Form 10-K.
| Year Ended December 31 |
2010 | 2009 | 2008 | 2007 | 2006 * | |||||||||||||||
| (in thousands, except per share amounts) | ||||||||||||||||||||
| Operating Data: |
||||||||||||||||||||
| Net sales |
$ | 110,520 | $ | 105,229 | $ | 124,745 | $ | 155,935 | $ | 153,695 | ||||||||||
| Net earnings (loss) |
1,577 | (10,272 | ) | (18,839 | ) | (4,422 | ) | (1,630 | ) | |||||||||||
| Net earnings (loss) per share: |
||||||||||||||||||||
| Basic |
$ | 0.24 | $ | (1.59 | ) | $ | (2.91 | ) | $ | (0.68 | ) | $ | (0.25 | ) | ||||||
| Diluted |
0.24 | (1.59 | ) | (2.91 | ) | (0.68 | ) | (0.25 | ) | |||||||||||
| Dividends per share |
$ | - | $ | - | $ | 0.16 | $ | 0.16 | $ | 0.16 | ||||||||||
| As of December 31: |
||||||||||||||||||||
| Total assets |
$ | 74,354 | $ | 75,703 | $ | 78,998 | $ | 114,318 | $ | 116,758 | ||||||||||
| Bank debt |
18,042 | 17,869 | 17,671 | 19,985 | 16,674 | |||||||||||||||
| * | Reflects the acquisition of Performance Products Limited (“PPL”) on October 20, 2006. |
| Item 7. | Management’s Discussion and Analysis of Financial Condition and Results of Operations |
The following management’s discussion and analysis should be read in conjunction with the Company’s audited Consolidated Financial Statements and Notes thereto included elsewhere in this Form 10-K, and any forward-looking statements contained herein or elsewhere in this Form 10-K involve risks, uncertainties and assumptions. Actual results may differ materially from those anticipated in these forward-looking statements as a result of various factors, including, but not limited to, those presented under Risk Factors in Item 1A in this Form 10-K and elsewhere herein.
Executive Summary
The Company had net earnings of $1.6 million, or $.24 per share, for the year ending December 31, 2010 compared to a net loss of $10.3 million, or $1.59 per share, for 2009. The 2009 loss included a net tax valuation allowance charge of $8.4 million.
The following is a summary of the highlights related to the $11.8 million improvement in net earnings reported for 2010 compared to 2009:
| — | Net sales increased $5.3 million, or 5.0 percent, largely due to higher Citizens Band radio sales in the U.S. and higher sales of satellite navigation products in the UK. |
| — | Gross profit in 2010 increased $3.5 million while the gross margin improved to 27.0 percent for 2010 from 25.1 percent for 2009 mainly because of favorable product mix in the U.S. |
| — | Selling, general and administrative expenses decreased $2.0 million, or 6.7 percent, due to lower fixed costs in the U.S. |
| — | Interest expense increased by $415,000, primarily due to the write-off of deferred loan fees. |
| — | Other income in 2010 decreased $377,000 mainly due to lower cash surrender value (“CSV”) and foreign exchange gains. |
| — | A $380,000 tax benefit for 2010 compared to a $6.8 million tax expense for 2009. The 2009 tax expense included an $8.4 million valuation allowance charge. |
17
Table of Contents
EBITDA
Improved operating results in 2010 generated a substantial improvement in EBITDA from the prior year. The following table shows the reconciliation of net income to EBITDA and EBITDA As Defined for the years ended December 31, 2010 and 2009:
| Years Ended December 31 | ||||||||
| 2010 | 2009 | |||||||
| (in thousands) | ||||||||
| Net earnings (loss) |
$ | 1,577 | $ | (10,272 | ) | |||
| Depreciation and amortization |
3,936 | 3,883 | ||||||
| Interest expense, excluding loan fee amortization |
1,012 | 928 | ||||||
| Income tax (benefit) provision |
(380 | ) | 6,762 | |||||
| EBITDA |
6,145 | 1,301 | ||||||
| Stock option expense |
202 | 229 | ||||||
| CSV gain |
(574 | ) | (743 | ) | ||||
| Non-controlling interest |
- | 2 | ||||||
| Deferred revenue, database |
511 | 755 | ||||||
| Other non-cash items |
127 | (435 | ) | |||||
| EBITDA As Defined |
$ | 6,411 | $ | 1,109 | ||||
EBITDA represents earnings before interest, taxes, depreciation and amortization. EBITDA As Defined represents EBITDA adjusted to conform with the EBITDA measurement for compliance with the financial covenants of the Company’s lenders. The Company believes EBITDA is a useful performance indicator and is frequently used by management, securities analysts and investors to judge operating performance between time periods and among other companies. The Company uses EBITDA As Defined to assess operating performance and ensure compliance with financial covenants.
EBITDA and EBITDA As Defined are Non-GAAP performance indicators that should be used in conjunction with U. S. Generally Accepted Accounting Principles (“GAAP”) performance measurements such as net sales, operating profit and net income to evaluate the Company’s operating performance. EBITDA and EBITDA As Defined are not alternatives to net income or cash flow from operations determined in accordance with GAAP. Furthermore, EBITDA and EBITDA As Defined may not be comparable to the calculation of similarly titled measures reported by other companies.
Results of Operations — 2010 Compared to 2009
The following table contains sales and pre-tax income (loss) after eliminating intercompany accounts by business segment for the years ended December 31, 2010 and 2009.
| 2010 vs. 2009 | ||||||||||||||||||||||||
| 2010 | 2009 | Increase (Decrease) | ||||||||||||||||||||||
| (in thousands) | ||||||||||||||||||||||||
| Business Segment |
Net Sales |
Pre-tax Income (Loss) |
Net Sales |
Pre-tax Income (Loss) |
Net Sales |
Pre-tax
Income (Loss) |
||||||||||||||||||
| Cobra |
$ | 95,797 | $ | 1,203 | $ | 93,305 | $ | (3,596 | ) | $ | 2,492 | $ | 4,799 | |||||||||||
| PPL |
14,723 | (6 | ) | 11,924 | 88 | 2,799 | (94 | ) | ||||||||||||||||
| Total Company |
$ | 110,520 | $ | 1,197 | $ | 105,229 | $ | (3,508 | ) | $ | 5,291 | $ | 4,705 | |||||||||||
Cobra Business Segment
Net sales for the Cobra segment grew in 2010 by $2.5 million, or 2.7 percent, to $95.8 million from $93.3 million in 2009. This growth was attributable primarily to a 26.2 percent increase in sales of Citizens Band radios domestically, as well as an 10.9 percent increase in sales at CEEL. The strong increase in Citizens Band radio sales reflected strong sales of the new patented 29 LX LE, which has a revolutionary new design and new features for the professional driver, as well as the positive effect of an improving economy on truck shipments and discretionary spending by professional drivers at travel centers. The increase in CEEL sales was due to strong sales of radar detectors into Russia and the United Arab Emirates. Partially offsetting these increases was a 16.3 percent decline in sales of radar detection domestically, due mainly to a combination of two less models at a major retailer and, for several major retailers, a shift in purchases to lower priced models or an overall reduction in spending on the category because of the negative effect of high unemployment on discretionary spending by cost conscious consumers.
Cobra’s gross profit increased $3.0 million in 2010 to $25.7 million from $22.7 million, while gross margin improved to 26.7 percent from 24.3 percent, in 2009. The improvement in gross margin was due to gross margin increases in the domestic business and at CEEL.
18
Table of Contents
Domestically, gross margin increased as a result of both a more favorable product mix, because of the strong growth in Citizens Band radio sales and higher gross margin for two-way radios because of decreases in air freight expense and the cost of pricing programs that were required in 2009 to maintain sales volume in the difficult economy. Partially offsetting this improvement in domestic gross margin was a lower radar detection gross margin because of an unfavorable product mix as sales of lower price point, lower margin models increased at several major retailers. CEEL’s gross margin rose because of a favorable product mix, as the percentage of sales of radar detectors, a high margin category, increased while the percentage of sales of PMR two-way radios, a low margin category, decreased.
Selling, general and administrative (“SG&A”) expenses in the Cobra segment decreased $2.5 million, or 9.6 percent, to $23.4 million in 2010 from $25.9 million in 2009, and, as a percentage of sales, declined to 24.5 percent from 27.8 percent. Much of the decrease was in fixed SG&A expenses, which declined $1.6 million, mainly as result of lower discretionary spending for trade shows, media, public relations and professional fees as management focused on containing these expenses. Also contributing to the decrease in SG&A expense was lower variable selling expense due to an increase in the reversal of unused accrued marketing program funds from prior years and lower costs for a major customer because it was switched earlier in the current year to a low price, low program arrangement (with net contribution essentially flat).
Interest expense for 2010 was $414,000 higher than last year mainly due to the write-off of deferred loan fees in 2010. Other income for 2010 was $238,000 less than 2009 due to the decrease in CSV income from last year.
As a result of the above, the Cobra segment generated pre-tax income of $1.2 million for 2010 compared to a pre-tax loss of $3.6 million for 2009.
Performance Products Limited Business Segment
PPL’s net sales increased $2.8 million, or 23.5 percent, to $14.7 million in 2010 from $11.9 million in 2009. On a local currency basis, PPL net sales increased 26.4 percent in 2010 compared to the prior year. The sales increase was attributable to higher sales of satellite navigation and outdoor leisure products, offset in part by lower sales for tracking devices and download fees.
Gross profit increased $506,000 to $4.2 million in 2010 from $3.7 million in 2009. Gross margin was 28.5 percent for 2010 compared to 30.9 percent for 2009. The gross margin decline was due to a decrease in download revenue to 11.3 percent of net sales in 2010 from 19.3 percent in 2009, exchange losses and inventory write downs.
Selling, general and administrative (“SG&A”) expenses increased $460,000 to $4.6 million in 2010 from $4.1 million in 2009 and, as a percentage of sales, were 31.2 percent in 2010 and 34.8 percent in 2009. The $460,000 increase in SG&A expenses was due to higher legal fees, marketing and sales expenses as well as payroll because of a headcount addition.
Other income decreased $139,000 to $410,000 in 2010 compared to $549,000 in 2009 and was due to a lower foreign exchange gain recorded in 2010 compared to 2009.
As a result of the above, the PPL segment generated a pre-tax loss of $6,000 for 2010 compared to a pre-tax income of $88,000 for 2009.
Income Taxes
For the year ended December 31, 2010, the Company reported a $380,000 tax benefit compared to the $6.8 million tax expense for the year ago period. The $380,000 tax benefit was comprised of a $130,000 tax benefit due to U.S. tax refunds received in 2010, a $91,000 tax expense for the pre-tax earnings in Ireland and a $341,000 deferred tax benefit in the UK. The UK tax benefit was due to a return to provision true-up for the 2009 return, the prospective reduction to a 27 percent tax rate for deferred taxes and book to tax timing differences.
The 2009 tax expense included $8.4 million tax valuation allowance charge for a full valuation allowance established for the Company’s U.S. operation in the second quarter of 2009. Until the more likely than not realization criteria can be satisfied, the Company will not report a U.S. tax benefit for future pre-tax losses or a U.S. tax expense for future pre-tax income. The valuation allowance does not affect tax reporting for CEEL and PPL as each is a separate non-U.S. tax jurisdiction.
Beginning in 2009, the Company intended to repatriate the future earnings of its Irish subsidiary (CEEL), which would have increased the Company’s effective tax on these earnings to reflect the higher U.S. tax rate once the prior year’s net operating loss is utilized and the valuation allowance is reversed. CEEL generated an operating loss for 2009, and accordingly no funds were repatriated to the United States. In 2010, CEEL generated an operating profit and accordingly deferred taxes were provided in the United States for the un-repatriated earnings.
19
Table of Contents
Results of Operations — 2009 Compared to 2008
The following table contains sales and pre-tax income (loss) after eliminating intercompany accounts by business segment for the years ended December 31, 2009 and 2008.
| 2009 vs 2008 | ||||||||||||||||||||||||
| 2009 | 2008 | Increase (Decrease) | ||||||||||||||||||||||
| (in thousands) | ||||||||||||||||||||||||
| Business Segment |
Net Sales |
Pre-tax Income (Loss) |
Net Sales |
Pre-tax Income (Loss) |
Net Sales |
Pre-tax Income (Loss) |
||||||||||||||||||
| Cobra |
$ | 93,305 | $ | (3,596 | ) | $ | 110,846 | $ | (559 | ) | $ | (17,541 | ) | $ | (3,037 | ) | ||||||||
| PPL |
11,924 | 88 | 13,899 | (17,671 | ) | (1,975 | ) | 17,759 | ||||||||||||||||
| Total Company |
$ | 105,229 | $ | (3,508 | ) | $ | 124,745 | $ | (18,230 | ) | $ | (19,516 | ) | $ | 14,722 | |||||||||
Cobra Business Segment
Net sales of the Cobra segment decreased in 2009 by $17.5 million, or 15.8 percent, to $93.3 million from $110.8 million in 2008. Sales were adversely affected by the economic conditions that resulted in reduced store traffic, reduced consumer spending for discretionary items and the consumer preference for lower price-point items. Lower domestic sales made up much of the decline, with Citizens Band radio and detection sales declining 19.9 percent and 27.2 percent, respectively. The decline in Citizens Band radios reflected the recession’s negative impact on freight traffic, which fell markedly resulting in a reduction in the disposable income of professional drivers and directly impacting sales of Citizens Band radios, especially those at higher price points. Detection sales declined not only because of reduced demand by consumers and their switch to purchases of lower price-point models but also because of a store-count reduction by a major retailer, the decision by a major retailer not to repeat a radar promotion with any vendor in 2009 and the bankruptcy and liquidation of Circuit City in 2008, which accounted for more than 4.0 percent of radar detection sales in 2008. Partially offsetting these declines were strong sales of the new mobile navigation product for the professional driver and an 11.9 percent increase in sales of two-way radios because of an exclusive supply agreement with a major retailer. International sales, mainly two-way radios and detection products to Canada and Europe, were down 35.1 percent due to the adverse economic conditions in these markets.
Cobra’s gross profit decreased to $22.7 million in 2009 from $31.0 million in 2008 while the gross margin was 24.3 percent and 28.0 percent in 2009 and 2008, respectively. Margin declines were experienced both domestically and in Europe due primarily to an unfavorable sales mix as the recession caused consumers to become very price conscious and focus diminished discretionary spending on purchases of lower price-point, lower margin products. Especially impacted were sales of domestic detection products as the average selling price in 2009 declined 7.6 percent compared to the prior year. The gross margin for domestic Citizens Band radios also experienced compression because of the shift in discretionary spending by price conscious professional drivers as unit sales of higher-price point models sold to professional drivers fell over 40 percent in 2009 compared to 2008, a rate that was more than twice that of the decline in unit sales of lower-price point models. Also contributing to the decrease in Cobra’s gross margin was a 76.7 percent increase in certain sales promotion funds that are accounted for as a reduction in sales in order to help maintain sales in the difficult economy and the impact of the fixed components of the cost of sales being expensed across a lower level of sales, which combined reduced gross margin by approximately one point. Lastly, a weaker euro, down 5.2 percent compared to 2008, reduced gross margin on sales in Europe.
Selling, general and administrative expenses for the Cobra segment decreased $3.1 million, or 10.6 percent, to $25.9 million in 2009 from $29.0 million in 2008 and, as a percentage of net sales, were 27.8 percent and 26.2 percent in 2009 and 2008, respectively. Approximately half of the decrease was due to lower variable selling costs because of the decline in sales while the remainder was due to lower fixed expenses, mainly resulting from cost savings measures implemented by management, including reductions in headcount and professional fees with these savings partially offset by $238,000 of severance expense.
Included in the Cobra segment 2009 pre-tax loss was interest expense of $1.1 million, which was an increase of $40,000 from 2008, and other income of $782,000 compared to other expense of $1.5 million in 2008. Interest expense, excluding the amortization of loan fees, decreased as a result of a lower weighted average interest rate for 2009 compared to 2008. The $2.2 million favorable swing in other income was due primarily to a $743,000 gain on the cash surrender value of life insurance in 2009 compared to a $1.6 million loss on the cash surrender value of life insurance in 2008. The life insurance is owned by the Company for the purpose of recovering the costs of deferred compensation programs for several current and former officers. Gains or losses arise because the investment vehicles in which the cash was invested moved approximately up or down in value in line with the overall financial markets.
As a result of the above, the Cobra segment had a pre-tax loss of $3.6 million in 2009 compared to a pre-tax loss of $559,000 in 2008.
Performance Products Limited Business Segment
PPL’s net sales decreased in 2009 by $2.0 million, or 14.2 percent, to $11.9 million from $13.9 million in 2008. Substantially all of the decrease was due to a 15.6% weakening of the British pound sterling relative to the dollar.
20
Table of Contents
Gross profit decreased to $3.7 million in 2009 from $7.2 million in 2008 while the gross margin was 30.9 percent and 51.6 percent in 2009 and 2008, respectively. The decrease in gross margin was due in part to the impact of the weaker British pound sterling noted above. Also contributing to the decrease in gross margin was a large decrease in high margin AURA database sales. These fees declined as a result of an increase in the portion of sales made outside of the UK, where the consumer’s purchase price includes unlimited downloads for competitive reasons, and higher sales of new products that do not use AURA database downloads (such as GPS-enabled handheld navigation units designed for the outdoor enthusiast, which are available under the Snooper brand as well as various third-party brands and provide skiers, runners, hikers and others with maps of trails and a record of their activities). The shift in sales made outside of the UK reflected both the severity of the recession in the UK compared to other countries in Europe and PPL’s successful efforts in expanding its distribution channels beyond its UK core market. Additionally, in 2008 there was a large AURA database sale for smartphones that was not repeated in 2009. Air freight charges increased as PPL attempted to meet strong demand for its satellite navigation products, principally the Truckmate product, a dedicated portable truck satellite navigation system for professional drivers.
Selling, general and administrative expenses declined $1.0 million, or 20.0 percent, to $4.1 million in 2009 compared to $5.2 million in 2008, and, as a percentage of net sales, were 34.8 percent and 37.3 percent, respectively. The decrease in selling, general and administrative expenses was due mainly to the previously discussed weaker British pound sterling.
The Company’s low stock price in relation to book value triggered an impairment review as of December 31, 2008 of the $20.1 million of goodwill associated with the PPL acquisition. Based on the year-end reconciliation of the book value to market capitalization, an impairment charge, equal to the goodwill balance at December 31, 2008, was recorded in the fourth quarter of 2008.
As a result of the above, the PPL segment had pre-tax income of $88,000 in 2009 compared to a pre-tax loss of $17.7 million in 2008.
Income Taxes
For 2009, there was a tax provision of $6.8 million compared to a tax provision of $598,000 for 2008. During the second quarter of 2009, management concluded that a deferred tax valuation allowance was required for its U.S. operation. This conclusion was based on the fact that the U.S. operation had sustained cumulative losses over the past three years, was forecasted to have a loss in 2009 because of the recession and had no tax planning strategies available that, if implemented, would generate taxable income sufficient for the U.S. operation to realize in full its net deferred tax assets within a reasonable time horizon absent a turnaround in the business. Accordingly, the Company recorded a charge of $9.6 million for a valuation allowance in the second quarter of 2009. In the fourth quarter of 2009, the Company recorded a tax benefit of $1.2 million primarily for the valuation allowance release related to a Federal tax refund of $974,000 resulting from a provision in The Worker, Homeownership, and Business Assistance Act of 2009, enacted November 6, 2009, which allows eligible businesses a one-time election to carry back net operating losses from 2008 or 2009 (but not both) for three, four or five years rather than the standard two years. For the Company’s remaining deferred tax valuation allowance, until the more likely than not realization criteria can be met, the Company will not report a U.S. tax benefit for any future pre-tax losses or a U.S. tax provision for any future pre-tax income. This does not affect tax reporting for CEEL and PPL as each of these is in a separate, non-U.S. tax jurisdiction.
Beginning in 2009, the Company intended to repatriate the future earnings of its Irish subsidiary (CEEL), which would have increased the Company’s effective tax on these earnings to reflect the higher U.S. tax rate once the prior year’s net operating loss is utilized and the valuation allowance is reversed. However, since CEEL generated an operating loss for 2009, no funds were repatriated to the U.S. in 2009.
Liquidity and Capital Resources
The Company refinanced its bank debt in July 2010 and replaced a $23.0 million revolving asset-based facility and a $2.2 million term loan with a $25.0 million revolving asset-based facility. This new Credit Agreement provides a lower cost credit facility and greater liquidity due to the borrowing base formula. Refer to Note 7 Financing Arrangements to the Consolidated Financial Statements included in Item 8 of this Annual Report on Form 10-K for additional information. Working capital requirements are seasonal, with demand for working capital being higher later in the year as customers begin purchasing for the holiday selling season. The Company believes that cash generated from operations and from borrowings under its credit agreement will be sufficient in 2011 to fund its working capital needs. At December 31, 2010, the Company had interest-bearing debt outstanding of $18.0 million and availability was approximately $4.2 million under the revolving credit line based on the borrowing base formula.
Absent a waiver from lenders, a failure to comply with the covenants in the Credit Agreement could result in any outstanding indebtedness under the Credit Agreement becoming immediately due and payable and the inability to borrow additional funds under the Credit Agreement.
Net cash flows provided by operating activities for the year ended December 31, 2010 totaled $1.2 million, compared to the $1.3 million of net cash provided by operating activities in 2009. Significant net cash inflows from operations and non-cash add-backs included net earnings of $1.6 million, depreciation and amortization totaling $3.9 million and income tax refunds of $1.3 million. These cash inflows were partially offset by a $1.8 million increase in inventory, a $1.5 million decrease in payables, a $1.4 million increase in other assets and a $643,000 increase in non-current assets.
21
Table of Contents
$2.7 million of the depreciation and amortization related to the Cobra segment in 2010 included $1.0 million of intangible asset amortization, $937,000 of fixed asset depreciation, and $780,000 of prepaid amortization, mainly for packaging and outside design. For the PPL segment, depreciation and amortization amounted to $1.2 million in 2010 and included $858,000 of amortization for intangibles and other assets, which resulted from the allocation of the purchase price, and $341,000 of fixed asset depreciation. The increase in inventories was mainly due to unfavorable variation from forecast, mainly in the UK, for fourth quarter 2010 sales. The decrease in payables was due to reduced trade payables in the UK due to the timing of purchases and payments. The increase in other assets was mainly due to deferred loan fees, prepayments and vendor receivables. The increase in non-current assets was due to product software, trademarks, patents and internet design expenditures.
Cash used in investing activities totaled $1.7 million in 2010. Capital expenditures, mainly building and leasehold improvements and tooling, totaled $1.4 million while life insurance premiums totaled $266,000.
Net cash provided by financing activities in 2010 totaled $173,000 as the result of additional bank borrowings.
Contractual Commitments
The payments for the Company’s contractual commitments at December 31, 2010 were as follows:
| Total | Less Than 1 year |
1 to 3 years | 3 to 5 years | After 5 years |
||||||||||||||||
| (in thousands) | ||||||||||||||||||||
| Capital lease |
$ | 60 | $ | 48 | $ | 12 | $ | - | $ | - | ||||||||||
| Operating leases |
1,863 | 434 | 734 | 384 | 311 | |||||||||||||||
| Purchase obligations (a) |
20,286 | 20,200 | 86 | - | - | |||||||||||||||
| Employment agreement obligations |
371 | 50 | 321 | - | - | |||||||||||||||
| Obligations under FIN 48 |
157 | 157 | - | - | - | |||||||||||||||
| Deferred compensation |
7,621 | 476 | 1,286 | 1,437 | 4,422 | |||||||||||||||
| Revolving loan (b) |
20,033 | 784 | 19,249 | - | - | |||||||||||||||
| Total |
$ | 50,391 | $ | 22,149 | $ | 21,688 | $ | 1,821 | $ | 4,733 | ||||||||||
| (a) | Purchase obligations include commitments to purchase goods or services of either a fixed or minimum quantity including open purchase orders of $19,921. |
| (b) | Includes interest of $1,991 for the revolving loan due under the Credit Agreement. |
Critical Accounting Policies and Estimates
The Company’s significant accounting policies are discussed in the notes to the consolidated financial statements included in Item 8 of this Annual Report on Form 10-K.The application of certain of these policies requires significant judgments or a historical based estimation process that can affect the results of operations and financial position of the Company as well as the related footnote disclosures. The Company bases its estimates on historical experience and other assumptions that it believes are reasonable. If actual amounts ultimately differ from previous estimates, the revisions are included in the Company’s results of operations for the period in which the actual amounts become known.
Critical accounting policies generally consist of those that are reflective of significant judgments and uncertainties and could potentially result in materially different results under different assumptions. The accounting policies and estimates that may have a significant impact upon the operating results, financial position and footnote disclosures of the Company are as follows:
Revenue Recognition. Revenue from the sale of goods is recognized at the time of shipment, except for revenue from sales of products to certain customers whose contractual terms specify FOB destination. Revenue from sales of products to these customers is recognized at the estimated time of receipt by the customer when title and risk of loss would pass to the customer. Obligations for sales returns and allowances and product warranties are recognized at the time of sale on an accrual basis as described in the policies for Sales Returns Reserve and Warranty Reserve. The Company bundles AURA database subscriptions with certain detection and navigation products and sells these products to customers in transactions accounted for as multiple element arrangements. The revenue associated with the sale of the AURA database is deferred and recognized into income over the applicable subscription period, while the revenue associated with the detection and navigation products is recognized at the date of sale.
Sales Returns Reserve. The Company has a policy that allows its customers to return product that was returned to them by their customers. The reserve reflects the sales, cost of sales and gross profit impact of expected returns and related stock adjustments, as well as reduction in accounts receivable and increases in inventory for the amount of expected returns. The amount of the reserve is determined by multiplying the sales and cost of sales by product category for the current quarter by historical return rates adjusted for any known changes in key variables affecting these return rates. Thus, judgments must be made regarding whether current return rates will approximate anticipated return rates. This reserve will vary based on the changes in sales, gross margin and historical, as well as anticipated, return rates from quarter to quarter.
22
Table of Contents
Warranty Reserve. The Company provides a warranty for its products and also allows its customers to return product that has been returned by their customers. Consequently, the Company maintains a warranty reserve, which reflects historical return rates by product category multiplied by the most recent six months of unit sales and the unit standard cost of each model. The Company uses the most recent six months of unit sales in its estimate, as historical experience indicates that most returns will occur within six months of the Company’s original sale date. Therefore, judgments must be made based on historical return rates and how the returned product will be disposed of by, either liquidation or return to vendors for credit on new purchases. This reserve may vary based upon the level of sales and changes in historical return rates from quarter to quarter as well as estimated costs of disposal, either liquidation prices or the credit given by vendors.
Liquidation Reserve. The Company maintains a liquidation reserve representing the write-down of returned product from our customers to its net realizable value. Returned inventory is either sold to various liquidators or returned to vendors for partial credit against similar, new models; this decision depends upon the estimated future demand for the models. Judgments are made as to whether various models are to be liquidated or returned to the vendor, taking into consideration the liquidation prices expected to be received and the amount of vendor credit. The amount of the reserve is determined by comparing the cost of each unit returned to the estimated amount to be realized upon each unit’s disposition, either from returning the unit to the vendor for credit towards the cost of new, similar product or liquidating the unit. This reserve can fluctuate significantly from quarter to quarter depending upon quantities of returned inventory on hand and the estimated liquidation price or vendor credit per unit.
Net Realizable Value Reserve. The Company maintains a net realizable value reserve to write-down below cost, as necessary, certain inventory not previously sold to customers where it is determined that net realizable value is less than cost. Thus, judgments must be made about which slow-moving, excess or non-current models are to be included in the reserve and the estimated net realizable value of such model (i.e., the per unit price that it is estimated can be received in the marketplace if the model was sold). This reserve will vary depending upon the specific models selected, the estimated net realizable value for each model and quantities of each model that are determined will be sold below cost from quarter to quarter.
Advertising and Sales Promotion Accrual. The advertising and sales promotion accrual reflects amounts provided to retailers and distributors for advertising and sales promotions. Customer programs, generally agreed to at the beginning of each year, are mainly variable programs dependent on sales and may be revised during the course of the year, based upon a customer’s projected sales and other factors, such as new promotional opportunities. Accruals are made monthly for each customer by multiplying the customer’s estimated program accrual percentage by the customer’s actual sales. Therefore, this accrual will vary quarter to quarter depending on a given quarter’s sales and the sales mix of customers. In addition, should a customer significantly exceed or fall short of its planned program sales, negotiate changes to the term of the existing programs or add new ones, adjustments may need to be made to the customer’s estimated program accrual percentage due to certain minimum and/or maximum sales thresholds in such customer’s programs. Periodic adjustments may also be necessary for unused customer funds.
Deferred Compensation. Obligations under the deferred compensation plans which are non-qualified defined benefit plans and annual deferred compensation expense are determined by a number of assumptions. Key assumptions in the determination of obligations under the deferred compensation plans and annual deferred compensation expense include the discount rate and anticipated compensation for each individual covered by the plans, which in part is dependent upon the anticipated future profitability of the Company. The discount rate for 2010 and 2009 was 7 percent. The compensation increase assumptions are based on historical experience and anticipated future performance. The Company maintains life insurance policies for certain current and former executives to provide funding for future obligations.
Software Related to Products to be Sold. The Company purchases and/or incurs costs in connection with the development of software to be used in products that the Company intends to sell, mainly mobile navigation products. Coding and related costs incurred after technological feasibility of the software has been established and a working model of the product developed are capitalized and deferred as intangible assets. Capitalized costs are charged to earnings based on the ratio of actual product sales during the reporting period to expected product sales over the estimated product life cycle. Software related intangible assets are reviewed at each balance sheet date for possible impairment. If such review indicates that the carrying amount of these assets may not be recoverable, the carrying amount is reduced to the estimated fair value.
Goodwill and Other Intangible Assets. The Company evaluates goodwill for impairment on an annual basis or if impairment indicators exist. For goodwill, the evaluation requires a comparison of estimated fair value of PPL reporting unit to which the goodwill has been assigned to the sum of the carrying value of the assets and liabilities of that unit. If the sum of the carrying value of the assets and liabilities of a reporting unit exceeds the fair value of that reporting unit, the carrying value of the reporting unit’s goodwill is reduced to its implied fair value through an adjustment to the goodwill balance, resulting in an impairment charge.
The fair values used in the impairment evaluation are estimated based upon discounted future cash flow projections and comparisons with comparable companies as well as the Company’s market capitalization. Due to the Company’s low market capitalization at December 31, 2008, a goodwill impairment evaluation indicated that the entire goodwill balance was impaired and resulted in a fourth quarter charge of $20.1 million. Intangible assets subject to amortization are evaluated for impairment whenever events or circumstances indicate that the carrying amount of an amortizable intangible asset may not be recoverable. If impairment indicators exist for an amortizable intangible asset, the undiscounted future cash flows associated with the expected service potential of the asset are compared
23
Table of Contents
to the carrying value of the asset. If the projection of undiscounted future cash flows is in excess of the carrying value of the intangible assets, no impairment charge is recorded. If the projection of undiscounted cash flows is less than the carrying value of the intangible asset, an impairment charge is recorded to reduce the intangible asset to its fair value.
Income Taxes. Deferred income taxes are determined based on the estimated future tax effects of differences between the financial statement and tax bases of assets and liabilities given the enacted tax laws for each applicable tax jurisdiction. The deferred income tax provisions and benefits are based on changes to the assets or liabilities from year to year and the effect of enacted tax rate changes. In providing for deferred taxes, we consider tax regulations of the jurisdictions in which the Company operates, estimates of future taxable income and available tax planning strategies. If tax regulations, operating results or the ability to implement tax planning and strategies vary, adjustments to the carrying value of deferred tax assets and liabilities may be required. Valuation allowances are recorded related to deferred tax assets based on the more likely than not criteria. Due to the operating results for 2009, the expected continuation of a global recession and the absence of tax planning strategies to generate a sufficient level of taxable income, management concluded the full realization of the deferred tax assets within a reasonable time horizon did not satisfy the more likely than not realization criteria. Accordingly, the Company established a full deferred tax valuation allowance for its U.S. operation in 2009. The Company maintained the full valuation allowance for its U.S. operation throughout 2010. The valuation allowance is a non-cash charge that does not preclude the Company from fully realizing the net deferred tax assets in the future. At December 31, 2010 the deferred tax valuation allowance totaled $7.9 million.
We recognize the financial statement benefit of a tax position only after determining that the relevant tax authority would more likely than not sustain the position following an audit. For tax positions meeting the more likely than not threshold, the amount recognized in the financial statements is the largest benefit that has a greater than 50 percent likelihood of being realized upon ultimate settlement with the relevant tax authority.
Amounts held by foreign subsidiaries are generally subject to U.S. income taxation on repatriation to the United States. Through 2008, the Company had not recorded deferred income taxes on the undistributed earnings of its Irish subsidiary totaling $1.8 million because the Company intended to indefinitely reinvest such earnings. Beginning in 2009, the Company intended to repatriate the future earnings of its Irish subsidiary (CEEL), which will increase the Company’s effective tax on these earnings to reflect the higher U.S. tax rate once the prior year’s net operating loss is utilized and the valuation allowance is reversed. CEEL generated an operating loss for 2009, and accordingly no funds were repatriated to the United States. CEEL generated an operating profit in 2010 and accordingly deferred taxes were provided in the United States for the un-repatriated earnings.
The above listing is not intended to be a comprehensive list of all of the Company’s accounting policies. In most cases, the accounting treatment of a particular transaction is specifically dictated by accounting principles generally accepted in the United States. Refer to Note 1 to the Company’s consolidated financial statements included under Item 8 of this Annual Report on Form 10-K, which is incorporated herein by reference, for more information with respect to the Company’s significant accounting policies.
Recently Issued Accounting Standards
Please refer to Note 2 in the consolidated financial statements, included under Item 8 of this Annual Report on Form 10-K, which is incorporated herein by reference, for further information on the Company’s new accounting standards.
Item 7A. Quantitative and Qualitative Disclosures About Market Risk
Market risks related to changes in foreign currency exchange risks and interest rates are inherent to the Company’s operations. Changes to these factors could cause fluctuations in the Company’s net earnings, cash flows and the fair values of financial instruments subject to market risks. The Company identifies these risks and when appropriate mitigates the financial impact with hedging and interest rate swaps.
Debt incurred under a revolving loan agreement with a balance of $18.0 million as of December 31, 2010 is priced at an interest rate that floats with the market. Therefore, the fair value of this debt is not significantly affected by changes in the interest rate market. A 50 basis point movement in the floating debt rate would result in approximately a $90,000 increase or decrease in interest expense and cash flows. The Company’s suppliers are located in China, Hong Kong and South Korea. The Company historically has negotiated substantially all of its purchases in U.S. dollars and, in the case of PPL, occasionally uses forward contracts to purchase dollars at a fixed exchange rate to the British pound sterling. The Company considers opportunities to make purchases in other currencies, such as euros, to the extent that doing so would be advantageous in light of currency fluctuations involving the U.S. dollar and other currencies.
In 2010, approximately 26.4 percent of the Company’s sales were outside the United States, principally in Europe and Canada, compared to 24.2 percent in 2009. Future fluctuations in foreign exchange rates could materially affect operating results. The Company minimizes the foreign currency exchange rate risk associated with relationships outside of the United States by conducting nearly all of its transactions in U.S. dollars, except for some billings of its European business, which are conducted in euros and the billings of PPL which are primarily in British pound sterling. The Company does not use derivative financial or commodity instruments for trading or speculative purposes, however, forward contracts are used occasionally for hedging a portion of the Company’s European business’ euro denominated transactions
24
Table of Contents
and hedging dollar purchases for PPL. The Company did not have any open foreign exchange contracts at December 31, 2010. Please refer to Notes 8 and 9 in the consolidated financial statements, included under Item 8 of this Annual Report on Form 10-K, which is incorporated herein by reference, for further information on the Company’s financial instruments and derivatives.
Forward-Looking Statements
This report contains forward-looking statements within the meaning of that term in the Private Securities Litigation Reform Act of 1995 found at Section 27A of the Securities Act of 1933 and Section 21E of the Exchange Act. Additional written or oral forward-looking statements may be made by the Company from time to time in filings with the SEC, press releases, or otherwise. Statements contained in this report that are not historical facts are forward-looking statements made pursuant to the safe harbor provisions of the Private Securities Litigation Reform Act. Forward-looking statements may include, but are not limited to, projections of revenue, income or loss and capital expenditures, statements regarding future operations, anticipated financing needs, compliance with financial covenants in loan agreements, liquidity, plans for acquisitions or sales of assets or businesses, plans relating to products or services, assessments of materiality, expansion into international markets, growth trends in the consumer electronics business, technological and market developments in the consumer electronics business, the availability of new consumer electronics products and predictions of future events, as well as assumptions relating to these statements. In addition, when used in this report, the words “anticipates,” “believes,” “should,” “estimates,” “expects,” “intends,” “plans” and variations thereof and similar expressions are intended to identify forward-looking statements.
Forward-looking statements are inherently subject to risks and uncertainties, some of which cannot be predicted or quantified based on current expectations. Consequently, future events and actual results could differ materially from those set forth in, contemplated by or underlying the forward-looking statements contained in this report or in other Company filings, press releases, or otherwise. Factors that could contribute to or cause such differences include, but are not limited to, unanticipated developments in any one or more of the following areas:
| Ÿ | global economic and market conditions, including continuation of or changes in the current economic environment; |
| Ÿ | ability of the Company to introduce new products to meet consumer needs, including timely introductions as new consumer technologies are introduced, and customer and consumer acceptance of these new product introductions; |
| Ÿ | pressure for the Company to reduce prices for older products as newer technologies are introduced; |
| Ÿ | significant competition in the consumer electronics business, including introduction of new products and changes in pricing; |
| Ÿ | factors related to foreign manufacturing, sourcing and sales (including foreign government regulation, trade and importation, and health and safety concerns, and effects of fluctuation in exchange rates); |
| Ÿ | ability of the Company to maintain adequate financing, to bear the interest cost of such financing and to remain in compliance with financing covenants; |
| Ÿ | impairment of intangible assets due to market conditions and/or the Company’s operating results; |
| Ÿ | changes in law; |
| Ÿ | ability to successfully integrate acquisitions, including PPL; and |
| Ÿ | other risk factors, which may be detailed from time to time in the Company’s SEC filings. |
Readers are cautioned not to place undue reliance on any forward-looking statements contained in this report, which speak only as of the date set forth on the signature page hereto. The Company undertakes no obligation to publicly release the result of any revisions to these forward-looking statements that may be made to reflect events or circumstances after such date or to reflect the occurrence of anticipated or unanticipated events.
25
Table of Contents
Item 8. Financial Statements and Supplementary Data
Financial statements are included in this Annual Report on Form 10-K, as indicated in the index on page 51.
REPORT OF INDEPENDENT REGISTERED PUBLIC ACCOUNTING FIRM
Board of Directors and Shareholders
Cobra Electronics Corporation and Subsidiaries
We have audited the accompanying consolidated balance sheets of Cobra Electronics Corporation (a Delaware corporation) and Subsidiaries (the “Company”) as of December 31, 2010 and 2009, and the related consolidated statements of operations, shareholders equity and comprehensive income (loss) and cash flows for each of the three years in the period ended December 31, 2010. These financial statements are the responsibility of the Company’s management. Our responsibility is to express an opinion on these financial statements based on our audits.
We conducted our audits in accordance with the standards of the Public Company Accounting Oversight Board (United States). Those standards require that we plan and perform the audit to obtain reasonable assurance about whether the financial statements are free of material misstatement. The Company is not required to have, nor were we engaged to perform an audit of its internal control over financial reporting. Our audit included consideration of internal control over financial reporting as a basis for designing audit procedures that are appropriate in the circumstances, but not for the purpose of expressing an opinion on the effectiveness of the Company’s internal control over financial reporting. Accordingly, we express no such opinion. An audit also includes examining, on a test basis, evidence supporting the amounts and disclosures in the financial statements, assessing the accounting principles used and significant estimates made by management, as well as evaluating the overall financial statement presentation. We believe that our audits provide a reasonable basis for our opinion.
In our opinion, the consolidated financial statements referred to above present fairly, in all material respects, the financial position of Cobra Electronics Corporation and Subsidiaries as of December 31, 2010 and 2009, and the results of its operations and its cash flows for each of the three years in the period ended December 31, 2010 in conformity with accounting principles generally accepted in the United States of America.
/s/ Grant Thornton LLP
Chicago, Illinois
March 15, 2011
26
Table of Contents
CONSOLIDATED STATEMENTS OF OPERATIONS
Cobra Electronics Corporation
Years Ended December 31, 2010, 2009 and 2008
(In Thousands, Except Per Share Amounts)
| 2010 | 2009 | 2008 | ||||||||||
| Net sales |
$ | 110,520 | $ | 105,229 | $ | 124,745 | ||||||
| Cost of sales |
80,666 | 78,853 | 86,576 | |||||||||
| Gross profit |
29,854 | 26,376 | 38,169 | |||||||||
| Selling, general and administrative expense |
28,047 | 30,066 | 34,175 | |||||||||
| Impairment of goodwill |
- | - | 20,084 | |||||||||
| Earnings (loss) from operations |
1,807 | (3,690 | ) | (16,090 | ) | |||||||
| Interest expense |
(1,564 | ) | (1,149 | ) | (1,109 | ) | ||||||
| Other income (expense) |
954 | 1,331 | (1,031 | ) | ||||||||
| Earnings (loss) before income taxes |
1,197 | (3,508 | ) | (18,230 | ) | |||||||
| Tax (benefit) provision |
(380 | ) | 6,762 | 598 | ||||||||
| Less non-controlling interest |
- | 2 | 11 | |||||||||
| Net earnings (loss) |
$ | 1,577 | $ | (10,272 | ) | $ | (18,839 | ) | ||||
| Net earnings (loss) per common share: |
||||||||||||
| Basic |
$ | 0.24 | $ | (1.59 | ) | $ | (2.91 | ) | ||||
| Diluted |
$ | 0.24 | $ | (1.59 | ) | $ | (2.91 | ) | ||||
| Weighted average shares outstanding: |
||||||||||||
| Basic |
6,471 | 6,471 | 6,471 | |||||||||
| Diluted |
6,471 | 6,471 | 6,471 | |||||||||
| Dividends declared and paid per common share |
$ | - | $ | - | $ | 0.16 | ||||||
The accompanying notes are an integral part of these financial statements.
27
Table of Contents
Cobra Electronics Corporation
December 31, 2010 and 2009
(In Thousands)
| 2010 | 2009 | |||||||
| ASSETS |
||||||||
| Current assets: |
||||||||
| Cash |
$ | 1,133 | $ | 1,405 | ||||
| Receivables, net of allowance for claims and doubtful accounts of $186 in 2010 and $103 in 2009 |
22,021 | 22,095 | ||||||
| Inventories, primarily finished goods, net |
27,614 | 26,198 | ||||||
| Other current assets |
3,289 | 3,961 | ||||||
| Total current assets |
54,057 | 53,659 | ||||||
| Property, plant and equipment, at cost: |
||||||||
| Buildings and improvements |
6,305 | 5,707 | ||||||
| Tooling and equipment |
18,393 | 17,746 | ||||||
| 24,698 | 23,453 | |||||||
| Accumulated depreciation |
(19,436 | ) | (18,318 | ) | ||||
| Land |
230 | 230 | ||||||
| Property, plant and equipment, net |
5,492 | 5,365 | ||||||
| Other assets: |
||||||||
| Cash surrender value of life insurance policies |
4,891 | 4,051 | ||||||
| Deferred income taxes, non-current |
427 | 1,717 | ||||||
| Intangible assets |
9,315 | 10,769 | ||||||
| Other assets |
172 | 142 | ||||||
| Total other assets |
14,805 | 16,679 | ||||||
| Total assets |
$ | 74,354 | $ | 75,703 | ||||
The accompanying notes are an integral part of these financial statements.
28
Table of Contents
CONSOLIDATED BALANCE SHEETS (cont.)
Cobra Electronics Corporation
December 31, 2010 and 2009
(In Thousands Except Share Data)
| 2010 | 2009 | |||||||
| LIABILITIES AND SHAREHOLDERS’ EQUITY |
||||||||
| Current liabilities: |
||||||||
| Current maturities of long-term bank debt |
$ | 18,042 | $ | 16,549 | ||||
| Accounts payable |
5,797 | 7,427 | ||||||
| Accrued salaries and commissions |
1,510 | 902 | ||||||
| Accrued advertising and sales promotion costs |
1,196 | 1,392 | ||||||
| Accrued product warranty costs |
923 | 857 | ||||||
| Accrued income taxes |
197 | 73 | ||||||
| Deferred income taxes, current |
439 | 1,728 | ||||||
| Other accrued liabilities |
2,388 | 2,524 | ||||||
| Total current liabilities |
30,492 | 31,452 | ||||||
| Non-current liabilities: |
||||||||
| Long-term bank debt, net of current maturities |
- | 1,320 | ||||||
| Deferred compensation |
7,145 | 6,772 | ||||||
| Deferred income taxes |
1,538 | 1,935 | ||||||
| Other long-term liabilities |
565 | 961 | ||||||
| Total non-current liabilities |
9,248 | 10,988 | ||||||
| Total liabilities |
39,740 | 42,440 | ||||||
| Commitments and contingencies |
- | - | ||||||
| Shareholders’ equity: |
||||||||
| Preferred stock, $1 par value 1,000,000 shares authorized None issued |
- | - | ||||||
| Common stock, $.33 1/3 par value 12,000,000 shares authorized 7,039,100 shares issued 6,471,280 shares outstanding |
2,345 | 2,345 | ||||||
| Paid-in capital |
20,785 | 20,583 | ||||||
| Retained earnings |
17,610 | 16,033 | ||||||
| Accumulated comprehensive income |
(2,317 | ) | (1,889 | ) | ||||
| 38,423 | 37,072 | |||||||
| Treasury stock, at cost (567,820 shares) |
(3,837 | ) | (3,837 | ) | ||||
| Total shareholders’ equity - Cobra |
34,586 | 33,235 | ||||||
| Non-controlling interest |
28 | 28 | ||||||
| Total equity |
34,614 | 33,263 | ||||||
| Total liabilities and shareholders’ equity |
$ | 74,354 | $ | 75,703 | ||||
The accompanying notes are an integral part of these financial statements.
29
Table of Contents
CONSOLIDATED STATEMENTS OF CASH FLOWS
Cobra Electronics Corporation
Years Ended December 31, 2010, 2009 and 2008
(In Thousands)
| 2010 | 2009 | 2008 | ||||||||||
| Cash flows from operating activities: |
||||||||||||
| Net earnings (loss) |
$ | 1,577 | $ | (10,272 | ) | $ | (18,839 | ) | ||||
| Adjustments to reconcile net loss to net cash flows from operating activities: |
||||||||||||
| Depreciation and amortization |
3,936 | 3,883 | 5,296 | |||||||||
| Tax valuation allowance |
- | 8,382 | - | |||||||||
| Goodwill impairment |
- | - | 20,084 | |||||||||
| Impairment - product software, tooling and packaging |
- | - | 266 | |||||||||
| Deferred income taxes |
(341 | ) | (285 | ) | (1,005 | ) | ||||||
| Loss (gain) on cash surrender value (CSV) life insurance |
(574 | ) | (743 | ) | 1,558 | |||||||
| Stock-based compensation |
202 | 229 | 253 | |||||||||
| Loss on sale of assets |
1 | 36 | - | |||||||||
| Non-controlling interests |
- | 2 | 11 | |||||||||
| Changes in assets and liabilities: |
||||||||||||
| Receivables |
(83 | ) | (3,943 | ) | 8,329 | |||||||
| Inventories |
(1,750 | ) | 1,613 | 4,250 | ||||||||
| Other current assets |
(1,363 | ) | (1,881 | ) | 67 | |||||||
| Income tax refunds |
1,251 | 863 | 1,298 | |||||||||
| Other long-term assets |
(643 | ) | (520 | ) | 1,888 | |||||||
| Accounts payable |
(1,498 | ) | 4,421 | (4,142 | ) | |||||||
| Accrued income taxes |
- | (439 | ) | (46 | ) | |||||||
| Accrued liabilities |
(1 | ) | (108 | ) | (4,357 | ) | ||||||
| Deferred compensation |
782 | 256 | 195 | |||||||||
| Deferred income |
119 | (377 | ) | (310 | ) | |||||||
| Other long-term liabilities |
(449 | ) | 188 | 212 | ||||||||
| Net cash provided by operating activities |
1,166 | 1,305 | 15,008 | |||||||||
| Cash flows from investing activities: |
||||||||||||
| Capital expenditures |
(1,441 | ) | (1,095 | ) | (1,166 | ) | ||||||
| Premiums on CSV life insurance |
(266 | ) | (274 | ) | (312 | ) | ||||||
| Additional purchase price for Performance Products Limited |
- | - | (8,464 | ) | ||||||||
| Net cash used in investing activities |
(1,707 | ) | (1,369 | ) | (9,942 | ) | ||||||
| Cash flows from financing activities : |
||||||||||||
| Bank borrowings |
173 | 198 | (2,314 | ) | ||||||||
| Dividends paid to shareholders |
- | - | (1,035 | ) | ||||||||
| Net cash provided by (used in) financing activities |
173 | 198 | (3,349 | ) | ||||||||
| Effect of exchange rate changes on cash and cash equivalents |
96 | (714 | ) | (1,592 | ) | |||||||
| Net (decrease) increase in cash |
(272 | ) | (580 | ) | 125 | |||||||
| Cash at beginning of year |
1,405 | 1,985 | 1,860 | |||||||||
| Cash at end of year |
$ | 1,133 | $ | 1,405 | $ | 1,985 | ||||||
| Supplemental disclosure of cash flow information: |
||||||||||||
| Cash paid (refund) during the period for: |
||||||||||||
| Interest |
$ | 872 | $ | 936 | $ | 1,008 | ||||||
| Income taxes, net of refunds |
$ | (1,213 | ) | $ | (449 | ) | $ | (314 | ) | |||
The accompanying notes are an integral part of these financial statements.
30
Table of Contents
CONSOLIDATED STATEMENTS OF SHAREHOLDERS’ EQUITY AND COMPREHENSIVE INCOME (LOSS)
Cobra Electronics Corporation
Years Ended December 31, 2010, 2009 and 2008
(In Thousands)
| Common Stock |
Paid-in Capital |
Retained Earnings |
Accumulated Comprehensive Income (Loss) |
Treasury Stock |
Total | |||||||||||||||||||
| Balance - January 1, 2008 |
$ | 2,345 | $ | 20,101 | $ | 46,179 | $ | 327 | $ | (3,837 | ) | $ | 65,115 | |||||||||||
| Comprehensive income (loss): |
||||||||||||||||||||||||
| Net loss |
- | - | (18,839 | ) | - | - | (18,839 | ) | ||||||||||||||||
| Accumulated other comprehensive income - Foreign currency translation adjustment |
|
- |
|
|
- |
|
|
- |
|
|
(2,700 |
) |
|
- |
|
|
(2,700 |
) | ||||||
| Interest rate swap, net of tax benefit of $203 |
- | - | - | (264 | ) | - | (264 | ) | ||||||||||||||||
| Total comprehensive loss |
(21,803 | ) | ||||||||||||||||||||||
| Dividends to shareholders |
- | - | (1,035 | ) | - | - | (1,035 | ) | ||||||||||||||||
| Stock compensation expense |
- | 253 | - | - | - | 253 | ||||||||||||||||||
| Balance – December 31, 2008 |
2,345 | 20,354 | 26,305 | (2,637 | ) | (3,837 | ) | 42,530 | ||||||||||||||||
| Comprehensive income (loss): |
||||||||||||||||||||||||
| Net loss |
- | - | (10,272 | ) | - | - | (10,272 | ) | ||||||||||||||||
| Accumulated other comprehensive income - |
||||||||||||||||||||||||
| Foreign currency translation adjustment |
- | - | - | 877 | - | 877 | ||||||||||||||||||
| Interest rate swap, no tax benefit |
- | - | - | (129 | ) | - | (129 | ) | ||||||||||||||||
| Total comprehensive loss |
(9,524 | ) | ||||||||||||||||||||||
| Stock compensation expense |
- | 229 | - | - | - | 229 | ||||||||||||||||||
| Balance - December 31, 2009 |
$ | 2,345 | 20,583 | 16,033 | (1,889 | ) | (3,837 | ) | 33,235 | |||||||||||||||
| Comprehensive income (loss): |
||||||||||||||||||||||||
| Net earnings |
- | - | 1,577 | - | - | 1,577 | ||||||||||||||||||
| Accumulated other comprehensive income - |
||||||||||||||||||||||||
| Foreign currency translation adjustment |
- | - | - | (558 | ) | - | (558 | ) | ||||||||||||||||
| Interest rate swap, no tax benefit |
- | - | - | 130 | - | 130 | ||||||||||||||||||
| Total comprehensive income |
1,149 | |||||||||||||||||||||||
| Stock compensation expense |
- | 202 | - | - | - | 202 | ||||||||||||||||||
| Balance – December 31, 2010 |
$ | 2,345 | $ | 20,785 | $ | 17,610 | $ | (2,317 | ) | $ | (3,837 | ) | $ | 34,586 | ||||||||||
The accompanying notes are an integral part of these financial statements.
31
Table of Contents
NOTES TO CONSOLIDATED FINANCIAL STATEMENTS
Cobra Electronics Corporation
Years ended December 31, 2010, 2009 and 2008
(1) Summary of Significant Accounting Policies
Business — Cobra designs and markets consumer electronics products, which it sells primarily under the Cobra brand name principally in the United States, Canada and Europe. Effective October 20, 2006, the Company acquired Performance Products Limited (“PPL”) which sells its products under the Snooper tradename, principally in the United Kingdom, as well as elsewhere in Europe. A majority of the Company’s products are purchased from overseas suppliers, primarily in China, Hong Kong and South Korea. The consumer electronics market is characterized by rapidly changing technology and certain products may have limited life cycles. Management believes that it maintains strong relationships with its current suppliers and that, if necessary, other suppliers could be found. The extent to which a change in a supplier would have an adverse effect on the Company’s business depends on the timing of the change, the product or products that the supplier produces for the Company and the volume of that production. The Company also maintains insurance coverage that would, in certain limited circumstances, reimburse the Company for lost profits resulting from a supplier’s inability to fulfill its commitments to the Company.
Principles of Consolidation — The consolidated financial statements include the accounts of the Company and its subsidiaries. The consolidated entities are collectively referred to as the “Company”. All intercompany balances and transactions have been eliminated in consolidation.
Reclassifications — Amortization of deferred loan fees were reclassified from Other Income (Expense) to Interest Expense for the periods presented in the consolidated financial statements included in this Form 10-K.
Translation of Foreign Currency — Assets and liabilities of consolidated foreign subsidiaries are translated into U.S. dollars at exchange rates in effect at year- end. Revenues and expenses are translated at average exchange rates prevailing during the year. Gains or losses on foreign currency transactions and the related tax effects are reflected in net earnings. The resulting translation adjustments are included in stockholders’ equity as a component of accumulated comprehensive income.
Use of Estimates — The preparation of financial statements in conformity with accounting principles generally accepted in the United States of America requires management to make estimates and assumptions that affect the reported amounts of assets and liabilities and disclosure of contingent assets and liabilities at the date of the financial statements and the reported amounts of revenues and expenses during the reporting period that are largely based on the current business conditions, including economic climate, revenue growth, sales returns rates, net realizable value of returned products and changes in certain working capital amounts. The Company believes its estimates and assumptions are reasonable. However, actual results and the timing of the recognition of such amounts could differ from those estimates.
Revenue Recognition — Revenue from the sale of goods is recognized at the time of shipment, except for revenue from sales of products to certain customers whose contractual terms specify FOB destination. Revenue from sales of products to these customers is recognized at the estimated time of receipt by the customer when title and risk of loss would pass to the customer. Obligations for sales returns and allowances and product warranties are recognized at the time of sale on an accrual basis as described in the policies for Sales Returns Reserve and Warranty Reserve. The Company bundles AURA database subscriptions with certain detection and navigation products and sells these products to customers in transactions accounted for as multiple element arrangements. The revenue associated with the sale of the AURA database is deferred and recognized into income over the applicable subscription period, while the revenue associated with the detection and navigation products is recognized at the date of sale.
Sales Returns Reserve — The Company allows its customers to return product that was returned to them by their customers. The reserve reflects the sales, cost of sales and gross profit impact of expected returns and related stock adjustments, as well as reduction in accounts receivable and increases in inventory for the amount of expected returns. The amount of the reserve is determined by multiplying the sales and cost of sales by product category for the current quarter by historical return rates adjusted for any known changes in key variables affecting these return rates. Thus, judgments must be made regarding whether current return rates will approximate anticipated return rates. This reserve will vary based on the changes in sales, gross margin and historical, as well as anticipated, return rates from quarter to quarter.
Warranty Reserve — The Company provides a consumer warranty for its products and also allows its customers to return product that has been returned by their customers. Consequently, the Company maintains a warranty reserve, which reflects historical return rates by product category multiplied by the most recent six months of unit sales and the unit standard cost of each model. The Company uses the most recent six months of unit sales in its estimate, as historical experience indicates that most returns will occur within six months of the Company’s original sale date. Therefore, judgments must be made based on historical return rates and how the returned product will be disposed of by, either liquidation or return to vendors for credit on new purchases. This reserve may vary based upon the level of sales and changes in historical return rates from quarter to quarter as well as estimated costs of disposal, either liquidation prices or the credit given by vendors.
32
Table of Contents
Shipping & Handling — Shipping and handling costs are included in cost of goods sold, and the amounts invoiced to customers relating to shipping and handling are included in net sales.
Sales Tax — Sales tax is reported on a net basis in the consolidated financial statements.
Advertising and Sales Promotion Expenses — These costs reflect amounts provided to retailers and distributors for advertising and sales promotions and are expensed as incurred. Customer programs, generally agreed to at the beginning of each year, are mainly variable programs dependent on sales and special promotional events. These customer programs may be revised during the course of the year, based upon a customer’s projected sales and other factors, such as new, or changes to existing, promotional programs. Customer programs are accounted for as either a reduction of revenue or an operating expense. Advertising and sales promotion expenses for the years ended December 31, 2010, 2009 and 2008 totaled $5.4 million, $6.2 million and $7.6 million, respectively.
Research, Engineering and Product Development Expenditures — Research and product development expenditures, as well as the non-capitalized engineering costs, are expensed as incurred and amounted to $1.6 million in 2010, $1.8 million in 2009, and $2.2 million in 2008.
Stock Based Compensation — The Company estimates the fair value of the stock option on the grant date using the Black-Scholes-Merton option pricing model and assumptions for expected price volatility, option term, risk-free interest rate and dividend yield and forfeitures. Expected price volatilities are based on historical volatilities of the Company’s stock. The risk-free rate for periods within the contractual life of the option is based on the U.S. Treasury yield curve in effect at the time of grant. The fair value of the stock based compensation is recognized on a straight-line basis over the requisite service period.
Income Taxes — Deferred income taxes are determined based on the estimated future tax effects of differences between the financial statement and tax bases of assets and liabilities given the provisions of enacted tax laws. The deferred income tax provisions and benefits are based on changes to the assets or liabilities from year to year. In providing for deferred taxes, the Company considers tax regulations of the jurisdictions in which it operates, estimates of future taxable income and available tax planning strategies. If tax regulations, operating results or the ability to implement tax planning and strategies vary, adjustments to the carrying value of deferred tax assets and liabilities may be required. Valuation allowances are recorded related to deferred tax assets based on the more likely than not realization criteria. Through 2008, the Company had not recorded deferred income taxes on the undistributed earnings of its Irish subsidiary because it intended to permanently reinvest such earnings. Beginning in 2009, the Company intends to repatriate the future earnings of its Irish subsidiary.
Comprehensive Income (Loss) — Comprehensive income (loss) is defined as the change in equity of a business enterprise from transactions and other events from non-owner sources. Comprehensive income (loss) includes net earnings (loss) and other non-owner changes in equity that bypass the statement of operations and are reported in a separate component of equity. For the years ended December 31, 2010, 2009 and 2008, other comprehensive income (loss) includes the foreign currency translation adjustment and the net of tax impact of an interest rate swap when applicable.
Accounts Receivable — The majority of the Company’s accounts receivables are due from retailers and two-step distributors. Credit is extended based on an evaluation of a customer’s financial condition, including, at times the availability of credit insurance, and, generally, collateral is not required. Accounts receivable are due within various time periods specified in the terms applicable to the specific customer and are stated at amounts due from customers net of an allowance for claims and doubtful accounts.
The Company determines its allowance by considering a number of factors, including the length of time trade accounts receivable are past due, the Company’s previous loss history, the customer’s current ability to pay its obligation to the Company, availability of credit insurance and the condition of the general economy and the industry as a whole. The Company writes off accounts receivable against the allowance for claims and doubtful accounts when they are judged to be uncollectible, and payments subsequently received on such receivables are credited to customer claims or bad debt expense.
Inventories — Inventories are recorded at the lower of cost or market, on a first-in, first-out basis.
Concentration of Credit Risk — The Company has evaluated its concentration of credit risk as it applies both to customers and to the institutions with which it places cash investments.
The Company believes that its concentration of credit risk as it applies to customers is low due to its broad customer base in all regions of the United States, as well as other areas in North America and Europe. Customer concentration is described by those customers that accounted for more than 10 percent of sales as follows: Net sales in 2010 by the Cobra segment to Wal-Mart totaled 11.1 percent of consolidated net sales. In 2009 and 2008, net sales by the Cobra segment to Wal-Mart totaled 15.4 percent and 11.2 percent, respectively, of consolidated net sales. The Company will selectively use credit insurance for certain accounts in light of management’s judgment of credit risk and the expense to acquire such insurance.
33
Table of Contents
The Company places temporary cash investments with institutions of high credit quality. At December 31, 2010 and 2009, the Company had approximately $1.1 million ($700,000 was on deposit in foreign banks) and approximately $1.4 million ($900,000 was on deposit in foreign banks) respectively, on deposit with such financial institutions, of which $209,000 and $658,000, respectively, were in excess of amounts insured by the respective governments. The Company performs periodic evaluations of these institutions for relative credit standing and has not experienced any losses as a result of this concentration. Consequently, no significant concentration of credit risk is considered to exist.
Depreciation — Depreciation of buildings, tooling and equipment is computed using the straight-line method over the following estimated useful lives. Building improvements are depreciated using the straight-line method over the lesser of the useful life or the lease term. Depreciation expense totaled $1.3 million for 2010, $1.5 million for 2009 and $1.9 million for 2008.
|
Classification |
Life | |
| Buildings |
30 years | |
| Building improvements |
20 years | |
| Motor vehicles |
2 - 5 years | |
| Equipment |
5 - 10 years | |
| Tools, dies and molds |
1.5 - 4.5 years |
Long-Lived Assets — Long-lived assets are reviewed for possible impairment whenever events indicate that the carrying amount of such assets may not be recoverable. If such a review indicates impairment, the carrying amount of such assets is reduced to an estimated fair value.
Intangible assets subject to amortization are evaluated for impairment whenever events or circumstances indicate that the carrying amount of an amortizable intangible asset may not be recoverable. If impairment indicators exist for an amortizable intangible asset, the undiscounted future cash flows associated with the expected service potential of the asset are compared to the carrying value of the asset. If the projection of undiscounted future cash flows is in excess of the carrying value of the intangible assets, no impairment charge is recorded. If the projection of undiscounted cash flows is less than the carrying value of the intangible asset, an impairment charge is recorded to reduce the intangible asset to its fair value. The Company recorded a product software impairment charge of $266,000 in the second quarter of 2008. Economic conditions in the fourth quarter of 2008 triggered an impairment analysis, however no impairment resulted. Economic conditions in 2009 and 2010 did not trigger an impairment review, and accordingly, the Company did not record any impairment charges in 2009 or 2010.
Goodwill and Other Intangible Assets — The Company evaluates goodwill for impairment on an annual basis or if impairment indicators exist. For goodwill, the evaluation requires a comparison of the estimated fair value of PPL to which the goodwill has been assigned to the sum of the carrying value of the assets and liabilities of that unit. If the sum of the carrying value of the assets and liabilities of a reporting unit exceeds the fair value of that reporting unit, the carrying value of the reporting unit’s goodwill is reduced to its estimated fair value through an adjustment to the goodwill balance, resulting in an impairment charge.
The fair values used in the impairment evaluation are estimated based upon discounted future cash flow projections and comparisons with comparable companies as well as the Company’s market capitalization. The Company’s annual impairment review as of October 1, 2008 was superseded by continued degradation of the financial markets and the Company’s stock price. The Company’s low stock price in relation to book value per share triggered an impairment review of the goodwill associated with the PPL acquisition as of December 31, 2008. Based on the year-end reconciliation of the book value to market capitalization, a $20.1 million impairment charge was recorded in the fourth quarter of 2008.
Amortization of intangible assets is computed using the straight-line method over the following weighted average useful lives:
|
Classification |
Life | |
| Internal use software |
3 years | |
| ERP internal use software |
7 years | |
| Trademarks and tradenames |
3 - 30 years | |
| Patents |
17 years | |
| Product software (based on product life cycle) |
1 - 3 years | |
| Enigma Data base |
5 years | |
| Noncompetition Agreements |
3 years | |
| Customer Relationships |
10 years |
Amortization expense relating to intangible assets subject to amortization totaled $1.9 million in 2010, $1.9 million in 2009, and $2.5 million in 2008.
34
Table of Contents
Software Related to Products Sold — The Company purchases and/or incurs costs in connection with the development of software to be used in products that the Company intends to sell. Coding and related costs incurred after technological feasibility of the software has been established and a working model of the product developed are capitalized and deferred as intangible assets. Capitalized costs are charged to earnings based on the ratio of actual product sales during the reporting period to expected product sales over the estimated product life cycle. Software related intangible assets are reviewed at each balance sheet date for possible impairment. If such review indicates that the carrying amount of these assets may not be recoverable, the carrying amount is reduced to the estimated fair value.
ERP System Costs — The Company capitalizes certain costs associated with ERP software developed or obtained for internal use. The Company’s policy provides for the capitalization of external direct costs of materials and services associated with developing or obtaining internal use ERP software. Capitalized costs are classified as intangible assets. Costs associated with preliminary project activities and training are expensed as incurred. Capitalized costs related to ERP software developed or obtained for internal use are amortized over a seven year period on a straight-line basis when the relevant ERP software is placed in service.
Deferred Income — Prepaid subscriptions to the AURA database and AURA database subscriptions bundled with certain detection and navigation products are classified as deferred income. The deferred subscription revenue is recognized over the applicable subscription period. At December 31, 2010 and 2009 the current portion of the deferred income totaled $1.2 million and $1.1 million, respectively, and the long-term portion of the deferred income totaled $282,000 and $227,000, respectively. The current deferred income is classified as other accrued liabilities and the long-term deferred income is classified as other long-term liabilities on the balance sheet.
(2) New Accounting Standards
No new accounting standards that affected the Company’s financial reporting were issued in 2010.
(3) Goodwill Impairment
The Company recorded goodwill of $12.0 million in connection with the acquisition of Performance Products Limited (“PPL”) in October 2006. Additional goodwill of $8.5 million resulted from the final earn-out payment to the former PPL shareholders that was recorded in September 2008 and paid in October 2008. Based on the Company’s annual impairment review in October 2008, a $20.1 million impairment charge was recorded in the fourth quarter of 2008. There were no impairment charges recorded in 2009 and 2010.
(4) Segment Information
The Company operates in two business segments (1) Cobra Consumer Electronics (“Cobra”) and (2) Performance Products Limited (“PPL”). The Cobra segment is comprised of Cobra Electronics Corporation, Cobra Hong Kong Limited (“CHK”) and Cobra Electronics Europe Limited (“CEEL”). The Company has separate sales departments and distribution channels for each segment, which provide all segment exclusive product lines to all customers for that segment. Currently, there are no intersegment sales.
The tabular presentation below sets forth certain financial information regarding the Company’s net sales and long-lived assets by geographic area for the years ended December 31, 2010, 2009 and 2008.
| Year Ended December 31 | ||||||||||||
| 2010 | 2009 | 2008 | ||||||||||
| (in thousands) | ||||||||||||
| Net sales |
||||||||||||
| Domestic |
$ | 81,388 | $ | 79,752 | $ | 89,654 | ||||||
| International |
29,132 | 25,477 | 35,091 | |||||||||
| Long-lived assets |
||||||||||||
| Domestic |
$ | 13,109 | $ | 14,016 | $ | 14,125 | ||||||
| International |
7,188 | 8,028 | 8,075 | |||||||||
35
Table of Contents
The tabular presentation below summarizes the financial information by business segment for the years ended December 31, 2010, 2009 and 2008.
| Year ended December 31, 2010 | Year ended December 31, 2009 | Year ended December 31, 2008 | ||||||||||||||||||||||||||||||||||
| COBRA | PPL | TOTAL | COBRA | PPL | TOTAL | COBRA | PPL | TOTAL | ||||||||||||||||||||||||||||
| (in thousands) | ||||||||||||||||||||||||||||||||||||
| STATEMENT OF OPERATIONS |
|
|||||||||||||||||||||||||||||||||||
| Net sales |
$ | 95,797 | $ | 14,723 | $ | 110,520 | $ | 93,305 | $ | 11,924 | $ | 105,229 | $ | 110,846 | $ | 13,899 | $ | 124,745 | ||||||||||||||||||
| Cost of sales |
70,133 | 10,533 | 80,666 | 70,613 | 8,240 | 78,853 | 79,849 | 6,727 | 86,576 | |||||||||||||||||||||||||||
| Gross profit |
25,664 | 4,190 | 29,854 | 22,692 | 3,684 | 26,376 | 30,997 | 7,172 | 38,169 | |||||||||||||||||||||||||||
| Selling, general and administrative expense |
23,442 | 4,605 | 28,047 | 25,921 | 4,145 | 30,066 | 28,994 | 5,181 | 34,175 | |||||||||||||||||||||||||||
| Impairment of goodwill |
- | - | - | - | - | - | - | 20,084 | 20,084 | |||||||||||||||||||||||||||
| Earnings (loss) from operations |
2,222 | (415 | ) | 1,807 | (3,229 | ) | (461 | ) | (3,690 | ) | 2,003 | (18,093 | ) | (16,090 | ) | |||||||||||||||||||||
| Interest expense |
(1,563 | ) | (1 | ) | (1,564 | ) | (1,149 | ) | - | (1,149 | ) | (1,109 | ) | - | (1,109 | ) | ||||||||||||||||||||
| Other income (expense) |
544 | 410 | 954 | 782 | 549 | 1,331 | (1,453 | ) | 422 | (1,031 | ) | |||||||||||||||||||||||||
| Earnings (loss) before income taxes |
1,203 | (6 | ) | 1,197 | (3,596 | ) | 88 | (3,508 | ) | (559 | ) | (17,671 | ) | (18,230 | ) | |||||||||||||||||||||
| Tax (benefit) expense |
(39 | ) | (341 | ) | (380 | ) | 7,035 | (273 | ) | 6,762 | 366 | 232 | 598 | |||||||||||||||||||||||
| Non-controlling interest |
- | - | - | - | (2 | ) | (2 | ) | - | (11 | ) | (11 | ) | |||||||||||||||||||||||
| Net earnings (loss) |
$ | 1,242 | $ | 335 | $ | 1,577 | $ | (10,631 | ) | $ | 359 | $ | (10,272 | ) | $ | (925 | ) | $ | (17,914 | ) | $ | (18,839 | ) | |||||||||||||
| December 31, 2010 | December 31, 2009 | December 31, 2008 | ||||||||||||||||||||||||||||||||||
| COBRA |
PPL |
TOTAL |
COBRA |
PPL |
TOTAL |
COBRA |
PPL |
TOTAL |
||||||||||||||||||||||||||||
| (in thousands) | ||||||||||||||||||||||||||||||||||||
| Capital expenditures |
$ | 1,025 | $ | 416 | $ | 1,441 | $ | 739 | $ | 356 | $ | 1,095 | $ | 1,057 | $ | 109 | $ | 1,166 | ||||||||||||||||||
| Depreciation and amortization |
2,737 | 1,199 | 3,936 | 2,656 | 1,227 | 3,883 | 3,537 | 1,759 | 5,296 | |||||||||||||||||||||||||||
| Impairment |
- | - | - | - | - | - | 266 | 20,084 | 20,350 | |||||||||||||||||||||||||||
| Long-lived assets |
13,645 | 6,652 | 20,297 | 14,391 | 7,653 | 22,044 | 14,479 | 7,721 | 22,200 | |||||||||||||||||||||||||||
| Total assets |
58,674 | 15,680 | 74,354 | 60,693 | 15,010 | 75,703 | 65,923 | 13,075 | 78,998 | |||||||||||||||||||||||||||
(5) Multiple Element Arrangements
The Company bundles the sale of its PPL trucker navigation and other selected PPL navigation products with ongoing access to its AURA speed camera database in order to allow those customers who so chose, to update their databases for both navigation low bridge height data (perceived as critical to some professional drivers) and speed camera locations. However, in order to receive these updates to these fully functional products, customers must first register on PPL’s website. The Company deferred the revenue associated with the ongoing service period, which was considered a separate unit of accounting. Revenues deferred from this arrangement were calculated using the relative fair market value method and amounted to $741,000 at December 31, 2010 and $556,000 at December 31, 2009.
In addition, beginning in 2009, the Company’s domestic business began selling products that bundled selected Detection products with ongoing access to the AURA database and a product that bundled the 7700 PRO professional driver navigation product with a three-month access to the AURA database. Revenues deferred from these arrangements were calculated using the relative fair market value method and amounted to $337,000 at December 31, 2010 and $199,000 at December 31, 2009.
(6) Income Taxes
Deferred income taxes are determined based on the estimated future tax effects of differences between the financial statement and tax bases of assets and liabilities given the enacted tax laws for each applicable tax jurisdiction. The deferred income tax provisions and benefits are based on changes to the assets or liabilities from year to year and the effect of enacted tax rate changes. Valuation allowances related to deferred taxes are recorded based on the more likely than not realization criteria. The Company reviews the need for a valuation allowance on a quarterly basis for each of its tax jurisdictions. When evaluating the recoverability of future tax benefits, the Company considers the historic operating results, projected operating results and available tax planning strategies, if any.
Due to the Company’s operating results for 2009, the expected continuation of a global recession and the absence of tax planning strategies to generate a sufficient level of taxable income, management concluded the full realization of the deferred tax assets within a reasonable time horizon did not satisfy the more likely than not realization criteria. Accordingly, the Company established a full deferred tax valuation allowance for its U.S. operation in 2009. The Company maintained the valuation allowance for its U.S. operation throughout 2010. The valuation allowance is a non-cash charge that does not preclude the Company from fully realizing the net deferred tax assets in the future. The deferred tax valuation allowance totaled $7.9 million at December 31, 2010 and $8.4 million at December 31, 2009.
36
Table of Contents
The Worker, Homeownership, and Business Assistance Act of 2009, enacted November 6, 2009, allowed eligible businesses a one-time election to carry back net operating losses (“NOL”) from 2008 or 2009 (but not both) for three, four or five years rather than the standard two years. As a result of this one-time opportunity, the Company carried back $5.0 million of 2009’s NOL to prior periods and generated a federal tax refund of $1.0 million. The NOL federal tax carry forward for 2008 and 2009 totaling $1.2 million was utilized in 2010. Accordingly, the Company does not have a federal NOL carry forward at December 31, 2010, however the state tax NOL carry forward at December 31, 2010 totaled $523,000. The Company’s AMT credit carry forward, which does not expire and is available to offset against future income tax payments, totaled $2.4 million at December 31, 2010. Amounts held by foreign subsidiaries are generally subject to U.S. income taxation on repatriation to the United States. Through 2008, the Company had not recorded deferred income taxes on the undistributed earnings of its Irish subsidiary totaling $1.8 million because the Company intended to indefinitely reinvest such earnings. Beginning in 2009, the Company intended to repatriate the future earnings of its Irish subsidiary (CEEL), which will increase the Company’s effective tax on these earnings to reflect the higher U.S. tax rate once the prior year’s net operating loss is utilized and the valuation allowance is reversed. CEEL generated an operating loss for 2009, and accordingly no funds were repatriated to the United States. In 2010, CEEL generated an operating profit and accordingly deferred taxes of $248,000 were provided in the United States for the un-repatriated earnings.
The provision (benefit) for income taxes for the years ended December 31, 2010, 2009 and 2008 consists of:
| 2010 | 2009 | 2008 | ||||||||||
| (in thousands) | ||||||||||||
| Current (benefit) provision |
||||||||||||
| Federal |
$ | (128 | ) | $ | (936 | ) | $ | (80 | ) | |||
| State |
(2 | ) | (165 | ) | (14 | ) | ||||||
| Foreign |
91 | (286 | ) | 1,697 | ||||||||
| (39 | ) | (1,387 | ) | 1,603 | ||||||||
| Deferred (benefit) provision |
||||||||||||
| Federal |
- | 6,958 | 170 | |||||||||
| State |
- | 1,228 | 30 | |||||||||
| Foreign |
(341 | ) | (37 | ) | (1,205 | ) | ||||||
| (341 | ) | 8,149 | (1,005 | ) | ||||||||
| Total (benefit) provision |
$ | (380 | ) | $ | 6,762 | $ | 598 | |||||
A summary of the pre-tax earnings (loss) and tax provision (benefit) for the years ended December 31, 2010, 2009 and 2008 by major taxing jurisdiction follows:
| 2010 | 2009 | 2008 | ||||||||||||||||||||||
| Pre-Tax Income |
Tax Benefit |
Pre-Tax Loss |
Tax (Benefit) Provision |
Pre-Tax Loss |
Tax Provision |
|||||||||||||||||||
| (in thousands) | ||||||||||||||||||||||||
| United States |
$ | 890 | $ | (130 | ) | $ | (2,613 | ) | $ | 7,085 | $ | (2,114 | ) | $ | 106 | |||||||||
| Foreign |
307 | (250 | ) | (895 | ) | (323 | ) | (16,116 | ) | 492 | ||||||||||||||
| Total |
$ | 1,197 | $ | (380 | ) | $ | (3,508 | ) | $ | 6,762 | $ | (18,230 | ) | $ | 598 | |||||||||
The statutory federal income tax rate (34 percent) for the years ended December 31, 2010, 2009 and 2008 is reconciled to the effective income tax rate as follows:
| 2010 | 2009 | 2008 | ||||||||||||||||||||||
| Income taxes at statutory federal income tax rate |
34.0 | % | (34.0 | ) | % | (34.0 | ) | % | ||||||||||||||||
| State taxes, net of federal income tax benefit |
3.2 | (2.9 | ) | (0.5 | ) | |||||||||||||||||||
| Foreign operations |
(29.6 | ) | (0.5 | ) | 1.4 | |||||||||||||||||||
| R & D credit |
(7.2 | ) | (2.8 | ) | (0.5 | ) | ||||||||||||||||||
| Valuation allowance |
(45.0 | ) | 239.0 | - | ||||||||||||||||||||
| Goodwill impairment |
- | - | 31.4 | |||||||||||||||||||||
| CSV (gain) loss |
(18.4 | ) | (8.0 | ) | 3.2 | |||||||||||||||||||
| Permanent items |
7.3 | 2.8 | 2.5 | |||||||||||||||||||||
| Deferred tax for Irish subsidiary |
20.7 | - | - | |||||||||||||||||||||
| Reduction in FIN 48 reserve |
(2.2 | ) | - | - | ||||||||||||||||||||
| Adjustment to prior year tax |
2.8 | (0.8 | ) | (0.2 | ) | |||||||||||||||||||
| Other |
2.6 | - | - | |||||||||||||||||||||
| Effective tax rate |
(31.8 | ) | % | 192.8 | % | 3.3 | % | |||||||||||||||||
37
Table of Contents
Deferred tax assets and liabilities by type at December 31, 2010 and 2009 are as follows:
| 2010 | 2009 | |||||||
| (in thousands) | ||||||||
| Deferred tax assets: |
||||||||
| Sales/receivable reserves |
$ | 581 | $ | 464 | ||||
| Inventory reserves |
900 | 890 | ||||||
| Compensation reserves |
3,106 | 2,767 | ||||||
| Accrued promotion expenses |
324 | 499 | ||||||
| Warranty reserves |
349 | 319 | ||||||
| AMT credit carry-forward |
2,442 | 2,425 | ||||||
| R & D expenditures |
588 | 574 | ||||||
| Net operating loss carry-forward |
523 | 1,006 | ||||||
| Other |
278 | 389 | ||||||
| Valuation allowance |
(7,895 | ) | (8,434 | ) | ||||
| Deferred tax assets |
1,196 | 899 | ||||||
| Deferred tax liabilities: |
||||||||
| Tax basis difference on PPL assets acquired |
(1,550 | ) | (1,946 | ) | ||||
| Intangible assets |
(826 | ) | (693 | ) | ||||
| Other |
(370 | ) | (206 | ) | ||||
| Deferred tax liabilities |
(2,746 | ) | (2,845 | ) | ||||
| Net deferred tax liability |
$ | (1,550 | ) | $ | (1,946 | ) | ||
A summary of the deferred tax asset/liability by major taxing jurisdiction at December 31, 2010 and 2009 follows:
| 2010 | 2009 | |||||||
| (in thousands) | ||||||||
| United States |
$ - | $ - | ||||||
| Foreign |
(1,550) | (1,946) | ||||||
| Total |
$ (1,550) | $ (1,946) | ||||||
Uncertain Tax Positions
Uncertain tax positions are evaluated for measurement, recognition and derecognition. The Company recognizes the effect of income tax positions only when those positions are more likely than not of being sustained. Recognized income tax positions are measured at the largest amount that is greater than 50 percent likely of being realized. Changes in recognition or measurement are reflected in the period in which the change in judgment occurs. Interest related to unrecognized tax benefits and penalties is recorded in income tax expense.
A reconciliation of the beginning and ending balance of the unrecognized tax benefit follows (in thousands);
| Balance at January 1, 2008 |
$ | 93 | ||
| Additions for current year tax positions |
29 | |||
| Balance at December 31, 2008 |
122 | |||
| Additions for current year tax positions |
25 | |||
| Balance at December 31, 2009 |
147 | |||
| Additions for current year tax positions |
24 | |||
| Reductions for prior years’ tax positions |
(14 | ) | ||
| Balance at December 31, 2010 |
$ | 157 | ||
The balance of unrecognized tax benefits at December 31, 2010 includes potential benefits of $157,000 that, if recognized, would affect the effective tax rate. The total amount of unrecognized tax benefits is not expected to significantly change in the next twelve months.
The expense reversal related to the uncertain tax positions totaled $9,000 in interest and $4,000 in penalties for 2010 and $3,000 in interest and $2,000 in penalties for 2009. The interest expense and penalties related to the uncertain tax positions for 2008 totaled $6,000 and $1,000, respectively. Total accrued interest and penalties at December 31, 2010 and 2009 were $0 and $13,000 respectively.
The Company files federal, state and foreign income tax returns. The federal tax returns for the 2005 – 2010 tax years remain open to examination by the Internal Revenue Service. State tax returns for the 2006 – 2010 tax years remain open to examination by certain tax jurisdictions. The major foreign jurisdictions where the Company files tax returns are Ireland and the United Kingdom. The 2008 through 2010 tax years are open to examination in those foreign jurisdictions.
38
Table of Contents
(7) Financing Arrangements
On July 16, 2010, the Company entered into the Credit Agreement (the “Credit Agreement”) among the Company, Harris N.A., as administrative agent (the “Administrative Agent”), and the lenders party thereto from time to time (the “Lenders”). The Credit Agreement provides for a $25.0 million revolving loan facility, which will mature on July 16, 2013. Borrowings under the Credit Agreement were used (i) to repay amounts outstanding under the Company’s term loan and revolving credit facility under the Loan and Security Agreement (as amended, the “Terminated Loan Agreement”) dated as of February 15, 2008 among the Company, the lenders party thereto and The PrivateBank and Trust Company, as a lender and administrative agent and (ii) for general corporate purposes. Pursuant to the terms of the Credit Agreement, the Company is required to make mandatory prepayments on the amounts outstanding thereunder in the event that the Company receives proceeds under certain circumstances or in connection with other specified events.
Borrowings under the Credit Agreement bear interest at either the base rate or the LIBOR lending rate (each as defined in the Credit Agreement), as applicable, plus the applicable margin set forth in the Credit Agreement. The Company will also pay certain fees and expenses, including a (i) commitment fee equal to 0.50 percent per annum on the unused portion of the Lenders’ aggregate revolving commitment and (ii) a letter of credit fee equal to the product of the applicable margin set forth in the Credit Agreement times the face amount of the standby letters of credit and the commercial letters of credit outstanding at such time. The Credit Agreement contains customary covenants, including but not limited to financial covenants requiring the Company to maintain a Fixed Charge Coverage Ratio (as defined in the Credit Agreement) of 1.10 to 1.00 for the periods set forth in the Credit Agreement and annual capital expenditures cannot exceed $3.5 million. The Company was restricted from paying dividends to shareholders in 2010. Commencing in 2011, the Company may pay dividends to shareholders up to an aggregate amount of $1,250,000 in any fiscal year, subject to compliance with certain covenants and conditions. The Company’s Fixed Charge Coverage Ratio, which is based on adjusted EBITDA less capital expenditures and cash tax payments in relation to interest expense, for the fourth quarter of 2010, exceeded the required minimum ratio of 1.10 to 1.00 and all financial covenants for the fourth quarter of 2010 were satisfied.
As a condition to the extension of the loans and the issuance of the letters of credit under the Credit Agreement, the Company has granted a security interest to the Administrative Agent, for the benefit of the Lenders, in substantially all the assets of the Company except (i) life insurance policies not collaterally assigned to the Lenders, (ii) any equipment subject to liens permitted under the Credit Agreement if such equipment is also subject to an agreement prohibiting the pledge of such equipment to the Lenders, (iii) deposit accounts used exclusively by the Company for payroll and employee retiree benefit purposes and (iv) the Company’s interest in the outstanding voting equity securities of any of its directly-owned foreign subsidiaries to the extent such interests exceed 65 percent of the outstanding voting equity securities of such foreign subsidiary.
In connection with the new Credit Agreement, the Company wrote-off the deferred financing costs associated with the Terminated Loan Agreement and recognized a non-cash pre-tax charge of $349,000 in the third quarter of 2010. Financing costs for the new Credit Agreement totaling $513,000 were capitalized in the third quarter of 2010 and will be amortized over the loan term. Additionally, in connection with the refinancing, the Company terminated an interest rate swap agreement in exchange for a $381,000 cash payment by the Company on July 16, 2010. With the elimination of the interest rate swap, the fair value of the Company’s debt is no longer affected by changes in the interest rate market and future changes in the applicable interest rate will affect the interest expense incurred on the Company’s outstanding indebtedness.
At December 31, 2010, the Company had interest bearing debt outstanding of $18.0 million borrowed under the revolving credit facility and credit availability was approximately $4.2 million under the revolving credit facility based on the borrowing base formula that includes the following: 85 percent of eligible accounts receivables, the lesser of 65 percent of lower of cost or market of eligible inventory or 85 percent of the appraised net orderly liquidation value of eligible inventory, and 65 percent of commercial letters of credit issued for the purchase of inventory, subject to certain limitations and reserves established at the lenders discretion. The weighted average interest rate for the twelve months ending December 31, 2010 and 2009 (which includes the amortization charges associated with the terminated interest rate swap, refer to Note 9, Derivatives for additional information) was 6.2 percent and 4.8 percent, respectively. Maximum borrowings outstanding at any month end were $20.8 million and $21.6 million in 2010 and 2009, respectively. Aggregate average daily borrowings outstanding were $16.4 million during 2010 and $19.5 million during 2009.
Aggregate principal repayments of long-term debt excluding payments on capital lease obligations over the next five years as of December 31, 2010 are as follows:
| Year |
Revolver | |||
| (in thousands) | ||||
| 2011 |
$ | - | ||
| 2012 |
- | |||
| 2013 |
18,042 | |||
| $ | 18,042 | |||
39
Table of Contents
The year-end interest for the term loan was 7.97 percent at December 31, 2009. The year-end interest rate for the revolving loan at prime was 5.25 percent at December 31, 2010 and 2009. The year-end interest for the portion of the revolving loan at LIBOR was 3.76 percent at December 31, 2010 and 6.17 percent at December 31, 2009.
(8) Fair Value of Financial Instruments
The Company’s financial instruments include cash, accounts receivable, accounts payable, short-term debt, long-term debt and letters of credit. The carrying values of cash, accounts receivable and accounts payable approximated their fair value because of the short-term maturity of these instruments. The carrying amounts of the Company’s bank borrowings under its Credit Agreement approximate fair value because the interest rates are reset periodically to reflect current market rates. The letters of credit approximated fair value due to the short-term nature of the instrument. The contract value/fair value of the letters of credit was $2.7 million at December 31, 2010 and 2009. The Company’s hedging activity is limited to foreign currency purchases and an interest rate swap. The Company engages in foreign currency hedging to minimize the risk that the eventual settlement of foreign currency transactions would be adversely affected by changes in exchange rates. The Company did not have any open foreign exchange contracts at December 31, 2010 and 2009. The purpose of the interest rate swap, which was terminated on July 16, 2010, was to fix the interest rate for the term of the loan and protect the Company from future interest rate increases.
The Company occasionally hedges foreign exchange exposures by entering into various short-term forward foreign exchange contracts. The instruments are carried at fair value in its Consolidated Balance Sheets as a component of current liabilities. Changes in the fair value of foreign exchange forward contracts that meet the applicable hedging criteria are recorded as a component of other comprehensive income and reclassified into earnings in the same period during which the hedged transaction affected earnings. Changes in the fair value of foreign exchange forward contracts that do not meet the applicable hedging criteria are recorded currently in income as cost of sales. Hedging activities did not have a material impact on results of operations or financial condition during the twelve-month periods ending December 31, 2010 and 2009.
Until it was terminated on July 16, 2010, the Company had a derivative contract for an interest rate swap that was valued on a recurring basis using quoted market prices. This financial instrument was exchange-traded and was classified within Level 2 of the fair value hierarchy because the exchange is not deemed to be an active market. The derivative was classified as a long-term liability on the balance sheet. Refer to Note 9, Derivatives, for additional information.
The following table provides the fair value information for the Company’s interest rate swap as of December 31, 2010 and 2009:
| December 31, 2010 | December 31, 2009 | |||||||||||||||||||||||
| Carrying Amount |
Fair Value | Carrying Amount |
Fair Value | |||||||||||||||||||||
| Liabilities |
Total Fair Value |
Significant Other Observable Inputs (Level 2) |
Total Fair Value |
Significant Other Observable Inputs (Level 2) |
||||||||||||||||||||
| (In thousands) | ||||||||||||||||||||||||
| Interest rate swap |
$ | - | $ | - | $ | - | $ | 420 | $ | 420 | $ | 420 | ||||||||||||
(9) Derivatives
The Company transacts business globally with various manufacturing and distribution facilities. The Company may reduce its exposure to fluctuations in foreign exchange rates by creating offsetting positions through derivative financial instruments. The Company currently does not use derivative financial instruments for trading or speculative purposes. The Company regularly monitors foreign exchange exposures and ensures hedge contract amounts do not exceed the amounts of the underlying exposures.
Prior to its termination on July 16, 2010, the Company maintained an interest rate swap to fix the interest rate for the term of the revolving credit facility and term loan under the Terminated Loan Agreement, thereby protecting the Company from future interest rate increases. The interest rate swap represented a cash flow hedge and was recorded at fair value and classified as a non-current liability. Changes in the recorded fair value of the interest rate swap were recorded to other comprehensive income. At March 31, 2009, the existing contract applicable to the term loan with a value of $250,000 was terminated and replaced with a contract applicable to the term loan and a portion of the revolving loan valued at $377,000. The value of the interest rate swap liability terminated in March 2009 will be amortized into interest expense through September 30, 2011. In connection with the refinancing of borrowings under the Terminated Loan Agreement, the Company paid $381,000 on July 16, 2010 to terminate the related interest rate swap agreement. The termination cost of the interest rate swap in July 2010 will be amortized into interest expense through March 31, 2014. The interest amortization for the Company’s terminated interest rate swaps reclassified from Accumulated Other Comprehensive Income into interest income (expense) during the twelve months ending December 31, 2010 and 2009 follows:
| Year Ended December 31, | ||||||||
| Income Statement Location |
2010 | 2009 | ||||||
| (in thousands) | ||||||||
| Interest income |
$ | 11 | $ | 125 | ||||
40
Table of Contents
The carrying value of the interest rate swap at December 31, 2010 and 2009 was $0 and $420,000, respectively. The fair value of outstanding derivative contracts designated as hedging instruments recorded as liabilities in the accompanying balance sheet were as follows:
| December 31, | ||||||||||
| Liability Derivative |
Balance Sheet Location |
2010 | 2009 | |||||||
| (In thousands) | ||||||||||
| Interest rate swap |
Non-current liability | $ | - | $ | 420 | |||||
The effective portion of the gain (loss) on outstanding derivatives recognized in Other Comprehensive Income (“OCI”) for the twelve months ending December 31, 2010 and 2009 follows:
| Year Ended December 31 | ||||||||
| 2010 | 2009 | |||||||
| (in thousands) | ||||||||
| Interest rate swap |
$ | 130 | $ | (129) | ||||
(10) Lease Transactions
The Company leases facilities and equipment under non-cancelable leases with remaining terms of one year or more, expiring at various dates through the year 2020. The terms of the agreements provide that the Company will pay certain operating expenses. The capital lease provides the Company with the option to purchase the related asset at the end of the respective initial lease terms. The gross amount and accumulated amortization for assets subject to the capital lease at December 31, 2010 was $136,000 and $79,000, respectively. The present value of the capital lease was $57,000 less $3,000 of interest.
Total minimum rental amounts committed in future years as of December 31, 2010 are as follows:
| Operating Lease |
Capital Lease |
Total | ||||||||||
| (in thousands) | ||||||||||||
| 2011 |
$ | 434 | $ | 48 | $ | 482 | ||||||
| 2012 |
383 | 12 | 395 | |||||||||
| 2013 |
351 | - | 351 | |||||||||
| 2014 |
290 | - | 290 | |||||||||
| 2015 |
94 | - | 94 | |||||||||
| Thereafter |
311 | - | 311 | |||||||||
| Total |
$ | 1,863 | $ | 60 | $ | 1,923 | ||||||
Rental expense totaled $714,000 in 2010, $669,000 in 2009, and $752,000 in 2008.
(11) Shareholders’ Equity
Preferred stock is issuable at anytime in one or more series, each of which may have such voting powers, designations, preferences, relative participating, optional or other special rights, and qualifications, limitations or restrictions thereof, as shall be stated and expressed in the resolution or resolutions providing for the issue of such stock adopted by the Board of Directors. The Company has designated 120,000 of the 1 million authorized shares of preferred stock as Series A Junior Participating preferred stock. No preferred stock has been issued.
41
Table of Contents
(12) Earnings Per Share
Basic earnings per share excludes any dilution and is computed by dividing net earnings available to common shareholders by the weighted-average number of common shares outstanding for the period. Diluted earnings per share reflect the potential dilution that could occur if securities or other contracts to issue common stock resulted in the issuance of common stock. If the common stock equivalents have an anti-dilutive effect, they are excluded from the computation of diluted earnings per share.
| 2010 | 2009 | 2008 | ||||||||||
| (in thousands, except per share data) | ||||||||||||
| Basic earnings (loss) per share: |
||||||||||||
| Net earnings (loss) available to common shareholders |
$ | 1,577 | $ | (10,272 | ) | $ | (18,839 | ) | ||||
| Weighted-average shares outstanding |
6,471 | 6,471 | 6,471 | |||||||||
| Basic earnings (loss) per share |
$ | 0.24 | $ | (1.59 | ) | $ | (2.91 | ) | ||||
| Diluted earnings (loss) per share: |
||||||||||||
| Weighted-average shares outstanding |
6,471 | 6,471 | 6,471 | |||||||||
| Dilutive shares issuable in connection with stock option plans (a) |
- | - | - | |||||||||
| Less: shares purchasable with option proceeds |
- | - | - | |||||||||
| Total |
6,471 | 6,471 | 6,471 | |||||||||
| Diluted earnings (loss) per share |
$ | 0.24 | $ | (1.59 | ) | $ | (2.91 | ) | ||||
| (a) | Stock options to purchase 322,780, 447,780 and 509,296 shares were not included in the calculation for dilutive earnings per share for the years ended December 31, 2010, 2009 and 2008, respectively, because the exercise price exceeded the market price. |
(13) Stock Based Compensation
The Company has equity based compensation plans from which stock based compensation awards can be granted to eligible employees, officers or directors. The 2010 Equity Incentive Plan replaced the 2002 plan and consolidated option and equity programs under a single plan. A summary of the stock based compensation awards by plan follows:
| 2010 Plan |
2002 Plan |
Closed Plans (a) |
||||||||||
| (in thousands) | ||||||||||||
| Authorized, unissued shares originally available for grant |
800 | 25 | 1,235 | |||||||||
| Granted |
- | 4 | 1,209 | |||||||||
| Shares available for grant at December 31, 2010 |
800 | 21 | - | |||||||||
| Options exercisable at December 31, 2010 |
- | 4 | 279 | |||||||||
| (a) | 2000, 1998, 1997 and 1995 Plans terminated in accordance with the respective plan terms. |
The Company awarded stock based compensation of 195,000 shares with a ten year term to employees and officers in 2007. Stock award expense totaled $202,000 for 2010, $229,000 for 2009 and $253,000 for 2008. The Company did not grant stock options in 2010, 2009 and 2008.
The Company estimates the fair value of the stock option on the grant date using the Black-Scholes-Merton option pricing model and assumptions for expected price volatility, option term, risk-free interest rate and dividend yield. Expected price volatilities are based on historical volatilities of the Company’s stock. The risk-free rate for periods within the contractual life of the option is based on the U.S. Treasury yield curve in effect at the time of grant. The expected forfeiture rate of 9 percent was based on the actual forfeitures for the current award. The fair value of the stock option is recognized on a straight-line basis over the requisite service period. The assumptions for the 2007 stock award are shown in the following table:
| Risk-free interest rate |
4.0-4.6 | % | ||
| Expected life |
10 years | |||
| Expected volatility |
40-43 | % |
Under the terms of the Plan, the consideration received by the Company upon exercise of the options may be paid in cash or by the surrender and delivery to the Company of previously owned shares of its common stock, or by a combination thereof. The optionee is credited with the fair market value of any stock surrendered and delivered as of the exercise date. Options become exercisable in annual 25 percent increments commencing twelve months after the date of grant
42
Table of Contents
A summary of the status of the Plan as of December 31, 2010, 2009 and 2008, and changes during the years ended on those dates is presented below:
| 2010 | 2009 | 2008 | ||||||||||||||||||||||
| Fixed Options |
Shares (000) |
Weighted Average Exercise Price Price |
Shares (000) |
Weighted Average Exercise Price Price |
Shares (000) |
Weighted Average Exercise Price Price |
||||||||||||||||||
| Outstanding at beginning of year |
448 | $ | 8.38 | 509 | $ | 7.99 | 684 | $ | 7.50 | |||||||||||||||
| Granted |
— | — | — | |||||||||||||||||||||
| Exercised |
— | — | — | |||||||||||||||||||||
| Cancellations and expirations |
(125 | ) | (61 | ) | (175 | ) | ||||||||||||||||||
| Outstanding at end of year |
323 | 8.93 | 448 | 8.38 | 509 | 7.99 | ||||||||||||||||||
| Options exercisable at year end |
283 | 359 | 366 | |||||||||||||||||||||
| Weighted-average fair value of options granted during the year |
$ | — | $ | — | $ | — | ||||||||||||||||||
The following table summarizes information about stock options outstanding at December 31, 2010:
| Options Outstanding | Options Exercisable | |||||||||||||||||||
| Range of Exercise Price |
Number Outstanding (000) |
Weighted Average Exercise Price Price |
Weighted Average Remaining Contractual Life |
Number Exercisable (000) |
Weighted Average Exercise Price Price |
|||||||||||||||
| $6.01 to $7.00 |
46 | $ | 6.55 | 0.2 | 46 | $ | 6.55 | |||||||||||||
| $7.01 to $8.00 |
104 | 7.15 | 1.5 | 104 | 7.15 | |||||||||||||||
| $8.01 to $9.00 |
5 | 8.41 | 1.1 | 5 | 8.41 | |||||||||||||||
| $9.01 to $10.00 |
10 | 9.55 | 3.1 | 10 | 9.55 | |||||||||||||||
| $10.01 to $11.00 |
158 | 10.78 | 6.2 | 118 | 10.78 | |||||||||||||||
| Total |
323 | 8.93 | 283 | 8.67 | ||||||||||||||||
A summary of the nonvested stock options at December 31, 2010 and 2009 and changes during the years then ended follows:
| Shares (000) |
Weighted Average Grant Date Fair Value |
|||||||
| Nonvested at January 1, 2008 |
203 | $ | 10.69 | |||||
| Forfeitures |
(8 | ) | 10.78 | |||||
| Vested |
(52 | ) | 10.57 | |||||
| Nonvested at December 31, 2008 |
143 | 10.72 | ||||||
| Forfeitures |
(5 | ) | 10.78 | |||||
| Vested |
(49 | ) | 10.62 | |||||
| Nonvested at December 31, 2009 |
89 | 10.78 | ||||||
| Forfeitures |
(5 | ) | 10.78 | |||||
| Vested |
(44 | ) | 10.78 | |||||
| Nonvested at December 31, 2010 |
40 | $ | 10.78 | |||||
The intrinsic value of the options outstanding at December 31, 2010 was zero. The total unrecognized stock compensation cost of $8,000 at December 31, 2010 will be recognized in the first quarter of 2011.
(14) Retirement Benefits
The Company has a tax-qualified retirement savings plan, the Cobra Electronics Corporation Profit Sharing and 401(k) Incentive Savings Plan (the “Plan”), under which participating employees may contribute up to the yearly statutory maximum into their Plan accounts. In addition, under the Plan, the Company matches amounts contributed by the participant up to a certain percent of earnings, not to exceed the statutory maximum. Matching 401(k) expenses for 2010, 2009 and 2008 were $201,000, $270,000 and $232,000, respectively. The Plan also allows the Company to make discretionary profit sharing contributions to the Plan accounts for the benefit of participating employees for any calendar year in an amount determined by the Board of Directors. Plan profit sharing expenses for 2010, 2009 and 2008 were $0. Non-U.S. defined contribution expenses amounted to $97,000 in 2010, $68,000 in 2009 and $57,000 in 2008.
As of December 31, 2010 and 2009, deferred compensation of $7.1 million and $6.8 million, respectively, was recorded as a long-term liability. The current portion of the deferred compensation liability was included in accrued salaries and commissions, and amounted to $476,000 at December 31, 2010 and $68,000 at December 31, 2009. Deferred compensation obligations arise pursuant to outstanding key executive deferred compensation plans, most of which are non-qualified defined benefit arrangements. The liability is based on discounted future cash flows related to these arrangements. The discount rate used at December 31, 2010 and 2009 was 7 percent.
43
Table of Contents
The cash surrender value of life insurance policies is classified on the balance sheet as a non-current asset. The cash value of officers’ life insurance policies is maintained to recover the costs of deferred compensation obligations and the aggregate death benefit to the Company totaled $20.6 million at December 31, 2010 and $19.1 million at December 31, 2009.
(15) Intangible Assets
Intangible assets consist of the following at December 31, 2010 and 2009:
| December 31 | ||||||||
| 2010 | 2009 | |||||||
| (in thousands) | ||||||||
| Internal use software |
$ | 2,399 | $ | 2,300 | ||||
| Less accumulated amortization |
(2,164 | ) | (1,990 | ) | ||||
| 235 | 310 | |||||||
| ERP internal software system |
4,303 | 4,274 | ||||||
| Less accumulated amortization |
(3,163 | ) | (2,551 | ) | ||||
| 1,140 | 1,723 | |||||||
| Trademarks, tradenames and patents |
6,172 | 6,048 | ||||||
| Less accumulated amortization |
(1,548 | ) | (1,316 | ) | ||||
| 4,624 | 4,732 | |||||||
| Product software, net of impairment |
630 | 499 | ||||||
| Less accumulated amortization, net of impairment |
(307 | ) | (320 | ) | ||||
| 323 | 179 | |||||||
| Enigma database |
1,194 | 1,230 | ||||||
| Less accumulated amortization |
(1,002 | ) | (786 | ) | ||||
| 192 | 444 | |||||||
| Customer relationships |
4,827 | 4,970 | ||||||
| Less accumulated amortization |
(2,026 | ) | (1,589 | ) | ||||
| 2,801 | 3,381 | |||||||
| Total |
$ | 9,315 | $ | 10,769 | ||||
The product software asset and accumulated amortization shown above are presented net of the respective impairment charges. There were no product software impairment charges for 2010 and 2009. The anticipated amortization expense of intangible assets over the next 5 years is $1.8 million in 2011, $1.6 million in 2012, $1.0 million in 2013, $900,000 in 2014 and $900,000 in 2015.
(16) Other Current Assets
The components of the other current assets at December 31, 2010 and 2009 follow:
| December 31 2010 |
December 31 2009 |
|||||||
| (in thousands) | ||||||||
| Prepaid assets |
$ | 2,151 | $ | 1,523 | ||||
| Tax refunds and receivables |
3 | 1,060 | ||||||
| Vendor and miscellaneous receivables |
1,135 | 1,378 | ||||||
| $ | 3,289 | $ | 3,961 | |||||
(17) Commitments and Contingencies
The Company is subject to various unresolved legal actions, which arise in the normal course of its business. None of these matters is expected to have a material adverse effect on the Company’s financial position or results of operations. However, the ultimate resolution of these matters cannot be determined at this time.
At December 31, 2010 and 2009, the Company had outstanding inventory purchase orders with suppliers totaling approximately $19.9 million and $17.7 million, respectively.
(18) Product Warranty Costs and Inventory Valuation Reserves
The Company warrants to the consumer who purchases its products that it will repair or replace, without charge, defective products within one year of purchase. The Company also has a return policy for its customers that allow them to return, to the Company, products returned
44
Table of Contents
to them by their customers for full or partial credit based on when the Company’s customer last purchased these products. Consequently, it maintains a warranty reserve, which reflects historical warranty return rates by product category multiplied by the most recent six months of unit sales of that model and the unit standard cost of the model. A roll-forward of the warranty reserve is as follows:
| 2010 | 2009 | 2008 | ||||||||||
| (in thousands) | ||||||||||||
| Accrued product warranty costs, January 1 |
$ | 857 | $ | 897 | $ | 3,440 | ||||||
| Warranty provision |
2,390 | 2,459 | 2,908 | |||||||||
| Warranty expenditures |
(2,324 | ) | (2,499 | ) | (5,451 | ) | ||||||
| Accrued product warranty costs, December 31 |
$ | 923 | $ | 857 | $ | 897 | ||||||
The Company maintains a liquidation reserve representing the write-down of returned product from its customers to its net realizable value. Returned inventory is either sold to various liquidators or returned to vendors for partial credit against similar, new models. The decision to sell or return products to vendors depends upon the estimated future demand for the models. Judgments are made as to whether various models are to be liquidated or returned to the vendor, taking into consideration the liquidation prices expected to be received and the amount of the vendor credit. The amount of the reserve is determined by comparing the cost of each unit returned to the estimated amount to be realized upon each unit’s disposition, either from returning the unit to the vendor for partial credit towards the cost of new, similar product or liquidating the unit. This reserve can fluctuate significantly from quarter to quarter depending upon quantities of returned inventory on hand and the estimated liquidation price or vendor credit per unit. A roll-forward of the liquidation reserve is as follows:
| 2010 | 2009 | 2008 | ||||||||||
| (in thousands) | ||||||||||||
| Liquidation reserve, January 1 |
$ | 648 | $ | 623 | $ | 2,695 | ||||||
| Liquidation provision |
2,229 | 2,650 | 4,490 | |||||||||
| Liquidation of models |
(2,100 | ) | (2,625 | ) | (6,562 | ) | ||||||
| Liquidation reserve, December 31 |
$ | 777 | $ | 648 | $ | 623 | ||||||
The Company maintains a net realizable value (“NRV”) reserve to write-down, as necessary, certain inventory not previously sold to customers, except for that covered by the liquidation reserve discussed above, below cost. The reserve includes models where it is determined that the NRV is less than cost. Thus, judgments must be made about which slow-moving, excess or non-current models are to be included in the reserve and the estimated net realizable value of such models. The estimated realizable value of each model is the per unit price that it is estimated to be received if the model was sold in the marketplace. This reserve will vary depending upon the specific models
selected, the estimated NRV for each model and quantities of each model that are determined will be sold below cost from quarter to quarter. A roll-forward of the NRV reserve is as follows:
| 2010 | 2009 | 2008 | ||||||||||
| (in thousands) | ||||||||||||
| Net realizable reserve, January 1 |
$ | 238 | $ | 109 | $ | 1,614 | ||||||
| NRV provision |
329 | 427 | 870 | |||||||||
| NRV write-offs |
(361 | ) | (298 | ) | (2,375 | ) | ||||||
| Net realizable reserve, December 31 |
$ | 206 | $ | 238 | $ | 109 | ||||||
(19) Stockholder Rights Plan
The Company maintains a Stockholder Rights Plan (the “Plan”) designed to deter coercive or unfair takeover tactics, to prevent a person or group from gaining control of the Company without fair value to all shareholders and to deter other abusive takeover tactics that are not in the best interest of shareholders. The Company has designated 120,000 of the 1 million authorized shares of the preferred stock as Series A Junior Participating preferred stock.
Under the terms of the Plan, each share of common stock is accompanied by one right; each right entitles the shareholder to purchase from the Company one one-hundredth of a newly issued share of Series A Junior Preferred Stock, par value $1 per share, of the Company at an exercise price of $35. The rights become exercisable 10 days after a public announcement that an Acquiring Person (as defined in the Plan) has become the beneficial owner of 15 percent or more of the outstanding shares of the Company (the “Stock Acquisition Date”) or 10 business days after the commencement of a tender or exchange offer that would result in a person beneficially owning 15 percent or more of such shares. The Company can redeem the rights for $0.01 per right at any time until the earlier of 10 days following the Stock Acquisition Date or the final expiration of the rights. The rights will expire on November 5, 2011, unless redeemed earlier by the Company.
In the event that any person becomes an Acquiring Person, each right will entitle the holder (except for the Acquiring Person) thereof, upon payment of the current exercise price, to receive shares of common stock of the Company, which at the time of such person
45
Table of Contents
becoming an Acquiring Person, have a market value equal to two times the then current exercise price. If, after the public announcement has been made that any person has become an Acquiring Person, (i) the Company merges into or consolidates with another person (with limited exceptions), (ii) another person (with limited exceptions) merges into or consolidates with the Company and shares of common stock of the Company are converted into securities of another person, cash or property or (iii) the Company transfers 50 percent or more of its consolidated assets, cash flow or earning power to another person (with limited exceptions), each right will entitle the holder thereof to receive, upon payment of the current exercise price, the number of shares of common stock of the Acquiring Person (or of another person affiliated therewith) which, at the time of consummation of the transaction, have a market value equal to two times the then current exercise price.
(20) Allowance for Claims and Doubtful Accounts
The following table shows the activity in the allowance for claims and doubtful accounts:
| 2010 | 2009 | 2008 | ||||||||||
| (in thousands) | ||||||||||||
| Balance, January 1 |
$ | 103 | $ | 107 | $ | 205 | ||||||
| Provision for claims and doubtful accounts |
85 | 45 | 118 | |||||||||
| Write-offs, less recoveries |
(2 | ) | (49 | ) | (216 | ) | ||||||
| Balance, December 31 |
$ | 186 | $ | 103 | $ | 107 | ||||||
(21) Interest Expense and Other Income (Expense)
The following table shows the components of interest for the years ending December 31, 2010, 2009 and 2008:
| 2010 | 2009 | 2008 | ||||||||||
| (in thousands) | ||||||||||||
| Interest on debt |
$ | 1,023 | $ | 1,053 | $ | 997 | ||||||
| Amortization of loan fees |
552 | 221 | 112 | |||||||||
| Interest rate swap amortization |
(11 | ) | (125 | ) | - | |||||||
| Total interest expense |
$ | 1,564 | $ | 1,149 | $ | 1,109 | ||||||
The following table shows the components of other income (expense) for the years ending December 31, 2010, 2009 and 2008:
| 2010 | 2009 | 2008 | ||||||||||
| (in thousands) | ||||||||||||
| Interest income |
$ | 2 | $ | 9 | $ | 67 | ||||||
| CSV income (loss) |
574 | 743 | (1,558 | ) | ||||||||
| Exchange gain |
390 | 482 | 190 | |||||||||
| Other - net |
(12 | ) | 97 | 270 | ||||||||
| Other income (expense) |
$ | 954 | $ | 1,331 | $ | (1,031 | ) | |||||
(22) Comprehensive Income (Loss)
Comprehensive income (loss) is defined as the change in equity of a business enterprise from transactions and other events from non-owner sources. Comprehensive income (loss) includes net earnings (loss) and other non-owner changes in equity that bypass the statement of operations and are reported in a separate component of equity. For the years ended December 31, 2010, 2009 and 2008, other comprehensive income (loss) includes the foreign currency translation adjustment and the interest rate swap. A summary of the comprehensive income (loss) for the three-year period ending December 31, 2010 follows:
| 2010 | 2009 | 2008 | ||||||||||
| (in thousands) | ||||||||||||
| Foreign currency translation adjustment |
$ | (2,143 | ) | $ | (1,585 | ) | $ | (2,462 | ) | |||
| Interest rate swap - gross |
(174 | ) | (304 | ) | (291 | ) | ||||||
| Total excluding tax effect of interest rate swap |
(2,317 | ) | (1,889 | ) | (2,753 | ) | ||||||
| Tax effect of interest rate swap |
- | - | 116 | |||||||||
| Total net of tax |
$ | (2,317 | ) | $ | (1,889 | ) | $ | (2,637 | ) | |||
46
Table of Contents
(23) Quarterly Financial Information (Unaudited)
The following table summarizes the unaudited quarterly financial information for years ending December 31, 2010 and 2009:
| Quarter Ended | ||||||||||||||||||||||||||||||||
| March 31 | June 30 | September 30 | December 31 | |||||||||||||||||||||||||||||
| 2010 | 2009 | 2010 | 2009 | 2010 | 2009 | 2010 | 2009 | |||||||||||||||||||||||||
| (in thousands, except per share amounts) | ||||||||||||||||||||||||||||||||
| Net sales |
$ | 21,083 | $ | 19,085 | $ | 25,710 | $ | 25,971 | $ | 28,909 | $ | 27,405 | $ | 34,818 | $ | 32,768 | ||||||||||||||||
| Gross profit |
5,850 | 5,062 | 6,862 | 6,232 | 7,437 | 6,628 | 9,705 | 8,454 | ||||||||||||||||||||||||
| Net (loss) earnings |
(1,317 | ) | (1,616 | ) | (316 | ) | (9,902 | ) | 874 | (509 | ) | 2,336 | 1,755 | |||||||||||||||||||
| Net (loss) earnings per share (a) |
||||||||||||||||||||||||||||||||
| Basic |
$ | (0.20 | ) | $ | (0.25 | ) | $ | (0.05 | ) | $ | (1.53 | ) | $ | 0.14 | $ | (0.08 | ) | $ | 0.36 | $ | 0.27 | |||||||||||
| Diluted |
(0.20 | ) | (0.25 | ) | (0.05 | ) | (1.53 | ) | 0.14 | (0.08 | ) | 0.36 | 0.27 | |||||||||||||||||||
| (a) | The sum of the quarterly net earnings per share amounts may not equal the annual amount because net earnings per share are calculated independently for each quarter. |
(24) Subsequent Events
On March 1, 2011, the Company awarded 25,000 shares of stock to its non-employee directors and 102,950 stock options and 43,300 shares of restricted stock were awarded to executive management and other key employees. The market price of the Company’s stock at the time of the award was $3.84 per share.
47
Table of Contents
Item 9. Changes in and Disagreements with Accountants on Accounting and Financial Disclosure
There were no changes in or disagreements with the Company’s auditors regarding accounting or financial disclosure matters.
Item 9A. Controls and Procedures
Evaluation of Disclosure Controls and Procedures
The Company has established disclosure controls and procedures (as defined in Rules 13a-15(e) and 15d-15(e) under the Exchange Act), to ensure that information required to be disclosed in the reports that the Company files or submits under the Exchange Act is recorded, processed, summarized and reported within the time periods specified in SEC rules and forms. The Company’s disclosure controls and procedures have also been designed to ensure that information required to be disclosed in the reports that the Company files or submits under the Exchange Act is accumulated and communicated to the Company’s management, including the principal executive officer and principal financial officer, to allow timely decisions regarding required disclosure.
During 2010, the Company carried out an evaluation, under the supervision and with the participation of the Company’s management, including the Company’s principal executive officer and principal financial officer, of the effectiveness of the Company’s disclosure controls and procedures. Based on this evaluation, the principal executive officer and principal financial officer of the Company have concluded that the Company’s disclosure controls and procedures are effective as of December 31, 2010.
Report of Management on Internal Control Over Financial Reporting
The management of the Company, including the Company’s Chief Executive Officer and Chief Financial Officer, is responsible for establishing and maintaining adequate internal control over financial reporting (as defined in Rules 13a-15(f) and 15d-15(f) under the Exchange Act).
Management of the Company, including the Chief Executive Officer and Chief Financial Officer, assessed the effectiveness of the Company’s internal control over financial reporting as of December 31, 2010. Management based this assessment on criteria for effective internal control over financial reporting described in Internal Control — Integrated Framework issued by the Committee of Sponsoring Organizations of the Treadway Commission. Based on this assessment, management determined that, as of December 31, 2010, the Company maintained effective internal control over financial reporting.
This Annual Report on Form 10-K does not include an attestation report of the Company’s registered public accounting firm regarding internal control over financial reporting. Internal control over financial reporting was not subject to attestation by the Company’s registered public accounting firm pursuant to the rules of the SEC that permit the Company to provide only management’s report in this Annual Report on Form 10-K.
Changes in Internal Control Over Financial Reporting
There has been no change in the Company’s internal control over financial reporting that occurred during the fourth quarter of 2010 that has materially affected, or is reasonably likely to materially affect, the Company’s internal control over financial reporting.
None.
48
Table of Contents
Item 10. Directors, Executive Officers and Corporate Governance
Information in response to this item will be set forth in a definitive proxy statement to be filed by the Company pursuant to Regulation 14A within 120 days after the end of the Company’s 2010 fiscal year, and such information is hereby incorporated by reference.
The Company has adopted a Code of Business Conduct and Ethics (the “Code”), which applies solely to the Company’s officers, senior financial accounting and financial personnel and directors. The Company has posted the Code on its website at www.cobra.com and any waivers of, or amendments to, the Code will be approved by the Board of Directors or the Governance and Nominating Committee of the Company’s Board of Directors. Any change to or waiver of the Code will be disclosed by publishing a statement on the Company’s website.
Additional information concerning Cobra’s executive officers is included under Executive Officers of the Registrant in Part I.
Item 11. Executive Compensation
Information in response to this item will be set forth in a definitive proxy statement to be filed by the Company pursuant to Regulation 14A within 120 days after the end of the Company’s 2010 fiscal year, and such information, provided that the Compensation Committee Report shall not be deemed “filed” in this Annual Report on Form 10-K.
Item 12. Security Ownership of Certain Beneficial Owners and Management and Related Shareholder Matters
Equity Compensation Plan Information
With the approval of the 2010 Equity Incentive Plan by the shareholders in 2010, the 2002 Outside Directors Stock Option Plan was replaced and all option and equity programs were consolidated into the 2010 Plan. The Company has not made any grants outside of its equity compensation plans. The following table provides information about stock options outstanding and shares available for future awards under the Company’s equity compensation plan as of December 31, 2010.
| Plan Category |
(a) Number of securities to be issued upon exercise of outstanding options, warrants and rights |
(b) Weighted-average exercise price of outstanding options, warrants and rights |
(c) Number of securities remaining available for future issuance under equity compensation plans (excluding securities reflected in column (a)) |
|||||||||
| Equity compensation plans approved by security holders |
313,780 | $ | 8.95 | - | (1) | |||||||
| Equity compensation plans not approved by security holders |
9,000 | 8.07 | - | (2) | ||||||||
| Total |
322,780 | 8.93 | - | |||||||||
| (1) | Represents shares from the 2000 Plan, which was closed on March 31, 2010. |
| (2) | The 21,000 shares available or issued under these plans may not be issued to directors prior to the approval of the plans by security holders. |
Set forth below is a brief description of the material features of the Company’s equity compensation plans that were adopted without the approval of the Company’s shareholders. As previously mentioned, the 2002 Outside Directors Stock Option Plan was replaced by the 2010 Equity Incentive Plan which was approved by shareholders.
2002 Outside Directors Stock Option Plan
This plan includes a total of 25,000 non-qualified stock options to be granted to Directors who are not officers or employees of the Company. The stock option committee, designated by the Company’s Board of Directors, has the authority to select persons who will receive options and determine the number of shares of common stock subject to each option and all other terms and conditions of each option. The period for the exercise of each option and the exercise price for an option will also be determined by the Stock Option Committee. An option may be exercised by giving written notice to the Company specifying the number of whole shares of common stock to be purchased. This plan was replaced by the 2010 plan and will terminate on May 14, 2012. The outstanding and vested shares at December 31, 2010 totaled 4,000.
2000 Outside Directors Stock Option Plan
This plan includes a total of 25,000 non-qualified stock options to be granted to Directors who are not officers or employees of the Company. The Stock Option Committee, designated by the Company’s Board of Directors, has the authority to select persons who will
49
Table of Contents
receive options and determine the number of shares of common stock subject to each option and all other terms and conditions of each option. The period for the exercise of each option and the exercise price for an option will also be determined by the Stock Option committee. An option may be exercised by giving written notice to the Company specifying the number of whole shares of common stock to be purchased. This plan was terminated on May 9, 2010. The outstanding and vested shares at December 31, 2010 totaled 5,000.
****
Other information in response to this item will be set forth in a definitive proxy statement to be filed by the Company pursuant to Regulation 14A within 120 days after the end of the Company’s 2010 fiscal year, and such information is hereby incorporated by reference.
Item 13. Certain Relationships and Related Transactions, and Director Independence
Information in response to this item will be set forth in a definitive proxy statement to be filed by the Company pursuant to Regulation 14A within 120 days after the end of the Company’s 2010 fiscal year, and such information is hereby incorporated by reference.
Item 14. Principal Accountant Fees and Services
Information in response to this item will be set forth in a definitive proxy statement to be filed by the Company pursuant to Regulation 14A within 120 days after the end of the Company’s 2010 fiscal year, and such information is hereby incorporated by reference.
50
Table of Contents
Item 15. Exhibits and Financial Statement Schedules
[a] Index to Consolidated Financial Statements and Schedules
| Description |
Page or Schedule Number |
|||||
| 1. | Report of Independent Registered Public Accounting Firm | 26 | ||||
| Consolidated Statements of Operations for the three years ended December 31, 2010 | 27 | |||||
| Consolidated Balance Sheets as of December 31, 2010 and 2009 | 28 | |||||
| Consolidated Statements of Cash Flows for the three years ended December 31, 2010 | 30 | |||||
| Consolidated Statements of Shareholders’ Equity and Comprehensive Income (Loss) for the three years ended December 31, 2010 | 31 | |||||
| Notes to Consolidated Financial Statements | 32-47 | |||||
| 2. | Exhibits: | |||||
| See Index to Exhibits on pages 53 through 54. | ||||||
51
Table of Contents
Pursuant to the requirements of Section 13 or 15 (d) of the Securities Exchange Act of 1934, the Registrant has duly caused this Report to be signed on its behalf by the undersigned, thereunto duly authorized.
| COBRA ELECTRONICS CORPORATION |
| /s/ ROBERT J. BEN |
| Robert J. Ben Vice President-Corporate Controller and Interim Chief Financial Officer |
Dated: March 15, 2011
Pursuant to the requirements of the Securities Exchange Act of 1934, this report has been signed below by the following persons on behalf of the Registrant and in the capacities and on the date indicated.
| /S/ JAMES R. BAZET James R. Bazet |
Director, Chairman of the Board, President and Chief Executive Officer (Principal Executive Officer) | |
| /S/ ROBERT J. BEN Robert J. Ben |
Vice President - Corporate Controller and Interim Chief Financial Officer (Principal Financial Officer) | |
| /S/ GERALD M. LAURES Gerald M. Laures |
Vice President — Finance and Corporate Secretary (Principal Accounting Officer) | |
| /S/ WILLIAM P. CARMICHAEL William P. Carmichael |
Director | |
| /S/ JOHN S. LUPO John S. Lupo |
Director | |
| /S/ IAN R. MILLER Ian R. Miller |
Director | |
| /S/ S. SAM PARK S. Sam Park |
Director | |
| /S/ ROBERT P. ROHLEDER Robert P. Rohleder |
Director | |
Dated: March 15, 2011
52
Table of Contents
| Exhibit |
Description of Document | |
| 2.1 | Share Purchase Deed dated October 14, 2006 among Cobra Electronics UK Limited, Performance Products Limited and the shareholders of Performance Products Limited — Filed as Exhibit No. 2.1 to the Registrant’s Current Report on Form 8-K dated October 19, 2006 (File No. 0-511), and hereby incorporated by reference. | |
| 3.1 | Restated Certificate of Incorporation, as amended October 28, 1998 — Filed as Exhibit No. 3(i) to the Registrant’s Form 10-K for the year ended December 31, 1998 (File No. 0-511), and hereby incorporated by reference. | |
| 3.2 | Amended and Restated Bylaws, as amended December 6, 2007 — Filed as Exhibit No. 3.2 to the Registrant’s Form 10-K for the year ended December 31, 2007 (File No. 0-511), and hereby incorporated by reference. | |
| 3.3 | Certificate of Designation of Series A Junior Participating Preferred Stock of Cobra Electronics Corporation pursuant to Section 151 of the General Corporation Law of the State of Delaware — Filed as Exhibit No. 3(iii) to the Registrant’s Form 10-K for the year ended December 31, 2001 (File No. 0-511), and hereby incorporated by reference. | |
| 4 | Rights Agreement dated as of October 24, 2001 between Cobra Electronics Corporation and American Stock Transfer & Trust Company, as Rights Agent — Filed as Exhibit 4 to the Registrant’s Current Report on Form 8-K dated October 25, 2001 (File No. 0-511), and hereby incorporated by reference. | |
| 10.1# | 1995 Key Employees Nonqualified and Incentive Stock Option Plan — Filed as Exhibit No. 10.23 to the Registrant’s Form 10-K for the year ended December 31, 1995 (File No. 0-511), and hereby incorporated by reference. | |
| 10.2# | Employment Agreement between Cobra Electronics Corporation and Anthony Mirabelli dated January 31, 1997 — Filed as Exhibit No. 10.29 to the Registrant’s Form 10-K for the year ended December 31, 1996 (File No. 0-511), and hereby incorporated by reference. | |
| 10.3# | 1997 Stock Option Plan – Filed as Exhibit A to the Registrant’s Proxy Statement Schedule 14A dated April 16, 1997 (File No. 0-511) and hereby incorporated by reference. | |
| 10.4# | Cobra Electronics Corporation Executive Deferred Compensation Plan dated May 11, 1999 — Filed as Exhibit No. 10.14 to the Registrant’s Form 10-K for the year ended December 31, 1999 (File No. 0-511), and hereby incorporated by reference. | |
| 10.5# | Cobra Electronics Corporation Deferred Compensation Plan For Select Executives dated December 21, 1999 — Filed as Exhibit No. 10.15 to the Registrant’s Form 10-K for the year ended December 31, 1999 (File No. 0-511), and hereby incorporated by reference. | |
| 10.6# | Cobra Electronics Corporation Executive Retirement Trust dated May 11, 1999 between Cobra Electronics Corporation and Gerald Laures, as trustee, for the benefit of James Bazet dated May 11, 1999 — Filed as Exhibit No. 10.16 to the Registrant’s Form 10-K for the year ended December 31, 1999 (File No. 0-511), and hereby incorporated by reference. | |
| 10.7# | Employment Agreement addendum between Cobra Electronics Corporation and Anthony Mirabelli dated April 22, 1999 — Filed as Exhibit No. 10.17 to the Registrant’s Form 10-Q for the quarter ended March 31, 2000 (File No. 0-511), and hereby incorporated by reference. | |
| 10.8# | 2000 Stock Option Plan — Filed as Exhibit 4.3 of the Registration Statement on Form S-8 of the Registrant dated July 25, 2000 (File No. 333-42164), and hereby incorporated by reference. | |
| 10.9# | 2000 Outside Directors Stock Option Plan — Filed as Exhibit 4.3 of the Registration Statement on Form S-8 of the Registrant dated July 25, 2000 (File No. 333-42166), and hereby incorporated by reference. | |
| 10.10# | 2002 Outside Directors Stock Option Plan — Filed as Exhibit 4.3 of the Registration Statement on Form S-8 of the Registrant dated June 24, 2002 (File No. 333-91078), and hereby incorporated by reference. | |
| 10.11 | Technology Patent License Agreement between TeleAtlas North America, Inc. and Cobra Electronics Corporation dated March 31, 2006 — Filed as Exhibit No. 10.1 to the Registrant’s Form 10-Q for the quarter ended March 31, 2006 (File No. 0-511), and hereby incorporated by reference. (Confidential material appearing in this document was omitted and filed separately with the Securities and Exchange Commission in accordance with Section 24(b) of the Securities and Exchange Act of 1934, as amended, and Rule 24b-2 promulgated thereunder. Omitted information was replaced with asterisks.) | |
| 10.12# | Employment Agreement between Cobra Electronics Corporation and Michael Smith dated December 21, 2007. Filed as Exhibit No. 10.26 to the Registrant’s Form 10-K for the year ended December 31, 2007 (File No. 0-511), and hereby incorporated by reference. | |
| 10.13 | Loan and Security Agreement with The PrivateBank and Trust and RBS Citizens N.A. — Filed as Exhibit No. 10.1 to the Registrant’s Current Report on Form 8-K dated February 22, 2008 (File No. 0-511), and hereby incorporated by reference. | |
| 10.14# | First Amendment to the Deferred Compensation Plan for Select Executives — Filed as Exhibit No. 10.1 to the Registrant’s Form 10-Q for the quarter ended September 30, 2008 (File No. 0-511), and hereby incorporated by reference. | |
| 10.15# | Cobra Electronics Corporation Severance Pay Plan — Filed as Exhibit No. 10.2 to the Registrant’s Form 10-Q for the quarter ended September 30, 2008 (File No. 0-511), and hereby incorporated by reference. | |
| 10.16# | First Amendment to Cobra Electronics Corporation Severance Pay Plan — Filed as Exhibit No. 10.3 to the Registrant’s Form 10-Q for the quarter ended September 30, 2008 (File No. 0-511), and hereby incorporated by reference. | |
53
Table of Contents
| Exhibit |
Description of Document | |
| 10.17# | Employment Agreement Amendment between Cobra Electronics Corporation and Anthony Mirabelli dated December 31, 2008 — Filed as Exhibit No. 10.1 to the Registrant’s Current Report on Form 8-K dated January 7, 2009 (File No. 0-511), and hereby incorporated by reference. | |
| 10.18 | Second Amendment to Loan and Security Agreement dated as of August 13, 2009 among Cobra Electronics Corporation, The PrivateBank Trust Company, as a lender and administrative agent for itself and the other lenders, and RBS Citizens, N.A., as lender — Filed as Exhibit 10.1 to the Registrant’s Form 10-Q for the quarter ended June 30, 2009 (File No. 0-511), and hereby incorporated by reference. | |
| 10.19 | Third Amendment to Loan and Security Agreement and Waiver, effective as of October 24, 2009 among Cobra Electronics Corporation, The PrivateBank and Trust Company as lender and administrative agent for itself and other lenders and RBS Citizens, N.A., as lender — filed as Exhibit 10.1 to the Registrant’s Current Report on Form 8-K dated November 6, 2009 and hereby incorporated by reference. | |
| 10.20 | Fourth Amendment to Loan and Security Agreement and Waiver effective as of March 9, 2010 among Cobra Electronics, the PrivateBank and Trust Company as lender and administrative agent for itself and others and RBS Citizens, N.A., as lender – Filed as Exhibit 10.26 to the Registrant’s Form 10-K for the year ended December 31, 2009 (File No. 0-511), and hereby incorporated by reference. | |
| 10.21 | Fifth Amendment to Loan and Security Agreement and Waiver, effective April 9, 2010, among Cobra Electronics Corporation, The PrivateBank and Trust Company as lender and administrative agent for itself and other lenders and RBS Citizens, N.A., as lender – Filed as Exhibit 10.1 to the Registrant’s Form 10-Q for the quarter ended March 31, 2010 (File No. 0-511), and hereby incorporated by reference. | |
| 10.22# | 2010 Executive Incentive Plan– Filed as Exhibit 10.2 to the Registrant’s Form 10-Q for the quarter ended March 31, 2010 (File No. 0-511), and hereby incorporated by reference. | |
| 10.23 | Credit Agreement dated July 16, 2010 among Cobra Electronics Corporation, Harris N. A., as administrative agent, and the lenders party thereto — Filed as Exhibit No. 10.1 to the Registrant’s Current Report on Form 8-K dated July 16, 2010 (File No. 0-511), and hereby incorporated by reference. | |
| 10.24# | 2010 Executive Incentive Payment Plan, as amended — Filed as Exhibit 10.1 to the Registrant’s Current Report on Form 8-K dated August 3, 2010 (File No. 0-511), and hereby incorporated by reference. | |
| 10.25# | Employment Agreement between Cobra Electronics Corporation and Sally Washlow dated as of July 28, 2010 – Filed as Exhibit 10.1 the Registrant’s Form 10-Q for the quarter ended September 30, 2010 (File No. 0-511) and hereby incorporated by reference. | |
| 10.26# | 2010 Equity Incentive Plan — Filed as Appendix A to the Registrant’s Proxy Statement Schedule 14A dated April 1, 2010 (File No. 0-511), and hereby incorporated by reference. | |
| 10.27#* | First Amendment to Cobra Electronics Corporation Executive Deferred Compensation Plan effective as of December 31, 2008. | |
| 10.28#* | Second Amendment to Cobra Electronics Corporation Deferred Compensation Plan for Select Executives effective as of December 31, 2008. | |
| 10.29#* | Cobra Electronics Corporation 2002 Deferred Compensation Plan for Select Executives. | |
| 10.30#* | First Amendment to Cobra Electronics Corporation 2002 Deferred Compensation Plan for Select Executives effective as of November 1, 2008. | |
| 10.31#* | Second Amendment to Cobra Electronics Corporation 2002 Deferred Compensation Plan for Select Executives effective as of December 31, 2008. | |
| 10.32#* | Third Amendment to Cobra Electronics Corporation 2002 Deferred Compensation Plan for Select Executives effective as August 1, 2010. | |
| 14.1 | Cobra Electronics Code of Business Conduct and Ethics For Officers, Senior Financial Accounting and Financial Personnel and Directors adopted February 22, 2006 — Filed as Exhibit No. 14.1 to the Registrant’s Current Report on Form 8-K dated February 22, 2006 (File No. 0-511), and hereby incorporated by reference. | |
| 21.1* | Cobra Electronics Corporation Subsidiaries. | |
| 23.1* | Consent of Grant Thornton LLP dated March 15, 2011. | |
| 31.1* | Rule 13a-14(a)/15d-14(a) Certification of the Chief Executive Officer. | |
| 31.2* | Rule 13a-14(a)/15d-14(a) Certification of the Chief Financial Officer. | |
| 32.1* | Section 1350 Certification of the Chief Executive Officer. | |
| 32.2* | Section 1350 Certification of the Chief Financial Officer. | |
| * | Filed herewith. |
| # | Executive compensation plan or arrangement. |
54