Attached files
| file | filename |
|---|---|
| 8-K - FORM 8-K - PERDOCEO EDUCATION Corp | d8k.htm |
 Credit Suisse
Global Services Conference
March 15, 2011
Exhibit 99.1 |
 Gary
E. McCullough President and Chief Executive Officer
|
 The
Company has included some non-GAAP financial measures in this presentation to discuss the
Company's financial results and outlook. As a general matter, the Company
uses these non-GAAP measures in addition to and in conjunction with
results presented in accordance with GAAP. Among other things, the Company
may use such non-GAAP financial measures in addition to and in conjunction with corresponding
GAAP measures, to help analyze the performance of its core business, in connection
with the preparation of annual budgets, and in measuring performance for
some forms of compensation. In addition, the Company believes that
non-GAAP financial measures are used by analysts and others in the investment community to
analyze the Company's historical results and in providing estimates of future
performance and that failure to report these non-GAAP measures could
result in confusion among analysts and others and a misplaced perception
that the Company's results have underperformed or exceeded expectations.
These non-GAAP financial measures reflect an additional way of viewing aspects
of the Company's operations that, when viewed with the GAAP results and the
reconciliations to corresponding GAAP financial measures,
provide
a
more
complete
understanding
of
the
Company's
results
of
operations
and
the
factors
and trends affecting the Company's business. However, these non-GAAP measures
should be considered as a supplement to, and not as a substitute for, or
superior to, the corresponding measures calculated in accordance with
GAAP. Non-GAAP Financial Measures |
 Safe
Harbor During this presentation, we will make forward-looking statements subject to known
and unknown risks and uncertainties that could cause actual performance to differ materially
from that expressed or implied by the statements. These statements are based on
information currently available to us. Some factors that could cause actual results and
performance to differ are: Our ability to comply with the extensive regulatory requirements and accreditation
requirements for school operations
Changes and uncertainties in student lending markets and federal and state student
financial aid programs
Financial and operating results, including new student starts
Our ability to manage and grow our business in current and changing economic, political,
regulatory and competitive environments
Litigation, claims and administrative proceedings involving the company
Other risks described from time to time in our press releases and our filings with the
Securities and Exchange Commission
We undertake no obligation to publicly release any revisions to forward-looking statements to
reflect events or expectations after the date of this presentation. We provide a detailed
discussion of risk factors in our SEC filings and encourage you to review the filings.
|
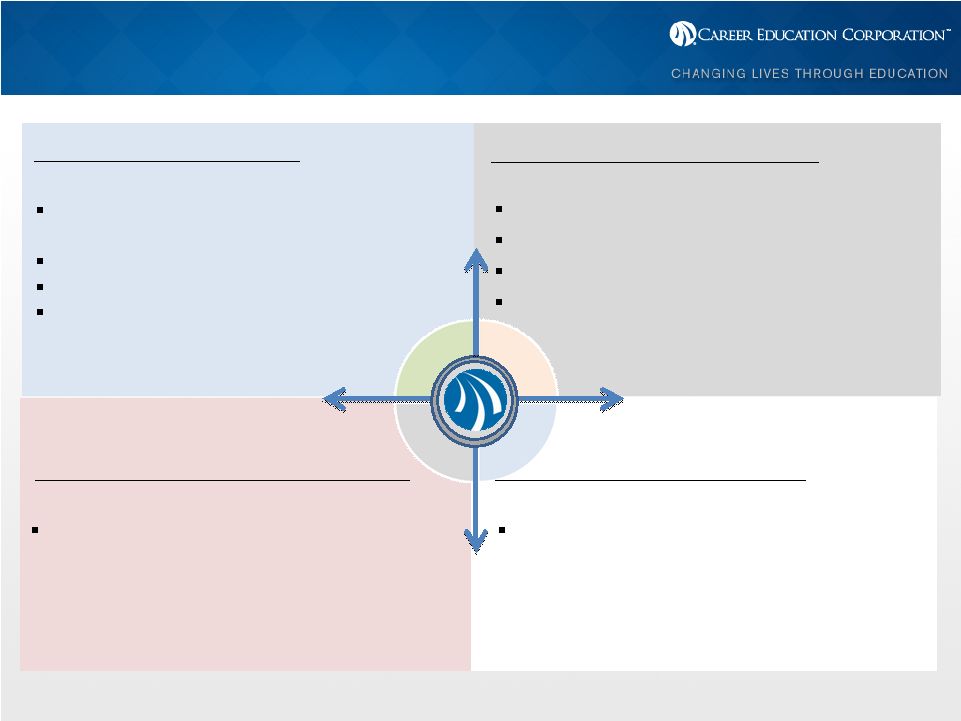
 Career Education Overview
Purpose: To change lives through education
Purpose: To change lives through education
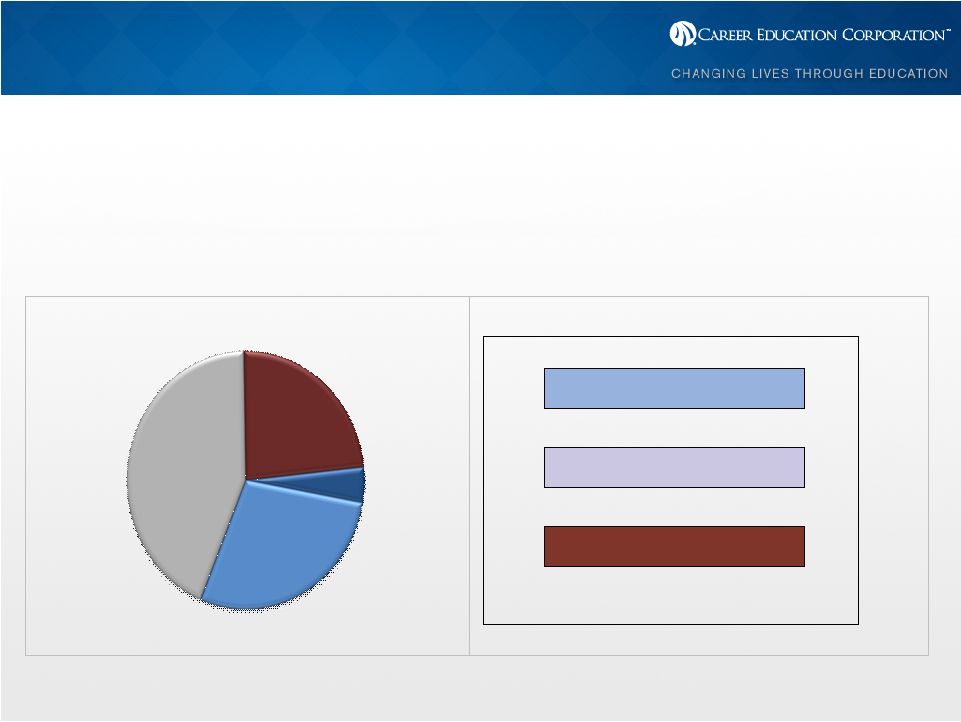
Nearly 117,000 Students
Over 500,000 Graduates
21 to 30
42%
Under 21
16%
Over 30
42%
Students by Age
Bachelors
31%
Masters
6%
Certificate
21%
Associates
42%
Students by Degree Type
Note: Demographics and student population data as of December 31, 2010.
|
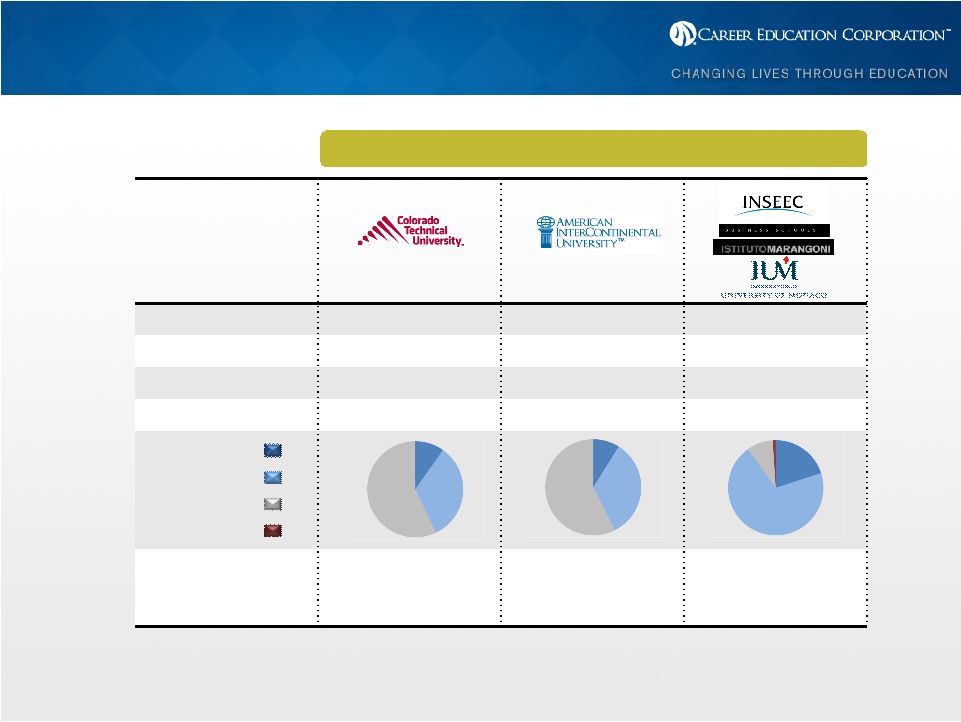 Population
30,900
20,000
12,300
% Online
83%
84%
N/A
# of Campuses
5
5
13
Accreditation
Regional
Regional
Various European
Program Emphasis
Business, IT, Health,
Protective Services
Business, IT
Education,
Protective Services
Business, Design
Bachelors
Masters
Certificate
Associates
University
Career Education: Diversified Portfolio
Note: Demographics and student population data as of December 31, 2010.
|
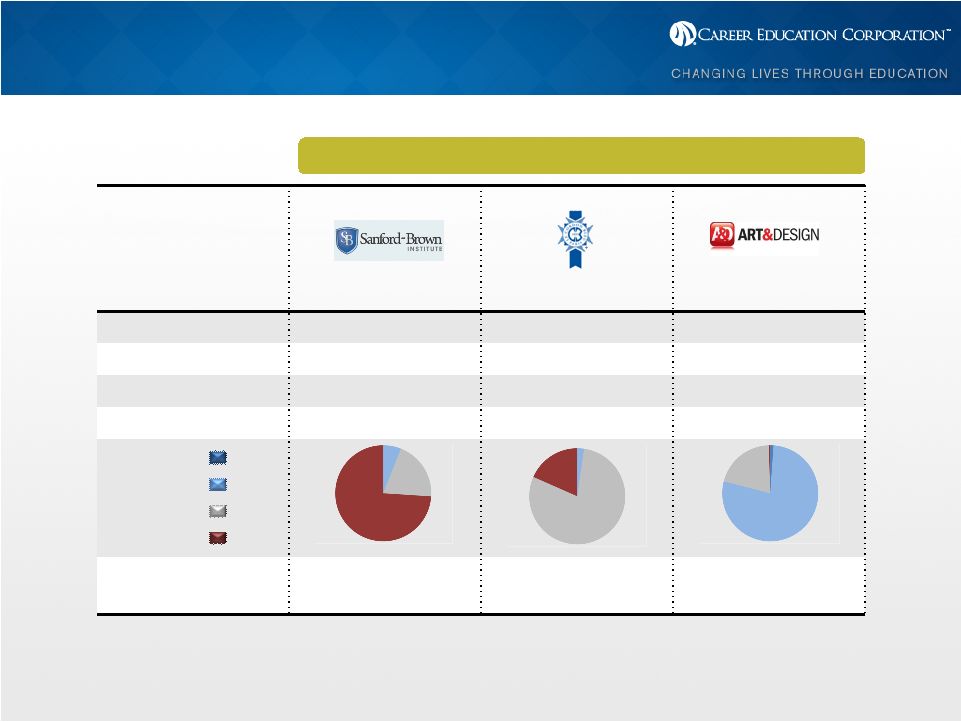 Career Education: Diversified Portfolio
Population
29,000
13,100
11,500
% Online
<1%
2%
16%
# of Campuses
39
18
14
Accreditation
National
National
National
Program Emphasis
Health
Culinary
Design, Photography
Bachelors
Masters
Certificate
Associates
Career-Focused
TM
Note: Demographics and student population data as of December 31, 2010.
|
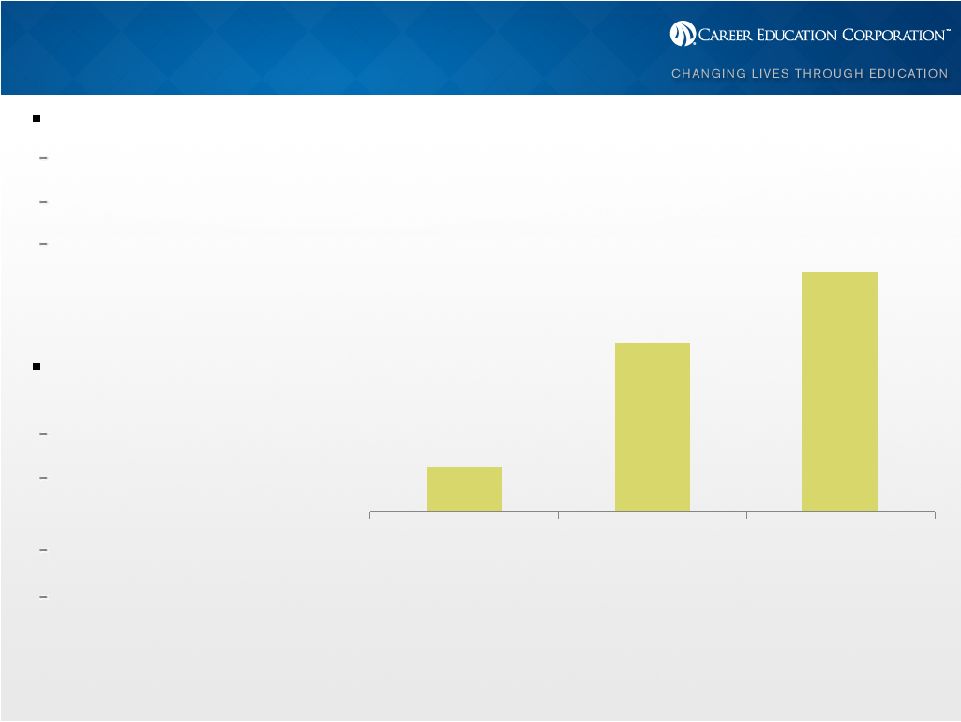
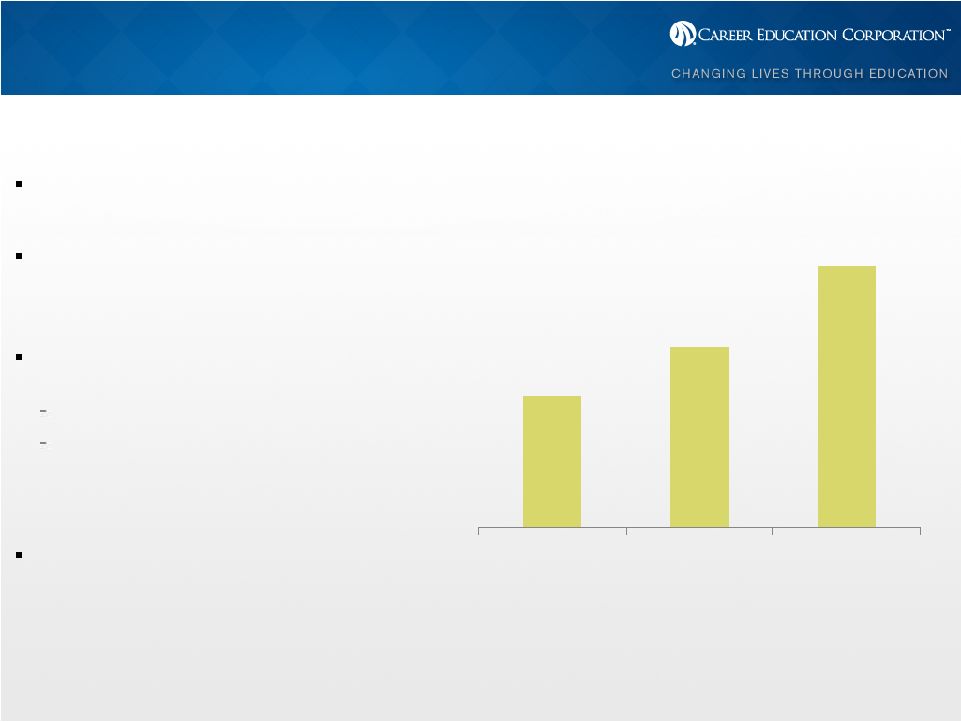 2008
– 2010: Key Accomplishments
Grew Revenue 28%
Increased Student Population 19% from
98,000 to nearly 117,000
Expanded Operating Margins 820 basis
points to 17.1%
EPS growth of 142%
Cumulative Free Cash Flow of
approximately
$500M
since
2008
(2)
Transformed Company Culture and
Values
Revenue Trend &
Adjusted Margin (%)
(1)
$1.66
$1.83
$2.12
2008
2009
2010
8.9%
14.1%
17.1%
(1)
Adjusted margins are based on continuing operations and exclude significant items as noted in
“Appendix -- GAAP to Non GAAP Reconciliation”. (2)
“Free Cash Flow” is defined as cash flows from operating activities less capital
expenditures. |
 2010
Performance Highlights Focus on
Student
Success
Growth with
Disciplined
Investment
Operational
Effectiveness
Strong
Balance
Sheet
Required completion of College Prep Course for online students
Increased Career Services personnel by 21%; Academics by 17%
Placement in line with 2009
Developed modified Culinary Arts model
Grew Student Population by 11%
Opened six Sanford-Brown schools
Generated $145M of free cash flow
Repurchased 5.4M shares of stock totaling $155M
Continued shared services expansion
Completed teach out of AIU Los Angeles
Aligned workforce in response to market dynamics
Further reduced employee turnover
$450M cash and short-term investments
No debt |
 Regulatory Environment
Remain
hopeful
the
Department
will
make
constructive
changes
to
proposed
rules
Overwhelming response to the DoE on Gainful Employment
Awaiting “Dear Colleague”
letter for Incentive Compensation Clarity
Conflicting
rules
which
require
institutions
to
“thread
the
eye
of
the
needle”
Gainful Employment: Encourages reduction in tuition
90/10: Encourages higher tuition levels to avoid penalty
Rules
will
likely
result
in
unintended
negative
consequences
Disproportionate impact on schools with diverse student population/open
enrollment Retroactive application
Institutions are unable to limit student borrowing levels to cost of
education |
         Why
CEC? Diversified Model
Disciplined Approach
Respond to all Challenges
-
Private Lending Market
-
Negotiated Rulemaking
-
Gainful Employment
University, Health Education, Culinary Arts,
Art & Design
Focus on programs with strong outcomes
Strong European platform
Online education remains fastest growing
segment in Education Market
Financial Resources
Strong balance sheet
-
$450M cash/no debt
-
2010 free cash flow of $145M
“Build”
versus “Buy”
for expansion
Select strategic M&A
Shared Services/proactive cost management
Returned ~$370M to shareholders through
share repurchase in last 3 years
Agile Management Team |
 Mike Graham
EVP & Chief Financial Officer |
 2010 Operating Margin
Disciplined Approach
Health Start-Ups
M&A
Increase in Career Services &
Academics
Responsive to Market
Conditions
Shared Services
Fixed & Metric based
reductions
Modified Culinary Model
Ended Extended Student
Payment Programs for New
Students
Adjusted Operating Income
(Margin %)
(1)
8.9%
14.1%
17.1%
2008
2009
2010
+520 bps
+300 bps
(1) Adjusted margins are based on continuing operations and exclude significant items as noted in
“Appendix -- GAAP to Non GAAP Reconciliation”. |
 Culinary Model
2010
Highlights
More
Sustainable
Positioning
Key
Changes
Grew student population by 20%
Increased adjusted operating margin by 560 basis points to
11.5%
Leverage strong kitchen curriculum
Competitive tuition between higher priced institutions and tax
payer subsidized community colleges
Ended student payment plan for incoming Culinary students
12 month certificate program with tuition of approximately
$17,500
Emphasis on practical hands-on kitchen skills
Shift of focus from Associate degree to Certificate
Average education cost reduction of 50%
Emphasis on 450 critical cooking competencies, less on
General Education subjects
Will continue Associate degrees in Chicago and Pasadena and
online Bachelors degree program
Teach out LCB Pittsburgh |
 Uses of Cash
Share Repurchase
•
Remain Committed to Returning Cash to
Shareholders
•
As of March 4, 2011, $201M
authorization remaining
High ROI Strategic Investments
•
High Return Projects
•
Health Education Start Ups
•
Completion of Chicago-area Real Estate
optimization
•
Critical Student Services –
Faculty,
Career Services, IT Systems
Strong Balance Sheet
•
Maintain appropriate ED ratios
•
Limited Future Receivable Growth
from Extended Payment Plans
•
Disciplined Capital Expenditures
M&A
•
Potential for accretive tuck-in
acquisitions across University, Career
Focused and International
•
New Locations
•
New Programs Areas
•
Build versus Buy Mindset |
 2011 Milestones
2010 Results
2011 Milestones
Revenue ($B)
$2.12
(2% - 5%)
Operating Income ($M)
$363
Operating Margin:
GAAP %
11.6%
Normalized %
17.1%
14% - 16% |
 QUESTIONS? |
 Appendix: GAAP to NON GAAP
Unaudited Reconciliation of GAAP to Non-GAAP Items
(1)
(In millions, except per share amounts)
2008
2009
2010
Operating
Earnings per
Operating
Earnings per
Operating
Earnings per
Income
Diluted Share
(2)
Income
Diluted Share
(2)
Income
Diluted Share
(2)
As Reported
$114.8
$1.04
$229.0
$1.73
$246.4
$2.06
Reconciling Items:
Asset Impairment
(3)
6.8
0.05
2.5
0.02
67.8
0.55
Legal Settlement
(4)
6.3
0.05
-
-
40.8
0.33
Severance & Stay
6.6
0.05
1.5
0.01
7.7
0.06
Remaining Lease Obligations for Vacated Space
11.6
0.08
14.3
0.11
-
-
Performance-based
Compensation Related to Plan Outperformance
(5)
-
-
23.1
0.17
-
-
Termination of Insurance
Policies (6)
-
-
(12.0)
(0.09)
-
-
Gain from Termination of
Affiliate Relationship (7)
-
(0.03)
-
-
-
-
Adjusted to Exclude
Significant Items $146.1
$1.24
$258.4
$1.95
$362.7
$3.00
Diluted Weighted Average Shares Outstanding
90,089
86,418
80,850
Footnotes:
(1)
The Company believes it is useful to present non-GAAP financial measures which exclude certain
significant items as a means to understand the performance of its core business. As a
general matter, the Company uses non-GAAP financial measures in conjunction with results presented in accordance with GAAP to help analyze the performance
of its core business, assist with preparing the annual operating plan, and measure performance for
some forms of compensation. In addition, the Company believes that non- GAAP financial
information is used by analysts and others in the investment community to analyze the Company's historical results and to provide estimates of future
performance and that failure to report non-GAAP measures could result in a misplaced perception
that the Company's results have underperformed or exceeded expectations. Non-GAAP financial
measures when viewed in a reconciliation to corresponding GAAP financial measures, provides an additional way of viewing the Company's results of
operations and the factors and trends affecting the Company's business. Non-GAAP financial
measures should be considered as a supplement to, and not as a substitute for, or superior to,
the corresponding financial results presented in accordance with GAAP. (2)
Earnings per share based on continuing operations.
(3)
Fourth quarter 2010 includes a $67.8 million pretax trade name impairment within Culinary Arts.
The $2.5 million asset impairment in 2009 resulted from the carrying value exceeding the fair
value for one of our owned facilities. In 2008, we recorded $6.8 million in asset impairment charges related to the reduction in asset carrying value for one of
our leased facilities within Culinary Arts and the write off of a trade name within Health Education.
|
 Appendix: GAAP to NON GAAP
Footnotes:
(4)
A $40.8 million charge was recorded in 2010 and $6.3 million, net in 2008 related to the settlements
of legal matters within Culinary Arts and Health Education. (5)
The 2009 performance-based compensation related to plan outperformance by segment was: Corporate
- $11.3, Health Education - $4.3, Culinary Arts - $2.1 million, Colorado Technical
University - $1.9, American Intercontinental University - $1.8, and Art & Design - $1.7.
(6)
A $12.0 million payment was received in the fourth quarter 2009 related to the termination of certain
insurance policies. (7)
Gain from Termination of Affiliate Relationship is recorded within other income on the consolidated
statement of operations. |