Attached files
Table of Contents
UNITED STATES
SECURITIES AND EXCHANGE COMMISSION
Washington, D.C. 20549
FORM 10-K
x Annual Report Pursuant to Section 13 or 15(d) of the Securities Exchange Act of 1934
For the fiscal year ended December 31, 2010
OR
¨ Transition Report Pursuant to Section 13 or 15(d) of the Securities Exchange Act of 1934
For the transition period from to
Commission File No. 000-52947
United Financial Bancorp, Inc.
(Exact name of registrant as specified in its charter)
| Maryland |
74-3242562 | |
| (State or other jurisdiction of incorporation or organization) | (I.R.S. Employer Identification Number) |
| 95 Elm Street, West Springfield, Massachusetts |
01089 | |
| (Address of Principal Executive Offices) | Zip Code |
(413) 787-1700
(Registrant’s telephone number)
Securities Registered Pursuant to Section 12(b) of the Act:
| Common Stock, par value $0.01 per share |
NASDAQ Global Select Market | |
| (Title of each class) | Name of each exchange on which registered |
Securities Registered Pursuant to Section 12(g) of the Act: None
Indicate by check mark if the Registrant is a well-known seasoned issuer, as defined in Rule 405 of the Securities Act. YES ¨ NO x
Indicate by check mark if the Registrant is not required to file reports pursuant to Section 13 or Section 15(d) of the Act. YES ¨ NO x
Indicate by check mark whether the Registrant (1) has filed all reports required to be filed by Section 13 or 15(d) of the Securities Exchange Act of 1934 during the preceding twelve months (or for such shorter period that the Registrant was required to file such reports) and (2) has been subject to such requirements for the past 90 days. YES x NO ¨.
Indicate by check mark whether the registrant has submitted electronically and posted on its website, if any, every Interactive Data File required to be submitted and posted pursuant to Rule 405 of Regulation S-T (§232.405 of this chapter) during the preceding 12 months (or for such shorter period that the registrant was required to submit and post such files. YES ¨ NO ¨
Indicate by check mark if disclosure of delinquent filers pursuant to Item 405 of Regulation S-K is not contained herein, and will not be contained, to the best of Registrant’s knowledge, in definitive proxy or information statements incorporated by reference in Part III of this Form 10-K or any amendments to this Form 10-K. x.
Indicate by check mark whether the Registrant is a large accelerated filer, an accelerated filer, a non-accelerated filer or a smaller reporting company. See definition of “large accelerated filer”, “accelerated filer”, and “smaller reporting company” in Rule 12b-2 of the Exchange Act. (Check one):
| Large accelerated filer ¨ |
Accelerated filer x | Non-accelerated filer ¨ | Smaller reporting company ¨ |
Indicate by check mark whether the Registrant is a shell company (as defined in Rule 12b-2 of the Exchange Act).
YES ¨ NO x
The aggregate market value of the voting and non-voting common equity held by non-affiliates of the Registrant, computed by reference to the last sale price on June 30, 2010, as reported by the NASDAQ Global Select Market, was approximately $198.1 million.
As of March 4, 2011, 16,096,035 shares of the Registrant’s common stock were outstanding.
DOCUMENTS INCORPORATED BY REFERENCE
Portions of the Proxy Statement for the Annual Meeting of Stockholders dated March 16, 2011 (are incorporated by reference in Part III and this 10-K).
Table of Contents
Table of Contents
PART I
| ITEM 1. | BUSINESS |
Terminology
As used in this Annual Report, unless we specify otherwise, terms such as “we,” “us,” and “our” refer to United Financial Bancorp, Inc., a Maryland corporation, or United Bank, a federal savings bank and the wholly owned subsidiary of United Financial Bancorp, Inc., as indicated by the context.
Forward Looking Statements
This Annual Report contains certain “forward-looking statements” that may be identified by the use of words such as “believe,” “expect,” “anticipate,” “should,” “planned,” “estimated” and “potential.” Examples of forward-looking statements include, but are not limited to, estimates with respect to our financial condition, results of operations and business that are subject to various factors that could cause actual results to differ materially from these estimates and most other statements that are not historical in nature. These factors include, but are not limited to, general and local economic conditions, changes in interest rates, deposit flows, demand for mortgage and other loans, real estate values, competition, changes in accounting principles, policies, or guidelines, changes in legislation or regulation, and other economic, competitive, governmental, regulatory, and technological factors affecting our operations, pricing, products and services. Additional factors are discussed in this Annual Report on Form 10-K under “Item 1A. Risk Factors”. These risks and uncertainties should be considered in evaluating forward-looking statements and undue reliance should not be placed on such statements. Forward-looking statements speak only as of the date they are made and the Company does not undertake to update forward-looking statements to reflect circumstances or events that occur after the date of the forward-looking statements or to reflect the occurrence of unanticipated events. Accordingly, past results and trends should not be used by investors to anticipate future results or trends.
United Financial Bancorp, Inc.
United Financial Bancorp, Inc., a Maryland corporation (the “Company”) incorporated in 2007 as the holding company for United Bank, sold 9,564,570 shares of its common stock in connection with the “second-step” conversion from mutual to stock form of United Financial Bancorp, MHC, a Federal mutual corporation. In connection with the offering, each public stockholder of United Financial Bancorp, Inc., a Federal corporation, (“United Financial - Federal”) received 1.04079 shares of the common stock of the Company in exchange for each share of United Financial – Federal. The Company contributed $45.1 million of the net proceeds of the offering to United Bank.
On November 30, 2009, the Company completed its acquisition of CNB Financial Corp. (“CNB Financial”), the holding company for Commonwealth National Bank. The transaction qualified as a tax-free reorganization for federal income tax purposes. The consideration paid in the transaction to stockholders of CNB Financial consisted of 943,376 shares of United Financial common stock and $12,639,495 in cash. Based upon the Company’s $12.84 per share closing price on November 30, 2009, the transaction was valued at approximately $24.8 million. As a result of this transaction, the Company added six branches, $289.3 million in assets, $242.9 million in loans and $195.2 million in deposits to its franchise.
United Financial Bancorp, Inc. is authorized to pursue other business activities permitted by applicable laws and regulations for savings and loan holding companies which may include the acquisition of banking and financial services companies. See “—Supervision and Regulation—Holding Company Regulation” for a discussion of the activities that are permitted for savings and loan holding companies. We currently have no understandings or agreements to acquire other financial institutions. We also may borrow funds for reinvestment in United Bank.
1
Table of Contents
United Financial Bancorp, Inc.’s cash flows depend on earnings from interest-earning deposits and any dividends received from United Bank. United Financial Bancorp, Inc. neither owns nor leases any property, but instead uses the premises, equipment and furniture of United Bank. At the present time, we employ as officers only certain persons who are also officers of United Bank. However, we use the support staff of United Bank from time to time. These persons are not separately compensated by the United Financial Bancorp, Inc. United Financial Bancorp, Inc. may hire additional employees, as appropriate, to the extent it expands its business in the future.
United Financial Bancorp, Inc.’s executive offices are located at 95 Elm Street, West Springfield, Massachusetts, and its telephone number is 413-787-1700.
United Bank
United Bank is a federally chartered savings bank headquartered in West Springfield, Massachusetts. United Bank was originally founded in 1882, as a Massachusetts-chartered cooperative bank. Over the years, United Bank has grown through internal growth as well as through a series of five mutual-to-mutual business combinations that occurred between 1960 and 1994. In February 2004, United Bank converted to a federal savings bank and, in April 2004, reorganized into the two-tier mutual holding company structure. In July 2005, United Bank completed a minority public stock offering through its holding company, United Financial-Federal. In that offering, 7.7 million shares of common stock were sold to the public at $10.00 per share, resulting in net proceeds of $74.8 million.
United Bank’s principal business consists of attracting retail deposits from the general public in the areas surrounding our main office in West Springfield, Massachusetts and our sixteen branch offices located in our Springfield Region (Agawam, Chicopee, East Longmeadow, Feeding Hills, Holyoke, Huntington, Indian Orchard, Longmeadow, Ludlow, Northampton, Springfield and Westfield, Massachusetts as well as our Express Drive-Up branch in Northampton, Massachusetts) and six branches in the Worcester Region (West Boylston, Whitinsville, Worcester and Shrewsbury, Massachusetts). We invest those deposits, together with funds generated from operations, in one- to four-family residential mortgage loans as well as in home equity loans and lines of credit, commercial real estate loans, construction loans, commercial and industrial loans, automobile loans, other consumer loans, and investment securities. We originate loans almost exclusively for investment. Occasionally, we will also enter into loan participations with other financial institutions. Our revenues are derived principally from interest on loans and securities. We also generate revenues from fees and service charges and other income. United Bank emphasizes exceptional personal service for its customers. Our primary sources of funds are deposits, borrowings and principal and interest payments on loans and securities.
United Bank’s executive offices are located at 95 Elm Street, West Springfield, Massachusetts, and our telephone number is 413-787-1700.
Available Information
United Financial Bancorp, Inc.’s annual report on Form 10-K, quarterly reports on Form 10-Q, current reports on Form 8-K, and any amendments to such reports filed or furnished pursuant to Section 13(a) or 15(d) of the Securities Exchange Act of 1934, as amended, are made available free of charge on our website, www.bankatunited.com, as soon as reasonably practicable after such reports are electronically filed with, or furnished to, the Securities and Exchange Commission. The information on our website shall not be considered as incorporated by reference into this Form 10-K.
Market Area
We are headquartered in West Springfield, Massachusetts. Our primary market area for generating deposits is concentrated in the communities surrounding our main and branch offices. We also maintain two financial services facilities that offer insurance and investment products and financial planning services. These
2
Table of Contents
facilities are located in West Springfield and Northampton. Our primary lending area is significantly broader than our deposit market area and includes all of Hampden and Hampshire Counties in Western Massachusetts, Northern Connecticut and Worcester County. At December 31, 2010, 86.6% of our mortgage loan portfolio consisted of loans secured by real estate located in Hampden and Hampshire Counties, Massachusetts.
Springfield Region. The city of West Springfield is largely suburban and is located in the Pioneer Valley near the intersection of U.S. Interstates 90 (the Massachusetts Turnpike) and 91. Interstate 90 is the major east-west highway that transverses Massachusetts. Interstate 91 is the major north-south highway that runs directly through the heart of New England. West Springfield is located approximately 90 miles west of Boston, Massachusetts, 70 miles southeast of Albany, New York and 30 miles north of Hartford, Connecticut. According to a recent census report, West Springfield’s estimated 2009 population was approximately 28,324 and the estimated 2009 population for Hampden and Hampshire Counties was 468,171 and 155,160, respectively. During the past eight years, the populations of Hampden and Hampshire Counties increased by 2.62% and 1.91%, respectively, while the population of the Commonwealth of Massachusetts increased by 2.55%. During the same period, the number of households in Hampden and Hampshire Counties increased by 0.92% and 3.56%, respectively.
The economy of our primary market area has benefited from the presence of large employers such as the University of Massachusetts, Baystate Health System, Mass Mutual Financial Group, Big Y Supermarkets, Hasbro Games, Peter Pan Bus Lines, Friendly Ice Cream Corporation, Westover Air Force Base, Smith & Wesson, Yankee Candle and Verizon. Other employment and economic activity is provided by financial institutions, colleges and universities, hospitals and a variety of wholesale and retail trade businesses. Our market area also enjoys a strong tourism business. According to recent census data, per capita and median household income for Hampden County was $24,556 and $47,617, respectively, in 2009, lower than the Commonwealth of Massachusetts ($33,460 and $64,496) and the United States ($27,041 and $51,425). 2009 per capita and median household income for Hampshire County was $27,621 and $57,293 respectively.
Our local economy has been experiencing a slowdown during the past two years. The unemployment rate in Hampden County decreased from 10.6% in December 2009 to 10.0% in November 2010, which is higher than the unemployment rates for Massachusetts as a whole (8.2%) and the United States (9.8%).
Worcester Region. Located one hour from our corporate headquarters in West Springfield, the city of Worcester is located 30 minutes from Boston’s MetroWest area and adjacent to the I-495 Corridor. Worcester is the second largest city in New England with an estimated population of 178,397 in 2009. Worcester County’s 2009 population was 795,726, a 5.96% increase from 2000. Households in Worcester County grew from 283,927 in 2000 to 292,724 in 2009, an increase of 3.10%. United Bank’s Worcester Region Headquarters is located at 33 Waldo Street in Worcester.
Worcester has a diversified economy. The City of Worcester is home to eight colleges and the University of Massachusetts Medical School, its largest employer. Biotechnology is a major enterprise within the city. Its biotech park is host to several innovative companies including Abbott Laboratories, a leading pharmaceutical research and manufacturing firm. Hanover Insurance maintains its national headquarters in Worcester and a subsidiary of Unum, the Paul Revere Life Insurance Company, is also headquartered in Worcester as is the Harleysville Worcester Insurance Company, the oldest life insurance company based in Massachusetts. In addition, Worcester is also home to several libraries and museums. Residents also enjoy access to several performing arts centers and variety of annual music festivals and events.
According to recent census data, per capita and median household income for Worcester County, 2009 per capital and median household income was $29,882 and $63,720. The unemployment rate in Worcester County decreased from 9.9% in December 2009 to 9.0% in November, 2010.
3
Table of Contents
Competition
We face intense competition within our market area both in making loans and attracting deposits. Our market area has a high concentration of financial institutions including large money center and regional banks, community banks and credit unions. Some of our competitors offer products and services that we currently do not offer, such as trust services and private banking. As of June 30, 2010, the latest date for which information is available, our market share of deposits represented 11.77%, 1.66% and 1.58% of deposits in Hampden, Hampshire and Worcester Counties, Massachusetts, respectively.
Our competition for loans and deposits comes principally from commercial banks, savings and co-operative institutions, mortgage banking firms and credit unions. We face additional competition for deposits from short-term money market funds, brokerage firms, mutual funds and insurance companies. Our primary focus is to build and develop profitable customer relationships across all lines of business while maintaining our role as a community bank.
Lending Activities
Our principal lending activities are the origination of first mortgage loans for the purchase or refinancing of one- to four-family residential real property, as well as the origination of home equity, commercial real estate and commercial and industrial loans. We generally originate loans for investment purposes. No loans were held for sale at December 31, 2010 or 2009.
4
Table of Contents
Loan Portfolio Composition. The following table sets forth the composition of our loan portfolio by type of loan as of the dates indicated.
| At December 31, | ||||||||||||||||||||||||||||||||||||||||
| 2010 | 2009 | 2008 | 2007 | 2006 | ||||||||||||||||||||||||||||||||||||
| Amount | Percent | Amount | Percent | Amount | Percent | Amount | Percent | Amount | Percent | |||||||||||||||||||||||||||||||
| (Dollars in thousands) | ||||||||||||||||||||||||||||||||||||||||
| Types of loans: |
||||||||||||||||||||||||||||||||||||||||
| Real estate loans: |
||||||||||||||||||||||||||||||||||||||||
| One- to four-family |
$ | 295,721 | 27.53% | $ | 343,300 | 30.59% | $ | 356,428 | 40.96% | $ | 339,470 | 41.16% | $ | 319,108 | 41.87% | |||||||||||||||||||||||||
| Commercial |
427,994 | 39.85% | 409,680 | 36.51% | 248,457 | 28.55% | 214,776 | 26.04% | 175,564 | 23.04% | ||||||||||||||||||||||||||||||
| Construction (1) |
27,553 | 2.57% | 48,808 | 4.35% | 32,082 | 3.69% | 42,059 | 5.10% | 54,759 | 7.19% | ||||||||||||||||||||||||||||||
| Home equity |
138,290 | 12.87% | 137,371 | 12.24% | 120,724 | 13.87% | 116,241 | 14.10% | 112,739 | 14.79% | ||||||||||||||||||||||||||||||
| Commercial and industrial |
165,335 | 15.39% | 159,437 | 14.21% | 84,919 | 9.76% | 81,562 | 9.89% | 69,762 | 9.15% | ||||||||||||||||||||||||||||||
| Automobile |
11,051 | 1.03% | 14,729 | 1.31% | 17,332 | 1.99% | 22,461 | 2.72% | 24,456 | 3.21% | ||||||||||||||||||||||||||||||
| Consumer |
8,167 | 0.76% | 8,916 | 0.79% | 10,334 | 1.19% | 8,126 | 0.99% | 5,725 | 0.75% | ||||||||||||||||||||||||||||||
| Total loans |
$ | 1,074,111 | 100.00% | $ | 1,122,241 | 100.00% | $ | 870,276 | 100.00% | $ | 824,695 | 100.00% | $ | 762,113 | 100.00% | |||||||||||||||||||||||||
| Other items: |
||||||||||||||||||||||||||||||||||||||||
| Net deferred loan costs and fees |
2,073 | 2,355 | 2,395 | 2,136 | 1,285 | |||||||||||||||||||||||||||||||||||
| Allowance for loan losses |
(9,987) | (9,180) | (8,250) | (7,714) | (7,218) | |||||||||||||||||||||||||||||||||||
| Total loans, net |
$ | 1,066,197 | $ | 1,115,416 | $ | 864,421 | $ | 819,117 | $ | 756,180 | ||||||||||||||||||||||||||||||
(1) Includes $24,833, $45,615, $30,161, $33,603 and $41,256 of commercial construction loans at December 31, 2010, 2009, 2008, 2007 and 2006, respectively.
5
Table of Contents
Loan Portfolio Maturities and Yields. The following table summarizes the scheduled repayments of our loan portfolio at December 31, 2010. Demand loans, loans having no stated repayment schedule or maturity, and overdraft loans are reported as being due in one year or less.
| Residential | Commercial Real Estate |
Construction | Home Equity | Commercial and Industrial |
Automobile | Other Consumer | Total (1) | |||||||||||||||||||||||||||||||||||||||||||||||||||||||||
| Amount | Weighted Average Rate |
Amount | Weighted Average Rate |
Amount | Weighted Average Rate |
Amount | Weighted Average Rate |
Amount | Weighted Average Rate |
Amount | Weighted Average Rate |
Amount | Weighted Average Rate |
Amount | Weighted Average Rate |
|||||||||||||||||||||||||||||||||||||||||||||||||
| (Dollars in thousands) | ||||||||||||||||||||||||||||||||||||||||||||||||||||||||||||||||
| Due during the years ending |
|
|||||||||||||||||||||||||||||||||||||||||||||||||||||||||||||||
| after December 31, 2010: |
||||||||||||||||||||||||||||||||||||||||||||||||||||||||||||||||
| One year or less |
$ | 89 | 6.15% | $ | 20,129 | 6.06% | $ | 7,444 | 5.06% | $ | 1,872 | 3.86% | $ | 16,004 | 5.00% | $ | 626 | 5.50% | $ | 70 | 4.88% | $ | 46,234 | 5.43% | ||||||||||||||||||||||||||||||||||||||||
| More than one to five years |
26,140 | 5.24% | 252,203 | 6.03% | 11,782 | 5.45% | 18,931 | 5.59% | 71,195 | 5.60% | 10,425 | 4.96% | 1,113 | 5.03% | 391,789 | 5.83% | ||||||||||||||||||||||||||||||||||||||||||||||||
| More than five years |
268,894 | 5.26% | 157,184 | 6.08% | 8,935 | 4.66% | 118,009 | 3.80% | 80,247 | 4.27% | - | 0.00% | 6,988 | 8.35% | 640,257 | 5.09% | ||||||||||||||||||||||||||||||||||||||||||||||||
| Total |
$ | 295,123 | 5.26% | $ | 429,516 | 6.05% | $ | 28,161 | 5.10% | $ | 138,812 | 4.04% | $ | 167,446 | 4.91% | $ | 11,051 | 4.99% | $ | 8,171 | 7.87% | $ | 1,078,280 | 5.38% | ||||||||||||||||||||||||||||||||||||||||
(1) Excludes the fair value adjustment balance of $4.2 million recorded in connection with the acquisition of CNB Financial.
The following table sets forth the scheduled repayments of fixed and adjustable-rate loans at December 31, 2010 that are contractually due after December 31, 2011.
| Due After December 31, 2011 | ||||||||||||
| Fixed | Adjustable | Total | ||||||||||
| (In thousands) | ||||||||||||
| Residential real estate |
$ | 270,870 | $ | 24,164 | $ | 295,034 | ||||||
| Commercial real estate |
221,136 | 188,251 | 409,387 | |||||||||
| Construction |
4,708 | 16,009 | 20,717 | |||||||||
| Home equity |
35,431 | 101,509 | 136,940 | |||||||||
| Commercial and industrial |
62,978 | 88,464 | 151,442 | |||||||||
| Automobile |
10,425 | - | 10,425 | |||||||||
| Consumer |
8,101 | - | 8,101 | |||||||||
| Total loans |
$ | 613,649 | $ | 418,397 | $ | 1,032,046 | ||||||
6
Table of Contents
One- to Four-Family Residential Mortgage Loans. One of our primary lending activities consists of the origination of one- to four-family residential mortgage loans, substantially all of which are secured by properties located in our primary market area. At December 31, 2010, $295.7 million, or 27.5% of our loan portfolio, consisted of one- to four-family residential mortgage loans. In general, we retain in our portfolio all loans that we originate, however, for strategic reasons, including our interest rate risk management objectives, we periodically sell fixed-rate one- to four-family residential mortgage loans. One- to four-family mortgage loan originations are generally obtained from our in-house loan representatives, from existing or past customers, through advertising, and through referrals from local builders, real estate brokers and attorneys, and are underwritten pursuant to United Bank’s policies and standards. Generally, one- to four-family residential mortgage loans are originated in amounts up to 80% of the lesser of the appraised value or purchase price of the property, with private mortgage insurance required on loans with a loan-to-value ratio in excess of 80%. We generally will not make loans with a loan-to-value ratio in excess of 95%. Further, we generally limit the loan-to-value ratio to 70% on a cash-out refinance transaction based on updated appraisal information.
Fixed-rate mortgage loans are originated for terms of up to 30 years. Generally, fixed-rate residential mortgage loans are underwritten according to Fannie Mae guidelines, policies and procedures. We also offer adjustable-rate mortgage loans for one- to four-family properties, with an interest rate based on the weekly average yield on U.S. Treasuries adjusted to a constant maturity of one-year, which adjust either annually or every three years from the outset of the loan or which adjust annually after a five-, seven- or ten-year initial fixed-rate period. For the year ended December 31, 2010, we originated $60.0 million of fixed rate one- to four-family residential loans. We did not originate adjustable-rate one- to four-family residential loans during 2010 primarily due to the low interest rate environment. Our adjustable-rate mortgage loans generally provide for maximum rate adjustments of 2% per adjustment, with a lifetime maximum adjustment up to 6%, regardless of the initial rate. Our adjustable-rate mortgage loans amortize over terms of up to 30 years.
Adjustable rate mortgage loans decrease the risk associated with changes in market interest rates by periodically repricing, but involve other risks because as interest rates increase the underlying payments by the borrower increase, thus increasing the potential for default by the borrower. At the same time, the marketability of the underlying collateral may be adversely affected by higher interest rates. Upward adjustment of the contractual interest rate also is limited by the maximum periodic and lifetime interest rate adjustments permitted by our loan documents and, therefore, the effectiveness of adjustable-rate mortgage loans may be limited during periods of rapidly rising interest rates. At December 31, 2010, $24.2 million, or 8.2%, of our one- to four-family residential mortgage loans had adjustable rates of interest.
In an effort to provide financing for low- and moderate-income home buyers, we offer a variety of programs to qualified borrowers. These programs include Veterans Administration (VA), Federal Housing Administration (FHA), Massachusetts Housing Financing Agency (MHFA) and several other programs that we have developed in-house. These loans are offered with fixed rates of interest, terms of up to 30 years and are secured by one-to four-family residential properties. All of these loans are originated using agency underwriting guidelines. These loans may be originated in amounts with loan-to-value ratios up to 100%. Private mortgage insurance is required for loans with loan-to-value ratios over 80%. We also offer our own first-time homebuyer loans to qualified individuals. These loans are offered with terms of up to 30 years and fixed or adjustable rates of interest, which may be discounted, and the applicant may not be required to pay certain loan origination fees.
We also offer our employees who satisfy certain criteria and our general underwriting standards fixed- or adjustable rate loan products with reduced interest rates, and reduced application and loan origination fees. Employee and insider loans adhere to all other terms and conditions contained in the loan policy.
All residential mortgage loans that we originate include “due-on-sale” clauses, which give us the right to declare a loan immediately due and payable in the event that, among other things, the borrower sells or otherwise disposes of the real property subject to the mortgage and the loan is not repaid. Regulations limit the amount that
7
Table of Contents
a savings bank may lend relative to the appraised value of the real estate securing the loan, as determined by an appraisal of the property at the time the loan is originated. All borrowers are required to obtain title insurance for the benefit of United Bank. We also require homeowner’s insurance and fire and casualty insurance and, where circumstances warrant, flood insurance on properties securing real estate loans.
Commercial Real Estate Loans. We originate commercial real estate loans that are generally secured by five or more unit apartment buildings, industrial properties and properties used for business purposes such as small office buildings, hotels, motels, recreational and retail facilities mainly located in our primary market area. At December 31, 2010, commercial real estate mortgage loans totaled $428.0 million, or 39.9% of our total loans, compared to $409.7 million, or 36.5% of our total loans at December 31, 2009. Our real estate underwriting policies provide that such loans may be made in amounts up to 85% of the appraised value of the property, though such loans are generally limited to 80% of the appraised value. In addition, these loans must comply with our loan policy guidelines and with our current loans-to-one borrower limit for these types of loans which is generally 15% of our unimpaired capital and surplus which, at December 31, 2010, was $28.6 million. Our commercial real estate loans may be made with terms of up to 25 years though generally loan terms do not exceed 10 years and loan amortization periods do not exceed 20 years. Commercial real estate loans are offered with interest rates that are fixed or adjust periodically and are generally indexed to the prime rate as reported in The Wall Street Journal or to rates published by the Federal Home Loan Bank of Boston. In reaching a decision on whether to make a commercial real estate loan, we consider the net operating income of the property, the borrower’s expertise and credit history, and the profitability of the underlying business and the value of the underlying property. In addition, with respect to real estate rental properties, we will also consider the term of the lease and the credit quality of the tenants. We generally require that the properties securing these real estate loans have stabilized debt service coverage ratios (the ratio of earnings before debt service to debt service) of at least 1.2 times. Environmental surveys are generally required for commercial real estate loans. Generally, commercial real estate loans made to corporations, partnerships and other business entities require personal guarantees by the principals.
A commercial borrower’s financial information is monitored on an ongoing basis by requiring periodic financial statement updates, payment history reviews and periodic face-to-face meetings with the borrower. We generally require commercial borrowers with loans in excess of $250,000 to provide annually updated financial statements and federal tax returns. These requirements also apply to the individual principals of our commercial borrowers when they are providing personal guarantees. We also require borrowers with rental investment property to provide us with an annual report of income and expenses for the property, including a tenant list and copies of leases, as applicable. The largest commercial real estate relationship in our portfolio at December 31, 2010 was a combination of loans totaling $13.6 million secured by two office buildings leased to a Fortune 500 company. The second largest commercial real estate loan at that date was a loan of $9.4 million secured by a supermarket-anchored retail plaza. All of these loans were performing in accordance with their terms at December 31, 2010.
Loans secured by commercial real estate, including multi-family properties, generally involve larger principal amounts and a greater degree of risk than one- to four-family residential mortgage loans. Because payments on loans secured by commercial real estate often depend on the successful operation or management of the properties, repayment of such loans may be affected by adverse conditions in the real estate market or the economy.
Construction Loans. We originate construction loans for the development of one- to four-family residential properties located in our primary market area. Residential construction loans are generally offered to individuals for the construction of their personal residences. At December 31, 2010, residential construction loans totaled $2.7 million, or 0.3% of total loans, compared to $3.2 million, or 0.3% at December 31, 2009. At December 31, 2010, the unadvanced portion of these construction loans totaled $824,000.
Our residential construction loans generally provide for the payment of interest only during the construction phase, which is usually 12 months. In the case of construction loans to individuals for the
8
Table of Contents
construction of their primary residences, our policies require that the loan convert to a permanent mortgage loan at the end of the construction phase. Residential construction loans can be made up to a maximum loan-to-value ratio of 90%, provided that the borrower obtains private mortgage insurance if the loan balance exceeds 80% of the appraised value or sales price, whichever is less, of the secured property. Residential construction loans are generally made on the same terms as our one- to four-family mortgage loans.
We also make commercial construction loans for residential and commercial development projects. The projects include single family, multi-family, apartment, industrial, retail and office buildings, and condominium developments. These loans generally have an interest-only phase during construction and then convert to permanent financing. We generally require that a commitment for permanent financing be in place prior to closing the construction loan. The maximum loan-to-value ratio limit applicable to these loans is generally 80%. Before making a commitment to fund a construction loan, we require an appraisal of the property by an independent licensed appraiser. We generally also review and inspect each property before disbursement of funds during the terms of the construction loan. Loan proceeds are disbursed after inspection based on the percentage-of-completion method. Due to current economic conditions, management has become more cautious in evaluating and approving funding for construction loans. At December 31, 2010, commercial construction loans totaled $24.8 million, or 2.3% of total loans, compared to $45.6 million, or 4.1% of total loans, at December 31, 2009. At December 31, 2010, the largest outstanding commercial construction loan balance was for $2.0 million, secured by a self storage facility located in eastern Massachusetts. This loan was performing according to its terms at December 31, 2010. At December 31, 2010, the unadvanced portion of all commercial construction loans totaled $25.7 million.
We also originate land loans to local individuals, contractors and developers to make improvements thereon, or to develop the land for sale. Loans to individuals are secured by a lien on the property, have loan-to-value ratios that generally are limited to a maximum of 70% of the value of the land (based on the lower of the acquisition price or the appraised value of the land) and are written with a fixed or floating interest rate. These loans are offered with a term of up to three years in which only interest is required to be paid each month. A balloon payment for the principal plus any accrued interest is due at the end of the three-year period. Land loans to developers are limited to a 65% loan-to-value ratio. The interest rate can be fixed or floating and the term can be for up to three years. Our land loans are generally secured by property in our primary market area. We require title insurance and, if applicable, a hazardous waste survey reporting that the land is free of hazardous or toxic waste. At December 31, 2010, land loans totaled $23.2 million, or 2.2% of total loans.
Construction and development financing is generally considered to involve a higher degree of credit risk than long-term financing on improved, owner-occupied real estate. Risk of loss on a construction loan depends largely upon the accuracy of the initial estimate of the value of the property at completion of construction compared to the estimated cost (including interest) of construction and other assumptions. If the estimate of construction cost proves to be inaccurate, we may be required to advance funds beyond the amount originally committed in order to protect the value of the property. Additionally, if the estimate of value proves to be inaccurate, the value of the project, when completed, may be insufficient to assure full repayment of the loan.
Home Equity Loans and Home Equity Lines of Credit. We also offer home equity loans and home equity lines of credit, both of which are secured by one- to four-family residences, substantially all of which are located in our primary market area. At December 31, 2010, home equity loans and equity lines of credit totaled $138.3 million, or 12.9% of total loans. Additionally, at December 31, 2010, the unadvanced amounts of home equity lines of credit totaled $124.7 million. The underwriting standards utilized for home equity loans and equity lines of credit include a determination of the applicant’s credit history, an assessment of the applicant’s ability to meet existing obligations and payments on the proposed loan and the value of the collateral securing the loan. The combined (first and second mortgage liens) loan-to-value ratio for home equity loans and equity lines of credit is limited to 80%. Home equity loans are offered with fixed and adjustable rates of interest and with terms of up to 20 years. Our home equity lines of credit have adjustable rates of interest, which are indexed to the prime rate, as reported in The Wall Street Journal, interest only draw periods under the lines are limited to 10
9
Table of Contents
years. We originated $39.5 million under home equity lines of credit and other home equity loans during the year ended December 31, 2010, as compared to total originations of $46.7 million during the year ended December 31, 2009.
Commercial and Industrial Loans. Commercial and industrial loans have been a substantial part of our lending operations for a number of years. At December 31, 2010, we had $165.3 million of commercial and industrial loans, which amounted to 15.4% of total loans compared to $159.4 million, or 14.2% of total loans at December 31, 2009. We make commercial and industrial loans primarily in our market area to a variety of professionals, sole proprietorships and small and mid-sized businesses. Commercial and industrial loan products include term loans and revolving lines of credit. The maximum amount of a commercial and industrial loan is limited by our loans-to-one-borrower limit which is generally 15% of our unimpaired capital and surplus and which, at December 31, 2010, was $28.6 million. Such loans are generally used for working capital and purchasing equipment or furniture. Commercial and industrial loans are made with either adjustable or fixed rates of interest with a maximum term of twenty years. The interest rates for commercial loans are based on the prime rate, as published in The Wall Street Journal.
When making commercial and industrial loans, we consider the financial strength and debt service capabilities of the borrower, our lending history with the borrower, the projected cash flows of the business and the value and type of the collateral. Commercial and industrial loans are generally secured by a variety of collateral, primarily accounts receivable, inventory, equipment, savings instruments and readily marketable securities. In addition, we usually require the business principals to execute personal guarantees.
Commercial and industrial loans generally have greater credit risk than residential mortgage loans. Unlike residential mortgage loans, which generally are made on the basis of the borrower’s ability to make repayment from his or her employment or other income, and which are secured by real property whose value tends to be more easily ascertainable, commercial and industrial loans generally are made on the basis of the borrower’s ability to repay the loan from the cash flows of the borrower’s business. As a result, the availability of funds for the repayment of commercial and industrial loans may depend substantially on the success of the business itself. Further, any collateral securing the loans may depreciate over time, may be difficult to appraise and may fluctuate in value. We seek to minimize these risks through our underwriting standards. At December 31, 2010, our largest commercial and industrial loan outstanding was $6.6 million, which is secured by a certificate of deposit that we maintain. Our largest committed commercial and industrial relationship was $14.5 million to a manufacturer located in our primary market area. Including an additional $4.2 million participated out to another bank, the total relationship of $18.7 million is comprised of $4.5 million of commercial and industrial loan availability, a $10 million industrial development bond for the construction of a new facility ($4.2 million of which is participated out) and a $4.2 million commercial real estate loan on the borrower’s existing facility. The total amount outstanding at December 31, 2010 was $13.8 million ($9.6 million net of participation), with no amounts outstanding on the commercial and industrial loans. All loans to these customers were performing in accordance with loan terms at December 31, 2010.
Automobile and Other Consumer Loans. We offer direct automobile loans with terms of up to 60 months. For new cars, our lending policy provides that the amount financed should not exceed 100% of the gross selling price of the vehicle. For used cars, our lending policy provides that the amount of the loan should not exceed the “loan value” of the vehicle, as established by industry guides. The interest rates offered are the same for new and used automobile loans. Full insurance coverage must be maintained on the financed vehicle and United Bank must be named loss payee on the policy. At December 31, 2010, we had $11.1 million in automobile loans, which amounted to 1.0% of total loans.
We offer a variety of other consumer loans, principally to existing United Bank customers residing in our primary market area with acceptable credit ratings. Our other consumer loans generally consist of secured and unsecured personal loans, motorcycle and motor home loans, manufactured housing, boat loans and pool and spa loans. Other consumer loans totaled $8.2 million, or 0.8% of our total loan portfolio at December 31, 2010. At December 31, 2010, $325,000 of such consumer loans were unsecured.
10
Table of Contents
Consumer loans have greater credit risk than residential mortgage loans, particularly in the case of loans that are unsecured or secured by rapidly depreciating assets such as automobiles, motorcycles, motor homes and boats. In these cases, any repossessed collateral for a defaulted consumer loan may not provide an adequate source of repayment of the outstanding loan balance as a result of the greater likelihood of damage, loss or depreciation. In addition, consumer loan collections depend on the borrower’s continuing financial stability, and thus are more likely to be adversely affected by job loss, divorce, illness or personal bankruptcy.
Loan Originations, Purchases, Sales, Participations and Servicing of Loans. Lending activities are conducted primarily by our loan personnel operating at our main and branch office locations. All loans that we originate are underwritten pursuant to our policies and procedures. We originate both fixed-rate and adjustable-rate loans. Our ability to originate fixed or adjustable rate loans is dependent upon relative customer demand for such loans, which is affected by current and expected future levels of market interest rates.
Generally, we retain in our portfolio all loans that we originate, however, for strategic reasons, including our interest rate risk management objectives, we periodically sell fixed rate residential mortgage loans which conform to the underwriting standards specified by Federal National Mortgage Association (“Fannie Mae”) and Massachusetts Housing Financing Authority (“MHFA”). All one-to four-family loans sold are on a non-recourse basis. Historically, in such instances, our loans have been typically sold to Fannie Mae and MHFA with servicing retained. Depending on interest rate levels at the time of any such sale, loans may be sold at either a net gain or a net loss. Additionally, we may not be able to reinvest the proceeds from any future loan sales at interest rates comparable to the interest rates on the loans that are sold. Reinvestment in loans with lower interest rates would result in lower interest income on the reinvested proceeds compared to the interest income previously generated by the loans that were sold.
The Company was servicing loans sold in the amount of $68.9 million and $50.9 million, as of December 31, 2010 and 2009, respectively. Loan servicing includes collecting and remitting loan payments, accounting for principal and interest, contacting delinquent mortgagors, supervising foreclosures and property dispositions in the event of unremedied defaults, making certain insurance and tax payments on behalf of the borrowers and generally administering the loans. The balance of mortgage servicing rights to these loans was insignificant as of December 31, 2010 and 2009.
From time to time, we will also purchase loans. No loans were purchased during 2010. During the second quarter of 2009, we purchased $10.3 million in commercial real estate loans from a major financial organization. These loans consisted of five loans secured by real estate located within 50 miles of our main office. Each of the loans were underwritten to our criteria and procedures and have maturities ranging from four years to 23 years.
From time to time, we will also participate in loans, sometimes as the “lead lender.” Whether we are the lead lender or not, we underwrite our participation portion of the loans according to our own underwriting criteria and procedures. At December 31, 2010, we had $41.9 million in loan participation interests in which we were the lead bank and $23.0 million in loan participations in which we were not the lead bank.
11
Table of Contents
The following table shows our loan originations, purchases, sales and repayment activities for the years indicated.
| Years Ended December 31, | ||||||||||||
| 2010 | 2009 | 2008 | ||||||||||
| (In thousands) | ||||||||||||
| Total loans at beginning of period |
$ | 1,122,241 | $ | 870,488 | $ | 824,695 | ||||||
| Loan originations: |
||||||||||||
| Residential mortgages |
59,992 | 61,374 | 46,946 | |||||||||
| Commercial mortgages |
45,164 | 71,087 | 57,096 | |||||||||
| Construction (1) |
33,307 | 15,805 | 28,799 | |||||||||
| Home equity |
39,528 | 46,706 | 58,928 | |||||||||
| Commercial and industrial |
63,412 | 61,923 | 97,274 | |||||||||
| Automobile |
4,387 | 6,603 | 5,367 | |||||||||
| Other consumer |
688 | 649 | 5,368 | |||||||||
| Total loans originated |
246,478 | 264,147 | 299,778 | |||||||||
| Loans purchased |
- | 10,262 | 15,024 | |||||||||
| Loans acquired from CNB Financial at fair value |
- | 236,387 | - | |||||||||
| Deductions: |
||||||||||||
| Principal loan repayments |
273,374 | 230,976 | 264,610 | |||||||||
| Loan sales |
27,058 | 29,530 | - | |||||||||
| (Increase) decrease due to other items (2) |
(5,824) | (1,463) | 4,399 | |||||||||
| Total deductions |
294,608 | 259,043 | 269,009 | |||||||||
| Net loan activity |
(48,130) | 251,753 | 45,793 | |||||||||
| Total loans at end of period |
$ | 1,074,111 | $ | 1,122,241 | $ | 870,488 | ||||||
(1) Includes $31,978, $7,847 and $25,799 of commercial construction loans for the years ended December 31, 2010, 2009 and 2008, respectively.
(2) Includes additional disbursements on home equity and lines of credit, participation loans serviced for others, minor changes and other activity on loans previously originated.
Loan Approval Procedures and Authority. United Bank’s lending activities follow written, non-discriminatory underwriting standards and loan origination procedures established by United Bank’s Board of Directors. The loan approval process is intended to assess the borrower’s ability to repay the loan, the viability of the loan and the adequacy of the value of the property that will secure the loan. To assess the borrower’s ability to repay, we review the employment and credit history and information on the historical and projected income and expenses of borrowers.
United Bank’s policies and loan approval limits are established by the Board of Directors. The Board of Directors has delegated authority to United Bank’s Chief Lending Officer to review and assign lending authorities to certain individuals of United Bank (ranging from senior management to senior loan underwriter) (the “Designated Individuals”) to consider and approve loans within their designated authority. In addition the Board has delegated authority at the request of the Chief Lending Officer to an Officers’ Loan Committee comprising the Chief Executive Officer, Chief Lending Officer, EVP of Commercial Banking, Chief Credit Officer and SVP of Risk Management. Loans in amounts above the authorized limits of the Officers’ Loan Committee and loans outside of the designated authority of the Officers’ Loan Committee require the approval of United Bank’s Directors’ Loan Committee. The Directors’ Loan Committee consists of four of our directors, including our Chief Executive Officer. All loans that are approved by the Designated Individuals or the Officers’ Loan Committee are still reviewed and ratified by the Directors’ Loan Committee and the Board of Directors on a monthly basis.
12
Table of Contents
All residential mortgage loans (one- to four-family loans, home equity loans, home equity lines of credit and residential construction loans) may be approved by certain of the Designated Individuals in amounts up to the annually adjusted Fannie Mae and Federal Home Loan Mortgage Corporation (“Freddie Mac”) secondary market conforming loan limits (“Conforming Loans”). Residential mortgage loans in excess of the Conforming Loan limit and up to $1.0 million may be approved by any two of either United Bank’s Chief Executive Officer, Chief Financial Officer or Senior Vice President of Residential Lending. Residential loans in excess of $1.0 million must be approved by any two of the senior executive officers listed above and United Bank’s Officers’ Loan Committee.
All commercial real estate, commercial construction loans and commercial and industrial loans in amounts up to $1.0 million may be approved by certain of the Designated Individuals. All such loans in excess of $1.0 million, or additional extensions of credit to existing commercial borrowers that result in liability in excess of $1.0 million, must be approved by United Bank’s Officers’ Loan Committee. All home equity loans and home equity lines of credit up to $500,000 may be approved by certain of the Designated Individuals. All home equity loans and home equity lines of credit in excess of $500,000 must be approved by the Officers’ Loan Committee. All loans in excess of $2.0 million, or additional extensions of credit to existing commercial borrowers that result in liability in excess of $2.0 million, must be approved by United Bank’s Directors’ Loan Committee. In addition, there are certain instances which may trigger the need for approval of the Directors’ Loan Committee at a $1.0 million threshold, for example if the collateral is located outside of our primary market area or if the loan is adversely rated.
All consumer loans in amounts up to $100,000 may be approved by certain of the Designated Individuals. All consumer loans in excess of $100,000 must be approved by the Loan Committee.
We generally require appraisals of all real property securing loans, except for home equity loans and equity lines of credit, in which case we may use the assessed tax value of the property securing such loans. Appraisals are performed by independent licensed appraisers. All appraisers are approved by the Loan Committee annually. We require fire and extended coverage insurance in amounts at least equal to the principal amount of the loan.
Non-performing and Problem Assets
Asset Quality Process. We have an independent loan review process and our loan review consultants provided two on-site reviews of our commercial portfolio during 2010. All loan relationships in excess of $1.0 million and all classified loans over $500,000 were reviewed by the third party consultants.
We initiate collection efforts when a loan becomes ten days past due with system-generated reminder notices. Subsequent late charge and delinquent notices are issued and the account is monitored on a regular basis thereafter. Personal, direct contact with the borrower is attempted early in the collection process as a courtesy reminder and later to determine the reason for the delinquency and to safeguard our collateral. When a loan is more than 60 days past due, the credit file is reviewed and, if deemed necessary, information is updated or confirmed and collateral re-evaluated. We make every effort to contact the borrower and develop a plan of repayment to cure the delinquency. A summary report of all loans 30 days or more past due is reported to the Board of Directors monthly. If no repayment plan is in process, the file is referred to counsel for the commencement of foreclosure or other collection efforts.
Loans are generally placed on non-accrual status when they are more than 90 days delinquent. When loans are placed on a non-accrual status, unpaid accrued interest is fully reversed.
13
Table of Contents
Non-Performing Assets. The table below sets forth the amounts and categories of our non-performing assets at the dates indicated. As noted, we had three troubled debt restructurings (loans for which a portion of interest or principal has been forgiven and loans modified at interest rates less than current market rates).
| At December 31, | ||||||||||||||||||||
| 2010 | 2009 | 2008 | 2007 | 2006 | ||||||||||||||||
| (Dollars in thousands) | ||||||||||||||||||||
| Non-accrual loans: |
||||||||||||||||||||
| Residential mortgages |
$ | 1,036 | $ | 1,190 | $ | 1,244 | $ | 328 | $ | - | ||||||||||
| Commercial mortgages |
3,256 | 10,717 | 2,544 | 553 | 1,144 | |||||||||||||||
| Construction |
410 | 3,280 | 444 | 577 | - | |||||||||||||||
| Home equity |
60 | 492 | - | 52 | 20 | |||||||||||||||
| Commercial and industrial |
2,885 | 571 | 425 | 275 | 123 | |||||||||||||||
| Automobile |
- | 4 | - | - | - | |||||||||||||||
| Other consumer |
55 | 33 | 140 | - | 1 | |||||||||||||||
| Total |
7,702 | 16,287 | 4,797 | 1,785 | 1,288 | |||||||||||||||
| Non-accrual troubled debt restructures: |
||||||||||||||||||||
| Commercial mortgages |
860 | (1) | - | - | - | - | ||||||||||||||
| Construction |
872 | (2) | - | - | - | - | ||||||||||||||
| Total |
1,732 | - | - | - | - | |||||||||||||||
| Total non-accrual loans |
9,434 | 16,287 | 4,797 | 1,785 | 1,288 | |||||||||||||||
| Other real estate owned |
1,536 | 1,545 | 998 | 880 | 562 | |||||||||||||||
| Total non-performing assets |
$ | 10,970 | $ | 17,832 | $ | 5,795 | $ | 2,665 | $ | 1,850 | ||||||||||
| Accruing troubled debt restructuring |
$ | 3,473 | (3) | $ | - | $ | - | $ | - | $ | - | |||||||||
| Ratios: |
||||||||||||||||||||
| Total non-performing loans to total loans |
0.88% | 1.45% | 0.55% | 0.22% | 0.17% | |||||||||||||||
| Total non-performing assets to total assets |
0.69% | 1.16% | 0.46% | 0.25% | 0.18% | |||||||||||||||
| Allowance for loan losses to non-performing loans |
105.86% | (4) | 56.36% | (4) | 171.98% | 432.16% | 560.40% | |||||||||||||
(1) Includes an $860,000 troubled debt restructure commercial mortgage loan which was restructured in the second quarter of 2010. There were no additional commitments to this borrower.
(2) Includes an $872,000 troubled debt restructure construction loan which was restructured in the fourth quarter of 2010. There were no additional commitments to this borrower.
(3) Represents a commercial mortgage loan which was restructured in the first quarter of 2010 and was returned to accrual status at September 30, 2010 as the customer has been current on the new payments for six months.
(4) Exclusive of the $163,000 and $3.3 million in non-performing loans acquired in acquisition of CNB Financial at December 2010 and 2009, respectively, allowance for loan losses as a percent of non-performing loans would have been 107.72% and 70.44%, respectively.
As noted in the above table, non-accrual loans amounted to approximately $9.4 million and $16.3 million at December 31, 2010 and 2009, respectively. There are no loans greater than 90 days past due and still accruing interest as of December 31, 2010. The non-accrual loan total for December 31, 2010 includes two troubled debt restructure loans, an $860,000 commercial real estate loan which was impaired at March 31, 2010 and was restructured during the second quarter of 2010 and a troubled debt restructure construction loan for $872,000 which was restructured in the fourth quarter of 2010. The non-accrual loan total for December 31, 2009 includes a $3.5 million commercial real estate loan which was impaired at December 31, 2009 and was restructured during the first quarter of 2010. This loan was classified as a troubled debt restructure and was placed on non-accrual status as of March 31, 2010. As of September 30, 2010, this loan was returned to accruing status as the customer has been current on the new payments for more than six months. The additional decrease of $3.4 million from 2009 reflects the resolution of four commercial real estate loans and two construction loans offset by the addition of one commercial and industrial relationship and two commercial real estate loans with
14
Table of Contents
balances over $500,000 during 2010. Each of the Company’s non-performing assets has an active workout plan in place. Additional interest income of approximately $363,000, $281,000, $132,000, $69,000 and $71,000, respectively, would have been recorded during the years ended December 31, 2010, 2009, 2008, 2007 and 2006, respectively, if the loans had performed in accordance with their original terms.
A loan is considered impaired when, based on current information and events, it is probable that the Company will be unable to collect the scheduled payments of principal or interest when due according to the contractual terms of the loan agreement. Factors considered by management in determining impairment include payment status, collateral value, and the probability of collecting scheduled principal and interest payments when due. Loans that experience insignificant payment delays and payment shortfalls generally are not classified as impaired. Impairment is measured on a loan-by-loan basis for commercial and construction loans by either the present value of expected future cash flows discounted at the loan’s effective interest rate, the loan’s obtainable market price, or the fair value of the collateral if the loan is collateral dependent.
At December 31, 2010 and 2009, the recorded investment in impaired loans was $12.9 million and $16.3 million, respectively. A loan reserve of $667,000 and $599,000 was established on $4.1 million and $11.9 million of the impaired loans at December 31, 2010 and 2009, respectively. In 2009 and in accordance with the “Loans and Debt Securities Acquired with Deteriorating Credit Quality” section of FASB ASC 310 “Receivables,” the Company recorded a non accretable credit discount of $2.3 million related to impaired loans of $5.2 million acquired from CNB Financial. The average balance of impaired loans was $14.0 million, $9.3 million and $4.0 million for the years ended December 31, 2010, 2009 and 2008, respectively. Interest income recognized on impaired loans during 2010, 2009 and 2008 was not significant.
15
Table of Contents
Delinquent Loans. The following table sets forth our loan delinquencies greater than 60 days by type and amount at the dates indicated.
| Loans Delinquent For | ||||||||||||||||||||||||
| 60 - 89 Days | 90 Days and Over | Total | ||||||||||||||||||||||
| Number | Amount | Number | Amount | Number | Amount | |||||||||||||||||||
| (Dollars in thousands) | ||||||||||||||||||||||||
| At December 31, 2010 |
||||||||||||||||||||||||
| Residential mortgages |
10 | $ | 1,001 | 5 | $ | 1,036 | 15 | $ | 2,037 | |||||||||||||||
| Commercial mortgage |
6 | 1,088 | 13 | 3,256 | (1) | 19 | 4,344 | |||||||||||||||||
| Construction |
- | - | 3 | 410 | (2) | 3 | 410 | |||||||||||||||||
| Home equity |
3 | 223 | 1 | 60 | 4 | 283 | ||||||||||||||||||
| Commercial and industrial |
3 | 122 | 13 | 2,885 | 16 | 3,007 | ||||||||||||||||||
| Automobile |
1 | 5 | - | - | 1 | 5 | ||||||||||||||||||
| Other consumer |
1 | 3 | 2 | 55 | 3 | 58 | ||||||||||||||||||
| Total |
24 | $ | 2,442 | 37 | $ | 7,702 | 61 | $ | 10,144 | |||||||||||||||
| At December 31, 2009 |
||||||||||||||||||||||||
| Residential mortgages |
13 | $ | 1,355 | 5 | $ | 1,190 | 18 | $ | 2,545 | |||||||||||||||
| Commercial mortgages |
8 | 2,298 | 13 | 10,717 | 21 | 13,015 | ||||||||||||||||||
| Construction |
3 | 424 | 5 | 3,280 | 8 | 3,704 | ||||||||||||||||||
| Home equity |
3 | 157 | 4 | 492 | 7 | 649 | ||||||||||||||||||
| Commercial and industrial |
3 | 54 | 15 | 571 | 18 | 625 | ||||||||||||||||||
| Automobile |
- | - | 3 | 4 | 3 | 4 | ||||||||||||||||||
| Other consumer |
3 | 11 | 1 | 33 | 4 | 44 | ||||||||||||||||||
| Total |
33 | $ | 4,299 | 46 | $ | 16,287 | 79 | $ | 20,586 | |||||||||||||||
| At December 31, 2008 |
||||||||||||||||||||||||
| Residential mortgages |
7 | $ | 939 | 7 | $ | 1,244 | 14 | $ | 2,183 | |||||||||||||||
| Commercial mortgages |
3 | 772 | 8 | 2,544 | 11 | 3,316 | ||||||||||||||||||
| Construction |
1 | 140 | 3 | 444 | 4 | 584 | ||||||||||||||||||
| Home equity |
2 | 126 | - | - | 2 | 126 | ||||||||||||||||||
| Commercial and industrial |
5 | 242 | 15 | 425 | 20 | 667 | ||||||||||||||||||
| Automobile |
1 | 8 | - | - | 1 | 8 | ||||||||||||||||||
| Other consumer |
1 | 2 | 2 | 140 | 3 | 142 | ||||||||||||||||||
| Total |
20 | $ | 2,229 | 35 | $ | 4,797 | 55 | $ | 7,026 | |||||||||||||||
| At December 31, 2007 |
||||||||||||||||||||||||
| Residential mortgages |
1 | $ | 558 | 4 | $ | 328 | 5 | $ | 886 | |||||||||||||||
| Commercial mortgages |
3 | 671 | 5 | 553 | 8 | 1,224 | ||||||||||||||||||
| Construction |
- | - | 5 | 577 | 5 | 577 | ||||||||||||||||||
| Home equity |
2 | 200 | 2 | 52 | 4 | 252 | ||||||||||||||||||
| Commercial and industrial |
7 | 454 | 8 | 275 | 15 | 729 | ||||||||||||||||||
| Automobile |
- | - | - | - | - | - | ||||||||||||||||||
| Other consumer |
2 | 50 | - | - | 2 | 50 | ||||||||||||||||||
| Total |
15 | $ | 1,933 | 24 | $ | 1,785 | 39 | $ | 3,718 | |||||||||||||||
| At December 31, 2006 |
||||||||||||||||||||||||
| Residential mortgages |
3 | $ | 203 | - | $ | - | 3 | $ | 203 | |||||||||||||||
| Commercial mortgages |
1 | 149 | 7 | 1,144 | 8 | 1,293 | ||||||||||||||||||
| Construction |
- | - | - | - | - | - | ||||||||||||||||||
| Home equity |
- | - | 1 | 20 | 1 | 20 | ||||||||||||||||||
| Commercial and industrial |
2 | 47 | 4 | 123 | 6 | 170 | ||||||||||||||||||
| Automobile |
2 | 1 | - | - | 2 | 1 | ||||||||||||||||||
| Other consumer |
- | - | 1 | 1 | 1 | 1 | ||||||||||||||||||
| Total |
8 | $ | 400 | 13 | $ | 1,288 | 21 | $ | 1,688 | |||||||||||||||
(1) Excludes an $860,000 commercial mortgage loan which was restructured in the second quarter of 2010 and was placed on non-accrual status. Although this troubled debt restructure loan is reported as a non-performing asset, the borrower is delinquent for less than 60 days.
(2) Excludes an $872,000 construction loan which was restructured in the fourth quarter of 2010 and was placed on non-accrual status. Although this loan is reported as a non-performing asset, the borrower is current with respect to the restructured payment terms.
16
Table of Contents
Other Real Estate Owned. Other real estate acquired by us as a result of foreclosure or by deed in lieu of foreclosure is classified as real estate owned until sold. When property is acquired it is recorded at the lower of cost or fair market value at the date of foreclosure, establishing a new cost basis. Holding costs and declines in fair value after acquisition are expensed. At December 31, 2010, we had $1.5 million of real estate owned.
Classified Assets. Office of Thrift Supervision regulations provide that loans and other assets of lesser quality should be classified as “substandard,” “doubtful” or “loss” assets. An asset is considered “substandard” if it is inadequately protected by the current net worth and paying capacity of the obligor or of the collateral pledged, if any. “Substandard” assets include those characterized by the “distinct possibility” that we will sustain “some loss” if the deficiencies are not corrected. Assets classified as “doubtful” have all of the weaknesses inherent in those classified “substandard,” with the added characteristic that the weaknesses present make “collection or liquidation in full,” on the basis of currently existing facts, conditions, and values, “highly questionable and improbable.” Assets classified as “loss” are those considered “uncollectible” and of such little value that their continuance as assets without the establishment of a specific loss reserve is not warranted. We classify an asset as “special mention” if the asset has a potential weakness that warrants management’s close attention. While such assets are not impaired, management has concluded that if the potential weakness in the asset is not addressed, the value of the asset may deteriorate, adversely affecting the repayment of the asset.
We establish general allowances for loan losses in an amount deemed prudent by management for loans classified substandard or doubtful, as well as for other potential problem loans. General allowances represent loss allowances which have been established to recognize the inherent losses associated with lending activities, but which, unlike specific allowances, have not been allocated to particular problem assets. When we classify problem assets as “loss,” we are required either to establish a specific allowance for losses equal to 100% of the amount of the asset so classified or to charge off such amount. Our determination as to the classification of our assets and the amount of our valuation allowances is subject to review by the Office of Thrift Supervision, which can order the establishment of additional general or specific loss allowances.
The following table shows the aggregate amounts of our classified assets at the dates indicated for both loans and foreclosed assets. The total amount of loans in the table below at December 31, 2010 includes nineteen relationships which represent 59% of the classified loans. Construction loans for one- to-four family home or condominium development represent 10% of total classified assets, a decrease from 24% at December 31, 2009. Of the $1.5 million in other real estate owned, two properties aggregating $900,000 are under contract to be sold in the first and second quarter of 2011.
| At December 31, 2010 |
At December 31, 2009 |
|||||||
| (In thousands) | ||||||||
| Classified Loans: |
||||||||
| Special mention |
$ | 27,687 | $ | 33,507 | ||||
| Substandard |
44,113 | 45,354 | ||||||
| Doubtful |
312 | 136 | ||||||
| Loss |
- | - | ||||||
| Total classified loans |
$ | 72,112 | $ | 78,997 | ||||
| Foreclosed Assets: |
||||||||
| Other real estate owned |
1,536 | 1,545 | ||||||
| Total classified assets |
$ | 73,648 | $ | 80,542 | ||||
The loan portfolio is reviewed on a regular basis to determine whether any loans require classification in accordance with applicable regulations. Not all classified assets constitute non-performing assets.
A loan is classified as a troubled debt restructuring if the Company, for economic or legal reasons related to the borrower’s financial difficulties, grants a concession to the borrower that it would not otherwise
17
Table of Contents
consider. This usually includes a modification of loan terms, such as a reduction of the interest rate to below market terms, capitalizing past due interest or extending the maturity date and possibly a partial forgiveness of debt. Interest income on restructured loans is accrued after the borrower demonstrates the ability to pay under the restructured terms through a sustained period of repayment performance, which is generally six months.
Allowance for Loan Losses
Our allowance for loan losses is maintained at a level necessary to absorb loan losses that are both probable and reasonably estimable. Management, in determining the allowance for loan losses, considers the losses inherent in our loan portfolio and changes in the nature and volume of loan activities, delinquent and classified loans and charge-offs, along with the general economic and real estate market conditions. A description of our methodology in establishing our allowance for loan losses is set forth in under Item 7. “Management’s Discussion and Analysis of Financial Condition and Results of Operation—Critical Accounting Policies—Allowance for Loan Losses.” The allowance for loan losses as of December 31, 2010 was maintained at a level that represents management’s best estimate of losses inherent in the loan portfolio. However, this analysis process is inherently subjective, as it requires us to make estimates that are susceptible to revisions as more information becomes available. Although we believe that we have established the allowance at levels to absorb probable and estimable losses, future additions or deductions may be necessary if economic or other conditions in the future differ from the current environment.
In addition, as an integral part of their examination process, the Office of Thrift Supervision has authority to periodically review our allowance for loan losses. Such agencies may require that we recognize additions to the allowance based on their judgments of information available to them at the time of their examination.
18
Table of Contents
Allowance for Loan Losses. The following table sets forth activity in our allowance for loan losses for the years indicated.
| At or For the Year Ended December 31, | ||||||||||||||||||||
| 2010 | 2009 | 2008 | 2007 | 2006 | ||||||||||||||||
| (Dollars in thousands) | ||||||||||||||||||||
| Balance at beginning of period |
$ | 9,180 | $ | 8,250 | $ | 7,714 | $ | 7,218 | $ | 6,382 | ||||||||||
| Charge-offs: |
||||||||||||||||||||
| Residential mortgages |
1 | 69 | - | - | - | |||||||||||||||
| Commercial mortgages |
529 | 1,399 | 6 | 39 | - | |||||||||||||||
| Construction |
206 | 135 | 444 | 326 | - | |||||||||||||||
| Home equity |
115 | - | 42 | - | 10 | |||||||||||||||
| Commercial and industrial |
766 | 545 | 827 | 593 | 164 | |||||||||||||||
| Automobile |
4 | 5 | 8 | 21 | 1 | |||||||||||||||
| Other consumer |
16 | 10 | 9 | 4 | 11 | |||||||||||||||
| Total charge-offs |
1,637 | 2,163 | 1,336 | 983 | 186 | |||||||||||||||
| Recoveries: |
||||||||||||||||||||
| Residential mortgages |
- | 1 | - | - | - | |||||||||||||||
| Commercial mortgages |
96 | 5 | - | - | 1 | |||||||||||||||
| Construction |
- | 2 | - | - | - | |||||||||||||||
| Home equity |
- | - | 5 | 4 | - | |||||||||||||||
| Commercial and industrial |
63 | 85 | 17 | 47 | 47 | |||||||||||||||
| Automobile |
- | 2 | 3 | 1 | 2 | |||||||||||||||
| Other consumer |
- | - | 1 | 2 | 3 | |||||||||||||||
| Total recoveries |
159 | 95 | 26 | 54 | 53 | |||||||||||||||
| Net charge-offs |
(1,478 | ) | (2,068 | ) | (1,310 | ) | (929 | ) | (133 | ) | ||||||||||
| Provision for loan losses |
2,285 | 2,998 | 1,846 | 1,425 | 969 | |||||||||||||||
| Balance at end of period |
$ | 9,987 | $ | 9,180 | $ | 8,250 | $ | 7,714 | $ | 7,218 | ||||||||||
| Ratios: |
||||||||||||||||||||
| Net charge-offs to average loans outstanding |
0.13% | 0.23% | 0.15% | 0.12% | 0.02% | |||||||||||||||
| Allowance for loan losses to non-performing loans at end of period |
105.86% (1) | 56.36% (1) | 171.98% | 432.16% | 560.40% | |||||||||||||||
| Allowance for loan losses to total loans at end of period |
0.93% (2) | 0.82% (2) | 0.95% | 0.94% | 0.95% | |||||||||||||||
(1) Exclusive of the $163,000 and $3.3 million in non-performing acquired loans at December 2010 and 2009, respectively, allowance for loan losses as a percent of non-performing loans would have been 107.72% and 70.44%, respectively.
(2) Exclusive of the $209.8 million and $242.9 million in acquired loans and $21.4 million and $22.7 million in loans purchased from other financial institutions, allowance for loan losses as a percent of total loans would have been 1.18% and 1.07% for the years ended December 2010 and 2009, respectively.
19
Table of Contents
Allocation of Allowance for Loan Losses. The following table sets forth the allowance for loan losses allocated by loan category, the total loan balances by category, and the percent of loans in each category to total loans at the dates indicated. The allowance for loan losses allocated to each category is not necessarily indicative of future losses in any particular category and does not restrict the use of the allowance to absorb losses in other categories.
| At December 31, | ||||||||||||||||||||||||||||||||||||
| 2010 | 2009 | 2008 | ||||||||||||||||||||||||||||||||||
| Amount | Percent
of Allowance to Total Allowance |
Percent of Loans in Category to Total Loans |
Amount | Percent
of Allowance to Total Allowance |
Percent of Loans in Category to Total Loans |
Amount | Percent
of Allowance to Total Allowance |
Percent of Loans in Category to Total Loans |
||||||||||||||||||||||||||||
| (Dollars in thousands) | ||||||||||||||||||||||||||||||||||||
| At end of period allocated to: |
||||||||||||||||||||||||||||||||||||
| Residential mortgages |
$ | 740 | 7.41% | 27.53% | $ | 802 | 8.74% | 30.59% | $ | 891 | 10.80% | 40.95% | ||||||||||||||||||||||||
| Commercial mortgages |
5,000 | 50.07% | 39.85% | 4,300 | 46.84% | 36.51% | 3,506 | 42.50% | 28.55% | |||||||||||||||||||||||||||
| Construction |
668 | 6.69% | 2.57% | 1,194 | 13.01% | 4.35% | 1,089 | 13.20% | 3.69% | |||||||||||||||||||||||||||
| Home equity |
623 | 6.24% | 12.87% | 621 | 6.76% | 12.24% | 604 | 7.32% | 13.87% | |||||||||||||||||||||||||||
| Commercial and industrial |
2,801 | 28.05% | 15.39% | 2,051 | 22.34% | 14.21% | 1,911 | 23.16% | 9.76% | |||||||||||||||||||||||||||
| Automobile |
90 | 0.90% | 1.03% | 110 | 1.20% | 1.31% | 156 | 1.89% | 1.99% | |||||||||||||||||||||||||||
| Other consumer |
65 | 0.64% | 0.76% | 102 | 1.11% | 0.79% | 93 | 1.13% | 1.19% | |||||||||||||||||||||||||||
| Total allowance |
$ | 9,987 | 100.00% | 100.00% | $ | 9,180 | 100.00% | 100.00% | $ | 8,250 | 100.00% | 100.00% | ||||||||||||||||||||||||
| At December 31, | ||||||||||||||||||||||||
| 2007 | 2006 | |||||||||||||||||||||||
| Amount | Percent of Allowance to Total Allowance |
Percent of Loans in Category to Total Loans |
Amount | Percent of Allowance to Total Allowance |
Percent of Loans in Category to Total Loans |
|||||||||||||||||||
| (Dollars in thousands) | ||||||||||||||||||||||||
| At end of period allocated to: |
||||||||||||||||||||||||
| Residential mortgages |
$ | 849 | 11.00% | 41.16% | $ | 957 | 13.26% | 41.87% | ||||||||||||||||
| Commercial mortgages |
3,164 | 41.02% | 26.04% | 2,588 | 35.85% | 23.04% | ||||||||||||||||||
| Construction |
1,229 | 15.93% | 5.10% | 1,255 | 17.39% | 7.19% | ||||||||||||||||||
| Home equity |
523 | 6.78% | 14.10% | 512 | 7.09% | 14.79% | ||||||||||||||||||
| Commercial and industrial |
1,667 | 21.61% | 9.89% | 1,633 | 22.62% | 9.15% | ||||||||||||||||||
| Automobile |
202 | 2.62% | 2.72% | 220 | 3.05% | 3.21% | ||||||||||||||||||
| Other consumer |
80 | 1.04% | 0.99% | 53 | 0.73% | 0.75% | ||||||||||||||||||
| Total allowance |
$ | 7,714 | 100.00% | 100.00% | $ | 7,218 | 100.00% | 100.00% | ||||||||||||||||
20
Table of Contents
Investments
The investment policy is reviewed annually by management and any changes to the policy are recommended to and subject to the approval of the Board of Directors. Authority to make investments under the approved investment policy guidelines is delegated to appropriate officers. While general investment strategies are developed and authorized by the Board of Directors, the execution of specific actions primarily rests with United Bank’s Chief Financial Officer. He is both responsible for ensuring that the guidelines and requirements included in the investment policy are followed and that all securities are considered prudent for investment. He and United Bank’s Treasurer or his/her designee, under his/her direction is authorized to execute investment transactions (purchases and sales) up to $10 million per transaction without prior approval and within the scope of the established investment policy. All investment transactions are reviewed and ratified or approved (as the case may be) at regularly scheduled meetings of the Board of Directors. Any investment that, subsequent to its purchase, fails to meet the guidelines of the policy is reported to the Board of Directors at its next meeting where the Board decides whether to hold or sell the investment.
The Company’s Board of Directors has adopted an investment policy that is substantially identical to the Bank’s policy. Any references herein to the “Bank” also apply to the Company.
Federally chartered savings banks have authority to invest in various types of assets, including U.S. Treasury obligations, securities of various federal agencies, mortgage-backed securities, certain certificates of deposit of insured financial institutions, overnight and short-term loans to other banks, corporate debt instruments, and Fannie Mae and Freddie Mac equity securities. United Financial Bancorp, Inc., as a savings and loan holding company, may invest in equity securities subject to certain limitations.
The investment policy requires that all securities transactions be conducted in a safe and sound manner. Investment decisions must be based upon a thorough analysis of each security instrument to determine its quality and inherent risks, fit within United Bank’s overall asset/liability management objectives, effect on its risk-based capital measurement and prospects for yield and/or appreciation. The investment policy provides that United Bank may invest in U.S. Treasury obligations, U.S. and state agency securities, mortgage-backed securities, corporate debt securities, commercial paper and other conservative investment opportunities.
Securities can be classified as held-to-maturity or available-for-sale at the date of purchase.
Mortgage-Backed Securities. We purchase mortgage-backed securities insured or guaranteed by Fannie Mae, Freddie Mac or Government National Mortgage Association (“Ginnie Mae”). We invest in mortgage-backed securities to achieve positive interest rate spreads with minimal administrative expense, and to lower our credit risk as a result of the guarantees provided by Freddie Mac, Fannie Mae or Ginnie Mae. Our investment policy also authorizes the investment in collateralized mortgage obligations (“CMOs”), also insured or issued by Freddie Mac, Fannie Mae and Ginnie Mae.
Mortgage-backed securities are created by the pooling of mortgages and the issuance of a security with an interest rate that is slightly less than the interest rate on the underlying mortgages. Mortgage-backed securities typically represent a participation interest in a pool of single-family or multi-family mortgages, although we focus our investments on mortgage-backed securities backed by one- to four-family mortgages. The issuers of such securities (generally U.S. government agencies and government sponsored enterprises, including Fannie Mae, Freddie Mac and Ginnie Mae) pool and resell the participation interests in the form of securities to investors such as us, and guarantee the payment of principal and interest to investors. Mortgage-backed securities generally yield less than the loans that underlie such securities because of the cost of payment guarantees and credit enhancements. However, mortgage-backed securities are usually more liquid than individual mortgage loans and may be used to collateralize our specific liabilities and obligations.
21
Table of Contents
At December 31, 2010, our mortgage-backed securities totaled $289.6 million, or 18.3% of total assets and 19.6% of interest earning assets. Our mortgage-backed securities at December 31, 2010 were classified as both available-for-sale and held-to-maturity. At December 31, 2010, 11.4% of the mortgage-backed securities were backed by adjustable-rate mortgage loans and 88.6% were backed by fixed-rate mortgage loans. The mortgage-backed securities portfolio had a weighted average yield of 3.94% at December 31, 2010. The estimated fair value of our mortgage-backed securities at December 31, 2010 was $289.4 million, which was $8.6 million more than the amortized cost of $280.8 million. Private issue CMOs are included in our mortgage-backed securities portfolio as a result of the acquisition of CNB Financial. At December 31, 2010, private issue CMOs had an estimated fair value of $3.6 million and an amortized cost of $3.5 million, represented 1.2% of total mortgage-backed securities and had a weighted average yield of 6.06%. Investments in mortgage-backed securities involve a risk that actual prepayments may differ from estimated prepayments over the life of the security, which may require adjustments to the amortization of any premium or accretion of any discount relating to such instruments thereby changing the net yield on such securities. There is also reinvestment risk associated with the cash flows from such securities or if such securities are redeemed by the issuer. In addition, the market value of such securities may be adversely affected by changes in interest rates.
Government-Sponsored Enterprises. At December 31, 2010, our U.S. Government-Sponsored Enterprises securities portfolio totaled $12.5 million, all of which was classified as available-for-sale. While these securities generally provide lower yields than other investments in our securities investment portfolio, we maintain these investments, to the extent appropriate, for liquidity purposes, as collateral for borrowings and for prepayment protection.
Corporate Bonds. At December 31, 2010, our corporate bond portfolio totaled $1.6 million, all of which was classified as available-for-sale, consisting of trust preferred securities issued by financial services companies. Although corporate bonds may offer higher yields than U.S. Treasury or agency securities of comparable duration, corporate bonds also have a higher risk of default due to possible adverse changes in the credit worthiness of the issuer. In order to mitigate this risk, our investment policy requires that at the time of purchase corporate debt obligations be rated in one of the four highest categories by a nationally recognized rating service. We may invest up to 5% of consolidated assets in corporate debt obligations and up to $1.0 million in any one issuer.
Municipal Obligations and Industrial Revenue Bonds. Municipal obligations are securities issued by states, counties and municipalities or their agencies. The industrial revenue bonds in our portfolio are issued by the Massachusetts Health and Educational Facilities Authority, an independent public authority created by Massachusetts to assist nonprofit organizations to borrow funds through tax-exempt bond issuances. Our investment policy requires that the municipal obligations be rated at the time of purchase within the first four rating categories by Standard & Poor’s or Moody’s. At December 31, 2010, our municipal obligations portfolio consisted of both available-for-sale and held-to-maturity securities.
22
Table of Contents
Investment Securities Portfolio. The following table sets forth the amortized cost and fair value of our securities portfolio at the dates indicated.
| At December 31, | ||||||||||||||||||||||||
| 2010 | 2009 | 2008 | ||||||||||||||||||||||
| Amortized Cost |
Fair Value | Amortized Cost |
Fair Value | Amortized Cost |
Fair Value | |||||||||||||||||||
| (In thousands) | ||||||||||||||||||||||||
| Investment securities |
||||||||||||||||||||||||
| Available-for-sale: |
||||||||||||||||||||||||
| Government-sponsored enterprises |
$ | 12,747 | $ | 12,502 | $ | 342 | $ | 353 | $ | 467 | $ | 465 | ||||||||||||
| Government-sponsored and government-guaranteed mortgage- backed securities |
172,003 | 180,766 | 215,819 | 224,836 | 294,824 | 301,111 | ||||||||||||||||||
| Private label mortgage-backed securities |
3,076 | 3,170 | 4,999 | 5,036 | - | - | ||||||||||||||||||
| Corporate debt obligations |
1,450 | 1,619 | 1,449 | 1,712 | 1,538 | 1,538 | ||||||||||||||||||
| Municipal bonds |
7,760 | 7,795 | 11,004 | 10,933 | 10,504 | 10,392 | ||||||||||||||||||
| Marketable equity securities |
- | - | 97 | 434 | - | - | ||||||||||||||||||
| Total available-for-sale |
$ | 197,036 | $ | 205,852 | $ | 233,710 | $ | 243,304 | $ | 307,333 | $ | 313,506 | ||||||||||||
| Held-to-maturity: |
||||||||||||||||||||||||
| Government-sponsored and government-guaranteed mortgage- backed securities |
$ | 105,312 | $ | 105,045 | $ | 53,769 | $ | 53,531 | $ | - | $ | - | ||||||||||||
| Private label mortgage-backed securities |
388 | 389 | 737 | 750 | - | - | ||||||||||||||||||
| Industrial revenue bonds |
19,050 | 19,050 | 1,039 | 1,039 | 1,122 | 1,122 | ||||||||||||||||||
| State of Israel bonds |
150 | 150 | 150 | 150 | - | - | ||||||||||||||||||
| Municipal bonds |
7,575 | 7,392 | 7,479 | 7,593 | 2,069 | 2,116 | ||||||||||||||||||
| Total held-to-maturity |
$ | 132,475 | $ | 132,026 | $ | 63,174 | $ | 63,063 | $ | 3,191 | $ | 3,238 | ||||||||||||
At December 31, 2010, the Company did not own any securities, other than government-sponsored and government-guaranteed mortgage-backed securities, that had an aggregate book value in excess of 10% of our total capital at that date.
23
Table of Contents
Portfolio Maturities and Yields. The composition and maturities of the investment securities portfolio at December 31, 2010 are summarized in the following table. Maturities are based on the final contractual payment dates, and do not reflect the impact of prepayments or early redemptions that may occur. Equity securities do not have contractual maturities and are excluded from this table. Weighted average yields are presented on a tax-equivalent basis.
| One Year or Less | More than One Year through Five Years |
More than Five
Years through Ten Years |
More than Ten Years | Total Securities | ||||||||||||||||||||||||||||||||||||||||
| Amortized Cost |
Weighted Average Yield |
Amortized Cost |
Weighted Average Yield |
Amortized Cost |
Weighted Average Yield |
Amortized Cost |
Weighted Average Yield |
Amortized Cost |
Weighted Average Yield |
Fair Value | ||||||||||||||||||||||||||||||||||
| (Dollars in thousands) | ||||||||||||||||||||||||||||||||||||||||||||
| Investment securities |
||||||||||||||||||||||||||||||||||||||||||||
| Available-for-sale: |
||||||||||||||||||||||||||||||||||||||||||||
| Government-sponsored enterprises |
$ | - | 0.00% | $ | 2,747 | 2.47% | $ | 10,000 | 2.37% | $ | - | 0.00% | $ | 12,747 | 2.39% | $ | 12,502 | |||||||||||||||||||||||||||
| Government-sponsored and government-guaranteed mortgage- backed securities |
103 | 3.71% | 4,591 | 4.25% | 15,137 | 4.47% | 152,172 | 4.59% | 172,003 | 4.57% | 180,766 | |||||||||||||||||||||||||||||||||
| Private label mortgage-backed securities |
- | 0.00% | - | 0.00% | 2,458 | 5.84% | 618 | 7.59% | 3,076 | 6.19% | 3,170 | |||||||||||||||||||||||||||||||||
| Corporate debt obligations |
- | 0.00% | - | 0.00% | - | 0.00% | 1,450 | 5.05% | 1,450 | 5.05% | 1,619 | |||||||||||||||||||||||||||||||||
| Municipal bonds |
- | 0.00% | - | 0.00% | 4,093 | 3.70% | 3,667 | 4.16% | 7,760 | 3.92% | 7,795 | |||||||||||||||||||||||||||||||||
| Total available-for-sale |
$ | 103 | 3.71% | $ | 7,338 | 3.58% | $ | 31,688 | 3.81% | $ | 157,907 | 4.60% | $ | 197,036 | 4.43% | $ | 205,852 | |||||||||||||||||||||||||||
| Held-to-maturity: |
||||||||||||||||||||||||||||||||||||||||||||
| Government-sponsored and government-guaranteed mortgage- backed securities |
$ | - | 0.00% | $ | - | 0.00% | $ | 19,663 | 2.66% | $ | 85,649 | 2.81% | $ | 105,312 | 2.78% | $ | 105,045 | |||||||||||||||||||||||||||
| Private label mortgage-backed securities |
- | 0.00% | - | 0.00% | 388 | 5.00% | - | 0.00% | 388 | 5.00% | 389 | |||||||||||||||||||||||||||||||||
| Industrial revenue bonds |
- | 0.00% | - | 0.00% | - | 0.00% | 19,050 | 4.27% | 19,050 | 4.27% | 19,050 | |||||||||||||||||||||||||||||||||
| State of Israel bonds |
- | 0.00% | 150 | 3.10% | - | 0.00% | - | 0.00% | 150 | 3.10% | 150 | |||||||||||||||||||||||||||||||||
| Municipal bonds |
130 | 3.04% | 870 | 3.66% | 1,277 | 3.63% | 5,298 | 4.06% | 7,575 | 3.92% | 7,392 | |||||||||||||||||||||||||||||||||
| Total held-to-maturity |
$ | 130 | 3.04% | $ | 1,020 | 3.58% | $ | 21,328 | 2.76% | $ | 109,997 | 3.12% | $ | 132,475 | 3.07% | $ | 132,026 | |||||||||||||||||||||||||||
24
Table of Contents
Sources of Funds
General. Deposits have traditionally been our primary source of funds for lending and investment activities. We also use borrowings, primarily Federal Home Loan Bank advances, to supplement cash flow needs, to lengthen the maturities of liabilities for interest rate risk management purposes and to manage the cost of funds. Other sources of funds are scheduled loan payments, investment maturities, loan prepayments, retained earnings and income on other earning assets. While scheduled loan payments and income on earning assets are relatively stable sources of funds, deposit inflows and outflows can vary widely and are influenced by prevailing interest rates, market conditions and levels of competition.
Deposits. Our deposits are generated primarily from residents and businesses within our primary market area. We offer a selection of deposit accounts, including demand accounts, NOW accounts, money market accounts, savings accounts, retirement accounts and certificates of deposit. Deposit account terms vary, with the principal differences being the minimum balance required, the amount of time the funds must remain on deposit and the interest rate. We currently do not accept brokered deposits, although we have the authority to do so.
Interest rates paid, maturity terms, service fees and withdrawal penalties are established on a periodic basis. Deposit rates and terms are based primarily on current operating strategies and market rates, liquidity requirements, rates paid by competitors and growth goals. We rely on personalized customer service, long-standing relationships with customers and an active marketing program to attract and retain deposits.
The flow of deposits is influenced significantly by general economic conditions, changes in money market and other prevailing interest rates, and competition. The variety of deposit accounts offered allows us to be competitive in obtaining funds and responding to changes in consumer demand. Based on experience, we believe that our deposits are relatively stable. However, the ability to attract and maintain deposits, and the rates paid on these deposits, have been and will continue to be significantly affected by market conditions. At December 31, 2010, $462.5 million, or 40.5% of our deposit accounts, were certificates of deposit, of which $282.8 million had maturities of one year or less.
The following table sets forth the distribution of total deposits by account type, at the dates indicated.
| At December 31, | ||||||||||||||||||||||||||||||||||||
| 2010 | 2009 | 2008 | ||||||||||||||||||||||||||||||||||
| Balance (1) | Percent | Weighted Average Rate |
Balance (1) | Percent | Weighted Average Rate |
Balance | Percent | Weighted Average Rate |
||||||||||||||||||||||||||||
| (Dollars in thousands) | ||||||||||||||||||||||||||||||||||||
| Deposit type: |
||||||||||||||||||||||||||||||||||||
| Demand |
$ | 175,996 | 15.40% | - % | $ | 154,374 | 14.87% | - % | $ | 114,178 | 14.59% | - % | ||||||||||||||||||||||||
| NOW |
40,922 | 3.58% | 0.48% | 42,262 | 4.07% | 0.41% | 32,390 | 4.14% | 0.50% | |||||||||||||||||||||||||||
| Regular savings |
203,165 | 17.77% | 0.80% | 174,270 | 16.79% | 0.84% | 99,492 | 12.71% | 1.04% | |||||||||||||||||||||||||||
| Money market |
260,573 | 22.79% | 0.88% | 189,763 | 18.28% | 0.89% | 160,736 | 20.54% | 1.69% | |||||||||||||||||||||||||||
| Certificates of deposit |
462,530 | 40.46% | 2.16% | 477,534 | 46.00% | 2.28% | 375,867 | 48.02% | 3.34% | |||||||||||||||||||||||||||
| Total deposits |
$ | 1,143,186 | 100.00% | 1.23% | $ | 1,038,203 | 100.00% | 1.37% | $ | 782,663 | 100.00% | 2.10% | ||||||||||||||||||||||||
(1) Excludes the fair value adjustment balance of $115,000 and $724,000 recorded in connection with the acquisition of CNB Financial at December 2010 and 2009, respectively.
25
Table of Contents
As of December 31, 2010, the aggregate amount of outstanding certificates of deposit in amounts greater than or equal to $100,000 was approximately $242.0 million. The following table sets forth the maturity of those certificates as of December 31, 2010, in thousands.
| Three months or less |
$ | 53,828 | ||
| Over three months through six months |
43,126 | |||
| Over six months through one year |
42,251 | |||
| Over one year to three years |
71,235 | |||
| Over three years |
31,570 | |||
| Total |
$ | 242,010 | ||
Borrowings. Our borrowings consist of advances from the Federal Home Loan Bank of Boston, collateralized repurchase agreements with our customers and other financial institutions and subordinated debentures. As of December 31, 2010, we had Federal Home Loan Bank advances of $151.3 million, or 11.1% of total liabilities, with a weighted average maturity of 2.7 years and a weighted average rate of 3.96%. As a member of the Federal Home Loan Bank of Boston, we can currently borrow up to approximately $373.2 million from the Federal Home Loan Bank.
The following table summarizes information concerning balances and interest rates on our Federal Home Loan Bank advances at and for the periods indicated:
| For the Years Ended December 31, | ||||||||||||
| 2010 | 2009 | 2008 | ||||||||||
| (In thousands) | ||||||||||||
| Balance at end of period |
$ | 151,282 | (1) | $ | 205,552 | (2) | $ | 208,564 | ||||
| Average amount outstanding during year |
165,224 | (1) | 171,058 | (2) | 178,699 | |||||||
| Interest expense incurred during year |
6,360 | (1) | 6,662 | 6,739 | ||||||||
| Maximum amount outstanding at any month-end |
214,626 | (1) | 205,552 | (2) | 228,214 | |||||||
| Average interest rate during the year |
3.85 | % | 3.89 | % | 3.77% | |||||||
| Weighted average interest rate on end of period balances |
3.96 | % | 3.47 | % | 3.32% | |||||||
(1) Excludes the fair value adjustment balance of $2.0 million, an average balance of $2.3 million and interest expense of $595,000 for December 31, 2010, recorded in connection with the acquisition of CNB Financial.
(2) Excludes the fair value adjustment balance of $2.6 million and an average balance of $243,000 at December 31, 2009, recorded in connection with the acquisition of CNB Financial.
Securities sold under agreements to repurchase include funds borrowed from customers on an overnight basis. At December 31, 2010, the Company had $21.0 million of repurchase agreements outstanding with its customers at a weighted average rate of 0.84%. The following table summarizes our customer repurchase agreements at and for the periods shown:
| For the Years Ended December 31, | ||||||||||||
| 2010 | 2009 | 2008 | ||||||||||
| (In thousands) | ||||||||||||
| Balance at end of period |
$ | 21,029 | $ | 27,303 | $ | 18,042 | ||||||
| Average amount outstanding during year |
19,240 | 10,559 | 8,534 | |||||||||
| Interest expense incurred during year |
185 | 126 | 158 | |||||||||
| Maximum amount outstanding at any month-end |
23,033 | 27,303 | 18,042 | |||||||||
| Average interest rate during the year |
0.96% | 1.19% | 1.85% | |||||||||
| Weighted average interest rate on end of period balances |
0.84% | 1.12% | 1.60% | |||||||||
26
Table of Contents
In addition, the Company had a total of $20.0 million in structured term repurchase agreements secured through another financial institution. The Company entered into a $10.0 million repurchase agreement in 2009 due to mature in 2019, is callable in 2014 and has a rate of 2.44%. The Company had previously entered into a $10.0 million repurchase agreement in 2008 due to mature in 2018, is callable in 2011 and has a rate of 2.73%. All of the repurchase agreements are secured by mortgage-backed securities issued by government sponsored enterprises.
The Company has outstanding subordinated debt in the form of trust preferred securities issued through a private placement offering in the amount of $7.7 million. The issue has a maturity date of March 15, 2036 and bears a floating rate of interest that reprices quarterly at the 3-month LIBOR rate plus 1.85%. The interest rate at December 31, 2010 was 2.15%. A special redemption provision allows the issue to be callable at 103.525% of par for the first year and thereafter on a sliding scale down to 100% of par upon the fifth year and thereafter.
Subsidiary Activities
UCB Securities, Inc. is a wholly owned subsidiary of United Bank and was established in 1998 as a Massachusetts security corporation for the purpose of buying, selling and holding investment securities. The income earned on UCB Securities, Inc.’s investment securities is subject to a significantly lower rate of state tax than that assessed on income earned on investment securities maintained at United Bank. At December 31, 2010, UCB Securities, Inc. had total assets of $156.7 million, all of which were qualifying securities under the applicable regulations.
UCB Securities, Inc. II is a wholly owned subsidiary of United Bank and was established in 2010 as a Massachusetts security corporation for the purpose of buying, selling and holding investment securities. The income earned on UCB Securities, Inc. II’s investment securities is subject to a significantly lower rate of state tax than that assessed on income earned on investment securities maintained at United Bank. At December 31, 2010, UCB Securities, Inc. had total assets of $34.8 million, all of which were qualifying securities under the applicable regulations.
UB Properties, LLC is a subsidiary of the Bank formed to hold real estate assets acquired through foreclosure. At December 31, 2010, UB Properties, LLC had total assets of $1.4 million.
United Wealth Management
United Bank, through its division, United Wealth Management, has a partnership with a registered broker-dealer, NFP Securities, Inc. In 2006, United Bank acquired Levine Financial Group in an effort to expand its customer base with increased opportunities to grow our market share and expand the financial services portion of business in the Northampton market. Together they offer United Bank customers a complete range of non-deposit investment products and financial planning services, including mutual funds, debt, equity and government securities, insurance products, fixed and variable annuities, financial planning for individual and commercial customers and estate planning services. United Bank receives a portion of the commissions generated by United Wealth Management from sales to customers.
Expense and Tax Allocation Agreements
United Bank has entered into an agreement with United Financial Bancorp, Inc. that generally provides that United Financial Bancorp will pay to United Bank, on a quarterly basis, fees for its use of United Bank’s premises, furniture, equipment and employees in an amount to be determined by the board of directors of United Financial Bancorp and United Bank. Such fees shall not be less than the fair market value received for such goods or services. In addition, United Financial Bancorp and United Bank entered into a tax allocation agreement as a result of their status as members of an affiliated group under the Internal Revenue Code. The tax allocation agreement generally provides that United Financial will file consolidated federal tax income returns with
27
Table of Contents
United Bank and its subsidiaries. The tax allocation agreement also formalizes procedures for allocating the consolidated tax liability of the group among its members and establishes procedures for the future payments by United Bank to United Financial Bancorp for tax liabilities attributable to United Bank and its subsidiaries. The financial information and discussion contained in this prospectus primarily relates to the activities of United Bank.
United Charitable Foundation
We established the United Charitable Foundation in 2005 in connection with our minority stock offering. At December 31, 2010, the foundation owned 358,156 shares of our common stock, or 2.2% of the shares outstanding. To maintain favorable tax status, the foundation must make annual grants equal to 5% of its assets, and grants are made to community activities and charitable causes in the communities in which we operate. Six of the foundation’s seven directors are directors of United Bank. All shares of common stock owned by the foundation must be voted in the same proportion as all other shares of our common stock are voted on any matter to come before the stockholders.
Personnel
As of December 31, 2010, we had 263 full-time employees and 28 part-time employees. Our employees are not represented by any collective bargaining group. Management believes that we have good relations with our employees.
SUPERVISION AND REGULATION
General
United Bank is examined and supervised by the Office of Thrift Supervision (“OTS”) and is also subject to examination by the Federal Deposit Insurance Corporation. This regulation and supervision establishes a comprehensive framework of activities in which an institution may engage and is intended primarily for the protection of the Federal Deposit Insurance Corporation’s deposit insurance funds and depositors. Under this system of federal regulation, financial institutions are periodically examined to ensure that they satisfy applicable standards with respect to their capital adequacy, assets, management, earnings, liquidity and sensitivity to market interest rates. Following completion of its examination, the federal agency critiques the institution’s operations and assigns its rating (known as an institution’s CAMELS rating). Under federal law, an institution may not disclose its CAMELS rating to the public. United Bank also is a member of and owns stock in the Federal Home Loan Bank of Boston, which is one of the twelve regional banks in the Federal Home Loan Bank System. United Bank also is regulated to a lesser extent by the Board of Governors of the Federal Reserve System, governing reserves to be maintained against deposits and other matters. The Office of Thrift Supervision examines United Bank and prepares reports for the consideration of its Board of Directors on any operating deficiencies. United Bank’s relationship with its depositors and borrowers also is regulated to a great extent by federal law and, to a much lesser extent, state law, especially in matters concerning the ownership of deposit accounts and the form and content of United Bank’s mortgage documents.
The Dodd-Frank Wall Street Reform and Consumer Protection act (the “Dodd-Frank Act”), signed by the President on July 21, 2010, provides for the regulation and supervision of federal savings institutions like United Bank to be transferred from the OTS to the Comptroller of the Currency (the “OCC”), the agency that regulates national banks. The Office of the Comptroller of the Currency will assume primary responsibility for examining United Bank and implementing and enforcing many of the laws and regulations applicable to federal savings banks. The transfer will occur over a transition period of up to one year, subject to a possible six month extension. At the same time, the responsibility for supervising and regulating savings and loan holding companies will be transferred to the Federal Reserve Board. The Dodd-Frank Act also provides for the creation of a new agency, the Consumer Financial Protection Bureau, as an independent bureau of the Federal Reserve
28
Table of Contents
Board, to take over the implementation of federal consumer financial protection and fair lending laws from the depository institution regulators. However, institutions of $10 billion or fewer in assets will continue to be examined for compliance with such laws and regulations by, and subject to the enforcement authority of, the prudential regulator rather than the Consumer Financial Protection Bureau.
Certain of the regulatory requirements that are or will be applicable to United Bank and United Financial Bancorp, Inc., are described below. This description of statutes and regulations is not intended to be a complete explanation of such statutes and regulations and their effects on United Bank and United Financial Bancorp, Inc. and is qualified in its entirety by reference to the actual statutes and regulations. Any change in these laws or regulations, whether by the Federal Deposit Insurance Corporation, the Office of Thrift Supervision or Congress, could have a material adverse impact on United Financial Bancorp and United Bank and their operations.
Federal Banking Regulation
Business Activities. A federal savings bank derives its lending and investment powers from the Home Owners’ Loan Act, as amended, and the regulations of the Office of Thrift Supervision. Under these laws and regulations, United Bank may invest in mortgage loans secured by residential real estate without limitations as a percentage of assets and non-residential real estate loans which may not in the aggregate exceed 400% of capital, commercial business loans up to 20% of assets in the aggregate and consumer loans up to 35% of assets in the aggregate, certain types of debt securities and certain other assets. United Bank also may establish subsidiaries that may engage in activities not otherwise permissible for United Bank, including real estate investment and securities and insurance brokerage.
The Dodd-Frank Act authorizes depository institutions to pay interest on business demand deposits effective July 31, 2011. Depending upon competitive responses, that change could have an adverse impact on United Bank’s interest exposure.
Capital Requirements. Office of Thrift Supervision capital regulations require savings associations to meet three minimum capital standards: a 1.5% tangible capital to total assets ratio; a 4% tier 1 capital to assets leverage ratio (3% for institutions receiving the highest rating on the CAMELS financial institution examination rating system); and an 8% risk-based capital ratio. In addition, the prompt corrective action standards discussed below also establish, in effect, a minimum 2% tangible capital standard, a 4% leverage ratio (3% for institutions receiving the highest examination rating) and, together with the risk-based capital standard itself, a 4% Tier 1 risk-based capital standard. The Office of Thrift Supervision regulations also require that, in meeting the tangible, leverage and risk-based capital standards, institutions must generally deduct investments in and loans to subsidiaries engaged in activities as principal that are not permissible for a national bank.
The risk-based capital standard for savings associations requires the maintenance of Tier 1 (core) and total capital (which is defined as core capital and supplementary capital, less certain specified deductions from total capital such as reciprocal holdings of depository institution capital instruments and equity investments) to risk-weighted assets of at least 4% and 8%, respectively. In determining the amount of risk-weighted assets, all assets, including certain off-balance sheet activities, recourse obligations, residual interests and direct credit substitutes, are multiplied by a risk-weight factor of 0% to 100%, assigned by the Office of Thrift Supervision capital regulation based on the risks believed inherent in the type of asset. Core (Tier 1) capital is generally defined as common stockholders’ equity (including retained earnings), certain non-cumulative perpetual preferred stock and related surplus and minority interests in equity accounts of consolidated subsidiaries less intangibles other than certain mortgage servicing rights and credit card relationships. The components of supplementary capital (Tier 2 capital) include cumulative preferred stock, long-term perpetual preferred stock, mandatory convertible securities, subordinated debt and intermediate preferred stock, the allowance for loan and lease losses limited to a maximum of 1.25% of risk-weighted assets, and up to 45% of unrealized gains on available-for-sale equity securities with readily determinable fair market values. Overall, the amount of supplementary capital included as part of total capital cannot exceed 100% of core capital.
29
Table of Contents
The Office of Thrift Supervision also has authority to establish individual minimum capital requirements in appropriate cases upon a determination that an institution’s capital level is or may become inadequate in light of the particular circumstances. Additionally, a savings bank that retains credit risk in connection with an asset sale may be required to maintain additional regulatory capital because of the recourse back to the savings bank.
In assessing an institution’s capital adequacy, the Office of Thrift Supervision takes into consideration not only these numeric factors but also qualitative factors as well, and has the authority to establish higher capital requirements for individual savings banks where necessary.
At December 31, 2010, United Bank’s capital exceeded all applicable requirements.
Loans-to-One Borrower. Generally, a federal savings bank may not make a loan or extend credit to a single or related group of borrowers in excess of 15% of unimpaired capital and surplus. An additional amount may be loaned, equal to 10% of unimpaired capital and surplus, if the loan is secured by readily marketable collateral, which generally does not include real estate. As of December 31, 2010, United Bank was in compliance with the loans-to-one borrower limitations.
Qualified Thrift Lender Test. As a federal savings bank, United Bank must satisfy the qualified thrift lender, or “QTL,” test. Under the QTL test, United Bank must maintain at least 65% of its “portfolio assets” in “qualified thrift investments” in at least nine months of the most recent 12 months. “Portfolio assets” generally means total assets of a savings institution, less the sum of specified liquid assets up to 20% of total assets, goodwill and other intangible assets, and the value of property used in the conduct of the savings bank’s business.
“Qualified thrift investments” include various types of loans made for residential and housing purposes, investments related to such purposes, including certain mortgage-backed and related securities, and loans for personal, family, household and certain other purposes up to a limit of 20% of portfolio assets. “Qualified thrift investments” also include 100% of an institution’s credit card loans, education loans and small business loans. United Bank also may satisfy the QTL test by qualifying as a “domestic building and loan association” as defined in the Internal Revenue Code.
A savings bank that fails the qualified thrift lender test must either convert to a bank charter or operate under specified restrictions. The Dodd-Frank Act also makes noncompliance with the QTL test subject to agency enforcement action for a violation of law. At December 31, 2010, United Bank satisfied this test.
Capital Distributions. Office of Thrift Supervision regulations govern capital distributions by a federal savings bank, which include cash dividends, stock repurchases and other transactions charged to the capital account. Savings banks must file an application for approval of a capital distribution if:
| • | the total capital distributions for the applicable calendar year exceed the sum of the savings bank’s net income for that year to date plus the savings bank’s retained net income for the preceding two years; |
| • | the savings bank would not be at least adequately capitalized following the distribution; |
| • | the distribution would violate any applicable statute, regulation, agreement or Office of Thrift Supervision-imposed condition; or |
| • | the savings bank is not eligible for expedited treatment of its filings. |
Even if an application is not otherwise required, every savings bank that is a subsidiary of a holding company must still file a notice with the Office of Thrift Supervision at least 30 days before the Board of Directors declares a dividend or approves a capital distribution.
30
Table of Contents
The Office of Thrift Supervision may disapprove a notice or application if:
| • | the association would be undercapitalized following the distribution; |
| • | the proposed capital distribution raises safety and soundness concerns; or |
| • | the capital distribution would violate a prohibition contained in any statute, regulation or agreement. |
In addition, the Federal Deposit Insurance Act provides that an insured depository institution may not make any capital distribution, if after making such distribution the institution would be undercapitalized.
Liquidity. A federal savings bank is required to maintain a sufficient amount of liquid assets to ensure its safe and sound operation.
Community Reinvestment Act and Fair Lending Laws. All savings banks have a responsibility under the Community Reinvestment Act and related regulations of the Office of Thrift Supervision to help meet the credit needs of their communities, including low- and moderate-income neighborhoods. In connection with its examination of a federal savings bank, the Office of Thrift Supervision is required to assess the savings bank’s record of compliance with the Community Reinvestment Act. In addition, the Equal Credit Opportunity Act and the Fair Housing Act prohibit lenders from discriminating in their lending practices on the basis of characteristics specified in those statutes. A savings bank’s failure to comply with the provisions of the Community Reinvestment Act could, at a minimum, result in denial of certain corporate applications such as branches or mergers, or in restrictions on its activities. The failure to comply with the Equal Credit Opportunity Act and the Fair Housing Act could result in enforcement actions by the Office of Thrift Supervision, as well as other federal regulatory agencies and the Department of Justice. United Bank received a “satisfactory” Community Reinvestment Act rating in its most recent federal examination.
Transactions with Related Parties. A federal savings bank’s authority to engage in transactions with its affiliates is limited by Office of Thrift Supervision regulations and by Sections 23A and 23B of the Federal Reserve Act and its implementing Regulation W. An affiliate is a company that controls, is controlled by, or is under common control with an insured depository institution such as United Bank. The Company is an affiliate of United Bank. In general, loan transactions between an insured depository institution and its affiliate are subject to certain quantitative and collateral requirements. In this regard, transactions between an insured depository institution and its affiliate are limited to 10% of the institution’s unimpaired capital and unimpaired surplus for transactions with any one affiliate and 20% of unimpaired capital and unimpaired surplus for transactions in the aggregate with all affiliates. Collateral in specified amounts ranging from 100% to 130% of the amount of the transaction must usually be provided by affiliates in order to receive loans from the savings bank. In addition, Office of Thrift Supervision regulations prohibit a savings bank from lending to any of its affiliates that are engaged in activities that are not permissible for bank holding companies and from purchasing the securities of any affiliate, other than a subsidiary. Finally, transactions with affiliates must be consistent with safe and sound banking practices, not involve low-quality assets and be on terms that are as favorable to the institution as comparable transactions with non-affiliates. The Office of Thrift Supervision requires savings banks to maintain detailed records of all transactions with affiliates.
United Bank’s authority to extend credit to its directors, executive officers and 10% shareholders, as well as to entities controlled by such persons, is currently governed by the requirements of Sections 22(g) and 22(h) of the FRA and Regulation O of the Federal Reserve Board. Among other things, these provisions generally require that extensions of credit to insiders (i) be made on terms that are substantially the same as, and follow credit underwriting procedures that are not less stringent than, those prevailing for comparable transactions with unaffiliated persons and that do not involve more than the normal risk of repayment or present other unfavorable features, and (ii) not exceed certain limitations on the amount of credit extended to such persons, individually and in the aggregate, which limits are based, in part, on the amount of United Bank’s capital. In addition, extensions of credit in excess of certain limits must be approved by United Bank’s Board of Directors.
31
Table of Contents
Enforcement. The Office of Thrift Supervision has primary enforcement responsibility over federal savings banks and has the authority to bring enforcement action against all “institution-affiliated parties,” including stockholders, and attorneys, appraisers and accountants who knowingly or recklessly participate in wrongful action likely to have an adverse effect on an insured institution. Formal enforcement action by the Office of Thrift Supervision may range from the issuance of a capital directive or cease and desist order, to removal of officers and/or directors of the institution and the appointment of a receiver or conservator. Civil penalties cover a wide range of violations and actions, and range up to $25,000 per day, unless a finding of reckless disregard is made, in which case penalties may be as high as $1.0 million per day. The Federal Deposit Insurance Corporation (the “FDIC”) also has the authority to terminate deposit insurance or to recommend to the Director of the Office of Thrift Supervision that enforcement action be taken with respect to a particular savings institution. If action is not taken by the Director, the Federal Deposit Insurance Corporation has authority to take action under specified circumstances. The Office of the Comptroller of the Currency will be assuming the Office of Thrift Supervision’s enforcement authority over federal savings banks pursuant to the Dodd-Frank Act regulatory restructuring.
Standards for Safety and Soundness. Federal law requires each federal banking agency to prescribe certain standards for all insured depository institutions. These standards relate to, among other things, internal controls, information systems and audit systems, loan documentation, credit underwriting, interest rate risk exposure, asset growth, compensation, and other operational and managerial standards as the agency deems appropriate. The federal banking agencies adopted Interagency Guidelines Prescribing Standards for Safety and Soundness to implement the safety and soundness standards required under federal law. The guidelines set forth the safety and soundness standards that the federal banking agencies use to identify and address problems at insured depository institutions before capital becomes impaired. The guidelines address internal controls and information systems, internal audit systems, credit underwriting, loan documentation, interest rate risk exposure, asset growth, compensation, fees and benefits. If the appropriate federal banking agency determines that an institution fails to meet any standard prescribed by the guidelines, the agency may require the institution to submit to the agency an acceptable plan to achieve compliance with the standard. If an institution fails to meet these standards, the appropriate federal banking agency may require the institution to submit a compliance plan.
Prompt Corrective Action Regulations. Under the prompt corrective action regulations, the Office of Thrift Supervision is required and authorized to take supervisory actions against undercapitalized savings banks. For this purpose, a savings bank is placed in one of the following five categories based on the savings bank’s capital:
| • | well-capitalized (at least 5% leverage capital, 6% Tier 1 risk-based capital and 10% total risk-based capital); |
| • | adequately capitalized (at least 4% leverage capital, 4% Tier 1 risk-based capital and 8% total risk-based capital); |
| • | undercapitalized (less than 3% leverage capital, 4% Tier 1 risk-based capital or 8% total risk-based capital); |
| • | significantly undercapitalized (less than 3% leverage capital, 3% Tier 1 risk-based capital or 6% total risk-based capital); and |
| • | critically undercapitalized (less than 2% tangible capital). |
Generally, the Office of Thrift Supervision is required to appoint a receiver or conservator for a savings bank that is “critically undercapitalized” within specific time frames. The regulations also provide that a capital restoration plan must be filed with the Office of Thrift Supervision within 45 days of the date a savings bank receives notice that it is “undercapitalized,” “significantly undercapitalized” or “critically undercapitalized.” The criteria for an acceptable capital restoration plan include, among other things, the establishment of the methodology and assumptions for attaining adequately capitalized status on an annual basis, procedures for ensuring compliance with restrictions imposed by applicable federal regulations, the identification of the types
32
Table of Contents
and levels of activities the savings bank will engage in while the capital restoration plan is in effect, and assurances that the capital restoration plan will not appreciably increase the current risk profile of the savings bank. Any holding company for the savings bank required to submit a capital restoration plan must guarantee the lesser of an amount equal to 5% of a savings bank’s assets at the time it was notified or deemed to be undercapitalized by the Office of Thrift Supervision, or the amount necessary to restore the savings bank to adequately capitalized status. This guarantee remains in place until the Office of Thrift Supervision notifies the savings bank that it has maintained adequately capitalized status for each of four consecutive calendar quarters, and the Office of Thrift Supervision has the authority to require payment and collect payment under the guarantee. Failure by a holding company to provide the required guarantee will result in certain operating restrictions on the savings bank, such as restrictions on the ability to declare and pay dividends, pay executive compensation and management fees, and increase assets or expand operations. The Office of Thrift Supervision may also take any one of a number of discretionary supervisory actions against undercapitalized savings banks, including the issuance of a capital directive and the replacement of senior executive officers and directors.
At December 31, 2010, United Bank met the criteria for being considered “well-capitalized.”
Insurance for Deposit Accounts. United Bank’s deposits are insured up to applicable limits by the Deposit Insurance Fund of the Federal Deposit Insurance Corporation. The Deposit Insurance Fund is the successor to the Bank Insurance Fund and the Savings Association Insurance Fund, which were merged in 2006.
Under the FDIC’s risk-based assessment system, insured institutions are assigned to one of four risk categories based on supervisory evaluations, regulatory capital levels and certain other factors, with less risky institutions paying lower assessments. An institution’s assessment rate depends upon the category to which it is assigned, and certain potential adjustments established by FDIC regulations. Assessment rates currently range from seven to 77.5 basis points of assessable deposits. The Federal Deposit Insurance may adjust the scale uniformly from one quarter to the next, except that no adjustment can deviate more than three basis points from the base scale without notice and comment. The Dodd-Frank Act requires the FDIC to revise its procedures to base its assessments upon total assets less tangible equity instead of deposits. The FDIC has issued a proposed rule, that if adopted, would implement that change for the second quarter of 2011. No institution may pay a dividend if in default of the federal deposit insurance assessment.
The FDIC imposed on all insured institutions a special emergency assessment of five basis points of total assets minus Tier 1 capital (as of June 30, 2009), capped at ten basis points of an institution’s deposit assessment base, in order to cover losses to the Deposit Insurance Fund. That special assessment was collected on September 30, 2009. The FDIC provided for similar assessments during the final two quarters of 2009, if deemed necessary. However, in lieu of further special assessments, the FDIC required insured institutions to prepay estimated quarterly risk-based assessments for the fourth quarter of 2009 through the fourth quarter of 2012. The estimated assessments, which include an assumed annual assessment base increase of 5%, were recorded as a prepaid expense asset as of December 30, 2009. As of December 31, 2009, and each quarter thereafter, a charge to earnings is being recorded for each regular assessment with an offsetting credit to the prepaid asset.
Due to the recent difficult economic conditions, deposit insurance per account owner has been raised to $250,000. That limit was made permanent by the Dodd-Frank Act. In addition, the FDIC adopted an optional Temporary Liquidity Guarantee Program by which, for a fee, noninterest-bearing transaction accounts would receive unlimited insurance coverage until June 30, 2010, subsequently extended to December 31, 2010, and certain senior unsecured debt issued by institutions and their holding companies between October 13, 2008 and October 31, 2009 would be guaranteed by the FDIC through June 30, 2012, or in some cases, December 31, 2012. United Bank opted to participate in the unlimited noninterest- bearing transaction account coverage and United Bank and the Company opted to participate in the unsecured debt guarantee program. The Dodd-Frank Act extended the unlimited coverage for certain noninterest-bearing transaction accounts until December 31, 2012.
33
Table of Contents
In addition to the assessment for deposit insurance, institutions are required to make payments on bonds issued in the late 1980s by the Financing Corporation to recapitalize a predecessor deposit insurance fund. That payment is established quarterly and during the four quarters ended September 30, 2010 averaged 1.04 basis points of assessable deposits.
The Dodd-Frank Act increased the minimum target Deposit Insurance Fund ratio from 1.15% of estimated insured deposits to 1.35% of estimated insured deposits. The FDIC must seek to achieve the 1.35% ratio by September 30, 2020. Insured institutions with assets of $10 billion or more are supposed to fund the increase. The Dodd-Frank Act eliminated the 1.5% maximum fund ratio, instead leaving it to the discretion of the FDIC.
Federal law also provides for the possibility that the Federal Deposit Insurance Corporation may pay dividends to insured institutions once the Deposit Insurance fund reserve ratio equals or exceeds 1.35% of estimated insured deposits.
In addition to the assessment for deposit insurance, institutions are required to make payments on bonds issued in the late 1980s by the Financing Corporation to recapitalize a predecessor deposit insurance fund. That payment is established quarterly and during the fourth quarter ended December 31, 2010 averaged 1.04 basis points of assessable deposits.
The Federal Deposit Insurance Corporation has authority to increase insurance assessments. A significant increase in insurance premiums would likely have an adverse effect on the operating expenses and results of operations of United Bank. Management cannot predict what insurance assessment rates will be in the future.
Insurance of deposits may be terminated by the Federal Deposit Insurance Corporation upon a finding that the institution has engaged in unsafe or unsound practices, is in an unsafe or unsound condition to continue operations or has violated any applicable law, regulation, rule, order or condition imposed by the Federal Deposit Insurance Corporation or the Office of Thrift Supervision. The management of United Bank does not know of any practice, condition or violation that might lead to termination of deposit insurance.
Prohibitions Against Tying Arrangements. Federal savings banks are prohibited, subject to some exceptions, from extending credit to or offering any other service, or fixing or varying the consideration for such extension of credit or service, on the condition that the customer obtain some additional service from the institution or its affiliates or not obtain services of a competitor of the institution.
Federal Home Loan Bank System. United Bank is a member of the Federal Home Loan Bank System, which consists of 12 regional Federal Home Loan Banks. The Federal Home Loan Bank provides a central credit facility primarily for member institutions. United Bank, as a member of the Federal Home Loan Bank, is required to acquire and hold shares of capital stock in that Federal Home Loan Bank. United Bank was in compliance with this requirement with an investment in Federal Home Loan Bank stock at December 31, 2010, of $15.4 million. Federal Home Loan Bank advances must be secured by specified types of collateral.
The Federal Home Loan Banks have been required to provide funds for the resolution of insolvent thrifts in the late 1980s and contribute funds for affordable housing programs. These and similar requirements, and general economic conditions, could reduce the amount of dividends that the Federal Home Loan Banks pay to their members and result in the Federal Home Loan Banks imposing a higher rate of interest on advances to their members. To the extent dividends are reduced, or interest on future Federal Home Loan Bank advances increased, United Bank’s net interest income would likely also be reduced. In fact, the Federal Home Loan Bank of Boston has not paid a dividend since 2008.
34
Table of Contents
Federal Reserve System
Federal Reserve Board regulations require savings banks to maintain noninterest-earning reserves against their transaction accounts, such as negotiable order of withdrawal and regular checking accounts. At December 31, 2010, United Bank was in compliance with these reserve requirements.
Other Regulations
Interest and other charges collected or contracted for by United Bank are subject to state usury laws and federal laws concerning interest rates. United Bank’s operations are also subject to federal laws applicable to credit transactions, such as the:
| • | Truth-In-Lending Act, governing disclosures of credit terms to consumer borrowers; |
| • | Home Mortgage Disclosure Act, requiring financial institutions to provide information to enable the public and public officials to determine whether a financial institution is fulfilling its obligation to help meet the housing needs of the community it serves; |
| • | Equal Credit Opportunity Act, prohibiting discrimination on the basis of race, creed or other prohibited factors in extending credit; |
| • | Fair Credit Reporting Act, governing the use and provision of information to credit reporting agencies; |
| • | Fair Debt Collection Act, governing the manner in which consumer debts may be collected by collection agencies; |
| • | Truth in Savings Act; and |
| • | rules and regulations of the various federal agencies charged with the responsibility of implementing such federal laws. |
The operations of United Bank also are subject to the:
| • | Right to Financial Privacy Act, which imposes a duty to maintain confidentiality of consumer financial records and prescribes procedures for complying with administrative subpoenas of financial records; |
| • | Electronic Funds Transfer Act and Regulation E promulgated thereunder, which govern automatic deposits to and withdrawals from deposit accounts and customers’ rights and liabilities arising from the use of automated teller machines and other electronic banking services; |
| • | Check Clearing for the 21st Century Act (also known as “Check 21”), which gives “substitute checks,” such as digital check images and copies made from that image, the same legal standing as the original paper check; |
| • | The USA PATRIOT Act, which requires savings banks to, among other things, establish broadened anti-money laundering compliance programs, due diligence policies and controls to ensure the detection and reporting of money laundering. Such required compliance programs are intended to supplement existing compliance requirements, also applicable to financial institutions, under the Bank Secrecy Act and the Office of Foreign Assets Control regulations; and |
35
Table of Contents
| • | The Gramm-Leach-Bliley Act, which places limitations on the sharing of consumer financial information by financial institutions with unaffiliated third parties. Specifically, the Gramm-Leach-Bliley Act requires all financial institutions offering financial products or services to retail customers to provide such customers with the financial institution’s privacy policy and provide such customers the opportunity to “opt out” of the sharing of certain personal financial information with unaffiliated third parties. |
Holding Company Regulation
The Company is a unitary savings and loan holding company, subject to regulation and supervision by the Office of Thrift Supervision. The Office of Thrift Supervision has enforcement authority over the Company and its non-savings institution subsidiaries. Among other things, this authority permits the Office of Thrift Supervision to restrict or prohibit activities that are determined to be a risk to United Bank. As part of the Dodd-Frank Act regulatory restructuring, the OTS’ authority over savings and loan holding companies will be transferred to the Federal Reserve Board, which is the agency that regulates and supervises bank holding companies.
Under federal law, the business activities of the Company are limited to those activities permissible for financial holding companies or for multiple savings and loan holding companies. A financial holding company may engage in activities that are financial in nature, including underwriting equity securities and insurance, as well as activities that are incidental to financial activities or complementary to a financial activity. A multiple savings and loan holding company is generally limited to activities permissible for bank holding companies under Section 4(c) (8) of the Bank Holding Company Act, subject to the prior approval of the Office of Thrift Supervision, and certain additional activities authorized by Office of Thrift Supervision regulations.
Federal law prohibits a savings and loan holding company, directly or indirectly, or through one or more subsidiaries, from acquiring control of another savings institution or holding company thereof, without prior written approval of the Office of Thrift Supervision. It also prohibits the acquisition or retention of, with specified exceptions, more than 5% of the equity securities of a company engaged in activities that are not closely related to banking or financial in nature or acquiring or retaining control of an institution that is not federally insured. In evaluating applications by holding companies to acquire savings institutions, the Office of Thrift Supervision must consider, among other things, the financial and managerial resources and future prospects of the savings institution and company involved, the effect of the acquisition on the risk to the insurance fund, the convenience and needs of the community and competitive factors.
The Office of Thrift Supervision is prohibited from approving any acquisition that would result in a multiple savings and loan holding company controlling savings institutions in more than one state, subject to two exceptions:
| (i) | the approval of interstate supervisory acquisitions by savings and loan holding companies; and |
| (ii) | the acquisition of a savings institution in another state if the laws of the state of the target savings institution specifically permit such acquisition. |
The states vary in the extent to which they permit interstate savings and loan holding company acquisitions. Savings and loan holding companies are not currently subject to specific regulatory capital requirements. The Dodd-Frank Act, however, requires the promulgator of consolidated capital requirements for depository institution holding companies that are no less stringent, both quantitatively and in terms of components of capital, than those applicable to institutions themselves. There is a five-year transition period (from the July 21, 2010 effective date of the Dodd-Frank Act) before the capital requirements will apply to savings and loan holding companies. Instruments such as cumulative preferred stock and trust preferred securities will no longer be includable as Tier 1 capital. Instruments issued by May 19, 2010 will be
36
Table of Contents
grandfathered for companies with consolidated assets of $15 billion or less. The Dodd-Frank Act also extends the “source of strength” doctrine to savings and loan holding companies. The regulatory agencies must issue regulations requiring that all bank and savings and loan holding companies serve as a source of strength to their subsidiary depository institutions. The regulations require holding companies to provide capital and other support to their subsidiary institutions in times of financial distress.
United Bank must notify the Office of Thrift Supervision 30 days before declaring any dividend to the Company. In addition, the financial impact of a holding company on its subsidiary institution is a matter that is evaluated by the OTS and the agency has authority to order cessation of activities or divestiture of subsidiaries deemed to pose a threat to the safety and soundness of the institution.
Regulatory Restructuring Legislation
On July 21, 2010, President Obama signed the Dodd-Frank Act, which is legislation that restructures the regulation of depository institutions. In addition to eliminating the Office of Thrift Supervision and creating the Consumer Financial Protection Bureau, the Dodd-Frank Act, among other things, requires changes in the way that institutions are assessed for deposit insurance, mandates the imposition of consolidated capital requirements on savings and loan holding companies, requires that originators of securitized loans retain a percentage of the risk for the transferred loans, requires the Federal Reserve Board to regulate pricing of debit card interchange fees, reduces the federal preemption afforded to federal savings associations and contains a number of reforms related to mortgage origination. Many of the provisions of the Dodd-Frank Act require the issuance of regulations before their impact on operations can be assessed by management. However, there is a significant possibility that the Dodd-Frank Act will, at a minimum, result in an increased regulatory burden and higher compliance, operating, and possibly, interest expense costs for the Company and United Bank.
Federal Securities Laws
The Company’s common stock is registered with the Securities and Exchange Commission under the Securities Exchange Act of 1933. The Company is subject to the information, proxy solicitation, insider trading restrictions and other requirements under the Securities Exchange Act of 1934.
TAXATION
Federal Taxation
General. The Company and United Bank are subject to federal income taxation in the same general manner as other corporations, with some exceptions discussed below. The following discussion of federal taxation is intended only to summarize certain pertinent federal income tax matters and is not a comprehensive description of the tax rules applicable to United Financial Bancorp, Inc. or United Bank.
Method of Accounting. For federal income tax purposes, the Company currently reports its income and expenses on the accrual method of accounting and uses a tax year ending December 31 for filing its federal and state income tax returns.
Bad Debt Reserves. Historically, United Bank has been subject to special provisions in the tax law regarding allowable bad debt tax deductions and related reserves. Tax law changes were enacted in 1996, pursuant to the Small Business Protection Act of 1996 (the “1996 Act”), that eliminated the use of the percentage of taxable income method for tax years after 1995 and required recapture into taxable income over a six year period all bad debt reserves accumulated after 1988. United Bank recaptured its reserves accumulated after 1988 over the six-year period ended December 31, 2001.
Currently, the Company’s consolidated group uses the specific charge off method to account for bad debt deductions for income tax purposes.
37
Table of Contents
Taxable Distributions and Recapture. Prior to the 1996 Act, bad debt reserves created prior to November 1, 1988 were subject to recapture into taxable income if United Bank failed to meet certain thrift asset and definitional tests.
At December 31, 2010, United Bank’s total federal base year reserve was approximately $2.6 million. However, under current law, base-year reserves remain subject to recapture if United Bank makes certain non-dividend distributions, repurchases any of its stock, pays dividends in excess of tax earnings and profits, or ceases to maintain a bank charter.
Alternative Minimum Tax. The IRC imposes an alternative minimum tax (“AMT”) at a rate of 20% on a base of regular taxable income plus certain tax preferences (“alternative minimum taxable income” or “AMTI”). The AMT is payable to the extent such AMTI is in excess of an exemption amount and the AMT exceeds the regular income tax. Net operating losses can offset no more than 90% of AMTI. Certain payments of alternative minimum tax may be used as credits against regular tax liabilities in future years. The Company and United Bank have not been subject to the alternative minimum tax and have no such amounts available as credits for carryover.
Corporate Dividends-Received Deduction. The Company may exclude from its federal taxable income 100% of dividends received from United Bank as a wholly owned subsidiary. The corporate dividends-received deduction is 80% when the dividend is received from a corporation having at least 20% of its stock owned by the recipient corporation. A 70% dividends-received deduction is available for dividends received from corporations owned less than 20% by the recipient corporation.
State Taxation
Beginning in 2009, due to a change in law, United Financial Bancorp, Inc. and United Bank filed a combined return. The security corporation subsidiaries continue to file separately. United Financial Bancorp, Inc.’s state tax returns, as well as those of United Bank and its subsidiaries, are not currently under audit. The years after 2005 are open for exam.
United Bank files Massachusetts financial institution income tax returns and is subject to an annual Massachusetts tax at a rate of 10% of its net income in 2010. Massachusetts net income is defined as gross income, other than 95% of dividends received in any taxable year beginning on or after January 1, 1999 from or on account of the ownership of any class of stock if the institution owns 15% or more of the voting stock of the institution paying the dividend, less the deductions, but not the credits allowable under the provisions of the Internal Revenue Code, as amended and in effect for the taxable year. The dividends must meet the qualifications under Massachusetts law. Deductions with respect to the following items, however, are not allowed except as otherwise provided: (a) dividends received, except as otherwise provided; (b) losses sustained in other taxable years; (c) taxes on or measured by income, franchise taxes measured by net income, franchise taxes for the privilege of doing business and capital stock taxes imposed by any state; or (d) the deduction allowed by section 168(k) of the Code.
Due to the legislative change, beginning in 2010, the Massachusetts financial institution tax rate decreases by 0.5% each year for three years until 2012, when it will become 9% and will remain at that rate.
United Financial Bancorp is required to file a Massachusetts income tax return and is generally subject to a state income tax rate that is the same rate as the tax rate for financial institutions in Massachusetts. As a Maryland business corporation, United Financial Bancorp is required to file annual returns and pay annual fees to the State of Maryland.
United Bank’s subsidiaries, UCB Securities, Inc. and UCB Securities, Inc. II, are taxed as Massachusetts security corporations, and are subject to a state tax rate of 1.32% of its gross income.
38
Table of Contents
Executive Officers of the Registrant
The executive officers of the Company and the Bank are elected annually by the Board of Directors and serve at the Board’s discretion. The executive officers of the Company and the Bank are:
| Name |
Position | |
| Richard B. Collins |
President and Chief Executive Officer of the Company and the Bank | |
| Keith E. Harvey |
Executive Vice President, Operations and Retail Sales, of the Bank | |
| Mark A. Roberts |
Executive Vice President and Chief Financial Officer of the Company and the Bank | |
| J. Jeffrey Sullivan |
Executive Vice President and Chief Lending Officer of the Bank | |
| Charles R. Valade |
Executive Vice President, Commercial Lending/Worcester Region, of the Bank | |
| John J. Patterson |
Senior Vice President, Risk Management, of the Bank | |
| Dena M. Hall |
Senior Vice President, Marketing and Community Relations, of the Bank |
Below is information regarding the executive officers who are not also directors. Unless otherwise stated, each executive officer has held his current position for at least the last five years. Ages presented are as of December 31, 2010.
Keith E. Harvey is the Executive Vice President for Operations and Retail Sales of the Bank. Mr. Harvey joined the Bank in 1984. Age 63.
Mark A. Roberts is the Executive Vice President and Chief Financial Officer of the Company and the Bank. He joined the Company and the Bank in 2006. Prior to that, he served as the Vice President and Controller for The Connecticut Bank and Trust Company in Hartford, Connecticut and was the Vice President of Finance at Woronoco Savings Bank for six years. Age 47.
J. Jeffrey Sullivan is Executive Vice President and Chief Lending Officer of the Bank. Mr. Sullivan joined the Bank in 2003. Age 46.
Charles R. Valade is Executive Vice President, Commercial Lending/Worcester Region, of the Bank. Prior to joining the Bank in connection with the Company’s acquisition of CNB Financial in November 2009, Mr. Valade served as President and Chief Executive Officer of CNB Financial since its formation in 2005. Age 59.
Dena M. Hall is the Senior Vice President of Marketing and Community Relations of the Bank. She joined the Bank in 2005. Previously, she was the Director of Marketing for Woronoco Savings Bank for seven years. Age 37.
John J. Patterson is Senior Vice President, Risk Management of the Bank. Mr. Patterson joined the Bank in 1993. Age 64.
39
Table of Contents
| ITEM 1A. | RISK FACTORS |
An investment in our common stock involves risk. You should carefully consider the risks described below and all other information contained in this annual report on Form 10-K before you decide to buy our common stock. It is possible that risks and uncertainties not listed below may arise or become material in the future and affect our business.
The Economic Recession Could Result In Increases In Our Level Of Non-Performing Loans And/Or Reduce Demand For Our Products And Services, Which Would Lead To Lower Revenue, Higher Loan Losses And Lower Earnings.
Our business activities and earnings are affected by general business conditions in the United States and in our local market area. These conditions include short-term and long-term interest rates, inflation, unemployment levels, monetary supply, consumer confidence and spending, fluctuations in both debt and equity capital markets, and the strength of the economy in the United States generally and in our market area in particular. The national economy has recently experienced a recession, with rising unemployment levels, declines in real estate values and erosion in consumer confidence. Dramatic declines in the U.S. housing market over the past few years, with falling home prices and increasing foreclosures, have negatively affected the performance of mortgage loans and resulted in significant write-downs of asset values by many financial institutions. A prolonged or more severe economic downturn, continued elevated levels of unemployment, further declines in the values of real estate, or other events that affect household and/or corporate incomes could impair the ability of our borrowers to repay their loans in accordance with their terms. Nearly all of our loans are secured by real estate or made to businesses in Massachusetts. As a result of this concentration, a prolonged or more severe downturn in the local economy could result in significant increases in nonperforming loans, which would negatively impact our interest income and result in higher provisions for loan losses, which would hurt our earnings. The economic downturn could also result in reduced demand for credit or fee-based products and services, which would hurt our revenues.
Future Changes in Interest Rates Could Reduce Our Profits
Our ability to make a profit largely depends on our net interest income, which could be negatively affected by changes in interest rates. Net interest income is the difference between the interest income we earn on our interest-earning assets, such as loans and securities and the interest expense we pay on our interest-bearing liabilities, such as deposits and borrowings.
The rates we earn on our assets and the rates we pay on our liabilities are generally fixed for a contractual period of time. Like many savings institutions, our liabilities generally have shorter contractual maturities than our assets. This imbalance can create significant earnings volatility because market interest rates change over time. In a period of rising interest rates, the interest income earned on our assets may not increase as rapidly as the interest paid on our liabilities. In a period of declining interest rates, the interest income earned on our assets may decrease more rapidly than the interest paid on our liabilities, as borrowers prepay mortgage loans, and mortgage-backed securities and callable investment securities are called or prepaid thereby requiring us to reinvest those cash flows at lower interest rates. See “Management’s Discussion and Analysis of Financial Condition and Results of Operations — Management of Market Risk.”
In addition, changes in interest rates can affect the average life of loans and mortgage-backed and related securities. A reduction in interest rates results in increased prepayments of loans and mortgage-backed and related securities, as borrowers refinance their debt in order to reduce their borrowing costs. This creates reinvestment risk, which is the risk that we may not be able to reinvest prepayments at rates that are comparable to the rates we earned on the prepaid loans or securities. Additionally, increases in interest rates may decrease loan demand and/or make it more difficult for borrowers to repay adjustable-rate loans.
40
Table of Contents
Changes in interest rates also affect the current fair value of our interest-earning securities portfolio. Generally, the value of securities moves inversely with changes in interest rates. At December 31, 2010, the fair value of our available-for-sale securities portfolio, consisting of agency securities, mortgage-backed securities, corporate debt obligations, municipal obligations and preferred stock, totaled $205.9 million. Unrealized net gains on these available-for-sale securities totaled $8.8 million at December 31, 2010 and are reported as a separate component of stockholders’ equity. Decreases in the fair value of securities available for sale in future periods would have an adverse effect on stockholders’ equity.
We evaluate interest rate sensitivity using income simulation models that estimate the change in United Bank’s net interest income over a range of interest rate scenarios. Net income at risk measures the risk of a decline in earnings due to potential short-term and long term changes in interest rates. At December 31, 2010, in the event of an immediate 200 basis point increase in interest rates, the model projects that we would experience a 0.54% increase in net interest income over the following 12 months.
Our Increased Emphasis on Commercial Real Estate and Commercial and Industrial Lending May Expose Us to Increased Lending Risks.
At December 31, 2010, our portfolio of commercial real estate loans totaled $428.0 million, or 39.9% of our total loans, and our portfolio of commercial and industrial loans totaled $165.3 million, or 15.4% of our total loans. These loans have increased as a percentage of our total loan portfolio in recent years and generally have more risk than one- to four-family residential mortgage loans. Because the repayment of commercial real estate and commercial and industrial loans depends on the successful management and operation of the borrower’s properties or related businesses, repayment of such loans can be affected by adverse conditions in the real estate market or the local economy. Many of our borrowers also have more than one commercial real estate or commercial and industrial loan outstanding with us. Consequently, an adverse development with respect to one loan or one credit relationship can expose us to significantly greater risk of loss compared to an adverse development with respect to a one- to four-family residential mortgage loan. Finally, if we foreclose on a commercial real estate or commercial and industrial loan, our holding period for the collateral, if any, typically is longer than for one- to four-family residential mortgage loans because there are fewer potential purchasers of the collateral. Because we plan to continue to increase our originations of these loans, it may be necessary to increase the level of our allowance for loan losses because of the increased risk characteristics associated with these types of loans. Any such increase to our allowance for loan losses would adversely affect our earnings.
Our Emphasis On Residential Mortgage Loans And Home Equity Loans And Lines Of Credit Exposes Us To Lending Risks.
At December 31, 2010, $295.7 million, or 27.5%, of our loan portfolio consisted of one- to four-family residential mortgage loans and $138.3 million, or 12.9%, of our loan portfolio consisted of home equity loans and lines of credit. Recent declines in the housing market have resulted in declines in real estate values in our market areas. These declines in real estate values could cause some of our mortgage and home equity loans and lines of credit to be inadequately collateralized, which would expose us to a greater risk of loss if we seek to recover on defaulted loans by selling the real estate collateral.
If Our Allowance for Loan Losses is Not Sufficient to Cover Actual Loan Losses, Our Earnings Could Decrease.
We make various assumptions and judgments about the collectibility of our loan portfolio, including the creditworthiness of our borrowers and the value of the real estate and other assets serving as collateral for the repayment of many of our loans. In determining the amount of the allowance for loan losses, we review our loans and our loss and delinquency experience, and we evaluate economic conditions. If our assumptions are incorrect, our allowance for loan losses may not be sufficient to cover losses inherent in our loan portfolio, resulting in additions to our allowance. Our allowance for loan losses was 0.93% of total loans and 105.86% of
41
Table of Contents
non-performing loans at December 31, 2010, compared to 0.82% of total loans and 56.36% of non-performing loans at December 31, 2009. Material additions to our allowance could materially decrease our net income.
In addition, bank regulators periodically review our allowance for loan losses and may require us to increase our provision for loan losses or recognize further loan charge-offs. Any increase in our allowance for loan losses or loan charge-offs as required by these regulatory authorities may have a material adverse effect on our financial condition and results of operations.
Further Declines in the Value of Certain Investment Securities Could Require Write-Downs, Which Would Reduce our Earnings.
At December 31, 2010, our investment portfolio included $1.6 million in trust preferred securities and $15.4 million in municipal bonds. During 2010, 2009 and 2008, we recognized $145,000, $82,000 and $1.3 million charges for the other-than-temporary impairment of certain trust preferred securities. During 2008, we also recognized a $94,000 charge for the other-than-temporary impairment of one municipal security. A number of factors or combinations of factors could cause us to conclude in one or more future reporting periods that an unrealized loss that exists with respect to these securities constitutes an impairment that is other than temporary. These factors include, but are not limited to, failure to make scheduled interest payments, an increase in the severity of the unrealized loss on a particular security, an increase in the continuous duration of the unrealized loss without an improvement in value or changes in market conditions and/or industry or issuer specific factors that would render us unable to forecast a full recovery in value. An other-than-temporary impairment write-down would reduce our earnings.
Recently enacted regulatory reform may have a material impact on our operations.
On July 21, 2010, the President signed into law The Dodd-Frank Wall Street Reform and Consumer Protection Act (the “Dodd-Frank Act”). The Dodd-Frank Act restructures the regulation of depository institutions. Under the Dodd-Frank Act, the Office of Thrift Supervision will be merged into the Office of the Comptroller of the Currency, which regulates national banks. Savings and loan holding companies will be regulated by the Board of Governors of the Federal Reserve System. The Dodd-Frank Act also creates a new federal agency to administer consumer protection and fair lending laws, a function that is now performed by the depository institution regulators. The federal preemption of state laws currently accorded federally chartered depository institutions, such as the Bank, will be reduced as well, and State Attorneys General will have greater authority to bring a suit against a federally chartered institution for violations of certain state and federal consumer protection laws. The Dodd-Frank Act also will impose consolidated capital requirements on savings and loan holding companies effective in five years. The Dodd-Frank Act contains various other provisions designed to enhance the regulation of depository institutions and prevent the recurrence of a financial crisis such as occurred in 2008-2009. The full impact of the Dodd-Frank Act on our business and operations will not be known for years until regulations implementing the statute are written and adopted. The Dodd-Frank Act may have a material impact on our operations, particularly through increased regulatory burden and compliance costs.
We operate in a highly regulated environment and we may be adversely affected by changes in laws and regulations.
We are subject to extensive regulation, supervision and examination by the Office of Thrift Supervision, our primary federal regulator, and the Federal Deposit Insurance Corporation, as insurer of its deposits. Such regulation and supervision governs the activities in which an institution and its holding company may engage, and are intended primarily for the protection of the insurance fund and the depositors and borrowers of the Bank rather than for holders of our common stock. Regulatory authorities have extensive discretion in their supervisory and enforcement activities, including the imposition of restrictions on our operations, the classification of our assets and determination of the level of our allowance for loan losses. Any change in such regulation and oversight, whether in the form of regulatory policy, regulations, legislation or supervisory action, may have a material impact on our operations.
42
Table of Contents
Increased and/or special FDIC assessments will hurt our earnings.
The recent economic recession has caused a high level of bank failures, which has dramatically increased FDIC resolution costs and led to a significant reduction in the balance of the Deposit Insurance Fund. As a result, the FDIC has significantly increased the initial base assessment rates paid by financial institutions for deposit insurance. Increases in the base assessment rate have increased our deposit insurance costs and negatively impacted our earnings. In addition, in May 2009, the FDIC imposed a special assessment on all insured institutions. Our special assessment, which was reflected in earnings for the quarter ended June 30, 2009, was $538,000. In lieu of imposing an additional special assessment, the FDIC required all institutions to prepay their assessments for all of 2010, 2011 and 2012, which for us totaled $4.8 million. Additional increases in the base assessment rate or additional special assessments would negatively impact our earnings.
If our Investment in the Federal Home Loan Bank of Boston is Classified as Other-Than-Temporarily Impaired or as Permanently Impaired, our Earnings and Stockholders’ Equity Would Decrease.
We own common stock of the Federal Home Loan Bank of Boston. We hold this stock to qualify for membership in the Federal Home Loan Bank System and to be eligible to borrow funds under the Federal Home Loan Bank of Boston’s advance program. The aggregate cost and fair value of our Federal Home Loan Bank of Boston common stock as of December 31, 2010 was $15.4 million based on its par value. There is no market for our Federal Home Loan Bank of Boston common stock. Published reports indicate that certain member banks of the Federal Home Loan Bank System may be subject to accounting rules and asset quality risks that could result in materially lower regulatory capital levels. In an extreme situation, it is possible that the capitalization of a Federal Home Loan Bank, including the Federal Home Loan Bank of Boston, could be substantially diminished. Consequently, we believe that there is a risk that our investment in Federal Home Loan Bank of Boston common stock could be impaired at some time in the future. If this occurs, it would cause our earnings and stockholders’ equity to decrease by the after-tax amount of the impairment charge.
The Federal Home Loan Bank of Boston Suspended Dividends During the Fourth Quarter of 2008. This Negatively Affects our Earnings.
The Federal Home Loan Bank of Boston suspended dividends during the fourth quarter of 2008. We received $402,000 in dividends from the Federal Home Loan Bank of Boston during the year ended December 31, 2008. The failure of the Federal Home Loan Bank of Boston to pay dividends during 2010 and 2009 has reduced our earnings.
Our Wholesale Funding Sources May Prove Insufficient to Replace Deposits at Maturity and Support Our Future Growth.
We must maintain sufficient funds to respond to the needs of depositors and borrowers. As a part of our liquidity management, we use a number of funding sources in addition to core deposit growth and repayments and maturities of loans and investments. As we continue to grow, we are likely to become more dependent on these sources, which include Federal Home Loan Bank advances, borrowings from the Federal Reserve Bank, reverse repurchase agreements, brokered CDs and proceeds from the sale of loans and securities and liquidity resources of the holding company. At December 31, 2010, we had approximately $153.3 million of FHLB advances outstanding. Our financial flexibility will be severely constrained if we are unable to maintain our access to funding or if adequate financing is not available to accommodate future growth at acceptable interest rates. Finally, if we are required to rely more heavily on more expensive funding sources to support future growth, our revenues may not increase proportionately to cover our costs. In this case, our operating margins and profitability would be adversely affected.
43
Table of Contents
Lack of Consumer Confidence in Financial Institutions May Decrease Our Level of Deposits.
Our level of deposits may be affected by lack of consumer confidence in financial institutions, which has resulted in large numbers of depositors unwilling to maintain deposits that are not insured by the Federal Deposit Insurance Corporation. In some cases, depositors have withdrawn deposits and invested uninsured funds in investments perceived as being more secure, such as securities issued by the U.S. Treasury. These consumer preferences may force us to pay higher interest rates to retain deposits and may constrain liquidity as we seek to meet funding needs caused by reduced deposit levels.
Strong Competition Within Our Market Area May Limit Our Growth and Profitability.
Competition in the banking and financial services industry is intense. In our market area, we compete with commercial banks, savings and cooperative institutions, mortgage brokerage firms, credit unions, finance companies, mutual funds, insurance companies, and brokerage and investment banking firms operating locally and elsewhere. Some of our competitors have substantially greater resources and lending limits than we have, have greater name recognition and market presence that benefit them in attracting business, and offer certain services that we do not or cannot provide. In addition, larger competitors may be able to price loans and deposits more aggressively than we do. Our profitability depends upon our continued ability to successfully compete in our market area. The greater resources and deposit and loan products offered by some of our competitors may limit our ability to increase our interest-earning assets.
Recent Negative Developments in the Financial Services Industry And the Credit Markets May Subject Us to Additional Regulation.
As a result of the recent financial crisis, the potential exists for the promulgation of new federal or state laws and regulations regarding lending and funding practices and liquidity standards, and bank regulatory agencies are expected to be active in responding to concerns and trends identified in examinations, which are expected to result in the issuance of many formal enforcement orders. Negative developments in the financial services industry and the credit markets, and the impact of new legislation in response to these developments, may negatively affect our operations by restricting our business operations, including our ability to originate or sell loans and pursue business opportunities. Compliance with such regulation also will likely increase our costs.
Our Future Growth May Require Us to Raise Additional Capital in the Future, But That Capital May Not Be Available When It Is Needed.
We are required by regulatory authorities to maintain adequate levels of capital to support our operations. We believe that our current capital levels will satisfy our regulatory requirements for the foreseeable future. We may at some point, however, need to raise additional capital to support our continued growth. Our ability to raise additional capital will depend, in part, on conditions in the capital markets at that time, which are outside our control, and on our financial performance. Accordingly, we may be unable to raise additional capital, if and when needed, on terms acceptable to us, or at all. If we cannot raise additional capital when needed, our ability to further expand our operations through internal growth and acquisitions could be materially impaired. In addition, if we decide to raise additional equity capital, your interest in our common stock could be diluted.
| ITEM 1B. | UNRESOLVED STAFF COMMENTS |
Not applicable.
44
Table of Contents
| ITEM 2. | PROPERTIES |
The following table provides certain information as of December 31, 2010 with respect to our main office located in West Springfield and our 21 other full service branch offices, our drive-up facilities and our financial service facilities:
| Location |
Leased or Owned | Year Acquired or Leased |
Square Footage | Net Book Value of Real Property |
||||||||
| (In thousands) | ||||||||||||
| Main Office: |
||||||||||||
| 95 Elm Street West Springfield, MA 01089 |
Owned | 1999 | 46,147 | $ 1,340 | ||||||||
| Full Service Branches: |
||||||||||||
| Springfield Region |
||||||||||||
| 115 State Street Springfield, MA 01103 |
Leased | (1) | 3,401 | - | ||||||||
| 1077 St. James Avenue Springfield, MA 01104 |
Owned | 2003 | 8,354 | 894 | ||||||||
| 459 Main Street Indian Orchard, MA 01151 |
Leased | (2) | 2,560 | - | ||||||||
| 528 Center Street Ludlow, MA 01056 |
Owned | 2002 | 3,000 | 901 | ||||||||
| 1930 Wilbraham Road Springfield, MA 01129 |
Owned | 2001 | 2,304 | 601 | ||||||||
| 670 Bliss Road Longmeadow, MA 01106 |
Leased | (3) | 1,652 | - | ||||||||
| 1325 Springfield Street Feeding Hills, MA 01030 |
Leased | (4) | 2,400 | - | ||||||||
| 180 Main Street Northampton, MA 01060 |
Leased | (5) | 2,800 | 147 | ||||||||
| 10 Elm Street Westfield, MA 01085 |
Owned | 1981 | 8,500 | 679 | ||||||||
| 14 Russell Road Huntington, MA 01050 |
Owned | 2001 | 720 | 176 | ||||||||
| 168 Southampton Road Westfield, MA 01085 |
Leased | (6) | 2,890 | 1,607 | ||||||||
| 1830 Northampton Street Holyoke, MA 01040 |
Owned | 1994 | 6,409 | 514 | ||||||||
| 94 Shaker Road East Longmeadow, MA 01028 |
Leased | 2008 (7) | 2,411 | - | ||||||||
| 806 Suffield Street Agawam, MA 01001 |
Leased | 2008 (8) | 2,972 | 1,129 | ||||||||
| 445 Montgomery Street Chicopee, MA 01020 |
Leased | 2009 (9) | 2,890 | 1,985 | ||||||||
45
Table of Contents
| Worcester Region |
||||||||||||
| 33 Waldo Street Worcester, MA 01608 |
Leased | 2001 (10) | 9,957 | 219 | ||||||||
| 1 West Boylston Street Worcester, MA 01605 |
Leased | 2003 (11) | 2,820 | 93 | ||||||||
| 572 Main Street Shrewsbury, MA 01545 |
Ground Leased | 2002 (12) | 28,253 | 514 | ||||||||
| 701 Church Street Northbridge, MA 01588 |
Sale, Leaseback | 2004 (13) | 30,492 | - | ||||||||
| 1393 Grafton Street Worcester, MA 01604 |
Leased | 2006 (14) | 2,000 | 263 | ||||||||
| 26 West Boylston Street West Boylston, MA 01583 |
Leased | 2006 (15) | 1,800 | 267 | ||||||||
| Other: |
||||||||||||
| 52 Van Deene Avenue West Springfield, MA 01089 |
Owned | 2005 (16) | 547 | 555 | ||||||||
| 33 Westfield Street West Springfield, MA 01089 |
Owned | (17) | 1,720 | 864 | ||||||||
| 140 Main Street Northampton, MA 01060 |
Leased | 2006 (18) | 1,375 | - | ||||||||
| 491 Pleasant Street Northampton, MA 01060 |
Leased | 2008 (19) | 7,405 | 486 | ||||||||
| (1) | United Bank has a lease for a five-year period expiring in June 2015. |
| (2) | United Bank has a lease for a five-year period expiring in May 2013 with an additional five-year renewal option. |
| (3) | United Bank has a lease for a five-year period expiring in September 2011. |
| (4) | United Bank has a lease for a five-year period expiring in September 2015. |
| (5) | United Bank has a lease for a ten-year period expiring in April 2016 with two five-year renewal options. |
| (6) | United Bank has a lease for a twenty-five year period expiring in March 2031 with two five-year renewal options. This lease is classified as a capitalized lease for accounting and reporting purposes. |
| (7) | United Bank has a lease for a ten-year period expiring in January 2018 with a renewal option for ten additional years. |
| (8) | United Bank has a lease for a twenty-year period expiring in March 2028 with two five-year renewal options. This lease is classified as a capitalized lease for accounting and reporting purposes. |
| (9) | United Bank has a lease for a twenty-five year period expiring in May 2034 with two five-year renewal options. This lease is classified as a capitalized lease for accounting and reporting purposes. |
| (10) | This location has a lease for a fifteen-year period expiring in October 2016 with two additional five-year renewal options. |
| (11) | This location has a lease for a twenty-year period expiring in March 2023 with two additional five-year renewal options. |
| (12) | This location has a ground lease for a twenty-year period expiring in June 2022 with eleven additional five-year renewal options. |
| (13) | This location has a leaseback agreement for a twenty-year period expiring in November 2024 with two additional five-year renewal options. |
| (14) | This location has a lease for a ten-year period expiring in January 2016 with three additional five-year renewal options. |
| (15) | This location has a lease for a ten-year period expiring in June 2016 with three additional five-year renewal options. |
| (16) | This office is a drive-up facility only. |
| (17) | A portion of this facility is used as a Wealth Management office which offers insurance, investment products and financial planning services. |
| (18) | United Bank has a two-year lease for this Wealth Management services facility which expires in November 2012. |
| (19) | This office is an express drive-up branch. |
46
Table of Contents
The net book value of our premises, land and equipment, including capitalized lease assets, was $13.2 million at December 31, 2010.
| ITEM 3. | LEGAL PROCEEDINGS |
United Bank, as successor in interest to Commonwealth National Bank, is involved in litigation relating to its foreclosure on a certain loan property. The litigants are claiming that Commonwealth National Bank acted in bad faith and in violation of applicable law and that their actions resulted in a sale of the underlying property for less than it should have thereby causing damage to the parties. United Bank believes these claims are without merit and is vigorously defending the litigation. The parties are scheduled to go to trial in the third quarter of 2011. No estimate of any reasonably possible loss or range of loss to United Bank can be made at this time.
In addition, the Company and its subsidiary are subject to various legal actions arising in the normal course of business. In the opinion of management, after consultation with legal counsel, the ultimate disposition of these matters is not expected to have a material adverse effect on the Company’s financial condition, results of operations or cash flows.
| ITEM 4. | [REMOVED AND RESERVED] |
PART II
| ITEM 5. | MARKET FOR REGISTRANT’S COMMON EQUITY, RELATED STOCKHOLDER MATTERS AND ISSUER PURCHASES OF EQUITY SECURITIES |
(a) Our shares of common stock are traded on the Nasdaq Global Select Market under the symbol “UBNK”. The approximate number of holders of record of United Financial Bancorp, Inc.’s common stock as of March 4, 2011 was 2,953. Certain shares of United Financial Bancorp, Inc. are held in “nominee” or “street” name; accordingly, the number of beneficial owners of such shares is not known or included in the foregoing number.
At the close of business on December 31, 2010, there were 16,109,106 shares of common stock outstanding. The following table presents quarterly market information and dividends declared for the common stock of the Company for the years ended December 31, 2010 and 2009. The high and low sales prices for the quarterly periods noted below were obtained from the NASDAQ Global Select Market.
| Price Per Share | Cash Dividend Declared |
|||||||||||||||
| High | Low | |||||||||||||||
| 2010 |
||||||||||||||||
| Fourth quarter |
$ | 15.46 | $ | 13.39 | $ | 0.08 | ||||||||||
| Third quarter |
15.08 | 12.95 | 0.08 | |||||||||||||
| Second quarter |
14.81 | 12.68 | 0.07 | |||||||||||||
| First quarter |
15.16 | 12.47 | 0.07 | |||||||||||||
| 2009 |
||||||||||||||||
| Fourth quarter |
$ | 13.47 | $ | 11.51 | $ | 0.07 | ||||||||||
| Third quarter |
14.00 | 11.31 | 0.07 | |||||||||||||
| Second quarter |
14.69 | 11.66 | 0.07 | |||||||||||||
| First quarter |
15.48 | 11.77 | 0.07 | |||||||||||||
Set forth hereunder is a stock performance graph comparing (a) the cumulative total return on the common stock for the period beginning on December 31, 2005 through December 31, 2010, (b) the cumulative total return on stocks included in the SNL Thrift Index over such period and (c) the cumulative total return on stocks included in the Russell 2000 Index over such period.
47
Table of Contents
The cumulative total return on the common stock was computed assuming the reinvestment of cash dividends during the period and is expressed in dollars based on an assumed initial investment of $100.
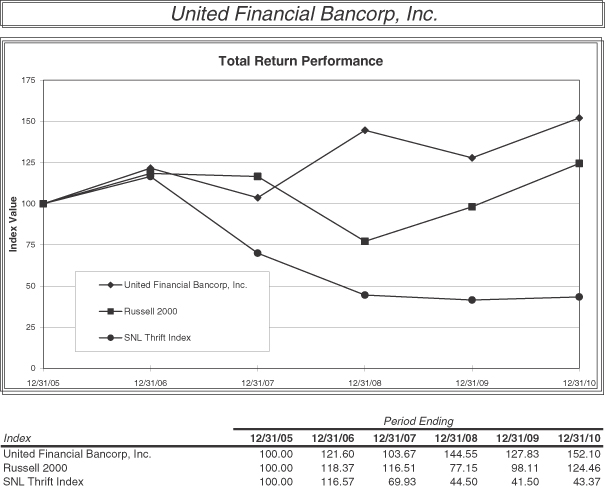
On January 24, 2011, the Board of Directors of United Financial Bancorp, Inc. declared a cash dividend of $0.08 per share. The dividend will be payable on March 8, 2011 to shareholders of record as of February 14, 2011.
Dividend payments by United Financial Bancorp, Inc. are dependent primarily on cash flows from the investment portfolio, debt service payments from United Bank in connection with its loan to the Employee Stock Ownership Plan, and dividends or capital distributions from United Bank.
For a discussion of United Bank’s ability to pay dividends, see “Supervision and Regulation—Federal Banking Regulation” and Note P to the Company’s financial statements.
| (b) | Not Applicable. |
48
Table of Contents
(c) The following table provides certain information with regard to shares repurchased by the Company in the fourth quarter of 2010.
| Period |
(a) Total Number of Shares (or Units) Purchased |
(b) Average Price Paid Per Share (or Unit) |
(c) Total Number of Shares (or Units) Purchased as Part of Publicly Announced Plans or Programs |
(d) Maximum Number (or Approximate Dollar Value) of Shares (or Units) that May Yet Be Purchased Under the Plans or Programs (1, 2) |
||||||||||||||||
| October 1 -31, 2010 |
25,451 | $ | 13.59 | 25,451 | 796,427 | |||||||||||||||
| November 1 -30, 2010 |
40,190 | (3) | 13.84 | 40,025 | 756,402 | |||||||||||||||
| December 1 -31, 2010 |
938 | (4) | 14.99 | - | 756,402 | |||||||||||||||
| Total |
66,579 | $ | 13.76 | 65,476 | ||||||||||||||||
| (1) | On October 16, 2009, the Board of Directors approved a plan to repurchase up to 5%, or approximately 798,055 shares, of the Company’s common stock. On October 26, 2010, the Company announced the completion of its stock repurchase program at a cost of approximately $10.8 million and at an average price of $13.51 per share. |
| (2) | On October 26, 2010, the Board of Directors approved a plan to repurchase up to 5%, or approximately 807,803 shares, of the Company’s common stock. This repurchase program commenced immediately upon completion of the previous plan approved on October 16, 2009. As of December 31, 2010, the Company repurchased 51,401 shares at a cost of approximately $709,000 and an average price of $13.80, under this plan. |
| (3) | Includes the withholding of 165 shares at $13.54 per share subject to restricted stock awards under the United Financial Bancorp, Inc. 2006 Stock-Based Incentive Plan as payment of taxes due upon the vesting of the restricted stock awards. |
| (4) | Represents withholdings subject to restricted stock awards under the United Financial Bancorp, Inc. 2006 Stock-Based Incentive Plan as payment of taxes due upon the vesting of the restricted stock awards. |
49
Table of Contents
| ITEM 6. | SELECTED FINANCIAL DATA |
The summary financial information presented below is derived in part from the consolidated financial statements of United Financial Bancorp, Inc. The following is only a summary and you should read it in conjunction with the consolidated financial statements and notes beginning on page F-1. The information at December 31, 2010 and 2009 and for the years ended December 31, 2010, 2009 and 2008 is derived in part from the audited consolidated financial statements of United Financial Bancorp, Inc. that appear in this Annual Report. The information for the years ended December 31, 2007 and 2006 is derived in part from audited consolidated financial statements that do not appear in this Annual Report.
| At December 31, | ||||||||||||||||||||
| 2010 | 2009 | 2008 | 2007 | 2006 | ||||||||||||||||
| (In thousands) | ||||||||||||||||||||
| Selected Financial Condition Data: |
||||||||||||||||||||
| Total assets |
$1,584,877 | $1,541,040 | $1,263,134 | $1,079,281 | $1,009,433 | |||||||||||||||
| Cash and cash equivalents |
83,069 | 21,877 | 13,572 | 14,254 | 25,419 | |||||||||||||||
| Short-term investments |
- | 1,096 | 1,071 | 1,030 | - | |||||||||||||||
| Investment securities available-for-sale |
205,852 | 243,304 | 313,506 | 201,257 | 190,237 | |||||||||||||||
| Investment securities held-to-maturity |
132,475 | 63,174 | 3,191 | 3,632 | 3,241 | |||||||||||||||
| Loans, net (1) |
1,066,197 | 1,115,416 | 864,421 | 819,117 | 756,180 | |||||||||||||||
| Deposits |
1,143,301 | 1,038,927 | 782,663 | 718,682 | 685,686 | |||||||||||||||
| FHLB advances |
153,307 | 208,173 | 208,564 | 107,997 | 169,806 | |||||||||||||||
| Repurchase agreements |
41,029 | 47,303 | 28,042 | 13,864 | 10,425 | |||||||||||||||
| Subordinated debentures |
5,448 | 5,357 | - | - | - | |||||||||||||||
| Stockholders' equity |
222,576 | 225,246 | 227,714 | 226,120 | 137,711 | |||||||||||||||
| Non-performing assets (2) |
10,970 | 17,832 | 5,795 | 2,665 | 1,850 | |||||||||||||||
| Years Ended December 31, | ||||||||||||||||||||
| 2010 | 2009 | 2008 | 2007 | 2006 | ||||||||||||||||
| (Dollars in thousands, except per share amounts) | ||||||||||||||||||||
| Selected Operating Data: |
||||||||||||||||||||
| Interest and dividend income |
$ | 73,858 | $ | 62,986 | $ | 64,814 | $ | 59,250 | $ | 52,202 | ||||||||||
| Interest expense |
20,947 | 21,986 | 25,003 | 30,083 | 24,647 | |||||||||||||||
| Net interest income before provision for loan losses |
52,911 | 41,000 | 39,811 | 29,167 | 27,555 | |||||||||||||||
| Provision for loan losses |
2,285 | 2,998 | 1,846 | 1,425 | 969 | |||||||||||||||
| Net interest income after provision for loan losses |
50,626 | 38,002 | 37,965 | 27,742 | 26,586 | |||||||||||||||
| Non-interest income |
8,716 | 8,676 | 5,220 | 5,735 | 5,392 | |||||||||||||||
| Non-interest expense |
43,841 | 36,858 | 30,690 | 26,039 | 24,036 | |||||||||||||||
| Income before taxes |
15,501 | 9,820 | 12,495 | 7,438 | 7,942 | |||||||||||||||
| Income tax expense |
5,469 | 4,014 | 5,197 | 3,061 | 3,018 | |||||||||||||||
| Net income |
$ | 10,032 | (3) | $ | 5,806 | (3) | $ | 7,298 | (4) | $ | 4,377 | $ | 4,924 | |||||||
| Basic earnings per share (5) |
$ | 0.66 | $ | 0.38 | $ | 0.44 | $ | 0.26 | $ | 0.29 | ||||||||||
| Diluted earnings per share (5) |
$ | 0.65 | $ | 0.38 | $ | 0.44 | $ | 0.26 | $ | 0.29 | ||||||||||
| Dividends per share |
$ | 0.30 | $ | 0.28 | $ | 0.27 | $ | 0.24 | $ | 0.20 | ||||||||||
| Number of shares outstanding (5) |
||||||||||||||||||||
| Basic |
15,302,505 | 15,265,192 | 16,445,388 | 17,126,864 | 17,134,150 | |||||||||||||||
| Diluted |
15,394,761 | 15,273,375 | 16,445,388 | 17,128,141 | 17,134,150 | |||||||||||||||
50
Table of Contents
| At or For the Years Ended December 31, | ||||||||||||||||||||
| 2010 | 2009 | 2008 | 2007 | 2006 | ||||||||||||||||
| Selected Financial Ratios and Other Data: |
||||||||||||||||||||
| Performance Ratios (6): |
||||||||||||||||||||
| Return on average assets |
0.65% | (7) | 0.46% | (7) | 0.62% | (13) | 0.42% | 0.51% | ||||||||||||
| Return on average equity |
4.49% | (7) | 2.67% | (7) | 3.23% | (13) | 2.99% | 3.59% | ||||||||||||
| Average equity to average assets |
14.56% | 17.17% | 19.06% | 14.17% | 14.35% | |||||||||||||||
| Tangible equity to tangible assets at end of period (6) |
13.60% | (8) | 14.18% | (8) | 18.03% | 20.95% | 13.64% | |||||||||||||
| Interest rate spread (9) |
3.25% | 2.83% | 2.69% | 2.08% | 2.23% | |||||||||||||||
| Net interest margin (10) |
3.65% | 3.39% | 3.47% | 2.91% | 2.97% | |||||||||||||||
| Average interest-earning assets to average interest-bearing liabilities |
127.83% | 130.87% | 135.95% | 127.77% | 128.10% | |||||||||||||||
| Total non-interest expense to average total assets |
2.85% | (11) | 2.91% | (11) | 2.59% | 2.52% | 2.51% | |||||||||||||
| Efficiency ratio (12) |
71.42% | (11) | 75.45% | (11) | 66.16% | 74.02% | 72.95% | |||||||||||||
| Dividend payout ratio |
45.74% | 72.99% | 60.78% | 40.15% | 29.69% | |||||||||||||||
| Regulatory Capital Ratios (6,14): |
||||||||||||||||||||
| Tier I risk-based capital |
15.49% | 15.73% | 17.76% | 19.25% | 14.83% | |||||||||||||||
| Tier I (core) capital |
11.53% | 12.14% | 12.31% | 14.00% | 10.57% | |||||||||||||||
| Tangible Equity Ratio |
11.53% | 12.14% | 12.31% | 14.00% | NA | |||||||||||||||
| Total risk-based capital |
16.34% | 16.53% | 18.71% | 20.25% | 15.86% | |||||||||||||||
| Asset Quality Ratios (6): |
||||||||||||||||||||
| Non-performing assets as a percent of total assets (2) |
0.69% | 1.16% | 0.46% | 0.25% | 0.18% | |||||||||||||||
| Non-performing loans as a percent of total loans (2) |
0.88% | 1.45% | 0.55% | 0.22% | 0.17% | |||||||||||||||
| Allowance for loan losses as a percent of total loans |
0.93% | (15) | 0.82% | (15) | 0.95% | 0.94% | 0.95% | |||||||||||||
| Allowance for loan losses as a percent of non- performing loans (2) |
105.86% | (16) | 56.36% | (16) | 171.98% | 432.16% | 560.40% | |||||||||||||
| Number of full service customer facilities |
22 | 22 | 15 | 13 | 13 | |||||||||||||||
| (1) | The allowance for loan losses at December 31, 2010, 2009, 2008, 2007 and 2006 was $10.0 million, $9.2 million, $8.3 million, $7.7 million and $7.2 million, respectively. |
| (2) | Non-performing assets consist of non-performing loans and foreclosed other real estate owned (“OREO”). Non-performing loans consist of non-accrual and accruing loans 90 days or more overdue, while OREO consists of real estate acquired through foreclosure and real estate acquired by acceptance of a deed-in-lieu of foreclosure. |
| (3) | Exclusive of the $819,000 and $2.5 million (after tax) in acquisition related expenses for the years ended December 31, 2010 and 2009, respectively, and a $318,000 (after tax) special FDIC insurance assessment for the year ended December 31, 2009, net income would have been $10.9 million and $8.7 million, respectively. |
| (4) | Exclusive of the $1.4 million OTTI charge and related tax effect of $550,000, net income in 2008 would have been $8.1 million. |
| (5) | The Company issued 17,205,995 shares of common stock in its July 2005 initial public offering, including 9,189,722 shares held by United Mutual Holding Company. In December 2007, the Company completed a second step conversion and offering in which each outstanding minority share was exchanged for 1.04079 shares and 9,564,570 shares were sold in a subscription and syndicated offering. All earnings per share data and share information have been adjusted by the exchange ratio for 2007 and all periods prior. |
| (6) | Asset Quality Ratios and Regulatory Capital Ratios and the “tangible equity to tangible assets” ratio are end-of-period ratios. With the exception of end-of-period ratios, all ratios are based on average monthly balances during the indicated periods and are annualized where appropriate. |
| (7) | Exclusive of the $819,000 and $2.5 million (after tax) in acquisition related expenses for the years ended December 31, 2010 and 2009, respectively, and a $318,000 (after tax) special FDIC insurance assessment for the year ended December 31, 2009, the return on average assets would have been 0.71% and 0.68% and average equity would have been 4.85% and 3.97%, respectively. |
| (8) | Excludes the impact of goodwill of $8.2 million and $7.8 million at December 31, 2010 and 2009, respectively. |
| (9) | The interest rate spread represents the difference between weighted-average yield on interest-earning assets and the weighted-average cost of interest-bearing liabilities. |
| (10) | The net interest margin represents net interest income as a percent of average interest-earning assets. |
| (11) | Exclusive of the $1.1 million and $2.9 million in acquisition related expenses for the years ended December 31, 2010 and 2009, respectively, and a $538,000 special FDIC insurance assessment for the year ended December 31, 2009, non-interest expense to average total assets would have been 2.78% and 2.64% and the efficiency ratio would have been 69.55% and 68.49%, respectively. |
51
Table of Contents
| (12) | The efficiency ratio represents non-interest expense divided by the sum of net interest income and non-interest income and excludes gains/losses on sales of securities and loans and impairment charges on securities. |
| (13) | Exclusive of the $1.4 million OTTI charge and related tax effect of $550,000, the return on average assets and average equity would have been 0.68% and 3.59%, respectively. |
| (14) | Regulatory Capital Ratios are reported for United Bank only. |
| (15) | Exclusive of the $209.8 million and $242.9 million in loans acquired from CNB Financial and $21.4 million and $22.7 million in loans purchased from other financial institutions, allowance for loan losses as a percent of total loans would have been 1.18% and 1.07% at December 31, 2010 and 2009, respectively. |
| (16) | Excluding the $163,000 and $3.3 million in non-performing loans acquired from CNB Financial, allowance for loan losses as a percent of non-performing loans would have been 107.72 and 70.44% at December 31, 2010 and 2009, respectively. |
| ITEM 7. | MANAGEMENT’S DISCUSSION AND ANALYSIS OF FINANCIAL CONDITION AND RESULTS OF OPERATIONS |
This discussion and analysis reflects our consolidated financial statements and other relevant statistical data, and is intended to enhance your understanding of our financial condition and results of operations. The information in this section has been derived from the audited consolidated financial statements, which appear beginning on page F-1 of this Annual Report. You should read the information in this section in conjunction with the business and financial information regarding United Financial Bancorp, Inc. provided in this Annual Report.
Overview
Our results of operations depend primarily on our net interest income. Net interest income is the difference between the interest income we earn on our interest-earning assets, consisting primarily of loans, investment securities (including mortgage-backed securities, other securities and corporate and municipal bonds) and other interest-earning assets (primarily federal home loan bank stock and cash and cash equivalents), and the interest paid on our interest-bearing liabilities, consisting primarily of savings accounts, money market accounts, transaction accounts, certificates of deposit and Federal Home Loan Bank advances.
Our results of operations are also affected by our provision for loan losses, non-interest income and non-interest expense. Non-interest income consists primarily of deposit account fees, financial services fees, increases in cash value-insurance, gains and losses on the sales of loans and of securities, impairment charges for securities and miscellaneous other income. Non-interest expense consists primarily of compensation and employee benefits, data processing, occupancy, marketing and public relations, professional services, printing and office supplies, and other operating expenses. Our results of operations also may be affected significantly by general and local economic and competitive conditions, changes in market interest rates, governmental policies and actions of regulatory authorities.
Critical Accounting Policies
The SEC defines “critical accounting policies” as those that require application of management’s most difficult, subjective or complex judgments, often as a result of the need to make estimates about the effect of matters that are inherently uncertain and may change in future periods. The Company’s significant accounting policies are described in Note 1 to the consolidated financial statements. Please see those policies in conjunction with this discussion. Management believes that the following policies would be considered critical under the SEC’s definition:
Allowance for Loan Losses. The allowance for loan losses is the amount estimated by management as necessary to cover credit losses inherent in the loan portfolio at the balance sheet date. The allowance is established through the provision for loan losses which is charged against income. The methodology for determining the allowance for loan losses is considered a critical accounting policy by management due to the high degree of judgment involved, the subjectivity of the assumptions utilized and the potential for changes in the economic environment that could result in adjustments to the amount of the recorded allowance for loan losses.
52
Table of Contents
Management performs a quarterly evaluation of the adequacy of the allowance for loan losses. We consider a variety of factors in establishing this estimate including, but not limited to, prior loss experience, current economic conditions, trends in nonperforming loans and delinquency rates, the adequacy of the underlying collateral, the financial strength of the borrower, results of internal loan reviews and other relevant factors. This evaluation is inherently subjective as it requires material estimates by management that may be susceptible to significant change based on changes in economic and real estate market conditions. The allowance consists of a specific and a general component, as further described below.
A loan is considered impaired when, based on current information and events, it is probable that the Company will be unable to collect the scheduled payments of principal or interest when due according to the contractual terms of the loan agreement. Factors considered by management in determining impairment include payment status, collateral value, and the probability of collecting scheduled principal and interest payments when due. Loans that experience insignificant payment delays and payment shortfalls generally are not classified as impaired.
The Company periodically may agree to modify the contractual terms of loans. When a loan is modified and a concession is made to a borrower experiencing financial difficulty, the modification is considered a troubled debt restructuring (“TDR”). All TDRs are initially classified as impaired.
Specific component. The specific component relates to loans that are classified as impaired. Impairment is measured on a loan by loan basis for the commercial segment (commercial and industrial, commercial real estate and construction) by either the present value of expected future cash flows discounted at the loan’s effective interest rate or the fair value of the collateral if the loan is collateral dependent. A specific allowance is established when the discounted cash flows (or collateral value) of the impaired loan is lower than the carrying value of the loan. Groups of smaller balance homogenous loans are collectively evaluated for impairment. Accordingly, the Company does not separately identify individual loans in the consumer segment (residential real estate, home equity and consumer loans) for impairment disclosures, unless such loans are subject to a troubled debt restructuring agreement.
General component. The general component is based on historical loss experience adjusted for qualitative factors stratified by each of the loan classes: commercial and industrial, commercial real estate, construction, residential real estate, home equity and consumer. Management uses an average of historical losses based on a time frame appropriate to capture relevant loss data for each loan class. This historical loss factor for each loan class is adjusted for the following qualitative factors: the levels/trends in delinquencies and nonaccruals; levels and trends in charge-offs and recoveries; trends in volume and terms of loans; effects of changes in risk selection and underwriting standards and other changes in lending policies, procedures and practices; experience, ability and depth of lending management and staff; national and local economic trends and conditions; industry conditions; and effects of changes in credit concentrations. This analysis establishes factors that are applied to each loan class to determine the amount of the general component of the allowance for loan losses.
Evaluation of the Investment Portfolio for Other-Than-Temporary Impairment. The evaluation of the investment portfolio for other-than-temporary impairment is also a critical accounting estimate. On a quarterly basis, we review securities with a decline in fair value below the amortized cost of the investment to determine whether the decline in fair value is temporary or other than temporary. Declines in the fair value of marketable equity securities below their cost that are deemed to be other than temporary based on the severity and duration of the impairment are reflected in earnings as realized losses. In estimating other than temporary impairment losses for held to maturity and available for sale debt securities, impairment is required to be recognized (1) if we intend to sell the security; (2) if it is “more likely than not” that we will be required to sell the security before recovery of its amortized cost basis; or (3) the present value of expected cash flows is not sufficient to recover the entire amortized cost basis. For all impaired held to maturity and available for sale securities that we intend to sell, or more likely than not will be required to sell, the full amount of the other than
53
Table of Contents
temporary impairment is recognized through earnings. For all other impaired held to maturity or available for sale securities, credit-related other than temporary impairment is recognized through earnings, while non-credit related other than temporary impairment is recognized in other comprehensive income, net of applicable taxes.
Income Taxes. The Company uses the asset and liability method of accounting for income taxes in which deferred tax assets and liabilities are established for the temporary differences between the financial reporting basis and the tax basis of the Company’s asset and liabilities. The realization of the net deferred tax asset generally depends upon future levels of taxable income and the existence of prior years’ taxable income, to which “carry back” refund claims could be made. A valuation allowance is maintained for deferred tax assets that management estimates are more likely than not to be unrealizable based on available evidence at the time the estimate is made. Significant management judgment is required in determining income tax expense and deferred tax assets and liabilities. In determining the valuation allowance, the Company uses historical and forecasted future operating results, based upon approved business plans, including a review of the eligible carryforward periods, tax planning opportunities and other relevant considerations. These underlying assumptions can change from period to period. For example, tax law changes or variances in future projected operating performance could result in a change in the valuation allowance. Should actual factors and conditions differ materially from those considered by management, the actual realization of the net deferred tax asset could differ materially from the amounts recorded in the financial statements. If the Company is not able to realize all or part of our net deferred tax asset in the future, an adjustment to the deferred tax asset valuation allowance would be charged to income tax expense in the period such determination was made.
Goodwill and Identifiable Intangible Assets. Goodwill and identifiable intangible assets are recorded as a result of business acquisitions and combinations. These assets are evaluated for impairment annually or whenever events or changes in circumstances indicate the carrying value of these assets may not be recoverable. If the carrying amount exceeds fair value, an impairment charge is recorded to income. The fair value is based on observable market prices, when practicable. Other valuation techniques may be used when market prices are unavailable, including estimated discounted cash flows and market multiples analyses. These types of analyses contain uncertainties because they require management to make assumptions and to apply judgment to estimate industry economic factors and the profitability of future business strategies. In the event of future changes in fair value, the Company may be exposed to an impairment charge that could be material.
Fair Valuation of Financial Instruments. The Company uses fair value measurements to record fair value adjustments to certain financial instruments and to determine fair value disclosures. Trading assets, securities available for sale, and derivative instruments are recorded at fair value on a recurring basis. Additionally, from time to time, the Company may be required to record at fair value other assets on a nonrecurring basis, or to establish a loss allowance or write-down based on the fair value of impaired assets. Further, the notes to financial statements include information about the extent to which fair value is used to measure assets and liabilities, the valuation methodologies used and its impact to earnings. Additionally, for financial instruments not recorded at fair value, the notes to financial statements disclose the estimate of their fair value. Due to the judgments and uncertainties involved in the estimation process, the estimates could result in materially different results under different assumptions and conditions.
Business Strategy
Our business strategy is to operate as a well-capitalized and profitable community bank dedicated to providing exceptional personal service to our individual and business customers. Over the past several years, we have emphasized the origination of commercial and industrial loans and loans secured by commercial real estate, and we intend to increase our origination of these loans in the future. In addition, we intend to expand our branch network in our primary market area, which consists of Hampden, Hampshire and Worcester Counties, Massachusetts. We also intend to evaluate opportunities to expand into new markets, including Northern Connecticut. We may not be able to successfully implement our business strategy.
54
Table of Contents
Highlights of our business strategy are as follows:
Remaining a Community-Oriented Financial Institution. We were established in 1882 and have been operating continuously since that time, growing through internal growth and acquisitions. We have been, and continue to be, committed to meeting the financial needs of the communities in which we operate, and we are dedicated to providing quality personal service to our customers. We provide a broad range of individualized consumer and business financial services.
Expanding our Branch Network. We currently operate from 22 full-service banking offices, a drive-up only facility and a drive-up express facility. We also maintain two financial services facilities that offer insurance and investment products and financial planning services. In 2009, we opened a new branch in Chicopee and acquired six branches in Worcester County in connection with our acquisition of CNB Financial. We intend to evaluate new branch expansion opportunities, through acquisitions and de novo branching, to expand our presence within and outside our primary market area, including Central Massachusetts and Northern Connecticut. Our current business plan also calls for the acquisition and establishment of additional branch offices. In addition, we intend to evaluate acquisitions of other financial institutions, as opportunities present themselves.
Increasing our Commercial Real Estate and Commercial and Industrial Lending. We intend to continue to increase our origination of higher-yielding commercial real estate and commercial and industrial loans as a means of increasing our interest income and improving our net interest margin. We have supplemented our existing staff of commercial loan officers, increased our credit analysis resources and enhanced the outside loan review process. We originated $45.1 million of commercial real estate loans and $63.4 million of commercial and industrial loans during the year ended December 31, 2010. At December 31, 2010, our commercial real estate loans and commercial and industrial loans totaled $427.9 million and $165.3 million, respectively. The additional capital raised from our 2007 “second-step” conversion offering has increased our commercial lending capacity by enabling us to originate more loans and loans with larger balances. Originating more commercial real estate loans and commercial and industrial loans exposes us to increased risks, as discussed in the Risk Factors section of this Annual Report.
Maintaining High Asset Quality. We have emphasized maintaining strong asset quality by following conservative underwriting criteria and by originating loans secured primarily by real estate. We will continue to focus on maintaining high asset quality as we seek to expand our commercial lending activities. During the past year, the resolution of four large problem commercial real estate loans and two problem construction loans contributed to a decrease in non-performing assets from $17.8 million, or 1.16% of total assets, at December 31, 2009 to $11.0 million, or 0.69% of total assets, at December 31, 2010. These reductions were somewhat offset by the addition of one large commercial and industrial relationship and two commercial real estate loans with balances over $500,000 during 2010. Our loan portfolio has no exposure to sub-prime borrowers. In addition, net charge-offs have decreased from 0.23% of average loans outstanding for the year ended December 31, 2009 to 0.13% of our average loans outstanding for the year ended December 31, 2010. Continued weakness or further deterioration in the economy and the real estate market may lead to future increases in non-performing assets and net charge-offs.
Increasing our Share of Lower-Cost Deposits. We remain committed to gathering lower cost and more stable core deposits. We attract and retain core deposits with competitive products and rates, excellent customer service, a comprehensive marketing program and a well-established incentive-based cross-sales program. Our efforts to attract and retain core deposits have resulted in an increase in core account balances and total number of accounts during 2010. At December 31, 2010, core deposits (demand deposits, NOW accounts, money market accounts and savings accounts) totaled $680.7 million, or 59.5% of total deposits, compared to $560.7 million, or 54.0% of our total deposits, at December 31, 2009.
55
Table of Contents
Increasing and Diversifying our Sources of Non-interest Income. In order to reduce our reliance on net interest income and the impact of market rates on our financial results, we have sought to diversify our revenue stream. In connection with our success in growing our deposit base, our fee income derived from deposits has increased. Through United Wealth Management Group, a division of United Bank, we offer United Bank customers and others a complete range of non-deposit investment products and financial planning services, including mutual funds, debt, equity and government securities, insurance products, fixed and variable annuities, financial planning for individual and commercial customers and estate planning services. In 2006, United Bank purchased Levine Securities in Northampton, Massachusetts in order to expand our market and capitalize on the establishment of a new branch. United Wealth Management Group offers these services through its partnership with NFP Securities, Inc. We have also invested in bank-owned life insurance for certain executive officers and directors, providing another source of non-interest income through the recognition of the growing cash surrender value of this insurance over time.
Comparison of Financial Condition at December 31, 2010 and 2009
Balance Sheet Summary. Total assets increased $43.8 million, or 2.8%, to $1.585 billion at December 31, 2010 from $1.541 billion at December 31, 2009 mainly due to growth in interest-bearing deposits and held to maturity investment securities, partially offset by decreases in net loans and available for sale investment securities. Interest-bearing deposits increased $65.6 million reflecting excess cash on deposit at the Federal Reserve Bank funded with excess deposits. Securities held to maturity increased $69.3 million, or 109.7%, to $132.5 million at December 31, 2010 due to purchases of government-sponsored and government-guaranteed mortgaged-backed securities and industrial revenue bonds totaling $90.9 million, partially offset by maturities, calls and principal repayments of $20.7 million. Net loans decreased $49.2 million, or 4.4%, to $1.066 billion at December 31, 2010 from $1.115 billion at December 31, 2009 reflecting the sale of $27.1 million in lower coupon, fixed rate residential mortgages. At year end, the Company continued to have considerable liquidity including significant unused borrowing capacity at the Federal Home Loan Bank and access to funding through the repurchase agreement and brokered deposit markets. The Company’s balance sheet is also supported by a strong capital position, with total stockholders’ equity of $222.6 million, or 14.0% of total assets, at December 31, 2010.
Loans. Net loans decreased $49.2 million, or 4.4%, to $1.066 billion at December 31, 2010 from $1.115 billion at December 31, 2009. Commercial real estate loans increased $18.3 million, or 4.5%, to $428.0 million, and commercial and industrial loans increased $5.9 million, or 3.7%, to $165.3 million, as a result of the economic activity in our primary market area, competitive pricing, attractive products and services, established relationships and successful business development efforts. One- to four-family residential mortgage loans decreased $47.6 million, or 13.9%, to $295.7 million at December 31, 2010, due to sales of lower coupon, fixed rate mortgages totaling $27.1 million. Construction loans decreased $21.3 million, or 43.6%, to $27.6 million, as several credits converted to fixed-rate commercial mortgages or were paid-in-full and management elected to be more cautious in evaluating and approving funding for construction projects. A significant portion of these loans mature in less than a year and will either convert to permanent financing or pay-off in full. Automobile loan balances declined $3.7 million or 25.0%, to $11.1 million reflecting a slow-down in demand in connection with weaker car sales and payments on existing loans. We continued to focus our efforts on growing the commercial real estate and commercial and industrial loan portfolios in order to increase our interest income and improve our net interest rate spread.
Asset Quality. Throughout 2010, economic conditions improved modestly which was reflected in lower delinquency and non-performing assets at December 31, 2010. In 2009, we experienced the effects of the fallout from the collapse of the sub-prime mortgage market. Although we did not originate or invest in sub-prime mortgages, our lending business is tied, in large part, to the housing market. While declines in home prices, increases in foreclosures and higher unemployment adversely affected the credit performance of some real estate-related loans in recent years, by December 31, 2010 we had recognized improvements in risk characteristics within the real estate segment of our loan portfolio. Our asset quality has also been impacted by a strategy
56
Table of Contents
adopted several years ago to emphasize the origination of commercial and industrial loans and commercial mortgages. These loans have increased as a percentage of our total loan portfolio in recent years and generally have more risk than one- to four-family residential mortgage loans. Because the repayment of commercial and industrial loans and commercial mortgages depends on the successful management and operation of the borrower’s properties or related businesses, repayment of such loans can be affected by adverse conditions in the real estate market or the local economy.
As a result of modest improvements in the economy and the resolution of several classified loans, we experienced a decrease in non-performing loans and classified assets in 2010. Non-performing loans decreased $6.9 million to $9.4 million, or 0.88% of total loans, at December 31, 2010 compared to $16.3 million, or 1.45% of total loans, at December 31, 2009. The decrease in non-performing loans was primarily due to the impact of the resolution of four large problem commercial real estate loans and two problem construction loans somewhat offset by the addition of one large commercial and industrial relationship and two commercial real estate loans with balances over $500,000 during 2010. Our loan portfolio has no exposure to sub-prime borrowers. In addition to the non-performing loans, the Company has identified $73.9 million of classified assets at December 31, 2010, compared to $80.5 million at December 31, 2009. Classified assets include loans that are currently performing, are of lesser quality and are reported as special mention, substandard, doubtful or loss, as well as other real estate owned. At December 31, 2010 and 2009, classified loans primarily consisted of special mention and substandard commercial business loans and commercial mortgages. Other real estate owned totaled $1.5 million at December 31, 2010 and was comprised of two residential properties and three commercial properties. Management cannot predict the extent to which economic conditions may worsen or other factors may impact borrowers and the classified assets. Accordingly, there can be no assurance that additional loans will not become 90 days or more past due, be placed on nonaccrual status, become classified or restructured, or require increased allowance coverage and provision for loan losses.
Investments. Our total investment portfolio increased $31.8 million, or 10.4%, to $338.3 million at December 31, 2010 from $306.5 million at December 31, 2009, mainly due to purchases totaling $140.2 million, offset by sales of $11.6 million and calls, maturities and principal repayments totaling $97.4 million.
Deposits and Other Funding Sources. Total deposits increased $104.4 million, or 10%, to $1.1 billion at December 31, 2010 from $1.0 billion at December 31, 2009, primarily due to growth in core deposits accounts driven by the success of sales and marketing initiatives in our new Worcester market, competitive products and pricing, attention to excellence in customer service and targeted promotional activities. Core deposits increased $120.0 million, or 21.4%, to $680.7 million at December 31, 2010, and represented 59.5% of total deposits.
FHLB Advances. At December 31, 2010, we had $153.3 million in long term FHLB advances. Due to liquidity provided by strong deposit growth total FHLB advances decreased $54.9 million, or 54.9% to $153.3 million during 2010.
Total Stockholders’ Equity. Total stockholders’ equity decreased $2.7 million, or 1.2%, to $222.6 million at December 31, 2010 from $225.2 million at December 31, 2009, mainly as a result of repurchases of our common stock totaling $10.6 million and cash dividends totaling $4.6 million partially offset by net income of $10.0 million, stock-based compensation of $2.4 million, and other comprehensive income of $500,000.
Comparison of Operating Results for the Years Ended December 31, 2010 and 2009
Net Income. Net income for the year ended December 31, 2010 totaled $10.0 million, or $0.65 per diluted share, compared to net income of $5.8 million, or $0.38 per diluted share, for the same period in 2009. Excluding acquisition-related expenses of $1.1 million ($819,000 net of tax benefit), net income would have been $10.9 million, or $0.70 per diluted share, in 2010. Excluding acquisition-related expenses totaling $2.9 million ($2.5 million net of tax benefit), net income would have been $8.3 million, or $0.55 per diluted share, for 2009.
57
Table of Contents
Average Balances and Yields. The following table sets forth average balance sheets, average yields and costs, and certain other information for the periods indicated. No tax-equivalent yield adjustments were made, as the effect thereof was not material. Loan fees are not included in interest income amounts. All average balances are daily average balances. Non-accrual loans were included in the computation of average balances, but have been reflected in the table as loans carrying a zero yield.
| Years Ended December 31, | ||||||||||||||||||||||||
| 2010 | 2009 | |||||||||||||||||||||||
| Average |
Interest and |
Yield/ |
Average |
Interest and |
Yield/ |
|||||||||||||||||||
| (Dollars in thousands) | ||||||||||||||||||||||||
| Interest-earning assets: |
||||||||||||||||||||||||
| Loans: |
||||||||||||||||||||||||
| Residential real estate(1) |
$ | 322,241 | $ | 17,308 | 5.37% | $ | 340,396 | $ | 18,738 | 5.50% | ||||||||||||||
| Commercial real estate |
459,901 | 28,958 | 6.30% | 312,120 | 18,568 | 5.95% | ||||||||||||||||||
| Home equity loans |
139,633 | 5,730 | 4.10% | 123,484 | 5,530 | 4.48% | ||||||||||||||||||
| Commercial and industrial |
155,036 | 8,306 | 5.36% | 90,396 | 4,732 | 5.23% | ||||||||||||||||||
| Consumer and other |
22,201 | 1,252 | 5.64% | 26,333 | 1,484 | 5.64% | ||||||||||||||||||
| Total loans(2) |
1,099,012 | 61,554 | 5.60% | 892,729 | 49,052 | 5.49% | ||||||||||||||||||
| Investment securities |
301,542 | 12,238 | 4.06% | 291,310 | 13,904 | 4.77% | ||||||||||||||||||
| Other interest-earning assets |
49,498 | 66 | 0.13% | 23,666 | 30 | 0.13% | ||||||||||||||||||
| Total interest-earning assets |
1,450,052 | 73,858 | 5.09% | 1,207,705 | 62,986 | 5.22% | ||||||||||||||||||
| Noninterest-earning assets(3) |
86,042 | 60,267 | ||||||||||||||||||||||
| Total assets |
$ | 1,536,094 | $ | 1,267,972 | ||||||||||||||||||||
| Interest-bearing liabilities: |
||||||||||||||||||||||||
| Savings accounts |
$ | 185,336 | 1,679 | 0.91% | $ | 124,606 | 1,320 | 1.06% | ||||||||||||||||
| Money market accounts |
236,158 | 2,121 | 0.90% | 183,652 | 2,209 | 1.20% | ||||||||||||||||||
| NOW accounts |
38,224 | 199 | 0.52% | 31,161 | 149 | 0.48% | ||||||||||||||||||
| Certificates of deposit |
456,039 | 9,848 | 2.16% | 375,972 | 10,617 | 2.82% | ||||||||||||||||||
| Total interest-bearing deposits |
915,757 | 13,847 | 1.51% | 715,391 | 14,295 | 2.00% | ||||||||||||||||||
| FHLB advances |
167,566 | 5,765 | 3.44% | 171,301 | 6,662 | 3.89% | ||||||||||||||||||
| Other interest-bearing liabilities |
51,004 | 1,335 | 2.62% | 36,163 | 1,029 | 2.85% | ||||||||||||||||||
| Total interest-bearing liabilities |
1,134,327 | 20,947 | 1.85% | 922,855 | 21,986 | 2.38% | ||||||||||||||||||
| Demand deposits |
168,189 | 118,434 | ||||||||||||||||||||||
| Other noninterest-bearing liabilities |
9,971 | 8,912 | ||||||||||||||||||||||
| Total liabilities |
1,312,487 | 1,050,201 | ||||||||||||||||||||||
| Stockholders' equity |
223,607 | 217,771 | ||||||||||||||||||||||
| Total liabilities and stockholders' equity |
$ | 1,536,094 | $ | 1,267,972 | ||||||||||||||||||||
| Net interest income |
$ | 52,911 | $ | 41,000 | ||||||||||||||||||||
| Interest rate spread(4) |
3.26% | 2.83% | ||||||||||||||||||||||
| Net interest-earning assets(5) |
$ | 315,725 | $ | 284,850 | ||||||||||||||||||||
| Net interest margin(6) |
3.65% | 3.39% | ||||||||||||||||||||||
| Average interest-earning assets to average interest-bearing liabilities |
127.83% | 130.87% | ||||||||||||||||||||||
| (1) | Includes loans held for sale. |
| (2) | Loans, including non-accrual loans, are net of deferred loan origination costs and advanced funds. |
| (3) | Includes bank-owned life insurance, the income on which is classified as non-interest income. |
| (4) | Net interest rate spread represents the difference between the yield on average interest-earning assets and the cost of average interest-bearing liabilities. |
| (5) | Net interest-earning assets represent total interest-earning assets less total interest-bearing liabilities. |
| (6) | Net interest margin represents annualized net interest income divided by average total interest-earning assets. |
58
Table of Contents
Rate/Volume Analysis. The following table presents the effects of changing rates and volumes on our net interest income for the periods indicated. The rate column shows the effects attributable to changes in rate (changes in rate multiplied by prior volume). The volume column shows the effects attributable to changes in volume (changes in volume multiplied by prior rate). The net column represents the sum of the prior columns. For purposes of this table, changes attributable to both rate and volume, which cannot be segregated, have been allocated proportionately, based on the changes due to rate and the changes due to volume.
| Years Ended December 31, 2010 vs. 2009 |
||||||||||||
| Increase (Decrease) Due to | Net | |||||||||||
| Volume | Rate | |||||||||||
| (In thousands) | ||||||||||||
| Interest-earning assets: |
||||||||||||
| Loans: |
||||||||||||
| Residential real estate(1) |
$ | (983) | $ | (447) | $ | (1,430) | ||||||
| Commercial real estate |
9,249 | 1,141 | 10,390 | |||||||||
| Home equity loans |
686 | (486) | 200 | |||||||||
| Commercial and industrial |
3,460 | 114 | 3,574 | |||||||||
| Consumer and other |
(233) | 1 | (232) | |||||||||
| Total loans |
12,179 | 323 | 12,502 | |||||||||
| Investment securities |
474 | (2,140) | (1,666) | |||||||||
| Other interest-earning assets |
35 | 1 | 36 | |||||||||
| Total interest-earning assets |
12,688 | (1,816) | 10,872 | |||||||||
| Interest-bearing liabilities: |
||||||||||||
| Savings accounts |
571 | (212) | 359 | |||||||||
| Money market accounts |
547 | (635) | (88) | |||||||||
| NOW accounts |
36 | 14 | 50 | |||||||||
| Certificates of deposit |
2,008 | (2,777) | (769) | |||||||||
| Total interest-bearing deposits |
3,162 | (3,610) | (448) | |||||||||
| FHLB advances |
(142) | (755) | (897) | |||||||||
| Other interest-bearing liabilities |
394 | (88) | 306 | |||||||||
| Total interest-bearing liabilities |
3,414 | (4,453) | (1,039) | |||||||||
| Change in net interest income |
$ | 9,274 | $ | 2,637 | $ | 11,911 | ||||||
(1) Includes loans held for sale.
Net Interest Income Before Provision for Loan Losses. Net interest income before provision for loan losses increased $11.9 million, or 29.0%, to $52.9 million for the year ended December 31, 2010 from $41.0 million for 2009 reflecting growth in average earning assets and net interest margin expansion. Average earning assets increased $242.3 million, or 20.1%, to $1.5 billion mainly due to the Company’s acquisition of CNB Financial Corp. in the fourth quarter of 2009. Net interest margin increased 26 basis points to 3.65% for the year ended December 31, 2010 from 3.39% for the prior year reflecting amortization of certain acquisition accounting adjustments totaling $2.6 million and improved spreads.
Interest Income. Interest income increased $10.9 million, or 17.3%, to $73.9 million for the year ended December 31, 2010 from $63.0 million for the prior year reflecting an increase in average interest-earning assets, partially offset by an decrease in the yield on earning assets. Total average interest-earning asset balances increased $242.3 million, or 20.1%, to $1.5 billion during 2010, due in large part to the Company’s acquisition of CNB Financial Corp. in the fourth quarter of 2009 and, to a lesser extent, organic loan origination activity and an increase in excess cash balances. These items were partially offset by loan and investment security sales and prepayments and normal amortization of the existing loan and mortgage-backed securities portfolio. The yield on average interest-earning assets decreased 13 basis points to 5.09% for the year ended December 31, 2010 in connection with the lower interest rate environment, partially offset by accretion of certain loan fair value accounting adjustments totaling $1.6 million The decrease in market rates contributed to the downward repricing of a portion of the Company’s existing assets and to lower rates for new assets.
59
Table of Contents
Interest Expense. Interest expense decreased $1.0 million, or 4.7%, to $20.9 million for the year ended December 31, 2010 from $22.0 million for the prior year due to a decrease in the average rate paid on interest-bearing liabilities, partially offset by growth in average interest-bearing liabilities. The average rate paid on interest-bearing liabilities declined 53 basis points to 1.85% for the year ended December 31, 2010 reflecting the repricing of savings, money market and certificate of deposit balances in response to the lower interest rate environment as well as a $1.1 million reduction in interest expense associated with the amortization of certain deposits and borrowings fair value accounting adjustments. Average interest-bearing liabilities increased $211.5 million, or 22.9%, to $1.1 billion for the year ended December 31, 2010 reflecting growth in interest-bearing deposits and other interest-bearing liabilities due in large part to the Company’s acquisition of CNB Financial Corp. in the fourth quarter of 2009 and organic growth in the Springfield and Worcester markets. Total average interest-bearing deposits increased $200.4 million, or 28.0%, to $915.8 million for the year ended December 31, 2010 mainly attributable to an increase in savings, money market and certificate of deposit balances related to our new Worcester market, attractive products, competitive pricing and excellent customer service. Other interest-bearing liabilities increased $14.8 million or 41.0% reflecting growth in customer repurchase agreement balances.
Provision for Loan Losses. We establish provisions for loan losses, which are charged to operations, at a level necessary to absorb known and inherent losses that are both probable and reasonably estimable at the date of the financial statements. In evaluating the level of the allowance for loan losses, management considers historical loss experience, the types of loans and the amount of loans in the loan portfolio, trends in nonperforming loans and delinquency rates, adverse situations that may affect the borrower’s ability to repay, the estimated value of any underlying collateral, peer group information and prevailing economic conditions. This evaluation is inherently subjective as it requires estimates that are susceptible to significant revision as more information becomes available or as future events occur. The provision for loan losses was $2.3 million for the year ended December 31, 2010 as compared to $3.0 million for 2009. The decrease in the 2010 provision reflects the impact of improving asset quality, a decrease in net loan originations and loan sales. The allowance for loan losses was $10.0 million, or 0.93% of loans outstanding, at December 31, 2010. Excluding the impact of the $209.8 million of loans acquired from CNB Financial and $21.4 million of loans acquired from other financial institutions, the ratio of the allowance for loan losses to total loans would have been 1.18%.
Non-interest Income. Non-interest income increased $40,000, or 0.5%, to $8.7 million for the year ended December 31, 2010 mainly attributable to growth in deposit service charges of $450,000, or 9.2%, as a result of growth in accounts and transactions and an increase of $210,000, or 57.9%, on gains from sales of lower coupon, fixed rate residential mortgages. These items were partially offset by losses totaling $185,000 from sales of substandard municipal securities as well as Fannie Mae and Freddie Mac stock in 2010 compared to gains of $543,000 from sales of securities in 2009 and an other-than-temporary impairment charge of an equity security of $145,000 in the first quarter of 2010.
Non-interest Expense. Non-interest expense increased $7.0 million, or 18.9%, to $43.8 million for the year ended December 31, 2010, from $36.9 million for the prior year. Excluding acquisition-related expenses of $1.1 million in 2010 and $2.9 million in 2009, total non-interest expenses would have increased $8.7 million, or 25.6%. Total salaries and benefits increased $5.1 million, or 26.9%, mainly due to costs incurred to support our new Worcester operations and, to a lesser extent, annual wage increases and a larger incentive accrual due to improved operating performance. Occupancy costs grew $786,000, or 30.1%, principally attributable to expenses incurred to operate our new Worcester facilities. Data processing costs increased $661,000, or 19.2%, reflecting expenses for our new Worcester accounts and a larger loan and deposit account base in our Springfield market. Marketing expenses increased $621,000, or 42.2%, in connection with advertising and promotional expenses focused on our Worcester market. Professional service costs increased $453,000, or 33.3%, as a result of increases in audit and accounting, legal and consulting costs related to the new Worcester operations and, to a lesser extent, expenses associated with loan workout activities and third party loan reviews. Other expenses increased $1.2 million, or 24.9%, primarily attributable to increases in costs to operate in Worcester including equipment maintenance, depreciation, telephone, postage and supplies as well as a $181,000 operating loss from
60
Table of Contents
an investment in a low income housing tax credit fund. These items were partially offset by a decrease of $76,000 in FDIC insurance premiums due to a one-time special assessment of $538,000 incurred in 2009 partially offset by a higher deposit base in 2010.
Income Tax Expense. Income tax expense increased $1.5 million, or 36.2%, to $5.5 million for year ended December 31, 2010 from $4.0 million for the comparable 2009 period due in large part to an increase in income before income taxes offset by a decrease in the effective rate from 40.9% to 35.3%. The higher effective tax rate in 2009 was primarily driven by non-deductible merger expenses.
Comparison of Operating Results for the Years Ended December 31, 2009 and 2008
Net Income. Net income for the year ended December 31, 2009 totaled $5.8 million, or $0.38 per diluted share, compared to net income of $7.3 million, or $0.44 per diluted share, for 2008. Excluding the impact of acquisition related expenses totaling $2.9 million ($2.5 million net of tax benefit), and the second quarter special FDIC insurance assessment of $537,000 ($312,000 net of tax benefit), net income would have been $8.6 million, or $0.57 per diluted share in the 2009 period. Excluding a non-cash charge of $1.4 million ($850,000, net of tax benefit) for other-than-temporary-impairment of specific securities, 2008 net income would have been $8.1 million, or $0.50 per diluted share.
61
Table of Contents
Average Balances and Yields. The following table sets forth average balance sheets, average yields and costs, and certain other information for the periods indicated. No tax-equivalent yield adjustments were made, as the effect thereof was not material. Loan fees are not included in interest income amounts. All average balances are daily average balances. Non-accrual loans were included in the computation of average balances, but have been reflected in the table as loans carrying a zero yield.
| Years Ended December 31, | ||||||||||||||||||||||||
| 2009 | 2008 | |||||||||||||||||||||||
| Average |
Interest |
Yield/ |
Average |
Interest |
Yield/ |
|||||||||||||||||||
| (Dollars in thousands) | ||||||||||||||||||||||||
| Interest-earning assets: |
||||||||||||||||||||||||
| Loans: |
||||||||||||||||||||||||
| Residential real estate(1) |
$ | 340,396 | $ | 18,738 | 5.50% | $ | 356,685 | $ | 20,069 | 5.63% | ||||||||||||||
| Commercial real estate |
312,120 | 18,568 | 5.95% | 260,675 | 16,411 | 6.30% | ||||||||||||||||||
| Home equity loans |
123,484 | 5,530 | 4.48% | 119,401 | 6,793 | 5.69% | ||||||||||||||||||
| Commercial and industrial |
90,396 | 4,732 | 5.23% | 83,470 | 5,223 | 6.26% | ||||||||||||||||||
| Consumer and other |
26,333 | 1,484 | 5.64% | 30,211 | 1,679 | 5.56% | ||||||||||||||||||
| Total loans(2) |
892,729 | 49,052 | 5.49% | 850,442 | 50,175 | 5.90% | ||||||||||||||||||
| Investment securities |
291,310 | 13,904 | 4.77% | 280,447 | 14,109 | 5.03% | ||||||||||||||||||
| Other interest-earning assets |
23,666 | 30 | 0.13% | 16,103 | 530 | 3.29% | ||||||||||||||||||
| Total interest-earning assets |
1,207,705 | 62,986 | 5.22% | 1,146,992 | 64,814 | 5.65% | ||||||||||||||||||
| Noninterest-earning assets(3) |
60,267 | 39,501 | ||||||||||||||||||||||
| Total assets |
$ | 1,267,972 | $ | 1,186,493 | ||||||||||||||||||||
| Interest-bearing liabilities: |
||||||||||||||||||||||||
| Savings accounts |
$ | 124,606 | 1,320 | 1.06% | $ | 84,816 | 1,015 | 1.20% | ||||||||||||||||
| Money market accounts |
183,652 | 2,209 | 1.20% | 170,439 | 3,336 | 1.96% | ||||||||||||||||||
| NOW accounts |
31,161 | 149 | 0.48% | 32,228 | 171 | 0.53% | ||||||||||||||||||
| Certificates of deposit |
375,972 | 10,617 | 2.82% | 363,836 | 13,309 | 3.66% | ||||||||||||||||||
| Total interest-bearing deposits |
715,391 | 14,295 | 2.00% | 651,319 | 17,831 | 2.74% | ||||||||||||||||||
| FHLB advances |
171,301 | 6,662 | 3.89% | 178,699 | 6,739 | 3.77% | ||||||||||||||||||
| Other interest-bearing liabilities |
36,163 | 1,029 | 2.85% | 13,686 | 433 | 3.16% | ||||||||||||||||||
| Total interest-bearing liabilities |
922,855 | 21,986 | 2.38% | 843,704 | 25,003 | 2.96% | ||||||||||||||||||
| Demand deposits |
118,434 | 107,182 | ||||||||||||||||||||||
| Other noninterest-bearing liabilities |
8,912 | 9,503 | ||||||||||||||||||||||
| Total liabilities |
1,050,201 | 960,389 | ||||||||||||||||||||||
| Stockholders' equity |
217,771 | 226,104 | ||||||||||||||||||||||
| Total liabilities and stockholders' equity |
$ | 1,267,972 | $ | 1,186,493 | ||||||||||||||||||||
| Net interest income |
$ | 41,000 | $ | 39,811 | ||||||||||||||||||||
| Interest rate spread(4) |
2.84% | 2.69% | ||||||||||||||||||||||
| Net interest-earning assets(5) |
$ | 284,850 | $ | 303,288 | ||||||||||||||||||||
| Net interest margin(6) |
3.39% | 3.47% | ||||||||||||||||||||||
| Average interest-earning assets to average interest-bearing liabilities |
130.87% | 135.95% | ||||||||||||||||||||||
| (1) | Includes loans held for sale. |
| (2) | Loans, including non-accrual loans, are net of deferred loan origination costs and advanced funds. |
| (3) | Includes bank-owned life insurance, the income on which is classified as non-interest income. |
| (4) | Net interest rate spread represents the difference between the yield on average interest-earning assets and the cost of average interest-bearing liabilities. |
| (5) | Net interest-earning assets represent total interest-earning assets less total interest-bearing liabilities. |
| (6) | Net interest margin represents annualized net interest income divided by average total interest-earning assets. |
62
Table of Contents
Rate/Volume Analysis. The following table presents the effects of changing rates and volumes on our net interest income for the periods indicated. The rate column shows the effects attributable to changes in rate (changes in rate multiplied by prior volume). The volume column shows the effects attributable to changes in volume (changes in volume multiplied by prior rate). The net column represents the sum of the prior columns. For purposes of this table, changes attributable to both rate and volume, which cannot be segregated, have been allocated proportionately, based on the changes due to rate and the changes due to volume.
| Years Ended December 31, 2009 vs. 2008 |
||||||||||||
| Increase (Decrease) Due to |
Net | |||||||||||
| Volume | Rate | |||||||||||
| (In thousands) | ||||||||||||
| Interest-earning assets: |
||||||||||||
| Loans: |
||||||||||||
| Residential real estate(1) |
$ | (903 | ) | $ | (428 | ) | $ | (1,331 | ) | |||
| Commercial real estate |
3,100 | (943 | ) | 2,157 | ||||||||
| Home equity loans |
225 | (1,488 | ) | (1,263 | ) | |||||||
| Commercial and industrial |
409 | (900 | ) | (491 | ) | |||||||
| Consumer and other |
(219 | ) | 24 | (195 | ) | |||||||
| Total loans |
2,612 | (3,735 | ) | (1,123 | ) | |||||||
| Investment securities |
535 | (740 | ) | (205 | ) | |||||||
| Other interest-earning assets |
171 | (671 | ) | (500 | ) | |||||||
| Total interest-earning assets |
3,318 | (5,146 | ) | (1,828 | ) | |||||||
| Interest-bearing liabilities: |
||||||||||||
| Savings accounts |
432 | (127 | ) | 305 | ||||||||
| Money market accounts |
242 | (1,369 | ) | (1,127 | ) | |||||||
| NOW accounts |
(6 | ) | (16 | ) | (22 | ) | ||||||
| Certificates of deposit |
431 | (3,123 | ) | (2,692 | ) | |||||||
| Total interest-bearing deposits |
1,099 | (4,635 | ) | (3,536 | ) | |||||||
| FHLB advances |
(284 | ) | 207 | (77 | ) | |||||||
| Other interest-bearing liabilities |
643 | (47 | ) | 596 | ||||||||
| Total interest-bearing liabilities |
1,458 | (4,475 | ) | (3,017 | ) | |||||||
| Change in net interest income |
$ | 1,860 | $ | (671 | ) | $ | 1,189 | |||||
(1) Includes loans held for sale.
Net Interest Income Before Provision for Loan Losses. Net interest income before provision for loan losses increased $1.2 million, or 3.0%, to $41.0 million for the year ended December 31, 2009 from $39.8 million for 2008 period reflecting growth in average earning assets, partially offset by net interest margin contraction. Average earning assets increased $60.7 million, or 5.3%, to $1.2 billion mainly due to purchases of mortgage-backed securities and loan growth. Net interest margin decreased 8 basis points to 3.39% for the year ended December 31, 2009 from 3.47% for the prior year reflecting a substantial amount of loan refinancing activity, an increase in funds held in lower-yielding cash equivalents, the elimination of the FHLB stock dividend beginning with the fourth quarter 2008 payment and the cost to fund the purchase of bank-owned life insurance and share repurchases, partially offset by improved spreads.
Interest Income. Interest income decreased $1.8 million, or 2.8%, to $63.0 million for the year ended December 31, 2009 from $64.8 million for the prior year reflecting a decrease in the yield on average interest-earning assets, partially offset by an increase in total average interest-earning asset balances. The yield on average interest-earning assets decreased 43 basis points to 5.22% for the year ended December 31, 2009 in
63
Table of Contents
connection with the lower interest rate environment. The decrease in market rates contributed to the downward repricing of a portion of the Company’s existing assets and to lower rates for new assets. Total average interest-earning asset balances increased $60.7 million, or 5.3%, to $1.2 billion for the year ended December 31, 2009 due in large part to loan growth and purchases of investment securities. Total average loans increased $42.3 million, or 5.0%, to $892.7 million during the year ended December 31, 2009 as a result of origination activity, partially offset by loan sales, prepayments and normal amortization. Total average investment securities increased by $10.9 million, or 3.9%, to $291.3 million for the year ended December 31, 2009 primarily due to purchases of mortgaged-backed securities, partially offset by sales of mortgaged-backed securities and principal repayments on existing securities.
Interest Expense. Interest expense decreased $3.0 million, or 12.1%, to $22.0 million for the year ended December 31, 2009 from $25.0 million for the prior year due to a decrease in the average rate paid on interest-bearing liabilities, partially offset by growth in average interest-bearing liabilities. The average rate paid on interest-bearing liabilities declined 58 basis points to 2.38% for the year ended December 31, 2009 reflecting the repricing of money market and certificate of deposit balances in response to interest rate cuts initiated by the Federal Reserve Board. Since a large portion of the Company’s interest-bearing liabilities are short-term, the impact of the expansion in market rates was significant. Average interest-bearing liabilities increased $79.2 million, or 9.4%, to $922.9 million for the year ended December 31, 2009 reflecting growth in interest-bearing deposits and other interest-bearing liabilities. Total average interest-bearing deposits increased $64.1 million, or 9.8%, to $715.4 million for the year ended December 31, 2009 mainly attributable to an increase in savings, money market and certificate of deposit balances related to new branches opened in 2008 and 2009, attractive products, competitive pricing and excellent customer service. Other interest-bearing liabilities increased $22.5 million or 164.2% reflecting the use of repurchase agreements to support balance sheet expansion and lengthen the duration of borrowings at attractive rates.
Provision for Loan Losses. The provision for loan losses was $3.0 million for the year ended December 31, 2009 as compared to $1.8 million for 2008. The increase in the 2009 provision reflects the impact of an expansion in non-accrual and classified assets and the continuing shift to a more commercially oriented loan portfolio. The allowance for loan losses was $9.2 million, or 0.82% of loans outstanding, at December 31, 2009. Excluding the impact of the $242.9 million of loans acquired from CNB Financial Corp. in the fourth quarter of 2009 and $22.7 million of loans acquired from other financial institutions, the ratio of the allowance for loan losses to total loans would have been 1.07%.
Non-interest Income. Non-interest income increased $3.5 million, or 66.2%, to $8.7 million for the year ended December 31, 2009 from $5.2 million for 2008. Excluding impairment charges on investment securities of $82,000 in 2009 and $1.4 million in 2008 (for information regarding the evaluation of other than temporary impairment refer to Note D—Investment Securities to the Consolidated Financial Statements), non-interest income would have increased by $2.2 million, or 32.8%, largely driven by an increase in BOLI income of $1.0 million, a $520,000 increase in net gains on sales of securities, net gains of $363,000 realized from loan sales and a $239,000, or 5.1%, increase in fee income on depositors’ accounts. The expansion in income from bank-owned life insurance reflects the purchase of an additional $20.0 million of insurance in November 2008. The increase in deposit service charges was primarily due to growth in accounts and transactions. These increases were partially offset by a decrease of $119,000 in wealth management income driven by the effect of the lower market valuations on assets under management and lower transaction fees earned from annuity sales.
Non-interest Expense. Non-interest expense increased $6.2 million, or 20.1%, to $36.9 million for the year ended December 31, 2009, from $30.7 million for the prior year period. Excluding acquisition-related expenses of $2.9 million, total non-interest expenses would have increased $3.3 million, or 10.8%. Total salaries and benefits increased $1.6 million, or 9.2%, mainly due to staffing costs for our new Chicopee branch opened in
64
Table of Contents
the second quarter of 2009, annual wage increases, growth in stock-based compensation, a higher incentive compensation accrual associated with improved financial performance and additional expenses incurred in December to operate CNB Financial. Occupancy costs grew $284,000, or 12.2%, principally attributable to new branches opened in 2008 and 2009 and costs incurred in December to operate CNB Financial. Data processing costs increased $248,000, or 7.8%, reflecting a larger loan and deposit base and new branches opened in 2008 and 2009. FDIC insurance assessments increased $1.0 million, or 202.5%, reflecting a special FDIC insurance assessment of $538,000 incurred in the second quarter of 2009 and an increase in the quarterly expense related to higher premiums that became effective in 2009. Other expenses increased $433,000, or 10.3%, primarily attributable to increases in check fraud losses and foreclosed properties costs, expenses associated with new branches opened in 2008 and 2009 and costs incurred to operate CNB Financial in December. These increases were partially offset by a decrease in professional fees of $320,000 as a result of lower legal and consulting costs.
Income Tax Expense. Income tax expense decreased $1.2 million, or 22.8%, to $4.0 million for year ended December 31, 2009 from $5.2 million for the comparable 2008 period due in large part to lower income before income taxes and to a lesser extent a slight decrease in the effective tax rate from 41.6% in 2008 to 40.9% in 2009.
Management of Market Risk
General. The majority of our assets and liabilities are monetary in nature. Consequently, our most significant form of market risk is interest rate risk. Our assets, consisting primarily of mortgage loans, have longer maturities than our liabilities, consisting primarily of deposits. As a result, a principal part of our business strategy is to manage interest rate risk and reduce the exposure of our net interest income to changes in market interest rates. Accordingly, our Board of Directors has established an Asset/Liability Management Committee which is responsible for evaluating the interest rate risk inherent in our assets and liabilities, for determining the level of risk that is appropriate, given our business strategy, operating environment, capital, liquidity and performance objectives, and for managing this risk consistent with the guidelines approved by the Board of Directors. With the assistance of an interest rate risk management consultant, senior management monitors the level of interest rate risk on a regular basis and the Asset/Liability Management Committee generally meets at least on a monthly basis to review our asset/liability policies and interest rate risk position.
Net Interest Simulation Analysis. We have sought to manage our interest rate risk in order to minimize the exposure of our earnings and capital to changes in interest rates. As part of our ongoing asset-liability management, we currently use the following strategies to manage our interest rate risk: (i) using alternative funding sources, such as advances from the Federal Home Loan Bank of Boston, to “match fund” or sell longer-term one- to four-family residential mortgage loans; (ii) emphasizing increasing our core deposits; (iii) offering adjustable-rate and shorter-term commercial real estate loans and commercial and industrial loans; (iv) offering a variety of consumer loans, which typically have shorter-terms; and (v) investing in mortgage-backed securities with variable rates or fixed rates with shorter durations. Reducing the average maturity of our interest-earning assets by increasing our investments in shorter-term loans and securities, as well as loans and securities with variable rates of interest, helps to better match the maturities and interest rates of our assets and liabilities, thereby reducing the exposure of our net interest income to changes in market interest rates.
65
Table of Contents
Net interest income at-risk measures the risk of a decline in earnings due to potential short-term and long term changes in interest rates. The table below represents an analysis of our interest rate risk as measured by the estimated changes in net interest income over the following twelve months, resulting from an instantaneous and sustained parallel shift in the yield curve of +200 and -100 basis points at December 31, 2010 and 2009. This data is for United Bank and its subsidiaries only and does not include any yield curve changes in the assets of United Financial Bancorp, Inc.
| Net Interest Income At-Risk | ||||
| Change in Interest
Rates |
Estimated Increase (Decrease) in NII (December 31, 2010) |
Estimated Increase (Decrease) in NII (December 31, 2009) | ||
| -100 |
(1.1)% | (2.8)% | ||
| Stable |
0.0% | 0.0% | ||
| +200 |
0.5% | 0.5% | ||
The preceding income simulation analysis does not represent a forecast of net interest income and should not be relied upon as being indicative of expected operating results. These hypothetical estimates are based upon numerous assumptions, which are subject to change, including: the nature and timing of interest rate levels including the yield curve shape, prepayments on loans and securities, deposit decay rates, pricing decisions on loans and deposits, reinvestment/replacement of asset and liability cash flows, and others. Also, as market conditions vary from those assumed in the income simulation models, the actual results will differ reflecting prepayment/refinancing levels likely deviating from those assumed, the varying impact of interest rate changes on caps and floors embedded in adjustable rate loans, early withdrawal of deposits, changes in product preferences, and other internal/external variables.
Net Portfolio Value Simulation Analysis. The Office of Thrift Supervision requires the computation of amounts by which the net present value of an institution’s cash flow from assets, liabilities and off balance sheet items (the institution’s net portfolio value or “NPV”) would change in the event of a range of assumed changes in market interest rates. The Office of Thrift Supervision provides all institutions that file a Consolidated Maturity/Rate Schedule as a part of their quarterly Thrift Financial Report an interest rate sensitivity report of net portfolio value. The Office of Thrift Supervision simulation model uses a discounted cash flow analysis and an option-based pricing approach to measuring the interest rate sensitivity of net portfolio value. Historically, the Office of Thrift Supervision model estimated the economic value of each type of asset, liability and off-balance sheet contract under the assumption that the United States Treasury yield curve increases or decreases instantaneously by 100 to 300 basis points in 100 basis point increments. However, given the low level of market interest rates, a net portfolio value calculation for an interest rate decrease of greater than 100 basis points was not prepared. A basis point equals one-hundredth of one percent, and 200 basis points equals two percent. An increase in interest rates from 3% to 5% would mean, for example, a 200 basis point increase in the “Change in Interest Rates” column below. The Office of Thrift Supervision provides us the results of the interest rate sensitivity model, which is based on information we provide to the Office of Thrift Supervision to estimate the sensitivity of our net portfolio value.
66
Table of Contents
The tables below set forth, at the dates indicated, the estimated changes in our net portfolio value that would result from the designated instantaneous changes in the United States Treasury yield curve. Computations of prospective effects of hypothetical interest rate changes are based on numerous assumptions, including relative levels of market interest rates, loan prepayments and deposit decay, and should not be relied upon as indicative of actual results. This data is for United Bank and its subsidiaries only and does not include any yield curve changes in the assets of United Financial Bancorp, Inc.
| December 31, 2010 | ||||||||||||||||||
| Change in Interest Rates (basis points) (1) |
Estimated NPV (2) |
NPV as a Percentage of Present Value of Assets (3) | ||||||||||||||||
| Estimated Increase (Decrease) in NPV |
NPV Ratio (4) | Increase (Decrease) (basis points) | ||||||||||||||||
| Amount | Percent | |||||||||||||||||
| (Dollars in thousands) | ||||||||||||||||||
| +300 |
$ | 146,150 | $ | (64,887) | (31)% | 9.99% | (334) | |||||||||||
| +200 |
170,561 | (40,475) | (19) | 11.34 | (198) | |||||||||||||
| +100 |
193,589 | (17,448) | (8) | 12.53 | (80) | |||||||||||||
| 0 |
211,036 | 13.32 | ||||||||||||||||
| -100 |
227,944 | 16,908 | 8 | 14.11 | 78 | |||||||||||||
| December 31, 2009 | ||||||||||||||||||
| Change in Interest Rates (basis points) (1) |
Estimated
NPV (2) |
NPV as a Percentage of Present Value of Assets (3) | ||||||||||||||||
| Estimated Increase (Decrease) in NPV |
NPV Ratio (4) | Increase (Decrease) (basis points) | ||||||||||||||||
| Amount | Percent | |||||||||||||||||
| (Dollars in thousands) | ||||||||||||||||||
| +300 |
$ | 138,536 | $ | (53,844) | (28)% | 9.83% | (278) | |||||||||||
| +200 |
160,423 | (31,957) | (17) | 11.07 | (155) | |||||||||||||
| +100 |
179,607 | (12,773) | (7) | 12.07 | (55) | |||||||||||||
| 0 |
192,380 | 12.62 | ||||||||||||||||
| -100 |
206,234 | 13,854 | 7 | 13.27 | 65 | |||||||||||||
| (1) | Assumes an instantaneous uniform change in interest rates at all maturities. |
| (2) | NPV is the discounted present value of expected cash flows from assets, liabilities and off-balance sheet contracts. |
| (3) | Present value of assets represents the discounted present value of incoming cash flows on interest-earning assets. |
| (4) | NPV ratio represents NPV divided by the present value of assets. |
The tables above indicate that at December 31, 2010 and December 31, 2009, in the event of a 300 basis point increase in interest rates, we would experience a 31% and 28%, respectively, decrease in net portfolio value. In the event of a 100 basis point decrease in interest rates at December 31, 2010 and December 31, 2009, we would experience an 8% and 7%, respectively, increase in net portfolio value.
Certain shortcomings are inherent in the methodology used in the above interest rate risk measurement. Modeling changes in net portfolio value require making certain assumptions that may or may not reflect the manner in which actual yields and costs respond to changes in market interest rates. In this regard, the net portfolio value table presented assumes that the composition of our interest-sensitive assets and liabilities existing at the beginning of a period remains constant over the period being measured and assumes that a particular change in interest rates is reflected uniformly across the yield curve regardless of the duration or repricing of specific assets and liabilities. Accordingly, although the net portfolio value table provides an indication of our interest rate risk exposure at a particular point in time, such measurements are not intended to and do not provide a precise forecast of the effect of changes in market interest rates on our net interest income and will differ from actual results.
67
Table of Contents
Liquidity and Capital Resources
Liquidity is the ability to meet current and future financial obligations of a short-term nature. Our primary sources of funds consist of deposit inflows, loan repayments, maturities and sales of securities and sales of loans. While maturities and scheduled amortization of loans and securities are predictable sources of funds, deposit flows, mortgage prepayments and loan and security sales are greatly influenced by general interest rates, economic conditions and competition. Our Asset/Liability Management Committee is responsible for establishing and monitoring our liquidity targets and strategies in order to ensure that sufficient liquidity exists for meeting the borrowing needs of our customers as well as unanticipated contingencies. We seek to maintain a liquidity ratio (defined as liquid assets less short-term liabilities) of 10% or greater. At December 31, 2010, our liquidity ratio was 22.15%.
We regularly adjust our investments in liquid assets based upon our assessment of (1) expected loan demand, (2) expected deposit flows, (3) yields available on interest-earning deposits and securities, and (4) the objectives of our asset/liability management program. Excess liquid assets are invested generally in interest-earning deposits and short- and intermediate-term securities.
Our most liquid assets are cash and cash equivalents. The levels of these assets are dependent on our operating, financing, lending and investing activities during any given period. At December 31, 2010, cash and cash equivalents totaled $83.1 million. Securities classified as available-for-sale and held-to-maturity, which provide additional sources of liquidity, totaled $205.9 million and $132.5 million, respectively, at December 31, 2010. In addition, at December 31, 2010, we had the ability to borrow a total of approximately $373.3 million from the Federal Home Loan Bank of Boston. On that date, we had $151.3 million in advances outstanding.
Our cash flows are derived from operating activities, investing activities and financing activities as reported in our Consolidated Statements of Cash Flows included in our Consolidated Financial Statements.
At December 31, 2010, we had $27.1 million in loan commitments outstanding. In addition to commitments to originate loans, we had $233.4 million in unused lines of credit to borrowers. Certificates of deposit due within one year of December 31, 2010 totaled $282.8 million, or 24.7% of total deposits. If these deposits do not remain with us, we will be required to seek other sources of funds, including other certificates of deposit, Federal Home Loan Bank advances, borrowings from the Federal Reserve Bank, reverse repurchase agreements and brokered deposits. Depending on market conditions, we may be required to pay higher rates on such deposits or other borrowings than we currently pay on the certificates of deposit due on or before December 31, 2011. We believe, however, based on past experience, a significant portion of our certificates of deposit will remain with us. We have the ability to attract and retain deposits by adjusting the interest rates offered.
Our primary investing activities are the origination of loans and the purchase of securities. In 2010, we originated $246.5 million of loans and purchased $140.1 million of securities. In 2009, we originated $264.1 million of loans and purchased $60.4 million of securities.
Financing activities consist primarily of activity in deposit accounts and Federal Home Loan Bank advances. We experienced a net increase in total deposits of $104.4 million and $256.3 million for the years ended December 31, 2010 and 2009, respectively. Deposit flows are affected by the overall level of interest rates, the interest rates and products offered by us and our local competitors and other factors.
Liquidity management is both a daily and long-term function of business management. If we require funds beyond our ability to generate them internally, borrowing agreements exist with the Federal Home Loan Bank of Boston, which provide an additional source of funds. Federal Home Loan Bank advances decreased $54.9 million for the year ended December 31, 2010 reflecting the use of cash flows received from the loan and investment portfolios to pay down short term Federal Home Loan Bank advances. For the year ended
68
Table of Contents
December 31, 2009, Federal Home Loan Bank advances decreased $391,000 reflecting the use of cash flows received from the loan and investment portfolios to pay down short term Federal Home Loan Bank advances, offset by outstanding advances assumed from CNB Financial as a result of the acquisition. Federal Home Loan Bank advances have primarily been used to fund loan demand and to purchase securities. Our current asset/liability management strategy has been to “match-fund” certain longer-term commercial real estate loans and one- to four-family residential mortgage loans with Federal Home Loan Bank advances. The Bank’s unused borrowing capacity with the FHLBB, excluding its available line of credit balance of $2.0 million at December 31, 2010 and $12.4 million at December 31, 2009, was approximately $219.9 million at December 31, 2010 and $185.8 million at December 31, 2009. At December 31, 2010 and 2009, the Bank had no borrowing against the line of credit. We also have access to funding through the repurchase agreement and brokered CD markets and have received approval from the Federal Reserve Bank to access its discount window. The Bank’s unused borrowing capacity with the FRB was approximately $63.9 million at December 31, 2010.
United Financial is a separate legal entity from the Bank and must provide for its own liquidity. In addition to its operating expenses, United Financial is responsible for paying any dividends declared to its shareholders. United Financial also has repurchased shares of its common stock. At December 31, 2010, United Financial had liquid assets of $18.4 million.
United Bank is subject to various regulatory capital requirements, including a risk-based capital measure. The risk-based capital guidelines include both a definition of capital and a framework for calculating risk-weighted assets by assigning balance sheet assets and off-balance sheet items to broad risk categories. At December 31, 2010, United Bank exceeded all regulatory capital requirements. United Bank is considered “well-capitalized” under regulatory guidelines. See Item 1. “Business—Supervision and Regulation—Federal Banking Regulation—Capital Requirements” and Note P of the Notes to the Consolidated Financial Statements.
Off-Balance Sheet Arrangements and Aggregate Contractual Obligations
Commitments. As a financial services provider, we routinely are a party to various financial instruments with off-balance-sheet risks, such as commitments to extend credit, standby letters of credit and unused lines of credit. While these contractual obligations represent our future cash requirements, a significant portion of commitments to extend credit may expire without being drawn upon. Such commitments are subject to the same credit policies and approval process accorded to loans made by us. We consider commitments to extend credit in determining our allowance for loan losses. For additional information, see Note N, “Commitments and Contingencies,” to our Consolidated Financial Statements.
Contractual Obligations. In the ordinary course of our operations, we enter into certain contractual obligations. Such obligations include operating and capitalized leases for premises and equipment.
69
Table of Contents
The following table summarizes our significant fixed and determinable contractual obligations and other funding needs by payment date at December 31, 2010. The payment amounts represent those amounts due to the recipient and do not include any unamortized premiums or discounts or other similar carrying amount adjustments.
| Payments Due by Period (In Thousands) | ||||||||||||||||||||
| Less Than One Year |
One to Three Years |
Three to Five Years |
More than Five Years |
Total | ||||||||||||||||
| Contractual Obligations: |
||||||||||||||||||||
| Certificates of deposit |
$ | 282,782 | $ | 126,414 | $ | 53,333 | $ | - | $ | 462,529 | ||||||||||
| Federal Home Loan Bank advances |
50,341 | 54,927 | 22,767 | 23,247 | 151,282 | |||||||||||||||
| Repurchase agreements |
21,029 | - | - | 20,000 | 41,029 | |||||||||||||||
| Subordinated debentures |
- | - | - | 7,732 | 7,732 | |||||||||||||||
| Standby letters of credit |
4,382 | - | - | - | 4,382 | |||||||||||||||
| Operating leases |
1,062 | 1,943 | 1,855 | 4,241 | 9,101 | |||||||||||||||
| Capitalized leases |
406 | 812 | 813 | 6,356 | 8,387 | |||||||||||||||
| Future benefits to be paid under |
25 | 3,432 | 233 | 5,628 | 9,318 | |||||||||||||||
| Total |
$ | 360,027 | $ | 187,528 | $ | 79,001 | $ | 67,204 | $ | 693,760 | ||||||||||
| Commitments: |
||||||||||||||||||||
| Commitments to extend credit |
$ | 291,353 | $ | - | $ | - | $ | - | $ | 291,353 | ||||||||||
| Commitment to invest in venture capital fund |
500 | - | - | - | 500 | |||||||||||||||
| Commitment to invest in low income tax credit fund |
3,182 | 3,503 | 413 | - | 7,098 | |||||||||||||||
| Total |
$ | 295,035 | $ | 3,503 | $ | 413 | $ | - | $ | 298,951 | ||||||||||
Recent Accounting Pronouncements
In July 2010, the FASB issued Accounting Standard Update 2010-20 (ASU 2010-20) “Disclosures about the Credit Quality of Financing Receivables and the Allowance for Credit Losses”, which amends the authoritative accounting guidance in accordance with and as required by the Receivables Topic of FASB ASC 310. The ASU is intended to provide financial statement users with greater transparency about an entity’s allowance for loan losses and the credit quality of its loan portfolio. Under the new guidelines, the allowance for loan losses and fair value are to be disclosed by portfolio segment, while credit quality information, impaired loans and non-accrual status are to be presented by class of loans. Disclosure of the nature and extent, the financial impact and segment information of troubled debt restructurings will also be required. The disclosures are to be presented at the level of disaggregation that management uses when assessing and monitoring the loan portfolio’s risk and performance. This guidance is effective for interim and annual reporting periods ending on or after December 15, 2010. The adoption of this new guidance had no material effect on the Company’s Consolidated Financial Statements.
Impact of Inflation and Changing Prices
The consolidated financial statements and related notes of United Financial Bancorp, Inc. have been prepared in accordance with accounting principles generally accepted in the United States of America (“GAAP”). GAAP generally requires the measurement of financial position and operating results in terms of historical dollars without consideration for changes in the relative purchasing power of money over time due to inflation. The impact of inflation is reflected in the increased cost of our operations. Unlike industrial companies, our assets and liabilities are primarily monetary in nature. As a result, changes in market interest rates have a greater impact on performance than the effects of inflation.
70
Table of Contents
| ITEM 7A. | QUANTITATIVE AND QUALITATIVE DISCLOSURE ABOUT MARKET RISK |
For information regarding market risk, see Item 7- “Management’s Discussion and Analysis of Financial Conditions and Results of Operations.”
| ITEM 8. | FINANCIAL STATEMENTS AND SUPPLEMENTAL DATA |
| Page | ||||
| Report of Independent Registered Public Accounting Firm on Financial Statements |
F-1 | |||
| F-2 | ||||
| F-3 | ||||
| Consolidated Statements of Stockholders’ Equity and Comprehensive Income |
F-4 | |||
| F-5 | ||||
| F-7 | ||||
71
Table of Contents
Report of Independent Registered Public Accounting Firm on Financial Statements
To the Board of Directors of
United Financial Bancorp, Inc.
We have audited the accompanying consolidated balance sheets of United Financial Bancorp, Inc. and subsidiary as of December 31, 2010 and 2009, and the related consolidated statements of earnings, stockholders’ equity and comprehensive income, and cash flows for the each of the three years in the period ended December 31, 2010. These financial statements are the responsibility of the Company’s management. Our responsibility is to express an opinion on these financial statements based on our audits.
We conducted our audits in accordance with the standards of the Public Company Accounting Oversight Board (United States). Those standards require that we plan and perform the audit to obtain reasonable assurance about whether the financial statements are free of material misstatement. An audit includes examining, on a test basis, evidence supporting the amounts and disclosures in the financial statements. An audit also includes assessing the accounting principles used and significant estimates made by management, as well as evaluating the overall financial statement presentation. We believe that our audits provide a reasonable basis for our opinion.
In our opinion, the consolidated financial statements referred to above present fairly, in all material respects, the financial position of United Financial Bancorp, Inc. and subsidiary as of December 31, 2010 and 2009, and the results of their operations and their cash flows for each of the three years in the period ended December 31, 2010 in conformity with accounting principles generally accepted in the United States of America.
We also have audited, in accordance with the standards of the Public Company Accounting Oversight Board (United States), United Financial Bancorp, Inc.’s internal control over financial reporting as of December 31, 2010, based on criteria established in Internal Control-Integrated Framework issued by the Committee of Sponsoring Organizations of the Treadway Commission (COSO) and our report dated March 14, 2011 expressed an unqualified opinion thereon.
/s/ Grant Thornton LLP
Boston, Massachusetts
March 14, 2011
F-1
Table of Contents
UNITED FINANCIAL BANCORP, INC. AND SUBSIDIARY
Consolidated Balance Sheets
December 31, 2010 and 2009
(Dollars in thousands except per share amounts)
| 2010 | 2009 | |||||||
| ASSETS |
||||||||
| Cash and due from banks |
$ | 10,157 | $ | 14,565 | ||||
| Interest-bearing deposits |
72,912 | 7,312 | ||||||
| Total cash and cash equivalents |
83,069 | 21,877 | ||||||
| Short-term investments |
- | 1,096 | ||||||
| Securities available for sale, at fair value |
205,852 | 243,304 | ||||||
| Securities held to maturity, at amortized cost (fair value of $132,026 at December 31, 2010 and $63,063 at December 31, 2009) |
132,475 | 63,174 | ||||||
| Loans, net of allowance for loan losses of $9,987 at December 31, 2010 and $9,180 at December 31, 2009 |
1,066,197 | 1,115,416 | ||||||
| Other real estate owned |
1,536 | 1,545 | ||||||
| Accrued interest receivable |
4,905 | 5,209 | ||||||
| Deferred tax asset, net |
11,029 | 11,295 | ||||||
| Stock in the Federal Home Loan Bank of Boston |
15,365 | 15,365 | ||||||
| Premises and equipment, net |
15,565 | 15,935 | ||||||
| Bank-owned life insurance |
29,180 | 28,476 | ||||||
| Goodwill |
8,192 | 7,844 | ||||||
| Other assets |
11,512 | 10,504 | ||||||
| TOTAL ASSETS |
$ | 1,584,877 | $ | 1,541,040 | ||||
| LIABILITIES AND STOCKHOLDERS’ EQUITY |
||||||||
| Liabilities: |
||||||||
| Deposits: |
||||||||
| Interest-bearing |
$ | 967,305 | $ | 884,553 | ||||
| Non-interest-bearing |
175,996 | 154,374 | ||||||
| Total deposits |
1,143,301 | 1,038,927 | ||||||
| Short-term borrowings |
21,029 | 57,303 | ||||||
| Long-term debt |
173,307 | 198,173 | ||||||
| Subordinated debentures |
5,448 | 5,357 | ||||||
| Escrow funds held for borrowers |
1,899 | 1,977 | ||||||
| Due to broker |
3,002 | - | ||||||
| Capitalized lease obligations |
5,011 | 5,141 | ||||||
| Accrued expenses and other liabilities |
9,304 | 8,916 | ||||||
| Total liabilities |
1,362,301 | 1,315,794 | ||||||
| Commitments and contingencies (Notes F and N) |
||||||||
| Stockholders’ equity: |
||||||||
| Preferred stock, par value $0.01 per share, authorized 50,000,000 shares; none issued |
- | - | ||||||
| Common stock, par value $0.01 per share, authorized 100,000,000 shares; shares issued: 18,706,933 at December 31, 2010 and December 31, 2009 |
187 | 187 | ||||||
| Paid-in capital |
180,322 | 178,666 | ||||||
| Retained earnings |
82,899 | 77,456 | ||||||
| Unearned compensation |
(10,750) | (11,441) | ||||||
| Treasury stock, at cost (2,597,827 shares at December 31, 2010 and 1,868,335 shares at December 31, 2009) |
(34,940) | (24,980) | ||||||
| Accumulated other comprehensive income, net of taxes |
4,858 | 5,358 | ||||||
| Total stockholders’ equity |
222,576 | 225,246 | ||||||
| TOTAL LIABILITIES AND STOCKHOLDERS’ EQUITY |
$ | 1,584,877 | $ | 1,541,040 | ||||
The accompanying notes are an integral part of the consolidated financial statements.
F-2
Table of Contents
UNITED FINANCIAL BANCORP, INC. AND SUBSIDIARY
Consolidated Statement of Earnings
For the years ended December 31, 2010, 2009 and 2008
(Dollars in thousands, except per share amounts)
| 2010 | 2009 | 2008 | ||||||||||
| Interest and dividend income: |
||||||||||||
| Loans |
$ | 61,554 | $ | 49,052 | $ | 50,175 | ||||||
| Investments |
12,238 | 13,904 | 14,109 | |||||||||
| Other interest-earning assets |
66 | 30 | 530 | |||||||||
| Total interest and dividend income |
73,858 | 62,986 | 64,814 | |||||||||
| Interest expense: |
||||||||||||
| Deposits |
13,847 | 14,295 | 17,831 | |||||||||
| Short-term borrowings |
229 | 1,385 | 1,417 | |||||||||
| Long-term debt |
6,871 | 6,306 | 5,755 | |||||||||
| Total interest expense |
20,947 | 21,986 | 25,003 | |||||||||
| Net interest income before provision for loan losses |
52,911 | 41,000 | 39,811 | |||||||||
| Provision for loan losses |
2,285 | 2,998 | 1,846 | |||||||||
| Net interest income after provision for loan losses |
50,626 | 38,002 | 37,965 | |||||||||
| Non-interest income: |
||||||||||||
| Fee income on depositors’ accounts |
5,327 | 4,877 | 4,638 | |||||||||
| Net gain on sales of loans |
573 | 363 | - | |||||||||
| Net (loss) gain on sales of securities |
(185) | 543 | 23 | |||||||||
| Impairment charges on securities |
(145) | (82) | (1,377) | |||||||||
| Wealth management income |
754 | 703 | 799 | |||||||||
| Income from bank-owned life insurance |
1,390 | 1,382 | 357 | |||||||||
| Other income |
1,002 | 890 | 780 | |||||||||
| Total non-interest income |
8,716 | 8,676 | 5,220 | |||||||||
| Non-interest expense: |
||||||||||||
| Salaries and benefits |
24,056 | 18,954 | 17,359 | |||||||||
| Occupancy expenses |
3,397 | 2,611 | 2,327 | |||||||||
| Marketing expenses |
2,091 | 1,470 | 1,440 | |||||||||
| Data processing expenses |
4,099 | 3,438 | 3,190 | |||||||||
| Professional fees |
1,812 | 1,359 | 1,679 | |||||||||
| Acquisition related expenses |
1,148 | 2,863 | - | |||||||||
| FDIC insurance assessments |
1,470 | 1,546 | 511 | |||||||||
| Other expenses |
5,768 | 4,617 | 4,184 | |||||||||
| Total non-interest expense |
43,841 | 36,858 | 30,690 | |||||||||
| Income before provision for income taxes |
15,501 | 9,820 | 12,495 | |||||||||
| Provision for income tax expense |
5,469 | 4,014 | 5,197 | |||||||||
| Net income |
$ | 10,032 | $ | 5,806 | $ | 7,298 | ||||||
| Earnings per share: |
||||||||||||
| Basic |
$ | 0.66 | $ | 0.38 | $ | 0.44 | ||||||
| Diluted |
$ | 0.65 | $ | 0.38 | $ | 0.44 | ||||||
| Weighted average shares outstanding: |
||||||||||||
| Basic |
15,302,505 | 15,265,192 | 16,445,388 | |||||||||
| Diluted |
15,394,761 | 15,273,375 | 16,445,388 | |||||||||
The accompanying notes are an integral part of the consolidated financial statements.
F-3
Table of Contents
UNITED FINANCIAL BANCORP, INC. AND SUBSIDIARY
Consolidated Statements of Stockholders’ Equity and Comprehensive Income
For the years ended December 31, 2010, 2009 and 2008
(Dollars in thousands)
| Common Shares Outstanding |
Common Stock |
Paid-In Capital |
Retained Earnings |
Unearned Compensation |
Treasury Stock |
Accumulated Other Comprehensive Income (Loss) |
Total | |||||||||||||||||||||||||
| Balances at December 31, 2007 |
17,763,747 | $ | 178 | $ | 165,920 | $ | 73,026 | $ | (12,835) | $ - | $ | (169) | $ | 226,120 | ||||||||||||||||||
| Net income |
- | - | - | 7,298 | - | - | - | 7,298 | ||||||||||||||||||||||||
| Net unrealized gain on securities available for sale, net of reclassification adjustments and taxes |
- | - | - | - | - | - | 3,331 | 3,331 | ||||||||||||||||||||||||
| Adjustments to pension and other post-retirement benefit plans, net of reclassification adjustments and taxes |
- | - | - | - | - | - | (231) | (231) | ||||||||||||||||||||||||
| Total comprehensive income |
10,398 | |||||||||||||||||||||||||||||||
| Net costs from issuance of common stock pursuant to second-step conversion |
|
- |
|
|
- |
|
(26) | - | - | - | - | (26) | ||||||||||||||||||||
| Repurchase of stock to fund the 2008 Equity Incentive |
||||||||||||||||||||||||||||||||
| Plan |
(359,581) | - | - | - | - | (4,240) | - | (4,240) | ||||||||||||||||||||||||
| Shares repurchased in connection with restricted stock forfeited for tax purposes |
(10,086) | - | - | - | - | (125) |
|
- |
|
(125) | ||||||||||||||||||||||
| Reissuance of treasury shares in connection with restricted stock grants and stock appreciation rights exercised |
314,069 | - | (3,703) | - | - | 3,703 | - | - | ||||||||||||||||||||||||
| Cash dividends paid ($0.27 per share) |
- | - | - | (4,436) | - | - | - | (4,436) | ||||||||||||||||||||||||
| Treasury stock purchases |
(206,200) | - | - | - | - | (2,835) | - | (2,835) | ||||||||||||||||||||||||
| Stock-based compensation |
- | - | 1,992 | - | - | - | - | 1,992 | ||||||||||||||||||||||||
| ESOP shares committed to be released |
- | - | 175 | - | 691 | - | - | 866 | ||||||||||||||||||||||||
| Balances at December 31, 2008 |
17,501,949 | 178 | 164,358 | 75,888 | (12,144) | (3,497) | 2,931 | 227,714 | ||||||||||||||||||||||||
| Net income |
- | - | - | 5,806 | - | - | - | 5,806 | ||||||||||||||||||||||||
| Net unrealized gain on securities available for sale, net of reclassification adjustments and taxes |
- | - | - | - | - | - | 2,119 | 2,119 | ||||||||||||||||||||||||
| Adjustments to pension and other post-retirement benefit plans, net of reclassification adjustments and taxes |
- | - | - | - | - | - | 308 | 308 | ||||||||||||||||||||||||
| Total comprehensive income |
8,233 | |||||||||||||||||||||||||||||||
| Shares issued pursuant to the acquisition of CNB Financial |
943,186 | 9 | 12,101 | - | - | - | - | 12,110 | ||||||||||||||||||||||||
| Cash paid for in-the-money stock options and warrants |
- | - | (354) | - | - | - | - | (354) | ||||||||||||||||||||||||
| Shares repurchased in connection with restricted stock forfeited for tax purposes |
(21,088) | - | - | - | - | (273) | - | (273) | ||||||||||||||||||||||||
| Tax benefit from MRP vesting |
- | - | 34 | - | - | - | - | 34 | ||||||||||||||||||||||||
| Reissuance of treasury shares in connection with restricted stock grants |
398 | - | (5) | - | - | 5 | - | - | ||||||||||||||||||||||||
| Cash dividends paid ($0.28 per share) |
- | - | - | (4,238) | - | - | - | (4,238) | ||||||||||||||||||||||||
| Treasury stock purchases |
(1,585,847) | - | - | - | - | (21,215) | - | (21,215) | ||||||||||||||||||||||||
| Stock-based compensation |
- | - | 2,281 | - | - | - 3 | - | 2,281 | ||||||||||||||||||||||||
| ESOP shares committed to be released |
- | - | 251 | - | 703 | - | - | 954 | ||||||||||||||||||||||||
| Balances at December 31, 2009 |
16,838,598 | 187 | 178,666 | 77,456 | (11,441) | (24,980) | 5,358 | 225,246 | ||||||||||||||||||||||||
| Net income |
- | - | - | 10,032 | - | - | - | 10,032 | ||||||||||||||||||||||||
| Net unrealized loss on securities available for sale, net of reclassification adjustments and taxes |
- | - | - | - | - | - | (427) | (427) | ||||||||||||||||||||||||
| Adjustments to pension and other post-retirement benefit plans, net of reclassification adjustments and taxes |
- | - | - | - | - | - | (73) | (73) | ||||||||||||||||||||||||
| Total comprehensive income |
9,532 | |||||||||||||||||||||||||||||||
| Shares repurchased in connection with restricted stock forfeited for tax purposes |
(28,061) | - | - | - | - | (401) | - | (401) | ||||||||||||||||||||||||
| Tax benefit from MRP vesting |
- | - | 115 | - | - | - | - | 115 | ||||||||||||||||||||||||
| Tax withheld on options exercised |
- | - | (29) | - | - | - | - | (29) | ||||||||||||||||||||||||
| Reissuance of treasury shares in connection with restricted stock grants |
82,495 | - | (1,087) | - | - | 1,087 | - | - | ||||||||||||||||||||||||
| Cash dividends paid ($0.30 per share) |
- | - | - | (4,589) | - | - | - | (4,589) | ||||||||||||||||||||||||
| Treasury stock purchases |
(783,926) | - | - | - | - | (10,646) | - | (10,646) | ||||||||||||||||||||||||
| Stock-based compensation |
- | - | 2,383 | - | - | - | - | 2,383 | ||||||||||||||||||||||||
| ESOP shares committed to be released |
- | - | 274 | - | 691 | - | - | 965 | ||||||||||||||||||||||||
| Balances at December 31, 2010 |
16,109,106 | $ | 187 | $ | 180,322 | $ | 82,899 | $ | (10,750) | $ | (34,940) | $ | 4,858 | $ | 222,576 | |||||||||||||||||
The accompanying notes are an integral part of the consolidated financial statements.
F-4
Table of Contents
UNITED FINANCIAL BANCORP, INC. AND SUBSIDIARY
Consolidated Statements of Cash Flows
For the years ended December 31, 2010, 2009 and 2008
(Dollars in thousands)
| 2010 | 2009 | 2008 | ||||||||||
| Cash flows from operating activities: |
||||||||||||
| Net income |
$ | 10,032 | $ | 5,806 | $ | 7,298 | ||||||
| Adjustments to reconcile net income to net cash provided by operating activities: |
||||||||||||
| Provision for loan losses |
2,285 | 2,998 | 1,846 | |||||||||
| ESOP expense |
965 | 954 | 866 | |||||||||
| Stock-based compensation |
2,383 | 2,281 | 1,992 | |||||||||
| Tax benefit from MRP vesting |
(115) | (34) | - | |||||||||
| Amortization of premiums and discounts |
1,355 | 402 | 192 | |||||||||
| Depreciation and amortization |
1,516 | 1,119 | 907 | |||||||||
| Amortization of intangible assets |
110 | 23 | 30 | |||||||||
| Provision for other real estate owned |
37 | 55 | 92 | |||||||||
| Loans originated for sale |
(17,423) | (16,018) | - | |||||||||
| Proceeds from sales of loans held for sale |
17,906 | 16,381 | - | |||||||||
| Net gain on sales of loans |
(573) | (363) | - | |||||||||
| Net (gain) loss on sale of other real estate owned |
(122) | 30 | 45 | |||||||||
| Net loss (gain) on sale of available for sale securities |
185 | (543) | (23) | |||||||||
| Impairment charges on securities |
145 | 82 | 1,377 | |||||||||
| Deferred (prepaid) tax provision |
672 | (1,556) | (3,577) | |||||||||
| Net increase in cash surrender value of bank-owned life insurance |
(704) | (1,303) | (521) | |||||||||
| Decrease (increase) in accrued interest receivable |
304 | 387 | (229) | |||||||||
| Increase in other assets |
(1,523) | (1,859) | (1,380) | |||||||||
| Increase (decrease) in accrued expenses and other liabilities |
645 | (5,898) | 1,842 | |||||||||
| Net cash provided by operating activities |
18,080 | 2,944 | 10,757 | |||||||||
| Cash flows from investing activities: |
||||||||||||
| Purchases of securities available for sale |
(49,283) | (4,482) | (231,991) | |||||||||
| Proceeds from sales of securities available for sale |
11,586 | 31,808 | 51,448 | |||||||||
| Proceeds from calls, maturities and principal repayments of securities available for sale |
76,679 | 71,156 | 72,136 | |||||||||
| Purchases of securities held to maturity |
(90,876) | (55,967) | - | |||||||||
| Proceeds from maturities, calls and principal repayments of securities held to maturity |
20,723 | 3,538 | 435 | |||||||||
| Decrease (increase) in investment in short-term time deposits |
1,096 | (25) | (41) | |||||||||
| Purchases of Federal Home Loan Bank of Boston stock |
- | - | (1,966) | |||||||||
| Proceeds from sales of other real estate owned |
1,681 | 782 | 655 | |||||||||
| Net loan (originations), (purchases) and principal repayments |
35,624 | (31,636) | (48,060) | |||||||||
| Proceeds from sales of loans |
9,725 | 13,637 | - | |||||||||
| Purchases of property and equipment |
(1,134) | (946) | (1,113) | |||||||||
| Cash used for acquisition, net of cash acquired |
- | (5,097) | - | |||||||||
| Cash paid to acquire Levine Financial Group |
- | (92) | (92) | |||||||||
| Purchases of bank-owned life insurance |
- | - | (20,000) | |||||||||
| Net cash provided by (used in) investing activities |
15,821 | 22,676 | (178,589) | |||||||||
(Continued)
F-5
Table of Contents
UNITED FINANCIAL BANCORP, INC. AND SUBSIDIARY
Consolidated Statements of Cash Flows (Concluded)
For the years ended December 31, 2010, 2009 and 2008
(Dollars in thousands)
| 2010 | 2009 | 2008 | ||||||||||
| Cash flows from financing activities: |
||||||||||||
| Net increase in deposits |
104,374 | 60,243 | 63,981 | |||||||||
| Net change in short-term borrowings |
(36,274) | (30,249) | 42,323 | |||||||||
| Proceeds from issuance of long-term debt |
- | 29,181 | 95,000 | |||||||||
| Repayment of long-term debt, net of amortization of discount |
(24,775) | (50,766) | (22,578) | |||||||||
| Net increase in escrow funds held for borrowers |
(78) | 310 | 311 | |||||||||
| Payments on capitalized lease obligation |
(406) | (342) | (225) | |||||||||
| Repurchases of common stock to fund the 2008 Equity Incentive Plan |
- | - | (4,240) | |||||||||
| Tax benefit from MRP vesting |
115 | 34 | - | |||||||||
| Tax withheld on options exercised |
(29) | - | - | |||||||||
| Treasury stock purchases |
(11,047) | (21,488) | (2,960) | |||||||||
| Cash dividends paid |
(4,589) | (4,238) | (4,436) | |||||||||
| Net costs from stock offering subscriptions |
- | - | (26) | |||||||||
| Net cash provided by (used in) financing activities |
27,291 | (17,315) | 167,150 | |||||||||
| Increase (decrease) in cash and cash equivalents |
61,192 | 8,305 | (682) | |||||||||
| Cash and cash equivalents at beginning of year |
21,877 | 13,572 | 14,254 | |||||||||
| Cash and cash equivalents at end of year |
$ | 83,069 | $ | 21,877 | $ | 13,572 | ||||||
| Supplemental Disclosure of Cash Flow Information: |
||||||||||||
| Cash paid during the period: |
||||||||||||
| Interest on deposits and other borrowings |
$ | 22,378 | $ | 21,706 | $ | 24,793 | ||||||
| Income taxes – net |
4,648 | 9,685 | 9,612 | |||||||||
| Non-cash item: |
||||||||||||
| Capitalized lease asset and obligations |
$ | - | $ | 2,119 | $ | 1,308 | ||||||
| Transfer of loans to other real estate owned |
1,587 | 363 | 910 | |||||||||
| Trade date accounting for securities purchased |
3,002 | |||||||||||
| Fair value of assets acquired, net of cash acquired |
$ | - | $ | 280,499 | $ | - | ||||||
| Goodwill and core deposit |
- | 8,326 | - | |||||||||
| Fair value of liabilities assumed |
- | 271,621 | - | |||||||||
The accompanying notes are an integral part of the consolidated financial statements.
F-6
Table of Contents
UNITED FINANCIAL BANCORP, INC. AND SUBSIDIARY
Notes to Consolidated Financial Statements
December 31, 2010, 2009 and 2008
(Dollars in thousands, except per share amounts)
NOTE A – SUMMARY OF SIGNIFICANT ACCOUNTING POLICIES
The consolidated financial statements include the accounts of United Financial Bancorp, Inc. and its wholly-owned subsidiary, United Bank (the “Bank”). UCB Securities, Inc. and UCB Securities, Inc. II are subsidiaries of the Bank and are engaged in buying, selling and holding of securities. UB Properties, LLC is a subsidiary of the Bank formed to hold real estate assets acquired through foreclosure. All significant intercompany accounts and transactions have been eliminated in consolidation. These entities are collectively referred to herein as the “Company”.
The accounting and reporting policies of the Company conform to accounting principles generally accepted in the United States of America (“U.S. GAAP”) and general practices within the banking industry.
Use of Estimates
In preparing consolidated financial statements in conformity with accounting principles generally accepted in the United States of America, management is required to make estimates and assumptions that affect the reported amounts of assets and liabilities and disclosures of contingent assets and liabilities as of the date of the balance sheet and reported amounts of revenues and expenses during the reporting period. Actual results could differ from those estimates. Material estimates that are particularly susceptible to significant change are the determination of the allowance for loan losses, other than temporary impairment of securities, goodwill, fair value of financial instruments, and income taxes.
The following is a description of the Company’s more significant accounting policies:
Cash and Cash Equivalents
The Company classifies cash and due from banks, interest-bearing deposits in other banks and overnight funds sold as cash and cash equivalents as these liquid assets have original maturities of 90 days or less.
Investment Securities
Debt securities that management has the positive intent and ability to hold to maturity are classified as “held to maturity” and recorded at amortized cost. Securities not classified as held to maturity or trading, including equity securities with readily determinable fair values, are classified as “available for sale” and recorded at fair value, with unrealized gains and losses excluded from earnings and reported in other comprehensive income.
F-7
Table of Contents
UNITED FINANCIAL BANCORP, INC. AND SUBSIDIARY
Notes to Consolidated Financial Statements
December 31, 2010, 2009 and 2008
(Dollars in thousands, except per share amounts)
NOTE A – SUMMARY OF SIGNIFICANT ACCOUNTING POLICIES – Continued
Purchase premiums and discounts are recognized in interest income using the level yield method over the terms of the securities. Gains and losses on the sale of securities are recorded on the trade date and are determined using the specific identification method.
Each reporting period, the Company evaluates all securities classified as available-for-sale or held-to-maturity, with a decline in fair value below the amortized cost of the investment to determine whether or not the impairment is deemed to be other-than-temporary (“OTTI”).
OTTI is required to be recognized (1) if the Company intends to sell the security; (2) if it is “more likely than not” that the Company will be required to sell the security before recovery of its amortized cost basis; or (3) for debt securities, the present value of expected cash flows is not sufficient to recover the entire amortized cost basis. Marketable equity securities are evaluated for OTTI based on the severity and duration of the impairment and, if deemed to be other than temporary, the declines in fair value are reflected in earnings as realized losses. For impaired debt securities that the Company intends to sell, or more likely than not will be required to sell, the full amount of the depreciation is recognized as OTTI through earnings. For all other impaired debt securities, credit-related OTTI is recognized through earnings and non-credit related OTTI is recognized in other comprehensive income, net of applicable taxes.
Federal Home Loan Bank stock
The Company, as a member of the Federal Home Loan Bank of Boston (the “FHLBB”), is required to maintain an investment in capital stock of the FHLBB. Based on redemption provisions of the FHLBB, the stock has no quoted market value and is carried at cost. At its discretion, the FHLBB may declare dividends on the stock. In the first quarter of 2009, the FHLBB suspended the payment of dividends on its stock and instituted a moratorium on the repurchase any excess capital stock from member banks in order to maintain their liquidity and capital positions. Management reviews its investment in FHLBB stock for other than temporary impairment based upon an assessment of the ultimate recoverability of the par value. Based upon the most recent review, management concluded that no other than temporary impairment charge was necessary as of December 31, 2010.
Significant Group Concentrations of Credit Risk
A substantial portion of the Company’s loans are secured by real estate in Hampden, Hampshire and Worcester Counties of Massachusetts. Accordingly, the ultimate collectability of the Company’s loan portfolio is susceptible to changing conditions in these market areas. Note E discusses the types of lending that the Company engages in. The Company does not have any significant concentrations in any one industry or customer.
F-8
Table of Contents
UNITED FINANCIAL BANCORP, INC. AND SUBSIDIARY
Notes to Consolidated Financial Statements
December 31, 2010, 2009 and 2008
(Dollars in thousands, except per share amounts)
NOTE A – SUMMARY OF SIGNIFICANT ACCOUNTING POLICIES – Continued
Loans
The Company’s loan portfolio includes commercial and consumer segments. The Commercial loan segment includes classes for Commercial & Industrial loans (“C&I”), Commercial Real Estate, and Construction. The Consumer loan segment includes classes for Residential Real Estate, Home Equity, and Consumer (including automobile, manufactured home, and other personal loans).
Loans are stated at their unpaid principal balance net of unearned loan fees and costs and the allowance for loan losses.
Interest on most loans is included in income as earned based upon interest rates applied to unpaid principal using the simple interest method. Accrual of interest on loans is discontinued when in the judgment of management the collectibility of principal or interest becomes doubtful or when a loan becomes contractually past due 90 days with respect to principal or interest. Past due status is based on the contractual terms of the loan. The accrual of interest on residential mortgage loans, however, may continue even though they are 90 days past due if management deems it appropriate, provided that the loans are well secured and in the process of collection. In all cases, loans are placed on nonaccrual or charged-off at an earlier date if collection of principal or interest is considered doubtful.
When a loan is placed on nonaccrual status, all interest previously accrued is reversed against current period interest income. Interest subsequently received on nonaccrual loans is either applied against principal or recorded as income based on management’s judgment as to the collectibility of principal. Interest accruals are resumed on such loans only when they are brought fully current as to principal and interest and when, in the judgment of management, the loans are estimated to be fully collectible.
Loan origination and commitment fees and certain direct loan origination costs are deferred and the net amount is amortized over the contractual term of the loan as an adjustment of yield. In addition, discounts related to fair value adjustments for loan receivables acquired in a business combination or asset purchase are accreted into earnings over the contractual term as an adjustment of yield. If acquired loans experience credit quality deterioration after acquisition, the Company evaluates the difference between the contractually required payments at acquisition and the cash flows expected to be collected. Changes in the expected cash flows from the date of acquisition will impact the accretable yield and may also result in a charge to the provision for loan losses to the extent the cash flow shortfall is greater than the nonaccretable difference.
F-9
Table of Contents
UNITED FINANCIAL BANCORP, INC. AND SUBSIDIARY
Notes to Consolidated Financial Statements
December 31, 2010, 2009 and 2008
(Dollars in thousands, except per share amounts)
NOTE A – SUMMARY OF SIGNIFICANT ACCOUNTING POLICIES – Continued
Allowance for Loan Losses
The allowance for loan losses is established as losses are estimated to have occurred through a provision for loan losses charged to earnings. Loan losses are charged against the allowance when management believes the uncollectibility of a loan balance is confirmed. Subsequent recoveries, if any, are credited to the allowance. The adequacy of the allowance for loan losses is evaluated on a quarterly basis by management. Factors considered in evaluating the adequacy of the allowance include prior loss experience, current economic conditions and their effect on borrowers, the composition and size of the loan portfolio, trends in nonperforming loans, classified assets, and delinquency rates and the performance of individual loans in relation to contractual terms. This evaluation is inherently subjective as it requires estimates that are susceptible to significant revision as more information becomes available. In addition, various regulatory agencies, as an integral part of their examination process, periodically review the allowance for loan losses. Such agencies may require the Company to recognize additions to the allowance based on judgments different from those of management.
A loan is considered impaired when, based on current information and events, it is probable that the Company will be unable to collect the scheduled payments of principal or interest when due according to the contractual terms of the loan agreement. Factors considered by management in determining impairment include payment status, collateral value, and the probability of collecting scheduled principal and interest payments when due. Loans that experience insignificant payment delays and payment shortfalls generally are not classified as impaired. Management determines the significance of payment delays and payment shortfalls on a case-by-case basis, taking into consideration all of the circumstances surrounding the loan and the borrower, including the length of the delay, the reasons for the delay, the borrower’s prior payment record, and the amount of the shortfall in relation to the principal and interest owed. Impairment is measured on a loan-by-loan basis for commercial and construction loans by either the present value of expected future cash flows discounted at the loan’s effective interest rate, the loan’s obtainable market price, or the fair value of the collateral if the loan is collateral dependent.
A loan is classified as a troubled debt restructuring (“TDR”) if the Company, for economic or legal reasons related to the borrower’s financial difficulties, grants a concession to the borrower that it would not otherwise consider. This usually includes a modification of loan terms, such as a reduction of the interest rate to below market terms, capitalizing past due interest or extending the maturity date or a partial forgiveness of debt. Interest income on restructured loans is returned to accrual status after the borrower demonstrates the ability to
F-10
Table of Contents
UNITED FINANCIAL BANCORP, INC. AND SUBSIDIARY
Notes to Consolidated Financial Statements
December 31, 2010, 2009 and 2008
(Dollars in thousands, except per share amounts)
NOTE A – SUMMARY OF SIGNIFICANT ACCOUNTING POLICIES – Continued
pay under the restructured terms through a sustained period of repayment performance, which is generally six months. All TDRs are initially classified as impaired.
The allowance consists of a specific and a general component, as further described below.
Specific component
The specific component relates to loans that are classified as impaired. A specific allowance is established when the discounted cash flows (or collateral value) of the impaired loan is lower than the carrying value of the loan. Groups of smaller balance homogenous loans are collectively evaluated for impairment. Accordingly, the Company does not separately identify individual loans in the Consumer segment (residential real estate, home equity and consumer loans) for impairment disclosures, unless such loans are subject to a troubled debt restructuring agreement.
General component
The general component is based on historical loss experience adjusted for qualitative factors stratified by each of the loan classes: C&I, commercial real estate, construction, residential real estate, home equity and consumer. Management uses an average of historical losses based on a time frame appropriate to capture relevant loss data for each loan class. This historical loss factor for each loan class is adjusted for the following qualitative factors: the levels/trends in delinquencies and nonaccruals; levels and trends in charge-offs and recoveries; trends in volume and terms of loans; effects of changes in risk selection and underwriting standards and other changes in lending policies, procedures and practices; experience, ability and depth of lending management and staff; national and local economic trends and conditions; industry conditions; and effects of changes in credit concentrations. This analysis establishes factors that are applied to each loan class to determine the amount of the general component of the allowance for loan losses.
The qualitative factors are determined based on the various risk characteristics of each loan class. Relevant risk characteristics are as follows:
Commercial and industrial loans – Loans in this class are made to businesses. Generally these loans are secured by assets of the business and repayment is expected from the cash flows of the business. A weakened economy, and resultant decreased consumer and/or business spending, may have an effect on the credit quality in this loan class.
Commercial real estate – Loans in this class include income-producing investment properties and owner-occupied real estate used for business purposes. The underlying properties are
F-11
Table of Contents
UNITED FINANCIAL BANCORP, INC. AND SUBSIDIARY
Notes to Consolidated Financial Statements
December 31, 2010, 2009 and 2008
(Dollars in thousands, except per share amounts)
NOTE A – SUMMARY OF SIGNIFICANT ACCOUNTING POLICIES – Continued
generally located in our primary market area. The cash flows of the income-producing investment properties may be adversely impacted by a downturn in the economy as vacancy rates may increase, which in turn, will have an effect on credit quality. Generally management obtains annual financial information for borrowers with loans in excess of $250 in this class. In the case of owner-occupied real estate used for business purposes a weakened economy and resultant decreased consumer and/or business spending may have an adverse effect on credit quality.
Construction loans – Loans in this class primarily include land loans to local individuals, contractors and developers for developing the land for sale or for making improvements thereon. Repayment is derived from sale of the lots/units including any pre-sold units. Credit risk is affected by market conditions, time to sell at an adequate price and cost overruns. To a lesser extent this class includes commercial development projects we finance which in most cases have an interest-only phase during construction and then convert to permanent financing. Credit risk is affected by cost overruns, market conditions and the availability of permanent financing, to the extent such permanent financing is not being provided by us.
Residential real estate – Loans in this class are made to and secured by owner-occupied residential real estate and repayment is dependent on the credit quality of the individual borrower. The overall health of the economy, including unemployment rates and housing prices, may have an effect on the credit quality in this loan class. The Company generally does not originate loans with a loan-to-value ratio greater than 80 percent and does not grant subprime loans.
Consumer loans – Loans in this class may be either secured or unsecured and repayment is dependent on the credit quality of the individual borrower and, if applicable, sale of the collateral securing the loan (such as automobile, mobile home). Therefore the overall health of the economy, including unemployment rates and housing prices, may have an effect on the credit quality in this loan class.
Loans acquired with evidence of credit quality deterioration since origination and for which it is probable at purchase that the Company will be unable to collect all contractually required payments are accounted for as required by and in accordance with the Receivables Topic of Financial Accounting Standards Board (“FASB”) Accounting Standards Codification (“ASC”), “Loans and Debt Securities Acquired with Deteriorating Credit Quality” (ASC 310). Evidence of credit quality deterioration as of the purchase date may include statistics such as past due status, refreshed borrower credit scores and refreshed loan-to-value (LTV), some of which are not immediately available as of the purchase date. The Company continues to evaluate this information and other credit-related information as it becomes available. ASC
F-12
Table of Contents
UNITED FINANCIAL BANCORP, INC. AND SUBSIDIARY
Notes to Consolidated Financial Statements
December 31, 2010, 2009 and 2008
(Dollars in thousands, except per share amounts)
NOTE A – SUMMARY OF SIGNIFICANT ACCOUNTING POLICIES – Continued
310 addresses accounting for differences between contractual cash flows and cash flows expected to be collected from the Company’s initial investment in loans if those differences are attributable, at least in part, to credit quality.
The initial fair values for loans within the scope of ASC 310 are determined by discounting both principal and interest cash flows expected to be collected using an observable discount rate for similar instruments with adjustments that management believes a market participant would consider in determining fair value. The Company estimates the cash flows expected to be collected at acquisition using internal credit risk, interest rate and prepayment risk models that incorporate management’s best estimate of current key assumptions, such as default rates, loss severity and payment speeds.
Goodwill
Goodwill is measured as the excess of the cost of a business acquisition over the sum of the amounts assigned to identifiable tangible and intangible assets acquired less liabilities assumed. Goodwill is not amortized but is reviewed for impairment annually as of the end of November or more frequently if circumstances warrant. The goodwill impairment analysis is a two-step test. The first step (“Step 1”) is used to identify potential impairment, and involves comparing the reporting unit’s (the consolidated Company, in our case) estimated fair value to its carrying amount, including goodwill. If the estimated fair value of the reporting unit exceeds its carrying amount, goodwill is not deemed to be impaired. Should the carrying amount of the reporting unit exceed its estimated fair value, an indicator of impairment is deemed to exist and a second step is performed to measure the amount of such impairment, if any. The second step (“Step 2”) involves calculating the implied fair value of goodwill. The implied fair value of goodwill is determined in a manner similar to how the amount of goodwill is determined in a business combination (i.e. by measuring the excess of the estimated fair value, as determined in Step 1, over the aggregate estimated fair values of the individual assets, liabilities, and identifiable intangibles as of the impairment testing date). If the implied fair value of goodwill exceeds the carrying amount of goodwill assigned to the reporting unit, no impairment exists. If the carrying amount of goodwill exceeds the implied fair value of the goodwill, an impairment loss is recorded in an amount equal to such excess. An impairment loss cannot exceed the carrying amount of goodwill, and the loss (write-down) establishes a new carrying amount for the goodwill. Subsequent reversal of goodwill impairment losses is not permitted. Application of the goodwill impairment test requires significant judgments including estimation of future cash flows, which is dependent on internal forecasts, estimation of the long-term rate of growth, the period over which cash flows will occur, and determination of our cost of capital. Changes in these estimates and
F-13
Table of Contents
UNITED FINANCIAL BANCORP, INC. AND SUBSIDIARY
Notes to Consolidated Financial Statements
December 31, 2010, 2009 and 2008
(Dollars in thousands, except per share amounts)
NOTE A – SUMMARY OF SIGNIFICANT ACCOUNTING POLICIES – Continued
assumptions could materially affect the determination of fair value and/or conclusions related to goodwill impairment. For the year ended December 31, 2010, the Company had no goodwill impairment.
Business Segments
An operating segment is a component of a business for which separate financial information is available that is evaluated regularly by the chief operating decision-maker in deciding how to allocate resources and evaluate performance. The Company’s operations are limited to financial services provided within the framework of a community bank, and decisions are based generally on specific market areas and or product offerings. Accordingly, based on the financial information which is presently evaluated by the Company’s chief operating decision-maker, the Company operates in a single business segment.
Bank-owned Life Insurance
Bank-owned life insurance policies are reflected on the consolidated balance sheet at cash surrender value net of any deferred fees or loans. Changes in the net cash surrender value of the policies, as well as insurance proceeds received, are reflected in non-interest income on the consolidated statements of income.
Off-balance Sheet Financial Instruments
In the ordinary course of business, the Company enters into off-balance sheet financial instruments, consisting primarily of credit related financial instruments. These financial instruments are recorded in the consolidated financial statements when they are funded or related fees are incurred or received.
Earnings Per Share
Basic earnings per share have been calculated by dividing net income by weighted average shares outstanding before any dilution and adjusted to exclude the weighted average number of unallocated shares held by the United Bank Employee Stock Ownership Plan (the “ESOP”). Diluted earnings per share have been calculated by dividing net income by weighted average shares outstanding after giving effect to the potential dilution that could occur if potential common shares were converted into common stock using the treasury stock method.
The basic and diluted share data for 2008 were revised as required by the Earnings Per Share Topic of Financial Accounting Standards Board (“FASB”) and Accounting Standards
F-14
Table of Contents
UNITED FINANCIAL BANCORP, INC. AND SUBSIDIARY
Notes to Consolidated Financial Statements
December 31, 2010, 2009 and 2008
(Dollars in thousands, except per share amounts)
NOTE A – SUMMARY OF SIGNIFICANT ACCOUNTING POLICIES – Continued
Codification (“ASC”) and in accordance with the provisions of “Determining Whether Instruments Issued in Share-Based Payment Transactions are Participating Securities” which require that share-based compensation awards that qualify as participating securities (entitled to receive non-forfeitable dividends) be included in basic earnings per share using the two-class method. This revision decreased basic earnings per share $0.01 for the year ended December 31, 2008.
Other Real Estate Owned
Other real estate owned (“OREO”) is comprised of properties acquired through foreclosure proceedings or acceptance of a deed in lieu of foreclosure. OREO is held for sale and is initially recorded at fair value, less cost to sell, at the date of foreclosure, establishing a new cost basis. Losses arising from the acquisition of such properties are charged against the allowance for loan losses. Operating expenses are charged to current period operations as incurred. Gains and losses upon disposition are reflected in income as realized.
Foreclosed assets held for sale are recorded at the lower of fair value less estimated costs to sell or cost. Subsequent changes in the fair value of the foreclosed assets are reflected through a valuation allowance.
Premises and Equipment
Land is carried at cost. Buildings and equipment are stated at cost less accumulated depreciation. Depreciation is computed for financial reporting purposes on the straight-line method over the estimated useful life of each type of asset. Leasehold improvements are amortized on the straight-line method over the shorter of the lease term, including consideration of renewal options, or the estimated useful life of the asset. The cost of maintenance and repairs is charged against income as incurred. The Company reviews for possible impairment of long-lived assets whenever events or changes in circumstances indicate that the carrying amount of an asset may not be recoverable.
Any asset retirement obligations are recognized as a liability and measured at fair value. Because such liabilities are recorded at fair value and not the ultimate settlement amount, increases in the liability’s carrying amount for accretion are recognized each period. The Company also capitalizes the estimated cost of its asset retirement obligations as part of the carrying amount of the associated long-lived assets.
F-15
Table of Contents
UNITED FINANCIAL BANCORP, INC. AND SUBSIDIARY
Notes to Consolidated Financial Statements
December 31, 2010, 2009 and 2008
(Dollars in thousands, except per share amounts)
NOTE A – SUMMARY OF SIGNIFICANT ACCOUNTING POLICIES – Continued
Transfers of Financial Assets
Transfers of an entire financial asset, a group of entire financial assets, or a participating interest in an entire financial asset are accounted for as sales when control over the assets has been surrendered. Control over transferred assets is deemed to be surrendered when (1) the assets have been isolated from the Company, (2) the transferee obtains the right to pledge or exchange the transferred assets, and (3) the Company does not maintain effective control over the transferred assets.
Effective January 1, 2010, the Company adopted accounting guidance pertaining to transfers of financial assets. During the normal course of business, the Company may transfer a portion of a financial asset, for example, a participation loan or the government guaranteed portion of a loan. In order to be eligible for sales treatment, the transfer of the portion of the loan must meet the criteria of a participating interest. If it does not meet the criteria of a participating interest, the transfer must be accounted for as a secured borrowing. In order to meet the criteria for a participating interest, all cash flows from the loan must be divided proportionately, the rights of each loan holder must have the same priority, the loan holders must have no recourse to the transferor other than standard representations and warranties and no loan holder has the right to pledge or exchange the entire loan. At December 31, 2010, there were no transfers of financial assets that were accounted for as a secured borrowing.
Securities Sold Under Agreements to Repurchase
The Company accounts for securities sold under agreements to repurchase as secured borrowings as the Company maintains effective control over the transferred assets. Securities sold under agreements to repurchase are reflected at the amount of cash received in connection with the transaction. The Company may be required to provide additional collateral based on the fair value of the underlying securities.
Retirement Benefits
The Company has established a defined contribution plan for eligible employees. The Company matches employee contributions up to 5% of an employee’s qualified compensation.
In 2007, the Company established an unfunded Supplemental Executive Retirement Plan (“SERP”) for certain employees that provides benefits that cannot be paid from a qualified retirement plan due to Internal Revenue Code restrictions. This plan is nonqualified under the Internal Revenue Code and assets used to fund benefit payments are not segregated from other assets of the Company; therefore, in general, a participant’s or beneficiary’s claim to benefits under these plans is as a general creditor.
F-16
Table of Contents
UNITED FINANCIAL BANCORP, INC. AND SUBSIDIARY
Notes to Consolidated Financial Statements
December 31, 2010, 2009 and 2008
(Dollars in thousands, except per share amounts)
NOTE A – SUMMARY OF SIGNIFICANT ACCOUNTING POLICIES – Continued
The Company recognizes the plan’s over-funded or under-funded status as an asset or liability with an offsetting adjustment to Accumulated Other Comprehensive Income (“AOCI”). Actuarial gains and losses, prior service costs or credits, and transition assets or obligations are recognized as a component of AOCI.
Income Taxes
The Company recognizes income taxes under the asset and liability method. Under this method, deferred tax assets and liabilities are established for the tax consequences attributable to the temporary differences between the financial statement carrying amount and the tax bases of the Company’s assets and liabilities and certain tax carryforwards at enacted tax rates.
The provision for deferred income taxes is the result of changes in deferred tax assets and liabilities. A valuation allowance is recorded against deferred tax assets when management deems a portion of the asset to be more likely than not unrealizable. The Company’s valuation allowance is reviewed and adjustments are made to the valuation allowance based on management’s judgments relating to the realizability of the deferred tax asset. It is management’s belief, that it is more likely than not, that the reversal of deferred tax liabilities and results of future operations will generate sufficient taxable income to realize the deferred tax assets. Therefore, no valuation allowance was necessary at December 31, 2010 or 2009 for deferred tax assets.
The Company may recognize the tax benefit from an uncertain tax position only if it is more likely than not the tax position will be sustained on examination by the taxing authorities, based on the technical merits of the position. The tax benefits recognized in the financial statements from such a position are measured based on the largest benefit that has a greater than fifty percent likelihood of being realized upon ultimate resolution. The Company reports interest and penalties associated with tax obligations in other non-interest expense.
The Company recognized interest and penalties in the amount of $0, $40 and $111 for the years ended December 31, 2010, 2009 and 2008, respectively.
Stock Compensation Plan
Share-based compensation costs are based on the grant date fair value and these costs are recognized over the requisite vesting period. For all of our stock option grants, the fair value of each grant was estimated at the date of grant using the Black-Scholes option pricing model. Black-Scholes utilizes assumptions related to volatility, the risk-free interest rate, the dividend
F-17
Table of Contents
UNITED FINANCIAL BANCORP, INC. AND SUBSIDIARY
Notes to Consolidated Financial Statements
December 31, 2010, 2009 and 2008
(Dollars in thousands, except per share amounts)
NOTE A – SUMMARY OF SIGNIFICANT ACCOUNTING POLICIES – Continued
yield and employee exercise behavior. Expected volatilities utilized in the model are based on the historic volatility of the Company’s stock price. The risk free interest rate is derived from the U.S. Treasury Yield curve in effect at the time of the grant. The model incorporates exercise and post-vesting forfeiture assumptions based on an analysis of historical data.
Employee Stock Ownership Plan
Compensation expense for the ESOP is recorded at an amount equal to the shares allocated by the ESOP multiplied by the average fair market value of the shares during the period. The Company recognizes compensation expense ratably over the year based upon the Company’s estimate of the number of shares expected to be allocated by the ESOP. Unearned compensation applicable to the ESOP is reflected as a reduction of stockholders’ equity in the consolidated balance sheet. The difference between the average fair market value and the cost of the shares allocated by the ESOP is recorded as an adjustment to additional paid-in capital. Cash dividends received on shares held in suspense are used to reduce the scheduled annual debt payment.
Treasury Stock
Common stock shares repurchased are recorded as treasury stock at cost.
Comprehensive Income
Accounting principles generally require that recognized revenue, expenses, gains and losses be included in net income. Although certain changes in assets and liabilities, such as unrealized gains and losses on available for sale securities, are reported as a separate component of stockholders’ equity, such items, along with net income, are components of comprehensive income.
F-18
Table of Contents
UNITED FINANCIAL BANCORP, INC. AND SUBSIDIARY
Notes to Consolidated Financial Statements
December 31, 2010, 2009 and 2008
(Dollars in thousands, except per share amounts)
NOTE A – SUMMARY OF SIGNIFICANT ACCOUNTING POLICIES – Continued
The components of other comprehensive income and related tax effects are as follows for the years ended December 31:
| 2010 | 2009 | 2008 | ||||||||||
| Change in unrealized holding gains on available-for-sale securities |
$ | (920) | $ | 3,883 | $ | 4,028 | ||||||
| Reclassification adjustment for losses (gains) realized in income |
330 | (461) | 1,354 | |||||||||
| Non-credit portion of other-than-temporary impairment losses on available-for-sale securities |
(188) | - | - | |||||||||
| Net change in unrealized gains |
(778) | 3,422 | 5,382 | |||||||||
| Tax effect |
351 | (1,303) | (2,051) | |||||||||
| (427) | 2,119 | 3,331 | ||||||||||
| Pension liability for retirement plans |
(279) | 411 | (514) | |||||||||
| Pension liability adjustment |
151 | 112 | 136 | |||||||||
| Net change in pension liability |
(128) | 523 | (378) | |||||||||
| Tax effect |
55 | (215) | 147 | |||||||||
| (73) | 308 | (231) | ||||||||||
| Other comprehensive income |
$ | (500) | $ | 2,427 | $ | 3,100 | ||||||
The components of accumulated other comprehensive income are as follows:
| December 31, 2010: |
Gross Amount |
Tax Effect |
Net of Tax |
|||||||||
| Unrealized gain on securities available for sale |
$ | 8,816 | $ | 3,282 | $ | 5,534 | ||||||
| Pension liability |
(1,136) | 460 | (676) | |||||||||
| Total accumulated other comprehensive income |
$ | 7,680 | $ | 3,742 | $ | 4,858 | ||||||
| December 31, 2009: |
Gross Amount |
Tax Effect |
Net of Tax |
|||||||||
| Unrealized gain on securities available for sale |
$ | 9,594 | $ | 3,633 | $ | 5,961 | ||||||
| Pension liability |
(1,008) | 405 | (603) | |||||||||
| Total accumulated other comprehensive income |
$ | 8,586 | $ | 4,038 | $ | 5,358 | ||||||
F-19
Table of Contents
UNITED FINANCIAL BANCORP, INC. AND SUBSIDIARY
Notes to Consolidated Financial Statements
December 31, 2010, 2009 and 2008
(Dollars in thousands, except per share amounts)
NOTE A – SUMMARY OF SIGNIFICANT ACCOUNTING POLICIES – Concluded
Advertising and public relations expense
Advertising, promotional and other business development costs are generally expensed as incurred. External costs incurred in producing media advertising are expensed the first time the advertising takes place. External costs relating to direct mailing costs are expensed in the period in which the direct mailings are sent.
Reclassifications
Amounts reported for prior periods are reclassified as necessary to be consistent with the current-period presentation.
Recent Accounting Pronouncements
In July 2010, the FASB issued Accounting Standard Update 2010-20 (ASU 2010-20) “Disclosures about the Credit Quality of Financing Receivables and the Allowance for Credit Losses”, which amends the authoritative accounting guidance in accordance with and as required by the Receivables Topic of FASB ASC 310. This Update requires an entity to provide disclosures that facilitate financial statement users’ evaluation of (1) the nature of credit risk inherent in the entity’s loan portfolio (2) how that risk is analyzed and assessed in arriving at the allowance for loan and lease losses and (3) the changes and reasons for those changes in the allowance for loan and lease losses. The disclosures as of the end of a reporting period are effective for interim and annual reporting periods ending on or after December 15, 2010. The disclosures about activity that occurs during a reporting period are effective for interim and annual reporting periods beginning on or after December 15, 2010. The Company has provided the disclosures required as of December 31, 2010 in Note E. The adoption of this new guidance had no material effect on the Company’s consolidated financial statements.
NOTE B – RESTRICTIONS ON CASH AND AMOUNTS DUE FROM BANKS
The Company is required to maintain average balances on hand or with the Federal Reserve Bank. At December 31, 2010 and 2009, these reserve balances amounted to $50 and $50, respectively.
NOTE C – ACQUISITION
On November 30, 2009, the Company completed its acquisition of CNB Financial, the holding company for Commonwealth National Bank. The transaction qualified as a tax-free reorganization for federal income tax purposes. The final consideration paid in the transaction
F-20
Table of Contents
UNITED FINANCIAL BANCORP, INC. AND SUBSIDIARY
Notes to Consolidated Financial Statements
December 31, 2010, 2009 and 2008
(Dollars in thousands, except per share amounts)
NOTE C – ACQUISITION – Continued
to stockholders of CNB Financial consisted of 943,186 shares of United Financial common stock and $12,639 in cash. Based upon the Company’s $12.84 per share closing price on November 30, 2009, the transaction was valued at approximately $24,750.
The Company accounted for the transaction using the acquisition method pursuant to FASB ASC 805 “Business Combinations.” (ASC 805) Accordingly, the Company recorded merger and acquisition expenses totaling $1,148 and $2,863 during the years ended December 31, 2010 and 2009, respectively. The Company’s results of operations include CNB Financial from the date of acquisition. Additionally, ASC 805 requires an acquirer to recognize the assets acquired and the liabilities assumed at fair value as of the acquisition date.
The following table summarizes the estimated fair value of the assets acquired and liabilities assumed as of the date of the acquisition.
| Assets: |
||||
| Cash |
$ | 7,546 | ||
| Investments |
32,354 | |||
| Loans |
236,387 | |||
| Premises and equipment |
1,838 | |||
| Goodwill |
7,844 | |||
| Core deposit intangible |
482 | |||
| Other real estate owned |
1,020 | |||
| Other assets |
8,900 | |||
| Total Assets Acquired |
296,371 | |||
| Liabilities: |
||||
| Deposits |
196,021 | |||
| Borrowings |
74,134 | |||
| Other liabilities |
1,466 | |||
| Total Liabilities Assumed |
271,621 | |||
| Net Assets Acquired |
$ | 24,750 | ||
As noted above, the Company acquired loans with a fair value of $236,387. Included in this amount was $5,178 of loans with evidence of deterioration of credit quality since origination for which it was probable, at the time of the acquisition, that the Company would be unable to collect all contractually required payments receivable. In accordance with the “Loans and Debt Securities Acquired with Deteriorating Credit Quality” section of FASB ASC 310 “Receivables,” the Company recorded a non accretable credit discount of $2,349, which is defined as the loan’s contractually required payments receivable in excess of the amount of its
F-21
Table of Contents
UNITED FINANCIAL BANCORP, INC. AND SUBSIDIARY
Notes to Consolidated Financial Statements
December 31, 2010, 2009 and 2008
(Dollars in thousands, except per share amounts)
NOTE C – ACQUISITION – Concluded
cash flows expected to be collected. The Company considered factors such as payment history, collateral values, and accrual status when determining whether there was evidence of deterioration of loan’s credit quality at the acquisition date.
The following summarizes the unaudited pro forma results of operations as if the Company acquired CNB Financial on January 1, 2008. The pro forma results for 2008 include merger costs net of tax of $3,602, or $0.21 per share.
| Years Ended December 31, | ||||||||
| 2009 | 2008 | |||||||
| Net interest income before provision for loan losses |
$ | 52,285 | $ | 52,012 | ||||
| Net income |
9,454 | 3,446 | ||||||
| Earnings per share - basic |
$ | 0.58 | $ | 0.20 | ||||
| Earnings per share - diluted |
$ | 0.58 | $ | 0.20 | ||||
Excluded from the pro forma results of operations for the year ended December 31, 2009 are merger costs net of tax of $3,602, or $0.22 per diluted share.
F-22
Table of Contents
UNITED FINANCIAL BANCORP, INC. AND SUBSIDIARY
Notes to Consolidated Financial Statements
December 31, 2010, 2009 and 2008
(Dollars in thousands, except per share amounts)
NOTE D – INVESTMENT SECURITIES
The amortized cost and fair values of securities classified as available for sale and held to maturity are as follows:
| Amortized Cost |
Unrealized | |||||||||||||||
| Gain | Losses | Fair Value | ||||||||||||||
| Securities Available for Sale |
||||||||||||||||
| December 31, 2010: |
||||||||||||||||
| Debt Securities: |
||||||||||||||||
| Government-sponsored enterprises |
$ | 12,747 | $ | 36 | $ | (281) | $ | 12,502 | ||||||||
| Government-sponsored and government-guaranteed mortgage-backed securities |
172,003 | 8,892 | (129) | 180,766 | ||||||||||||
| Private label mortgage-backed securities |
3,076 | 110 | (16) | 3,170 | ||||||||||||
| Municipal bonds |
7,760 | 105 | (70) | 7,795 | ||||||||||||
| Corporate bonds |
1,450 | 357 | (188) | 1,619 | ||||||||||||
| Total |
$ | 197,036 | $ | 9,500 | $ | (684) | $ | 205,852 | ||||||||
| December 31, 2009: |
||||||||||||||||
| Debt Securities: |
||||||||||||||||
| Government-sponsored enterprises |
$ | 342 | $ | 11 | $ | - | $ | 353 | ||||||||
| Government-sponsored and government-guaranteed mortgage-backed securities |
215,819 | 9,216 | (199) | 224,836 | ||||||||||||
| Private label mortgage-backed securities |
4,999 | 97 | (60) | 5,036 | ||||||||||||
| Municipal bonds |
11,004 | 189 | (260) | 10,933 | ||||||||||||
| Corporate bonds |
1,449 | 279 | (16) | 1,712 | ||||||||||||
| Subtotal |
233,613 | 9,792 | (535) | 242,870 | ||||||||||||
| Marketable equity securities |
97 | 337 | - | 434 | ||||||||||||
| Total |
$ | 233,710 | $ | 10,129 | $ | (535) | $ | 243,304 | ||||||||
F-23
Table of Contents
UNITED FINANCIAL BANCORP, INC. AND SUBSIDIARY
Notes to Consolidated Financial Statements
December 31, 2010, 2009 and 2008
(Dollars in thousands, except per share amounts)
NOTE D – INVESTMENT SECURITIES – Continued
| Amortized Cost |
Unrealized | Fair Value | ||||||||||||||
| Gain | Losses | |||||||||||||||
| Securities Held to Maturity |
||||||||||||||||
| December 31, 2010: |
||||||||||||||||
| Government-sponsored and government-guaranteed mortgage-backed securities |
$ | 105,312 | $ | 936 | $ | (1,203) | $ | 105,045 | ||||||||
| Private label mortgage-backed securities |
388 | 1 | - | 389 | ||||||||||||
| IRB |
19,050 | - | - | 19,050 | ||||||||||||
| State of Israel bonds |
150 | - | - | 150 | ||||||||||||
| Municipal bonds |
7,575 | 65 | (248) | 7,392 | ||||||||||||
| Total |
$ | 132,475 | $ | 1,002 | $ | (1,451) | $ | 132,026 | ||||||||
| December 31, 2009: |
||||||||||||||||
| Government-sponsored and government-guaranteed mortgage-backed securities |
$ | 53,769 | $ | 180 | $ | (418) | $ | 53,531 | ||||||||
| Private label mortgage-backed securities |
737 | 13 | - | 750 | ||||||||||||
| IRB |
1,039 | - | - | 1,039 | ||||||||||||
| State of Israel bonds |
150 | - | - | 150 | ||||||||||||
| Municipal bonds |
7,479 | 114 | - | 7,593 | ||||||||||||
| Total |
$ | 63,174 | $ | 307 | $ | (418) | $ | 63,063 | ||||||||
The Company’s portfolio of mortgage-backed securities, which represent interests in pools of residential mortgage loans, consists solely of securities issued by the Federal Home Loan Mortgage Corporation (Freddie Mac), the Federal National Mortgage Association (Fannie Mae), and the Government National Mortgage Association (Ginnie Mae), all of which are federal government owned or sponsored agencies. The Company also owns an insignificant amount of private label, residential mortgage-backed securities as a result of its acquisition of CNB Financial.
As of December 31, 2010, the Bank has pledged securities with an amortized cost of $122,015 and a fair value of $126,207 to secure municipal deposits, reverse repurchase agreements, treasury, tax and loan deposits at the Federal Reserve Bank of Boston and customers’ repurchase agreements. Additionally, there is a blanket lien on certain securities to collateralize borrowings from the FHLBB, as discussed further in Note H.
F-24
Table of Contents
UNITED FINANCIAL BANCORP, INC. AND SUBSIDIARY
Notes to Consolidated Financial Statements
December 31, 2010, 2009 and 2008
(Dollars in thousands, except per share amounts)
NOTE D – INVESTMENT SECURITIES – Continued
Gross unrealized losses and fair values at December 31, 2010 and 2009 aggregated by investment category and the length of time that individual securities have been in a continuous unrealized loss position follow:
| Less than 12 months | 12 months or longer | Total | ||||||||||||||||||||||||||
| Fair Value | Unrealized Losses |
Fair Value | Unrealized Losses |
Number
of Securities |
Fair Value | Unrealized Losses |
||||||||||||||||||||||
| 2010: |
||||||||||||||||||||||||||||
| Securities Available for Sale |
||||||||||||||||||||||||||||
| Debt Securities: |
||||||||||||||||||||||||||||
| Government-sponsored enterprises |
$ | 4,718 | $ | (281) | $ | - | $ | - | 1 | $ | 4,718 | $ | (281) | |||||||||||||||
| Government-sponsored and government-guaranteed mortgage-backed securities |
15,343 | (129) | - | - | 6 | 15,343 | (129) | |||||||||||||||||||||
| Private label mortgage-backed securities |
- | - | 907 | (16) | 1 | 907 | (16) | |||||||||||||||||||||
| Municipal bonds |
2,713 | (37) | 256 | (33) | 9 | 2,969 | (70) | |||||||||||||||||||||
| Corporate bonds |
137 | (188) | - | - | 1 | 137 | (188) | |||||||||||||||||||||
| Total |
$ | 22,911 | $ | (635) | $ | 1,163 | $ | (49) | 18 | $ | 24,074 | $ | (684) | |||||||||||||||
| Securities Held to Maturity |
||||||||||||||||||||||||||||
| Government-sponsored and government-guaranteed mortgage-backed securities |
$ | 51,839 | $ | (1,203) | $ | - | $ | - | 14 | $ | 51,839 | $ | (1,203) | |||||||||||||||
| Municipal bonds |
4,960 | (248) | - | - | 23 | 4,960 | (248) | |||||||||||||||||||||
| Total |
$ | 56,799 | $ | (1,451) | $ | - | $ | - | 37 | $ | 56,799 | $ | (1,451) | |||||||||||||||
| 2009: |
||||||||||||||||||||||||||||
| Securities Available for Sale |
||||||||||||||||||||||||||||
| Debt Securities: |
||||||||||||||||||||||||||||
| Government-sponsored and government-guaranteed mortgage-backed securities |
$ | 14,428 | $ | (197) | $ | 1,068 | $ | (2) | 16 | $ | 15,496 | $ | (199) | |||||||||||||||
| Private label mortgage-backed securities |
2,301 | (60) | - | - | 2 | 2,301 | (60) | |||||||||||||||||||||
| Municipal bonds |
2,076 | (166) | 935 | (94) | 9 | 3,011 | (260) | |||||||||||||||||||||
| Corporate bonds |
- | - | 308 | (16) | 1 | 308 | (16) | |||||||||||||||||||||
| Total |
$ | 18,805 | $ | (423) | $ | 2,311 | $ | (112) | 28 | $ | 21,116 | $ | (535) | |||||||||||||||
| Securities Held to Maturity |
||||||||||||||||||||||||||||
| Government-sponsored and government-guaranteed mortgage-backed securities |
$ | 36,742 | $ | (418) | $ | - | $ | - | 15 | $ | 36,742 | $ | (418) | |||||||||||||||
| Total |
$ | 36,742 | $ | (418) | $ | - | $ | - | 15 | $ | 36,742 | $ | (418) | |||||||||||||||
Management evaluated the securities in the preceding tables and has determined that one trust preferred security has suffered impairment that is considered to be OTTI as of December 31, 2010. OTTI for this security amounted to $188, was non-credit related and was recognized in other comprehensive income. In 2009, management recognized a pre-tax, non-cash charge $82 for other-than-temporary impairment of the Company’s $1.8 million (before OTTI) trust
F-25
Table of Contents
UNITED FINANCIAL BANCORP, INC. AND SUBSIDIARY
Notes to Consolidated Financial Statements
December 31, 2010, 2009 and 2008
(Dollars in thousands, except per share amounts)
NOTE D – INVESTMENT SECURITIES – Concluded
preferred securities portfolio. Management based its assessment on the issuers’ credit ratings, credit outlook, payment status and financial condition, the length of time the bonds have been in a loss position, the size of the loss position and other meaningful information.
In its evaluation, management considered the types of securities, including if the securities were U.S. Government issued, the credit rating on the securities, credit outlook, payment status and financial condition, the length of time the bond has been in a loss position, the size of the loss position, our intent and ability to hold the securities to expected recovery of value and other meaningful information. The Company does not intend to sell any debt securities and is unlikely to be required to sell any security before its maturity or market price recovery.
Realized gains and losses and the proceeds from sales of securities available for sale are as follows for the years ended December 31:
| 2010 | 2009 | 2008 | ||||||||||
| Proceeds from sales |
$ | 11,586 | $ | 31,808 | $ | 51,448 | ||||||
| Gross gains |
88 | 556 | 72 | |||||||||
| Gross losses |
(273) | (13) | (49) | |||||||||
The scheduled maturities of debt securities held to maturity and available for sale at December 31, 2010, are shown below. Actual maturities will differ from contractual maturities because issuers generally have the right to call or prepay obligations with or without call or prepayment penalties.
| At December 31, 2010 | ||||||||||||||||
| Securities Available for Sale |
Securities Held to Maturity |
|||||||||||||||
| Amortized Cost |
Fair Value | Amortized Cost |
Fair Value | |||||||||||||
| Due in one year or less |
$ | 103 | $ | 104 | $ | 130 | $ | 132 | ||||||||
| Due from one year to five years |
7,338 | 7,509 | 1,020 | 1,060 | ||||||||||||
| Due from five years to ten years |
31,688 | 32,466 | 21,328 | 21,515 | ||||||||||||
| Due after ten years |
157,907 | 165,773 | 109,997 | 109,319 | ||||||||||||
| $ | 197,036 | $ | 205,852 | $ | 132,475 | $ | 132,026 | |||||||||
Maturities are based on the final contractual payment dates, and do not reflect the impact of potential prepayments or early redemptions. Such securities have been classified within the category that represents the final maturity date.
F-26
Table of Contents
UNITED FINANCIAL BANCORP, INC. AND SUBSIDIARY
Notes to Consolidated Financial Statements
December 31, 2010, 2009 and 2008
(Dollars in thousands, except per share amounts)
NOTE E – LOANS, NET
The components of loans are as follows at December 31:
| 2010 | 2009 | |||||||
| One- to four-family residential real estate |
$ | 295,721 | $ | 343,300 | ||||
| Commercial real estate |
427,994 | 409,680 | ||||||
| Construction |
27,553 | 48,808 | ||||||
| Home equity loans |
138,290 | 137,371 | ||||||
| Commercial and industrial |
165,335 | 159,437 | ||||||
| Automobile |
11,051 | 14,729 | ||||||
| Consumer |
8,167 | 8,916 | ||||||
| Total loans |
1,074,111 | 1,122,241 | ||||||
| Net deferred loan costs and fees |
2,073 | 2,355 | ||||||
| Allowance for loan losses |
(9,987) | (9,180) | ||||||
| Loans, net |
$ | 1,066,197 | $ | 1,115,416 | ||||
The Company’s lending activities are conducted principally in Hampden, Hampshire and Worcester counties of Massachusetts. The Company grants single family and multi-family residential loans, commercial real estate loans, commercial loans, and a variety of consumer loans. In addition, the Company grants loans for the construction of residential homes, multi-family properties and commercial real estate properties. Most loans granted by the Company are collateralized by real estate. The Company also from time-to-time purchases commercial loans secured by real estate. The ability and willingness of the single family residential, commercial and consumer borrowers to honor their repayment commitments is generally dependent on the level of overall economic activity within the borrowers’ geographic areas and real estate values. The ability and willingness of commercial real estate and construction loan borrowers to honor their repayment commitments is generally dependent on the health of the real estate economic sector in the borrowers’ geographic areas and the general economy.
The Company has transferred a portion of its originated commercial real estate and commercial and industrial loans to participating lenders. The amounts transferred have been accounted for as sales and are therefore not included in the Company’s accompanying consolidated balance sheets. The Company and participating lenders share ratably in any gains or losses that may result from a borrower’s lack of compliance with contractual terms of the loan. The Company continues to service the loans on behalf of the participating lenders and, as such, collects cash payments from the borrowers, remits payments (net of servicing fees) to participating lenders and disburses required escrow funds to relevant parties. At December 31, 2010 and 2009, the Company was servicing loans for participants aggregating $44,444 and $43,149, respectively.
F-27
Table of Contents
UNITED FINANCIAL BANCORP, INC. AND SUBSIDIARY
Notes to Consolidated Financial Statements
December 31, 2010, 2009 and 2008
(Dollars in thousands, except per share amounts)
NOTE E – LOANS, NET – Continued
Certain officers and directors of the Company and certain corporations and individuals related to such persons, incurred indebtedness, in the form of loans, as customers. These loans were made on substantially the same terms, including interest rates and collateral, as those prevailing at the time or comparable transactions with other customers and did not involve more than the normal risk of collectibility.
The following table summarizes the Company’s lending activity with its directors and executive officers all of which was conducted with terms consistent with those offered to unrelated parties:
| December 31, | ||||||||
| 2010 | 2009 | |||||||
| Beginning balance |
$ | 1,571 | $ | 1,699 | ||||
| New loans |
576 | 345 | ||||||
| Repayments |
(410) | (473) | ||||||
| Ending balance |
$ | 1,737 | $ | 1,571 | ||||
In 2010, the Company recognized proceeds of $17,906 from sales of residential mortgage loans originated for the purpose of reselling them in the secondary market and $9,725 from sales of residential mortgage loans held in its portfolio. In 2009, the Company recognized proceeds of $16,381 from sales of residential mortgage loans originated for the purpose of reselling them in the secondary market and $13,637 from sales of residential mortgage loans held in its portfolio. Loans serviced by the Company for others totaled $69,006 and $51,021 at December 31, 2010 and 2009, respectively. The balances of mortgage servicing rights related to such loans were insignificant at December 31, 2010 and 2009.
A summary of changes in the allowance for loan losses for the years ended December 31 follows:
| 2010 | 2009 | 2008 | ||||||||||
| Balance at beginning of year |
$ | 9,180 | $ | 8,250 | $ | 7,714 | ||||||
| Provision for loan losses |
2,285 | 2,998 | 1,846 | |||||||||
| Charge-offs |
(1,637) | (2,163) | (1,336) | |||||||||
| Recoveries |
159 | 95 | 26 | |||||||||
| Balance at end of year |
$ | 9,987 | $ | 9,180 | (1) | $ | 8,250 | |||||
(1) In accordance with FASB ASC 805 “Business Combinations” the Company recorded loans acquired from CNB Financial at fair value and as such no allowance for loan losses for these loans existed as of the acquisition date of November 30, 2009.
F-28
Table of Contents
UNITED FINANCIAL BANCORP, INC. AND SUBSIDIARY
Notes to Consolidated Financial Statements
December 31, 2010, 2009 and 2008
(Dollars in thousands, except per share amounts)
NOTE E – LOANS, NET – Continued
Further information pertaining to the allowance for loan losses at December 31, 2010 is as follows:
| Commercial and Industrial |
Commercial Real Estate |
Commercial & Residential Construction |
Residential | Home Equity |
Consumer | Total | ||||||||||||||||||||||
| Allowance for Credit Losses: |
||||||||||||||||||||||||||||
| Ending balance (total allowance) |
$ | 2,801 | $ | 5,000 | $ | 668 | $ | 740 | $ | 623 | $ | 155 | $ | 9,987 | ||||||||||||||
| Ending balance: individually evaluated for impairment |
449 | 48 | - | - | - | - | 497 | |||||||||||||||||||||
| Ending balance: collectively evaluated for impairment |
- | - | - | - | - | - | - | |||||||||||||||||||||
| Ending balance: loans acquired with deteriorated credit quality |
- | 170 | - | - | - | - | 170 | |||||||||||||||||||||
| Financing Receivables: |
||||||||||||||||||||||||||||
| Ending balance (loan portfolio) |
$ | 165,335 | $ | 427,994 | $ | 27,553 | $ | 295,721 | $ | 138,290 | $ | 19,218 | $ | 1,074,111 | ||||||||||||||
| Ending balance: individually evaluated for impairment |
2,885 | 5,266 | 1,261 | - | - | - | 9,412 | |||||||||||||||||||||
| Ending balance: collectively evaluated for impairment |
- | - | - | 832 | 60 | 54 | 946 | |||||||||||||||||||||
| Ending balance: loans acquired with deteriorated credit quality |
- | 850 | - | - | - | - | 850 | |||||||||||||||||||||
Loans acquired from CNB Financial are excluded from the above table.
The following is a summary of past due and non-accrual loans at December 31, 2010:
| 30-59 Days Past Due |
60-89 Days Past Due |
90 Days and Over Past Due |
Total Past Due |
Current | Total Financing Receivables |
Recorded Investments > 90 Days and Accruing |
||||||||||||||||||||||
| Commercial: |
||||||||||||||||||||||||||||
| Commercial and industrial |
$ | 131 | $ | 122 | $ | 3,135 | $ | 3,388 | $ | 161,947 | $ | 165,335 | $ | - | ||||||||||||||
| Commercial real estate |
3,291 | 1,088 | 2,864 | 7,243 | 420,751 | 427,994 | - | |||||||||||||||||||||
| Construction |
- | - | 552 | 552 | 27,001 | 27,553 | - | |||||||||||||||||||||
| Consumer: |
||||||||||||||||||||||||||||
| Residential real estate |
7,657 | 1,001 | 1,036 | 9,694 | 286,027 | 295,721 | - | |||||||||||||||||||||
| Home equity |
730 | 223 | 60 | 1,013 | 137,277 | 138,290 | - | |||||||||||||||||||||
| Consumer |
145 | 8 | 55 | 208 | 19,010 | 19,218 | - | |||||||||||||||||||||
| Total |
$ | 11,954 | $ | 2,442 | $ | 7,702 | $ | 22,098 | $ | 1,052,013 | $ | 1,074,111 | $ | - | ||||||||||||||
F-29
Table of Contents
UNITED FINANCIAL BANCORP, INC. AND SUBSIDIARY
Notes to Consolidated Financial Statements
December 31, 2010, 2009 and 2008
(Dollars in thousands, except per share amounts)
NOTE E – LOANS, NET – Continued
The following is a summary of impaired loans at December 31, 2010:
| Recorded Investment |
Unpaid Principal Balance |
Related Allowance |
||||||||||
| With no related allowance recorded: |
||||||||||||
| Commercial and industrial |
$ | 112 | $ | 112 | $ | - | ||||||
| Commercial real estate |
6,246 | 6,246 | - | |||||||||
| Construction |
1,282 | 1,282 | - | |||||||||
| Residential real estate |
1,036 | 1,036 | - | |||||||||
| Home Equity |
60 | 60 | - | |||||||||
| Consumer |
55 | 55 | - | |||||||||
| With an allowance recorded: |
||||||||||||
| Commercial and industrial |
2,324 | 2,773 | 449 | |||||||||
| Commercial real estate |
1,125 | 1,343 | 218 | |||||||||
| Construction |
- | - | - | |||||||||
| Residential real estate |
- | - | - | |||||||||
| Home Equity |
- | - | - | |||||||||
| Consumer |
- | - | - | |||||||||
| Total: |
||||||||||||
| Commercial portfolio segment |
$ | 11,089 | $ | 11,756 | $ | 667 | ||||||
| Consumer portfolio segment |
1,151 | 1,151 | - | |||||||||
| Total impaired loans |
$ | 12,240 | $ | 12,907 | $ | 667 | ||||||
Loans acquired from CNB Financial that are impaired at December 31, 2010, are included in the above table.
The following is a summary of information pertaining to impaired and non-accrual loans:
| December 31, | ||||||||
| 2010 | 2009 | |||||||
| Impaired loans without a valuation allowance |
$ | 8,791 | $ | 4,444 | ||||
| Impaired loans with a valuation allowance |
4,116 | 11,843 | ||||||
| Total impaired loans |
$ | 12,907 | $ | 16,287 | ||||
| Valuation allowance related to impaired loans |
$ | 667 | $ | 599 | ||||
| Total non-accrual loans |
$ | 9,434 | (1) | $ | 16,287 | |||
| Total loans past-due ninety days or more and still accruing |
$ | - | $ | - | ||||
| Accruing troubled debt restructure |
$ | 3,473 | $ | - | ||||
(1) Includes two troubled debt restructure loans in the amounts of $860 and $872 that were restructured in the second and fourth quarters of 2010, respectively.
F-30
Table of Contents
UNITED FINANCIAL BANCORP, INC. AND SUBSIDIARY
Notes to Consolidated Financial Statements
December 31, 2010, 2009 and 2008
(Dollars in thousands, except per share amounts)
NOTE E – LOANS, NET – Continued
| Years Ended December 31, | ||||||||||||
| 2010 | 2009 | 2008 | ||||||||||
| Average investment in impaired loans |
$ | 14,070 | $ | 9,264 | $ | 3,961 | ||||||
| Interest income recognized on impaired loans |
$ | 120 | $ | - | $ | - | ||||||
| Interest income recognized on a cash basis on impaired loans |
$ | 120 | $ | - | $ | - | ||||||
Additional interest income of approximately $363, $281 and $132, respectively, would have been recorded during the years ended December 31, 2010, 2009 and 2008, respectively, if the impaired loans had performed in accordance with their original terms.
No additional funds are committed to be advanced to borrowers with impaired loans.
The following is a summary of non-accrual loans as of December 31, 2010:
| 2010 | ||||
| Commercial: |
||||
| Commercial and industrial |
$ | 2,885 | ||
| Commercial real estate |
4,116 | |||
| Commercial and residential construction |
1,282 | |||
| Consumer: |
||||
| Residential real estate |
1,036 | |||
| Home equity |
60 | |||
| Consumer |
55 | |||
| Total |
$ | 9,434 | ||
CREDIT QUALITY INFORMATION
The Company utilizes a nine grade risk rating system for C&I, commercial real estate and construction loans as follows:
Pass: Loans in these categories are considered “pass” rated loans with low to average risk.
Special Mention: Loans in this category are considered “special mention”. These loans portray one or more weaknesses that may be tolerated in the short run. Assets in this category are currently protected but are potentially weak and are being closely monitored by management.
Substandard: Loans in this category are considered “substandard”. Generally, a loan is considered substandard if it is inadequately protected by the current sound worth and paying capacity of the obligor or of the collateral pledged. There is distinct possibility that the Company will sustain some loss if the weakness is not corrected.
F-31
Table of Contents
UNITED FINANCIAL BANCORP, INC. AND SUBSIDIARY
Notes to Consolidated Financial Statements
December 31, 2010, 2009 and 2008
(Dollars in thousands, except per share amounts)
NOTE E – LOANS, NET – Continued
Doubtful: Loans in this category are considered “doubtful”. Loans classified as doubtful have all the weaknesses inherent in those classified substandard with the added characteristic that the weaknesses make the collection or liquidation in full, on the basis of currently existing facts, conditions and values, highly questionable and improbable. The possibility of loss is extremely high, however, its classification as an estimated loss is deferred until a more exact determination of the extent of the loss is ascertained.
Loss: Loans in this category are considered uncollectible “loss” and of such little value that their continuance as loans is not warranted.
The Company does not assign risk ratings to residential real estate, home equity and mobile home consumer loans unless they are contractually past due 90 days or more or where legal action has commenced against the borrower. All other consumer loans are charged off when they become contractually past due 120 days. Those loans not assigned a rating are considered “pass”.
On an annual basis, or more often if needed, the Company formally reviews the ratings on all commercial and industrial, commercial real estate and construction loans. Semi-annually, the Company engages an independent third-party to review a significant portion of loans within these segments. Management uses the results of these reviews as part of its annual review process.
| Commercial Portfolio Segment Credit Exposure Credit Risk Profile by Internally Assigned Grade |
||||||||||||
| Commercial and Industrial |
Commercial Real Estate |
Construction | ||||||||||
| Grade: |
||||||||||||
| Pass |
$ | 141,101 | $ | 391,336 | $ | 18,315 | ||||||
| Special Mention |
11,503 | 13,447 | 2,678 | |||||||||
| Substandard |
12,419 | 23,211 | 6,560 | |||||||||
| Doubtful |
312 | - | - | |||||||||
| Total |
$ | 165,335 | $ | 427,994 | $ | 27,553 | ||||||
| Consumer Portfolio Segment Credit Exposure Credit Risk Profile by Internally Assigned Grade |
||||||||||||
| Residential | Home Equity | Consumer | ||||||||||
| Grade: |
||||||||||||
| Pass |
$ | 293,999 | $ | 138,093 | $ | 19,155 | ||||||
| Special Mention |
59 | - | - | |||||||||
| Substandard |
1,663 | 197 | 63 | |||||||||
| Doubtful |
- | - | - | |||||||||
| Total |
$ | 295,721 | $ | 138,290 | $ | 19,218 | ||||||
F-32
Table of Contents
UNITED FINANCIAL BANCORP, INC. AND SUBSIDIARY
Notes to Consolidated Financial Statements
December 31, 2010, 2009 and 2008
(Dollars in thousands, except per share amounts)
NOTE E – LOANS, NET – Continued
As of November 30, 2009, the CNB Financial Corp. commercial loans acquired by the Company within the scope of ASC 310 had an unpaid principal balance of $5,178 and a fair value of $3,079.
The following is a summary of acquired loan information for CNB Financial as of December 31, 2010:
| Contractual Required Payments Receivable |
Cash Expected To Be Collected (1) |
Non-accretable Difference |
Accretable Yield |
Loans Receivable |
||||||||||||||||
| Balance at acquisition date of November 30, 2009 |
$ | 5,178 | $ | 3,079 | $ | 2,099 | $ | 13 | $ | 3,066 | ||||||||||
| Recognition of additional non- accretable yield |
- | (250 | ) (2) | 250 | - | - | ||||||||||||||
| Balance as of December 31, 2009 |
5,178 | 2,829 | 2,349 | 13 | 2,816 | |||||||||||||||
| 2010 Collections |
(3,645 | ) | (2,264 | ) | (1,381 | ) | (13 | ) | (2,251 | ) | ||||||||||
| Transfer to OREO |
(393 | ) | (393 | ) (3) | - | - | (393 | ) | ||||||||||||
| Accretable yield recognized in earnings |
- | - | - | (348 | ) (4) | - | ||||||||||||||
| Balance as of December 31, 2010 |
$ | 1,140 | $ | 172 | $ | 968 | $ - | $ | 172 | |||||||||||
| (1) | The Company has not factored any prepayments into the expected cash flows. |
(2) During the third quarter of 2010, the Company increased its non-accretable difference, with a corresponding increase to goodwill, by $250, based upon information obtained in the third quarter about conditions existing at the acquisition date.
(3) The reduction in the carrying amount and the cash expected to be collected is due to one loan that was foreclosed upon and transferred to OREO. Prior to acquisition of CNB a portion of this loan was charged off in order to adjust the loan to its fair value; therefore, there was no non-accretable difference recorded against this loan on the aquisition date.
(4) The transfer from non-accretable yield is due to repayment received in excess of cash expected to be collected, net of selling costs.
Under ASC 310, the excess of cash flows expected at acquisition over the estimated fair value is referred to as the accretable yield and is recognized in interest income over the remaining life of the loans. The difference between contractually required payments at acquisition and the cash flows expected to be collected at acquisition is referred to as the nonaccretable difference. Changes in the expected cash flows from the date of acquisition will either impact the accretable yield or result in a charge to the provision for credit losses. Subsequent decreases to expected principal cash flows will result in a charge to the provision for credit losses and a corresponding increase to the allowance for loan losses. Subsequent increases in expected principal cash flows will result in recovery of any previously recorded allowance for loan losses, to the extent applicable, and a reclassification from nonaccretable difference to accretable yield for any remaining increase. All changes in expected interest cash flows will result in reclassifications to/from nonaccretable differences.
F-33
Table of Contents
UNITED FINANCIAL BANCORP, INC. AND SUBSIDIARY
Notes to Consolidated Financial Statements
December 31, 2010, 2009 and 2008
(Dollars in thousands, except per share amounts)
NOTE E – LOANS, NET – Concluded
Loans in the ASC 310 population that are modified subsequent to acquisition are reviewed to compare modified contractual cash flows to the ASC 310 carrying value. If modified cash flows are lower than the carrying value, the loan is removed from the ASC 310 pool at its carrying value, as well as the related allowance for loan losses, and is classified as a troubled debt restructure. At December 31, 2010 the Company did not have any acquired loans that were troubled debt restructures.
NOTE F – BANKING PREMISES AND EQUIPMENT
The composition of banking premises and equipment is as follows at December 31:
| 2010 | 2009 | Estimated Useful Lives | ||||||||
| Land and improvements |
$ | 2,426 | $ | 2,419 | ||||||
| Buildings and improvements |
8,857 | 8,804 | 25 - 40 Years | |||||||
| Leasehold improvements |
1,394 | 1,294 | Lesser of useful life or term of lease | |||||||
| Furniture and equipment |
3,141 | 3,326 | 3 - 10 Years | |||||||
| Assets under capitalized leases |
5,359 | 5,359 | Lesser of lease term or useful life | |||||||
| 21,177 | 21,202 | |||||||||
| Less accumulated depreciation and amortization |
(5,612) | (5,267) | ||||||||
| $ | 15,565 | $ | 15,935 | |||||||
Depreciation and amortization expense, including amortization for capitalized leases, totaled $1,504, $1,119 and $907 for the years ended December 31, 2010, 2009 and 2008, respectively.
The Company leases fifteen of its branches, two ATM facilities and two financial services offices (all operating leases). Rent expense for the years ended December 31, 2010, 2009 and 2008 amounted to approximately $1,334, $757 and $645, respectively. The leases, which are non-cancelable, expire at various dates through 2034. The Company also entered into a capital lease obligation for three of its branches.
F-34
Table of Contents
UNITED FINANCIAL BANCORP, INC. AND SUBSIDIARY
Notes to Consolidated Financial Statements
December 31, 2010, 2009 and 2008
(Dollars in thousands, except per share amounts)
NOTE F – BANKING PREMISES AND EQUIPMENT – Concluded
Future minimum rental commitments under the terms of these leases are as follows:
| Operating Leases |
Capital Leases |
Total | ||||||||||
| Years ending December 31, |
||||||||||||
| 2011 |
$ | 1,062 | $ | 406 | $ | 1,468 | ||||||
| 2012 |
999 | 406 | 1,405 | |||||||||
| 2013 |
944 | 406 | 1,350 | |||||||||
| 2014 |
947 | 406 | 1,353 | |||||||||
| 2015 |
908 | 407 | 1,315 | |||||||||
| Thereafter |
4,241 | 6,356 | 10,597 | |||||||||
| Total minimum lease payments |
$ | 9,101 | 8,387 | $ | 17,488 | |||||||
| Less interest included above |
(3,376) | |||||||||||
| Capitalized lease obligations |
$ | 5,011 | ||||||||||
NOTE G – DEPOSITS
Deposit accounts by type are summarized as follows at December 31:
| 2010 | 2009 | |||||||
| Demand |
$ | 175,996 | $ | 154,374 | ||||
| NOW |
40,922 | 42,262 | ||||||
| Savings |
203,165 | 174,270 | ||||||
| Money market |
260,573 | 189,763 | ||||||
| Certificates of deposit |
462,645 | 478,258 | ||||||
| $ | 1,143,301 | $ | 1,038,927 | |||||
At December 31, 2010, the scheduled maturities of time deposits are as follows:
| Time Deposits | ||||||||||||
| > $100 | < $100 | Total (1) | ||||||||||
| 2011 |
$ | 139,205 | $ | 143,577 | $ | 282,782 | ||||||
| 2012 |
44,736 | 37,309 | 82,045 | |||||||||
| 2013 |
26,499 | 17,870 | 44,369 | |||||||||
| 2014 |
13,289 | 13,583 | 26,872 | |||||||||
| 2015 |
18,281 | 8,180 | 26,461 | |||||||||
| Total |
$ | 242,010 | $ | 220,519 | $ | 462,529 | ||||||
(1) Includes brokered deposits in the amount of $8,360 and excludes the unamortized fair value adjustment balance of $116 recorded in connection with the acquisition of CNB Financial.
F-35
Table of Contents
UNITED FINANCIAL BANCORP, INC. AND SUBSIDIARY
Notes to Consolidated Financial Statements
December 31, 2010, 2009 and 2008
(Dollars in thousands, except per share amounts)
NOTE G – DEPOSITS – Concluded
Interest expense on deposits, classified by type, is as follows:
| Years Ended December 31, | ||||||||||||
| 2010 | 2009 | 2008 | ||||||||||
| NOW |
$ | 199 | $ | 149 | $ | 171 | ||||||
| Regular savings |
1,679 | 1,320 | 1,015 | |||||||||
| Money market |
2,121 | 2,209 | 3,336 | |||||||||
| Certificates of deposit |
9,848 | 10,617 | 13,309 | |||||||||
| Total |
$ | 13,847 | $ | 14,295 | $ | 17,831 | ||||||
NOTE H – SHORT-TERM BORROWINGS
Federal Home Loan Bank of Boston Advances
There were no FHLBB advances with an original maturity of less than one year at December 31, 2010. FHLBB advances with an original maturity of less than one year, amounted to $30,000 at December 31, 2009, at a weighted average rate of .20%. The Company has an available line of credit with the FHLBB at an interest rate that adjusts daily. There were no borrowings against the line of credit at December 31, 2010. All borrowings from the FHLBB are secured by a blanket security agreement on qualified collateral, principally mortgage loans and U.S. Government and federal agency securities in an aggregate amount equal to outstanding advances. The Company’s unused borrowing capacity with the FHLBB, excluding its available line of credit balance of $2,000 at December 31, 2010 was approximately $219,900.
Repurchase Agreements
Securities sold under agreements to repurchase include funds borrowed from customers on an overnight basis. These customer repurchase agreements amounted to $21,029 and $27,303 at December 31, 2010 and 2009, respectively, at weighted average rates of 0.84% and 1.12%, respectively. Interest expense for 2010, 2009 and 2008 was $185, $122, and $157, respectively. All of the repurchase agreements are secured by government-sponsored and government-guaranteed mortgage-backed securities.
F-36
Table of Contents
UNITED FINANCIAL BANCORP, INC. AND SUBSIDIARY
Notes to Consolidated Financial Statements
December 31, 2010, 2009 and 2008
(Dollars in thousands, except per share amounts)
NOTE I – LONG-TERM DEBT
Federal Home Loan Bank of Boston Advances
Advances outstanding (together with year of maturity) at December 31, 2010 and 2009 consisted of the following:
| 2010 | 2009 | |||||||||||||||
| Amount (1) | Weighted Average Rate |
Amount (1) | Weighted Average Rate |
|||||||||||||
| 2010 |
$ | — | — | $ | 17,644 | 4.65% | ||||||||||
| 2011 |
50,341 | 4.07% | 51,346 | 4.05% | ||||||||||||
| 2012 |
11,902 | 4.26% | 14,013 | 4.27% | ||||||||||||
| 2013 |
43,025 | 4.04% | 44,489 | 4.04% | ||||||||||||
| 2014 |
13,000 | 2.90% | 13,000 | 2.90% | ||||||||||||
| 2015 |
9,767 | 3.41% | 11,806 | 3.41% | ||||||||||||
| Thereafter |
23,247 | 4.27% | 23,254 | 4.27% | ||||||||||||
| $ | 151,282 | 3.96% | $ | 175,552 | 4.03% | |||||||||||
(1) Excludes the fair value adjustment of $2,025 and $2,621 at December 2010 and 2009, respectively, recorded in connection with the acquisition of CNB Financial.
At December 31, 2010, advances in the amount of $48,000 are callable at the option of the FHLBB at various dates through 2013.
Reverse Repurchase Agreements
The Company secured two structured term reverse repurchase agreements for $10,000 through another financial institution in 2008 and 2009. The reverse repurchase agreement entered into in 2008 for $10,000 matures in 2018, is callable in 2011 and has a rate of 2.73%. The reverse repurchase agreement entered into in 2009 for $10,000 matures in 2019, is callable in 2014 and has a rate of 2.44%. Interest expense for 2010, 2009 and 2008 was $517, $512 and $27, respectively. All of the repurchase agreements are secured by government-sponsored and government-guaranteed mortgage-backed securities.
Subordinated Debentures
The Company has outstanding subordinated debt in the form of trust preferred securities issued through a private placement offering in the face amount of $7,732. The Company recorded a fair value acquisition discount of $2,383 in connection with the acquisition of CNB Financial Corp. on November 30, 2009. The remaining unamortized discount was $2,284 at December 31, 2010. The issue has a maturity date of March 15, 2036 and bears a floating rate
F-37
Table of Contents
UNITED FINANCIAL BANCORP, INC. AND SUBSIDIARY
Notes to Consolidated Financial Statements
December 31, 2010, 2009 and 2008
(Dollars in thousands, except per share amounts)
NOTE I – LONG-TERM DEBT – Concluded
of interest that reprices quarterly at the 3-month LIBOR rate plus 1.85%. The interest rate at December 31, 2010 was 2.15%. A special redemption provision allows the Company to redeem the issue at par.
NOTE J – INCOME TAXES
The provision for federal and state income taxes is as follows:
| Years Ended December 31, | ||||||||||||
| 2010 | 2009 | 2008 | ||||||||||
| Current tax provision: |
||||||||||||
| Federal |
$ | 3,771 | $ | 4,514 | $ | 6,942 | ||||||
| State |
1,026 | 1,056 | 1,832 | |||||||||
| 4,797 | 5,570 | 8,774 | ||||||||||
| Deferred tax provision (benefit): |
||||||||||||
| Federal |
780 | (1,190) | (2,890) | |||||||||
| State |
(108) | (366) | (687) | |||||||||
| 672 | (1,556) | (3,577) | ||||||||||
| Provision for income taxes |
$ | 5,469 | $ | 4,014 | $ | 5,197 | ||||||
The following table summarizes the difference between the statutory federal income tax rate and the effective rate:
| Years Ended December 31, | ||||||||||||
| 2010 | 2009 | 2008 | ||||||||||
| Statutory federal income tax rate |
34.0% | 34.0% | 34.0% | |||||||||
| Increase (decrease) resulting from: |
||||||||||||
| State taxes, net of federal tax benefit |
3.8 | 4.6 | 6.0 | |||||||||
| Stock-based compensation |
1.8 | 2.7 | 1.6 | |||||||||
| Tax-exempt obligations |
(2.7) | (2.1) | (1.3) | |||||||||
| Bank owned life insurance |
(3.1) | (4.9) | (1.0) | |||||||||
| Non-deductible acquisition expenses |
0.5 | 6.2 | - | |||||||||
| Other, net |
1.0 | 0.4 | 2.3 | |||||||||
| Effective tax rate |
35.3% | 40.9% | 41.6% | |||||||||
F-38
Table of Contents
UNITED FINANCIAL BANCORP, INC. AND SUBSIDIARY
Notes to Consolidated Financial Statements
December 31, 2010, 2009 and 2008
(Dollars in thousands, except per share amounts)
NOTE J – INCOME TAXES – Continued
The components of the net deferred tax asset are as follows:
| December 31, | ||||||||
| 2010 | 2009 | |||||||
| Deferred tax asset: |
||||||||
| Federal |
$ | 12,242 | $ | 13,194 | ||||
| State |
3,455 | 3,450 | ||||||
| 15,697 | 16,644 | |||||||
| Deferred tax liability: |
||||||||
| Federal |
(3,947) | (4,480) | ||||||
| State |
(721) | (869) | ||||||
| (4,668) | (5,349) | |||||||
| Net deferred tax asset: |
$ | 11,029 | $ | 11,295 | ||||
The tax effects of each type of income and expense item that give rise to deferred taxes are as follows:
| At December 31, | ||||||||
| 2010 | 2009 | |||||||
| Cash basis of accounting |
$ | 267 | $ | 129 | ||||
| Investments: |
||||||||
| Net unrealized gain on securities available for sale |
(3,282) | (3,633) | ||||||
| Impairment losses |
645 | 596 | ||||||
| Retirement benefits |
460 | 405 | ||||||
| Depreciation |
644 | 679 | ||||||
| Deferred benefit (expense) |
336 | (799) | ||||||
| Fair value acquisition adjustment |
- | 2,786 | ||||||
| Allowance for loan losses |
4,080 | 3,750 | ||||||
| Employee benefit plans |
3,127 | 2,807 | ||||||
| Market value adjustment on loans |
4,770 | 4,217 | ||||||
| Contribution carryover |
- | 244 | ||||||
| State tax credits |
- | 53 | ||||||
| Other |
(18) | 61 | ||||||
| Net deferred tax asset |
$ | 11,029 | $ | 11,295 | ||||
F-39
Table of Contents
UNITED FINANCIAL BANCORP, INC. AND SUBSIDIARY
Notes to Consolidated Financial Statements
December 31, 2010, 2009 and 2008
(Dollars in thousands, except per share amounts)
NOTE J – INCOME TAXES – Concluded
A summary of the change in the net deferred tax asset is as follows:
| At December 31, | ||||||||
| 2010 | 2009 | |||||||
| Balance at beginning of year |
$ | 11,295 | $ | 7,969 | ||||
| (Benefit) provision for prepaid taxes |
(672) | 1,556 | ||||||
| Tax effect of changes in accumulated other comprehensive income |
406 | (2,854) | ||||||
| Acquisition of CNB Financial |
- | 4,624 | ||||||
| Balance at end of year |
$ | 11,029 | $ | 11,295 | ||||
The Bank’s base year reserve (as of December 31, 1995) will not be recaptured unless the reserve is used for purposes other than for loan losses, such as in a distribution in liquidation or otherwise. Accordingly, the Bank has not recorded a deferred tax liability of approximately $1,043 relating to approximately $2,600 of cumulative tax deductions related to loans generated prior to December 31, 1995.
NOTE K – EARNINGS PER SHARE
The calculation of basic earnings per common share and diluted earnings per common share for the years ended December 31, 2010, 2009 and 2008 is presented below.
| Years Ended December 31, | ||||||||||||
| 2010 | 2009 | 2008 | ||||||||||
| Net income |
$ | 10,032 | $ | 5,806 | $ | 7,298 | ||||||
| Weighted average common shares applicable to basic EPS (3 & 4) |
15,302,505 | 15,265,192 | 16,445,388 | |||||||||
| Effect of dilutive potential common shares (1, 2) |
92,256 | 8,183 | - | |||||||||
| Weighted average common shares applicable to diluted EPS (4) |
15,394,761 | 15,273,375 | 16,445,388 | |||||||||
| Earnings per share: |
||||||||||||
| Basic |
$ | 0.66 | $ | 0.38 | $ | 0.44 | ||||||
| Diluted |
$ | 0.65 | $ | 0.38 | $ | 0.44 | ||||||
| (1) | For the years ended December 31, 2010, 2009 and 2008, options to purchase 1,405,286, 1,604,850 and 1,175,964 shares, respectively, were not included in the computation of diluted earnings per share because they were antidilutive. |
| (2) | Includes incremental shares related to dilutive stock options. |
F-40
Table of Contents
UNITED FINANCIAL BANCORP, INC. AND SUBSIDIARY
Notes to Consolidated Financial Statements
December 31, 2010, 2009 and 2008
(Dollars in thousands, except per share amounts)
NOTE K – EARNINGS PER SHARE – Concluded
| (3) | Includes shares repurchased in June 2008 through September 2008 to fund the 2008 Equity Incentive Plan. |
| (4) | 2008 basic and diluted share data were revised as required by the Earnings Per Share Topic of FASB ASC and in accordance with the provisions of “Determining Whether Instruments Issued in Share-Based Payment Transactions are Participating Securities” which require that share-based compensation awards that qualify as participating securities (entitled to receive non-forfeitable dividends) be included in basic EPS using the two-class method. This revision decreased basic earnings per share $0.01 for the year ended December 31, 2008. |
NOTE L – STOCK-BASED INCENTIVE PLANS
The Company’s 2008 Equity Incentive Plan (the “2008 Incentive Plan”) was approved by the shareholders at the Company’s Annual Meeting held in June 2008. The 2008 Incentive Plan will remain in effect for a period of ten years and authorizes the issuance of up to 1,258,534 shares of Company common stock pursuant to grants of restricted stock awards, restricted stock unit awards, incentive stock options, non-statutory stock options and stock appreciation rights; provided, however, that no more than 898,953 shares may be issued or delivered in the aggregate pursuant to the exercise of stock options or stock appreciation rights, and no more than 359,581 shares may be issued or delivered pursuant to restricted stock awards or restricted stock unit awards.
Employees and outside directors of the Company are eligible to receive awards under the 2008 Incentive Plan. The holders of restricted stock awards also have full voting rights beginning on the grant date. Upon the occurrence of an event constituting a change in control of the Company, as defined in the 2008 Incentive Plan, all outstanding stock options will become fully vested, and all stock awards then outstanding will vest free of restrictions.
The Company’s 2006 Stock-Based Incentive Plan (the “2006 Incentive Plan”) was approved by shareholders at the Company’s Annual Meeting held in July 2006. The 2006 Incentive Plan will remain in effect for a period of ten years and provides for the issuance of up to 1,180,330 shares of Company common stock pursuant to grants of incentive and non-statutory stock options, stock appreciation rights and restricted stock awards, provided that no more than 337,237 shares may be issued as restricted stock awards, and no more than 843,093 shares may be issued pursuant to the exercise of stock options. As of a result of the Company’s second step conversion and offering completed in December 2007 and in accordance with provisions in the 2006 Incentive Plan, the Board of Directors voted to adjust the total number of shares authorized for grant, the number of stock options outstanding and the exercise prices for outstanding options by the exchange ratio of 1.04079. Employees and outside directors of the Company are eligible to receive awards under the 2006 Incentive Plan. The holders of
F-41
Table of Contents
UNITED FINANCIAL BANCORP, INC. AND SUBSIDIARY
Notes to Consolidated Financial Statements
December 31, 2010, 2009 and 2008
(Dollars in thousands, except per share amounts)
NOTE L – STOCK-BASED INCENTIVE PLANS – Continued
restricted stock awards also have full voting rights beginning on the grant date. Upon the occurrence of an event constituting a change in control of the Company, as defined in the 2006 Incentive Plan, all outstanding stock options will become fully vested, and all stock awards then outstanding will vest free of restrictions.
Under the incentive plans, stock options are granted at an exercise price equal to the fair value of the underlying shares at the date of grant and have a contractual life of ten years. Stock options vest based on continued service with the Company over the five year period following the grant date. The compensation cost related to stock options is based upon the fair value for each option as of the date of the grant determined using the Black-Scholes option pricing model. The Black-Scholes model requires the Company to provide estimates of the expected term, volatility of the underlying stock, the stock’s dividend yield and the discount rate. The Company intends to repurchase shares in the open market to satisfy stock option exercises.
The compensation cost related to restricted stock awards is based upon the Company’s stock price at the grant date. Restricted stock awards generally vest based upon continuous service with the Company over the five year period following the grant date. During the vesting period, participants are entitled to dividends for all awards.
F-42
Table of Contents
UNITED FINANCIAL BANCORP, INC. AND SUBSIDIARY
Notes to Consolidated Financial Statements
December 31, 2010, 2009 and 2008
(Dollars in thousands, except per share amounts)
NOTE L – STOCK-BASED INCENTIVE PLANS – Continued
A combined summary of activity in the Company’s incentive plans for the years ended December 31, 2009 and 2010 is presented in the following table:
| Shares Available for Grant |
Stock Awards Outstanding |
Stock Options Outstanding | ||||||||||||||||||
| Number of Shares |
Weighted- Average Grant Value |
Number of Shares |
Weighted- Average Exercise Price |
|||||||||||||||||
| Balance at December 31, 2008 |
334,795 | 488,992 | $ | 11.91 | 1,525,745 | $ | 12.00 | |||||||||||||
| Stock Incentive Plans assumed from CNB Financial |
202,680 | (1) | - | - | 146,737 | (2) | 15.31 | |||||||||||||
| Granted |
(232,500) | 68,750 | 12.94 | 163,750 | 12.99 | |||||||||||||||
| Stock options exercised |
- | - | - | (3,500) | 11.66 | |||||||||||||||
| Shares vested |
- | (121,196) | 12.02 | - | - | |||||||||||||||
| Forfeited |
8,847 | - | - | (8,847) | 12.35 | |||||||||||||||
| Cancelled |
14,000 | - | - | (14,000) | 11.66 | |||||||||||||||
| Balance at December 31, 2009 |
327,822 | 436,546 | $ | 12.04 | 1,809,885 | $ | 12.36 | |||||||||||||
| Granted |
(38,500) | 3,000 | 14.34 | 35,500 | 14.70 | |||||||||||||||
| Stock options exercised |
- | - | - | (73,955) | 12.10 | |||||||||||||||
| Shares vested |
- | (132,924) | 12.30 | - | - | |||||||||||||||
| Forfeited |
6,800 | - | - | (6,800) | 13.85 | |||||||||||||||
| Cancelled |
- | - | - | - | - | |||||||||||||||
| Balance at December 31, 2010 |
296,122 | 306,622 | $ | 12.15 | 1,764,630 | $ | 12.42 | |||||||||||||
| (1) | Reflects stock options and restricted shares available for grant under plans assumed from CNB Financial. |
| (2) | Certain options to acquire CNB Financial common stock (the “CNB Financial Options”) were assumed by the Company and converted into options to purchase 146,737 shares of the Company’s Common Stock. |
During 2010 the Company granted 35,500 stock options and 3,000 restricted shares to certain employees under the 2008 Incentive Plans. The stock options had a weighted average value of $3.77 per share, with a total grant date fair value of $134. The restricted shares had a weighted average value of $14.34 per share, with a total grant date fair value of $43.
On December 1, 2009 the Company granted 155,250 stock options and 68,750 restricted shares to certain directors and employees under the 2006 and 2008 Incentive Plans. The stock options had a weighted average value of $4.16 per share, with a total grant date fair value of $646. The restricted shares had a weighted average value of $12.94 per share, with a total grant date fair value of $890. In 2009, the Company also granted 8,500 stock options to certain employees under the 2008 Incentive plan. The stock options had a weighted average fair value of $2.83 per share and a grant date fair value of $24.
F-43
Table of Contents
UNITED FINANCIAL BANCORP, INC. AND SUBSIDIARY
Notes to Consolidated Financial Statements
December 31, 2010, 2009 and 2008
(Dollars in thousands, except per share amounts)
NOTE L – STOCK-BASED INCENTIVE PLANS – Concluded
The Company’s total compensation cost for shared-based payment arrangements was $2,383 in 2010, $2,281 in 2009 and $1,992 in 2008. The Company recorded tax benefits of $115 in 2010, $34 in 2009 and $0 in 2008 related to the recognition of the shared-based compensation expense. As of December 31, 2010, compensation costs related to non-vested stock awards totaling $4,682 have not been recognized. These costs will be recognized over an estimated weighted average period of 2.4 years.
The following table presents the assumptions used to compute the fair value of options using the Black-Scholes option pricing model for stock options granted during 2010 and 2009.
| 2010 | 2009 | 2008 | ||||||||||
| Weighted average fair value |
$ | 3.77 | $ | 4.16 | $ | 2.57 | ||||||
| Expected term (short-cut method) |
6.50 years | 6.50 years | 6.50 years | |||||||||
| Volatility |
28.13% | 35.33% | 19.30% | |||||||||
| Expected dividend yield |
2.12% | 2.18% | 1.88% | |||||||||
| Weighted average risk-free interest rate |
2.76% | 3.28% | 3.89% | |||||||||
A summary of stock options outstanding and exercisable at December 31, 2010 is as follows:
| Stock Options | ||||||||
| Outstanding | Exercisable | |||||||
| Total number of shares |
1,764,630 | 1,001,350 | ||||||
| Weighted average exercise price |
$ | 12.42 | $ | 12.63 | ||||
| Aggregate intrinsic value |
$ | 5,090 | $ | 2,706 | ||||
| Weighted average remaining contractual term |
6.6 years | 6.0 years | ||||||
NOTE M – EMPLOYEE BENEFIT PLANS
Retirement Plans
The Company sponsors a defined contribution plan. Employees make voluntary contributions which are matched by the Company up to a maximum of 5% of the employee’s qualified salary. The contributions matched by the Company were $600, $434 and $389 for the years ended December 31, 2010, 2009 and 2008, respectively.
F-44
Table of Contents
UNITED FINANCIAL BANCORP, INC. AND SUBSIDIARY
Notes to Consolidated Financial Statements
December 31, 2010, 2009 and 2008
(Dollars in thousands, except per share amounts)
NOTE M – EMPLOYEE BENEFIT PLANS – Continued
Incentive Plan
The Company maintains an incentive plan in which employees are eligible to participate. The incentive plan provides for awards based on the achievement of both individual and Company performance goals, subject to approval by the Board of Directors. Related expense amounted to $1,259, $972 and $839 for the years ended December 31, 2010, 2009 and 2008, respectively.
Senior Executive Retirement Plan
The Company has entered into Executive Supplemental Compensation Agreements (the “Agreements”) with certain of its current and former officers. The estimated amount to be paid under the Agreements is accrued over the executive’s active employment from the time the agreement is signed to the date of full eligibility. Effective October 1, 2007, the Company consolidated the Agreements of current senior executives into a SERP. The Company continues to maintain the Agreements for certain former officers. The liability associated with the Agreements was $747 and $777 at December 31, 2010 and 2009, respectively, and is included in accrued expenses and other liabilities in the consolidated balance sheets. The expense for the Agreements was $46 for the year ended December 31, 2010 and $18 for the years ended 2009 and 2008.
The SERP provides that each executive will receive supplemental benefits, to the extent vested, commencing 180 days following separation from service. The supplemental benefit will be equal to the percentage of the executive’s final average compensation set forth in each executive’s participation agreement, multiplied by a fraction, the numerator of which is the executive’s years of credited service with the Company and the denominator of which is set forth in the executive’s participation agreement. The supplemental benefit will commence on the executive’s normal benefit date and will be payable in a lump sum, unless the executive has elected, at the time of execution of the participation agreement, to receive an annuity or other form of benefit. The SERP is unfunded and is considered a nonqualified plan under the Internal Revenue Code.
Directors Fee Continuation Plan
The Company sponsors a Directors Fee Continuation Plan under which a Director will annually receive $15 ($24 for former chairpersons) for ten years beginning upon attaining the normal retirement date. The benefit is reduced for directors serving fewer than 15 years. In the event of the participant’s death prior to receiving the full benefits of the plan, any unpaid benefits will be paid to the beneficiary. The Company recognizes expense under this plan on a
F-45
Table of Contents
UNITED FINANCIAL BANCORP, INC. AND SUBSIDIARY
Notes to Consolidated Financial Statements
December 31, 2010, 2009 and 2008
(Dollars in thousands, except per share amounts)
NOTE M – EMPLOYEE BENEFIT PLANS – Continued
ratable basis such that the present value of the liability is fully accrued at each director’s normal retirement date. Effective October 1, 2007, the Board of Directors adopted a Director Retirement Plan to replace the Directors Fee Continuation Plan. Current directors who are participants in the Directors Fee Continuation Plan, the predecessor plan, will participate in the plan from the effective date. Additional directors will begin participation in the plan as of the first day of the plan year in which they become members of the board of directors. Retired directors will continue to receive benefits under the Directors Fee Continuation Plan. At December 31, 2010 and 2009, the Company’s recorded liability for this plan amounted to $356 and $433, respectively, and is included in accrued expenses and other liabilities in the consolidated balance sheets. The Company was not required to record an expense for the years ended December 31, 2010, 2009 and 2008.
Director Retirement Plan
The Director Retirement Plan will provide for the payment of normal retirement benefits upon the director’s separation from service on or after attainment of his normal retirement age (age 72 or age 65 with 10 years of service). The normal retirement benefit will generally be equal to 70% of the average annual director’s fees over the highest three years during a Director’s final 10 years of service, and will be payable in 10 annual installments commencing within 60 days after the director’s separation from service.
In the event a participant has a separation from service prior to his normal retirement date (other than due to termination for cause, disability or death), the participant will be entitled to a lesser benefit payable in ten annual installments commencing at age 65. The amount payable will be determined by multiplying the normal retirement benefit by the director’s benefit percentage, which is 10% for each year of service, up to 100%. The supplemental benefit will commence on the director’s normal benefit date and will be payable in a lump sum, unless the director has elected, at the time of execution of the participation agreement, to receive an annuity or other form of benefit. A director’s benefit percentage will accelerate to 100% upon the director’s separation from service due to death, disability or a change in control. The Director Retirement Plan is accounted for as a defined benefit plan.
F-46
Table of Contents
UNITED FINANCIAL BANCORP, INC. AND SUBSIDIARY
Notes to Consolidated Financial Statements
December 31, 2010, 2009 and 2008
(Dollars in thousands, except per share amounts)
NOTE M – EMPLOYEE BENEFIT PLANS – Continued
The following table summarizes the changes in the projected benefit obligation (“PBO”), the funded status of the PBO and the weighted average assumptions used to determine the benefit obligation for the SERP and Director Retirement Plan at December 31, 2010 and 2009. These plans had no assets at December 31, 2010 and 2009. Amounts recognized at December 31, 2010 and 2009 are reflected in accrued expenses and other liabilities on the consolidated balance sheets.
| At or For the Years Ended December 31, | ||||||||||||||||
| 2010 | 2009 | |||||||||||||||
| SERP | Director Retirement Plan |
SERP | Director Retirement Plan |
|||||||||||||
| Change in projected benefit obligation: |
||||||||||||||||
| Beginning of period |
$ | 2,741 | $ | 788 | $ | 2,721 | $ | 708 | ||||||||
| Service cost |
319 | 69 | 276 | 59 | ||||||||||||
| Interest cost |
176 | 42 | 140 | 36 | ||||||||||||
| Actuarial (gain)/loss |
(73) | 27 | (396) | (15) | ||||||||||||
| Plan amendments |
326 | - | - | - | ||||||||||||
| Benefits paid |
- | (26) | - | - | ||||||||||||
| End of period |
$ | 3,489 | $ | 900 | $ | 2,741 | $ | 788 | ||||||||
| Funded status: |
||||||||||||||||
| Accrued benefit cost |
$ | 3,489 | $ | 900 | $ | 2,741 | $ | 788 | ||||||||
| Amounts recognized in accumulated other comprehensive income consist of: |
||||||||||||||||
| Prior service cost |
$ | (882) | $ | (219) | $ | (670) | $ | (256) | ||||||||
| Net gain/(losses) |
10 | (45) | (64) | (18) | ||||||||||||
| Total |
$ | (872) | $ | (264) | $ | (734) | $ | (274) | ||||||||
| Weighted-average assumptions used to determine benefit obligations: |
||||||||||||||||
| Discount rate |
6.00% | 5.00% | 6.00% | 5.00% | ||||||||||||
| Rate of compensation increase |
5.00% | 2.00% | 5.00% | 2.00% | ||||||||||||
F-47
Table of Contents
UNITED FINANCIAL BANCORP, INC. AND SUBSIDIARY
Notes to Consolidated Financial Statements
December 31, 2010, 2009 and 2008
(Dollars in thousands, except per share amounts)
NOTE M – EMPLOYEE BENEFIT PLANS – Continued
Components of the net periodic benefit cost are as follows:
| For the Years Ended December 31, | ||||||||||||||||
| 2010 | 2009 | |||||||||||||||
| SERP | Director Retirement Plan |
SERP | Director Retirement Plan |
|||||||||||||
| Periodic benefit cost: |
||||||||||||||||
| Service cost |
$ | 319 | $ | 69 | $ | 276 | $ | 59 | ||||||||
| Interest cost |
176 | 42 | 140 | 36 | ||||||||||||
| Total pension cost |
495 | 111 | 416 | 95 | ||||||||||||
| Prior service cost amortization |
115 | 36 | 76 | 36 | ||||||||||||
| Net periodic benefit cost |
$ | 610 | $ | 147 | $ | 492 | $ | 131 | ||||||||
| Weighted-average assumptions used to determine net periodic benefit cost: |
||||||||||||||||
| Discount rate |
6.00% | 6.00% | 6.00% | 6.00% | ||||||||||||
| Rate of compensation increase |
5.00% | 2.00% | 5.00% | 2.00% | ||||||||||||
The unrecognized prior service cost is being amortized over a period of ten years (estimated employee service life). In 2011, approximately $115 and $37 in prior service cost for SERP and the Director Retirement Plan, respectively, is expected to be recognized as a component of net periodic benefit cost.
At December 31, 2010, the benefit payments expected to be paid in each of the next five years and the aggregate for the five fiscal years thereafter are as follows:
| SERP | Director Retirement Plan |
|||||||
| Years ending December 31, |
||||||||
| 2011 |
$ | - | $ | 25 | ||||
| 2012 |
665 | 219 | ||||||
| 2013 |
2,523 | 25 | ||||||
| 2014 |
- | 26 | ||||||
| 2015 |
- | 207 | ||||||
| 2016 through 2020 |
870 | 518 | ||||||
| Years after 2020 |
3,551 | 689 | ||||||
| Total expected benefit payments |
$ | 7,609 | $ | 1,709 | ||||
Except for the benefit payments expected to be paid, the Company does not expect to make contributions to these plans in 2011.
F-48
Table of Contents
UNITED FINANCIAL BANCORP, INC. AND SUBSIDIARY
Notes to Consolidated Financial Statements
December 31, 2010, 2009 and 2008
(Dollars in thousands, except per share amounts)
NOTE M – EMPLOYEE BENEFIT PLANS – Continued
Employee Stock Ownership Plan
In connection with the Company’s 2005 initial public offering, the Bank established an ESOP for the benefit of each employee that has reached the age of 21 and has completed at least 1,000 hours of service in the previous twelve-month period. The Company issued 641,301 shares of common stock to the ESOP in exchange for a twenty-year note. In connection with the Company’s second step conversion, the number of shares in the plan has been adjusted by the exchange ratio of 1.04079 to total 667,458 shares. The loan amount was approximately $6,413 and was recorded as “Unearned Compensation” within stockholders’ equity. The loan bears interest equal to the prime rate in effect at January 1st of each year and provides for annual payments of principal and interest. Prior to January, 2008, the Board of Directors voted to accelerate its Employee Stock Ownership Plan benefit from a twenty (20) year to a fifteen (15) year allocation period.
As part of the Company’s 2007 second step conversion and offering, an additional 753,834 shares of common stock were contributed to the ESOP in exchange for a twenty-year note. The loan amount was approximately $7,538 and was recorded as “Unearned Compensation” within stockholders’ equity. The loan bears interest equal to the prime rate in effect at January 1st of each year and provides for annual payments of principal and interest. The Board of Directors voted to use a twenty (20) year allocation period for the related ESOP benefit beginning in 2008.
The Company has committed to make contributions to the ESOP sufficient to support the debt service of the loan. The loan is secured by the shares held by the plan trustee in a suspense account for allocation among the participants as the loan is repaid. The Company reports compensation expense equal to the average daily market price of the shares as they are committed to be released from the suspense account. Total compensation expense applicable to the ESOP amounted to $965, $954 and $866 for the years ended December 31, 2010, 2009 and 2008, respectively.
Shares held by the ESOP, adjusted by the exchange ratio of 1.04079, include the following:
| December 31, | ||||||||||||
| 2010 | 2009 | 2008 | ||||||||||
| Allocated |
249,607 | 181,587 | 109,880 | |||||||||
| Committed to be released |
71,709 | 71,709 | 71,707 | |||||||||
| Unallocated |
1,093,212 | 1,164,922 | 1,236,631 | |||||||||
| 1,414,528 | 1,418,218 | 1,418,218 | ||||||||||
F-49
Table of Contents
UNITED FINANCIAL BANCORP, INC. AND SUBSIDIARY
Notes to Consolidated Financial Statements
December 31, 2010, 2009 and 2008
(Dollars in thousands, except per share amounts)
NOTE M – EMPLOYEE BENEFIT PLANS – Concluded
Cash dividends received on allocated shares are allocated to participants and cash dividends received on shares held in suspense are used to fund the scheduled annual debt payment. The fair value of unallocated shares at December 31, 2010, 2009 and 2008 was $16,693, $15,272 and $18,723, respectively.
NOTE N – COMMITMENTS AND CONTINGENCIES
Financial Instruments With Off-Balance Sheet Risk
The Company is party to financial instruments with off-balance sheet risk in the normal course of business to meet the financing needs of its customers. These financial instruments include commitments to originate loans and standby letters of credit. The Company does not record a liability for the fair value of the obligation undertaken in issuing standby letters of credit unless it becomes probable that the Company would have to perform under the guarantee. These instruments involve, to varying degrees, elements of credit and interest rate risk in excess of the amount recognized in the consolidated balance sheets. The contract or notional amounts of those instruments reflect the extent of involvement the Company has in particular classes of financial instruments.
The Company’s exposure to credit loss in the event of nonperformance by the other party to the financial instrument for loan commitments and standby letters of credit is represented by the contractual or notional amounts of those instruments. The Company uses the same credit policies in making commitments and conditional obligations as it does for on-balance sheet instruments.
Financial instruments with off-balance sheet risk at December 31, 2010 and 2009 are as follows:
| 2010 | 2009 | |||||||
| Unused lines of credit |
$ | 233,403 | $ | 226,543 | ||||
| Amounts due mortgagors |
26,500 | 30,225 | ||||||
| Standby letters of credit |
4,382 | 6,155 | ||||||
| Commitments to originate loans |
27,068 | 16,120 | ||||||
Included in commitments to originate loans at December 31, 2010 and 2009 are fixed rate commitments in the amount of $24,116 and $8,698, at interest ranges of 3.40% to 7.00% and 4.45% to 7.25%, respectively.
Commitments to extend credit are agreements to lend to a customer as long as there is no violation of any condition established in the contract. Commitments generally have fixed
F-50
Table of Contents
UNITED FINANCIAL BANCORP, INC. AND SUBSIDIARY
Notes to Consolidated Financial Statements
December 31, 2010, 2009 and 2008
(Dollars in thousands, except per share amounts)
NOTE N – COMMITMENTS AND CONTINGENCIES – Continued
expiration dates or other termination clauses and may require payment of a fee. Since many of the commitments are expected to expire without being drawn upon, the total commitment amounts do not necessarily represent future cash requirements. The Company evaluates each customer’s creditworthiness on a case-by-case basis.
The amount of collateral obtained, if deemed necessary by the Company upon extension of credit, is based on management’s credit evaluation.
Standby letters of credit are conditional commitments issued by the Company to guarantee the performance of a customer to a third party. Those guarantees are primarily issued to support public and private borrowing arrangements, including commercial paper, bond financing and similar transactions. The credit risk involved in issuing letters of credit is essentially the same as that involved in extending loan facilities to customers. The Company holds residential or commercial real estate, accounts receivable, inventory and equipment as collateral supporting those commitments for which collateral is deemed necessary. The extent of collateral held for those commitments at December 31, 2010 and 2009 exceeds 100%.
The Company has also committed to invest up to $10,000, representing 25% of the Class A or senior investor balance, in a low income housing tax credits fund by the end of 2014. At December 31, 2010, the Company has invested $1,970 in the fund, which is included in other assets on the consolidated statement of condition. As a Class A investor, the Company has the right to transfer its investment to the fund’s Class B investor at the end of 10 years at which time the Company would have no compliance requirements or interest in the fund. The fund structure contemplates that the Class A investors will receive 95% of the tax credits and tax benefits from net operating losses for a period of eight years or until the minimum investment return has been met.
Employment and Change in Control Agreements
The Company has entered into a three-year employment agreement with its President and Chief Executive Officer expiring in 2013. This agreement generally provides for a base salary and the continuation of certain benefits currently received. Annually the Company may extend the agreement for an additional year. Under certain specified circumstances, the employment agreement requires certain payments to be made for certain reasons other than cause, including a “change in control” as defined in the agreement. However, such employment may be terminated for cause, as defined, without incurring any continuing obligations.
The Company also entered into three-year change in control agreements with certain executive officers, none of whom are covered by an employment agreement. The change in control
F-51
Table of Contents
UNITED FINANCIAL BANCORP, INC. AND SUBSIDIARY
Notes to Consolidated Financial Statements
December 31, 2010, 2009 and 2008
(Dollars in thousands, except per share amounts)
NOTE N – COMMITMENTS AND CONTINGENCIES – Concluded
agreements are renewable on an annual basis and generally provide a severance payment and the continuation of certain benefits currently received following a “change in control” as defined in the agreements.
Litigation
United Bank, as successor in interest to Commonwealth National Bank, is involved in litigation relating to its foreclosure on a certain loan property. The litigants are claiming that Commonwealth National Bank acted in bad faith and in violation of applicable law and that their actions resulted in a sale of the underlying property for less than it should have thereby causing damage to the parties. United Bank believes these claims are without merit and is vigorously defending the litigation. The parties are scheduled to go to trial in the third quarter of 2011. No estimate of any reasonably possible loss or range of loss to United Bank can be made at this time.
In addition, the Company is subject to various legal actions arising in the normal course of business. In the opinion of management, after consultation with legal counsel, the ultimate disposition of these matters is not expected to have a material adverse effect on the Company’s financial condition, results of operations or cash flows.
NOTE O – FAIR VALUES OF FINANCIAL INSTRUMENTS
The Company groups its financial assets and financial liabilities measured at fair value in three levels, based on the markets in which the assets and liabilities are traded and the reliability of the assumptions used to determine fair value.
Level 1 – Valuations for assets and liabilities traded in active exchange markets, such as the New York Stock Exchange. Level 1 also includes U.S. Treasury and other U.S. government and government-sponsored enterprises that are traded by dealers or brokers in active markets. Valuations are obtained from readily available pricing sources for market transactions involving identical assets or liabilities.
Level 2 – Valuations for assets and liabilities traded in less active dealer or broker markets. Level 2 includes U.S. government and mortgage-backed securities issued by government-sponsored enterprises. Valuations are obtained from third party pricing services for identical or comparable assets or liabilities.
Level 3 – Valuations for assets and liabilities that are derived from other valuation methodologies, including option pricing models, discounted cash flow models and similar
F-52
Table of Contents
UNITED FINANCIAL BANCORP, INC. AND SUBSIDIARY
Notes to Consolidated Financial Statements
December 31, 2010, 2009 and 2008
(Dollars in thousands, except per share amounts)
NOTE O – FAIR VALUES OF FINANCIAL INSTRUMENTS – Continued
techniques, and not based on market exchange, dealer, or broker-traded transactions. Level 3 valuations incorporate certain assumptions and projections in determining the fair value assigned to such assets and liabilities.
Assets measured at fair value on a recurring basis, are summarized below:
| Level 1 | Level 2 | Level 3 | Total Fair Value |
|||||||||||||
| At December 31, 2010 |
||||||||||||||||
| Securities available for sale: |
||||||||||||||||
| Government-sponsored enterprises |
$ | - | $ | 12,502 | $ | - | $ | 12,502 | ||||||||
| Government-sponsored and government- guaranteed mortgage-backed securities |
- | 180,766 | - | 180,766 | ||||||||||||
| Private label mortgage-backed securities |
- | 3,170 | - | 3,170 | ||||||||||||
| Municipal bonds |
- | 7,795 | - | 7,795 | ||||||||||||
| Corporate bonds |
- | - | 1,619 | 1,619 | ||||||||||||
| Total |
$ | - | $ | 204,233 | $ | 1,619 | $ | 205,852 | ||||||||
| Level 1 | Level 2 | Level 3 | Total Fair Value |
|||||||||||||
| At December 31, 2009 |
||||||||||||||||
| Securities available for sale: |
||||||||||||||||
| Government-sponsored enterprises |
$ | - | $ | 353 | $ | - | $ | 353 | ||||||||
| Government-sponsored and government- guaranteed mortgage-backed securities |
- | 224,836 | - | 224,836 | ||||||||||||
| Private label mortgage-backed securities |
- | 5,036 | - | 5,036 | ||||||||||||
| Municipal bonds |
- | 10,631 | 302 | 10,933 | ||||||||||||
| Corporate bonds |
- | - | 1,712 | 1,712 | ||||||||||||
| Marketable equity securities |
434 | - | - | 434 | ||||||||||||
| Total |
$ | 434 | $ | 240,856 | $ | 2,014 | $ | 243,304 | ||||||||
The Company has no liabilities measured at fair value on a recurring basis at December 31, 2010 and 2009.
F-53
Table of Contents
UNITED FINANCIAL BANCORP, INC. AND SUBSIDIARY
Notes to Consolidated Financial Statements
December 31, 2010, 2009 and 2008
(Dollars in thousands, except per share amounts)
NOTE O – FAIR VALUES OF FINANCIAL INSTRUMENTS – Continued
The table below presents the changes in Level 3 assets measured at fair value on a recurring basis for the year ended December 31, 2010 and 2009.
| 2010 | 2009 | |||||||
| Balance at beginning of year |
$ | 2,014 | $ | 1,832 | ||||
| Total realized/unrealized losses included in net income |
(35) | (82) | ||||||
| Change in unrealized (loss)/gain |
(93) | 264 | ||||||
| Purchases |
- | - | ||||||
| Sales |
(267) | - | ||||||
| Issuances |
- | - | ||||||
| Settlements |
- | - | ||||||
| Transfers |
- | - | ||||||
| Balance at end of year |
$ | 1,619 | $ | 2,014 | ||||
The Company may be required, from time to time, to measure certain other financial assets on a nonrecurring basis in accordance with generally accepted accounting principles. These adjustments to fair value usually result from application of lower-of-cost-or-fair value accounting or write-downs of individual assets. The following table summarizes the fair value hierarchy used to determine the adjustment and the carrying value of the related assets as of and for the years ended December 31, 2010 and 2009.
| December 31, 2010 |
Level 1 | Level 2 | Level 3 | Total Gains/(Losses) |
||||||||||||
| Assets: |
||||||||||||||||
| Loans |
$ | - | $ | 3,489 | $ | - | $ | (156) | ||||||||
| Other assets |
- | - | 545 | (145) | ||||||||||||
| Total assets |
$ | - | $ | 3,489 | $ | 545 | $ | (301) | ||||||||
| December 31, 2009 |
||||||||||||||||
| Assets: |
||||||||||||||||
| Loans |
$ | - | $ | 16,287 | $ | - | $ | (2,335) | ||||||||
| Other real estate owned |
- | 1,545 | - | (85) | ||||||||||||
| Total assets |
$ | - | $ | 17,832 | $ | - | $ | (2,420) | ||||||||
The amount of loans represents the carrying value and related write-down and valuation allowance of impaired loans for which adjustments are based on the estimated fair value of the underlying collateral. The other real estate owned amount represents the carrying value for which adjustments are also based on the estimated fair value of the property. Included in other
F-54
Table of Contents
UNITED FINANCIAL BANCORP, INC. AND SUBSIDIARY
Notes to Consolidated Financial Statements
December 31, 2010, 2009 and 2008
(Dollars in thousands, except per share amounts)
NOTE O – FAIR VALUES OF FINANCIAL INSTRUMENTS – Continued
assets is private company stock which is carried at cost. In 2010 management determined that several impairment indicators exist and that the investment is impaired. In its evaluation, management considered the investee’s earnings performance, credit rating, asset quality, regulatory, economic, or technological environment operating environment, and the investee’s ability to continue as a going concern. The cost basis of the individual security was written down by $145 to fair value as a new cost basis and the amount of the write-down is accounted for as a realized loss and is included in earnings.
Fair value estimates are made at a specific point in time, based on relevant market information and information about the financial instrument. These estimates do not reflect any premium or discount that could result from offering for sale at one time the Bank’s entire holdings of a particular financial instrument. Because a market may not readily exist for a significant portion of the Bank’s financial instruments, fair value estimates are based on judgments regarding future expected loss experience, current economic conditions, risk characteristics of various financial instruments, and other factors. These estimates are subjective in nature and involve uncertainties and matters of significant judgment and therefore cannot be determined with precision. Changes in assumptions could significantly affect the estimates.
The following methods and assumptions were used by the Company in estimating fair values of its financial instruments:
Cash and Cash Equivalents and Short-term Investments
The carrying amounts of cash and short-term instruments approximate fair values based on the short-term nature of the assets.
Investment Securities and FHLBB Stock
The fair value of securities to be held to maturity and securities available for sale is estimated based on quoted market prices, where available. If quoted market prices are not available, fair values are based on quoted market prices of comparable instruments. Ownership of FHLBB stock is restricted to member banks; therefore, the stock is not traded. The estimated fair value of FHLBB stock is equal to its carrying value, which represents the price at which the FHLBB is obligated to redeem its stock.
Loans
For valuation purposes, the loan portfolio was segregated into its significant categories, which are residential mortgage, commercial real estate, commercial and consumer. These categories
F-55
Table of Contents
UNITED FINANCIAL BANCORP, INC. AND SUBSIDIARY
Notes to Consolidated Financial Statements
December 31, 2010, 2009 and 2008
(Dollars in thousands, except per share amounts)
NOTE O – FAIR VALUES OF FINANCIAL INSTRUMENTS – Continued
were further segregated, where appropriate, into components based on significant financial characteristics such as type of interest rate (fixed or adjustable). Fair values were estimated for each component using assumptions developed by management and a valuation model provided by a third party specialist.
The fair values of residential mortgage, commercial real estate, commercial and consumer loans were estimated by discounting the anticipated cash flows from the respective portfolios. Estimates of the timing and amount of these cash flows considered factors such as future loan prepayments. The discount rates reflected current market rates for loans with similar terms to borrowers of similar credit quality. The fair value of home equity lines of credit was based on the outstanding loan balances. Fair values for non-performing loans are estimated using discounted cash flow analyses or underlying collateral values, where applicable.
Deposits
The fair value of deposits with no stated maturity, such as demand deposits, NOW, regular savings, and money market deposit accounts, is equal to the amount payable on demand. The fair value estimates do not include the benefit that results from the generally lower cost of funding provided by the deposit liabilities compared to the cost of borrowing funds in the market. The fair value estimate of time deposits is based on the discounted value of contractual cash flows. The discount rate is estimated using the rates currently offered for deposits having similar remaining maturities.
Short- term- borrowings
For short-term borrowings maturing within ninety days, carrying values approximate fair values. Fair values of other short-term borrowings are estimated using discounted cash flow analyses based on the current incremental borrowing rates in the market for similar types of borrowing arrangements.
Long- term- debt
The fair values of the Company’s long-term debt are estimated using discounted cash flow analyses based on the current incremental borrowing rates in the market for similar types of borrowing arrangements.
Repurchase Agreements
The Company enters into overnight repurchase agreements with its customers. Since these agreements are short-term instruments, the fair value of these agreements approximates their recorded balance. The Company also secures term repurchase agreements through other
F-56
Table of Contents
UNITED FINANCIAL BANCORP, INC. AND SUBSIDIARY
Notes to Consolidated Financial Statements
December 31, 2010, 2009 and 2008
(Dollars in thousands, except per share amounts)
NOTE O – FAIR VALUES OF FINANCIAL INSTRUMENTS – Concluded
financial institutions. The fair value of these agreements are determined by discounting the anticipated future cash payments using rates currently available to the Bank for debt with similar terms and remaining maturities.
Subordinated Debentures
The Company has outstanding subordinated debt in the form of trust preferred securities issued through a private placement offering. The fair value estimate is determined by discounting the anticipated future cash payments by using the rates currently available to the Company for debt with similar terms and remaining maturities.
Off-Balance Sheet Instruments
Fair value of off-balance-sheet mortgage lending commitments are based on fees currently charged to enter into similar agreements, taking into account the remaining terms of the agreements and the counterparties’ credit standing. In the case of the commitments discussed in Note N, the fair value equals the carrying amounts which are not significant.
Summary of Fair Values of Financial Instruments
The estimated fair values, and related carrying or notional amounts, of the Company’s financial instruments are as follows. Certain financial instruments and all nonfinancial instruments are exempt from disclosure requirements. Accordingly, the aggregate fair value amounts presented herein do not represent the underlying fair value of the Company.
| 2010 | 2009 | |||||||||||||||
| Carrying Value |
Estimated Fair Value |
Carrying Value |
Estimated Fair Value |
|||||||||||||
| Financial Assets: |
||||||||||||||||
| Cash and cash equivalents |
$ | 83,069 | $ | 83,069 | $ | 21,877 | $ | 21,877 | ||||||||
| Short-term investments |
- | - | 1,096 | 1,096 | ||||||||||||
| Securities available for sale |
205,852 | 205,852 | 243,304 | 243,304 | ||||||||||||
| Securities held to maturity |
132,475 | 132,026 | 63,174 | 63,063 | ||||||||||||
| Stock in Federal Home Loan Bank of Boston |
15,365 | 15,365 | 15,365 | 15,365 | ||||||||||||
| Net loans |
1,066,197 | 1,091,165 | 1,115,416 | 1,114,441 | ||||||||||||
| Financial Liabilities: |
||||||||||||||||
| Deposits (with no stated maturity) |
680,656 | 680,656 | 560,669 | 560,669 | ||||||||||||
| Time deposits |
462,645 | 469,717 | 478,258 | 483,843 | ||||||||||||
| Federal Home Loan Bank of Boston advances |
153,307 | 155,945 | 208,173 | 211,954 | ||||||||||||
| Repurchase agreements |
41,029 | 40,403 | 47,303 | 46,068 | ||||||||||||
| Subordinated debentures |
5,448 | 5,448 | 5,357 | 5,357 | ||||||||||||
F-57
Table of Contents
UNITED FINANCIAL BANCORP, INC. AND SUBSIDIARY
Notes to Consolidated Financial Statements
December 31, 2010, 2009 and 2008
(Dollars in thousands, except per share amounts)
NOTE P – STOCKHOLDERS’ EQUITY
Regulatory Capital
The Bank is subject to various minimum regulatory capital standards promulgated by the Office of Thrift Supervision (the “OTS”). Failure to meet minimum capital requirements can initiate certain mandatory and possibly additional discretionary actions by regulators that, if undertaken, could have a direct material effect on the Bank’s financial statements. Under capital adequacy guidelines and the regulatory framework for prompt corrective action, the Bank must meet specific capital guidelines that involve quantitative measures of the Bank’s assets, liabilities, and certain off-balance-sheet items as calculated under regulatory accounting practices. The Bank’s capital amounts and classification are also subject to qualitative judgments by the regulators about components, risk weightings, and other factors. The Company is not separately subject to capital guidelines.
The minimum capital standards of the OTS generally require the maintenance of regulatory capital sufficient to meet each of three tests, hereinafter described as the total risk-based capital requirement, the Tier I risk-based capital requirement and the Tier I or leverage capital requirement. The Tier I risk-based and Tier I leverage capital requirements provide for minimum core capital (tangible capital plus certain forms of supervisory goodwill and other qualifying intangible assets) generally equal to 4.0% of risk-weighted assets and to 4.0% of adjusted total assets, respectively, except for those banks with the highest examination rating and acceptable levels of risk. The risk- based capital requirement provides for the maintenance of core capital plus general loss allowances equal to 8.0% of risk-weighted assets. In computing risk-weighted assets, the Bank multiplies the value of each asset on its balance sheet by a defined risk-weighting factor, e.g., one- to four-family residential loans carry a risk-weighted factor of 50%.
The OTS capital rules also require savings associations to hold a ratio of 1.5% tangible capital to tangible assets. Tangible equity is defined as core capital less tangible assets. Tangible assets are defined as adjusted total assets less intangible assets.
As of December 31, 2010, the most recent notification from the OTS categorized the Bank as well capitalized under the regulatory framework for prompt corrective action. To be categorized as adequately capitalized the Bank must maintain minimum ratios as set forth in the accompanying table. There are no conditions or events since that notification that management believes have changed the Bank’s category.
F-58
Table of Contents
UNITED FINANCIAL BANCORP, INC. AND SUBSIDIARY
Notes to Consolidated Financial Statements
December 31, 2010, 2009 and 2008
(Dollars in thousands, except per share amounts)
NOTE P – STOCKHOLDERS’ EQUITY – Continued
The Bank’s actual capital amounts and ratios, as well as minimum amounts and ratios required for capital adequacy are presented below:
| Actual | For Capital Adequacy Purposes |
To Be Well Capitalized Under Regulatory Framewok |
||||||||||||||||||||||||||||||||||||||
| Amount | Ratio | Amount | Ratio | Amount | Ratio | |||||||||||||||||||||||||||||||||||
| As of December 31, 2010: |
||||||||||||||||||||||||||||||||||||||||
| Total Risk-based Capital |
||||||||||||||||||||||||||||||||||||||||
| (to Risk Weighted Assets) |
$ | 190,533 | 16.3% | > | $ | 93,265 | > | 8.0% | > | $ | 116,581 | > | 10.0% | |||||||||||||||||||||||||||
| Tier I Risk-based Capital |
||||||||||||||||||||||||||||||||||||||||
| (to Risk Weighted Assets) |
180,546 | 15.5% | > | 46,632 | > | 4.0% | > | 69,948 | > | 6.0% | ||||||||||||||||||||||||||||||
| Tier I (Core) Capital |
||||||||||||||||||||||||||||||||||||||||
| (to Adjusted Total Assets) |
180,546 | 11.5% | > | 62,629 | > | 4.0% | > | 78,286 | > | 5.0% | ||||||||||||||||||||||||||||||
| Tangible Equity |
||||||||||||||||||||||||||||||||||||||||
| (to Tangible Assets) |
180,546 | 11.5% | > | 23,486 | > | 1.5% | > | N/A | ||||||||||||||||||||||||||||||||
| As of December 31, 2009: |
||||||||||||||||||||||||||||||||||||||||
| Total Risk-based Capital |
||||||||||||||||||||||||||||||||||||||||
| (to Risk Weighted Assets) |
$ | 193,863 | 16.5% | > | $ | 93,846 | > | 8.0% | > | $ | 117,308 | > | 10.0% | |||||||||||||||||||||||||||
| Tier I Risk-based Capital |
||||||||||||||||||||||||||||||||||||||||
| (to Risk Weighted Assets) |
184,531 | 15.7% | > | 46,923 | > | 4.0% | > | 70,385 | > | 6.0% | ||||||||||||||||||||||||||||||
| Tier I (Core) Capital |
||||||||||||||||||||||||||||||||||||||||
| (to Adjusted Total Assets) |
184,531 | 12.1% | > | 60,785 | > | 4.0% | > | 75,981 | > | 5.0% | ||||||||||||||||||||||||||||||
| Tangible Equity |
||||||||||||||||||||||||||||||||||||||||
| (to Tangible Assets) |
184,531 | 12.1% | > | 22,794 | > | 1.5% | > | N/A | ||||||||||||||||||||||||||||||||
The following table provides a reconciliation of the Company’s total consolidated equity to the capital amounts for the Bank reflected in the preceding table:
| December 31 | ||||||||
| 2010 | 2009 | |||||||
| Total consolidated equity |
$ | 222,576 | $ | 222,035 | ||||
| Adjustments: |
||||||||
| Additional equity capital of United Financial Bancorp, Inc. |
(28,639) | (23,656) | ||||||
| Accumulated other comprehensive income |
(4,858) | (5,358) | ||||||
| Disallowed goodwill and intangible assets |
(8,533) | (8,490) | ||||||
| Tangible, Tier I and Core Capital |
180,546 | 184,531 | ||||||
| Allowance for loan losses |
9,987 | 10,110 | ||||||
| Other |
- | 152 | ||||||
| Total risk-based capital |
$ | 190,533 | $ | 194,793 | ||||
F-59
Table of Contents
UNITED FINANCIAL BANCORP, INC. AND SUBSIDIARY
Notes to Consolidated Financial Statements
December 31, 2010, 2009 and 2008
(Dollars in thousands, except per share amounts)
NOTE P – STOCKHOLDERS’ EQUITY – Concluded
Common Stock Repurchase Plans
On October 26, 2010, the Board of Directors approved a plan to repurchase up to 5%, or approximately 807,803 shares, of the Company’s common stock through open market purchases. Stock repurchases are accounted for as treasury stock, carried at cost, and reflected as a reduction in stockholders’ equity. As of December 31, 2010, the Company repurchased 51,401 shares at a cost of approximately $709 and an average price of $13.80, under this plan.
On October 16, 2009, the Board of Directors approved a plan to repurchase up to 5%, or approximately 798,055 shares, of the Company’s common stock through open market purchases or privately negotiated transactions. The Company completed its repurchase of 798,055 shares of its outstanding common stock, at a cost of approximately $10,779 and at an average price of $13.51, on October 26, 2010.
On February 19, 2009, the Board of Directors approved a plan to repurchase up to 5%, or approximately 841,138 shares, of the Company’s common stock through open market purchases or privately negotiated transactions. The Company completed its repurchase of 841,138 shares of its outstanding common stock, at a cost of approximately $10,832 and at an average price of $12.88, on November 30, 2009.
On November 20, 2008, the Board of Directors approved a plan to repurchase up to 5%, or approximately 885,379 shares, of the Company’s common stock through open market purchases or privately negotiated transactions. The Company completed its repurchase of 885,379 shares of its outstanding common stock, at a cost of approximately $12,376 and at an average price of $13.98, on February 3, 2009.
F-60
Table of Contents
UNITED FINANCIAL BANCORP, INC. AND SUBSIDIARY
Notes to Consolidated Financial Statements
December 31, 2010, 2009 and 2008
(Dollars in thousands, except per share amounts)
NOTE Q – CONDENSED FINANCIAL STATEMENTS OF
UNITED FINANCIAL BANCORP, INC.
The following are the condensed financial statements for United Financial Bancorp, Inc. (parent company only).
| BALANCE SHEETS | ||||||||
| December 31, 2010 |
December 31, 2009 |
|||||||
| ASSETS |
||||||||
| Cash and cash equivalents |
$ | 18,421 | $ | 15,632 | ||||
| Short-term investments |
- | 1,096 | ||||||
| Investment in Bank |
193,937 | 198,379 | ||||||
| ESOP loans receivable |
11,676 | 12,262 | ||||||
| Other assets |
4,007 | 3,518 | ||||||
| TOTAL ASSETS |
$ | 228,291 | $ | 230,887 | ||||
| LIABILITIES AND STOCKHOLDERS’ EQUITY |
||||||||
| Subordinated debentures |
$ | 5,448 | $ | 5,357 | ||||
| Other liabilities |
267 | 284 | ||||||
| Stockholders’ equity |
222,576 | 225,246 | ||||||
| TOTAL LIABILITIES AND STOCKHOLDERS’ EQUITY |
$ | 228,291 | $ | 230,887 | ||||
| STATEMENTS OF INCOME | ||||||||||||
| Years Ended December 31, | ||||||||||||
| 2010 | 2009 | 2008 | ||||||||||
| Income: |
||||||||||||
| Investment interest |
$ | 168 | $ | 399 | $ | 1,235 | ||||||
| ESOP loan interest |
398 | 418 | 955 | |||||||||
| Gain on sale of securities |
- | - | 15 | |||||||||
| Impairment charges on securities |
(145) | - | - | |||||||||
| Other income |
- | - | 3 | |||||||||
| Total income |
421 | 817 | 2,208 | |||||||||
| Expense: |
||||||||||||
| Subordinated debentures interest |
250 | 15 | - | |||||||||
| Professional services |
1,248 | 1,089 | 1,311 | |||||||||
| Acquisition related expenses |
126 | 1,841 | - | |||||||||
| Other expenses |
67 | 52 | 47 | |||||||||
| Total expense |
1,691 | 2,997 | 1,358 | |||||||||
| (Loss) income before income tax (benefit) expense |
(1,270) | (2,180) | 850 | |||||||||
| Income tax (benefit) expense |
(145) | (421) | 348 | |||||||||
| (Loss) income before equity in undistributed earnings of the Bank |
(1,125) | (1,759) | 502 | |||||||||
| Equity in undistributed earnings of the Bank |
11,157 | 7,565 | 6,796 | |||||||||
| NET INCOME |
$ | 10,032 | $ | 5,806 | $ | 7,298 | ||||||
F-61
Table of Contents
UNITED FINANCIAL BANCORP, INC. AND SUBSIDIARY
Notes to Consolidated Financial Statements
December 31, 2010, 2009 and 2008
(Dollars in thousands, except per share amounts)
NOTE Q – CONDENSED FINANCIAL STATEMENTS OF
UNITED FINANCIAL BANCORP, INC. – Concluded
| STATEMENTS OF CASH FLOWS | ||||||||||||
| Years Ended December 31, | ||||||||||||
| 2010 | 2009 | 2008 | ||||||||||
| Cash flows from operating activities: |
||||||||||||
| Net income |
$ | 10,032 | $ | 5,806 | $ | 7,298 | ||||||
| Adjustments to reconcile net income to net cash provided |
||||||||||||
| Equity in undistributed earnings of the bank |
(11,157) | (7,565) | (6,796) | |||||||||
| Net amortization of discounts and premiums |
- | - | 2 | |||||||||
| Net gain on sale of available for sale securities |
- | - | (15) | |||||||||
| Impairment charges on securities |
145 | - | - | |||||||||
| Decrease in deferred income taxes |
- | (51) | (3) | |||||||||
| Decrease in accrued interest receivable |
(2) | - | 247 | |||||||||
| Decrease (increase) in other assets |
(681) | (94) | 718 | |||||||||
| (Decrease) increase in intercompany payables and other liabilities |
(37) | 121 | (359) | |||||||||
| Net cash (used in) provided by operating activities |
(1,700) | (1,783) | 1,092 | |||||||||
| Cash flows from investing activities: |
||||||||||||
| Proceeds from sales of securities available for sale |
- | - | 9,352 | |||||||||
| Proceeds from maturities and principal repayments |
- | - | 9,218 | |||||||||
| Cash used for acquisition of CNB Financial, net of cash acquired |
- | (10,587) | - | |||||||||
| Capital contributions to venture capital fund |
(200) | (200) | (100) | |||||||||
| Maturity of (investment in) short term time deposits |
1,096 | (25) | (41) | |||||||||
| Principal payments on ESOP loans |
586 | 567 | 331 | |||||||||
| Net cash provided by (used in) investing activities |
1,482 | (10,245) | 18,760 | |||||||||
| Cash flows from financing activities: |
||||||||||||
| Return of capital from United Bank |
18,557 | 168 | 837 | |||||||||
| Repurchase of stock to fund the 2008 Incentive Plan |
- | - | (4,240) | |||||||||
| Tax benefit from MRP vesting |
115 | 34 | - | |||||||||
| Tax withheld on options exercised |
(29) | - | - | |||||||||
| Treasury stock purchases |
(11,047) | (21,488) | (2,960) | |||||||||
| Cash dividends paid |
(4,589) | (4,238) | (4,436) | |||||||||
| Net costs from stock issuance |
- | - | (26) | |||||||||
| Net cash provided by (used in) financing activities |
3,007 | (25,524) | (10,825) | |||||||||
| Increase (decrease) in cash and cash equivalents |
2,789 | (37,552) | 9,027 | |||||||||
| Cash and cash equivalents at beginning of period |
15,632 | 53,184 | 44,157 | |||||||||
| Cash and cash equivalents at end of period |
$ | 18,421 | $ | 15,632 | $ | 53,184 | ||||||
| Supplemental Disclosure of Cash Flow Information: |
||||||||||||
| Cash paid during the period: |
||||||||||||
| Income taxes – net |
4,750 | 6,521 | 1,097 | |||||||||
F-62
Table of Contents
UNITED FINANCIAL BANCORP, INC. AND SUBSIDIARY
Notes to Consolidated Financial Statements
December 31, 2010, 2009 and 2008
(Dollars in thousands, except per share amounts)
NOTE R – QUARTERLY RESULTS OF OPERATIONS (UNAUDITED)
The following table summarizes the operating results on a quarterly basis for the years ended December 31, 2010 and 2009.
| Three Months Ended | ||||||||||||||||
| March 31 | June 30 | September 30 | December 31 | |||||||||||||
| 2010: |
||||||||||||||||
| Interest income |
$ | 18,757 | $ | 18,536 | $ | 18,395 | $ | 18,170 | ||||||||
| Interest expense |
5,261 | 5,249 | 5,228 | 5,209 | ||||||||||||
| Net interest income |
13,496 | 13,287 | 13,167 | 12,961 | ||||||||||||
| Provision for loan losses |
733 | 450 | 750 | 352 | ||||||||||||
| Non-interest income |
2,037 | 2,219 | 2,103 | 2,357 | ||||||||||||
| Non-interest expense |
12,018 | 10,631 | 10,456 | 10,736 | ||||||||||||
| Income before income taxes |
2,782 | 4,425 | 4,064 | 4,230 | ||||||||||||
| Income tax expense |
1,031 | 1,492 | 1,387 | 1,559 | ||||||||||||
| Net income |
$ | 1,751 | $ | 2,933 | $ | 2,677 | $ | 2,671 | ||||||||
| Basic earnings per share |
$ | 0.11 | $ | 0.19 | $ | 0.18 | $ | 0.18 | ||||||||
| Diluted earnings per share |
$ | 0.11 | $ | 0.19 | $ | 0.18 | $ | 0.18 | ||||||||
| Dividends paid per share |
$ | 0.07 | $ | 0.07 | $ | 0.08 | $ | 0.08 | ||||||||
| 2009: |
||||||||||||||||
| Interest income |
$ | 15,930 | $ | 15,120 | $ | 15,325 | $ | 16,611 | ||||||||
| Interest expense |
5,775 | 5,577 | 5,351 | 5,283 | ||||||||||||
| Net interest income |
10,155 | 9,543 | 9,974 | 11,328 | ||||||||||||
| Provision for loan losses |
540 | 675 | 800 | 983 | ||||||||||||
| Non-interest income |
1,851 | 2,595 | 1,985 | 2,245 | ||||||||||||
| Non-interest expense |
8,155 | 10,030 | 8,093 | 10,580 | ||||||||||||
| Income before income taxes |
3,311 | 1,433 | 3,066 | 2,010 | ||||||||||||
| Income tax expense |
1,188 | 873 | 1,165 | 788 | ||||||||||||
| Net income |
$ | 2,123 | $ | 560 | $ | 1,901 | $ | 1,222 | ||||||||
| Basic earnings per share |
$ | 0.14 | $ | 0.04 | $ | 0.13 | $ | 0.08 | ||||||||
| Diluted earnings per share |
$ | 0.14 | $ | 0.04 | $ | 0.13 | $ | 0.08 | ||||||||
| Dividends paid per share |
$ | 0.07 | $ | 0.07 | $ | 0.07 | $ | 0.07 | ||||||||
F-63
Table of Contents
| ITEM 9. | CHANGES IN AND DISAGREEMENTS WITH ACCOUNTANTS ON ACCOUNTING AND FINANCIAL DISCLOSURE |
None.
| ITEM 9A. | CONTROLS AND PROCEDURES |
| (a) | Evaluation of disclosure controls and procedures. |
Under the supervision and with the participation of our management, including our Chief Executive Officer and Chief Financial Officer, we evaluated the effectiveness of the design and operation of our disclosure controls and procedures (as defined in Rule 13a-15(e) and 15d-15(e) under the Exchange Act) as of the end of the fiscal year (the “Evaluation Date”). Based upon that evaluation, the Chief Executive Officer and Chief Financial Officer concluded that, as of the Evaluation Date, our disclosure controls and procedures were effective.
| (b) | Management’s report on internal control over financial reporting. |
Management of the Company is responsible for establishing and maintaining adequate internal control over financial reporting.
The Company’s internal control over financial reporting is a process designed to provide reasonable assurance regarding the reliability of financial reporting and the preparation of financial statements for external purposes in accordance with accounting principles generally accepted in the United States of America. The Company’s internal control over financial reporting includes those policies and procedures that (i) pertain to the maintenance of records that, in reasonable detail, accurately and fairly reflect the transactions and dispositions of the assets of the Company; (ii) provide reasonable assurance that transactions are recorded as necessary to permit preparation of financial statements in accordance with accounting principles generally accepted in the United States of America, and that receipts and expenditures of the Company are being made only in accordance with authorizations of management and directors of the Company; and (iii) provide reasonable assurance regarding prevention or timely detection of unauthorized acquisition, use, or disposition of the Company’s assets that could have a material effect on the financial statements.
Because of its inherent limitations, internal control over financial reporting may not prevent or detect misstatements. Also, projections of any evaluation of effectiveness to future periods are subject to the risk that controls may become inadequate because of changes in conditions, or that the degree of compliance with the policies or procedures may deteriorate.
Management assessed the effectiveness of the Company’s internal control over financial reporting as of December 31, 2010, based on the framework set forth by the Committee of Sponsoring Organizations of the Treadway Commission in Internal Control—Integrated Framework. Based on that assessment, management concluded that, as of December 31, 2010, the Company’s internal control over financial reporting was effective based on the criteria established in Internal Control—Integrated Framework. Management’s evaluation of internal control over financial reporting as of December 31, 2010
Our internal control over financial reporting as of December 31, 2010 has been audited by Grant Thornton LLP, an independent registered public accounting firm, as stated in their report which is included herein.
| (c) | Attestation report |
72
Table of Contents
Report of Independent Registered Public Accounting Firm on
Internal Control Over Financial Reporting
To the Board of Directors of
United Financial Bancorp, Inc.:
We have audited United Financial Bancorp, Inc. and subsidiary’s internal control over financial reporting as of December 31, 2010, based on criteria established in Internal Control - Integrated Framework issued by the Committee of Sponsoring Organizations of the Treadway Commission (COSO). United Financial Bancorp, Inc. and subsidiary’s management is responsible for maintaining effective internal control over financial reporting and for its assessment of the effectiveness of internal control over financial reporting, included in the accompanying Management’s Report on Internal Control Over Financial Reporting (Management’s Report).
We conducted our audit in accordance with the standards of the Public Company Accounting Oversight Board (United States). Those standards require that we plan and perform the audit to obtain reasonable assurance about whether effective internal control over financial reporting was maintained in all material respects. Our audit included obtaining an understanding of internal control over financial reporting, assessing the risk that a material weakness exists, testing and evaluating the design and operating effectiveness of internal control based on the assessed risk, and performing such other procedures as we considered necessary in the circumstances. We believe that our audit provides a reasonable basis for our opinion.
A company’s internal control over financial reporting is a process designed to provide reasonable assurance regarding the reliability of financial reporting and the preparation of financial statements for external purposes in accordance with generally accepted accounting principles. A company’s internal control over financial reporting includes those policies and procedures that (1) pertain to the maintenance of records that, in reasonable detail, accurately and fairly reflect the transactions and dispositions of the assets of the company; (2) provide reasonable assurance that transactions are recorded as necessary to permit preparation of financial statements in accordance with generally accepted accounting principles, and that receipts and expenditures of the company are being made only in accordance with authorizations of management and directors of the company; and (3) provide reasonable assurance regarding prevention or timely detection of unauthorized acquisition, use, or disposition of the company’s assets that could have a material effect on the financial statements.
Because of its inherent limitations, internal control over financial reporting may not prevent or detect misstatements. Also, projections of any evaluation of effectiveness to future periods are subject to the risk that controls may become inadequate because of changes in conditions, or that the degree of compliance with the policies or procedures may deteriorate.
In our opinion, United Financial Bancorp, Inc. and subsidiary maintained, in all material respects, effective internal control over financial reporting as of December 31, 2010, based on criteria established in Internal Control-Integrated Framework issued by COSO.
We also have audited, in accordance with the standards of the Public Company Accounting Oversight Board (United States), the 2010 consolidated financial statements of United Financial Bancorp, Inc. and subsidiary and our report dated March 14, 2011 expressed an unqualified opinion thereon.
/s/ Grant Thornton LLP
Boston, Massachusetts
March 14, 2011
73
Table of Contents
| (d) | Changes to internal controls |
There were no changes made in our internal controls over financial reporting that occurred during the quarter ended December 31, 2010 that could materially affect, or are reasonably likely to materially affect, our internal control over financial reporting.
| ITEM 9B. | OTHER INFORMATION |
Not Applicable.
PART III
| ITEM 10. | DIRECTORS , EXECUTIVE OFFICERS AND CORPORATE GOVERNANCE |
Directors
For information concerning the Company’s directors, the information contained under the section captioned “Proposal 1—Election of Directors” in the Company’s Proxy Statement for the 2010 Annual Meeting of Stockholders (the “Proxy Statement”) is incorporated herein by reference.
Executive Officers
For information relating to officers of the Company, the section captioned “Proposal 1—Election of Directors” in the Proxy Statement, and Part I, Item 1, “Business—Executive Officers of the Registrant” in this Annual Report on Form 10-K, are incorporated by reference.
Compliance with Section 16(a) of the Exchange Act
For information regarding compliance with Section 16(a) of the Exchange Act, the information contained under the section captioned “Section 16(a) Beneficial Ownership Reporting Compliance” in the Proxy Statement is incorporated herein by reference.
Disclosure of Code of Ethics
The Company has adopted a Code of Ethics for Chief Executive Officer and Senior Financial Officer, a copy of which can be found in the investor relations section of the Company’s website at www.bankatunited.com.
Corporate Governance
For information regarding the audit committee and its composition and the audit committee financial expert, the section captioned “Corporate Governance and Board Matters” in the Proxy Statement is incorporated herein by reference.
| ITEM 11. | EXECUTIVE COMPENSATION |
The information required by this item is incorporated by reference to the “Compensation Discussion and Analysis”, “Executive Compensation”, “Corporate Governance and Board Matters—Directors’ Compensation” and “Compensation Committee Report” sections of the Company’s Proxy Statement for the 2010 Annual Meeting of Stockholders.
74
Table of Contents
| ITEM 12. | SECURITY OWNERSHIP OF CERTAIN BENEFICIAL OWNERS AND MANAGEMENT AND RELATED STOCKHOLDER MATTERS |
| (a) | Security Ownership of Certain Beneficial Owners |
Information required by this item is incorporated herein by reference to the section captioned “Stock Ownership” in the Proxy Statement.
| (b) | Security Ownership of Management |
Information required by this item is incorporated herein by reference to the section captioned “Stock Ownership” in the Proxy Statement.
| (c) | Changes in Control |
| Management | of the Company knows of no arrangements, including any pledge by any person or securities of the Company, the operation of which may at a subsequent date result in a change in control of the registrant. |
| (d) | Equity Compensation Plan Information |
The following table sets forth information as of December 31, 2010 about Company common stock that may be issued under the Company’s equity compensation plans. All plans were approved by the Company’s stockholders.
| Plan Category |
|
(a) Number of securities |
|
|
(b) Weighted-average exercise price of outstanding options, warrants and rights |
|
|
(c) Number of securities |
| |||
| Equity compensation plans approved by security holders |
1,764,630 | $12.42 | 296,122 | |||||||||
| Equity compensation plans not approved by security holders |
- | - | - | |||||||||
| Total |
1,764,630 | $12.42 | 296,122 |
| ITEM 13. | CERTAIN RELATIONSHIPS AND RELATED TRANSACTIONS, DIRECTOR INDEPENDENCE |
The information required by this item is incorporated by reference to the “Transactions with Related Persons” and “Corporate Governance—Director Independence” sections of the Company’s Proxy Statement for the 2010 Annual Meeting of Stockholders.
| ITEM 14. | PRINCIPAL ACCOUNTANT FEES AND SERVICES |
The information required by this item is incorporated by reference to “Proposal 2 – Ratification of Appointment of Independent Registered Public Accounting Firm” of the Company’s Proxy Statement for the 2010 Annual Meeting of Stockholders.
75
Table of Contents
PART IV
| ITEM 15. | EXHIBITS AND FINANCIAL STATEMENT SCHEDULES |
| (a)(1) | Financial Statements |
The following documents are filed as item 8 of this Form 10-K.
Report of Independent Registered Public Accounting Firm on Financial Statements
Consolidated Balance Sheets - at December 31, 2010 and 2009
Consolidated Statements of Earnings - Years Ended December 31, 2010, 2009 and 2008
Consolidated Statements of Stockholders’ Equity and Comprehensive Income - Years Ended
December 31, 2010, 2009 and 2008
Consolidated Statements of Cash Flows - Years ended December 31, 2010, 2009 and 2008
Notes to Consolidated Financial Statements.
| (a)(2) | Financial Statement Schedules |
None.
| (a)(3) | None. |
| (b) | Exhibits – set forth below |
| (c) | Not applicable |
| Exhibits | ||
| 3.1 | Articles of Incorporation of United Financial Bancorp, Inc. (1) | |
| 3.2 | Amended and Restated Bylaws of United Financial Bancorp, Inc. (2) | |
| 4 | Form of Common Stock Certificate of United Financial Bancorp, Inc. (1) | |
| 10.1 | Employment Agreement by and between United Bank and Richard B. Collins (4)* | |
| 10.2 | Change in Control Agreement by and between United Bank and Keith E. Harvey (4)* | |
| 10.3 | Change in Control Agreement by and between United Bank and J. Jeffrey Sullivan (4)* | |
| 10.4 | Change in Control Agreement by and between United Bank and Mark A. Roberts (4)* | |
| 10.5 | Change in Control Agreement by and between United Bank and Charles R. Valade* | |
| 10.5 A | Amendment to the Change in Control Agreement by and between United Bank and Charles R. Valade* | |
| 10.6 | United Bank 2007 Supplemental Retirement Plan for Senior Executives (4)* | |
| 10.7 | Split Dollar Life Insurance Agreement by and between United Bank and Richard B. Collins (5)* | |
| 10.8 | Split Dollar Life Insurance Agreement by and between United Bank and Keith E. Harvey (5)* | |
| 10.9 | Split Dollar Life Insurance Agreement by and between United Bank and John J. Patterson (5)* | |
| 10.10 | United Bank 2006 Stock-Based Incentive Plan (6)* | |
| 10.11 | United Bank 2009 Annual Incentive Plan (2)* | |
| 10.12 | United Bank 2007 Director Retirement Plan (7)* | |
| 10.13 | Directors Fee Continuation Plan (3)* | |
| 10.14 | United Financial Bancorp, Inc. 2008 Equity Incentive Plan (8) | |
76
Table of Contents
| 10.15 | Retention Agreement by and between United Bank and Charles R. Valade* | |
| 10.16 | CNB Financial Corp. 2008 Equity Incentive Plan (9)* | |
| 10.17 | CNB Financial Corp. Amended and Restated Stock Option Plan (10)* | |
| 10.18 | Form of Award Agreement under the CNB Financial Corp. 2008 Equity Incentive Plan (11)* | |
| 10.19 | Form of Award Agreement under the CNB Financial Corp. Amended and Restated Stock Option Plan (10)* | |
| 21 | Subsidiaries of Registrant (1) | |
| 23 | Consent of Independent Registered Public Accounting Firm | |
| 31.1 | Rule 13a-14(a)/15d-14(a) Certification of Chief Executive Officer | |
| 31.2 | Rule 13a-14(a)/15d-14(a) Certification of Chief Financial Officer | |
| 32 | Section 1350 Certification of Chief Executive Officer and Chief Financial Officer |
| * | Management contract or compensatory plan, contract or arrangement |
| (1) | Incorporated by reference to the Registration Statement on Form S-1 of United Financial Bancorp, Inc. (File No. 333-144245), originally filed with the Securities and Exchange Commission on June 29, 2007. |
| (2) | Incorporated by reference to the Form 10-K of United Financial Bancorp, Inc. filed with the Securities and Exchange Commission on March 13, 2009. |
| (3) | Incorporated by reference to the Registration Statement on Form S-1 of United Financial Bancorp, Inc. (File No. 333-123371), originally filed with the Securities and Exchange Commission on March 16, 2005. |
| (4) | Incorporated by reference to the Form 8-K of United Financial Bancorp, Inc. filed with the Securities and Exchange Commission on November 29, 2007. |
| (5) | Incorporated by reference to the Form 8-K of United Financial Bancorp, Inc. filed with the Securities and Exchange Commission on January 2, 2008. |
| (6) | Incorporated by reference to Appendix B to the proxy statement for the 2006 Annual Meeting of Stockholders of United Financial Bancorp, Inc. (File No. 000-51369), filed by United Financial Bancorp, Inc. under the Securities Exchange Act of 1934, on June 12, 2006. |
| (7) | Incorporated by reference to the Form 8-K of United Financial Bancorp, Inc. filed with the Securities and Exchange Commission on November 21, 2007. |
| (8) | Incorporated by reference to Appendix A of the Company’s Definitive Proxy Statement for the 2008 Annual Meeting of Stockholders (File No. 000-52947), as filed with the SEC on April 29, 2008). |
| (9) | Incorporated by reference to Appendix A to the Proxy Statement filed by CNB Financial Corp. with the Commission on April 11, 2008. |
| (10) | Incorporated by reference to the Registration Statement on Form S-8 filed by CNB Financial Corp. with the Commission on March 27, 2007. |
| (11) | Incorporated by reference to the Registration Statement on Form S-8 filed by CNB Financial Corp. with the Commission on August 7, 2008. |
77
Table of Contents
Pursuant to the requirements of Section 13 or 15(d) of the Securities Exchange Act of 1934, the Registrant has duly caused this report to be signed on its behalf by the undersigned, thereunto duly authorized.
UNITED FINANCIAL BANCORP, INC.
| Date: March 14, 2011 |
By: |
/s/ Richard B. Collins | ||
| Richard B. Collins | ||||
| Chairman, President and Chief Executive Officer | ||||
| (Duly Authorized Representative) |
Pursuant to the requirements of the Securities Exchange of 1934, this report has been signed below by the following persons on behalf of the Registrant and in the capacities and on the dates indicated.
| Signatures |
Title |
Date | ||
| /s/ Richard B. Collins Richard B. Collins |
Chief Executive Officer, President and Chairman (Principal Executive Officer) | March 14, 2011 | ||
| /s/ Mark A. Roberts Mark A. Roberts |
Executive Vice President and Chief Financial Officer (Principal Financial and Accounting Officer) | March 14, 2011 | ||
| /s/ Paula A. Aiello Paula A. Aiello |
Director | March 14, 2011 | ||
| /s/ Michael F. Crowley Michael F. Crowley |
Director | March 14, 2011 | ||
| /s/ Carol Moore Cutting Carol Moore Cutting |
Director | March 14, 2011 | ||
| /s/ Carol A. Leary Carol A. Leary |
Director | March 14, 2011 | ||
| /s/ Kevin E. Ross Kevin E. Ross |
Director | March 14, 2011 | ||
| /s/ Robert A. Stewart, Jr. Robert A. Stewart, Jr. |
Director | March 14, 2011 | ||
| /s/ Thomas H. Themistos Thomas H. Themistos |
Director | March 14, 2011 | ||
| /s/ Michael F. Werenski Michael F. Werenski |
Director | March 14, 2011 | ||
78