Attached files
| file | filename |
|---|---|
| EX-31.1 - EXHIBIT 31.1 - Territorial Bancorp Inc. | dex311.htm |
| EX-31.2 - EXHIBIT 31.2 - Territorial Bancorp Inc. | dex312.htm |
| EX-32 - EXHIBIT 32 - Territorial Bancorp Inc. | dex32.htm |
UNITED STATES
SECURITIES AND EXCHANGE COMMISSION
Washington, D.C. 20549
FORM 10-K
| x | ANNUAL REPORT PURSUANT TO SECTION 13 OR 15(d) OF THE SECURITIES EXCHANGE ACT OF 1934 |
For the Fiscal Year Ended December 31, 2010
OR
| ¨ | TRANSITION REPORT PURSUANT TO SECTION 13 OR 15(d) OF THE SECURITIES EXCHANGE ACT OF 1934 |
For the transition period from to
Commission File Number: 001-34403
Territorial Bancorp Inc.
(Name of Registrant as Specified in its Charter)
| Maryland | 26-4674701 | |
| (State or Other Jurisdiction of Incorporation or Organization) |
(I.R.S. Employer Identification Number) | |
| 1132 Bishop Street, Suite 2200, Honolulu, Hawaii |
96813 | |
| (Address of Principal Executive Office) | (Zip Code) | |
(808) 946-1400
(Registrant’s Telephone Number including area code)
Securities Registered pursuant to Section 12(b) of the Act:
Common Stock, par value $0.01 per share
(Title of Class)
The NASDAQ Stock Market LLC
(Name of exchange on which registered)
Securities Registered Under Section 12(g) of the Exchange Act:
None
Indicate by check mark if the registrant is a well-known seasoned issuer, as defined in Rule 405 of the Securities Act. YES ¨ NO x
Indicate by check mark if the registrant is not required to file reports pursuant to Section 13 of 15(d) of the Act. YES ¨ NO x
Indicate by check mark whether the registrant: (1) has filed all reports required to be filed by Section 13 or 15(d) of the Securities Exchange Act of 1934 during the preceding 12 months (or for such shorter period that the Registrant was required to file reports), and (2) has been subject to such requirements for the past 90 days.
(1) YES x NO ¨
(2) YES x NO ¨
Indicate by check mark whether the registrant has submitted electronically and posted on its corporate Web site, if any, every Interactive Data File required to be submitted and posted pursuant to Rule 405 of Regulation S-T during the preceding 12 months (or for such shorter period that the registrant was required to submit and post such files). Yes ¨ No ¨
Indicate by a check mark if disclosure of delinquent filers pursuant to Item 405 of Regulation S-K is not contained herein, and will not be contained, to the best of Registrant’s knowledge, in definitive proxy or information statements incorporated by reference in Part III of this Form 10-K or any amendments to this Form 10-K. x
Indicate by check mark whether the registrant is a large accelerated filer, an accelerated filer, or a non-accelerated filer, or a smaller reporting company. See definitions of “large accelerated filer,” “accelerated filer” and “smaller reporting company” in Rule 12b-2 of the Exchange Act. (Check one):
| Large accelerated filer | ¨ | Accelerated filer | x | |||
| Non-accelerated filer | ¨ | Smaller reporting company | ¨ | |||
Indicate by check mark whether the Registrant is a shell company (as defined in Rule 12b-2 of the Exchange Act) ¨ YES x NO
The aggregate value of the voting common equity held by non-affiliates of the Registrant, computed by reference to the closing price of the Registrant’s shares of common stock as of June 30, 2010 ($18.95) was $226.1 million.
As of February 28, 2011, there were 12,127,068 shares outstanding of the Registrant’s common stock.
DOCUMENTS INCORPORATED BY REFERENCE
None.
TERRITORIAL BANCORP, INC.
FORM 10-K
FORWARD LOOKING STATEMENTS
This Annual Report contains forward-looking statements, which can be identified by the use of words such as “estimate,” “project,” “believe,” “intend,” “anticipate,” “plan,” “seek,” “expect,” “will,” “may” and words of similar meaning. These forward-looking statements include, but are not limited to:
| • | statements of our goals, intentions and expectations; |
| • | statements regarding our business plans, prospects, growth and operating strategies; |
| • | statements regarding the asset quality of our loan and investment portfolios; and |
| • | estimates of our risks and future costs and benefits. |
These forward-looking statements are based on our current beliefs and expectations and are inherently subject to significant business, economic and competitive uncertainties and contingencies, many of which are beyond our control. In addition, these forward-looking statements are subject to assumptions with respect to future business strategies and decisions that are subject to change. We are under no duty to and do not take any obligation to update any forward-looking statements after the date of this Annual Report.
The following factors, among others, could cause actual results to differ materially from the anticipated results or other expectations expressed in the forward-looking statements:
| • | general economic conditions, either nationally or in our market areas, that are worse than expected; |
| • | competition among depository and other financial institutions; |
| • | inflation and changes in the interest rate environment that reduce our margins or reduce the fair value of financial instruments; |
| • | adverse changes in the securities markets; |
| • | changes in laws or government regulations or policies affecting financial institutions, including changes in regulatory fees and capital requirements; |
| • | our ability to enter new markets successfully and capitalize on growth opportunities; |
| • | our ability to successfully integrate acquired entities, if any; |
| • | changes in consumer spending, borrowing and savings habits; |
| • | changes in accounting policies and practices, as may be adopted by the bank regulatory agencies, the Financial Accounting Standards Board, the Securities and Exchange Commission and the Public Company Accounting Oversight Board; |
| • | changes in our organization, compensation and benefit plans; |
| • | the timing and amount of revenues that we may recognize; |
| • | the value and marketability of collateral underlying our loan portfolios; |
| • | the impact of recent legislation to restructure the U.S. financial and regulatory system; |
| • | the quality and composition of our investment portfolio; |
| • | changes in our financial condition or results of operations that reduce capital available to pay dividends; and |
| • | changes in the financial condition or future prospects of issuers of securities that we own. |
Because of these and a wide variety of other uncertainties, our actual future results may be materially different from the results indicated by these forward-looking statements. Please also see “Item 1A. Risk Factors.”
| ITEM 1. | Business |
Territorial Bancorp Inc.
Territorial Bancorp Inc. is a Maryland corporation and owns 100% of the common stock of Territorial Savings Bank. On July 10, 2009, we completed our initial public offering of common stock in connection with the mutual-to-stock conversion of Territorial Mutual Holding Company, selling 12,233,125 shares of common stock at $10.00 per share and raising $122.3 million of gross proceeds. Since the completion of our initial public offering, we have not engaged in any significant business activity other than owning the common stock of and having savings deposits in Territorial Savings Bank. At December 31, 2010, we had consolidated assets of $1.443 billion, consolidated deposits of $1.076 billion and consolidated stockholders’ equity of $227.4 million.
Our executive offices are located at 1132 Bishop Street, Suite 2200, Honolulu, Hawaii 96813. Our telephone number at this address is (808) 946-1400.
Territorial Savings Bank
Territorial Savings Bank is a federally chartered savings bank headquartered in Honolulu, Hawaii. Territorial Savings Bank was organized in 1921, and reorganized into the mutual holding company structure in 2002. Territorial Savings Bank is currently the wholly-owned subsidiary of Territorial Bancorp Inc. We provide financial services to individuals, families and businesses through our 26 banking offices located throughout the State of Hawaii.
Territorial Savings Bank’s executive offices are located at 1132 Bishop Street, Suite 2200, Honolulu, Hawaii 96813. Our telephone number at this address is (808) 946-1400.
Available Information
Territorial Bancorp Inc. is a public company, and files interim, quarterly and annual reports with the Securities and Exchange Commission. These respective reports are on file and a matter of public record with the Securities and Exchange Commission and may be read and copied at the Securities and
2
Exchange Commission’s Public Reference Room at 450 Fifth Street, NW, Washington, DC 20549. The public may obtain information on the operation of the Public Reference Room by calling the Securities and Exchange Commission at 1-800-SEC-0330. The Securities and Exchange Commission maintains an Internet site that contains reports, proxy and information statements, and other information regarding issuers that file electronically with the SEC (http://www.sec.gov).
Our website address is www.territorialsavings.net. Information on our website should not be considered a part of this annual report.
General
Territorial Savings Bank’s business consists primarily of accepting deposits from the general public and investing those deposits, together with funds generated from operations and borrowings, in one- to four-family residential mortgage loans and investment securities. To a much lesser extent, we also originate home equity loans and lines of credit, construction, commercial and other non-residential real estate loans, consumer loans, multi-family mortgage loans and other loans. Territorial Savings Bank offers a variety of deposit accounts, including passbook and statement savings accounts, certificates of deposit, money market accounts, commercial and regular checking accounts and Super NOW accounts. Through our subsidiary, Territorial Financial Services, Inc., we engage in insurance agency activities. We also offer various non-deposit investments to our customers, including annuities and mutual funds, through a third-party broker-dealer.
Market Area
We conduct business from our corporate offices and from our 26 full-service branch offices located throughout the State of Hawaii.
The two largest components of Hawaii’s economy are tourism and the federal government, including the military. The Hawaii Department of Business, Economic Development and Tourism reported a 9.6% increase in tourists for the month of December 2010 compared to the month of December 2009, and an 8.7% increase in 2010 compared to 2009. The increase in visitor arrivals is primarily due to growth in the number of visitors from the United States and Canada. Total visitor expenditures in 2010 were approximately 16.2% higher than in 2009. There were 7.1 million visitors to the state in 2010 and total expenditures amounted to $11.4 billion. Activity in the visitor industry in 2010 was lower than the 2007 peak when visitor arrivals totaled 7.4 million with total spending of $12.2 billion.
The unemployment rate for the State of Hawaii was 6.4% in December 2010, representing a decrease from a rate of 6.8% in December 2009. This rate continued to be lower than the unemployment rate for the United States, which decreased to 9.4% in December 2010 from 9.9% from December 2009. Some of the largest individual private employers in the state include a staffing company, financial services companies, the University of Hawaii System of higher education and research and health services companies. Employment in the construction industry has fallen from 39,700 jobs in late 2007 to below 29,000 jobs in the third quarter of 2010. Currently, the only major construction projects in the state are the military’s $3.0 billion housing expansion project, which is expected to be completed over the next 10 years, and the $800.0 million Disney Hotel and Vacation Club on the west side of Oahu.
The number of existing single-family homes and condominium units sold in 2010 has increased compared to 2009 but real estate prices on some islands have declined. Home prices have not declined as severely as those reported on the mainland.
3
On the island of Oahu, the primary real estate market in Hawaii, sales of existing single-family homes totaled 3,051 units for the year ended December 2010, an increase of 13.4% compared to sales in 2009. The number of condominium sales, a notable portion of the overall housing market, grew by 10.3% in 2010 compared to 2009. The median price paid on Oahu for a single-family home in 2010 was $587,000, an increase of 5.8% compared to the median price in 2009. The median price paid on Oahu for condominiums in 2010 was $303,000, an increase of 0.2% compared to the median price in 2009.
On the island of Maui, the second largest real estate market in Hawaii, sales of existing single-family homes totaled 814 units in 2010, an increase of 17.5% compared to similar sales during 2009. The number of condominium sales increased by 38.9% in 2010 compared to 2009. The median price paid for a single-family home on Maui in 2010 was $460,000, a decrease of 7.7% compared to the median price in 2009. The median price paid on Maui for condominiums in 2010 was $377,500, a 16.1% decrease compared to the median price in 2009.
The slowing Hawaiian economy has caused an increase in foreclosure and bankruptcy filings. There were 12,425 mortgage foreclosure cases in Hawaii in 2010, a 38% increase from 2009. In 2010, Hawaii had the 13th highest number of foreclosure filings per household among the 50 states. In 2010, there were 3,954 bankruptcy filings, an increase of 28% compared to the number of filings in 2009.
Competition
We face intense competition in our market area both in making loans and attracting deposits. We compete with commercial banks, savings institutions, mortgage brokerage firms, credit unions, finance companies, mutual funds, insurance companies and investment banking firms. Some of our competitors have greater name recognition and market presence that benefit them in attracting business, and offer certain services that we do not or cannot provide.
Our deposit sources are primarily concentrated in the communities surrounding our banking offices, located in all four counties in the State of Hawaii. As of June 30, 2010 (the latest date for which information is publicly available), we ranked fifth in deposit market share (out of 12 banks and thrift institutions with offices in Hawaii) in the State of Hawaii, with a 3.96% market share. As of that date, our largest market share was in the County of Honolulu, where we ranked fifth in deposit market share (out of 12 banks and thrift institutions with offices in Hawaii) with a 4.17% market share.
Lending Activities
Our primary lending activity is the origination of one- to four-family residential mortgage loans. To a much lesser extent, we also originate home equity loans and lines of credit, construction, commercial and other non-residential real estate loans, consumer loans, multi-family mortgage loans and commercial business loans.
One- to Four-Family Residential Mortgage Loans. At December 31, 2010, $604.5 million, or 93.0% of our total loan portfolio, consisted of one- to four-family residential mortgage loans. We offer conforming, fixed-rate and adjustable-rate residential mortgage loans with maturities generally up to 30 years, and to a much more limited extent, of up to 40 years and non-conforming loans with maturities of up to 50 years. There has been little demand for adjustable-rate mortgage loans in our market area.
One- to four-family residential mortgage loans are generally underwritten according to Fannie Mae and Freddie Mac guidelines, and we refer to loans that conform to such guidelines as “conforming loans.” We generally originate both fixed- and adjustable-rate mortgage loans in amounts up to the maximum conforming loan limits as established by the Office of Federal Housing Enterprise Oversight,
4
which is currently $625,500 for single-family homes located in the State of Hawaii. We also originate loans above this amount, which are referred to as “jumbo loans.” These jumbo loan amounts are generally up to $1.0 million, although we do originate loans above this amount. We generally originate fixed-rate jumbo loans with terms of up to 30 years. We have not originated significant amounts of adjustable-rate jumbo loans in recent years due to customer preference for fixed-rate loans in our market area. We generally underwrite jumbo loans in a manner similar to conforming loans. Jumbo loans are not uncommon in our market area.
We will originate loans with loan-to-value ratios in excess of 80%, up to and including a loan-to-value ratio of 100%. We generally require private mortgage insurance for loans with loan-to-value ratios in excess of 80%. During the year ended December 31, 2010, we originated $16.4 million of one- to four-family residential mortgage loans with loan-to-value ratios in excess of 80%. Prior to 2010, we retained the servicing rights on residential mortgage loans sold. In 2010, we began selling loans on a servicing-released basis. For the year ended December 31, 2010, we received servicing fees of $396,000. As of December 31, 2010, the principal balance of loans serviced for others totaled $131.6 million.
We offer a variety of credit programs for low- to moderate-income and first-time home purchasers. These include our first time home purchaser program, where the borrower will receive a 100 basis point reduction in points charged in connection with the loan. We will also originate first mortgage loans to lower-income individuals who reside in rural census tracts where the U.S. Department of Agriculture will issue a second mortgage and complete the underwriting of the loan, subject to our review before origination. We also offer both FHA and VA fixed-rate loans.
Other than our loans for the construction of one- to four-family residential mortgage loans (described under “—Nonresidential Real Estate Loans”), we currently do not originate new “interest only” mortgage loans on one- to four-family residential properties (where the borrower pays interest for an initial period, after which the loan converts to a fully amortizing loan). We also do not offer loans that provide for negative amortization of principal, such as “Option ARM” loans, where the borrower can pay less than the interest owed on their loan, resulting in an increased principal balance during the life of the loan. We do not offer “subprime loans” (loans that generally target borrowers with weakened credit histories typically characterized by payment delinquencies, previous charge-offs, judgments, bankruptcies, or borrowers with questionable repayment capacity as evidenced by low credit scores or high debt-burden ratios) or Alt-A loans (traditionally defined as non-conforming loans having less than full documentation).
Home Equity Loans and Lines of Credit. In addition to traditional one- to four-family residential mortgage loans, we offer home equity loans and home equity lines of credit that are secured primarily by the borrower’s primary residence. Home equity lines of credit have a maximum term of 10 years during which time the borrower is required to make payments to principal based on the amortization of 0.125% of principal outstanding per month. The borrower is permitted to draw against the line during the entire term. Our home equity lines of credit are originated with adjustable rates of interest or with fixed rates of interest that convert to adjustable rates of interest after an initial period of up to three years. Our home equity loans are originated with fixed rates of interest and with terms of up to 30 years. Home equity loans and lines of credit are generally underwritten with the same criteria that we use to underwrite one- to four-family residential mortgage loans. Home equity loans may be underwritten with a loan-to-value ratio of 80% when combined with the principal balance of the existing mortgage loan, while lines of credit for owner-occupied properties and investment properties may be underwritten with loan-to-value ratios of 75% and 65%, respectively, when combined with the principal balance of the existing mortgage loan. We require appraisals on home equity loans and lines of credit when the aggregate loan amount exceeds 60% of the property’s tax assessed value or when the home equity loan or line of credit is
5
$250,000 or greater. At the time we close a home equity loan or line of credit, we record a mortgage to perfect our security interest in the underlying collateral. At December 31, 2010, the outstanding balance of home equity loans totaled $10.5 million, or 1.6% of our total loan portfolio, and the outstanding balance of home equity lines of credit totaled $9.6 million, or 1.5% of our total loan portfolio.
Nonresidential Real Estate Loans. Our non-residential real estate loans consist primarily of commercial real estate loans and construction loans for residential real estate projects. These loans totaled $14.4 million, or 2.2% of our loan portfolio as of December 31, 2010. The commercial real estate properties primarily include owner-occupied light industrial properties. We seek to originate commercial real estate loans with initial principal balances of $1.0 million or less. Loans secured by commercial real estate totaled $8.8 million, or 1.4%, of our total loan portfolio at December 31, 2010, and consisted of 14 loans outstanding with an average loan balance of approximately $629,000. All of our nonresidential real estate loans are secured by properties located in our primary market area. At December 31, 2010, our largest commercial real estate loan had a principal balance of approximately $1.7 million and was secured by real property and a building. This loan was performing in accordance with its terms at December 31, 2010.
In the underwriting of commercial real estate loans, we generally lend up to the lesser of 75% of the property’s appraised value or purchase price. We base our decision to lend primarily on the economic viability of the property and the creditworthiness of the borrower. In evaluating a proposed commercial real estate loan, we emphasize the ratio of the property’s projected net cash flow to the loan’s debt service requirement (generally requiring a minimum ratio of 115%), computed after deduction for a vacancy factor and property expenses we deem appropriate. Personal guarantees are usually obtained from commercial real estate borrowers. We require title insurance, fire and extended coverage casualty insurance, and, if appropriate, flood insurance, in order to protect our security interest in the underlying property. Almost all of our commercial real estate loans are generated internally by our loan officers.
Commercial real estate loans generally carry higher interest rates and have shorter terms than one- to four-family residential mortgage loans. Commercial real estate loans, however, entail greater credit risks compared to one- to four-family residential mortgage loans, as they typically involve larger loan balances concentrated with single borrowers or groups of related borrowers. In addition, the payment of loans secured by income-producing properties typically depends, in large part, on sufficient income from the property to cover operating expenses and debt service. Changes in economic conditions that are not in the control of the borrower or lender could affect the value of the collateral for the loan or the future cash flow of the property. Additionally, any decline in real estate values may be more pronounced for commercial real estate than residential properties.
We also originate a limited amount of construction loans to experienced developers, almost exclusively for the construction of residential real estate projects. Construction loans are also made to individuals for the construction of their personal residences. Construction loans to individuals are generally “interest-only” loans during the construction period, and convert to permanent, amortizing loans following the completion of construction. At December 31, 2010, construction loans totaled $2.2 million, or 0.3% of total loans receivable. At December 31, 2010, the additional unadvanced portion of these construction loans totaled $1.1 million.
Advances on construction loans are made in accordance with a schedule reflecting the cost of construction, but are generally limited to an 80% loan-to-completed-appraised-value ratio. Repayment of construction loans on residential properties is normally expected from the sale of units to individual purchasers. In the case of income-producing property, repayment is usually expected from permanent financing upon completion of construction. We typically provide the permanent mortgage financing on our construction loans on income-producing property.
6
Before making a commitment to fund a construction loan, we require an appraisal of the property by a licensed appraiser. We review and inspect properties before disbursement of funds during the term of the construction loan.
Construction financing generally involves greater credit risk than long-term financing on improved, owner-occupied real estate. Risk of loss on a construction loan depends largely upon the accuracy of the initial estimate of the value of the property at completion of construction compared to the estimated cost (including interest) of construction and other assumptions. If the estimate of construction cost is inaccurate, we may be required to advance additional funds beyond the amount originally committed in order to protect the value of the property. Moreover, if the estimated value of the completed project is inaccurate, the borrower may hold a property with a value that is insufficient to assure full repayment of the construction loan upon the sale of the property. In the event we make a land acquisition loan on property that is not yet approved for the planned development, there is the risk that approvals will not be granted or will be delayed. We currently do not have any land acquisition development and construction loans. Construction loans also expose us to the risk that improvements will not be completed on time in accordance with specifications and projected costs. In addition, the ultimate sale or rental of the property may not occur as anticipated.
Loan Originations, Purchases, Sales, Participations and Servicing. All loans that we originate are underwritten pursuant to our policies and procedures, which incorporate standard underwriting guidelines, including those of Freddie Mac and Fannie Mae, to the extent applicable. We originate both adjustable-rate and fixed-rate loans. However, in our market area, customer demand is primarily for fixed-rate loans. Our loan origination and sales activity may be adversely affected by a rising interest rate environment that typically results in decreased loan demand. Most of our one- to four-family residential mortgage loan originations are generated by our branch managers and employees located in our banking offices and our additional commissioned loan officers located in our corporate headquarters. We also advertise throughout our market area.
Prior to 2010, we retained the servicing rights on residential mortgage loans sold. In 2010, we began selling loans on a servicing-released basis. We sell loans to assist us in managing interest rate risk. We sold $45.1 million, $85.2 million and $1.4 million of residential mortgage loans (all fixed-rate loans, with terms of 10 years or longer) during the years ended December 31, 2010, 2009 and 2008, respectively. We had 13 loans totaling $3.2 million classified as held for sale at December 31, 2010.
We sell our loans without recourse, except for normal representations and warranties provided in sales transactions. At December 31, 2010, we were servicing loans owned by others with a principal balance of $131.6 million. Loan servicing includes collecting and remitting loan payments, accounting for principal and interest, contacting delinquent borrowers, supervising foreclosures and property dispositions in the event of unremedied defaults, making certain insurance and tax payments on behalf of the borrowers and generally administering the loans. We retain a portion of the interest paid by the borrower on the loans we service as consideration for our servicing activities. At December 31, 2010, substantially all of the loans serviced for Freddie Mac and Fannie Mae were performing in accordance with their contractual terms and we believe that there are no material repurchase obligations associated with these loans. We have not entered into loan participations in recent years.
Loan Approval Procedures and Authority. Our lending activities follow written, non-discriminatory underwriting standards and loan origination procedures established by our Board of Directors. The loan approval process is intended to assess the borrower’s ability to repay the loan and value of the property that will secure the loan. To assess the borrower’s ability to repay, we review the borrower’s employment and credit history and information on the historical and projected income and expenses of the borrower.
7
Our policies and loan approval limits are established by the Board of Directors. Aggregate lending relationships in amounts up to $2.0 million can be approved by designated individual officers or officers acting together with specific lending approval authority. Relationships in excess of $2.0 million require the approval of the Loan Committee of the Board of Directors.
Territorial Savings Bank also uses automated underwriting systems to review one- to four-family residential mortgage loans. We require appraisals of all real property securing one- to four-family residential real estate loans, and on property securing home equity lines of credit when the aggregate loan amount exceeds 60% of the property’s tax assessed value or when the line of credit is $250,000 or greater. All appraisers are licensed appraisers and all third-party appraisers are approved by the Board of Directors annually.
Investments
Our Board of Directors has primary responsibility for establishing and overseeing our investment policy. The Board of Directors has delegated authority to implement the investment policy to our Investment Committee, consisting of the same members as our Asset/Liability Management Committee. The investment policy is reviewed at least annually by the Investment Committee, and any changes to the policy are subject to approval by the full Board of Directors. The overall objectives of the Investment Policy are to maintain a portfolio of high quality and diversified investments to maximize interest income over the long term and to minimize risk, to provide collateral for borrowings, to provide additional earnings when loan production is low, and to reduce our tax liability. The policy dictates that investment decisions give consideration to the safety of principal, liquidity requirements and potential returns. Our Senior Vice President and Treasurer executes our securities portfolio transactions as directed by the Investment Committee. All purchase and sale transactions are reported to the Board of Directors on a monthly basis.
Our current investment policy permits investments in securities issued by the United States Government as well as mortgage-backed securities and direct obligations of Fannie Mae, Freddie Mac and Ginnie Mae. The investment policy also permits, with certain limitations, investments in certificates of deposit, bank owned life insurance, collateralized mortgage obligations, trust preferred securities, municipal securities and stock in the Federal Home Loan Bank of Seattle. We purchased stock in the Federal Home Loan Bank of Seattle in order to obtain services such as demand deposit accounts, certificates of deposit, security safekeeping services and borrowings in the form of advances.
Our current investment policy does not permit investment in stripped mortgage-backed securities, complex securities and derivatives as defined in federal banking regulations and other high-risk securities. As of December 31, 2010, we held no asset-backed securities other than mortgage-backed securities. As a federal savings bank, Territorial Savings Bank is not permitted to invest in equity securities. This general restriction does not apply to Territorial Bancorp Inc.
Our current policies do not permit hedging activities, such as engaging in futures, options or swap transactions, or investing in high-risk mortgage derivatives, such as collateralized mortgage obligation residual interests, real estate mortgage investment conduit residual interests or stripped mortgage-backed securities.
8
The Investments – Debt and Equity Securities topic of the Financial Accounting Standards Board Accounting Standards Codification (FASB ASC) requires that, at the time of purchase, we designate a security as either held to maturity, available-for-sale, or trading, based upon our ability and intent. Securities available-for-sale and trading securities are reported at market value and securities held to maturity are reported at amortized cost. A periodic review and evaluation of the available-for-sale and held to maturity securities portfolios is conducted to determine if the fair value of any security has declined below its carrying value and whether such decline is other-than-temporary. If we do not have the intent to sell a security and it is not more likely than not that we will be required to sell a security, impairment occurs when the present value of the remaining cash flows is less than the remaining amortized cost basis. The difference between the present value of remaining cash flows and the remaining amortized cost basis is considered a credit loss. If a credit loss has occurred, impairment is recorded by writing down the value of a security to its fair market value. The difference between the write down and the credit loss is considered other comprehensive loss, which is a reduction of net worth.
Our securities held to maturity at December 31, 2010, consisted primarily of securities with the following amortized costs: $408.3 million of mortgage-backed securities, $122.2 million of collateralized mortgage obligations and $32,000 of trust preferred securities which were issued by pools of issuers consisting primarily of financial institution holding companies. All of our mortgage-backed securities and collateralized mortgage obligations were issued by Ginnie Mae, Freddie Mac or Fannie Mae. At December 31, 2010, there were two securities with a fair value of $15.0 million that were classified as available-for-sale. At December 31, 2010, none of the collateral underlying our securities portfolio was considered subprime or Alt-A, and we did not hold any common or preferred stock issued by Freddie Mac or Fannie Mae as of that date. See “Item 7. Management’s Discussion and Analysis of Financial Condition and Results of Operations—Balance Sheet Analysis—Securities” for a discussion of the recent performance of our securities portfolio. The fair values of our securities, which, at December 31, 2010, consisted primarily of mortgage-backed securities, are based on published or securities dealers’ market values.
We purchase mortgage-backed securities insured or guaranteed by Fannie Mae, Freddie Mac or Ginnie Mae. Historically, we invested in mortgage-backed securities to achieve positive interest rate spreads with minimal administrative expense and to lower our credit risk as a result of the guarantees provided by Freddie Mac, Fannie Mae or Ginnie Mae. However, in September 2008, the Federal Housing Finance Agency placed Freddie Mac and Fannie Mae into conservatorship. The U.S. Treasury Department has established financing agreements to ensure that Freddie Mac and Fannie Mae meet their obligations to holders of mortgage-backed securities that they have issued or guaranteed. These actions have not affected the markets for mortgage-backed securities issued by Freddie Mac or Fannie Mae.
Mortgage-backed securities are securities issued in the secondary market that are collateralized by pools of mortgages. Certain types of mortgage-backed securities are commonly referred to as “pass-through” certificates because the principal and interest of the underlying loans is “passed through” to investors, net of certain costs, including servicing and guarantee fees. Mortgage-backed securities typically are collateralized by pools of one- to four-family or multifamily mortgages, although we invest primarily in mortgage-backed securities backed by one- to four-family mortgages. The issuers of such securities pool and resell the participation interests in the form of securities to investors such as Territorial Savings Bank. The interest rate of the security is lower than the interest rates of the underlying loans to allow for payment of servicing and guaranty fees. Ginnie Mae, a United States Government agency, and government sponsored enterprises, such as Fannie Mae and Freddie Mac, either guarantee the payments or guarantee the timely payment of principal and interest to investors. Mortgage-backed securities are more liquid than individual mortgage loans since there is an active trading market for such securities. In addition, mortgage-backed securities may be used to collateralize our borrowings. Investments in mortgage-backed securities involve a risk that actual payments will be greater or less than the prepayment
9
rate estimated at the time of purchase, which may require adjustments to the amortization of any premium or accretion of any discount relating to such interests, thereby affecting the net yield on our securities. Current prepayment speeds determine whether prepayment estimates require modification that could cause amortization or accretion adjustments.
Sources of Funds
General. Deposits traditionally have been our primary source of funds for our investment and lending activities. We also borrow from the Federal Home Loan Bank of Seattle and from securities dealers to supplement cash flow needs, to lengthen the maturities of liabilities for interest rate risk management purposes and to manage our cost of funds. Our additional sources of funds are loan repayments, maturing investments, retained earnings, income on other earning assets and the proceeds of loan sales.
Deposits. We accept deposits primarily from the areas in which our offices are located. We rely on our competitive pricing and products, convenient locations and quality customer service to attract and retain deposits. We offer a variety of deposit accounts with a range of interest rates and terms. Our deposit accounts consist of passbook and statement savings accounts, certificates of deposit, money market accounts, commercial and regular checking accounts and Super NOW accounts. Historically, we have not accepted brokered deposits.
Interest rates paid, maturity terms, service fees and withdrawal penalties are established on a periodic basis. Deposit rates and terms are based primarily on current operating strategies and market interest rates, liquidity requirements and our deposit growth goals.
Borrowings. Our borrowings consist of advances from the Federal Home Loan Bank of Seattle and funds borrowed from securities sold under agreements to repurchase. At December 31, 2010, our securities sold under agreements to repurchase totaled $105.2 million, or 8.7% of total liabilities, and Federal Home Loan Bank advances totaled $10.0 million, or 0.8% of total liabilities. At December 31, 2010, we had access to additional Federal Home Loan Bank advances of up to $350.3 million. Advances from the Federal Home Loan Bank of Seattle are secured by our investment in the common stock of the Federal Home Loan Bank of Seattle as well as by a blanket pledge on our assets not otherwise pledged. Securities sold under agreements to repurchase are secured by mortgage-backed securities.
Subsidiary Activities
Through December 30, 2010, Territorial Savings Bank owned 100% of the common stock of Territorial Holdings, Inc., a Hawaii corporation, which in turn owned 100% of the voting common stock of Territorial Realty, Inc. Territorial Realty, Inc. was a Hawaii real estate investment trust that held mortgage loans and mortgage-backed securities. These entities enabled Territorial Savings Bank to segregate certain assets for management purposes, and promoted Territorial Savings Bank’s ability to raise regulatory capital in the future through the sale of preferred stock or other capital-enhancing securities by these entities. On December 31, 2010, Territorial Holdings, Inc. and Territorial Realty, Inc. were liquidated and their accounts and results of operations were incorporated into Territorial Savings Bank.
Territorial Savings Bank owns 100% of the common stock of Territorial Financial Services, Inc., a Hawaii corporation that engages primarily in insurance activities. At December 31, 2010, Territorial Savings Bank’s investment in Territorial Financial Services, Inc. was $12,000, and Territorial Financial Services, Inc. had assets of $65,000 at that date. Territorial Savings Bank also owns 100% of the common stock of Territorial Real Estate Co., Inc., an inactive Hawaii corporation that is authorized to manage and dispose of troubled real estate.
10
Personnel
As of December 31, 2010, we had 246 full-time employees and 12 part-time employees. Our employees are not represented by any collective bargaining group. Management believes that we have a good working relationship with our employees.
FEDERAL AND STATE TAXATION
Federal Taxation
General. Territorial Bancorp Inc. and Territorial Savings Bank are subject to federal income taxation in the same general manner as other corporations, with some exceptions discussed below. The following discussion of federal taxation is intended only to summarize material federal income tax matters and is not a comprehensive description of the tax rules applicable to Territorial Bancorp Inc. and Territorial Savings Bank.
Method of Accounting. For federal income tax purposes, Territorial Savings Bank currently reports its income and expenses on the accrual method of accounting and uses a tax year ending December 31st for filing its consolidated federal income tax returns. The Small Business Protection Act of 1996 eliminated the use of the reserve method of accounting for bad debt reserves by savings institutions, effective for taxable years beginning after 1995.
Minimum Tax. The Internal Revenue Code of 1986, as amended, imposes an alternative minimum tax at a rate of 20% on a base of regular taxable income plus certain tax preferences, referred to as “alternative minimum taxable income.” The alternative minimum tax is payable to the extent alternative minimum taxable income is in excess of an exemption amount. Net operating losses can, in general, offset no more than 90% of alternative minimum taxable income. Certain payments of alternative minimum tax may be used as credits against regular tax liabilities in future years. At December 31, 2010 and 2009, Territorial Savings Bank had no alternative minimum tax credit carryforward.
Net Operating Loss Carryovers. A financial institution may carry back net operating losses to the preceding two taxable years and forward to the succeeding 20 taxable years. However, as a result of recent legislation, subject to certain limitations, the carryback period for net operating losses incurred in 2008 or 2009 (but not both years) has been expanded to five years. At December 31, 2010 and 2009, Territorial Savings Bank had no net operating loss carryforward for federal income tax purposes.
Corporate Dividends. We may exclude from our income 100% of dividends received from Territorial Savings Bank as a member of the same affiliated group of corporations.
Audit of Tax Returns. Territorial Savings Bank’s federal income tax returns have not been audited in the most recent five-year period.
State Taxation
Territorial Bancorp Inc. and Territorial Savings Bank are subject to a franchise tax imposed under Hawaii law at a rate of 7.92% of net income. The net income to which the tax rate is applied is determined in a manner consistent with the taxable income determined for federal purposes with some adjustments. The principal adjustment to federal taxable income is the inclusion of interest received on municipal bonds in gross income for Hawaii franchise tax purposes.
11
SUPERVISION AND REGULATION
General
Territorial Savings Bank is examined and supervised by the Office of Thrift Supervision and is subject to examination by the Federal Deposit Insurance Corporation. This regulation and supervision establishes a comprehensive framework of activities in which an institution may engage and is intended primarily for the protection of the Federal Deposit Insurance Corporation’s deposit insurance fund and depositors, and not for the protection of security holders. Under this system of federal regulation, financial institutions are periodically examined to ensure that they satisfy applicable standards with respect to their capital adequacy, assets, management, earnings, liquidity and sensitivity to market interest rates. Territorial Savings Bank also is regulated to a lesser extent by the Board of Governors of the Federal Reserve System, or Federal Reserve Board, governing reserves to be maintained against deposits and other matters. The Office of Thrift Supervision examines Territorial Savings Bank and prepares reports for the consideration of its Board of Directors on any operating deficiencies. Territorial Savings Bank’s relationship with its depositors and borrowers also is regulated to a great extent by federal law and, to a much lesser extent, state law, especially in matters concerning the ownership of deposit accounts and the form and content of Territorial Savings Bank’s loan documents.
Any change in these laws or regulations, whether by the Federal Deposit Insurance Corporation, the Office of Thrift Supervision or Congress, could have a material adverse impact on Territorial Bancorp Inc., Territorial Savings Bank and their operations.
Territorial Bancorp Inc., as a savings and loan holding company, is required to file certain reports with, is subject to examination by, and otherwise must comply with the rules and regulations of the Office of Thrift Supervision. Territorial Bancorp Inc. is also subject to the rules and regulations of the Securities and Exchange Commission under the federal securities laws.
Certain of the regulatory requirements that are applicable to Territorial Savings Bank and Territorial Bancorp Inc. are described below. This description of statutes and regulations is not intended to be a complete description of such statutes and regulations and their effects on Territorial Savings Bank and Territorial Bancorp Inc. and is qualified in its entirety by reference to the actual statutes and regulations.
Legislation has been adopted that would implement sweeping changes to the current bank regulatory structure. The Dodd-Frank Wall Street Reform and Consumer Protection Act (“Dodd-Frank Act”) will eliminate our current primary federal regulator, the Office of Thrift Supervision, by merging the Office of Thrift Supervision into the Comptroller of the Currency (the primary federal regulator for national banks). The Comptroller of the Currency will assume the responsibility for examining, regulating and enforcing laws and regulations against federal savings banks. That will occur on July 21, 2011, subject to a possible six month extension. The legislation would also establish a Financial Services Oversight Council and grant the Board of Governors of the Federal Reserve System exclusive authority to regulate all bank and thrift holding companies. As a result, Territorial Bancorp Inc. would become subject to supervision by the Federal Reserve Board as opposed to the Office of Thrift Supervision, and would become subject to the Federal Reserve’s regulations, including holding company capital requirements, that Territorial Bancorp Inc. would not be subject to as a savings and loan holding company. In addition, compliance with new regulations and being supervised by one or more new regulatory agencies could increase our expenses.
12
The Dodd-Frank Act also provides for the creation of a new agency, the Consumer Financial Protection Bureau, as an independent bureau of the Federal Reserve Board, to take over the implementation of federal consumer financial protection and fair lending laws from the depository institution regulators. However, institutions of $10 billion or fewer in assets will continue to be examined for compliance with such laws and regulations by, and subject to the primary enforcement authority of, the primary banking regulator rather than the Consumer Financial Protection Bureau.
Federal Banking Regulation
Business Activities. A federal savings bank derives its lending and investment powers from the Home Owners’ Loan Act, as amended, and the regulations of the Office of Thrift Supervision. Under these laws and regulations, Territorial Savings Bank may invest in mortgage loans secured by residential and commercial real estate, commercial business and consumer loans, certain types of debt securities and certain other assets, subject to applicable limits. Territorial Savings Bank also may establish subsidiaries that may engage in activities not otherwise permissible for Territorial Savings Bank, including real estate investment and securities and insurance brokerage. In addition, the Dodd-Frank Act authorizes the payment of interest on commercial checking accounts, effective July 21, 2011.
Capital Requirements. Office of Thrift Supervision regulations requires savings banks to meet three minimum capital standards: a 1.5% tangible capital ratio, a 4% leverage ratio (3% for savings banks receiving the highest rating on the CAMELS rating system) and an 8% risk-based capital ratio.
The risk-based capital standard for savings banks requires the maintenance of Tier 1 (core) and total capital (which is defined as core capital and supplementary capital) to risk-weighted assets of at least 4% and 8%, respectively. In determining the amount of risk-weighted assets, all assets, including certain off-balance sheet assets, are multiplied by a risk-weight factor of 0% to 100%, assigned by the Office of Thrift Supervision, based on the risks believed inherent in the type of asset. Core capital is defined as common stockholders’ equity (including retained earnings), certain noncumulative perpetual preferred stock and related surplus and minority interests in equity accounts of consolidated subsidiaries, less intangibles other than certain mortgage servicing rights and credit card relationships. The components of supplementary capital include cumulative preferred stock, long-term perpetual preferred stock, mandatory convertible securities, subordinated debt and intermediate preferred stock, the allowance for loan and lease losses limited to a maximum of 1.25% of risk-weighted assets and up to 45% of net unrealized gains on available-for-sale equity securities with readily determinable fair market values. Overall, the amount of supplementary capital included as part of total capital cannot exceed 100% of core capital. Additionally, a savings bank that retains credit risk in connection with an asset sale may be required to maintain additional regulatory capital because of the recourse back to the savings bank. In assessing an institution’s capital adequacy, the Office of Thrift Supervision takes into consideration not only these numeric factors but also qualitative factors as well, and has the authority to establish higher capital requirements for individual associations where necessary.
At December 31, 2010, Territorial Savings Bank’s capital exceeded all applicable requirements.
Loans-to-One Borrower. Generally, a federal savings bank may not make a loan or extend credit to a single or related group of borrowers in excess of 15% of unimpaired capital and surplus. An additional amount may be loaned, equal to 10% of unimpaired capital and surplus, if the loan is secured by readily marketable collateral, which generally does not include real estate. As of December 31, 2010, Territorial Savings Bank’s largest lending relationship with a single or related group of borrowers totaled $3.2 million, which represented 1.4% of unimpaired capital and surplus. Therefore, Territorial Savings Bank was in compliance with the loans-to-one borrower limitations.
13
Qualified Thrift Lender Test. As a federal savings bank, Territorial Savings Bank must satisfy the qualified thrift lender, or “QTL,” test. Under the QTL test, Territorial Savings Bank must maintain at least 65% of its “portfolio assets” in “qualified thrift investments” (primarily residential mortgages and related investments, including mortgage-backed securities) in at least nine months of the most recent 12-month period. “Portfolio assets” generally means total assets of a savings institution, less the sum of specified liquid assets up to 20% of total assets, goodwill and other intangible assets, and the value of property used in the conduct of the savings bank’s business.
Territorial Savings Bank also may satisfy the QTL test by qualifying as a “domestic building and loan association” as defined in the Internal Revenue Code. A savings bank that fails the qualified thrift lender test must operate under specified restrictions set forth in the Home Owners’ Loan Act. Additionally, the Dodd-Frank Act makes non-compliance with the QTL Test potentially subject to agency enforcement action for violation of law.
At December 31, 2010, Territorial Savings Bank maintained approximately 95.2% of its portfolio assets in qualified thrift investments and, therefore, satisfied the QTL test.
Capital Distributions. Office of Thrift Supervision regulations govern capital distributions by a federal savings bank, which include cash dividends, stock repurchases and other transactions charged to the savings bank’s capital account. A savings bank must file an application for approval of a capital distribution if:
| • | the total capital distributions for the applicable calendar year exceed the sum of the savings bank’s net income for that year to date plus the savings bank’s retained net income for the preceding two years; |
| • | the savings bank would not be at least adequately capitalized following the distribution; |
| • | the distribution would violate any applicable statute, regulation, agreement or Office of Thrift Supervision-imposed condition; or |
| • | the savings bank is not eligible for expedited treatment of its filings. |
Even if an application is not otherwise required, every savings bank that is a subsidiary of a holding company must still file a notice with the Office of Thrift Supervision at least 30 days before the Board of Directors declares a dividend or approves a capital distribution.
The Office of Thrift Supervision may disapprove a notice or application if:
| • | the savings bank would be undercapitalized following the distribution; |
| • | the proposed capital distribution raises safety and soundness concerns; or |
| • | the capital distribution would violate a prohibition contained in any statute, regulation or agreement. |
In addition, the Federal Deposit Insurance Act provides that an insured depository institution shall not make any capital distribution, if after making such distribution the institution would be undercapitalized.
14
Liquidity. A federal savings bank is required to maintain a sufficient amount of liquid assets to ensure its safe and sound operation. Our primary source of liquidity to meet our short- and long-term funding needs are cash balances at the Federal Reserve Bank, savings deposits, loan repayments, reverse repurchase agreements with security dealers and borrowing lines at the Federal Home Loan Bank of Seattle. At December 31, 2010, we had $194.4 million of cash and cash equivalents. We also had the capacity to borrow up to $350.3 million from the Federal Home Loan Bank of Seattle at December 31, 2010.
Community Reinvestment Act and Fair Lending Laws. All savings banks have a responsibility under the Community Reinvestment Act and related regulations of the Office of Thrift Supervision to help meet the credit needs of their communities, including low- and moderate-income borrowers. In connection with its examination of a federal savings bank, the Office of Thrift Supervision is required to assess the savings bank’s record of compliance with the Community Reinvestment Act. In addition, the Equal Credit Opportunity Act and the Fair Housing Act prohibit lenders from discriminating in their lending practices on the basis of characteristics specified in those statutes. A savings bank’s failure to comply with the provisions of the Community Reinvestment Act could, at a minimum, result in denial of certain corporate applications such as branches or mergers, or in restrictions on its activities. The failure to comply with the Equal Credit Opportunity Act and the Fair Housing Act could result in enforcement actions by the Office of Thrift Supervision, as well as other federal regulatory agencies and the Department of Justice. The Community Reinvestment Act requires all Federal Deposit Insurance-insured institutions to publicly disclose their rating. Territorial Savings Bank received a satisfactory Community Reinvestment Act rating in its most recent federal examination.
Transactions with Related Parties. A federal savings bank’s authority to engage in transactions with its affiliates is limited by Office of Thrift Supervision regulations and by Sections 23A and 23B of the Federal Reserve Act and its implementing Regulation W promulgated by the Board of Governors of the Federal Reserve System. An affiliate is generally a company that controls, is controlled by, or is under common control with an insured depository institution such as Territorial Savings Bank. Territorial Bancorp Inc. is an affiliate of Territorial Savings Bank. In general, transactions between an insured depository institution and its affiliates are subject to certain quantitative and collateral requirements. In addition, Office of Thrift Supervision regulations prohibit a savings bank from lending to any of its affiliates that are engaged in activities that are not permissible for bank holding companies and from purchasing the securities of any affiliate, other than a subsidiary. Finally, transactions with affiliates must be consistent with safe and sound banking practices, not involve low-quality assets and be on terms that are as favorable to the institution as comparable transactions with non-affiliates. The Office of Thrift Supervision requires savings banks to maintain detailed records of all transactions with affiliates.
Territorial Savings Bank’s authority to extend credit to its directors, executive officers and 10% stockholders, as well as to entities controlled by such persons, is currently governed by the requirements of Sections 22(g) and 22(h) of the Federal Reserve Act and Regulation O of the Federal Reserve Board. Among other things, these provisions require that extensions of credit to insiders:
| (i) | be made on terms that are substantially the same as, and follow credit underwriting procedures that are not less stringent than, those prevailing for comparable transactions with unaffiliated persons and that do not involve more than the normal risk of repayment or present other unfavorable features, and |
| (ii) | not exceed certain limitations on the amount of credit extended to such persons, individually and in the aggregate, which limits are based, in part, on the amount of Territorial Savings Bank’s capital. |
15
In addition, extensions of credit in excess of certain limits must be approved by Territorial Savings Bank’s Board of Directors.
Enforcement. The Office of Thrift Supervision has primary enforcement responsibility over federal savings institutions and has the authority to bring enforcement action against all “institution-affiliated parties,” including directors, officers, stockholders, attorneys, appraisers and accountants who knowingly or recklessly participate in wrongful action likely to have an adverse effect on an insured institution. Formal enforcement action by the Office of Thrift Supervision may range from the issuance of a capital directive or cease and desist order to removal of officers and/or directors of the institution, and the appointment of a receiver or conservator. Civil penalties cover a wide range of violations and actions, and range up to $25,000 per day, unless a finding of reckless disregard is made, in which case penalties may be as high as $1 million per day. The Federal Deposit Insurance Corporation also has the authority to terminate deposit insurance or to recommend to the Director of the Office of Thrift Supervision that enforcement action be taken with respect to a particular savings institution. If action is not taken by the Director, the Federal Deposit Insurance Corporation has authority to take action under specified circumstances.
The Comptroller of the Currency will assume the Office of Thrift Supervision’s enforcement authority under the Dodd-Frank Act regulatory restructuring.
Standards for Safety and Soundness. Federal law requires each federal banking agency to prescribe certain standards for all insured depository institutions. These standards relate to, among other things, internal controls, information systems and audit systems, loan documentation, credit underwriting, interest rate risk exposure, asset growth, compensation, and other operational and managerial standards as the agency deems appropriate. Interagency guidelines set forth the safety and soundness standards that the federal banking agencies use to identify and address problems at insured depository institutions before capital becomes impaired. If the appropriate federal banking agency determines that an institution fails to meet any standard prescribed by the guidelines, the agency may require the institution to submit to the agency an acceptable plan to achieve compliance with the standard. If an institution fails to meet these standards, the appropriate federal banking agency may require the institution to implement an acceptable compliance plan. Failure to implement such a plan can result in further enforcement action, including the issuance of a cease and desist order or the imposition of civil money penalties.
Prompt Corrective Action Regulations. Under prompt corrective action regulations, the Office of Thrift Supervision is authorized and, under certain circumstances, required to take supervisory actions against undercapitalized savings banks. For this purpose, a savings bank is placed in one of the following five categories based on the savings bank’s capital:
| • | well-capitalized (at least 5% leverage capital, 6% Tier 1 risk-based capital and 10% total risk-based capital); |
| • | adequately capitalized (at least 4% leverage capital (3% for savings banks with a composite examination rating of 1), 4% Tier 1 risk-based capital and 8% total risk-based capital); |
| • | undercapitalized (less than 4% leverage capital (3% for savings banks with a composite examination rating of 1), 4% Tier 1 risk-based capital or 8% total risk-based capital); |
| • | significantly undercapitalized (less than 3% leverage capital, 3% Tier 1 risk-based capital or 6% total risk-based capital); and |
16
| • | critically undercapitalized (less than 2% tangible capital). |
Generally, the Office of Thrift Supervision is required to appoint a receiver or conservator for a savings bank that is “critically undercapitalized” within specific time frames. The regulations also provide that a capital restoration plan must be filed with the Office of Thrift Supervision within 45 days of the date a savings bank receives notice that it is “undercapitalized,” “significantly undercapitalized” or “critically undercapitalized.” Any holding company for the savings bank required to submit a capital restoration plan must guarantee the lesser of an amount equal to 5% of the savings bank’s assets at the time it was notified or deemed to be undercapitalized by the Office of Thrift Supervision, or the amount necessary to restore the savings bank to adequately capitalized status. This guarantee remains in place until the Office of Thrift Supervision notifies the savings bank that it has maintained adequately capitalized status for each of four consecutive calendar quarters, and the Office of Thrift Supervision has the authority to require payment and collect payment under the guarantee. Failure by a holding company to provide the required guarantee will result in certain operating restrictions on the savings bank, such as restrictions on the ability to declare and pay dividends, pay executive compensation and management fees, and increase assets or expand operations. The Office of Thrift Supervision may also take any one of a number of discretionary supervisory actions against undercapitalized associations, including the issuance of a capital directive and the replacement of senior executive officers and directors.
At December 31, 2010, Territorial Savings Bank met the criteria for being considered “well-capitalized.”
Insurance of Deposit Accounts. Territorial Savings Bank’s deposits are insured up to applicable limits by the Deposit Insurance Fund of the Federal Deposit Insurance Corporation.
Under the Federal Deposit Insurance Corporation’s risk-based assessment system, insured institutions are assigned to one of four risk categories based on supervisory evaluations, regulatory capital levels and certain other factors, with less risky institutions paying lower assessments. An institution’s assessment rate depends upon the category to which it is assigned, and certain adjustments specified by Federal Deposit Insurance Corporation regulations. Assessment rates currently range from seven to seventy seven basis points of assessable deposits. The Federal Deposit Insurance Corporation may adjust the scale uniformly, except that no adjustment can deviate more than three basis points from the base scale without notice and comment. No institution may pay a dividend if in default of the federal deposit insurance assessment.
The Dodd-Frank Act requires the Federal Deposit Insurance Corporation to revise its procedures to base its assessments upon total assets less tangible equity instead of deposits. The Federal Deposit Insurance Corporation recently finalized a rule that would implement that change, effective April 1, 2011. Among other things, the final rule changes the assessment range.
The Federal Deposit Insurance Corporation imposed on all insured institutions a special emergency assessment of five basis points of total assets minus Tier 1 capital (as of June 30, 2009), capped at ten basis points of an institution’s deposit assessment base, in order to cover losses to the Deposit Insurance Fund. We accrued $ 689,000 for the special assessment in the quarter ended June 30, 2009. The special assessment was paid on September 30, 2009. The Federal Deposit Insurance Corporation provided for similar assessments during the final two quarters of 2009, if deemed necessary.
In lieu of further special assessments, however, the Federal Deposit Insurance Corporation required insured institutions to prepay estimated quarterly risk-based assessments for the fourth quarter of 2009 through the fourth quarter of 2012. The estimated assessments, which included an assumed annual assessment base increase of 5%, were recorded as a prepaid expense asset as of December 30, 2009. On
17
December 30, 2009, we prepaid $4.3 million in estimated assessments for the fourth quarter of 2009 through 2012. As of December 31, 2009, and each quarter thereafter, a charge to earnings is recorded for each regular assessment with an offsetting credit to the prepaid asset.
Due to the recent difficult economic conditions, deposit insurance per account owner has been raised to $250,000. That coverage was made permanent by the Dodd-Frank Act. In addition, the Federal Deposit Insurance Corporation adopted an optional Temporary Liquidity Guarantee Program by which, for a fee, noninterest-bearing transaction accounts would receive unlimited insurance coverage until June 30, 2010, subsequently extended to December 31, 2010, and certain senior unsecured debt issued by institutions and their holding companies between October 13, 2008 and October 31, 2009 would be guaranteed by the Federal Deposit Insurance Corporation through June 30, 2012, or in some cases, December 31, 2012. Territorial Savings Bank opted to participate in the unlimited noninterest- bearing transaction account coverage through June 30, 2010. Territorial Savings Bank did not participate in the unlimited noninterest-bearing transaction account coverage program after June 30, 2010. Territorial Savings Bank and Territorial Bancorp, Inc. opted not to participate in the unsecured debt guarantee program. The Dodd-Frank Act extended the unlimited coverage for certain noninterest-bearing transaction accounts from January 1, 2011 until December 31, 2012 without the opportunity for opt out.
In addition to the assessment for deposit insurance, institutions are required to make payments on bonds issued in the late 1980s by the Financing Corporation to recapitalize a predecessor deposit insurance fund. That payment is established quarterly and during the four quarters ended December 31, 2010 averaged 1.045 basis points of assessable deposits.
The Dodd-Frank Act increased the minimum target Deposit Insurance Fund ratio from 1.15% of estimated insured deposits to 1.35% of estimated insured deposits. The Federal Deposit Insurance Corporation must seek to achieve the 1.35% ratio by September 30, 2020. Insured institutions with assets of $10 billion or more are supposed to fund the increase. The Dodd-Frank Act eliminated the 1.5% maximum fund ratio, instead leaving it to the discretion of the Federal Deposit Insurance Corporation and the Federal Deposit Insurance Corporation has recently exercised that discretion by establishing a long range fund ratio of 2%.
The Federal Deposit Insurance Corporation has authority to increase insurance assessments. A significant increase in insurance premiums would likely have an adverse effect on the operating expenses and results of operations of the Bank. Management cannot predict what insurance assessment rates will be in the future.
Prohibitions Against Tying Arrangements. Federal savings banks are prohibited, subject to some exceptions, from extending credit to or offering any other service, or fixing or varying the consideration for such extension of credit or service, on the condition that the customer obtain some additional service from the institution or its affiliates or not obtain services of a competitor of the institution.
Federal Home Loan Bank System. Territorial Savings Bank is a member of the Federal Home Loan Bank System, which consists of twelve regional Federal Home Loan Banks. The Federal Home Loan Bank System provides a central credit facility primarily for member institutions as well as other entities involved in home mortgage lending. As a member of the Federal Home Loan Bank of Seattle, Territorial Savings Bank is required to acquire and hold shares of capital stock in the Federal Home Loan Bank. As of December 31, 2010, Territorial Savings Bank held $12.3 million of capital stock in the Federal Home Loan Bank of Seattle and was in compliance with this requirement.
18
Other Regulations
Interest and other charges collected or contracted for by Territorial Savings Bank are subject to state usury laws and federal laws concerning interest rates. Territorial Savings Bank’s operations are also subject to federal laws applicable to credit transactions, such as the:
| • | Truth-In-Lending Act, governing disclosures of credit terms to consumer borrowers; |
| • | Real Estate Settlement Procedures Act, requiring that borrowers for mortgage loans for one- to four-family residential real estate receive various disclosures, including good faith estimates of settlement costs, lender servicing and escrow account practices, and prohibiting certain practices that increase the cost of settlement services; |
| • | Home Mortgage Disclosure Act, requiring financial institutions to provide information to enable the public and public officials to determine whether a financial institution is fulfilling its obligation to help meet the housing needs of the community it serves; |
| • | Equal Credit Opportunity Act, prohibiting discrimination on the basis of race, creed or other prohibited factors in extending credit; |
| • | Fair Credit Reporting Act, governing the use and provision of information to credit reporting agencies; |
| • | Fair Debt Collection Act, governing the manner in which consumer debts may be collected by collection agencies; |
| • | Truth in Savings Act; and |
| • | rules and regulations of the various federal agencies charged with the responsibility of implementing such federal laws. |
The operations of Territorial Savings Bank also are subject to the:
| • | Right to Financial Privacy Act, which imposes a duty to maintain confidentiality of consumer financial records and prescribes procedures for complying with administrative subpoenas of financial records; |
| • | Electronic Funds Transfer Act and Regulation E promulgated thereunder, which govern automatic deposits to and withdrawals from deposit accounts and customers’ rights and liabilities arising from the use of automated teller machines and other electronic banking services; |
| • | Check Clearing for the 21st Century Act (also known as “Check 21”), which gives “substitute checks,” such as digital check images and copies made from that image, the same legal standing as the original paper check; |
| • | The USA PATRIOT Act, which requires savings banks to, among other things, establish broadened anti-money laundering compliance programs, due diligence policies and controls to ensure the detection and reporting of money laundering. Such required compliance programs are intended to supplement existing compliance requirements, also applicable to financial institutions, under the Bank Secrecy Act and the Office of Foreign Assets Control regulations; and |
19
| • | The Gramm-Leach-Bliley Act, which places limitations on the sharing of consumer financial information by financial institutions with unaffiliated third parties. Specifically, the Gramm-Leach-Bliley Act requires all financial institutions offering financial products or services to retail customers to provide such customers with the financial institution’s privacy policy and provide such customers the opportunity to “opt out” of the sharing of certain personal financial information with unaffiliated third parties. |
Holding Company Regulation
General. Territorial Bancorp Inc. is a non-diversified savings and loan holding company within the meaning of the Home Owners’ Loan Act. As such, Territorial Bancorp Inc. is registered with the Office of Thrift Supervision and subject to Office of Thrift Supervision regulations, examinations, supervision and reporting requirements. In addition, the Office of Thrift Supervision has enforcement authority over Territorial Bancorp Inc. and its subsidiaries. Among other things, this authority permits the Office of Thrift Supervision to restrict or prohibit activities that are determined to be a serious risk to the subsidiary savings institution. The Dodd-Frank Act regulatory restructuring transfers the responsibility for regulating and supervising savings and loan holding companies to the Federal Reserve Board. That will occur one year from the July 21, 2010 effective date of the Dodd-Frank Act, subject to a possible six month extension.
Permissible Activities. The business activities of Territorial Bancorp Inc. are generally limited to those activities permissible for financial holding companies under Section 4(k) of the Bank Holding Company Act of 1956, as amended, or for multiple savings and loan holding companies. A financial holding company may engage in activities that are financial in nature, including underwriting equity securities and insurance as well as activities that are incidental to financial activities or complementary to a financial activity. The Dodd-Frank Act added that any savings and loan holding company that engages in activities permissible for a financial holding company must meet the qualitative requirements for a bank holding company to be a financial holding company and conduct the activities in accordance with the requirements that would apply to a financial holding company’s conduct of the activity. A multiple savings and loan holding company is generally limited to activities permissible for bank holding companies under Section 4(c)(8) of the Bank Holding Company Act, subject to the prior approval of the Office of Thrift Supervision, and certain additional activities authorized by Office of Thrift Supervision regulations.
Federal law prohibits a savings and loan holding company, including Territorial Bancorp Inc., directly or indirectly, or through one or more subsidiaries, from acquiring more than 5% of another savings institution or holding company thereof, without prior written approval of the Office of Thrift Supervision. It also prohibits the acquisition or retention of, with certain exceptions, more than 5% of a non-subsidiary company engaged in activities that are not closely related to banking or financial in nature, or acquiring or retaining control of an institution that is not federally insured. In evaluating applications by holding companies to acquire savings institutions, the Office of Thrift Supervision must consider the financial and managerial resources, future prospects of the company and institution involved, the effect of the acquisition on the risk to the federal deposit insurance fund, the convenience and needs of the community and competitive factors.
The Office of Thrift Supervision is prohibited from approving any acquisition that would result in a multiple savings and loan holding company controlling savings institutions in more than one state, subject to two exceptions:
| (i) | the approval of interstate supervisory acquisitions by savings and loan holding companies; and |
20
| (ii) | the acquisition of a savings institution in another state if the laws of the state of the target savings institution specifically permit such acquisition. |
The states vary in the extent to which they permit interstate savings and loan holding company acquisitions.
Capital. Savings and loan holding companies are not currently subject to specific regulatory capital requirements. The Dodd-Frank Act, however, requires the Federal Reserve Board to promulgate consolidated capital requirements for depository institution holding companies that are no less stringent, both quantitatively and in terms of components of capital, than those applicable to institutions themselves. Instruments such as cumulative preferred stock and trust preferred securities will no longer be includable as Tier 1 capital, as is currently the case with bank holding companies. Instruments issued by May 19, 2010 will be grandfathered for companies with consolidated assets of $15 billion or less. There is a five-year transition period (from the July 21, 2010 effective date of the Dodd-Frank Act) before the capital requirements will apply to savings and loan holding companies.
Source of Strength. The Dodd-Frank Act also extends the “source of strength” doctrine to savings and loan holding companies. The regulatory agencies must issue regulations requiring that all bank and savings and loan holding companies serve as a source of strength to their subsidiary depository institutions by providing capital, liquidity and other support in times of financial stress.
Federal Securities Laws
Territorial Bancorp Inc.’s common stock is registered with the Securities and Exchange Commission under the Securities Exchange Act of 1934. Territorial Bancorp Inc. is subject to the information, proxy solicitation, insider trading restrictions and other requirements under the Securities Exchange Act of 1934.
Territorial Bancorp Inc. common stock held by persons who are affiliates (generally officers, directors and principal shareholders) of Territorial Bancorp Inc. may not be resold without registration or unless sold in accordance with certain resale restrictions. If Territorial Bancorp Inc. meets specified current public information requirements, each affiliate of Territorial Bancorp Inc. is able to sell in the public market, without registration, a limited number of shares in any three-month period.
Sarbanes-Oxley Act of 2002
The Sarbanes-Oxley Act of 2002 addresses, among other issues, corporate governance, auditing and accounting, executive compensation, and enhanced and timely disclosure of corporate information. We have prepared policies, procedures and systems designed to ensure compliance with the Sarbanes-Oxley Act and related regulations.
| ITEM 1A. | Risk Factors |
Future changes in interest rates could reduce our profits.
Our ability to make a profit largely depends on our net interest income, which could be negatively affected by changes in interest rates. Net interest income is the difference between:
| • | the interest income we earn on our interest-earning assets, such as loans and securities; and |
21
| • | the interest expense we pay on our interest-bearing liabilities, such as deposits and borrowings. |
As a result of our focus on one- to four-family residential real estate loans and the low demand for adjustable-rate loans in our market area, the interest rates we earn on our loans are generally fixed for long periods of time. Additionally, many of our securities investments are of long maturities with fixed interest rates. Like many savings institutions, our focus on deposit accounts as a source of funds, which have no stated maturity date or shorter contractual maturities than loans, results in our liabilities having a shorter duration than our assets. For example, as of December 31, 2010, 89.8% of our loans had maturities of 15 years or longer, while 72.5% of our certificates of deposits had maturities of one year or less. This imbalance can create significant earnings volatility, because market interest rates change over time. In a period of rising interest rates, the interest income earned on our assets, such as loans and investments, may not increase as rapidly as the interest paid on our liabilities, such as deposits. In a period of declining interest rates, the interest income earned on our assets may decrease more rapidly than the interest paid on our liabilities, as borrowers prepay mortgage loans and mortgage-backed securities, thereby requiring us to reinvest these cash flows at lower interest rates. See “Item 7. Management’s Discussion and Analysis of Financial Condition and Results of Operations—Management of Market Risk.”
In addition, changes in interest rates can affect the average life of loans and mortgage-backed and related securities. A reduction in interest rates results in increased prepayments of loans and mortgage-backed and related securities, as borrowers refinance their debt in order to reduce their borrowing costs. This creates reinvestment risk, which is the risk that we may not be able to reinvest prepayments at rates that are comparable to the rates we earned on the prepaid loans or securities. Additionally, increases in interest rates may decrease loan demand and/or make it more difficult for borrowers to repay adjustable-rate loans.
Changes in interest rates also affect the current fair value of our interest-earning securities portfolio. Generally, the value of securities moves inversely with changes in interest rates. At December 31, 2010, the fair value of our investment in held-to-maturity securities, totaled $546.8 million. Net unrealized gains on these securities totaled $16.3 million at December 31, 2010.
At December 31, 2010, the Office of Thrift Supervision “rate shock” analysis indicated that our net portfolio value (the difference between the present value of our assets and the present value of our liabilities) would decrease by $76.9 million if there was an instantaneous 200 basis point increase in market interest rates. See “Item 7. Management’s Discussion and Analysis of Financial Condition and Results of Operations—Management of Market Risk.”
Our lending activities provide lower interest rates than financial institutions that originate more commercial loans.
Our principal lending activity consists of originating one- to four-family residential real estate mortgage loans. As of December 31, 2010, these loans totaled $604.5 million, or 93.0% of total loans as of that date. We originate our loans with a focus on limiting credit risk and not to generate the highest return or create the greatest difference between our cost of funds and the yield on our interest-earning assets (interest rate spread).
Residential real estate mortgage loans generally have lower interest rates than commercial business loans, commercial real estate loans and consumer loans. As a result, we may generate lower interest rate spreads and rates of return when compared to our competitors who originate more consumer or commercial loans than we do. We intend to continue our focus on residential real estate lending.
22
We could record future losses on our holdings of trust preferred securities that we purchased from issuer pools consisting primarily of financial institution holding companies. In addition, we may not receive full future interest payments on these securities.
We own shares of trust preferred securities with an adjusted cost basis of $32,000, and a fair value of $128,000 at December 31, 2010. The trust preferred securities are debt obligations issued by two issuer pools (Preferred Term Securities XXIII, Ltd. co-marketed by Keefe, Bruyette & Woods, Inc. and FTN Financial Capital Markets (“PreTSL XXIII”) and Preferred Term Securities XXIV, Ltd. co-marketed by Keefe, Bruyette & Woods, Inc. and FTN Financial Capital Markets (“PreTSL XXIV”)), consisting primarily of holding companies for Federal Deposit Insurance Corporation-insured financial institutions. Each of these securities is a Class D security, and was originated with a credit rating of BBB. As of December 31, 2010, both PreTSL XXIII and PreTSL XXIV were rated C by Fitch. We recognized a pre-tax loss for other-than-temporary impairment of $2.5 million on PreTSL XXIV for the year ended December 31, 2008. In addition, effective January 1, 2009, the cumulative effect of our adoption of revisions to the Financial Accounting Standards Board Accounting Standards Codification (FASB ASC) resulted in the reclassification of $1.5 million of securities impairment from retained earnings to accumulated other comprehensive loss. In subsequent quarters, we determined that PreTSL XXIV was other-than-temporarily impaired and recorded an additional impairment charge of $1.0 million in 2009, of which $3.5 million was a credit loss recorded through our income statement as a charge to non-interest income, and $2.5 million was recorded as a decrease to other comprehensive loss. The $3.5 million impairment charge for 2009 includes the $2.5 million that was previously reflected as a charge against income in the last quarter of 2008. Due to revisions in accounting pronouncements, we were required to once again charge income in the amount of $2.5 million for the year ended December 31, 2009 for the same security. PreTSL XXIV has a book value of $0.
Our investment in PreTSL XXIII was determined to be other-than temporarily impaired as the present value of cash flows was lower than the amortized cost basis of the security. We recorded an impairment charge of $2.4 million in the year ended December 31, 2010. When the impairment charge of $2.4 million on PreTSL XXIII was recorded, the security was written down to its fair value of $32,000. The $1.1 million difference between the original outstanding principal balance of $3.5 million and the impairment charge of $2.4 million, was reported as other comprehensive loss and is related to non-credit factors such as an inactive trust preferred securities market.
It is reasonably possible that the fair value of PreTSL XXIII could decline in the near term if the overall economy and the financial condition of some of the issuers continue to deteriorate and the liquidity of these securities remains low. As a result, there is a risk that the Company’s remaining outstanding balance of $1.1 million in PreTSL XXIII could be credit-related other-than-temporarily impaired in the near term. The impairment could be material to the Company’s consolidated statement of income.
A number of factors or combinations of factors could cause us to conclude in one or more future reporting periods that an unrealized loss that exists with respect to PreTSL XXIII constitutes an impairment that is other than temporary, which could result in material losses to us. These factors include, but are not limited to, continued failure to make scheduled interest payments, an increase in the severity of the unrealized loss on a particular security, an increase in the continuous duration of the unrealized loss without an improvement in value or changes in market conditions and/or industry or issuer specific factors that would render us unable to forecast a full recovery in value. In addition, the fair value of PreTSL XXIII could decline if the overall economy and the financial condition of some of the issuers continue to deteriorate and there remains limited liquidity for these securities.
23
For the year ended December 31, 2010, we received no interest payments on the trust preferred securities. The continued failure of the trust preferred issuers to make interest payments for any quarter will reduce our earnings during that quarter.
The following table sets forth information with respect to these securities as of December 31, 2010:
| Pool Deal Name |
Book Value | Fair Value | Unrealized Gain (Loss) |
Credit Rating |
Number of Financial Institutions in Pool |
Deferrals and Defaults as a % of Collateral |
Excess Subordination (1) |
|||||||||||||||||||||
| (Dollars in Thousands) | ||||||||||||||||||||||||||||
| PreTSL XXIII |
$ | 32 | $ | 128 | $ | 96 | C | 117 | 27.3 | % | $ | 0 | ||||||||||||||||
| PreTSL XXIV |
$ | 0 | $ | 0 | $ | 0 | C | 83 | 38.5 | % | $ | 0 | ||||||||||||||||
| (1) | Estimated present value of future cash flows in excess of amortized cost basis, assuming that 50% of the security collateral is called in the 10th year following issuance. |
We have been negatively affected by current market and economic conditions. A continuation or worsening of these conditions could adversely affect our operations, financial condition and earnings.
The severe economic recession of 2008 and 2009 and the weak economic recovery since then have resulted in continued uncertainty in the financial markets and the expectation of weak general economic conditions, including high levels of unemployment, continuing through 2011. The resulting economic pressure on consumers and businesses has adversely affected our business, financial condition and results of operations. The credit quality of loan and investment securities portfolios has deteriorated at many financial institutions and the values of real estate collateral supporting many commercial loans and home mortgages have declined and may continue to decline. Financial companies’ stock prices have been negatively affected, as has the ability of banks and bank holding companies to raise capital or borrow in the debt markets. A continuation or worsening of these conditions could result in reduced loan demand and further increases in loan delinquencies, loan losses, loan loss provisions, costs associated with monitoring delinquent loans and disposing of foreclosed property, and otherwise negatively affect our operations, financial condition and earnings. Further, a decline in the stock market in general, or for stock of financial institutions and their holding companies, could affect our stock performance.
Changes in laws and regulations and the cost of regulatory compliance with new laws and regulations may adversely affect our operations and our income.
In response to the developments described above, Congress has taken actions that are intended to strengthen confidence and encourage liquidity in financial institutions, and the Federal Deposit Insurance Corporation has taken actions to increase insurance coverage on deposit accounts. In addition, there have been proposals made by members of Congress and others that would reduce the amount distressed borrowers are otherwise contractually obligated to pay under their mortgage loans and limit an institution’s ability to foreclose on mortgage collateral.
24
The potential exists for additional federal or state laws and regulations, or changes in policy, regarding lending and funding practices and liquidity standards, and bank regulatory agencies are expected to be active in responding to concerns and trends identified in examinations, including the expected issuance of many formal enforcement orders. Bank regulatory agencies, such as the Office of Thrift Supervision and the Federal Deposit Insurance Corporation, govern the activities in which we may engage, primarily for the protection of depositors, and not for the protection or benefit of potential investors. In addition, new laws, regulations, and other regulatory changes may increase our costs of regulatory compliance and of doing business, and otherwise affect our operations. New laws, regulations, and other regulatory changes may significantly affect the markets in which we do business, the markets for and value of our loans and investments, and our ongoing operations, costs and profitability. Federal and state proposals limiting our rights as a creditor could result in credit losses or increased expense in pursuing our remedies as a creditor.
The Federal Home Loan Bank of Seattle has entered into a consent order with the Federal Housing Finance Agency. If our investment in the Federal Home Loan Bank of Seattle is classified as other-than-temporarily impaired or as permanently impaired, our earnings and stockholders’ equity could decrease.
We own common stock of the Federal Home Loan Bank of Seattle. We hold this stock to qualify for membership in the Federal Home Loan Bank System and to be eligible to borrow funds under the Federal Home Loan Bank of Seattle’s advance program. The aggregate cost and fair value of our Federal Home Loan Bank of Seattle common stock as of December 31, 2010 was $12.3 million based on its par value. There is no market for our Federal Home Loan Bank of Seattle common stock.
On October 25, 2010, the Federal Home Loan Bank of Seattle entered into a consent order with the Federal Housing Finance Agency (“the FHFA”), which requires the Federal Home Loan Bank of Seattle to take certain specified actions related to its business and operations. Following the filing of the Federal Home Loan Bank of Seattle’s second quarter 2011 quarterly report on Form 10-Q with the Securities and Exchange Commission, and once the Federal Home Loan Bank of Seattle reaches and maintains certain thresholds, the bank may begin repurchasing member capital stock at par. Further, the Federal Home Loan Bank of Seattle may again be in position to redeem certain capital stock from members and begin paying dividends once the bank:
| • | Achieves and maintains certain other financial and operational metrics; |
| • | Remediates certain concerns regarding its oversight and management, asset improvement program, capital adequacy and retained earnings, risk management, compensation practices, examination findings, and information technology; and |
| • | Returns to a “safe and sound” condition as determined by the FHFA. |
Any stock repurchases and redemptions and dividend payments will be subject to FHFA approval.
There continues to be a risk that the Federal Home Loan Bank of Seattle may not be permitted to redeem certain capital stock from members and begin paying dividends in the future, and that our investment in Federal Home Loan Bank of Seattle common stock could be impaired at some time in the future. If this occurs, it would cause our earnings and stockholders’ equity to decrease by the after-tax amount of the impairment charge.
25
Non-residential real estate loans increase our exposure to credit risks.
At December 31, 2010, our portfolio of commercial real estate, construction and other non-residential real estate loans totaled $14.4 million, or 2.2% of total loans. These loans generally expose us to a greater risk of non-payment and loss than residential real estate loans because repayment of such loans often depends on the successful operations and income stream of the borrowers. Additionally, such loans typically involve larger loan balances to single borrowers or groups of related borrowers compared to residential real estate loans.
We target our business lending and marketing strategy towards small to medium-sized businesses. These small to medium-sized businesses generally have fewer financial resources in terms of capital or borrowing capacity than larger entities. If general economic conditions negatively impact these businesses, our results of operations and financial condition may be adversely affected.
Strong competition within our market areas may limit our growth and profitability.
Competition in the banking and financial services industry is intense. In our market areas, we compete with commercial banks, savings institutions, mortgage brokerage firms, credit unions, finance companies, mutual funds, insurance companies, and brokerage and investment banking firms operating locally. Some of our competitors have greater name recognition and market presence that benefit them in attracting business, and offer certain services that we do not or cannot provide. In addition, larger competitors may be able to price loans and deposits more aggressively than we do, which could affect our ability to grow and remain profitable on a long-term basis. Our profitability depends upon our continued ability to successfully compete in our market areas. If we must raise interest rates paid on deposits or lower interest rates charged on our loans, our net interest margin and profitability could be adversely affected. For additional information see “Item 1. Business—Competition.”
If our allowance for loan losses is not sufficient to cover actual loan losses, our earnings will decrease.
We make various assumptions and judgments about the collectability of our loan portfolio, including the creditworthiness of our borrowers and the value of the real estate and other assets serving as collateral for the repayment of many of our loans. In determining the amount of the allowance for loan losses, we review our loans and our loss and delinquency experience, and we evaluate economic conditions. If our assumptions are incorrect, our allowance for loan losses may not be sufficient to cover probable incurred losses in our loan portfolio, resulting in additions to our allowance. While our allowance for loan losses was 0.2% of total loans at December 31, 2010, material additions to our allowance could materially decrease our net income.
In addition, bank regulators periodically review our allowance for loan losses and may require us to increase our provision for loan losses or recognize further loan charge-offs. Any increase in our allowance for loan losses or loan charge-offs as required by these regulatory authorities might have a material adverse effect on our financial condition and results of operations.
Our 2010 Equity Incentive Plan will increase our expenses and reduce our income, and may dilute your ownership interests.
In August 2010, our stockholders approved the Territorial Bancorp, Inc. 2010 Equity Incentive Plan. Stockholders approved the issuance of 736,434 shares of common stock pursuant to restricted stock and the issuance of 976,203 shares of common stock pursuant to stock options. During 2010, we recognized $1.0 million in non-interest expense relating to this stock benefit plan, and we expect to incur similar expenses in the future. The actual amount of future expenses may be greater on an annual basis.
26
We may fund the 2010 Equity Incentive Plan either through open market purchases or from the issuance of authorized but unissued shares of common stock. Our ability to repurchase shares of common stock to fund this plan will be subject to many factors, including, but not limited to, applicable regulatory restrictions on stock repurchases, the availability of stock in the market, the trading price of the stock, our capital levels, alternative uses for our capital and our financial performance. Our intention is to fund the plan through open market purchases and we have purchased 55,707 shares as of December 31, 2010. However, stockholders would experience a 12.0% reduction in ownership interest in the event newly issued shares of our common stock are used to fund stock options and shares of restricted common stock beyond the shares we have already repurchased.
Concentration of loans in our primary market area, which has recently experienced an economic downturn, may increase risk.
Our success depends primarily on the general economic conditions in the State of Hawaii, as nearly all of our loans are to customers in the state. Accordingly, the local economic conditions in the State of Hawaii have a significant impact on the ability of borrowers to repay loans as well as our ability to originate new loans. As such, a decline in real estate valuations in this market would lower the value of the collateral securing those loans. In addition, a significant weakening in general economic conditions such as inflation, recession, unemployment or other factors beyond our control could negatively affect our financial results.
The number of existing single-family homes and condominium units sold in 2010 have increased compared to 2009 but real estate prices on some islands have declined. Home prices have not declined as severely as those reported on the mainland.
On the island of Oahu, the primary real estate market in Hawaii, sales of existing single-family homes totaled 3,051 units for the year ended December 2010, an increase of 13.4% compared to sales in 2009. The number of condominium sales, a notable portion of the overall housing market, grew by 10.3% in 2010 compared to 2009. The median price paid on Oahu for a single-family home in 2010 was $587,000, an increase of 5.8% compared to the median price in 2009. The median price paid on Oahu for condominiums in 2010 was $303,000, an increase of 0.2% compared to the median price in 2009.
On the island of Maui, the second largest real estate market in Hawaii, sales of existing single-family homes totaled 814 units in 2010, an increase of 17.5% compared to similar sales during 2009. The number of condominium sales increased by 38.9% in 2010 compared to 2009. The median price paid for a single-family home on Maui in 2010 was $460,000, a decrease of 7.7% compared to the median price in 2009. The median price paid on Maui for condominiums in 2010 was $377,500, a 16.1% decrease compared to the median price in 2009.
The slowing Hawaiian economy has caused an increase in foreclosure and bankruptcy filings. There were 12,425 mortgage foreclosure cases in Hawaii in 2010, a 38% increase from 2009. In 2010, Hawaii had the 13th highest number of foreclosure filings per household among the 50 states. In 2010 there were 3,954 bankruptcy filings, an increase of 28% compared to the number of filings in 2009.
Our local economy relies heavily on the tourism industry. Downturns in this industry could affect our operations and results.
Tourism is one of the two largest components of Hawaii’s economy. The Hawaii Department of Business, Economic Development and Tourism reported a 9.6% increase in tourists for the month of December 2010 compared to December 2009. Tourism grew by 8.7% in 2010 compared to 2009. A downturn in the tourism industry, and the related loss of jobs or operating income for businesses, could have a significant impact on our ability to originate loans, and the ability of borrowers to repay loans, either of which could adversely affect our financial condition and results of operations.
27
We are subject to extensive regulatory oversight.
We and our subsidiaries are subject to extensive regulation and supervision. Regulators have intensified their focus on bank lending criteria and controls, and on the USA PATRIOT Act’s anti-money laundering and Bank Secrecy Act compliance requirements. There also is increased scrutiny of our compliance practices generally and particularly with the rules enforced by the Office of Foreign Assets Control. Our failure to comply with these and other regulatory requirements could lead to, among other remedies, administrative enforcement actions and legal proceedings. In addition, the Dodd-Frank Act and implementing regulations are likely to have a significant effect on the financial services industry, which are likely to increase operating costs and reduce profitability. Regulatory or legislative changes could make regulatory compliance more difficult or expensive for us, and could cause us to change or limit some of our products and services, or the way we operate our business.
Severe weather, natural disasters and other external events could significantly affect our operations and results.
Because all of our office locations are located in the State of Hawaii, severe weather or natural disasters, such as tsunamis, hurricanes and earthquakes and other adverse external events could have a significant effect on our ability to conduct business. Such events could affect the stability of our deposit base, impair the ability of borrowers to repay outstanding loans, impair the value of collateral securing loans, cause significant property damage, result in loss of revenue and/or cause us to incur additional expenses. Accordingly, the occurrence of any such event could have a material adverse effect on our business, which, in turn, could adversely affect our financial condition and results of operations.
Higher Federal Deposit Insurance Corporation insurance premiums and special assessments will adversely affect our earnings.
On May 22, 2009, the Federal Deposit Insurance Corporation adopted a final rule levying a five basis point special assessment on each insured depository institution's assets minus Tier 1 capital as of June 30, 2009. We recorded an expense of $689,000 during the quarter ended June 30, 2009, to reflect the special assessment. Any further special assessments that the Federal Deposit Insurance Corporation levies will be recorded as an expense during the appropriate period. In addition, the Federal Deposit Insurance Corporation increased the general deposit insurance assessment rate and, therefore, our Federal Deposit Insurance Corporation insurance premium expense will increase compared to prior periods.
The Federal Deposit Insurance Corporation also adopted a rule pursuant to which all insured depository institutions were required to prepay their estimated assessments for the fourth quarter of 2009, and for all of 2010, 2011 and 2012. The prepayment amount was collected on December 30, 2009. The assessment rate for the fourth quarter of 2009 and for 2010 is based on each institution’s total base assessment rate for the third quarter of 2009, modified to assume that the assessment rate in effect on September 30, 2009 had been in effect for the entire third quarter, and the assessment rate for 2011 and 2012 will be equal to the modified third quarter assessment rate plus an additional three basis points. In addition, each institution’s base assessment rate for each period will be calculated using its third quarter assessment base, adjusted quarterly for an estimated 5% annual growth rate in the assessment base through the end of 2012. We recorded the pre-payment as a prepaid expense, which will be amortized to expense over three years. Based on our deposits and assessment rate as of September 30, 2009, our prepayment amount was $4.3 million.
28
Financial reform legislation recently enacted by Congress will, among other things, eliminate the Office of Thrift Supervision, tighten capital standards, create a new Consumer Financial Protection Bureau and result in new laws and regulations that are expected to increase our costs of operations.
Congress recently enacted the Dodd-Frank Wall Street Reform and Consumer Protection Act (the “Dodd-Frank Act”). This new law will significantly change the current bank regulatory structure and affect the lending, deposit, investment, trading and operating activities of financial institutions and their holding companies. The Dodd-Frank Act requires various federal agencies to adopt a broad range of new implementing rules and regulations, and to prepare numerous studies and reports for Congress. The federal agencies are given significant discretion in drafting the implementing rules and regulations, and consequently, many of the details and much of the impact of the Dodd-Frank Act may not be known for many months or years.
Certain provisions of the Dodd-Frank Act are expected to have a near term effect on us. For example, the new law provides that the Office of Thrift Supervision, which currently is the primary federal regulator for Territorial Bancorp Inc. and its subsidiary, Territorial Savings Bank, will cease to exist one year from the date of the new law’s enactment. The Office of the Comptroller of the Currency, which is currently the primary federal regulator for national banks, will become the primary federal regulator for federal thrifts. The Board of Governors of the Federal Reserve System will supervise and regulate all savings and loan holding companies that were formerly regulated by the Office of Thrift Supervision, including Territorial Bancorp Inc.
Also effective one year after the date of enactment is a provision of the Dodd-Frank Act that eliminates the federal prohibitions on paying interest on demand deposits, thus allowing businesses to have interest bearing checking accounts. Depending on competitive responses, this significant change to existing law could have an adverse effect on our interest expense.
The Dodd-Frank Act also broadens the base for Federal Deposit Insurance Corporation insurance assessments. Assessments will now be based on the average consolidated total assets less tangible equity capital of a financial institution. The Dodd-Frank Act also permanently increases the maximum amount of deposit insurance for banks, savings institutions and credit unions to $250,000 per depositor, retroactive to January 1, 2009, and non-interest bearing transaction accounts have unlimited deposit insurance through December 31, 2013.
The Dodd-Frank Act will require publicly traded companies to give stockholders a non-binding vote on executive compensation and so-called “golden parachute” payments, and authorize the Securities and Exchange Commission to promulgate rules that would allow stockholders to nominate their own candidates using a company’s proxy materials. The legislation also directs the Federal Reserve Board to promulgate rules prohibiting excessive compensation paid to bank holding company executives, regardless of whether the company is publicly traded or not.
The Dodd-Frank Act creates a new Consumer Financial Protection Bureau with broad powers to supervise and enforce consumer protection laws. The Consumer Financial Protection Bureau has broad rule-making authority for a wide range of consumer protection laws that apply to all banks and savings institutions, including the authority to prohibit “unfair, deceptive or abusive” acts and practices. The Consumer Financial Protection Bureau has examination and enforcement authority over all banks and savings institutions with more than $10 billion in assets. Banks and savings institutions with $10 billion or less in assets will be examined by their applicable bank regulators. The Dodd-Frank Act also weakens the federal preemption rules that have been applicable for national banks and federal savings associations, and gives state attorneys general the ability to enforce federal consumer protection laws.
29
It is difficult to predict at this time what specific impact the Dodd-Frank Act and the yet to be written implementing rules and regulations will have on community banks. However, it is expected that at a minimum they will increase our operating and compliance costs and could increase our interest expense.
Our ability to originate mortgage loans may be adversely affected by the retructuring of Freddie Mac and Fannie Mae.
Both Fannie Mae and Freddie Mac are under conservatorship with the Federal Housing Finance Agency, an agency of the U.S. government. On February 11, 2011, the Obama administration presented the U.S. Congress with a report of its proposals for reforming America’s housing finance market with the goal of scaling back the role of the U.S. government in, and promoting the return of private capital to, the mortgage markets and ultimately winding down Fannie Mae and Freddie Mac. Without mentioning a specific time frame, the report calls for the reduction of the role of Fannie Mae and Freddie Mac in the mortgage markets by, among other things, reducing conforming loan limits, increasing guarantee fees and requiring larger down payments by borrowers. The report presents three options for the long-term structure of housing finance, all of which call for the unwinding of Fannie Mae and Freddie Mac and a reduced role of the government in the mortgage market: (i) a system with U.S. government insurance limited to a narrowly targeted group of lower- and moderate-income borrowers; (ii) a system similar to (i) above except with an expanded guarantee during times of crisis; and (iii) a system where the U.S. government offers reinsurance for the securities of a broad range of mortgages behind significant private capital. We cannot be certain if or when Fannie Mae and Freddie Mac will be wound down, if or when reform of the housing finance market will be implemented or what the future role of the U.S. government will be in the mortgage market, and, accordingly, we will not be able to determine the impact that any such reform may have on us until a definitive reform plan is adopted.
Government responses to economic conditions may adversely affect our operations, financial condition and earnings.
Newly enacted financial reform legislation will change the bank regulatory framework, create an independent consumer protection bureau that will assume the consumer protection responsibilities of the various federal banking agencies, and establish more stringent capital standards for banks and bank holding companies. The legislation will also result in new regulations affecting the lending, funding, trading and investment activities of banks and bank holding companies. Bank regulatory agencies also have been responding aggressively to concerns and adverse trends identified in examinations. Ongoing uncertainty and adverse developments in the financial services industry and the domestic and international credit markets, and the effect of new legislation and regulatory actions in response to these conditions, may adversely affect our operations by restricting our business activities, including our ability to originate or sell loans, modify loan terms, or foreclose on property securing loans. These measures are likely to increase our costs of doing business and may have a significant adverse effect on our lending activities, financial performance and operating flexibility. In addition, these risks could affect the performance and value of our loan and investment securities portfolios, which also would negatively affect our financial performance.
Furthermore, the Board of Governors of the Federal Reserve System, in an attempt to help the overall economy, has, among other things, kept interest rates low through its targeted federal funds rate and the purchase of mortgage-backed securities. If the Federal Reserve Board increases the federal funds rate, overall interest rates will likely rise, which may negatively impact the housing markets and the U.S. economic recovery. In addition, deflationary pressures, while possibly lowering our operating costs, could have a significant negative effect on our borrowers, especially our business borrowers, and the values of underlying collateral securing loans, which could negatively affect our financial performance.
30
System failure or breaches of our network security could subject us to increased operating costs as well as litigation and other liabilities.
The computer systems and network infrastructure we use could be vulnerable to unforeseen problems. Our operations are dependent upon our ability to protect our computer equipment against damage from physical theft, fire, power loss, telecommunications failure or a similar catastrophic event, as well as from security breaches, denial of service attacks, viruses, worms and other disruptive problems caused by hackers. Any damage or failure that causes an interruption in our operations could have a material adverse effect on our financial condition and results of operations. Computer break-ins, phishing and other disruptions could also jeopardize the security of information stored in and transmitted through our computer systems and network infrastructure, which may result in significant liability to us and may cause existing and potential customers to refrain from doing business with us. Although we, with the help of third-party service providers, intend to continue to implement security technology and establish operational procedures to prevent such damage, there can be no assurance that these security measures will be successful. In addition, advances in computer capabilities, new discoveries in the field of cryptography or other developments could result in a compromise or breach of the algorithms we and our third-party service providers use to encrypt and protect customer transaction data. A failure of such security measures could have a material adverse effect on our financial condition and results of operations.
Our stock value may be negatively affected by federal regulations that restrict takeovers.
For three years following our stock offering, Office of Thrift Supervision regulations prohibit any person from acquiring or offering to acquire more than 10% of our common stock without the prior written approval of the Office of Thrift Supervision.
The corporate governance provisions in our articles of incorporation and bylaws, and the corporate governance provisions under Maryland law, may prevent or impede the holders of our common stock from obtaining representation on our Board of Directors and may impede takeovers of the company that our board might conclude are not in the best interest of Territorial Bancorp Inc. or its stockholders.
Provisions in our articles of incorporation and bylaws may prevent or impede holders of our common stock from obtaining representation on our Board of Directors and may make takeovers of Territorial Bancorp Inc. more difficult. For example, our Board of Directors is divided into three staggered classes. A classified board makes it more difficult for stockholders to change a majority of the directors because it generally takes at least two annual elections of directors for this to occur. Our articles of incorporation include a provision that no person will be entitled to vote any shares of our common stock in excess of 10% of our outstanding shares of common stock. This limitation does not apply to the purchase of shares by a tax-qualified employee stock benefit plan established by us. In addition, our articles of incorporation and bylaws restrict who may call special meetings of stockholders and how directors may be removed from office. Additionally, in certain instances, the Maryland General Corporation Law requires a supermajority vote of our stockholders to approve a merger or other business combination with a large stockholder, if the proposed transaction is not approved by a majority of our directors.
31
Legislative proposals would increase our state income taxes.
Recent legislative proposals in the State of Hawaii would increase taxes and other expenses paid by companies like Territorial Bancorp Inc., including increased taxes on banks and other financial corporations, the application of excise taxes on proceeds from bank owned life insurance, and the imposition of other fees on financial institutions. If adopted, these proposals would increase our taxes and other non-interest expenses and reduce our net income.
| ITEM 1B. | Unresolved Staff Comments |
Not applicable.
32
| ITEM 2. | Properties |
We operate from our corporate office in Honolulu, Hawaii, and from our 26 full-service branches located in the State of Hawaii. The net book value of our premises, land and equipment was $5.4 million at December 31, 2010. The following table sets forth information with respect to our full-service banking offices, including the expiration date of leases with respect to leased facilities.
| ALA MOANA CENTER 1450 Ala Moana Boulevard Honolulu, Oahu 96814 12/31/2017 |
KAIMUKI 1108 12th Avenue Honolulu, Oahu 96816 12/31/2018 |
KIHEI Azeka Shopping Center 1279 South Kihei Road Kihei, Maui 96753 1/31/2019 |
PEARLRIDGE 98-084
Kamehameha Aiea, Oahu 96701 6/30/2012 | |||
| DOWNTOWN 1000 Bishop Street Honolulu, Oahu 96813 12/31/2020 |
KALIHI-KAPALAMA 1199 Dillingham Boulevard Honolulu, Oahu 96817 8/31/2012 |
KONA Crossroads Shopping Center 75-1027 Henry Street Kailua-Kona, Hawaii 96740 8/31/2015 |
PIIKOI 1159 South Beretania Street Honolulu, Oahu 96814 12/31/2020 | |||
| HAWAII KAI Hawaii Kai Shopping Center 377 Keahole Street Honolulu, Oahu 96825 9/30/2013 |
KAMEHAMEHA 1620 North School Street Honolulu, Oahu 96817 9/30/2015 |
LAHAINA Old Lahaina Center 170 Papalaua Street Lahaina, Maui 96761 3/31/2013 |
SALT LAKE Salt Lake Shopping Center 848 Ala Lilikoi Street Honolulu, Oahu 96818 1/31/2011 (lease is
currently | |||
| HILO Waiakea Center 315 Makaala Street Hilo, Hawaii 96720 12/31/2018 |
KANEOHE 46-005 Kawa Street Kaneohe, Oahu 96744 12/31/2014 |
McCULLY 1111 McCully Street Honolulu, Oahu 96826 5/31/2013 |
WAIPAHU Waipahu Town Center 94-050 Farrington Highway Waipahu, Oahu 96797 12/31/2014 | |||
| KAHALA 4819 Kilauea Avenue Honolulu, Oahu 96816 3/16/2015 |
KAPAHULU Kilohana Square 1016 Kapahulu Avenue Honolulu, Oahu 96816 11/14/2013 |
MILILANI Town Center of Mililani 95-1249 Meheula Parkway Mililani, Oahu 96789 10/11/2014 |
WAIPIO Laniakea Plaza 94-1221 Ka Uka Boulevard Waipahu, Oahu 96797 9/30/2016 | |||
| KAHULUI Kaahumanu Center 275 W. Kaahumanu Avenue Kahului, Maui 96732 12/31/2019 |
KAPOLEI Ace Center at Kapolei 480 Kamokila Boulevard Kapolei, Oahu 96707 7/31/2014 |
NUUANU Nuuanu Shopping Center 1613 Nuuanu Avenue Honolulu, Oahu 96817 7/22/2016 |
||||
| KAILUA 19 Oneawa Street Kailua, Oahu 96734 |
KAUAI Kukui Grove Shopping Center 4393 Kukui Grove Street Lihue, Kauai 96766 2/28/2013 |
PEARL CITY Pearl City Shopping Center 850 Kamehameha Highway Pearl City, Oahu 96782 9/22/2014 |
||||
| ITEM 3. | Legal Proceedings |
From time to time, we are involved as plaintiff or defendant in various legal proceedings arising in the ordinary course of business. Except as previously disclosed, at December 31, 2010, we were not involved in any legal proceedings, the outcome of which would be material to our financial condition or results of operations.
33
| ITEM 4. | [Reserved] |
| ITEM 5. | Market for Registrant’s Common Equity, Related Stockholder Matters and Issuer Purchases of Equity Securities |
(a) Market, Holder and Dividend Information. Our common stock is traded on the NASDAQ Global Select Market under the symbol “TBNK.” The approximate number of holders of record of Territorial Bancorp Inc.’s common stock as of February 28, 2011 was 1,348. Certain shares of Territorial Bancorp Inc. are held in “nominee” or “street” name and accordingly, the number of beneficial owners of such shares is not known or included in the foregoing number. The following table presents quarterly market information for Territorial Bancorp Inc.’s common stock for the period beginning July 10, 2009 (the date of completion of our initial public offering) and ended December 31, 2010. The following information with respect to high and low closing prices was provided by the NASDAQ Global Select Market:
| High | Low | Dividends Declared Per Share |
||||||||||
| Year Ended December 31, 2010 |
||||||||||||
| Quarter ended December 31, 2010 |
$ | 20.19 | $ | 16.74 | $ | 0.07 | ||||||
| Quarter ended September 30, 2010 |
$ | 19.04 | $ | 16.57 | $ | 0.07 | ||||||
| Quarter ended June 30, 2010 |
$ | 20.66 | $ | 18.22 | $ | 0.05 | ||||||
| Quarter ended March 31, 2010 |
$ | 21.17 | $ | 17.72 | $ | 0.05 | ||||||
| Year Ended December 31, 2009 |
||||||||||||
| Quarter ended December 31, 2009 |
$ | 18.85 | $ | 15.69 | — | |||||||
| Quarter ended September 30, 2009 |
$ | 16.23 | $ | 10.00 | — | |||||||
Dividend payments by Territorial Bancorp Inc. are dependent on dividends it receives from Territorial Savings Bank, because Territorial Bancorp Inc. has no source of income other than dividends from Territorial Savings Bank, earnings from the investment of proceeds from the sale of shares of common stock retained by Territorial Bancorp Inc. and interest payments with respect to Territorial Bancorp Inc.’s loan to the Employee Stock Ownership Plan. See “Item 1. Business—Supervision and Regulation—Federal Banking Regulation—Capital Distributions.”
(b) Sales of Unregistered Securities. Not applicable.
(c) Use of Proceeds. Not applicable.
(d) Securities Authorized for Issuance Under Equity Compensation Plans. See “Item 12. Security Ownership of Certain Beneficial Owners and Management and Related Stockholder Matters.”
34
(e) Stock Repurchases. The following table sets forth information in connection with repurchases of our shares of common stock during the fourth quarter of 2010:
| Period |
Total Number of Shares Purchased |
Average Price Paid per Share |
Total Number of Shares Purchased as Part of Publicly Announced Plans or Programs |
Maximum Number of Shares That May Yet be Purchased Under the Plans or Programs (1) |
||||||||||||
| October 1, 2010 through October 31, 2010 |
— | $ | — | — | 733,988 | |||||||||||
| November 1, 2010 through November 30, 2010 |
27,104 | 18.23 | 27,104 | 706,884 | ||||||||||||
| December 1, 2010 through December 31, 2010 |
28,603 | 18.63 | 28,603 | 678,281 | ||||||||||||
| Total |
55,707 | $ | 18.44 | 55,707 | 678,281 | |||||||||||
| (1) | On September 22, 2010, our Board of Directors authorized the repurchase of up to 733,988 shares of our common stock. In accordance with this authorization, we had repurchased 55,707 shares of our common stock as of December 31, 2010. This repurchase authorization has no expiration date. |
(f) Stock Performance Graph. Set forth hereunder is a stock performance graph comparing (a) the cumulative total return on our shares of common stock between July 13, 2009 and December 31, 2010, (b) the cumulative total return on stocks included in the Total Return Index for the NASDAQ Stock Market (US) over such period, and (c) the cumulative total return on stocks included in the NASDAQ Bank Index over such period. Cumulative return assumes the reinvestment of dividends, and is expressed in dollars based on an assumed investment of $100.
There can be no assurance that the Company’s stock performance will continue in the future with the same or similar trend depicted in the graph. The Company will not make or endorse any predictions as to future stock performance.
35
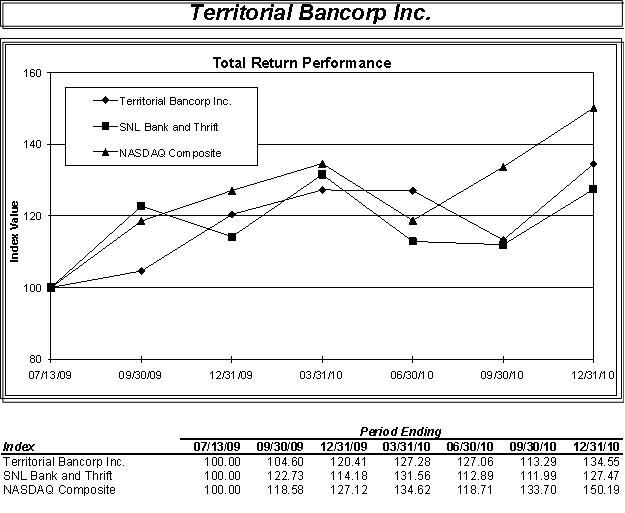
36
| ITEM 6. | Selected Financial Data |
The following selected consolidated financial and other data has been derived, in part, from the consolidated financial statements and notes appearing elsewhere in this annual report.
| At December 31, | ||||||||||||||||||||
| 2010 | 2009 | 2008 | 2007 | 2006 | ||||||||||||||||
| (In thousands) | ||||||||||||||||||||
| Selected Financial Condition Data: |
||||||||||||||||||||
| Total assets |
$ | 1,443,412 | $ | 1,389,612 | $ | 1,224,446 | $ | 1,162,018 | $ | 1,299,783 | ||||||||||
| Cash and cash equivalents |
194,435 | 135,953 | 11,216 | 19,755 | 88,512 | |||||||||||||||
| Investment securities held to maturity |
530,555 | 598,394 | 527,767 | 538,025 | 621,339 | |||||||||||||||
| Loans receivable, net |
641,790 | 597,700 | 633,160 | 554,795 | 546,201 | |||||||||||||||
| Bank owned life insurance |
29,266 | 28,249 | 27,107 | 26,068 | 20,026 | |||||||||||||||
| Federal Home Loan Bank of Seattle stock, at cost |
12,348 | 12,348 | 12,348 | 12,348 | 12,348 | |||||||||||||||
| Deposits |
1,076,470 | 1,014,668 | 923,914 | 892,316 | 981,354 | |||||||||||||||
| Federal Home Loan Bank of Seattle advances |
10,000 | — | 35,791 | 72,000 | 100,000 | |||||||||||||||
| Securities sold under agreements to repurchase |
105,200 | 130,200 | 115,200 | 55,200 | 60,545 | |||||||||||||||
| Subordinated debentures |
— | — | 24,221 | 24,199 | 24,178 | |||||||||||||||
| Stockholders’ equity |
227,359 | 219,671 | 99,381 | 92,479 | 86,829 | |||||||||||||||
| Years Ended December 31, | ||||||||||||||||||||
| 2010 | 2009 | 2008 | 2007 | 2006 | ||||||||||||||||
| (In thousands) | ||||||||||||||||||||
| Selected Operating Data: |
||||||||||||||||||||
| Interest and dividend income |
$ | 61,115 | $ | 61,525 | $ | 61,220 | $ | 60,947 | $ | 61,887 | ||||||||||
| Interest expense |
14,828 | 19,984 | 25,247 | 32,368 | 28,836 | |||||||||||||||
| Net interest income |
46,287 | 41,541 | 35,973 | 28,579 | 33,051 | |||||||||||||||
| Provision for loan losses |
345 | 1,198 | 149 | 25 | 6 | |||||||||||||||
| Net interest and dividend income after provision for loan losses |
45,942 | 40,343 | 35,824 | 28,554 | 33,045 | |||||||||||||||
| Non-interest income |
2,128 | 2,505 | 2,173 | 3,876 | 4,013 | |||||||||||||||
| Non-interest expense |
31,530 | 29,545 | 27,003 | 24,047 | 25,100 | |||||||||||||||
| Income before income taxes |
16,540 | 13,303 | 10,994 | 8,383 | 11,958 | |||||||||||||||
| Income taxes |
5,512 | 4,639 | 3,794 | 2,615 | 4,247 | |||||||||||||||
| Net income |
$ | 11,028 | $ | 8,664 | $ | 7,200 | $ | 5,768 | $ | 7,711 | ||||||||||
37
| At or For the Years Ended December 31, | ||||||||||||||||||||
| 2010 | 2009 | 2008 | 2007 | 2006 | ||||||||||||||||
| Selected Financial Ratios and Other Data: |
||||||||||||||||||||
| Performance Ratios: |
||||||||||||||||||||
| Return on average assets (ratio of net income to average total assets) |
0.77 | % | 0.66 | % | 0.60 | % | 0.48 | % | 0.62 | % | ||||||||||
| Return on average equity (ratio of net income to average equity) |
4.91 | % | 5.50 | % | 7.37 | % | 6.35 | % | 8.93 | % | ||||||||||
| Interest rate spread (1) |
3.14 | % | 3.04 | % | 2.95 | % | 2.25 | % | 2.60 | % | ||||||||||
| Net interest margin (2) |
3.35 | % | 3.26 | % | 3.14 | % | 2.48 | % | 2.78 | % | ||||||||||
| Efficiency ratio (3) |
65.12 | % | 67.08 | % | 70.79 | % | 74.09 | % | 67.72 | % | ||||||||||
| Non-interest expense to average total assets |
2.20 | % | 2.24 | % | 2.25 | % | 2.01 | % | 2.03 | % | ||||||||||
| Average interest-earning assets to average interest-bearing liabilities |
119.19 | % | 114.30 | % | 108.71 | % | 108.16 | % | 107.18 | % | ||||||||||
| Average equity to average total assets |
15.69 | % | 11.93 | % | 8.15 | % | 7.58 | % | 6.99 | % | ||||||||||
| Basic earnings per share (4) |
$ | 0.97 | $ | 0.77 | N/A | N/A | N/A | |||||||||||||
| Diluted earnings per share (4) |
$ | 0.97 | $ | 0.77 | N/A | N/A | N/A | |||||||||||||
| Dividend payout ratio |
24.74 | % | N/A | N/A | N/A | N/A | ||||||||||||||
| Asset Quality Ratios: |
||||||||||||||||||||
| Non-performing assets to total assets |
0.06 | % | 0.05 | % | 0.02 | % | 0.01 | % | 0.05 | % | ||||||||||
| Non-performing loans to total loans |
0.12 | % | 0.09 | % | 0.02 | % | 0.02 | % | 0.11 | % | ||||||||||
| Allowance for loan losses to non-performing loans |
184.16 | % | 323.27 | % | 603.36 | % | 724.53 | % | 129.51 | % | ||||||||||
| Allowance for loan losses to total loans |
0.23 | % | 0.28 | % | 0.14 | % | 0.14 | % | 0.14 | % | ||||||||||
| Capital Ratios (bank-level only): |
||||||||||||||||||||
| Total capital (to risk-weighted assets) |
43.06 | % | 37.18 | % | 24.97 | % | 25.33 | % | 23.57 | % | ||||||||||
| Tier I capital (to risk-weighted assets) |
42.75 | % | 36.85 | % | 24.82 | % | 25.17 | % | 23.41 | % | ||||||||||
| Tier I capital (to total assets) |
14.02 | % | 13.67 | % | 9.89 | % | 9.83 | % | 8.39 | % | ||||||||||
| Other Data: |
||||||||||||||||||||
| Number of full service offices |
26 | 25 | 24 | 24 | 24 | |||||||||||||||
| Full time equivalent employees |
252 | 256 | 250 | 244 | 226 | |||||||||||||||
| (1) | The average interest rate spread represents the difference between the weighted-average yield on interest-earning assets and the weighted-average cost of interest-bearing liabilities for the year. |
| (2) | The net interest margin represents net interest income as a percent of average interest-earning assets for the year. |
| (3) | The efficiency ratio represents non-interest expense divided by the sum of net interest income and non-interest income. |
| (4) | The number of shares for the year ended 2009 are calculated from the effective date of July 10, 2009 to the period end. |
| ITEM 7. | Management’s Discussion and Analysis of Financial Condition and Results of Operations |
The objective of this section is to help readers understand our views on our results of operations and financial condition. You should read this discussion in conjunction with the consolidated financial statements and notes to the consolidated financial statements that appear elsewhere in the annual report.
Overview
We have historically operated as a traditional thrift institution. The significant majority of our assets consist of long-term, fixed-rate residential mortgage loans and mortgage-backed securities, which we have funded primarily with deposit accounts, reverse repurchase agreements and Federal Home Loan Bank advances. This has resulted in our being particularly vulnerable to increases in interest rates, as our interest-bearing liabilities mature or reprice more quickly than our interest-earning assets.
We have continued our focus on originating one- to four-family residential real estate loans. Our emphasis on conservative loan underwriting has resulted in low levels of non-performing assets at a time when many financial institutions are experiencing significant asset quality issues. Our non-performing
38
assets totaled $808,000, or 0.06% of total assets at December 31, 2010, compared to $679,000 or 0.05% of total assets at December 31, 2009, and $280,000 or 0.02% of total assets at December 31, 2008. As of December 31, 2010, we had six delinquent mortgage loans for $803,000 and no real estate owned. Total loan delinquencies as of December 31, 2010 were $808,000. Our non-performing loans and loss experience has enabled us to maintain a relatively low allowance for loan losses in relation to other peer institutions and correspondingly resulted in low levels of provisions for loan losses. Our provision for loan losses was $345,000, $1.2 million and $149,000 for the years ended December 31, 2010, 2009 and 2008, respectively.
Other than our loans for the construction of one- to four-family residential mortgage loans, we do not offer “interest only” mortgage loans on one- to four-family residential properties (where the borrower pays interest for an initial period, after which the loan converts to a fully amortizing loan). We also do not offer loans that provide for negative amortization of principal, such as “Option ARM” loans, where the borrower can pay less than the interest owed on their loan, resulting in an increased principal balance during the life of the loan. We do not offer “subprime loans” (loans that generally target borrowers with weakened credit histories typically characterized by payment delinquencies, previous charge-offs, judgments, bankruptcies, or borrowers with questionable repayment capacity as evidenced by low credit scores or high debt-burden ratios) or Alt-A loans (traditionally defined as non-conforming loans having less than full documentation). We also do not own any private label mortgage-backed securities that are collateralized by ALT-A, low or no documentation or subprime mortgage loans.
Our operations in recent years have been affected by our efforts to manage our interest rate risk position. In 2008 and 2009, we obtained $60.0 million and $15.0 million, respectively, of long-term, fixed-rate reverse repurchase agreements and purchased $36.8 million and $91.4 million, respectively, of shorter-duration mortgage-backed securities. In 2009 we also sold $85.2 million of fixed-rate mortgage loan originations and raised $122.3 million of capital in a stock conversion to reduce our interest rate risk. In 2010, we obtained an additional $10.2 million of shorter-duration mortgage-backed securities and sold $45.1 million of fixed-rate mortgage loan production. See “—Management of Market Risk” for a discussion of all of the actions we took in 2008, 2009 and 2010 in managing interest rate risk.
All of the Bank’s mortgage-backed securities and collateralized mortgage obligations have been issued by Freddie Mac, Fannie Mae or Ginnie Mae, U.S. government-sponsored enterprises. These agencies guarantee the payment of principal and interest on the Bank’s mortgage-backed securities. We do not own any preferred stock issued by Fannie Mae or Freddie Mac. As of December 31, 2010, our available credit line at the Federal Home Loan Bank of Seattle has not been reduced compared to levels from December 31, 2009 or 2008.
Critical Accounting Policies
We consider accounting policies that require management to exercise significant judgment or discretion or make significant assumptions that have, or could have, a material impact on the carrying value of certain assets or on income, to be critical accounting policies. We consider the following to be our critical accounting policies:
Allowance for Loan Losses. We maintain an allowance for loan losses at an amount estimated to equal all credit losses incurred in our loan portfolio that are both probable and reasonable to estimate at a balance sheet date. We establish specific allowances for impaired loans, and general allowances for the remaining loans in our loan portfolio. To estimate credit losses on impaired loans (in accordance with the Receivables topic of the FASB ASC), we evaluate numerous factors, as described below in “—Allowance for Loan Losses.” Based on our estimate of the level of allowance for loan losses required, we record a provision for loan losses to maintain the allowance for loan losses at an appropriate level.
39
Since we cannot predict with certainty the amount of loan charge-offs that will be incurred and because the eventual level of loan charge-offs is affected by numerous conditions beyond our control, a range of loss estimates can reasonably be used to determine the allowance for loan losses and the related provisions for loan losses. In addition, various regulatory agencies, as an integral part of their examination processes, periodically review our allowance for loan losses. Such agencies may require that we recognize additions to the allowance for loan losses based on their judgments about information available to them at the time of their examination. Accordingly, actual results could differ from those estimates.
Deterioration in the Hawaii real estate market could result in an increase in loan delinquencies, additional increases in our allowance for loan losses and provision for loan losses, as well as an increase in loan charge-offs.
Securities Impairment. We periodically perform analyses to determine whether there has been an other-than-temporary decline in the value of our securities. Our held to maturity securities consist primarily of debt securities for which we have a positive intent and ability to hold to maturity, and are carried at amortized cost. Our available-for-sale securities are carried at fair value. We conduct a quarterly review and evaluation of the securities portfolio to determine if the value of any security has declined below its cost or amortized cost, and whether such decline is other-than-temporary. If such decline is deemed other-than-temporary, we would adjust the cost basis of the security by writing down the security for any credit losses through a charge on the income statement. The market values of our securities are affected by changes in interest rates as well as shifts in the market’s perception of the issuers. The fair value of investment securities is usually based on quoted market prices or dealer quotes. However, if there are no observable market inputs (for securities such as trust preferred securities), we estimate the fair value using unobservable inputs. We obtain estimates of the fair value of trust preferred securities from pricing services which discount projected cash flows using a risk-adjusted discount rate in accordance with the Fair Value Measurements and Disclosures topic of the FASB ASC.
On April 9, 2009, the Financial Accounting Standards Board revised the Investments – Debt and Equity Securities and the Fair Value Measurements topics of the FASB ASC. The revisions amend the other-than-temporary impairment guidance for U.S. GAAP for debt securities to make the guidance more operational and to improve the presentation and disclosure of other-than-temporary impairments on debt and equity securities in a company’s financial statements. Before these recent revisions, to conclude that an impairment was not other than temporary an entity was required, among other considerations, to assert that it had the intent and ability to hold the security for a period of time sufficient to allow for any anticipated recovery in fair value in accordance with Securities and Exchange Commission Staff Accounting Bulletin Topic 5M, “Other Than Temporary Impairment of Certain Investments in Debt and Equity Securities,” and other authoritative literature. As a result of these recent revisions, an entity should assess whether the entity (a) has the intent to sell the debt security or (b) more likely than not will be required to sell the debt security before its anticipated recovery (for example, if its cash or working capital requirements or contractual or regulatory obligations indicate that the debt security will be required to be sold before the forecasted recovery occurs). The revisions also change the trigger used to assess the collectability of cash flows from “probable that the investor will be unable to collect all amounts due” to “the entity does not expect to recover the entire amortized cost basis of the security.” If the present value of cash flows expected to be collected is less than the amortized cost basis of the security, an other-than-temporary impairment shall have occurred. We adopted the two revisions to the FASB ASC for the quarter ended March 31, 2009.
We had previously considered our investment in PreTSL XXIV to be other-than-temporarily impaired. PreTSL XXIV has a book value of $0. Our investment in PreTSL XXIII was determined to be other-than temporarily impaired and we recorded an impairment charge of $2.4 million in the year ended
40
December 31, 2010. When the impairment charge of $2.4 million on PreTSL XXIII was recorded, the security was written to its fair value of $32,000. The $1.1 million difference between the original outstanding principal balance of $3.5 million and the impairment charge of $2.4 million, was reported as other comprehensive loss and is related to non-credit factors such as an inactive trust preferred securities market.
See also “Item 1A. Risk Factors” for a discussion on our investment in trust preferred securities.
We evaluated our $12.3 million investment in FHLB stock for other-than-temporary impairment as of December 31, 2009. Considering the long-term nature of this investment, the liquidity position of the FHLB of Seattle, the actions taken by the FHLB of Seattle to meet its regulatory capital requirement, and our intent not to sell this investment for a period of time sufficient to recover the par value, our FHLB stock was not considered other-than-temporarily impaired. As of December 31, 2010, the FHLB of Seattle has met all of its regulatory capital requirements. Moody’s Investor Services and Standard and Poor’s have given the FHLB of Seattle long-term credit ratings of Aaa and AA+, respectively. Even though we did not recognize an other-than-temporary impairment loss on our investment in FHLB stock in 2010, continued deterioration in the FHLB of Seattle’s financial position may result in future impairment losses.
Deferred Tax Assets. Deferred tax assets and liabilities are recognized for the estimated future tax effects attributable to temporary differences and carryforwards. A valuation allowance may be required if, based on the weight of available evidence, it is more likely than not that some portion or all of the deferred tax assets will not be realized. In determining whether a valuation allowance is necessary, we consider the level of taxable income in prior years, to the extent that carrybacks are permitted under current tax laws, as well as estimates of future taxable income and tax planning strategies that could be implemented to accelerate taxable income if necessary. If our estimates of future taxable income were materially overstated or if our assumptions regarding the tax consequences of tax planning strategies were inaccurate, some or all of our deferred tax assets may not be realized, which would result in a charge to earnings.
Defined Benefit Retirement Plan. Defined benefit plan obligations and related assets of our defined benefit retirement plan are presented in Note 16 to the Consolidated Financial Statements. Effective December 31, 2008, the defined benefit retirement plan was frozen and all plan benefits were fixed as of that date. Plan assets, which consist primarily of marketable equity and debt securities, are typically valued using market quotations. Plan obligations and the annual pension expense are determined by independent actuaries through the use of a number of assumptions. Key assumptions in measuring the plan obligations include the discount rate and the expected long-term rate of return on plan assets. In determining the discount rate, we utilize a yield that reflects the top 50% of the universe of bonds, ranked in the order of the highest yield. These bonds provide cash flows which match the timing of expected benefit payments. Asset returns are based upon the anticipated average rate of earnings expected on the invested funds of the plans.
At December 31, 2010, we used weighted-average discount rates of 6.20% and 5.80% for calculating annual pension expense and projected plan liabilities, respectively, and an expected long-term rate of return on plan assets of 8.00% for calculating annual pension expense. At December 31, 2009, we used a weighted-average discount rate of 6.30% and 6.20% for calculating annual pension expense and projected plan liabilities, respectively, and an expected long-term rate of return on plan assets of 8.00% for calculating annual pension expense. For both the discount rate and the asset return rate, a range of estimates could reasonably have been used, which would affect the amount of pension expense and pension liability recorded.
41
An increase in the discount rate or asset return rate would reduce pension expense in 2010, while a decrease in the discount rate or asset return rate would have the opposite effect. A 25 basis point decrease in the discount rate assumptions would increase 2010 pension expense by $4,000 and year-end 2010 pension liability by $359,000, while a 25 basis point decrease in the asset return rate would increase 2010 pension expense by $24,000.
Balance Sheet Analysis
Assets. At December 31, 2010, our assets were $1.443 billion, an increase of $53.8 million, or 3.9%, from $1.390 billion at December 31, 2009. The increase was caused by an increase in cash and cash equivalents of $58.5 million, or 43.0% due primarily to a $61.8 million increase in deposits. In addition, loans receivable increased by $44.1 million, or 7.4%, as one- to four-family residential loan production exceeded principal repayments and loan sales due to continued high levels of loan originations in the current interest rate environment. This was partially offset by a $52.8 million, or 8.8%, decrease in investment securities. The decrease in investment securities was primarily due to repayments exceeding purchases.
Cash and Cash Equivalents. At December 31, 2010, we had $194.4 million of cash and cash equivalents, which primarily represents the proceeds from our stock offering and a $61.8 million increase in deposits which occurred in 2010.
42
Loan Portfolio Composition. The following table sets forth the composition of our loan portfolio at the dates indicated.
| At December 31, | ||||||||||||||||||||||||||||||||||||||||
| 2010 | 2009 | 2008 | 2007 | 2006 | ||||||||||||||||||||||||||||||||||||
| Amount | Percent | Amount | Percent | Amount | Percent | Amount | Percent | Amount | Percent | |||||||||||||||||||||||||||||||
| (Dollars in thousands) | ||||||||||||||||||||||||||||||||||||||||
| Real estate loans: |
||||||||||||||||||||||||||||||||||||||||
| First mortgage: |
||||||||||||||||||||||||||||||||||||||||
| One- to four-family residential |
$ | 604,456 | 92.99 | % | $ | 555,473 | 91.25 | % | $ | 581,251 | 90.52 | % | $ | 506,410 | 90.21 | % | $ | 516,554 | 93.26 | % | ||||||||||||||||||||
| Multi-family residential |
5,408 | 0.83 | 3,807 | 0.63 | 3,756 | 0.58 | 4,488 | 0.80 | 4,983 | 0.90 | ||||||||||||||||||||||||||||||
| Construction, commercial and other |
14,412 | 2.22 | 20,762 | 3.41 | 21,042 | 3.28 | 17,041 | 3.04 | 14,784 | 2.67 | ||||||||||||||||||||||||||||||
| Home equity loans and lines of credit |
20,064 | 3.09 | 21,789 | 3.58 | 29,956 | 4.67 | 26,828 | 4.78 | 12,763 | 2.30 | ||||||||||||||||||||||||||||||
| Other loans |
5,635 | 0.87 | 6,895 | 1.13 | 6,097 | 0.95 | 6,579 | 1.17 | 4,830 | 0.87 | ||||||||||||||||||||||||||||||
| Total loans |
649,975 | 100.00 | % | 608,726 | 100.00 | % | 642,102 | 100.00 | % | 561,346 | 100.00 | % | 553,914 | 100.00 | % | |||||||||||||||||||||||||
| Other items: |
||||||||||||||||||||||||||||||||||||||||
| Unearned fees and discounts, net |
(5,585 | ) | (5,255 | ) | (5,100 | ) | (4,375 | ) | (4,415 | ) | ||||||||||||||||||||||||||||||
| Undisbursed loan funds |
(1,112 | ) | (4,090 | ) | (2,943 | ) | (1,408 | ) | (2,530 | ) | ||||||||||||||||||||||||||||||
| Allowance for loan losses |
(1,488 | ) | (1,681 | ) | (899 | ) | (768 | ) | (768 | ) | ||||||||||||||||||||||||||||||
| Loans receivable, net |
$ | 641,790 | $ | 597,700 | $ | 633,160 | $ | 554,795 | $ | 546,201 | ||||||||||||||||||||||||||||||
Loan Portfolio Maturities and Yields. The following table summarizes the scheduled maturities of our loan portfolio at December 31, 2010. Demand loans, loans having no stated repayment schedule or maturity, and overdraft loans are reported as being due in one year or less.
| One- to four- family residential real estate |
Multi-family residential real estate |
Construction, commercial and other real estate |
Home equity loans and lines of credit |
Other loans | Total | |||||||||||||||||||||||||||||||||||||||||||
| Amount | Weighted Average Rate |
Amount | Weighted Average Rate |
Amount | Weighted Average Rate |
Amount | Weighted Average Rate |
Amount | Weighted Average Rate |
Amount | Weighted Average Rate |
|||||||||||||||||||||||||||||||||||||
| (Dollars in thousands) | ||||||||||||||||||||||||||||||||||||||||||||||||
| Due During the Years Ending December 31, |
||||||||||||||||||||||||||||||||||||||||||||||||
| 2011 |
$ | — | — | % | $ | — | — | % | $ | 953 | 6.57 | % | $ | 1,001 | 5.25 | % | $ | 1,320 | 5.90 | % | $ | 3,274 | 5.90 | % | ||||||||||||||||||||||||
| 2012 to 2015 |
582 | 6.00 | 929 | 7.00 | 2,046 | 7.07 | 903 | 5.35 | 1,532 | 6.91 | 5,992 | 6.66 | ||||||||||||||||||||||||||||||||||||
| 2016 and beyond |
603,874 | 5.18 | 4,479 | 6.61 | 11,413 | 5.94 | 18,160 | 6.28 | 2,783 | 6.34 | 640,709 | 5.24 | ||||||||||||||||||||||||||||||||||||
| Total |
$ | 604,456 | 5.18 | % | $ | 5,408 | 6.68 | % | $ | 14,412 | 6.14 | % | $ | 20,064 | 6.19 | % | $ | 5,635 | 6.39 | % | $ | 649,975 | 5.26 | % | ||||||||||||||||||||||||
43
The following table sets forth the scheduled repayments of fixed- and adjustable-rate loans at December 31, 2010 that are contractually due after December 31, 2011.
| Due After December 31, 2011 | ||||||||||||
| Fixed | Adjustable | Total | ||||||||||
| (In thousands) | ||||||||||||
| Real estate loans: |
||||||||||||
| First mortgage: |
||||||||||||
| One- to four-family residential |
$ | 596,845 | $ | 7,611 | $ | 604,456 | ||||||
| Multi-family residential |
4,911 | 497 | 5,408 | |||||||||
| Construction, commercial and other |
11,789 | 1,670 | 13,459 | |||||||||
| Home equity loans and lines of credit |
10,478 | 8,585 | 19,063 | |||||||||
| Other loans |
3,637 | 678 | 4,315 | |||||||||
| Total loans |
$ | 627,660 | $ | 19,041 | $ | 646,701 | ||||||
Securities. At December 31, 2010, our securities portfolio totaled $545.6 million, or 37.8% of assets and included $530.6 million classified as held-to-maturity and $15.0 million classified as available for sale. At that date, our securities held-to-maturity consisted primarily of securities with the following amortized costs: $408.3 million of mortgage-backed securities, $122.2 million of collateralized mortgage obligations and $32,000 of trust preferred securities. All of the mortgage-backed securities and collateralized mortgage obligations were issued by Fannie Mae, Freddie Mac or Ginnie Mae. At December 31, 2010, none of the underlying collateral consisted of subprime or Alt-A loans (traditionally defined as non-conforming loans having less than full documentation). At December 31, 2010, we held no common or preferred stock of Fannie Mae or Freddie Mac.
During the year ended December 31, 2010, our securities portfolio decreased $52.8 million, or 8.8%, primarily due to repayments exceeding purchases.
44
The following table sets forth the amortized cost and estimated fair value of our securities portfolio (excluding Federal Home Loan Bank of Seattle common stock) at the dates indicated.
| At December 31, | ||||||||||||||||||||||||
| 2010 | 2009 | 2008 | ||||||||||||||||||||||
| Amortized Cost |
Fair Value | Amortized Cost |
Fair Value | Amortized Cost |
Fair Value | |||||||||||||||||||
| (In thousands) | ||||||||||||||||||||||||
| Held to Maturity: |
||||||||||||||||||||||||
| U.S. government sponsored mortgage-backed securities: |
||||||||||||||||||||||||
| Fannie Mae |
$ | 62,174 | $ | 65,576 | $ | 81,234 | $ | 83,538 | $ | 103,313 | $ | 105,272 | ||||||||||||
| Freddie Mac |
301,450 | 310,082 | 299,143 | 305,166 | 308,522 | 315,823 | ||||||||||||||||||
| Collateralized mortgage obligations |
122,209 | 125,427 | 175,100 | 178,049 | 111,328 | 112,358 | ||||||||||||||||||
| Ginnie Mae |
44,690 | 45,631 | 39,375 | 39,416 | 65 | 61 | ||||||||||||||||||
| Total U.S. government sponsored mortgage-backed securities |
530,523 | 546,716 | 594,852 | 606,169 | 523,228 | 533,514 | ||||||||||||||||||
| Trust preferred securities |
32 | 128 | 3,542 | 100 | 4,539 | 2,076 | ||||||||||||||||||
| Total |
$ | 530,555 | $ | 546,844 | $ | 598,394 | $ | 606,269 | $ | 527,767 | $ | 535,590 | ||||||||||||
| Available for Sale: |
||||||||||||||||||||||||
| U.S. government sponsored mortgage-backed securities: |
||||||||||||||||||||||||
| Freddie Mac |
$ | 5,148 | $ | 4,965 | — | — | — | — | ||||||||||||||||
| Ginnie Mae |
10,392 | 10,045 | — | — | — | — | ||||||||||||||||||
| Total U.S. government sponsored mortgage-backed securities |
$ | 15,540 | $ | 15,010 | $ | — | $ | — | $ | — | $ | — | ||||||||||||
Unrealized losses on individual mortgage-backed securities as of December 31, 2010, 2009 and 2008 were caused by increases in current market interest rates. All of our mortgage-backed securities are guaranteed by U.S. government-sponsored enterprises. Since the decline in market value had been attributable to changes in interest rates and not credit quality, and we have had, and continue to have, the intent not to sell these investments prior to the recovery of the amortized cost basis, we have not considered these investments to be other-than-temporarily impaired as of December 31, 2010, 2009 or 2008.
At December 31, 2010, we owned trust preferred securities with a carrying value of $32,000. This portfolio consists of two securities, which represent investments in a pool of debt obligations issued by Federal Deposit Insurance Corporation-insured financial institutions, insurance companies and real estate investment trusts.
The trust preferred securities market is considered to be inactive as only three transactions have occurred over the past 12 months in similar tranches to the securities owned by the Company. The Company used a discounted cash flow model to determine whether these securities are other-than-temporarily impaired. The assumptions used in preparing the discounted cash flow model include the following: estimated discount rates, estimated deferral and default rates on collateral, and estimated cash flows. Our pricing service uses a discount rate of 22.00% and determined fair value to be $3.61 per $100 of par value.
See also “Item 1A. Risk Factors” for a discussion on our investment in trust preferred securities.
At December 31, 2010, we had no investments in a single company or entity that had an aggregate book value in excess of 10% of our consolidated equity.
45
Portfolio Maturities and Coupons. The composition and maturities of the investment securities portfolio at December 31, 2010 are summarized in the following table. Maturities are based on the final contractual payment dates, and do not reflect the impact of prepayments or early redemptions that may occur. No tax-equivalent adjustments have been made, as we did not hold any tax-free investment securities at December 31, 2010.
| One Year or Less | More than One Year through Five Years |
More than Five Years through Ten Years |
More than Ten Years | Total Securities | ||||||||||||||||||||||||||||||||||||||||
| Amortized Cost |
Weighted Average Coupon |
Amortized Cost |
Weighted Average Coupon |
Amortized Cost |
Weighted Average Coupon |
Amortized Cost |
Weighted Average Coupon |
Amortized Cost |
Fair Value |
Weighted Average Coupon |
||||||||||||||||||||||||||||||||||
| (Dollars in thousands) | ||||||||||||||||||||||||||||||||||||||||||||
| Held to Maturity: |
||||||||||||||||||||||||||||||||||||||||||||
| U.S. government sponsored mortgage-backed securities |
||||||||||||||||||||||||||||||||||||||||||||
| Fannie Mae |
$ | — | — | % | $ | — | — | % | $ | 202 | 4.53 | % | $ | 61,972 | 5.07 | % | $ | 62,174 | $ | 65,576 | 5.06 | % | ||||||||||||||||||||||
| Freddie Mac |
— | — | — | — | 24 | 4.50 | 301,426 | 4.64 | 301,450 | 310,082 | 4.64 | |||||||||||||||||||||||||||||||||
| Collateralized mortgage obligations |
— | — | — | — | 13,370 | 4.34 | 108,839 | 4.74 | 122,209 | 125,427 | 4.70 | |||||||||||||||||||||||||||||||||
| Ginnie Mae |
— | — | — | — | — | — | 44,690 | 4.38 | 44,690 | 45,631 | 4.38 | |||||||||||||||||||||||||||||||||
| Total U.S. government sponsored mortgage-backed securities |
— | — | — | — | 13,596 | 4.34 | 516,927 | 4.69 | 530,523 | 546,716 | 4.68 | |||||||||||||||||||||||||||||||||
| Trust preferred securities |
— | — | — | — | — | — | 32 | 2.40 | 32 | 128 | 2.40 | |||||||||||||||||||||||||||||||||
| Total |
$ | — | — | % | $ | — | — | % | $ | 13,596 | 4.34 | % | $ | 516,959 | 4.69 | % | $ | 530,555 | $ | 546,844 | 4.68 | % | ||||||||||||||||||||||
| Available for Sale: |
||||||||||||||||||||||||||||||||||||||||||||
| U.S. government sponsored mortgage-backed securities |
||||||||||||||||||||||||||||||||||||||||||||
| Freddie Mac |
$ | — | — | % | $ | — | — | % | $ | — | — | % | $ | 5,148 | 4.00 | % | $ | 5,148 | $ | 4,965 | 4.00 | % | ||||||||||||||||||||||
| Ginnie Mae |
— | — | — | — | — | — | 10,392 | 4.00 | 10,392 | 10,045 | 4.00 | |||||||||||||||||||||||||||||||||
| Total |
$ | — | — | % | $ | — | — | % | $ | — | — | % | $ | 15,540 | 4.00 | % | $ | 15,540 | $ | 15,010 | 4.00 | % | ||||||||||||||||||||||
Bank Owned Life Insurance. We invest in bank owned life insurance to provide us with a funding source for our benefit plan obligations. Bank owned life insurance also generally provides us non-interest income that is non-taxable. Federal regulations generally limit our investment in bank owned life insurance to 25% of our Tier 1 capital plus our allowance for loan losses. At December 31, 2010, this limit was $51.0 million, and we had invested $29.3 million in bank owned life insurance at that date.
46
Deposits. We accept deposits primarily from the areas in which our offices are located. We rely on our competitive pricing, convenient locations and customer service to attract and retain deposits. We offer a variety of deposit accounts with a range of interest rates and terms. Our deposit accounts consist of passbook and statement savings accounts, certificates of deposit, money market accounts, commercial and regular checking accounts and Super NOW accounts. Historically, we have not accepted brokered deposits.
Interest rates paid, maturity terms, service fees and withdrawal penalties are established on a periodic basis. Deposit rates and terms are based primarily on current operating strategies and market interest rates, liquidity requirements and our deposit growth goals.
During the year ended December 31, 2010, our deposits grew by $61.8 million, or 6.1%. The increase was caused by our promoting higher than market rates for our passbook and statement savings accounts. Savings accounts grew by $102.3 million or 16.0% because higher interest rates and the ability to get immediate access to their funds without incurring an early withdrawal penalty appealed to customers.
At December 31, 2010, we had a total of $209.2 million in certificates of deposit, of which $151.6 million had remaining maturities of one year or less. Based on historical experience and our current pricing strategy, we believe we will retain a portion of these accounts upon maturity.
The following tables set forth the distribution of our average total deposit accounts (including interest-bearing and non-interest bearing deposits), by account type, for the periods indicated.
| For the Years Ended December 31, | ||||||||||||||||||||||||
| 2010 | 2009 | |||||||||||||||||||||||
| Average Balance |
Percent | Weighted Average Rate |
Average Balance |
Percent | Weighted Average Rate |
|||||||||||||||||||
| (Dollars in thousands) | ||||||||||||||||||||||||
| Deposit type: |
||||||||||||||||||||||||
| Noninterest bearing |
$ | 18,788 | 1.8 | % | — | % | $ | 33,583 | 3.4 | % | — | % | ||||||||||||
| Savings accounts |
715,500 | 67.2 | 1.08 | % | 511,152 | 51.3 | 1.52 | % | ||||||||||||||||
| Certificates of deposit |
228,835 | 21.5 | 1.14 | % | 337,487 | 33.9 | 1.81 | % | ||||||||||||||||
| Money market |
19,060 | 1.8 | 0.06 | % | 94,857 | 9.5 | 0.25 | % | ||||||||||||||||
| Checking and Super NOW |
82,543 | 7.7 | 0.06 | % | 19,554 | 1.9 | 0.06 | % | ||||||||||||||||
| Total deposits |
$ | 1,064,726 | 100.0 | % | 0.99 | % | $ | 996,633 | 100.0 | % | 1.42 | % | ||||||||||||
| For the Year Ended December 31, 2008 |
||||||||||||
| Average Balance |
Percent | Weighted Average Rate |
||||||||||
| (Dollars in thousands) | ||||||||||||
| Deposit type: |
||||||||||||
| Noninterest bearing |
$ | 13,303 | 1.4 | % | — | % | ||||||
| Savings accounts |
392,041 | 43.0 | 1.53 | % | ||||||||
| Certificates of deposit |
403,405 | 44.3 | 3.09 | % | ||||||||
| Money market |
81,691 | 9.0 | 0.06 | % | ||||||||
| Checking and Super NOW |
20,530 | 2.3 | 0.05 | % | ||||||||
| Total deposits |
$ | 910,970 | 100.0 | % | 2.03 | % | ||||||
47
As of December 31, 2010, the aggregate amount of outstanding certificates of deposit in amounts greater than or equal to $100,000 was $130.3 million. The following table sets forth the maturity of those certificates as of December 31, 2010.
| At December 31, 2010 |
||||
| (In thousands) | ||||
| Three months or less |
$ | 100,064 | ||
| Over three months through six months |
2,672 | |||
| Over six months through one year |
6,274 | |||
| Over one year to three years |
11,097 | |||
| Over three years |
10,193 | |||
| Total |
$ | 130,300 | ||
Borrowings and Subordinated Debentures. Our borrowings consist primarily of advances from the Federal Home Loan Bank of Seattle and funds borrowed under repurchase agreements. At December 31, 2010, our repurchase agreements totaled $105.2 million, or 8.7% of total liabilities and our Federal Home Loan Bank advances totaled $10.0 million, or 0.8% of total liabilities. At December 31, 2010, we had the capability to borrow up to $350.3 million in the form of advances from the Federal Home Loan Bank.
During the year ended December 31, 2010, our borrowings decreased $15.0 million, or 11.5%. The decrease was caused by the payoff of $25.0 million of securities sold under agreements to repurchase, which was partially offset when we obtained $10.0 million of Federal Home Loan Bank advances. We have not required any other borrowings to fund our operations. Instead, we have primarily funded our operations with the net proceeds from our stock offering, additional deposits and principal repayments on loans and mortgage-backed securities. The shift from short-term Federal Home Loan Bank advances to longer-term reverse purchase agreements is part of our continued effort to reduce interest rate risk. See “—Management of Market Risk.”
The following table sets forth information concerning balances and interest rates on our Federal Home Loan Bank advances at the dates and for the years indicated.
| At or For the Years Ended December 31, | ||||||||||||
| 2010 | 2009 | 2008 | ||||||||||
| (Dollars in thousands) | ||||||||||||
| Balance at end of year |
$ | 10,000 | $ | — | $ | 35,791 | ||||||
| Average balance during year |
$ | 7,233 | $ | 3,932 | $ | 21,033 | ||||||
| Maximum outstanding at any month end |
$ | 10,000 | $ | 29,381 | $ | 43,875 | ||||||
| Weighted average interest rate at end of year |
2.12 | % | 0.00 | % | 0.63 | % | ||||||
| Average interest rate during year |
2.11 | % | 0.84 | % | 2.45 | % | ||||||
The following table sets forth information concerning balances and interest rates on our securities sold under agreements to repurchase at the dates and for the years indicated.
| At or For the Years Ended December 31, | ||||||||||||
| 2010 | 2009 | 2008 | ||||||||||
| (Dollars in thousands) | ||||||||||||
| Balance at end of year |
$ | 105,200 | $ | 130,200 | $ | 115,200 | ||||||
| Average balance during year |
$ | 106,422 | $ | 129,214 | $ | 110,871 | ||||||
| Maximum outstanding at any month end |
$ | 105,200 | $ | 130,200 | $ | 123,200 | ||||||
| Weighted average interest rate at end of year |
3.98 | % | 3.82 | % | 3.95 | % | ||||||
| Average interest rate during year |
4.02 | % | 3.88 | % | 4.05 | % | ||||||
48
In the year ended December 31, 2009, we repaid $24.7 million of subordinated debentures. We recognized a loss of $507,000 when the unamortized costs relating to the issuance of the debentures were written off.
Stockholders’ Equity. At December 31, 2010, our stockholders’ equity was $227.4 million, an increase of $7.7 million, or 3.5%, from $219.7 million at December 31, 2009. The increase primarily resulted from net income of $11.0 million for the year ended December 31, 2010. The increase was partially offset by dividends declared of $2.7 million and the repurchase of 55,707 shares of our common stock for $1.0 million.
49
Average Balances and Yields
The following tables set forth average balance sheets, average yields and rates, and certain other information for the years indicated. No tax-equivalent yield adjustments were made, as the effect thereof was not material. All average balances are daily average balances. Non-accrual loans were included in the computation of average balances, but have been reflected in the table as loans carrying a zero yield. The yields set forth below include the effect of net deferred costs, discounts and premiums that are amortized or accreted to interest income.
| For the Year Ended December 31, 2010 |
||||||||||||
| Average Outstanding Balance |
Interest | Yield/ Rate | ||||||||||
| (Dollars in thousands) | ||||||||||||
| Interest-earning assets: |
||||||||||||
| Loans: |
||||||||||||
| Real estate loans: |
||||||||||||
| First mortgage: |
||||||||||||
| One- to four-family residential |
$ | 574,924 | $ | 31,879 | 5.54 | % | ||||||
| Multi-family residential |
4,733 | 321 | 6.78 | |||||||||
| Construction, commercial and other |
16,653 | 1,058 | 6.35 | |||||||||
| Home equity loans and lines of credit |
20,815 | 1,303 | 6.26 | |||||||||
| Other loans |
6,243 | 398 | 6.38 | |||||||||
| Total loans |
623,368 | 34,959 | 5.61 | |||||||||
| Investment securities |
||||||||||||
| U.S. government sponsored mortgage-backed securities |
577,221 | 25,754 | 4.46 | |||||||||
| Trust preferred securities |
888 | — | — | |||||||||
| Total securities |
578,109 | 25,754 | 4.45 | |||||||||
| Other |
180,658 | 402 | 0.22 | |||||||||
| Total interest-earning assets |
1,382,135 | 61,115 | 4.42 | |||||||||
| Non-interest-earning assets |
48,102 | |||||||||||
| Total assets |
$ | 1,430,237 | ||||||||||
| Interest-bearing liabilities: |
||||||||||||
| Savings accounts |
$ | 715,500 | 7,722 | 1.08 | % | |||||||
| Certificates of deposit |
228,835 | 2,614 | 1.14 | |||||||||
| Money market accounts |
19,060 | 12 | 0.06 | |||||||||
| Checking and Super NOW accounts |
82,543 | 47 | 0.06 | |||||||||
| Total interest-bearing deposits |
1,045,938 | 10,395 | 0.99 | |||||||||
| Federal Home Loan Bank advances |
7,233 | 153 | 2.12 | |||||||||
| Other borrowings |
106,422 | 4,280 | 4.02 | |||||||||
| Total interest-bearing liabilities |
1,159,593 | 14,828 | 1.28 | |||||||||
| Non-interest-bearing liabilities |
46,224 | |||||||||||
| Total liabilities |
1,205,817 | |||||||||||
| Stockholders’ equity |
224,420 | |||||||||||
| Total liabilities and stockholders’ equity |
$ | 1,430,237 | ||||||||||
| Net interest income |
$ | 46,287 | ||||||||||
| Net interest rate spread (1) |
3.14 | % | ||||||||||
| Net interest-earning assets (2) |
$ | 222,542 | ||||||||||
| Net interest margin (3) |
3.35 | % | ||||||||||
| Average interest-earning assets to interest-bearing liabilities |
119.19 | % | ||||||||||
(footnotes on following page)
50
| For the Years Ended December 31, | ||||||||||||||||||||||||
| 2009 | 2008 | |||||||||||||||||||||||
| Average Outstanding Balance |
Interest | Yield/ Rate | Average Outstanding Balance |
Interest | Yield/ Rate | |||||||||||||||||||
| (Dollars in thousands) | ||||||||||||||||||||||||
| Interest-earning assets: |
||||||||||||||||||||||||
| Loans: |
||||||||||||||||||||||||
| Real estate loans: |
||||||||||||||||||||||||
| First mortgage: |
||||||||||||||||||||||||
| One- to four-family residential |
$ | 563,094 | $ | 32,267 | 5.73 | % | $ | 544,920 | $ | 31,087 | 5.70 | % | ||||||||||||
| Multi-family residential |
3,742 | 266 | 7.11 | 4,174 | 301 | 7.21 | ||||||||||||||||||
| Construction, commercial and other |
17,733 | 1,169 | 6.59 | 19,168 | 1,319 | 6.88 | ||||||||||||||||||
| Home equity loans and lines of credit |
24,709 | 1,630 | 6.60 | 28,910 | 2,012 | 6.96 | ||||||||||||||||||
| Other loans |
6,679 | 443 | 6.63 | 6,074 | 434 | 7.15 | ||||||||||||||||||
| Total loans |
615,957 | 35,775 | 5.81 | 603,246 | 35,153 | 5.83 | ||||||||||||||||||
| Investment securities |
||||||||||||||||||||||||
| U.S. government sponsored mortgage-backed securities |
536,441 | 25,609 | 4.77 | 519,400 | 25,439 | 4.90 | ||||||||||||||||||
| Municipal bonds |
— | — | — | 3,000 | 112 | 3.73 | ||||||||||||||||||
| Trust preferred securities (4) |
3,751 | (8 | ) | (.21 | ) | 7,049 | 361 | 5.12 | ||||||||||||||||
| Other |
— | — | — | 459 | 9 | 1.96 | ||||||||||||||||||
| Total securities |
540,192 | 25,601 | 4.74 | 529,908 | 25,921 | 4.89 | ||||||||||||||||||
| Other |
117,045 | 149 | 0.13 | 13,957 | 146 | 1.05 | ||||||||||||||||||
| Total interest-earning assets |
1,273,194 | 61,525 | 4.83 | 1,147,111 | 61,220 | 5.34 | ||||||||||||||||||
| Non-interest-earning assets |
48,574 | 50,362 | ||||||||||||||||||||||
| Total assets |
$ | 1,321,768 | $ | 1,197,473 | ||||||||||||||||||||
| Interest-bearing liabilities: |
||||||||||||||||||||||||
| Savings accounts |
$ | 511,152 | 7,761 | 1.52 | % | $ | 392,041 | 6,003 | 1.53 | % | ||||||||||||||
| Certificates of deposit |
337,487 | 6,118 | 1.81 | 403,405 | 12,457 | 3.09 | ||||||||||||||||||
| Money market accounts |
94,857 | 239 | 0.25 | 81,691 | 51 | 0.06 | ||||||||||||||||||
| Checking and Super NOW accounts |
19,554 | 11 | 0.06 | 20,530 | 10 | 0.05 | ||||||||||||||||||
| Total interest-bearing deposits |
963,050 | 14,129 | 1.47 | 897,667 | 18,521 | 2.06 | ||||||||||||||||||
| Federal Home Loan Bank advances |
3,932 | 33 | 0.84 | 21,033 | 515 | 2.45 | ||||||||||||||||||
| Other borrowings |
146,878 | 5,822 | 3.96 | 136,493 | 6,211 | 4.55 | ||||||||||||||||||
| Total interest-bearing liabilities |
1,113,860 | 19,984 | 1.79 | 1,055,193 | 25,247 | 2.39 | ||||||||||||||||||
| Non-interest-bearing liabilities |
50,285 | 44,642 | ||||||||||||||||||||||
| Total liabilities |
1,164,145 | 1,099,835 | ||||||||||||||||||||||
| Stockholders’ equity |
157,623 | 97,638 | ||||||||||||||||||||||
| Total liabilities and stockholders’ equity |
$ | 1,321,768 | $ | 1,197,473 | ||||||||||||||||||||
| Net interest income |
$ | 41,541 | $ | 35,973 | ||||||||||||||||||||
| Net interest rate spread (1) |
3.04 | % | 2.95 | % | ||||||||||||||||||||
| Net interest-earning assets (2) |
$ | 159,334 | $ | 91,918 | ||||||||||||||||||||
| Net interest margin (3) |
3.26 | % | 3.14 | % | ||||||||||||||||||||
| Average of interest-earning assets to interest-bearing liabilities |
114.30 | % | 108.71 | % | ||||||||||||||||||||
| (1) | Net interest rate spread represents the difference between the yield on average interest-earning assets and the cost of average interest-bearing liabilities. |
| (2) | Net interest-earning assets represent total interest-earning assets less total interest-bearing liabilities. |
| (3) | Net interest margin represents net interest income divided by average total interest-earning assets. |
| (4) | Interest on trust preferred securities for 2009 has a negative balance because interest owed on these securities was reversed in 2009. |
51
Rate/Volume Analysis
The following table presents the effects of changing rates and volumes on our net interest income for the years indicated. The rate column shows the effects attributable to changes in rate (changes in rate multiplied by prior volume). The volume column shows the effects attributable to changes in volume (changes in volume multiplied by prior rate). The total column represents the sum of the prior columns. For purposes of this table, changes attributable to both rate and volume, which cannot be segregated, have been allocated proportionately based on the changes due to rate and the changes due to volume.
| Years Ended December 31, 2010 vs. 2009 |
Years Ended December 31, 2009 vs. 2008 |
|||||||||||||||||||||||
| Increase (Decrease) Due to |
Total Increase (Decrease) |
Increase (Decrease) Due to |
Total Increase (Decrease) |
|||||||||||||||||||||
| Volume | Rate | Volume | Rate | |||||||||||||||||||||
| (In thousands) | ||||||||||||||||||||||||
| Interest-earning assets: |
||||||||||||||||||||||||
| Loans: |
||||||||||||||||||||||||
| Real estate loans: |
||||||||||||||||||||||||
| First mortgage: |
||||||||||||||||||||||||
| One- to four-family residential |
$ | 719 | $ | (1,107 | ) | $ | (388 | ) | $ | 1,041 | $ | 139 | $ | 1,180 | ||||||||||
| Multi-family residential |
67 | (12 | ) | 55 | (31 | ) | (4 | ) | (35 | ) | ||||||||||||||
| Construction, commercial and other |
(70 | ) | (41 | ) | (111 | ) | (96 | ) | (54 | ) | (150 | ) | ||||||||||||
| Home equity loans and lines of credit |
(247 | ) | (80 | ) | (327 | ) | (281 | ) | (101 | ) | (382 | ) | ||||||||||||
| Other loans |
(28 | ) | (17 | ) | (45 | ) | 32 | (23 | ) | 9 | ||||||||||||||
| Total loans |
441 | (1,257 | ) | (816 | ) | 665 | (43 | ) | 622 | |||||||||||||||
| Investment securities |
||||||||||||||||||||||||
| U.S. government sponsored mortgage-backed securities |
1,037 | (892 | ) | 145 | 742 | (572 | ) | 170 | ||||||||||||||||
| Municipal bonds |
— | — | — | (112 | ) | — | (112 | ) | ||||||||||||||||
| Trust preferred securities |
3 | 5 | 8 | (114 | ) | (255 | ) | (369 | ) | |||||||||||||||
| Other |
— | — | — | (9 | ) | — | (9 | ) | ||||||||||||||||
| Total securities |
1,040 | (887 | ) | 153 | 507 | (827 | ) | (320 | ) | |||||||||||||||
| Other |
106 | 147 | 253 | 3 | — | 3 | ||||||||||||||||||
| Total interest-earning assets |
$ | 1,587 | $ | (1,997 | ) | $ | (410 | ) | $ | 1,175 | $ | (870 | ) | $ | 305 | |||||||||
| Interest-bearing liabilities: |
||||||||||||||||||||||||
| Savings accounts |
$ | (141 | ) | $ | 102 | $ | (39 | ) | $ | 1,808 | $ | (50 | ) | $ | 1,758 | |||||||||
| Certificates of deposit |
(1,631 | ) | (1,873 | ) | (3,504 | ) | (1,797 | ) | (4,542 | ) | (6,339 | ) | ||||||||||||
| Money market accounts |
(117 | ) | (110 | ) | (227 | ) | 9 | 179 | 188 | |||||||||||||||
| Checking and Super NOW accounts |
36 | — | 36 | — | 1 | 1 | ||||||||||||||||||
| Total interest-bearing deposits |
(1,853 | ) | (1,881 | ) | (3,734 | ) | 20 | (4,412 | ) | (4,392 | ) | |||||||||||||
| Federal Home Loan Bank advances |
43 | 77 | 120 | (267 | ) | (215 | ) | (482 | ) | |||||||||||||||
| Other borrowings |
(1,628 | ) | 86 | (1,542 | ) | 560 | (949 | ) | (389 | ) | ||||||||||||||
| Total interest-bearing liabilities |
$ | (3,438 | ) | $ | (1,718 | ) | $ | (5,156 | ) | $ | 313 | $ | (5,576 | ) | $ | (5,263 | ) | |||||||
| Change in net interest income |
$ | 5,025 | $ | (279 | ) | $ | 4,746 | $ | 862 | $ | 4,706 | $ | 5,568 | |||||||||||
52
Comparison of Operating Results for the Years Ended December 31, 2010, 2009 and 2008
General. Net income increased by $2.4 million, or 27.3%, to $11.0 million for the year ended December 31, 2010 from $8.7 million for the year ended December 31, 2009. The increase was primarily caused by a $5.2 million decrease in interest expense and an $853,000 decrease in the provision for loan losses. These changes were partially offset by a $2.0 million increase in non-interest expense, a $377,000 decrease in non-interest income and an $873,000 increase in income taxes.
Net income increased $1.5 million, or 20.3%, to $8.7 million for the year ended December 31, 2009 from $7.2 million for the year ended December 31, 2008. The increase was primarily caused by a $5.3 million decrease in interest expense. The decrease in interest expense was partially offset by a $2.5 million increase in non-interest expense and a $1.0 million increase in the provision for loan losses.
Net Interest Income. Net interest income increased by $4.7 million, or 11.4%, for the year ended December 31, 2010, compared to the prior year. Interest expense decreased by $5.2 million as declining market interest rates for certificates of deposits allowed us to reduce our deposit expense by $3.7 million. In addition, interest expense on borrowings decreased by $1.4 million to $4.4 million for the year ended December 31, 2010 from $5.9 million for the year ended December 31, 2009. The decrease in interest expense on borrowings is due to the payoff of $24.7 million of subordinated debentures and $25.0 million of securities sold under agreements to repurchase. Interest and dividend income decreased by $410,000 to $61.1 million for the year ended December 31, 2010 from $61.5 million for the year ended December 31, 2009. Interest income on loans decreased $816,000, primarily due to lower loan yields. Interest income on securities rose by $153,000, primarily due to a $37.9 million increase in the average securities balance. Interest income on other interest earning assets grew by $253,000 due to an increase in interest earned on cash invested at the Federal Reserve Bank. The interest rate spread and net interest margin were 3.14% and 3.35%, respectively, for the year ended December 31, 2010, compared to 3.04% and 3.26% for 2009. The improvement in the interest rate spread was the result of a 51 basis point decrease in the average cost of interest-bearing liabilities that was partially offset by a 41 basis point decrease in the average yield on interest-earning assets.
Net interest income increased $5.6 million, or 15.5%, for the year ended December 31, 2009, compared to the prior year. Interest and dividend income rose by $305,000 to $61.5 million for the year ended December 31, 2009 from $61.2 million for the year ended December 31, 2008. Interest expense decreased by $5.3 million or 20.8% to $20.0 million for the year ended December 31, 2009 from $25.2 million for the year ended December 31, 2008. The decline in interest expense is due to a $4.4 million decrease in interest expense on deposits which primarily occurred as a result of a decrease in interest expense on certificates of deposit. In addition, interest expense on FHLB advances and other borrowings decreased by $871,000 as advances and subordinated debentures were paid off. The interest rate spread and net interest margin were 3.04% and 3.26%, respectively, for the year ended December 31, 2009, compared to 2.95% and 3.14% for 2008. The improvement in the interest rate spread was the result of a 60 basis point decrease in the average cost of interest-bearing liabilities that was partially offset by a 51 basis point decrease in the average yield on interest-earning assets.
Interest and Dividend Income. Interest and dividend income decreased $410,000 to $61.1 million for the year ended December 31, 2010 from $61.5 million for the year ended December 31, 2009. In 2010, interest income on loans decreased by $816,000, or 2.3%, to $35.0 million for the year ended December 31, 2010 from $35.8 million for year ended December 31, 2009. The decrease in interest income on loans primarily occurred because of a 20 basis point decrease in the average loan yield to 5.61% for the year ended December 31, 2010 from 5.81% for the year ended December 31, 2009. The decrease in interest income was partially offset by a $7.4 million increase in the average loan balance to $623.4 million for the year ended December 31, 2010 from $616.0 million for the year ended December 31, 2009.
53
Interest income on securities grew by $153,000, or 0.6%, to $25.8 million for the year ended December 31, 2010 from $25.6 million for the year ended December 31, 2009. The increase in interest income on securities was primarily due to a $37.9 million increase in the average securities balance which was partially offset by a 29 basis point decrease in the average securities yield. Interest income on other interest bearing assets increased by $253,000 to $402,000 for the year ended December 31, 2010 from $149,000 for the year ended December 31, 2009 due to an increase in cash balances invested at the Federal Reserve Bank.
Interest and dividend income increased by $305,000 to $61.5 million for the year ended December 31, 2009 from $61.2 million for the year ended December 31, 2008. Interest income on loans increased by $622,000, or 1.8%, to $35.8 million for the year ended December 31, 2009 from $35.2 million for the year ended December 31, 2008. The increase in interest income on loans was primarily due to a $12.7 million increase in the average balance. Interest income on securities decreased by $320,000, or 1.2%, to $25.6 million for the year ended December 31, 2009 from $25.9 million for the year ended December 31, 2008. The decrease in interest income on securities primarily occurred because of a 15 basis point decrease in the average yield to 4.74% for the year ended December 31, 2009 from 4.89% for the year ended December 31, 2008.
Interest Expense. Interest expense decreased by $5.2 million, or 25.8%, to $14.8 million for the year ended December 31, 2010 from $20.0 million for the year ended December 31, 2009. Interest expense on deposits decreased $3.7 million, or 26.4%, to $10.4 million for the year ended December 31, 2010 compared to $14.1 million for the year ended December 31, 2009. The decline in interest expense on deposits was primarily caused by a $3.5 million decrease in interest expense on certificates of deposit. In 2010, the average rate paid on certificates of deposit decreased by 67 basis points to 1.14% and we experienced a $108.7 million, or 32.2%, decrease in the average balance of certificates of deposit. Most of the funds from these maturing certificates of deposit were transferred to savings accounts. In 2010, the average balance of savings accounts grew by $204.3 million while the average rate we paid on these accounts decreased by 44 basis points. We lowered the rates we pay on certificates of deposit and savings accounts due to declining market interest rates and increased liquidity from principal repayments on loans and mortgage-backed securities. Interest expense on subordinated debentures and securities sold under agreements to repurchase decreased by $1.5 million, or 26.5%, because the average balance decreased by $40.3 million to $106.4 million for the year ended December 31, 2010. The decrease in the average balance occurred when we paid off $25.0 million of securities sold under agreements to repurchase in the three months ended March 31, 2010 and $24.7 million of subordinated debentures in the three months ended September 30, 2009. Interest expense on Federal Home Loan Bank advances increased by $120,000 during the year ended December 31, 2010 as we obtained a $10.0 million advance during the three months ended June 30, 2010.
Interest expense decreased $5.3 million, or 20.8%, to $20.0 million for the year ended December 31, 2009 from $25.2 million for the year ended December 31, 2008. Interest expense on deposits decreased $4.4 million, or 23.7%, caused by a $6.3 million, or 50.9%, decrease in interest expense on certificates of deposit. The decrease in interest expense on certificates of deposit occurred when the average balance of certificates of deposit decreased by $65.9 million, or 16.3%, and the rates we paid on certificates of deposit decreased 128 basis points. The decrease in interest expense on certificates of deposit was partially offset by a $1.8 million increase in interest expense on savings accounts. The increase in interest expense on savings accounts occurred because of a $119.1 million increase in the average balance of savings accounts. The increase in savings accounts occurred as we continued to offer higher than market rates for these accounts. Interest expense on other borrowings also decreased by $389,000, or 6.3%. The decrease in interest expense on other borrowings occurred primarily when the average rate on borrowings declined by 59 basis points from 4.55% for the year ended December 31, 2008 to 3.96% for the year ended December 31, 2009. The decrease in interest expense which occurred because
54
of the drop in the average rate was partially offset by a $10.4 million increase in the average balance of other borrowings. In 2009, interest expense on Federal Home Loan Bank advances decreased by $482,000, or 93.6%, as the average balance of advances decreased by $17.1 million and the average rate we paid decreased by 161 basis points.
Provision for Loan Losses. Based on our analysis of the factors described in “Allowance for Loan Losses,” we recorded provisions for loan losses of $345,000, $1.2 million and $149,000 for the years ended December 31, 2010, 2009 and 2008, respectively. The provisions for loan losses reflected net chargeoffs of $538,000, $416,000 and $18,000 for the years ended December 31, 2010, 2009 and 2008, respectively. The provisions recorded resulted in ratios of the allowance for loan losses to total loans of 0.23%, 0.28% and 0.14% at December 31, 2010, 2009 and 2008, respectively. Non-accrual loans totaled $808,000, $520,000 and $149,000 at December 31, 2010, 2009 and 2008, respectively. To the best of our knowledge, we have provided for all losses that are both probable and reasonable to estimate at December 31, 2010, 2009 and 2008.
Non-Interest Income. The following table summarizes changes in non-interest income for the years ended December 31, 2010, 2009 and 2008.
| Years Ended December 31, | Change 2010/2009 | Change 2009/2008 | ||||||||||||||||||||||||||
| 2010 | 2009 | 2008 | $ Change | % Change | $ Change | % Change | ||||||||||||||||||||||
| (In thousands) | ||||||||||||||||||||||||||||
| Service fees on loan and deposit accounts |
$ | 2,401 | $ | 2,611 | $ | 2,918 | $ | (210 | ) | (8.0 | )% | $ | (307 | ) | (10.5 | )% | ||||||||||||
| Income on bank-owned life insurance |
1,017 | 1,142 | 1,039 | (125 | ) | (10.9 | )% | 103 | 9.9 | % | ||||||||||||||||||
| Other-than-temporary-impairment loss on investments |
(2,404 | ) | (3,481 | ) | (2,483 | ) | 1,077 | (30.9 | )% | (998 | ) | 40.2 | % | |||||||||||||||
| Gain on sale of investment securities |
350 | 266 | 146 | 84 | 31.6 | % | 120 | 82.2 | % | |||||||||||||||||||
| Gain on sale of loans |
442 | 1,636 | 2 | (1,194 | ) | (73.0 | )% | 1,634 | 81,700.0 | % | ||||||||||||||||||
| Other |
322 | 331 | 551 | (9 | ) | (2.7 | )% | (220 | ) | (39.9 | )% | |||||||||||||||||
| Total |
$ | 2,128 | $ | 2,505 | $ | 2,173 | $ | (377 | ) | (15.0 | )% | $ | 332 | 15.3 | % | |||||||||||||
Non-interest income declined by $377,000 to $2.1 million for the year ended December 31, 2010 from $2.5 million for the year ended December 31, 2009. We recognized other-than-temporary impairment losses on trust preferred securities of $2.4 million and $3.5 million for the years ended December 31, 2010 and 2009. The $3.5 million impairment charge for 2009 includes the $2.5 million that was previously reflected as a charge against income in 2008. Due to revisions in accounting pronouncements, we were required to once again charge income in the amount of $2.5 million for the year ended December 31, 2009 for the same security. Our investment in trust preferred securities is further discussed in “Item 1A. Risk Factors.” We sold $45.1 million of mortgage loans for the year ended December 31, 2010 to reduce our interest rate risk and recognized a gain of $442,000. For the year ended December 31, 2009 we sold $85.2 million of mortgage loans and recognized a gain of $1.6 million.
Non-interest income rose by $332,000 to $2.5 million for the year ended December 31, 2009 from $2.2 million for the year ended December 31, 2008. We recognized an other-than-temporary impairment loss on trust preferred securities of $2.5 million for the year ended December 31, 2008. We sold $1.4 million of mortgage loans for the year ended December 31, 2008 and recognized a gain of $2,000.
55
Non-Interest Expense. The following table summarizes changes in non-interest expense for the years ended December 31, 2010, 2009 and 2008.
| Years Ended December 31, | Change 2010/2009 | Change 2009/2008 | ||||||||||||||||||||||||||
| 2010 | 2009 | 2008 | $ Change | % Change | $ Change | % Change | ||||||||||||||||||||||
| (In thousands) | ||||||||||||||||||||||||||||
| Salaries and employee benefits |
$ | 18,793 | $ | 16,449 | $ | 15,430 | $ | 2,344 | 14.3 | % | $ | 1,019 | 6.6 | % | ||||||||||||||
| Occupancy |
4,719 | 4,492 | 4,291 | 227 | 5.1 | % | 201 | 4.7 | % | |||||||||||||||||||
| Equipment |
2,963 | 2,967 | 2,866 | (4 | ) | (0.1 | )% | 101 | 3.5 | % | ||||||||||||||||||
| Loss on extinguishment of debt |
— | 507 | — | (507 | ) | (100.0 | )% | 507 | — | % | ||||||||||||||||||
| Federal deposit insurance premiums |
1,195 | 1,747 | 1,079 | (552 | ) | (31.6 | )% | 668 | 61.9 | % | ||||||||||||||||||
| Other |
3,860 | 3,383 | 3,337 | 477 | 14.1 | % | 46 | 1.4 | % | |||||||||||||||||||
| Total |
$ | 31,530 | $ | 29,545 | $ | 27,003 | $ | 1,985 | 6.7 | % | $ | 2,542 | 9.4 | % | ||||||||||||||
Non-interest expense rose by $2.0 million to $31.5 million for the year-ended December 31, 2010 from $29.5 million for the year ended December 31, 2009. Salaries and employee benefits expense increased by $2.3 million to $18.8 million for the year ended December 31, 2010 from $16.4 million for the year ended December 31, 2009. The increase was primarily due to $989,000 of expenses accrued for the equity incentive plan which was approved by stockholders in August 2010, a $244,000 increase in expenses accrued for our employee stock ownership plan, a 2.0% bank-wide budgeted salary increase which was effective July 1, 2010, higher cash bonus accruals, a $106,000 increase in health insurance expenses, a $125,000 increase in payroll taxes and a $232,000 increase in supplemental employee retirement plan expenses. In 2009, we recognized a $507,000 loss on extinguishment of debt when we paid off $24.7 million of subordinated debentures and wrote off unamortized costs related to the issuance of these debentures. In 2010, Federal deposit insurance premiums decreased by $552,000 primarily as a result of a special one-time premium imposed on all Federal Deposit Insurance Corporation insured financial institutions in 2009. Other non-interest expense rose by $477,000 to $3.9 million for the year ended December 31, 2010 from $3.4 million for the year ended December 31, 2009. The increase in other non-interest expense was primarily due to increases in legal, accounting and insurance expenses associated with being a publicly held company. These include expenses to file SEC reports and to document and test internal controls to comply with the Sarbanes-Oxley Act.
Non-interest expense rose by $2.5 million to $29.5 million for the year ended December 31, 2009 from $27.0 million for the year ended December 31, 2008. Salaries and employee benefits expense increased by $1.0 million to $16.4 million for the year ended December 31, 2009 from $15.4 million for the year ended December 31, 2008. The increase was primarily due to $902,000 of expenses related to our employee stock ownership plan, a 2.5% bank-wide budgeted salary increase which was effective July 1, 2009 and higher cash bonus accruals. The increase in these expenses was partially offset by a $576,000 decrease in pension plan expense which occurred when the pension plan was frozen. Federal deposit insurance premiums increased by $668,000 as a result of a special one-time premium imposed on all Federal Deposit Insurance Corporation insured financial institutions. In 2009, we also recognized a $507,000 loss on extinguishment of debt when we paid off $24.7 million of subordinated debentures and wrote off unamortized costs related to the issuance of these debentures.
Income Tax Expense. Income taxes were $5.5 million for 2010, reflecting an effective tax rate of 33.3%, $4.6 million for 2009, reflecting an effective tax rate of 34.9% and $3.8 million for 2008, reflecting an effective tax rate of 34.5%. The effective tax rate in 2010 was lower than the tax rates in 2009 and 2008 primarily due to a $1.0 million tax refund from the State of Hawaii as settlement of a tax case involving dividend received deductions. The refund was subject to federal and state income taxes.
56
Non-performing and Problem Assets
When a residential mortgage loan or home equity line of credit is 15 days past due, we attempt personal, direct contact with the borrower to determine when payment will be made. On the first day of the following month, we mail a letter reminding the borrower of the delinquency, and will send an additional letter when a loan is 60 days or more past due. If necessary, subsequent late charges are issued and the account will be monitored on a regular basis thereafter. By the 75th day of delinquency, unless the borrower has made arrangements to bring the loan current on its payments, we will refer the loan to legal counsel to commence foreclosure proceedings. Upon the recommendation of our Vice President of Mortgage Loan Servicing, our Senior Vice President of Special Credits can shorten these time frames.
Commercial business loans, commercial real estate loans and consumer loans are generally handled in the same manner as residential mortgage loans or home equity lines of credit. All commercial business loans that are 15 days past due are immediately referred to our senior lending officer. In addition, we generate past due notices and attempt direct contact with a borrower when a consumer loan is 10 days past due. Because of the nature of the collateral securing consumer loans, we may commence collection procedures faster for consumer loans than for residential mortgage loans or home equity lines of credit.
Loans are placed on non-accrual status when payment of principal or interest is more than 90 days delinquent. Loans are also placed on non-accrual status if collection of principal or interest in full is in doubt. When loans are placed on a non-accrual status, unpaid accrued interest is fully reversed, and further income is recognized only to the extent received. The loan may be returned to accrual status if both principal and interest payments are brought current and full payment of principal and interest is expected.
Non-Performing Assets. The table below sets forth the amounts and categories of our non-performing assets at the dates indicated.
| At December 31, | ||||||||||||||||||||
| 2010 | 2009 | 2008 | 2007 | 2006 | ||||||||||||||||
| (Dollars in thousands) | ||||||||||||||||||||
| Non-accrual loans: |
||||||||||||||||||||
| Real estate loans: |
||||||||||||||||||||
| First mortgage: |
||||||||||||||||||||
| One- to four-family residential |
$ | 801 | $ | 517 | $ | — | $ | 99 | $ | 561 | ||||||||||
| Multi-family residential |
— | — | — | — | — | |||||||||||||||
| Construction, commercial and other |
2 | — | — | — | — | |||||||||||||||
| Home equity loans and lines of credit |
— | — | 149 | — | 32 | |||||||||||||||
| Other loans |
5 | 3 | — | 7 | — | |||||||||||||||
| Total non-accrual loans |
808 | 520 | 149 | 106 | 593 | |||||||||||||||
| Real estate owned: |
||||||||||||||||||||
| Real estate loans: |
||||||||||||||||||||
| First mortgage: |
||||||||||||||||||||
| One- to four-family residential |
— | 159 | 131 | — | — | |||||||||||||||
| Multi-family residential |
— | — | — | — | — | |||||||||||||||
| Construction, commercial and other |
— | — | — | — | — | |||||||||||||||
| Home equity loans and lines of credit |
— | — | — | — | — | |||||||||||||||
| Other loans |
— | — | — | — | — | |||||||||||||||
| Total real estate owned |
— | 159 | 131 | — | — | |||||||||||||||
| Total non-performing assets |
808 | 679 | 280 | 106 | 593 | |||||||||||||||
57
| At December 31, | ||||||||||||||||||||
| 2010 | 2009 | 2008 | 2007 | 2006 | ||||||||||||||||
| (Dollars in thousands) | ||||||||||||||||||||
| Loans delinquent 90 days or greater and still accruing interest: |
||||||||||||||||||||
| Real estate loans: |
||||||||||||||||||||
| First mortgage: |
||||||||||||||||||||
| One- to four-family residential |
— | — | — | — | — | |||||||||||||||
| Multi-family residential |
— | — | — | — | — | |||||||||||||||
| Construction, commercial and other |
— | — | — | — | — | |||||||||||||||
| Home equity loans and lines of credit |
— | — | — | — | — | |||||||||||||||
| Other loans |
— | — | — | — | — | |||||||||||||||
| Total loans delinquent 90 days or greater and still accruing interest |
— | — | — | — | — | |||||||||||||||
| Restructured loans still accruing interest: |
||||||||||||||||||||
| Real estate loans: |
||||||||||||||||||||
| First mortgage: |
||||||||||||||||||||
| One- to four-family residential |
2,600 | 2,724 | 309 | — | — | |||||||||||||||
| Multi-family residential |
— | — | — | — | — | |||||||||||||||
| Construction, commercial and other |
— | — | — | — | — | |||||||||||||||
| Home equity loans and lines of credit |
— | — | — | — | — | |||||||||||||||
| Other loans |
— | — | — | — | — | |||||||||||||||
| Total restructured loans still accruing interest |
2,600 | 2,724 | 309 | — | — | |||||||||||||||
| Total non-performing assets, accruing loans delinquent for 90 days or more and restructured loans still accruing interest |
$ | 3,408 | $ | 3,403 | $ | 589 | $ | 106 | $ | 593 | ||||||||||
| Ratios: |
||||||||||||||||||||
| Non-performing loans to total loans |
0.12 | % | 0.09 | % | 0.02 | % | 0.02 | % | 0.11 | % | ||||||||||
| Non-performing assets to total assets |
0.06 | % | 0.05 | % | 0.02 | % | 0.01 | % | 0.05 | % | ||||||||||
For the year ended December 31, 2010, gross interest income that would have been recorded had our non-accruing loans been current in accordance with their original terms was $36,000. We recognized $0 interest income on such non-accruing loans on a cash basis during the year.
The Company had nine troubled debt restructurings totaling $2.6 million as of December 31, 2010, all of which were one- to four-family residential mortgage loans and considered to be impaired. All of the loans are performing in accordance with their restructured terms and accruing interest at December 31, 2010. There were nine restructured one- to four-family residential mortgage loans totaling $3.0 million as of December 31, 2009 that were considered to be impaired. Eight of the loans totaling $2.7 million were still accruing interest at December 31, 2009. Restructurings include deferrals of interest and/or principal payments and temporary or permanent reductions in interest rates due to the financial difficulties of the borrowers.
We also grant concessions that we do not consider troubled debt restructurings. At December 31, 2010, we had five such modified loans totaling $1.5 million where we permitted the borrowers to make only interest and escrow payments for a short period of time, not exceeding one year. At December 31, 2009, we had one such modified loan totaling $329,000 where we permitted the borrower to make only interest and escrow payments for a short period of time, not exceeding one year. The loan payments on these modified loans are re-amortized at the end of the loan modification period.
58
Delinquent Loans. The following table sets forth our loan delinquencies by type and by amount at the dates indicated.
| Loans Delinquent For | Total | |||||||||||||||||||||||
| 60-89 Days | 90 Days and Over | |||||||||||||||||||||||
| Number | Amount | Number | Amount | Number | Amount | |||||||||||||||||||
| (Dollars in thousands) | ||||||||||||||||||||||||
| At December 31, 2010 |
||||||||||||||||||||||||
| Real estate loans: |
||||||||||||||||||||||||
| First mortgage: |
||||||||||||||||||||||||
| One- to four-family residential |
— | $ | — | 5 | $ | 801 | 5 | $ | 801 | |||||||||||||||
| Multi-family residential |
— | — | — | — | — | — | ||||||||||||||||||
| Construction, commercial and other |
— | — | 1 | 2 | 1 | 2 | ||||||||||||||||||
| Home equity loans and lines of credit |
— | — | — | — | — | — | ||||||||||||||||||
| Other loans |
3 | 8 | 1 | 5 | 4 | 13 | ||||||||||||||||||
| Total loans |
3 | $ | 8 | 7 | $ | 808 | 10 | $ | 816 | |||||||||||||||
| At December 31, 2009 |
||||||||||||||||||||||||
| Real estate loans: |
||||||||||||||||||||||||
| First mortgage: |
||||||||||||||||||||||||
| One- to four-family residential |
— | $ | — | 1 | $ | 274 | 1 | $ | 274 | |||||||||||||||
| Multi-family residential |
— | — | — | — | — | — | ||||||||||||||||||
| Construction, commercial and other |
— | — | — | — | — | — | ||||||||||||||||||
| Home equity loans and lines of credit |
— | — | — | — | — | — | ||||||||||||||||||
| Other loans |
1 | 1 | 4 | 3 | 5 | 4 | ||||||||||||||||||
| Total loans |
1 | $ | 1 | 5 | $ | 277 | 6 | $ | 278 | |||||||||||||||
| At December 31, 2008 |
||||||||||||||||||||||||
| Real estate loans: |
||||||||||||||||||||||||
| First mortgage: |
||||||||||||||||||||||||
| One- to four-family residential |
3 | $ | 871 | — | $ | — | 3 | $ | 871 | |||||||||||||||
| Multi-family residential |
— | — | — | — | — | — | ||||||||||||||||||
| Construction, commercial and other |
— | — | — | — | — | — | ||||||||||||||||||
| Home equity loans and lines of credit |
— | — | — | — | — | — | ||||||||||||||||||
| Other loans |
1 | 3 | — | — | 1 | 3 | ||||||||||||||||||
| Total loans |
4 | $ | 874 | — | $ | — | 4 | $ | 874 | |||||||||||||||
| At December 31, 2007 |
||||||||||||||||||||||||
| Real estate loans: |
||||||||||||||||||||||||
| First mortgage: |
||||||||||||||||||||||||
| One- to four-family residential |
— | $ | — | 1 | $ | 99 | 1 | $ | 99 | |||||||||||||||
| Multi-family residential |
— | — | — | — | — | — | ||||||||||||||||||
| Construction, commercial and other |
— | — | — | — | — | — | ||||||||||||||||||
| Home equity loans and lines of credit |
1 | 55 | — | — | 1 | 55 | ||||||||||||||||||
| Other loans |
3 | 4 | 2 | 7 | 5 | 11 | ||||||||||||||||||
| Total loans |
4 | $ | 59 | 3 | $ | 106 | 7 | $ | 165 | |||||||||||||||
| At December 31, 2006 |
||||||||||||||||||||||||
| Real estate loans: |
||||||||||||||||||||||||
| First mortgage: |
||||||||||||||||||||||||
| One- to four-family residential |
1 | $ | 99 | 2 | $ | 561 | 3 | $ | 660 | |||||||||||||||
| Multi-family residential |
— | — | — | — | — | — | ||||||||||||||||||
| Construction, commercial and other |
— | — | — | — | — | — | ||||||||||||||||||
| Home equity loans and lines of credit |
— | — | 1 | 32 | 1 | 32 | ||||||||||||||||||
| Other loans |
1 | 3 | — | — | 1 | 3 | ||||||||||||||||||
| Total loans |
2 | $ | 102 | 3 | $ | 593 | 5 | $ | 695 | |||||||||||||||
59
Real Estate Owned. Real estate acquired by us as a result of foreclosure or by deed in lieu of foreclosure is classified as real estate owned. When property is acquired it is recorded at estimated fair market value at the date of foreclosure less the cost to sell, establishing a new cost basis. Estimated fair value generally represents the sale price a buyer would be willing to pay on the basis of current market conditions, including normal terms from other financial institutions. Holding costs and declines in estimated fair market value result in charges to expense after acquisition. At December 31, 2010, 2009, 2008, 2007 and 2006 we had real estate owned of $0, $159,000, $131,000, $0 and $0, respectively.
Classification of Assets. Our policies, consistent with regulatory guidelines, provide for the classification of loans and other assets that are considered to be of lesser quality as substandard, doubtful, or loss assets. An asset is considered substandard if it is inadequately protected by the current net worth and paying capacity of the obligor or of the collateral pledged, if any. Substandard assets include those assets characterized by the distinct possibility that we will sustain some loss if the deficiencies are not corrected. Assets classified as doubtful have all of the weaknesses inherent in those classified substandard with the added characteristic that the weaknesses present make collection or liquidation in full, on the basis of currently existing facts, conditions and values, highly questionable and improbable. Assets (or portions of assets) classified as loss are those considered uncollectible and of such little value that their continuance as assets is not warranted. Assets that do not expose us to risk sufficient to warrant classification in one of the aforementioned categories, but which possess potential weaknesses that deserve our close attention, are required to be designated as special mention. As of December 31, 2010, we had no assets designated as special mention.
We maintain an allowance for loan losses at an amount estimated to equal all credit losses incurred in our loan portfolio that are both probable and reasonable to estimate at a balance sheet date. Our determination as to the classification of our assets and the amount of our loss allowances is subject to review by our principal federal regulator, the Office of Thrift Supervision, which can require that we establish additional loss allowances. We regularly review our asset portfolio to determine whether any assets require classification in accordance with applicable regulations. On the basis of our review of our assets at December 31, 2010, classified assets consisted of substandard assets of $3.1 million, no doubtful assets and loss assets of $1.1 million. The classified assets total at December 31, 2010 includes $710,000 of nonperforming loans, $1.1 million of trust preferred securities and $2.3 million of troubled debt restructurings.
Allowance for Loan Losses
We provide for loan losses based upon the consistent application of our documented allowance for loan loss methodology. All loan losses are charged to the allowance for loan losses and all recoveries are credited to it. Additions to the allowance for loan losses are provided by charges to income based on various factors which, in our judgment, deserve current recognition in estimating probable losses. We regularly review the loan portfolio and make provisions for loan losses in order to maintain the allowance for loan losses in accordance with GAAP. The allowance for loan losses consists primarily of two components:
| (1) | specific allowances established for impaired loans (generally defined as loans delinquent 90 days or greater). The amount of impairment provided for as a specific allowance is represented by the deficiency, if any, between the estimated fair value of the loan, less selling costs, and the carrying value of the loan. For collateral dependent loans, the specific allowance is based on the deficiency between the fair value of the underlying |
60
| collateral, less selling costs, and the carrying value of the loan. If the estimated fair value of the loan or the fair value of the underlying collateral, less selling costs, exceeds the carrying value of the loan, the excess is not considered in establishing specific allowances for loan losses; and |
| (2) | general allowances established for loan losses on a portfolio basis for loans that do not meet the definition of impaired in accordance with current accounting standards. The portfolio is grouped into similar risk characteristics, primarily loan type and delinquency status. We apply an estimated loss rate to each loan group. The loss rates applied are based upon our loss experience adjusted, as appropriate, for the environmental factors discussed below. This evaluation is inherently subjective, as it requires material estimates that may be susceptible to significant revisions based upon changes in economic and real estate market conditions. Actual loan losses may be significantly more than the allowance for loan losses we have established, which could have a material negative effect on our financial results. |
Residential mortgage loans represent the largest segment of the Company’s loan portfolio. All of the residential mortgage loans are secured by a first mortgage on residential real estate in Hawaii, consist primarily of fixed-rate mortgage loans which have been underwritten to Freddie Mac and Fannie Mae guidelines and have similar risk characteristics. The loan loss allowance is determined by first calculating the historical loss rate for this segment of the portfolio. The loss rate may be adjusted for qualitative and environmental factors. The allowance for loan loss is calculated by multiplying the adjusted loss rate by the total loans in this segment of the portfolio.
The adjustments to historical loss experience are based on an evaluation of several qualitative and environmental factors, including:
| • | changes in lending policies and procedures, including changes in underwriting standards and collections, chargeoff and recovery practices; |
| • | changes in international, national, and local economic trends; |
| • | changes in the types of loans in the loan portfolio; |
| • | changes in the experience and ability of personnel in the mortgage loan origination and loan servicing departments; |
| • | changes in the number and amount of delinquent loans and classified assets; |
| • | changes in the type and volume of loans being originated; |
| • | changes in the value of underlying collateral for collateral dependent loans; |
| • | changes in any concentration of credit; and |
| • | external factors such as competition, legal and regulatory requirements on the level of estimated credit losses in the existing loan portfolio. |
61
The Company has a limited loss experience on certain segments of the loan portfolio. The loan loss allowance on these portfolio segments is determined using the loan loss rate of other financial institutions in the State of Hawaii. The allowance for loan loss is calculated by multiplying the loan loss rate of other financial institutions in the state by the total loans in this segment of the Company’s loan portfolio. The Company uses this method of determining the loan loss allowance for the following portfolio segments:
| • | Construction, commercial and other mortgage loans; |
| • | Home equity and home equity lines of credit; and |
| • | Consumer and other loans |
We evaluate our allowance for loan losses based upon the combined total of the specific and general components. Generally, when the loan portfolio increases, absent other factors, the allowance for loan loss methodology results in a higher dollar amount of estimated probable losses than would be the case without the increase. Generally, when the loan portfolio decreases, absent other factors, the allowance for loan loss methodology results in a lower dollar amount of estimated probable losses than would be the case without the decrease. The unallocated allowance is established to provide for probable losses that have been incurred as of the reporting date but are not reflected in the allocated allowance.
We evaluate our loan portfolio on a quarterly basis and the allowance is adjusted accordingly. While we use the best information available to make evaluations, future adjustments to the allowance may be necessary if conditions differ substantially from the information used in making the evaluations. In addition, as an integral part of their examination process, the Office of Thrift Supervision will periodically review the allowance for loan losses. The Office of Thrift Supervision may require us to increase the allowance based on their analysis of information available at the time of their examination.
The following table sets forth activity in our allowance for loan losses for the years indicated.
62
| At or For the Years Ended December 31, | ||||||||||||||||||||
| 2010 | 2009 | 2008 | 2007 | 2006 | ||||||||||||||||
| Balance at beginning of period |
$ | 1,681 | $ | 899 | $ | 768 | $ | 768 | $ | 770 | ||||||||||
| Charge-offs: |
||||||||||||||||||||
| Real estate loans: |
||||||||||||||||||||
| First mortgage: |
||||||||||||||||||||
| One- to four-family residential |
238 | 268 | — | — | — | |||||||||||||||
| Multi-family residential |
— | — | — | — | — | |||||||||||||||
| Construction, commercial and other |
41 | — | — | — | — | |||||||||||||||
| Home equity loans and lines of credit |
— | 149 | — | — | — | |||||||||||||||
| Other loans |
376 | 9 | 23 | 27 | 10 | |||||||||||||||
| Total charge-offs |
655 | 426 | 23 | 27 | 10 | |||||||||||||||
| Recoveries: |
||||||||||||||||||||
| Real estate loans: |
||||||||||||||||||||
| First mortgage: |
||||||||||||||||||||
| One- to four-family residential |
99 | — | — | — | — | |||||||||||||||
| Multi-family residential |
— | — | — | — | — | |||||||||||||||
| Construction, commercial and other |
7 | — | — | — | — | |||||||||||||||
| Home equity loans and lines of credit |
— | — | — | — | — | |||||||||||||||
| Other loans |
11 | 10 | 5 | 2 | 2 | |||||||||||||||
| Total recoveries |
117 | 10 | 5 | 2 | 2 | |||||||||||||||
| Net charge-offs |
(538 | ) | (416 | ) | (18 | ) | (25 | ) | (8 | ) | ||||||||||
| Provision for loan losses |
345 | 1,198 | 149 | 25 | 6 | |||||||||||||||
| Balance at end of year |
$ | 1,488 | $ | 1,681 | $ | 899 | $ | 768 | $ | 768 | ||||||||||
| Ratios: |
||||||||||||||||||||
| Net charge-offs to average loans outstanding |
0.09 | % | 0.07 | % | 0.00 | % | 0.00 | % | 0.00 | % | ||||||||||
| Allowance for loan losses to non-performing loans at end of year |
184.16 | % | 323.27 | % | 603.36 | % | 724.53 | % | 129.51 | % | ||||||||||
| Allowance for loan losses to total loans at end of year |
0.23 | % | 0.28 | % | 0.14 | % | 0.14 | % | 0.14 | % | ||||||||||
63
Allocation of Allowance for Loan Losses. The following tables set forth the allowance for loan losses allocated by loan category and the percent of loans in each category to total loans at the dates indicated. The allowance for loan losses allocated to each category is not necessarily indicative of future losses in any particular category. We have reduced the amount of the unallocated portion of the allowance for loan losses in recent years as a result of refinements to our allowance for loan loss methodology. The allowance for loan losses for each category is affected by external factors affecting the national and Hawaii economies and interest rates. In prior years, the effect of these external factors was reflected in the unallocated category of the allowance for loan losses, however, beginning in 2007, these factors are largely reflected in the allowance for loan losses allocated to each specific loan category.
| At December 31, | ||||||||||||||||||||||||
| 2010 | 2009 | 2008 | ||||||||||||||||||||||
| Allowance for Loan Losses |
Percent of Loans in Each Category to Total Loans |
Allowance for Loan Losses |
Percent of Loans in Each Category to Total Loans |
Allowance for Loan Losses |
Percent of Loans in Each Category to Total Loans |
|||||||||||||||||||
| (Dollars in thousands) | ||||||||||||||||||||||||
| Real estate loans: |
||||||||||||||||||||||||
| First mortgage: |
||||||||||||||||||||||||
| One- to four-family residential |
$ | 577 | 92.99 | % | $ | 536 | 91.25 | % | $ | 53 | 90.52 | % | ||||||||||||
| Multi-family residential |
6 | 0.83 | 14 | 0.63 | 5 | 0.58 | ||||||||||||||||||
| Construction, commercial and other |
277 | 2.22 | 183 | 3.41 | 171 | 3.28 | ||||||||||||||||||
| Home equity loans and lines of credit |
305 | 3.09 | 573 | 3.58 | 405 | 4.67 | ||||||||||||||||||
| Other loans |
208 | 0.87 | 219 | 1.13 | 222 | 0.95 | ||||||||||||||||||
| Total allocated allowance |
1,373 | 100.00 | 1,525 | 100.00 | 856 | 100.00 | ||||||||||||||||||
| Unallocated |
115 | — | 156 | — | 43 | — | ||||||||||||||||||
| Total |
$ | 1,488 | 100.00 | % | $ | 1,681 | 100.00 | % | $ | 899 | 100.00 | % | ||||||||||||
| At December 31, | ||||||||||||||||
| 2007 | 2006 | |||||||||||||||
| Allowance for Loan Losses |
Percent of Loans in Each Category to Total Loans |
Allowance for Loan Losses |
Percent of Loans in Each Category to Total Loans |
|||||||||||||
| (Dollars in thousands) | ||||||||||||||||
| Real estate loans: |
||||||||||||||||
| First mortgage: |
||||||||||||||||
| One- to four-family residential |
$ | 17 | 90.21 | % | $ | 17 | 93.26 | % | ||||||||
| Multi-family residential |
— | 0.80 | — | 0.90 | ||||||||||||
| Construction, commercial and other |
169 | 3.04 | 109 | 2.67 | ||||||||||||
| Home equity loans and lines of credit |
260 | 4.78 | 221 | 2.30 | ||||||||||||
| Other loans |
238 | 1.17 | 174 | 0.87 | ||||||||||||
| Total allocated allowance |
684 | 100.00 | 521 | 100.00 | ||||||||||||
| Unallocated |
84 | — | 247 | — | ||||||||||||
| Total |
$ | 768 | 100.00 | % | $ | 768 | 100.00 | % | ||||||||
64
Management of Market Risk
General. Our most significant form of market risk is interest rate risk because, as a financial institution, the majority of our assets and liabilities are sensitive to changes in interest rates. Therefore, a principal part of our operations is to manage interest rate risk and limit the exposure of our net interest income to changes in market interest rates. Our Board of Directors has established an Asset/Liability Management Committee, which is responsible for evaluating the interest rate risk inherent in our assets and liabilities, for determining the level of risk that is appropriate, given our business strategy, operating environment, capital, liquidity and performance objectives, and for managing this risk consistent with the guidelines approved by the Board of Directors.
Because we have historically operated as a traditional thrift institution, the significant majority of our assets consist of long-term, fixed-rate residential mortgage loans and mortgage backed securities, which we have funded primarily with checking and savings accounts and short-term borrowings. In addition, there is little demand for adjustable-rate mortgage loans in the Hawaii market area. This has resulted in our being particularly vulnerable to increases in interest rates, as our interest-bearing liabilities mature or reprice more quickly than our interest-earning assets.
In 2007, our Board of Directors adopted an Interest Rate Risk Reduction Plan to assist us in reversing this trend and the negative effect on our net income. We hired an outside third-party consultant to assist us in formulating strategies to restructure our balance sheet and reduce our interest rate risk. Following our review of the consultant’s suggestions, we implemented strategies to manage our interest rate risk which included the sale of fixed-rate mortgage loans and extending the maturity of our liabilities.
We continued our efforts to reduce interest rate risk in 2008 by obtaining an additional $60.0 million of long-term, fixed-rate securities sold under agreements to repurchase and through the purchase of $36.8 million of shorter-duration mortgage-backed securities. In 2009, we obtained an additional $15.0 million of long-term, fixed-rate securities sold under agreements to repurchase and purchased $91.4 million of shorter-duration mortgage-backed securities. The interest rates on long-term fixed-rate securities sold under agreements to repurchase in 2008 and 2009 were lower than rates offered on then-available Federal Home Loan Bank advances. In 2009, we also sold $85.2 million of fixed-rate mortgage loan originations and raised $122.3 million of capital in a stock conversion to reduce our interest rate risk. In 2010, we obtained an additional $10.2 million of shorter-duration mortgage-backed securities and sold $45.1 million of fixed-rate mortgage loan originations. In addition, we may utilize the following strategies to further reduce our interest rate risk:
| • | Continuing our efforts to increase our personal and business checking accounts, which are less rate-sensitive than certificates of deposit and which provide us with a stable, low-cost source of funds; |
| • | Continuing to repay short-term borrowings; |
| • | Purchasing mortgage-backed securities with shorter durations; and |
| • | Subject to the maintenance of our credit quality standards, originating commercial loans and home equity lines of credit, which have adjustable interest rates and shorter average lives than first mortgage loans. |
Our policies do not permit hedging activities, such as engaging in futures, options or swap transactions, or investing in high-risk mortgage derivatives, such as collateralized mortgage obligation residual interests, real estate mortgage investment conduit residual interests or stripped mortgage-backed securities. We have no current intention to sell additional loans classified as held for investment at this time.
65
Net Portfolio Value. The Office of Thrift Supervision requires the computation of amounts by which the difference between the present value of an institution’s assets and liabilities (the institution’s net portfolio value or “NPV”) would change in the event of a range of assumed changes in market interest rates. The Office of Thrift Supervision provides all institutions that file a Consolidated Maturity/Rate Schedule as a part of their quarterly Thrift Financial Report with a report that measures the sensitivity of net portfolio value. The Office of Thrift Supervision simulation model uses a discounted cash flow analysis and an option-based pricing approach to measure the interest rate sensitivity of net portfolio value. Historically, the Office of Thrift Supervision model estimated the economic value of each type of asset, liability and off-balance sheet contract using the current interest rate yield curve with instantaneous increases or decreases of 100 to 300 basis points in 100 basis point increments. A basis point equals one-hundredth of one percent, and 100 basis points equals one percent. An increase in interest rates from 3% to 4% would mean, for example, a 100 basis point increase in the “Change in Interest Rates” column below. Given the current relatively low level of market interest rates, an NPV calculation for an interest rate decrease of greater than 100 basis points has not been prepared. The Office of Thrift Supervision provides us with the results of the interest rate sensitivity model, which is based on information we provide to the Office of Thrift Supervision to estimate the sensitivity of our net portfolio value.
The table below sets forth, as of December 31, 2010, the Office of Thrift Supervision’s calculation of the estimated changes in our net portfolio value that would result from the designated instantaneous changes in the interest rate yield curve. Computations of prospective effects of hypothetical interest rate changes are based on numerous assumptions, including relative levels of market interest rates, loan prepayments and deposit decay, and should not be relied upon as indicative of actual results.
66
| Change in Interest Rates (bp) (1) |
Estimated NPV (2) |
Estimated Increase (Decrease) in NPV |
Percentage Change in NPV |
NPV Ratio as a Percent of Present Value of Assets (3)(4) |
Increase (Decrease) in NPV Ratio as a Percent of Present value of Assets (3)(4) |
|||||||||||||||
| (dollars in thousands) | ||||||||||||||||||||
| +300 | $ | 165,857 | $ | (122,087 | ) | (42.40 | )% | 11.69 | % | (7.00 | )% | |||||||||
| +200 | $ | 211,018 | $ | (76,926 | ) | (26.72 | )% | 14.41 | % | (4.28 | )% | |||||||||
| +100 | $ | 254,258 | $ | (33,686 | ) | (11.70 | )% | 16.87 | % | (1.82 | )% | |||||||||
| 0 | $ | 287,944 | — | — | 18.69 | % | — | |||||||||||||
| (100) | $ | 309,573 | $ | 21,629 | 7.51 | % | 19.81 | % | 1.12 | % | ||||||||||
| (1) | Assumes an instantaneous uniform change in interest rates at all maturities. |
| (2) | NPV is the difference between the present value of an institution’s assets and liabilities. |
| (3) | Present value of assets represents the discounted present value of incoming cash flows on interest-earning assets. |
| (4) | NPV Ratio represents NPV divided by the present value of assets. |
The table above indicates that at December 31, 2010, in the event of a 200 basis point increase in interest rates, we would experience a 26.7% decrease in net portfolio value. In the event of a 100 basis point decrease in interest rates, we would experience a 7.5% increase in net portfolio value.
In addition to the Office of Thrift Supervision’s calculations with respect to the effects of changes in interest rates on net portfolio value, we prepare our own internal calculations, which utilizes a single interest rate scenario and prepayment assumption in calculating the market value of fixed- and adjustable-rate loans (compared to the Office of Thrift Supervision model, which uses an option-based pricing methodology). Our model also calculates the average life and value for core deposit intangibles that is based on a core deposit study we completed in 2009, whereas the Office of Thrift Supervision model uses a nationwide study to estimate the average life and value for core deposit intangibles. The following table presents our internal calculations of the estimated changes in our net portfolio value as of December 31, 2010 that would result from the designated instantaneous changes in the interest rate yield curve.
| Change in Interest Rates (bp) (1) |
Estimated NPV (2) |
Estimated Increase (Decrease) in NPV |
Percentage Change in NPV |
NPV Ratio as a Percent of Present Value of Assets (3)(4) |
Increase (Decrease) in NPV Ratio as a Percent of Present value of Assets (3)(4) |
|||||||||||||||
| (dollars in thousands) | ||||||||||||||||||||
| +300 | $ | 244,045 | $ | (39,104 | ) | (13.81 | )% | 16.31 | % | (2.14 | )% | |||||||||
| +200 | $ | 264,080 | $ | (19,069 | ) | (6.73 | )% | 17.42 | % | (1.03 | )% | |||||||||
| +100 | $ | 280,806 | $ | (2,343 | ) | (0.83 | )% | 18.32 | % | (0.13 | )% | |||||||||
| 0 | $ | 283,149 | — | — | 18.45 | % | — | |||||||||||||
| (100) | $ | 249,569 | $ | (33,580 | ) | (11.86 | )% | 16.62 | % | (1.83 | )% | |||||||||
| (1) | Assumes an instantaneous uniform change in interest rates at all maturities. |
| (2) | NPV is the difference between the present value of an institution’s assets and liabilities. |
| (3) | Present value of assets represents the discounted present value of incoming cash flows on interest-earning assets. |
| (4) | NPV Ratio represents NPV divided by the present value of assets. |
Certain shortcomings are inherent in the methodologies used in determining interest rate risk through changes in net portfolio value. Modeling changes in net portfolio value requires making certain assumptions that may or may not reflect the manner in which actual yields and costs respond to changes in market interest rates. In this regard, the net portfolio value tables presented assume that the
67
composition of our interest-sensitive assets and liabilities existing at the beginning of a period remains constant over the period being measured and assume that a particular change in interest rates is reflected uniformly across the yield curve regardless of the duration or repricing of specific assets and liabilities. Accordingly, although the net portfolio value tables provide an indication of our interest rate risk exposure at a particular point in time, such measurements are not intended to and do not provide a precise forecast of the effect of changes in market interest rates on our NPV and net interest income and will differ from actual results.
Liquidity and Capital Resources
Liquidity is the ability to meet current and future financial obligations. Our primary sources of funds consist of deposit inflows, cash balances at the Federal Reserve Bank, loan repayments, advances from the Federal Home Loan Bank of Seattle, securities sold under agreements to repurchase, and maturities and principal repayments on held-to-maturity and available-for-sale securities. While maturities and scheduled amortization of loans and securities are predictable sources of funds, deposit flows and mortgage prepayments are greatly influenced by general interest rates, economic conditions and competition. We have established an Asset/Liability Management Committee, consisting of our President and Chief Executive Officer, our Vice Chairman and Co-Chief Operating Officer, our Senior Vice President and Treasurer and our Vice President and Controller, which is responsible for establishing and monitoring our liquidity targets and strategies in order to ensure that sufficient liquidity exists for meeting the borrowing needs and deposit withdrawals of our customers as well as unanticipated contingencies. We believe that we have enough sources of liquidity to satisfy our short- and long-term liquidity needs as of December 31, 2010.
We regularly monitor and adjust our investments in liquid assets based upon our assessment of:
| (i) | expected loan demand; |
| (ii) | expected deposit flows and borrowing maturities; |
| (iii) | yields available on interest-earning deposits and securities; and |
| (iv) | the objectives of our asset/liability management program. |
Excess liquid assets are invested generally in interest-earning deposits or securities and may also be used to pay off short-term borrowings.
Our most liquid asset is cash. The level of this asset is dependent on our operating, financing, lending and investing activities during any given period. At December 31, 2010, cash and cash equivalents totaled $194.4 million. On that date, we had $10.0 million of Federal Home Loan Bank advances outstanding and $105.2 million in securities sold under agreements to repurchase outstanding, with the ability to borrow an additional $350.3 million under Federal Home Loan Bank advances.
Our cash flows are derived from operating activities, investing activities and financing activities as reported in our Consolidated Statements of Cash Flows included in our Consolidated Financial Statements.
At December 31, 2010, we had $56.3 million in loan commitments outstanding, most of which were for fixed-rate loans. In addition to commitments to originate loans, we had $18.4 million in unused lines of credit to borrowers. Certificates of deposit due within one year of December 31, 2010 totaled $151.6 million, or 14.1% of total deposits. If these deposits do not remain with us, we may be required to
68
seek other sources of funds, including loan sales, brokered deposits, securities sold under agreements to repurchase and Federal Home Loan Bank advances. Depending on market conditions, we may be required to pay higher rates on such deposits or other borrowings than we currently pay on the certificates of deposit due on or before December 31, 2011. We believe, however, based on past experience that a portion of such deposits will remain with us. We have the ability to attract and retain deposits by adjusting the interest rates offered.
Our primary investing activities are originating loans and purchasing mortgage-backed securities. During the years ended December 31, 2010, 2009 and 2008, we originated $203.6 million, $189.2 million and $149.0 million of loans, respectively. During these years, we purchased $166.9 million, $202.5 million and $62.8 million of securities, respectively.
Financing activities consist primarily of activity in deposit accounts and Federal Home Loan Bank advances. We experienced a net increase in deposits of $61.8 million for the year ended December 31, 2010 compared to a net increase in total deposits of $90.8 million for the year ended December 31, 2009. Deposit flows are affected by the overall level of interest rates, the interest rates and products offered by us and our local competitors, and by other factors.
Liquidity management is both a daily and long-term function of business management. If we require funds beyond our ability to generate them internally, borrowing agreements exist with the Federal Home Loan Bank of Seattle, which provide an additional source of funds. We also utilize securities sold under agreements to repurchase as another borrowing source. Federal Home Loan Bank advances increased by $10.0 million for the year ended December 31, 2010, compared to a decrease of $35.8 million for the year ended December 31, 2009. At December 31, 2010, we had the ability to borrow up to an additional $350.3 million from the Federal Home Loan Bank of Seattle. Securities sold under agreements to repurchase decreased by $25.0 million for the year ended December 31, 2010, compared to an increase of $15.0 million for the year ended December 31, 2009.
In 2010, the Company adopted a common stock repurchase program. Shares repurchased will reduce the amount of shares issued and outstanding. The repurchased shares may be reissued in connection with share-based compensation plans and for general corporate purposes. As of December 31, 2010, the Company repurchased 55,707 shares of the total 733,988 shares authorized by the Board of Directors. The 55,707 shares were repurchased at an average cost of $18.44.
Territorial Savings Bank is subject to various regulatory capital requirements, including a risk-based capital measure. The risk-based capital guidelines include both a definition of capital and a framework for calculating risk-weighted assets by assigning balance sheet assets and off-balance sheet items to broad risk categories. At December 31, 2010, Territorial Savings Bank exceeded all regulatory capital requirements. Territorial Savings Bank is considered “well capitalized” under regulatory guidelines. See Note 22 of the Notes to the Consolidated Financial Statements.
The net proceeds from the stock offering significantly increased our liquidity and capital resources. Over time, the initial level of liquidity will be reduced as net proceeds from the stock offering are used for general corporate purposes, including the funding of loans. Our financial condition and results of operations will be enhanced by the net proceeds from the stock offering, resulting in increased net interest-earning assets and net interest income. However, due to the increase in equity resulting from the net proceeds raised in the stock offering, our return on equity will be adversely affected following the stock offering.
69
Off-Balance Sheet Arrangements and Aggregate Contractual Obligations
Commitments. As a financial services provider, we routinely are a party to various financial instruments with off-balance-sheet risks, such as commitments to extend credit and unused lines of credit. While these contractual obligations represent our potential future cash requirements, a significant portion of commitments to extend credit may expire without being drawn upon. Such commitments are subject to the same credit policies and approval process accorded to loans we make. In addition, we enter into commitments to sell mortgage loans. For additional information, see Note 21 of the Notes to the Consolidated Financial Statements.
Contractual Obligations. In the ordinary course of our operations, we enter into certain contractual obligations. Such obligations include operating leases for premises and equipment, agreements with respect to borrowed funds and deposit liabilities and agreements with respect to investments.
The following table summarizes our significant fixed and determinable contractual obligations and other funding needs by payment date at December 31, 2010. The payment amounts represent those amounts due to the recipient and do not include any unamortized premiums or discounts or other similar carrying amount adjustments.
| Payments Due by Period | ||||||||||||||||||||
| Contractual Obligations |
One year or less |
More
than one year to three years |
More than three years to five years |
More than five years |
Total | |||||||||||||||
| (In thousands) | ||||||||||||||||||||
| Long-term debt |
$ | 43,900 | $ | 71,300 | $ | — | $ | — | $ | 115,200 | ||||||||||
| Operating leases |
2,335 | 4,185 | 3,288 | 3,676 | 13,484 | |||||||||||||||
| Capitalized leases |
— | — | — | — | — | |||||||||||||||
| Purchase obligations |
2,233 | 4,042 | 1,848 | — | 8,123 | |||||||||||||||
| Certificates of deposit |
151,603 | 34,753 | 22,827 | — | 209,183 | |||||||||||||||
| Other long-term liabilities |
— | — | — | — | — | |||||||||||||||
| Total |
$ | 200,071 | $ | 114,280 | $ | 27,963 | $ | 3,676 | $ | 345,990 | ||||||||||
| Commitments to extend credit |
$ | 56,319 | $ | — | $ | — | $ | — | $ | 56,319 | ||||||||||
Recent Accounting Pronouncements
In January 2010, the FASB amended the Fair Value Measurements and Disclosures topic of the FASB ASC. The amendment requires disclosures about the significant transfers in and out of Level 1 and Level 2 fair value measurements and the reasons for the transfers, and requires the reconciliation of activity in Level 3 fair value measurements be made on a gross basis. The amendment also clarifies the level of disaggregation required in disclosures and the valuation techniques and inputs used to measure fair value for both recurring and nonrecurring fair value measurements for Level 2 or Level 3 items. The part of the amendment related to the reconciliation of Level 3 activity is effective for interim and annual periods beginning after December 15, 2010. The remaining parts of the amendment are effective for interim and annual periods beginning after December 15, 2009. Except for the part related to the reconciliation of Level 3 activity, the Company adopted the amendment on January 1, 2010 and the Fair Value of Financial Instruments footnote has been updated to include the revised disclosures. The Company does not expect the adoption of the remainder of the amendment to have a material impact on its consolidated financial statements.
In July 2010, the FASB amended the Receivables topic of the FASB ASC. The amendment requires a greater level of disaggregated information about the credit quality of financing receivables and the allowance for credit losses. The amendment also requires disclosures of credit quality indicators, past due information, and modifications of financing receivables. The amendment is effective for interim and annual reporting periods ending on or after December 15, 2010. The Company adopted this amendment on December 31, 2010 and the Loans Receivable footnote has been updated to include the revised disclosures.
70
Impact of Inflation and Changing Prices
Our consolidated financial statements and related notes have been prepared in accordance with U.S. GAAP. U.S. GAAP generally requires the measurement of financial position and operating results in terms of historical dollars without consideration of changes in the relative purchasing power of money over time due to inflation. The impact of inflation is reflected in the increased cost of our operations. Unlike industrial companies, our assets and liabilities are primarily monetary in nature. As a result, changes in market interest rates have a greater impact on performance than the effects of inflation.
| ITEM 7A. | Quantitative and Qualitative Disclosures About Market Risk |
Information required by this item is included in “ITEM 7. Management’s Discussion and Analysis of Financial Condition and Results of Operation,” above.
| ITEM 8. | Financial Statements and Supplementary Data |
71
Report of Independent Registered Public Accounting Firm
The Board of Directors and Stockholders
Territorial Bancorp Inc.:
We have audited the accompanying consolidated balance sheets of Territorial Bancorp Inc. and subsidiaries as of December 31, 2010 and 2009, and the related consolidated statements of income, stockholders’ equity and comprehensive income, and cash flows for each of the years in the three-year period ended December 31, 2010. These consolidated financial statements are the responsibility of the Company’s management. Our responsibility is to express an opinion on these consolidated financial statements based on our audits.
We conducted our audits in accordance with the standards of the Public Company Accounting Oversight Board (United States). Those standards require that we plan and perform the audit to obtain reasonable assurance about whether the financial statements are free of material misstatement. An audit includes examining, on a test basis, evidence supporting the amounts and disclosures in the financial statements. An audit also includes assessing the accounting principles used and significant estimates made by management, as well as evaluating the overall financial statement presentation. We believe that our audits provide a reasonable basis for our opinion.
In our opinion, the consolidated financial statements referred to above present fairly, in all material respects, the financial position of Territorial Bancorp Inc. and subsidiaries as of December 31, 2010 and 2009, and the results of their operations and their cash flows for each of the years in the three-year period ended December 31, 2010, in conformity with U.S. generally accepted accounting principles.
We also have audited, in accordance with the standards of the Public Company Accounting Oversight Board (United States), Territorial Bancorp Inc.’s internal control over financial reporting as of December 31, 2010, based on criteria established in Internal Control – Integrated Framework issued by the Committee of Sponsoring Organizations of the Treadway Commission (COSO), and our report dated March 14, 2011 expressed an unqualified opinion on the effectiveness of the Company’s internal control over financial reporting.
/s/ KPMG LLP
Honolulu, Hawaii
March 14, 2011
72
Report of Independent Registered Public Accounting Firm
The Board of Directors and Stockholders
Territorial Bancorp Inc.:
We have audited Territorial Bancorp Inc.’s (the Company’s) internal control over financial reporting as of December 31, 2010, based on criteria established in Internal Control – Integrated Framework issued by the Committee of Sponsoring Organizations of the Treadway Commission (COSO). The Company’s management is responsible for maintaining effective internal control over financial reporting and for its assessment of the effectiveness of internal control over financial reporting, included in the accompanying Management’s Report on Internal Control over Financial Reporting. Our responsibility is to express an opinion on the Company’s internal control over financial reporting based on our audit.
We conducted our audit in accordance with the standards of the Public Company Accounting Oversight Board (United States). Those standards require that we plan and perform the audit to obtain reasonable assurance about whether effective internal control over financial reporting was maintained in all material respects. Our audit included obtaining an understanding of internal control over financial reporting, assessing the risk that a material weakness exists, and testing and evaluating the design and operating effectiveness of internal control based on the assessed risk. Our audit also included performing such other procedures as we considered necessary in the circumstances. We believe that our audit provides a reasonable basis for our opinion.
A company’s internal control over financial reporting is a process designed to provide reasonable assurance regarding the reliability of financial reporting and the preparation of financial statements for external purposes in accordance with generally accepted accounting principles. A company’s internal control over financial reporting includes those policies and procedures that (1) pertain to the maintenance of records that, in reasonable detail, accurately and fairly reflect the transactions and dispositions of the assets of the company; (2) provide reasonable assurance that transactions are recorded as necessary to permit preparation of financial statements in accordance with generally accepted accounting principles, and that receipts and expenditures of the company are being made only in accordance with authorizations of management and directors of the company; and (3) provide reasonable assurance regarding prevention or timely detection of unauthorized acquisition, use, or disposition of the company’s assets that could have a material effect on the financial statements.
73
Because of its inherent limitations, internal control over financial reporting may not prevent or detect misstatements. Also, projections of any evaluation of effectiveness to future periods are subject to the risk that controls may become inadequate because of changes in conditions, or that the degree of compliance with the policies or procedures may deteriorate.
In our opinion, the Company maintained, in all material respects, effective internal control over financial reporting as of December 31, 2010, based on criteria established in Internal Control – Integrated Framework issued by the Committee of Sponsoring Organizations of the Treadway Commission.
We also have audited, in accordance with the standards of the Public Company Accounting Oversight Board (United States), the consolidated balance sheets of Territorial Bancorp Inc. and subsidiaries as of December 31, 2010 and 2009, and the related consolidated statements of income, stockholders’ equity and comprehensive income, and cash flows for each of the years in the three-year period ended December 31, 2010, and our report dated March 14, 2011 expressed an unqualified opinion on those consolidated financial statements.
/s/ KPMG LLP
Honolulu, Hawaii
March 14, 2011
74
TERRITORIAL BANCORP INC. AND SUBSIDIARIES
Consolidated Balance Sheets
December 31, 2010 and 2009
(Dollars in thousands, except share data)
| 2010 | 2009 | |||||||
| ASSETS |
||||||||
| Cash and cash equivalents |
$ | 194,435 | $ | 135,953 | ||||
| Investment securities available for sale |
15,010 | — | ||||||
| Investment securities held to maturity, at amortized cost (fair value of $546,844 and $606,269 at December 31, 2010 and 2009, respectively) |
530,555 | 598,394 | ||||||
| Federal Home Loan Bank stock, at cost |
12,348 | 12,348 | ||||||
| Loans held for sale |
3,234 | 1,084 | ||||||
| Loans receivable, net |
641,790 | 597,700 | ||||||
| Accrued interest receivable |
4,536 | 4,781 | ||||||
| Premises and equipment, net |
5,426 | 4,495 | ||||||
| Real estate owned |
— | 159 | ||||||
| Bank-owned life insurance |
29,266 | 28,249 | ||||||
| Deferred income taxes receivable |
22 | — | ||||||
| Prepaid expenses and other assets |
6,790 | 6,449 | ||||||
| Total assets |
$ | 1,443,412 | $ | 1,389,612 | ||||
| LIABILITIES AND STOCKHOLDERS’ EQUITY |
||||||||
| Liabilities: |
||||||||
| Deposits |
$ | 1,076,470 | $ | 1,014,668 | ||||
| Advances from the Federal Home Loan Bank |
10,000 | — | ||||||
| Securities sold under agreements to repurchase |
105,200 | 130,200 | ||||||
| Accounts payable and accrued expenses |
20,430 | 18,837 | ||||||
| Current income taxes payable |
577 | 670 | ||||||
| Deferred income taxes payable |
— | 2,661 | ||||||
| Advance payments by borrowers for taxes and insurance |
3,376 | 2,905 | ||||||
| Total liabilities |
1,216,053 | 1,169,941 | ||||||
| Commitments and contingencies |
||||||||
| Stockholders’ Equity: |
||||||||
| Preferred stock, $.01 par value; authorized 50,000,000 shares, no shares issued or outstanding |
— | — | ||||||
| Common stock, $.01 par value; authorized 100,000,000 shares; issued and outstanding 12,177,418 and 12,233,125 shares at December 31, 2010 and 2009, respectively |
122 | 122 | ||||||
| Additional paid-in capital |
119,153 | 118,823 | ||||||
| Unearned ESOP shares |
(8,808 | ) | (9,297 | ) | ||||
| Retained earnings |
119,397 | 111,082 | ||||||
| Accumulated other comprehensive loss |
(2,505 | ) | (1,059 | ) | ||||
| Total stockholders’ equity |
227,359 | 219,671 | ||||||
| Total liabilities and stockholders’ equity |
$ | 1,443,412 | $ | 1,389,612 | ||||
See accompanying notes to consolidated financial statements.
75
TERRITORIAL BANCORP INC. AND SUBSIDIARIES
Consolidated Statements of Income
For the years ended December 31, 2010, 2009 and 2008
(Dollars in thousands, except per share data)
| 2010 | 2009 | 2008 | ||||||||||
| Interest and dividend income: |
||||||||||||
| Investment securities |
$ | 25,754 | $ | 25,601 | $ | 25,809 | ||||||
| Tax-exempt investment securities |
— | — | 112 | |||||||||
| Dividends on Federal Home Loan Bank stock |
— | — | 117 | |||||||||
| Loans |
34,959 | 35,775 | 35,153 | |||||||||
| Other investments |
402 | 149 | 29 | |||||||||
| Total interest and dividend income |
61,115 | 61,525 | 61,220 | |||||||||
| Interest expense: |
||||||||||||
| Deposits |
10,395 | 14,129 | 18,521 | |||||||||
| Advances from the Federal Home Loan Bank |
153 | 33 | 515 | |||||||||
| Securities sold under agreements to repurchase |
4,280 | 5,008 | 4,486 | |||||||||
| Subordinated debentures and other borrowings |
— | 814 | 1,725 | |||||||||
| Total interest expense |
14,828 | 19,984 | 25,247 | |||||||||
| Net interest income |
46,287 | 41,541 | 35,973 | |||||||||
| Provision for loan losses |
345 | 1,198 | 149 | |||||||||
| Net interest income after provision for loan losses |
45,942 | 40,343 | 35,824 | |||||||||
| Non-interest income: |
||||||||||||
| Other-than-temporary impairment losses |
(2,404 | ) | (3,481 | ) | (2,483 | ) | ||||||
| Service fees on loan and deposit accounts |
2,401 | 2,611 | 2,918 | |||||||||
| Income on bank-owned life insurance |
1,017 | 1,142 | 1,039 | |||||||||
| Gain on sale of investment securities |
350 | 266 | 146 | |||||||||
| Gain on sale of loans |
442 | 1,636 | 2 | |||||||||
| Other |
322 | 331 | 551 | |||||||||
| Total non-interest income |
2,128 | 2,505 | 2,173 | |||||||||
| Non-interest expense: |
||||||||||||
| Salaries and employee benefits |
18,793 | 16,449 | 15,430 | |||||||||
| Occupancy |
4,719 | 4,492 | 4,291 | |||||||||
| Equipment |
2,963 | 2,967 | 2,866 | |||||||||
| Loss on extinguishment of debt |
— | 507 | — | |||||||||
| Federal deposit insurance premiums |
1,195 | 1,747 | 1,079 | |||||||||
| Other general and administrative expenses |
3,860 | 3,383 | 3,337 | |||||||||
| Total non-interest expense |
31,530 | 29,545 | 27,003 | |||||||||
| Income before income taxes |
16,540 | 13,303 | 10,994 | |||||||||
| Income taxes |
5,512 | 4,639 | 3,794 | |||||||||
| Net income |
$ | 11,028 | $ | 8,664 | $ | 7,200 | ||||||
| Basic earnings per share (1) |
$ | 0.97 | $ | 0.77 | N/A | |||||||
| Diluted earnings per share (1) |
$ | 0.97 | $ | 0.77 | N/A | |||||||
| Cash dividends declared per common share |
$ | 0.24 | N/A | N/A | ||||||||
| Basic weighted average shares outstanding (1) |
11,322,798 | 11,279,716 | N/A | |||||||||
| Diluted weighted average shares outstanding (1) |
11,369,161 | 11,279,716 | N/A | |||||||||
| (1) | Number of shares for the year ended 2009 are calculated from the effective date of July 10, 2009 to the period end. |
See accompanying notes to consolidated financial statements.
76
TERRITORIAL BANCORP INC. AND SUBSIDIARIES
Consolidated Statements of Stockholders’ Equity
And Comprehensive Income
For the years ended December 31, 2010, 2009 and 2008
(Dollars in thousands, except share data)
| Common Stock |
Additional Paid-in Capital |
Unearned ESOP Shares |
Retained Earnings |
Accumulated Other Comprehensive Income (loss) |
Total Stockholders’ Equity |
|||||||||||||||||||
| Balances at December 31, 2007 |
$ | — | — | — | 93,700 | (1,221 | ) | 92,479 | ||||||||||||||||
| Comprehensive income: |
||||||||||||||||||||||||
| Net income |
— | — | — | 7,200 | — | 7,200 | ||||||||||||||||||
| Other comprehensive loss, net of tax: |
||||||||||||||||||||||||
| Retirement benefit plans: |
||||||||||||||||||||||||
| Net losses arising during the period, net of tax benefits of $248 |
— | — | — | — | (373 | ) | (373 | ) | ||||||||||||||||
| Less: Amortization of prior service credit and net losses recognized during the period in net periodic benefit cost, net of taxes of $51 |
— | — | — | — | 78 | 78 | ||||||||||||||||||
| Total comprehensive income |
6,905 | |||||||||||||||||||||||
| Cash dividends declared |
— | — | — | (3 | ) | — | (3 | ) | ||||||||||||||||
| Balances at December 31, 2008 |
$ | — | — | — | 100,897 | (1,516 | ) | 99,381 | ||||||||||||||||
| Cumulative effect from adoption of FASB ASC Topic 320, net of taxes of $958 |
— | — | — | 1,524 | (1,524 | ) | — | |||||||||||||||||
| Balances at December 31, 2008, as revised |
$ | — | — | — | 102,421 | (3,040 | ) | 99,381 | ||||||||||||||||
| Comprehensive income: |
||||||||||||||||||||||||
| Net income |
— | — | — | 8,664 | — | 8,664 | ||||||||||||||||||
| Other comprehensive loss, net of tax: |
||||||||||||||||||||||||
| Retirement benefit plans: |
||||||||||||||||||||||||
| Net gains arising during the period, net of taxes of $284 |
— | — | — | — | 428 | 428 | ||||||||||||||||||
| Less: Net losses recognized during the period in net periodic benefit cost, net of taxes of $20 |
— | — | — | — | 29 | 29 | ||||||||||||||||||
| Investment securities: |
||||||||||||||||||||||||
| Reduction of noncredit related losses on securities not expected to be sold, net of taxes of $958 |
— | — | — | — | 1,524 | 1,524 | ||||||||||||||||||
| Total comprehensive income |
10,645 | |||||||||||||||||||||||
| Issuance of 12,233,125 shares of common stock net of offering costs |
122 | 118,521 | — | — | — | 118,643 | ||||||||||||||||||
| Purchase of 978,650 ESOP shares |
— | — | (9,787 | ) | — | — | (9,787 | ) | ||||||||||||||||
| Allocation of 48,933 ESOP shares |
— | 302 | 490 | — | — | 792 | ||||||||||||||||||
| Cash dividends declared |
— | — | — | (3 | ) | — | (3 | ) | ||||||||||||||||
| Balances at December 31, 2009 |
$ | 122 | 118,823 | (9,297 | ) | 111,082 | (1,059 | ) | 219,671 | |||||||||||||||
| Comprehensive income: |
||||||||||||||||||||||||
| Net income |
— | — | — | 11,028 | — | 11,028 | ||||||||||||||||||
| Other comprehensive loss, net of tax: |
||||||||||||||||||||||||
| Retirement benefit plans: |
||||||||||||||||||||||||
| Net loss arising during the period, net of taxes of $288 |
— | — | — | — | (459 | ) | (459 | ) | ||||||||||||||||
| Less: Net losses recognized during the period in net periodic benefit cost, net of taxes of $9 |
— | — | — | — | 14 | 14 | ||||||||||||||||||
| Investment securities: |
||||||||||||||||||||||||
| Unrealized loss on securities available for sale, net of taxes of $208 |
— | — | — | — | (322 | ) | (322 | ) | ||||||||||||||||
| Noncredit related losses on securities not expected to be sold, net of taxes of $427 |
— | — | — | — | (679 | ) | (679 | ) | ||||||||||||||||
| Total comprehensive income |
9,582 | |||||||||||||||||||||||
| Cash dividends declared ($0.24 per share) |
— | — | — | (2,713 | ) | — | (2,713 | ) | ||||||||||||||||
| Stock compensation expense |
— | 939 | — | — | — | 939 | ||||||||||||||||||
| Allocation of 48,932 ESOP shares |
— | 418 | 489 | — | — | 907 | ||||||||||||||||||
| Purchase of 55,707 shares of company stock |
— | (1,027 | ) | — | — | — | (1,027 | ) | ||||||||||||||||
| Balances at December 31, 2010 |
$ | 122 | 119,153 | (8,808 | ) | 119,397 | (2,505 | ) | 227,359 | |||||||||||||||
See accompanying notes to consolidated financial statements.
77
TERRITORIAL BANCORP INC. AND SUBSIDIARIES
Consolidated Statements of Cash Flows
For the years ended December 31, 2010, 2009 and 2008
(Dollars in thousands)
| 2010 | 2009 | 2008 | ||||||||||
| Cash flows from operating activities: |
||||||||||||
| Net income |
$ | 11,028 | $ | 8,664 | $ | 7,200 | ||||||
| Adjustments to reconcile net income to net cash provided by operating activities: |
||||||||||||
| Provision for loan losses |
345 | 1,198 | 149 | |||||||||
| Depreciation and amortization |
1,010 | 943 | 1,020 | |||||||||
| Deferred income tax benefit |
(1,769 | ) | (1,829 | ) | (1,014 | ) | ||||||
| Amortization of fees, discounts, and premiums |
91 | (885 | ) | (375 | ) | |||||||
| Origination of loans held for sale |
(47,863 | ) | (85,060 | ) | (1,449 | ) | ||||||
| Proceeds from sales of loans held for sale |
45,071 | 85,612 | 1,438 | |||||||||
| Gain on sale of loans, net |
(442 | ) | (1,636 | ) | (2 | ) | ||||||
| Net gain on sale of real estate owned |
(1 | ) | — | — | ||||||||
| Other-than-temporary impairment loss on investment |
2,404 | 3,481 | 2,483 | |||||||||
| Purchases of investment securities held for trading |
(18,143 | ) | — | — | ||||||||
| Proceeds from sale of investment securities held for trading |
18,244 | — | — | |||||||||
| Gain on sale of investment securities held for trading |
(101 | ) | — | — | ||||||||
| Gain on sale of investment securities available for sale |
(249 | ) | (266 | ) | (146 | ) | ||||||
| Loss on extinguishment of debt |
— | 507 | — | |||||||||
| Net (gain) loss on sale of premises and equipment |
68 | (4 | ) | (13 | ) | |||||||
| ESOP expense |
907 | 792 | — | |||||||||
| Share-based compensation expense |
939 | — | — | |||||||||
| (Increase) decrease in accrued interest receivable |
245 | 6 | (216 | ) | ||||||||
| Net increase in bank-owned life insurance |
(1,017 | ) | (1,142 | ) | (1,039 | ) | ||||||
| Net increase in prepaid expenses and other assets |
(341 | ) | (2,963 | ) | (1,493 | ) | ||||||
| Net increase in accounts payable and accrued expenses |
869 | 964 | 71 | |||||||||
| Net increase (decrease) in federal and state income taxes, net |
(93 | ) | (293 | ) | 243 | |||||||
| Net cash provided by operating activities |
11,202 | 8,089 | 6,857 | |||||||||
| Cash flows from investing activities: |
||||||||||||
| Purchases of investment securities held to maturity |
(102,139 | ) | (184,527 | ) | (53,085 | ) | ||||||
| Purchases of investment securities available for sale |
(64,774 | ) | (17,928 | ) | (9,736 | ) | ||||||
| Principal repayments on investment securities held to maturity |
165,291 | 112,440 | 50,183 | |||||||||
| Principal repayments on investment securities available for sale |
114 | 23 | — | |||||||||
| Proceeds from sale of investment securities held to maturity |
— | — | 10,538 | |||||||||
| Proceeds from sale of investment securities available for sale |
49,365 | 18,172 | 9,871 | |||||||||
| Loan originations, net of principal repayments on loans receivable |
(42,261 | ) | 35,623 | (78,082 | ) | |||||||
| Increase in acquisition value of real estate owned |
— | (28 | ) | — | ||||||||
| Proceeds from sale of real estate owned |
160 | — | — | |||||||||
| Purchases of premises and equipment |
(2,009 | ) | (997 | ) | (1,022 | ) | ||||||
| Proceeds from disposals of premises and equipment |
— | 7 | 31 | |||||||||
| Net cash provided by (used in) investing activities |
3,747 | (37,215 | ) | (71,302 | ) | |||||||
(Continued)
78
TERRITORIAL BANCORP INC. AND SUBSIDIARIES
Consolidated Statements of Cash Flows
For the years ended December 31, 2010, 2009 and 2008
(Dollars in thousands)
| 2010 | 2009 | 2008 | ||||||||||
| Cash flows from financing activities: |
||||||||||||
| Net increase in deposits |
$ | 61,802 | $ | 90,754 | $ | 31,598 | ||||||
| Proceeds from advances from the Federal Home Loan Bank |
10,000 | 55,692 | 645,317 | |||||||||
| Repayments of advances from the Federal Home Loan Bank |
— | (91,483 | ) | (681,526 | ) | |||||||
| Proceeds from reverse repurchase agreements |
1,136 | 15,000 | 205,350 | |||||||||
| Repayments of reverse repurchase agreements |
(26,136 | ) | — | (145,350 | ) | |||||||
| Purchases of Fed Funds |
10 | 39,367 | — | |||||||||
| Sales of Fed Funds |
(10 | ) | (39,367 | ) | — | |||||||
| Repayments of subordinated debt |
— | (24,744 | ) | — | ||||||||
| Net increase (decrease) in advance payments by borrowers for taxes and insurance |
471 | (209 | ) | 520 | ||||||||
| Proceeds from issuance of common stock, net of costs |
— | 108,856 | — | |||||||||
| Purchases of company stock |
(1,027 | ) | — | — | ||||||||
| Cash dividends paid |
(2,713 | ) | (3 | ) | (3 | ) | ||||||
| Net cash provided by financing activities |
43,533 | 153,863 | 55,906 | |||||||||
| Net increase (decrease) in cash and cash equivalents |
58,482 | 124,737 | (8,539 | ) | ||||||||
| Cash and cash equivalents at beginning of the year |
135,953 | 11,216 | 19,755 | |||||||||
| Cash and cash equivalents at end of the year |
$ | 194,435 | $ | 135,953 | $ | 11,216 | ||||||
| Supplemental disclosure of cash flow information: |
||||||||||||
| Cash paid for: |
||||||||||||
| Interest on deposits and borrowings |
$ | 14,965 | $ | 20,095 | $ | 25,460 | ||||||
| Income taxes |
8,374 | 6,761 | 4,565 | |||||||||
| Supplemental disclosure of noncash investing activities: |
||||||||||||
| Loans transferred to real estate owned |
$ | — | $ | — | $ | 131 | ||||||
| Supplemental disclosure of noncash financing activities: |
||||||||||||
| During July 2009, the Company loaned $9.8 million to the Employee Stock Ownership Plan, which was used to acquire 978,650 shares of the Company’s common stock. The loan is secured by the shares purchased and is shown as Unearned ESOP shares in the consolidated balance sheets. |
||||||||||||
See accompanying notes to consolidated financial statements.
79
TERRITORIAL BANCORP INC. AND SUBSIDIARIES
Notes to Consolidated Financial Statements
December 31, 2010, 2009 and 2008
(1) Organization
On November 4, 2008, the Board of Directors of Territorial Mutual Holding Company approved a plan of conversion and reorganization under which the Company would convert from a mutual holding company to a stock holding company. The conversion to a stock holding company was approved by the depositors and borrowers of Territorial Savings Bank and the Office of Thrift Supervision (OTS) and included the filing of a registration statement with the U.S. Securities and Exchange Commission. Upon the completion of the conversion and reorganization on July 10, 2009, Territorial Mutual Holding Company and Territorial Savings Group, Inc. ceased to exist as separate legal entities and Territorial Bancorp Inc. became the holding company for Territorial Savings Bank. A total of 12,233,125 shares were issued in the conversion at $10 per share, raising $122.3 million of gross proceeds. Approximately $3.7 million of conversion expenses have been offset against the gross proceeds. Territorial Bancorp Inc.’s common stock began trading on the NASDAQ Global Select Market under the symbol “TBNK” on July 13, 2009.
Upon completion of the conversion and reorganization, a special “liquidation account” was established in an amount equal to the total equity of Territorial Mutual Holding Company as of December 31, 2008. The liquidation account is to provide eligible account holders and supplemental eligible account holders who maintain their deposit accounts with Territorial Savings Bank after the conversion with a liquidation interest in the unlikely event of the complete liquidation of Territorial Savings Bank after the conversion. The liquidation account will be reduced annually to the extent that eligible account holders and supplemental eligible account holders have reduced their qualifying deposits. Subsequent increases will not restore an eligible account holder’s or supplemental eligible account holder’s interest in the liquidation account. In the event of a complete liquidation of Territorial Savings Bank, and only in such event, each account holder will be entitled to receive a distribution from the liquidation account in an amount proportionate to the adjusted qualifying account balances then held.
(2) Summary of Significant Accounting Policies
| (a) | Description of Business |
The Company provides loan and deposit products and services primarily to individual customers through 26 branches located throughout Hawaii. We deal primarily in residential mortgage loans in the State of Hawaii. The Company’s earnings depend primarily on its net interest income, which is the difference between the interest income earned on interest-earning assets (loans receivable and investments) and the interest expense incurred on interest-bearing liabilities (deposit liabilities and borrowings). Deposits traditionally have been the principal source of the Bank’s funds for use in lending, meeting liquidity requirements, and making investments. The Company also derives funds from receipt of interest and principal on outstanding loans receivable and investments, borrowings from the Federal Home Loan Bank (FHLB) of Seattle, securities sold under agreements to repurchase, and proceeds from issuance of common stock.
| (b) | Principles of Consolidation |
The consolidated financial statements include the accounts and results of operations of Territorial Bancorp Inc. and its wholly owned subsidiaries, Territorial Savings Bank, Territorial Real Estate Company, Inc., Territorial Financial Services, Inc., and Territorial Holdings, Inc. Territorial Holdings, Inc. includes the accounts and results of operations of Territorial Realty, Inc. Significant intercompany balances and transactions have been eliminated in consolidation.
80
TERRITORIAL BANCORP INC. AND SUBSIDIARIES
Notes to Consolidated Financial Statements
December 31, 2010, 2009 and 2008
As of December 31, 2010, Territorial Holdings, Inc. and Territorial Realty, Inc. were liquidated and their accounts and results of operations were incorporated into Territorial Savings Bank.
As of December 31, 2008, the Company had three wholly owned statutory trusts that were considered variable interest entities. In accordance with then existing accounting standards, the trusts were not consolidated as the Company was not the primary beneficiary. All three trusts were terminated in September 2009.
| (c) | Reclassifications |
Certain prior year amounts in the consolidated financial statement footnotes have been reclassified to conform to the current year presentation.
| (d) | Cash and Cash Equivalents |
Cash and cash equivalents includes cash and due from banks, interest-bearing deposits in other banks, federal funds sold, and short-term, highly liquid investments with original maturities of three months or less.
| (e) | Investment Securities |
The Company classifies and accounts for its investment securities as follows: (1) held-to-maturity debt securities in which the Company has the positive intent and ability to hold to maturity are reported at amortized cost; (2) trading securities that are purchased for the purpose of selling in the near term are reported at fair value, with unrealized gains and losses included in current earnings; and (3) available-for-sale securities not classified as either held-to-maturity or trading securities are reported at fair value, with unrealized gains and losses excluded from current earnings and reported as a separate component of equity. At December 31, 2010, the Company classified $15.0 million and $530.6 million of its investments as available-for-sale and held-to-maturity, respectively. At December 31, 2009, the Company classified all of its investments as held-to-maturity.
A decline in the market value of any available-for-sale or held-to-maturity security below cost that is deemed to be other than temporary results in an impairment to reduce the carrying amount to fair value. To determine whether an impairment is other than temporary, the Company considers whether it has the intent not to sell the security for a sufficient period of time to recover the remaining amortized cost basis.
In April 2009, the FASB amended the Investments—Debt and Equity Securities topic of the FASB ASC. This amendment changes the other-than-temporary impairment guidance in U.S. GAAP and disclosure requirements in the financial statements. For securities not expected to be sold, credit related other-than-temporary impairment is recognized in earnings while noncredit related impairment is recognized in other comprehensive income. The amendment is effective for interim and annual reporting periods ending after June 15, 2009, with early adoption permitted for periods ending after March 15, 2009. The Company early adopted the provisions of the amendment on January 1, 2009. As a result, a $1.5 million cumulative adjustment for prior year impairment losses was recorded that increased retained earnings and decreased accumulated other comprehensive income as of the beginning of the year.
81
TERRITORIAL BANCORP INC. AND SUBSIDIARIES
Notes to Consolidated Financial Statements
December 31, 2010, 2009 and 2008
Gains or losses on the sale of investment securities are computed using the specific-identification method. The Company amortizes premiums and accretes discounts associated with investment securities using the interest method over the contractual life of the respective investment security. Such amortization and accretion is included in the interest and dividend income line item in the consolidated statements of income. Dividend and interest income are recognized when earned.
| (f) | Loans Receivable |
This policy applies to all loan classes. Loans receivable are stated at the principal amount outstanding, less the allowance for loan losses, loan origination fees and costs, and commitment fees. Interest on loans receivable is accrued as earned. The Company has a policy of placing loans on a nonaccrual basis when more than 90 days contractually delinquent, or when, in the opinion of management, collection of all or part of the principal balance appears doubtful. Interest, net deferred fees, and discounts on loans classified as nonaccrual are generally recognized on a cash basis. The Company, considering current information and events regarding the borrowers’ ability to repay their obligations, considers a loan to be impaired when it is probable that the Company will be unable to collect all amounts due according to the contractual terms of the loan agreement. When a loan is considered to be impaired, the amount of the impairment is measured based on the present value of expected future cash flows discounted at the loan’s effective interest rate or, if the loan is considered to be collateral dependent, based on the fair value of the collateral. Impairment losses are included in the allowance for loan losses through a charge to the provision for loan losses. Similarly, interest, net deferred fees, and discounts on impaired loans are recognized on a cash basis. A nonaccrual loan may be restored to an accrual basis when principal and interest payments are current and full payment of principal and interest is expected.
| (g) | Loans Held for Sale |
Loans held for sale are stated at the lower of aggregate cost or market value. Net fees and costs of originating loans held for sale are deferred and are included in the basis for determining the gain or loss on sales of loans held for sale.
| (h) | Deferred Loan Origination Fees and Unearned Loan Discounts |
Loan origination and commitment fees and certain direct loan origination costs are being deferred, and the net amount is recognized over the life of the related loan as an adjustment to yield. Net deferred loan fees are amortized using the interest method over the contractual term of the loan, adjusted for actual prepayments. Net unamortized fees on loans paid in full are recognized as a component of interest income.
| (i) | Real Estate Owned |
Real estate operations, net, include operating income and expenses, gains and losses on sales of real estate, and provisions for losses resulting from subsequent declines in fair values. Real estate is valued at the time of foreclosure at fair value, less estimated cost to sell, thereby establishing a new cost basis. The Company obtains appraisals based on recent comparable sales to assist management in estimating the fair value of real estate owned. Subsequent to acquisition, real estate owned is valued at the lower of cost or fair value, less estimated cost to sell. Declines in value are charged to expense through a valuation allowance. Costs related to holding real estate are charged to expense while costs related to development and improvements are capitalized.
82
TERRITORIAL BANCORP INC. AND SUBSIDIARIES
Notes to Consolidated Financial Statements
December 31, 2010, 2009 and 2008
Profits from the sale of real estate are recognized when title has passed, minimum down payment requirements are met, the terms of any notes received are such as to satisfy continuing investment requirements, and the Company is relieved of any requirements for continued involvement with the properties. If the minimum down payment or the continuing investment is not adequate to meet the criteria specified in the Property, Plant and Equipment topic of the Financial Accounting Standards Board (FASB) Accounting Standards Codification (ASC), the Company will defer income recognition and account for such sales using alternative methods, such as installment, deposit, or cost recovery.
| (j) | Allowance for Loan Losses |
The Company’s allowance for credit losses is maintained at a level considered adequate to provide for losses that can be estimated based upon specific and general conditions. All loan losses are charged, and all recoveries are credited, to the allowance for loan losses. Additions to the allowance for loan losses are provided by charges to income based on various factors, which, in the Company’s judgment, deserve current recognition in estimating probable losses. Charge-offs to the allowance are made when management determines that collectibility of all or a portion of a loan is doubtful and available collateral is insufficient to repay the loan. The allowance for loan losses consists primarily of two components:
| (1) | Specific allowances established for impaired loans (generally defined as loans delinquent 90 days or more). The amount of impairment provided as a specific allowance is represented by the deficiency, if any, between the estimated fair value of the loan less selling costs and the carrying value of the loan. For collateral dependent loans, the specific allowance is based on the deficiency between the fair value of the underlying collateral, less selling costs, and the carrying value of the loan. If the estimated fair value of the loan or the fair value of the underlying collateral, less selling costs, exceeds the carrying value of the loan, the excess is not considered in establishing specific allowances for loan losses. |
| (2) | General allowances are established for loan losses on a portfolio basis for loans that do not meet the definition of impaired, in accordance with the Receivables topic of the FASB ASC. The portfolio is grouped into similar risk characteristics, primarily loan type and delinquency status. The Company applies an estimated loss rate to each loan group. The loss rates applied are based upon its loss experience adjusted, as appropriate, for environmental factors discussed below. This evaluation is inherently subjective, as it requires material estimates that may be susceptible to significant revisions based upon changes in economic and real estate market conditions. Actual loan losses may be significantly more than the allowance for loan losses the Company has established, which could have a material negative effect on its financial results. |
Residential mortgage loans represent the largest segment of the Company’s loan portfolio. All of the residential mortgage loans are secured by a first mortgage on residential real estate in Hawaii, consist primarily of fixed-rate mortgage loans which have been underwritten to Freddie Mac and Fannie Mae guidelines and have similar risk characteristics. The loan loss allowance is determined by first calculating the historical loss rate for this segment of the portfolio. The loss rate may be adjusted for qualitative and environmental factors. The allowance for loan loss is calculated by multiplying the adjusted loss rate by the total loans in this segment of the portfolio.
83
TERRITORIAL BANCORP INC. AND SUBSIDIARIES
Notes to Consolidated Financial Statements
December 31, 2010, 2009 and 2008
The adjustments to historical loss experience are based on an evaluation of several qualitative and environmental factors, including:
| • | changes in lending policies and procedures, including changes in underwriting standards and collections, chargeoff and recovery practices; |
| • | changes in international, national, and local economic trends; |
| • | changes in the types of loans in the loan portfolio; |
| • | changes in the experience and ability of personnel in the mortgage loan origination and loan servicing departments; |
| • | changes in the number and amount of delinquent loans and classified assets; |
| • | changes in the type and volume of loans being originated; |
| • | changes in the value of underlying collateral for collateral dependent loans; |
| • | changes in any concentration of credit; and |
| • | external factors such as competition, legal and regulatory requirements on the level of estimated credit losses in the existing loan portfolio. |
The Company has a limited loss experience on certain segments of the loan portfolio. The loan loss allowance on these portfolio segments is determined using the loan loss rate of other financial institutions in the State of Hawaii. The allowance for loan loss is calculated by multiplying the loan loss rate of other financial institutions in the state by the total loans in this segment of the Company’s loan portfolio. The Company uses this method of determining the loan loss allowance for the following portfolio segments:
| • | Construction, commercial and other mortgage loans; |
| • | Home equity and home equity lines of credit; and |
| • | Consumer and other loans |
In addition, the unallocated allowance is established to provide for probable losses that have been incurred as of the reporting date but are not reflected in the allocated allowance.
While the Company uses the best information available to make evaluations, future adjustments to the allowance may be necessary if conditions differ substantially from the information used in making the evaluations. In addition, as an integral part of their examination process, the Office of Thrift Supervision will periodically review the allowance for loan losses. The Office of Thrift Supervision may require the Company to increase the allowance based on their analysis of information available at the time of their examination.
84
TERRITORIAL BANCORP INC. AND SUBSIDIARIES
Notes to Consolidated Financial Statements
December 31, 2010, 2009 and 2008
| (k) | Transfer of Financial Assets |
Transfers of financial assets are accounted for as sales when control is surrendered. Control is surrendered when the assets have been isolated from the Company, the transferee obtains the right to pledge or exchange the assets without constraint, and the Company does not maintain effective control over the transferred assets. Mortgage loans sold for cash are accounted for as sales as the above criteria have been met.
Mortgage loans may also be packaged into securities that are issued and guaranteed by U.S. government-sponsored enterprises. The Company receives 100% of the mortgage-backed securities issued. Securitizations are not accounted for as sales and no gain or loss is recognized. The mortgage-backed securities received in securitizations are valued at amortized cost and classified as held-to-maturity.
Mortgage loan transfers accounted for as sales and securitizations are without recourse and the Company may retain the related rights to service the loans. The retained servicing rights create mortgage servicing assets that are accounted for in accordance with the Transfers and Servicing topic of the FASB ASC. Mortgage servicing assets are initially valued at fair market value and subsequently at the lower of cost or market value and are amortized in proportion to and over the period of estimated net servicing income. Valuations are obtained from independent third-party appraisers on a quarterly basis.
| (l) | Premises and Equipment |
Premises and equipment are stated at cost less accumulated depreciation and amortization. Depreciation is principally computed on the straight-line method over the estimated useful lives of the respective assets. The estimated useful life of buildings and improvements is 30 years, furniture, fixtures, and equipment is 3 to 10 years, and automobiles is 3 years. Leasehold improvements are amortized on a straight-line basis over the shorter of the lease term or estimated useful life of the asset.
| (m) | Income Taxes |
The Company files a consolidated federal income tax return and a consolidated tax return for state franchise and corporate income taxes.
Deferred tax assets and liabilities are recognized using the asset and liability method of accounting for the future tax consequences attributable to differences between the financial statement carrying amounts of existing assets and liabilities and their respective tax bases and net operating loss and tax credit carryforwards. Deferred tax assets and liabilities are measured using the enacted tax rates expected to apply to taxable income in the years in which those temporary differences are expected to be recovered or settled. The effect on deferred tax assets and liabilities of a change in tax rates is recognized in income in the period that includes the enactment date.
We established income tax contingency reserves for potential tax liabilities related to uncertain tax positions. A liability for income tax uncertainties would be recorded for unrecognized tax benefits related to uncertain tax positions where it is more likely than not that the position will be sustained upon examination by a taxing authority.
85
TERRITORIAL BANCORP INC. AND SUBSIDIARIES
Notes to Consolidated Financial Statements
December 31, 2010, 2009 and 2008
As of December 31, 2010 and 2009, the Company has not recognized a liability for income tax uncertainties in the accompanying consolidated balance sheets. Management concluded that a liability for income tax uncertainties is not expected to be recorded within the next 12 months.
In 2010, the Company did not incur any interest or penalties on income taxes. The Company will record interest on income tax penalties, if any, when they are incurred in other expense.
Tax years 2007 to 2009 currently remain subject to examination by the Internal Revenue Service and by the Department of Taxation of the State of Hawaii.
| (n) | Impairment of Long-Lived Assets |
Long-lived assets, such as premises and equipment, are reviewed for impairment whenever events or changes in circumstances indicate that the carrying amount of an asset may not be recoverable. Recoverability of assets to be held and used is measured by a comparison of the carrying amount of an asset to estimated undiscounted future cash flows expected to be generated by the asset. If the carrying amount of an asset exceeds its estimated future cash flows, an impairment charge is recognized by the amount by which the carrying amount of the asset exceeds the fair value of the asset. Assets to be disposed of would be separately presented in the consolidated balance sheets and reported at the lower of the carrying amount or fair value less costs to sell, and are no longer depreciated. The assets and liabilities of a disposed group classified as held-for-sale would be presented separately in the appropriate asset and liability sections of the consolidated balance sheets.
| (o) | Pension Plan |
Pension benefit costs (returns) are charged (credited) to salaries and employee benefits expense, and the corresponding prepaid (accrued) pension cost is recorded in prepaid expenses and other assets or accounts payable and accrued expenses in the consolidated balance sheets. The Company’s policy is to fund pension costs in amounts that will not be less than the minimum funding requirements of the Employee Retirement Income Security Act of 1974 and will not exceed the maximum tax-deductible amounts. The Company generally funds at least the net periodic pension cost, subject to limits and targeted funded status as determined with the consulting actuary.
| (p) | Employee Stock Ownership Plan (ESOP) |
The cost of shares issued to the ESOP, but not yet allocated to participants, is shown as a reduction of stockholders’ equity. Compensation expense is based on the market price of shares as they are committed to be released to participant accounts. Dividends on allocated ESOP shares reduce retained earnings; dividends on unearned ESOP shares reduce debt and accrued interest.
| (q) | Earnings Per Share |
Basic earning per share is computed by dividing net income by the weighted average number of common shares outstanding during the period. Diluted earnings per share is computed by dividing net income by the sum of the weighted average number of shares outstanding plus the dilutive effect of stock options and restricted stock. ESOP shares not committed to be released are not considered outstanding.
86
TERRITORIAL BANCORP INC. AND SUBSIDIARIES
Notes to Consolidated Financial Statements
December 31, 2010, 2009 and 2008
| (r) | Common Stock Repurchase Program |
In 2010, the Company adopted a common stock repurchase program in which shares repurchased reduce the amount of shares issued and outstanding. The repurchased shares may be reissued in connection with share-based compensation plans and for general corporate purposes. As of December 31, 2010, the Company repurchased 55,707 shares of the total 733,988 shares authorized by the Board of Directors. The 55,707 shares were repurchased at an average cost of $18.44.
| (s) | Bank-Owned Life Insurance |
The Company invests in bank-owned life insurance to provide a funding source for benefit plan obligations. Bank-owned life insurance also generally provides noninterest income that is nontaxable. Federal regulations generally limit the investment in bank-owned life insurance to 25% of the Company’s Tier 1 capital plus the allowance for loan losses. At December 31, 2010, this limit was $51.0 million, and the Company had invested $29.3 million in bank-owned life insurance at that date.
| (t) | Use of Estimates |
The preparation of the consolidated financial statements requires management to make a number of estimates and assumptions relating to the reported amount of assets and liabilities and the disclosure of contingent assets and liabilities at the date of the consolidated financial statements and the reported amount of revenues and expenses during the reporting period. Significant items subject to such estimates and assumptions include the allowance for loan losses; valuation of certain investment securities and determination as to whether declines in fair value below amortized cost are other than temporary; valuation allowances for deferred income tax assets; mortgage servicing assets; and assets and obligations related to employee benefit plans. Accordingly, actual results could differ from those estimates.
| (u) | Recently Issued Accounting Pronouncements |
In January 2010, the FASB amended the Fair Value Measurements and Disclosures topic of the FASB ASC. The amendment requires disclosures about the significant transfers in and out of Level 1 and Level 2 fair value measurements and the reasons for the transfers, and requires the reconciliation of activity in Level 3 fair value measurements be made on a gross basis. The amendment also clarifies the level of disaggregation required in disclosures and the valuation techniques and inputs used to measure fair value for both recurring and nonrecurring fair value measurements for Level 2 or Level 3 items. The part of the amendment related to the reconciliation of Level 3 activity is effective for interim and annual periods beginning after December 15, 2010. The remaining parts of the amendment are effective for interim and annual periods beginning after December 15, 2009. Except for the part related to the reconciliation of Level 3 activity, the Company adopted the amendment on January 1, 2010 and the Fair Value of Financial Instruments footnote has been updated to include the revised disclosures. The Company does not expect the adoption of the remainder of the amendment to have a material impact on its consolidated financial statements.
In July 2010, the FASB amended the Receivables topic of the FASB ASC. The amendment requires a greater level of disaggregated information about the credit quality of financing receivables and the allowance for credit losses. The amendment also requires disclosures of credit quality indicators, past due information, and modifications of financing receivables. The amendment is effective for interim and annual reporting periods ending on or after December 15, 2010. The Company adopted this amendment on December 31, 2010 and the Loans Receivable footnote has been updated to include the revised disclosures.
87
TERRITORIAL BANCORP INC. AND SUBSIDIARIES
Notes to Consolidated Financial Statements
December 31, 2010, 2009 and 2008
(3) Cash and Cash Equivalents
The table below presents the balances of cash and cash equivalents as of December 31, 2010 and December 31, 2009:
| December 31, | ||||||||
| (Dollars in thousands) | 2010 | 2009 | ||||||
| Cash and due from banks |
$ | 8,827 | $ | 12,466 | ||||
| Interest-bearing deposits in other banks |
185,608 | 123,487 | ||||||
| Cash and cash equivalents |
$ | 194,435 | $ | 135,953 | ||||
(4) Investment Securities
The amortized cost and fair values of securities classified as held-to-maturity and available for sale are as follows:
| Amortized Cost |
Gross unrealized | Estimated fair value |
||||||||||||||
| (Dollars in thousands) | Gains | Losses | ||||||||||||||
| December 31, 2010: |
||||||||||||||||
| Held to maturity: |
||||||||||||||||
| U.S. government-sponsored mortgage-backed securities |
$ | 530,523 | 18,191 | (1,998 | ) | $ | 546,716 | |||||||||
| Trust preferred securities |
32 | 96 | — | 128 | ||||||||||||
| Total |
$ | 530,555 | 18,287 | (1,998 | ) | $ | 546,844 | |||||||||
| Available for sale: |
||||||||||||||||
| U.S. government-sponsored mortgage-backed securities |
$ | 15,540 | — | (530 | ) | $ | 15,010 | |||||||||
| Total |
$ | 15,540 | — | (530 | ) | $ | 15,010 | |||||||||
| December 31, 2009: |
||||||||||||||||
| Held to maturity: |
||||||||||||||||
| U.S. government-sponsored mortgage-backed securities |
$ | 594,852 | 12,555 | (1,238 | ) | $ | 606,169 | |||||||||
| Trust preferred securities |
3,542 | — | (3,442 | ) | 100 | |||||||||||
| Total |
$ | 598,394 | 12,555 | (4,680 | ) | $ | 606,269 | |||||||||
88
TERRITORIAL BANCORP INC. AND SUBSIDIARIES
Notes to Consolidated Financial Statements
December 31, 2010, 2009 and 2008
The amortized cost and estimated fair value of investment securities at December 31, 2010 are shown below. Incorporated in the maturity schedule are mortgage-backed and trust preferred securities, which are allocated using the contractual maturity as a basis. Expected maturities may differ from contractual maturities because issuers may have the right to call or prepay obligations with or without call or prepayment penalties.
| (Dollars in thousands) | Amortized cost |
Estimated fair value |
||||||
| Held to maturity: |
||||||||
| Due after 5 years through 10 years |
$ | 13,596 | 14,016 | |||||
| Due after 10 years |
516,959 | 532,828 | ||||||
| Total |
$ | 530,555 | 546,844 | |||||
| Held for sale: |
||||||||
| Due after 10 years |
15,540 | 15,010 | ||||||
| Total |
$ | 15,540 | 15,010 | |||||
Realized gains and losses and the proceeds from sales of securities available for sale and trading for the years ended December 31 are shown in the table below. All sales of securities were U.S. government-sponsored mortgage-backed securities.
| (Dollars in thousands) | 2010 | 2009 | 2008 | |||||||||
| Proceeds from sales |
$ | 67,609 | $ | 18,172 | $ | 9,871 | ||||||
| Gross gains |
350 | 266 | 145 | |||||||||
| Gross losses |
— | — | — | |||||||||
There were no sales of held-to-maturity securities during 2010 and 2009. In 2008, the Company received proceeds of $10.5 million from the sale of $10.5 million of held-to-maturity municipal bonds, resulting in gross realized gains and losses of $81,000 and $80,000, respectively. Approximately $5.5 million of these securities experienced a credit downgrade. The remaining securities were sold because of concerns about a potential downgrade of the bond’s insurers.
Investment securities with carrying values of $293.3 million and $315.5 million at December 31, 2010 and 2009, respectively, were pledged to secure public deposits, reverse repurchase agreements, and transaction clearing accounts.
89
TERRITORIAL BANCORP INC. AND SUBSIDIARIES
Notes to Consolidated Financial Statements
December 31, 2010, 2009 and 2008
Provided below is a summary of investment securities, which were in an unrealized loss position at December 31, 2010 and 2009. The Company has the intent and ability to hold these securities until such time as the value recovers or the securities mature.
| Less than 12 months | 12 months or longer | Total | ||||||||||||||||||||||||||
| Description of securities |
Fair value | Unrealized Losses |
Fair value | Unrealized Losses |
Number of securities |
Fair value | Unrealized losses |
|||||||||||||||||||||
| (Dollars in thousands) | ||||||||||||||||||||||||||||
| December 31, 2010 |
||||||||||||||||||||||||||||
| Mortgage-backed securities |
$ | 98,524 | 2,480 | 2,962 | 48 | 17 | 101,486 | 2,528 | ||||||||||||||||||||
| Total |
$ | 98,524 | 2,480 | 2,962 | 48 | 17 | 101,486 | 2,528 | ||||||||||||||||||||
| December 31, 2009 |
||||||||||||||||||||||||||||
| Mortgage-backed securities |
$ | 123,463 | 1,227 | 362 | 11 | 25 | 123,825 | 1,238 | ||||||||||||||||||||
| Trust preferred securities |
— | — | 100 | 3,442 | 1 | 100 | 3,442 | |||||||||||||||||||||
| Total |
$ | 123,463 | 1,227 | 462 | 3,453 | 26 | 123,925 | 4,680 | ||||||||||||||||||||
Mortgage-Backed Securities. The unrealized losses on the Company’s investment in mortgage-backed securities were caused by increases in current market interest rates. All of the mortgage-backed securities are guaranteed by Freddie Mac, Fannie Mae, or Ginnie Mae, which are U.S. government-sponsored enterprises. Since the decline in market value is attributable to changes in interest rates and not credit quality, and the Company has the intent not to sell these investments until maturity, the Company does not consider these investments to be other-than-temporarily impaired as of December 31, 2010 and 2009.
Trust Preferred Securities. At December 31, 2010, the Company owns two trust preferred securities, PreTSL XXIII and XXIV. The trust preferred securities represent investments in a pool of debt obligations issued primarily by holding companies for Federal Deposit Insurance Corporation-insured financial institutions. All of these securities are classified in the Bank’s held-to-maturity investment portfolio.
The trust preferred securities market is considered to be inactive as only three transactions have occurred over the past 12 months in similar tranches to the securities owned by the Company. The Company used a discounted cash flow model to determine whether these securities are other-than-temporarily impaired. The assumptions used in preparing the discounted cash flow model include the following: estimated discount rates, estimated deferral and default rates on collateral, and estimated cash flows.
Based on the Company’s review, the Company’s investment in trust preferred securities incurred a credit-related impairment loss of $2.4 million during the year ending December 31, 2010.
PreTSL XXIV has a book value of $0. PreTSL XXIII has a book value of $32,000. The difference between the book value of $32,000 and the remaining outstanding principal of $1.1 million is reported as other comprehensive loss and is related to non-credit factors such as the trust preferred securities market being inactive.
90
TERRITORIAL BANCORP INC. AND SUBSIDIARIES
Notes to Consolidated Financial Statements
December 31, 2010, 2009 and 2008
It is reasonably possible that the fair values of the trust preferred securities could decline in the near term if the overall economy and the financial condition of some of the issuers continue to deteriorate and the liquidity of these securities remains low. As a result, there is a risk that the Company’s remaining outstanding principal of $1.1 million on its trust preferred securities could be credit-related other-than-temporarily impaired in the near term. The impairment could be material to the Company’s consolidated statements of income.
The table below provides a cumulative roll forward of credit losses recognized in earnings for debt securities held and not intended to be sold:
| (Dollars in thousands) | 2010 | 2009 | ||||||
| Balance at January 1 |
$ | 3,481 | $ | 1 | ||||
| Credit losses on debt securities for which other-than-temporary impairment was not previously recognized |
2,404 | — | ||||||
| Credit losses on debt securities for which other-than-temporary impairment was previously recognized |
— | 3,480 | ||||||
| Balance at December 31 |
$ | 5,885 | $ | 3,481 | ||||
The table below shows the components of comprehensive loss, net of taxes, resulting from other-than-temporarily impaired securities:
| December 31, | ||||||||
| (Dollars in thousands) | 2010 | 2009 | ||||||
| Non-credit losses on other-than-temporarily impaired securities, net of taxes of $427 |
$ | 679 | $ | — | ||||
(5) Federal Home Loan Bank Stock
The Company evaluated its investment in FHLB stock for other-than-temporary impairment as of December 31, 2010, consistent with its accounting policies. Based on the Company’s evaluation of the underlying investment, including the long-term nature of the investment, the liquidity position of the FHLB of Seattle, the actions being taken by the FHLB of Seattle to address its regulatory capital situation and the Company’s intent not to sell the investment for a sufficient period of time to recover the par value, the Company did not consider its FHLB stock other-than-temporarily impaired. As of December 31, 2010, the FHLB of Seattle has met all of its regulatory capital requirements. Moody’s Investor Service and Standard and Poor’s Rating Services have given the FHLB of Seattle credit ratings of Aaa and AA+, respectively. Even though the Company did not recognize an OTTI loss on its investment in FHLB stock in 2010, continued deterioration in the FHLB of Seattle’s financial position may result in future impairment losses.
91
TERRITORIAL BANCORP INC. AND SUBSIDIARIES
Notes to Consolidated Financial Statements
December 31, 2010, 2009 and 2008
(6) Loans Receivable and Allowance for Loan Losses
The components of loans receivable are as follows:
| December 31, | ||||||||
| (Dollars in thousands) | 2010 | 2009 | ||||||
| Real estate loans: |
||||||||
| First mortgages: |
||||||||
| One- to four-family residential |
$ | 604,456 | $ | 555,473 | ||||
| Multifamily residential |
5,408 | 3,807 | ||||||
| Construction, commercial, and other |
14,412 | 20,762 | ||||||
| Home equity loans and lines of credit |
20,064 | 21,789 | ||||||
| Total real estate loans |
644,340 | 601,831 | ||||||
| Other loans: |
||||||||
| Loans on deposit accounts |
895 | 1,109 | ||||||
| Consumer and other loans |
4,740 | 5,786 | ||||||
| Total other loans |
5,635 | 6,895 | ||||||
| Less: |
||||||||
| Net unearned fees and discounts |
(5,585 | ) | (5,255 | ) | ||||
| Undisbursed loan funds |
(1,112 | ) | (4,090 | ) | ||||
| Allowance for loan losses |
(1,488 | ) | (1,681 | ) | ||||
| (8,185 | ) | (11,026 | ) | |||||
| Loans receivable, net |
$ | 641,790 | $ | 597,700 | ||||
The activity in the allowance for loan losses on loans receivable is as follows:
| For the year ended December 31, | ||||||||||||
| (Dollars in thousands) | 2010 | 2009 | 2008 | |||||||||
| Balance, beginning of year |
$ | 1,681 | $ | 899 | $ | 768 | ||||||
| Provision for loan losses |
345 | 1,198 | 149 | |||||||||
| 2,026 | 2,097 | 917 | ||||||||||
| Charge-offs |
(655 | ) | (426 | ) | (23 | ) | ||||||
| Recoveries |
117 | 10 | 5 | |||||||||
| Net charge-offs |
(538 | ) | (416 | ) | (18 | ) | ||||||
| Balance, end of year |
$ | 1,488 | $ | 1,681 | $ | 899 | ||||||
92
TERRITORIAL BANCORP INC. AND SUBSIDIARIES
Notes to Consolidated Financial Statements
December 31, 2010, 2009 and 2008
The table below presents the balance in the allowance for loan losses and the recorded investment in loans by portfolio segment and based on impairment method as of December 31, 2010:
| (Dollars in thousands) | Residential Mortgage |
Construction Commercial And Other Mortgage Loans |
Home Equity and Lines of Credit |
Consumer and Other |
Unallocated | Totals | ||||||||||||||||||
| Allowance for loan losses: |
||||||||||||||||||||||||
| Ending allowance balance: |
||||||||||||||||||||||||
| Individually evaluated for impairment |
$ | — | $ | — | $ | — | $ | — | $ | — | $ | — | ||||||||||||
| Collectively evaluated for impairment |
583 | 277 | 305 | 208 | 115 | 1,488 | ||||||||||||||||||
| Total ending allowance balance |
$ | 583 | $ | 277 | $ | 305 | $ | 208 | $ | 115 | $ | 1,488 | ||||||||||||
| Loans: |
||||||||||||||||||||||||
| Ending loan balance: |
||||||||||||||||||||||||
| Individually evaluated for impairment |
$ | 3,401 | $ | 2 | $ | — | $ | 5 | $ | — | $ | 3,408 | ||||||||||||
| Collectively evaluated for impairment |
600,981 | 13,185 | 20,079 | 5,625 | — | 639,870 | ||||||||||||||||||
| Total ending loan balance |
$ | 604,382 | $ | 13,187 | $ | 20,079 | $ | 5,630 | $ | — | $ | 643,278 | ||||||||||||
The table below presents the balance of impaired loans and the related amount of allocated loan loss allowances as of December 31, 2010 and 2009:
| (Dollars in thousands) | 2010 | 2009 | ||||||
| Loans with no allocated allowance for loan losses |
$ | 3,408 | $ | 3,241 | ||||
| Loans with allocated allowance for loan losses |
— | — | ||||||
| Total impaired loans |
$ | 3,408 | $ | 3,241 | ||||
| Amount of allocated loan loss allowance |
$ | — | $ | — | ||||
The table below presents the balance of impaired loans individually evaluated for impairment by class of loans as of December 31, 2010 and 2009:
| As of December 31 | ||||||||||||
| (Dollars in thousands) | Recorded Investment |
Unpaid Principal Balance |
Related Allowance |
|||||||||
| 2010: |
||||||||||||
| With no related allowance recorded: |
||||||||||||
| One- to four-family residential mortgages |
$ | 3,401 | $ | 3,413 | $ | — | ||||||
| Construction, commercial and other mortgages |
2 | 2 | — | |||||||||
| Consumer and other |
5 | 5 | — | |||||||||
| Total |
$ | 3,408 | $ | 3,420 | $ | — | ||||||
| 2009: |
||||||||||||
| With no related allowance recorded: |
||||||||||||
| One- to four-family residential mortgages |
$ | 3,241 | $ | 3,269 | $ | — | ||||||
| Total |
$ | 3,241 | $ | 3,269 | $ | — | ||||||
93
TERRITORIAL BANCORP INC. AND SUBSIDIARIES
Notes to Consolidated Financial Statements
December 31, 2010, 2009 and 2008
There were no loans individually evaluated for impairment with a related allowance for loan loss as of December 31, 2010 or 2009.
Impaired loans at December 31, 2010 and 2009 amounted to $3.4 million and $3.2 million, respectively, and included all nonaccrual and restructured loans. During the years ended December 31, 2010, 2009 and 2008, the average recorded investment in impaired loans was $3.5 million, $3.3 million and $309,000, respectively. Interest income recognized on impaired loans for the years ended December 31, 2010, 2009 and 2008 was $131,000, $78,000 and $0, respectively.
The table below presents the aging of loans and accrual status by class of loans as of December 31, 2010 and 2009:
| (Dollars in thousands) | 30 – 59 Days Past Due |
60 – 89 Days Past Due |
90 Days or Greater Past Due |
Total Past Due |
Loans Not Past Due |
Total Loans | Nonaccrual Loans |
Loans More Than 90 Days Past Due and Still Accruing |
||||||||||||||||||||||||
| 2010: |
||||||||||||||||||||||||||||||||
| One- to four family residential mortgages |
$ | 1,476 | $ | — | $ | 801 | $ | 2,277 | $ | 596,732 | $ | 599,009 | $ | 801 | $ | — | ||||||||||||||||
| Multifamily residential mortgages |
— | — | — | — | 5,373 | 5,373 | — | — | ||||||||||||||||||||||||
| Construction, commercial and other mortgages |
— | — | 2 | 2 | 13,185 | 13,187 | 2 | — | ||||||||||||||||||||||||
| Home equity and lines of credit |
58 | — | — | 58 | 20,021 | 20,079 | — | — | ||||||||||||||||||||||||
| Loans on deposit accounts |
— | — | — | — | 895 | 895 | — | — | ||||||||||||||||||||||||
| Consumer and other |
10 | 8 | 5 | 23 | 4,712 | 4,735 | 5 | — | ||||||||||||||||||||||||
| Total |
$ | 1,544 | $ | 8 | $ | 808 | $ | 2,360 | $ | 640,918 | $ | 643,278 | $ | 808 | $ | — | ||||||||||||||||
| 2009: |
||||||||||||||||||||||||||||||||
| One- to four-family residential mortgages |
$ | 464 | $ | — | $ | 269 | $ | 733 | $ | 549,730 | $ | 550,463 | $ | 517 | $ | — | ||||||||||||||||
| Multifamily residential mortgages |
— | — | — | — | 3,779 | 3,779 | — | — | ||||||||||||||||||||||||
| Construction, commercial and other mortgages |
— | — | — | — | 16,438 | 16,438 | — | — | ||||||||||||||||||||||||
| Home equity and lines of credit |
— | — | — | — | 21,815 | 21,815 | — | — | ||||||||||||||||||||||||
| Loans on deposit accounts |
— | — | — | — | 1,109 | 1,109 | — | — | ||||||||||||||||||||||||
| Consumer and other |
31 | 1 | 3 | 35 | 5,742 | 5,777 | 3 | — | ||||||||||||||||||||||||
| Total |
$ | 495 | $ | 1 | $ | 272 | $ | 768 | $ | 598,613 | $ | 599,381 | $ | 520 | $ | — | ||||||||||||||||
94
TERRITORIAL BANCORP INC. AND SUBSIDIARIES
Notes to Consolidated Financial Statements
December 31, 2010, 2009 and 2008
The Company primarily uses the aging of loans and accrual status to monitor the credit quality of its loan portfolio. When a mortgage loan becomes seriously delinquent (90 days or more contractually past due), it displays weaknesses which may result in a loss. As a loan becomes more delinquent, the likelihood of the borrower repaying the loan decreases and the loan becomes more collateral dependent. A mortgage loan becomes collateral dependent when the proceeds for repayment can be expected to come only from the sale or operation of the collateral and not from borrower repayments. Generally, appraisals are obtained after a loan becomes collateral dependent or is five months delinquent. The carrying value of collateral dependent loans is adjusted to the fair market value of the collateral less selling costs. Any commercial real estate, commercial, construction or equity loans which have a loan balance in excess of a specified amount are also periodically reviewed to determine whether the loan exhibits any weaknesses and are performing in accordance with their contractual terms.
The Company had seven nonaccrual loans with a book value of $808,000 at December 31, 2010 and six nonaccrual loans with a book value of $520,000 as of December 31, 2009. The Company collected and recognized interest income on nonaccrual loans of $0, $5,000 and $0 during 2010, 2009 and 2008, respectively. The Company would have recognized additional interest income of $36,000, $21,000 and $3,000 throughout 2010, 2009 and 2008, respectively, had the loans been accruing interest. The Company did not have any loans more than 90 days past due and still accruing interest as of December 31, 2010 or 2009.
The Company had nine troubled debt restructurings totaling $2.6 million as of December 31, 2010, all of which were one- to four-family residential mortgage loans and considered to be impaired. All of the loans are performing in accordance with their restructured terms and accruing interest at December 31, 2010. There were nine troubled debt restructured one- to four-family residential mortgage loans totaling $3.0 million as of December 31, 2009 that were considered to be impaired. Eight of the loans totaling $2.7 million were still accruing interest at December 31, 2009. Restructurings include deferrals of interest and/or principal payments and temporary or permanent reductions in interest rates due to the financial difficulties of the borrowers. We have no commitments to lend any additional funds to these borrowers.
Nearly all of our real estate loans are collateralized by real estate located in the State of Hawaii. Loan-to-value ratios on these real estate loans generally do not exceed 80% at the time of origination.
During the years ended December 31, 2010 and 2009, the Company sold $45.1 million and $85.2 million, respectively, of mortgage loans held for sale and recognized gains of $442,000 and $1.6 million, respectively. The Company had 13 loans held for sale totaling $3.2 million at December 31, 2010 and four loans held for sale totaling $1.1 million at December 31, 2009.
The Company serviced loans for others of $131.6 million, $135.6 million, and $63.2 million at December 31, 2010, 2009, and 2008, respectively. Of these amounts, $8.1 million, $10.4 million, and $12.7 million relate to securitizations for which the Company continues to hold the related mortgage-backed securities at December 31, 2010, 2009, and 2008, respectively. The amount of contractually specified servicing fees earned was $396,000, $333,000, and $242,000 for 2010, 2009, and 2008, respectively. The fees are reported in service fees on loan and deposit accounts in the consolidated statements of income.
95
TERRITORIAL BANCORP INC. AND SUBSIDIARIES
Notes to Consolidated Financial Statements
December 31, 2010, 2009 and 2008
In the normal course of business, the Company has made loans to certain directors and executive officers under terms which management believes are consistent with the Company’s general lending policies. Loans to directors and executive officers amounted to $1.5 million at December 31, 2010 and 2009.
(7) Accrued Interest Receivable
The components of accrued interest receivable are as follows:
| December 31, | ||||||||
| (Dollars in thousands) | 2010 | 2009 | ||||||
| Investment securities |
$ | 2,102 | $ | 2,380 | ||||
| Loans receivable |
2,414 | 2,388 | ||||||
| Interest-bearing deposits |
20 | 13 | ||||||
| Total |
$ | 4,536 | $ | 4,781 | ||||
(8) Mortgage Servicing Assets
Mortgage servicing assets are created when the Company sells mortgage loans and retains the rights to service the loans. Mortgage servicing assets are accounted for in accordance with the Transfers and Servicing topic of the FASB ASC and are initially valued at fair value and subsequently at the lower of cost or fair value. We amortize mortgage servicing assets in proportion to and over the period of estimated net servicing income. All servicing assets are grouped into categories based on the interest rate and original term of the loan sold. Mortgage servicing assets related to loan sales are recorded as a gain on sale of loans and totaled $141,000 and $1.0 million for the years ended December 31, 2010 and 2009, respectively.
The table below presents the changes in our mortgage servicing assets for the years ended December 31, 2010 and 2009:
| (Dollars in thousands) | 2010 | 2009 | ||||||
| Balance at beginning of year |
$ | 1,237 | 376 | |||||
| Additions |
141 | 1,011 | ||||||
| Impairments |
(64 | ) | (21 | ) | ||||
| Amortization |
(177 | ) | (129 | ) | ||||
| Balance at end of year |
$ | 1,137 | 1,237 | |||||
The table below presents the gross carrying values, accumulated amortization, and net carrying values of our mortgage servicing assets for the years ended December 31, 2010 and 2009:
| (Dollars in thousands) | 2010 | 2009 | ||||||
| Gross carrying value |
$ | 1,535 | 1,458 | |||||
| Accumulated amortization |
(398 | ) | (221 | ) | ||||
| Net carrying value |
$ | 1,137 | 1,237 | |||||
96
TERRITORIAL BANCORP INC. AND SUBSIDIARIES
Notes to Consolidated Financial Statements
December 31, 2010, 2009 and 2008
The estimated amortization expense for our mortgage servicing assets for the next five years and all years thereafter are as follows:
| (Dollars in thousands) | ||||
| 2011 |
$ | 145 | ||
| 2012 |
134 | |||
| 2013 |
120 | |||
| 2014 |
105 | |||
| 2015 |
91 | |||
| Thereafter |
542 | |||
| $ | 1,137 | |||
The valuation of new servicing assets is obtained from a cash flow model prepared by an independent third-party appraiser. The valuation reports prepared by the third party are also used to assess impairment of servicing assets. Impairments are recorded as adjustments to amortization expense and included in service fees on loan and deposit accounts in the statements of income. Critical assumptions used in the discounted cash flow model include mortgage prepayment speeds, discount rates, cost of servicing and ancillary income.
Prepayment speed may be affected by economic factors such as home price appreciation, market interest rates, the availability of other loan products to our borrowers and customer payment patterns. Prepayment speeds include the impact of all borrower prepayments, including full payoffs, additional principal payments and the impact of loans paid off due to foreclosure liquidations. As market interest rates decline, prepayment speeds will generally increase as customers refinance existing mortgage loans under more favorable interest rate terms and anticipated cash flows will generally decline resulting in a potential reduction, or impairment, to the fair value of the mortgage servicing assets. Alternatively, an increase in market interest rates may cause a decrease in prepayment speeds and therefore an increase in the fair value of mortgage servicing assets.
The table below presents the fair values and key assumptions used in determining the fair values of our mortgage servicing assets as of December 31, 2010 and 2009:
| (Dollars in thousands) | 2010 | 2009 | ||||||
| Fair value, beginning of year |
$ | 1,346 | 382 | |||||
| Fair value, end of year |
1,366 | 1,346 | ||||||
| Weighted average discount rate |
10.00 | % | 10.00 | % | ||||
| Weighted average prepayment speed assumption (PSA prepayment speed) |
135.6 PSA | 152.4 PSA | ||||||
97
TERRITORIAL BANCORP INC. AND SUBSIDIARIES
Notes to Consolidated Financial Statements
December 31, 2010, 2009 and 2008
The PSA prepayment model assumes increasing prepayment rates for the first 30 months of a loan’s term and constant prepayment rates thereafter.
(9) Interest Rate Lock and Forward Loan Sale Commitments
The Company may enter into interest rate lock commitments with borrowers on loans intended to be sold. To manage interest rate risk on the lock commitments, the Company may also enter into forward loan sale commitments. The interest rate lock commitments and forward loan sale commitments are treated as derivatives and are recorded at their fair values in prepaid expenses and other assets or in accounts payable and accrued expenses. Changes in fair value are recorded in current earnings. At December 31, 2010, interest rate locks and forward loan sale commitments on loans held for sale amounted to $10.4 million and $13.7 million, respectively.
The table below presents the location of assets and liabilities related to derivatives:
| Asset Derivatives | Liability Derivatives | |||||||||||||||||
| (Dollars in thousands) | Location on Balance Sheet |
Fair Value at December 30, 2010 |
Fair Value at December 31, 2009 |
Fair Value at December 30, 2010 |
Fair Value at December 31, 2009 |
|||||||||||||
| Interest rate contracts |
Prepaid expenses and other assets |
$ | 456 | 69 | — | — | ||||||||||||
| Interest rate contracts |
Accounts payable and accrued expenses |
— | — | 314 | 20 | |||||||||||||
| Total derivatives |
$ | 456 | 69 | 314 | 20 | |||||||||||||
The table below presents the location of gains related to derivatives:
| (Dollars in thousands) | Location of gain on Statement of Income |
2010 | 2009 | |||||||
| Interest rate contracts |
Gain on sale of loans |
$ | 93 | 49 | ||||||
| Total derivatives |
$ | 93 | 49 | |||||||
98
TERRITORIAL BANCORP INC. AND SUBSIDIARIES
Notes to Consolidated Financial Statements
December 31, 2010, 2009 and 2008
(10) Premises and Equipment
Premises and equipment are as follows:
| December 31, | ||||||||
| (Dollars in thousands) | 2010 | 2009 | ||||||
| Land |
$ | 585 | $ | 585 | ||||
| Buildings and improvements |
596 | 577 | ||||||
| Leasehold improvements |
8,989 | 8,185 | ||||||
| Furniture, fixtures and equipment |
4,767 | 4,541 | ||||||
| Automobiles |
104 | 104 | ||||||
| 15,041 | 13,992 | |||||||
| Less accumulated depreciation and amortization |
(10,771 | ) | (10,286 | ) | ||||
| 4,270 | 3,706 | |||||||
| Construction in progress |
1,156 | 789 | ||||||
| $ | 5,426 | $ | 4,495 | |||||
Depreciation expense was $1.0 million, $943,000 and $1.0 million for the years ended December 31, 2010, 2009 and 2008, respectively.
(11) Deposits
Deposit accounts by type are summarized with their respective weighted average interest rates as follows:
| December 31, | ||||||||||||||||
| 2010 | 2009 | |||||||||||||||
| (Dollars in thousands) | Amount | Rate | Amount | Rate | ||||||||||||
| Non-interest bearing |
$ | 20,485 | — | $ | 18,414 | — | ||||||||||
| Savings accounts |
741,047 | 0.68 | % | 638,752 | 1.41 | % | ||||||||||
| Certificates of deposit |
209,183 | 1.02 | 254,426 | 1.24 | ||||||||||||
| Money market |
624 | 0.40 | 82,487 | 0.06 | ||||||||||||
| Checking and Super NOW |
105,131 | 0.06 | 20,589 | 0.05 | ||||||||||||
| $ | 1,076,470 | 0.67 | % | $ | 1,014,668 | 1.20 | % | |||||||||
The maturity of certificate of deposit accounts at December 31, 2010 is as follows (dollars in thousands):
| Maturing in: |
||||
| 2011 |
$ | 151,603 | ||
| 2012 |
28,472 | |||
| 2013 |
6,281 | |||
| 2014 |
13,850 | |||
| 2015 |
8,977 | |||
| $ | 209,183 | |||
99
TERRITORIAL BANCORP INC. AND SUBSIDIARIES
Notes to Consolidated Financial Statements
December 31, 2010, 2009 and 2008
Certificates of deposit with balances greater than or equal to $100,000 totaled $130.3 million and $147.2 million at December 31, 2010 and 2009, respectively. Accounts in the Bank are insured by the FDIC, generally up to a maximum of $250,000.
Interest expense by type of deposit is as follows:
| (Dollars in thousands) | 2010 | 2009 | 2008 | |||||||||
| Savings |
$ | 7,722 | $ | 7,761 | $ | 6,003 | ||||||
| Certificates of deposit and money market |
2,626 | 6,357 | 12,508 | |||||||||
| Checking and Super NOW |
47 | 11 | 10 | |||||||||
| Total |
$ | 10,395 | $ | 14,129 | $ | 18,521 | ||||||
At December 31, 2010 and 2009, overdrawn deposit accounts totaled $87,000 and $105,000, respectively, and have been reclassified as loans in the consolidated balance sheets.
(12) Advances from the Federal Home Loan Bank
The FHLB advances are secured by a blanket pledge on the Bank’s assets. At December 31, 2010 and 2009, the Company had available additional unused FHLB advances of approximately $350.3 million and $339.1 million.
Advances outstanding consisted of the following:
| December 31, | ||||||||||||||||||||||||
| 2010 | 2009 | 2008 | ||||||||||||||||||||||
| (Dollars in thousands) | Amount | Weighted average rate |
Amount | Weighted average rate |
Amount | Weighted average rate |
||||||||||||||||||
| Due within one year |
$ | — | — | $ | — | — | $ | 35,791 | 0.63 | % | ||||||||||||||
| Due over 1 year to 2 years |
$ | — | — | $ | — | — | $ | — | — | |||||||||||||||
| Due over 2 years to 3 years |
$ | 10,000 | 2.12 | % | $ | — | — | $ | — | — | ||||||||||||||
The Company, as a member of the FHLB system, is required to obtain and hold shares of capital stock of the FHLB in an amount equal to the greater of 0.50% of mortgage loans and mortgage-backed securities or $500. At December 31, 2010 and 2009, the Company met such requirement. At December 31, 2010 and 2009, the Company owned $12.3 million of capital stock of the FHLB.
100
TERRITORIAL BANCORP INC. AND SUBSIDIARIES
Notes to Consolidated Financial Statements
December 31, 2010, 2009 and 2008
(13) Securities Sold under Agreements to Repurchase
Securities sold under agreements to repurchase are treated as financings and the obligations to repurchase the identical securities sold are reflected as a liability with the dollar amount of securities underlying the agreements remaining in the asset accounts. Securities sold under agreements to repurchase are summarized as follows:
| December 31, | ||||||||||||||||
| 2010 | 2009 | |||||||||||||||
| (Dollars in thousands) | Repurchase liability |
Weighted average rate |
Repurchase liability |
Weighted average rate |
||||||||||||
| Maturing: |
||||||||||||||||
| 1 year or less |
$ | 43,900 | 3.53 | % | $ | 25,000 | 3.13 | % | ||||||||
| Over 1 year to 2 years |
28,300 | 4.75 | 43,900 | 3.53 | ||||||||||||
| Over 2 years to 3 years |
33,000 | 3.91 | 28,300 | 4.75 | ||||||||||||
| Over 3 years to 4 years |
— | — | 33,000 | 3.91 | ||||||||||||
| $ | 105,200 | 3.95 | % | $ | 130,200 | 3.82 | % | |||||||||
Below is a summary comparing the carrying value and fair value of securities pledged to secure repurchase agreements, the repurchase liability, and the amount at risk at December 31, 2010. The amount at risk is the greater of the carrying value or fair value over the repurchase liability. All the agreements to repurchase are with JP Morgan Chase Bank N.A. and the securities pledged are issued and guaranteed by U.S. government-sponsored enterprises.
| (Dollars in thousands) | Carrying value of securities |
Fair value of securities |
Repurchase liability |
Amount at risk |
Weighted average months to maturity |
|||||||||||||||
| Maturing: |
||||||||||||||||||||
| Over 90 days |
$ | 125,603 | 129,640 | 105,200 | 24,440 | 16 | ||||||||||||||
| $ | 125,603 | 129,640 | 105,200 | 24,440 | 16 | |||||||||||||||
(14) Income Taxes
Allocation of federal and state income taxes between current and deferred provisions is as follows:
| (Dollars in thousands) | 2010 | 2009 | 2008 | |||||||||
| Current |
||||||||||||
| Federal |
$ | 7,253 | $ | 5,767 | $ | 4,117 | ||||||
| State |
28 | 701 | 691 | |||||||||
| 7,281 | 6,468 | 4,808 | ||||||||||
| Deferred |
||||||||||||
| Federal |
(1,391 | ) | (1,569 | ) | (813 | ) | ||||||
| State |
(378 | ) | (260 | ) | (201 | ) | ||||||
| (1,769 | ) | (1,829 | ) | (1,014 | ) | |||||||
| $ | 5,512 | $ | 4,639 | $ | 3,794 | |||||||
101
TERRITORIAL BANCORP INC. AND SUBSIDIARIES
Notes to Consolidated Financial Statements
December 31, 2010, 2009 and 2008
The federal statutory corporate tax rate for the year ended December 31, 2010 was 35% and 34% for the tax years ended December 31, 2009, and 2008. A reconciliation of the tax provision based on the statutory corporate rate on pretax income and the provision for taxes as shown in the accompanying consolidated statements of income is as follows:
| (Dollars in thousands) | 2010 | 2009 | 2008 | |||||||||
| Income tax expense at statutory rate |
$ | 5,624 | $ | 4,523 | $ | 3,738 | ||||||
| Income tax effect of: |
||||||||||||
| Tax-exempt interest |
— | — | (44 | ) | ||||||||
| Other tax-exempt income |
(399 | ) | (448 | ) | (407 | ) | ||||||
| State income taxes, net of federal income tax benefits |
864 | 291 | 323 | |||||||||
| Refund of state franchise taxes (net of taxes) |
(608 | ) | — | — | ||||||||
| Other |
31 | 273 | 184 | |||||||||
| Total income tax expense |
$ | 5,512 | $ | 4,639 | $ | 3,794 | ||||||
| Effective income tax rate |
33.33 | % | 34.87 | % | 34.51 | % | ||||||
The company recorded a $1.0 million tax refund from the State of Hawaii as settlement for litigation related to the State’s denial of a dividend received deduction. After providing taxes on the refund, the Company recognized a net reduction in income tax expense of $608,000.
The components of income taxes payable are as follows:
| (Dollars in thousands) | 2010 | 2009 | ||||||
| Current taxes payable: |
||||||||
| Federal |
$ | (849 | ) | $ | (387 | ) | ||
| State |
1,426 | 1,057 | ||||||
| 577 | 670 | |||||||
| Deferred taxes payable (receivable) |
||||||||
| Federal |
128 | 2,324 | ||||||
| State |
(150 | ) | 337 | |||||
| (22 | ) | 2,661 | ||||||
| Total |
$ | 555 | $ | 3,331 | ||||
102
TERRITORIAL BANCORP INC. AND SUBSIDIARIES
Notes to Consolidated Financial Statements
December 31, 2010, 2009 and 2008
The tax effects of temporary differences that give rise to significant portions of the deferred tax assets and deferred tax liabilities at December 31, 2010 and 2009 are presented below:
| (Dollars in thousands) | 2010 | 2009 | ||||||
| Deferred tax assets: |
||||||||
| Premises and equipment |
$ | 1,055 | $ | 1,009 | ||||
| Hawaii franchise tax |
601 | 472 | ||||||
| Unfunded pension liability |
960 | 681 | ||||||
| Allowance for loan losses |
574 | 648 | ||||||
| Impaired asset write-down |
2,699 | 1,344 | ||||||
| Deferred compensation |
132 | — | ||||||
| Equity incentive plan |
382 | — | ||||||
| Unrealized loss on available-for-sale securities |
208 | — | ||||||
| 6,611 | 4,154 | |||||||
| Deferred tax liabilities: |
||||||||
| Net deferred loan fees |
3,421 | 3,416 | ||||||
| FHLB stock dividends |
2,557 | 2,557 | ||||||
| Prepaid expense |
172 | 365 | ||||||
| Premiums on loans sold |
439 | 477 | ||||||
| 6,589 | 6,815 | |||||||
| Net deferred tax assets (liabilities) |
$ | 22 | $ | (2,661 | ) | |||
In assessing the realizability of deferred tax assets, management considers whether it is more likely than not that some portion or all of the deferred tax assets will not be realized. The ultimate realization of deferred tax assets is dependent upon the generation of future taxable income during the periods in which those temporary differences become deductible. Management considers the scheduled reversal of deferred tax liabilities, projected future taxable income, and tax planning strategies in making this assessment. Based upon the level of historical taxable income and projections for future taxable income over the periods in which the deferred tax assets are deductible, management believes it is more likely than not the Company will realize the benefits of these deductible differences. The amount of the deferred tax assets considered realizable, however, could be reduced in the near term if estimates of future taxable income are reduced. There was no valuation allowance for deferred tax assets as of December 31, 2010 and 2009.
103
TERRITORIAL BANCORP INC. AND SUBSIDIARIES
Notes to Consolidated Financial Statements
December 31, 2010, 2009 and 2008
(15) Subordinated Debentures
As of December 31, 2008, the Company had three wholly owned trust subsidiaries, Territorial Savings Statutory Trust I, Territorial Savings Statutory Trust II, and Territorial Savings Statutory Trust III. The trusts issued a total of $24.0 million of trust preferred securities. The proceeds from the issuance of the trust preferred securities, along with cash from the initial trust capitalizations, were used to invest in $24.7 million of the Company’s convertible junior subordinated debentures.
In September 2009, the Company paid off the $24.7 million of subordinated debentures using part of the proceeds received from the issuance of common stock in its conversion from a mutual holding company to a stock holding company. As part of the transaction, unamortized discounts of $507,000 related to the subordinated debt issuance were written off as a loss on extinguishment of debt. Concurrent with the payoff of the subordinated debentures, all the trust preferred securities issued by the trusts were retired and the trusts were terminated.
(16) Employee Benefit Plans
The Company has a noncontributory defined benefit pension plan (Pension Plan) that covers substantially all employees with at least one year of service. The benefits are based on years of service and the employees’ compensation during the service period. The Company’s policy is to accrue the actuarially determined pension costs and to fund pension costs within regulatory guidelines. The Company reviews its assumptions on an annual basis and makes modifications to the assumptions based on current rates and trends when it is appropriate to do so. The effect of modifications to those assumptions is recorded in accumulated other comprehensive income (AOCI) beginning in 2006 and amortized to net periodic benefit cost over future periods using the corridor method. The Company believes that the assumptions utilized in recording its obligations under the plan are reasonable based on its experience and market conditions.
In addition, the Company sponsors a Supplemental Employee Retirement Plan (SERP), a noncontributory supplemental retirement benefit plan, which covers certain current and former employees of the Company for amounts in addition to those provided under the defined pension plan.
104
TERRITORIAL BANCORP INC. AND SUBSIDIARIES
Notes to Consolidated Financial Statements
December 31, 2010, 2009 and 2008
The following table sets forth the status of the Pension Plan and SERP at the dates indicated:
| Pension Plan | SERP | |||||||||||||||
| December 31 | ||||||||||||||||
| (Dollars in thousands) | 2010 | 2009 | 2010 | 2009 | ||||||||||||
| Accumulated benefit obligation at end of year |
$ | 11,111 | $ | 10,004 | $ | 7,573 | $ | 6,609 | ||||||||
| Change in projected benefit obligation: |
||||||||||||||||
| Benefit obligation at beginning of year |
$ | 10,004 | $ | 9,370 | 6,609 | 5,722 | ||||||||||
| Service cost |
101 | 61 | 627 | 596 | ||||||||||||
| Interest cost |
609 | 589 | 354 | 308 | ||||||||||||
| Actuarial loss |
629 | 214 | — | — | ||||||||||||
| Benefits paid |
(232 | ) | (230 | ) | (17 | ) | (17 | ) | ||||||||
| Curtailments |
— | — | — | — | ||||||||||||
| Benefit obligation at end of year |
11,111 | 10,004 | 7,573 | 6,609 | ||||||||||||
| Change in plan assets: |
||||||||||||||||
| Fair value of plan assets at beginning of year |
9,926 | 8,561 | — | — | ||||||||||||
| Actual return on plan assets |
652 | 1,595 | — | — | ||||||||||||
| Employer contributions |
— | — | 17 | 17 | ||||||||||||
| Benefits paid |
(232 | ) | (230 | ) | (17 | ) | (17 | ) | ||||||||
| Fair value of plan assets at end of year |
10,346 | 9,926 | — | — | ||||||||||||
| Funded status at end of year |
$ | (765 | ) | $ | (78 | ) | $ | (7,573 | ) | $ | (6,609 | ) | ||||
| Amounts recognized in the consolidated balance sheets: |
||||||||||||||||
| Accounts payable and accrued expenses |
$ | (765 | ) | $ | (78 | ) | $ | (7,573 | ) | $ | (6,609 | ) | ||||
| Liability |
$ | (765 | ) | $ | (78 | ) | $ | (7,573 | ) | $ | (6,609 | ) | ||||
| Amounts recognized in accumulated other comprehensive loss: |
||||||||||||||||
| Net actuarial loss |
$ | 2,488 | $ | 1,764 | $ | — | $ | — | ||||||||
| Prior service cost |
— | — | — | — | ||||||||||||
| Accumulated other comprehensive loss, before tax |
$ | 2,488 | $ | 1,764 | $ | — | $ | — | ||||||||
The following table sets forth the changes recognized in accumulated other comprehensive loss at the dates indicated:
| Pension benefits | ||||||||
| Year ended December 31 | ||||||||
| (Dollars in thousands) | 2010 | 2009 | ||||||
| Accumulated other comprehensive loss at beginning of year, before tax |
$ | 1,764 | $ | 2,525 | ||||
| Actuarial net (gain) loss arising during the period |
747 | (712 | ) | |||||
| Amortizations (recognized in net periodic benefit cost): |
||||||||
| Actuarial loss |
(23 | ) | (49 | ) | ||||
| Prior service cost |
— | — | ||||||
| Total recognized in other comprehensive income |
724 | (761 | ) | |||||
| Accumulated other comprehensive loss at end of year, before tax |
$ | 2,488 | $ | 1,764 | ||||
105
TERRITORIAL BANCORP INC. AND SUBSIDIARIES
Notes to Consolidated Financial Statements
December 31, 2010, 2009 and 2008
For the fiscal years ended December 31, 2010 and 2009, the following weighted average assumptions were used to determine benefit obligations at the end of the fiscal years:
| Pension benefits | SERP | |||||||||||||||
| Year ended December 31, | ||||||||||||||||
| 2010 | 2009 | 2010 | 2009 | |||||||||||||
| Assumptions used to determine the fiscal year-end benefit obligations: |
||||||||||||||||
| Discount rate |
5.80 | % | 6.20 | % | 5.03 | % | 5.03 | % | ||||||||
| Rate of compensation increase |
N/A | N/A | 5.00 | % | 5.00 | % | ||||||||||
The Company does not expect any plan assets to be returned to the Company during calendar year 2011.
The dates used to determine retirement measurements for the Pension Plan were December 31, 2010 and 2009.
The Company’s investment strategy for the defined benefit retirement plan is to maintain a consistent rate of return with primary emphasis on capital appreciation and secondary emphasis on income to enhance the purchasing power of the plan’s assets over the long-term and to preserve capital. The investment policy establishes a target allocation for each asset class that is reviewed periodically and rebalanced when considered appropriate. Normal target allocations at December 31, 2010 were 53% domestic equity securities, 12% international equity securities and 35% bonds. Equity securities primarily include investment in exchange traded funds and large-cap, mid-cap and small-cap mutual funds. Fixed income securities include U.S. Treasuries, mortgage-backed securities and corporate bonds of companies in diversified industries. Other types of investments include money market mutual funds and savings accounts opened with the Company.
As of December 31, 2010, the Pension Plan’s assets measured at fair value were classified as follows:
| Fair value of measurements at report date using: | ||||||||||||||||
| December 31, 2010 |
Quoted prices in active markets for identical assets (Level 1) |
Significant other observable inputs (Level 2) |
Significant unobservable inputs (Level 3) |
|||||||||||||
| Assets: |
||||||||||||||||
| Cash |
$ | 99 | $ | 99 | $ | — | $ | — | ||||||||
| Money market funds |
968 | 968 | — | — | ||||||||||||
| Mutual funds (a) |
9,279 | 9,279 | — | — | ||||||||||||
| Total |
$ | 10,346 | $ | 10,346 | $ | — | $ | — | ||||||||
| (a) | This category includes mutual funds that invest in stocks and fixed income securities. The mutual fund managers have the ability to change the amounts invested in stocks and bonds depending on their investment outlook. |
106
TERRITORIAL BANCORP INC. AND SUBSIDIARIES
Notes to Consolidated Financial Statements
December 31, 2010, 2009 and 2008
Estimated future benefit payments reflecting expected future service at December 31, 2010 are as follows:
| (Dollars in thousands) | Pension benefits |
SERP | ||||||
| 2011 |
$ | 471 | 375 | |||||
| 2012 |
512 | 648 | ||||||
| 2013 |
524 | 648 | ||||||
| 2014 |
555 | 649 | ||||||
| 2015 |
581 | 649 | ||||||
| 2016 – 2020 |
3,491 | 3,654 | ||||||
| $ | 6,134 | 6,623 | ||||||
For the fiscal years ended December 31, 2010, 2009, and 2008, the following weighted average assumptions were used to determine net periodic benefit cost for the fiscal years shown:
| Pension benefits | SERP | |||||||||||||||||||||||
| Year ended December 31 | ||||||||||||||||||||||||
| (Dollars in thousands) | 2010 | 2009 | 2008 | 2010 | 2009 | 2008 | ||||||||||||||||||
| Assumptions used to determine the net periodic benefit cost: |
||||||||||||||||||||||||
| Discount rate |
6.20 | % | 6.30 | % | 6.00 | % | 5.01 | % | 5.01 | % | 5.02 | % | ||||||||||||
| Expected return on plan assets |
8.00 | 8.00 | 8.00 | — | — | — | ||||||||||||||||||
| Rate of compensation increase |
N/A | 4.00 | 4.00 | 5.00 | 5.00 | 5.00 | ||||||||||||||||||
The components of net periodic benefit cost were as follows:
| Pension benefits | SERP | |||||||||||||||||||||||
| Year ended December 31 | ||||||||||||||||||||||||
| (Dollars in thousands) | 2010 | 2009 | 2008 | 2010 | 2009 | 2008 | ||||||||||||||||||
| Net periodic benefit cost for the year: |
||||||||||||||||||||||||
| Service cost |
$ | 101 | $ | 61 | $ | 596 | $ | 627 | $ | 596 | $ | 511 | ||||||||||||
| Interest cost |
609 | 589 | 588 | 354 | 308 | 268 | ||||||||||||||||||
| Expected return on plan assets |
(771 | ) | (669 | ) | (706 | ) | — | — | — | |||||||||||||||
| Amortization of prior service cost |
— | — | 3 | — | — | — | ||||||||||||||||||
| Recognized actuarial loss |
24 | 49 | 110 | — | — | — | ||||||||||||||||||
| Recognized curtailment loss |
— | — | 16 | — | — | — | ||||||||||||||||||
| Net periodic benefit cost |
$ | (37 | ) | $ | 30 | $ | 607 | $ | 981 | $ | 904 | $ | 779 | |||||||||||
The estimated prior service cost and net actuarial loss that will be amortized from AOCI into net periodic pension benefit cost in 2011 are $0 and $41,000, respectively.
107
TERRITORIAL BANCORP INC. AND SUBSIDIARIES
Notes to Consolidated Financial Statements
December 31, 2010, 2009 and 2008
The expected return on plan assets is based on the weighted-average long-term rates of return for the types of assets held in the plan. The expected return on plan assets is adjusted when there is a change in the expected long-term rate of return or in the composition of assets held in the plan.
On November 4, 2008, the Board of Directors approved changes to the Company’s defined benefit pension plan. Effective December 31, 2008, there will be no further accrual of benefits for any participants, and benefits will not increase with any additional years of service. Employees already enrolled in the Pension Plan as of December 31, 2008 will be 100% vested if they have at least five years of service. For employees with less than five years of service, vesting would occur at the employee’s five-year anniversary date.
Based on actuarial calculations, the Company is not expected to make a contribution to the defined benefit pension plan in 2011. The Company expects to make a $17,000 contribution to the SERP in 2011 to cover actual benefit payments.
The Company also has a 401(k) defined contribution plan and profit sharing plan covering all employees after one year of service. The 401(k) plan provides for employer matching contributions, as determined by the Company, based on a percentage of employees’ contributions subject to a maximum amount defined in the plan agreement. The Company’s 401(k) matching contributions, based on 7% of employees’ contributions for 2010, 10% for 2009, and 15% for 2008, amounted to $69,000, $90,000, and $132,000, respectively. The Company contributes to the profit sharing plan an amount determined by the Board of Directors. No contributions were made to the profit sharing plan for year ended December 31, 2010, 2009, and 2008.
(17) Employee Stock Ownership Plan
Effective January 1, 2009, Territorial Savings Bank adopted an Employee Stock Ownership Plan (ESOP) for eligible employees. The ESOP borrowed $9.8 million from the Company and used those funds to acquire 978,650 shares or 8% of the total number of shares issued by the Company in its initial public offering. The shares were acquired at a price of $10.00 per share.
The loan is secured by the shares purchased with the loan proceeds and will be repaid by the ESOP over the 20-year term of the loan with funds from Territorial Savings Bank’s contributions to the ESOP and dividends payable on stock. The interest rate on the ESOP loan is an adjustable rate equal to the prime rate, as published in The Wall Street Journal. The interest rate will adjust annually and will be the prime rate on the first business day of the calendar year.
Shares purchased by the ESOP will be held by a trustee in an unallocated suspense account, and shares will be released annually from the suspense account on a pro-rata basis as principal and interest payments are made by the ESOP to the Company. The trustee will allocate the shares released among participants on the basis of each participant’s proportional share of compensation relative to all participants. As shares are committed to be released from the suspense account, Territorial Savings Bank reports compensation expense based on the average fair value of shares released with a corresponding credit to stockholders’ equity. The shares committed to be released are considered outstanding for earnings per share computations. Compensation expense recognized for the years ended December 31, 2010 and 2009 amounted to $896,000 and $792,000, respectively.
108
TERRITORIAL BANCORP INC. AND SUBSIDIARIES
Notes to Consolidated Financial Statements
December 31, 2010, 2009 and 2008
Shares held by the ESOP trust were as follows:
| December 31, | ||||||||
| 2010 | 2009 | |||||||
| Allocated shares |
97,865 | 48,933 | ||||||
| Unearned shares |
880,785 | 929,717 | ||||||
| Total ESOP shares |
978,650 | 978,650 | ||||||
| Fair value of unearned shares, in thousands |
$ | 17,536 | $ | 16,781 | ||||
The ESOP restoration plan is a non-qualified plan that provides supplemental benefits to certain executives who are prevented from receiving the full benefits contemplated by the employee stock ownership plan’s benefit formula. The supplemental cash payments consist of payments representing shares that cannot be allocated to the participants under the ESOP due to IRS limitations imposed on tax-qualified plans. We accrue for these benefits over the period during which employees provide services to earn these benefits. For the years ended December 31, 2010 and 2009, we accrued $250,000 and $112,000, respectively, for the ESOP restoration plan.
(18) Share-Based Compensation
On August 19, 2010, Territorial Bancorp Inc. adopted the 2010 Equity Incentive Plan, which provides for awards of stock options and restricted stock to key officers and outside directors. In accordance with the Compensation – Stock Compensation topic of the FASB ASC, the cost of the 2010 Equity Incentive Plan is based on the fair value of the awards on the grant date. The fair value of restricted stock is based on the closing price of the Company’s stock on the grant date. The fair value of stock options is estimated using a Black-Scholes option pricing model using assumptions for dividend yield, stock price volatility, risk-free interest rate and option term. These assumptions are based on our judgments regarding future events, are subjective in nature, and cannot be determined with precision. The cost of the awards will be recognized on a straight-line basis over the six-year vesting period during which participants are required to provide services in exchange for the awards.
Shares of our common stock issued under the Plan shall be authorized unissued shares. The maximum number of shares that will be awarded under the plan will be 1,712,637 shares. Share-based compensation expense for the year ending December 31, 2010 was $989,000 and the related income tax benefit was $382,000.
Stock Options
The table below presents the stock option activity for the twelve months ended December 31, 2010:
| Options | Weighted average exercise price |
Remaining contractual life (years) |
Aggregate intrinsic value (in thousands) |
|||||||||||||
| Options outstanding at December 31, 2009 |
— | $ | — | — | $ | — | ||||||||||
| Granted |
871,144 | 17.36 | 9.83 | 0 | ||||||||||||
| Exercised |
— | — | — | — | ||||||||||||
| Forfeited |
— | — | — | — | ||||||||||||
| Expired |
— | — | — | — | ||||||||||||
| Options outstanding at December 31, 2010 |
871,144 | $ | 17.36 | 9.83 | $ | 0 | ||||||||||
109
TERRITORIAL BANCORP INC. AND SUBSIDIARIES
Notes to Consolidated Financial Statements
December 31, 2010, 2009 and 2008
As of December 31, 2010, the Company had $4.2 million of unrecognized compensation costs related to the stock option plan. The cost of the stock option plan will be amortized in equal annual installments over the six-year vesting period. There were no shares vested in 2010.
The fair value of the Company’s stock options was determined using the Black-Scholes option pricing formula. The following assumptions were used in the formula:
| Expected volatility |
31.98 | % | ||
| Risk-free interest rate |
2.58 | % | ||
| Expected dividends |
1.61 | % | ||
| Expected life (in years) |
6.75 | |||
| Grant price for the stock options |
$ | 17.36 |
Expected volatility - Based on the historical volatility of the Company’s stock and a peer group of comparable thrifts.
Risk-free interest rate - Based on the U.S. Treasury yield curve and expected life of the options at the time of grant.
Expected dividends - Based on the quarterly dividend and the price of the Company’s stock at the time of grant.
Expected life - Based on a weighted-average of the six-year vesting period and the 10-year contractual term of the stock option plan.
Grant price for the stock options - Based on the closing price of the Company’s stock at the time of grant.
Restricted Stock Awards
Restricted stock awards are accounted for as fixed grants using the fair value of the Company’s stock at the time of grant. Unvested restricted stock awards may not be disposed of or transferred during the vesting period. Restricted stock awards carry with them the right to receive dividends.
The table below presents the restricted stock award activity for the twelve months ended December 31, 2010:
| Restricted stock awards |
Weighted average grant date fair value |
|||||||
| Non-vested at December 31, 2009 |
— | $ | — | |||||
| Granted |
713,600 | 17.36 | ||||||
| Vested |
— | — | ||||||
| Forfeited |
— | — | ||||||
| Non-vested at December 31, 2010 |
713,600 | $ | 17.36 | |||||
110
TERRITORIAL BANCORP INC. AND SUBSIDIARIES
Notes to Consolidated Financial Statements
December 31, 2010, 2009 and 2008
There were no shares vested in 2010.
As of December 31, 2010, the company had $11.7 million of unrecognized compensation cost related to restricted stock awards. The cost of the restricted stock awards will be amortized in equal annual installments over the six-year vesting period.
(19) Earnings Per Share
The table below presents the information used to compute basic and diluted earnings per share for the years ended December 31, 2010 and 2009. Because the mutual to stock conversion was not completed until July 10, 2009, per share earnings data is not presented for the year ended December 31, 2008.
| For the year ended December 31, | ||||||||
| (Dollars in thousands, except per share data) | 2010 | 2009 | ||||||
| Net income |
$ | 11,028 | $ | 8,664 | ||||
| Weighted average number of shares used in: |
||||||||
| Basic earnings per share |
11,322,798 | 11,279,716 | ||||||
| Dilutive common stock equivalents: |
||||||||
| Stock options and restricted stock units |
46,363 | — | ||||||
| Diluted earnings per share(1) |
11,369,161 | 11,279,716 | ||||||
| Net income per common share, basic (1) |
$ | 0.97 | $ | 0.77 | ||||
| Net income per common share, diluted (1) |
$ | 0.97 | $ | 0.77 | ||||
| (1) | For the year ended December 31, 2009, amount calculated from the effective date of July 10, 2009 to the year end |
(20) Accumulated Other Comprehensive Loss
The components of accumulated other comprehensive loss, net of taxes, were as follows:
| December 31 | ||||||||
| (Dollars in thousands) | 2010 | 2009 | ||||||
| Unfunded pension liability |
$ | 1,504 | $ | 1,059 | ||||
| Noncredit related losses on securities not expected to be sold |
679 | — | ||||||
| Unrealized losses on available for sale securities |
322 | — | ||||||
| Accumulated other comprehensive loss |
$ | 2,505 | $ | 1,059 | ||||
111
TERRITORIAL BANCORP INC. AND SUBSIDIARIES
Notes to Consolidated Financial Statements
December 31, 2010, 2009 and 2008
The changes in accumulated other comprehensive loss, net of taxes, were as follows:
| Year ended December 31, | ||||||||||||
| (Dollars in thousands) | 2010 | 2009 | 2008 | |||||||||
| Retirement benefit plans: |
||||||||||||
| Net gain (loss) during the period |
$ | 459 | $ | (428 | ) | $ | 373 | |||||
| Net loss recognized in net periodic benefit cost |
(14 | ) | (29 | ) | (78 | ) | ||||||
| Unrealized losses on available for sale securities |
322 | — | — | |||||||||
| Change in noncredit related losses on securities not expected to be sold |
679 | — | — | |||||||||
| Change in accumulated other comprehensive loss |
$ | 1,446 | $ | (457 | ) | $ | 295 | |||||
(21) Commitments
| (a) | Loan Commitments |
Commitments to extend credit are agreements to lend to a customer as long as there is no violation of any terms or conditions established in the contract. Commitments generally have fixed expiration dates or other termination clauses and may require payment of a fee. Since commitments may expire without being drawn upon, the total commitment amounts do not necessarily represent future cash requirements. The Company evaluates each customer’s creditworthiness on an individual basis. The Company’s policy is to require suitable collateral, primarily real estate, to be provided by customers prior to disbursement of approved loans. At December 31, 2010 and 2009, the Company had loan commitments aggregating $56.3 million (interest rates from 3.25% to 6.00%) and $10.1 million (interest rates from 4.375% to 5.75%), respectively, primarily consisting of fixed-rate residential first mortgage loans.
| (b) | Lease Commitments |
The Company leases a majority of its premises under operating leases expiring on various dates through 2021. Total rental expense comprised minimum rentals of $2.5 million, $2.4 million, and $2.2 million for the years ended December 31, 2010, 2009, and 2008, respectively.
At December 31, 2010, future minimum rental commitments under all noncancelable operating leases are as follows:
| (Dollars in thousands) | ||||
| 2011 |
$ | 2,335 | ||
| 2012 |
2,242 | |||
| 2013 |
1,943 | |||
| 2014 |
1,792 | |||
| 2015 |
1,496 | |||
| Thereafter |
3,676 | |||
| $ | 13,484 | |||
112
TERRITORIAL BANCORP INC. AND SUBSIDIARIES
Notes to Consolidated Financial Statements
December 31, 2010, 2009 and 2008
Certain leases are renegotiable during the period of the lease or have renewal options at the expiration of the lease term. The majority of lease agreements relate to real estate and generally provide that the Company pay taxes, maintenance, insurance, and certain other operating expenses applicable to the leased premises.
In addition, the Company leases to a tenant certain property that it owns. Future minimum rental income for this noncancelable lease is as follows:
| (Dollars in thousands) | ||||
| 2011 |
$ | 80 | ||
| 2012 |
80 | |||
| 2013 |
80 | |||
| 2014 |
80 | |||
| 2015 |
80 | |||
| Thereafter |
1,280 | |||
| $ | 1,680 | |||
Rental income comprised of minimum rentals for 2010, 2009, and 2008 was approximately $80,000 per year.
| (c) | Reserve Requirements |
The Company is required by the Federal Reserve Bank to maintain reserves based on the amount of deposits held. The reserve requirements at December 31, 2010 and 2009 were $10.1 million and $853,000, respectively, and the Company met such requirements.
(22) Regulatory Capital and Supervision
| (a) | Financial Institutions Reform, Recovery, and Enforcement Act (FIRREA) |
Under the provisions of FIRREA, the Bank is required to meet a minimum 4.0% leverage (core) capital ratio, a minimum regulatory tangible capital equal to 1.5% of adjusted total assets, an 8.0% risk-based capital ratio, and a 4.0% Tier 1 risk-based capital ratio.
At December 31, 2010 and 2009, the Bank’s core, tangible, risk-based, and Tier 1 risk-based capital exceeded the minimum required regulatory capital ratios as follows:
| Required | Actual | Excess over | ||||||||||||||||||
| (Dollars in thousands) | Amount | Percentage | Amount | Percentage | requirement | |||||||||||||||
| December 31, 2010: |
||||||||||||||||||||
| Core (Tier 1) capital |
$ | 57,777 | 4.00 | % | $ | 202,527 | 14.02 | % | $ | 144,750 | ||||||||||
| Tangible capital |
21,666 | 1.50 | 202,527 | 14.02 | 180,861 | |||||||||||||||
| Risk-based capital |
37,899 | 8.00 | 204,015 | 43.06 | 166,116 | |||||||||||||||
| Tier 1 risk-based capital |
18,950 | 4.00 | 202,527 | 42.75 | 183,577 | |||||||||||||||
| December 31, 2009: |
||||||||||||||||||||
| Core (Tier 1) capital |
$ | 55,636 | 4.00 | % | $ | 190,078 | 13.67 | % | $ | 134,442 | ||||||||||
| Tangible capital |
20,863 | 1.50 | 190,078 | 13.67 | 169,215 | |||||||||||||||
| Risk-based capital |
41,260 | 8.00 | 191,759 | 37.18 | 150,499 | |||||||||||||||
| Tier 1 risk-based capital |
20,630 | 4.00 | 190,078 | 36.85 | 169,448 | |||||||||||||||
113
TERRITORIAL BANCORP INC. AND SUBSIDIARIES
Notes to Consolidated Financial Statements
December 31, 2010, 2009 and 2008
The following is a reconciliation of Bank equity to regulatory capital:
| 2010 | 2009 | |||||||
| Bank equity |
$ | 200,141 | $ | 189,188 | ||||
| Intangible assets |
(119 | ) | (169 | ) | ||||
| Minority interest |
— | — | ||||||
| Accumulated other comprehensive loss |
2,505 | 1,059 | ||||||
| Core and tangible capital |
202,527 | 190,078 | ||||||
| Allowance for loan losses – general |
1,488 | 1,681 | ||||||
| Regulatory risk-based capital – computed |
$ | 204,015 | $ | 191,759 | ||||
| (b) | Federal Deposit Insurance Corporation Improvement Act (FDICIA) |
FDICIA was signed into law and regulations implementing the Prompt Corrective Action provisions of FDICIA became effective on December 19, 1992. In addition to the Prompt Corrective Action requirements, FDICIA includes significant changes to the legal and regulatory environment for insured depository institutions, including reductions in insurance coverage for certain kinds of deposits; increased supervision by the federal regulatory agencies; increased reporting requirements for insured institutions; and new regulations concerning internal controls, accounting, and operations.
The Prompt Corrective Action provisions define specific capital categories based on an institution’s capital ratios. However, the regulators may impose higher minimum capital standards on individual institutions or may downgrade an institution from one capital category to a lower category because of safety and soundness concerns. Failure to meet minimum capital requirements can initiate certain mandatory and possible additional discretionary actions by regulators that, if undertaken, could have a direct material effect on the Company’s consolidated financial statements.
The Prompt Corrective Action provisions impose certain restrictions on institutions that are undercapitalized. The restrictions imposed become increasingly more severe as an institution’s capital category declines from “undercapitalized” to “critically undercapitalized.”
At December 31, 2010 and 2009, the Bank’s core, tangible, Tier 1/risk-based, and total risk-based ratios exceeded the minimum capital thresholds for a “well-capitalized” institution. There are no conditions or events that have changed the institution’s category under the capital guidelines.
114
TERRITORIAL BANCORP INC. AND SUBSIDIARIES
Notes to Consolidated Financial Statements
December 31, 2010, 2009 and 2008
The Bank is required to notify the Office of Thrift Supervision (OTS) when dividends are paid to the parent company.
(23) Contingencies
The Company is involved in various claims and legal actions arising out of the ordinary course of business. In the opinion of management, the ultimate disposition of these matters will not have a material adverse effect on the Company’s consolidated balance sheets.
(24) Fair Value of Financial Instruments
In accordance with the Fair Value Measurements and Disclosures topic of the FASB ASC, the Company groups its financial assets and liabilities at fair value into three levels based on the markets in which the financial assets and liabilities are traded and the reliability of the assumptions used to determine fair value as follows:
| • | Level 1 – Valuation is based upon quoted prices (unadjusted) for identical assets or liabilities traded in active markets. A quoted price in an active market provides the most reliable evidence of fair value and shall be used to measure fair value whenever available. |
| • | Level 2 – Valuation is based upon quoted prices for similar instruments in active markets, quoted prices for identical or similar instruments in markets that are not active, and model-based valuation techniques for which all significant assumptions are observable in the market. |
| • | Level 3 – Valuation is generated from model-based techniques that use significant assumptions not observable in the market. These unobservable assumptions reflect management’s own estimates of assumptions that market participants would use in pricing the asset or liability. Valuation techniques include use of discounted cash flow models and similar techniques that require the use of significant judgment or estimation. |
In accordance with the Fair Value Measurements and Disclosures topic, the Company bases its fair values on the price that it would expect to receive if an asset were sold or pay to transfer a liability in an orderly transaction between market participants at the measurement date. Also as required, the Company maximizes the use of observable inputs and minimizes the use of unobservable inputs when developing fair value measurements.
The Company uses fair value measurements to determine fair value disclosures. Investment securities held for sale and derivatives are recorded at fair value on a recurring basis. From time to time, the Company may be required to record other financial assets at fair value on a nonrecurring basis, such as loans held for sale, impaired loans and investments, and mortgage servicing assets. These nonrecurring fair value adjustments typically involve application of the lower of cost or fair value accounting or write-downs of individual assets.
Cash and Cash Equivalents, Accrued Interest Receivable, Accounts Payable and Accrued Expenses, Current Income Taxes Payable, and Advance Payments by Borrowers for Taxes and Insurance. The carrying amount approximates fair value because of the short maturity of these instruments.
115
TERRITORIAL BANCORP INC. AND SUBSIDIARIES
Notes to Consolidated Financial Statements
December 31, 2010, 2009 and 2008
Investment Securities. The estimated fair values of U.S. government-sponsored mortgage-backed securities are considered Level 2 inputs because the valuation for investment securities utilized pricing models that varied based on asset class and included trade, bid and other observable market information.
The trust preferred securities represent investments in a pool of debt obligations issued primarily by holding companies for Federal Deposit Insurance Corporation-insured financial institutions. The trust preferred securities market is considered to be inactive since there have been only three sales transactions of similar rated securities over the past 12 months and no new issues of pooled trust preferred securities have occurred since 2007. The fair value of our trust preferred securities was determined by an independent third-party pricing service which used a discounted cash flow model. Our pricing service used a discount rate of 22.00% and provided a fair value estimate of $3.61 per $100 of par value for PreTSL XXIII.
The discounted cash flow analysis included a review of all issuers within each collateral pool and incorporated higher deferral and default rates in the cash flow projections over the next three years and a forecast of lower deferral and default rates in later years. The fair value of the trust preferred securities are classified as Level 3 inputs because they are based on discounted cash flow models.
FHLB Stock. FHLB stock, which is redeemable for cash at par value, is reported at its par value.
Loans. The fair value of loans is estimated by discounting the future cash flows using the current rates at which similar loans would be made to borrowers with similar credit ratings and for the same remaining maturities. The fair value of loans is not based on the concept of exit price.
Deposits. The fair value of checking and Super NOW savings accounts, passbook accounts, and certain money market deposits is the amount payable on demand at the reporting date. The fair value of fixed-maturity certificates of deposit is estimated by discounting future cash flows using the rates currently offered for deposits with similar remaining maturities.
Advances From the FHLB and Securities Sold Under Agreements to Repurchase. Fair value is estimated by discounting future cash flows using the rates currently offered to the Company for debt with similar remaining maturities.
116
TERRITORIAL BANCORP INC. AND SUBSIDIARIES
Notes to Consolidated Financial Statements
December 31, 2010, 2009 and 2008
The estimated fair values of the Company’s financial instruments are as follows:
| December 31, | ||||||||||||||||
| 2010 | 2009 | |||||||||||||||
| (Dollars in thousands) | Carrying amount |
Estimated fair value |
Carrying amount |
Estimated fair value |
||||||||||||
| Assets | ||||||||||||||||
| Cash and cash equivalents |
$ | 194,435 | $ | 194,435 | $ | 135,953 | $ | 135,953 | ||||||||
| Investment securities available for sale |
15,010 | 15,010 | — | — | ||||||||||||
| Investment securities held to maturity |
530,555 | 546,844 | 598,394 | 606,269 | ||||||||||||
| FHLB stock |
12,348 | 12,348 | 12,348 | 12,348 | ||||||||||||
| Loans held for sale |
3,234 | 3,234 | 1,084 | 1,084 | ||||||||||||
| Loans receivable, net |
641,790 | 666,339 | 597,700 | 615,858 | ||||||||||||
| Accrued interest receivable |
4,536 | 4,536 | 4,781 | 4,781 | ||||||||||||
| Liabilities | ||||||||||||||||
| Deposits |
$ | 1,076,470 | $ | 1,078,590 | $ | 1,014,668 | $ | 1,017,396 | ||||||||
| Advances from the FHLB |
10,000 | 10,274 | — | — | ||||||||||||
| Securities sold under agreements to repurchase |
105,200 | 109,953 | 130,200 | 136,029 | ||||||||||||
| Accounts payable and accrued expenses |
20,430 | 20,430 | 18,837 | 18,837 | ||||||||||||
| Current income taxes payable |
577 | 577 | 670 | 670 | ||||||||||||
| Advance payments by borrowers for taxes and insurance |
3,376 | 3,376 | 2,905 | 2,905 | ||||||||||||
At December 31, 2010 and 2009, neither the commitment fees received on commitments to extend credit nor the fair value thereof was material to the consolidated financial statements of the Company.
The table below presents the balance of assets and liabilities measured at fair value on a recurring basis as of December 31, 2010 and December 31, 2009 and the related gains and losses for the years then ended:
| (Dollars in thousands) | Level 1 | Level 2 | Level 3 | Total | Total Gains (Losses) |
|||||||||||||||
| December 31, 2010 |
||||||||||||||||||||
| Interest rate contracts – assets |
$ | — | 456 | — | 456 | 388 | ||||||||||||||
| Interest rate contracts – liabilities |
(314 | ) | — | (314 | ) | (295 | ) | |||||||||||||
| Available-for-sale investments |
15,010 | — | 15,010 | (530 | ) | |||||||||||||||
| December 31, 2009 |
||||||||||||||||||||
| Interest rate contracts – assets |
$ | — | 69 | — | 69 | 69 | ||||||||||||||
| Interest rate contracts – liabilities |
(20 | ) | — | (20 | ) | (20 | ) | |||||||||||||
The fair value of interest rate contracts was determined by referring to prices quoted in the secondary market for similar contracts. Gains and losses are included in gain on sale of loans in the consolidated statements of income. The fair value of available-for-sale investments was determined using quoted market prices. The losses, net of taxes, are included in accumulated other comprehensive loss in the consolidated balance sheets.
117
TERRITORIAL BANCORP INC. AND SUBSIDIARIES
Notes to Consolidated Financial Statements
December 31, 2010, 2009 and 2008
The table below presents the balance of assets measured at fair value on a nonrecurring basis as of December 31, 2010 and December 31, 2009 and the related losses for the years then ended:
| (Dollars in thousands) | Level 1 | Level 2 | Level 3 | Total | Total Losses |
|||||||||||||||
| December 31, 2010 |
||||||||||||||||||||
| Impaired loans |
$ | — | 254 | 2,429 | 2,683 | 183 | ||||||||||||||
| Trust preferred securities |
— | — | 128 | 128 | 2,404 | |||||||||||||||
| Mortgage servicing assets |
— | — | 1,366 | 1,366 | 64 | |||||||||||||||
| December 31, 2009 |
||||||||||||||||||||
| Impaired loans |
$ | — | — | 2,668 | 2,668 | 182 | ||||||||||||||
| Trust preferred securities |
— | — | — | — | 3,481 | |||||||||||||||
| Mortgage servicing assets |
— | — | 1,346 | 1,346 | 21 | |||||||||||||||
The fair value of impaired loans that are considered to be collateral-dependent is determined using the value of collateral less estimated selling costs. Gains and losses are included in the provision for loans losses in the consolidated statements of income. The fair value of trust preferred securities was determined by an independent third-party pricing service using a discounted cash flow model. The assumptions used in the discounted cash flow model are discussed above. Losses on trust preferred securities are included in net other-than-temporary impairment losses in the consolidated statements of income. Mortgage servicing assets are valued using a cash flow model prepared by an independent third-party appraiser. Assumptions used in the model include mortgage prepayment speeds, discount rates, cost of servicing and ancillary income. Losses on mortgage servicing assets are included in service fees on loan and deposit accounts in the consolidated statements of income.
(25) Parent Company Only
Presented below are the condensed balance sheet, statement of income, and statement of cash flows for Territorial Bancorp Inc.
Condensed Balance Sheet
| December 31, | ||||||||
| (Dollars in thousands) | 2010 | 2009 | ||||||
| Assets | ||||||||
| Cash |
$ | 24,550 | $ | 23,705 | ||||
| Investment in Territorial Savings Bank |
200,141 | 189,176 | ||||||
| Receivable from Territorial Savings Bank |
515 | — | ||||||
| Prepaid expenses and other assets |
2,204 | 8,260 | ||||||
| Total assets |
$ | 227,410 | $ | 221,141 | ||||
| Liabilities and Equity | ||||||||
| Payable to Territorial Savings Bank |
$ | — | $ | 1,457 | ||||
| Other liabilities |
51 | 13 | ||||||
| Equity |
227,359 | 219,671 | ||||||
| Total liabilities and equity |
$ | 227,410 | $ | 221,141 | ||||
118
TERRITORIAL BANCORP INC. AND SUBSIDIARIES
Notes to Consolidated Financial Statements
December 31, 2010, 2009 and 2008
Condensed Statement of Income
| (Dollars in thousands) | For the year ended December 31, 2010 |
Period from 7/10/09 through 12/31/09 |
||||||
| Interest and dividend income: |
||||||||
| Dividends from Territorial Savings Bank |
$ | — | $ | 6,294 | ||||
| Interest-bearing deposit with Territorial Savings Bank |
230 | 59 | ||||||
| Other dividends |
— | 7 | ||||||
| Total interest and dividend income |
230 | 6,360 | ||||||
| Interest expense: |
||||||||
| Long-term debentures |
— | 206 | ||||||
| Total interest expense |
— | 206 | ||||||
| Noninterest expense: |
||||||||
| Salaries |
37 | 15 | ||||||
| Other general and administrative expenses |
843 | 778 | ||||||
| Total noninterest expense |
880 | 793 | ||||||
| Income before income taxes and equity in undistributed earnings in subsidiaries |
(650 | ) | 5,361 | |||||
| Income taxes |
(256 | ) | (187 | ) | ||||
| Income before equity in undistributed earnings in subsidiaries |
(394 | ) | 5,548 | |||||
| Equity in undistributed earnings of Territorial Savings Bank, net of dividends |
11,422 | (1,786 | ) | |||||
| Net income |
$ | 11,028 | $ | 3,762 | ||||
119
TERRITORIAL BANCORP INC. AND SUBSIDIARIES
Notes to Consolidated Financial Statements
December 31, 2010, 2009 and 2008
Condensed Statement of Cash Flows
| (Dollars in thousands) | For the year ended December 31, 2010 |
Period from 7/10/09 through 12/31/09 |
||||||
| Cash flows from operating activities: |
||||||||
| Net income |
$ | 11,028 | $ | 3,762 | ||||
| Adjustments to reconcile net income to net cash used in operating activities: |
||||||||
| Equity in undistributed earnings of Territorial |
||||||||
| Savings Bank, net of dividends |
(11,422 | ) | 1,786 | |||||
| Amortization of fees, discounts and premiums |
— | 5 | ||||||
| Loss on extinguishment of debt |
— | 507 | ||||||
| ESOP expense |
907 | 792 | ||||||
| Net (increase) decrease in prepaid expenses and other assets |
5,541 | (3,934 | ) | |||||
| Net decrease in other liabilities |
(1,418 | ) | (2,154 | ) | ||||
| Net cash provided by operating activities |
4,636 | 764 | ||||||
| Cash flows from investing activities: |
||||||||
| Investment in Territorial Savings Bank |
(51 | ) | (61,171 | ) | ||||
| Net cash used in investing activities |
(51 | ) | (61,171 | ) | ||||
| Cash flows from financing activities: |
||||||||
| Repayment of subordinated debt |
— | (24,744 | ) | |||||
| Proceeds from issuance of common stock, net of cost |
— | 108,856 | ||||||
| Purchases of company stock |
(1,027 | ) | — | |||||
| Cash dividends paid |
(2,713 | ) | — | |||||
| Net cash provided by (used in) financing activities |
(3,740 | ) | 84,112 | |||||
| Net increase in cash |
845 | 23,705 | ||||||
| Cash at beginning of the period |
23,705 | — | ||||||
| Cash at end of the period |
$ | 24,550 | $ | 23,705 | ||||
| Supplemental disclosure of noncash financing activities: |
||||||||
| During July 2009, the Company loaned $9.8 million to the Employee Stock Ownership Plan, which was used to acquire 978,650 shares of the Company’s common stock. The loan is secured by the shares purchased and is shown as Unearned ESOP shares in the consolidated balance sheets. |
||||||||
120
TERRITORIAL BANCORP INC. AND SUBSIDIARIES
Notes to Consolidated Financial Statements
December 31, 2010, 2009 and 2008
(26) Unaudited Quarterly Financial Information
| First Quarter |
Second Quarter |
Third Quarter |
Fourth Quarter |
Full Year | ||||||||||||||||
| (Dollars in thousands, except per share data) | ||||||||||||||||||||
| 2010: |
||||||||||||||||||||
| Interest and dividend income |
$ | 15,412 | $ | 15,322 | $ | 15,393 | $ | 14,988 | $ | 61,115 | ||||||||||
| Interest expense |
4,043 | 4,072 | 3,679 | 3,034 | 14,828 | |||||||||||||||
| Net interest income |
11,369 | 11,250 | 11,714 | 11,954 | 46,287 | |||||||||||||||
| Provision for loan losses |
— | 158 | 118 | 69 | 345 | |||||||||||||||
| Net interest income after provision for loan losses |
11,369 | 11,092 | 11,596 | 11,885 | 45,942 | |||||||||||||||
| Noninterest income |
(1,332 | ) | 1,478 | 1,043 | 939 | 2,128 | ||||||||||||||
| Noninterest expense |
7,789 | 7,431 | 7,666 | 8,644 | 31,530 | |||||||||||||||
| Income before income taxes |
2,248 | 5,139 | 4,973 | 4,180 | 16,540 | |||||||||||||||
| Income taxes |
787 | 1,904 | 1,839 | 982 | 5,512 | |||||||||||||||
| Net income |
1,461 | 3,235 | 3,134 | 3,198 | 11,028 | |||||||||||||||
| Basic earnings per share |
0.13 | 0.29 | 0.28 | 0.28 | 0.97 | |||||||||||||||
| Diluted earnings per share |
0.13 | 0.29 | 0.28 | 0.28 | 0.97 | |||||||||||||||
| Cash dividends declared |
0.05 | 0.05 | 0.07 | 0.07 | 0.24 | |||||||||||||||
| First Quarter |
Second Quarter |
Third Quarter |
Fourth Quarter |
Full Year | ||||||||||||||||
| (Dollars in thousands, except per share data) | ||||||||||||||||||||
| 2009: |
||||||||||||||||||||
| Interest and dividend income |
$ | 15,720 | $ | 14,964 | $ | 15,303 | $ | 15,538 | $ | 61,525 | ||||||||||
| Interest expense |
5,342 | 5,371 | 4,917 | 4,354 | 19,984 | |||||||||||||||
| Net interest income |
10,378 | 9,593 | 10,386 | 11,184 | 41,541 | |||||||||||||||
| Provision for loan losses |
1,102 | — | 10 | 86 | 1,198 | |||||||||||||||
| Net interest income after provision for loan losses |
9,276 | 9,593 | 10,376 | 11,098 | 40,343 | |||||||||||||||
| Noninterest income |
1,497 | 1,117 | (1,426 | ) | 1,317 | 2,505 | ||||||||||||||
| Noninterest expense |
6,635 | 7,363 | 7,896 | 7,651 | 29,545 | |||||||||||||||
| Income before income taxes |
4,138 | 3,347 | 1,054 | 4,764 | 13,303 | |||||||||||||||
| Income taxes |
1,467 | 1,092 | 325 | 1,755 | 4,639 | |||||||||||||||
| Net income |
2,671 | 2,255 | 729 | 3,009 | 8,664 | |||||||||||||||
| Basic earnings per share (1) |
N/A | N/A | 0.06 | 0.27 | 0.77 | |||||||||||||||
| Diluted earnings per share (1) |
N/A | N/A | 0.06 | 0.27 | 0.77 | |||||||||||||||
| Cash dividends declared |
— | — | — | — | — | |||||||||||||||
| (1) | Calculated from the effective date of July 10, 2009 to the period end |
(27) Subsequent Events
On February 3, 2011, the Board of Directors of Territorial Bancorp approved a quarterly cash dividend of $.07 per share of common stock. The dividend was paid on March 3, 2011 to stockholders of record as of February 17, 2011.
121
| ITEM 9. | Changes In and Disagreements With Accountants on Accounting and Financial Disclosure |
None.
| ITEM 9A. | Controls and Procedures |
(a) An evaluation was performed under the supervision and with the participation of the Company’s management, including the Chairman of the Board, President and Chief Executive Officer and the Senior Vice President and Treasurer, of the effectiveness of the design and operation of the Company’s disclosure controls and procedures (as defined in Rule 13a-15(e) promulgated under the Securities and Exchange Act of 1934, as amended) as of December 31, 2010. Based on that evaluation, the Company’s management, including the Chairman of the Board, President and Chief Executive Officer and the Senior Vice President and Treasurer, concluded that the Company’s disclosure controls and procedures were effective.
During the quarter ended December 31, 2010, there have been no changes in the Company’s internal control over financial reporting that have materially affected, or are reasonably likely to materially affect, the Company’s internal control over financial reporting.
(b) Management’s annual report on internal control over financial reporting.
Management of the Company is responsible for establishing and maintaining effective internal control over financial reporting as such term is defined in Rule 13a-15(f) in the Exchange Act. The Company’s internal control system is a process designed to provide reasonable assurance to the Company’s management and Board of Directors regarding the preparation and fair presentation of published financial statements.
Our internal control over financial reporting includes policies and procedures that pertain to the maintenance of records that, in reasonable detail, accurately and fairly reflect transactions and dispositions of assets; provide reasonable assurances that transactions are recorded as necessary to permit preparation of financial statements in accordance with U.S. generally accepted accounting principles, and that receipts and expenditures are being made only in accordance with authorizations of management and the directors of the Company; and provide reasonable assurance regarding prevention or timely detection of unauthorized acquisition, use or disposition of the Company’s assets that could have a material effect on our financial statements.
All internal control systems, no matter how well designed, have inherent limitations. Therefore, even those systems determined to be effective can provide only reasonable assurance with respect to financial statement preparation and presentation. Also, projections of any evaluation of effectiveness to future periods are subject to the risk that controls may become inadequate because of changes in conditions, or that the degree of compliance with the policies or procedures may deteriorate.
The Company’s management assessed the effectiveness of the Company’s internal control over financial reporting as of December 31, 2010. In making this assessment, we used the criteria set forth by the Committee of Sponsoring Organizations of the Treadway Commission in Internal Control-Integrated Framework. Based on our assessment we believe that, as of December 31, 2010, the Company’s internal control over financial reporting is effective based on those criteria.
The Company’s independent registered public accounting firm that audited the consolidated financial statements has issued an audit report on the effectiveness of the Company’s internal control over financial reporting as of December 31, 2010, and it is included in Item 8, under Part II of this Annual Report on Form 10-K.
| ITEM 9B. | Other Information |
None.
| ITEM 10. | Directors, Executive Officers and Corporate Governance |
The information in Territorial Bancorp Inc.’s definitive Proxy Statement for the 2011 Annual Meeting of Stockholders under the captions “Proposal 1—Election of Directors,” “Information About Executive Officers,” “Section 16(a) Beneficial Ownership Reporting Compliance,” “Code of Ethics and Business Conduct,” “Nominating and Corporate Governance Committee Procedures—Procedures to be Followed by Stockholders,” “Committees of the Board of Directors” and “—Audit Committee” is incorporated herein by reference.
| ITEM 11. | Executive Compensation |
The information in Territorial Bancorp Inc.’s definitive Proxy Statement for the 2011 Annual Meeting of Stockholders under the caption “Executive Compensation” is incorporated herein by reference.
122
| ITEM 12. | Security Ownership of Certain Beneficial Owners and Management and Related Stockholder Matters |
The information in Territorial Bancorp Inc.’s definitive Proxy Statement for the 2011 Annual Meeting of Stockholders under the caption “Stock Ownership” is incorporated herein by reference. Information with respect to the security ownership of our directors and executive officers is included above in “Item 10. Directors, Executive Officers and Corporate Governance,” and is incorporated herein by reference.
Equity Compensation Plan Information
Set forth below is information as of December 31, 2010 with respect to compensation plans (other than our employee stock ownership plan) under which equity securities of the Registrant are authorized for issuance.
| Equity Compensation Plan Information |
||||||||||||
| Number of securities to be issued upon exercise of outstanding options, warrants and rights |
Weighted-average exercise price of outstanding options, warrants and rights |
Number of securities remaining available for future issuance under stock-based compensation plans (excluding securities reflected in first column) |
||||||||||
| Equity compensation plans approved by security holders |
1,587,744 | $ | 17.36 | (1) | 124,893 | |||||||
| Equity compensation plans not approved by security holders |
N/A | N/A | N/A | |||||||||
| Total |
1,587,744 | $ | 17.36 | 124,893 | ||||||||
| (1) | Reflects weighted average price of stock options only |
| ITEM 13. | Certain Relationships and Related Transactions, and Director Independence |
The information in Territorial Bancorp Inc.’s definitive Proxy Statement for the 2011 Annual Meeting of Stockholders under the captions “Transactions with Certain Related Persons” and “Proposal 1 — Election of Directors” is incorporated herein by reference.
| ITEM 14. | Principal Accountant Fees and Services |
The information in Territorial Bancorp Inc.’s definitive Proxy Statement for the 2011 Annual Meeting of Stockholders under the captions “Proposal II—Ratification of Independent Registered Public Accounting Firm—Audit Fees” and “—Pre-Approval of Services by the Independent Registered Public Accounting Firm” is incorporated herein by reference.
| ITEM 15. | Exhibits and Financial Statement Schedules |
| (a) | Financial Statements |
123
The following documents are filed as part of this annual report:
| (i) | Report of Independent Registered Public Accounting Firm |
| (ii) | Consolidated Balance Sheets at December 31, 2010 and 2009 |
| (iii) | Consolidated Statements of Income for the years ended December 31, 2010, 2009 and 2008 |
| (iv) | Consolidated Statements of Stockholders’ Equity and Comprehensive Income for the years ended December 31, 2010, 2009 and 2008 |
| (v) | Consolidated Statements of Cash Flows for the years ended December 31, 2010, 2009 and 2008 |
| (vi) | Notes to Consolidated Financial Statements |
| (b) | Exhibits. |
| 3.1 | Articles of Incorporation of Territorial Bancorp Inc.* |
| 3.2 | Bylaws of Territorial Bancorp Inc.* |
| 4 | Form of Common Stock Certificate of Territorial Bancorp Inc.* |
| 10.1 | Employment Agreement between Territorial Bancorp Inc. and Allan S. Kitagawa** |
| 10.2 | Employment Agreement between Territorial Savings Bank and Allan S. Kitagawa* |
| 10.3 | First Amendment to Employment Agreement between Territorial Savings Bank and Allan S. Kitagawa |
| 10.4 | Employment Agreement between Territorial Bancorp Inc. and Vernon Hirata** |
| 10.5 | Employment Agreement between Territorial Savings Bank and Vernon Hirata* |
| 10.6 | First Amendment to Employment Agreement between Territorial Savings Bank and Vernon Hirata |
| 10.7 | Employment Agreement between Territorial Bancorp Inc. and Ralph Y. Nakatsuka** |
| 10.8 | Employment Agreement between Territorial Savings Bank and Ralph Y. Nakatsuka* |
| 10.9 | First Amendment to Employment Agreement between Territorial Savings Bank and Ralph Y. Nakatsuka |
| 10.10 | Supplemental Executive Retirement Agreement between Territorial Savings Bank and Allan S. Kitagawa* |
| 10.11 | Supplemental Executive Retirement Agreement between Territorial Savings Bank and Vernon Hirata* |
| 10.12 | Supplemental Executive Retirement Agreement between Territorial Savings Bank and Ralph Y. Nakatsuka* |
| 10.13 | Executive Deferred Incentive Agreement between Territorial Savings Bank and Allan S. Kitagawa* |
| 10.14 | Executive Deferred Incentive Agreement between Territorial Savings Bank and Vernon Hirata* |
| 10.15 | [Reserved] |
| 10.16 | Territorial Savings Bank Non-Qualified Supplemental Employee Stock Ownership Plan** |
| 10.17 | Territorial Savings Bank Executive Incentive Compensation Plan* |
| 10.18 | First Amendment to Territorial Savings Bank Executive Incentive Compensation Plan* |
| 10.19 | Second Amendment to Territorial Savings Bank Executive Incentive Compensation Plan |
| 10.20 | Territorial Bancorp Inc. 2010 Equity Incentive Plan*** |
| 10.21 | Form of Employee Restricted Stock Award |
| 10.22 | Form of Employee Stock Option Award |
| 10.23 | Form of Director Restricted Stock Award |
124
| 10.24 | Form of Director Stock Option Award |
| 10.25 | Territorial Savings Bank Separation Pay Plan and Summary Plan Description* |
| 23 | Consent of KPMG LLP |
| 31.1 | Certification of Chief Executive Officer pursuant to Rule 13a-14(a) of the Securities Exchange Act of 1934, as amended, as adopted pursuant to Section 302 of the Sarbanes-Oxley Act of 2002 |
| 31.2 | Certification of Chief Financial Officer pursuant to Rule 13a-14(a) of the Securities Exchange Act of 1934, as amended, as adopted pursuant to Section 302 of the Sarbanes-Oxley Act of 2002 |
| 32 | Certification of Chief Executive Officer and Chief Financial Officer pursuant to 18 U.S.C. Section 1350, as adopted pursuant to Section 906 of the Sarbanes-Oxley Act of 2002 |
| * | Incorporated by reference to the Registration Statement on Form S-1 (file no. 333-155388), initially filed November 14, 2008. |
| ** | Incorporated by reference to the Current Report on Form 8-K (file no. 1-34403), filed November 18, 2009. |
| *** | Incorporated by reference to the Proxy Statement for the 2010 Annual Meeting of Stockholders (file no. 1-34403), filed July 12, 2010. |
| (c) | Financial Statement Schedules |
Not applicable.
125
Exhibit 23
Consent of Independent Registered Public Accounting Firm
The Board of Directors
Territorial Bancorp Inc.:
We consent to the incorporation by reference in the registration statements No. 333-168839 and No. 333-170579 on Form S-8 of Territorial Bancorp Inc. of our reports dated March 14, 2011, with respect to the consolidated balance sheets of Territorial Bancorp Inc. as of December 31, 2010 and 2009, and the related consolidated statements of income, stockholders’ equity and comprehensive income, and cash flows for each of the years in the three-year period ended December 31, 2010, and the effectiveness of internal control over financial reporting as of December 31, 2010, which reports appear in the December 31, 2010 annual report on Form 10-K of Territorial Bancorp Inc.
/s/ KPMG LLP
Honolulu, Hawaii
March 14, 2011
SIGNATURES
In accordance with Section 13 of the Exchange Act, the Registrant has duly caused this report to be signed on its behalf by the undersigned, thereunto duly authorized.
| TERRITORIAL BANCORP INC. | ||
| By: | /s/ Allan S. Kitagawa | |
| Allan S. Kitagawa | ||
| Chairman of the Board, President and Chief Executive Officer | ||
| (Duly Authorized Representative) | ||
In accordance with the Exchange Act, this report has been signed by the following persons on behalf of the Registrant and in the capacities and on the dates indicated.
| Signatures |
Title |
Date | ||
| /s/ Allan S. Kitagawa Allan S. Kitagawa |
Chairman of the Board, President and Chief Executive Officer (Principal Executive Officer) |
March 14, 2011 | ||
| /s/ Melvin M. Miyamoto Melvin M. Miyamoto |
Senior Vice President and Treasurer (Principal Financial and Accounting Officer) |
March 14, 2011 | ||
| /s/ Kirk W. Caldwell Kirk W. Caldwell |
Director |
March 14, 2011 | ||
| /s/ Howard Y. Ikeda Howard Y. Ikeda |
Director |
March 14, 2011 | ||
| /s/ David S. Murakami David S. Murakami |
Director |
March 14, 2011 | ||
| /s/ Richard I. Murakami Richard I. Murakami |
Director |
March 14, 2011 | ||
| /s/ Harold H. Ohama Harold H. Ohama |
Director |
March 14, 2011 | ||
126