Attached files
UNITED STATES
SECURITIES AND EXCHANGE COMMISSION
WASHINGTON, D.C. 20549
FORM 10-K
ANNUAL REPORT PURSUANT TO SECTION 13 OR 15(d) OF THE SECURITIES EXCHANGE
ACT OF 1934
FOR THE FISCAL YEAR ENDED DECEMBER 31, 2010
COMMISSION FILE NUMBER 000-23777
PENSECO FINANCIAL SERVICES CORPORATION
SCRANTON, PENNSYLVANIA
COMMONWEALTH OF PENNSYLVANIA
I.R.S. EMPLOYER IDENTIFICATION NUMBER 23-2939222
150 NORTH WASHINGTON AVENUE
SCRANTON, PENNSYLVANIA 18503-1848
TELEPHONE NUMBER 570-346-7741
SECURITIES REGISTERED UNDER SECTION 12(g) OF THE ACT
Common Stock, Par Value $ .01 per share
Indicate by check mark if the registrant is a well-known seasoned issuer, as defined in Rule 405 of the Securities Act. Yes ¨ No x
Indicate by check mark if the registrant is not required to file reports pursuant to Section 13 or Section 15(d) of the Act. Yes ¨ No x
Indicate by check mark whether the registrant (1) has filed all reports required to be filed by Section 13 or 15(d) of the Securities Exchange Act of 1934 during the preceding 12 months (or for such shorter period that the registrant was required to file such reports), and (2) has been subject to such filing requirements for the past 90 days. Yes x No ¨
Indicate by check mark whether the registrant has submitted electronically and posted on its corporate Website, if any, every Interactive Data File required to be submitted and posted pursuant to Rule 405 of Regulation S-T (§ 232.405 of this chapter) during the preceding 12 months (or for such shorter period that the registrant was required to submit and post such files). Yes ¨ No ¨
Indicate by check mark if disclosure of delinquent filers pursuant to Item 405 of Regulation S-K (§ 229.405 of this chapter) is not contained herein, and will not be contained, to the best of registrant’s knowledge, in definitive proxy or information statements incorporated by reference in Part III of this Form 10-K or any amendment to this Form 10-K. ¨
Indicate by check mark whether the registrant is a large accelerated filer, an accelerated filer, a non-accelerated filer or a smaller reporting company. See the definitions of “large accelerated filer”, “accelerated filer” and “smaller reporting company” in Rule 12b-2 of the Exchange Act.
| Large accelerated filer |
¨ |
Accelerated filer |
x | |||
| Non-accelerated filer |
¨ (Do not check if a smaller reporting company) |
Smaller reporting company |
¨ | |||
Indicate by check mark whether the registrant is a shell company (as defined in Rule 12b-2 of the Act). Yes ¨ No x
The aggregate market value of the Company’s voting stock held by non-affiliates of the registrant on June 30, 2010, based on the closing price of such stock on that date, equals approximately $92,645,322.
The number of shares of common stock outstanding as of March 11, 2011 equals 3,276,079.
DOCUMENTS INCORPORATED BY REFERENCE
Portions of the Corporation’s definitive proxy statement relating to the 2011 Annual Meeting of Stockholders, to be held on May 3, 2011, are incorporated by reference in Part III.
PENSECO FINANCIAL SERVICES CORPORATION
All information is presented in thousands of dollars, except as indicated and per share amounts are based on weighted average shares outstanding in each period.
PART I
| ITEM 1 | BUSINESS |
GENERAL
PENSECO FINANCIAL SERVICES CORPORATION, (the “Company”), which is headquartered in Scranton, Pennsylvania, was formed under the general corporation laws of the Commonwealth of Pennsylvania in 1997 and is registered as a financial holding company. The Company became a holding company upon the acquisition of all of the outstanding shares of Penn Security Bank and Trust Company (the “Bank”), a Pennsylvania state-chartered bank, on December 31, 1997. The Company is subject to supervision by the Board of Governors of the Federal Reserve System, or the “Federal Reserve Board.” The Bank, as a state-chartered financial institution, is subject to supervision, regulation and examination by the Federal Deposit Insurance Corporation and the Pennsylvania Department of Banking.
The Bank is a full service community bank operating twelve branch offices in Lackawanna, Luzerne, Monroe and Wayne Counties of Pennsylvania serving principally the communities of Scranton, Clarks Summit, Old Forge, Moscow, Stroudsburg, East Stroudsburg and Mount Pocono. The Company’s principal banking office is located at 150 North Washington Avenue, Scranton, Pennsylvania, containing trust, investor services, marketing, audit, human resources, executive, data processing, central loan processing and central bookkeeping offices.
ACQUISITION OF OLD FORGE BANK
On April 1, 2009, the Company completed its acquisition of Old Forge Bank in a cash and stock transaction valued at approximately $55.5 million (the “Merger”). The Merger was accounted for using the acquisition method of accounting and, accordingly, the assets and liabilities of Old Forge Bank have been recorded at their respective fair values on the date the Merger was completed. Old Forge Bank was merged into Penn Security Bank and Trust Company. An aggregate of 1,128,079 shares of Company common stock and approximately $17.4 million in cash was paid to former Old Forge Bank shareholders.
Recognized amounts of identifiable assets acquired and liabilities assumed on April 1, 2009 as a result of the Merger are as follows:
| Cash |
$ | 4,760 | ||
| Investments |
31,261 | |||
| Loans |
159,949 | |||
| Property and equipment |
1,576 | |||
| Core Deposit Intangible |
2,027 | |||
| All other assets |
13,027 | |||
| Identifiable Assets |
212,600 | |||
| Deposits |
177,018 | |||
| Borrowings |
5,000 | |||
| All other liabilities |
1,517 | |||
| Identifiable Liabilities |
183,535 | |||
| Identifiable net assets |
29,065 | |||
| Goodwill |
26,398 | |||
| Total consideration transferred |
$ | 55,463 | ||
2
The following table reflects net income from accretion and amortization, net of taxes, of acquisition date fair value adjustments relating to the Merger included in the Company’s financial results during the period indicated.
| Years Ended December 31, |
2010 | 2009 | ||||||
| Homogeneous loan pools |
$ | 633 | $ | 550 | ||||
| Time deposits |
185 | 305 | ||||||
| Core deposit intangible expense |
(225 | ) | (182 | ) | ||||
| Net income from acquisition fair value adjustment |
$ | 593 | $ | 673 | ||||
FINANCIAL OVERVIEW
The following table sets forth certain financial information regarding the Company at and for the years ended December 31, 2010, 2009 and 2008:
| 2010 | 2009 | 2008 | ||||||||||
| Interest Income |
$ | 41,745 | $ | 40,151 | $ | 33,898 | ||||||
| Interest Expense |
8,356 | 9,580 | 10,830 | |||||||||
| Net Interest Income |
33,389 | 30,571 | 23,068 | |||||||||
| Provision for Loan Losses |
1,999 | 2,260 | 861 | |||||||||
| Net Interest Income after Provision for Loan Losses |
31,390 | 28,311 | 22,207 | |||||||||
| Non-Interest Income |
12,152 | 10,369 | 11,036 | |||||||||
| Non-Interest Expenses |
28,453 | 28,420 | 22,172 | |||||||||
| Income Taxes |
3,367 | 1,888 | 2,458 | |||||||||
| Net Income |
$ | 11,722 | $ | 8,372 | $ | 8,613 | ||||||
| Earnings per Share |
$ | 3.58 | $ | 2.80 | $ | 4.01 | ||||||
| Total Revenue |
$ | 53,897 | $ | 50,520 | $ | 44,934 | ||||||
| Net Interest Margin |
4.11 | % | 4.11 | % | 3.93 | % | ||||||
| BALANCE SHEET AMOUNTS: |
||||||||||||
| Assets |
$ | 916,087 | $ | 883,327 | $ | 628,967 | ||||||
| Investment Securities |
$ | 217,044 | $ | 195,930 | $ | 151,912 | ||||||
| Net Loans |
$ | 608,605 | $ | 597,670 | $ | 435,873 | ||||||
| Deposits |
$ | 691,032 | $ | 645,434 | $ | 424,725 | ||||||
| Long-Term Borrowings |
$ | 68,835 | $ | 68,094 | $ | 72,720 | ||||||
| Stockholders’ Equity |
$ | 121,922 | $ | 117,397 | $ | 73,642 | ||||||
Net income for 2010 increased $3,350 or 40.0%, to $11,722 or $3.58 per weighted average share compared with the year ago period of $8,372 or $2.80 per weighted average share. The increase in net income was primarily attributed to higher net interest income as well as the absence of merger-related costs in 2010, compared to $1,550 incurred in 2009 due to the Company’s acquisition of Old Forge Bank. Also, the Company did not recognize any impairment losses in 2010 as compared to $787 of losses in 2009 related to the Bank’s equity investment portfolio. The results of operations for 2010 include twelve months of operations from the former Old Forge Bank, as opposed to only nine months of Old Forge Bank operations captured in 2009. Net interest margin remained unchanged at 4.11% for the year ended December 31, 2010 compared to the year ended December 31, 2009. Net interest income increased $2,818 or 9.2% to $33,389 for the year ended December 31, 2010 compared to $30,571 for 2009. Net interest income after provision for loan losses increased $3,079 or 10.9% during 2010 primarily due to increased interest and fees on loans, which in turn were attributable to the expansion of our loan portfolio following the acquisition of Old Forge Bank in 2009. Net interest income was also positively affected in 2010 by reduced interest expense from lower borrowing costs. The provision for loan losses decreased $261 to $1,999 during 2010 compared with $2,260 for the same period of 2009, based on management’s evaluation of the adequacy of the allowance for loan losses through the application of its allowance for loan losses methodology. Among other things, the methodology, which was enhanced in the third quarter of 2010, takes into consideration the strength of the local economy. Please see the discussion of our methodology for calculating the allowance for loan losses under the heading “Management’s Discussion & Analysis—Provision for Loan Losses.”
3
Net income for 2009 decreased $241 or 2.8%, to $8,372 or $2.80 per weighted average share compared with 2008 net income of $8,613 or $4.01 per share. The decrease in net income was primarily attributed to merger costs of $1,550, the recognition of an impairment loss on bank equity investment securities of $787, increased FDIC insurance costs of $909, along with the effect of a one time gain of $1,129, net of tax, related to Visa International’s Initial Public Offering during 2008. Net interest margin increased from 3.93% for the year ended December 31, 2008 to 4.11% for the year ended December 31, 2009. Net interest income increased $7,503 or 32.5% to $30,571 for the twelve months ended December 31, 2009 compared to $23,068 for the same period of 2008. The increase was largely due to an increase in the loan portfolio of $159.9 million that resulted from the acquisition of Old Forge Bank on April 1, 2009. Net interest income after provision for loan losses increased $6,104 or 27.5% during the 2009 period, largely due to increased interest and fees on loans and reduced interest expense from lower borrowing costs. The provision for loan losses increased $1,399 to $2,260 during 2009 compared with $861 for the same period of 2008 due to economic weakness and uncertainty with regard to the overall state of the economy, concern as to the local economy and the unemployment rate. In 2009 the Bank had an increase in non-performing loans, charge-offs and foreclosures.
In 2010, the local economy continued to experience the effects of our nation’s economic downturn. The local housing market remained weak and the unemployment rate in Northeastern Pennsylvania was largely unchanged at 9.5% at year-end (compared to 9.6% at December 31, 2009) according to the Pennsylvania Department of Labor & Industry.
Although the level of non-performing loans increased because of the high levels of unemployment, we believe that adequate allowances for non-performing loans have been made at this time. To enhance our ability to identify and manage risk throughout our organization going forward, the Bank created the senior level position of Chief Risk Officer. This position will facilitate our enterprise-wide risk assessment to identify, monitor and quickly mitigate the inherent risks of a community bank in today’s economic environment.
The table below sets forth allowances for loan losses for the three most recently completed fiscal years:
| As of: |
2010 | 2009 | 2008 | |||||||||
| Provision for loan losses |
$ | 1,999 | $ | 2,260 | $ | 861 | ||||||
| Allowance for loan losses to non-performing loans |
161.1 | % | 269.3 | % | 362.8 | % | ||||||
| Non-performing loans to period end loans |
0.66 | % | 0.39 | % | 0.33 | % | ||||||
| Ratio of charge-off loans to average loans |
0.30 | % | 0.23 | % | 0.07 | % | ||||||
| Ratio of foreclosed loans to average loans |
0.19 | % | 0.21 | % | — | |||||||
| 2010 | 2009 | 2008 | ||||||||||||||||||||||
| As of: |
Amount | (#) | Amount | (#) | Amount | (#) | ||||||||||||||||||
| Charge-offs |
$ | 1,838 | 102 | $ | 1,300 | 75 | $ | 317 | 50 | |||||||||||||||
| Foreclosures completed |
1,183 | 6 | 1,145 | 7 | — | — | ||||||||||||||||||
| Non-performing loans |
4,034 | 70 | 2,339 | 46 | 1,454 | 16 | ||||||||||||||||||
As a result of the economic conditions in our market area, starting in 2009, management took the following actions:
| • | Adjusted the credit policy in 2009 to lower the maximum loan-to-value ratios on commercial real estate loans and certain consumer loans; |
| • | Hired a former bank examiner in February 2010 to perform loan reviews on a full time basis and to enhance our allowance for loan loss methodology for implementation in the third quarter of 2010; and |
| • | Contracted with a credit professional in March 2010 to assess the soundness of the small business underwriting function as well as the appropriateness of the Company’s established methodology for determining the allowance for loan losses. |
There were no purchased loans in 2010, 2009 or 2008 other than loan participations with local banks. Originations of new loans are primarily in loans secured by real estate. The growth in loans from 2008 to 2010 was mainly due to the merger of Old Forge Bank.
4
MARKET AREA AND COMPETITIVE CONDITIONS
The Bank considers Monroe, Lackawanna, Wayne and Luzerne Counties in Northeastern Pennsylvania to be its primary market area. The Bank operates in a competitive environment in which it must compete with many local independent banks as well as several banks that are affiliates or branches of very large regional and national holding companies. The competition includes commercial banks, savings and loan associations, credit unions, other lending institutions and mortgage originators.
The following table sets forth the percentage of deposits held by the Bank in each of the counties comprising its primary market area as of June 30, 2010, the latest date for which information is available, and June 30, 2009:
| June 30, 2010 | June 30, 2009 | |||||||
| Monroe |
1.94 | % | 2.02 | % | ||||
| Lackawanna |
12.10 | % | 12.34 | % | ||||
| Wayne |
1.20 | % | 1.26 | % | ||||
| Luzerne |
0.37 | % | 0.37 | % | ||||
The principal competitive factors among the Company’s competitors can be grouped into two categories: pricing and services. In the Company’s primary service area, interest rates on deposits, especially time deposits, and interest rates and fees charged to customers on loans are very competitive. In the current economic environment, there is increased competition in view of weaker loan demand. From a service perspective, the Bank competes in areas such as convenience of location, types of services offered, service costs and banking hours. Our profitability depends on our continued ability to compete successfully in our market area.
LENDING AND DEPOSIT PRODUCTS
Through its banking subsidiary, the Company generates interest income from its outstanding loans receivable and its investment portfolio. Other income is generated primarily from merchant transaction fees, trust fees and service charges on deposit accounts. The Company’s primary costs are interest paid on deposits and borrowings and general operating expenses. The Company provides a variety of commercial and retail banking services to business and professional customers, as well as retail customers, on a personalized basis. The Company’s primary lending products are real estate, commercial and consumer loans. The Company also offers ATM access, credit cards, active investment accounts, trust department services and other various lending, depository and related financial services. The Company’s primary deposit products are savings and demand deposit accounts and certificates of deposit. The Company also offers collateralized repurchase agreements, as an alternative deposit option for its customers. The repurchase agreements are accounted for as a collateralized borrowing with a one day maturity and are collateralized by U.S. Agency securities. At December 31, 2010, the Company had aggregate repurchase agreements with balances of approximately $19.4 million.
The table presented below indicates the composition of the Company’s loan portfolio at December 31 of each of the years ended 2010, 2009 and 2008.
| 2010 | 2009 | 2008 | ||||||||||||||||||||||
| Commercial Secured by Real Estate |
$ | 207,964 | 33.8 | % | $ | 194,935 | 32.3 | % | $ | 115,957 | 26.3 | % | ||||||||||||
| Residential Real Estate |
295,301 | 48.0 | % | 308,068 | 51.0 | % | 261,520 | 59.3 | % | |||||||||||||||
| Commercial and Industrial |
36,190 | 5.9 | % | 30,743 | 5.1 | % | 27,793 | 6.3 | % | |||||||||||||||
| Consumer |
55,862 | 9.1 | % | 59,789 | 9.9 | % | 28,281 | 6.4 | % | |||||||||||||||
| States & Political Subdivisions |
9,882 | 1.6 | % | 6,873 | 1.1 | % | 4,471 | 1.0 | % | |||||||||||||||
| All Other |
9,906 | 1.6 | % | 3,562 | 0.6 | % | 3,126 | 0.7 | % | |||||||||||||||
| Loans net of Unearned Income |
$ | 615,105 | 100.0 | % | $ | 603,970 | 100.0 | % | $ | 441,148 | 100.0 | % | ||||||||||||
Loans secured by real estate represent the largest portion of the loan portfolio and have been relatively stable in terms of the percentage of the Company’s loan portfolio representing 82%, 83%, and 86% for the years ended 2010, 2009, and 2008, respectively. Installment loans represent 10% of the loan portfolio due to the indirect automobile loan portfolio acquired in the merger with Old Forge Bank, which was $25 million at April 1, 2009. Commercial and industrial loans have remained relatively stable as a percentage of the loan portfolio, representing 6%, 5% and 6% at year end 2010, 2009 and 2008.
The Company’s loan portfolio is primarily residential and commercial secured mortgage loans in its Northeastern Pennsylvania market area. Approximately 2% of the loan portfolio was comprised of loans to entities located outside our market area.
At December 31, 2010, the loan portfolio was comprised of approximately $285.4 million or 46.4% of fixed rate loans and $329.7 million or 53.6% of adjustable rate loans.
5
The Company is not dependent upon a single customer, or a few customers, the loss of one or more of which would have a material adverse effect on its operations. The operations and earnings of the Company are not materially affected by seasonal changes or by Federal, state or local environmental laws or regulations.
Lending Activities
The Bank offers a variety of loans including commercial, residential and consumer loans. The consumer portfolio includes automobile loans, educational loans and home equity loans and lines of credit. Since 2008, the Company has discontinued originating educational loans. Since 2007, the commercial real estate loan portfolio has grown steadily. During 2010, the commercial real estate portfolio remained stable despite the weakened economy, and at December 31, 2010 and 2009, it comprised 33.8% and 32.3% of our total loan portfolio, respectively.
The Company intends to continue to evaluate commercial real estate and commercial business lending opportunities, including small business lending. The Bank has added to the experienced staff of commercial lenders and continues to proactively monitor and manage existing credit relationships. To this end, the Bank has enhanced the credit risk management staff and procedures as it relates to residential mortgage loans.
The Company has not engaged in sub-prime residential mortgage lending, which is defined as mortgage loans advanced to borrowers who do not qualify for market interest rates because of problems with their credit history. The Company focuses its lending efforts within its market area.
One-to-Four Family Residential Loans. The Bank offers two types of residential mortgage loans: fixed-rate loans, with terms of up to 30 years, and adjustable-rate loans, with interest rates and payments that adjust annually after an initial fixed period of one, three or five years. Interest rates and payments on our adjustable-rate loans generally are adjusted to a rate equal to a percentage above the U.S. Treasury Security Index. The Bank’s adjustable-rate single-family residential real estate loans generally have a cap of 2% on any increase or decrease in the interest rate at any adjustment date, and a maximum adjustment limit of 6% on any such increase or decrease over the life of the loan. Although the Bank does offer adjustable-rate loans with initial rates below the fully indexed rate, loans tied to the one-year constant maturity treasury (“CMT”) are underwritten using methods approved by the Federal Home Loan Mortgage Corporation (“Freddie Mac”) or the Federal National Mortgage Association (“Fannie Mae”), which require borrowers to be qualified at a rate equal to 200 basis points above the discounted loan rate under certain conditions.
Borrower demand for adjustable-rate loans compared to fixed-rate loans is a function of the level of interest rates, the expectations of changes in the level of interest rates, and the difference between the interest rates and loan fees offered for fixed-rate mortgage loans as compared to the interest rates and loan fees for adjustable-rate loans. The loan fees, interest rates and other provisions of mortgage loans are determined by us on the basis of our own pricing criteria and competitive market conditions.
Our residential mortgage loans are consistently underwritten to standards established by Freddie Mac.
While one-to-four family residential real estate loans are normally originated with up to 30-year terms, such loans typically remain outstanding for substantially shorter periods because borrowers often prepay their loans in full either upon sale of the property pledged as security or upon refinancing the original loan. Therefore, average loan maturity is a function of, among other factors, the level of purchase and sale activity in the real estate market, prevailing interest rates and the interest rates payable on outstanding loans. The Bank does not offer loans with negative amortization or interest only loans.
The Bank generally does not make high loan-to-value loans (defined as loans with a loan-to-value ratio in excess of 80%) without private mortgage insurance. The maximum loan-to-value ratio the Bank generally permits is 95% with private mortgage insurance. The Bank requires all properties securing mortgage loans to be appraised by a board-approved independent appraiser. The Bank generally requires title insurance on all first mortgage loans. Borrowers must obtain hazard insurance, and flood insurance is required for loans on properties located in a flood zone.
Commercial Real Estate Loans. At December 31, 2010, the Bank had commercial real estate loans totaling $208.0 million, or 33.8%, of our total loan portfolio.
6
The Bank offers commercial real estate loans secured by real estate primarily with adjustable rates. The Bank originates a variety of commercial real estate loans generally for terms up to 25 years and payments based on an amortization schedule of up to 25 years. These loans are typically based on either the Federal Home Loan Bank (“FHLB”) of Pittsburgh’s borrowing rate or our own pricing criteria and adjust every three to five years. Commercial real estate loans also are originated for the acquisition and development of land. Conditions of acquisition and development loans originated generally limit the number of model homes and homes built on speculation, and draws are scheduled against executed agreements of sale. Commercial real estate loans for the acquisition and development of land are typically based upon the prime rate as published in The Wall Street Journal. Commercial real estate loans for developed real estate and for real estate acquisition and development are originated generally with loan-to-value ratios up to 75%, while loans for the acquisition of land are originated with a maximum loan to value ratio of 65%.
Commercial Loans. The Bank offers commercial business loans to professionals, sole proprietorships and small businesses in our market area. The Bank offers installment loans for capital improvements, equipment acquisition and long-term working capital. These loans are typically priced at short term fixed rates or variable rates based on the prime rate as published in The Wall Street Journal. These loans are secured by business assets other than real estate, such as business equipment and inventory, and, generally, are backed by the personal guarantee of the borrower. The Bank originates lines of credit to finance the working capital needs of businesses to be repaid by seasonal cash flows or to provide a period of time during which the business can borrow funds for planned equipment purchases.
When making commercial business loans, the Bank considers the financial statements of the borrower and guarantor, the borrower’s payment history of both corporate and personal debt, the debt service capabilities of the borrower, the projected global cash flows of the business and guarantor, the viability of the industry in which the customer operates and the value of the collateral.
Consumer Loans. The Bank offers a variety of consumer loans, including home equity loans and lines of credit, automobile loans and loans secured by savings accounts and certificates of deposit. The Banks also offers unsecured loans.
The Bank generally offers home equity loans and lines of credit with a maximum combined loan-to-value ratio of 80%. Home equity loans have fixed-rates of interest and are originated with terms of up to 15 years. Home equity lines of credit have variable rates and are based upon the prime rate as published in The Wall Street Journal. Home equity lines of credit have draw periods with 20 year repayment periods.
The Bank offers loans secured by new and used automobiles, both directly and indirectly through dealerships. These loans have fixed interest rates and generally have terms up to six years. The Bank offers automobile loans with loan-to-value ratios of up to 100% of the purchase price of the vehicle depending upon the credit history of the borrower and other factors.
The Bank offers consumer loans secured by savings accounts and certificates of deposit held at the Company based upon the deposit rates plus a margin with terms up to five years. The Bank will offer such loans up to 100% of the principal balance of the certificate of deposit or balance in the savings account. The Bank also offers unsecured loans and lines of credit with terms up to five years. Our unsecured loans and lines of credit bear a substantially higher interest rate than our secured loans and lines of credit.
The procedures for underwriting consumer loans include an assessment of the applicant’s payment history on other debts and ability to meet existing obligations and payments on the proposed loan. Although the applicant’s creditworthiness is a primary consideration, the underwriting process also includes a comparison of the value of the collateral, if any, to the proposed loan amount.
Credit Risks
The Company adheres to sound credit policies, both prior to and during the current economic downturn. Our loan policies require verification of information provided by loan applicants as well as an assessment of their ability to repay for all loans. At no time has the Company made loans similar to those commonly referred to as “no doc” or “stated income” loans.
While the vast majority of the loan portfolio involves collateral, the Company has made and will continue to make loans on an unsecured basis. At December 31, 2010, there were $12.5 million in unsecured consumer loans in our portfolio and $5.5 million in commercial loans which is considerably less than the $9.1 million outstanding at December 31, 2009. Unsecured commercial loans are only granted to those borrowers exhibiting historically strong cash flow and capacity with seasoned management of unquestioned character. In addition, for unsecured loans made to businesses, the Company’s credit policy requires loan guarantees by all individuals having 20% or more ownership interest in the borrowing entity. Unsecured consumer loans are made for relatively short terms and to borrowers with strong credit histories. Unsecured consumer loans at December 31, 2010 also included a credit card portfolio of $3.3 million.
7
Requests to modify, restructure or otherwise change the terms of loans are considered by the Company on an individual basis as the circumstances and/or reasons for such changes may vary. All such changes in terms must be authorized by the original approval body. Also, our credit policy prohibits the modification of loans or the extension of additional credit to borrowers who are not current on their payments. Exceptions are approved only where the Company’s position in the credit relationship is expected to be greatly enhanced by such action.
Adjustable-Rate Loans. While the Bank anticipates that adjustable-rate loans will better offset the adverse effects of an increase in interest rates as compared to fixed-rate mortgages, an increased monthly mortgage payment required of adjustable-rate loan borrowers in a rising interest rate environment could cause an increase in delinquencies and defaults. The marketability of the underlying property also may be adversely affected in a high interest rate environment. In addition, although adjustable-rate mortgage loans make our asset base more responsive to changes in interest rates, the extent of this interest sensitivity is limited by the annual and lifetime interest rate adjustment limits on residential mortgage loans.
Commercial Real Estate Loans. Loans secured by commercial real estate generally have larger balances and involve a greater degree of risk than one-to-four family residential mortgage loans. Of primary concern in commercial real estate lending is the borrower’s and guarantor’s creditworthiness and the feasibility and global cash flow potential of the project. Additional considerations include: location, market and geographic concentrations, loan to value, strength of guarantors and quality of tenants. Payments on loans secured by income properties often depend on successful operation and management of the properties. As a result, repayment of such loans may be subject to a greater extent than residential real estate loans, to adverse conditions in the real estate market or the economy. To monitor cash flows on income properties, the Bank requires borrowers and loan guarantors, if any, to provide annual financial statements on commercial real estate loans and rent rolls where applicable. In reaching a decision on whether to make a commercial real estate loan, the Bank considers and reviews a global cash flow analysis of the borrower and guarantor, when applicable, and considers the net operating income of the property, the borrower’s expertise, credit history and profitability and the value of the underlying property. The Bank has generally required that the properties securing these real estate loans have debt service coverage ratios (the ratio of earnings before debt service to debt service) of at least 1.2x. An environmental report is obtained when the possibility exists that hazardous materials may have existed on the site, or the site may have been impacted by adjoining properties that handled hazardous materials.
Commercial Business Loans. Unlike residential mortgage loans, which generally are made on the basis of the borrower’s ability to make repayment from his or her employment or other income, and which are secured by real property, the value of which tends to be more easily ascertainable, commercial business loans are of higher risk and typically are made on the basis of the borrower’s ability to make repayment from the cash flow of the borrower’s business. As a result, the availability of funds for the repayment of commercial business loans may depend substantially on the success of the business itself. Further, any non-real estate collateral securing such loans may depreciate over time, may be difficult to appraise and may fluctuate in value.
Consumer Loans. Consumer loans may entail greater risk than do residential mortgage loans, particularly in the case of consumer loans that are unsecured or secured by assets that depreciate rapidly, such as motor vehicles. In the latter case, repossessed collateral for a defaulted consumer loan may not provide an adequate source of repayment for the outstanding loan and a small remaining deficiency often does not warrant further substantial collection efforts against the borrower. Consumer loan collections depend on the borrower’s continuing financial stability, and therefore are likely to be adversely affected by various factors, including job loss, divorce, illness or personal bankruptcy. Furthermore, the application of various federal and state laws, including federal and state bankruptcy and insolvency laws, may limit the amount that can be recovered on such loans.
Loan Originations. Loan originations come from a number of sources. The primary sources of loan originations are existing customers, walk-in traffic, advertising and referrals from customers.
The Bank also purchases participations in loans from local financial institutions to supplement our lending portfolio. Loan participations totaled $19.5 million at December 31, 2010. Loan participations are subject to the same credit analysis and loan approvals as loans the Bank originates. The Bank is permitted to review all of the documentation relating to any loan in which the Bank participates. However, in a purchased participation loan, the Bank does not service the loan and thus are subject to the policies and practices of the lead lender with regard to monitoring delinquencies, pursuing collections and instituting foreclosure proceedings.
Loan Approval Procedures and Authority. Our lending activities follow written, non-discriminatory, underwriting standards and loan origination procedures established by our board of directors and management. The Board of Directors has granted loan approval authority to certain officers or groups of officers up to prescribed limits, based on the officer’s experience. Individual loans or lending relationships with aggregate exposure of more than $500,000 must be approved by the Senior Loan Committee, which is comprised of senior Bank officers. All loans or lending relationships in excess of $1.0 million must be approved by the Credit Committee of the Bank’s Board, which includes four non-employee directors. All loans or lending relationships in excess of $3.0 million must be approved by the full Board of Directors of the Bank.
8
Loans to One Borrower. The maximum amount that the Bank may lend to one borrower and the borrower’s related entities is limited, by regulation, to generally 15% of our stated capital and reserves. At December 31, 2010, our regulatory limit on loans to one borrower was $14.8 million. At that date, the total outstanding available credit balance with our largest lending relationship was $9.1 million which was secured by various mixed use commercial real estate and general business assets. All of the loans in the relationship are performing in accordance with their original terms at December 31, 2010.
Financial Services.
The Company has a third party marketing agreement with UVEST Financial Services that allows the Company to offer a full range of securities, brokerage services and annuity sales to its customers. The Company’s Investor Services Division is located in the Company’s headquarters building and the services are offered throughout the entire branch system. For the year ended December 31, 2010, the Company’s income from brokerage services was $340 or 0.6% of total revenue compared to $348 or 0.7% in 2009 and $596 or 1.3% in 2008.
REGULATION AND SUPERVISION
General
The Bank is a commercial bank chartered by the Commonwealth of Pennsylvania. The Federal Deposit Insurance Corporation insures our deposits up to applicable limits. The Bank is subject to extensive regulation, examination and supervision by the Pennsylvania Department of Banking, our primary regulator, and the Federal Deposit Insurance Corporation, as deposit insurer. The Bank is required to file reports with the Pennsylvania Department of Banking and the Federal Deposit Insurance Corporation concerning our activities and financial condition. The Pennsylvania Department of Banking and the Federal Deposit Insurance Corporation periodically review our safety and soundness and our compliance with various regulatory requirements.
The Company is a bank holding company subject to regulation by the Federal Reserve Board under the Bank Holding Company Act (“BHCA”). The Company is also subject to regular examination by and the enforcement authority of the Federal Reserve Board. The Company is also treated as a bank holding company under Pennsylvania banking law. As such, the Company is subject to periodic examination by, and may be required to file reports with, the Pennsylvania Department of Banking.
This regulation and supervision establishes a comprehensive framework of activities in which an institution can engage and is intended primarily for the protection of depositors and borrowers, not our stockholders. The regulatory structure also gives the regulatory authorities extensive discretion in connection with their supervisory, enforcement activities and examination policies, with respect to the classification of assets and the establishment of adequate loan loss reserves for regulatory purposes. Any change in such regulatory requirements and policies, whether by the Pennsylvania Department of Banking, the Pennsylvania Legislature, the Federal Deposit Insurance Corporation or the U.S. Congress could have a material adverse impact on our operations.
Certain legal and regulatory requirements that apply to us are referred to below or elsewhere in this document. The summaries of the statutory provisions and regulations set forth in the document do not purport to be a complete description of all applicable statutes and regulations and their effects on us and are qualified in their entirety by reference to the actual statutes and regulations.
Regulation of Pennsylvania Commercial Banks
The Pennsylvania Department of Banking regulates the internal organization of the Bank as well as our activities, including, deposit-taking, lending and investment. The basic authority for our activities is specified by Pennsylvania law and by regulations, policies and directives issued by the Pennsylvania Department of Banking. The Federal Deposit Insurance Corporation also regulates many of the areas regulated by the Pennsylvania Department of Banking and federal law limits some of the authority that Pennsylvania law grants to us.
Business Activities. The Pennsylvania Department of Banking is required to regularly examine each state-chartered bank. The approval of the Pennsylvania Department of Banking is required to establish or close branches, to merge with another bank and to undertake many other activities.
Limits on Loans to One Borrower. Generally, the maximum amount that the Bank will be able to lend to a single borrower under Pennsylvania law is 15% of our capital accounts.
9
Loans to a Bank’s Insiders. Pennsylvania law provides that the Bank may make loans to our executive officers and directors and greater than 10% stockholders (collectively, “insiders”) in accordance with federal regulations. Generally, under federal law, loans to insiders and certain related interests must be approved in advance by a majority of the board of directors of the institution, with any “interested” director not participating in the voting, if the loan exceeds the greater of twenty five thousand or 5% of the institution’s capital. Loans aggregating five hundred thousand are subject to the approval requirements in all cases. Loans to insiders must be made on terms substantially the same as offered in comparable transactions to outside parties and must not present more than the normal risk of loss or present any other unfavorable features. There is an exception for extensions of credit made to officers and directors as part of a bank-wide compensation or benefit program that does not favor directors or officers over other employees. There are further restrictions on loans that can be made to executive officers.
Intrastate Branching Activities. The Bank may, with the approval of the Pennsylvania Department of Banking and the Federal Deposit Insurance Corporation, establish, acquire and operate branches anywhere in Pennsylvania.
Interstate Branching. Federal law authorizes the responsible federal banking agencies to approve merger transactions between banks located in different states, regardless of whether the merger would be prohibited under the law of the two states, unless the state in which the target institution is located has opted out. Accordingly, the Bank may acquire branches in a state other than Pennsylvania unless the other state has enacted legislation opting out. Pennsylvania and federal law also generally authorize de novo branching into another state.
Activities and Investments. The Federal Deposit Insurance Corporation Improvement Act of 1991 generally limits the activities that all state-chartered banks may engage in as principal to those authorized for national banks, despite more expansive state law. Additionally, equity investments by state banks are limited to the types and amounts permitted for national banks, subject to certain exceptions. For example, the Bank may engage in state authorized activities or investments that are impermissible for national banks (other than non-subsidiary equity investments) if the Bank meets all applicable capital requirements and the Federal Deposit Insurance Corporation determines that the activities or investments do not pose a significant risk to deposit insurance fund.
Capital Requirements. The Bank is subject to the Federal Deposit Insurance Corporation’s regulatory capital requirements. The capital regulations require state banks to meet two minimum capital standards: a 4% leverage ratio (3% for institutions receiving the highest rating on the depository institution examination rating system) and an 8% risk-based capital ratio. In addition, the prompt corrective action standards discussed below establish, in effect, a minimum 2% tangible capital standard, a 4% leverage ratio (3% for institutions receiving the highest examination rating) and, together with the risk-based capital standard itself, a 4% Tier 1 risk-based capital standard.
The leverage ratio requires a minimum ratio of Tier 1 (or “core”) capital to adjusted total assets of 4% (3% for institutions with the highest examination rating). Tier 1 capital is generally defined as common stockholders’ equity (including retained earnings), certain noncumulative perpetual preferred stock and related surplus and minority interests in equity accounts of consolidated subsidiaries, less certain deferred tax assets and intangibles other than certain mortgage servicing rights and credit card relationships.
The risk-based capital standard requires the maintenance of Tier 1 and total capital (which is defined as Tier 1 capital plus Tier 2 (or supplementary capital)) to risk-weighted assets of at least 4% and 8%, respectively. In determining risk-weighted assets, all assets, including certain off-balance sheet assets, recourse obligations, residual interests and direct credit substitutes, are multiplied by risk weighting of 0% to 100% assigned by the Federal Deposit Insurance Corporation capital regulation based on the risks believed inherent in the type of asset. The components of Tier 2 capital currently include such instruments as cumulative preferred stock, long-term perpetual preferred stock, mandatory convertible securities, subordinated debt and intermediate preferred stocks, as well as the allowance for loan and lease losses up to a maximum of 1.25% of risk-weighted assets and up to 45% of unrealized gains on available-for-sale equity securities with readily determinable fair market values. Overall, the amount of Tier 2 capital included as total capital cannot exceed 100% of Tier 1 capital.
The Federal Deposit Insurance Corporation may increase required capital levels in the future. The Federal Deposit Insurance Corporation also has authority to establish individual minimum capital requirements in appropriate cases upon a determination that an institution’s capital level is or may become inadequate in light of the particular circumstances.
10
Prompt Corrective Regulatory Action. Under federal law, the appropriate federal regulatory agency is required to take certain supervisory actions against undercapitalized institutions, the severity of which depends upon the institution’s degree of undercapitalization. Generally, a bank that has a ratio of total capital to risk weighted assets of less than 8%, a ratio of Tier 1 capital to risk-weighted assets of less than 4% or a ratio of Tier 1 capital to total assets of less than 4% (3% or less for institutions with the highest examination rating) is considered to be “undercapitalized.” A bank that has a total risk-based capital ratio of less than 6%, a Tier 1 capital ratio of less than 3% or a leverage ratio that is less than 3% is considered to be “significantly undercapitalized” and a bank that has a tangible capital to assets ratio equal to or less than 2% is deemed to be “critically undercapitalized.” Subject to a narrow exception, a receiver or conservator must be appointed within specified time frames for an institution that is “critically undercapitalized.” The law also provides that an acceptable restoration plan must be filed within 45 days of the date a bank receives notice that it is “undercapitalized,” “significantly undercapitalized” or “critically undercapitalized.” Performance under the plan must be guaranteed by the institution’s parent company in an amount of up to the lesser of 5% of the total assets when deemed to be undercapitalized or the amount necessary to adequately achieve capitalized status. In addition, certain mandatory supervisory actions become applicable to any undercapitalized institution including, but not limited to, increased monitoring by regulators and restrictions on growth, capital distributions (including dividends) and expansion. The Federal Deposit Insurance Corporation could also take additional discretionary supervisory actions, including the issuance of a capital directive, requiring the sale of the institution and the replacement of senior executive officers and directors.
Safety and Soundness Guidelines. Federal law requires each federal banking agency to establish safety and soundness standards for institutions under its authority. The federal banking agencies, including the Federal Deposit Insurance Corporation, have issued Interagency Guidelines Establishing Standards for Safety and Soundness. The guidelines specify basic standards for internal controls and information systems, internal audit systems, loan documentation, credit underwriting, interest rate risk exposure and asset growth, asset quality earnings and employee compensation. If the appropriate federal banking agency determines that a depository institution is not in compliance with the safety and soundness guidelines, it may require the institution to submit an acceptable plan to achieve compliance with the guidelines. The institution must submit an acceptable compliance plan within 30 days of receipt of a request for such a plan. Failure to submit or implement a compliance plan may result in regulatory sanctions.
Uniform Lending Standards. Under Federal Deposit Insurance Corporation’s regulations, state banks must adopt and maintain written policies that establish appropriate limits and standards for loans that are secured by interests in real estate or are made for the purpose of financing permanent improvements to real estate. The policies must establish loan portfolio diversification standards, prudent underwriting standards, including loan-to-value limits that are clear and measurable, loan administration procedures and documentation and loan approval and reporting requirements. Such real estate lending policies must reflect the Interagency Guidelines for Real Estate Lending Policies that have been adopted by the federal banking agencies.
Transactions with Related Parties. Transactions between a state bank and any affiliate are governed by Sections 23A and 23B of the Federal Reserve Act. Sections 23A and 23B of the Federal Reserve Act apply to us, as a state non-member bank, by virtue of Section 18(i) of the Federal Deposit Insurance Act. An affiliate is any company or entity, which controls, is controlled by or is under common control with the state member bank, such as the Company. Generally, Sections 23A and 23B: (i) limit the extent to which an institution or its subsidiaries may engage in “covered transactions” with any one affiliate to an amount equal to 10% of such institution’s capital stock and surplus, and contain an aggregate limit on all such transactions with all affiliates to an amount equal to 20% of such capital stock and surplus, (ii) impose collateral requirements on certain transactions with affiliates, and (iii) require that all such transactions be on terms substantially the same, or at least as favorable, to the institution or subsidiary as those provided to a nonaffiliate. The term “covered transaction” includes loans to, purchases of assets from and the issuance of a guarantee on behalf of an affiliate, and certain other transactions.
Tying Arrangements. The Bank is prohibited from engaging in certain tying arrangements in connection with any extension of credit, sale or lease of property or furnishing of services. With certain exceptions for traditional banking services, the Bank may not condition an extension of credit to a customer on a requirement that the customer obtain or provide additional credit, property or services from or to us or any of our subsidiaries or that the customer refrain from obtaining credit, property or other services from a competitor.
Dividend Restrictions. Our ability to pay dividends is governed by Pennsylvania law and the regulations of the Federal Deposit Insurance Corporation. Under Pennsylvania law, the Bank may only declare and pay dividends from our accumulated net earnings. In addition, the Bank may not declare and pay dividends from the surplus funds that Pennsylvania law requires that the Bank maintains. Each year the Bank must set aside as surplus funds a sum equal to not less than 10% of our net earnings until the surplus funds equal 100% of our capital stock. The Bank may invest the surplus funds in the same manner as deposits, subject to certain exceptions. Federal Deposit Insurance Corporation policy provides that, during the first three years of operation, the Bank may pay cash dividends only from net operating income and only after the Bank has established an appropriate allowance for loan and lease losses and our overall capital is adequate. Under federal law, an insured bank may not pay dividends if doing so would make it undercapitalized within the meaning of the prompt corrective action law discussed previously or if in default of its deposit insurance fund assessment.
11
Enforcement. The Pennsylvania Department of Banking has authority to appoint a receiver or conservator for a Pennsylvania Bank in a variety of circumstances, including where the bank conducts its business in an unsafe manner, is in an unsafe or unsound condition to transact business, has assets less than its obligations or violates a law, court order or order of the Banking Department. The Pennsylvania Department of Banking may, under certain circumstances, suspend or remove officers or directors who have violated the law, conducted the bank’s business in a manner which is unsafe, unsound or contrary to the depositors’ interests or been negligent in the performance of their duties. In addition, upon finding that a bank has engaged in an unsafe or unsound practice, violated a law, rule, regulation or written agreement relating to its supervision, or violated any condition, imposed in writing, in connection with the approval of any application, the Pennsylvania Department of Banking may issue an order to cease and desist against the bank or its directors or officers.
The Federal Deposit Insurance Corporation has primary federal enforcement responsibility over state banks under its jurisdiction, including the authority to bring enforcement action against all “institution-related parties,” including stockholders, and any attorneys, appraisers and accountants who knowingly or recklessly participate in wrongful action likely to have an adverse effect on an institution. Formal enforcement action may range from the issuance of a capital directive or cease and desist order to removal of officers and/or directors, receivership, conservatorship or termination of deposit insurance. Civil money penalties cover a wide range of violations and actions, and range up to $25,000 per day or even up to $1 million per day (in the most egregious cases). Criminal penalties for most financial institution crimes include fines of up to $1 million and imprisonment for up to 30 years.
Consumer Protection and Fair Lending Regulations. Pennsylvania commercial banks are subject to a variety of federal and Pennsylvania statutes and regulations that are intended to protect consumers and prohibit discrimination in the granting of credit. These statutes and regulations provide for a range of sanctions for non-compliance with their terms, including imposition of administrative fines and remedial orders, and referral to the Attorney General for prosecution of a civil action for actual and punitive damages and injunctive relief. Certain of these statutes authorize private individual and class action lawsuits and the award of actual, statutory and punitive damages and attorneys’ fees for certain types of violations.
Dodd-Frank Act. The Dodd-Frank Wall Street Reform and Consumer Protection Act (the “Dodd-Frank Act”) became law on July 21, 2010. The Dodd-Frank Act implements far-reaching changes across the financial regulatory landscape.
The Dodd-Frank Act creates the Bureau of Consumer Financial Protection (“Bureau”), which will be an independent bureau within the Federal Reserve System with broad authority to regulate the consumer finance industry including regulated financial institutions such as the Bank and non banks and others who are involved in the consumer finance industry. The Bureau will have exclusive authority through rulemaking, orders, policy statements, guidance and enforcement actions to administer and enforce federal consumer finance laws, to oversee non federally regulated entities, and to impose its own regulations and pursue enforcement actions when it determines that a practice is unfair, deceptive or abusive (“UDA”). The federal consumer finance laws are currently interpreted, administered and enforced by different federal agencies, including the Federal Deposit Insurance Corporation (“FDIC”), the current federal regulator of the Bank. The Treasury Secretary has determined July 21, 2011 as the date when all of the functions and responsibilities of the Bureau will be transferred to it. While the Bureau will have the exclusive power to interpret, administer and enforce federal consumer finance laws and UDA, the Dodd-Frank Act provides that the FDIC will continue to have examination and enforcement powers over the Bank relating to the matters within the jurisdiction of the Bureau because it has less than $10 billion in assets. The Dodd-Frank Act also gives state attorneys general the ability to enforce federal consumer protection laws.
The Dodd-Frank Act also:
| • | Applies the same leverage and risk-based capital requirements to most bank holding companies (“BHCs”) that apply to insured depository institutions; |
| • | Requires the FDIC to make its capital requirements for insured depository institutions countercyclical, so that capital requirements increase in times of economic expansion and decrease in times of economic contractions; |
| • | Requires BHCs and banks to be both well-capitalized and well-managed in order to acquire banks located outside their home state and requires any BHC electing to be treated as a financial holding company to be both well-managed and well-capitalized; |
| • | Changes the assessment base for federal deposit insurance from the amount of insured deposits held by the depository institution to the depository institution’s average total consolidated assets less tangible equity, eliminates the ceiling on the size of the DIF and increases the floor of the size of the DIF; |
12
| • | Makes permanent the $250,000 limit for federal deposit insurance and increases the cash limit of Securities Investor Protection Corporation protection from $100,000 to $250,000 and provides unlimited federal deposit insurance until January 1, 2013 for noninterest-bearing demand transaction accounts at all insured depository institutions; |
| • | Eliminates all remaining restrictions on interstate banking by authorizing national and state banks to establish de novo branches in any state that would permit a bank chartered in that state to open a branch at that location; and |
| • | Repeals the federal prohibitions on the payment of interest on demand deposits, effective July 21, 2011, thereby permitting depository institutions to pay interest on business transaction and other accounts. |
Many of the provisions of the Dodd-Frank Act will require the federal banking agencies to promulgate hundreds of regulations to implement its provisions. One provision amends the Electronic Fund Transfer Act to, among other things, give the Federal Reserve Board the authority to issue rules which are expected to limit debit-card interchange fees. While this restriction will not be applicable to the Bank due to its size, the impact of any restriction may set a market floor which could have negative competitive implications for the Bank based upon final approval in April 2011.
While designed primarily to reform the financial regulatory system, the Dodd Frank Act also contains a number of corporate governance provisions that will affect public companies. The Dodd Frank Act requires the SEC to adopt rules which may affect the Bank’s executive compensation policies and disclosure.
The Bank continues to review the Dodd-Frank Act to determine its impact on the Bank. The Dodd-Frank Act could require the Bank to make material expenditures, in particular personnel training costs and additional compliance expenses, or otherwise adversely affect the Bank’s business, financial condition, results of operations or cash flow. It could also require the Bank to change certain of its business practices, adversely affect its ability to pursue business opportunities the Bank might otherwise consider pursuing, cause business disruptions and/or have other impacts that are as of yet unknown to the Bank. Failure to comply with these laws or regulations, even if inadvertent, could result in negative publicity, fines or additional expenses, any of which could have an adverse effect on the Bank’s business, financial condition, results of operations, or cash flow.
Community Reinvestment Act. Under the Community Reinvestment Act (the “CRA”), as implemented by Federal Deposit Insurance Corporation regulations, a bank has a continuing and affirmative obligation, consistent with its safe and sound operation, to help meet the credit needs of its entire community, including low and moderate income neighborhoods. The CRA does not establish specific lending requirements or programs for financial institutions, nor does it limit an institution’s discretion to develop the types of products and services that it believes are best suited to its particular community. The CRA requires the Federal Deposit Insurance Corporation, when examining an institution, to assess the institution’s record of meeting the credit needs of its community and to take the record into account in its evaluation of certain applications by the institution. The CRA also requires all institutions to make public disclosure of their CRA ratings. Unlike the responsibility for other federal consumer protection and fair lending regulations, which is being transferred to the new Consumer Financial Protection Bureau, the CRA will remain with the federal prudential regulators. Our most recent CRA rating was “satisfactory.”
Assessments. Pennsylvania banks are required to pay annual assessments to the Pennsylvania Department of Banking to cover the cost of regulating Pennsylvania institutions. Our asset size determines the rate of assessment.
Deposit Insurance. The Bank’s deposits are insured up to applicable limits by the Deposit Insurance Fund of the FDIC. The Deposit Insurance Fund is the successor to the Bank Insurance Fund and the Savings Association Insurance Fund, which were merged in 2006. Under the FDIC’s existing risk-based assessment system for 2010, insured institutions are assigned to one of four risk categories based on supervisory evaluations, regulatory capital levels and certain other factors. An institution’s assessment rate depends upon the category to which it is assigned, and certain potential adjustments established by FDIC regulations, with less risky institutions paying lower assessments. Assessment rates, with adjustments, currently range from seven to 77.5 basis points of assessable deposits. The FDIC may change the scale uniformly from one quarter to the next, except that no adjustment can deviate more than three basis points from the base scale without notice and comment. No institution may pay a dividend if in default of the federal deposit insurance assessment.
In November 2009, the FDIC issued a rule that required all insured depository institutions, with limited exceptions, to prepay their estimated quarterly risk-based assessments for the fourth quarter of 2009 and for all of 2010, 2011 and 2012. The FDIC also adopted a uniform three basis point increase in assessment rates effective on January 1, 2011.
13
The Dodd-Frank Act changed the assessment base for federal deposit insurance from the amount of insured deposits held by the depository institution to the depository institution’s average total consolidated assets less average tangible equity, eliminating the ceiling on the size of the DIF and increasing the floor of the size of the DIF. The Dodd-Frank Act establishes a minimum designated reserve ratio (“DRR”) of 1.35% of estimated insured deposits, mandates the FDIC adopt a restoration plan should the fund balance fall below 1.35%, and provides dividends to the industry should the fund balance exceed 1.50%.
On February 7, 2011, the FDIC approved a final rule on Assessments, Dividend Assessment Base and Large Bank Pricing (the “Final Rule”). The Final Rule implements the changes to the deposit insurance assessment system as mandated by the Dodd-Frank Act and is effective April 1, 2011.
The Final Rule changed the assessment base for insured depository institutions from adjusted domestic deposits to the average consolidated total assets during an assessment period less average tangible equity capital during that assessment period. Tangible equity is defined in the Final Rule as Tier 1 Capital and shall be calculated monthly, unless, like the Bank, the insured depository institution has less than $1 billion in assets, then the insured depository institution will calculate the Tier 1 Capital on an end of quarter basis. Parents or holding companies of other insured depository institutions are required to report separately from their subsidiary depository institutions.
The Final Rule retains the unsecured debt adjustment, which lowers an insured depository institution’s assessment rate for any unsecured debt on its balance sheet. In general, the unsecured debt adjustment in the Final Rule will be measured to the new assessment base and will be increased by 40 basis points. The Final Rule also contains a brokered deposit adjustment for assessments. The Final Rule provides an exemption to the brokered deposit adjustment to financial institutions that are “well capitalized” and have composite CAMEL ratings of 1 or 2.
The Final Rule also creates a new rate schedule that is intended to provide more predictable assessment rates to financial institutions. The revenue under the new rate schedule will be approximately the same. Moreover, it indefinitely suspends the requirement in the Dodd-Frank Act that the FDIC pay dividends from the insurance fund when the fund reaches 1.5% of insured deposits to increase the probability that the fund reserve ratio will reach a sufficient level to withstand a future crisis. In lieu of the dividend payments, the FDIC has adopted progressively lower assessment rate schedules that become effective when the reserve ratio exceeds 2% and 2.5%.
The Dodd-Frank Act makes permanent the $250,000 limit for federal deposit insurance and increases the cash limit of Securities Investor Protection Corporation protection from $100,000 to $250,000 and provides unlimited federal deposit insurance until January 1, 2013 for noninterest-bearing demand transaction accounts at all insured depository institutions. In addition, the FDIC adopted an optional Temporary Liquidity Guarantee Program (“TLGP”) under which, for a fee, noninterest-bearing transaction accounts would receive unlimited insurance coverage until June 30, 2010, subsequently extended to December 31, 2010. The TLGP also included a debt component under which certain senior unsecured debt issued by institutions and their holding companies between October 13, 2008 and October 31, 2009 would be guaranteed by the FDIC through June 30, 2012, or in some cases, December 31, 2012. The Bank opted to participate in the unlimited noninterest-bearing transaction account coverage and opted not to participate in the unsecured debt guarantee program.
In addition to the assessment for deposit insurance, institutions are required to make payments on bonds issued in the late 1980s by the Financing Corporation to recapitalize a predecessor deposit insurance fund. This payment is established quarterly and, during the four quarters ended June 30, 2010, averaged 1.04 basis points of assessable deposits.
The FDIC has authority to increase insurance assessments. A significant increase in insurance premiums would likely have an adverse effect on the operating expenses and results of operations of the Bank. Management cannot predict what insurance assessment rates will be in the future.
Insurance of deposits may be terminated by the Federal Deposit Insurance Corporation upon a finding that the institution has engaged in unsafe or unsound practices, is in an unsafe or unsound condition to continue operations or has violated any applicable law, regulation, rule, order or condition imposed by the Federal Deposit Insurance Corporation or the Pennsylvania Department of Banking.
SAFE Act. The Secure and Fair Enforcement for Mortgage Licensing Act of 2008 (the “SAFE” Act) requires all mortgage loan originators (“MLOs”) employed by federally insured depository institutions, credit unions, or owned and controlled subsidiaries that are federally supervised (collectively “federally insured banks” or “banks”) to federally register with the Nationwide Mortgage Licensing System and Registry (“NMLS”). A bank that employs MLOs must also register with the NMLS.
14
The federal banking agencies released a final rule to implement the SAFE Act requirements for the federal registration of MLOs (the “Rule”) on July 28, 2010, which took effect on October 1, 2010. Under the Rule, an employee of a bank who engages in the business of loan originations must, among other things, register as a loan originator with the NMLS, maintain that registration annually, and obtain a unique identifier.
Under the Rule, banks that employ MLOs are required to, among other things, register with the NMLS and develop policies and procedures to ensure compliance with the federal registration rules of SAFE Act.
The registration with the NMLS opened on January 31, 2011 and all MLOs and banks that employ MLOs must complete the registration within 180 days of January 31, 2011.
The Company is subject to the requirements of the SAFE Act and intends to be fully compliant within the required time period.
Regulation of Bank Holding Companies
The Company is subject to a number of regulatory requirements due to its status as a bank holding company under federal and Pennsylvania laws.
Activities. With certain exceptions, the BHCA prohibits a bank holding company from acquiring direct or indirect ownership or control of more than 5% of the voting shares of a company that is not a bank or a bank holding company, or from engaging directly or indirectly in activities other than those of banking, managing or controlling banks, or providing services for its subsidiaries. The principal exceptions to these prohibitions involve certain non-bank activities which, by statute or by Federal Reserve Board regulation or order, have been identified as activities closely related to the business of banking. Our activities are subject to these legal and regulatory limitations under the BHCA and the related Federal Reserve Board regulations. Notwithstanding the Federal Reserve Board’s prior approval of specific nonbanking activities, the Federal Reserve Board has the power to order a holding company or its subsidiaries to terminate any activity, or to terminate its ownership or control of any subsidiary, when it has reasonable cause to believe that the continuation of such activity or such ownership or control constitutes a serious risk to the financial safety, soundness or stability of any bank subsidiary of that holding company.
A bank holding company whose financial institution subsidiaries are “well capitalized” and “well managed” and have satisfactory CRA records can elect to become a “financial holding company” and thereby be permitted to engage in a broader range of financial activities than are permitted to bank holding companies. Financial holding companies are authorized to engage in, directly or indirectly, financial activities. A financial activity is an activity that is: (i) financial in nature; (ii) incidental to an activity that is financial in nature; or (iii) complementary to a financial activity and that does not pose a safety and soundness risk. Statutes and regulations include a list of activities that are deemed to be financial in nature. Other activities also may be decided by the Federal Reserve Board to be financial in nature or incidental thereto if they meet specified criteria. A financial holding company that intends to engage in a new activity or to acquire a company to engage in such an activity is required to give prior notice to the Federal Reserve Board. If the activity is not either specified in statutes and regulations as being a financial activity or one that the Federal Reserve Board has determined by rule or regulation to be financial in nature, the prior approval of the Federal Reserve Board is required.
Acquisitions. Under the BHCA, a bank holding company must obtain the prior approval of the Federal Reserve Board before (1) acquiring direct or indirect ownership or control of any voting shares of any bank or bank holding company if, after such acquisition, the bank holding company would directly or indirectly own or control more than 5% of such shares; (2) acquiring all or substantially all of the assets of another bank or bank holding company; or (3) merging or consolidating with another bank holding company. Satisfactory financial condition, particularly with regard to capital adequacy, and satisfactory CRA ratings generally are prerequisites to obtaining federal regulatory approval to make acquisitions.
Capital Requirements. The Federal Reserve Board has adopted guidelines regarding the consolidated capital adequacy of bank holding companies, which require bank holding companies to maintain specified minimum ratios of capital to total assets and capital to risk-weighted assets.
Source of Strength. Federal Reserve Board policy is that bank holding companies should serve as a source of strength to their subsidiary banks by providing capital, liquidity and other support in times of financial distress.
15
Dividends. The Federal Reserve Board has the power to prohibit dividends by bank holding companies if their actions constitute unsafe or unsound practices. The Federal Reserve Board has issued a policy statement on the payment of cash dividends by bank holding companies, which expresses the Federal Reserve Board’s view that a bank holding company should pay cash dividends only to the extent that the company’s net income for the past year is sufficient to cover both the cash dividends and a rate of earnings retention that is consistent with the company’s capital needs, asset quality and overall financial condition. The Federal Reserve Board also indicated that it would be inappropriate for a bank holding company experiencing serious financial problems to borrow funds to pay dividends. Under the prompt corrective action regulations, the Federal Reserve Board may prohibit a bank holding company from paying any dividends if the holding company’s bank subsidiary is classified as “undercapitalized.”
Stock Repurchases. As a bank holding company, the Company is required to give the Federal Reserve Board prior written notice of any purchase or redemption of our outstanding equity securities if the gross consideration for the purchase or redemption, when combined with the net consideration paid for all such purchases or redemptions during the preceding 12 months, is equal to 10% or more of the Company’s consolidated net worth. The Federal Reserve Board may disapprove such a purchase or redemption if it determines that the proposal would violate any law, regulation, Federal Reserve Board order, directive or any condition imposed by, or written agreement with, the Federal Reserve Board. This requirement does not apply to bank holding companies that are “well capitalized,” received one of the two highest examination ratings at their last examination and are not the subject of any unresolved supervisory issues.
Change in Control. Under the BHCA, any company must obtain approval of the Federal Reserve Board prior to acquiring control of a bank holding company, such as the Company or insured bank, such as the Bank. For purposes of the BHCA, “control” is defined as ownership of more than 25% of any class of voting securities of the holding company or the bank, the ability to control the election of a majority of the directors, or the exercise of a controlling influence over management or policies of the holding company or the Bank.
In addition, the Change in Bank Control Act and the related regulations of the Federal Reserve Board require any person or persons acting in concert (except for companies required to make application under the BHCA), to file a written notice with the Federal Reserve Board before such person or persons may acquire control of a bank holding company. The Change in Bank Control Act defines “control” as the power, directly or indirectly, to vote 25% or more of any voting securities or to direct the management or policies of a bank holding company. There is a presumption of “control” where the acquiring person will own, control or hold with power to vote 10% or more of any class of voting security of a bank holding company under certain specified circumstances.
Under Pennsylvania banking law, prior approval of the Pennsylvania Department of Banking is also required before any person may acquire control of a Pennsylvania bank or bank holding company.
FORWARD LOOKING INFORMATION
This Annual Report on Form 10-K contains forward-looking statements that are based on assumptions and may describe future plans, strategies and expectations of Penseco Financial Services Corporation. These forward-looking statements are generally identified by use of the words “believe,” “expect,” “intend,” “anticipate,” “estimate,” “project” or similar expressions. Penseco Financial Services Corporation’s ability to predict results or the actual effect of future plans or strategies is inherently uncertain. Factors which could have a material adverse effect on the operations of Penseco Financial Services Corporation and its subsidiary include, but are not limited to, changes in interest rates, national and regional economic conditions, legislative and regulatory changes, monetary and fiscal policies of the U.S. government, including policies of the U.S. Treasury and the Federal Reserve Board, the quality and composition of the loan or investment portfolios, demand for loan products, deposit flows, competition, demand for financial services in Penseco Financial Services Corporation’s market area, changes in real estate market values in Penseco Financial Services Corporation’s market area, changes in relevant accounting principles and guidelines and inability of third party service providers to perform. Additional factors that may affect our results are discussed in Item 1A to this Annual Report on Form 10-K titled “Risk Factors”.
These risks and uncertainties should be considered in evaluating forward-looking statements and undue reliance should not be placed on such statements. Except as required by applicable law or regulation, Penseco Financial Services Corporation does not undertake, and specifically disclaims any obligation, to release publicly the result of any revisions that may be made to any forward-looking statements to reflect events or circumstances after the date of the statements or to reflect the occurrence of anticipated or unanticipated events.
Unless the context indicates otherwise, all references in this Annual Report to “Company,” “we,” “us” and “our” refer to Penseco Financial Services Corporation and its subsidiary.
16
| ITEM 1A | RISK FACTORS |
In addition to the other information set forth in this report, one should carefully consider the factors discussed below, which could materially affect our business, financial condition or future results. The risks described below are not the only risks that the Company faces. Additional risks and uncertainties not currently known to us or that the Company currently deems to be immaterial also may materially adversely affect our business, financial condition and/or operating results.
RISKS RELATED TO OUR BUSINESS
Credit Risk
Changes in the credit quality of our loan portfolio may impact the level of our allowance for loan losses.
The Bank makes various judgments about the collectibility of our loans, including the creditworthiness of our borrowers and the value of the real estate and other assets serving as collateral for our loans. In determining the allowance for loan losses, we review our loans and our loan loss and delinquency experience, and we evaluate economic conditions. In the third quarter of 2010, we refined our methodology for determining loan losses to emphasize, in particular, local economic conditions in response to our experience during this recent recession. If our judgments are incorrect, our allowance for loan losses may not be sufficient to cover future losses and our financial statements may not accurately reflect our financial condition. In addition, bank regulators periodically review our allowance for loan losses and may require us to increase our provision for loan losses or recognize further loan charge-offs. Increased provisions for loan losses would increase our expenses and reduce our profits.
Our emphasis on residential mortgage and commercial real estate loans in the Northeast Pennsylvania market area exposes us to a risk of loss.
At December 31, 2010, $295.3 million, or 48.0%, of our loan portfolio consisted of residential mortgage loans and $208.0 million, or 33.8%, of our loan portfolio consisted of commercial real estate loans. A significant majority of these loans are made to borrowers or secured by properties located in Northeastern Pennsylvania. As a result of this concentration, a sustained downturn in the regional economy could significantly increase non-performing loans, which would hurt our profits. Future declines in real estate values in the Northeastern Pennsylvania area could also cause some of our mortgage and commercial real estate loans to be inadequately collateralized, which would expose us to a greater risk of loss if the Bank seeks to recover on defaulted loans by selling the real estate collateral.
Changes in the credit quality of our investment portfolio may affect our earnings.
Investments are evaluated periodically to determine whether a decline in their value is other than temporary. Management utilizes criteria such as the magnitude and duration of the decline, in addition to the reasons underlying the decline, to determine whether the loss in value is other than temporary. The term “other than temporary” is not intended to indicate that the decline is permanent. It indicates that the prospects for a near term recovery of value are not necessarily favorable, or that there is a lack of evidence to support fair values equal to, or greater than, the carrying value of the investment. Once a decline in value is determined to be other than temporary, the value of the security is reduced and a corresponding charge to earnings is recognized.
Changes in interest rates could affect our investment values and net interest income which could hurt our profits.
At December 31, 2010, the Company had approximately $173.3 million of marketable securities available for sale in its portfolio. These securities are carried at fair value on the consolidated balance sheets. Unrealized gains or losses on these securities, that is, the difference between the fair value and the amortized cost of these securities, are reflected in stockholders’ equity, net of deferred taxes. As of December 31, 2010, the Company’s available for sale marketable securities portfolio had an unrealized gain, net of taxes, of $1.1 million. The fair value of the Company’s available for sale marketable securities is subject to interest rate change, which would not affect recorded earnings, but would increase or decrease comprehensive income and stockholders’ equity.
The principal component of the Company’s earnings is net interest income, which is the difference between interest and fees earned on interest-earning assets and interest paid on deposits and other borrowings. The most significant impact on net interest income between periods is derived from the interaction of changes in the volume of and rates earned or paid on interest-earning assets and interest-bearing liabilities. The volume of earning dollars in loans and investments, compared to the volume of interest-bearing liabilities represented by deposits and borrowings, combined with the spread, produces the changes in net interest income between periods.
17
The Company continually monitors the relationship of its interest rate sensitive assets and liabilities through its Asset/Liability Committee.
We are subject to credit risk in connection with our lending activities, and our financial condition and results of operations may be negatively impacted by economic conditions and other factors that adversely affect our borrowers.
Our financial condition and results of operations are affected by the ability of our borrowers to repay their loans, and in a timely manner. Lending money is a significant part of the banking business. Borrowers, however, do not always repay their loans. The risk of non-payment is assessed through our underwriting and loan review procedures based on several factors including credit risks of a particular borrower, changes in economic conditions, the duration of the loan and in the case of a collateralized loan, uncertainties as to the future value of the collateral and other factors. Despite our efforts, we do and will experience loan losses, and our financial condition and results of operations will be adversely affected. Our non-performing assets were approximately $4,837 on December 31, 2010. Our allowance for loan losses was approximately $6,500 on December 31, 2010. Our loans which were between thirty and fifty-nine days delinquent totaled $2,955 on December 31, 2010.
Our concentration of commercial real estate loans could result in increased loan losses and costs of compliance.
A substantial portion of our loan portfolio, 33.8% as of December 31, 2010, is comprised of commercial real estate loans. The commercial real estate market is cyclical and poses risks of loss to us because of the concentration of commercial real estate loans in our loan portfolio, and the lack of diversity in risk associated with such a concentration. Banking regulators have been giving and continue to give commercial real estate lending greater scrutiny, and banks with larger commercial real estate loan portfolios are expected by their regulators to implement improved underwriting, internal controls, risk management policies and portfolio stress-testing practices to manage risks associated with commercial real estate lending. In addition, commercial real estate lenders are making greater provisions for loan losses and accumulating higher capital levels as a result of commercial real estate lending exposures. Additional losses or regulatory requirements related to our commercial real estate loan concentration could materially adversely affect or business, financial condition and results of operations.
Our allowance for loan losses may not be adequate to absorb actual loan losses, and we may be required to make further provisions for loan losses and charge off additional loans in the future, which could materially and adversely affect our business.
We attempt to maintain an allowance for loan losses, established through a provision for loan losses accounted for as an expense, which is adequate to absorb losses inherent in our loan portfolio. If our allowance for loan losses is inadequate, it may have a material adverse effect on our financial condition and results of operations.
The determination of the allowance for loan losses inherently involves a high degree of subjectivity and judgment and requires us to make significant estimates of current credit risks and future trends, all of which may undergo material changes. Changes in economic conditions affecting borrowers, new information regarding existing loans, identification of additional problem loans and other factors, both within and outside of our control, may require us to increase our allowance for loan losses. Increases in non-performing loans have a significant impact on our allowance for loan losses. Our allowance for loan losses may not be adequate to absorb actual loan losses. If current trends in the real estate markets continue, we could continue to experience increased delinquencies and credit losses, particularly with respect to real estate construction and land acquisition and development loans and one-to-four family residential mortgage loans. Moreover, we expect that the current recession will negatively impact economic conditions in our market areas and that we could experience significantly higher delinquencies and credit losses. As a result, we will continue to make provisions for loan losses and to charge off additional loans in the future, which could materially adversely affect our financial conditions and results of operations.
In addition to our internal processes for determining loss allowances, bank regulatory agencies periodically review our allowance for loan losses and may require us to increase the provision for loan losses or to recognize further loan charge-offs, based on judgments that differ from those of our management. If loan charge-offs in future periods exceed the allowance for loan losses, we will need to increase our allowance for loan losses. Furthermore, growth in our loan portfolio would generally lead to an increase in the provision for loan losses. Any increases in our allowance for loan losses will result in a decrease in net income and capital, and may have a material adverse effect on our financial condition, results of operations and cash flows.
Our results of operations may be materially and adversely affected by other-than-temporary impairment charges relating to our investment portfolio.
18
During 2009, we recorded an other-than-temporary impairment charge for bank equity investment securities, and we may be required to record future impairment charges on our investment securities if they suffer declines in value that we determine are other-than-temporary. Numerous factors, including the lack of liquidity for re-sales of certain investment securities, the absence of reliable pricing information for investment securities, adverse changes in the business climate, adverse regulatory actions or unanticipated changes in the competitive environment, could have a negative effect on our investment portfolio in future periods. If an impairment charge is significant enough, it could affect the Bank’s ability to pay dividends, which could materially adversely affect us and our ability to pay dividends to shareholders. Significant impairment charges could also negatively impact our regulatory capital ratios and result in us not being classified as “well-capitalized” for regulatory purposes.
We are exposed to environmental liabilities with respect to real estate that we have or had title to in the past.
A significant portion of our loan portfolio is secured by real property. In the course of our business, we may foreclose, accept deeds in lieu of foreclosure, or otherwise acquire real estate, and in doing so could become subject to environmental liabilities with respect to these properties. We may become responsible to a governmental agency or third parties for property damage, personal injury, investigation and clean-up costs incurred by those parties in connection with environmental contamination, or may be required to investigate or clean-up hazardous or toxic substances, or chemical releases at a property. The costs associated with environmental investigation or remediation activities could be substantial. In addition, as the owner or former owner of a contaminated site, we may be subject to common law claims by third parties based on damages and costs resulting from environmental contamination emanating from the property. Although we have policies and procedures to perform an environmental review before acquiring title to any real property, these may not be sufficient to detect all potential environmental hazards. If we were to become subject to significant environmental liabilities, it could materially and adversely affect us.
Consumer protection initiatives related to the foreclosure process could affect our remedies as a creditor.
Consumer protection initiatives proposed related to the foreclosure process, including voluntary and/or mandatory programs intended to permit or require lenders to consider loan modifications or other alternatives to foreclosure, could increase our credit losses or increase our expense in pursuing our remedies as a creditor.
The requirement to record certain assets and liabilities at fair value may adversely affect our financial results.
We report certain assets, including available-for-sale investment securities, at fair value. Generally, for assets that are reported at fair value we use quoted market prices or valuation models that utilize market data inputs to estimate fair value. Because we record these assets at their estimated fair value, we may incur losses even if the asset in question presents minimal credit risk. The level of interest rates can impact the estimated fair value of investment securities. Disruptions in the capital markets may require us to recognize other-than-temporary impairments in future periods with respect to investment securities in our portfolio. The amount and timing of any impairment recognized will depend on the severity and duration of the decline in fair value of our investment securities and our estimation of the anticipated recovery period.
Continued and sustained deterioration in the housing sector and related markets and prolonged elevated unemployment levels may adversely affect our business and financial results.
During 2009 and the beginning of 2010, general economic conditions continued to worsen nationally as well as in our market area. While we did not invest in sub-prime mortgages and related investments, our lending business is tied significantly to the housing market. Declines in home prices, and increases in foreclosures and unemployment levels, have adversely impacted the credit performance of real estate loans, resulting in the write-down of asset values. While the economic downturn moderated in late 2010, the continuing housing slump has resulted in reduced demand for the construction of new housing, further declines in home prices, and increased delinquencies on construction, residential and commercial mortgage loans. The ongoing concern about the economy in general has caused many lenders to reduce or cease providing funding to borrowers. These conditions may also cause a further reduction in loan demand, and increases in our non-performing assets, net charge-offs and provisions for loan losses. A worsening of these negative economic conditions could adversely affect our prospects for growth, asset and goodwill valuations and could result in a decrease in our interest income and a material increase in our provision for loan losses.
If our investment in the common stock of the Federal Home Loan Bank of Pittsburgh is classified as other-than-temporarily impaired or as permanently impaired, our earnings and stockholders’ equity could decrease.
We own common stock of the Federal Home Loan Bank of Pittsburgh. We hold this stock to qualify for membership in the Federal Home Loan Bank System and to be eligible to borrow funds under the Federal Home Loan Bank of Pittsburgh’s advance program.
19
The aggregate cost and fair value of our Federal Home Loan Bank of Pittsburgh common stock as of December 31, 2010 was $6.1 million based on its par value. There is no market for our Federal Home Loan Bank of Pittsburgh common stock.
Published reports indicate that certain member banks of the Federal Home Loan Bank System may be subject to accounting rules and asset quality risks that could result in materially lower regulatory capital levels. In an extreme situation, it is possible that the capital of a Federal Home Loan Bank, including the Federal Home Loan Bank of Pittsburgh, could be substantially diminished or reduced to zero. Consequently, we believe that there is a risk that our investment in Federal Home Loan Bank of Pittsburgh common stock could be impaired at some time in the future, and if this occurs, it would cause our earnings and stockholders’ equity to decrease by the after-tax amount of the impairment charge.
Compliance Risk
The Company operates in a highly regulated environment and may be adversely affected by changes in laws and regulations.
The Company is registered as a financial holding company under the Bank Holding Company Act of 1956, as amended, and, as such, is subject to supervision and regulation by the Board of Governors of the Federal Reserve System (“FRB”). The Company is required to file annual and quarterly reports of its operations with the FRB.
As a financial holding company, the Company is permitted to engage in banking-related activities as authorized by the FRB, directly or through subsidiaries or by acquiring companies already established in such activities subject to the FRB regulations relating to those activities.
Our banking subsidiary, Penn Security Bank and Trust Company, as a Pennsylvania state-chartered financial institution, is subject to supervision, regulation and examination by the Commonwealth of Pennsylvania Department of Banking and by the Federal Deposit Insurance Corporation (the “FDIC”), which insures the Bank’s deposits to the maximum extent permitted by law.
Regulatory authorities have extensive discretion in their supervisory and enforcement activities, including the imposition of restrictions on operations, the classification of assets and determination of the level of allowance for loan losses. Any change in such regulation and oversight, whether in the form of regulatory policy, regulations, legislation or supervisory claim may have a material impact on the Company’s and the Bank’s operations. The current administration has also proposed comprehensive legislation intended to modernize regulation of the United States financial system. Among other things, the proposed legislation would also create a new federal agency, the Consumer Financial Protection Agency that would be dedicated to administering and enforcing fair lending and consumer compliance laws with respect to financial products and services, which could result in new regulatory requirements and increased regulatory costs for us. If enacted, the legislation may have a substantial impact on our operations. However, because any final legislation may differ significantly from the current administration’s proposal, the specific effects of the legislation cannot be evaluated at this time.
Any change in such regulation and oversight, whether in the form of regulatory policy, regulations, legislation or supervisory actions, may have a material impact on our operations.
Recently enacted financial reform legislation will, among other things, create a new Consumer Financial Protection Bureau, tighten capital standards and result in new laws and regulations that are expected to increase our costs of operations.
On July 21, 2010, the Dodd-Frank Act became law. This new law will significantly change the current bank regulatory structure and affect the lending, deposit, investment, trading and operating activities of financial institutions and their holding companies. The Dodd-Frank Act requires various federal agencies to adopt a broad range of new implementing rules and regulations, and to prepare numerous studies and reports for Congress. The federal agencies are given significant discretion in drafting the implementing rules and regulations, and consequently, many of the details and much of the impact of the Dodd-Frank Act may not be known for many months or years.
Effective one year after the date of enactment is a provision for the Dodd-Frank Act that eliminates the federal prohibitions on paying interest on demand deposits, thus allowing businesses to have interest bearing checking accounts. Depending on competitive responses, this significant change to existing law could have an adverse impact on our interest expense.
The Dodd-Frank Act also broadens the base for FDIC deposit insurance assessments. Assessments will now be based on the average consolidated total assets less tangible equity capital of a financial institution, rather than deposits.
20
The Dodd-Frank Act will require publicly traded companies to give stockholders a non-binding vote on executive compensation and so-called “golden parachute” payments, and authorizes the Securities and Exchange Commission to promulgate rules that would allow stockholders to nominate their own candidates using a company’s proxy materials. It also provides that the listing standards of the national securities exchanges shall require listed companies to implement and disclose “clawback” policies mandating the recovery of incentive compensation paid to executive officers in connection with accounting restatements. The legislation also directs the Federal Reserve Board to promulgate rules prohibiting excessive compensation paid to bank holding company executives, regardless of whether the company is publicly traded or not.
The Dodd-Frank Act creates a new Consumer Financial Protection Bureau with broad powers to supervise and enforce consumer protection laws. The Consumer Financial Protection Bureau has broad rule-making authority for a wide range of consumer protection laws that apply to all banks and savings institutions, including the authority to prohibit “unfair, deceptive or abusive” acts and practices. The Consumer Financial Protection Bureau has examination and enforcement authority over all banks and savings institutions with more than $10 billion in assets. Banks with $10 billion or less in assets will continue to be examined for compliance with the consumer laws by their primary bank regulators. The Dodd-Frank Act also weakens the federal preemption rules that have been applicable for national banks and federal savings associations, and gives state attorneys general the ability to enforce federal consumer protection laws.
The Dodd-Frank Act requires minimum leverage (Tier 1) and risk based capital requirements for bank and savings and loan holding companies that are no less than those applicable to banks, which will exclude certain instruments that previously have been eligible for inclusion by bank holding companies as Tier 1 capital, such as trust preferred securities.
It is difficult to predict at this time what specific impact the Dodd-Frank Act and the yet to be written implementing rules and regulations will have on community banks. However, it is expected that at a minimum they will increase our operating and compliance costs and could increase our interest expense.
Operational Risk
A continuation of recent turmoil in the financial markets could have an adverse effect on our financial position or our results of operations.
In recent periods, United States and global markets, as well as general economic conditions, have been disrupted and volatile. Concerns regarding the strength of financial institutions have led to distress in credit markets and issues relating to liquidity among financial institutions. Some financial institutions around the world have failed; others have been forced to seek acquisition partners. The United States and other governments have taken steps to try to stabilize the financial system, including investing in financial institutions. The Company has not applied for and is not participating in any government sponsored Capital Purchase Programs. Our company’s financial condition and results of operations could be adversely affected by (1) continued disruption and volatility in financial markets, (2) continued capital and liquidity concerns regarding financial institutions generally and our counterparties specifically, including the Federal Home Loan Bank, (3) limitations resulting from governmental action in an effort to stabilize or provide additional regulation of the financial system, or (4) recessionary conditions that are deeper or last longer than currently anticipated. Further, there can be no assurance that action by Federal and state legislatures, and governmental agencies and regulators, including the enacted legislation authorizing the U.S. government to invest in financial institutions, or changes in tax policy, will help stabilize the U.S. financial system and any such action, including changes to existing legislation or policy, could have an adverse effect on the financial conditions or results of operations of the Company.
The current economic recession could result in increases in our level of non-performing loans and/or reduce demand for our products and services, which would lead to lower revenue, higher loan losses and lower earnings.
Our business activities and earnings are affected by general business conditions in the United States and in our primary market area. These conditions include short-term and long-term interest rates, inflation, unemployment levels, monetary supply, consumer confidence and spending, fluctuations in both debt and equity capital markets and the strength of the economy in the United States generally and in our primary market area in particular. In the current recession, the national economy has experienced general economic downturns, with rising unemployment levels, declines in real estate values and erosion in consumer confidence. The current economic recession has also had a negative impact on our primary market area, which has experienced a softening of the local real estate market and reductions in local property values. A prolonged or more severe economic downturn, continued elevated levels of unemployment, further declines in the values of real estate, or other events that affect household and/or corporate incomes could impair the ability of our borrowers to repay their loans in accordance with their terms. The economic downturn could also result in reduced demand for credit or fee-based products and services, which also would decrease our revenues.
21
Special FDIC assessments and increased base assessment rates by the FDIC will decrease our earnings.
Beginning in late 2008, the economic environment caused higher levels of bank failures, which dramatically increased FDIC resolution costs and led to a significant reduction in the Deposit Insurance Fund. As a result, the FDIC has significantly increased the initial base assessment rates paid by financial institutions for deposit insurance. The base assessment rate was increased by seven basis points (7 cents for every $100 of deposits) for the first quarter of 2009. Effective April 1, 2009, initial base assessment rates were changed to range from 12 basis points to 45 basis points across all risk categories with possible adjustments to these rates based on certain debt-related components. These increases in the base assessment rate will increase our deposit insurance costs and negatively impact our earnings. In addition, in May 2009, the FDIC imposed a special assessment on all insured institutions due to recent bank and savings association failures. The emergency assessment amounts to 5 basis points on each institution’s assets minus Tier 1 capital as of June 30, 2009, subject to a maximum equal to 10 basis points times the institution’s assessment base. The assessment was collected on September 30, 2009. Based on our assets and Tier 1 capital as of June 30, 2009, our special assessment was approximately $385 thousand. The special assessment decreased our earnings. In addition, the FDIC may impose additional emergency special assessments after June 30, 2009 of up to 5 basis points per quarter on each institution’s assets minus Tier 1 capital if necessary to maintain public confidence in federal deposit insurance or as a result of deterioration in the Deposit Insurance Fund reserve ratio due to institution failures. Any additional emergency special assessment imposed by the FDIC will further decrease our earnings.
The Company may experience increased lending and credit risk as a result of our acquisition of Old Forge Bank.
On April 1, 2009, the Company completed the acquisition of Old Forge Bank in a cash and stock transaction valued at approximately $55.5 million. There are inherent risks in the acquisition of any merger candidate as to the loans and deposits acquired in the merger. There may be greater losses in the loan portfolio than were identified at the merger date. Furthermore, deposit customers might leave the Bank for any number of personal or business reasons. Management monitors the asset quality and deposit base on an ongoing basis. The fair value adjustments applicable to the merger are reviewed annually for appropriateness based upon the actual results compared to the merger date. As such, the market rate adjustment and the credit fair value adjustment are evaluated to ensure that the amortizations and accretions are reasonable.
The Company needs to continually attract and retain qualified personnel for its operations.
High quality customer service, as well as efficient and profitable operations, is dependent on the Company’s ability to attract and retain qualified individuals for key positions within the organization. The Company has successfully recruited several individuals for management positions in recent years. As of December 31, 2010, the Company employed 224 full-time equivalent employees. The employees of the Company are not represented by any collective bargaining group. Management of the Company considers relations with its employees to be good. The Company relies heavily on the executive officers and employees. The loss of certain executive officers or employees could have an adverse effect on us because, as a community bank, the executive officers and employees typically have more responsibility than would be typical at a larger financial institution with more employees. In addition, as a community bank, the Bank has fewer management-level and other personnel who are in position to succeed and assume the responsibilities of certain existing executive officers and employees.
Our operations could be affected if we do not have access to modern and reliable technology.
The Company operates in a highly-automated environment, wherein almost all transactions are processed by computer software to produce results. To remain competitive, the Company must continually evaluate the adequacy of its data processing capabilities and make revisions as needed.
The Company regularly tests its ability to restore data capabilities in the event of a natural disaster, sustained power failure or other inability to utilize its primary systems.
Strong competition within our market could hurt our profits and inhibit growth.
The Bank operates in a competitive environment in which it must share its market with many local independent banks as well as several banks which are affiliates or branches of very large regional holding companies. The Bank encounters competition from diversified financial institutions, ranging in size from small banks to the nationwide banks operating in its region. The competition includes commercial banks, savings and loan associations, credit unions, other lending institutions and mortgage originators.
22
The principal competitive factors among the Company’s competitors can be grouped into two categories: pricing and services. In the Company’s primary service area, interest rates on deposits, especially time deposits, and interest rates and fees charged to customers on loans are very competitive. In this current economic environment there is increased competition in view of weaker loan demand. From a service perspective, the Bank competes in areas such as convenience of location, types of services, service costs and banking hours. Our profitability depends on our continued ability to compete successfully in our market area.
Recent health care legislation could increase our expenses or require us to pass further costs on to our employees, which could adversely affect our operations, financial condition and earnings.
Legislation enacted in 2010 requires companies to provide expanded health care coverage to their employees, such as affordable coverage to part-time employees and coverage to dependent adult children of employees. Companies will also be required to enroll new employees automatically into their health plans. Compliance with these and other new requirements of the health care legislation will increase our employee benefits expense, and may require us to pass these costs on to our employees, which could give us a competitive disadvantage in hiring and retaining qualified employees.
Our disclosure controls and procedures and our internal control over financial reporting may not achieve their intended objectives.
We maintain disclosure controls and procedures designed to ensure that we timely report information as specified in the rules and forms of the Securities and Exchange Commission. We also maintain a system of internal control over financial reporting. These controls may not achieve their intended objectives. Control processes that involve human diligence and compliance, such as our disclosure controls and procedures and internal control over financial reporting, are subject to lapses in judgment and breakdowns resulting from human failures. Controls can also be circumvented by collusion or improper management override. Because of such limitations, there are risks that material misstatements due to error or fraud may not be prevented or detected and that information may not be reported on a timely basis. If our controls are not effective, it could have a material adverse effect on our financial condition, results of operations, and market for our common stock, and could subject us to regulatory scrutiny.
We are subject to certain operational risks, including, but not limited to, customer or employee fraud and data processing system failures and errors.
Employee errors and misconduct could subject us to financial losses or regulatory sanctions and seriously harm our reputation. Misconduct by our employees could include hiding unauthorized activities from us, improper or unauthorized activities on behalf of our customers or improper use of confidential information. It is not always possible to prevent employee errors and misconduct, and the precautions we take to prevent and detect this activity may not be effective in all cases. Employee errors could also subject us to financial claims for negligence.
We maintain a system of internal controls and insurance coverage to mitigate operational risks, including data processing system failures and errors, and customer or employee fraud. Should our internal controls fail to prevent or detect an occurrence, or if any resulting loss is not insured or exceeds applicable insurance limits, it could have a material adverse effect on our business, financial condition and results of operations.
Risks Regarding Our Common Stock
There may be a limited market for our common stock, which may adversely affect our stock price.
Although the common stock is traded on the Over-the-Counter Bulletin Board, the shares might not be actively traded. If an active trading market for the common stock does not exist, you may not be able to sell all of your shares of common stock on short notice, and the sale of a large number of shares at one time could temporarily depress the market price. There also may be a wide spread between the bid and ask price for our common stock. When there is a wide spread between the bid and ask price, the price at which you may be able to sell our common stock may be significantly lower than the price at which you could buy it at that time.
A significant percentage of our common stock is held by our directors and executive officers, which could enable insiders to prevent a merger or other transaction that may provide stockholders a premium for their shares.
At December 31, 2010, our directors and executive officers beneficially owned 480,721, or 14.7%, of our outstanding shares. If these individuals were to act together, they could have a significant influence over the outcome of any shareholder vote.
23
Our governing documents, Pennsylvania law, and current policies of our board of directors contain provisions which may reduce the likelihood of a change in control transaction that may otherwise be available and attractive to shareholders.
Our articles of incorporation and bylaws contain certain anti-takeover provisions that may make it more difficult or expensive or may discourage a tender offer, change in control or takeover attempt that is opposed by our board of directors. In particular, the articles of incorporation and bylaws: classify our board of directors into four groups, so that shareholders elect only approximately one-fourth of the board each year; require our shareholders to give us advance notice to nominate candidates for election to the board of directors or to make shareholder proposals at a shareholders’ meeting; and require the vote of the holders of at least 75% of the Company’s voting shares to approve certain business combinations. These provisions of our articles of incorporation and bylaws could discourage potential acquisition proposals and could delay or prevent a change in control, even though a majority of our shareholders may consider such proposals desirable. Such provisions could also make it more difficult for third parties to remove and replace the members of our board of directors. Moreover, these provisions could diminish the opportunities for shareholders to participate in certain tender offers, including tender offers at prices above the then-current market value of our common stock, and may also inhibit increases in the trading price of our common stock that could result from takeover attempts or speculation.
In addition, anti-takeover provisions in Pennsylvania law could make it more difficult for a third party to acquire control of us. These provisions could adversely affect the market price of our common stock and could reduce the amount that shareholders might receive if we are sold. For example, Pennsylvania law may restrict a third party’s ability to obtain control of the Company and may prevent shareholders from receiving a premium for their shares of our common stock. Pennsylvania law also provides that our shareholders are not entitled by statute to propose amendments to our articles of incorporation.
Liquidity Risk
Increased needs for disbursement of funds on loans and deposits can affect our liquidity.
The objective of liquidity management is to maintain a balance between sources and uses of funds in such a way that the cash requirements of customers for loans and deposit withdrawals are met in the most economical manner. Management monitors its liquidity position continuously in relation to trends of loans and deposits for short-term as well as long-term requirements. Liquid assets are monitored on a daily basis to assure maximum utilization. Management also manages its liquidity requirements by maintaining an adequate level of readily marketable assets and access to short-term funding sources. Management does not foresee any adverse trends in liquidity.
Our future pension plan costs and contributions could be unfavorably impacted by the factors that are used in the actuarial calculations.
Although the Company’s non-contributory defined benefit pension plan was frozen in 2008, the costs for the pension plan are dependent upon a number of factors, such as the rates of return on plan assets, discount rates, the level of interest rates used to measure the required minimum funding levels of the plans, future government regulation and required or voluntary contributions made to the plans. Without sustained growth in the pension investments over time to increase the value of our plan assets and depending upon the other factors impacting our costs as listed above, the Bank could be required to fund our plans with higher amounts of cash than are anticipated by our actuaries. Such increased funding obligations could have a material impact on our liquidity by reducing our cash flows.
We are a holding company dependent for liquidity on payments from our banking subsidiary, which payments are subject to restrictions.
We are a holding company and depend on dividends, distributions and other payments from the Bank to fund dividend payments, if any, and to fund all payments on obligations. The Bank and its subsidiaries are subject to laws that restrict dividend payments or authorize regulatory bodies to block or reduce the flow of funds from those subsidiaries to us. Restrictions or regulatory actions of that kind could impede our access to funds that we may need to make payments on our obligations or dividend payments, if any. In addition, our right to participate in a distribution of assets upon a subsidiary’s liquidation or reorganization is subject to the prior claims of the subsidiary’s creditors. Holders of our common stock are entitled to receive dividends if and when declared from time to time by our board of directors in its sole discretion out of funds legally available for that purpose.
24
| ITEM 1B | UNRESOLVED STAFF COMMENTS |
None
| ITEM 2 | PROPERTIES |
The Company and Bank operate twelve offices positioned throughout the greater Northeastern Pennsylvania region in the South Scranton, East Scranton, Green Ridge, and Central City sections of Scranton; Moscow; Gouldsboro; South Abington Township,; Mount Pocono; East Stroudsburg at Eagle Valley Corners; Old Forge; Peckville and Duryea. Through these offices, the Company provides a full range of banking and trust services primarily to Lackawanna, Luzerne, Wayne, Monroe and the surrounding counties. All offices are owned by the Bank or through a wholly owned subsidiary of the Bank, Penseco Realty, Inc., with the exception of the Mount Pocono Office, which is owned by the Bank but is located on land occupied under a long-term lease. During 2010, we executed purchase agreements for land in Scranton, Pennsylvania with an aggregate value of $1.0 million to be used for construction of a new branch facility. The Bank has received regulatory approval for the establishment of this new branch office. The Company also owns property in the Borough of Dalton, Lackawanna County, which it may use for potential future expansion.
The Company’s and Bank’s principal office, located at the corner of North Washington Avenue and Spruce Street in the “Central City” of Scranton’s business district, houses the operations, trust, investor services, marketing and audit departments as well as the Company’s executive offices. Several remote ATM locations are leased by the Bank, which are located throughout Northeastern Pennsylvania. All branches and ATM locations are equipped with closed circuit television monitoring.
| ITEM 3 | LEGAL PROCEEDINGS |
There are no material pending legal proceedings, other than ordinary routine litigation incidental to the business of the Company and its subsidiary, as to which the Company or subsidiary is a party or of which any of their property is subject.
| ITEM 4 | (REMOVED AND RESERVED) |
Part II
| ITEM 5 | MARKET FOR REGISTRANT’S COMMON EQUITY, RELATED STOCKHOLDER MATTERS AND ISSUER PURCHASES OF EQUITY SECURITIES |
This Form 10-K is the Company’s annual disclosure statement as required under Section 13 or 15(d) of the Securities Exchange Act of 1934. Questions may be directed to any branch location of the Company or by contacting the Finance Division Head’s office at:
Patrick Scanlon, Senior Vice President, Finance Division Head
Penseco Financial Services Corporation
150 North Washington Avenue
Scranton, Pennsylvania 18503-1848
1-800-327-0394
The Company’s capital stock is traded on the “Over-the-Counter” (Bulletin Board) under the symbol “PFNS”. The following table sets forth the price range together with dividends paid for each of the past two years. These quotations reflect inter-dealer prices, without retail mark-up, mark-down or commission, and may not necessarily reflect the value of actual transactions.
| 2010 |
High | Low | Dividends Paid Per Share |
2009 |
High | Low | Dividends Paid Per Share |
|||||||||||||||||||||
| First Quarter |
$ | 34.99 | $ | 33.00 | $ | .42 | First Quarter |
$ | 38.00 | $ | 34.05 | $ | .42 | |||||||||||||||
| Second Quarter |
34.30 | 32.50 | .42 | Second Quarter |
38.50 | 31.00 | .42 | |||||||||||||||||||||
| Third Quarter |
37.25 | 31.50 | .42 | Third Quarter |
36.00 | 31.80 | .42 | |||||||||||||||||||||
| Fourth Quarter |
38.75 | 35.10 | .42 | Fourth Quarter |
34.80 | 30.00 | .42 | |||||||||||||||||||||
| $ | 1.68 | $ | 1.68 | |||||||||||||||||||||||||
As of February 17, 2011 there were approximately 2,452 stockholders of the Company based on the number of holders of record. Reference should be made to the information about the Company’s dividend policy under the heading “Management’s Discussion & Analysis—Dividend Policy” and regulatory guidelines under the heading “General Notes to Financial Statements—Note 24 Regulatory Matters.”
25
PENSECO FINANCIAL SERVICES CORPORATION
The following line graph sets forth comparative information regarding the Company’s cumulative shareholder return on its Common Stock over the last five fiscal years. Total shareholder return is measured by dividing total dividends (assuming dividend reinvestment) plus share price change for a period by the share price at the beginning of the investment period. The Company’s cumulative shareholder return based on an investment of $100 at the beginning of the five-year period beginning December 31, 2005 is compared to the cumulative total return of the Russell 2000 Index (“Russell 2000”) and the SNL Securities Northeast Quadrant Pink Sheet Banks Index (“Pink Banks”), which more closely reflects the Company’s peer group. The yearly points marked on the horizontal axis of the graph correspond to December 31st of that year.
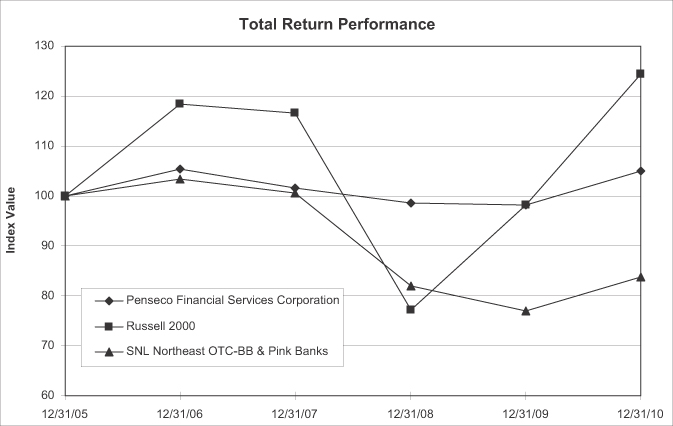
| Period Ending | ||||||||||||||||||||||||
| Index |
12/31/05 | 12/31/06 | 12/31/07 | 12/31/08 | 12/31/09 | 12/31/10 | ||||||||||||||||||
| Penseco Financial Services Corporation |
$ | 100.00 | $ | 105.40 | $ | 101.51 | $ | 98.60 | $ | 98.15 | $ | 104.97 | ||||||||||||
| Russell 2000 |
100.00 | 118.37 | 116.51 | 77.15 | 98.11 | 124.46 | ||||||||||||||||||
| SNL Northeast OTC-BB and Pink Banks |
100.00 | 103.34 | 100.64 | 81.97 | 77.02 | 83.86 | ||||||||||||||||||
26
| ITEM 6 | SELECTED FINANCIAL DATA |
(in thousands, except per share amounts)
RESULTS OF OPERATIONS:
| 2010 | 2009 | 2008 | 2007 | 2006 | ||||||||||||||||
| Interest Income |
$ | 41,745 | $ | 40,151 | $ | 33,898 | $ | 34,329 | $ | 31,922 | ||||||||||
| Interest Expense |
8,356 | 9,580 | 10,830 | 12,739 | 11,054 | |||||||||||||||
| Net Interest Income |
33,389 | 30,571 | 23,068 | 21,590 | 20,868 | |||||||||||||||
| Provision for Loan Losses |
1,999 | 2,260 | 861 | 657 | 433 | |||||||||||||||
| Net Interest Income after Provision for Loan Losses |
31,390 | 28,311 | 22,207 | 20,933 | 20,435 | |||||||||||||||
| Non-Interest Income |
12,152 | 10,369 | 11,036 | 8,720 | 8,205 | |||||||||||||||
| Non-Interest Expenses |
28,453 | 28,420 | 22,172 | 21,331 | 21,037 | |||||||||||||||
| Income Taxes |
3,367 | 1,888 | 2,458 | 1,624 | 1,595 | |||||||||||||||
| Net Income |
$ | 11,722 | $ | 8,372 | $ | 8,613 | $ | 6,698 | $ | 6,008 | ||||||||||
| BALANCE SHEET AMOUNTS: |
||||||||||||||||||||
| Assets |
$ | 916,087 | $ | 883,327 | $ | 628,967 | $ | 580,793 | $ | 569,821 | ||||||||||
| Investment Securities |
$ | 217,044 | $ | 195,930 | $ | 151,912 | $ | 141,059 | $ | 160,987 | ||||||||||
| Net Loans |
$ | 608,605 | $ | 597,670 | $ | 435,873 | $ | 399,939 | $ | 365,722 | ||||||||||
| Deposits |
$ | 691,032 | $ | 645,434 | $ | 424,725 | $ | 416,533 | $ | 413,800 | ||||||||||
| Long-Term Borrowings |
$ | 68,835 | $ | 68,094 | $ | 72,720 | $ | 55,966 | $ | 65,853 | ||||||||||
| Stockholders’ Equity |
$ | 121,922 | $ | 117,397 | $ | 73,642 | $ | 69,715 | $ | 66,571 | ||||||||||
| PER SHARE AMOUNTS: |
||||||||||||||||||||
| Earnings per Share |
$ | 3.58 | $ | 2.80 | $ | 4.01 | $ | 3.12 | $ | 2.80 | ||||||||||
| Dividends per Share |
$ | 1.68 | $ | 1.68 | $ | 1.66 | $ | 1.58 | $ | 1.50 | ||||||||||
| Book Value per Share |
$ | 37.22 | $ | 35.84 | $ | 34.28 | $ | 32.45 | $ | 30.99 | ||||||||||
| Common Shares Outstanding |
3,276,079 | 3,276,079 | 2,148,000 | 2,148,000 | 2,148,000 | |||||||||||||||
| FINANCIAL RATIOS: |
||||||||||||||||||||
| Net Interest Margin |
4.11 | % | 4.11 | % | 3.93 | % | 3.92 | % | 3.89 | % | ||||||||||
| Return on Average Assets |
1.32 | % | 1.04 | % | 1.40 | % | 1.15 | % | 1.07 | % | ||||||||||
| Return on Average Equity |
9.74 | % | 7.93 | % | 11.89 | % | 9.75 | % | 9.15 | % | ||||||||||
| Average Equity to Average Assets |
13.55 | % | 13.12 | % | 11.76 | % | 11.81 | % | 11.68 | % | ||||||||||
| Dividend Payout Ratio |
46.93 | % | 60.00 | % | 41.40 | % | 50.64 | % | 53.57 | % | ||||||||||
27
| ITEM 7 | MANAGEMENT’S DISCUSSION AND ANALYSIS OF FINANCIAL CONDITION AND RESULTS OF OPERATIONS |
Our financial statements are prepared in accordance with accounting principles generally accepted in the United States (GAAP). The following discussion is intended to provide information to facilitate the understanding and assessment of significant changes and trends related to the financial condition of the Company and the results of its operations. This discussion and analysis should be read in conjunction with the Company’s audited consolidated financial statements and notes thereto.
SUMMARY
| 2010 | 2009 | 2008 | ||||||||||
| Interest Income |
$ | 41,745 | $ | 40,151 | $ | 33,898 | ||||||
| Interest Expense |
8,356 | 9,580 | 10,830 | |||||||||
| Net Interest Income |
33,389 | 30,571 | 23,068 | |||||||||
| Provision for Loan Losses |
1,999 | 2,260 | 861 | |||||||||
| Net Interest Income after Provision for Loan Losses |
31,390 | 28,311 | 22,207 | |||||||||
| Non-Interest Income |
12,152 | 10,369 | 11,036 | |||||||||
| Non-Interest Expenses |
28,453 | 28,420 | 22,172 | |||||||||
| Income Taxes |
3,367 | 1,888 | 2,458 | |||||||||
| Net Income |
$ | 11,722 | $ | 8,372 | $ | 8,613 | ||||||
| Earnings per Share |
$ | 3.58 | $ | 2.80 | $ | 4.01 | ||||||
| Total Revenue |
$ | 53,897 | $ | 50,520 | $ | 44,934 | ||||||
| Net Interest Margin |
4.11 | % | 4.11 | % | 3.93 | % | ||||||
| BALANCE SHEET AMOUNTS: |
||||||||||||
| Assets |
$ | 916,087 | $ | 883,327 | $ | 628,967 | ||||||
| Investment Securities |
$ | 217,044 | $ | 195,930 | $ | 151,912 | ||||||
| Net Loans |
$ | 608,605 | $ | 597,670 | $ | 435,873 | ||||||
| Deposits |
$ | 691,032 | $ | 645,434 | $ | 424,725 | ||||||
| Long-Term Borrowings |
$ | 68,835 | $ | 68,094 | $ | 72,720 | ||||||
| Stockholders’ Equity |
$ | 121,922 | $ | 117,397 | $ | 73,642 | ||||||
Net income for 2010 increased $3,350 or 40.0%, to $11,722 or $3.58 per weighted average share compared with the year ago period of $8,372 or $2.80 per weighted average share. The increase in net income was primarily attributed to higher net interest income as well as the absence of merger-related costs in 2010 compared to $1,550 incurred in 2009 due to the Company’s acquisition of Old Forge Bank. Also, the Company did not recognize any impairment losses in 2010 as compared to $787 of losses in 2009 related to the Bank’s equity investment portfolio. The results of operations for 2010 include twelve months of operations from the former Old Forge Bank, as opposed to only nine months of Old Forge Bank operations captured in 2009. Net interest margin remained unchanged at 4.11% for the year ended December 31, 2010 compared to the same period in 2009. Net interest income increased $2,818 or 9.2% to $33,389 for the year ended December 31, 2010 compared to $30,571 for 2009. Net interest income after provision for loan losses increased $3,079 or 10.9% during 2010 primarily due to increased interest and fees on loans, which in turn were attributable to the expansion of our loan portfolio following the acquisition of Old Forge Bank in 2009. Net interest income was also positively affected in 2010 by reduced interest expense from lower borrowing costs. The provision for loan losses decreased $261 to $1,999 during 2010 compared with $2,260 for the same period of 2009, based on management’s evaluation of the adequacy of the allowance for loan losses through the application of its allowance for loan losses methodology. Among other things, the methodology, which was enhanced in the third quarter of 2010, emphasizes the strength of the local economy.
28
Net income for 2009 decreased $241 or 2.8%, to $8,372 or $2.80 per weighted average share compared with 2008 net income of $8,613 or $4.01 per share. The decrease in net income was primarily attributed to merger costs of $1,550, the recognition of an impairment loss on bank equity investment securities of $787, increased FDIC insurance costs of $909, along with the effect of a one time gain of $1,129, net of tax, related to Visa International’s Initial Public Offering during 2008. Net interest margin increased from 3.93% for the year ended December 31, 2008 to 4.11% for the year ended December 31, 2009. Net interest income increased $7,503 or 32.5% to $30,571 for the twelve months ended December 31, 2009 compared to $23,068 for the same period of 2008. The increase was largely due to an increase in the loan portfolio of $159.9 million that resulted from the acquisition of Old Forge Bank on April 1, 2009. Net interest income after provision for loan losses increased $6,104 or 27.5% during the 2009 period, largely due to increased interest and fees on loans and reduced interest expense from lower borrowing costs. The provision for loan losses increased $1,399 to $2,260 during 2009 compared with $861 for the same period of 2008 due to economic weakness and uncertainty with regard to the overall state of the economy, concern as to the local economy and the unemployment rate. In 2009 the Bank had an increase in non-performing loans and charge-offs and foreclosures.
The Company’s return on average assets was 1.32% in 2010 compared to 1.04% in 2009 and 1.40% in 2008. Return on average equity was 9.74%, 7.93% and 11.89% in 2010, 2009 and 2008, respectively.
The following table reflects net income from accretion and amortization, net of taxes, of acquisition date fair value adjustments relating to the Merger included in the Company’s financial results during the periods indicated.
| Years Ended December 31, |
2010 | 2009 | ||||||
| Homogeneous loan pools |
$ | 633 | $ | 550 | ||||
| Time deposits |
185 | 305 | ||||||
| Core deposit intangible expense |
(225 | ) | (182 | ) | ||||
| Net income from acquisition fair value adjustment |
$ | 593 | $ | 673 | ||||
Accretion of the loan pools credit fair value adjustment and market rate fair value adjustment is calculated on a sum-of-the-years-digits basis over an eight year period. The fair value market rate adjustment of the time deposits is amortized monthly based on a level yield methodology over five years. The core deposit intangible is being amortized over ten years on a sum-of-the-years-digits basis.
Loan Portfolio
| December 31, |
2010 | 2009 | 2008 | |||||||||||||||||||||
| Commercial Secured by Real Estate |
$ | 207,964 | 33.8 | % | $ | 194,935 | 32.3 | % | $ | 115,957 | 26.3 | % | ||||||||||||
| Residential Real Estate |
295,301 | 48.0 | % | 308,068 | 51.0 | % | 261,520 | 59.3 | % | |||||||||||||||
| Commercial and Industrial |
36,190 | 5.9 | % | 30,743 | 5.1 | % | 27,793 | 6.3 | % | |||||||||||||||
| Consumer |
55,862 | 9.1 | % | 59,789 | 9.9 | % | 28,281 | 6.4 | % | |||||||||||||||
| States & Political Subdivisions |
9,882 | 1.6 | % | 6,873 | 1.1 | % | 4,471 | 1.0 | % | |||||||||||||||
| All Other |
9,906 | 1.6 | % | 3,562 | 0.6 | % | 3,126 | 0.7 | % | |||||||||||||||
| Loans net of Unearned Income |
$ | 615,105 | 100.0 | % | $ | 603,970 | 100.0 | % | $ | 441,148 | 100.0 | % | ||||||||||||
There were no purchased loans in 2010, 2009 or 2008 other than loan participations with local banks. Originations of new loans are primarily in loans secured by real estate. The growth in loans from 2008 to 2010 was mainly due to the merger of Old Forge Bank.
| Year Ended December 31, 2010 |
Number of Loans |
Original Balance |
||||||
| Commercial real estate |
81 | $ | 49,561 | |||||
| Residential real estate |
661 | 70,139 | ||||||
| Commercial and industrial loans |
554 | 39,612 | ||||||
| Consumer loans |
1,277 | 16,203 | ||||||
Of the Company’s $70.1 million residential real estate loan originations in 2010, $30.9 million was sold to the Federal Home Loan Mortgage Corporation (“Freddie Mac”). There were no loans held for sale as of December 31, 2010 and 2009.
Market Area
Our market area has been affected by the economic decline that has affected the U.S. economy as a whole. The local unemployment rates at December 31, 2010 for the counties in which the Bank operates were: Lackawanna County, 9.1%; Luzerne County, 9.7%; Monroe County, 9.6% and Wayne County, 7.6%. The unemployment rate for the Scranton/Wilkes-Barre metropolitan area was 9.5% in December 2010 and the highest among Pennsylvania’s fourteen metropolitan statistical areas, or MSAs. The high unemployment rate can be attributed to a gradual decline in manufacturing in Northeastern Pennsylvania, and much like the rest of the country, a slowdown in construction of residential and commercial property.
29
Weak labor conditions coupled with high unemployment led to an increase in the foreclosure rate in 2010. The foreclosure rate for the Scranton-Wilkes/Barre MSA was 2.99% for 2010, an increase of 0.61% compared to 2.38% for 2009. Although, the pace of foreclosures has increased, one of the strengths of the Northeastern Pennsylvania housing market is that it was not impacted by the loss of home equity that has affected the rest of the country. The Case-Shiller House Price Index for Northeastern Pennsylvania has stalled, but has not exhibited the sharp trough seen in other regions. High unemployment in Northeastern Pennsylvania will continue to put pressure on the local economy and on our loan portfolio. We believe that our focus on identifying borrowers who are facing cash flow problems before they are unable to make their payments will significantly improve our ability to help these borrowers through difficult times
Deposits
As of December 31, 2010, the Company had Certificate of Deposit Account Registry Service (“CDARS”) reciprocal deposits in the amount of $22.1 million. The Company also issues brokered certificates of deposit; the balance of this funding as of December 31, 2010 was $49.5 million. The brokered certificates of deposit issued were generally a low cost alternative to wholesale funding with the majority offered having a call feature optionality not provided by wholesale funding. As of December 31, 2010, the dollar amount of total brokered deposits, exclusive of CDARS reciprocal deposits, was $51.3 million or 7.4% of total deposits, compared to $1.8 million or 0.3% at December 31, 2009 and $1.8 million or 0.4% at December 31, 2008.
| December 31, |
2010 | 2009 | 2008 | |||||||||
| Demand – Non-interest bearing |
$ | 113,391 | $ | 109,855 | $ | 72,456 | ||||||
| Demand – Interest bearing |
70,989 | 72,477 | 51,975 | |||||||||
| Savings |
113,382 | 110,994 | 74,907 | |||||||||
| Money markets |
144,206 | 146,189 | 115,811 | |||||||||
| Time – Over $100,000 |
85,404 | 78,702 | 37,960 | |||||||||
| Time – Other |
163,660 | 127,217 | 71,616 | |||||||||
| Total Deposits |
$ | 691,032 | $ | 645,434 | $ | 424,725 | ||||||
Increases in deposits for 2010 can be primarily attributed to the Company’s issuance of brokered certificates of deposit totaling $49.5 million at December 31, 2010 and increased CDARS reciprocal deposits.
Critical Accounting Policies
The preparation of financial statements in conformity with generally accepted accounting principles requires management to make estimates and assumptions that affect the reported amounts of assets and liabilities and disclosure of contingent assets and liabilities at the date of the financial statements and the reported amounts of revenues and expenses during the reporting period. Actual results could differ from those estimates.
Provision (allowance) for loan losses - The provision for loan losses is based on past loan loss experience, management’s evaluation of the probable loss in the current loan portfolio under current economic conditions and such other factors as, in management’s best judgment, deserve current recognition in estimating loan losses. The annual provision for loan losses charged to operating expense is that amount which is sufficient to bring the balance of the allowance for loan losses to an adequate level to absorb anticipated losses.
Actuarial assumptions associated with pension, post-retirement and other employee benefit plans - These assumptions include discount rate, rate of future compensation increases and expected return on plan assets.
Income taxes - The calculation of the provision for federal income taxes is complex and requires the use of estimates and judgments. Deferred federal income tax assets or liabilities represent the estimated impact of temporary differences between the recognition of assets and liabilities under GAAP, and how such assets and liabilities are recognized under the federal tax code. The Company uses an estimate of future earnings to support management’s position that the benefit of the deferred tax assets will be realized. If future income should prove non-existent or less than the amount of the deferred tax assets within the tax years to which they may be applied, the asset may not be realized and net income will be reduced. Deferred tax assets are described further in Note 18 of the “Notes to Consolidated Financial Statements”.
30
The Company and its subsidiary file income tax and other returns in the U.S Federal jurisdiction, Pennsylvania state jurisdiction and local jurisdictions.
Management evaluated the Company’s tax positions and concluded that the aggregate liabilities related to taxes are appropriately reflected in the consolidated financial statements. With few exceptions, the Company is no longer subject to income tax examinations by the U.S. Federal, state or local tax authorities for years before 2006.
Fair Value Measurements – Fair values of financial instruments are estimated using relevant market information and other assumptions. Fair value estimates involve uncertainties and matters of significant judgment regarding interest rates, credit risk, prepayment speeds and other factors. Changes in assumptions or in market conditions could significantly affect the estimates. Fair value measurements are classified within one of three levels within a valuation hierarchy based on the transparency of inputs to each valuation as of the fair value measurement date. The three levels are defined as follows:
Level I – quoted prices (unadjusted) for identical assets or liabilities in active markets.
Level II – inputs include quoted prices for similar assets and liabilities in active markets, quoted prices of identical or similar assets or liabilities in markets that are not active, and inputs that are observable for the asset or liability, either directly or indirectly, for substantially the full term of the financial instrument.
Level III – inputs that are unobservable and significant to the fair value measurement. Financial instruments are considered Level III when values are determined using pricing models, discounted cash flow methodologies, or similar techniques, and at least one significant model assumption or input is unobservable.
Other-than-temporary impairment of investments - Investments are evaluated periodically to determine whether a decline in their value is other than temporary. Management utilizes criteria such as the magnitude and duration of the decline, in addition to the reasons underlying the decline, to determine whether the loss in value is other than temporary. The term “other-than-temporary” is not intended to indicate that the decline is permanent. It indicates that the prospects for a near term recovery of value are not necessarily favorable, or that there is a lack of evidence to support fair values equal to, or greater than, the carrying value of the investment. Once a decline in value is determined to be other than temporary, the value of the security is reduced and a corresponding charge to earnings is recognized. In 2009, the Company recorded an other-than-temporary impairment charge of $787 related to the Company’s equity investment portfolio containing stock of financial institutions.
Premium amortization - The amortization of premiums on mortgage-backed securities is done based on management’s estimate of the lives of the securities, adjusted, when necessary, for advanced prepayments in excess of those estimates.
Loans purchased – Loans purchased as a result of the Merger were recorded at the acquisition date fair value. Management made three different types of fair value adjustments in order to record the loans at fair value. An interest rate fair value adjustment was made comparing current weighted average rates of the acquired loans to stated market rates of similar loan types. A general credit fair value adjustment was made on similar loan types based on historical loss projections plus a discount for the weak economic environment. A specific credit fair value adjustment was made to loans identified by management as being problematic. The specific loans have been discounted by management based on collateral values and expected cash flows. The interest rate and general credit fair value adjustments are being accreted over an eight year period based on a sum-of-the-years-digits basis. The specific credit fair value adjustment is reduced only when cash flows are received or loans are charged-off or transferred to other real estate owned.
Loan servicing rights – Mortgage servicing rights are evaluated for impairment based on the fair value of those rights. Fair values are estimated using discounted cash flows based on current market rates of interest and current expected future prepayment rates. For purposes of measuring impairment, the rights must be stratified by one or more predominant risk characteristics of the underlying loans. The Company stratifies its capitalized mortgage servicing rights based on the product type, interest rate and term of the underlying loans. The amount of impairment recognized is the amount, if any, by which the amortized cost of the rights for each stratum exceed the fair value.
Time deposits – Time deposits acquired through the Merger have been recorded at their acquisition date fair value. The fair value of time deposits represents the present value of the time deposits’ expected contractual payments discounted by market rates for similar deposits. The fair value adjustment is amortized monthly based on a level yield methodology.
31
Repurchase agreements - The Company also offers repurchase agreements as an alternative to conventional savings deposits for its customers. The repurchase agreements are accounted for as a collateralized borrowing with a one day maturity and are collateralized by U.S. Agency securities.
Core deposit intangible – The fair value assigned to the core deposit intangible asset represents the future economic benefit of the potential cost savings from acquiring core deposits in the Merger compared to the cost of obtaining alternative funding, such as brokered deposits, from market sources. Management utilized an income approach to present value the expected after tax cash flow benefits of the acquired core deposits. The core deposit intangible is being amortized over ten years on a sum-of-the-years-digits basis.
Goodwill – Goodwill arose in connection with the Merger. It is reviewed by management for possible impairment at least annually or more frequently upon the occurrence of an event or when circumstances indicate that its carrying amount exceeds fair value. Management has obtained a professional evaluation of the Company value as of December 31, 2010. The evaluation disclosed that the fair value of the Company stock is approximately 37% above book value, considering both income and market approaches. Market conditions that could negatively impact the value of goodwill in the future are essentially those Risk Factors discussed in Part 1A of this report. Management has determined that the carrying value of goodwill has not been impaired at December 31, 2010.
RESULTS OF OPERATIONS
Net Interest Income
The principal component of the Company’s earnings is net interest income, which is the difference between interest and fees earned on interest-earning assets and interest paid on deposits and other borrowings.
Net interest income increased $2,818 or 9.2% to $33,389 for 2010 compared to $30,571 for 2009. Loan interest income increased $2,234 or 6.9% for 2010, largely due to the increased loan portfolio from Old Forge Bank. Investment income decreased $637 or 8.2% due to lower rates despite a higher volume of investments. Interest expense for 2010 decreased $1,224 or 12.8% to $8,356 for 2010 compared to $9,580 in 2009, mainly due to lower deposit and borrowing costs.
Net interest income increased $7,503 or 32.5% to $30,571 for 2009 compared to $23,068 for 2008. Loan interest income increased $6,181 or 23.6% for 2009 largely due to the increased loan portfolio from Old Forge Bank. Investment income remained relatively unchanged due to lower rates despite a higher volume of investments. Interest expense for 2009 decreased $1,250 or 11.5% to $9,580 for 2009 compared to $10,830 in 2008, mainly due to lower borrowing costs.
Net interest income, when expressed as a percentage of average interest-earning assets, is referred to as net interest margin. The Company’s net interest margin for the year ended December 31, 2010 was 4.11% compared with 4.11% for the year ended December 31, 2009 and 3.93% for the year ended December 31, 2008.
Interest income in 2010 totaled $41,745, compared to $40,151 in 2009, an increase of $1,594 or 4.0%. The tax equivalent yield on average interest-earning assets decreased to 5.40% in 2010, compared to 5.70% in 2009. Average interest-earning assets increased $69,407 or 9.3% in 2010 to $813,142 from $743,735 in 2009. Average loans, which are typically the Company’s highest yielding earning assets, increased $54,539 or 9.8% in 2010 due primarily to the Merger. Average loans represented 74.9% of 2010 average interest-earning assets, compared to 74.5% in 2009. Income on loans increased $2,234 or 6.9% in 2010 due in part to the Merger, compared to an increase in loan income of $6,181 or 23.6% during 2009. Investment securities increased on average by $13,509 or 7.5% to $192,787 in 2010 compared to $179,278 in 2009 due to the Merger. Income on investments decreased $637 or 8.2% to $7,103 in 2010, from $7,740 in 2009. Average earning assets, including Bank-Owned Life Insurance (BOLI), decreased to 93.2% of average total assets for 2010 compared to 93.9% for the year ago period.
Interest expense in 2010 totaled $8,356, compared to $9,580 in 2009, a decrease of $1,224 or 12.8%. The average rate paid on interest-bearing liabilities decreased during 2010 to 1.29%, compared to 1.61% in 2009. Average interest-bearing liabilities increased $51,155 or 8.6% in 2010 to $647,848 from $596,693 in 2009. Average savings deposits increased $12,390 or 12.2%. Average time deposits increased $35,347 or 19.1% in 2010 due primarily to the issuance of brokered certificates of deposit. Average time deposits represented 33.9% of 2010 average interest-bearing liabilities, compared to 30.9% in 2009. Average demand non-interest bearing deposits increased $15,577 or 16.3%.
32
Interest income in 2009 totaled $40,151, compared to $33,898 in 2008, an increase of $6,253 or 18.4%. The tax equivalent yield on average interest-earning assets decreased to 5.70% in 2009, compared to 6.07% in 2008. Average interest-earning assets increased in 2009 to $743,735 from $586,689 in 2008. Average loans, which are typically the Company’s highest yielding earning assets, increased $133,457 or 31.7% in 2009 due to the Merger. Average loans represented 74.5% of 2009 average interest-earning assets, compared to 71.8% in 2008. Income on loans increased $6,181 or 23.7% in 2009 due to the Merger, compared to a decrease in loan income of $211 or .8% during 2008. Investment securities increased on average by $24,114 or 15.5% to $179,278 in 2009 compared to $155,164 in 2008 due to the Merger. Income on investments increased $321 or 4.3% to $7,740 in 2009, from $7,419 in 2008. Average earning assets, including Bank-Owned Life Insurance (BOLI), decreased to 93.9% of average total assets for 2009 compared to 96.4% for the year ago period.
Interest expense in 2009 totaled $9,580, compared to $10,830 in 2008, a decrease of $1,250 or 11.5%. The average rate paid on interest-bearing liabilities decreased during 2009 to 1.61%, compared to 2.32% in 2008. Average interest-bearing liabilities increased $129,255 or 27.6% in 2009 to $596,693 from $467,468 in 2008 due to the Merger. Average savings deposits increased $25,439 or 33.3% and average time deposits increased $76,401 or 70.6% in 2010 due the Merger. Average time deposits represented 30.9% of 2010 average interest-bearing liabilities, compared to 23.1% in 2009. Average demand non-interest bearing deposits increased $23,476 or 32.6% due to the Merger.
The most significant impact on net interest income between periods is derived from the interaction of changes in the volume of and rates earned or paid on interest-earning assets and interest-bearing liabilities. The volume of earning dollars in loans and investments, compared to the volume of interest-bearing liabilities represented by deposits and borrowings, combined with the spread, produces the changes in net interest income between periods.
Historically low interest rates will begin to stress our margin as funding costs have reached a low point and asset yields continue to price downward. The Dodd-Frank financial reform bill passed in 2010 will reduce revenue and increase compliance and regulatory costs.
33
DISTRIBUTION OF ASSETS, LIABILITIES AND STOCKHOLDERS’ EQUITY/INTEREST RATES AND INTEREST DIFFERENTIAL
The table below presents average weekly balances, interest income on a fully taxable equivalent basis and interest expense, as well as average rates earned and paid on the company’s major asset and liability items for the years ended December 31, 2010, 2009 and 2008.
| 2010 | 2009 | 2008 | ||||||||||||||||||||||||||||||||||
| ASSETS |
Average Balance |
Revenue Expense |
Yield/ Rate |
Average Balance |
Revenue Expense |
Yield/ Rate |
Average Balance |
Revenue Expense |
Yield/ Rate |
|||||||||||||||||||||||||||
| Investment Securities: |
||||||||||||||||||||||||||||||||||||
| Available-for-Sale |
||||||||||||||||||||||||||||||||||||
| U.S. Agency obligations |
$ | 78,268 | $ | 1,865 | 2.38 | % | $ | 60,030 | $ | 1,969 | 3.28 | % | $ | 47,530 | $ | 2,270 | 4.78 | % | ||||||||||||||||||
| States & political subdivisions |
69,941 | 3,133 | 6.79 | 62,464 | 2,941 | 7.13 | 40,127 | 1,818 | 6.86 | |||||||||||||||||||||||||||
| Other |
3,696 | 51 | 1.38 | 1,349 | 39 | 2.89 | 2,497 | 92 | 3.68 | |||||||||||||||||||||||||||
| Held to Maturity: |
||||||||||||||||||||||||||||||||||||
| U.S. Agency obligations |
20,546 | 990 | 4.82 | 28,200 | 1,337 | 4.74 | 35,775 | 1,677 | 4.69 | |||||||||||||||||||||||||||
| States & political subdivisions |
20,336 | 1,064 | 7.93 | 27,235 | 1,454 | 8.09 | 29,235 | 1,562 | 8.10 | |||||||||||||||||||||||||||
| Loans, net of unearned income: |
||||||||||||||||||||||||||||||||||||
| Real estate mortgages |
328,881 | 17,302 | 5.26 | 318,444 | 17,788 | 5.59 | 270,368 | 16,376 | 6.06 | |||||||||||||||||||||||||||
| Commercial real estate |
177,552 | 9,163 | 5.16 | 148,641 | 7,879 | 5.30 | 90,544 | 5,734 | 6.33 | |||||||||||||||||||||||||||
| Commercial |
31,239 | 2,067 | 6.62 | 25,656 | 1,551 | 6.05 | 24,286 | 1,612 | 6.64 | |||||||||||||||||||||||||||
| Consumer & other |
71,316 | 6,101 | 8.55 | 61,708 | 5,181 | 8.40 | 35,794 | 2,496 | 6.97 | |||||||||||||||||||||||||||
| Federal funds sold |
— | — | — | — | — | — | 1,739 | 29 | 1.67 | |||||||||||||||||||||||||||
| Federal Home Loan Bank stock |
6,346 | — | — | 6,175 | — | — | 4,911 | 164 | 3.34 | |||||||||||||||||||||||||||
| Interest on balances with banks |
5,021 | 9 | .18 | 3,833 | 12 | .31 | 3,883 | 68 | 1.75 | |||||||||||||||||||||||||||
| Total Interest Earning Assets/Total Interest Income |
813,142 | $ | 41,745 | 5.40 | % | 743,735 | $ | 40,151 | 5.70 | % | 586,689 | $ | 33,898 | 6.07 | % | |||||||||||||||||||||
| Cash and due from banks |
10,915 | 10,326 | 9,687 | |||||||||||||||||||||||||||||||||
| Bank premises and equipment |
12,924 | 11,804 | 9,362 | |||||||||||||||||||||||||||||||||
| Accrued interest receivable |
3,713 | 3,829 | 3,350 | |||||||||||||||||||||||||||||||||
| Goodwill |
26,398 | 19,798 | — | |||||||||||||||||||||||||||||||||
| Cash surrender value life insurance |
14,824 | 12,559 | 7,515 | |||||||||||||||||||||||||||||||||
| Other assets |
12,580 | 9,140 | 4,693 | |||||||||||||||||||||||||||||||||
| Less: Allowance for loan losses |
6,277 | 5,963 | 4,986 | |||||||||||||||||||||||||||||||||
| Total Assets |
$ | 888,219 | $ | 805,228 | $ | 616,310 | ||||||||||||||||||||||||||||||
| LIABILITIES AND STOCKHOLDERS’ EQUITY |
||||||||||||||||||||||||||||||||||||
| Deposits: |
||||||||||||||||||||||||||||||||||||
| Demand-Interest Bearing |
$ | 69,534 | $ | 327 | .47 | % | $ | 64,762 | $ | 393 | .61 | % | $ | 53,915 | $ | 377 | .70 | % | ||||||||||||||||||
| Savings |
114,155 | 324 | .28 | 101,765 | 409 | .40 | 76,326 | 412 | .54 | |||||||||||||||||||||||||||
| Money markets |
143,863 | 874 | .61 | 137,527 | 1,379 | 1.00 | 114,521 | 2,131 | 1.86 | |||||||||||||||||||||||||||
| Time-Over $100 |
100,210 | 2,173 | 2.17 | 67,075 | 1,726 | 2.57 | 37,745 | 1,451 | 3.84 | |||||||||||||||||||||||||||
| Time-Other |
119,719 | 1,930 | 1.61 | 117,507 | 2,634 | 2.24 | 70,436 | 2,602 | 3.69 | |||||||||||||||||||||||||||
| Repurchase agreements |
20,484 | 154 | .75 | 25,554 | 339 | 1.33 | 34,204 | 848 | 2.48 | |||||||||||||||||||||||||||
| Federal funds purchased |
3,936 | 22 | .56 | 4,568 | 29 | .63 | — | — | — | |||||||||||||||||||||||||||
| Short-term borrowings |
8,917 | 42 | .47 | 9,689 | 48 | .50 | 7,069 | 175 | 2.48 | |||||||||||||||||||||||||||
| Long-term borrowings |
67,030 | 2,510 | 3.74 | 68,246 | 2,623 | 3.84 | 73,252 | 2,834 | 3.87 | |||||||||||||||||||||||||||
| Total Interest Bearing Liabilities/Total Interest Expense |
647,848 | $ | 8,356 | 1.29 | % | 596,693 | $ | 9,580 | 1.61 | % | 467,468 | $ | 10,830 | 2.32 | % | |||||||||||||||||||||
| Demand-Non-interest bearing |
111,068 | 95,491 | 72,015 | |||||||||||||||||||||||||||||||||
| All other liabilities |
8,927 | 7,431 | 4,366 | |||||||||||||||||||||||||||||||||
| Stockholders’ equity |
120,376 | 105,613 | 72,461 | |||||||||||||||||||||||||||||||||
| Total Liabilities Stockholders’ Equity |
$ | 888,219 | $ | 805,228 | $ | 616,310 | ||||||||||||||||||||||||||||||
| Interest Spread |
4.11 | % | 4.09 | % | 3.75 | % | ||||||||||||||||||||||||||||||
| Net Interest Income |
$ | 33,389 | $ | 30,571 | $ | 23,068 | ||||||||||||||||||||||||||||||
| FINANCIAL RATIOS |
||||||||||||||||||||||||||||||||||||
| Net interest margin |
4.11 | % | 4.11 | % | 3.93 | % | ||||||||||||||||||||||||||||||
| Return on average assets |
1.32 | % | 1.04 | % | 1.40 | % | ||||||||||||||||||||||||||||||
| Return on average equity |
9.74 | % | 7.93 | % | 11.89 | % | ||||||||||||||||||||||||||||||
| Average equity to average assets |
13.55 | % | 13.12 | % | 11.76 | % | ||||||||||||||||||||||||||||||
| Dividend payout ratio |
46.93 | % | 60.00 | % | 41.40 | % | ||||||||||||||||||||||||||||||
34
DOLLAR AMOUNT OF CHANGE IN INTEREST INCOME AND INTEREST EXPENSE
| 2010 compared to 2009 |
Dollar Amount of Change |
Change in Volume |
Change in Rate |
Change in Rate- Volume |
||||||||||||||
| EARNING |
Investment Securities: |
|||||||||||||||||
| ASSETS |
Available-for-Sale |
|||||||||||||||||
| U.S. Agency obligations |
$ | (104 | ) | $ | 598 | $ | (540 | ) | $ | (162 | ) | |||||||
| States & political subdivisions |
192 | 533 | (212 | ) | (129 | ) | ||||||||||||
| Equity securities |
12 | 68 | (20 | ) | (36 | ) | ||||||||||||
| Held to Maturity: |
||||||||||||||||||
| U.S. Agency obligations |
(347 | ) | (363 | ) | 23 | (7 | ) | |||||||||||
| States & political subdivisions |
(390 | ) | (558 | ) | (44 | ) | 212 | |||||||||||
| Loans, net of unearned income: |
||||||||||||||||||
| Real estate mortgages |
798 | 2,163 | (1,274 | ) | (91 | ) | ||||||||||||
| Commercial |
516 | 338 | 146 | 32 | ||||||||||||||
| Consumer and other |
920 | 807 | 93 | 20 | ||||||||||||||
| Federal funds sold |
— | — | — | — | ||||||||||||||
| Federal Home Loan Bank stock |
— | — | — | — | ||||||||||||||
| Interest bearing balances with banks |
(3 | ) | 4 | (5 | ) | (2 | ) | |||||||||||
| Total Interest Income |
1,594 | 3,590 | (1,833 | ) | (163 | ) | ||||||||||||
| INTEREST |
Deposits: |
|||||||||||||||||
| BEARING |
Demand-Interest Bearing |
(66 | ) | 29 | (91 | ) | (4 | ) | ||||||||||
| LIABILITIES |
Savings |
(85 | ) | 50 | (122 | ) | (13 | ) | ||||||||||
| Money markets |
(505 | ) | 63 | (536 | ) | (32 | ) | |||||||||||
| Time-Over $100 |
447 | 852 | (268 | ) | (137 | ) | ||||||||||||
| Time-Other |
(704 | ) | 50 | (740 | ) | (14 | ) | |||||||||||
| Repurchase agreements |
(185 | ) | (67 | ) | (148 | ) | 30 | |||||||||||
| Short-term borrowings |
(13 | ) | (7 | ) | — | (6 | ) | |||||||||||
| Long-term borrowings |
(113 | ) | (47 | ) | (68 | ) | 2 | |||||||||||
| Total Interest Expense |
(1,224 | ) | 923 | (1,973 | ) | (174 | ) | |||||||||||
| Net Interest Income |
$ | 2,818 | $ | 2,667 | $ | 140 | $ | 11 | ||||||||||
| 2009 compared to 2008 |
||||||||||||||||||
| EARNING |
Investment Securities: |
|||||||||||||||||
| ASSETS |
Available-for-Sale |
|||||||||||||||||
| U.S. Agency obligations |
$ | (301 | ) | $ | 598 | $ | (713 | ) | $ | (186 | ) | |||||||
| States & political subdivisions |
1,123 | 1,532 | 108 | (517 | ) | |||||||||||||
| Equity securities |
(53 | ) | (42 | ) | (20 | ) | 9 | |||||||||||
| Held to Maturity: |
||||||||||||||||||
| U.S. Agency obligations |
(340 | ) | (355 | ) | 18 | (3 | ) | |||||||||||
| States & political subdivisions |
(108 | ) | (162 | ) | (3 | ) | 57 | |||||||||||
| Loans, net of unearned income: |
||||||||||||||||||
| Real estate mortgages |
3,557 | 6,506 | (2,274 | ) | (675 | ) | ||||||||||||
| Commercial |
(61 | ) | 91 | (143 | ) | (9 | ) | |||||||||||
| Consumer and other |
2,685 | 1,806 | 512 | 367 | ||||||||||||||
| Federal funds sold |
(29 | ) | (29 | ) | (29 | ) | 29 | |||||||||||
| Federal Home Loan Bank stock |
(164 | ) | 42 | (164 | ) | (42 | ) | |||||||||||
| Interest bearing balances with banks |
(56 | ) | (1 | ) | (56 | ) | 1 | |||||||||||
| Total Interest Income |
6,253 | 9,986 | (2,764 | ) | (969 | ) | ||||||||||||
| INTEREST |
Deposits: |
|||||||||||||||||
| BEARING |
Demand-Interest Bearing |
16 | 76 | (49 | ) | (11 | ) | |||||||||||
| LIABILITIES |
Savings |
(3 | ) | 137 | (107 | ) | (33 | ) | ||||||||||
| Money markets |
(752 | ) | 428 | (985 | ) | (195 | ) | |||||||||||
| Time-Over $100 |
275 | 1,126 | (479 | ) | (372 | ) | ||||||||||||
| Time-Other |
32 | 1,737 | (1,021 | ) | (684 | ) | ||||||||||||
| Repurchase agreements |
(509 | ) | (215 | ) | (393 | ) | 99 | |||||||||||
| Short-term borrowings |
(98 | ) | 178 | (137 | ) | (139 | ) | |||||||||||
| Long-term borrowings |
(211 | ) | (194 | ) | (22 | ) | 5 | |||||||||||
| Total Interest Expense |
(1,250 | ) | 3,273 | (3,193 | ) | (1,330 | ) | |||||||||||
| Net Interest Income |
$ | 7,503 | $ | 6,713 | $ | 429 | $ | 361 | ||||||||||
35
(1) The net interest margin is equal to tax equivalent net interest income divided by average interest earning assets. In order to make pre-tax income on tax-exempt investments comparable to taxable investments and loans, a tax equivalent adjustment is made to interest income. This adjustment increased interest income by $2,165, $2,262 and $1,741 for the years ended December 31, 2010, 2009 and 2008, respectively, for the purposes of the tax equivalent yield calculation. We believe that the tax equivalent presentation is consistent with industry practice. Although we believe that these financial measures enhance investors’ understanding of our business and performance, these measures should not be considered an alternative to GAAP.
PROVISION FOR LOAN LOSSES
The provision for loan losses represents management’s determination of the risk of future losses inherent in the Company’s loan portfolio.
During 2009, as the local economy began to experience the negative impact of the nation’s economic downturn, the Company was prompted to increase the provision for loan losses substantially in 2009 in the amount of $2,260 compared to $861 in 2008. In 2010, the local economy continued to experience the negative impact of our nation’s economic downturn. The local housing market remained weak and the unemployment rate in Northeastern Pennsylvania was largely unchanged at 9.5% at year-end. To enhance our ability to identify and manage risk throughout our organization, the Bank created the senior level position of Chief Risk Officer. This position will facilitate our enterprise-wide risk assessment to identify, monitor and quickly mitigate the inherent risks of a community bank in today’s economic environment. The Company has continued to apply a proactive approach in evaluating probable loan losses and addressing delinquent loans by, among other things, obtaining current appraisals of collateral; and increasing communication with clients and facilitating payment of delinquent loans.
The Bank’s process for determining an appropriate level for the allowance for loan and lease losses (ALLL) is based on a comprehensive, well documented and consistently applied analysis of its loan portfolio. This analysis considers all significant factors that affect the collectability of the loans within our portfolio and supports the credit losses estimated by this process. Our ALLL methodology includes procedures for a review by a party who is independent of the Bank’s credit approval and ALLL estimation processes.
The Bank follows its systematic methodology in accordance with the FFIEC Interagency Policy Statements, as amended, and GAAP in assessing the adequacy of the allowance account. Under GAAP, the adequacy of the allowance for loan losses is determined based on the provisions of FASB ASC 310 for loans specifically identified to be individually evaluated for impairment and the requirements of FASB ASC 450 for large groups of smaller balance homogeneous loans to be collectively evaluated for impairment. Loans are identified by the Bank’s rating system, past due reports, watch list and sensitivity to economic factors and are then collectively evaluated for impairment compared to other loans utilizing standard criteria. Consideration is given to current local economic conditions which the Company continues to classify as recessionary.
Our historical analysis of loss factors, which utilizes a rolling twenty quarters, was refined in the third quarter of 2010 to assign greater weight to the four quarters of the previous five years that reflected the greatest loan loss allowances. This change in our methodology is designed to better address deterioration in local economic conditions. In addition, and in view of the concentration of the Bank’s loan portfolio in real estate, over 80% of the portfolio is secured by real estate mainly in the counties in which the Bank operates, the Bank also took into account the decline in real estate sales and new construction in our market area and the drop in real estate values within the market area. Our provision for loan losses has been primarily allocated to the commercial and industrial and commercial real estate portfolio.
Based on this methodology, management made a provision of $1,999 for loan losses for the year ended December 31, 2010, compared to a $2,260 provision for 2009. The amount and number of charge-offs and foreclosures increased during 2010 due to the slowing local economy as indicated in the following tables.
| As of: |
2010 | 2009 | 2008 | |||||||||
| Provision for loan losses |
$ | 1,999 | $ | 2,260 | $ | 861 | ||||||
| Allowance for loan losses to non-performing loans |
161.1 | % | 269.3 | % | 362.8 | % | ||||||
| Non-performing loans to period end loans |
0.66 | % | 0.39 | % | 0.33 | % | ||||||
| Ratio of charge-off loans to average loans |
0.30 | % | 0.23 | % | 0.07 | % | ||||||
| Ratio of foreclosed loans to average loans |
0.19 | % | 0.21 | % | — | |||||||
36
| 2010 | 2009 | 2008 | ||||||||||||||||||||||
| As of: |
Amount | (#) | Amount | (#) | Amount | (#) | ||||||||||||||||||
| Charge-offs |
$ | 1,838 | 102 | $ | 1,300 | 75 | $ | 317 | 50 | |||||||||||||||
| Foreclosures completed |
1,183 | 6 | 1,145 | 7 | — | — | ||||||||||||||||||
| Non-performing loans |
4,034 | 70 | 2,339 | 46 | 1,454 | 16 | ||||||||||||||||||
There was one troubled debt restructuring recorded (TDR) during 2010 and no troubled debt restructuring or concessions given to customers in 2009 or 2008.
The following table presents loans whose terms have been modified in a TDR:
| December 31, |
2010 | 2009 | ||||||
| Restructured Loans on Accrual Status and Not Past Due 90 Days or More |
$ | — | $ | — | ||||
| Restructured Loans Included in Non-Accrual Loans or Accruing Loans Past Due 90 Days or More |
401 | — | ||||||
| Total Restructured Loans |
$ | 401 | $ | — | ||||
The Company had one loan whose terms had been modified in a troubled debt restructuring as of December 31, 2010. This was a commercial loan where the monthly payments were lowered to accommodate the borrower’s financial needs for a period of time.
The Company believes that the judgments used in establishing the allowance for loan losses are based on reliable information. In assessing the sufficiency of the allowance for loan losses, management considers how well prior estimates have related to actual experience. The Company continually monitors the risk elements, historical rates and other data used in establishing the allowance on a periodic basis. Based on this ongoing evaluation, management determines the provision necessary to maintain an appropriate allowance.
The process of determining the adequacy of the allowance is necessarily judgmental and subject to changes in external conditions. Accordingly, there can be no assurance that existing levels of the allowance will ultimately prove adequate to cover actual loan losses. Although management uses available information to establish the appropriate level of the allowance for loan losses, future additions or reductions to the allowance may be necessary, based on estimates that are susceptible to change, as a result of changes in economic conditions and other factors. As a result, our allowance for loan losses may not be sufficient to cover actual loan losses, and future provisions for loan losses could materially adversely affect the Company’s operating results. In addition, various regulatory agencies, as an integral part of their examination process, periodically review the Company’s allowance for loan losses. Such agencies may require the Company to recognize adjustments to the allowance based on their judgments about information available to them at the time of their examination.
There are also no particular risk elements in the local economy that put a group or category of loans at increased risk, however, the Company has increased its portfolio of commercial loans, which typically bear a higher risk. These loans are typically secured by real estate to minimize this risk. At December 31, 2010, management believes the allowance for loan losses is adequate to manage the risk inherent in the loan portfolio due to today’s economic environment.
37
NON-INTEREST INCOME
The following table sets forth information by category of non-interest income for the Company for the past three years:
| Years Ended December 31, |
2010 | 2009 | 2008 | |||||||||
| Trust department income |
$ | 1,493 | $ | 1,392 | $ | 1,474 | ||||||
| Service charges on deposit accounts |
2,163 | 1,939 | 1,477 | |||||||||
| Merchant transaction income |
4,521 | 4,379 | 4,502 | |||||||||
| Brokerage fee income |
340 | 348 | 596 | |||||||||
| Cardholder discounts |
799 | 665 | 569 | |||||||||
| Other fee income |
771 | 727 | 710 | |||||||||
| Bank-owned life insurance |
538 | 470 | 316 | |||||||||
| Gain on sale of mortgage loans |
682 | 356 | 19 | |||||||||
| Other operating income |
287 | 7 | 148 | |||||||||
| VISA mandatory share redemption |
— | — | 1,213 | |||||||||
| Impairment losses on investment securities |
— | (787 | ) | — | ||||||||
| Realized gains on securities, net |
558 | 873 | 12 | |||||||||
| Total Non-Interest Income |
$ | 12,152 | $ | 10,369 | $ | 11,036 | ||||||
Total non-interest income increased $1,783 or 17.2% to $12,152 during 2010, from $10,369 for the same period of 2009. Trust department income increased $101 or 7.3% due to an increase in the market value of trust assets and new business. Service charges on deposit accounts increased $224 or 11.6% primarily due to the increased number of accounts and increased service charge activity. Merchant transaction income increased $142 or 3.2%, mainly due to new accounts and higher transaction volume. Cardholder discounts increased $134 or 20.2% mainly from increased debit card discounts related to the increased number of accounts. Bank-owned life insurance income increased $68 or 14.5% from additional policies acquired in the merger. Other operating income increased $280 largely due to additional revenue of $150 from an over accrual from the 2006 Voluntary Early Retirement Incentive program along with a reimbursement of legal fees from the merger with Old Forge Bank. The Company recognized an impairment loss on bank equity investment securities of $787 during 2009. Realized gains on securities decreased $315 to $558 during 2010 from $873 for 2009.
Total non-interest income decreased $667 or 6.0% to $10,369 during 2009, from $11,036 for the same period of 2008. Trust department income decreased $82 or 5.6% due to a lower market value of trust assets. Service charges on deposit accounts increased $462 or 31.3% primarily due to the increased number of accounts and increased service charge activity. Merchant transaction income decreased $123 or 2.7%, mainly due to lower transaction volume from continued softness in the economy. Brokerage fee income decreased $248 or 41.6% mostly due to the decline in the overall volume of transactions. Other operating income increased $196 or 117.4% largely due to gains on the sale of low yielding long-term fixed rate real estate loans. In the first quarter of 2008, the Company realized a gain of $1,213 related to VISA, Inc.’s Initial Public Offering, which consisted of a mandatory partial share redemption. The Company recognized an impairment loss on bank equity investment securities of $787 during 2009. Realized gains on securities increased $861 to $873 during 2009 from $12 for 2008 largely due to gains on the sale of the majority of the Old Forge Bank securities portfolio, with the proceeds reinvested into higher quality securities.
NON-INTEREST EXPENSES
VISA Contingency
In October 2007, Penn Security Bank & Trust Company, as a member of VISA U.S.A. Inc. received shares of restricted stock in VISA, Inc. (VISA) as a result of a global restructuring of VISA in preparation for an initial public offering in 2008.
In connection with this, VISA member banks were required to recognize a contingent obligation to indemnify VISA under its revised bylaws for potential losses arising from certain antitrust litigation at the estimated fair value of such obligation. The Company, accordingly, recorded a $497 charge or $328, net of tax, in the fourth quarter of 2007. Upon successful completion of the public offering in 2008, VISA established an escrow account for the litigation, funded by a partial redemption of member shares allowing the Company to reverse the $497 litigation accrual during the first quarter of 2008.
38
The following table sets forth information by category of non-interest expenses for the Company for the past three years:
| Years Ended December 31, |
2010 | 2009 | 2008 | |||||||||
| Salaries and employee benefits |
$ | 13,081 | $ | 12,551 | $ | 10,157 | ||||||
| Expense of premises and equipment, net |
3,547 | 3,246 | 2,703 | |||||||||
| Merchant transaction expenses |
3,139 | 3,085 | 3,403 | |||||||||
| Merger related costs |
— | 1,550 | — | |||||||||
| FDIC insurance assessments |
1,150 | 968 | 59 | |||||||||
| Legal and professional expenses |
694 | 442 | (108 | ) | ||||||||
| Advertising expense |
605 | 409 | 603 | |||||||||
| Bank shares tax |
805 | 1,039 | 743 | |||||||||
| Outside services |
781 | 615 | 770 | |||||||||
| Director fees |
550 | 568 | 493 | |||||||||
| Other operating expenses |
4,101 | 3,947 | 3,349 | |||||||||
| Total Non-Interest Expenses |
$ | 28,453 | $ | 28,420 | $ | 22,172 | ||||||
Total non-interest expenses increased $33 or 0.1% to $28,453 during 2010 compared with $28,420 for the same period of 2009. Salaries and employee benefits expense increased $530 or 4.2% mainly due to additional employees as a result of the merger. Expense of premises and equipment increased $301 or 9.3% mostly due to additional depreciation as a result of branch renovation projects. There were no merger related costs in 2010 compared to 2009, during which the Company incurred Merger related costs of $1,550, which consisted of computer and equipment upgrades of $606, investment banking, valuation services, legal and accounting fees of $429, severance payments of $450 and stay bonuses of $65. FDIC insurance assessments increased $182 or 18.8% due to increases in quarterly assessments. Legal and professional expenses increased $252 or 57% due to increased fees associated with non-performing loans as a result of the current economic conditions. Advertising expense increased $196 or 47.9% due to increased promotional activity to generate deposits. Bank shares tax decreased $234 or 22.5% primarily from the benefit of educational tax credits. Other operating expenses increased $154 or 3.9% due to an increase in the amortization of core deposit intangibles of $65 and other real estate owned expense of $51.
Total non-interest expenses increased $6,248 or 28.2% to $28,420 during 2009 compared with $22,172 for the same period of 2008. Salaries and employee benefits expense increased $2,394 or 23.6% mainly due to increased salaries resulting from additional employees as a result of the merger. Premises and fixed assets expense increased $543 or 20.1% due to additional depreciation and increased occupancy expense in part due to the merger. Merchant transaction expenses decreased $318 or 9.3% due to lower transaction volume. Merger related costs of $1,550 consist of computer system conversions and equipment upgrades of $606, investment banking, valuation services, legal and accounting fees of $429, severance payments of $450 and stay bonuses of $65. FDIC insurance assessments increased $909 due to a one time FDIC special assessment charge of $385 and increases in quarterly assessments. Bank shares tax increased $296 or 39.8% as a result of the Merger. Other operating expenses increased $954 or 24.8% due to the effect of the reversal in the first quarter of 2008 of the $497 VISA litigation accrual recorded by the Company in the fourth quarter of 2007, in addition to an increase of $248 in consulting and advisory expense and $850 of legal and professional services.
INCOME TAXES
Federal income tax expense increased $1,479 or 78.3% to $3,367 in 2010 compared to $1,888 in 2009, primarily due to higher income and the effect of $1,550 of costs associated with the Merger recorded during 2009.
Federal income tax expense decreased $570 or 23.2% to $1,888 in 2009 compared to $2,458 in 2008, primarily due to lower operating income described above and higher tax-free income.
The Company’s effective income tax rate for 2010, 2009 and 2008 was 22.3%, 18.4% and 22.2%, respectively.
The Company uses the asset and liability method of accounting for deferred income taxes. If current available information raises doubt as to the realization of deferred tax assets, a valuation allowance is established. The Company evaluates the recoverability of deferred tax assets based on its ability to generate future profits. The Company employs budgeting and periodic reporting processes to continually monitor its progress. Historically, the Company has had sufficient profits for recovery of deferred tax benefits.
For further discussion pertaining to Federal income taxes, see Note 18 to the Consolidated Financial Statements.
39
FINANCIAL CONDITION
Total assets increased $32.8 million or 3.7% during 2010 to $916.1 million at December 31, 2010 compared to $883.3 million at December 31, 2009. Total assets increased $254.3 million or 40.4% during 2009 to $883.3 million at December 31, 2009 compared to $629.0 million at December 31, 2008, including the acquisition of Old Forge Bank assets at fair value of $212.6 million and the recording of Goodwill of $26.4 million.
INVESTMENT PORTFOLIO
The Company’s investment portfolio has two primary functions: To provide liquidity and to contribute to earnings. To provide liquidity the Company may invest in short-term securities such as Federal funds sold, interest bearing deposits with banks, U.S. Treasury securities and U.S. Agency securities all with maturities of one year or less. These funds are invested short-term to ensure the availability of funds to meet customer demand for credit needs. The Company enhances interest income by securing long-term investments within its investment portfolio, by means of U.S. Treasury securities, U.S. Agency securities, municipal securities and mortgage-backed securities, generally with maturities greater than one year. The Company’s mortgage-backed securities portfolio does not contain any sub-prime or Alt-A credits.
The following table presents the carrying value, by security type and by maturity, for the Company’s investment portfolio:
| December 31, |
2010 | 2009 | 2008 | |||||||||
| U.S. Agency obligations |
$ | 134,541 | $ | 95,962 | $ | 80,643 | ||||||
| States & political subdivisions |
77,428 | 98,584 | 70,010 | |||||||||
| Corporate securities |
4,090 | — | — | |||||||||
| Total Debt Securities |
216,059 | 194,546 | 150,653 | |||||||||
| Equity securities |
985 | 1,384 | 1,259 | |||||||||
| Total Investment Securities |
$ | 217,044 | $ | 195,930 | $ | 151,912 | ||||||
The following table shows the actual maturity of debt securities in specified categories of the Bank’s investment portfolio at December 31, 2010 and the weighted average yields (for tax-exempt obligations on a fully taxable basis at 34 percent tax rate). The table does not include any estimate of prepayments which significantly shortens the average useful life of certain U.S. Agency mortgage-backed securities.
| As of December 31, 2010: |
Aggregate Value |
Weighted Average Yield |
||||||
| Due in one year or less: |
||||||||
| U.S. Agency securities |
$ | 17,177 | 2.54 | % | ||||
| States & political subdivisions |
— | — | ||||||
| Corporate securities |
3,069 | 0.61 | % | |||||
| After one year through five years: |
||||||||
| U.S. Agency securities |
62,117 | 1.40 | % | |||||
| States & political subdivisions |
346 | 8.43 | % | |||||
| Corporate securities |
1,021 | 1.09 | % | |||||
| After five year through ten years: |
||||||||
| U.S. Agency securities |
25,578 | 2.43 | % | |||||
| States & political subdivisions |
9,915 | 7.83 | % | |||||
| Corporate securities |
— | — | ||||||
| After ten years: |
||||||||
| U.S. Agency securities |
29,669 | 4.84 | % | |||||
| States & political subdivisions |
67,167 | 6.82 | % | |||||
| Corporate securities |
— | — | ||||||
| Total Debt Securities |
$ | 216,059 | ||||||
Investment securities with amortized costs and fair values of $129,004 and $131,757, respectively, at December 31, 2010 and $141,193 and $145,554, respectively, at December 31, 2009, were pledged to secure trust funds, public deposits and for other purposes as required by law.
40
The amortized cost and fair value of debt securities at December 31, 2010 by contractual maturity are shown in Note 3 to the Consolidated Financial Statements. Expected maturities will differ from contractual maturities because borrowers may have the right to call or prepay obligations with or without call or prepayment penalties.
Equity securities at December 31, 2010 and 2009 consisted primarily of other financial institutions’ stock.
In 2009, the Company recorded an other-than-temporary impairment charge of $787 related to the Company’s equity investment portfolio containing stock of financial institutions. Prior to this impairment charge, the decline in value of the securities was recorded as unrealized losses on securities available-for-sale and reflected as a reduction in stockholders’ equity through other comprehensive income.
In recent periods, United States and global markets, as well as general economic conditions, have been disrupted and volatile. Concerns regarding the financial strength of financial institutions have led to distress in credit markets and issues relating to liquidity among financial institutions. The United States and other governments have taken steps to try to stabilize the financial system, including investing in financial institutions. The Company has not applied for and is not participating in any government sponsored Capital Purchase Programs. Our businesses, financial conditions and results of operations could be adversely affected by (1) continued disruption and volatility in financial markets, (2) continued capital and liquidity concerns regarding financial institutions generally and our counterparties specifically, including the Federal Home Loan Bank, (3) limitations resulting from governmental action in an effort to stabilize or provide additional regulation of the financial system, or (4) recessionary conditions that are deeper or last longer than currently anticipated.
A summary of transactions involving available-for-sale debt securities in 2010, 2009 and 2008 are as follows:
| December 31, |
2010 | 2009 | 2008 | |||||||||
| Proceeds from sales |
$ | 8,897 | $ | 25,568 | $ | 11,798 | ||||||
| Gross realized gains |
66 | 1,029 | 11 | |||||||||
| Gross realized losses |
4 | 142 | — | |||||||||
Federal Home Loan Bank Stock Impairment Evaluation
The Company held FHLB stock of $6,082, $6,402 and $5,568 at December 31, 2010, 2009 and 2008, respectively. The Company’s banking subsidiary, Penn Security Bank, is required to maintain certain amounts of FHLB stock in order to participate in a FHLB line of credit program. The FHLB stock is stated at par value as it is restricted to purchases and sales with the FHLB. FHLB stock is less liquid than other tradable equity securities and the fair value is equal to cost. No impairment write-downs have been recorded on FHLB stock during 2010 or 2009.
The FHLB had suspended its stock repurchase and dividend payments during December 2008. A reduction in the level of core earnings resulting from lower short-term interest rates, the increased cost of maintaining liquidity and constrained access to the debt markets at attractive rates and maturities are the main reasons the FHLB cited as significant for the decision to suspend dividends and the repurchase of excess capital stock. Accounting guidance indicates that investors should recognize impairment in FHLB Pittsburgh capital stock if it is determined that it is not probable that the Bank will ultimately recover the par value of its shares. An investor in FHLB Pittsburgh must determine whether impairment exists based on its long-term performance, the severity and duration of declines in the market value of its net assets related to its capital stock amount, its commitment to make payments required by law or regulation and the level of such payments in relation to its operating performance, the impact of legislation and regulatory changes and its liquidity. During 2010, the FHLB repurchased $320 of capital stock which represented 5.0% of the Bank’s $6,402 investment. Based on current financial information available, management does not believe the FHLB stock value is impaired as of December 31, 2010.
41
LOAN PORTFOLIO
Details regarding the Company’s loan portfolio for the past five years are as follows:
| December 31, |
2010 | 2009 | 2008 | 2007 | 2006 | |||||||||||||||
| Real estate – construction and land development |
||||||||||||||||||||
| Residential real estate |
$ | 7,799 | $ | 9,970 | $ | 5,191 | $ | 7,263 | $ | 6,132 | ||||||||||
| Commercial real estate |
28,345 | 22,940 | 16,758 | 18,595 | 17,582 | |||||||||||||||
| Residential real estate |
287,502 | 298,098 | 256,560 | 237,594 | 207,613 | |||||||||||||||
| Commercial real estate |
179,619 | 171,995 | 98,968 | 80,843 | 76,710 | |||||||||||||||
| Commercial |
36,190 | 30,743 | 27,793 | 24,505 | 26,265 | |||||||||||||||
| Credit card and related plans |
3,327 | 3,365 | 3,272 | 3,324 | 3,282 | |||||||||||||||
| Installment |
62,441 | 59,986 | 28,135 | 26,542 | 25,532 | |||||||||||||||
| Obligations of states & political subdivisions |
9,882 | 6,873 | 4,471 | 5,973 | 6,806 | |||||||||||||||
| Loans, net of unearned income |
615,105 | 603,970 | 441,148 | 404,639 | 369,922 | |||||||||||||||
| Less: Allowance for loan losses |
6,500 | 6,300 | 5,275 | 4,700 | 4,200 | |||||||||||||||
| Loans, net |
$ | 608,605 | $ | 597,670 | $ | 435,873 | $ | 399,939 | $ | 365,722 | ||||||||||
The following table shows the actual maturity of the loans in specified categories of the Bank’s loan portfolio at December 31, 2010 and the weighted average yields (for tax-exempt loans on a fully taxable basis at 34 percent tax rate).
| Aggregate Value |
Weighted Average Yield |
|||||||
| Due in one year or less: |
||||||||
| Real estate – construction and land development |
$ | 3,274 | 4.05 | % | ||||
| Residential real estate |
7,694 | 3.49 | % | |||||
| Commercial real estate |
15,130 | 4.52 | % | |||||
| Commercial |
15,825 | 3.82 | % | |||||
| Credit card and related plans |
— | — | ||||||
| Installment |
17,685 | 5.72 | % | |||||
| Obligations of states & political subdivisions |
3,885 | 4.86 | % | |||||
| After one year through five years: |
||||||||
| Real estate – construction and land development |
2,925 | 4.49 | % | |||||
| Residential real estate |
16,479 | 5.94 | % | |||||
| Commercial real estate |
22,135 | 5.66 | % | |||||
| Commercial |
14,088 | 4.45 | % | |||||
| Credit card and related plans |
3,327 | 13.23 | % | |||||
| Installment |
36,845 | 6.47 | % | |||||
| Obligations of states & political subdivisions |
1,265 | 6.91 | % | |||||
| After five year: |
||||||||
| Real estate – construction and land development |
29,945 | 3.39 | % | |||||
| Residential real estate |
263,329 | 5.88 | % | |||||
| Commercial real estate |
142,354 | 5.51 | % | |||||
| Commercial |
6,277 | 3.01 | % | |||||
| Credit card and related plans |
— | — | ||||||
| Installment |
7,911 | 5.35 | % | |||||
| Obligations of states & political subdivisions |
4,732 | 6.41 | % | |||||
| Total Loan Portfolio |
$ | 615,105 | ||||||
There were no purchased loans in 2010, 2009 or 2008 other than loan participations with local banks. Originations of new loans are primarily in loans secured by real estate. The growth in loans from 2008 to 2010 was mainly due to the merger of Old Forge Bank.
42
The Company has not engaged in any sub-prime residential mortgage lending. Therefore, the Company is not subject to any credit risks associated with such loans. The Company’s loan portfolio primarily consists of residential and commercial mortgage loans, secured by properties located in Northeastern Pennsylvania and subject to conservative underwriting standards.
Loans secured by real estate continue to be the largest component of the loan portfolio, representing 82% and 83% of total loans at December 31, 2010 and December 31, 2009, respectively. However, recent economic conditions and recessionary concerns have resulted in lower levels of loan demand. Accordingly, we expect that loan growth may be slower than historically expected.
The Company’s loan portfolio is primarily residential and commercial secured mortgage loans in its Northeastern Pennsylvania market area. Approximately 2% of the loan portfolio was comprised of loans to entities located outside our market area.
At December 31, 2010, the loan portfolio was comprised of approximately $285.4 million or 46.4% of fixed rate loans and $329.7 million or 53.6% of adjustable rate loans.
LOANS
Total net loans increased $10.9 million or 1.8% to $608.6 million at December 31, 2010 from $597.7 million at December 31, 2009.
Total net loans increased $161.8 million or 37.1% to $597.7 million at December 31, 2009 from $435.9 million at December 31, 2008. This increase is primarily due to the acquisition of the Old Forge Bank loan portfolio of $159.9 million.
LOAN QUALITY
The lending activities of the Company are guided by the comprehensive lending policy established by the Board of Directors. Loans must meet certain criteria relating to the character, capacity and capital of the borrower, collateral provided for the loan, and prevailing economic conditions. Due to the consistent application of conservative underwriting standards, the Company’s loan quality has remained strong during the current general economic downturn.
Regardless of credit standards, there is risk of loss inherent in every loan portfolio. The allowance for loan losses is an amount that management believes will be adequate to absorb probable losses on existing loans that may become uncollectible, based on evaluations of the collectibility of the loans. The evaluations take into consideration such factors as change in the nature and volume of the loan portfolio, overall portfolio quality, review of specific problem loans, industry experience, collateral value and current economic conditions that may affect the borrower’s ability to pay. Management believes that the allowance for loan losses is adequate. While management uses available information to estimate probable losses on loans, future additions to the allowance may be necessary based on changes in economic conditions. In addition, various regulatory agencies, as an integral part of their examination process, periodically review the Company’s allowance for loan losses. Such agencies may require the Company to recognize additions to the allowance based on their judgment of information available to them at the time of their examination.
The allowance for loan losses is increased by periodic charges against earnings as a provision for loan losses, and decreased periodically by charge-offs of loans (or parts of loans) management has determined to be uncollectible, net of actual recoveries on loans previously charged-off.
The allowance for loan loss as a percentage of loans was 1.06% at December 31, 2010, compared to 1.04% at December 31, 2009.
43
NON-PERFORMING ASSETS
Non-performing assets consist of non-accrual loans and other real estate owned. The following table sets forth information regarding non-performing assets and loans past due 90 days or more and still accruing interest as of the dates indicated:
| As of: |
2010 | 2009 | 2008 | 2007 | 2006 | |||||||||||||||
| Non-accrual loans |
||||||||||||||||||||
| Residential real estate |
$ | 1,579 | $ | 1,273 | $ | 290 | $ | 408 | $ | 223 | ||||||||||
| Commercial real estate |
1,385 | 672 | 808 | 249 | 2,782 | |||||||||||||||
| Commercial loans |
977 | 199 | 201 | 949 | 175 | |||||||||||||||
| Consumer loans |
93 | 195 | 155 | 4 | — | |||||||||||||||
| Total non-performing loans |
$ | 4,034 | $ | 2,339 | $ | 1,454 | $ | 1,610 | $ | 3,180 | ||||||||||
| Other real estate owned |
803 | 405 | — | — | — | |||||||||||||||
| Total non-performing assets |
$ | 4,837 | $ | 2,744 | $ | 1,454 | $ | 1,610 | $ | 3,180 | ||||||||||
| Loans past due 90 days or more and accruing: |
||||||||||||||||||||
| Secured by real estate |
$ | 1,236 | $ | 1,456 | $ | 810 | $ | 57 | $ | 177 | ||||||||||
| Guaranteed student loans |
268 | 218 | 203 | 408 | 251 | |||||||||||||||
| Credit card loans |
20 | 9 | 17 | 2 | 6 | |||||||||||||||
| Commercial loans |
100 | — | 119 | — | — | |||||||||||||||
| Consumer loans |
6 | 14 | 4 | 12 | — | |||||||||||||||
| Total loans past due 90 days or more and accruing |
$ | 1,630 | $ | 1,697 | $ | 1,153 | $ | 479 | $ | 434 | ||||||||||
| Ratios: |
||||||||||||||||||||
| Non-performing loans to period end loans |
0.66 | % | 0.39 | % | 0.33 | % | 0.40 | % | 0.86 | % | ||||||||||
| Total loans past due 90 days or more and accruing to period end loans |
0.27 | % | 0.28 | % | 0.26 | % | 0.12 | % | 0.12 | % | ||||||||||
| Non-performing assets to period end assets |
0.53 | % | 0.31 | % | 0.23 | % | 0.28 | % | 0.56 | % | ||||||||||
Loans are generally placed on a non-accrual status when principal or interest is past due 90 days and when payment in full is not anticipated. When a loan is placed on non-accrual status, all interest previously accrued but not collected is charged against current income. Loans are returned to accrual status when past due interest is collected and the collection of future principal and interest is probable.
During the second quarter of 2008, the Company was notified that The Education Resources Institute, Inc. (TERI), a guarantor of a portion of our student loan portfolio, had filed for reorganization under Chapter 11 of the Federal Bankruptcy Act. Currently, the Company had $7,395 of TERI loans out of a total student loan portfolio of $16,493. The Company does not anticipate that TERI’s bankruptcy filing will significantly impact the Company’s financial statements. These loans are placed on non-accrual status when they become more than 90 days past due. At December 31, 2010 there was $60 of such loans placed on non-accrual status.
Loans on which the accrual of interest has been discontinued or reduced amounted to $4,034, $2,339 and $1,454 at December 31, 2010, 2009 and 2008, respectively. The 2010 increase can be attributed primarily to three borrowers. In each case the Bank has taken a charge-off or provided a specific reserve as reflected in the current recorded loan balance in the applicable financial statements. If interest on those loans had been accrued, such income would have been $219, $90 and $192 for 2010, 2009 and 2008, respectively. Interest income on those loans, which is recorded only when received, amounted to $104, $52 and $29 for 2010, 2009 and 2008, respectively. There are no commitments to lend additional funds to individuals whose loans are in non-accrual status.
Real estate loans of $1,236 that are past due 90 days or more and still accruing are primarily 1-4 family residential loans with favorable loan-to-value ratios and in the process of collection.
Management’s process for evaluating the adequacy of the allowance for loan losses includes reviewing each month’s loan committee reports which list all loans that do not meet certain internally developed criteria as to collateral adequacy, payment performance, economic conditions and overall credit risk. These reports also address the current status and actions in process on each listed loan. From this information, adjustments are made to the allowance for loan losses. Such adjustments include both specific loss allocation amounts and general provisions by loan category based on present and past collection experience, nature and volume of the loan portfolio, overall portfolio quality, and current economic conditions that may affect the borrower’s ability to pay. Please see the discussion of our allowance for loan losses methodology under the heading “Management’s Discussion & Analysis—Provision for Loan Losses”.
44
As of December 31, 2010, the Company had total impaired loans of $4,493. Management performed an evaluation of expected future cash flows, including the anticipated cash flow from the sale of collateral, and compared that to the carrying amount of the impaired loans. Based on these evaluations, the Company has determined that a reserve of $1,415 is required against impaired loans at December 31, 2010.
At December 31, 2009 and 2008, the Company did not have any loans classified as impaired.
Most of the Company’s lending activity is with customers located in the Company’s geographic market area and repayment thereof is affected by economic conditions in this market area.
Our non-performing loans increased from $2,339 at December 31, 2009 to $4,034 at December 31, 2010. As of December 31, 2009, our non-performing loans were comprised of thirty-six loans of which eleven loans were in excess of one hundred thousand dollars in size and the remainder of which were less than one hundred thousand dollars each. As of December 31, 2010, our non-performing loans were comprised of forty-six loans of which thirteen loans are in excess of one hundred thousand dollars and the remainder of which are less than one hundred thousand dollars. The increase in the non-performing loans can be attributed to the following factors: (1) the addition of a large land development credit and two commercial loans, (2) the continuing deterioration in the economic conditions both locally and regionally, and (3) the widely depressed housing and real estate construction market.
The decrease in asset quality has been addressed by maintaining an adequate loss allowance. As of December 31, 2010, the total of the allowance for loan losses was $6,500. The level of loan loss coverage reflects management’s conservative view of the local economic conditions and an appropriate increase in the allowance for loan losses. As a result of the economic conditions in our market area and the increase in non-performing loans, management has undertaken the following actions beginning in 2009:
| • | Adjusted the credit policy in 2009 to lower the maximum loan-to-value ratios on commercial real estate loans and certain consumer loans; |
| • | Hired a former bank examiner in February 2010 to perform loan reviews on a full time basis and to enhance our allowance for loan loss methodology for implementation in the third quarter of 2010 which did not have any appreciable impact on the required level on loan loss allowance; |
| • | Contracted with a credit professional in March 2010 to assess the soundness of the small business underwriting function as well as the appropriateness of the Company’s established methodology for determining the allowance for loan losses; |
| • | As a result of the local and national weakness in the real estate industry, and to mitigate or prevent loan loss, the Bank orders a current appraisal of the collateral securing such loan after it is 90 days delinquent to assess the current loan to value ratio. |
45
LOAN LOSS EXPERIENCE
The following table presents the Company’s loan loss experience during the periods indicated:
| Years Ended December 31, |
2010 | 2009 | 2008 | 2007 | 2006 | |||||||||||||||
| Balance at beginning of year |
$ | 6,300 | $ | 5,275 | $ | 4,700 | $ | 4,200 | $ | 3,800 | ||||||||||
| Charge-offs: |
||||||||||||||||||||
| Residential real estate mortgages |
213 | 161 | 83 | — | 74 | |||||||||||||||
| Commercial real estate and all others |
1,138 | 798 | — | 94 | 18 | |||||||||||||||
| Credit card and related plans |
97 | 71 | 55 | 66 | 49 | |||||||||||||||
| Installment loans |
390 | 270 | 179 | 5 | 26 | |||||||||||||||
| Total charge-offs |
1,838 | 1,300 | 317 | 165 | 167 | |||||||||||||||
| Recoveries: |
||||||||||||||||||||
| Residential real estate mortgages |
19 | 42 | — | — | — | |||||||||||||||
| Commercial real estate and all others |
1 | — | 14 | 6 | 131 | |||||||||||||||
| Credit card and related plans |
3 | 1 | 16 | 1 | 3 | |||||||||||||||
| Installment loans |
16 | 22 | 1 | 1 | — | |||||||||||||||
| Total recoveries |
39 | 65 | 31 | 8 | 134 | |||||||||||||||
| Net charge-offs |
1,799 | 1,235 | 286 | 157 | 33 | |||||||||||||||
| Provision charged to operations |
1,999 | 2,260 | 861 | 657 | 433 | |||||||||||||||
| Balance at End of Year |
$ | 6,500 | $ | 6,300 | $ | 5,275 | $ | 4,700 | $ | 4,200 | ||||||||||
| Ratio of net charge-offs to average loans outstanding |
0.30 | % | 0.22 | % | 0.07 | % | 0.04 | % | 0.01 | % | ||||||||||
The allowance for loan losses at December 31, 2010 was $6,500 or 1.06% of total loans compared to $6,300 or 1.04% of total loans at December 31, 2009.
The 2010 increase can be attributed primarily to two borrowers. In each case the Bank has taken a charge-off or provided a specific reserve, based on current appraisals, and the current recorded loan balance reflects those actions.
The overwhelming majority of commercial loans and real estate mortgages charged-off during 2009 were comprised of one and two borrowing relationships, respectively.
The allowance for loan losses is allocated as follows:
| 2010 | 2009 | 2008 | 2007 | 2006 | ||||||||||||||||||||||||||||||||||||
| December 31, |
Amount | %(1) | Amount | %(1) | Amount | %(1) | Amount | %(1) | Amount | %(1) | ||||||||||||||||||||||||||||||
| Residential real estate |
$ | 800 | 48 | % | $ | 1,200 | 51 | % | $ | 1,200 | 59 | % | $ | 1,200 | 58 | % | $ | 1,200 | 56 | % | ||||||||||||||||||||
| Commercial real estate and all others |
4,000 | 40 | 4,000 | 37 | 3,275 | 33 | 2,900 | 34 | 2,500 | 36 | ||||||||||||||||||||||||||||||
| Credit card and related plans |
350 | 1 | 350 | 1 | 300 | 1 | 300 | 1 | 250 | 1 | ||||||||||||||||||||||||||||||
| Personal installment loans |
1,350 | 11 | 750 | 11 | 500 | 7 | 300 | 7 | 250 | 7 | ||||||||||||||||||||||||||||||
| Total |
$ | 6,500 | 100 | % | $ | 6,300 | 100 | % | $ | 5,275 | 100 | % | $ | 4,700 | 100 | % | $ | 4,200 | 100 | % | ||||||||||||||||||||
(1) - Percent of loans in each category to total loans
DEPOSITS
| December 31, |
2010 | 2009 | 2008 | |||||||||
| Demand – Non-interest bearing |
$ | 113,391 | $ | 109,855 | $ | 72,456 | ||||||
| Demand – Interest bearing |
70,989 | 72,477 | 51,975 | |||||||||
| Savings |
113,382 | 110,994 | 74,907 | |||||||||
| Money markets |
144,206 | 146,189 | 115,811 | |||||||||
| Time – Over $100,000 |
85,404 | 78,702 | 37,960 | |||||||||
| Time – Other |
163,660 | 127,217 | 71,616 | |||||||||
| Total Deposits |
$ | 691,032 | $ | 645,434 | $ | 424,725 | ||||||
46
The maturities of time deposits of $100,000 or more at December 31, 2010 are as follows:
| Three months or less |
$ | 21,255 | ||
| Over three months through six months |
10,795 | |||
| Over six months through twelve months |
30,228 | |||
| Over twelve months |
23,126 | |||
| Total |
$ | 85,404 | ||
As of December 31, 2010, the Company had Certificate of Deposit Account Registry Service (“CDARS”) reciprocal deposits in the amount of $22.1 million. The Company also issues brokered certificates of deposit; the balance of this funding as of December 31, 2010 was $49.5 million. The brokered certificates of deposit issued were generally a low cost alternative to wholesale funding with the majority offered having a call feature optionality not provided by wholesale funding. As of December 31, 2010, the dollar amount of total brokered deposits, exclusive of CDARS reciprocal deposits, was $51.3 million or 7.4% of total deposits, compared to $1.8 million or 0.3% at December 31, 2009 and $1.8 million or 0.4% at December 31, 2008.
Increases in deposits for 2010 can be primarily attributed to the Company’s issuance of brokered certificates of deposit totaling $49.5 million at December 31, 2010 and increased CDARS reciprocal deposits.
The Company is largely dependent on its core deposit base to fund operations. Management has competitively priced its deposit products in checking, savings, money market and time deposits to provide a stable source of funding.
As general interest rates in the economy change, some deposits migrate towards investment with higher anticipated yields.
The primary source of funds to support the Company’s operations is its deposit base. Company deposits increased $220.7 million to $645.4 million at December 31, 2009 from $424.7 million at December 31, 2008. Largely, the Company experienced growth in transaction accounts and time deposits due to the acquisition of Old Forge Bank accounts of $177.0 million at April 1, 2009, as well as growth from increased marketing efforts.
DIVIDEND POLICY
Payment of future dividends will be subject to the discretion of the Board of Directors and will depend upon the earnings of the Company, its financial condition, capital requirements, need for funds and other matters as the Board deems appropriate.
Dividends on the Company common stock, if approved by the Board of Directors, are customarily paid on or about March 15, June 15, September 15 and December 15.
ASSET/LIABILITY MANAGEMENT
The Company’s policy is to match its level of rate-sensitive assets and rate-sensitive liabilities within a limited range, thereby reducing its exposure to interest rate fluctuations. While no single measure can completely identify the impact of changes in interest rates on net interest income, one gauge of interest rate-sensitivity is to measure, over a variety of time periods, the differences in the amounts of the Company’s rate-sensitive assets and rate-sensitive liabilities. These differences, or “gaps”, provide an indication of the extent to which net interest income may be affected by future changes in interest rates. A positive gap exists when rate-sensitive assets exceed rate-sensitive liabilities and indicates that a greater volume of assets than liabilities will reprise during a given period. This mismatch may enhance earnings in a rising interest rate environment and may inhibit earnings when interest rates decline. Conversely, when rate-sensitive liabilities exceed rate-sensitive assets, referred to as a negative gap, it indicates that a greater volume of liabilities than assets may reprise during the period. In this case, a rising interest rate environment may inhibit earnings and declining interest rates may enhance earnings. However, because interest rates for different asset and liability products offered by financial institutions respond differently, the gap is only a general indicator of interest rate sensitivity.
LIQUIDITY
The objective of liquidity management is to maintain a balance between sources and uses of funds in such a way that the cash requirements of customers for loans and deposit withdrawals are met in the most economical manner. Management monitors its liquidity position continuously in relation to trends of loans and deposits for short-term as well as long-term requirements. Liquid assets are monitored on a daily basis to assure maximum utilization. Management also manages its liquidity requirements by maintaining an adequate level of readily marketable assets and access to short-term funding sources. Management does not foresee any adverse trends in liquidity.
47
The Company remains in a highly liquid condition both in the short and long term. Sources of liquidity include the Company’s U.S. Agency bond portfolios, additional deposits, earnings, overnight loans to and from other companies (Federal Funds) and lines of credit at the Federal Reserve Bank and the Federal Home Loan Bank (FHLB). The Company is not a party to any commitments, guarantees or obligations that could materially affect its liquidity.
The Company offers collateralized repurchase agreements, which have a one day maturity, as an alternative deposit option for its customers. The repurchase agreements are accounted for as a collateralized borrowing with a one day maturity and are collateralized by U.S. Agency securities. The Company also has long-term debt outstanding to the FHLB, which was used to purchase a Freddie Mac pool of residential mortgages. At December 31, 2010 the Company had $238,106 of available borrowing capacity with the FHLB, a Borrower-In-Custody (BIC) line of credit of $20,325 with the Federal Reserve Bank of Philadelphia, available borrowing capacity at the Discount Window of $34,646, an overnight Federal funds line of credit of $19,000 with PNC Bank and an overnight Federal funds line of credit of $5,000 with Wells Fargo.
The Company is a separate legal entity from the Bank and must provide for its own liquidity. In addition to its operating expenses, the Company is responsible for paying any dividends declared to its shareholders. The Company’s primary source of income is dividends received from the Bank. The amount of dividends that the Bank may declare and pay to the Company is generally restricted under Pennsylvania law to the retained earnings of the Bank.
COMMITMENTS AND CONTINGENT LIABILITIES
In the normal course of business, there are outstanding commitments and contingent liabilities, created under prevailing terms and collateral requirements such as commitments to extend credit, financial guarantees and letters of credit, which are not reflected in the accompanying Financial Statements. The Company does not anticipate any losses as a result of these transactions. These instruments involve, to varying degrees, elements of credit and interest rate risk in excess of the amount recognized in the Balance Sheets.
The contract or notional amounts of those instruments reflect the extent of involvement the Company has in particular classes of financial instruments.
Financial instruments whose contract amounts represent credit risk at December 31, 2010 and 2009 are as follows:
| 2010 | 2009 | |||||||
| Commitments to extend credit: |
||||||||
| Fixed rate |
$ | 53,011 | $ | 39,576 | ||||
| Variable rate |
$ | 96,036 | $ | 87,454 | ||||
| Standby letters of credit |
$ | 15,969 | $ | 16,091 | ||||
Commitments to extend credit are agreements to lend to a customer as long as there is no violation of any condition established in the contract. Commitments generally have expiration dates of one year or less or other termination clauses and may require payment of a fee. Since many of the commitments are expected to expire without being drawn upon, the total commitment amounts do not necessarily represent future cash requirements.
Standby letters of credit are conditional commitments issued to guarantee the performance of a customer to a third party. The credit risk involved in issuing letters of credit is essentially the same as that involved in extending loan facilities to customers.
During 2010 the Bank had executed purchase agreements in the amount of one million dollars for land in Scranton, Pennsylvania, to be used for construction of a new branch facility. The Bank has received regulatory approval for the establishment of this new branch office.
RELATED PARTIES
The Company does not have any material transactions involving related persons or entities, other than traditional banking transactions, which are made on the same terms and conditions as those prevailing at the time for comparable transactions with unrelated parties. At December 31, 2010, the Bank has issued standby letters of credit for the accounts of related parties in the amount of $7,785.
48
CAPITAL RESOURCES
A strong capital position is important to the continued profitability of the Company and promotes depositor and investor confidence. The Company’s capital provides a basis for future growth and expansion and also provides additional protection against unexpected losses.
Additional sources of capital would come from retained earnings from the operations of the Company and from the sale of additional shares of common stock. Management has no plans to offer additional shares of common stock at this time.
The Company’s total risk-based capital ratio was 16.42% at December 31, 2010. The Company’s risk-based capital ratio is more than the 10.00% ratio that Federal regulators use as the “well capitalized” threshold under the Federal prompt corrective action regulations. This is the current criteria which the FDIC uses in determining the lowest insurance rate for deposit insurance. The Company’s risk-based capital ratio is more than double the 8.00% minimum threshold, which determines whether a company is “adequately capitalized”. Under these rules, the Company could significantly increase its assets and still comply with these capital requirements without the necessity of increasing its equity capital.
The following table presents Stockholders’ Equity of the Company for the past two years:
| Years Ended December 31, |
2010 | 2009 | ||||||
| Balance at beginning of year |
$ | 117,397 | $ | 73,642 | ||||
| Fair value of consideration exchanged in merger |
— | 38,058 | ||||||
| Net income |
11,722 | 8,372 | ||||||
| Other comprehensive income |
(1,693 | ) | 2,356 | |||||
| Cash dividends declared |
(5,504 | ) | (5,031 | ) | ||||
| Total Stockholders’ Equity |
$ | 121,922 | $ | 117,397 | ||||
Non-GAAP Financial Measures
Core Earnings Calculation
Certain financial measures for 2009 contained in this Form 10-K exclude costs related to the Company’s acquisition of Old Forge Bank on April 1, 2009.
Merger costs of $1,550 for the year ended December 31, 2009, related to the merger with Old Forge Bank, consist primarily of investment banking costs, system conversion costs, valuation services, legal and accounting fees and severance payments.
In March 2008, VISA, Inc. (VISA) completed its initial public offering. The Bank and certain other VISA member banks are shareholders in VISA. Following the initial public offering, the Company received $1.2 million in proceeds from the offering, as a mandatory partial redemption of 28,351 shares, reducing the Company’s holdings from 73,333 to 44,982 shares of Class B common stock. Using proceeds from this offering, VISA established a $3.0 billion escrow account to cover the resolution of pending litigation and related claims. The partial redemption proceeds of $1.2 million are reflected in other non-interest income in the first quarter of 2008.
The remaining unredeemed shares of VISA Class B common stock are restricted and may not be transferred until the later of (1) three years from the date of the initial public offering or (2) the period of time necessary to resolve the covered litigation. The current conversion ratio of 0.5824 was established for the conversion rate of Class B shares into Class A shares. If the funds in the escrow account are insufficient to settle all the covered litigation, VISA may sell additional Class A shares, use the proceeds to settle litigation, and further reduce the conversion ratio. If funds remain in the escrow account after all litigation is settled, the Class B conversion ratio will be increased to reflect that surplus. As of December 31, 2009, the value of the Class A shares was $87.46 per share. The value of unredeemed Class A equivalent shares owned by the Company was $2.3 million as of December 31, 2009, and has not yet been reflected in the accompanying financial statements.
In connection with VISA’s establishment of the litigation escrow account, the Company reversed a $497 accrual in the first quarter of 2008, reflected as a reduction of other non-interest expense. This reserve was created in the fourth quarter of 2007, pending completion of the VISA, Inc. initial public offering as a charge to other non-interest expense.
49
Financial measures which exclude the above referenced items have not been determined in accordance with generally accepted accounting principles (“GAAP”) and are therefore non-GAAP financial measures. Management of the Company believes that investors’ understanding of the Company’s performance is enhanced by disclosing these non-GAAP financial measures as a reasonable basis for comparison of the Company’s ongoing results of operations. These non-GAAP measures should not be considered a substitute for GAAP-basis measures and results. Our non-GAAP measures may not be comparable to non-GAAP measures of other companies. The Non-GAAP Reconciliation Schedule provides a disclosure of these non-GAAP financial measures to the most closely analogous measure determined in accordance with GAAP.
The following tables present the reconciliation of non-GAAP financial measures to reported GAAP financial measures.
| Years Ended December 31, | ||||||||||||
| 2010 | 2009 | Change | ||||||||||
| Net interest income after provision for loan losses |
$ | 31,390 | $ | 28,311 | $ | 3,079 | ||||||
| Non-interest income |
12,152 | 10,369 | 1,783 | |||||||||
| Non-interest expense |
(28,453 | ) | (28,420 | ) | (33 | ) | ||||||
| Income tax benefit (provision) |
(3,367 | ) | (1,888 | ) | (1,479 | ) | ||||||
| Net income |
11,722 | 8,372 | 3,350 | |||||||||
| Adjustments |
||||||||||||
| Non-interest expense |
||||||||||||
| Merger related costs |
— | 1,550 | (1,550 | ) | ||||||||
| Total Adjustments pre-tax |
— | 1,550 | (1,550 | ) | ||||||||
| Income tax provision (benefit) (25% 1/34% tax rate) |
— | 381 | (381 | ) | ||||||||
| After tax adjustments to GAAP |
— | 1,169 | (1,169 | ) | ||||||||
| Adjusted net income |
$ | 11,722 | $ | 9,541 | $ | 2,181 | ||||||
| Return on Average Assets |
1.32 | % | 1.18 | % | ||||||||
| Return on Average Equity |
9.74 | % | 9.03 | % | ||||||||
| Dividend Payout Ratio |
46.93 | % | 52.66 | % | ||||||||
Return on average equity (ROE) and return on average assets (ROA) for the year ended December 31, 2010 was 9.74% and 1.32%, respectively. ROE was 7.93% (9.03% excluding the Merger costs) and ROA was 1.04% (1.18% excluding the Merger costs) for the same period last year. The dividend payout ratio for December 31, 2010 was 46.93% and 60.00% (52.66% excluding the Merger costs) for the same period last year.
| Years Ended December 31, | ||||||||||||
| 2009 | 2008 | Change | ||||||||||
| Net interest income after provision for loan losses |
$ | 28,311 | $ | 22,207 | $ | 6,104 | ||||||
| Non-interest income |
10,369 | 11,036 | (667 | ) | ||||||||
| Non-interest expense |
(28,420 | ) | (22,172 | ) | (6,248 | ) | ||||||
| Income tax benefit (provision) |
(1,888 | ) | (2,458 | ) | 570 | |||||||
| Net income |
8,372 | 8,613 | (241 | ) | ||||||||
| Adjustments |
||||||||||||
| Non-interest income |
||||||||||||
| Gain on mandatory redemption of VISA, Inc. |
||||||||||||
| class B common stock |
— | (1,213 | ) | 1,213 | ||||||||
| Non-interest expense |
||||||||||||
| Merger related costs |
1,550 | — | 1,550 | |||||||||
| Covered litigation accrual |
— | (497 | ) | 497 | ||||||||
| Total Adjustments pre-tax |
1,550 | (1,710 | ) | 3,260 | ||||||||
| Income tax provision (benefit) (25% 2/34% tax rate) |
381 | (581 | ) | 962 | ||||||||
| After tax adjustments to GAAP |
1,169 | (1,129 | ) | 2,298 | ||||||||
| Adjusted net income |
$ | 9,541 | $ | 7,484 | $ | 2,057 | ||||||
| Return on Average Assets |
1.18 | % | 1.21 | % | ||||||||
| Return on Average Equity |
9.03 | % | 10.33 | % | ||||||||
| Dividend Payout Ratio |
52.66 | % | 47.70 | % | ||||||||
| 1 | Income tax effect calculation is 34% except for the portion of the merger costs that are non-deductible. |
| 2 | Income tax effect calculation is 34% except for the portion of the merger costs that are non-deductible. |
50
Return on average equity (ROE) and return on average assets (ROA) for the year ended December 31, 2009 was 7.93% (9.03% excluding the Merger costs) and 1.04% (1.18% excluding the Merger costs), respectively. ROE was 11.89% (10.33% excluding the VISA IPO impact) and ROA was 1.40% (1.21% excluding the VISA IPO impact) for the same period last year. The dividend payout ratio for December 31, 2009 was 60.00% (52.66% excluding the Merger costs) and was 41.40% (47.70% excluding the VISA IPO impact) for the same period last year.
Allowance for Loan Losses and Credit Fair Value Adjustment
The Company has provided for anticipated loan losses through the allowance for loan losses and a credit fair value adjustment on loans acquired thru the Merger, as shown below:
| December 31, 2010 |
December 31, 2009 |
|||||||
| Loans, net of unearned income |
$ | 615,105 | $ | 603,970 | ||||
| Credit fair value adjustment on purchased loans |
3,579 | 5,795 | ||||||
| Total adjusted loans |
$ | 618,684 | $ | 609,765 | ||||
| December 31, 2010 |
December 31, 2009 |
|||||||
| Allowance for loan losses |
$ | 6,500 | $ | 6,300 | ||||
| Credit fair value adjustment on purchased loans |
3,579 | 5,795 | ||||||
| Total allowance |
$ | 10,079 | $ | 12,095 | ||||
| Total allowance to adjusted loans |
1.63 | % | 1.98 | % | ||||
Management believes that the above information is useful to investors as to the Company’s evaluation of probable credit losses and its results of operations and financial condition.
| ITEM 7A | QUANTITATIVE AND QUALITATIVE DISCLOSURES ABOUT MARKET RISK |
The Company currently does not enter into derivative financial instruments, which include futures, forwards, interest rate swaps, option contracts and other financial instruments with similar characteristics. However, the Company is party to traditional financial instruments with off-balance sheet risk in the normal course of business to meet the financing needs of its customers. These financial instruments include commitments to extend credit, financial guarantees and letters of credit. These traditional instruments involve to varying degrees, elements of credit and interest rate risk in excess of the amount recognized in the Consolidated Balance Sheets.
Commitments to extend credit are agreements to lend to a customer as long as there is no violation of any condition established in the contract. Commitments generally have fixed expiration dates or other termination clauses and may require payment of a fee. Standby letters of credit are conditional commitments issued to guarantee the performance of a customer to a third party up to a stipulated amount and with specified terms and conditions.
Commitments to extend credit and standby letters of credit are not recorded as an asset or liability by the Company until the instrument is exercised.
The Company’s exposure to market risk is reviewed on a regular basis by the Asset/Liability Committee. Interest rate risk is the potential of economic losses due to future interest rate changes. These economic losses can be reflected as a loss of future net interest income and/or a loss of current fair market values. The objective is to measure the effect on net interest income and to adjust the balance sheet to minimize the inherent risk while at the same time maximizing income. Management realizes certain risks are inherent and that the goal is to identify and minimize the risks. Tools used by management include the standard GAP report and an interest rate shock simulation report. The Company has no market risk sensitive instruments held for trading purposes. It appears the Company’s market risk is reasonable at this time.
The following table provides information about the Company’s market rate sensitive instruments used for purposes other than trading that are sensitive to changes in interest rates. For loans, securities, and liabilities with contractual maturities, the table presents principal cash flows and related weighted-average interest rates by contractual maturities as well as the Company’s historical experience of the impact of interest rate fluctuations on the prepayment of residential and home equity loans and mortgage-backed securities. For core deposits (e.g., DDA, interest checking, savings and money market deposits) that have no contractual maturity, the table presents principal cash flows and, as applicable, related weighted-average interest rates based on the Company’s historical experience, management’s judgment, and statistical analysis, as applicable, concerning their most likely withdrawal behaviors.
51
MATURITIES AND SENSITIVITY OF MARKET RISK AS OF DECEMBER 31, 2010
The table below presents States and political subdivisions securities on a fully taxable equivalent basis.
| 2011 | 2012 | 2013 | 2014 | 2015 | Thereafter | Non-Rate Sensitive |
Total | Fair Value |
||||||||||||||||||||||||||||
| Assets |
||||||||||||||||||||||||||||||||||||
| Fixed interest rate securities: |
||||||||||||||||||||||||||||||||||||
| U.S. Agency obligations |
$ | 25,628 | $ | 32,364 | $ | 23,718 | $ | 15,660 | $ | 14,739 | $ | 16,720 | $ | — | $ | 128,829 | $ | 129,961 | ||||||||||||||||||
| Yield |
3.04 | % | 2.16 | % | 1.90 | % | 2.09 | % | 1.72 | % | 3.53 | % | — | 2.48 | % | — | ||||||||||||||||||||
| State & political subdivisions |
15,913 | 7,296 | 5,838 | 3,079 | 3,073 | 42,229 | — | 77,428 | 77,762 | |||||||||||||||||||||||||||
| Yield |
7.23 | % | 7.67 | % | 6.78 | % | 6.66 | % | 6.57 | % | 6.91 | % | — | 7.01 | % | — | ||||||||||||||||||||
| Corporate Securities |
3,075 | 1,015 | — | — | — | — | — | 4,090 | 4,090 | |||||||||||||||||||||||||||
| Yield |
.94 | % | 1.65 | % | — | — | — | — | — | 1.12 | % | — | ||||||||||||||||||||||||
| Variable interest rate securities: |
||||||||||||||||||||||||||||||||||||
| U.S. Agency obligations |
5,712 | — | — | — | — | — | — | 5,712 | 5,717 | |||||||||||||||||||||||||||
| Yield |
2.25 | % | — | — | — | — | — | — | 2.25 | % | — | |||||||||||||||||||||||||
| Other |
985 | — | — | — | — | — | — | 985 | 985 | |||||||||||||||||||||||||||
| Yield |
.89 | % | — | — | — | — | — | — | .89 | % | — | |||||||||||||||||||||||||
| Fixed interest rate loans: |
||||||||||||||||||||||||||||||||||||
| Real estate mortgages |
50,704 | 40,963 | 35,279 | 26,665 | 19,843 | 29,536 | — | 202,990 | 212,242 | |||||||||||||||||||||||||||
| Yield |
6.04 | % | 6.04 | % | 5.99 | % | 5.95 | % | 5.93 | % | 5.56 | % | — | 5.94 | % | — | ||||||||||||||||||||
| Commercial |
12,275 | 6,113 | 2,871 | 3,875 | 6,756 | 10,589 | — | 42,479 | 43,811 | |||||||||||||||||||||||||||
| Yield |
5.59 | % | 6.05 | % | 6.16 | % | 6.44 | % | 3.59 | % | 6.25 | % | — | 5.62 | % | — | ||||||||||||||||||||
| Consumer and other |
16,723 | 9,795 | 6,788 | 3,520 | 950 | 3,054 | — | 40,830 | 41,566 | |||||||||||||||||||||||||||
| Yield |
6.45 | % | 7.02 | % | 6.75 | % | 6.37 | % | 5.73 | % | 5.35 | % | — | 6.53 | % | — | ||||||||||||||||||||
| Variable interest rate loans: |
||||||||||||||||||||||||||||||||||||
| Real estate mortgages |
120,126 | 31,670 | 31,372 | 19,935 | 16.827 | 5.991 | — | 225,921 | 227,685 | |||||||||||||||||||||||||||
| Yield |
4.56 | % | 5.86 | % | 5.78 | % | 5.40 | % | 5.87 | % | 5.75 | % | — | 5.12 | % | — | ||||||||||||||||||||
| Commercial |
68,743 | 4,667 | 2,701 | 3,781 | 5,543 | 500 | — | 85,935 | 84,518 | |||||||||||||||||||||||||||
| Yield |
4.20 | % | 6.90 | % | 5.67 | % | 5.63 | % | 5.61 | % | 5.62 | % | — | 4.80 | % | — | ||||||||||||||||||||
| Consumer and other |
16,950 | — | — | — | — | — | — | 16,950 | 16,718 | |||||||||||||||||||||||||||
| Yield |
4.99 | % | — | — | — | — | — | — | 4.99 | % | — | |||||||||||||||||||||||||
| Less: Allowance for loan losses |
— | — | — | — | — | 6,500 | — | 6,500 | — | |||||||||||||||||||||||||||
| Federal Home Loan Bank stock |
— | — | — | — | — | — | 6,082 | 6,082 | 6,082 | |||||||||||||||||||||||||||
| Yield |
— | — | — | — | — | — | — | — | — | |||||||||||||||||||||||||||
| Interest bearing balances with banks |
2,634 | — | — | — | — | — | — | 2,634 | 2,634 | |||||||||||||||||||||||||||
| Yield |
.30 | % | — | — | — | — | — | — | .03 | % | — | |||||||||||||||||||||||||
| Cash surrender life insurance |
15,380 | — | — | — | — | — | — | 15,380 | 15,380 | |||||||||||||||||||||||||||
| Yield |
3.37 | % | — | — | — | — | — | — | 3.37 | % | — | |||||||||||||||||||||||||
| Cash and due from banks |
— | — | — | — | — | — | 11,585 | 11,585 | 11,585 | |||||||||||||||||||||||||||
| Goodwill |
— | — | — | — | — | — | 26,398 | 26,398 | — | |||||||||||||||||||||||||||
| Other assets |
— | — | — | — | — | — | 28,359 | 28,359 | — | |||||||||||||||||||||||||||
| Total Assets |
$ | 354,848 | $ | 133,883 | $ | 108,567 | $ | 76,515 | $ | 67,731 | $ | 102,119 | $ | 72,424 | $ | 916,087 | $ | 880,736 | ||||||||||||||||||
| LIABILITIES AND STOCKHOLDERS’ EQUITY |
| |||||||||||||||||||||||||||||||||||
| Variable interest rate deposits: |
||||||||||||||||||||||||||||||||||||
| Demand-Interest bearing |
$ | 16,324 | $ | — | $ | — | $ | — | $ | — | $ | 54,665 | $ | — | $ | 70,989 | $ | 70,989 | ||||||||||||||||||
| Yield |
1.15 | % | — | — | — | — | .23 | % | — | .44 | % | — | ||||||||||||||||||||||||
| Savings |
10,890 | — | — | — | — | 102,492 | — | 113,382 | 113,382 | |||||||||||||||||||||||||||
| Yield |
.36 | % | — | — | — | — | .26 | % | — | .27 | % | — | ||||||||||||||||||||||||
| Money markets |
144,206 | — | — | — | — | — | — | 144,206 | 144,206 | |||||||||||||||||||||||||||
| Yield |
.58 | % | — | — | — | — | — | — | .58 | % | — | |||||||||||||||||||||||||
| Fixed interest rate deposits: |
||||||||||||||||||||||||||||||||||||
| Time-Over $100,000 |
59,914 | 8,781 | 4,827 | 4,576 | 6,502 | 804 | — | 85,404 | 86,335 | |||||||||||||||||||||||||||
| Yield |
1.48 | % | 2.13 | % | 2.50 | % | 3.00 | % | 2.65 | % | 3.06 | % | — | 1.83 | % | — | ||||||||||||||||||||
| Time-Other |
108,615 | 34,670 | 7,060 | 5,763 | 5,739 | 1,813 | — | 163,660 | 165,444 | |||||||||||||||||||||||||||
| Yield |
1.31 | % | 1.58 | % | 2.76 | % | 3.26 | % | 2.74 | % | 2.24 | % | — | 1.55 | % | — | ||||||||||||||||||||
| Demand-Non interest bearing |
— | — | — | — | — | — | 113,391 | 113,391 | 113,391 | |||||||||||||||||||||||||||
| Repurchase agreements |
19,394 | — | — | — | — | — | — | 19,394 | 19,394 | |||||||||||||||||||||||||||
| Yield |
.50 | % | — | — | — | — | — | — | .50 | % | — | |||||||||||||||||||||||||
| Short-term borrowings |
8,688 | — | — | — | — | — | — | 8,688 | 8,688 | |||||||||||||||||||||||||||
| Yield |
.67 | % | — | — | — | — | — | — | .67 | % | — | |||||||||||||||||||||||||
| Long-term borrowings |
11,228 | 11,116 | 11,230 | 4,840 | 11,204 | 19,217 | — | 68,835 | 71,309 | |||||||||||||||||||||||||||
| Yield |
3.57 | % | 3.66 | % | 3.68 | % | 3.64 | % | 3.12 | % | 3.89 | % | — | 3.62 | % | — | ||||||||||||||||||||
| Other liabilities |
— | — | — | — | — | — | 6,216 | 6,216 | — | |||||||||||||||||||||||||||
| Stockholders’ equity |
— | — | — | — | — | — | 121,922 | 121,922 | — | |||||||||||||||||||||||||||
| Total Liabilities and Stockholders’ Equity |
$ | 379,259 | $ | 54,567 | $ | 23,117 | $ | 15,179 | $ | 23,445 | $ | 178,991 | $ | 241,529 | $ | 916,087 | $ | 793,138 | ||||||||||||||||||
| Excess of assets (liabilities) Subject to interest rate change |
$ | (24,411 | ) | $ | 79,316 | $ | 85,450 | $ | 61,336 | $ | 44,286 | $ | (76,872 | ) | $ | (169,105 | ) | $ | — | |||||||||||||||||
52
| ITEM 8 | FINANCIAL STATEMENTS AND SUPPLEMENTARY DATA |
(in thousands, except per share amounts)
Consolidated Balance Sheets
| December 31, |
2010 | 2009 | ||||||
| Cash and due from banks |
$ | 11,585 | $ | 11,100 | ||||
| Interest bearing balances with banks |
2,634 | 2,274 | ||||||
| Cash and Cash Equivalents |
14,219 | 13,374 | ||||||
| Investment securities: |
||||||||
| Available-for-sale, at fair value |
173,297 | 149,079 | ||||||
| Held-to-maturity (fair value of $45,218 and $49,054, respectively) |
43,747 | 46,851 | ||||||
| Total Investment Securities |
217,044 | 195,930 | ||||||
| Loans, net of unearned income |
615,105 | 603,970 | ||||||
| Less: Allowance for loan losses |
6,500 | 6,300 | ||||||
| Loans, Net |
608,605 | 597,670 | ||||||
| Bank premises and equipment |
13,406 | 12,396 | ||||||
| Other real estate owned |
803 | 528 | ||||||
| Accrued interest receivable |
3,809 | 4,317 | ||||||
| Goodwill |
26,398 | 26,398 | ||||||
| Cash surrender value of life insurance |
15,380 | 14,380 | ||||||
| Federal Home Loan Bank stock |
6,082 | 6,402 | ||||||
| Other assets |
10,341 | 11,932 | ||||||
| Total Assets |
$ | 916,087 | $ | 883,327 | ||||
| Deposits: |
||||||||
| Non-interest bearing |
$ | 113,391 | $ | 109,855 | ||||
| Interest bearing |
577,641 | 535,579 | ||||||
| Total Deposits |
691,032 | 645,434 | ||||||
| Other borrowed funds: |
||||||||
| Repurchase agreements |
19,394 | 18,168 | ||||||
| Short-term borrowings |
8,688 | 27,430 | ||||||
| Long-term borrowings |
68,835 | 68,094 | ||||||
| Accrued interest payable |
1,128 | 1,317 | ||||||
| Other liabilities |
5,088 | 5,487 | ||||||
| Total Liabilities |
794,165 | 765,930 | ||||||
| Common stock; $.01 par value, 15,000,000 shares authorized, 3,276,079 shares issued and outstanding |
33 | 33 | ||||||
| Surplus |
48,865 | 48,865 | ||||||
| Retained earnings |
74,304 | 68,086 | ||||||
| Accumulated other comprehensive income |
(1,280 | ) | 413 | |||||
| Total Stockholders’ Equity |
121,922 | 117,397 | ||||||
| Total Liabilities and Stockholders’ Equity |
$ | 916,087 | $ | 883,327 | ||||
The accompanying Notes are an integral part of these Consolidated Financial Statements.
53
Consolidated Statements of Income
| Years Ended December 31, |
2010 | 2009 | 2008 | |||||||||
| Interest and fees on loans |
$ | 34,633 | $ | 32,399 | $ | 26,218 | ||||||
| Interest and dividends on investments: |
||||||||||||
| U.S. Treasury securities and U.S. Agency obligations |
2,855 | 3,306 | 3,947 | |||||||||
| States & political subdivisions |
4,197 | 4,395 | 3,380 | |||||||||
| Other securities |
51 | 39 | 256 | |||||||||
| Interest on Federal funds sold |
— | — | 29 | |||||||||
| Interest on balances with banks |
9 | 12 | 68 | |||||||||
| Total Interest Income |
41,745 | 40,151 | 33,898 | |||||||||
| Interest on time deposits of $100,000 or more |
2,173 | 1,726 | 1,451 | |||||||||
| Interest on other deposits |
3,455 | 4,815 | 5,522 | |||||||||
| Interest on other borrowed funds |
2,728 | 3,039 | 3,857 | |||||||||
| Total Interest Expense |
8,356 | 9,580 | 10,830 | |||||||||
| Net Interest Income |
33,389 | 30,571 | 23,068 | |||||||||
| Provision for loan losses |
1,999 | 2,260 | 861 | |||||||||
| Net Interest Income After Provision for Loan Losses |
31,390 | 28,311 | 22,207 | |||||||||
| Trust department income |
1,493 | 1,392 | 1,474 | |||||||||
| Service charges on deposit accounts |
2,163 | 1,939 | 1,477 | |||||||||
| Merchant transaction income |
4,521 | 4,379 | 4,502 | |||||||||
| Brokerage fee income |
340 | 348 | 596 | |||||||||
| Cardholder discounts |
799 | 665 | 569 | |||||||||
| Other fee income |
771 | 727 | 710 | |||||||||
| Bank-owned life insurance |
538 | 470 | 316 | |||||||||
| Gain on sale of mortgage loans |
682 | 356 | 19 | |||||||||
| Other operating income |
287 | 7 | 148 | |||||||||
| VISA mandatory share redemption |
— | — | 1,213 | |||||||||
| Impairment losses on investment securities |
— | (787 | ) | — | ||||||||
| Realized gains on securities, net |
558 | 873 | 12 | |||||||||
| Total Non-Interest Income |
12,152 | 10,369 | 11,036 | |||||||||
| Salaries and employee benefits |
13,081 | 12,551 | 10,157 | |||||||||
| Expense of premises and equipment, net |
3,547 | 3,246 | 2,703 | |||||||||
| Merchant transaction expenses |
3,139 | 3,085 | 3,403 | |||||||||
| Merger related costs |
— | 1,550 | — | |||||||||
| FDIC insurance assessments |
1,150 | 968 | 59 | |||||||||
| Legal and professional expenses |
694 | 442 | (108 | ) | ||||||||
| Advertising expense |
605 | 409 | 603 | |||||||||
| Bank shares tax |
805 | 1,039 | 743 | |||||||||
| Outside services |
781 | 615 | 770 | |||||||||
| Director fees |
550 | 568 | 493 | |||||||||
| Other operating expenses |
4,101 | 3,947 | 3,349 | |||||||||
| Total Non-Interest Expenses |
28,453 | 28,420 | 22,172 | |||||||||
| Income before income taxes |
15,089 | 10,260 | 11,071 | |||||||||
| Applicable income taxes |
3,367 | 1,888 | 2,458 | |||||||||
| Net Income |
$ | 11,722 | $ | 8,372 | $ | 8,613 | ||||||
| Earnings Per Share |
$ | 3.58 | $ | 2.80 | $ | 4.01 | ||||||
The accompanying Notes are an integral part of these Consolidated Financial Statements.
54
Consolidated Statements of Stockholders’ Equity
| Years Ended December 31, 2010, 2009 and 2008 |
Common Stock |
Surplus | Retained Earnings |
Accumulated Other Comprehensive Income |
Total Stockholders’ Equity |
|||||||||||||||
| Balance, December 31, 2007 |
$ | 21 | $ | 10,819 | $ | 59,697 | $ | (822 | ) | $ | 69,715 | |||||||||
| Comprehensive income: |
||||||||||||||||||||
| Net income, 2008 |
— | — | 8,613 | — | 8,613 | |||||||||||||||
| Other comprehensive income, net of tax |
||||||||||||||||||||
| Unrealized losses on securities, net of reclassification adjustment |
— | — | — | (728 | ) | (728 | ) | |||||||||||||
| Unrealized losses on employee benefit plans, net |
— | — | — | (393 | ) | (393 | ) | |||||||||||||
| Other comprehensive income |
(1,121 | ) | (1,121 | ) | ||||||||||||||||
| Comprehensive income |
7,492 | |||||||||||||||||||
| Cash dividends declared ($1.66 per share) |
— | — | (3,565 | ) | — | (3,565 | ) | |||||||||||||
| Balance, December 31, 2008 |
21 | 10,819 | 64,745 | (1,943 | ) | 73,642 | ||||||||||||||
| Fair value of consideration exchanged in merger |
12 | 38,046 | — | — | 38,058 | |||||||||||||||
| Comprehensive income: |
||||||||||||||||||||
| Net income, 2009 |
— | — | 8,372 | — | 8,372 | |||||||||||||||
| Other comprehensive income, net of tax |
||||||||||||||||||||
| Unrealized gains on securities, net of reclassification adjustment |
— | — | — | 2,069 | 2,069 | |||||||||||||||
| Unrealized gains on employee benefit plans, net |
— | — | — | 287 | 287 | |||||||||||||||
| Other comprehensive income |
2,356 | 2,356 | ||||||||||||||||||
| Comprehensive income |
10,728 | |||||||||||||||||||
| Cash dividends declared ($1.68 per share) |
— | — | (5,031 | ) | — | (5,031 | ) | |||||||||||||
| Balance, December 31, 2009 |
33 | 48,865 | 68,086 | 413 | 117,397 | |||||||||||||||
| Comprehensive income: |
||||||||||||||||||||
| Net income, 2010 |
— | — | 11,722 | — | 11,722 | |||||||||||||||
| Other comprehensive income, net of tax |
||||||||||||||||||||
| Unrealized losses on securities, net of reclassification adjustment |
— | — | — | (1,195 | ) | (1,195 | ) | |||||||||||||
| Unrealized losses on employee benefit plans, net |
— | — | — | (498 | ) | (498 | ) | |||||||||||||
| Other comprehensive income |
(1,693 | ) | (1,693 | ) | ||||||||||||||||
| Comprehensive income |
10,029 | |||||||||||||||||||
| Cash dividends declared ($1.68 per share) |
— | — | (5,504 | ) | — | (5,504 | ) | |||||||||||||
| Balance, December 31, 2010 |
$ | 33 | $ | 48,865 | $ | 74,304 | $ | (1,280 | ) | $ | 121,922 | |||||||||
The accompanying Notes are an integral part of these Consolidated Financial Statements.
55
Consolidated Statements of Cash Flows
| Years Ended December 31, |
2010 | 2009 | 2008 | |||||||||
| Net income |
$ | 11,722 | $ | 8,372 | $ | 8,613 | ||||||
| Adjustments to reconcile net income to net cash provided by operating activities: |
||||||||||||
| Depreciation |
1,088 | 997 | 795 | |||||||||
| Provision for loan losses |
1,999 | 2,260 | 861 | |||||||||
| Deferred income tax provision |
737 | 60 | 244 | |||||||||
| Amortization of securities (net of accretion) |
464 | 486 | 317 | |||||||||
| Accretion of purchase accounting fair value adjustment (net of amortization) |
(913 | ) | (1,075 | ) | — | |||||||
| Gain on VISA mandatory share redemption |
— | — | (1,213 | ) | ||||||||
| Increase in cash surrender value of life insurance |
(538 | ) | (469 | ) | (316 | ) | ||||||
| Other-than-temporary impairment loss |
— | 787 | — | |||||||||
| Net realized gains on securities |
(558 | ) | (873 | ) | (12 | ) | ||||||
| (Gain) loss on other real estate |
(12 | ) | 25 | (69 | ) | |||||||
| Decrease in interest receivable |
508 | 206 | 40 | |||||||||
| Increase in other assets |
(570 | ) | (122 | ) | (350 | ) | ||||||
| Increase (decrease) in income taxes payable |
788 | (469 | ) | (565 | ) | |||||||
| Decrease in interest payable |
(189 | ) | (140 | ) | (380 | ) | ||||||
| Increase (decrease) in other liabilities |
11 | 493 | (484 | ) | ||||||||
| Net cash provided by operating activities |
14,537 | 10,538 | 7,481 | |||||||||
| Purchase of investment securities available-for-sale |
(54,587 | ) | (63,292 | ) | (51,389 | ) | ||||||
| Purchase of investment securities to be held-to-maturity |
(12,732 | ) | — | — | ||||||||
| Proceeds from sales and maturities of investment securities available-for-sale |
24,542 | 34,792 | 24,976 | |||||||||
| Proceeds from repayments of investment securities available-for-sale |
4,205 | 3,891 | 7,603 | |||||||||
| Proceeds from repayments of investment securities to be held-to-maturity |
15,741 | 15,438 | 5,369 | |||||||||
| Proceeds from VISA mandatory share redemption |
— | — | 1,213 | |||||||||
| Net loans originated |
(13,059 | ) | (4,626 | ) | (36,817 | ) | ||||||
| Proceeds from other real estate |
827 | 538 | 91 | |||||||||
| Purchase of life insurance contract |
(450 | ) | — | — | ||||||||
| Investment in premises and equipment |
(2,098 | ) | (1,426 | ) | (1,863 | ) | ||||||
| Proceeds from FHLB share buyback |
320 | — | — | |||||||||
| Net cash paid in merger |
— | (12,645 | ) | — | ||||||||
| Net cash used by investing activities |
(37,291 | ) | (27,330 | ) | (50,817 | ) | ||||||
| Net increase in demand and savings deposits |
2,453 | 38,274 | 2,426 | |||||||||
| Net proceeds from time deposits |
43,425 | 4,955 | 5,766 | |||||||||
| Increase (decrease) in repurchase agreements |
1,226 | (10,987 | ) | 8,663 | ||||||||
| Net (decrease) increase in short-term borrowings |
(18,742 | ) | (1,774 | ) | 11,003 | |||||||
| Increase in long-term borrowings |
12,800 | 8,000 | 27,000 | |||||||||
| Payments on long-term borrowings |
(12,059 | ) | (12,626 | ) | (10,246 | ) | ||||||
| Cash dividends paid |
(5,504 | ) | (5,031 | ) | (3,565 | ) | ||||||
| Net cash provided by financing activities |
23,599 | 20,811 | 41,047 | |||||||||
| Net increase (decrease) in cash and cash equivalents |
845 | 4,019 | (2,289 | ) | ||||||||
| Cash and cash equivalents at January 1 |
13,374 | 9,355 | 11,644 | |||||||||
| Cash and cash equivalents at December 31 |
$ | 14,219 | $ | 13,374 | $ | 9,355 | ||||||
The accompanying Notes are an integral part of these Consolidated Financial Statements.
56
General Notes to Financial Statements
NOTE 1 — NATURE OF OPERATIONS AND SUMMARY OF SIGNIFICANT ACCOUNTING POLICIES
Penseco Financial Services Corporation (Company) is a financial holding company, incorporated in 1997, under the laws of Pennsylvania. It is the parent company of Penn Security Bank and Trust Company (Bank), a Pennsylvania state chartered bank.
The Company operates twelve banking offices under a state bank charter and provides full banking services, including trust services, to individual and corporate customers primarily in Northeastern Pennsylvania. The Company’s primary deposit products are savings and demand deposit accounts and certificates of deposit. Its primary lending products are real estate, commercial and consumer loans.
The Company’s revenues are attributable to a single reportable segment; therefore segment information is not presented.
The accounting policies of the Company conform with accounting principles generally accepted in the United States of America (GAAP) and with general practices within the banking industry.
BASIS OF PRESENTATION
The Financial Statements of the Company have been consolidated with those of its wholly-owned subsidiary, Penn Security Bank and Trust Company, eliminating all intercompany items and transactions.
The Statements are presented on the accrual basis of accounting.
On April 1, 2009, the Company completed its acquisition of Old Forge Bank in a cash and stock transaction valued at approximately $55.5 million (the “Merger”). The Merger was accounted for using the acquisition method of accounting and, accordingly, the assets and liabilities of Old Forge Bank have been recorded at their respective fair values on the date the Merger was completed. The Merger was effected by payment of $17.4 million in cash and the issuance of 1,128,079 shares of Company common stock to former Old Forge Bank shareholders. Each share of Old Forge Bank common stock was exchanged for 2.9012 shares of Company common stock, with any fractional shares as a result of the exchange paid to Old Forge Bank shareholders in cash based on $35.255 per share of Company stock. The operations of OFB prior to April 1, 2009 are not included in the accompanying consolidated financial statements.
All information is presented in thousands of dollars, except per share amounts.
USE OF ESTIMATES
The preparation of financial statements in conformity with GAAP requires management to make estimates and assumptions that affect the reported amounts of assets and liabilities and disclosure of contingent assets and liabilities at the date of the financial statements and the reported amounts of revenues and expenses during the reporting period. Actual results could differ from those estimates.
Material estimates that are particularly susceptible to significant change relate to the determination of the allowance for losses on loans and the valuation of real estate acquired in connection with foreclosures or in satisfaction of loans. In connection with the determination of the allowances for losses on loans and foreclosed real estate, management obtains independent appraisals for significant properties.
RECLASSIFICATIONS
Certain prior year amounts have been reclassified to conform to the current year presentation.
RECENT ACCOUNTING PRONOUNCEMENTS
In October 2009, the FASB issued ASU 2009-13, Revenue Recognition (Topic 605): Mutiple-Deliverable Revenue Arrangements – a consensus of the FASB Emerging Issues Task Force. ASU 2009-13 establishes new guidance related to the revenue recognition in situations with multiple-element arrangements. The new guidance requires companies to allocate revenue in multiple-element arrangements based on an element’s estimated selling price if vendor-specific or other third-party evidence of value is not available. The accounting guidance will be applied prospectively and will become effective for the Company on January 1, 2011. The guidance is not expected to have a significant impact on the Company’s consolidated financial statements.
57
In December 2009, the FASB issued ASU 2009-16, Transfers and Servicing (Topic 860): Accounting for Transfers of Financial Assets. ASU 2009-16 amended prior guidance to enhance reporting about transfers of financial assets, including securitizations, and where companies have continuing exposure to the risks related to transferred financial assets. Among other provisions, ASU 2009-16 eliminated the concept of a “qualifying special-purpose entity” (QSPE) from SFAS No.140 and removed the exception from applying FIN 46(R), Consolidation of Variable Interest Entities, to QSPEs. ASU 2009-16 also changed the requirements for derecognizing financial assets and required additional disclosures about all continuing involvements with transferred financial assets including information about gains and losses resulting from transfers during the period. The provisions of ASU 2009-16 became effective on January 1, 2010 and did not have a significant impact on the Company’s consolidated financial statements.
In January 2010, the FASB issued ASU 2010-06 Fair Value Measurements and Disclosures (Topic 820): Improving Disclosures about Fair Value Measurements. ASU 2010-06 requires new fair value measurement disclosures about transfers in and out of Levels 1 and 2, and activity in Level 3 fair value measurements (purchases, sales, issuances, and settlements on a gross basis). ASU 2010-06 also clarified existing disclosures about the level of disaggregation and about inputs and valuation techniques. The new disclosures and clarifications of existing disclosures were effective for the Company January 1, 2010, except for the disclosures about purchases, sales, issuances, and settlements in the roll forward of activity in Level 3 fair value measurements. Those disclosures are effective for the Company January 1, 2011. As this guidance provides only disclosure requirements, the adoption of this standard will not impact the Company’s financial position, results of operation and cash flows.
In July 2010, the FASB issued ASU 2010-20, Receivables (Topic 310): Disclosures about the Credit Quality of Financing Receivables and the Allowance for Credit Losses. ASU 2010-20 requires more robust and disaggregated disclosures about the credit quality of financing receivables and allowances for credit losses, including disclosure about credit quality indicators, past due information and modifications of finance receivables. The disclosures as of the end of a reporting period were effective for the Company for the year ended December 31, 2010. The disclosures about activity that occurs during a reporting period are effective for the Company for the year beginning January 1, 2011. The adoption of this guidance significantly expanded the existing disclosure requirements but did not have an impact on the Company’s financial position, results of operation and cash flows.
In December 2010, the FASB issued ASU 2010-28, Intangibles – Goodwill and Other (Topic 350): When to Perform Step 2 of the Goodwill Impairment Test for Reporting Units with Zero or Negative Carrying Amounts. ASU 2010-28 modifies Step 1 of the goodwill impairment test for reporting units with zero or negative carrying amounts. For those reporting units, an entity is required to perform Step 2 of the goodwill impairment test if it is more likely than not that a goodwill impairment exists. The provisions of ASU 2010-28 are effective for the Company’s reporting period ending March 31, 2011. As of December 31, 2010, the Company had no operating units with zero or negative carrying amounts or reporting units where there was a reasonable possibility of failing Step 1 of the goodwill impairment test. As a result, the adoption of ASU 2010-28 is not expected to have a material impact on the Company’s financial position, results of operation and cash flows.
In December 2010, the FASB issued ASU 2010-29, Business Combinations (Topic 805): Disclosures of Supplementary Pro Forma Information for Business Combinations. ASU 2010-29 provides clarification regarding the acquisition date that should be used for reporting the pro forma financial information disclosures required by Topic 805 when comparative financial statements are presented. ASU 2010-29 also requires entities to provide a description of the nature and amount of material, nonrecurring pro forma adjustments that are directly attributable to the business combination. ASU 2010-29 is effective for the Company prospectively for business combinations occurring after December 21, 2010.
In January 2011, the FASB issued ASU 2011-01, Receivables (Topic 310): Deferral of the Effective Date of Disclosures about Troubled Debt Restructurings in Update No. 2010-20. The amendments in ASU 2011-01 temporarily delay the effective date of the disclosures about troubled debt restructurings in ASU 2010-20, Receivables (Topic 310): Disclosures about the Credit Quality of Financing Receivables and the Allowance for Credit Losses. The delay is intended to allow the FASB time to complete its deliberations on what constitutes a troubled debt restructuring. The new disclosures about troubled debt restructurings and the guidance for determining what constitutes a troubled debt restructuring will be effective for the first interim or annual period beginning on or after June 15, 2011. As the provisions of ASU 2011-01 only defer the effective date of disclosure requirements related to troubled debt restructurings, the adoption of ASU 2011-01 will have no impact on the Company’s financial position, results of operation and cash flows.
INVESTMENT SECURITIES
Investments in securities are classified in two categories and accounted for as follows:
Securities Held-to-Maturity Bonds, notes, debentures and mortgage-backed securities for which the Company has the positive intent and ability to hold to maturity are reported at cost, adjusted for amortization of premiums and accretion of discounts computed on the straight-line basis, which approximates the interest method, over the remaining period to maturity.
58
Securities Available-for-Sale Bonds, notes, debentures, mortgage-backed securities and certain equity securities not classified as securities to be held to maturity are carried at fair value with unrealized holding gains and losses, net of tax, reported as a net amount in a separate component of stockholders’ equity until realized.
The amortization of premiums on mortgage-backed securities is done based on management’s estimate of the lives of the securities, adjusted, when necessary, for advanced prepayments in excess of those estimates.
Realized gains and losses on the sale of securities available-for-sale are determined using the specific identification method and are reported as a separate component of other income in the Statements of Income. Unrealized gains and losses are included as a separate item in computing comprehensive income.
Investments are evaluated periodically to determine whether a decline in their value is other than temporary. Management utilizes criteria such as the magnitude and duration of the decline, in addition to the reasons underlying the decline, to determine whether the loss in value is other than temporary. The term “other than temporary” is not intended to indicate that the decline is permanent. It indicates that the prospects for a near term recovery of value are not necessarily favorable, or that there is a lack of evidence to support fair values equal to, or greater than, the carrying value of the investment. Once a decline in value is determined to be other than temporary, the value of the security is reduced and a corresponding charge to earnings is recognized.
LOANS AND PROVISION (ALLOWANCE) FOR LOAN LOSSES
Loans are stated at the principal amount outstanding, net of any unearned income, deferred loan fees and the allowance for loan losses. Interest is accrued daily on the outstanding balances.
Loans are generally placed on a non-accrual status when principal or interest is past due 90 days or when payment in full is not anticipated. When a loan is placed on non-accrual status, all interest previously accrued but not collected is charged against current income. Loans are returned to accrual status when past due interest is collected and the collection of principal is probable.
The provision for loan losses is based on past loan loss experience, management’s evaluation of the potential loss in the current loan portfolio under current economic conditions and such other factors as, in management’s best judgement, deserve current recognition in estimating loan losses. The annual provision for loan losses charged to operating expense is that amount which is sufficient to bring the balance of the allowance for loan losses to an adequate level to absorb anticipated losses.
The Bank follows its systematic methodology in accordance with the FFIEC Interagency Policy Statements, as amended, and GAAP in assessing the adequacy of the allowance account. Under GAAP, the adequacy of the allowance account is determined based on the provisions of FASB ASC 310 for loans specifically identified to be individually evaluated for impairment and the requirements of FASB ASC 450 for large groups of smaller balance homogeneous loans to be collectively evaluated for impairment. Loans are identified by the Bank’s rating system, past due reports, watch list and subjectivity to economic factors and are then collectively evaluated for impairment with others utilizing standard criteria. Consideration is given to current local economic conditions which at this time the Company classifies as recessionary.
Our historical analysis of loss factors, which utilizes a rolling twenty quarters, was refined in the third quarter of 2010 to assign greater weight to the four quarters of the previous five years that reflected the greatest loan loss allowances. This change in our methodology is designed to better address deterioration in local economic conditions. The Bank’s loan portfolio is concentrated in real estate with over 80% of the portfolio secured by real estate mainly in the counties in which the Bank operates and, therefore, the Bank also took into account the decline in real estate sales and new construction in our market area and the drop in real estate values within the market area.
PREMISES AND EQUIPMENT
Premises and equipment are stated at cost less accumulated depreciation. Provision for depreciation and amortization, computed principally on the straight-line method, is charged to operating expenses over the estimated useful lives of the assets. Maintenance and repairs are charged to current expense as incurred.
LOAN SERVICING
The Company generally retains the right to service mortgage loans sold to others. The cost allocated to the mortgage servicing rights retained has been recognized as a separate asset and is being amortized in proportion to and over the period of estimated net servicing income.
59
Mortgage servicing rights are evaluated for impairment based on the fair value of those rights. Fair values are estimated using discounted cash flows based on current market rates of interest and current expected future prepayment rates. For purposes of measuring impairment, the rights must be stratified by one or more predominant risk characteristics of the underlying loans. The Company stratifies its capitalized mortgage servicing rights based on the product type, interest rate and term of the underlying loans. The amount of impairment recognized is the amount, if any, by which the amortized cost of the rights for each stratum exceed the fair value.
ADVERTISING EXPENSES
Advertising costs are expensed as incurred. Advertising expenses for the years ended December 31, 2010, 2009 and 2008, amounted to $605, $409 and $603, respectively.
INCOME TAXES
Provisions for income taxes are based on taxes payable or refundable for the current year (after exclusion of non-taxable income such as interest on state and municipal securities) as well as deferred taxes on temporary differences, between the amount of taxable income and pre-tax financial income and between the tax bases of assets and liabilities and their reported amounts in the Financial Statements. Deferred tax assets and liabilities are included in the Financial Statements at currently enacted income tax rates applicable to the period in which the deferred tax assets and liabilities are expected to be realized or settled. As changes in tax laws or rates are enacted, deferred tax assets and liabilities are adjusted through the provision for income taxes.
Management evaluated the Company’s tax positions and concluded that the Company had taken no uncertain tax positions that require adjustment to the financial statements. With few exceptions, the Company is no longer subject to income tax examinations by the U.S. Federal, state or local tax authorities for years before 2007.
PENSION AND POSTRETIREMENT BENEFITS EXPENSE
The Company sponsors various pension plans covering substantially all employees. The Company also provides post-retirement benefit plans other than pensions, consisting principally of life insurance benefits, to eligible retirees. The liabilities and annual income or expense of the Company’s pension and other post-retirement benefit plans are determined using methodologies that involve several actuarial assumptions, the most significant of which are the discount rate and the long-term rate of asset return (based on the market-related value of assets). The fair values of plan assets are determined based on prevailing market prices or estimated fair value for investments with no available quoted prices.
STOCK APPRECIATION RIGHTS EXPENSE
The compensation expense recognized for the Company’s stock appreciation rights (SARs) is recorded over the vesting period (five years). The fair value of the SARs is estimated using a Black-Scholes option-pricing model.
CASH FLOWS
For purposes of the Statements of Cash Flows, cash and cash equivalents include cash on hand, due from banks, interest bearing balances with banks and Federal funds sold for a one-day period.
The Company paid interest and income taxes during the years ended December 31, 2010, 2009 and 2008 as follows:
| 2010 | 2009 | 2008 | ||||||||||
| Income taxes paid |
$ | 2,600 | $ | 1,699 | $ | 2,836 | ||||||
| Interest paid |
$ | 8,545 | $ | 9,720 | $ | 11,210 | ||||||
Non-cash transactions during the years ended December 31, 2010, 2009 and 2008, comprised entirely of the net acquisition of real estate in the settlement of loans, amounted to $1,099, $927 and $22, respectively.
LONG-LIVED ASSETS
The Company reviews the carrying value of long-lived assets for impairment whenever events or changes in circumstances indicate that carrying amounts of the assets might not be recoverable.
TRUST ASSETS AND INCOME
Assets held by the Company in a fiduciary or agency capacity for its customers are not included in the Financial Statements since such items are not assets of the Company. Trust income is reported on the accrual basis of accounting.
60
EARNINGS PER SHARE
Basic earnings per share is computed on the weighted average number of common shares outstanding. For the years ended December 31, 2010, 2009 and 2008, the weighted average number of common shares outstanding was 3,276,079, 2,994,059, and 2,148,000, respectively. A calculation of diluted earnings per share is not applicable to the Company.
NOTE 2 — CASH AND DUE FROM BANKS
Cash and due from banks are summarized as follows:
| December 31, |
2010 | 2009 | ||||||
| Cash items in process of collection |
$ | 5,339 | $ | 4,928 | ||||
| Non-interest bearing balances |
719 | 481 | ||||||
| Cash on hand |
5,527 | 5,691 | ||||||
| Total |
$ | 11,585 | $ | 11,100 | ||||
The Company may, from time to time, maintain bank balances with other financial institutions in excess of FDIC limitations. Management is not aware of any evidence that would indicate that such deposits are at risk.
NOTE 3 — INVESTMENT SECURITIES
The amortized cost and fair value of investment securities at December 31, 2010 and 2009 are as follows:
Available-for-Sale
| 2010 |
Amortized Cost |
Gross Unrealized Gains |
Gross Unrealized Losses |
Fair Value |
||||||||||||
| U.S. Agency securities |
$ | 78,993 | $ | 620 | $ | 319 | $ | 79,294 | ||||||||
| Mortgage-backed securities |
25,686 | 709 | 25 | 26,370 | ||||||||||||
| States & political subdivisions |
62,381 | 839 | 662 | 62,558 | ||||||||||||
| Corporate securities |
4,077 | 13 | — | 4,090 | ||||||||||||
| Total Debt Securities |
171,137 | 2,181 | 1,006 | 172,312 | ||||||||||||
| Equity securities |
494 | 540 | 49 | 985 | ||||||||||||
| Total Available-for-Sale |
$ | 171,631 | $ | 2,721 | $ | 1,055 | $ | 173,297 | ||||||||
| 2009 |
Amortized Cost |
Gross Unrealized Gains |
Gross Unrealized Losses |
Fair Value |
||||||||||||
| U.S. Agency securities |
$ | 54,165 | $ | 595 | $ | 65 | $ | 54,695 | ||||||||
| Mortgage-backed securities |
16,999 | 568 | — | 17,567 | ||||||||||||
| States & political subdivisions |
74,060 | 1,784 | 411 | 75,433 | ||||||||||||
| Total Debt Securities |
145,224 | 2,947 | 476 | 147,695 | ||||||||||||
| Equity securities |
378 | 1,006 | — | 1,384 | ||||||||||||
| Total Available-for-Sale |
$ | 145,602 | $ | 3,953 | $ | 476 | $ | 149,079 | ||||||||
|
Held-to-Maturity |
| |||||||||||||||
| 2010 |
Amortized Cost |
Gross Unrealized Gains |
Gross Unrealized Losses |
Fair Value |
||||||||||||
| Mortgage-backed securities |
$ | 28,877 | $ | 1,161 | $ | 24 | $ | 30,014 | ||||||||
| States & political subdivisions |
14,870 | 334 | — | 15,204 | ||||||||||||
| Total Held-to-Maturity |
$ | 43,747 | $ | 1,495 | $ | 24 | $ | 45,218 | ||||||||
61
| 2009 |
Amortized Cost |
Gross Unrealized Gains |
Gross Unrealized Losses |
Fair Value |
||||||||||||
| Mortgage-backed securities |
$ | 23,700 | $ | 1,281 | $ | — | $ | 24,981 | ||||||||
| States & political subdivisions |
23,151 | 922 | — | 24,073 | ||||||||||||
| Total Held-to-Maturity |
$ | 46,851 | $ | 2,203 | $ | — | $ | 49,054 | ||||||||
Equity securities at December 31, 2010 and 2009 consisted primarily of other financial institutions’ stock.
A summary of transactions involving available-for-sale debt securities in 2010, 2009 and 2008 are as follows:
| December 31, |
2010 | 2009 | 2008 | |||||||||
| Proceeds from sales |
$ | 8,897 | $ | 25,568 | $ | 11,798 | ||||||
| Gross realized gains |
66 | 1,029 | 11 | |||||||||
| Gross realized losses |
4 | 142 | — | |||||||||
Investment securities with amortized costs and fair values of $129,004 and $131,757, respectively, at December 31, 2010 and $141,193 and $145,554, respectively, at December 31, 2009, were pledged to secure trust funds, public deposits and for other purposes as required by law.
The amortized cost and fair value of debt securities at December 31, 2010 by contractual maturity are shown in the following table. Expected maturities will differ from contractual maturities because borrowers may have the right to call or prepay obligations with or without call or prepayment penalties.
| Available-for-Sale | Held-to-Maturity | |||||||||||||||
| December 31, 2010 |
Amortized Cost |
Fair Value |
Amortized Cost |
Fair Value |
||||||||||||
| Due in one year or less: |
||||||||||||||||
| U.S. Agency securities |
$ | 17,047 | $ | 17,177 | $ | — | $ | — | ||||||||
| Corporate securities |
3,063 | 3,069 | — | — | ||||||||||||
| After one year through five years: |
||||||||||||||||
| U.S. Agency securities |
61,946 | 62,117 | — | — | ||||||||||||
| States & political subdivisions |
95 | 100 | 246 | 250 | ||||||||||||
| Corporate securities |
1,014 | 1,021 | — | — | ||||||||||||
| After five year through ten years: |
||||||||||||||||
| States & political subdivisions |
2,902 | 3,033 | 6,882 | 7,062 | ||||||||||||
| After ten years: |
||||||||||||||||
| States & political subdivisions |
59,384 | 59,425 | 7,742 | 7,892 | ||||||||||||
| Subtotal |
145,451 | 145,942 | 14,870 | 15,204 | ||||||||||||
| Mortgage-backed securities |
25,686 | 26,370 | 28,877 | 30,014 | ||||||||||||
| Total Debt Securities |
$ | 171,137 | $ | 172,312 | $ | 43,747 | $ | 45,218 | ||||||||
The gross fair value and unrealized losses of the Company’s investments aggregated by investment category and length of time that individual securities have been in a continuous unrealized loss position, at December 31, 2010 and 2009 are as follows:
| Less than twelve months | Twelve months or more | Totals | ||||||||||||||||||||||
| December 31, 2010 |
Fair Value |
Unrealized Losses |
Fair Value |
Unrealized Losses |
Fair Value |
Unrealized Losses |
||||||||||||||||||
| U.S. Agency securities |
$ | 28,662 | $ | 319 | $ | — | $ | — | $ | 28,662 | $ | 319 | ||||||||||||
| Mortgage-backed securities |
25,554 | 49 | — | — | 25,554 | 49 | ||||||||||||||||||
| States & political subdivisions |
23,627 | 582 | 721 | 80 | 24,348 | 662 | ||||||||||||||||||
| Equities |
186 | 49 | — | — | 186 | 49 | ||||||||||||||||||
| Total |
$ | 78,029 | $ | 999 | $ | 721 | $ | 80 | $ | 78,750 | $ | 1,079 | ||||||||||||
62
| Less than twelve months | Twelve months or more | Totals | ||||||||||||||||||||||
| December 31, 2009 |
Fair Value |
Unrealized Losses |
Fair Value |
Unrealized Losses |
Fair Value |
Unrealized Losses |
||||||||||||||||||
| U.S. Agency securities |
$ | 14,259 | $ | 65 | $ | — | $ | — | $ | 14,259 | $ | 65 | ||||||||||||
| States & political subdivisions |
9,212 | 383 | 3,817 | 28 | 13,029 | 411 | ||||||||||||||||||
| Total |
$ | 23,471 | $ | 448 | $ | 3,817 | $ | 28 | $ | 27,288 | $ | 476 | ||||||||||||
The table at December 31, 2010, includes fifty-one (51) securities that have unrealized losses for less than twelve months and two (2) securities that have been in an unrealized loss position for twelve or more months. The table at December 31, 2009, includes fourteen (14) securities that have unrealized losses for less than twelve months and ten (10) securities that have been in an unrealized loss position for twelve or more months.
In 2009, the Company recorded an other-than-temporary impairment charge of $787 related to the Company’s equity investment portfolio containing stock of financial institutions. Prior to this impairment charge, the decline in value of the securities was recorded as unrealized losses on securities available-for-sale and reflected as a reduction in stockholders’ equity through other comprehensive income.
U.S. Agency Securities
The unrealized losses on the Company’s investments in U.S. Agency securities were caused by interest rate fluctuations. The contractual terms of these investments do not permit the issuer to settle the securities at a price less than the par value of the investment. Because the Company does not intend to sell the investments and it is not more likely than not that the Company will be required to sell the investments before recovery of their amortized cost bases, which may be maturity, the Company does not consider those investments to be other-than-temporarily impaired at December 31, 2010.
Mortgage-backed Securities
The unrealized losses on the Company’s investments in mortgage-backed securities were caused by interest rate fluctuations. The contractual cash flows of these investments are guaranteed by an agency of the U.S. Government. Accordingly, it is expected that these securities would not be settled at a price less than the amortized cost of the Company’s investment. Because the Company does not intend to sell the investments and it is not more likely than not that the Company will be required to sell the investments before recovery of their amortized cost bases, which may be maturity, the Company does not consider those investments to be other-than-temporarily impaired at December 31, 2010.
States and Political Subdivisions
The unrealized losses on the Company’s investments in states and political subdivisions were caused by interest rate fluctuations and not credit quality. The contractual terms of these investments do not permit the issuer to settle the securities at a price less than the par value of the investment. Because the Company does not intend to sell the investments and it is not more likely than not that the Company will be required to sell the investments before recovery of their amortized cost bases, which may be maturity, the Company does not consider those investments to be other-than-temporarily impaired at December 31, 2010.
Marketable Equity Securities
The unrealized losses on the Company’s investments in marketable equity securities were caused primarily by interest rate fluctuations and other market conditions. The Company’s investments in marketable equity securities consist primarily of investments in common stock of companies in the financial services industry. The Company has analyzed its equity portfolio and determined that the market value fluctuation in these equity securities is consistent with the broader market and not a cause for recognition of a current loss. Because the Company does not intend to sell the investments and it is not more likely than not that the Company will be required to sell the investments before recovery of their cost bases, the Company does not consider those investments to be other-than-temporarily impaired at December 31, 2010.
63
NOTE 4 — LOANS
Major classifications of loans are as follows:
| December 31, |
2010 | 2009 | ||||||
| Loans secured by real estate: |
||||||||
| Construction and land development |
||||||||
| Residential real estate |
$ | 7,799 | $ | 9,970 | ||||
| Commercial real estate |
28,345 | 22,940 | ||||||
| Secured by 1-4 family residential properties: |
||||||||
| Revolving, open-end loans |
33,102 | 31,674 | ||||||
| Secured by first liens |
225,105 | 240,615 | ||||||
| Secured by junior liens |
21,233 | 21,840 | ||||||
| Secured by multi-family properties |
8,062 | 3,969 | ||||||
| Secured by non-farm, non-residential properties |
179,619 | 171,995 | ||||||
| Commercial and industrial loans to U.S. addressees |
36,190 | 30,743 | ||||||
| Loans to individuals for household, family and other personal expenditures: |
||||||||
| Credit card and related plans |
3,327 | 3,365 | ||||||
| Other (installment and student loans, etc.) |
52,536 | 56,426 | ||||||
| Obligations of states & political subdivisions |
9,882 | 6,873 | ||||||
| All other loans |
9,906 | 3,562 | ||||||
| Gross Loans |
615,106 | 603,972 | ||||||
| Less: Unearned income on loans |
1 | 2 | ||||||
| Loans, Net of Unearned Income |
$ | 615,105 | $ | 603,970 | ||||
Loans on which the accrual of interest has been discontinued or reduced amounted to $4,034, $2,339 and $1,454 at December 31, 2010, 2009 and 2008, respectively. If interest on those loans had been accrued, such income would have been $219, $90 and $192 for 2010, 2009 and 2008, respectively. Interest income on those loans, which is recorded only when received, amounted to $104, $52 and $29 for 2010, 2009 and 2008, respectively. Also, at December 31, 2010 and 2009, the Bank had loans totaling $1,630 and $1,697, respectively, which were past due 90 days or more and still accruing interest.
The Company has not engaged in any sub-prime residential mortgage lending. Therefore, the Company is not subject to any credit risks associated with such loans. The Company’s loan portfolio consists primarily of residential and commercial mortgage loans secured by properties located in Northeastern Pennsylvania and subject to conservative underwriting standards.
64
Age Analysis of Past Due Loans
As of December 31, 2010
| 30-59 Days Past Due |
60-89 Days Past Due |
Greater Than 90 Days |
Total Past Due |
Current | Total Loans | Recorded Investment > 90 Days and Accruing |
||||||||||||||||||||||
| Commercial |
$ | 90 | $ | — | $ | 1,077 | $ | 1,167 | $ | 54,811 | $ | 55,978 | $ | 100 | ||||||||||||||
| Commercial real estate: |
||||||||||||||||||||||||||||
| Commercial real estate construction |
— | 516 | 1,040 | 1,556 | 26,789 | 28,345 | — | |||||||||||||||||||||
| Commercial real estate – other |
229 | 102 | 345 | 676 | 178,943 | 179,619 | — | |||||||||||||||||||||
| Consumer: |
||||||||||||||||||||||||||||
| Consumer – credit card |
— | 36 | 20 | 56 | 3,271 | 3,327 | 20 | |||||||||||||||||||||
| Consumer – other |
— | 9 | 5 | 14 | 5,914 | 5,928 | — | |||||||||||||||||||||
| Consumer – auto |
261 | 18 | 34 | 313 | 29,801 | 30,114 | 6 | |||||||||||||||||||||
| Student loans – TERI |
21 | 89 | 60 | 170 | 7,233 | 7,403 | — | |||||||||||||||||||||
| Student loans – other |
150 | 21 | 268 | 439 | 8,651 | 9,090 | 268 | |||||||||||||||||||||
| Residential: |
||||||||||||||||||||||||||||
| Residential – prime |
2,204 | 985 | 2,815 | 6,004 | 289,297 | 295,301 | 1,236 | |||||||||||||||||||||
| Total |
$ | 2,955 | $ | 1,776 | $ | 5,664 | $ | 10,395 | $ | 604,710 | $ | 615,105 | $ | 1,630 | ||||||||||||||
Credit Quality Indicators. As part of the on-going monitoring of the credit quality of the Company’s loan portfolio, management tracks certain credit quality indicators including trends related to (i) loan delinquency, (ii) the level of classified commercial loans, (iii) net charge-offs, (iv) non-performing loans (see details above) and (v) the general economic conditions in the Company’s market area.
The Company utilizes a risk grading matrix to assign a risk grade to each of its commercial loans. Loans are graded on a scale of 1 to 8. A description of the general characteristics of the 8 risk grades is as follows:
Pass 1 (Minimal Risk)
This classification includes loans which are fully secured by liquid collateral or loans to very high quality borrowers who demonstrate exceptional credit fundamentals, including stable and predictable profit margins and cash flows, strong liquidity, a conservative balance sheet, superior asset quality and good management with an excellent track record.
Pass 2 (Average Risk)
This classification includes loans which have no identifiable risk of collection and conform in all aspects to the Bank’s policies and procedures as well as federal and state regulations. Documentation exceptions are minimal and in the process of correction and not of a type that could subsequently introduce loan loss risk.
Pass 3 (Acceptable Risk)
This classification includes loans to borrowers of acceptable credit quality and risk. Such borrowers are differentiated from Pass 2 in terms of secondary sources of repayment or they are of lesser stature in other key credit metrics in that they may be over-leveraged, under capitalized, inconsistent in performance or in an industry that is known to have a higher level of risk, volatility, or susceptibility to weaknesses in the economy.
65
Pass 4 (Watch List)
This classification is intended to be utilized on a temporary basis for pass grade borrowers where a significant risk-modifying action is anticipated in the near term. It is assigned to loans where, for example, the financial condition of the company has taken a negative turn and may be temporarily strained; borrowers may exhibit excessive growth, declining earnings, strained cash flow, increasing leverage and/or weakening market position that indicate above average risk. Interim losses and/or adverse trends may occur, but not to the level that would affect the Bank’s position and cash flow may be weak but minimally acceptable.
Criticized 5 (Other Assets Especially Mentioned)
This classification is also intended to be temporary and includes loans to borrowers whose credit quality has clearly deteriorated and are at risk of further decline unless active measures are taken to correct the situation.
Classified 6 (Substandard)
This classification includes loans with well-defined weaknesses which are inadequately protected by current net worth, repayment capacity or pledged collateral of the borrower. Loans are Substandard when they have one or more weaknesses that could jeopardize debt repayment and/or liquidation, primarily resulting in the possibility that the Bank may sustain some loss if the deficiencies are not corrected.
Classified 7 (Doubtful)
This classification includes loans that have all weaknesses inherent in the Substandard category and where collection or liquidation in full is highly improbable. The possibility of loss is high, but because of certain important and reasonably specific pending factors, its classification as an estimated loss is deferred until its more exact status may be determined.
Classified 8 (Loss)
This classification includes loans considered uncollectible and of such little value that continuance as bankable assets is not warranted and, therefore, should be charged-off. This classification does not mean that the loans have absolutely no recovery or salvage value, but rather it is not practical or desirable to defer writing off these assets even though partial recovery may be affected in the future.
Credit Quality Indicators as of December 31, 2010
Corporate Credit Exposure
Credit Risk Profile by Credit worthiness Category
| Commercial | Commercial Real Estate Construction |
Commercial Real Estate - Other |
||||||||||
| Pass / Watch |
$ | 54,188 | $ | 25,860 | $ | 160,583 | ||||||
| Criticized |
896 | 1,436 | 10,416 | |||||||||
| Substandard |
893 | 1,049 | 8,620 | |||||||||
| Total |
$ | 55,977 | $ | 28,345 | $ | 179,619 | ||||||
Consumer Credit Exposure
Credit Risk Profile by Payment Activity
| Residential - Real Estate |
||||
| Performing |
$ | 292,486 | ||
| Non-performing |
2,815 | |||
| Total |
$ | 295,301 | ||
66
Credit Risk Profile by Payment Activity
| Consumer - Credit Card |
Consumer - Other |
Consumer - Auto | Student loans - TERI |
Student loans - other |
||||||||||||||||
| Performing |
$ | 3,307 | $ | 5,923 | $ | 30,080 | $ | 7,343 | $ | 8,822 | ||||||||||
| Non-performing |
20 | 5 | 34 | 60 | 268 | |||||||||||||||
| Total |
$ | 3,327 | $ | 5,928 | $ | 30,114 | $ | 7,403 | $ | 9,090 | ||||||||||
Impaired Loans. Loans are considered impaired when, based on current information and events, it is probable the Company will be unable to collect all amounts due in accordance with the original contractual terms of the loan agreement, including scheduled principal and interest payments. Impairment is evaluated in total for smaller-balance loans of a similar nature and on an individual loan basis for other loans. If a loan is impaired, a specific valuation allowance is allocated, if necessary, so that the loan is reported net, at the present value of estimated future cash flows using the loan’s existing rate or at the fair value of collateral if repayment is expected solely from the collateral. Interest payments on impaired loans are typically applied to principal unless collectibility of the principal amount is reasonably assured, in which case interest is recognized on a cash basis. Impaired loans, or portions thereof, are charged off when deemed uncollectible.
Impaired Loans
For the Year Ended December 31, 2010
| Recorded Investment |
Unpaid Principal Balance |
Related Allowance |
Average Recorded Investment |
Interest Income Recognized |
||||||||||||||||
| With no related allowance recorded: |
||||||||||||||||||||
| Commercial Real Estate |
$ | 195 | $ | 195 | $ | — | $ | 195 | $ | — | ||||||||||
| Commercial |
— | — | — | — | — | |||||||||||||||
| Consumer – TERI |
60 | 60 | 100 | — | ||||||||||||||||
| Consumer – other |
5 | 5 | — | 67 | — | |||||||||||||||
| Consumer – auto |
28 | 28 | — | 30 | — | |||||||||||||||
| Residential Real Estate |
467 | 467 | — | 500 | — | |||||||||||||||
| With an allowance recorded: |
||||||||||||||||||||
| Commercial Real Estate construction |
1,040 | 1,040 | 200 | 1,300 | — | |||||||||||||||
| Commercial Real Estate – other |
150 | 150 | 25 | 155 | — | |||||||||||||||
| Commercial |
1,178 | 1,178 | 921 | 427 | 17 | |||||||||||||||
| Residential Real Estate |
1,370 | 1,370 | 269 | 700 | 14 | |||||||||||||||
| Total: |
$ | 4,493 | $ | 4,493 | $ | 1,415 | $ | 3,474 | $ | 31 | ||||||||||
| Commercial Real Estate |
$ | 1,385 | $ | 1,385 | $ | 225 | $ | 1,650 | $ | — | ||||||||||
| Commercial |
$ | 1,178 | $ | 1,178 | $ | 921 | $ | 427 | $ | 17 | ||||||||||
| Consumer |
$ | 93 | $ | 93 | $ | — | $ | 197 | $ | — | ||||||||||
| Residential Real Estate |
$ | 1,837 | $ | 1,837 | $ | 269 | $ | 1,200 | $ | 14 | ||||||||||
Non-Accrual and Past Due Loans. Loans are considered past due if the required principal and interest payments have not been received as of the date such payments were due. Loans are placed on non-accrual status when, in management’s opinion, the borrower may be unable to meet payment obligations as they become due, as well as when required by regulatory provisions. Loans may be placed on non-accrual status regardless of whether or not such loans are considered past due. When interest accrual is discontinued, all unpaid accrued interest is reversed. Interest income is subsequently recognized only to the extent cash payments are received in excess of principal due. Loans are returned to accrual status when all the principal and interest amounts contractually due are brought current and future payments are reasonably assured with the minimum of a six month positive payment history.
67
Year-end non-accrual loans, segregated by class of loans, were as follows:
| December 31, |
2010 | |||
| Commercial |
$ | 977 | ||
| Commercial real estate: |
||||
| Commercial real estate construction |
1,040 | |||
| Commercial real estate – other |
345 | |||
| Consumer: |
||||
| Student loans – TERI |
60 | |||
| Student loans – other |
— | |||
| Consumer – other |
5 | |||
| Consumer – auto |
28 | |||
| Residential: |
||||
| Residential real estate |
1,579 | |||
| Total |
$ | 4,034 | ||
The Allowance for Credit Losses and Recorded Investment in Loans for the year ended December 31, 2010 is as follows:
| Commercial | Commercial Real Estate |
Consumer | Residential | Credit Card | Unallocated | Total | ||||||||||||||||||||||
| Allowance for credit losses: |
||||||||||||||||||||||||||||
| Ending balance |
$ | 1,957 | $ | 2,067 | $ | 1,380 | $ | 753 | $ | 343 | $ | — | $ | 6,500 | ||||||||||||||
| Ending balance: Individually evaluated for impairment |
921 | 225 | — | 269 | — | — | 1,415 | |||||||||||||||||||||
| Ending balance: collectively evaluated for impairment |
$ | 1,036 | $ | 1,842 | $ | 1,380 | $ | 484 | $ | 343 | $ | — | $ | 5,085 | ||||||||||||||
| Ending balance: loans acquired with deteriorated credit quality |
$ | — | $ | — | $ | — | $ | — | $ | — | $ | — | $ | — | ||||||||||||||
| Loans: |
||||||||||||||||||||||||||||
| Ending balance |
$ | 55,978 | $ | 207,964 | $ | 52,535 | $ | 295,301 | $ | 3,327 | $ | — | $ | 615,105 | ||||||||||||||
| Ending balance: Individually evaluated for impairment |
1,178 | 1,385 | 93 | 1,837 | — | — | 4,493 | |||||||||||||||||||||
| Ending balance: collectively evaluated for impairment |
$ | 54,800 | $ | 206,579 | $ | 52,442 | $ | 293,464 | $ | 3,327 | $ | — | $ | 610,612 | ||||||||||||||
| Ending balance: loans acquired with deteriorated credit quality |
$ | — | $ | — | $ | — | $ | — | $ | — | $ | — | $ | — | ||||||||||||||
NOTE 5 — ALLOWANCE FOR LOAN LOSSES
The allowance for loan losses is a reserve established through a provision for loan losses charged to expense, which represents management’s best estimate of probable losses that have been incurred within the existing portfolio of loans. The allowance, in the judgment of management, is necessary to reserve for estimated loan losses and risks inherent in the loan portfolio. The Company’s allowance for loan loss methodology includes allowance allocations calculated in accordance with ASC Topic 310, “Receivables” and allowance allocations calculated in accordance with ASC Topic 450, “Contingencies.” Accordingly, the methodology is based on historical loss experience by type of credit and internal risk grade, specific homogeneous risk pools and specific loss allocations, with adjustments for current events and conditions. The Company’s process for determining the appropriate level of the allowance for loan losses is designed to account for credit deterioration as it occurs. The provision for loan losses reflects loan quality trends, including the levels of and trends related to non-accrual loans, past due loans, potential problem loans, criticized loans and net charge-offs or recoveries, among other factors. The provision for loan losses also reflects the totality of actions taken on all loans for a particular period. In other words, the amount of the provision reflects not only the necessary increases in the allowance for loan losses related to newly identified criticized loans, but it also reflects actions taken related to other loans including, among other things, any necessary increases or decreases in required allowances for specific loans or loan pools.
68
Changes in the allowance for loan losses are as follows:
| Years Ended December 31, |
2010 | 2009 | 2008 | |||||||||
| Balance at beginning of year |
$ | 6,300 | $ | 5,275 | $ | 4,700 | ||||||
| Charge-offs: |
||||||||||||
| Residential real estate mortgages |
213 | 161 | 83 | |||||||||
| Commercial real estate |
— | 188 | — | |||||||||
| Commercial loans |
1,138 | 610 | — | |||||||||
| Consumer loans |
487 | 341 | 234 | |||||||||
| Total charge-offs |
1,838 | 1,300 | 317 | |||||||||
| Recoveries: |
||||||||||||
| Residential real estate mortgages |
19 | 42 | — | |||||||||
| Commercial real estate |
1 | — | — | |||||||||
| Commercial loans |
— | — | 14 | |||||||||
| Consumer loans |
19 | 23 | 17 | |||||||||
| Total recoveries |
39 | 65 | 31 | |||||||||
| Net charge-offs |
1,799 | 1,235 | 286 | |||||||||
| Provision charged to operations |
1,999 | 2,260 | 861 | |||||||||
| Balance at End of Year |
$ | 6,500 | $ | 6,300 | $ | 5,275 | ||||||
| Ratio of net charge-offs to average loans outstanding |
0.30 | % | 0.22 | % | 0.07 | % | ||||||
A comparison of the provision for loan losses for Financial Statement purposes with the allowable bad debt deduction for tax purposes is as follows:
| Years Ended December 31, |
Book Provision | Tax Deduction | ||||||
| 2010 |
$ | 1,999 | $ | 1,685 | ||||
| 2009 |
$ | 2,260 | $ | 1,178 | ||||
| 2008 |
$ | 861 | $ | 286 | ||||
The balance of the Reserve for Bad Debts as reported for Federal income tax purposes was $400, $514 and $0 at December 31, 2010, 2009 and 2008, respectively.
NOTE 6 —LOAN SERVICING
The Company generally retains the right to service mortgage loans sold to third parties. The cost allocated to the mortgage servicing rights retained has been recognized as a separate asset and is amortized in proportion to and over the period of estimated net servicing income.
The Company services $74,009 in mortgage loans for Freddie Mac which are not included in the accompanying Consolidated Balance Sheets.
Custodial escrow balances maintained in connection with the foregoing loan servicing, and included in deposits, were approximately $425 and $496 at December 31, 2010 and 2009, respectively. The balance of the servicing rights was $293 and $163 at December 31, 2010 and 2009, respectively, net of amortization.
The Company has recorded new mortgage servicing rights of $193 and $169 at December 31, 2010 and 2009, respectively. Amortization expense of $63 and $47 was recorded for the years ended December 31, 2010 and 2009, respectively.
Mortgage servicing rights are evaluated for impairment based on the fair value of those rights. Fair values are estimated using discounted cash flows based on current market rates of interest and expected future prepayment rates. For purposes of measuring impairment, the rights must be stratified by one or more predominant risk characteristics of the underlying loans. The Company stratifies its capitalized mortgage servicing rights based on the product type, interest rate and term of the underlying loans. The amount of impairment recognized is the amount, if any, by which the amortized cost of the rights for each stratum exceed the fair value.
There was no allowance for impairment recorded at December 31, 2010 or 2009.
69
NOTE 7 — BANK PREMISES AND EQUIPMENT
| December 31, |
2010 | 2009 | ||||||
| Land |
$ | 3,481 | $ | 3,471 | ||||
| Buildings and improvements |
18,897 | 17,667 | ||||||
| Furniture and equipment |
17,158 | 16,300 | ||||||
| 39,536 | 37,438 | |||||||
| Less: Accumulated depreciation |
26,130 | 25,042 | ||||||
| Net Bank Premises and Equipment |
$ | 13,406 | $ | 12,396 | ||||
Buildings and improvements are being depreciated over 10 to 39.5 year periods and equipment over 3 to 10 year periods. Depreciation expense amounted to $1,088 in 2010, $997 in 2009 and $795 in 2008.
Occupancy expenses were reduced by rental income received in the amount of $187, $196 and $154 in the years ended December 31, 2010, 2009 and 2008, respectively.
NOTE 8 — OTHER REAL ESTATE OWNED
Real estate acquired through foreclosure is recorded at the lower of cost or market at the time of acquisition. Any subsequent write-downs are charged against operating expenses. The other real estate owned was $803 and $528 as of December 31, 2010 and 2009, respectively.
NOTE 9 — INVESTMENT IN AND LOAN TO, INCOME FROM DIVIDENDS AND EQUITY IN EARNINGS OR LOSSES OF SUBSIDIARY
Penseco Realty, Inc. is a wholly-owned subsidiary of the Bank which owns certain banking premises. Selected financial information is presented below:
| Year |
Percent of voting stock owned |
Total investment and loan |
Equity in underlying net assets at balance sheet date |
Amount of dividends |
Bank’s proportionate part of loss for the period |
|||||||||||||||
| 2010 |
100 | % | $ | 3,250 | $ | 3,234 | None | $ | — | |||||||||||
| 2009 |
100 | % | $ | 3,250 | $ | 3,234 | None | $ | — | |||||||||||
| 2008 |
100 | % | $ | 3,250 | $ | 3,235 | None | $ | — | |||||||||||
NOTE 10 — GOODWILL
Goodwill represents the excess of the purchase price over the underlying fair value of merged entities. Goodwill is assessed for impairment at least annually and as triggering events occur. In making this assessment, management considers a number of factors including, but not limited to, operating results, business plans, economic projections, anticipated future cash flows, and current market data. There are inherent uncertainties related to these factors and management’s judgment in applying them to the analysis of Goodwill impairment. Changes in economic and operating conditions, as well as other factors, could result in Goodwill impairment in future periods. Management has determined that the carrying value of Goodwill was not impaired at December 31, 2010 or December 31, 2009.
NOTE 11 — CASH SURRENDER VALUE OF LIFE INSURANCE
The Company has purchased BOLI policies on certain officers. The value of such policies totaled $15,380 and $14,380 at December 31, 2010 and 2009, respectively.
The policies are split-dollar life insurance policies which provide for the Company to receive the cash value of the policy and to split the residual proceeds with the officer’s designated beneficiary upon the death of the insured, while the officer is employed at the Company. The majority of the residual proceeds are retained by the Company per the individual agreements with the insured officers.
70
NOTE 12 — FEDERAL HOME LOAN BANK STOCK
Federal Home Loan Bank of Pittsburgh (FHLB) stock is a required investment in order for the Company to participate in a FHLB line of credit program. The Company held FHLB stock of $6,082, $6,402 and $5,568 at December 31, 2010, 2009 and 2008, respectively. The FHLB stock is stated at par value as it is restricted to purchases and sales with the FHLB. The FHLB suspended its stock repurchase and dividend payments during December 2008. During 2010, the FHLB repurchased $320 of capital stock which represented 5.0% of the Bank’s $6,402 investment. Based on current financial information available, management does not believe the FHLB stock value is impaired as of December 31, 2010.
NOTE 13 — OTHER INTANGIBLE ASSETS
Intangible assets include the premium assigned to the core deposit relationships acquired in the Merger. The core deposit intangible is being amortized over ten years on a sum-of-the-years-digits basis. Amortization expense is expected to be as follows:
| 2011 |
$ | 304 | ||
| 2012 |
267 | |||
| 2013 |
230 | |||
| 2014 |
194 | |||
| 2015 |
157 | |||
| 2016 and thereafter |
258 | |||
| Total |
$ | 1,410 | ||
NOTE 14 — DEPOSITS
| December 31, |
2010 | 2009 | ||||||
| Demand – Non-interest bearing |
$ | 113,391 | $ | 109,855 | ||||
| Demand – Interest bearing |
70,989 | 72,477 | ||||||
| Savings |
113,382 | 110,994 | ||||||
| Money markets |
144,206 | 146,189 | ||||||
| Time – Over $100,000 |
85,404 | 78,702 | ||||||
| Time – Other |
163,660 | 127,217 | ||||||
| Total |
$ | 691,032 | $ | 645,434 | ||||
Scheduled maturities of time deposits are as follows:
| 2011 |
$ | 154,411 | ||
| 2012 |
36,378 | |||
| 2013 |
19,638 | |||
| 2014 |
13,076 | |||
| 2015 |
16,698 | |||
| 2016 and thereafter |
8,863 | |||
| Total |
$ | 249,064 | ||
NOTE 15 — OTHER BORROWED FUNDS
At December 31, 2010 and 2009, other borrowed funds consisted of demand notes to the U.S. Treasury, Federal Reserve Bank overnight borrowings, Federal Home Loan Bank overnight borrowings and repurchase agreements.
Short-term borrowings generally have original maturity dates of thirty days or less.
Investment securities with amortized costs and fair values of $24,182 and $25,422, respectively, at December 31, 2010 and $27,256 and $28,546, respectively, at December 31, 2009, were pledged to secure repurchase agreements.
71
| Year Ended December 31, |
2010 | 2009 | ||||||
| Amount outstanding at year end |
$ | 28,082 | $ | 45,598 | ||||
| Average interest rate at year end |
0.39 | % | 0.44 | % | ||||
| Maximum amount outstanding at any month end |
$ | 52,177 | $ | 65,389 | ||||
| Average amount outstanding |
$ | 33,337 | $ | 44,951 | ||||
| Weighted average interest rate during the year |
||||||||
| Federal funds purchased |
0.56 | % | 0.48 | % | ||||
| Federal Home Loan Bank borrowings |
0.56 | % | 0.51 | % | ||||
| Repurchase agreements |
0.75 | % | 1.33 | % | ||||
| Demand notes to U.S. Treasury |
— | — | ||||||
The Company has an available credit facility with the Federal Reserve Bank of Philadelphia in the amount of $34,646, secured by pledged securities with amortized costs and fair values of $34,571 and $35,346, respectively, at December 31, 2010 and $36,678 and $37,699, respectively, at December 31, 2009 and with interest rates of .75% at December 31, 2010 and .50% at December 31, 2009. There is no stated expiration date for the credit facility as long as the Company maintains the pledged securities at the Federal Reserve Bank. There was no outstanding balance as of December 31, 2010 and 2009.
The Company has a $20,325 Borrower in Custody (BIC) line of credit with the Federal Reserve Bank of Philadelphia, secured by commercial loans with an outstanding principal of $27,100 and a collateral value of $20,325 at December 31, 2010. There was no outstanding balance as of December 31, 2010 and 2009.
The Company has the availability of a $5,000 overnight Federal funds line of credit with Wells Fargo. Also, the Company has a $19,000 overnight Federal Funds line with PNC Bank. There was no balance outstanding under either line as of December 31, 2010 and 2009.
The Company maintains a collateralized maximum borrowing capacity of $314,766 with the Federal Home Loan Bank of Pittsburgh. There was a balance of $76,660 outstanding as of December 31, 2010, including $7,825 in short-term borrowings.
NOTE 16 — LONG-TERM DEBT
The loans from the Federal Home Loan Bank of Pittsburgh are secured by a general collateral pledge of the Company’s assets. The Company has agreed to maintain sufficient qualifying collateral to fully secure the borrowings below.
| A summary of long-term debt, including amortizing principal and interest payments, at December 31, 2010 is as follows: |
|
Aggregate maturities of long-term debt at December 31, 2010 are as follows: |
| |||||||||||||||||
|
Monthly Installment |
Fixed Rate | Maturity Date | Balance | December 31, |
Principal | |||||||||||||||
| Amortizing Loans |
||||||||||||||||||||
| $ 29 |
1.84 | % | 08/28/12 | 562 | 2011 | $ | 10,615 | |||||||||||||
| 90 |
3.10 | % | 02/28/13 | 2,262 | 2012 | 10,823 | ||||||||||||||
| 430 |
3.74 | % | 03/13/13 | 11,120 | 2013 | 11,094 | ||||||||||||||
| 18 |
2.66 | % | 08/28/14 | 746 | 2014 | 4,670 | ||||||||||||||
| 67 |
3.44 | % | 03/02/15 | 3,120 | 2015 | 11,135 | ||||||||||||||
| 13 |
3.48 | % | 03/31/15 | 636 | Thereafter | 20,498 | ||||||||||||||
| 10 |
3.83 | % | 04/02/18 | 770 | $ | 68,835 | ||||||||||||||
| 186 |
4.69 | % | 03/13/23 | 20,819 | ||||||||||||||||
| Total amortizing |
40,035 | |||||||||||||||||||
| Non-amortizing loans |
||||||||||||||||||||
| 2.88 | % | 02/28/11 | 2,000 | |||||||||||||||||
| 3.27 | % | 02/29/12 | 2,000 | |||||||||||||||||
| 3.49 | % | 02/28/13 | 7,000 | |||||||||||||||||
| 2.89 | % | 11/28/14 | 2,000 | |||||||||||||||||
| 2.58 | % | 05/18/15 | 6,300 | |||||||||||||||||
| 3.32 | % | 11/27/15 | 3,000 | |||||||||||||||||
| 2.36 | % | 09/22/17 | 6,500 | |||||||||||||||||
| Total non-amortizing |
28,800 | |||||||||||||||||||
| Total long term-debt |
$ | 68,835 | ||||||||||||||||||
72
NOTE 17 — BENEFIT PLANS
The Company provides an Employee Stock Ownership Plan (ESOP), a Retirement Profit Sharing 401(k) Plan, an Employees’ Pension Plan, unfunded supplemental executive defined benefit and defined contribution plans, a Postretirement Life Insurance Plan, a Stock Appreciation Rights Plan (SAR), and a Long-Term Incentive Plan.
Under the ESOP, amounts voted by the Board of Directors are paid into the ESOP and each employee is credited with a share in proportion to their annual compensation. All contributions to the ESOP are invested in or will be invested primarily in Company stock. Distribution of a participant’s ESOP account occurs upon retirement, death or termination in accordance with the plan provisions.
At December 31, 2010 and 2009, the ESOP held 75,555 and 70,604 shares, respectively, of the Company’s stock, all of which were acquired as described above and allocated to specific participant accounts. These shares are treated the same for dividend purposes and earnings per share calculations as are any other outstanding shares of the Company’s stock. The Company contributed $90, $90 and $0 to the ESOP plan during the years ended December 31, 2010, 2009 and 2008, respectively.
Under the Retirement Profit Sharing Plan, amounts approved by the Board of Directors have been paid into a fund and each employee was credited with a share in proportion to their annual compensation. Upon retirement, death or termination, each employee is paid the total amount of their credits in the fund in one of a number of optional ways in accordance with the plan provisions. Effective July 1, 2008, the Retirement Profit Sharing Plan became a 401(k) Deferred Compensation and Profit Sharing Plan for eligible employees. Eligible employees may elect deferrals of up to the maximum amounts permitted by law. The Bank’s contributions included a Safe Harbor contribution of $306, $209 and $202, during the years ended December 31, 2010, 2009 and 2008, respectively, and a discretionary match of $200, $204 and $119 during the years ended December 31, 2010, 2009 and 2008, respectively, equal to one-half of employee deferrals, up to a maximum match of 3%. In 2008, the Company also provided a benefit of $356, allocated to fifty employees who were negatively impacted by the Employees’ Pension Plan freeze in the second quarter of 2008. A portion of this benefit was rolled into the 401(k) plan and the balance used to fund individual Supplemental Employee Retirement Plans (SERP) for the impacted employees.
Under the Employees’ Pension Plan (currently under curtailment), amounts computed on an actuarial basis were being paid by the Company into a trust fund. The plan provided for fixed benefits payable for life upon retirement at the age of 65, based on length of service and compensation levels as defined in the plan. As of June 22, 2008 no further benefits are being accrued in this plan. Plan assets of the trust fund are invested and administered by the Trust Department of Penn Security Bank and Trust Company.
The Unfunded Supplemental Executive Pension Plan (currently under curtailment) provided certain officers with additional retirement benefits to replace benefits lost due to limits imposed on qualified plans by Federal tax law. Benefits under this plan were actuarially computed and recorded as a liability. As of June 22, 2008 no further benefits are being accrued in this plan. Effective July 1, 2008, the Company established an Unfunded Supplemental Executive Defined Contribution Plan to replace 401(k) plan benefits lost due to compensation limits imposed on qualified plans by Federal tax law. The annual benefit is a maximum of 6% of the executive compensation in excess of Federal limits.
The Postretirement Life Insurance Plan is an unfunded, non-vesting defined benefit plan. The plan is non-contributory and provides for a reducing level of term life insurance coverage following retirement. Annual expense amounts are calculated on an actuarial basis and are recorded as a liability.
The Company granted 10,000 SAR’s to an executive on January 3, 2006 at a strike price of $43.00 per share. The Company also granted 8,500 SAR’s to an executive on February 29, 2008 at a strike price of $37.50 per share. All rights vest on a straight-line basis over a five year period and are expected to be settled in cash when exercised. The Company calculates the value of the vested rights using the Black-Scholes method and has recorded an expense of $24 in 2010 and $13 in 2009.
Under the 2008 Long-Term Incentive Plan (the “2008 plan”), the Compensation Committee of the Board of Directors has broad authority with respect to awards granted under the 2008 plan, including, without limitation, the authority to:
| • | Designate the individuals eligible to receive awards under the 2008 plan. |
| • | Determine the size, type and date of grant for individual awards, provided that awards approved by the Committee are not effective unless and until ratified by the Board of Directors. |
| • | Interpret the 2008 plan and award agreements issued with respect to individual participants. |
73
Persons eligible to receive awards under the 2008 Plan include directors, officers, employees, consultants and other service providers of the Company and its subsidiaries, except that incentive stock option may be granted only to individuals who are employees on the date of grant.
The total number of shares of the Company’s common stock available for grant awards under the 2008 plan shall not exceed in the aggregate five percent of the outstanding shares of the Company’s common stock as of February 15, 2008, or 107,400 shares of the Company’s common stock.
The 2008 plan authorizes grants of stock options, stock appreciation rights, dividend equivalents, performance awards, restricted stock and restricted stock units. There was no award during 2010 and $75 during 2009 under this 2008 plan.
Obligations and funded status of the plans:
| Pension Benefits | Other Benefits | |||||||||||||||
| December 31, |
2010 | 2009 | 2010 | 2009 | ||||||||||||
| Change in benefit obligation: |
||||||||||||||||
| Benefit obligation, beginning |
$ | 12,137 | $ | 11,782 | $ | 354 | $ | 327 | ||||||||
| Service cost |
— | — | 6 | 5 | ||||||||||||
| Interest cost |
709 | 701 | 20 | 19 | ||||||||||||
| Amendments |
— | — | — | — | ||||||||||||
| Change in assumptions |
802 | 24 | 11 | 22 | ||||||||||||
| Actuarial (gain) loss |
20 | 244 | 2 | – | ||||||||||||
| Benefits paid |
(673 | ) | (614 | ) | (18 | ) | (19 | ) | ||||||||
| Benefit obligation, ending |
12,995 | 12,137 | 375 | 354 | ||||||||||||
| Change in plan assets: |
||||||||||||||||
| Fair value of plan assets, beginning |
10,685 | 9,971 | — | — | ||||||||||||
| Actual return on plan assets |
911 | 1,328 | — | — | ||||||||||||
| Employer contribution |
— | — | — | — | ||||||||||||
| Benefits paid |
(673 | ) | (614 | ) | — | — | ||||||||||
| Fair value of plan assets, ending |
10,923 | 10,685 | — | — | ||||||||||||
| Funded status at end of year |
$ | (2,072 | ) | $ | (1,452 | ) | $ | (375 | ) | $ | (354 | ) | ||||
| Amounts recognized in the balance sheet consist of: |
||||||||||||||||
| Pension Benefits | Other Benefits | |||||||||||||||
| December 31, |
2010 | 2009 | 2010 | 2009 | ||||||||||||
| Non Current Assets |
$ | 704 | $ | 494 | $ | — | $ | — | ||||||||
| Non Current Liabilities |
$ | 2,072 | $ | 1,452 | $ | 375 | $ | 354 | ||||||||
| Amounts recognized in the accumulated other comprehensive income consist of: |
||||||||||||||||
| Pension Benefits | Other Benefits | |||||||||||||||
| December 31, |
2010 | 2009 | 2010 | 2009 | ||||||||||||
| Prior service costs |
$ | — | $ | — | $ | 7 | $ | 20 | ||||||||
| Net actuarial loss (gain) |
3,579 | 2,845 | 19 | (16 | ) | |||||||||||
| Deferred taxes |
(1,217 | ) | (967 | ) | (9 | ) | (1 | ) | ||||||||
| Net amount recognized |
$ | 2,362 | $ | 1,878 | $ | 17 | $ | 3 | ||||||||
74
Components of net periodic pension cost and other amounts recognized in other comprehensive income:
| Pension Benefits | ||||||||||||
| Years Ended December 31, |
2010 | 2009 | 2008 | |||||||||
| Components of net periodic pension cost: |
||||||||||||
| Service cost |
$ | — | $ | — | $ | 209 | ||||||
| Interest cost |
709 | 701 | 752 | |||||||||
| Expected return on plan assets |
(880 | ) | (819 | ) | (985 | ) | ||||||
| Amortization of prior service cost |
— | — | — | |||||||||
| Amortization of unrecognized net loss |
57 | 194 | 86 | |||||||||
| Curtailment loss |
— | — | 30 | |||||||||
| Net periodic pension cost |
$ | (114 | ) | $ | 76 | $ | 92 | |||||
| Other changes in plan assets and benefit obligations recognized in other comprehensive income: |
||||||||||||
| Net (gain) loss |
734 | (435 | ) | 624 | ||||||||
| Prior service cost |
— | — | (52 | ) | ||||||||
| Deferred tax |
(250 | ) | 148 | (194 | ) | |||||||
| Total recognized in other comprehensive income |
484 | (287 | ) | 378 | ||||||||
| Total recognized in net period pension cost and other comprehensive income |
$370 | $ | (211 | ) | $ | 470 | ||||||
| Other Benefits | ||||||||||||
| Years Ended December 31, |
2010 | 2009 | 2008 | |||||||||
| Components of net periodic pension cost: |
||||||||||||
| Service cost |
$ | 6 | $ | 5 | $ | 5 | ||||||
| Interest cost |
20 | 19 | 18 | |||||||||
| Amortization of prior service cost |
6 | 7 | 7 | |||||||||
| Amortization of unrecognized net gain |
— | — | — | |||||||||
| Net periodic other benefit cost |
32 | 31 | 30 | |||||||||
| Other changes in plan assets and benefit obligations recognized in other comprehensive income: |
| |||||||||||
| Net (gain) loss |
(13 | ) | 21 | 29 | ||||||||
| Prior service cost |
35 | (7 | ) | (7 | ) | |||||||
| Deferred tax |
(8 | ) | (5 | ) | (7 | ) | ||||||
| Total recognized in other comprehensive income |
14 | 9 | 15 | |||||||||
| Total recognized in net period pension cost and other comprehensive income |
$ | 46 | $ | 40 | $ | 45 | ||||||
The estimated net loss for the defined benefit pension plans that will be amortized from accumulated other comprehensive income into net periodic benefit cost over the next fiscal year is $79. There is no estimated amortization of net loss for the defined benefit postretirement plan that will be amortized from accumulated other comprehensive income over the next fiscal year.
Weighted-average assumptions used to determine benefit obligations were as follows:
| Pension Benefits | Other Benefits | |||||||||||||||
| December 31, |
2010 | 2009 | 2010 | 2009 | ||||||||||||
| Discount rate |
5.50 | % | 6.00 | % | 5.50 | % | 5.75 | % | ||||||||
| Expected long-term return on plan assets |
8.50 | % | 8.50 | % | — | — | ||||||||||
| Rate of compensation increase |
— | — | 3.50 | % | 3.50 | % | ||||||||||
The expected long-term return on plan assets was determined using average historical returns of the Company’s plan assets.
The Company’s pension plan weighted-average asset allocations at December 31, 2010 and 2009, by asset category are as follows:
75
| Plan Assets at December 31, |
2010 | 2009 | ||||||
| Asset Category |
||||||||
| Equity securities |
53.5 | % | 50.3 | % | ||||
| Corporate bonds |
26.6 | 28.9 | ||||||
| U.S. Government securities |
18.1 | 18.7 | ||||||
| Cash and cash equivalents |
1.8 | 2.1 | ||||||
| 100.0 | % | 100.0 | % | |||||
Fair Value Measurement at December 31, 2010
| Asset Category |
Total | Quoted Prices in Active Markets for Identical Assets (Level I) |
Significant Observable Inputs (Level II) |
Significant Observable Inputs (Level III) |
||||||||||||
| Cash |
$ | 198 | $ | 198 | $ | — | $ | — | ||||||||
| Equity securities: |
||||||||||||||||
| U.S. large cap |
5,537 | 5,537 | — | — | ||||||||||||
| International |
310 | 310 | — | — | ||||||||||||
| Fixed income securities: |
||||||||||||||||
| U.S. Treasuries |
1,171 | — | 1,171 | — | ||||||||||||
| U.S. Government Agencies |
804 | — | 804 | — | ||||||||||||
| Corporate bonds |
2,903 | — | 2,903 | — | ||||||||||||
| Total |
$ | 10,923 | $ | 6,045 | $ | 4,878 | $ | — | ||||||||
The Company investment policies and strategies include:
1.) The Trust and Investment Division’s equity philosophy is Large-Cap Core with a value bias. We invest in individual high-grade common stocks that are selected from our approved list.
2.) Diversification is maintained by having no more than 20% in any industry sector and no individual equity representing more than 10% of the portfolio.
3.) The fixed income style is conservative but also responsive to the various needs of our individual clients. For our “Fixed Income” securities, we buy U.S. Government bonds and Agencies or high-grade Corporate rated “A” or better. The Company targets the following allocation percentages: cash equivalents 10%, fixed income 40% and equities 50%.
There is no Company stock included in equity securities at December 31, 2010 or 2009.
Contributions
The Company does not expect to contribute to the Employees’ Pension Plan in 2011. The Company expects to contribute $19 to its Postretirement Life Insurance Plan in 2011.
Estimated Future Benefit Payments
The following benefit payments, which reflect expected future service, as appropriate, are expected to be paid in the next five years and in the aggregate for the five years thereafter:
| Pension Benefits | Other Benefits | |||||||
| 2011 |
$ | 621 | $ | 19 | ||||
| 2012 |
633 | 18 | ||||||
| 2013 |
691 | 18 | ||||||
| 2014 |
713 | 19 | ||||||
| 2015 |
762 | 21 | ||||||
| 2016-2020 |
4,085 | 110 | ||||||
76
NOTE 18 — INCOME TAXES
The total income taxes in the Statements of Income are as follows:
| Years Ended December 31, |
2010 | 2009 | 2008 | |||||||||
| Currently payable |
$ | 2,630 | $ | 1,828 | $ | 2,214 | ||||||
| Deferred provision |
737 | 60 | 244 | |||||||||
| Total |
$ | 3,367 | $ | 1,888 | $ | 2,458 | ||||||
A reconciliation of income taxes at statutory rates to applicable income taxes reported in the Statements of Income is as follows:
| Years Ended December 31, |
2010 | 2009 | 2008 | |||||||||
| Tax at statutory rate |
$ | 5,130 | $ | 3,488 | $ | 3,764 | ||||||
| Reduction for non-taxable interest |
(1,886 | ) | (1,855 | ) | (1,409 | ) | ||||||
| Disallowed merger costs |
— | 146 | — | |||||||||
| Other additions |
123 | 109 | 103 | |||||||||
| Applicable Income Taxes |
$ | 3,367 | $ | 1,888 | $ | 2,458 | ||||||
The components of the deferred income tax provision, which result from temporary differences, are as follows:
| Years Ended December 31, |
2010 | 2009 | 2008 | |||||||||
| Accretion of discount on bonds |
$ | 9 | $ | (42 | ) | $ | (6 | ) | ||||
| Accelerated depreciation |
(51 | ) | 355 | 316 | ||||||||
| Supplemental benefit plans |
(8 | ) | (8 | ) | (46 | ) | ||||||
| Allowance for loan losses |
(107 | ) | (368 | ) | (196 | ) | ||||||
| Purchase accounting accretion, net |
794 | 390 | — | |||||||||
| Other-than-temporary impairment loss |
103 | (267 | ) | — | ||||||||
| Alternative minimum tax |
(3 | ) | — | — | ||||||||
| Prepaid pension cost |
— | — | 7 | |||||||||
| Accrued liabilities |
— | — | 169 | |||||||||
| Total |
$ | 737 | $ | 60 | $ | 244 | ||||||
The significant components of deferred tax assets and liabilities are as follows:
| December 31, |
2010 | 2009 | ||||||
| Deferred tax assets: |
||||||||
| Allowance for loan losses |
$ | 2,074 | $ | 1,967 | ||||
| Accrued pension costs |
704 | 494 | ||||||
| Accrued supplemental benefit plans |
62 | 54 | ||||||
| Purchase accounting |
833 | 1,627 | ||||||
| Other-than-temporary impairment loss |
164 | 267 | ||||||
| AMT |
82 | 79 | ||||||
| Post retirement benefits |
2 | 2 | ||||||
| Total Deferred Tax Assets |
3,921 | 4,490 | ||||||
| Deferred tax liabilities: |
||||||||
| Unrealized securities gains |
566 | 1,183 | ||||||
| Accumulated accretion |
19 | 10 | ||||||
| Accumulated depreciation |
439 | 490 | ||||||
| Total Deferred Tax Liabilities |
1,024 | 1,683 | ||||||
| Net Deferred Tax Assets |
$ | 2,897 | $ | 2,807 | ||||
In management’s opinion, the deferred tax assets are realizable in as much as there is a history of strong earnings and a carryback potential greater than the deferred tax assets. Management is not aware of any evidence that would preclude the realization of the benefit in the future and, accordingly, has not established a valuation allowance against the deferred tax assets.
77
NOTE 19 — ACCUMULATED OTHER COMPREHENSIVE INCOME
Accumulated other comprehensive income was ($1,280), $413 and ($1,943) at December 31, 2010, 2009 and 2008, respectively.
Other Comprehensive Income
The components of other comprehensive income are reported net of related tax effects in the Consolidated Statements of Changes in Stockholders’ Equity.
A reconciliation of other comprehensive income for the years ended December 31, 2010, 2009 and 2008 is as follows:
| 2010 |
Before-Tax Amount |
Tax (Expense) Benefit |
Net-of-Tax Amount |
|||||||||
| Unrealized losses on available-for-sale securities: |
||||||||||||
| Unrealized losses arising during the year |
$ | (1,253 | ) | $ | 426 | $ | (827 | ) | ||||
| Less: Reclassification adjustment for gains realized in income |
558 | (190 | ) | 368 | ||||||||
| Net unrealized losses |
(1,811 | ) | 616 | (1,195 | ) | |||||||
| Change in funded status of employee benefit plans |
(755 | ) | 257 | (498 | ) | |||||||
| Other Comprehensive Income |
$ | (2,566 | ) | $ | 873 | $ | (1,693 | ) | ||||
| 2009 |
Before-Tax Amount |
Tax (Expense) Benefit |
Net-of-Tax Amount |
|||||||||
| Unrealized gains on available-for-sale securities: |
||||||||||||
| Unrealized gains arising during the year |
$ | 3,221 | $ | (1,096 | ) | $ | 2,125 | |||||
| Less: Reclassification adjustment for gains realized in income |
873 | (297 | ) | 576 | ||||||||
| Recognition of other-than-temporary impairment losses |
(787 | ) | 267 | (520 | ) | |||||||
| Net unrealized gains |
3,135 | (1,066 | ) | 2,069 | ||||||||
| Change in funded status of employee benefit plans |
435 | (148 | ) | 287 | ||||||||
| Other Comprehensive Income |
$ | 3,570 | $ | (1,214 | ) | $ | 2,356 | |||||
| 2008 |
Before-Tax Amount |
Tax (Expense) Benefit |
Net-of-Tax Amount |
|||||||||
| Unrealized losses on available-for-sale securities: |
||||||||||||
| Unrealized losses arising during the year |
$ | (1,092 | ) | $ | 371 | $ | (721 | ) | ||||
| Less: Reclassification adjustment for gains realized in income |
12 | (5 | ) | 7 | ||||||||
| Net unrealized losses |
(1,104 | ) | 376 | (728 | ) | |||||||
| Change in funded status of employee benefit plans |
(595 | ) | 202 | (393 | ) | |||||||
| Other Comprehensive Income |
$ | (1,699 | ) | $ | 578 | $ | (1,121 | ) | ||||
NOTE 20 — COMMITMENTS AND CONTINGENT LIABILITIES
In the normal course of business, there are outstanding commitments and contingent liabilities, created under prevailing terms and collateral requirements such as commitments to extend credit, financial guarantees and letters of credit, which are not reflected in the accompanying Financial Statements. The Company does not anticipate any losses as a result of these transactions. These instruments involve, to varying degrees, elements of credit and interest rate risk in excess of the amount recognized in the Balance Sheets.
The contract or notional amounts of those instruments reflect the extent of involvement the Company has in particular classes of financial instruments.
78
Financial instruments whose contract amounts represent credit risk at December 31, 2010 and 2009 are as follows:
| 2010 | 2009 | |||||||
| Commitments to extend credit: |
||||||||
| Fixed rate |
$ | 53,011 | $ | 39,576 | ||||
| Variable rate |
$ | 96,036 | $ | 87,454 | ||||
| Standby letters of credit |
$ | 15,969 | $ | 16,091 | ||||
Commitments to extend credit are agreements to lend to a customer as long as there is no violation of any condition established in the contract. Commitments generally have expiration dates of one year or less or other termination clauses and may require payment of a fee. Since many of the commitments are expected to expire without being drawn upon, the total commitment amounts do not necessarily represent future cash requirements.
Standby letters of credit are conditional commitments issued to guarantee the performance of a customer to a third party. The credit risk involved in issuing letters of credit is essentially the same as that involved in extending loan facilities to customers.
Various actions and proceedings are presently pending to which the Company is a party. Management is of the opinion that the aggregate liabilities, if any, arising from such actions would not have a material adverse effect on the financial position of the Company.
NOTE 21 — FAIR VALUE MEASUREMENTS
The following table sets forth the Company’s financial assets that were accounted for at fair value and are classified in their entirety based on the lowest level of input that is significant to the fair value measurement.
Level I - Quoted prices (unadjusted) in active markets for identical assets or liabilities that the Company has the ability to access at the measurement date.
Level II - Observable inputs other than Level I prices, such as quoted prices for similar assets or liabilities in active markets; quoted prices in markets that are not active for identical or similar assets or liabilities; or other inputs that are observable or can be corroborated by observable market data for substantially the full term of the assets or liabilities.
Level III - Unobservable inputs that are supported by little or no market activity and significant to the fair value of the assets or liabilities that are developed using the reporting entities’ estimates and assumptions, which reflect those that market participants would use.
Assets and Liabilities Measured at Fair Value on a Recurring Basis
A description of the valuation methodologies used for financial assets measured at fair value on a recurring basis, as well as the classification of the assets pursuant to the valuation hierarchy, are as follows:
Securities Available-for-Sale
Securities classified as available-for-sale are reported using Level I, Level II and Level III inputs. Level I instruments generally include equity securities valued in accordance with quoted market prices in active markets. Level II instruments include U.S. government agency obligations, state and municipal bonds, mortgage-backed securities and corporate bonds. For these securities, the Company obtains fair value measurements from an independent pricing service. The fair value measurements consider observable data that may include dealer quotes, market spreads, cash flows, the U.S. Treasury yield curve, live trading levels, trade execution data, market consensus prepayment speeds, credit information and the bond’s terms and conditions, among other things. Level III instruments include certain non-public equity securities and real estate sold under contract. See Note 3 – Investment Securities for additional information.
79
Assets and liabilities measured at fair value on a recurring basis are as follows:
| December 31, 2010 | ||||||||||||||||
| Level I | Level II | Level III | Total | |||||||||||||
| Assets: |
||||||||||||||||
| Securities available-for-sale |
||||||||||||||||
| U.S. Agency securities |
$ | — | $ | 79,294 | $ | — | $ | 79,294 | ||||||||
| Mortgage-backed securities: |
||||||||||||||||
| Residential |
— | 26,370 | — | 26,370 | ||||||||||||
| States & political subdivisions: |
||||||||||||||||
| Bank qualified tax exempt |
— | 62,558 | — | 62,558 | ||||||||||||
| Corporate securities: |
||||||||||||||||
| Aaa credit rating |
— | 4,090 | — | 4,090 | ||||||||||||
| Equity securities: |
||||||||||||||||
| Financial services industry |
985 | — | — | 985 | ||||||||||||
| Total securities available-for-sale |
$ | 985 | $ | 172,312 | $ | — | $ | 173,297 | ||||||||
| December 31, 2009 | ||||||||||||||||
| Level I | Level II | Level III | Total | |||||||||||||
| Assets: |
||||||||||||||||
| Securities available-for-sale |
||||||||||||||||
| U.S. Agency securities |
$ | — | $ | 54,695 | $ | — | $ | 54,695 | ||||||||
| Mortgage-backed securities: |
||||||||||||||||
| Residential |
— | 17,567 | — | 17,567 | ||||||||||||
| States & political subdivisions: |
||||||||||||||||
| Bank qualified tax exempt |
— | 75,433 | — | 75,433 | ||||||||||||
| Equity securities: |
||||||||||||||||
| Financial services industry |
1,384 | — | — | 1,384 | ||||||||||||
| Total securities available-for-sale |
$ | 1,384 | $ | 147,695 | $ | — | $ | 149,079 | ||||||||
During 2009, the Company recognized a $50 other-than-temporary impairment charge to an available-for-sale security that was in Level III at $50 during the year ended December 31, 2008.
Assets Measured at Fair Value on a Nonrecurring Basis
Disclosure of non-financial assets and non-financial liabilities became effective January 1, 2009. Certain non-financial assets and non-financial liabilities, measured at fair value on a non-recurring basis, include foreclosed assets, goodwill and intangible assets.
A description of the valuation methodologies and classification levels used for non-financial assets and non-financial liabilities measured at fair value on a nonrecurring basis are listed below.
Goodwill and Other Identifiable Intangibles
The Company employs general industry practices in evaluating the fair value of its goodwill and other identifiable intangibles. The Company calculates the fair value, with the assistance of a third party specialist, using a combination of the following valuation methods: dividend discount analysis under the income approach, which calculates the present value of all excess cash flows plus the present value of a terminal value and market multiples (pricing ratios) under the market approach. Management performed a review of goodwill and other identifiable intangibles as of December 31, 2010.
Impaired Loans
At December 31, 2010 certain impaired loans were remeasured and reported at fair value through a specific valuation allowance allocation of the allowance for loan losses based upon the fair value of the underlying collateral and the evaluation of expected future cash flows. Impaired loans with a carrying value of $4,493 were reduced by a specific valuation allowance allocation totaling $1,415, to a total reported fair value of $3,078 based on collateral valuations utilizing Level III valuation inputs.
80
Other Real Estate Owned
Other real estate owned, which at December 31, 2010 and 2009 also included a real estate sales contract of $0 and $123, respectively, was adjusted to fair values with any impairment charge included in earnings for the year. Foreclosed real estate, which is considered to be non-financial assets, has been valued using a market approach. The values were determined using market prices of similar real estate assets, which the Company considered to be Level II inputs.
Certain assets measured at fair value on a non-recurring basis as of December 31, 2010 is as follows:
| Fair Value Measurement Using | ||||||||||||||||
| Quoted Prices in Active Markets for Identical Assets/Liabilities |
Significant
Other Observable Inputs |
Significant Unobservable Inputs |
Balance December 31, 2010 |
|||||||||||||
| Level I | Level II | Level III | Total | |||||||||||||
| Assets |
||||||||||||||||
| Core deposit intangible |
$ | — | $ | — | $ | 1,410 | $ | 1,410 | ||||||||
| Impaired loans |
— | — | 4,493 | 4,493 | ||||||||||||
| Goodwill |
— | — | 26,398 | 26,398 | ||||||||||||
| Federal Home Loan Bank stock |
— | — | 6,082 | 6,082 | ||||||||||||
| Other real-estate owned |
— | 803 | — | 803 | ||||||||||||
| Total non-financial assets |
$ | — | $ | 803 | $ | 38,383 | $ | 39,186 | ||||||||
|
Certain assets measured at fair value on a non-recurring basis for the year ended December 31, 2009 is as follows:
|
| |||||||||||||||
| Fair Value Measurement Using | ||||||||||||||||
| Quoted Prices in Active Markets for Identical Assets/Liabilities |
Significant Other Observable Inputs |
Significant Unobservable Inputs |
Balance December 31, 2009 |
|||||||||||||
| Level I | Level II | Level III | Total | |||||||||||||
| Assets |
||||||||||||||||
| Core deposit intangible |
$ | — | $ | — | $ | 1,751 | $ | 1,751 | ||||||||
| Goodwill |
— | — | 26,398 | 26,398 | ||||||||||||
| Federal Home Loan Bank stock |
— | — | 6,402 | 6,402 | ||||||||||||
| Other real-estate owned |
— | 405 | 123 | 528 | ||||||||||||
| Total non-financial assets |
$ | — | $ | 405 | $ | 34,674 | $ | 35,079 | ||||||||
A reconciliation of items in Level III for the year ended December 31, 2010 is as follows:
| Core deposit intangible |
Impaired Loans |
Goodwill | Federal Home Loan Bank Stock |
Real estate sold under contract |
Total | |||||||||||||||||||
| Balance December 31, 2009 |
$ | 1,751 | $ | — | $ | 26,398 | $ | 6,402 | $ | 123 | $ | 34,674 | ||||||||||||
| Amortization of core deposit intangible |
(341 | ) | — | — | — | — | (341 | ) | ||||||||||||||||
| Increase in impaired loans |
— | 5,073 | — | — | — | 5,073 | ||||||||||||||||||
| Decrease in impaired loans |
— | (580 | ) | — | — | — | (580 | ) | ||||||||||||||||
| Payments received |
— | — | — | (320 | ) | (123 | ) | (443 | ) | |||||||||||||||
| Balance December 31, 2010 |
$ | 1,410 | $ | 4,493 | $ | 26,398 | $ | 6,082 | $ | — | $ | 38,383 | ||||||||||||
81
A reconciliation of items in Level III for the year ended December 31, 2009 is as follows:
| Core deposit intangible |
Goodwill | Federal Home Loan Bank Stock |
Real estate sold under contract |
Total | ||||||||||||||||
| Balance December 31, 2008 |
$ | — | $ | — | $ | 5,568 | $ | — | $ | 5,568 | ||||||||||
| Additions due to the Merger |
2,027 | 26,398 | 834 | 129 | 29,388 | |||||||||||||||
| Amortization of core deposit intangible |
(276 | ) | — | — | — | (276 | ) | |||||||||||||
| Payments received |
— | — | — | (6 | ) | (6 | ) | |||||||||||||
| Balance December 31, 2009 |
$ | 1,751 | $ | 26,398 | $ | 6,402 | $ | 123 | $ | 34,674 | ||||||||||
Disclosures about Fair Value of Financial Instruments
General Accepted Accounting Principles (GAAP) require disclosure of the estimated fair value of an entity’s assets and liabilities considered to be financial instruments. For the Company, as for most financial institutions, the majority of its assets and liabilities are considered financial instruments. However, many such instruments lack an available trading market, as characterized by a willing buyer and seller engaging in an exchange transaction. Also, it is the Company’s general practice and intent to hold its financial instruments to maturity and not to engage in trading or sales activities, except for certain loans and investments. Therefore, the Company had to use significant estimates and present value calculations to prepare this disclosure.
Changes in the assumptions or methodologies used to estimate fair values may materially affect the estimated amounts. Also, management is concerned that there may not be reasonable comparability between institutions due to the wide range of permitted assumptions and methodologies in the absence of active markets. This lack of uniformity gives rise to a high degree of subjectivity in estimating financial instrument fair values.
Estimated fair values have been determined by the Company using the best available data and an estimation methodology suitable for each category of financial instruments. The estimation methodologies used at December 31, 2010 and December 31, 2009 are outlined below. The methodologies for estimating the fair value of financial assets and financial liabilities that are measured at fair value on a recurring or non-recurring basis are discussed in the fair value measurements section above. The estimated fair value approximates carrying value for cash and cash equivalents, accrued interest and the cash surrender value of life insurance policies. The methodologies for other financial assets and financial liabilities are discussed below:
Short-term financial instruments
The carrying value of short-term financial instruments including cash and due from banks, federal funds sold, interest-bearing deposits in banks and other short-term investments and borrowings, approximates the fair value of these instruments. These financial instruments generally expose the Company to limited credit risk and have no stated maturities or have short-term maturities with interest rates that approximate market rates.
Investment securities held-to-maturity
The estimated fair values of investment securities held to maturity are based on quoted market prices, provided by independent third parties that specialize in those investment sectors. If quoted market prices are not available, estimated fair values are based on quoted market prices of comparable instruments.
Federal Home Loan Bank Stock
Federal Home Loan Bank of Pittsburgh (FHLB) stock is a required investment in order for the Company to participate in a FHLB line of credit program. The FHLB stock is stated at par value as it is restricted to purchases and sales with the FHLB. The FHLB had indefinitely suspended its stock repurchase and dividend payments during December 2008. During the third quarter of 2010, the FHLB repurchased $320 of capital stock which represented 5.0% of the Bank’s $6,402 investment. Based on current financial information available, management does not believe the FHLB stock value is impaired as of December 31, 2010.
82
Loans
The loan portfolio, net of unearned income, has been valued by a third party specialist using quoted market prices, if available. When market prices were not available, a credit risk based present value discounted cash flow analysis was utilized. The primary assumptions utilized in this analysis are the discount rate based on the libor curve, adjusted for credit risk, and prepayment estimates based on factors such as refinancing incentives, age of the loan and seasonality. These assumptions were applied by loan category and different spreads were applied based upon prevailing market rates by category.
Deposits
The estimated fair values of demand deposits (i.e., interest and non-interest bearing checking accounts, savings and money market accounts) are, by definition, equal to the amount payable on demand at the reporting date (i.e., their carrying amounts). The fair value for certificates of deposit was calculated by an independent third party by discounting contractual cash flows using current market rates for instruments with similar maturities, using a credit based risk model. The carrying amount of accrued interest receivable and payable approximates fair value.
Long-term borrowings
The amounts assigned to long-term borrowings was based on quoted market prices, when available, or were based on discounted cash flow calculations using prevailing market interest rates for debt of similar terms.
The carrying and fair values of certain financial instruments were as follows:
| December 31, 2010 | December 31, 2009 | |||||||||||||||
| Carrying Amount |
Fair Value | Carrying Amount |
Fair Value | |||||||||||||
| Cash and cash equivalents |
$ | 14,219 | $ | 14,219 | $ | 13,374 | $ | 13,374 | ||||||||
| Investment securities held-to-maturity |
43,747 | 45,218 | 46,851 | 49,054 | ||||||||||||
| Loans, net |
608,605 | 620,040 | 597,670 | 606,814 | ||||||||||||
| Cash surrender value of life insurance |
15,380 | 15,380 | 14,380 | 14,380 | ||||||||||||
| Federal Home Loan Bank stock |
6,082 | 6,082 | 6,402 | 6,402 | ||||||||||||
| Demand deposits |
441,968 | 441,968 | 439,515 | 439,515 | ||||||||||||
| Time deposits |
249,064 | 251,779 | 205,919 | 208,205 | ||||||||||||
| Short-term borrowings |
28,082 | 28,082 | 45,598 | 45,598 | ||||||||||||
| Long-term borrowings |
68,835 | 71,309 | 68,094 | 69,853 | ||||||||||||
| Standby Letters of Credit |
$ | (164 | ) | $ | (164 | ) | $ | (161 | ) | $ | (161 | ) | ||||
NOTE 22 — OPERATING LEASES
The Company leases the land upon which the Mount Pocono Office was built and the land upon which a drive-up ATM was built on Meadow Avenue, Scranton. The Company also leases space at several locations which are being used as remote banking facilities. Rental expense was $94 in 2010, $87 in 2009 and $85 in 2008. All leases contain renewal options. The Mount Pocono and the Meadow Avenue leases contain the right of first refusal for the purchase of the properties and provisions for annual rent adjustments based upon the Consumer Price Index.
Future minimum rental commitments under these leases at December 31, 2010 are as follows:
| Mount Pocono |
Meadow Avenue |
ATM Sites |
Total | |||||||||||||
| 2011 |
$ | 66 | $ | 16 | $ | 8 | $ | 90 | ||||||||
| 2012 |
66 | — | — | 66 | ||||||||||||
| 2013 |
66 | — | — | 66 | ||||||||||||
| 2014 |
66 | — | — | 66 | ||||||||||||
| 2015 and beyond |
94 | — | — | 94 | ||||||||||||
| Total minimum payments required |
$ | 358 | $ | 16 | $ | 8 | $ | 382 | ||||||||
83
NOTE 23 — LOANS TO DIRECTORS, PRINCIPAL OFFICERS AND RELATED PARTIES
The Company has had, and may be expected to have in the future, banking transactions in the ordinary course of business with directors, principal officers, their immediate families and affiliated companies in which they are principal stockholders (commonly referred to as related parties), on the same terms, including interest rates and collateral, as those prevailing at the time for comparable transactions with others. A summary of loans to directors, principal officers and related parties is as follows:
| Years Ended December 31, |
2010 | 2009 | ||||||
| Beginning Balance |
$ | 13,067 | $ | 10,016 | ||||
| Additions |
2,459 | 4,083 | ||||||
| Reclassifications |
(1,094) | (20) | ||||||
| Collections |
(2,197) | (1,012) | ||||||
| Ending Balance |
$ | 12,235 | $ | 13,067 | ||||
In addition to the loan amounts shown above, the Bank has issued standby letters of credit for the accounts of related parties in the amount of $7,785.
NOTE 24 — REGULATORY MATTERS
The Company and the Bank are subject to various regulatory capital requirements administered by the Federal banking agencies. Failure to meet minimum capital requirements can initiate certain mandatory—and possibly additional discretionary—actions by regulators that, if undertaken, could have a direct material effect on the Company and the Bank’s Consolidated Financial Statements. Under capital adequacy guidelines and the regulatory framework for prompt corrective action, the Company and the Bank must meet specific capital guidelines that involve quantitative measures of their assets, liabilities, and certain off-balance sheet items as calculated under regulatory accounting practices. The Company and the Bank’s capital amounts and classifications are also subject to qualitative judgments by the regulators about components, risk weightings and other factors.
Quantitative measures established by regulation to ensure capital adequacy require the Company and the Bank to maintain minimum amounts and ratios (set forth in the Capital Adequacy table on the following page) of Tier I and Total Capital to risk-weighted assets and of Tier I Capital to average assets (Leverage ratio). The table also presents the Company’s actual capital amounts and ratios. Management believes, as of December 31, 2010, that the Company and the Bank meet all capital adequacy requirements to which they are subject.
As of June 30, 2010, the most recent regulatory notifications categorized the Bank as “well capitalized” under the regulatory framework for prompt corrective action. To be categorized as “well capitalized”, the Bank must maintain minimum Tier I Capital, Total Capital and Leverage ratios as set forth in the Capital Adequacy table. There are no conditions or events since that notification that management believes have changed the Company’s categorization by the FDIC.
The Company and Bank are also subject to minimum capital levels, which could limit the payment of dividends, although the Company and Bank currently have capital levels which are in excess of minimum capital level ratios required.
The Pennsylvania Banking Code restricts capital funds available for payment of dividends to the retained earnings of the Bank. The balances in the capital stock and surplus accounts are unavailable for dividends.
In addition, the Bank is subject to restrictions imposed by Federal law on certain transactions with the Company’s affiliates. These transactions include extensions of credit, purchases of or investments in stock issued by the affiliate, purchases of assets subject to certain exceptions, acceptance of securities issued by an affiliate as collateral for loans, and the issuance of guarantees, acceptances, and letters of credit on behalf of affiliates. These restrictions prevent the Company’s affiliates from borrowing from the Bank unless the loans are secured by obligations of designated amounts. Further, the aggregate of such transactions by the Bank with a single affiliate is limited in amount to 10 percent of the Bank’s Capital Stock and Surplus, and the aggregate of such transactions with all affiliates is limited to 20 percent of the Bank’s capital stock and surplus. The Federal Reserve System has interpreted “capital stock and surplus” to include undivided profits.
84
| Actual |
Regulatory Requirements | |||||||||||||||||||||||||||||||||||||||
| For Capital | To Be | |||||||||||||||||||||||||||||||||||||||
| Adequacy Purposes | “Well Capitalized” | |||||||||||||||||||||||||||||||||||||||
| As of December 31, 2010 |
Amount | Ratio | Amount | Ratio | Amount | Ratio | ||||||||||||||||||||||||||||||||||
| Total Capital (to Risk Weighted Assets) |
||||||||||||||||||||||||||||||||||||||||
| PFSC (Company) |
$ | 98,220 | 16.42 | % | > | $ | 47,852 | > | 8.0 | % | > | N/A | N/A | |||||||||||||||||||||||||||
| PSB (Bank) |
$ | 94,455 | 15.81 | % | > | $ | 47,808 | > | 8.0 | % | > | $ | 59,760 | > | 10.0 | % | ||||||||||||||||||||||||
| Tier 1 Capital (to Risk Weighted Assets) |
||||||||||||||||||||||||||||||||||||||||
| PFSC (Company) |
$ | 91,499 | 15.30 | % | > | $ | 23,926 | > | 4.0 | % | > | N/A | N/A | |||||||||||||||||||||||||||
| PSB (Bank) |
$ | 87,955 | 14.72 | % | > | $ | 23,904 | > | 4.0 | % | > | $ | 35,856 | > | 6.0 | % | ||||||||||||||||||||||||
| Tier 1 Capital (to Average Assets) |
||||||||||||||||||||||||||||||||||||||||
| PFSC (Company) |
$ | 91,499 | 10.68 | % | > | $ | * | > | * | > | N/A | N/A | ||||||||||||||||||||||||||||
| PSB (Bank) |
$ | 87,955 | 10.32 | % | > | $ | * | > | * | > | $ | 42,607 | > | 5.0 | % | |||||||||||||||||||||||||
| PFSC – *3.0% ($25,696), 4.0% ($34,261) or 5.0% ($42,826) depending on the bank’s CAMELS Rating and other regulatory risk factors. |
||||||||||||||||||||||||||||||||||||||||
| PSB – *3.0% ($25,564), 4.0% ($34,086) or 5.0% ($42,607) depending on the bank’s CAMELS Rating and other regulatory risk factors. |
||||||||||||||||||||||||||||||||||||||||
| Actual |
Regulatory Requirements | |||||||||||||||||||||||||||||||||||||||
| For Capital | To Be | |||||||||||||||||||||||||||||||||||||||
| Adequacy Purposes | “Well Capitalized” | |||||||||||||||||||||||||||||||||||||||
| As of December 31, 2009 |
Amount | Ratio | Amount | Ratio | Amount | Ratio | ||||||||||||||||||||||||||||||||||
| Total Capital (to Risk Weighted Assets) |
||||||||||||||||||||||||||||||||||||||||
| PFSC (Company) |
$ | 95,492 | 16.90 | % | > | $ | 45,198 | > | 8.0 | % | > | N/A | N/A | |||||||||||||||||||||||||||
| PSB (Bank) |
$ | 92,077 | 16.31 | % | > | $ | 45,170 | > | 8.0 | % | > | $ | 56,463 | > | 10.0 | % | ||||||||||||||||||||||||
| Tier 1 Capital (to Risk Weighted Assets) |
||||||||||||||||||||||||||||||||||||||||
| PFSC (Company) |
$ | 89,192 | 15.79 | % | > | $ | 22,599 | > | 4.0 | % | > | N/A | N/A | |||||||||||||||||||||||||||
| PSB (Bank) |
$ | 85,777 | 15.19 | % | > | $ | 22,585 | > | 4.0 | % | > | $ | 33,878 | > | 6.0 | % | ||||||||||||||||||||||||
| Tier 1 Capital (to Average Assets) |
||||||||||||||||||||||||||||||||||||||||
| PFSC (Company) |
$ | 89,192 | 11.48 | % | > | $ | * | > | * | > | N/A | N/A | ||||||||||||||||||||||||||||
| PSB (Bank) |
$ | 85,777 | 11.09 | % | > | $ | * | > | * | > | $ | 38,658 | > | 5.0 | % | |||||||||||||||||||||||||
| PFSC – *3.0% ($22,308), 4.0% ($31,077) or 5.0% ($38,846) depending on the bank’s CAMELS Rating and other regulatory risk factors. |
||||||||||||||||||||||||||||||||||||||||
| PSB – *3.0% ($23,195), 4.0% ($30,926) or 5.0% ($38,658) depending on the bank’s CAMELS Rating and other regulatory risk factors. |
||||||||||||||||||||||||||||||||||||||||
85
NOTE 25 — PENSECO FINANCIAL SERVICES CORPORATION (PARENT CORPORATION)
The condensed Company-only information follows:
BALANCE SHEETS
| December 31, |
2010 | 2009 | ||||||
| Cash |
$ | 11 | $ | 16 | ||||
| Interest bearing balances with banks |
2,611 | 2,240 | ||||||
| Cash and Cash Equivalents |
2,622 | 2,256 | ||||||
| Investment in bank subsidiary |
118,324 | 113,840 | ||||||
| Equity investments |
953 | 1,352 | ||||||
| Other assets |
25 | 23 | ||||||
| Total Assets |
$ | 121,924 | $ | 117,471 | ||||
| Total Liabilities |
$ | 2 | $ | 74 | ||||
| Total Stockholders’ Equity |
121,922 | 117,397 | ||||||
| Total Liabilities and Stockholders’ Equity |
$ | 121,924 | $ | 117,471 | ||||
STATEMENTS OF INCOME
| Years Ended December 31, |
2010 | 2009 | 2008 | |||||||||
| Dividends from bank subsidiary |
$ | 5,504 | $ | 5,031 | $ | 3,565 | ||||||
| Dividends on investment securities |
31 | 40 | 91 | |||||||||
| Interest on balances with banks |
7 | 11 | 19 | |||||||||
| Impairment losses on investment securities |
— | (787 | ) | — | ||||||||
| Gain on sale of equities |
462 | 4 | 1 | |||||||||
| Total income |
6,004 | 4,299 | 3,676 | |||||||||
| Other non-interest expense |
17 | 13 | 18 | |||||||||
| Provision (benefit) for income taxes |
173 | (294 | ) | 26 | ||||||||
| Net income before undistributed earnings of bank subsidiary |
5,814 | 4,580 | 3,632 | |||||||||
| Undistributed earnings of bank subsidiary |
5,908 | 3,792 | 4,981 | |||||||||
| Net Income |
$ | 11,722 | $ | 8,372 | $ | 8,613 | ||||||
86
STATEMENTS OF CASH FLOWS
| Years Ended December 31, |
2010 | 2009 | 2008 | |||||||||
| Operating Activities: |
||||||||||||
| Net income |
$ | 11,722 | $ | 8,372 | $ | 8,613 | ||||||
| Adjustments to reconcile net income to net cash provided by operating activities: |
||||||||||||
| Deferred income tax expense (benefit) |
104 | (268 | ) | — | ||||||||
| Gain on sale of equities |
(462 | ) | (4 | ) | (1 | ) | ||||||
| Other-than-temporary impairment loss |
— | 787 | — | |||||||||
| Equity in undistributed net income of bank subsidiary |
(5,908 | ) | (3,792 | ) | (4,981 | ) | ||||||
| Increase in other assets |
(2 | ) | (23 | ) | — | |||||||
| Increase (decrease) in other liabilities |
70 | (4 | ) | (48 | ) | |||||||
| Net cash provided by operating activities |
5,524 | 5,068 | 3,583 | |||||||||
| Investing Activities: |
||||||||||||
| Purchase of equity investments |
(361 | ) | — | — | ||||||||
| Proceeds from sales of equity securities |
707 | 118 | 1,158 | |||||||||
| Special dividend received from subsidiary |
— | 17,405 | — | |||||||||
| Cash paid in merger |
— | (17,405 | ) | — | ||||||||
| Net cash provided by investing activities |
346 | 118 | 1,158 | |||||||||
| Financing Activities: |
||||||||||||
| Cash dividends paid |
(5,504 | ) | (5,031 | ) | (3,565 | ) | ||||||
| Net cash used by financing activities |
(5,504 | ) | (5,031 | ) | (3,565 | ) | ||||||
| Net increase in cash and cash equivalents |
366 | 155 | 1,176 | |||||||||
| Cash and cash equivalents at January 1 |
2,256 | 2,101 | 925 | |||||||||
| Cash and cash equivalents at December 31 |
$ | 2,622 | $ | 2,256 | $ | 2,101 | ||||||
NOTE 26 — MERGER
An Agreement and Plan of Merger (the Agreement) by and between the Company, the Bank and Old Forge Bank, was entered into on December 5, 2008. The Agreement provided for, among other things, the Company to acquire 100% of the outstanding common shares of Old Forge Bank through a two-step merger transaction (the Merger). The Company consummated the acquisition of Old Forge Bank on April 1, 2009, at which time Old Forge Bank was merged with and into the Bank. Following the Merger, the Bank continues to operate as a banking subsidiary of the Company.
Shareholders of Old Forge Bank were entitled to receive the merger consideration in either cash or shares of Company common stock, or any combination thereof, subject to certain limitations and allocation procedures set forth in the Agreement. The per share amount was calculated from the cash consideration and the value of the stock consideration based on the Company’s closing price of the Company’s common stock over a fixed period of time, as provided for in the Agreement.
Old Forge Bank was an independent $215 million community bank, operating from three locations in Lackawanna and Luzerne Counties of Pennsylvania. As a result of the Merger, the Company is now an $883 million financial institution serving Northeastern Pennsylvania from 12 locations. Management of the Company believes that the combined entity is in a more favorable position to compete with local and regional banks in the marketplace.
There was approximately $26.4 million of goodwill created in the Merger, largely based on the Company’s evaluation of the business growth opportunities inherent in the Old Forge Bank customer base, as well as operating synergies and economy of scale resulting from the Merger. None of the goodwill is expected to be deductible for income tax purposes.
The following table summarizes the consideration paid for Old Forge Bank and the identifiable assets acquired and liabilities assumed at acquisition date.
87
| April 1, 2009 | ||||
| Consideration |
||||
| Cash |
$ | 17,405 | ||
| Common Stock issued – 1,128,079 shares of the Company, net of issuance costs of $184 |
38,058 | |||
| Fair value of consideration transferred |
$ | 55,463 | ||
The fair value of the 1,128,079 common shares of the Company issued as part of the consideration paid to former Old Forge Bank shareholders was $38,058, determined by use of the weighted average price of Company common shares traded on March 31, 2009 ($33.90 per share). The Company believes that the weighted average price of the Company common stock traded on March 31, 2009 is the best indication of value since the Company’s common stock is not a heavily traded security.
| Acquisition-related costs recorded in the income statement of the acquirer for the year ended December 31, 2009. |
$ | 1,550 | ||
| Acquisition-related costs recorded as an offset to surplus of the acquirer as of December 31, 2009. |
$ | 184 | ||
| Recognized amounts of identifiable assets acquired and liabilities assumed on April 1, 2009 are: |
||||
| Cash |
$ | 4,760 | ||
| Investments |
31,261 | |||
| Loans |
159,949 | |||
| Property and equipment |
1,576 | |||
| Core Deposit Intangible |
2,027 | |||
| All other assets |
13,027 | |||
| Identifiable Assets |
212,600 | |||
| Deposits |
177,018 | |||
| Borrowings |
5,000 | |||
| All other liabilities |
1,517 | |||
| Identifiable Liabilities |
183,535 | |||
| Identifiable net assets |
29,065 | |||
| Goodwill |
26,398 | |||
| Total consideration transferred |
$ | 55,463 | ||
The fair value of the financial assets acquired included loans receivable with a gross amortized cost basis of $166,348 at April 1, 2009.
The table below illustrates the fair value adjustments made to the amortized cost basis in order to present the fair value of the loans acquired.
| Gross amortized cost basis at April 1, 2009 |
$ | 166,348 | ||
| Market rate adjustment |
640 | |||
| Credit fair value adjustment in pools of homogeneous loans |
(5,648 | ) | ||
| Credit fair value adjustment on distressed loans |
(1,391 | ) | ||
| Fair value of purchased loans at April 1, 2009 |
$ | 159,949 | ||
88
In connection with its acquisition of Old Forge Bank, the Company acquired loans with evidence of credit deterioration that have been accounted for under ASC 310-30. As part of the Company’s acquisition of Old Forge Bank, the acquired loan portfolio of Old Forge Bank was evaluated based on risk characteristics and other credit and market criteria to determine a credit adjustment to the fair value of the loans acquired. The acquired loan balance was reduced by the aggregate amount of the credit fair value adjustment for both homogeneous pools and specific loans in determining the fair value of the loans. The credit fair value adjustment accounted for acquired loans deemed to require a specific allocation in accordance with Accounting Standard Codification 310-30-30, previously known as Statement of Position (SOP) 03-3, “Accounting for Certain Loans Acquired in a Transfer.” These loans are accounted for in the credit fair value adjustment considering the portion of the loan balance that has been deemed uncollectible based on management’s expectations of future cash flows for each respective loan. Based on management’s evaluation of the acquired loan portfolio of Old Forge Bank, six loans with a carrying value of $2,151 exhibited credit quality deterioration resulting in a credit fair value adjustment of $1,391. As of December 31, 2009, there were a total of three loans remaining with a carrying value of $1,966 with a credit fair value adjustment of $1,307. As of December 31, 2010, there were a total of two loans remaining with a carrying value of $229 with a credit fair value adjustment of $229. There is no accretable yield for the specific loans accounted for under Accounting Standard Codification 310-30-30. There were no significant prepayment estimates by Management in the determination of contractual cash flows and cash flows expected to be collected.
Changes in the credit fair value adjustment on specific loans purchased for the year ended December 31, 2010 were as follows:
| Carrying Value |
Credit Fair Value Adjustment |
Net Amount |
||||||||||
| Balance, December 31, 2009 |
||||||||||||
| Residential Mortgages |
$ | — | $ | — | $ | — | ||||||
| Commercial |
1,966 | 1,307 | 659 | |||||||||
| Consumer / Other |
— | — | — | |||||||||
| 1,966 | 1,307 | 659 | ||||||||||
| Charge-offs |
||||||||||||
| Residential Mortgages |
— | — | — | |||||||||
| Commercial |
— | — | — | |||||||||
| Consumer / Other |
— | — | — | |||||||||
| Total Charge-offs |
— | — | — | |||||||||
| Loans transferred to other real estate owned |
||||||||||||
| Residential Mortgages |
— | — | — | |||||||||
| Commercial |
(1,225 | ) | (924 | ) | (301 | ) | ||||||
| Consumer / Other |
— | — | — | |||||||||
| Total loans transferred to other real estate owned |
(1,225 | ) | (924 | ) | (301 | ) | ||||||
| Payments |
||||||||||||
| Residential Mortgages |
— | — | — | |||||||||
| Commercial |
(512 | ) | (154 | ) | (358 | ) | ||||||
| Consumer / Other |
— | — | — | |||||||||
| Total Payments |
(512 | ) | (154 | ) | (358 | ) | ||||||
| Balance, December 31, 2010 |
$ | 229 | $ | 229 | $ | — | ||||||
89
Changes in the credit fair value adjustment on specific loans purchased for the year ended December 31, 2009 were as follows:
| Carrying Value |
Credit Fair Value Adjustment |
Net Amount |
||||||||||
| Balance, April 1, 2009 |
||||||||||||
| Residential Mortgages |
$ | 178 | $ | 77 | $ | 101 | ||||||
| Commercial |
1,973 | 1,314 | 659 | |||||||||
| Consumer / Other |
— | — | — | |||||||||
| 2,151 | 1,391 | 760 | ||||||||||
| Charge-offs |
||||||||||||
| Residential Mortgages |
(2 | ) | — | (2 | ) | |||||||
| Commercial |
— | — | — | |||||||||
| Consumer / Other |
— | — | — | |||||||||
| Total Charge-offs |
(2 | ) | — | (2 | ) | |||||||
| Loans transferred to other real estate owned |
||||||||||||
| Residential Mortgages |
(62 | ) | (16 | ) | (46 | ) | ||||||
| Commercial |
— | — | — | |||||||||
| Consumer / Other |
— | — | — | |||||||||
| Total loans transferred to other real estate owned |
(62 | ) | (16 | ) | (46 | ) | ||||||
| Payments |
||||||||||||
| Residential Mortgages |
(114 | ) | (61 | ) | (53 | ) | ||||||
| Commercial |
(7 | ) | (7 | ) | — | |||||||
| Consumer / Other |
— | — | — | |||||||||
| Total Payments |
(121 | ) | (68 | ) | (53 | ) | ||||||
| Balance, December 31, 2009 |
$ | 1,966 | $ | 1,307 | $ | 659 | ||||||
90
Pro Forma Income Statement
For the Twelve Months Ended December 31, 2009
| Penseco Financial Services Corporation 12/31/2009 |
Old Forge Bank 12/31/2009 |
Adjustments | Pro Forma 12/31/2009 |
|||||||||||||
| Interest and fees on loans |
$ | 32,399 | $ | 2,524 | $ | 184 | (a) | $ | 35,107 | |||||||
| Interest and dividends on investments |
7,740 | 377 | (30 | )(b) | 8,087 | |||||||||||
| Interest on Federal funds sold |
— | 1 | 1 | |||||||||||||
| Interest on balances with banks |
12 | — | 12 | |||||||||||||
| Total Interest Income |
40,151 | 2,902 | 154 | 43,207 | ||||||||||||
| Interest on deposits |
6,541 | 897 | (58 | )(c) | 7,380 | |||||||||||
| Interest on borrowed funds |
3,039 | 9 | 3,048 | |||||||||||||
| Total Interest Expense |
9,580 | 906 | (58 | ) | 10,428 | |||||||||||
| Net Interest Income |
30,571 | 1,996 | 212 | 32,779 | ||||||||||||
| Provision for loan losses |
2,260 | 75 | 2,335 | |||||||||||||
| Net Interest Income after Provision for Loan Losses |
28,311 | 1,921 | 212 | 30,444 | ||||||||||||
| Service charges on deposits |
1,939 | 80 | 2,019 | |||||||||||||
| Other non-interest income |
8,344 | 97 | 8,441 | |||||||||||||
| Impairment losses on investment securities |
(787 | ) | — | (787 | ) | |||||||||||
| Realized gains (losses) on securities |
873 | — | 873 | |||||||||||||
| Total Non-Interest Income |
10,369 | 177 | 10,546 | |||||||||||||
| Salaries and employee benefits |
12,551 | 696 | 13,247 | |||||||||||||
| Expense of premises and equipment |
3,246 | 146 | 3,392 | |||||||||||||
| Other non-interest expense |
11,073 | 428 | 61 | (d) | 11,562 | |||||||||||
| Total Non-Interest Expenses |
26,870 | 1,270 | 61 | 28,201 | ||||||||||||
| Income before income taxes |
11,810 | 828 | 151 | 12,789 | ||||||||||||
| Applicable income taxes |
2,269 | 315 | 51 | 2,635 | ||||||||||||
| Net Income |
$ | 9,541 | (f) | $ | 513 | (f) | $ | 100 | $ | 10,154 | ||||||
| Earnings Per Share |
$ | 4.44 | $ | 0.92 | (e) | $ | 3.10 | |||||||||
Footnotes:
| (a) | Accretion of loan fair value adjustment |
| (b) | Opportunity cost of cash paid to Old Forge shareholders at 0.70% rate |
| (c) | Amortization of certificate of deposit fair value adjustment |
| (d) | Amortization of core deposit intangible over a 10 year period using the sum-of-the-years-digits method |
| (e) | Pro Forma EPS based on weighted average shares outstanding of 3,276,079 |
| (f) | Excludes merger related costs of $1,550 and $451 and related tax effect incurred by Penseco and Old Forge Bank, respectively |
91
Pro Forma Income Statement
For the Twelve Months Ended December 31, 2008
| Penseco Financial Services Corporation 12/31/2008 |
Old Forge Bank 12/31/2008 |
Adjustments | Pro Forma 12/31/2008 |
|||||||||||||
| Interest and fees on loans |
$ | 26,218 | $ | 10,184 | $ | 735 | (a) | $ | 37,137 | |||||||
| Interest and dividends on investments |
7,583 | 1,779 | (122 | )(b) | 9,240 | |||||||||||
| Interest on Federal funds sold |
29 | 33 | 62 | |||||||||||||
| Interest on balances with banks |
68 | — | 68 | |||||||||||||
| Total Interest Income |
33,898 | 11,996 | 613 | 46,507 | ||||||||||||
| Interest on deposits |
6,973 | 4,361 | (364 | )(c) | 10,970 | |||||||||||
| Interest on borrowed funds |
3,857 | 47 | 3,904 | |||||||||||||
| Total Interest Expense |
10,830 | 4,408 | (364 | ) | 14,874 | |||||||||||
| Net Interest Income |
23,068 | 7,588 | 977 | 31,633 | ||||||||||||
| Provision for loan losses |
861 | 300 | 1,161 | |||||||||||||
| Net Interest Income after Provision for Loan Losses |
22,207 | 7,288 | 977 | 30,472 | ||||||||||||
| Service charges on deposits |
1,477 | 486 | 1,963 | |||||||||||||
| Other non-interest income |
9,547 | 293 | 9,840 | |||||||||||||
| Realized gains (losses) on securities |
12 | 20 | 32 | |||||||||||||
| Total Non-Interest Income |
11,036 | 799 | 11,835 | |||||||||||||
| Salaries and employee benefits |
10,157 | 2,824 | 12,981 | |||||||||||||
| Expense of premises and equipment |
2,703 | 543 | 3,246 | |||||||||||||
| Other non-interest expense |
9,312 | 1,635 | 243 | (d) | 11,190 | |||||||||||
| Total Non-Interest Expenses |
22,172 | 5,002 | 243 | 27,417 | ||||||||||||
| Income before income taxes |
11,071 | 3,085 | 734 | 14,890 | ||||||||||||
| Applicable income taxes |
2,458 | 565 | 250 | 3,273 | ||||||||||||
| Net Income |
$ | 8,613 | $ | 2,520 | $ | 484 | $ | 11,617 | ||||||||
| Earnings Per Share |
$ | 4.01 | $ | 4.51 | $ | 3.55 | ||||||||||
Footnotes:
| (a) | Accretion of loan fair value adjustment |
| (b) | Opportunity cost of cash paid to Old Forge shareholders at 0.70% rate |
| (c) | Amortization of certificate of deposit fair value adjustment |
| (d) | Amortization of core deposit intangible over a 10 year period using the sum-of-the-years-digits method |
| (e) | Pro Forma EPS based on Pro Forma shares outstanding of 3,276,079 |
92
NOTE 27 — SELECTED QUARTERLY FINANCIAL DATA (UNAUDITED)
| 2010 |
First Quarter |
Second Quarter |
Third Quarter |
Fourth Quarter |
||||||||||||
| Net Interest Income |
$ | 8,451 | $ | 8,323 | $ | 8,297 | $ | 8,318 | ||||||||
| Provision for Loan Losses |
328 | 537 | 858 | 276 | ||||||||||||
| Non-Interest Income |
2,711 | 2,873 | 3,638 | 2,930 | ||||||||||||
| Non-Interest Expenses and Taxes |
7,853 | 7,643 | 8,033 | 8,291 | ||||||||||||
| Net Income |
2,981 | 3,016 | 3,044 | 2,681 | ||||||||||||
| Earnings Per Share |
$ | .91 | $ | .92 | $ | .93 | $ | .82 | ||||||||
| 2009 |
First Quarter |
Second Quarter |
Third Quarter |
Fourth Quarter |
||||||||||||
| Net Interest Income |
$ | 5,998 | $ | 8,040 | $ | 8,143 | $ | 8,390 | ||||||||
| Provision for Loan Losses |
996 | 235 | 342 | 687 | ||||||||||||
| Non-Interest Income |
2,410 | 2,771 | 3,143 | 2,045 | ||||||||||||
| Non-Interest Expenses and Taxes |
6,971 | 7,707 | 7,849 | 7,781 | ||||||||||||
| Net Income |
441 | 2,869 | 3,095 | 1,967 | ||||||||||||
| Earnings Per Share |
$ | .21 | $ | .88 | $ | .94 | $ | .60 | ||||||||
93
MMQ
McGrail Merkel Quinn & Associates, P.C.
CERTIFIED PUBLIC ACCOUNTANTS & CONSULTANTS
Francis J. Merkel, CPA
Joseph J. Quinn, CPA/ABV, CVA
Daniel J. Gerrity, CPA
Mary Ann E. Novak, CPA
REPORT OF INDEPENDENT REGISTERED PUBLIC ACCOUNTING FIRM
To the Board of Directors and Stockholders
Penseco Financial Services Corporation
We have audited the accompanying consolidated balance sheets of Penseco Financial Services Corporation and subsidiary as of December 31, 2010 and 2009, and the related consolidated statements of income, stockholders’ equity, and cash flows for each of the three years in the period ended December 31, 2010. These financial statements are the responsibility of the Company’s management. Our responsibility is to express an opinion on these financial statements based on our audits.
We conducted our audits in accordance with the standards of the Public Company Accounting Oversight Board (United States). Those standards require that we plan and perform the audit to obtain reasonable assurance about whether the financial statements are free of material misstatement. An audit includes examining, on a test basis, evidence supporting the amounts and disclosures in the financial statements. An audit also includes assessing the accounting principles used and significant estimates made by management, as well as evaluating the overall financial statement presentation. We believe that our audits provide a reasonable basis for our opinion.
In our opinion, the consolidated financial statements referred to above present fairly, in all material respects, the financial position of Penseco Financial Services Corporation and subsidiary as of December 31, 2010 and 2009, and the results of their operations and their cash flows for each of the three years in the period ended December 31, 2010, in conformity with U.S. generally accepted accounting principles.
We have also audited, in accordance with the standards of the Public Company Accounting Oversight Board (United States), Penseco Financial Services Corporation and subsidiary’s internal control over financial reporting as of December 31, 2010, based on criteria established in Internal Control — Integrated Framework issued by the Committee of Sponsoring Organizations of the Treadway Commission, and our report dated March 14, 2011 expressed an unqualified opinion on the effectiveness of Penseco Financial Services Corporation’s internal control over financial reporting.
/S/ McGrail Merkel Quinn & Associates, P.C.
Scranton, Pennsylvania
March 14, 2011
An Independently Owned Member McGladrey Alliance/McGladrey
Clay Avenue Professional Plaza, 1173 Clay Avenue, Scranton, PA 18510 570 961-0345 Fax: 570 961-8650
www.mmq.com
94
| ITEM 9 | CHANGES IN AND DISAGREEMENTS WITH ACCOUNTANTS ON ACCOUNTING AND FINANCIAL DISCLOSURE |
There were no changes in or disagreements with accountants on matters of accounting principles or practices or financial statement disclosures in 2010 or 2009.
| ITEM 9A | CONTROLS AND PROCEDURES |
Under the supervision and with the participation of the Company’s management, including our Chief Executive Officer and Finance Division Head, we conducted an evaluation of our disclosure controls and procedures; as such term is defined under Rule 13a-15(e) under the Securities Exchange Act of 1934. Based upon this evaluation, the Company’s Chief Executive Officer and the Company’s Finance Division Head concluded that our disclosure controls and procedures were effective as of the end of the period covered by this annual report. Management’s annual report on internal control over financial reporting is included below.
The Company continually assesses the adequacy of its internal control over financial reporting and enhances its controls in response to internal control assessments, and internal and external audit and regulatory recommendations. No change in internal control over financial reporting during the quarter ended December 31, 2010, or through the date of this Annual Report on Form 10-K, have materially affected, or are reasonably likely to materially affect, the Company’s internal control over financial reporting.
Management maintains a comprehensive system of controls intended to ensure that transactions are executed in accordance with management’s authorization, assets are safeguarded, and financial records are reliable. Management also takes steps to see that information and communication flows are effective and to monitor performance, including performance of internal control procedures.
Because of its inherent limitations, internal control over financial reporting may not prevent or detect misstatements. Also, projections of any evaluation of effectiveness to future periods are subject to the risk that controls may become inadequate due to changes in conditions, or that the degree of compliance with the policies or procedures may deteriorate.
MANAGEMENT’S REPORT ON INTERNAL CONTROL OVER FINANCIAL REPORTING
The management of Penseco Financial Services Corporation is responsible for establishing and maintaining adequate internal control over financial reporting. Penseco Financial Services Corporation’s internal control system over financial reporting was designed to provide reasonable assurance to the Company’s management and Board of Directors regarding the preparation and fair presentation of published financial statements in accordance with U.S. generally accepted accounting principles. All internal control systems, no matter how well designed, have inherent limitations. Therefore, even those systems determined to be effective can provide only reasonable assurance with respect to financial statement preparation and presentation.
The Company’s management, under the supervision and with the participation of the Company’s Chief Executive Officer and Finance Division Head, has evaluated the effectiveness of the Company’s internal control over financial reporting as of December 31, 2010 based on the criteria set forth by the Committee of Sponsoring Organizations of the Treadway Commission (COSO) in Internal Controls-Integrated Framework. Based on this assessment, management believes that, as of December 31, 2010, the Company’s internal control over financial reporting is effective.
The effectiveness of the Company’s internal control over financial reporting as of December 31, 2010 has been audited by McGrail, Merkel, Quinn & Associates, P.C., an independent registered public accounting firm, as stated in their report appearing on the following page.
95
MMQ
McGrail Merkel Quinn & Associates, P.C.
CERTIFIED PUBLIC ACCOUNTANTS & CONSULTANTS
Francis J. Merkel, CPA
Joseph J. Quinn, CPA/ABV, CVA
Daniel J. Gerrity, CPA
Mary Ann E. Novak, CPA
REPORT OF INDEPENDENT REGISTERED PUBLIC ACCOUNTING FIRM
To the Board of Directors and Stockholders
Penseco Financial Services Corporation
We have audited Penseco Financial Services Corporation and subsidiary’s internal control over financial reporting as of December 31, 2010, based on criteria established in Internal Control — Integrated Framework issued by the Committee of Sponsoring Organizations of the Treadway Commission. Penseco Financial Services Corporation and subsidiary’s management is responsible for maintaining effective internal control over financial reporting and for its assessment of the effectiveness of internal control over financial reporting included in the accompanying Management’s Report on Internal Control Over Financial Reporting. Our responsibility is to express an opinion on the Company’s internal control over financial reporting based on our audit.
We conducted our audit in accordance with the standards of the Public Company Accounting Oversight Board (United States). Those standards require that we plan and perform the audit to obtain reasonable assurance about whether effective internal control over financial reporting was maintained in all material respects. Our audit included obtaining an understanding of internal control over financial reporting, assessing the risk that a material weakness exists, and testing and evaluating the design and operating effectiveness of internal control based on the assessed risk. Our audit also included performing such other procedures as we considered necessary in the circumstances. We believe that our audit provides a reasonable basis for our opinion.
A company’s internal control over financial reporting is a process designed to provide reasonable assurance regarding the reliability of financial reporting and the preparation of financial statements for external purposes in accordance with generally accepted accounting principles. A company’s internal control over financial reporting includes those policies and procedures that (a) pertain to the maintenance of records that, in reasonable detail, accurately and fairly reflect the transactions and dispositions of the assets of the company; (b) provide reasonable assurance that transactions are recorded as necessary to permit preparation of financial statements in accordance with generally accepted accounting principles, and that receipts and expenditures of the company are being made only in accordance with authorizations of management and directors of the company; and (c) provide reasonable assurance regarding prevention or timely detection of unauthorized acquisition, use, or disposition of the company’s assets that could have a material effect on the financial statements.
Because of its inherent limitations, internal control over financial reporting may not prevent or detect misstatements. Also, projections of any evaluation of effectiveness to future periods are subject to the risk that controls may become inadequate because of changes in conditions, or that the degree of compliance with the policies or procedures may deteriorate.
96
In our opinion, Penseco Financial Services Corporation and subsidiary maintained, in all material respects, effective internal control over financial reporting as of December 31, 2010, based on criteria established in Internal Control — Integrated Framework issued by the Committee of Sponsoring Organizations of the Treadway Commission.
We have also audited, in accordance with the standards of the Public Company Accounting Oversight Board (United States), the consolidated financial statements of Penseco Financial Services Corporation and subsidiary and our report dated March 14, 2011 expressed an unqualified opinion.
/S/ McGrail Merkel Quinn & Associates, P.C.
Scranton, Pennsylvania
March 14, 2011
An Independently Owned Member McGladrey Alliance/McGladrey
Clay Avenue Professional Plaza, 1173 Clay Avenue, Scranton, PA 18510 570 961-0345 Fax: 570 961-8650
www.mmq.com
97
| ITEM 9B | OTHER INFORMATION |
None.
PART III
| ITEM 10 | DIRECTORS, EXECUTIVE OFFICERS AND CORPORATE GOVERNANCE |
Code of Ethical Conduct
The Company has a Code of Ethical Conduct applicable to all employees including the Company’s Principal Executive Officer and Principal Financial Officer (Finance Division Head). The purpose of the Code is to promote honest and ethical conduct, full and fair disclosures of financial information, compliance with laws and regulations and accountability for actions.
A copy of the Code of Ethics may be obtained, without charge, on our website (www.pennsecurity.com) or by contacting:
Patrick Scanlon, Senior Vice President, Finance Division Head
Penseco Financial Services Corporation
150 North Washington Avenue
Scranton, PA 18503-1848
1-800-327-0394
The information required by this Item as to Directors of the Company contained under the headings “Stock Ownership”, Item 1 “Election of Directors”, “Corporate Governance” and “Certain Relationships and Related Transactions” within the Proxy Statement relating to the Company’s Annual Meeting of Shareholders, to be held May 3, 2011, (the “Proxy Statement”) is incorporated herein by reference.
The information required by this item as to the Audit Committee’s financial expert (or lack thereof) is incorporated herein by reference to the section entitled “Corporate Governance-Committees of the Board of Directors” in the Proxy Statement.
| ITEM 11 | EXECUTIVE COMPENSATION |
The information contained under the headings “Executive Compensation”, “Director Compensation”, “Compensation Discussion and Analysis”, “Compensation and Benefits Committee Report” and “Compensation Committee Interlocks and Insider Participation” in the Proxy Statement is incorporated herein by reference.
| ITEM 12 | SECURITY OWNERSHIP OF CERTAIN BENEFICIAL OWNERS AND MANAGEMENT AND RELATED STOCKHOLDER MATTERS |
The information contained under the heading “Stock Ownership” in the Proxy Statement is incorporated herein by reference.
| ITEM 13 | CERTAIN RELATIONSHIPS AND RELATED TRANSACTIONS, AND DIRECTOR INDEPENDENCE |
The information contained under the headings “Certain Relationships and Related Transactions” and “Corporate Governance” and “Item 1- Election of Directors” in the Proxy Statement is incorporated herein by reference.
| ITEM 14 | PRINCIPAL ACCOUNTING FEES AND SERVICES |
The information contained under the heading “Item 2 - Ratification of Independent Registered Public Accounting Firm” in the Proxy Statement is incorporated herein by reference.
98
PART IV
| ITEM 15 | EXHIBITS, FINANCIAL STATEMENT SCHEDULES |
| (a) |
(1) |
Financial Statements - The following financial statements are incorporated by reference in Part II, Item 8 hereof: | ||||
| Balance Sheets Consolidated Statements of Income Consolidated Statements of Stockholders’ Equity Consolidated Statements of Cash Flows General Notes to Financial Statements Report of Independent Registered Public Accounting Firm | ||||||
| (2) |
Financial Statement Schedules - The Financial Statement Schedules are incorporated by reference in Part II, Item 8 hereof. | |||||
| (3) |
Exhibits | |||||
| The following exhibits are filed herewith or incorporated by reference as part of this Annual Report. | ||||||
| Exhibit No. |
Description | |||||
| 2.1 |
Agreement and Plan of Merger by and among Penseco Financial Services Corporation, Penn Security Bank and Trust Company and Old Forge Bank, dated as of December 5, 2008 (incorporated by reference to Exhibit 2.1 to the Registrant’s current report on Form 8-K filed with the SEC on December 10, 2008). | |||||
| 3.1.1 |
Articles of Incorporation of Penseco Financial Services Corporation, dated September 30, 1997 (incorporated by reference to Exhibit 3.1 to the Registrant’s annual report on Form 10-K filed with the SEC on March 30, 1998). | |||||
| 3.1.2 |
Amendment to Articles of Incorporation of Penseco Financial Services Corporation, dated March 10, 2011, filed herewith. | |||||
| 3.2 |
Amended and Restated By-Laws (incorporated herein by reference to Exhibit 3.2 of the Registrant’s current report on Form 8-K filed with the SEC on May 11, 2009). | |||||
| 10.1* |
Penseco Financial Services Corporation 2008 Long Term Incentive Plan (incorporated herein by reference to Annex A of the Registrant’s proxy statement on Schedule 14A filed with the SEC on March 17, 2008). | |||||
| 10.2* |
Form of Restricted Stock or Restricted Stock Unit Award Agreement (incorporated herein by reference to the Registrant’s registration statement on Form S-8 filed with the SEC on May 17, 2010). | |||||
| 10.3* |
Form of Stock Option and/or Appreciation Right Award Agreement (incorporated herein by reference to the Registrant’s registration statement on Form S-8 filed with the SEC on May 17, 2010). | |||||
| 10.4* |
Form of Performance Award Agreement (incorporated herein by reference to the Registrant’s registration statement on Form S-8 filed with the SEC on May 17, 2010). | |||||
| 10.5* |
Employment Agreement, dated January 3, 2011, among Penseco Financial Services Corporation, Penn Security Bank & Trust, and Craig W. Best (incorporated herein by reference to Exhibit 10.1 of the Registrant’s current report on Form 8-K filed with the SEC on January 7, 2011). | |||||
| 10.6* |
Penn Security Bank & Trust Company Executive Deferred Compensation Plan, filed herewith. | |||||
| 10.7* |
Penn Security Bank & Trust Company Deferred Compensation Plan No. 2 (incorporated herein by reference to Appendix D of Exhibit 10.1 of the Registrant’s current report on Form 8-K filed with the SEC on January 7, 2011). | |||||
| 10.8* |
Penn Security Bank & Trust Company Employee Stock Ownership Plan, amended and restated as of January 1, 2010, filed herewith. | |||||
| 10.9* |
Penn Security Bank and Trust Company Excess Benefit Plan, amended and restated December 31, 2008, filed herewith. | |||||
| 21.1 |
List of Subsidiaries of the registrant, filed herewith. | |||||
| 23.1 |
Consent of McGrail Merkel Quinn & Associates, P.C. relating to the financial statement of the Registrant, filed herewith. | |||||
| 31.1 |
Certification of the Principal Executive Officer of registrant required under Section 302 of the Sarbanes-Oxley Act of 2002, filed herewith. | |||||
| 31.2 |
Certification of the Principal Financial Officer of registrant required under Section 302 of the Sarbanes-Oxley Act of 2002, filed herewith. | |||||
| 32.1 |
Certifications of the Principal Executive Officer of registrant required under Section 906 of the Sarbanes-Oxley Act of 2002, filed herewith. | |||||
| 32.2 |
Certifications of the Principal Financial Officer of registrant required under Section 906 of the Sarbanes-Oxley Act of 2002, filed herewith. | |||||
| * - Management contract or compensatory plan or arrangement | ||||||
99
SIGNATURES
Pursuant to the requirements of Section 13 or 15(d) of the Securities Exchange Act of 1934, the Bank has duly caused this report to be signed on its behalf by the undersigned, thereunto duly authorized on March 14, 2011.
| By: |
/s/ Craig W. Best |
|||||||
| Craig W. Best |
||||||||
| President and CEO |
||||||||
| By: |
/s/ Patrick Scanlon |
|||||||
| Patrick Scanlon |
||||||||
| Senior Vice President, Finance Division Head |
||||||||
| Pursuant to the requirements of the Securities Exchange Act of 1934, this report has been signed below by the following persons on behalf of the registrant and in the capacities indicated on March 14, 2011. | ||||||||
| By: |
/s/ Craig W. Best |
By: |
/s/ Robert J. Mellow | |||||
| Craig W. Best |
Robert J. Mellow | |||||||
| President and CEO |
Director | |||||||
| By: |
/s/ Edwin J. Butler |
By: |
/s/ Robert W. Naismith, Ph. D. | |||||
| Edwin J. Butler |
Robert W. Naismith, Ph.D. | |||||||
| Director |
Director | |||||||
| By: |
/s/ Joseph G. Cesare, M.D. |
By: |
/s/ James B. Nicholas | |||||
| Joseph G. Cesare, M.D. |
James B. Nicholas | |||||||
| Director |
Director | |||||||
| By: |
/s/ Richard E. Grimm |
By: |
/s/ Emily S. Perry | |||||
| Richard E. Grimm |
Emily S. Perry | |||||||
| Director |
Director | |||||||
| By: |
/s/ Russell C. Hazelton |
By: |
/s/ Sandra C. Phillips | |||||
| Russell C. Hazelton |
Sandra C. Phillips | |||||||
| Director |
Director | |||||||
| By: |
/s/ D. William Hume |
By: |
/s/ Jerry J. Weinberger | |||||
| D. William Hume |
Jerry J. Weinberger | |||||||
| Director, Chairman of the Board |
Director | |||||||
| By: |
/s/ James G. Keisling |
By: |
/s/ Steven L. Weinberger | |||||
| James G. Keisling |
Steven L. Weinberger | |||||||
| Director |
Director | |||||||
| By: |
/s/ P. Frank Kozik |
|||||||
| P. Frank Kozik |
||||||||
| Director |
||||||||
100
EXHIBIT INDEX
| Exhibit No. |
Description | |
| 3.1.2 |
Articles of Incorporation, filed with the Secretary of the Commonwealth of Pennsylvania on March 10, 2011. | |
| 10.6* |
Penn Security Bank & Trust Company Executive Deferred Compensation Plan, filed herewith. | |
| 10.8* |
Penn Security Bank & Trust Company Employee Stock Ownership Plan, amended and restated as of January 1, 2010, filed herewith. | |
| 10.9* |
Penn Security Bank and Trust Company Excess Benefit Plan, amended and restated December 31, 2008, filed herewith. | |
| 21.1 |
List of Subsidiaries of the Registrant. | |
| 23.1 |
Consent of McGrail Merkel Quinn & Associates, P.C. relating to the financial statement of the Registrant. | |
| 31.1 |
Certification of the Principal Executive Officer of Registrant required under Section 302 of the Sarbanes-Oxley Act of 2002. | |
| 31.2 |
Certification of the Principal Financial Officer of Registrant required under Section 302 of the Sarbanes-Oxley Act of 2002. | |
| 32.1 |
Certifications of the Principal Executive Officer of Registrant required under Section 906 of the Sarbanes-Oxley Act of 2002. | |
| 32.2 |
Certifications of the Principal Financial Officer of Registrant required under Section 906 of the Sarbanes-Oxley Act of 2002. |
* - Management contract or compensatory plan or arrangement
101