Attached files
Table of Contents
UNITED STATES
SECURITIES AND EXCHANGE COMMISSION
Washington, D.C. 20549
FORM 10-K
(Mark One)
| x | ANNUAL REPORT PURSUANT TO SECTION 13 OR 15(d) OF THE SECURITIES EXCHANGE ACT OF 1934 |
For the fiscal year ended December 31, 2010
OR
| ¨ | TRANSITION REPORT PURSUANT TO SECTION 13 OR 15(d) OF THE SECURITIES EXCHANGE ACT OF 1934 |
For the transition period from to
Commission File Number 0-28082
KVH Industries, Inc.
(Exact Name of Registrant as Specified in its Charter)
| Delaware | 05-0420589 | |
| (State or Other Jurisdiction of Incorporation or Organization) | (I.R.S. Employer Identification Number) |
50 Enterprise Center, Middletown, RI 02842
(Address of Principal Executive Offices) (Zip Code)
(401) 847-3327
(Registrant’s Telephone Number, Including Area Code)
Securities registered pursuant to Section 12(b) of the Act:
| Title of Each Class |
Name of Each Exchange on Which Registered | |
| Common Stock, $0.01 par value per share | The NASDAQ Global Market |
Securities registered pursuant to Section 12(g) of the Act: None
Indicate by check mark if the registrant is a well-known seasoned issuer, as defined in Rule 405 of the Securities Act. Yes ¨ No x
Indicate by check mark if the registrant is not required to file reports pursuant to Section 13 or Section 15(d) of the Exchange Act. Yes ¨ No x
Indicate by check mark whether the registrant (1) has filed all reports required to be filed by Section 13 or 15(d) of the Securities Exchange Act of 1934 during the preceding 12 months (or for such shorter period that the registrant was required to file such reports), and (2) has been subject to such filing requirements for the past 90 days. Yes x No ¨
Indicate by check mark whether the registrant has submitted electronically and posted on its corporate Web site, if any, every Interactive Data File required to be submitted and posted pursuant to Rule 405 of Regulation S-T during the preceding 12 months (or for such shorter period that the registrant was required to submit and post such files). Yes ¨ No ¨
Indicate by check mark if disclosure of delinquent filers pursuant to Item 405 of Regulation S-K is not contained herein, and will not be contained, to the best of registrant’s knowledge, in definitive proxy or information statements incorporated by reference in Part III of this Form 10-K or any amendment to this Form 10-K. ¨
Indicate by check mark whether the registrant is a large accelerated filer, an accelerated filer, a non-accelerated filer, or a smaller reporting company. See the definitions of “large accelerated filer,” “accelerated filer” and “smaller reporting company” in Rule 12b-2 of the Exchange Act. (Check one):
|
Large accelerated filer ¨ |
Accelerated filer x | |
|
Non-accelerated filer ¨ |
Smaller reporting company ¨ | |
| (Do not check if a smaller reporting company) |
Indicate by check mark whether the registrant is a shell company (as defined in Rule 12b-2 of the Exchange Act). Yes ¨ No x
As of June 30, 2010, the aggregate market value of the registrant’s common stock held by non-affiliates of the registrant was $156,733,681 based on the closing sale price of $12.42 per share as reported on the NASDAQ Global Market.
As of March 4, 2011, the registrant had 14,757,082 shares of common stock outstanding.
DOCUMENTS INCORPORATED BY REFERENCE
Portions of the registrant’s Proxy Statement relating to its 2011 Annual Meeting of Stockholders are incorporated herein by reference in Part III.
Table of Contents
| Page | ||||||
| PART I | ||||||
| Item 1. |
3 | |||||
| Item 1A. |
12 | |||||
| Item 1B. |
24 | |||||
| Item 2. |
25 | |||||
| Item 3. |
25 | |||||
| PART II | ||||||
| Item 5. |
26 | |||||
| Item 6. |
28 | |||||
| Item 7. |
Management’s Discussion and Analysis of Financial Condition and Results of Operations |
29 | ||||
| Item 7A. |
42 | |||||
| Item 8. |
43 | |||||
| Item 9. |
Changes in and Disagreements with Accountants on Accounting and Financial Disclosure |
43 | ||||
| Item 9A. |
43 | |||||
| Item 9B. |
44 | |||||
| PART III | ||||||
| Item 10. |
45 | |||||
| Item 11. |
45 | |||||
| Item 12. |
Security Ownership of Certain Beneficial Owners and Management and Related Stockholder Matters |
45 | ||||
| Item 13. |
Certain Relationships and Related Transactions and Director Independence |
45 | ||||
| Item 14. |
45 | |||||
| PART IV | ||||||
| Item 15. |
46 | |||||
| 49 | ||||||
2
Table of Contents
| ITEM 1. | Business |
Cautionary Statement Regarding Forward-Looking Information
In addition to historical facts, this annual report contains forward-looking statements. Forward-looking statements are merely our current predictions of future events. These statements are inherently uncertain, and actual events could differ materially from our predictions. Important factors that could cause actual events to vary from our predictions include those discussed in this annual report under the headings “Item 7. Management’s Discussion and Analysis of Financial Condition and Results of Operations”, and “Item 1A. Risk Factors.” We assume no obligation to update our forward-looking statements to reflect new information or developments. We urge readers to review carefully the risk factors described in this annual report and in the other documents that we file with the Securities and Exchange Commission. You can read these documents at www.sec.gov.
Additional Information Available
Our principal Internet address is www.kvh.com. Our website provides a hyperlink to a third-party website through which our annual, quarterly, and current reports, as well as amendments to those reports, are available free of charge. We believe these reports are made available as soon as reasonably practicable after we electronically file them with, or furnish them to, the SEC. We do not provide any information regarding our SEC filings directly to the third-party website, and we do not check its accuracy or completeness.
Introduction
We are a leading manufacturer of solutions that provide global high-speed Internet, television, and voice services via satellite to mobile users at sea, on land, and in the air. We are also a premier manufacturer of high-performance navigational sensors and integrated inertial systems for defense and commercial guidance and stabilization applications. Our research and development, manufacturing and quality control capabilities have enabled us to meet the demanding standards of our military, consumer and commercial customers for performance and reliability. This combination of factors has allowed us to create products offering important differentiating advantages to our customers. We are based in Middletown, Rhode Island, with offices in Illinois, Denmark, Norway and Singapore.
We sell our mobile communications products and airtime services, including the TracVision, TracPhone, and CommBoxTM systems and mini-VSAT Broadband airtime, through an extensive international network of distributors and retailers worldwide. We are nearing completion of the initial global coverage plan for our mini-VSAT Broadband service, which primarily supports maritime applications along with land-based mobile and aeronautical uses on a more limited basis currently. We may also pursue expanded coverage in the future to support customer, market, or capacity demands. We also developed and now manufacture a satellite TV antenna system sold on an original equipment manufacturer, or OEM, basis to LiveTV, LLC, a leading provider of entertainment systems on commercial aircraft. In addition, we are pursuing opportunities to apply our mobile communications expertise to military applications that require affordable, high-bandwidth mobile connections.
Our guidance and stabilization products include precision fiber optic gyro (FOG)-based systems that help stabilize platforms, such as gun turrets, remote weapon stations, and radar units, and provide guidance for munitions, as well as tactical navigation systems for a broad range of military vehicles. We sell our guidance and stabilization products directly to United States (U.S.) and allied governments and government contractors, as well as through an international network of authorized independent sales representatives. Our fiber optic products are also used in such commercial applications as train track geometry measurement systems, industrial robotics, surveying, optical stabilization, autonomous vehicles, and undersea remotely operated submersibles.
In September 2010, we acquired Virtek Communication AS, which develops and distributes middleware software solutions known as CommBox technology, which will be integrated into our satellite communications products.
3
Table of Contents
Our Products and Services
Mobile Satellite Communications
We believe that there is an increasing demand for mobile access to television, voice services and the Internet on the move. Our objective is to connect mobile users on sea, land, and air to the satellite TV, communications, and Internet services they wish to use. We have developed a comprehensive family of products and services marketed under the TracVision, TracPhone, and CommBox brand names as well as the mini-VSAT Broadband airtime network to address the unique needs of our communications markets.
Our mobile satellite products are typically installed on mobile platforms and use sophisticated robotics, stabilization and control software, sensing technologies, transceiver integration, and advanced antenna designs to automatically search for, identify and point directly at the selected television and communications satellite while the vehicle, vessel, or plane is in motion. Our antennas use gyros and inclinometers to measure the pitch, roll and yaw of an antenna platform in relation to the earth. Microprocessors and our proprietary stabilization and control software use that data to compute the antenna movement necessary for the antenna’s motors to point the antenna properly and maintain contact with the satellite. If an obstruction temporarily blocks the satellite signal, our products continue to track the satellite’s location according to the movement of the antenna platform in order to carry out automatic, rapid reacquisition of the signal when a direct line of sight to the satellite is restored.
Our Certified Support Network offers our TracVision and TracPhone customers an international network of skilled technical dealers and support centers in many locations where our customers are likely to travel. We have selected distributors based on their technical expertise, professionalism and commitment to quality and regularly provide them with extensive training in the sale, installation and support of our products.
We offer a broad array of products to address the needs of a variety of customers seeking mobile communications in maritime, land mobile and aeronautical applications.
Marine. In the marine market, we offer a range of mobile satellite TV and communications products. In December 2009, we began selling the TracVision HD7, a 24-inch diameter satellite TV antenna capable of receiving signals from two DIRECTV Ka-band satellites and one DIRECTV Ku-band satellite simultaneously to offer a high-definition TV experience comparable to what a home DIRECTV HDTV subscriber would enjoy. It includes an Internet Protocol-enabled antenna control unit as well as optional antenna controls via a free TracVision application for use on an Apple iPhone. We believe that this is the first marine antenna to offer this combination of capabilities. Our marine TracVision M-series satellite TV antennas are designed with the full spectrum of vessel sizes in mind, ranging from recreational vessels as small as 20 to 25 feet to large commercial vessels. The award-winning family of marine TracVision products vary in size from a lower-profile elliptical parabolic system similar to those offered for use on recreation vehicles (RV) to the 12.5-inch TracVision M1, 14.5-inch TracVision M3, 18-inch TracVision M5, 24-inch TracVision M7, and 32-inch diameter TracVision M9, each of which employs a high-efficiency circular antenna. These products are compatible with Ku-band HDTV programming as well as high-powered regional satellite TV services around the globe, based on available signal strength and antenna size requirements.
Broadband Internet. In 2007, we introduced our Ku-band airtime service branded as mini-VSAT Broadband. This service utilizes spread spectrum technology and ArcLight modem technology, both of which were developed by ViaSat. This spread spectrum approach reduces the broadcast power requirements and the pointing accuracy necessary to track the high-bandwidth Ku-band satellites that carry the service. The resulting efficiencies allowed us to develop and bring to market the 24-inch diameter TracPhone V7 antenna, which we also introduced in 2007. This antenna is 85% smaller by volume and 75% lighter than alternative 1-meter VSAT antennas. In February 2011, we introduced a new addition to our mini-VSAT Broadband-compatible antenna family, the 14.5-inch diameter TracPhone V3. We believe that the TracPhone V3 is the smallest maritime VSAT system currently available. Its small size makes it practical for use on smaller vessels as well as land vehicles. We currently expect to begin TracPhone V3 shipments during the second quarter of 2011.
4
Table of Contents
The high bandwidth offered by the Ku-band satellites also permits faster data rates than those supported by Inmarsat’s L-band satellites. TracPhone V7 subscribers may select service packages with Internet data connections offering ship-to-shore satellite data rates as fast as 512 Kbps, or kilobits per second, and shore-to-ship satellite data rates as fast as 2 Mbps, or megabits per second. The TracPhone V3, due to its smaller dish diameter, offers ship-to-shore data rates as fast as 128 Kbps and shore-to-ship satellite data rates as fast as 2 Mbps. In addition, subscriptions include Voice over Internet Protocol (VoIP) telephone services optimized for use over satellite connections. The TracPhone V7 can support two or more simultaneous calls while the TracPhone V3 can support one call at a time.
We are actively engaged in sales efforts for the TracPhone V7 and mini-VSAT Broadband service to government agencies for maritime, military, and emergency responder use. In September 2010, the U.S. Coast Guard awarded us a 10-year, up to $42 million contract to supply TracPhone V7 systems and mini-VSAT Broadband airtime to as many as 216 U.S. Coast Guard light cutters. We are also taking steps to expand our ability to support the commercial maritime market. In February 2010, we entered into a distribution agreement with Japan Radio Co. Ltd. (JRC), under which JRC is reselling our TracPhone V7 through its established channels. JRC also sells the mini-VSAT Broadband airtime service to non-Japanese vessels and owners. In October 2010, we entered into an agreement with Furuno Electric Co. Ltd., under which Furuno will sell mini-VSAT Broadband service through its global distribution network. In March 2011, we signed a contract to provide TracPhone V7 and mini-VSAT Broadband service to Vroon B.V. and its fleet of more than 125 commercial vessels.
Service is currently offered in the north Pacific Ocean, the Americas, Caribbean, North Atlantic, Europe, the Persian Gulf, Asia-Pacific, Africa, Brazil, Australian and New Zealand waters, and the Indian Ocean. We believe that our mini-VSAT Broadband service represents the only global multi-megabit commercial satellite communications network for vessels and airplanes. This unified Ku-band Broadband service enables us to offer commercial, leisure and government customers an integrated hardware and service solution for mobile communications and seamless region-to-region roaming. It is our long-term plan to invest in and deploy the mini-VSAT Broadband network on a global basis in cooperation with ViaSat under the terms of a 10-year agreement announced in July 2008. As part of the coverage expansion, we have been acquiring satellite capacity from Ku-band satellite operators as well as purchasing regional satellite hubs from ViaSat. These hubs use ViaSat’s ArcLight spread spectrum mobile broadband technology and are operated by ViaSat on our behalf. Over the course of the 10-year agreement, we and ViaSat also expect to implement future enhancements to the mini-VSAT Broadband spread spectrum maritime services and related products. Under the terms of our revenue sharing arrangement with ViaSat, this expansion positions us to earn revenue not only from the maritime and land-based use of the mini-VSAT Broadband service but also from aeronautical applications that roam throughout our network.
This broadband Internet offering represents a relatively new business model for KVH. We are the source of the mini-VSAT Broadband service and, as a result, we generate revenue from hardware sales as well as recurring monthly revenue derived from subscription packages. We offer a selection of airtime subscription plans designed to provide leisure, commercial, and government customers the flexibility to select packages that best suit their data and voice usage patterns and their budgets. Airtime options for the TracPhone V7 include fixed-rate subscription packages ranging from $995 to $8,995 per month, seasonal fixed-rate packages that permit subscribers to use their system for as little as three months per year, and per-megabyte service plans that we believe can be significantly more affordable than competing legacy VSAT and Inmarsat offerings in many instances. Service pricing for TracPhone V3 subscribers will be provided on a per-megabyte basis for data services and a per-minute basis for voice calls.
In addition to our TracPhone V7, V3 and mini-VSAT Broadband service, we also offer a family of Inmarsat-compatible TracPhone products that provide in-motion access to global satellite communications. These products rely on services offered by Inmarsat, a satellite service provider that supports links for phone, fax and data communications as fast as 432 Kbps. The TracPhone F77 uses the Inmarsat Fleet service; the TracPhone FB150, FB250, and FB500 antennas use the Inmarsat FleetBroadband service to offer voice as well as high-speed Internet service. The TracPhone F77, FB150, FB250, and FB500 are manufactured by Thrane & Thrane
5
Table of Contents
A/S of Denmark and distributed on an OEM basis by us in North America under the KVH TracPhone brand and distributed in other markets on a non-exclusive basis. Unlike mini-VSAT Broadband, where we control and sell the airtime, we purchase Inmarsat airtime from a distributor and resell it to our customers.
In September 2010, we completed our acquisition of Virtek Communication, a Norwegian firm responsible for developing a ship/shore network management product called CommBox. We believe that the addition of a network management resource was crucial to the long-term success and competitive position of our satellite communication product line, especially within the commercial maritime market. CommBox, which comprises shipboard hardware, a KVH-hosted or privately owned shore-based hub, and a suite of software applications, offers a range of tools designed to increase communication efficiency, reduce costs, and manage network operations. Key functions include web and data compression and optimization to increase network capacity; remote PC management for customer IT departments; integrated e-mail, web compression, firewalls, and security; least-cost routing; and bandwidth management on multiple communication carriers. CommBox is now offered as an option for the TracPhone V7, V3 and with our Inmarsat-compatible TracPhone systems. CommBox sales include both the shipboard hardware and optional private shore-based hub, subscriptions to the selected software applications, and monthly system maintenance fees.
Land. We design, manufacture, and sell a range of TracVision satellite TV antenna systems for use on a broad array of vehicles, including recreational vehicles, trucks, conversion vans, and automobiles.
In the RV/truck market, we offer a line-up of our TracVision satellite TV products, including products intended for both stationary and in-motion use. Our RV product line, known as the TracVision SlimLine series, offers Ku-band HDTV support, automatic satellite switching, and integrated compatibility with the international DVB (Digital Video Broadcast) standard. The 12.5-inch high in-motion TracVision R5SL and stationary automatic TracVision R4SL use an elliptical parabolic antenna to reduce the antenna’s profile to address height restrictions on the road. The in-motion 12.5-inch high TracVision R6 is the flagship product of our RV-specific offerings. This system incorporates a number of innovations, including a high-efficiency antenna, integrated global positioning system (GPS) for faster satellite acquisition, and our patented DewShield electronic dew elimination technology.
The TracVision A7 uses hybrid phased-array antenna technology to provide in-motion reception of satellite TV programming in the continental United States using the DIRECTV service. Our TracVision A7 product includes a mobile satellite television antenna and an integrated 12V mobile DIRECTV receiver/controller designed specifically for the mobile environment by KVH and DIRECTV. The TracVision A7 stands approximately five inches high and mounts either to a vehicle’s roof rack or directly to the vehicle’s roof, making it practical for use aboard minivans, SUVs and other passenger vehicles. The TracVision A7 is also popular for tall motor coaches and buses. Automotive customers subscribe to DIRECTV’s TOTAL CHOICE MOBILE satellite TV programming package, which is specifically promoted for automotive applications. Local channels and network programming are also available as an option for TracVision A7 users as a result of the system’s integrated GPS and mobile receiver. At this time, we are the only company authorized by DIRECTV to sell, promote, and activate mobile users for the TOTAL CHOICE MOBILE programming package.
In addition to sales through aftermarket dealers, we sell our TracVision products to original equipment manufacturers for factory installation on new vehicles. Our TracVision SlimLine systems work with a range of service providers, including DIRECTV, DISH Network, and other regional service providers. Although initially designed for automotive applications, the TracVision A7 is now also sold within the RV marketplace to provide access to DIRECTV programming in in-motion applications and for vehicles with height restrictions that could prevent them from safely using a satellite TV antenna based on parabolic technology, and/or where the accumulation of moisture on the outer surface of the antenna’s radome is not a concern.
Aeronautical Applications. In February 2008, we announced that we had been awarded a $20.1 million contract by LiveTV, a leading in-flight entertainment supplier, which was subsequently increased in 2009 to
6
Table of Contents
$20.9 million. Under the terms of the multi-year contract, we design, develop, and manufacture new DIRECTV-compatible satellite TV antennas for use on narrowbody commercial aircraft, such as Boeing’s 737 and the Airbus A320, operating in the United States.
Shipments of these antennas began in the second quarter of 2009 and continued into 2010. They are intended to help fill the growing demand from airlines and passengers for live television in the air. While JetBlue Airways Corporation is the first and best known of the airlines to add DIRECTV service, Continental Airlines, Inc. began working in 2009 with LiveTV to field satellite television on its fleet of airliners. In the fourth quarter of 2010, Continental Airlines, Inc. merged with United Airlines. Both companies are now subsidiaries of United Continental Holdings. The merger has not had any impact on the original contract or the sales relationship with LiveTV.
Guidance and Stabilization Products
We offer a portfolio of digital compass and fiber optic gyro-based systems that address the rigorous requirements of military and commercial customers. Our systems provide reliable, easy-to-use and continuously available navigation and pointing data. Our guidance and stabilization products include our inertial measurement unit for precision guidance, fiber optic gyros for tactical navigation and stabilization, and digital compasses that provide accurate heading information for demanding applications.
Guidance and Stabilization. Our fiber optic gyro products use an all-fiber design that has no moving parts, resulting in an affordable combination of precision, accuracy and durability. Our fiber optic gyro products support a broad range of military applications, including stabilization of remote weapons stations, antennas, radar, optical devices or turrets; image stabilization and synchronization for shoulder-or tripod-mounted weapon simulators; precision tactical navigation systems for military vehicles, and guidance for weapons and unmanned autonomous vehicles. Our fiber optic gyro products are also used in commercial and industrial applications, such as train location control and track geometry measurement systems, robotics, surveying, optical stabilization, autonomous vehicles, and undersea remotely operated submersibles.
Our TG-6000 Inertial Measurement Unit (IMU) is a guidance system that provides precise measurement of motion and acceleration in three dimensions. It uses a three-axis configuration of our high-performance DSP-based (digital signal processing) fiber optic gyros integrated with three accelerometers. We believe that this configuration provides outstanding performance, high reliability, low maintenance and easy system integration. The TG-6000 IMU is in full production as a component in the U.S. Navy’s MK54 lightweight torpedo and is suitable for use in other applications that involve flight control, orientation, instrumentation and navigation, such as unmanned aerial vehicles. Building on our inertial measurement product offering, in June 2010, we introduced the CG-5100, our first commercial-grade inertial measurement unit. The CG-5100 is focused on a wide range of applications such as 3D Augmented Reality, mobile mapping, platform navigation and GPS augmentation for unmanned vehicle programs, precise mapping and imagery.
In October 2008, we introduced the CNS-5000 continuous navigation system, a self-contained navigation system that combines our fiber optic gyro-based inertial measurement technology with GPS technology from NovAtel. This navigation solution provides precise position and orientation of a host platform on a continuous basis, even during periods where GPS signals are blocked by natural or man-made obstructions or conditions. The CNS-5000 is designed for demanding commercial applications, such as dynamic surveying, precision agriculture, container terminal management, and autonomous vehicle navigation, where the ability to determine the precise position and orientation of a piece of equipment or a mobile platform is critical. The CNS-5000 is a commercial-off-the-shelf (COTS) product consisting of a FOG-based inertial measurement unit tightly integrated with GPS within a single enclosure. This design reduces the operational complexities for customers whose products cross international boundaries.
Our open-loop DSP-1500, DSP-3000 series, and DSP-4000 fiber optic gyros provide precision measurement of the rate and angle of a platform’s turning motion typically for significantly less cost than competing
7
Table of Contents
closed-loop gyros. These DSP-based products deliver performance superior to analog signal processing devices, which experience greater temperature-sensitive drift and rotation errors. Applications for these products include inertial measurement units, integrated navigation systems, attitude/heading/reference systems, and stabilization of antenna, radar and optical equipment.
We believe that our DSP-1500 fiber optic gyro is the world’s smallest precision fiber optic gyro. Its optical sensor is only 1.5 inches in diameter and 0.8 inches tall, and weighs just 0.09 lbs. Thanks to the tethered design, the sensor can be installed separately from the power and processing circuit boards. The small size and weight of the DSP-1500 make it well suited for applications with size and weight restrictions, such as night vision and thermal imaging systems, aircraft-mounted gimbaled cameras for law enforcement and homeland security, and shipboard optical systems.
The DSP-3000 series is slightly larger than a deck of playing cards and offers a variety of interface options to support a range of applications. High-performance 2-axis and 3-axis configurations can be realized by integrating multiple DSP-3000 units. Currently, the DSP-3000 series is used in an array of pointing and stabilization applications, including the U.S. Army’s Common Remotely Operated Weapon Station (CROWS) to provide the image and gun stabilization necessary to ensure that the weapon remains aimed at its target. We estimate that more than 20 companies have developed or are developing stabilized remote weapons stations that we believe will require similar fiber optic gyro stabilization capabilities. Our fiber optic products are also used in commercial and industrial applications, such as train location control and track geometry measurement systems, robotics, precision surveying, augmented reality systems, optical stabilization, autonomous vehicles, and undersea remotely operated submersibles. The larger, militarized DSP-4000 is designed for use in high-shock and highly dynamic environments, such as gun turret stabilization.
Tactical Navigation. Our TACNAV tactical navigation product line employs digital compass sensors and KVH fiber optic gyros to offer vehicle-based navigation and pointing systems with a range of capabilities, including GPS backup and enhancement, vehicle position, hull azimuth and navigation displays. Because our digital compass products measure the earth’s magnetic field rather than detect satellite signals from the GPS, they are not susceptible to GPS jamming devices.
TACNAV systems vary in size and complexity to suit a wide range of vehicles. The TACNAV Light is a low-cost, digital compass-based battlefield navigation system specifically designed for non-turreted vehicles, such as high mobility multi-wheeled vehicles (HMMWVs) and trucks. Turreted vehicles, including reconnaissance vehicles, armored personnel carriers and light armored vehicles, are supported by the TACNAV TLS, a digital compass-based tactical navigation and targeting system that offers a fiber optic gyro upgrade for enhanced accuracy. We also manufacture the TACNAV II Fiber Gyro Navigation system, which offers a compact design, continuous output of heading and pointing data, and a flexible architecture that allows it to function as either a stand-alone navigation module or as the central component of an expanded, multifunctional navigation system.
Our navigation systems function as standalone tools and also aggregate, integrate and communicate critical information from a variety of on-board systems. TACNAV can receive data from systems such as the vehicle’s odometer, military and commercial GPS devices, laser rangefinders, turret angle indicators and laser warning systems. TACNAV can also output this data to an on-board computer for retransmission through the vehicle’s communications systems to a digital battlefield management application.
Our TACNAV digital compass products have been sold for use aboard U.S. Army, Marine Corps, and Navy vehicles as well as to many allied countries, including Australia, the United Kingdom, Canada, Germany, Italy, New Zealand, Saudi Arabia, Spain, Sweden, Taiwan, Malaysia and Switzerland. We believe that we are among the leading manufacturers of such systems. Our standard TACNAV products can be customized to our customers’ specifications. At customer request, we offer training and other services on a time-and-materials basis.
8
Table of Contents
Sales, Marketing and Support
Our sales, marketing and support efforts target markets that are substantial and require dedicated dealers and distributors to reach end customers. These channels vary from time to time, but currently include targeted efforts to reach the leisure and commercial maritime markets, the RV and high-end automotive markets, and the commercial, industrial and government markets. We believe our brands are well known and well respected by consumers within their respective niches. These brands include:
TracVision—satellite television systems for vessels and vehicles
TracPhone—two-way satellite communications systems
mini-VSAT Broadband—broadband mobile satellite communications network
CommBox—network management hardware and software for maritime communications
Azimuth—digital compass for powerboats
Sailcomp—digital compass for sailboats
DataScope—handheld digital compass/rangefinder
TACNAV—tactical navigation systems for military vehicles
Our fiber optic gyros and digital compass sensors use an alphanumeric model numbering sequence such as C-100, DSP-1500, DSP-3000, DSP-4000, CNS-5000, CG-5100, and TG-6000 IMU.
We sell our mobile satellite communications products through an international network of independent retailers, chain stores and distributors, as well as to manufacturers of vessels and vehicles.
Our European sales subsidiary located in Denmark, KVH Europe A/S (KVH Europe), coordinates our sales, marketing and support efforts for our mobile satellite communications products in Europe, the Middle East, and Africa. Asian and South American sales are managed by our Asian subsidiary, KVH Industries Asia Pte Ltd. and our Brazilian subsidiary, KVH South America Comunicacao Por Satelite Ltda, respectively, under the oversight of our North American sales and marketing offices. Standalone CommBox sales are managed by Virtek Communication in cooperation with members of our satellite sales teams in all offices worldwide. See note 12 of the notes to our consolidated financial statements for information regarding our geographic segments.
We sell our guidance and stabilization products directly to U.S. and allied governments and government contractors, as well as through an international network of authorized independent sales representatives. This same network also sells our fiber optic products to commercial/industrial entities.
Backlog
Our backlog for all products and services was approximately $20.8 million on December 31, 2010, $24.5 million on December 31, 2009 and $12.3 million on December 31, 2008. The decrease in backlog of $3.7 million from December 31, 2009 to December 31, 2010 was primarily a result of a decrease in orders of our aeronautical antenna system sold to LiveTV. The increase in backlog of $12.2 million from December 31, 2008 to December 31, 2009 was primarily a result of increased orders for fiber optic gyros in support of remotely operated weapons station programs as well as our aeronautical antenna system sold to LiveTV.
Backlog consists of orders evidenced by written agreements and specified delivery dates for customers who are acceptable credit risks. Military orders included in backlog are generally subject to cancellation for the convenience of the customer. When orders are cancelled, we generally recover actual costs incurred through the date of cancellation and the costs resulting from termination. Individual orders for guidance and stabilization products are often large and may require procurement of specialized long-lead components and allocation of manufacturing resources. The complexity of planning and executing larger orders generally requires customers to order well in advance of the required delivery date, resulting in backlog.
9
Table of Contents
Backlog is not a meaningful indicator for predicting revenue in future periods. Commercial resellers for our mobile satellite communications products and legacy products do not carry extensive inventories and rely on us to ship products quickly. Generally due to the rapid delivery of our commercial products, our backlog for those products is not significant.
Intellectual Property
Our ability to compete effectively depends to a significant extent on our ability to protect our proprietary information. We rely primarily on patents and trade secret laws, confidentiality procedures and licensing arrangements to protect our intellectual property rights. We own approximately 40 U.S. and foreign patents and have additional patent applications that are currently pending. We also register our trademarks in the United States and other key markets where we do business. Our patents will expire at various dates between March 2013 and July 2028. We enter into confidentiality agreements with our consultants, key employees and sales representatives, and maintain controls over access to and distribution of our technology, software and other proprietary information. The steps we have taken to protect our technology may be inadequate to prevent others from using what we regard as our technology to compete with us.
We do not generally conduct exhaustive patent searches to determine whether the technology used in our products infringes patents held by third parties. In addition, product development is inherently uncertain in a rapidly evolving technological environment in which there may be numerous patent applications pending, many of which are confidential when filed, with regard to similar technologies.
From time to time, we have faced claims by third parties that our products or technologies infringe their patents or other intellectual property rights, and we may face similar claims in the future. Any claim of infringement could cause us to incur substantial costs defending against the claim, even if the claim is invalid, and could distract the attention of our management. If any of our products is found to violate third-party proprietary rights, we may be required to pay substantial damages. In addition, we may be required to re-engineer our products or seek to obtain licenses from third parties to continue to offer our products. Any efforts to re-engineer our products or obtain licenses on commercially reasonable terms may not be successful, which would prevent us from selling our products, and, in any case, could substantially increase our costs and have a material adverse effect on our business, financial condition and results of operations.
Manufacturing
Manufacturing operations for our mobile satellite communications and navigation products consist of light manufacture, final assembly and testing. Manufacturing operations for our fiber optic gyro products are more complex. We produce specialized optical fiber, fiber optic components and sensing coils and combine them with components purchased from outside vendors for assembly into finished goods. We own optical fiber drawing towers where we produce the specialized optical fiber that we use in all of our fiber optic products. Excluding the CommBox product, which we manufacture in Norway, we manufacture our mobile satellite communications products at our headquarters in Middletown, Rhode Island, and utilize a nearby leased facility for warehousing and distribution purposes. We manufacture our navigation and fiber optic gyro products in our facility located in Tinley Park, Illinois.
We contract with third parties for fabrication and assembly of printed circuit boards, injection-molded plastic parts, machined metal components, connectors and housings. We believe there are a number of acceptable vendors for the components we purchase. We regularly evaluate both domestic and foreign suppliers for quality, dependability and cost effectiveness. In some instances we utilize sole-source suppliers to develop strategic relationships to enhance the quality of materials and save costs. Our manufacturing processes are controlled by an ISO 9001:2008-certified quality standards program.
10
Table of Contents
Competition
We encounter significant competition in all of our markets, and we expect this competition to intensify in the future. Many of our primary competitors are well-established companies and some have substantially greater financial, managerial, technical, marketing, operational and other resources than we do.
In the market for mobile satellite communications products, we compete with a variety of companies. We believe the principal competitive factors in this market are product size, design, performance, reliability, and price.
In the marine market for satellite TV equipment, we compete primarily with NaviSystem Marine Electronics Systems Srl, King Controls, Cobham Sea Tel, Inc., Intellian, Thrane & Thrane A/S and Raymarine. In the marine market for voice, fax, data and Internet communications equipment and services, we compete with Cobham Sea Tel, Inc., Thrane & Thrane A/S, Furuno Electric Co., Ltd., Globalstar LP, Iridium Satellite LLC, Intellian, Ship Equip and JRC. We also face competition from providers of marine satellite data services and maritime VSAT solutions, including MTN/SeaMobile, Speedcast, CapRock, Schlumberger, Ship Equip, Vizada and Stratos.
Foreign competition for our mobile satellite communications products has continued to intensify, most notably from companies based in South Korea that seek to compete primarily on price. We anticipate that this trend of substantial competition from this region will continue.
In the land mobile markets, we compete primarily with King Controls, Cobham TracStar, MotoSAT, and Winegard Company.
In the guidance and stabilization markets, we compete primarily with Honeywell International Inc., Kearfott Guidance & Navigation Corporation, Northrop Grumman Corporation, Goodrich Aerospace, IAI and Fizoptica. We believe the principal competitive factors in these markets are performance, size, reliability, durability and price.
Research and Development
Focused investments in research and development are critical to our future growth and competitive position in the marketplace. Our research and development efforts are directly related to timely development of new and enhanced products that are central to our core business strategy. The industries in which we compete are subject to rapid technological developments, evolving industry standards, changes in customer requirements, and new product introductions and enhancements. As a result, our success depends in part upon our ability, on a cost-effective and timely basis, to continue to enhance our existing products and to develop and introduce new products that improve performance and meet customers’ operational and cost requirements. Our current research and development efforts include projects to achieve additional cost reductions in our products and the development of new products for our existing marine and land mobile communications markets, and navigation, guidance and stabilization application markets. For example, in February 2011, we introduced a new addition to our mini-VSAT Broadband-compatible antenna family, the 14.5-inch diameter TracPhone V3, and we are currently developing a miniaturized gyro intended for integration within stabilized cameras, drones, and other systems that need very high bandwith, super low noise sensors.
Our research and development activities consist of projects funded by us, projects funded with the assistance of customer-funded contract research and Small Business Innovative Research (SBIR) grants. Our customer-funded research efforts are made up of contracts with defense and OEM customers, whose performance specifications are unique to their product applications. SBIR projects are generally directed towards the discovery of specific information requested by the government research sponsor. Many of these grants have enhanced our technologies, resulting in new or improved product offerings. Defense and OEM research often results in new product offerings. We strive to be the first company to bring a new product to market, and we use our own funds to accelerate new product development efforts.
11
Table of Contents
Government Regulation
Our manufacturing operations are subject to various laws governing the protection of the environment and our employees. These laws and regulations are subject to change, and any such change may require us to improve our technologies, incur expenditures, or both, in order to comply with such laws and regulations.
We are subject to compliance with the U.S. Export Administration Regulations. Some of our products have military or strategic applications, and are on the Munitions List of the U.S. International Traffic in Arms Regulations. These products require an individual validated license to be exported to certain jurisdictions. The length of time involved in the licensing process varies and can result in delays of the shipping of the products. Sales of our products to either the U.S. government or its prime contractors are subject to the U.S. Federal Acquisition Regulations.
We are also subject to the laws and regulations of the various foreign jurisdictions in which we offer and sell our products and services, including those of the European Union, Brazil, Norway and Singapore.
Employees
On December 31, 2010, we employed 390 full-time employees. We also employ temporary or contract personnel, when necessary, to provide short-term and/or specialized support for production and other functional projects.
We believe our future success will depend upon the continued service of our key technical and senior management personnel and upon our continued ability to attract and retain highly qualified technical and managerial personnel. None of our employees is represented by a labor union. We have never experienced a work stoppage and consider our relationship with our employees to be good.
| ITEM 1A. | Risk Factors |
An investment in our common stock involves a high degree of risk. You should carefully consider the following risk factors in evaluating our business. If any of these risks, or other risks not presently known to us or that we currently believe are not significant, develops into an actual event, then our business, financial condition and results of operations could be adversely affected. If that happens, the market price of our common stock could decline.
Our revenues and results of operations have been and may continue to be adversely impacted by worldwide economic turmoil, credit tightening and associated declines in consumer spending.
Worldwide economic conditions have experienced a significant downturn over the last two to three years, including slower economic activity, tightened credit markets, inflation and deflation concerns, decreased consumer confidence, reduced corporate profits, reduced or canceled capital spending, adverse business conditions and liquidity concerns. These conditions make it difficult for businesses, governments and consumers to accurately forecast and plan future activities. Although net sales of our FOG products increased $11.4 million, or 39%, from 2009 to 2010, driven largely by increased sales for commercial applications, such as surveying and optical stabilization, and a range of government and defense applications, including weapons stabilization, there can be no assurance that such an increase will continue in the future. Governments are experiencing significant declines in tax receipts, which may cause them to curtail spending significantly or reallocate funds away from defense programs. There can be no assurances that government responses to the disruptions in the economy will remedy these problems. As a result of these and other factors, customers could slow or suspend spending on our products and services. We may also incur increased credit losses and need to increase our allowance for doubtful accounts, which would have a negative impact on our earnings and financial condition. We cannot predict the timing, duration or ultimate impact of this downturn. We expect our business to continue to be adversely impacted by this downturn.
12
Table of Contents
Net sales of our mobile communications products are largely generated by discretionary consumer spending, and demand for these products may demonstrate slower growth or decline as a result of continuing weak regional and global economic conditions. Consumer spending tends to decline during recessionary periods and may decline at other times. For example, although sales of our mobile satellite communications products have recently increased, sales of those products declined approximately 27% from 2008 to 2009. These recent increases in sales may not be sustained in future periods. Consumers may choose not to purchase our mobile communications products due to a perception that they are luxury items. As global and regional economic conditions change, including the general level of interest rates, fluctuating oil prices and demand for durable consumer products, demand for our products could be materially and adversely affected.
Our results of operations could be adversely affected if unseasonably cold weather, prolonged winter conditions, disasters or similar events occur.
Our marine leisure business is highly seasonal and seasonality can also impact our commercial marine business. We historically have generated the majority of our marine leisure product revenues during the first and second quarters of each year, and these revenues typically decline in the third and fourth quarters of each year, compared to the first two quarters. Our marine leisure business is also significantly affected by the weather. Unseasonably cool weather, prolonged winter conditions, hurricanes, unusual amounts of rain, and natural and other disasters may decrease boating, which could reduce our revenues. Specifically, we may encounter a decrease in new airtime activations as well as an increase in the number of cancellations or temporary suspensions of our airtime service.
We expect that we could derive an increasing portion of our revenues from commercial leases of mobile communications equipment, rather than sales, which could increase our credit and collection risk.
We are actively seeking to increase revenues from the commercial markets for our mini-VSAT Broadband service, particularly shipping companies and other companies that deploy a fleet of vessels. In marketing this service, we offer leasing arrangements for the TracPhone antennas to both commercial and leisure customers. If commercial leases become increasingly popular with our customers, we could face increased risks of default under those leases. Defaults could increase our costs of collection (including costs of retrieving leased equipment) and reduce the amount we collect from customers, which could harm our results of operations.
Our inventory levels could require an inventory write-down if our inventory reduction and rebalancing efforts are ineffective.
During 2009, we recorded an additional $1.3 million in inventory charges in order to account for the risk of excess inventory due, in part, to weak consumer demand and during 2010, we wrote off approximately $0.6 million of fully reserved inventory. However, if our future inventory reduction and rebalancing efforts are unsuccessful or take an extended period of time, we may have to consider additional, more sizeable inventory reserves or write-downs to address potential excess and obsolete inventory, and our gross margins may fall below historical levels, which would adversely affect our financial results.
Adverse economic conditions could result in financial difficulties or bankruptcy for any of our suppliers, which could adversely affect our business and results of operations.
The significant downturn in worldwide economic conditions and credit tightening could present challenges to our suppliers, which could result in disruptions to our business, increase our costs, delay shipment of our products and impair our ability to generate and recognize revenue. To address their own business challenges, our suppliers may increase prices, reduce the availability of credit, require deposits or advance payments or take other actions that may impose a burden on us.
13
Table of Contents
They may also reduce production capacity, slow or delay delivery of products, face challenges meeting our specifications or otherwise fail to meet our requirements. In some cases, our suppliers may face bankruptcy. We may be required to identify, qualify and engage new suppliers, which would require time and the attention of management. Any of these events could impair our ability to deliver our products to customers in a timely and cost-effective manner, cause us to breach our contractual commitments or result in the loss of customers.
Shifts in our product sales mix toward our mobile communications products may reduce our overall gross margins.
Our mobile communications products historically have had lower product gross margins than our guidance and stabilization products. During the first three quarters of 2008, sales of our guidance and stabilization products either declined or grew at a substantially lower rate than our overall sales growth. During the fourth quarter of 2008 and the years ended December 31, 2009 and 2010, we experienced a significant increase in sales of our guidance and stabilization products, primarily due to an increase in our FOG product sales. A shift in our product sales mix toward mobile communications products would likely cause lower gross margins in the future, especially if driven by reduced demand.
We must generate a certain level of sales of the TracPhone V7, TracPhone V3 and our mini-VSAT Broadband service in order to improve our service gross margins.
As a result of our continued build-out of the mini-VSAT Broadband network infrastructure, our cost of service sales includes certain fixed costs that do not vary with the volume of service sales. These fixed costs are increasing as we expand our network across the globe and we have an extremely limited ability to reduce these fixed costs in the short term. If sales of our TracPhone V7, TracPhone V3 and the mini-VSAT Broadband service do not generate the level of revenue that we expect or decline, our service gross margins may remain below historical levels or decline. For example, our overall service gross margin, which also includes product repair sales, Inmarsat airtime sales, and contracted engineering sales, declined from 26% for the year ended December 31, 2009 to 20% for the year ended December 31, 2010. The failure to improve our mini-VSAT Broadband service gross margins would have a material adverse effect on our overall profitability.
Competition may limit our ability to sell our mobile communications products and guidance and stabilization products.
The mobile communications markets and defense navigation, guidance and stabilization markets in which we participate are very competitive, and we expect this competition to persist and intensify in the future. We may not be able to compete successfully against current and future competitors, which could impair our ability to sell our products. For example, improvements in the performance of lower cost gyros by competitors could potentially jeopardize sales of our fiber optic gyros. Foreign competition for our mobile satellite communications products has continued to intensify, most notably from companies that seek to compete primarily on price. We anticipate that this trend of substantial competition will continue.
In the market for marine satellite TV equipment, we compete with NaviSystem Marine Electronic Systems Srl, King Controls, Cobham Sea Tel, Inc., Raymarine, Thrane & Thrane A/S and Intellian.
In the market for maritime broadband service we compete with Speedcast, MTN/SeaMobile, CapRock, Schlumberger, Ship Equip, Vizada and Stratos.
In the marine market for satellite communications equipment, we compete with Cobham Sea Tel, Inc., Furuno Electric Co., Ltd., Globalstar LP, Thrane & Thrane A/S, Intellian, Ship Equip, JRC and Iridium Satellite LLC.
In the market for land mobile satellite TV equipment, we compete with MotoSAT, King Controls, Cobham TracStar and Winegard Company.
14
Table of Contents
In the guidance and stabilization markets, we compete primarily with Honeywell International Inc., Kearfott Guidance & Navigation Corporation, Northrop Grumman Corporation, Goodrich Aerospace, IAI, and Fizoptica.
Among the factors that may affect our ability to compete in our markets are the following:
| • | many of our primary competitors are well-established companies that could have substantially greater financial, managerial, technical, marketing, personnel and other resources than we do; |
| • | product improvements, new product developments or price reductions by competitors may weaken customer acceptance of, and reduce demand for, our products; |
| • | new technology or market trends may disrupt or displace a need for our products; and |
| • | our competitors may have lower production costs than we do, which may enable them to compete more aggressively in offering discounts and other promotions. |
The emergence of a competing small maritime VSAT antenna and complementary service or other similar service could reduce the competitive advantage we believe we currently enjoy with our 24-inch diameter TracPhone V7 and 14.5-inch diameter TracPhone V3 antennas along with our integrated mini-VSAT Broadband service.
Our TracPhone V7 and TracPhone V3 systems offer customers a range of benefits due to their integrated design, hardware costs that are lower than existing maritime VSAT systems, and spread spectrum technology. We currently compete against companies that offer established maritime VSAT service using, in some cases, antennas 1-meter in diameter or larger. While we are unaware of any company offering a 14.5-inch VSAT solution comparable to our TracPhone V3, we are encountering regional competition from companies offering 24-inch VSAT systems and services. In addition, other companies could replicate some of the distinguishing features of our TracPhone V7 or TracPhone V3, which could potentially reduce the appeal of our solution, increase price competition and adversely affect sales. Moreover, consumers may choose other services such as FleetBroadband or Iridium OpenPort for their service coverage and potentially lower hardware costs despite higher service costs and slower data rates.
Our ability to compete in the maritime airtime services market may be impaired if we are unable to complete or expand coverage of our mini-VSAT Broadband service around the globe to provide sufficient service capacity to meet customer demand.
The TracPhone V7 and V3 and mini-VSAT Broadband service offer a range of benefits to mariners, especially in commercial markets, due to the smaller size antenna and faster, more affordable airtime. However, to support these customers globally, we may need to continue the expansion of the coverage areas of the mini-VSAT Broadband service, which is currently offered in the north Pacific Ocean, the Americas, Caribbean, North Atlantic, Europe, the Persian Gulf, Asia-Pacific, Africa, Brazil, Australian and New Zealand waters, and the Indian Ocean. If we are unable to reach agreement with third-party satellite providers to support the mini-VSAT Broadband service and its spread spectrum technology or transponder capacity is unavailable should we need to increase our capacity to meet growing demand in a given region, our ability to support vessels and aeronautical applications globally will be at risk and could reduce the attractiveness of the product and service to these customers.
The purchasing and delivery schedules and priorities of the U.S. military and foreign governments are often unpredictable.
We sell our fiber optic gyro systems as well as vehicle navigation products to U.S. and foreign military and government customers, either directly or as a subcontractor to other contractors. These customers often use a competitive bidding process and have unique purchasing and delivery requirements, which often makes the timing of sales to these customers unpredictable. Factors that affect their purchasing and delivery decisions include:
| • | changes in modernization plans for military equipment; |
15
Table of Contents
| • | changes in tactical navigation requirements; |
| • | global conflicts impacting troop deployment; |
| • | priorities for current battlefield operations; |
| • | allocation of funding for military programs; |
| • | new military and operational doctrines that affect military equipment needs; |
| • | sales cycles that are long and difficult to predict; |
| • | shifting response time and/or delays in the approval process associated with the export licenses we must obtain prior to the international shipment of certain of our military products; |
| • | delays in military procurement schedules; and |
| • | delays in the testing and acceptance of our products, including delays resulting from changes in customer specifications. |
These factors can cause substantial fluctuations in sales of our FOG and TACNAV products from period to period. For example, sales of our FOG products increased $11.4 million, or 39%, from 2009 to 2010 driven largely by increased sales for commercial applications, such as surveying and optical stabilization, and a range of government and defense applications, including weapons stabilization. The Obama administration and Congress may change defense spending priorities, either in conjunction with the decision to commence troop withdrawals from Iraq and Afghanistan or for other reasons. Moreover, government customers and their contractors can generally cancel orders for our products for convenience or decline to exercise previously disclosed contract options. Even under firm orders with government customers, funding must often be appropriated in the budget process in order for the government to complete the contract. The cancellation of or failure to fund orders for our products could substantially reduce our net sales and results of operations. For example, our contract award from the U.S. Coast Guard for our mini-VSAT Broadband service does not impose any minimum order quantity, and the U.S. Coast Guard could order substantially fewer products and services than we anticipate.
Sales of our fiber optic gyro systems and TACNAV products generally consist of a few large orders, and the delay or cancellation of a single order could substantially reduce our net sales.
KVH products sold to customers in the defense industry are purchased through orders that can generally range in size from several hundred thousand dollars to more than one million dollars. For example, in July 2010, we received a $13.0 million TACNAV products order and in October 2010, we also received a $1.1 million fiber optic gyro contract. As a result, the delay or cancellation of a single order could materially reduce our net sales and results of operations. We periodically experience repeated and unanticipated delays in defense orders, which make our revenues and operating results less predictable. Because our guidance and stabilization products typically have relatively higher product gross margins than our mobile communications products, the loss of an order for guidance and stabilization products could have a disproportionately adverse effect on our results of operations.
Only a few customers account for a substantial portion of our guidance and stabilization revenues, and the loss of any of these customers could substantially reduce our net sales.
We derive a significant portion of our guidance and stabilization revenues from a small number of customers, most of whom are contractors for the U.S. Government. Our top four guidance and stabilization customers in 2010 accounted for approximately 29% of our net sales during 2010. The loss of business from any of these customers could substantially reduce our net sales and results of operations and could seriously harm our business. Since we are often awarded a contract as a subcontractor to a major defense supplier that is engaged in a competitive bidding process as prime contractor for a major weapons procurement program, our revenues depend significantly on the success of the prime contractors with which we align ourselves. For example, our
16
Table of Contents
largest remote weapon systems customer accounted for approximately 14% and 15% of our net sales in 2010 and 2009, respectively. In addition, a subcontractor to this customer accounted for approximately 5% and 7% of our net sales in 2010 and 2009, respectively. We anticipate a sequential decline in net sales related to our largest remote weapon systems customer during the first half of 2011.
We only have one customer for our aviation antenna, and the customer may cancel this agreement at any time subject to a termination charge.
In February 2008, we entered into a $20.1 million long-term antenna development and production agreement with LiveTV that was subsequently increased in 2009 to $20.9 million. Under the terms of the agreement with LiveTV, we manufacture a DIRECTV-compatible satellite television antenna for use on narrowbody commercial aircraft operating in the United States. We began shipment of the antennas in the second quarter of 2009. LiveTV may terminate the agreement including any outstanding purchase orders at any time subject to a sliding scale termination charge driven by the quantity shortfall in units shipped under the agreement. As of December 31, 2010, the termination fee would be approximately $3.0 million, which would be offset by an approximate total charge of $3.2 million related to capitalized aviation research and development costs and inventory specific to the aviation antenna that would be required to be expensed if termination was invoked. As a result, if the aviation contract was terminated as of December 31, 2010, we would have recorded an approximate net charge to our income statement of $0.2 million.
The cancellation of or failure to fund orders under this agreement could reduce our future net sales and negatively impact our results of operations, as we currently do not have another customer in the aviation market .
Our mobile satellite products currently depend on satellite services and facilities provided by third parties, and a disruption in those services could adversely affect sales.
Our satellite products include only the equipment necessary to utilize satellite services; we do not broadcast satellite television programming or own the satellites to directly provide two-way satellite communications. We currently offer satellite television products compatible with the DIRECTV and DISH Network services in the United States, the Bell TV service in Canada, the Sky Mexico service and various other regional services in other parts of the world.
SES World Skies, Eutelsat, Sky Perfect-JSAT, GE Satellite, Telesat, EchoStar and Star One currently provide the satellite capacity to support the mini-VSAT Broadband service and our TracPhone V7 and V3. In addition, we have agreements with various teleports and Internet Service Providers (ISPs) around the globe to support the mini-VSAT Broadband service. We rely on Inmarsat for satellite communications services for our mini-M, Fleet and FleetBroadband compatible TracPhone products.
If customers become dissatisfied with the programming, pricing, service, availability or other aspects of any of these satellite services, or if any one or more of these services becomes unavailable for any reason, we could suffer a substantial decline in sales of our satellite products. There may be no alternative service provider available in a particular geographic area, and our modem or other technology may not be compatible with the technology of any alternative service provider that may be available. In addition, the unexpected failure of a satellite could disrupt the availability of programming and services, which could reduce the demand for, or customer satisfaction with, our products.
We rely upon spread spectrum communications technology developed by ViaSat and transmitted by third-party satellite providers to permit two-way broadband Internet via our 24-inch diameter TracPhone V7 antenna and our 14.5-inch diameter TracPhone V3 antenna, to be released during the second quarter of 2011, and any disruption in the availability of this technology could adversely affect sales.
Our mini-VSAT Broadband service relies on spread spectrum technology developed with ViaSat, Inc., for use with satellite capacity controlled by SES World Skies, Eutelsat, Sky Perfect-JSAT, GE Satellite, Telesat, Echostar, Star One and Optus. Our TracPhone V7 and V3 two-way broadband satellite terminal combines our stabilized antenna technology with ViaSat’s ArcLight spread spectrum mobile broadband technology, along with a new maritime version of ViaSat’s ArcLight spread spectrum modem. The ArcLight technology is also
17
Table of Contents
integrated within the satellite hubs that support this service. Sales of the TracPhone V7 and V3 and our mini-VSAT Broadband service could be disrupted if we fail to receive approval from regulatory authorities to provide our spread spectrum service in the waters of various countries where our customers operate or if there are issues with the availability of the ArcLight maritime modems.
Investment in the initial global deployment of the mini-VSAT Broadband service has required significant capital investment and initial network costs of service, as well as operating expenses that may not be recouped if we fail to meet the subscriber levels necessary to cover those costs on an ongoing basis.
It is our intent to continue to invest in and deploy the mini-VSAT Broadband network on a global basis in cooperation with ViaSat under the terms of a 10-year agreement announced in July 2008. As part of the coverage expansion, we agreed to acquire satellite capacity from Ku-band satellite operators and are in the process of purchasing new regional satellite hubs from ViaSat. Each satellite hub represents a substantial capital investment. During the initial deployment period, we have incurred a substantial increase in costs associated with the build out of the mini-VSAT Broadband global infrastructure and support capability and may continue to incur an increase in costs if we pursue expanded coverage in the future. In the short term, KVH and ViaSat will be covering the operational cost per transponder access until sufficient subscribers join the network and allow us to reach acceptable gross margin levels relating to our transponder and other network service costs, which may not occur. We currently estimate that, on average, it will require at least nine months to reach the breakeven point for a discrete region, i.e., offsetting these incremental network costs, once the service is turned on for a new coverage region. However, certain regions that are essential for our global coverage may exceed this time period before being profitable or may not be profitable. In addition, should an insufficient number of subscribers activate within a region, our operations may continue below the breakeven level for a longer duration and adversely affect our operating results and cash levels.
High fuel prices, tight credit availability and environmental concerns are adversely affecting sales of our mobile communications products.
Factors such as historically high fuel prices, tight credit and environmental protection laws are continuing to materially and adversely affect sales of larger vehicles and vessels for which our mobile satellite communications products are designed. Many customers finance their purchases of these vehicles and vessels, and tightened credit availability has reduced demand for both these vehicles and vessels and our mobile communications products. Moreover, in the current credit markets, financing for these purchases has been unavailable or more difficult to obtain. The increased cost of operating these vehicles and vessels is adversely affecting and may continue to adversely affect demand for our mobile satellite communications products.
We may continue to increase the use of international suppliers to source components for our manufacturing operations, which could disrupt our business.
Although we have historically manufactured and sourced raw materials for the majority of our products in the U.S., in order for us to compete with lower priced competitive products while also improving our profitability, we have found it desirable to source raw materials and manufactured components from foreign countries such as China and Mexico. Our increased reliance on foreign manufacturing and/or raw material supply has lengthened our supply chain and increased the risk that a disruption in that supply chain could have a material adverse affect on our operations and financial performance.
We have single dedicated manufacturing facilities for each of our mobile communications and guidance and stabilization product categories, and any significant disruption to a facility could impair our ability to deliver our products.
Excluding the CommBox product, which we manufacture in Norway, we currently manufacture all of our mobile communications products at our headquarters in Middletown, Rhode Island, and the majority of our guidance and stabilization products at our facility in Tinley Park, Illinois. Some of our production processes are
18
Table of Contents
complex, and we may be unable to respond rapidly to the loss of the use of either production facility. For example, our production facilities use some specialized equipment that may take time to replace if they are damaged or become unusable for any reason. In that event, shipments would be delayed, which could result in customer or dealer dissatisfaction, loss of sales and damage to our reputation. Finally, we have only a limited capability to increase our manufacturing capacity in the short term. If short-term demand for our products exceeds our manufacturing capacity, our inability to fulfill orders in a timely manner could also lead to customer or dealer dissatisfaction, loss of sales and damage to our reputation.
We depend on sole or limited source suppliers, and any disruption in supply could impair our ability to deliver our products on time or at expected cost.
We obtain many key components for our products from third-party suppliers, and in some cases we use a single or a limited number of suppliers. Any interruption in supply could impair our ability to deliver our products until we identify and qualify a new source of supply, which could take several weeks, months or longer and could increase our costs significantly. Suppliers might change or discontinue key components, which could require us to modify our product designs. For example, in the past, we have experienced changes in the chemicals used to coat our optical fiber, which changed its characteristics and thereby necessitated design modifications. In general, we do not have written long-term supply agreements with our suppliers but instead purchase components through purchase orders, which expose us to potential price increases and termination of supply without notice or recourse. It is generally not our practice to carry significant inventories of product components, and this could magnify the impact of the loss of a supplier. If we are required to use a new source of materials or components, it could also result in unexpected manufacturing difficulties and could affect product performance and reliability. In addition, from time to time, lead times for certain components can increase significantly due to imbalances in overall market supply and demand. This, in turn, could limit our ability to satisfy the demand for certain of our products on a timely basis, and could result in some customer orders being rescheduled or cancelled.
Any failure to maintain and expand our third-party distribution relationships may limit our ability to penetrate markets for mobile communications products.
We market and sell our mobile communications products through an international network of independent retailers, chain stores and distributors, as well as to manufacturers of marine vessels and recreational vehicles. If we are unable to maintain or improve our distribution relationships, it could significantly limit our sales. In addition, our distribution partners may sell products of other companies, including competing products, and are generally not required to purchase minimum quantities of our products.
If we are unable to improve our existing mobile communications and guidance and stabilization products and develop new, innovative products, our sales and market share may decline.
The markets for mobile communications products and guidance and stabilization products are each characterized by rapid technological change, frequent new product innovations, changes in customer requirements and expectations and evolving industry standards. If we fail to make innovations in our existing products and reduce the costs of our products, our market share may decline. Products using new technologies, or emerging industry standards, could render our products obsolete. If our competitors successfully introduce new or enhanced products that eliminate technological advantages our products may have in a market or otherwise outperform our products, or are perceived by consumers as doing so, we may be unable to compete successfully in the markets affected by these changes.
If we cannot effectively manage changes in our rate of growth, our business may suffer.
We have previously expanded our operations to pursue existing and potential market opportunities, and we are continuing to expand our international operations in connection with the build-out of our mini-VSAT network. This growth placed a strain on our personnel, management, financial and other resources. Although
19
Table of Contents
both our guidance and stabilization revenue and our mobile communications revenue have increased dramatically in 2010, they have both declined dramatically in earlier periods in response to economic conditions, weak consumer demand and other factors. If, in the future, any portion of our business grows more rapidly than we anticipate and we fail to manage that growth properly, we may incur unnecessary expenses, and the efficiency of our operations may decline. If we are unable to adjust our operating expenses on a timely basis in response to changes in revenue cycles, our results of operations may be harmed. To manage changes in our rate of growth effectively, we must, among other things:
| • | match our manufacturing facilities and capacity to demand for our products in a timely manner; |
| • | successfully attract, train, motivate and manage appropriate numbers of employees for manufacturing, sales and customer support activities; |
| • | effectively manage our inventory and working capital; and |
| • | improve the efficiencies within our operating, administrative, financial and accounting systems, and our procedures and controls. |
We may be unable to hire and retain the skilled personnel we need to expand our operations.
To meet our growth objectives, we must attract and retain highly skilled technical, operational, managerial and sales and marketing personnel. If we fail to attract and retain the necessary personnel, we may be unable to achieve our business objectives and may lose our competitive position, which could lead to a significant decline in net sales. We face significant competition for these skilled professionals from other companies, research and academic institutions, government entities and other organizations.
Our success depends on the services of our executive officers.
Our future success depends to a significant degree on the skills and efforts of Martin Kits van Heyningen, our co-founder, President, Chief Executive Officer, and Chairman of the Board. If we lost the services of Mr. Kits van Heyningen, our business and operating results could be seriously harmed. We also depend on the ability of our other executive officers to work effectively as a team. The loss of one or more of our executive officers could impair our ability to manage our business effectively.
Our international business operations expose us to a number of difficulties in coordinating our activities abroad and in dealing with multiple regulatory environments.
Historically, sales to customers outside the United States and Canada have accounted for a significant portion of our net sales. We have foreign sales offices in Denmark, Singapore and Norway and we otherwise support our international sales from our operations in the United States. Our limited operations in foreign countries may impair our ability to compete successfully in international markets and to meet the service and support needs of our customers in countries where we have no infrastructure. We are subject to a number of risks associated with our international business activities, which may increase our costs and require significant management attention. These risks include:
| • | technical challenges we may face in adapting our mobile communications products to function with different satellite services and technology in use in various regions around the world; |
| • | satisfaction of international regulatory requirements and delays and costs associated with procurement of any necessary licenses or permits; |
| • | restrictions on the sale of certain guidance and stabilization products to foreign military and government customers; |
| • | increased costs of providing customer support in multiple languages; |
20
Table of Contents
| • | potentially adverse tax consequences, including restrictions on the repatriation of earnings; |
| • | protectionist laws and business practices that favor local competitors, which could slow our growth in international markets; |
| • | potentially longer sales cycles, which could slow our revenue growth from international sales; |
| • | potentially longer accounts receivable payment cycles and difficulties in collecting accounts receivable; |
| • | losses arising from impairment charges associated with goodwill or intangible assets; |
| • | losses arising from foreign currency exchange rate fluctuations; and |
| • | economic and political instability in some international markets. |
Exports of certain guidance and stabilization products are subject to the International Traffic in Arms Regulations and require a license from the U.S. Department of State prior to shipment.
We must comply with the United States Export Administration Regulations and the International Traffic in Arms Regulations, or ITAR. Certain of our products have military or strategic applications and are on the munitions list of the ITAR and require an individual validated license in order to be exported to certain jurisdictions. Any changes in export regulations may further restrict the export of our products, and we may cease to be able to procure export licenses for our products under existing regulations. The length of time required by the licensing process can vary, potentially delaying the shipment of products and the recognition of the corresponding revenue. Any restriction on the export of a product line or any amount of our products could cause a significant reduction in net sales.
Our business may suffer if we cannot protect our proprietary technology.
Our ability to compete depends significantly upon our patents, our source code and our other proprietary technology. The steps we have taken to protect our technology may be inadequate to prevent others from using what we regard as our technology to compete with us. Our patents could be challenged, invalidated or circumvented, and the rights we have under our patents could provide no competitive advantages. Existing trade secrets, copyright and trademark laws offer only limited protection. In addition, the laws of some foreign countries do not protect our proprietary technology to the same extent as the laws of the United States, which could increase the likelihood of misappropriation. Furthermore, other companies could independently develop similar or superior technology without violating our intellectual property rights. Any misappropriation of our technology or the development of competing technology could seriously harm our competitive position, which could lead to a substantial reduction in net sales.
If we resort to legal proceedings to enforce our intellectual property rights, the proceedings could be burdensome, disruptive and expensive, distract the attention of management, and there can be no assurance that we would prevail.
Also, we have delivered certain technical data and information to the U.S. government under procurement contracts, and it may have unlimited rights to use that technical data and information. There can be no assurance that the U.S. government will not authorize others to use that data and information to compete with us.
Claims by others that we infringe their intellectual property rights could harm our business and financial condition.
Our industries are characterized by the existence of a large number of patents and frequent claims and related litigation regarding patent and other intellectual property rights. We cannot be certain that our products do not and will not infringe issued patents, patents that may be issued in the future, or other intellectual property rights of others.
21
Table of Contents
We do not generally conduct exhaustive patent searches to determine whether the technology used in our products infringes patents held by third parties. In addition, product development is inherently uncertain in a rapidly evolving technological environment in which there may be numerous patent applications pending, many of which are confidential when filed, with regard to similar technologies.
From time to time we have faced claims by third parties that our products or technology infringe their patents or other intellectual property rights, and we may face similar claims in the future. Any claim of infringement could cause us to incur substantial costs defending against the claim, even if the claim is invalid, and could distract the attention of our management. If any of our products are found to violate third-party proprietary rights, we may be required to pay substantial damages. In addition, we may be required to re-engineer our products or obtain licenses from third parties to continue to offer our products. Any efforts to re-engineer our products or obtain licenses on commercially reasonable terms may not be successful, which would prevent us from selling our products, and, in any case, could substantially increase our costs and have a material adverse effect on our business, financial condition and results of operations.
Fluctuations in our quarterly net sales and results of operations could depress the market price of our common stock.
We have at times experienced significant fluctuations in our net sales and results of operations from one quarter to the next. Our future net sales and results of operations could vary significantly from quarter to quarter due to a number of factors, many of which are outside our control. Accordingly, you should not rely on quarter-to-quarter comparisons of our results of operations as an indication of future performance. It is possible that our net sales or results of operations in a quarter will fall below the expectations of securities analysts or investors. If this occurs, the market price of our common stock could fall significantly. Our results of operations in any quarter can fluctuate for many reasons, including:
| • | changes in demand for our mobile communications products and services and guidance and stabilization products and services; |
| • | the timing and size of individual orders from military customers; |
| • | the mix of products we sell; |
| • | our ability to manufacture, test and deliver products in a timely and cost-effective manner, including the availability and timely delivery of components and subassemblies from our suppliers; |
| • | our success in winning competitions for orders; |
| • | the timing of new product introductions by us or our competitors; |
| • | expense incurred in pursuing acquisitions; |
| • | market and competitive pricing pressures; |
| • | general economic climate; and |
| • | seasonality of pleasure boat and recreational vehicle usage. |
A large portion of our expenses, including expenses for network infrastructure, facilities, equipment, and personnel, are relatively fixed. Accordingly, if our net sales decline or do not grow as much as we anticipate, we might be unable to maintain or improve our operating margins. Any failure to achieve anticipated net sales could therefore significantly harm our operating results for a particular fiscal period.
We may have exposure to additional tax liabilities, which could negatively impact our income tax expense, net income and cash flow.
We are subject to income taxes and other taxes in both the U.S. and the foreign jurisdictions in which we currently operate. The determination of our worldwide provision for income taxes and current and deferred tax assets and liabilities requires judgment and estimation. In the ordinary course of our business, there are many
22
Table of Contents
transactions and calculations where the ultimate tax determination is uncertain. We are subject to regular review and audit by both domestic and foreign tax authorities and to the prospective and retrospective effects of changing tax regulations and legislation. Although we believe our tax estimates are reasonable, the ultimate tax outcome may materially differ from the tax amounts recorded in our consolidated financial statements and may materially affect our income tax (benefit) expense, net income (loss), and cash flows in the period in which such determination is made.
Deferred tax assets are recognized for the expected future tax consequences of temporary differences between the financial reporting and tax bases of assets and liabilities, and for operating losses and tax credit carryforwards. A valuation allowance reduces deferred tax assets to estimated realizable value, which assumes that it is more likely than not that we will be able to generate sufficient future taxable income to realize the net carrying value. We review our deferred tax assets and valuation allowance on a quarterly basis. As part of our review, we consider positive and negative evidence, including cumulative results in recent years.
If, during our quarterly reviews of our deferred tax assets, we determine that it is more likely than not that we will not be able to generate sufficient future taxable income to realize the net carrying value of our deferred tax assets, we will record a valuation allowance to reduce the tax assets to estimated realizable value. This could result in a material income tax charge.
The market price of our common stock may be volatile.
Our stock price has historically been volatile. During the period from November 1, 2008 to December 31, 2010, the trading price of our common stock ranged from $2.81 to $16.66. Many factors may cause the market price of our common stock to fluctuate, including:
| • | variations in our quarterly results of operations; |
| • | the introduction of new products and services by us or our competitors; |
| • | changing needs of military customers; |
| • | changes in estimates of our performance or recommendations by securities analysts; |
| • | the hiring or departure of key personnel; |
| • | acquisitions or strategic alliances involving us or our competitors; |
| • | market conditions in our industries; and |
| • | the global macroeconomic and geopolitical environment. |
In addition, the stock market can experience extreme price and volume fluctuations. Major stock market indices experienced dramatic declines in 2008 and in the first quarter of 2009. These fluctuations are often unrelated to the operating performance of particular companies. These broad market fluctuations may adversely affect the market price of our common stock. When the market price of a company’s stock drops significantly, stockholders often institute securities litigation against that company. Any such litigation could cause us to incur significant expenses defending against the claim, divert the time and attention of our management and result in significant damages.
Acquisitions may disrupt our operations or adversely affect our results.
We evaluate strategic acquisition opportunities to acquire other businesses as they arise, such as our recent acquisition of Virtek Communication. The expenses we incur evaluating and pursuing this and other such acquisitions could have a material adverse effect on our results of operations. For example, we incurred $0.6 million of transaction expenses in 2010 in connection with the Virtek Communication acquisition. If we acquire a business, we may be unable to manage it profitably or successfully integrate its operations with our own.
23
Table of Contents
Moreover, we may be unable to realize the financial, operational and other benefits we anticipate from any acquisition. Competition for acquisition opportunities could increase the price we pay for businesses we acquire and could reduce the number of potential acquisition targets. Further, our approach to acquisitions may involve a number of special financial and business risks, such as:
| • | charges related to any potential acquisition from which we may withdraw; |
| • | diversion of our management’s time, attention, and resources; |
| • | loss of key acquired personnel; |
| • | increased costs to improve or coordinate managerial, operational, financial, and administrative systems, including compliance with the Sarbanes-Oxley Act of 2002; |
| • | dilutive issuances of equity securities; |
| • | the assumption of legal liabilities; and |
| • | losses arising from impairment charges associated with goodwill or intangible assets. |
Our charter and by-laws and Delaware law may deter takeovers.
Our certificate of incorporation, by-laws and Delaware law contain provisions that could have an anti-takeover effect and discourage, delay or prevent a change in control or an acquisition that many stockholders may find attractive. These provisions may also discourage proxy contests and make it more difficult for our stockholders to take some corporate actions, including the election of directors. These provisions relate to:
| • | the ability of our Board of Directors to issue preferred stock, and determine its terms, without a stockholder vote; |
| • | the classification of our Board of Directors, which effectively prevents stockholders from electing a majority of the directors at any one annual meeting of stockholders; |
| • | the limitation that directors may be removed only for cause by the affirmative vote of the holders of two-thirds of our shares of capital stock entitled to vote; |
| • | the prohibition against stockholder actions by written consent; |
| • | the inability of stockholders to call a special meeting of stockholders; and |
| • | advance notice requirements for stockholder proposals and director nominations. |
| ITEM 1B. | Unresolved Staff Comments |
None.
24
Table of Contents
| ITEM 2. | Properties |
The following table provides information about our facilities as of December 31, 2010.
| Location |
Type |
Principal Uses |
Approximate Square Footage |
Ownership | Lease Expiration | |||||
| Middletown, Rhode Island |
Office, plant and warehouse | Corporate headquarters, research and development, sales and service, manufacturing (mobile communications products), marketing and administration | 75,000 | Owned | — | |||||
| Middletown, Rhode Island |
Warehouse | Warehousing (mobile communications products) | 39,000 | Leased | December 2011 | |||||
| Tinley Park, Illinois |
Plant and warehouse | Manufacturing, research and development (guidance and stabilization products) | 101,000 | Owned | — | |||||
| Kokkedal, Denmark |
Office and warehouse | European headquarters, sales, marketing and support | 11,000 | Leased | May 2014 | |||||
| Singapore |
Office | Sales office | 300 | Leased | April 2011 | |||||
| Horten, Norway |
Office | Research and development, sales, marketing and support | 4,400 | Leased | December 2013 | |||||
We anticipate that any substantial increase in demand for our products would require us to expand our production capacity. Although we can expand production by adding additional shifts to our operations, we may need to identify and acquire or lease additional manufacturing facilities. We believe that suitable additional or substitute facilities will be available as required.
| ITEM 3. | Legal Proceedings |
From time to time, we are involved in litigation incidental to the conduct of our business. In the ordinary course of business, we are a party to inquiries, legal proceedings and claims including, from time to time, disagreements with vendors and customers. We are not a party to any lawsuit or proceeding that, in management’s opinion, is likely to materially harm our business, results of operations, financial condition or cash flows.
25
Table of Contents
| ITEM 5. | Market for Registrant’s Common Equity, Related Stockholder Matters and Issuer Purchases of Equity Securities |
Market Information. Our common stock trades on the NASDAQ Global Market under the symbol “KVHI”. The following table provides, for the periods indicated, the high and low sale prices for our common stock as reported on the NASDAQ Global Market.
| High | Low | |||||||
| Year Ended December 31, 2010: |
||||||||
| First quarter |
$ | 15.28 | $ | 11.63 | ||||
| Second quarter |
16.66 | 10.76 | ||||||
| Third quarter |
15.13 | 11.28 | ||||||
| Fourth quarter |
16.24 | 11.44 | ||||||
| Year Ended December 31, 2009: |
||||||||
| First quarter |
$ | 6.07 | $ | 4.06 | ||||
| Second quarter |
7.55 | 4.75 | ||||||
| Third quarter |
10.25 | 6.33 | ||||||
| Fourth quarter |
15.75 | 9.64 | ||||||
Stockholders. As of March 4, 2011, we had 94 holders of record of our common stock. This number does not include stockholders for whom shares were held in a nominee or “street” name.
Dividends. We have never declared or paid cash dividends on our capital stock, and we have no plan to pay any cash dividends in the foreseeable future. We currently intend to retain any future earnings to finance our operations and future growth. In addition, the terms of our bank line of credit place restrictions on our ability to pay cash dividends on our common stock.
Issuer Purchases of Equity Securities. During the three months ended December 31, 2010, we repurchased our shares as described below:
| Period |
Total Number of Shares Purchased |
Average Price Paid per Share |
Total Number of Shares Purchased as Part of Publicly Announced Programs |
Maximum Number of Shares that May Yet be Purchased Under the Programs |
||||||||||||
| October 1, 2010—October 31, 2010 |
— | — | — | 798,676 | ||||||||||||
| November 1, 2010—November 30, 2010 |
— | — | — | 798,676 | ||||||||||||
| December 1, 2010—December 31, 2010 |
— | — | — | 798,676 | ||||||||||||
| Total |
— | — | — | 798,676 | ||||||||||||
On November 26, 2008, our Board of Directors authorized a program to repurchase up to one million shares of our common stock. The repurchase program is funded using our existing cash, cash equivalents, marketable securities and future cash flows. Under the repurchase program, at management’s discretion, we may repurchase shares on the open market from time to time, in privately negotiated transactions or block transactions, or through an accelerated repurchase agreement. The timing of such repurchases depends on availability of shares, price, market conditions, alternative uses of capital, and applicable regulatory requirements. The program may be modified, suspended or terminated at any time without prior notice. The repurchase program has no expiration
26
Table of Contents
date. There were no other repurchase programs outstanding during the three months ended December 31, 2010, and no repurchase programs expired during the period.
During the year ended December 31, 2010, 37,726 vested restricted shares were surrendered in satisfaction of tax withholding obligations at an average price of $12.73 per share.
During the year ended December 31, 2010, we did not repurchase any shares of our common stock in open market transactions.
STOCK PERFORMANCE GRAPH
The following graph compares the performance of our cumulative stockholder return with that of the NASDAQ Composite Index, a broad equity market index, and the NASDAQ Telecommunications Index, a published industry index. The cumulative stockholder returns for shares of our common stock and for the market indices are calculated assuming $100 was invested on December 31, 2005. We paid no cash dividends during the periods shown. The performance of the market indices is shown on a total return (dividends reinvested) basis. Measurement points are the last trading days of the years ended December 2005, 2006, 2007, 2008, 2009 and 2010.
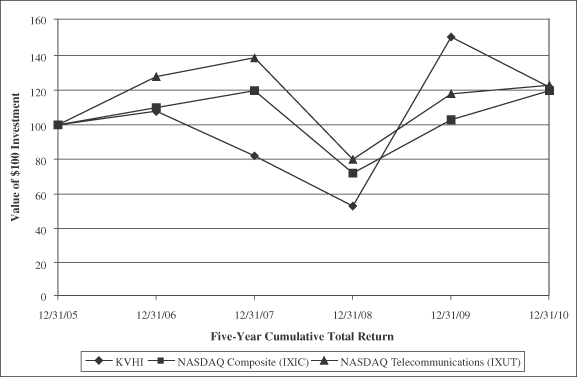
| Value of investments as of December 31, | ||||||||||||||||||||||||
| 2005 | 2006 | 2007 | 2008 | 2009 | 2010 | |||||||||||||||||||
| KVH Industries, Inc. |
$ | 100 | $ | 108 | $ | 82 | $ | 53 | $ | 151 | $ | 122 | ||||||||||||
| NASDAQ Composite |
100 | 110 | 120 | 72 | 103 | 120 | ||||||||||||||||||
| NASDAQ Telecommunications |
100 | 128 | 139 | 80 | 118 | 123 | ||||||||||||||||||
27
Table of Contents
| ITEM 6. | Selected Financial Data |
We have derived the following selected financial data from our audited consolidated financial statements. You should read this data in conjunction with “Item 7. Management’s Discussion and Analysis of Financial Condition and Results of Operations” and “Item 8. Financial Statements and Supplementary Data.”
In September 2010, we acquired Virtek Communication for approximately $6.5 million. See note 1 to our consolidated financial statements for a summary of significant accounting policies and the effects on the year-to-year comparability of the selected financial data.
| Year Ended December 31, | ||||||||||||||||||||
| 2010 | 2009 | 2008 | 2007 | 2006 | ||||||||||||||||
| (in thousands, except per share data) | ||||||||||||||||||||
| Consolidated Statement of Operations Data: |
||||||||||||||||||||
| Sales: |
||||||||||||||||||||
| Product |
$ | 92,059 | $ | 75,191 | $ | 69,941 | $ | 73,533 | $ | 70,748 | ||||||||||
| Service |
20,184 | 13,869 | 12,463 | 7,382 | 8,225 | |||||||||||||||
| Net sales |
112,243 | 89,060 | 82,404 | 80,915 | 78,973 | |||||||||||||||
| Costs and expenses: |
||||||||||||||||||||
| Costs of product sales |
51,348 | 46,552 | 42,552 | 44,892 | 42,494 | |||||||||||||||
| Costs of service sales |
16,086 | 10,198 | 6,130 | 3,557 | 4,674 | |||||||||||||||
| Research and development |
10,715 | 8,805 | 7,655 | 9,265 | 7,720 | |||||||||||||||
| Sales, marketing and support |
18,469 | 16,316 | 16,162 | 15,402 | 14,387 | |||||||||||||||
| General and administrative |
10,084 | 7,832 | 7,035 | 7,538 | 7,842 | |||||||||||||||
| Total costs and expenses |
106,702 | 89,703 | 79,534 | 80,654 | 77,117 | |||||||||||||||
| Income (loss) from operations |
5,541 | (643 | ) | 2,870 | 261 | 1,856 | ||||||||||||||
| Interest income |
301 | 358 | 1,220 | 2,715 | 2,387 | |||||||||||||||
| Interest expense |
204 | 89 | 153 | 156 | 193 | |||||||||||||||
| Other income (expense) |
23 | (20 | ) | (231 | ) | (77 | ) | (26 | ) | |||||||||||
| Income (loss) before income taxes |
5,661 | (394 | ) | 3,706 | 2,743 | 4,024 | ||||||||||||||
| Income tax (benefit) expense |
(2,612 | ) | (261 | ) | 648 | 244 | 350 | |||||||||||||
| Net income (loss) |
$ | 8,273 | $ | (133 | ) | $ | 3,058 | $ | 2,499 | $ | 3,674 | |||||||||
| Per share information: |
||||||||||||||||||||
| Net income (loss) per common share, basic |
$ | 0.57 | $ | (0.01 | ) | $ | 0.21 | $ | 0.17 | $ | 0.25 | |||||||||
| Net income (loss) per common share, diluted |
$ | 0.56 | $ | (0.01 | ) | $ | 0.21 | $ | 0.17 | $ | 0.25 | |||||||||
| Number of shares used in per share calculation: |
||||||||||||||||||||
| Basic |
14,420 | 13,996 | 14,373 | 14,964 | 14,787 | |||||||||||||||
| Diluted |
14,850 | 13,996 | 14,377 | 14,983 | 14,915 | |||||||||||||||
| December 31, | ||||||||||||||||||||
| 2010 | 2009 | 2008 | 2007 | 2006 | ||||||||||||||||
| (in thousands) | ||||||||||||||||||||
| Consolidated Balance Sheet Data: |
||||||||||||||||||||
| Cash, cash equivalents and marketable securities |
$ | 37,307 | $ | 41,304 | $ | 42,660 | $ | 53,305 | $ | 54,739 | ||||||||||
| Working capital |
60,571 | 60,690 | 58,222 | 67,696 | 67,122 | |||||||||||||||
| Total assets |
115,198 | 97,746 | 93,758 | 91,570 | 88,424 | |||||||||||||||
| Long-term debt, excluding current portion |
3,684 | 3,807 | — | 2,026 | 2,158 | |||||||||||||||
| Total stockholders’ equity |
96,303 | 81,600 | 79,069 | 80,770 | 77,795 | |||||||||||||||
28
Table of Contents
| ITEM 7. | Management’s Discussion and Analysis of Financial Condition and Results of Operations |
The following discussion and analysis should be read in conjunction with the other financial information and consolidated financial statements and related notes appearing elsewhere in this annual report. This discussion contains forward-looking statements that involve risks and uncertainties. Our actual results could differ materially from those anticipated in the forward-looking statements as a result of a variety of factors, including those discussed under the heading “Item 1A. Risk Factors” and elsewhere in this annual report.
Overview
We develop, manufacture and market mobile communications products for the marine, land mobile and aeronautical markets, and navigation, guidance and stabilization products for both the defense and commercial markets.
Our mobile communications products enable customers to receive voice and Internet services and live digital television via satellite services in marine vessels, recreational vehicles and automobiles as well as live digital television on commercial airplanes while in motion. We sell our mobile communications products through an extensive international network of retailers, distributors and dealers. We also lease products directly to end users.
We offer precision fiber optic gyro-based (FOG) systems that enable platform and optical stabilization, navigation, pointing and guidance. Our guidance and stabilization products also include tactical navigation systems that provide uninterrupted access to navigation and pointing information in a variety of military vehicles, including tactical trucks and light armored vehicles. Our guidance and stabilization products are sold directly to U.S. and allied governments and government contractors, as well as through an international network of authorized independent sales representatives. In addition, our guidance and stabilization products have numerous commercial applications such as precision mapping, dynamic surveying, autonomous vehicles, train location control and track geometry measurement systems, industrial robotics and optical stabilization.
Our mobile communications service sales include sales earned from satellite voice and Internet airtime services, engineering services provided under development contracts, sales from product repairs, certain DIRECTV and DISH Network account subsidies and referral fees earned in conjunction with the sale of our products and extended warranty sales. We provide, for monthly fixed and usage fees, satellite connectivity sales from broadband Internet, data and Voice over Internet Protocol (VoIP) service to our TracPhone V7 customers. We also earn monthly usage fees for third-party satellite connectivity for voice, data and Internet services to our Inmarsat TracPhone customers who choose to activate their subscriptions with us. Under current DIRECTV and DISH Network programs, we are eligible to receive a one-time subsidy for each DIRECTV receiver activated for service and a new mobile account activation fee from DIRECTV and DISH Network for each customer who activates their DIRECTV or DISH Network service directly through us.
Our guidance and stabilization service sales include engineering services provided under development contracts, product repairs and extended warranty sales.
We generate sales primarily from the sale of our mobile satellite systems and services and our guidance and stabilization products and services. The following table provides, for the periods indicated, our sales by industry category:
| Year Ended December 31, | ||||||||||||
| 2010 | 2009 | 2008 | ||||||||||
| (in thousands) | ||||||||||||
| Mobile communications |
$ | 62,473 | $ | 49,587 | $ | 59,690 | ||||||
| Guidance and stabilization |
49,770 | 39,473 | 22,714 | |||||||||
| Net sales |
$ | 112,243 | $ | 89,060 | $ | 82,404 | ||||||
29
Table of Contents
Net sales to Kongsberg accounted for approximately 14%, 15% and 5% of our net sales for the years ended December 31 2010, 2009 and 2008, respectively. In addition, net sales to a subcontractor to Kongsberg accounted for approximately 5%, 7% and 0% of our net sales for the years ended December 31, 2010, 2009 and 2008, respectively. The terms and conditions of sales to Kongsberg and the subcontractor to Kongsberg are consistent with our standard terms and conditions of product sales as discussed in note 1 of our consolidated financial statements. As of December 31, 2010, Kongsberg had no outstanding accounts receivable balances with us and the subcontractor to Kongsberg was current with all outstanding receivable balances. We anticipate a sequential decline in net sales to Kongsberg during the first half of 2011. No other individual customer accounted for more than 10% of our net sales for the years ended December 31, 2010, 2009 and 2008, respectively.
We have historically derived a substantial portion of our revenue from sales to customers located outside the United States and Canada. The following table provides, for the periods indicated, sales to specified geographic regions:
| Year Ended December 31, | ||||||||||||
| 2010 | 2009 | 2008 | ||||||||||
| (in thousands) | ||||||||||||
| Originating from the Americas locations |
||||||||||||
| United States |
$ | 70,620 | $ | 49,941 | $ | 49,761 | ||||||
| Canada |
5,923 | 3,465 | 3,107 | |||||||||
| Europe |
17,892 | 19,644 | 8,656 | |||||||||
| Other |
3,950 | 4,623 | 3,201 | |||||||||
| Total North America |
98,385 | 77,673 | 64,725 | |||||||||
| Originating from European and Asian locations |
||||||||||||
| Europe |
10,398 | 8,637 | 12,787 | |||||||||
| Other |
3,460 | 2,750 | 4,892 | |||||||||
| Total Europe |
13,858 | 11,387 | 17,679 | |||||||||
| Net sales |
$ | 112,243 | $ | 89,060 | $ | 82,404 | ||||||
See note 12 to our consolidated financial statements for more information on our geographic segments.
In addition to our internally funded research and development efforts, we also conduct research and development activities that are funded by our customers. These activities relate primarily to engineering activities including the research and development associated with our aviation antenna, engineering studies, surveys, prototype development, program management and standard product customization. In accordance with accounting principles generally accepted in the United States of America, we account for customer-funded research as service revenue, and we account for the associated research and development costs as costs of service and product sales. As a result, customer-funded research and development are not included in the research and development expense that we present in our statement of operations. The following table presents our total annual research and development effort, representing the sum of research costs of service and product sales and the operating expense of research and development as described in our statement of operations. Our management believes this information is useful because it provides a better understanding of our total expenditures on research and development activities.
30
Table of Contents
| Year ended December 31, | ||||||||||||
| 2010 | 2009 | 2008 | ||||||||||
| (in thousands) | ||||||||||||
| Research and development expense presented on statement of operations |
$ | 10,715 | $ | 8,805 | $ | 7,655 | ||||||
| Costs of customer-funded research and development included in costs of service sales |
953 | 475 | 1,011 | |||||||||
| Costs of customer-funded research and development included in costs of product sales |
1,001 | 801 | — | |||||||||
| Total consolidated statements of operations expenditures on research and development activities |
$ | 12,669 | $ | 10,081 | $ | 8,666 | ||||||
In addition to the research and development expenses listed above, we have a total of approximately $2.9 million, $3.9 million and $3.2 million in research and development costs related to a long-term aviation antenna development and production agreement capitalized as of December 31, 2010, 2009 and 2008, respectively. These research and development costs are reflected in other non-current assets, as we have a contractual right to recover these costs. See note 14 to our consolidated financial statements for further discussion.
As of December 31, 2010, we had approximately $37.3 million in cash, cash equivalents and marketable securities and accumulated earnings of approximately $2.9 million.
Critical Accounting Policies and Significant Estimates
The discussion and analysis of our financial condition and results of operations are based upon our consolidated financial statements, which have been prepared in accordance with accounting principles generally accepted in the United States. The preparation of these financial statements requires us to make estimates and judgments that affect the reported amounts of assets and liabilities, revenues and expenses, and related disclosure at the date of our financial statements. Our significant accounting policies are summarized in note 1 to our consolidated financial statements. The significant accounting policies that we believe are the most critical in understanding and evaluating our reported financial results include the following:
Revenue Recognition
Product sales. Product sales are recognized when persuasive evidence of an arrangement exists, goods are shipped, title has passed and collectability is reasonably assured. Our standard sales terms require that:
| • | All sales are final; |
| • | Terms are generally either Net 30 or Net 45; |
| • | Shipments are tendered and shipped FOB (or as may be applicable, FCA, or EXW) our plant or warehouse; and |
| • | Title and risk of loss or damage passes to the dealer or distributor at the point of shipment when delivery is made to the possession of the carrier. |
For certain guidance and stabilization product sales, customer acceptance or inspection may be required before title and risk of loss transfers to the customer. For those sales, revenue is recognized after transfer of title and risk of loss and after notification of customer acceptance.
Under certain limited conditions, we, at our sole discretion, provide for the return of goods. No product is accepted for return and no credit is allowed on any returned product unless we have granted and confirmed prior written permission by means of appropriate authorization. We establish reserves for potential sales returns, credit and allowances, and evaluate, on a monthly basis, the adequacy of those reserves based upon historical experience and our expectations for the future.
31
Table of Contents
Satellite connectivity sales. Directly sold and re-sold satellite connectivity service for voice, data and Internet is recognized monthly based upon minutes or megabytes of traffic processed or contracted fixed fee schedules. Typically, all subscribers enter into a contracted one-year minimum service agreement. We record all satellite connectivity service sales to subscribers as gross sales, as we are the primary obligor in the contracted service arrangement. All associated regulatory service fees and costs are recorded net in our consolidated financial statements. The accounting estimates related to the recognition of satellite connectivity service sales in our results of operations require us to make assumptions about future billing adjustments for disputes with subscribers as well as unauthorized usage.
See note 11 to our consolidated financial statements for disclosures associated with our significant customers.
Accounts Receivable Allowance
Our estimate of allowance for doubtful accounts related to trade receivables is primarily based on specific and historical criteria. We evaluate specific accounts where we have information that the customer may have an inability to meet its financial obligations. We make judgments, based on facts and circumstances, regarding the need to record a specific reserve for that customer against amounts owed to reduce the receivable to the amount that we expect to collect. We also provide for a reserve based on an aging analysis of our accounts receivable. We evaluate these reserves on a monthly basis and adjust them as we receive additional information that impacts the amount reserved. If circumstances change, we could change our estimates of the recoverability of amounts owed to us by a material amount.
In 2010, we wrote off approximately $0.5 million of our allowance for doubtful accounts. The write-off was driven largely by the financial deterioration of a couple of our mobile communications product distributors as well as a few of our airtime customers. The current economic downturn could continue to adversely impact the financial condition of our customers, which could result in additional write-offs and increases in our allowance for doubtful accounts and have a negative impact on our results of operations.
Inventories
Inventory is valued at the lower of cost or market. We generally must order components for our products and build inventory in advance of product shipments. We regularly review current quantities on hand, actual and projected sales volumes and anticipated selling prices on products and write down, as appropriate, slow-moving and/or obsolete inventory to its net realizable value. For example, in 2009, we recorded an additional $1.3 million in inventory reserves due in part to weak consumer demand. In 2010, we wrote off approximately $0.6 million of fully reserved inventory. Generally, our inventory does not become obsolete because the materials we use are typically interchangeable among various product offerings. However, if we overestimate projected sales or anticipated selling prices, our inventory might be overstocked, and we would have to reduce our inventory valuation accordingly.
Accounting for Income Taxes
Our provision for income taxes is comprised of a current and a deferred portion. The current income tax provision is calculated as the estimated taxes payable or refundable on tax returns for the current year. We provide for deferred income taxes resulting from temporary differences between financial and taxable income. Such differences arise primarily from tax credit and net operating loss carry-forwards , depreciation, stock-based compensation expense, accruals and reserves.
At December 31, 2010, we had valuation allowances of $2.3 million to offset gross deferred tax assets of $10.2 million. This valuation allowance represents a reduction in our valuation allowance from December 31, 2009. At December 31, 2009, we had gross deferred tax assets of $11.1 million and a valuation allowance of $6.9 million. During 2010, based upon an evaluation of the positive and negative evidence, we concluded that $3.3 million of the deferred tax asset valuation allowance was no longer required. As part of our analysis, we
32
Table of Contents
considered all available positive and negative evidence including our past operating results, the existence of cumulative income in the most recent fiscal years, changes in the business in which we operate and our forecast of future taxable income. In determining future taxable income, we necessarily made certain assumptions about our expected future plans and operations, including assumptions about the amount of state, federal and international pre-tax operating income, the reversal of temporary differences and the implementation of feasible and prudent tax planning strategies. After considering these factors, we concluded that a $3.3 million reversal of the valuation allowance was appropriate. These assumptions required significant judgment about the forecasts of future taxable income and were consistent with the plans and estimates we were using to manage the underlying businesses.
We provide for income taxes during interim periods based on the estimated effective tax rate for the full fiscal year. We record a cumulative adjustment to the tax provision in an interim period in which a change in the estimated annual effective tax rate is determined.
We assess all material positions taken in any income tax return, including all significant uncertain positions, in all tax years that are still subject to assessment or challenge by relevant taxing authorities. Assessing an uncertain tax position begins with the initial determination of the position’s sustainability and is measured at the largest amount of benefit that is greater than 50% likely of being realized upon ultimate settlement. As of each balance sheet date, unresolved uncertain tax positions must be reassessed, and we will determine whether (i) the factors underlying the sustainability assertion have changed and (ii) the amount of recognized tax benefit is still appropriate. The recognition and measurement of tax benefits require significant judgment. Judgments concerning the recognition and measurement of a tax benefit might change as new information becomes available.
Warranty Provision
We typically offer a one to two year warranty for all of our base products. We provide for the estimated cost of product warranties at the time product revenue is recognized. Factors that affect our warranty reserves include the number of units sold, historical and anticipated rates of warranty repairs and the cost per repair. While we engage in extensive product quality programs and processes, including actively monitoring and evaluating the quality of our component suppliers, our estimated warranty obligation is affected by ongoing product failure rates, specific product class failures outside our baseline experience, material usage and service delivery costs incurred in correcting a product failure. If actual product failure rates, material usage or service delivery costs differ from our estimates, revisions to the estimated warranty liability would be required. Assumptions and historical warranty experience are evaluated to determine the appropriateness of such assumptions. We assess the adequacy of the warranty provision on a quarterly basis and we adjust this provision when necessary.
Stock-Based Compensation
Our stock-based compensation cost is measured at the grant date based on the fair value of the award and is recognized as expense over the requisite service period, which is generally the vesting period.
We use the Black-Scholes valuation model for estimating the fair value on the date of grant of compensatory stock options. Determining the fair value of stock option awards at the grant date requires judgment regarding certain valuation assumptions, including the volatility of our stock price, expected term of the option, risk-free interest rate and expected dividends. Changes in these assumptions and estimates could result in different fair values and could therefore impact our earnings. These changes would not impact our cash flows. The fair value of restricted stock and performance-based stock awards is based upon our stock price on the grant date.
The amount of stock-based compensation expense recorded in any period for unvested awards requires estimates of the amount of stock-based awards that are expected to be forfeited prior to vesting, as well as assumptions regarding the probability that performance-based awards will be earned.
33
Table of Contents
Compensation cost for awards subject only to service conditions that vest ratably are recognized on a straight-line basis over the requisite service period for the entire award.
Goodwill and Intangible Assets
Goodwill and intangible assets with indefinite lives are tested at least annually for impairment. Intangible assets with estimated lives and other long-lived assets are reviewed for impairment when events or changes in circumstances indicate that the carrying amount of an asset may not be recoverable. Recoverability of intangible assets with estimated lives and other long-lived assets is measured by comparing the carrying amount of the asset to future net undiscounted cash flows expected to be generated by the asset. If these comparisons indicate that an asset is not recoverable, we will recognize an impairment loss for the amount by which the carrying value of the asset exceeds the related estimated fair value. Estimated fair value is based on either discounted future operating cash flows or appraised values, depending on the nature of the asset. Considerable judgment is required to estimate discounted future operating cash flows. Judgment is also required in determining whether an event has occurred that may impair the value of goodwill or identifiable intangible or other long-lived assets. Factors that could indicate an impairment may exist include significant underperformance relative to plan or long-term projections, changes in business strategy, significant negative industry or economic trends, a significant change in circumstances relative to a large customer, a significant decline in our stock price for a sustained period and a decline in our market capitalization to below net book value. We must make assumptions about future cash flows, future operating plans, discount rates and other factors in our models and valuation reports. To the extent these future projections and estimates change, the estimated amounts of impairment could differ from current estimates. Our annual testing for impairment of goodwill is expected to be completed as of August 31 of each year. As of December 31, 2010 all goodwill and intangible assets are associated with the purchase of Virtek Communication in September 2010.
Contingencies
We are subject to ongoing business risks arising in the ordinary course of business. An estimated loss contingency is accrued when it is probable that a liability has been incurred or an asset has been impaired and the amount of loss can be reasonably estimated. We regularly evaluate current information available to determine whether such amounts should be adjusted and record changes in estimates in the period they become known. We reserve for legal contingencies and legal fees when the amounts are probable and reasonably estimable. At December 31, 2010, we have not recorded any material loss contingencies.
34
Table of Contents
Results of Operations
The following table provides, for the periods indicated, certain financial data expressed as a percentage of net sales:
| Year Ended December 31, | ||||||||||||
| 2010 | 2009 | 2008 | ||||||||||
| Sales: |
||||||||||||
| Product |
82.0 | % | 84.4 | % | 84.9 | % | ||||||
| Service |
18.0 | 15.6 | 15.1 | |||||||||
| Net sales |
100.0 | 100.0 | 100.0 | |||||||||
| Costs and expenses: |
||||||||||||
| Costs of product sales |
45.8 | 52.3 | 51.6 | |||||||||
| Costs of service sales |
14.3 | 11.5 | 7.5 | |||||||||
| Research and development |
9.5 | 9.8 | 9.3 | |||||||||
| Sales, marketing and support |
16.5 | 18.3 | 19.6 | |||||||||
| General and administrative |
9.0 | 8.8 | 8.5 | |||||||||
| Total costs and expenses |
95.1 | 100.7 | 96.5 | |||||||||
| Income (loss) from operations |
4.9 | (0.7 | ) | 3.5 | ||||||||
| Interest income |
0.3 | 0.4 | 1.5 | |||||||||
| Interest expense |
0.2 | 0.1 | 0.2 | |||||||||
| Other expense |
0.0 | 0.0 | 0.3 | |||||||||
| Income (loss) before income taxes |
5.0 | (0.4 | ) | 4.5 | ||||||||
| Income tax (benefit) expense |
(2.4 | ) | (0.3 | ) | 0.8 | |||||||
| Net income (loss) |
7.4 | % | (0.1 | )% | 3.7 | % | ||||||
Years ended December 31, 2010 and 2009
Net Sales
Product sales increased in 2010 by $16.9 million, or 22%, to $92.1 million from $75.2 million in 2009. The primary reason for the increase was a $10.4 million, or 28%, increase in sales of our guidance and stabilization products. Specifically, sales of our FOG products increased $11.4 million, or 39%, driven largely by increased sales for commercial applications, such as surveying and optical stabilization, and a range of government and defense applications, including weapons stabilization. Partially offsetting this increase was a decrease of $1.2 million, or 16%, in sales of our TACNAV defense products. Although we expect that FOG sales will continue to grow over the long term, sales on a quarter to quarter basis could be very uneven. Largely as a result of uncertainty regarding future remotely operated weapons stations programs, we expect our FOG sales to decline in 2011 from 2010.
Mobile communications product sales in 2010 increased $6.4 million, or 17%, to $43.9 million from $37.5 million in 2009. The primary reason for the increase was a $4.0 million, or 14% increase in sales of our marine products, driven primarily by demand for our TracPhone V7 product, and to a lesser extent sales of our TracVision HD7 satellite television product that we launched in the fourth quarter of 2009. Also contributing to the increase in marine product sales was $0.9 million in sales from Virtek Communication, which was acquired in September 2010. In addition, sales of our land mobile products increased $1.6 million, or 32%, driven primarily by increased sales to original equipment manufacturers in the recreational vehicle market. Further contributing to the increase in mobile communications product sales was a $0.9 million increase in sales of our satellite television antenna used on narrowbody commercial aircraft. We began shipping this antenna to LiveTV in the second quarter of 2009. Future sales to LiveTV are expected to be uneven on a quarter to quarter basis and future fiscal year delivery schedules are undetermined at this time. For example, we do not expect any shipments to LiveTV during the first half of 2011. Mobile communications product sales originating from our European and Asian subsidiaries increased $2.5 million, or 22%, from 2009 to 2010. Mobile communications product sales originating from the Americas increased $3.9 million, or 15%, from 2009 to 2010.
35
Table of Contents
Service sales increased in 2010 by $6.3 million, or 46%, to $20.2 million from $13.9 million in 2009. The primary reason for the increase was a $6.6 million increase in airtime sales for our mini-VSAT Broadband service. Also contributing to the increase was an increase in contracted engineering revenue of $0.6 million primarily related to FOG and TACNAV products. Offsetting this increase was a decline of $0.9 million in service repair sales, primarily related to a decline in guidance and stabilization TACNAV product refurbishment and repair programs.
Costs of Sales
Our costs of product sales consist primarily of direct labor, materials and manufacturing overhead used to produce our products. Costs of product sales in 2010 increased by $4.8 million, or 10%, to $51.3 million from $46.6 million in 2009. The primary reason for the increase was the increase in unit sales of FOG products. Also contributing to the increase was an increase in unit sales of marine and land mobile communications products, and to a lesser extent, an increase in unit sales of our satellite television antenna used on narrowbody commercial aircraft. Partially offsetting this increase was a $1.1 million decrease in our inventory reserve costs as a result of a 2009 charge in the amount of $1.3 million primarily related to certain military components and product obsolescence due to the introduction of new mobile communications products during 2009.
Our costs of service sales consist primarily of satellite service capacity, direct network service labor, service network overhead and depreciation expense associated with our mini-VSAT Broadband network infrastructure, Inmarsat service costs, service material and direct labor associated with non-warranty product repairs, as well as engineering and related direct costs associated with customer-funded research and development. Costs of service sales increased by $5.9 million, or 58%, to $16.1 million in 2010 from $10.2 million in 2009. The primary reason for the increase was a $5.4 million increase in airtime costs of sales for our mini-VSAT Broadband service. Also contributing to the increase was a $0.5 million increase in costs related to contracted engineering service sales.
Gross margin from product sales increased in 2010 to 44% from 38% in 2009. The primary reason for the increase in gross margin was a 28% increase in our relatively higher margin guidance and stabilization product sales and a 17% increase in our mobile communications product sales, resulting in improved utilization of production capacity for fiber optic gyros and mobile communications products. Also contributing to the gross margin improvement was a $1.1 million decrease in our inventory reserve costs.
Gross margin from service sales decreased in 2010 to 20% from 26% in 2009. The deterioration in our gross margin from service sales was primarily attributable to increased costs related to the build out and operations of the network and support infrastructure for our mini-VSAT Broadband service. Although we are near completion of the deployment of our mini-VSAT Broadband service, we expect to continue to see cost increases as some new coverage regions come online.
Operating Expenses
Sales, marketing and support expense consists primarily of salaries and related expenses for sales and marketing personnel, commissions for both in-house and third-party representatives, other sales and marketing support costs such as advertising, literature and promotional materials, product service personnel and support costs, warranty-related costs and bad debt expense. Sales, marketing and support expense also includes the operating expenses of our wholly owned subsidiaries in Denmark and Singapore. Sales, marketing and support expense in 2010 increased by $2.2 million, or 13%, to $18.5 million from $16.3 million in 2009. The primary reason for the increase in 2010 was a $1.0 million increase in U.S. based employee compensation for sales, marketing and support, primarily in connection with the global expansion of our mini-VSAT Broadband satellite communication service as well as an increase in stock compensation expense and accrued performance based incentive compensation. Also contributing to the increase was a $0.5 million increase in facility expenditures allocated to the sales and marketing department, a $0.4 million increase in commission expense primarily as a
36
Table of Contents
result of the increase in mini-VSAT Broadband service sales discussed above and a $0.8 million increase in sales, marketing and support expense of our foreign subsidiaries, of which $0.4 million relates to our Singaporean and Norwegian subsidiaries, that were incorporated or acquired during 2010. Partially offsetting the increase was a $0.5 million decrease in bad debt expense, as well as a decrease in warranty expense of $0.2 million. As a percentage of sales, sales, marketing and support expense decreased in 2010 to 17% from 18% in 2009.
Research and development expense consists of direct labor, materials, external consultants and related overhead costs that support our internally funded product development and product sustaining engineering activities. All research and development costs are expensed as incurred, excluding the aviation antenna development costs related to the development project for LiveTV, which are capitalized, as we have a contractual right to recover such costs (see note 14 to the consolidated financial statements). Research and development expense in 2010 increased by $1.9 million, or 22%, to $10.7 million from $8.8 million in 2009. The primary reason for the increase in 2010 expense was the core completion of the development project for the satellite television antenna to be used on narrowbody commercial aircraft. The project was substantially complete in the second quarter of 2009 and resulted in a $1.4 million decrease in the capitalization of aviation antenna development costs during 2010 versus 2009 and a corresponding increase in research and development expense. Also contributing to the increase was an increase in engineering related employee compensation, material costs and consulting, primarily in connection with the general increase in development of products for all markets, as well as a $0.2 million increase in research and development expense associated with the acquisition of Virtek Communication in September 2010. As a percentage of sales, research and development expense was 10% in 2010, which was consistent with 2009.
General and administrative expense consists of costs attributable to management, finance and accounting, information technology, human resources, certain outside professional services and other administrative costs. General and administrative expense in 2010 increased by $2.3 million, or 29%, to $10.1 million from $7.8 million in 2009. The primary reason for the expense increase in 2010 was a $1.2 million increase in general and administrative U.S. based employee compensation, primarily as a result of an increase in general and administrative staffing as well as an increase in stock compensation expense and accrued performance based incentive compensation. Also contributing to the increase was $0.6 million in transaction costs associated with the September 2010 acquisition of Virtek Communication, as well as $0.3 million in general and administrative expense incurred by Virtek Communication. In addition, legal and insurance expense increased by $0.2 million in connection with the global expansion of our mini-VSAT Broadband satellite communication service, and property taxes increased by $0.1 million primarily due to the purchase of our facility in Tinley Park, Illinois in September 2010. As a percentage of sales, general and administrative expense was 9% in 2010, which was consistent with 2009.
Interest Income and Other Expense
Interest income and other expense decreased by $0.1 million to $0.1 million in 2010 from $0.2 million in 2009. The primary reason for the decrease was a $0.1 million increase in interest expense associated with two interest rate swap agreements entered into in April 2010.
Income Tax Benefit
The income tax benefit increased by $2.4 million to $2.6 million in 2010 from $0.3 million in 2009. The primary reason for the increase in 2010 was a tax benefit in the amount of $3.3 million recognized as a result of the reversal of a substantial portion of the U.S. deferred tax asset valuation allowance during 2010. During 2010, based upon an evaluation of the positive and negative evidence, we concluded that $3.3 million of the deferred tax asset valuation allowance was no longer required. As part of our analysis, we considered all available positive and negative evidence, including our past operating results, the existence of cumulative income in the most recent fiscal years, changes in the business in which we operate and our forecast of future taxable income. After considering these factors, we concluded that it is more likely than not that we will be able to realize a $3.3 million reversal of the valuation allowance. Partially offsetting the income tax benefit was income tax expense associated with our $5.7 million pre-tax income in 2010 versus a $0.4 million pre-tax loss in 2009.
37
Table of Contents
Years ended December 31, 2009 and 2008
Net Sales
Product sales increased in 2009 by $5.3 million, or 8%, to $75.2 million from $69.9 million in 2008. The primary reason for the increase was a $19.1 million, or 103%, increase in sales of our guidance and stabilization products. Specifically, sales of our FOG products increased $19.9 million, or 215%, driven largely by increased sales in support of remotely operated weapons station programs. Partially offsetting the guidance and stabilization product sales increase was a $0.8 million decrease in sales related to our legacy navigation and TACNAV products. Further offsetting the increase in total product sales was a decrease in sales of our marine products of $12.1 million, or 29%. This decrease was primarily the result of decreases in the sales of our marine consumer products, including the TracVision M-series satellite television products and Inmarsat-compatible TracPhone products. This was partially offset by a modest increase in our TracPhone V7 product sales from increased sales to commercial customers, with decreased sales to leisure customers due primarily to weak consumer economic conditions. In addition, sales of our land mobile products decreased by $5.4 million, or 52%. The decline in mobile communications product sales was greater in North America, where sales decreased $11.4 million, or 34%, whereas mobile communications product sales originating from our Danish subsidiary decreased only $2.5 million, or 14%.
The weakening of consumer demand, especially in the recreational vehicle market commencing in the second quarter of 2008, due in part to increased fuel prices, and the crisis of consumer confidence in the general economy during the second half of 2008 and throughout 2009 caused declines in demand for our land mobile products and our marine consumer products.
Service sales increased in 2009 by $1.4 million, or 11%, to $13.9 million from $12.5 million in 2008. The primary reason for the increase was a $4.7 million increase in airtime sales for our mini-VSAT Broadband service that we launched in the fourth quarter of 2007, which was partially offset by a decline in service repair sales, contracted engineering service sales, and Inmarsat airtime sales of $3.1 million. The decrease in service repair sales was driven by a reduction in guidance and stabilization repair service of navigation products for military vehicles. The decrease in contracted engineering service sales is attributed to our decision to concentrate our engineering efforts on initiatives associated with our global roll-out of the mini-VSAT network and our FOG products and de-emphasize non-strategic engineering services requested by customers. The decrease in Inmarsat service sales is primarily related to our success in transitioning Inmarsat customers to our mini-VSAT Broadband service in 2009 and to the overall decline in consumer demand.
Costs of Sales
Costs of product sales in 2009 increased by $4.0 million, or 9%, to $46.6 million from $42.6 million in 2008. On a percentage basis, the 9% increase in our cost of product sales was largely consistent with the 8% increase in net product sales in 2009 from 2008. The primary reason for the increase was the increase in unit sales of higher priced FOG products, which was partially offset by a decline in unit sales of mobile communications products and a shift in the sales mix of mobile communications products towards lower priced marine products.
Costs of service sales increased by $4.1 million, or 66%, to $10.2 million in 2009 from $6.1 million in 2008. The primary reason for the increase was a $5.1 million increase in airtime costs of sales for our mini-VSAT Broadband service that we launched in the fourth quarter of 2007, which was partially offset by a $0.9 million decline in costs related to service repair sales and contracted engineering service sales. The decrease in costs related to service repair sales was driven by a reduction in guidance and stabilization repair service of navigation products for military vehicles. The decrease in contracted engineering service costs is attributed to our decision to concentrate our engineering efforts on initiatives associated with our global roll-out of the mini-VSAT network and our FOG products.
38
Table of Contents
Gross margin from product sales decreased in 2009 to 38% from 39% in 2008. The deterioration in our gross margin from product sales was attributable to under-utilization of our production capacity earlier in 2009 due to reduced unit sales of mobile communications products, a higher level of price discounts to maintain our competitive position in the mobile communications marketplace and a $1.2 million increase in our inventory reserves primarily related to certain military components and the introduction of new mobile communications products. Partially offsetting the decrease was a $19.9 million, or 215%, increase in FOG product sales, which typically have a relatively higher gross margin than sales of our mobile communications products.
Gross margin from service sales decreased in 2009 to 26% from 51% in 2008. The deterioration in our gross margin from service sales was primarily attributable to increased costs related to the build out and operations of the network and support infrastructure for our mini-VSAT Broadband service.
Operating Expenses
Sales, marketing and support expense in 2009 increased by $0.2 million, or 1%, to $16.3 million from $16.2 million in 2008. As a percentage of sales, sales, marketing and support expense decreased in 2009 to 18% from 20% in 2008. The primary reason for the expense increase in 2009 was a $0.6 million increase in commission expense as a result of the increase in mini-VSAT Broadband service sales discussed above. Also contributing to the increase was a $0.6 million increase in bad debt expense. Partially offsetting the increase was a $0.8 million decrease in warranty and service-related expenses and a $0.3 million decrease in sales, marketing and support expense related to our Danish subsidiary. Contributing to the decrease in sales, marketing and support expense of our Danish subsidiary was a 5% decrease in the average valuation of the Danish Krone versus the U.S. dollar year-over-year.
Research and development expense in 2009 increased by $1.2 million, or 15%, to $8.8 million from $7.7 million in 2008. As a percentage of sales, research and development expense increased in 2009 to 10% from 9% in 2008. The primary reason for the increase in 2009 expense was the core completion of the development project for the DIRECTV-compatible satellite television antenna sold to LiveTV to be used on narrowbody commercial aircraft. The project was substantially complete in the second quarter of 2009 and resulted in a $1.4 million decrease in the capitalization of aviation antenna development costs associated with engineering labor and overhead (see note 14 to the consolidated financial statements) year-over-year and a corresponding increase in research and development expense.
General and administrative expense in 2009 increased by $0.8 million, or 11%, to $7.8 million from $7.0 million in 2008. The primary reason for the expense increase in 2009 was a $0.3 million increase in legal and consulting fees associated with licensing arrangements in connection with the global expansion of our mini-VSAT Broadband satellite communication service and information technology initiatives. Also contributing to the increase was an increase in general and administrative related employee compensation of $0.3 million for performance based incentive compensation. As a percentage of sales, general and administrative expense remained fairly consistent on a year-over-year basis at 9%.
Interest Income and Other Expense
Interest income and other expense decreased by $0.6 million to $0.2 million in 2009 from $0.8 million in 2008. The primary reason for the decrease was a $0.9 million decrease in interest income in the 2009 period resulting from lower interest rates and a lower average amount of cash, cash equivalents and marketable securities invested in 2009. Partially offsetting the decrease was a $0.2 million decrease in losses related to foreign currency exchange contracts.
Income Tax (Benefit) Expense
Income tax expense decreased by $0.9 million to a benefit of $0.3 million in 2009 from a provision of $0.6 million in 2008. Our effective tax rate was (66.2%) in 2009 compared to 17.5% in 2008. The primary reason for
39
Table of Contents
the decrease in 2009 was our $0.4 million pre-tax loss versus a net profit in 2008. Also contributing to the decrease was a decrease of $0.2 million in federal income tax expense resulting from an adjustment recorded to reconcile our previously recorded estimates of federal income tax expense to our 2008 federal income tax return that was completed and filed in June 2009 and a $0.2 million federal income tax benefit recorded in 2009 from the monetization of research and development tax credits.
Liquidity and Capital Resources
We have historically funded our operations primarily from cash flows from operations, net proceeds from public and private equity offerings, bank financings and proceeds received from exercises of stock options. As of December 31, 2010, we had $37.3 million in cash, cash equivalents and marketable securities and $60.6 million in working capital.
Net cash provided by operations for 2010 was $9.6 million as compared to net cash provided by operations of $0.9 million for 2009. The increase is primarily due to an $8.4 million increase in net income as well as a $3.6 million reduction in cash outflows related to accounts payable and accrued expenses and a $2.9 million reduction in cash outflows for other non-current assets. Partially offsetting this increase was an increase in cash outflows of $3.3 million due to increased inventory levels, a $0.5 decrease in cash inflows related to other long-term liabilities and a $0.6 million increase in cash outflows related to deferred revenue.
Net cash used in investing activities for 2010 was $12.1 million as compared to net cash used in investing activities of $3.0 million for 2009. The increase is primarily due to the $6.4 million in net cash paid for the acquisition of Virtek Communication. Also contributing to the increase in cash outflows was a $5.8 million increase in our capital expenditures, primarily due to the purchase of the land and building in our Tinley Park, Illinois location for approximately $4.3 million as well as the global expansion of our mini-VSAT Broadband satellite communication products and service. This increase in cash outflows was partially offset by a $3.2 million decrease in our net investment in marketable securities.
Net cash provided by financing activities for 2010 was $3.8 million as compared to net cash provided by financing activities of $2.9 million for 2009. The increase is primarily due to a $2.8 million increase in proceeds from exercises of stock options and purchases of shares under our employee stock purchase plan. Also contributing to the increase in net cash provided by financing activities was a $0.6 million decrease in repurchases of common stock. Partially offsetting the increase in cash provided by financing activities was a decrease of $2.0 million in net cash provided by our mortgage refinancing activities in the first two quarters of 2009, when we made a $2.0 million balloon repayment on our former mortgage loan and took out a new $4.0 million mortgage loan on our headquarters facility. Further offsetting the increase in cash provided by financing activities was a $0.4 million increase in payments of employee restricted stock tax withholdings.
On April 6, 2009, we entered into a mortgage loan in the amount of $4.0 million related to our headquarters facility in Middletown, Rhode Island. The loan term is 10 years, with a principal amortization of 20 years, and the interest rate will be a rate per year adjusted periodically based on a defined interest period equal to the BBA LIBOR Rate plus 2.25 percentage points. Land, building and improvements with a carrying value of $5.0 million as of December 31, 2010 secure the mortgage loan. The monthly mortgage payment is approximately $9,400 plus interest and increases in increments of approximately $600 each year throughout the life of the mortgage. Due to the difference in the term of the loan and amortization of the principal, a balloon payment of $2.6 million is due on April 1, 2019. The loan contains one financial covenant, a Fixed Charge Coverage Ratio, which applies in the event that our consolidated cash, cash equivalents and marketable securities balance falls below $25.0 million at any time. As our consolidated cash, cash equivalents and marketable securities balance was above $25.0 million throughout 2010, the Fixed Charge Coverage Ratio did not apply. Under the mortgage loan we may prepay our
40
Table of Contents
outstanding loan balance subject to certain early termination charges as defined in the mortgage loan agreement. If we were to default on our mortgage loan, the land, building and improvements would be used as collateral. As discussed in note 17 to the consolidated financial statements, effective April 1, 2010, in order to reduce the volatility of cash outflows that arise from changes in interest rates, we entered into two interest rate swap agreements that are intended to hedge our mortgage interest obligations by fixing the interest rates specified in the mortgage loan to 5.91% for half of the principal amount outstanding and 6.07% for the remaining half of the principal amount outstanding as of April 1, 2010 until the mortgage loan expires on April 16, 2019.
On September 13, 2010, our Danish subsidiary, KVH Europe A/S, completed the purchase of Virtek Communication for approximately $6.5 million. The purchase was made using existing cash, cash equivalents and marketable securities.
On September 15, 2010, we purchased a facility located in Tinley Park, Illinois, which we had previously leased, for approximately $4.3 million. The property was purchased using existing cash, cash equivalents and marketable securities.
Currently, we have a revolving loan agreement with a bank that provides for a maximum available credit of $15.0 million and will expire on December 31, 2011. We pay interest on any outstanding amounts at a rate equal to, at our option, BBA LIBOR Daily Floating Rate plus 1.75%, or the Eurodollar Rate plus 1.75%. The line of credit contains two financial covenants, a Leverage Ratio and a Fixed Charge Coverage Ratio, that apply in the event that our consolidated cash, cash equivalents and marketable securities balance falls below $25.0 million at any time. As our consolidated cash, cash equivalents and marketable securities balance was above $25.0 million throughout 2010, the Leverage Ratio and Fixed Charge Coverage Ratio did not apply. We may terminate the loan agreement prior to its full term without penalty, provided we give 30 days advance written notice to the bank. As of December 31, 2010, no borrowings were outstanding under the facility.
On November 26, 2008, our Board of Directors authorized a program to repurchase up to one million shares of our common stock. The share repurchase program is funded using our existing cash, cash equivalents, marketable securities and future cash flows. As of December 31, 2010, there were 798,676 shares that may yet be purchased under this program. We did not repurchase any shares of our common stock during 2010 under the program.
It is our intent to continue to invest in the mini-VSAT Broadband network on a global basis in cooperation with ViaSat under the terms of a 10-year agreement announced in July 2008. As part of this investment, we expect that we will purchase additional hubs from ViaSat over time for capacity and/or regional expansion. Each satellite hub represents a substantial capital investment. In 2008, we entered into an agreement to lease satellite capacity in order to provide coverage in the Pacific Ocean. In 2009, we entered into several agreements with various satellite owners in order to provide satellite coverage to North American, Caribbean, African, Asia-Pacific, Indian Ocean, Australian and New Zealand waters. During the third quarter of 2010, we entered into an agreement to lease satellite capacity to provide coverage in offshore Brazilian waters. In addition to these agreements, as part of future potential capacity and coverage expansion, we would plan to seek to acquire additional satellite capacity from satellite operators, expend funds to seek regulatory approvals and permits, develop product enhancements in anticipation of the expansion, and hire additional personnel. We anticipate these costs will be funded by cash, cash equivalents and marketable securities on hand, as well as cash flows from operations.
We believe that the $37.3 million we hold in cash, cash equivalents and marketable securities, together with our other existing working capital and cash flows from operations, will be adequate to meet planned operating and capital requirements through at least the next twelve months. However, as the need or opportunity arises, we may seek to raise additional capital through public or private sales of securities or through additional debt financing. There are no assurances that we will be able to obtain any additional funding or that such funding will be available on terms acceptable to us.
41
Table of Contents
Contractual Obligations and Other Commercial Commitments
As of December 31, 2010, our contractual commitments consisted of satellite service capacity, equipment and facility leases, near-term purchase commitments, and a mortgage note payable. Our purchase commitments include unconditional purchase orders for inventory, manufacturing materials and fixed assets extending out over various periods throughout 2011. We are also obligated under multi-year facility leases and satellite service capacity leases that terminate at various times between 2011 and 2016.
The following table summarizes our obligations under these commitments, excluding interest, at December 31, 2010:
| Payment Due by Period | ||||||||||||||||||||
| Contractual Obligations |
Total | Less than 1 Year |
1-3 Years | 3-5 Years | More than 5 Years |
|||||||||||||||
| (in thousands) | ||||||||||||||||||||
| Satellite service capacity and equipment lease obligations |
$ | 29,852 | $ | 7,579 | $ | 14,482 | $ | 7,634 | $ | 157 | ||||||||||
| Inventory purchase commitments |
23,015 | 23,015 | — | — | — | |||||||||||||||
| Mortgage note payable |
3,807 | 124 | 269 | 300 | 3,114 | |||||||||||||||
| Facility lease obligations |
873 | 449 | 371 | 53 | — | |||||||||||||||
| Total |
$ | 57,547 | $ | 31,167 | $ | 15,122 | $ | 7,987 | $ | 3,271 | ||||||||||
We did not have any off-balance sheet commitments, guarantees or standby repurchase obligations as of December 31, 2010.
Recent Accounting Pronouncements
See note 1 of our accompanying audited consolidated financial statements for a description of recent accounting pronouncements including the dates (or expected dates) of adoption and effects (or expected effects) on our results of operations.
| ITEM 7A. | Quantitative and Qualitative Disclosure About Market Risk |
Our primary market risk exposure is in the area of foreign currency exchange risk. We are exposed to currency exchange rate fluctuations related to our subsidiary operations in Brazil, Denmark, Norway and Singapore. Certain transactions in these locations are made in the local currency, yet are reported in the U.S. dollar, the functional currency. For foreign currency exposures existing at December 31, 2010, a 10% unfavorable movement in the foreign exchange rates for our subsidiary locations would not expose us to material losses in earnings or cash flows.
From time to time, we purchase foreign currency forward contracts generally having durations of no more than five months. These forward contracts are intended to offset the impact of exchange rate fluctuations on cash flows of our foreign subsidiaries. Foreign exchange contracts are accounted for as cash flow hedges and are recorded on the balance sheet at fair value until executed. Changes in the fair value are recognized in earnings. We did not enter into any such contracts during 2010.
The primary objective of our investment activities is to preserve principal and maintain liquidity, while at the same time maximize income. We have not entered into any instruments for trading purposes. Some of the securities that we invest in may have market risk. To minimize this risk, we maintain our portfolio of cash equivalents and short-term investments in a variety of securities that can include United States treasuries, certificates of deposit, investment grade asset-backed corporate securities, money market mutual funds and government agency and non-government debt securities. As of December 31, 2010, a hypothetical 100 basis-
42
Table of Contents
point increase in interest rates would result in an immaterial decrease in the fair value of our investments that have maturities of greater than one year. Due to the conservative nature of our investments and the relatively short duration of their maturities, we believe interest rate risk is substantially mitigated. As of December 31 2010, 65% of the $30.1 million classified as available-for-sale marketable securities will mature or reset within one year. Accordingly, long-term interest rate risk is not considered material. We do not invest in any financial instruments denominated in foreign currencies as of December 31, 2010.
To the extent that we borrow against our variable-rate credit facility, we will be subject to interest rate risk. There were no borrowings outstanding at December 31, 2010.
As previously discussed in note 17 to the consolidated financial statements, effective April 1, 2010, in order to reduce the volatility of cash outflows that arise from changes in interest rates, we entered into two interest rate swap agreements. These interest rate swap agreements are intended to hedge our mortgage loan related to our headquarters facility in Middletown, Rhode Island by fixing the interest rates specified in the mortgage loan to 5.91% for half of the principal amount outstanding and 6.07% for the remaining half of the principal amount outstanding as of April 1, 2010 until the mortgage loan expires on April 16, 2019.
| ITEM 8. | Financial Statements and Supplementary Data |
Our consolidated financial statements and supplementary data, together with the report of KPMG LLP, our independent registered public accounting firm, are included in Part IV of this annual report on Form 10-K.
| ITEM 9. | Changes in and Disagreements with Accountants on Accounting and Financial Disclosure |
None.
| ITEM 9A. | Controls and Procedures |
Evaluation of Disclosure Controls and Procedures
We maintain disclosure controls and procedures, as defined in Rules 13a-15(e) and 15d-15(e) under the Securities Exchange Act of 1934, as amended, or the Exchange Act, which are designed to ensure that information required to be disclosed in the reports we file or submit under the Exchange Act is recorded, processed, summarized and reported within the time periods specified in the Securities and Exchange Commission’s rules and forms, and that such information is accumulated and communicated to our management, including our President, Chief Executive Officer and Chairman of the Board, or CEO, and Chief Financial and Accounting Officer, or CFO, as appropriate to allow timely decisions regarding required disclosure.
Under the supervision and with the participation of our CEO and CFO, our management has evaluated the effectiveness of our disclosure controls and procedures as of the end of the period covered by this annual report. Based on that evaluation, our CEO and CFO concluded that our disclosure controls and procedures were effective as of December 31, 2010.
Management’s Report on Internal Control over Financial Reporting
Our management is responsible for establishing and maintaining adequate internal control over financial reporting. Our internal control over financial reporting is the process designed by and under the supervision of our CEO and CFO to provide reasonable assurance regarding the reliability of our financial reporting and the preparation of our financial statements for external reporting in accordance with accounting principles generally accepted in the United States of America. Management has evaluated the effectiveness of our internal control over financial reporting using the criteria set forth by the Committee of Sponsoring Organizations of the Treadway Commission (COSO) in Internal Control—Integrated Framework.
43
Table of Contents
Under the supervision and with the participation of our CEO and CFO, our management has assessed the effectiveness of our internal control over financial reporting as of December 31, 2010 and concluded that it is effective.
Our independent registered public accounting firm, KPMG LLP, has issued an audit report regarding the effectiveness of our internal control over financial reporting as of December 31, 2010, and that report is included below.
Evaluation of Changes in Internal Control over Financial Reporting
Under the supervision and with the participation of our CEO and CFO, our management has evaluated changes in our internal control over financial reporting that occurred during the fourth quarter of 2010. Based on that evaluation, our CEO and CFO did not identify any change in our internal control over financial reporting that has materially affected, or is reasonably likely to materially affect, our internal control over financial reporting.
Important Considerations
The effectiveness of our disclosure controls and procedures and our internal control over financial reporting is subject to various inherent limitations, including cost limitations, judgments used in decision making, assumptions about the likelihood of future events, the soundness of our systems, the possibility of human error, and the risk of fraud. Moreover, projections of any evaluation of effectiveness to future periods are subject to the risk that controls may become inadequate because of changes in conditions and the risk that the degree of compliance with policies or procedures may deteriorate over time. Because of these limitations, there can be no assurance that any system of disclosure controls and procedures or internal control over financial reporting will be successful in preventing all errors or fraud or in making all material information known in a timely manner to the appropriate levels of management.
| ITEM 9B. | Other Information |
None.
44
Table of Contents
We have omitted the information required in Part III of this annual report because we intend to include that information in our definitive proxy statement for our 2011 annual meeting of stockholders, which we expect to file before 120 days after the end of fiscal 2010. We incorporate the information required in Part III of this annual report by reference to our 2011 proxy statement.
| ITEM 10. | Directors, Executive Officers and Corporate Governance |
Except as set forth below, the information required by this item is incorporated by reference to our 2011 proxy statement.
Our Board of Directors has adopted a Code of Business Conduct and Ethics that applies to our directors, executives, officers and employees. Our Code of Business Conduct and Ethics can be found on our website, which is located at www.kvh.com. We intend to make all required disclosures concerning any amendments to or waivers from, our Code of Business Conduct and Ethics on our website. Any person may request a copy of the Code of Business Conduct and Ethics, at no cost, by writing to us at the following address: KVH Industries, Inc., 50 Enterprise Center, Middletown, Rhode Island, 02842, Attention: Investor Relations.
| ITEM 11. | Executive Compensation |
The information required by this item is incorporated by reference to our 2011 proxy statement.
| ITEM 12. | Security Ownership of Certain Beneficial Owners and Management and Related Stockholder Matters |
The information required by this item is incorporated by reference to our 2011 proxy statement.
| ITEM 13. | Certain Relationships and Related Transactions and Director Independence |
The information required by this item is incorporated by reference to our 2011 proxy statement.
| ITEM 14. | Principal Accountant Fees and Services |
The information required by this item is incorporated by reference to our 2011 proxy statement.
45
Table of Contents
| ITEM 15. | Exhibits and Financial Statement Schedules |
46
Table of Contents
| 3. | Exhibits |
| Exhibit No. |
Description |
Filed with this Form 10-K |
Incorporated by Reference | |||||||||||||
| Form | Filing Date | Exhibit No. | ||||||||||||||
| 3.1 | Amended and Restated Certificate of Incorporation, as amended | 10-Q | August 6, 2010 |
3.1 | ||||||||||||
| 3.2 | Amended, Restated and Corrected Bylaws of KVH Industries, Inc. | 8-K | July 31, 2007 | 3 | ||||||||||||
| 4.1 | Specimen certificate for the common stock | S-1/A | March 22, 1996 |
4.1 | ||||||||||||
| *10.1 | Amended and Restated 1996 Incentive and Nonqualified Stock Option Plan | 8-K | July 31, 2007 | 10.3 | ||||||||||||
| *10.2 | Amended and Restated 1996 Employee Stock Purchase Plan | 8-K | June 2, 2010 | 10.2 | ||||||||||||
| *10.3 | Second Amended and Restated 2003 Incentive and Nonqualified Stock Option Plan | 10-Q | May 6, 2009 | 10.21 | ||||||||||||
| *10.4 | Third Amended and Restated 2006 Stock Incentive Plan | 8-K | June 2, 2010 | 10.1 | ||||||||||||
| *10.5 | Form of Nonqualified Stock Option agreement granted under the Second Amended and Restated 2003 Incentive and Nonqualified Stock Option Plan | 10-K | March 15, 2005 |
10.14 | ||||||||||||
| *10.6 | Form of Incentive Stock Option agreement granted under the Second Amended and Restated 2003 Incentive and Nonqualified Stock Option Plan | 10-K | March 15, 2005 |
10.15 | ||||||||||||
| *10.7 | Form of Incentive Stock Option agreement granted under the Third Amended and Restated 2006 Stock Incentive Plan | 8-K | August 28, 2006 |
10.1 | ||||||||||||
| *10.8 | Form of Non-Statutory Stock Option agreement granted under the Third Amended and Restated 2006 Stock Incentive Plan | 8-K | August 28, 2006 |
10.2 | ||||||||||||
| *10.9 | Form of Restricted Stock Agreement granted under the Third Amended and Restated 2006 Stock Incentive Plan | 8-K | August 16, 2007 |
10.1 | ||||||||||||
| *10.10 | Policy Regarding Automatic Grants to Non-Employee Directors | 10-Q | May 6, 2009 | 10.23 | ||||||||||||
| 10.11 | Amended and Restated Credit and Security Agreement dated July 17, 2003 with Fleet Capital Corporation | 8-K | July 18, 2003 | 99.1 | ||||||||||||
| 10.12 | Assignment and Assumption and Amendment and Note Modification Agreement, dated July 17, 2006 by and among KVH Industries, Inc., Banc of America Leasing & Capital, LLC (successor-by-merger to Fleet Capital Corporation) (“assignor”), and Bank of America, N.A. (successor-by-merger to Fleet National Bank) (“assignee”) | 8-K | July 20, 2006 | 10.1 | ||||||||||||
| 10.13 | Second Amendment and Note Modification Agreement, dated December 28, 2006 by and among KVH Industries, Inc., and Bank of America, N.A. | 8-K | January 3, 2007 |
10.1 | ||||||||||||
47
Table of Contents
| Exhibit No. |
Description |
Filed with this Form 10-K |
Incorporated by Reference | |||||||||||
| Form | Filing Date | Exhibit No. | ||||||||||||
| 10.14 | Third Amendment and Note Modification Agreement, dated August 20, 2007 by and among KVH Industries, Inc., and Bank of America, N.A. | 10-K | March 8, 2010 |
|||||||||||
| 10.15 | Fourth Amendment and Note Modification Agreement, dated December 31, 2008 by and among KVH Industries, Inc., and Bank of America, N.A. | 8-K | January 2, 2009 |
10.1 | ||||||||||
| 10.16 | Loan Agreement dated April 6, 2009 by and among KVH Industries, Inc., and Bank of America, N.A. | 8-K | April 8, 2009 |
10.1 | ||||||||||
| 10.17 | Purchase and Sale Agreement by and between Jefferson-Pilot Investments, Inc., and KVH Industries, Inc. | 10-Q | August 6, 2010 |
10.3 | ||||||||||
| 21.1 | List of Subsidiaries | X | ||||||||||||
| 23.1 | Consent of KPMG LLP | X | ||||||||||||
| 31.1 | Rule 13a-14(a)/15d-14(a) certification of principal executive officer | X | ||||||||||||
| 31.2 | Rule 13a-14(a)/15d-14(a) certification of principal financial officer | X | ||||||||||||
| 32.1 | Rule 1350 certification | X | ||||||||||||
| * | Management contract or compensatory plan. |
48
Table of Contents
Pursuant to the requirements of Section 13 or Section 15(d) of the Securities Exchange Act of 1934, the registrant has duly caused this report to be signed on its behalf by the undersigned, thereunto duly authorized.
| KVH Industries, Inc. | ||||||
| Date: March 14, 2011 | By: | /S/ MARTIN A. KITS VAN HEYNINGEN | ||||
| Martin A. Kits van Heyningen President, Chief Executive Officer and Chairman | ||||||
Pursuant to the requirements of the Securities Exchange Act of 1934, this report has been signed below by the following persons in the capacities and on the dates indicated.
| Name |
Title |
Date | ||
|
/S/ MARTIN A. KITS VAN HEYNINGEN Martin A. Kits van Heyningen |
President, Chief Executive Officer and Chairman of the Board (Principal Executive Officer) |
March 14, 2011 | ||
| /S/ PATRICK J. SPRATT Patrick J. Spratt |
Chief Financial and Accounting Officer (Principal Financial and Accounting Officer) |
March 14, 2011 | ||
| /S/ ROBERT W.B. KITS VAN HEYNINGEN Robert W.B. Kits van Heyningen |
Director | March 14, 2011 | ||
| /S/ MARK S. AIN Mark S. Ain |
Director | March 14, 2011 | ||
| /S/ STANLEY K. HONEY Stanley K. Honey |
Director |
March 14, 2011 | ||
| /S/ BRUCE J. RYAN Bruce J. Ryan |
Director |
March 14, 2011 | ||
| /S/ CHARLES R. TRIMBLE Charles R. Trimble |
Director |
March 14, 2011 | ||
49
Table of Contents
Report of Independent Registered Public Accounting Firm
The Board of Directors and Stockholders
KVH Industries, Inc.:
We have audited the accompanying consolidated balance sheets of KVH Industries, Inc. and subsidiaries (the “Company”) as of December 31, 2010 and 2009, and the related consolidated statements of operations, stockholders’ equity and accumulated other comprehensive income (loss), and cash flows for each of the years in the three-year period ended December 31, 2010. We also have audited the Company’s internal control over financial reporting as of December 31, 2010, based on criteria established in Internal Control—Integrated Framework issued by the Committee of Sponsoring Organizations of the Treadway Commission (COSO). The Company’s management is responsible for these consolidated financial statements, for maintaining effective internal control over financial reporting, and for its assessment of the effectiveness of internal control over financial reporting, included in the accompanying Management’s Report on Internal Control over Financial Reporting. Our responsibility is to express an opinion on these consolidated financial statements and an opinion on the Company’s internal control over financial reporting based on our audits.
We conducted our audits in accordance with the standards of the Public Company Accounting Oversight Board (United States). Those standards require that we plan and perform the audits to obtain reasonable assurance about whether the financial statements are free of material misstatement and whether effective internal control over financial reporting was maintained in all material respects. Our audits of the consolidated financial statements included examining, on a test basis, evidence supporting the amounts and disclosures in the financial statements, assessing the accounting principles used and significant estimates made by management, and evaluating the overall financial statement presentation. Our audit of internal control over financial reporting included obtaining an understanding of internal control over financial reporting, assessing the risk that a material weakness exists, and testing and evaluating the design and operating effectiveness of internal control based on the assessed risk. Our audits also included performing such other procedures as we considered necessary in the circumstances. We believe that our audits provide a reasonable basis for our opinions.
A company’s internal control over financial reporting is a process designed to provide reasonable assurance regarding the reliability of financial reporting and the preparation of financial statements for external purposes in accordance with generally accepted accounting principles. A company’s internal control over financial reporting includes those policies and procedures that (1) pertain to the maintenance of records that, in reasonable detail, accurately and fairly reflect the transactions and dispositions of the assets of the company; (2) provide reasonable assurance that transactions are recorded as necessary to permit preparation of financial statements in accordance with generally accepted accounting principles, and that receipts and expenditures of the company are being made only in accordance with authorizations of management and directors of the company; and (3) provide reasonable assurance regarding prevention or timely detection of unauthorized acquisition, use, or disposition of the company’s assets that could have a material effect on the financial statements.
Because of its inherent limitations, internal control over financial reporting may not prevent or detect misstatements. Also, projections of any evaluation of effectiveness to future periods are subject to the risk that controls may become inadequate because of changes in conditions, or that the degree of compliance with the policies or procedures may deteriorate.
In our opinion, the consolidated financial statements referred to above present fairly, in all material respects, the financial position of the Company as of December 31, 2010 and 2009, and the results of their operations and their cash flows for each of the years in the three-year period ended December 31, 2010, in conformity with U.S. generally accepted accounting principles. Also in our opinion, the Company maintained, in all material respects, effective internal control over financial reporting as of December 31, 2010, based on criteria established in Internal Control—Integrated Framework issued by the Committee of Sponsoring Organizations of the Treadway Commission.
| /S/ KPMG LLP |
| Providence, Rhode Island March 14, 2011 |
50
Table of Contents
KVH INDUSTRIES, INC. AND SUBSIDIARIES
CONSOLIDATED BALANCE SHEETS
| December 31, | ||||||||
| 2010 | 2009 | |||||||
| ASSETS | ||||||||
| Current assets: |
||||||||
| Cash and cash equivalents |
$ | 7,241,188 | $ | 5,870,771 | ||||
| Marketable securities |
30,065,581 | 35,433,491 | ||||||
| Accounts receivable, net of allowance for doubtful accounts of $592,458 as of December 31, 2010 and $843,852 as of December 31, 2009 |
18,769,709 | 15,802,796 | ||||||
| Inventories |
14,765,210 | 13,386,981 | ||||||
| Prepaid expenses and other assets |
2,734,058 | 1,615,022 | ||||||
| Deferred income taxes |
944,489 | 17,356 | ||||||
| Total current assets |
74,520,235 | 72,126,417 | ||||||
| Property and equipment, less accumulated depreciation of $23,518,164 as of December 31, 2010 and $21,502,669 as of December 31, 2009 |
23,044,116 | 15,777,154 | ||||||
| Intangible assets, less accumulated amortization of $101,222 as of December 31, 2010 |
2,271,458 | — | ||||||
| Goodwill |
4,517,103 | — | ||||||
| Other non-current assets |
5,863,093 | 6,508,767 | ||||||
| Deferred income taxes |
4,981,949 | 3,333,794 | ||||||
| Total assets |
$ | 115,197,954 | $ | 97,746,132 | ||||
| LIABILITIES AND STOCKHOLDERS’ EQUITY | ||||||||
| Current liabilities: |
||||||||
| Accounts payable |
$ | 3,922,089 | $ | 3,611,037 | ||||
| Accrued compensation and employee-related expenses |
4,414,911 | 3,576,475 | ||||||
| Accrued other |
3,278,456 | 1,667,415 | ||||||
| Accrued product warranty costs |
886,558 | 1,084,302 | ||||||
| Accrued professional fees |
312,081 | 418,822 | ||||||
| Deferred revenue |
1,011,265 | 960,996 | ||||||
| Current portion of long-term debt |
123,870 | 117,256 | ||||||
| Total current liabilities |
13,949,230 | 11,436,303 | ||||||
| Other long-term liabilities |
1,262,524 | 902,113 | ||||||
| Long-term debt excluding current portion |
3,683,536 | 3,807,406 | ||||||
| Total liabilities |
18,895,290 | 16,145,822 | ||||||
| Commitments and contingencies (notes 1, 5, 6 and 18) |
||||||||
| Stockholders’ equity: |
||||||||
| Preferred stock, $0.01 par value. Authorized 1,000,000 shares; none issued |
— | — | ||||||
| Common stock, $0.01 par value. Authorized 30,000,000 shares, 15,890,083 and 15,355,602 shares issued; 14,688,759 and 14,154,278 shares outstanding at December 31, 2010 and December 31, 2009, respectively |
158,989 | 153,644 | ||||||
| Additional paid-in capital |
102,727,761 | 96,274,199 | ||||||
| Accumulated earnings (deficit) |
2,867,216 | (5,405,996 | ) | |||||
| Accumulated other comprehensive income |
19,817 | 49,582 | ||||||
| 105,773,783 | 91,071,429 | |||||||
| Less: treasury stock at cost, common stock, 1,201,324 shares as of December 31, 2010 and December 31, 2009 |
(9,471,119 | ) | (9,471,119 | ) | ||||
| Total stockholders’ equity |
96,302,664 | 81,600,310 | ||||||
| Total liabilities and stockholders’ equity |
$ | 115,197,954 | $ | 97,746,132 | ||||
See accompanying Notes to Consolidated Financial Statements.
51
Table of Contents
KVH INDUSTRIES, INC. AND SUBSIDIARIES
CONSOLIDATED STATEMENTS OF OPERATIONS
| Year Ended December 31, | ||||||||||||
| 2010 | 2009 | 2008 | ||||||||||
| Sales: |
||||||||||||
| Product |
$ | 92,058,745 | $ | 75,191,081 | $ | 69,940,726 | ||||||
| Service |
20,184,049 | 13,868,768 | 12,462,991 | |||||||||
| Net sales |
112,242,794 | 89,059,849 | 82,403,717 | |||||||||
| Costs and expenses: |
||||||||||||
| Costs of product sales |
51,347,555 | 46,551,735 | 42,552,375 | |||||||||
| Costs of service sales |
16,086,394 | 10,198,161 | 6,130,049 | |||||||||
| Research and development |
10,714,889 | 8,805,350 | 7,654,610 | |||||||||
| Sales, marketing and support |
18,470,019 | 16,316,115 | 16,161,515 | |||||||||
| General and administrative |
10,083,851 | 7,832,124 | 7,034,964 | |||||||||
| Total costs and expenses |
106,702,708 | 89,703,485 | 79,533,513 | |||||||||
| Income (loss) from operations |
5,540,086 | (643,636 | ) | 2,870,204 | ||||||||
| Interest income |
301,352 | 358,135 | 1,220,455 | |||||||||
| Interest expense |
204,076 | 88,485 | 153,426 | |||||||||
| Other income (expense) |
23,448 | (19,764 | ) | (231,185 | ) | |||||||
| Income (loss) before income taxes |
5,660,810 | (393,750 | ) | 3,706,048 | ||||||||
| Income tax (benefit) expense |
(2,612,402 | ) | (260,575 | ) | 647,721 | |||||||
| Net income (loss) |
$ | 8,273,212 | $ | (133,175 | ) | $ | 3,058,327 | |||||
| Per share information: |
||||||||||||
| Net income (loss) per share, basic |
$ | 0.57 | $ | (0.01 | ) | $ | 0.21 | |||||
| Net income (loss) per share, diluted |
$ | 0.56 | $ | (0.01 | ) | $ | 0.21 | |||||
| Number of shares used in per share calculation: |
||||||||||||
| Basic |
14,419,599 | 13,996,363 | 14,372,626 | |||||||||
| Diluted |
14,850,325 | 13,996,363 | 14,376,537 | |||||||||
See accompanying Notes to Consolidated Financial Statements.
52
Table of Contents
KVH INDUSTRIES, INC. AND SUBSIDIARIES
CONSOLIDATED STATEMENTS OF STOCKHOLDERS’ EQUITY AND
ACCUMULATED OTHER COMPREHENSIVE INCOME (LOSS)
| Common Stock | Additional Paid-in Capital |
Accumulated (Deficit) Earnings |
Accumulated Other Comprehensive Income (Loss) |
Treasury Stock |
Total Stockholders’ Equity |
|||||||||||||||||||||||
| Shares | Amount | |||||||||||||||||||||||||||
| Balances at January 1, 2008 |
14,829,528 | $ | 150,705 | $ | 91,124,130 | $ | (8,331,148 | ) | $ | (366 | ) | $ | (2,172,903 | ) | $ | 80,770,418 | ||||||||||||
| Comprehensive income: |
||||||||||||||||||||||||||||
| Net income |
— | — | — | 3,058,327 | — | — | 3,058,327 | |||||||||||||||||||||
| Unrealized gain on marketable securities |
— | — | — | — | 129,658 | — | 129,658 | |||||||||||||||||||||
| Comprehensive income |
— | — | — | — | — | — | 3,187,985 | |||||||||||||||||||||
| Stock-based compensation |
— | — | 1,540,268 | — | — | — | 1,540,268 | |||||||||||||||||||||
| Common stock issued under benefit plan |
40,511 | 405 | 251,130 | — | — | — | 251,535 | |||||||||||||||||||||
| Acquisition of treasury stock |
(837,280 | ) | — | — | — | — | (6,697,345 | ) | (6,697,345 | ) | ||||||||||||||||||
| Exercise of stock options, vesting of restricted stock awards |
16,288 | 163 | 16,168 | — | — | — | 16,331 | |||||||||||||||||||||
| Balances at December 31, 2008 |
14,049,047 | $ | 151,273 | $ | 92,931,696 | $ | (5,272,821 | ) | $ | 129,292 | $ | (8,870,248 | ) | $ | 79,069,192 | |||||||||||||
| Comprehensive income: |
||||||||||||||||||||||||||||
| Net loss |
— | — | — | (133,175 | ) | — | — | (133,175 | ) | |||||||||||||||||||
| Unrealized loss on marketable securities |
— | — | — | — | (79,710 | ) | — | (79,710 | ) | |||||||||||||||||||
| Comprehensive loss |
— | — | — | — | — | — | (212,885 | ) | ||||||||||||||||||||
| Stock-based compensation |
— | — | 1,734,042 | — | — | — | 1,734,042 | |||||||||||||||||||||
| Registration fees |
— | — | (4,356 | ) | — | — | — | (4,356 | ) | |||||||||||||||||||
| Common stock issued under benefit plan |
37,011 | 370 | 238,204 | — | — | — | 238,574 | |||||||||||||||||||||
| Acquisition of treasury stock |
(123,044 | ) | — | — | — | — | (600,871 | ) | (600,871 | ) | ||||||||||||||||||
| Payment of restricted stock withholdings |
(8,790 | ) | — | (46,938 | ) | — | — | — | (46,938 | ) | ||||||||||||||||||
| Exercise of stock options, vesting of restricted stock awards |
200,054 | 2,001 | 1,421,551 | — | — | — | 1,423,552 | |||||||||||||||||||||
| Balances at December 31, 2009 |
14,154,278 | $ | 153,644 | $ | 96,274,199 | $ | (5,405,996 | ) | $ | 49,582 | $ | (9,471,119 | ) | $ | 81,600,310 | |||||||||||||
| Comprehensive income: |
||||||||||||||||||||||||||||
| Net income |
— | — | — | 8,273,212 | — | — | 8,273,212 | |||||||||||||||||||||
| Currency translation adjustment |
— | — | — | — | 260,256 | — | 260,256 | |||||||||||||||||||||
| Unrealized loss on interest rate swaps |
— | — | — | — | (242,880 | ) | — | (242,880 | ) | |||||||||||||||||||
| Unrealized loss on marketable securities |
— | — | — | — | (47,141 | ) | — | (47,141 | ) | |||||||||||||||||||
| Comprehensive income |
— | — | — | — | — | — | 8,243,447 | |||||||||||||||||||||
| Stock-based compensation |
— | — | 2,522,737 | — | — | — | 2,522,737 | |||||||||||||||||||||
| Registration fees |
— | — | (6,962 | ) | — | — | — | (6,962 | ) | |||||||||||||||||||
| Tax benefit from exercise of stock options |
— | — | 478,947 | — | — | — | 478,947 | |||||||||||||||||||||
| Common stock issued under benefit plan |
21,654 | 217 | 259,767 | — | — | — | 259,984 | |||||||||||||||||||||
| Payment of restricted stock withholdings |
(37,726 | ) | (377 | ) | (480,409 | ) | — | — | — | (480,786 | ) | |||||||||||||||||
| Exercise of stock options, vesting of restricted stock awards |
550,553 | 5,505 | 3,679,482 | — | — | — | 3,684,987 | |||||||||||||||||||||
| Balances at December 31, 2010 |
14,688,759 | $ | 158,989 | $ | 102,727,761 | $ | 2,867,216 | $ | 19,817 | $ | (9,471,119 | ) | $ | 96,302,664 | ||||||||||||||
See accompanying Notes to Consolidated Financial Statements.
53
Table of Contents
KVH INDUSTRIES, INC. AND SUBSIDIARIES
CONSOLIDATED STATEMENTS OF CASH FLOWS
| Year Ended December 31, | ||||||||||||
| 2010 | 2009 | 2008 | ||||||||||
| Cash flows from operating activities: |
||||||||||||
| Net income (loss) |
$ | 8,273,212 | $ | (133,175 | ) | $ | 3,058,327 | |||||
| Adjustments to reconcile net income (loss) to net cash provided by (used in) operating activities: |
||||||||||||
| Depreciation and amortization |
3,845,016 | 2,653,578 | 2,215,436 | |||||||||
| Deferred income taxes |
(3,133,858 | ) | 14,773 | (14,864 | ) | |||||||
| Provision for doubtful accounts |
280,578 | 831,334 | 260,029 | |||||||||
| Gain on sale of fixed assets |
— | (10,278 | ) | (3,051 | ) | |||||||
| Loss on foreign currency forward exchange contracts |
— | — | 231,162 | |||||||||
| Loss on interest rate swaps |
102,572 | — | — | |||||||||
| Compensation expense related to awards and employee stock purchase plan |
2,523,799 | 1,734,042 | 1,546,296 | |||||||||
| Changes in operating assets and liabilities, excluding the effects of acquisition: |
||||||||||||
| Accounts receivable |
(2,660,238 | ) | (2,674,255 | ) | (1,393,459 | ) | ||||||
| Inventories |
(1,215,185 | ) | 2,097,230 | (6,170,829 | ) | |||||||
| Prepaid expenses and other assets |
(1,078,556 | ) | (840,191 | ) | 224,941 | |||||||
| Other non-current assets |
645,674 | (2,282,269 | ) | (4,190,242 | ) | |||||||
| Accounts payable |
178,539 | (1,876,618 | ) | 1,903,662 | ||||||||
| Deferred revenue |
(43,713 | ) | 595,303 | 67,821 | ||||||||
| Accrued expenses |
1,499,612 | (61,837 | ) | 1,237,380 | ||||||||
| Other long-term liabilities |
360,411 | 902,113 | — | |||||||||
| Net cash provided by (used in) operating activities |
9,577,863 | 949,750 | (1,027,391 | ) | ||||||||
| Cash flows from investing activities: |
||||||||||||
| Capital expenditures |
(11,010,756 | ) | (5,163,026 | ) | (3,219,888 | ) | ||||||
| Proceeds from the sale of fixed assets |
— | 29,025 | 27,446 | |||||||||
| Net cash paid for business acquired |
(6,365,518 | ) | — | — | ||||||||
| Purchases of marketable securities |
(87,886,677 | ) | (35,026,808 | ) | (30,190,048 | ) | ||||||
| Maturities and sales of marketable securities |
93,207,446 | 37,194,077 | 33,659,852 | |||||||||
| Net cash (used in) provided by investing activities |
(12,055,505 | ) | (2,966,732 | ) | 277,362 | |||||||
| Cash flows from financing activities: |
||||||||||||
| Repayments of mortgage loan |
(117,256 | ) | (2,101,494 | ) | (132,210 | ) | ||||||
| Borrowings from mortgage loan |
— | 4,000,000 | — | |||||||||
| Proceeds from stock options exercised and employee stock purchase plan |
4,423,918 | 1,662,126 | 274,563 | |||||||||
| Payment of employee restricted stock withholdings |
(480,786 | ) | (46,938 | ) | — | |||||||
| Payment of stock registration fees |
(6,962 | ) | (4,356 | ) | — | |||||||
| Repurchase of common stock |
— | (600,871 | ) | (6,697,345 | ) | |||||||
| Net cash provided by (used in) financing activities |
3,818,914 | 2,908,467 | (6,554,992 | ) | ||||||||
| Effect on exchange rate changes on cash and cash equivalents |
29,145 | — | — | |||||||||
| Net increase (decrease) in cash and cash equivalents |
1,370,417 | 891,485 | (7,305,021 | ) | ||||||||
| Cash and cash equivalents at beginning of year |
5,870,771 | 4,979,286 | 12,284,307 | |||||||||
| Cash and cash equivalents at end of year |
$ | 7,241,188 | $ | 5,870,771 | $ | 4,979,286 | ||||||
| Supplemental disclosure of cash flow information: |
||||||||||||
| Cash paid for interest |
$ | 189,931 | $ | 81,767 | $ | 146,897 | ||||||
| Cash paid for income taxes |
$ | 881,025 | $ | 480,957 | $ | 415,892 | ||||||
| Supplemental disclosure of noncash investing activity: |
||||||||||||
| Write-off of fully depreciated fixed assets |
$ | 48,972 | $ | 5,369 | $ | 128,325 | ||||||
| Supplemental disclosure of noncash financing activity: |
||||||||||||
| Employee stock purchase plan activity |
$ | 1,062 | $ | 6,230 | $ | 6,028 | ||||||
See accompanying Notes to Consolidated Financial Statements.
54
Table of Contents
KVH INDUSTRIES, INC. AND SUBSIDIARIES
NOTES TO CONSOLIDATED FINANCIAL STATEMENTS
December 31, 2010, 2009 and 2008
(in thousands except share and per share amounts)
| (1) | Summary of Significant Accounting Policies |
| (a) | Description of Business |
KVH Industries, Inc. (the Company or KVH) develops, manufactures and markets mobile communications products for the marine, land mobile and aeronautical markets, and navigation, guidance and stabilization products for both the defense and commercial markets.
KVH’s mobile communications products enable customers to receive voice and Internet services, and live digital television via satellite services in marine vessels, recreational vehicles and automobiles as well as live digital television on commercial airplanes while in motion. KVH sells its mobile communications products through an extensive international network of retailers, distributors and dealers. KVH also leases products directly to end users.
KVH offers precision fiber optic gyro-based (FOG) systems that enable platform and optical stabilization, navigation, pointing and guidance. KVH’s guidance and stabilization products also include tactical navigation systems that provide uninterrupted access to navigation and pointing information in a variety of military vehicles, including tactical trucks and light armored vehicles. KVH’s guidance and stabilization products are sold directly to U.S. and allied governments and government contractors, as well as through an international network of authorized independent sales representatives. In addition, KVH’s guidance and stabilization products have numerous commercial applications such as precision mapping, dynamic surveying, autonomous vehicles, train location control and track geometry measurement systems, industrial robotics and optical stabilization.
KVH’s mobile communications service sales include sales earned from satellite voice and Internet airtime services, engineering services provided under development contracts, sales from product repairs, certain DIRECTV and DISH Network account subsidies and referral fees earned in conjunction with the sale of its products and extended warranty sales. KVH provides, for monthly fixed and usage fees, satellite connectivity sales from broadband Internet, data and Voice over Internet Protocol (VoIP) service to its TracPhone V7 customers. KVH also earns monthly usage fees for third-party satellite connectivity for voice, data and Internet services to its Inmarsat TracPhone customers who choose to activate their subscriptions with KVH. Under current DIRECTV and DISH Network programs, KVH is eligible to receive a one-time subsidy for each DIRECTV receiver activated for service and a new mobile account activation fee from DIRECTV and DISH Network for each customer who activates their DIRECTV or DISH Network service directly through KVH.
KVH’s guidance and stabilization service sales include product repairs, engineering services provided under development contracts and extended warranty sales.
| (b) | Principles of Consolidation |
The accompanying consolidated financial statements of KVH Industries, Inc. and its wholly owned subsidiaries, KVH Europe A/S, KVH Industries Asia Pte. Ltd., KVH South America Comunicacao Por Satelite Ltda. and Virtek Communication (collectively, KVH or the Company), have been prepared in accordance with accounting principles generally accepted in the United States of America. The Company has evaluated all subsequent events through the date of this filing. Given that KVH Europe A/S, KVH Industries Asia Pte. Ltd. and KVH South America Comunicacao Por Satelite Ltda. operate as the Company’s European, Asian and Brazilian international distributors, all of their operating expenses are reflected within sales, marketing and support within the accompanying consolidated statements of operations. Virtek Communication AS, a subsidiary of KVH Europe A/S that was purchased in September 2010, develops and distributes middleware software solutions known as CommBox™ technology, which will be integrated into the Company’s satellite communications
55
Table of Contents
KVH INDUSTRIES, INC. AND SUBSIDIARIES
NOTES TO CONSOLIDATED FINANCIAL STATEMENTS—(Continued)
December 31, 2010, 2009 and 2008
(in thousands except share and per share amounts)
| (1) | Summary of Significant Accounting Policies—(continued) |
products and services. All significant intercompany accounts and transactions have been eliminated in consolidation. Certain prior year amounts have been reclassified to conform with the current year presentation.
| (c) | Significant Estimates and Assumptions |
The preparation of financial statements in conformity with accounting principles generally accepted in the United States of America requires management to make estimates and assumptions that affect the reported amounts of assets and liabilities and disclosure of contingent assets and liabilities as of the date of the financial statements and the reported amounts of sales and expenses during the reporting periods. Significant estimates and assumptions by management affect the Company’s revenue recognition, valuation of accounts receivable, valuation of inventory, assumptions used to determine fair value of goodwill and intangible assets, deferred tax assets and related valuation allowance, stock-based compensation, certain accrued expenses and accounting for contingencies.
Although the Company regularly assesses these estimates, actual results could differ materially from these estimates. Changes in estimates are recorded in the period in which they become known. The Company bases its estimates on historical experience and various other assumptions that it believes to be reasonable under the circumstances.
| (d) | Concentration of Credit Risk and Single Source Suppliers |
Cash, cash equivalents and marketable securities. The Company is potentially subject to financial instrument concentration of credit risk through its cash, cash equivalent and marketable securities investments. To mitigate these risks the Company maintains cash, cash equivalents and marketable securities with reputable and nationally recognized financial institutions. As of December 31, 2010, $30,066 classified as marketable securities was held by Wells Fargo and substantially all of the cash and cash equivalents were held by Bank of America, N.A. See note 2 for a description of marketable securities.
Trade accounts receivable. Concentrations of risk with respect to trade accounts receivable are generally limited due to the large number of customers and their dispersion across several geographic areas. Although the Company does not foresee credit risk associated with these receivables to deviate from historical experience, repayment is dependent upon the financial stability of those individual customers. The Company establishes allowances for potential bad debts and evaluates, on a monthly basis, the adequacy of those reserves based upon historical experience and its expectations for future collectability concerns. Activity within the Company’s allowance for doubtful accounts for the periods presented is as follows:
| 2010 | 2009 | 2008 | ||||||||||
| Beginning balance |
$ | 844 | $ | 333 | $ | 256 | ||||||
| Additions charged to expense |
281 | 831 | 260 | |||||||||
| Deductions (write-offs/recoveries) from reserve |
(533 | ) | (320 | ) | (183 | ) | ||||||
| Ending balance |
$ | 592 | $ | 844 | $ | 333 | ||||||
56
Table of Contents
KVH INDUSTRIES, INC. AND SUBSIDIARIES
NOTES TO CONSOLIDATED FINANCIAL STATEMENTS—(Continued)
December 31, 2010, 2009 and 2008
(in thousands except share and per share amounts)
| (1) | Summary of Significant Accounting Policies—(continued) |
Certain components from third parties used in the Company’s products are procured from single sources of supply. The failure of a supplier, including a subcontractor, to deliver on schedule could delay or interrupt the Company’s delivery of products and thereby materially adversely affect the Company’s revenues and operating results.
| (e) | Revenue Recognition |
Product sales. Product sales are recognized when persuasive evidence of an arrangement exists, goods are shipped, title has passed and collectability is reasonably assured. The Company’s standard sales terms require that:
| • | All sales are final; |
| • | Terms are generally either Net 30 or Net 45; |
| • | Shipments are tendered and shipped FOB (or as may be applicable, FCA, or EXW) the Company’s plant or warehouse; and |
| • | Title and risk of loss or damage passes to the dealer or distributor at the point of shipment when delivery is made to the possession of the carrier. |
For certain guidance and stabilization product sales, customer acceptance or inspection may be required before title and risk of loss transfers. For those sales, revenue is recognized after transfer of title and risk of loss and after notification of customer acceptance.
Under certain limited conditions, the Company, at its sole discretion, provides for the return of goods. No product is accepted for return and no credit is allowed on any returned product unless the Company has granted and confirmed prior written permission by means of appropriate authorization. The Company establishes reserves for potential sales returns, credits, and allowances, and evaluates, on a monthly basis, the adequacy of those reserves based upon historical experience and expectations for the future.
Satellite connectivity sales. Directly sold and re-sold satellite connectivity service for voice, data and Internet is recognized monthly based upon minutes or megabytes of traffic processed or contracted fixed fee schedules. All subscribers typically enter into a contracted one year minimum service agreement. The Company records all satellite connectivity service sales to subscribers as gross sales, as the Company is the primary obligor in the contracted service arrangement. All associated regulatory service fees and costs are recorded net in the consolidated financial statements. The accounting estimates related to the recognition of satellite connectivity service sales in the results of operations require the Company to make assumptions about future billing adjustments for disputes with subscribers as well as unauthorized usage.
Lease financing. Lease financing consists of sales-type leases primarily of the TracPhone V7. The Company records the leases at a price typically equivalent to normal selling price and in excess of the cost or carrying amount. Upon delivery, the Company records the present value of all payments under these leases as revenues, and the related costs of the product are charged to cost of sales. Interest income is recognized throughout the lease term (typically 3 years) using an implicit interest rate. Through December 31, 2010, lease sales have not been a significant portion of the Company’s total sales.
57
Table of Contents
KVH INDUSTRIES, INC. AND SUBSIDIARIES
NOTES TO CONSOLIDATED FINANCIAL STATEMENTS—(Continued)
December 31, 2010, 2009 and 2008
(in thousands except share and per share amounts)
| (1) | Summary of Significant Accounting Policies—(continued) |
Contracted service sales. Customer and government-agency contracted engineering service and grant sales under development contracts are recognized during the period in which the Company performs the service or development efforts in accordance with the agreement. Services performed under these types of contracts include engineering studies, surveys, prototype development and program management. Performance is determined principally by comparing the accumulated costs incurred to date with management’s estimate of the total cost to complete the contracted work. Costs and recognized proportionate income not yet billed are recognized within the accompanying consolidated balance sheets in the caption “prepaid expenses and other assets.”
Sales related to customer contracts that call for standard product modification or enhancement are recognized upon the complete delivery and title transfer of all customer-approved products. Costs of contracts in progress are accumulated within the accompanying consolidated balance sheets in the caption “prepaid expenses and other assets” and relieved upon product delivery or when billed.
Revisions to costs and income estimates are reflected in the period in which the facts that require revision become known. Any advance payments arising from such extended-term development contracts are recorded as deposits. If, in any period, estimated total costs under a contract indicate an expected loss, then such loss is provided for in that period. Through December 31, 2010, contracted service revenue has not been a significant portion of the Company’s total sales.
Product service sales. Product service sales other than under development contracts are recognized when completed services are provided to the customer and collectability is reasonably assured. The Company establishes reserves for potential sales returns, credit and allowances, and evaluates, on a monthly basis, the adequacy of those reserves based upon historical experience and its expectations for the future. Through December 31, 2010, product service sales have not been a significant portion of the Company’s total sales.
DIRECTV and DISH Network subsidies and commissions. One-time subsidies and new mobile account activation fees from DIRECTV or DISH Network for customers who activate their DIRECTV or DISH Network service directly through KVH are recognized in the month of activation. The Company establishes reserves for potential credits for early customer cancellations, on a quarterly basis. The adequacy of those reserves is based upon historical experience. Through December 31, 2010, such payments from DIRECTV and DISH Network have not been a significant portion of the Company’s total sales.
Extended warranty sales. The Company sells extended warranty contracts on mobile communications and guidance and stabilization products. Sales under these contracts are recognized ratably over the contract term. Through December 31, 2010, warranty sales have not been a significant portion of the Company’s total sales.
| (f) | Fair Value of Financial Instruments |
The carrying amounts of the Company’s financial instruments, which include cash equivalents, marketable securities, investments, accounts receivable, accounts payable and accrued expenses approximate their fair values due to the short maturity of these instruments. The carrying amount of the Company’s mortgage loan approximates fair value based on currently available quoted rates of similarly structured mortgage facilities. See note 2 for more information on the fair value of the Company’s marketable securities.
58
Table of Contents
KVH INDUSTRIES, INC. AND SUBSIDIARIES
NOTES TO CONSOLIDATED FINANCIAL STATEMENTS—(Continued)
December 31, 2010, 2009 and 2008
(in thousands except share and per share amounts)
| (1) | Summary of Significant Accounting Policies—(continued) |
| (g) | Cash, Cash Equivalents and Marketable Securities |
In accordance with the Company’s investment policy, cash in excess of operational needs is invested in money market funds, United States treasuries, investment grade asset-backed corporate securities, certificates of deposit and government and non-government debt securities, which are reflected within marketable securities in the accompanying consolidated balance sheets. The Company considers all highly liquid investments, not included within marketable securities, with an original maturity of ninety days or less, as of the date of purchase, to be cash equivalents. The Company determines the appropriate classification of marketable securities at each balance sheet date. As of December 31, 2010 and 2009, all of the Company’s marketable securities have been designated as available-for-sale and are carried at their fair value with unrealized gains and losses included in accumulated other comprehensive income in the accompanying consolidated balance sheets.
The Company reviews investments in debt securities for other than temporary impairment whenever the fair value of an investment is less than amortized cost and evidence indicates that an investment’s carrying amount is not recoverable within a reasonable period of time. To determine whether an impairment is other-than-temporary, the Company considers whether it intends to sell the security, whether it expects to recover the credit loss, and if it is more likely than not that the Company will be required to sell the security prior to recovery. Evidence considered in this assessment includes the reasons for the impairment, compliance with the Company’s investment policy, the severity and duration of the impairment, changes in value subsequent to year-end and forecasted performance of the investee. The Company has reviewed its securities with unrealized losses as of December 31, 2010 and 2009, and has concluded that no other-than-temporary impairments exist.
| (h) | Inventories |
Inventories are stated at the lower of cost or market using the first-in first-out costing method. The Company provides inventory reserves based on excess and obsolete inventory determined primarily by future demand forecasts. The Company records inventory charges to costs of product sales.
| (i) | Property and Equipment |
Property and equipment are stated at cost. Depreciation and amortization are computed on the straight-line method over the estimated useful lives of the respective assets. The principal lives used in determining the depreciation rates of various assets are: buildings and improvements, 5-40 years; leasehold improvements, over the shorter of the asset’s useful life or the term of the lease; machinery, satellite hubs and equipment, 5-10 years; office and computer equipment, 3-7 years; and motor vehicles, 5 years.
| (j) | Goodwill and Long-lived Assets |
All of the Company’s goodwill and intangible assets are associated with the purchase of Virtek Communication in September 2010.
Goodwill is recorded when the consideration for an acquisition exceeds the fair value of net tangible and identifiable intangible assets acquired. Goodwill is not amortized, but instead is tested for impairment at least annually, or if indicators of potential impairment exist by comparing the fair value of the Company’s reporting unit to its carrying value. The Company estimates the fair value of the Virtek Communication reporting unit
59
Table of Contents
KVH INDUSTRIES, INC. AND SUBSIDIARIES
NOTES TO CONSOLIDATED FINANCIAL STATEMENTS—(Continued)
December 31, 2010, 2009 and 2008
(in thousands except share and per share amounts)
| (1) | Summary of Significant Accounting Policies—(continued) |
using a discounted cash flow model or other valuation models, such as comparative transactions and market multiples. The Company expects to perform an annual impairment test on August 31 of each year. No indicators of potential goodwill impairment were identified during 2010.
Intangible assets are comprised of intellectual property, which is amortized over its estimated useful life of seven years. Intangible assets are reviewed for impairment when events or changes in circumstances indicate that their carrying amounts may not be recoverable based upon the estimated undiscounted cash flows. No events or changes in circumstances indicated that any of the carrying amounts of the Company’s intangible assets may not be recoverable during 2010.
Intangible assets with estimated lives and other long-lived assets are reviewed for impairment when events or changes in circumstances indicate that the carrying amount of an asset may not be recoverable. Recoverability of intangible assets with estimated lives and other long-lived assets is measured by a comparison of the carrying amount of an asset or asset group to future net undiscounted cash flows expected to be generated by the asset or asset group. If these comparisons indicate that an asset is not recoverable, the Company will recognize an impairment loss for the amount by which the carrying value of the asset or asset group exceeds the related estimated fair value. Estimated fair value is based on either discounted future operating cash flows or appraised values, depending on the nature of the asset. See note 9 for further discussion of goodwill and intangible assets.
| (k) | Other Non-Current Assets |
Other non-current assets are primarily comprised of the long-term portion of deferred research and development costs associated with an aviation antenna development and production agreement, long-term lease receivable, prepaid expenses and deposits. See note 14 for more information on the Company’s long-term aviation antenna development and production agreement.
| (l) | Product Warranty |
The Company’s products carry limited warranties that range from one to four years and vary by product. The warranty period begins on the date of retail purchase or lease by the original purchaser. The Company accrues estimated product warranty costs at the time of sale and any additional amounts are recorded when such costs are probable and can be reasonably estimated. Factors that affect the Company’s warranty liability include the number of units sold or leased, historical and anticipated rates of warranty repairs and the cost per repair. Warranty and related costs are reflected within sales, marketing and support in the accompanying statements of operations. As of December 31, 2010 and 2009, the Company had accrued product warranty costs of $887 and $1,084, respectively. The following table summarizes product warranty activity during 2010 and 2009:
| 2010 | 2009 | |||||||
| Beginning balance |
$ | 1,084 | $ | 1,139 | ||||
| Charges to expense |
512 | 701 | ||||||
| Costs incurred |
(709 | ) | (756 | ) | ||||
| Ending balance |
$ | 887 | $ | 1,084 | ||||
60
Table of Contents
KVH INDUSTRIES, INC. AND SUBSIDIARIES
NOTES TO CONSOLIDATED FINANCIAL STATEMENTS—(Continued)
December 31, 2010, 2009 and 2008
(in thousands except share and per share amounts)
| (1) | Summary of Significant Accounting Policies—(continued) |
| (m) | Shipping and Handling Costs |
Shipping and handling costs are expensed as incurred and included in cost of sales. Billings for shipping and handling are reflected within net sales in the accompanying statements of operations.
| (n) | Research and Development |
Expenditures for research and development, including customer-funded research and development, are expensed as incurred. Revenue from customer-funded research and development is included in service revenue and the related product development costs are included in costs of service and product sales. Revenue and related development costs from customer-funded research and development are as follows:
| Year ended December 31, | ||||||||||||
| 2010 | 2009 | 2008 | ||||||||||
| Customer-funded service sales |
$ | 1,062 | $ | 440 | $ | 1,286 | ||||||
| Customer-funded costs included in costs of service sales |
953 | 475 | 1,011 | |||||||||
| Customer-funded costs included in costs of product sales |
1,001 | 801 | — | |||||||||
In addition to the customer-funded research and development expenses listed above, the Company incurred a total of $0, $619 and $3,249 in research and development costs related to a long-term aviation antenna development and production agreement for the years ended December 31, 2010, 2009 and 2008, respectively. These research and development costs are reflected in other non-current assets, as the Company has a contractual right to recover these costs. See note 14 for further discussion.
| (o) | Advertising Costs |
Costs related to advertising are expensed as incurred. Advertising expense was $2,171, $2,261, and $2,072 for the years ended December 31, 2010, 2009 and 2008, respectively, and is included in sales, marketing, and support expense in the accompanying consolidated statements of operations.
| (p) | Foreign Currency Translation |
The financial statements of the Company’s foreign subsidiaries located in Denmark and Singapore are maintained using the United States dollar as the functional currency. Exchange rates in effect on the date of the transaction are used to record monetary assets and liabilities. Revenue and other expense elements are recorded at rates that approximate the rates in effect on the transaction dates. Realized foreign currency remeasurement gains and losses are recognized within “other income (expense)” in the accompanying consolidated statements of operations. For the years ended December 31, 2010, 2009 and 2008, the Company experienced foreign currency losses of $22, $58 and $6, respectively.
The financial statements of the Company’s Brazilian and Norwegian subsidiaries use the foreign subsidiaries’ respective local currencies as the functional currency. The Company translates the assets and liabilities of these foreign subsidiaries at the exchange rates in effect at year-end. Net sales, costs and expenses are translated using average exchange rates in effect during the year. Gains and losses from foreign currency translation are credited or charged to accumulated other comprehensive income included in stockholder’s equity in the accompanying consolidated balance sheets.
61
Table of Contents
KVH INDUSTRIES, INC. AND SUBSIDIARIES
NOTES TO CONSOLIDATED FINANCIAL STATEMENTS—(Continued)
December 31, 2010, 2009 and 2008
(in thousands except share and per share amounts)
| (1) | Summary of Significant Accounting Policies—(continued) |
| (q) | Income Taxes |
Income taxes are accounted for under the asset and liability method. Under the asset and liability method, deferred tax assets and liabilities are recognized for the future tax consequences attributable to differences between the financial statement carrying amounts of existing assets and liabilities and their respective tax bases.
Deferred tax assets and liabilities are measured using enacted tax rates expected to apply to taxable income in the years in which those temporary differences are expected to be recovered or settled. The effect on deferred tax assets and liabilities of a change in tax rates is recognized in income in the period that includes the enactment date. The Company records valuation allowances to reduce deferred income tax assets to the amount that is more likely than not to be realized. The Company determines whether it is more likely than not that a tax position will be sustained upon examination. If it is not more likely than not that a position will be sustained, no amount of the benefit attributable to the position is recognized. The tax benefit to be recognized of any tax position that meets the more likely than not recognition threshold is calculated as the largest amount that is more than 50% likely of being realized upon resolution of the contingency. See note 8 for further discussion of income taxes.
| (r) | Net Income (Loss) per Common Share |
Basic net income (loss) per share is calculated based on the weighted average number of common shares outstanding during the period. Diluted net income (loss) per share incorporates the dilutive effect of common stock equivalent options, warrants and other convertible securities, if any, as determined in accordance with the treasury stock accounting method. Common stock equivalents related to options and restricted stock awards for 196,076, 899,492, and 1,399,131 shares of common stock for the years ended December 31, 2010, 2009, and 2008, respectively, have been excluded from the fully diluted calculation of net income (loss) per share, as inclusion would be anti-dilutive.
A reconciliation of the basic and diluted weighted average common shares outstanding is as follows:
| 2010 | 2009 | 2008 | ||||||||||
| Weighted average common shares outstanding—basic |
14,419,599 | 13,996,363 | 14,372,626 | |||||||||
| Dilutive common shares issuable in connection with stock plans |
430,726 | — | 3,911 | |||||||||
| Weighted average common shares outstanding—diluted |
14,850,325 | 13,996,363 | 14,376,537 | |||||||||
| (s) | Contingent Liabilities |
The Company estimates the amount of potential exposure it may have with respect to claims, assessments and litigation in accordance with ASC 450, Contingencies. The Company is not party to any lawsuit or proceeding that, in management’s opinion, is likely to materially harm the Company’s business, results of operations, financial condition or cash flows, as described in note 18. It is not always possible to predict the outcome of litigation, as it is subject to many uncertainties. Additionally, it is not always possible for management to make a meaningful estimate of the potential loss or range of loss associated with such litigation. As of December 31, 2010, no losses have been accrued with respect to pending litigation.
62
Table of Contents
KVH INDUSTRIES, INC. AND SUBSIDIARIES
NOTES TO CONSOLIDATED FINANCIAL STATEMENTS—(Continued)
December 31, 2010, 2009 and 2008
(in thousands except share and per share amounts)
| (1) | Summary of Significant Accounting Policies—(continued) |
| (t) | Operating Segments |
The Company operates in a single segment. Operating segments are identified as components of an enterprise about which separate discrete financial information is available for evaluation by the chief operating decision maker in making decisions regarding resource allocation and assessing performance. To date, the chief operating decision maker has made such decisions and assessed performance at the company level, as one segment. The Company’s chief operating decision maker is its President, Chief Executive Officer and Chairman of the Board.
| (u) | Recent Accounting Pronouncements |
In October 2009, the Financial Accounting Standards Board, or FASB, issued new accounting guidance related to revenue recognition for arrangements with multiple deliverables. This guidance eliminates the residual method of allocation and requires the relative selling price method when allocating deliverables of a multiple deliverable revenue arrangement. The determination of the selling price for each deliverable requires the use of a hierarchy designed to maximize the use of available objective evidence, including vendor specific objective evidence, third party evidence of selling price, or estimated selling price. The guidance is effective prospectively for revenue arrangements entered into or materially modified in fiscal years beginning on or after June 15, 2010, and must be adopted in the same period using the same transition method. If adoption is elected in a period other than the beginning of a fiscal year, the amendments in these standards must be applied retrospectively to the beginning of the fiscal year. Full retrospective application of these amendments to prior fiscal years is optional. Early adoption of these standards may be elected. The Company adopted these standards effective January 1, 2010. The adoption of this guidance did not have a material impact on the Company’s financial position or results of operations.
In October 2009, the FASB issued new accounting guidance related to certain revenue arrangements that include software elements. Previously, companies that sold tangible products with “more than incidental” software were required to apply software revenue recognition guidance. This guidance often delayed revenue recognition for the delivery of the tangible product. Under the new guidance, tangible products that have software components that are “essential to the functionality” of the tangible product will be excluded from the software revenue recognition guidance. The new guidance will include factors to help companies determine what is “essential to the functionality.” Software-enabled products will now be subject to other revenue guidance and will likely follow the guidance for multiple element arrangements issued by the FASB in October 2009. The new guidance is to be applied on a prospective basis for revenue arrangements entered into or materially modified in fiscal years beginning on or after June 15, 2010, with earlier application permitted. If a vendor elects earlier application and the first reporting period of adoption is not the first reporting period in the vendor’s fiscal year, the guidance must be applied through retrospective application from the beginning of the vendor’s fiscal year and the vendor must disclose the effect of the change to those previously reported periods. The Company adopted this guidance effective January 1, 2010. The adoption of this guidance did not have a material impact on the Company’s financial position or results of operations.
In January 2010, the FASB issued ASU No. 2010-06, Improving Disclosures about Fair Value Measurements, which amended the disclosure requirements related to recurring and non-recurring fair value measurements. The guidance requires new disclosures on the transfers of assets and liabilities between those whose fair value is measured using Level 1 inputs (quoted prices in an active market for identical assets or
63
Table of Contents
KVH INDUSTRIES, INC. AND SUBSIDIARIES
NOTES TO CONSOLIDATED FINANCIAL STATEMENTS—(Continued)
December 31, 2010, 2009 and 2008
(in thousands except share and per share amounts)
| (1) | Summary of Significant Accounting Policies—(continued) |
liabilities) and using Level 2 inputs (significant other observable inputs) of the fair value measurement hierarchy, including the reasons and the timing of the transfers. Additionally, the guidance requires separate disclosure of purchases, sales, issuances and settlements of assets and liabilities measured using significant unobservable inputs (Level 3 fair value measurements). This standard is effective for all interim and year-end financial statements issued after January 1, 2010, except for the disclosure on the activities for Level 3 fair value measurements, which is effective for all interim and year-end financial statements issued after January 1, 2011. The Company does not currently expect the adoption of this guidance to have a material impact on its consolidated financial statements.
| (2) | Marketable Securities |
Included in marketable securities as of December 31, 2010 and 2009 are the following:
| December 31, 2010 |
Amortized Cost |
Gross Unrealized Gains |
Gross Unrealized Losses |
Fair Value |
||||||||||||
| Money market mutual funds |
$ | 14,607 | $ | — | $ | — | $ | 14,607 | ||||||||
| Government agency bonds |
11,020 | 1 | — | 11,021 | ||||||||||||
| Certificates of deposit |
2,572 | — | — | 2,572 | ||||||||||||
| Corporate notes |
1,865 | 1 | — | 1,866 | ||||||||||||
| Total marketable securities designated as available for sale |
$ | 30,064 | $ | 2 | $ | — | $ | 30,066 | ||||||||
| December 31, 2009 |
Amortized Cost |
Gross Unrealized Gains |
Gross Unrealized Losses |
Fair Value |
||||||||||||
| Government agency bonds |
$ | 12,038 | $ | 26 | $ | — | $ | 12,064 | ||||||||
| United States treasuries |
11,594 | 29 | — | 11,623 | ||||||||||||
| Money market mutual funds |
5,977 | — | — | 5,977 | ||||||||||||
| Government agency discount notes |
3,499 | — | — | 3,499 | ||||||||||||
| Certificates of deposit |
2,276 | — | (6 | ) | 2,270 | |||||||||||
| Total marketable securities designated as available for sale |
$ | 35,384 | $ | 55 | $ | (6 | ) | $ | 35,433 | |||||||
The amortized costs and fair value of debt securities as of December 31, 2010 and 2009 are shown below by effective maturity. Effective maturities may differ from contractual maturities because the issuers of the securities may have the right to prepay obligations without prepayment penalties.
| December 31, 2010 |
Amortized Cost |
Fair Value |
||||||
| Due in less than one year |
$ | 19,432 | $ | 19,432 | ||||
| Due after one year and within two years |
10,632 | 10,634 | ||||||
| $ | 30,064 | $ | 30,066 | |||||
64
Table of Contents
KVH INDUSTRIES, INC. AND SUBSIDIARIES
NOTES TO CONSOLIDATED FINANCIAL STATEMENTS—(Continued)
December 31, 2010, 2009 and 2008
(in thousands except share and per share amounts)
| (2) | Marketable Securities—(continued) |
| December 31, 2009 |
Amortized Cost |
Fair Value |
||||||
| Due in less than one year |
$ | 25,352 | $ | 25,379 | ||||
| Due after one year and within two years |
10,032 | 10,054 | ||||||
| $ | 35,384 | $ | 35,433 | |||||
No realized gains or losses were recognized on the Company’s marketable securities during the year ended December 31, 2010 and 2009.
| (3) | Inventories |
Inventories as of December 31, 2010 and 2009 include the costs of material, labor, and factory overhead. Inventories consist of the following:
| December 31, | ||||||||
| 2010 | 2009 | |||||||
| Raw materials |
$ | 10,191 | $ | 9,121 | ||||
| Work in process |
1,369 | 1,118 | ||||||
| Finished goods |
3,205 | 3,148 | ||||||
| $ | 14,765 | $ | 13,387 | |||||
| (4) | Property and Equipment |
Property and equipment, net, as of December 31, 2010 and 2009 consist of the following:
| December 31, | ||||||||
| 2010 | 2009 | |||||||
| Land |
$ | 1,802 | $ | 807 | ||||
| Building and improvements |
9,417 | 5,761 | ||||||
| Leasehold improvements |
206 | 2,237 | ||||||
| Machinery and equipment |
25,914 | 21,069 | ||||||
| Office and computer equipment |
9,157 | 7,340 | ||||||
| Motor vehicles |
66 | 66 | ||||||
| 46,562 | 37,280 | |||||||
| Less accumulated depreciation |
(23,518 | ) | (21,503 | ) | ||||
| $ | 23,044 | $ | 15,777 | |||||
Depreciation for the years ended December 31, 2010, 2009 and 2008 amounted to $3,744, $2,654, and $2,512, respectively.
65
Table of Contents
KVH INDUSTRIES, INC. AND SUBSIDIARIES
NOTES TO CONSOLIDATED FINANCIAL STATEMENTS—(Continued)
December 31, 2010, 2009 and 2008
(in thousands except share and per share amounts)
| (5) | Debt and Line of Credit |
On April 6, 2009, the Company entered into a mortgage loan in the amount of $4,000 related to its headquarters facility in Middletown, Rhode Island. The loan term is 10 years, with a principal amortization of 20 years, and the interest rate will be a rate per year adjusted periodically based on a defined interest period equal to the BBA LIBOR Rate plus 2.25 percentage points. Land, building and improvements with a carrying value of $4,963 as of December 31, 2010 secure the mortgage loan. The monthly mortgage payment is approximately $9 plus interest and increases in increments of approximately $1 each year throughout the life of the mortgage. Due to the difference in the term of the loan and amortization of the principal, a balloon payment of $2,551 is due on April 1, 2019. The loan contains one financial covenant, a Fixed Charge Coverage Ratio, which applies in the event that the Company’s consolidated cash, cash equivalents and marketable securities balance falls below $25,000 at any time. As the Company’s consolidated cash, cash equivalents and marketable securities balance was above $25,000 throughout 2010, the Fixed Charge Coverage Ratio did not apply. Under the mortgage loan the Company may prepay its outstanding loan balance subject to certain early termination charges as defined in the mortgage loan agreement. If the Company were to default on its mortgage loan, the land, building and improvements would be used as collateral.
The following is a summary of future principal payments under the mortgage:
| Year ending December 31, |
Principal Payment |
|||
| 2011 |
124 | |||
| 2012 |
131 | |||
| 2013 |
138 | |||
| 2014 |
146 | |||
| 2015 |
154 | |||
| Thereafter |
3,114 | |||
| Total outstanding at December 31, 2010 |
$ | 3,807 | ||
Currently, the Company has a revolving loan agreement with a bank that provides for a maximum available credit of $15,000 and will expire on December 31, 2011. The Company pays interest on any outstanding amounts at a rate equal to, at the Company’s option, BBA LIBOR Daily Floating Rate plus 1.75%, or the Eurodollar Rate plus 1.75%. The line of credit contains two financial covenants, a Leverage Ratio and a Fixed Charge Coverage Ratio, that apply in the event that the Company’s consolidated cash, cash equivalents and marketable securities balance falls below $25,000 at any time. As the Company’s consolidated cash, cash equivalents and marketable securities balance was above $25,000 throughout 2010, the Fixed Charge Coverage Ratio did not apply. The Company may terminate the loan agreement prior to its full term without penalty, provided it gives 30 days advance written notice to the bank. As of December 31, 2010 and December 31, 2009, no borrowings were outstanding under the facility.
Total commitment fees related to the line of credit were $61, $49, and $16 for the years ended December 31, 2010, 2009 and 2008, respectively.
66
Table of Contents
KVH INDUSTRIES, INC. AND SUBSIDIARIES
NOTES TO CONSOLIDATED FINANCIAL STATEMENTS—(Continued)
December 31, 2010, 2009 and 2008
(in thousands except share and per share amounts)
| (6) | Commitments and Contingencies |
The Company has certain operating leases for satellite capacity, various equipment, and facilities. The following reflects future minimum payments under operating leases that have initial or remaining non-cancelable lease terms at December 31, 2010:
| Years ending December 31, |
Operating Leases |
|||
| 2011 |
$ | 8,028 | ||
| 2012 |
7,571 | |||
| 2013 |
7,282 | |||
| 2014 |
5,338 | |||
| 2015 |
2,349 | |||
| Thereafter |
157 | |||
| Total minimum lease payments |
$ | 30,725 | ||
Total rent expense incurred under facility operating leases for the years ended December 31, 2010, 2009 and 2008 amounted to $754, $903, and $929, respectively.
In the normal course of business, the Company enters into unconditional purchase order obligations with its suppliers for inventory and other operational purchases. Outstanding and unconditional purchase order obligations, which generally are for a period of less than one year, were $23,015 as of December 31, 2010.
The Company did not enter into any off-balance sheet commitments, guarantees, or standby repurchase obligations as of December 31, 2010.
| (7) | Stockholders’ Equity |
| (a) | Employee Stock Options |
Options are granted with an exercise price equal to the fair market value of the common stock on the date of grant and generally vest in equal annual amounts over four years beginning on the first anniversary of the date of the grant. No options are exercisable for periods of more than 5 years after date of grant. Under the Company’s Amended and Restated 2006 Stock Incentive Plan, each share issued under awards other than options will reduce the number of shares reserved for issuance by two shares. Shares issued under options will reduce the shares reserved for issuance on a share-for-share basis. All plans were approved by the Company’s shareholders, pursuant to which 7,165,000 shares of the Company’s common stock were reserved for issuance. As of December 31, 2010, 5,122,622 options and awards to purchase shares of common stock had been issued or expired and 2,042,378 were available for future grants. The Compensation Committee of the Board of Directors administers the plans, approves the individuals to whom options will be granted and determines the number of shares and exercise price of each option. Outstanding options under the plans at December 31, 2010 expire from February 2011 through December 2015. None of the Company’s outstanding options includes performance-based or market-based vesting conditions as of December 31, 2010.
The Company has estimated the fair value of each option grant on the date of grant using the Black-Scholes option-pricing model. The expected volatility assumption is based on the historical daily price data of the Company’s common stock over a period equivalent to the weighted average expected life of the Company’s
67
Table of Contents
KVH INDUSTRIES, INC. AND SUBSIDIARIES
NOTES TO CONSOLIDATED FINANCIAL STATEMENTS—(Continued)
December 31, 2010, 2009 and 2008
(in thousands except share and per share amounts)
(7) Stockholders’ Equity—(continued)
options. The expected term of options granted is derived using assumed exercise rates based on historical exercise patterns and represents the period of time the options granted are expected to be outstanding. The risk-free interest rate is based on the actual U.S. Treasury zero-coupon rates for bonds matching the expected term of the option as of the option grant date. The dividend yield of zero is based upon the fact that the Company has not historically declared or paid cash dividends, and does not expect to declare or pay dividends in the foreseeable future.
The per share weighted-average fair values of stock options granted during 2010, 2009 and 2008 were $6.54, $3.34, and $2.61, respectively. The weighted-average assumptions used to value options as of their grant date were as follows:
| Year Ended December 31, |
||||||||||||
| 2010 | 2009 | 2008 | ||||||||||
| Risk-free interest rate |
0.95 | % | 2.18 | % | 2.75 | % | ||||||
| Expected volatility |
60.0 | % | 44.7 | % | 36.0 | % | ||||||
| Expected life (in years) |
4.18 | 4.08 | 4.08 | |||||||||
| Dividend yield |
0 | % | 0 | % | 0 | % | ||||||
The changes in outstanding stock options for the year ended December 31, 2010, is as follows:
| Number of Options | Weighted Average Exercise Price |
Weighted Average Remaining Contractual Life (in Years) |
Aggregate Intrinsic Value |
|||||||||||||
| Outstanding at December 31, 2009 |
925,242 | $ | 10.02 | |||||||||||||
| Granted |
141,275 | 13.86 | ||||||||||||||
| Exercised |
(357,241 | ) | 10.32 | |||||||||||||
| Expired, canceled or forfeited |
(12,475 | ) | 9.71 | |||||||||||||
| Outstanding at December 31, 2010 |
696,801 | $ | 10.65 | 2.28 | $ | 1,254 | ||||||||||
| Exercisable at December 31, 2010 |
416,710 | $ | 10.06 | 1.44 | $ | 851 | ||||||||||
The total intrinsic value of options exercised was $1,157, $382, and $2 in 2010, 2009, and 2008, respectively. The total aggregate intrinsic value of options exercisable at December 31, 2009 and 2008 was $3 and $19, respectively. The total aggregate intrinsic value of options outstanding at December 31, 2009 and 2008 was $4 and $20, respectively.
As of December 31, 2009 and 2008, the number of options exercisable was 623,019 and 762,198, respectively and the weighted average exercise price of those options was $10.15 and $10.78 per share, respectively. The weighted average remaining contractual term for options exercisable at December 31, 2009 and 2008 was 1.57 and 1.75 years, respectively. The weighted average remaining contractual term for options outstanding at December 31, 2009 and 2008 was 1.99 and 2.21 years, respectively.
As of December 31, 2010, there was $947 of total unrecognized compensation expense related to stock options, which is expected to be recognized over a weighted-average period of 2.54 years. In 2010, 2009 and
68
Table of Contents
KVH INDUSTRIES, INC. AND SUBSIDIARIES
NOTES TO CONSOLIDATED FINANCIAL STATEMENTS—(Continued)
December 31, 2010, 2009 and 2008
(in thousands except share and per share amounts)
| (7) | Stockholders’ Equity—(continued) |
2008, the Company recorded compensation charges of $514, $823 and $1,149, respectively, related to stock options. Compensation cost for options subject only to service conditions that vest ratably are recognized on a straight-line basis over the requisite service period for the entire award. During 2010, 2009 and 2008, cash received under stock option plans for exercises was $3,685, $1,424 and $16, respectively.
| (b) | Restricted Stock |
The Company granted 324,321, 567,008 and 298,709 restricted stock awards to employees under the terms of the Amended and Restated 2006 Stock Incentive Plan for the years ended December 31, 2010, 2009 and 2008, respectively. The restricted stock awards vest annually over four years from the date of grant subject to the recipient remaining an employee through the applicable vesting dates. Compensation expense for restricted stock awards is measured at fair value on the date of grant based on the number of shares granted and the quoted market closing price of the Company’s common stock. Such value is recognized as expense over the vesting period of the award, net of estimated forfeitures. The weighted-average grant-date fair value of restricted stock granted during 2010, 2009 and 2008 was $13.12, $5.11 and $8.61 per share, respectively.
A total of 75,000 of the restricted stock awards granted during the year ended December 31, 2010 were performance-based awards granted to executives. These awards will vest ratably over four years from date of grant, as the Company achieved the necessary objectives as of December 31, 2010. As a result, the Company recorded expense for the year ended December 31, 2010 related to the performance-based restricted stock awards, the amount of which was not material.
As of December 31, 2010, there was $4,443 of total unrecognized compensation expense related to restricted stock awards, which is expected to be recognized over a weighted-average period of 2.48 years. Compensation cost for awards subject only to service conditions that vest ratably are recognized on a straight-line basis over the requisite service period for the entire award. In 2010, 2009 and 2008, the Company recorded compensation charges of $1,942, $853 and $317, respectively, related to restricted stock awards.
Restricted stock activity under the Amended and Restated 2006 Stock Incentive Plan for 2010 is as follows:
| Number of Shares |
Weighted- average grant date fair value |
|||||||
| Outstanding at December 31, 2009, nonvested |
599,502 | $ | 6.02 | |||||
| Granted |
324,321 | 13.12 | ||||||
| Vested |
(193,312 | ) | 6.77 | |||||
| Forfeited |
(1,975 | ) | 8.08 | |||||
| Outstanding at December 31, 2010, nonvested |
728,536 | $ | 8.97 | |||||
| (c) | Employee Stock Purchase Plan |
Under the Company’s Amended and Restated Employee Stock Purchase Plan (ESPP), the Company is authorized to issue up to 600,000 shares of common stock, of which 102,026 shares remain available as of December 31, 2010.
69
Table of Contents
KVH INDUSTRIES, INC. AND SUBSIDIARIES
NOTES TO CONSOLIDATED FINANCIAL STATEMENTS—(Continued)
December 31, 2010, 2009 and 2008
(in thousands except share and per share amounts)
| (7) | Stockholders’ Equity—(continued) |
The ESPP covers all of the Company’s employees. Under the terms of the ESPP, eligible employees can elect to have up to six percent of their pre-tax compensation withheld to purchase shares of the Company’s common stock on a semi-annual basis. The ESPP allows eligible employees the right to purchase the Company’s common stock on a semi-annual basis at 85% of the market price at the end of each purchase period. During 2010, 2009 and 2008, 21,654, 37,011, and 40,511 shares, respectively, were issued under this plan. The Company utilizes the Black-Scholes option-pricing model to calculate the fair value of these discounted purchases. The fair value of the 15% discount is recognized as compensation expense over the purchase period. The Company applies a graded vesting approach because the ESPP provides for multiple purchase periods and is, in substance, a series of linked awards. In 2010, 2009 and 2008, the Company recorded compensation charges of $68, $58 and $80, respectively, related to the ESPP. During 2010, 2009 and 2008, cash received under the ESPP was $260, $238 and $258, respectively.
| (8) | Income Taxes |
Income tax (benefit) expense for the years ended December 31, 2010, 2009 and 2008 attributable to income (loss) from operations is presented below.
| Current | Deferred | Total | ||||||||||
| Year ended December 31, 2010 |
||||||||||||
| Federal |
$ | 217 | $ | (2,142 | ) | $ | (1,925 | ) | ||||
| State |
136 | (998 | ) | (862 | ) | |||||||
| Foreign |
154 | 21 | 175 | |||||||||
| $ | 507 | $ | (3,119 | ) | $ | (2,612 | ) | |||||
| Year ended December 31, 2009 |
||||||||||||
| Federal |
$ | (317 | ) | $ | — | $ | (317 | ) | ||||
| State |
(65 | ) | — | (65 | ) | |||||||
| Foreign |
106 | 15 | 121 | |||||||||
| $ | (276 | ) | $ | 15 | $ | (261 | ) | |||||
| Year ended December 31, 2008 |
||||||||||||
| Federal |
$ | 38 | $ | — | $ | 38 | ||||||
| State |
126 | — | 126 | |||||||||
| Foreign |
499 | (15 | ) | 484 | ||||||||
| $ | 663 | $ | (15 | ) | $ | 648 | ||||||
70
Table of Contents
KVH INDUSTRIES, INC. AND SUBSIDIARIES
NOTES TO CONSOLIDATED FINANCIAL STATEMENTS—(Continued)
December 31, 2010, 2009 and 2008
(in thousands except share and per share amounts)
(8) Income Taxes—(continued)
The actual income tax (benefit) expense differs from the “expected” income tax (benefit) expense computed by applying the United States Federal corporate income tax rate of 35% to income (loss) before (benefit) expense as follows:
| Year Ended December 31, | ||||||||||||
| 2010 | 2009 | 2008 | ||||||||||
| Computed “expected” tax expense (benefit) |
$ | 1,981 | $ | (134 | ) | $ | 1,261 | |||||
| (Decrease) increase in income taxes resulting from: |
||||||||||||
| State income tax expense, net of federal benefit |
636 | 82 | 144 | |||||||||
| State research and development credits |
(342 | ) | (953 | ) | (456 | ) | ||||||
| Non-deductible expenses |
268 | 60 | 91 | |||||||||
| Foreign tax rate differential |
(28 | ) | (25 | ) | (27 | ) | ||||||
| Federal research and development credits |
(378 | ) | (2,634 | ) | (350 | ) | ||||||
| Adjustments to operating loss carry-forwards and other deferred taxes, net |
(346 | ) | 614 | (115 | ) | |||||||
| Stock-based compensation |
146 | — | — | |||||||||
| Change in valuation allowance |
(4,549 | ) | 2,729 | 100 | ||||||||
| Net income tax (benefit) expense |
$ | (2,612 | ) | $ | (261 | ) | $ | 648 | ||||
The components of results of income (loss) from operations before income tax (benefit) provision, determined by tax jurisdiction, are as follows:
| Year Ended December 31, | ||||||||||||
| 2010 | 2009 | 2008 | ||||||||||
| United States |
$ | 5,458 | $ | (871 | ) | $ | 1,952 | |||||
| Denmark |
390 | 477 | 1,754 | |||||||||
| Norway |
61 | — | — | |||||||||
| Brazil |
(260 | ) | — | — | ||||||||
| Singapore |
12 | — | — | |||||||||
| Total |
$ | 5,661 | $ | (394 | ) | $ | 3,706 | |||||
71
Table of Contents
KVH INDUSTRIES, INC. AND SUBSIDIARIES
NOTES TO CONSOLIDATED FINANCIAL STATEMENTS—(Continued)
December 31, 2010, 2009 and 2008
(in thousands except share and per share amounts)
| (8) | Income Taxes—(continued) |
The tax effects of temporary differences that give rise to significant portions of deferred tax assets and liabilities for the periods presented are as follows:
| December 31, | ||||||||
| 2010 | 2009 | |||||||
| Deferred tax assets: |
||||||||
| Accounts receivable, due to allowance for doubtful accounts |
$ | 348 | $ | 442 | ||||
| Inventories |
226 | 554 | ||||||
| Operating loss carry-forwards |
1,443 | 2,045 | ||||||
| Stock-based compensation expense |
1,186 | 1,252 | ||||||
| Intangible assets due to differences in amortization |
81 | 77 | ||||||
| Research and development, alternative minimum tax credit carry-forwards |
3,428 | 3,176 | ||||||
| Foreign tax credit carry-forwards |
1,146 | 995 | ||||||
| State tax credit carry-forwards |
1,671 | 1,742 | ||||||
| Accrued expenses |
682 | 770 | ||||||
| Gross deferred tax assets |
10,211 | 11,053 | ||||||
| Less valuation allowance |
(2,304 | ) | (6,853 | ) | ||||
| Total deferred tax assets |
7,907 | 4,200 | ||||||
| Deferred tax liabilities: |
||||||||
| Purchased intangible assets |
(614 | ) | — | |||||
| Property and equipment, due to differences in depreciation |
(1,367 | ) | (849 | ) | ||||
| Total deferred tax liabilities |
(1,981 | ) | (849 | ) | ||||
| Net deferred tax assets |
$ | 5,926 | $ | 3,351 | ||||
| Net deferred tax asset—current |
$ | 944 | $ | 17 | ||||
| Net deferred tax asset—noncurrent |
$ | 4,982 | $ | 3,334 | ||||
As of December 31, 2010, the Company had federal net operating loss carry-forwards available to offset future taxable income of $4,777. The Company also had foreign net operating loss carry-forwards available to offset future foreign income of $420 with no expiration date. The federal net operating loss carry-forwards expire in years 2024 through 2030. The foreign net operating loss carry-forwards have no expiration. The tax benefit related to $4,777 of federal net operating loss carry-forwards would occur upon utilization of these deferred tax assets to reduce taxes payable and would result in a credit to additional paid-in capital within stockholders’ equity rather than the provision for income taxes.
As of December 31, 2010, the Company had federal research and development tax credit carry-forwards in the amount of $3,487 that expire in years 2021 through 2030, and foreign tax credit carry-forwards in the amount of $1,314 that expire in years 2015 through 2020. The Company also had alternative minimum tax credits of $73 that have no expiration date. As of December 31, 2010, the Company had state research and development tax credit carry-forwards in the amount of $2,440 that expire in years 2011 through 2017. The Company also had other state tax credit carry-forwards of $280 available to reduce future state tax expense that expire in years 2011 through 2017. The tax benefit related to $805 of federal and state tax credits would occur upon utilization of these deferred tax assets to reduce taxes payable and would result in a credit to additional paid-in capital within stockholders’ equity rather than the provision for income taxes.
72
Table of Contents
KVH INDUSTRIES, INC. AND SUBSIDIARIES
NOTES TO CONSOLIDATED FINANCIAL STATEMENTS—(Continued)
December 31, 2010, 2009 and 2008
(in thousands except share and per share amounts)
| (8) | Income Taxes—(continued) |
The Company’s ability to utilize these net operating loss carry-forwards and tax credit carry-forwards may be limited in the future if the Company experiences an ownership change pursuant to Internal Revenue Code Section 382. An ownership change occurs when the ownership percentages of 5% or greater stockholders change by more than 50% over a three-year period.
For the years ended December 31, 2010, 2009 and 2008, the Company generated income (loss) before income taxes of $5,661, $(394) and $2,870, respectively. In assessing the realizability of its net deferred tax assets, the Company considered whether it is more likely than not that some portion or all of the deferred tax assets will not be realized. The ultimate realization of deferred tax assets depends upon the generation of future taxable income during the periods in which those temporary differences become deductible. As of December 31, 2010, based upon an evaluation of the positive and negative evidence, the Company concluded that $3,286 of the deferred tax asset valuation allowance was no longer required, resulting in a remaining valuation allowance of $2,304 as of December 31, 2010. As part of the Company’s analysis, the Company evaluated, among other factors, its recent history of generating taxable income and its near-term forecasts of future taxable income and determined that it is more likely than not that it will be able to realize an additional $3,286 of the Company’s deferred tax assets over the next several years. After considering these factors, the Company concluded that a reversal of the valuation allowance was appropriate. For the year ended December 31, 2010, the Company has recorded valuation allowances of approximately $508 against certain state tax credits and foreign net operating loss carry-forwards, and intends to maintain the valuation allowance until sufficient evidence exists to support the reversal of the valuation allowance.
In addition, the Company continues to maintain a $1,796 valuation allowance against net operating losses and credits carryforwards attributed to tax deduction in excess of recognized compensation cost from employee stock compensation awards that existed as of the adoption of ASC 718, Compensation – Stock Compensation. The Company will recognize the net deferred tax asset and corresponding benefit to additional paid-in capital for these windfall tax benefits once such amounts reduce income taxes payable, in accordance with the requirements of ASC 718.
The Company’s income taxes currently payable for federal and state purposes have been reduced by the benefit of the tax deduction in excess of recognized compensation cost from employee stock compensation transactions in the amount of $479, which has been recorded as an increase to additional paid-in capital for the year ended December 31, 2010.
As of December 31, 2010, the Company has not provided for U.S. deferred income taxes on undistributed earnings of its foreign subsidiaries of approximately $2,626 since these earnings are to be indefinitely reinvested. Upon distribution of those earnings in the form of dividends or otherwise, the Company will be subject to additional U.S. and state income taxes (less foreign tax credits), as well as withholding taxes in its foreign locations. The amount of taxes attributable to the undistributed earnings is not practicably determinable.
The Company establishes reserves for uncertain tax positions based on management’s assessment of exposure associated with tax deductions, permanent tax differences and tax credits. The tax reserves are analyzed periodically and adjustments are made as events occur to warrant adjustment to the reserve.
The Company did not have any material unrecognized tax benefits at December 31, 2010, 2009 or 2008. The Company’s policy is to recognize interest and penalties related to unrecognized tax benefits as a component of
73
Table of Contents
KVH INDUSTRIES, INC. AND SUBSIDIARIES
NOTES TO CONSOLIDATED FINANCIAL STATEMENTS—(Continued)
December 31, 2010, 2009 and 2008
(in thousands except share and per share amounts)
| (8) | Income Taxes—(continued) |
income tax expense. The Company’s tax jurisdictions include the United States, Denmark, Brazil, Norway and Singapore. In general, the statute of limitations with respect to the Company’s United States federal income taxes has expired for years prior to 2007, and the relevant state and foreign statutes vary. However, preceding years remain open to examination by United States Federal and state and foreign taxing authorities to the extent of future utilization of net operating losses and research and development tax credits generated in each preceding year. The Company is no longer subject to income tax examinations by the Danish tax authorities for years prior to 2007.
| (9) | Goodwill and Intangible Assets |
On September 13, 2010, the Company’s Danish subsidiary, KVH Europe A/S, completed the purchase of Virtek Communication for approximately $6.5 million. The purchase was made using existing cash, cash equivalents and marketable securities. In connection with this acquisition, the Company recorded $4,517 of goodwill, primarily related to expected synergies from combining operations and the value of the existing workforce, and $2,372 of intangible assets related to intellectual property.
| December 31, 2010 |
Useful Life | Cost | Accumulated Amortization |
Net Carrying Value |
||||||||||||
| Intellectual property |
7 years | $ | 2,372 | $ | 101 | $ | 2,271 | |||||||||
The Company amortizes its intangible assets over the estimated useful lives of the respective assets. Amortization expense related to intangible assets was $101 in the year ended December 31, 2010.
Estimated future amortization expense for intangible assets recorded by the Company at December 31, 2010 is as follows:
| Years ending December 31, |
Amortization Expense |
|||
| 2011 |
$ | 339 | ||
| 2012 |
339 | |||
| 2013 |
339 | |||
| 2014 |
339 | |||
| 2015 |
339 | |||
| Thereafter |
575 | |||
| Total amortization expense |
$ | 2,271 | ||
Goodwill is recorded when the consideration for an acquisition exceeds the fair value of net tangible and identifiable intangible assets acquired. The changes in the carrying amount of goodwill during the year ended December 31, 2010 is as follows:
| 2010 | ||||
| Balance at January 1 |
$ | — | ||
| Goodwill acquired during the year |
4,346 | |||
| Foreign currency translation adjustment |
171 | |||
| Balance at December 31 |
$ | 4,517 | ||
74
Table of Contents
KVH INDUSTRIES, INC. AND SUBSIDIARIES
NOTES TO CONSOLIDATED FINANCIAL STATEMENTS—(Continued)
December 31, 2010, 2009 and 2008
(in thousands except share and per share amounts)
| (10) | 401(k) Plan |
The Company has a 401(k) Plan (the Plan) for all eligible employees. Participants may defer a portion of their pre-tax earnings subject to limits determined by the Internal Revenue Service. Participants age 50 or older may be eligible to make additional contributions. As of December 31, 2010, the Company matches one half of the first 4% contributed by the Plan participants. The Company’s contributions vest over a five-year period from the date of hire. Total Company matching contributions were $326, $262 and $301 for the years ended December 31, 2010, 2009, and 2008, respectively. In addition, the Company may make contributions to the Plan at the discretion of the Compensation Committee of the Board of Directors. There were no discretionary contributions in 2010, 2009, and 2008.
| (11) | Business and Credit Concentrations |
Significant portions of the Company’s net sales are as follows:
| Year Ended December 31, |
||||||||||||
| 2010 | 2009 | 2008 | ||||||||||
| Net sales to foreign customers outside the U.S. and Canada |
31.8 | % | 44.0 | % | 35.8 | % | ||||||
| Net sales to Kongsberg Defence & Aerospace AS (Kongsberg) |
14.1 | % | 15.1 | % | * | |||||||
| * | Represents less than 10% of net sales. |
Net sales to Kongsberg accounted for approximately 14% and 15% of the Company’s net sales for the years ended December 31, 2010 and 2009, respectively, and less than 10% of the Company’s net sales for the year ended December 31, 2008. In addition, net sales to a subcontractor to Kongsberg accounted for approximately 5% and 7% of the Company’s net sales for the years ended December 31, 2010 and 2009, respectively. The Company’s net sales to this subcontractor were immaterial for the year ended December 31, 2008. The terms and conditions of sales to Kongsberg and the subcontractor to Kongsberg are consistent with the Company’s standard terms and conditions of product sales as discussed in note 1 of the Company’s consolidated financial statements. As of December 31, 2010, Kongsberg had no outstanding receivable balances and the subcontractor to Kongsberg was current with all outstanding receivable balances. No other individual customer accounted for more than 10% of the Company’s net sales for the years ended December 31, 2010, 2009 and 2008, respectively.
| (12) | Segment Reporting |
Under common operational management, the Company designs, develops, manufactures and markets its navigation, guidance and stabilization and mobile communications products for use in a wide variety of applications. Products are generally sold directly to third-party consumer electronic dealers and retailers, original equipment manufacturers, government contractors or to U.S. and other foreign government agencies. Primarily, sales originating in the Americas consist of sales within the United States and Canada and, to a lesser extent, Mexico and some Latin and South American countries. The Americas’ sales also include all guidance and stabilization product sales throughout the world. Sales originating from the Company’s European and Asian subsidiaries principally consist of sales into all European countries, both inside and outside the European Union, as well as Africa, Asia/Pacific, the Middle East and India.
The Company operates in two geographic segments, exclusively in the mobile communications, navigation and guidance and stabilization equipment industry, which it considers to be a single business activity. The Company has two primary product categories: mobile communication and guidance and stabilization. Mobile communication sales and services include marine, land mobile, automotive, and aeronautical communication
75
Table of Contents
KVH INDUSTRIES, INC. AND SUBSIDIARIES
NOTES TO CONSOLIDATED FINANCIAL STATEMENTS—(Continued)
December 31, 2010, 2009 and 2008
(in thousands except share and per share amounts)
(12) Segment Reporting—(continued)
equipment and satellite-based voice, television and Broadband Internet connectivity services. Guidance and stabilization sales and services include sales of commercial and defense-related navigation and guidance and stabilization equipment based upon digital compass and fiber optic sensor technology. Mobile communication and guidance and stabilization sales also include development contract revenue.
The following table summarizes information regarding the Company’s operations by geographic segment:
| Sales Originating From | ||||||||||||
| Year ended December 31, 2010 |
Americas | Europe and Asia |
Total | |||||||||
| Mobile communication sales to the United States |
$ | 46,358 | $ | — | $ | 46,358 | ||||||
| Mobile communication sales to Canada |
571 | — | 571 | |||||||||
| Mobile communication sales to Europe |
524 | 10,398 | 10,922 | |||||||||
| Mobile communication sales to other geographic areas |
1,162 | 3,460 | 4,622 | |||||||||
| Guidance and stabilization sales to the United States |
24,262 | — | 24,262 | |||||||||
| Guidance and stabilization sales to Canada |
5,353 | — | 5,353 | |||||||||
| Guidance and stabilization sales to Europe |
17,368 | — | 17,368 | |||||||||
| Guidance and stabilization sales to other geographic areas |
2,787 | — | 2,787 | |||||||||
| Intercompany sales |
6,528 | 413 | 6,941 | |||||||||
| Subtotal |
104,913 | 14,271 | 119,184 | |||||||||
| Eliminations |
(6,528 | ) | (413 | ) | (6,941 | ) | ||||||
| Net sales |
$ | 98,385 | $ | 13,858 | $ | 112,243 | ||||||
| Segment net income |
$ | 8,201 | $ | 72 | $ | 8,273 | ||||||
| Depreciation and amortization |
$ | 3,711 | $ | 134 | $ | 3,845 | ||||||
| Total assets |
$ | 101,116 | $ | 14,082 | $ | 115,198 | ||||||
| Sales Originating From | ||||||||||||
| Year ended December 31, 2009 |
North America |
Europe | Total | |||||||||
| Mobile communication sales to the United States |
$ | 32,708 | $ | — | $ | 32,708 | ||||||
| Mobile communication sales to Canada |
568 | — | 568 | |||||||||
| Mobile communication sales to Europe |
4,262 | 8,637 | 12,899 | |||||||||
| Mobile communication sales to other geographic areas |
662 | 2,750 | 3,412 | |||||||||
| Guidance and stabilization sales to the United States |
17,233 | — | 17,233 | |||||||||
| Guidance and stabilization sales to Canada |
2,897 | — | 2,897 | |||||||||
| Guidance and stabilization sales to Europe |
15,382 | — | 15,382 | |||||||||
| Guidance and stabilization sales to other geographic areas |
3,961 | — | 3,961 | |||||||||
| Intercompany sales |
5,597 | 247 | 5,844 | |||||||||
| Subtotal |
83,270 | 11,634 | 94,904 | |||||||||
| Eliminations |
(5,597 | ) | (247 | ) | (5,844 | ) | ||||||
| Net sales |
$ | 77,673 | $ | 11,387 | $ | 89,060 | ||||||
| Segment net (loss) income |
$ | (489 | ) | $ | 356 | $ | (133 | ) | ||||
| Depreciation |
$ | 2,620 | $ | 34 | $ | 2,654 | ||||||
| Total assets |
$ | 92,823 | $ | 4,923 | $ | 97,746 | ||||||
76
Table of Contents
KVH INDUSTRIES, INC. AND SUBSIDIARIES
NOTES TO CONSOLIDATED FINANCIAL STATEMENTS—(Continued)
December 31, 2010, 2009 and 2008
(in thousands except share and per share amounts)
| (12) | Segment Reporting—(continued) |
| Sales Originating From | ||||||||||||
| Year ended December 31, 2008 |
North America |
Europe | Total | |||||||||
| Mobile communication sales to the United States |
$ | 37,414 | $ | — | $ | 37,414 | ||||||
| Mobile communication sales to Canada |
1,136 | — | 1,136 | |||||||||
| Mobile communication sales to Europe |
2,690 | 12,787 | 15,477 | |||||||||
| Mobile communication sales to other geographic areas |
771 | 4,892 | 5,663 | |||||||||
| Guidance and stabilization sales to the United States |
12,347 | — | 12,347 | |||||||||
| Guidance and stabilization sales to Canada |
1,971 | — | 1,971 | |||||||||
| Guidance and stabilization sales to Europe |
5,966 | — | 5,966 | |||||||||
| Guidance and stabilization sales to other geographic areas |
2,430 | — | 2,430 | |||||||||
| Intercompany sales |
11,655 | — | 11,655 | |||||||||
| Subtotal |
76,380 | 17,679 | 94,059 | |||||||||
| Eliminations |
(11,655 | ) | — | (11,655 | ) | |||||||
| Net sales |
$ | 64,725 | $ | 17,679 | $ | 82,404 | ||||||
| Segment net income |
$ | 1,788 | $ | 1,270 | $ | 3,058 | ||||||
| Depreciation |
$ | 2,181 | $ | 34 | $ | 2,215 | ||||||
| Total assets |
$ | 89,048 | $ | 4,710 | $ | 93,758 | ||||||
| (13) | Share Buyback Program |
On November 26, 2008, the Company’s Board of Directors authorized a program to repurchase up to one million shares of the Company’s common stock. As of December 31, 2010, 798,676 shares of the Company’s common stock remain available for repurchase under the authorized program. The repurchase program is funded using the Company’s existing cash, cash equivalents, marketable securities and future cash flows. Under the repurchase program, the Company, at management’s discretion, may repurchase shares on the open market from time to time, in privately negotiated transactions or block transactions, or through an accelerated repurchase agreement. The timing of such repurchases depends on availability of shares, price, market conditions, alternative uses of capital, and applicable regulatory requirements. The program may be modified, suspended or terminated at any time without prior notice. The repurchase program has no expiration date. There were no other repurchase programs outstanding during the year ended December 31, 2010, and no repurchase programs expired during the period.
During the years ended December 31, 2010, 2009 and 2008 the Company repurchased 0, 123,044 and 837,280 shares of its common stock in open market transactions at a cost of $0, $601 and $6,697, respectively.
| (14) | Long-Term Aviation Antenna Development and Production Agreement |
On February 18, 2008, the Company entered into a $20,055 long-term antenna development and production agreement (the “Agreement”) that was subsequently increased in 2009 to $20,896. Under the terms of the Agreement, the Company designs, develops, and manufactures DIRECTV-compatible satellite television antennas for use on narrowbody commercial aircraft operating in the United States. The Company began shipment of the antennas in the second quarter of 2009. As of December 31, 2010, the Company has incurred $4,669 in research and development costs related to this arrangement. In accordance with ASC 730, Research
77
Table of Contents
KVH INDUSTRIES, INC. AND SUBSIDIARIES
NOTES TO CONSOLIDATED FINANCIAL STATEMENTS—(Continued)
December 31, 2010, 2009 and 2008
(in thousands except share and per share amounts)
| (14) | Long-Term Aviation Antenna Development and Production Agreement—(continued) |
and Development, and the Agreement, these costs are capitalized as they are incurred and then expensed into costs of product sales as antennas are sold in proportion to the number of antennas delivered versus the total contractual antenna production requirement. The Company expensed $1,000 of aviation antenna research and development costs into costs of product sales during the year ended December 31, 2010. The net amount of $2,868 in remaining capitalized research and development costs are costs that the Company has a contractual right to recover, and are reflected in other non-current assets as of December 31, 2010.
(15) Comprehensive Income (Loss)
Comprehensive income (loss) includes net income (loss) and other comprehensive income (loss). Other comprehensive income (loss) includes the effects of unrealized gains or losses on available-for-sale marketable securities and currency translation adjustments that are separately included in accumulated other comprehensive (loss) income within stockholders’ equity as well as unrealized losses on derivatives. The Company’s comprehensive income (loss) for the periods presented is as follows:
| Year ended December 31, |
||||||||||||
| 2010 | 2009 | 2008 | ||||||||||
| Net income (loss) |
$ | 8,273 | $ | (133 | ) | $ | 3,058 | |||||
| Unrealized (loss) gain on available-for-sale securities |
(47 | ) | (80 | ) | 130 | |||||||
| Currency translation adjustment gain |
260 | — | — | |||||||||
| Unrealized loss on interest rate swaps |
(243 | ) | — | — | ||||||||
| Total comprehensive income (loss) |
$ | 8,243 | $ | (213 | ) | $ | 3,188 | |||||
| (16) | Fair Value Measurements |
Effective January 1, 2008, the Company adopted the required provisions of ASC 820, Fair Value Measurements and Disclosures. ASC 820 defines fair value as the exchange price that would be received for an asset or paid to transfer a liability (an exit price) in the principal or most advantageous market for the asset or liability in an orderly transaction between market participants on the measurement date. ASC 820 also establishes a fair value hierarchy, which requires an entity to maximize the use of observable inputs and minimize the use of unobservable inputs when measuring fair value. ASC 820 describes three levels of inputs that may be used to measure fair value:
| Level 1: | Unadjusted quoted prices in active markets that are accessible at the measurement date for identical, unrestricted assets or liabilities. The Company’s Level 1 assets are investments in money market mutual funds, government agency bonds, United States treasuries, certificates of deposit and corporate notes. | |
| Level 2: | Quoted prices for similar assets or liabilities in active markets; or observable prices that are based on observable market data, based on directly or indirectly market-corroborated inputs. The Company’s Level 2 liabilities are interest rate swaps. | |
| Level 3: | Unobservable inputs that are supported by little or no market activity, and are developed based on the best information available given the circumstances. The Company has no Level 3 assets. | |
78
Table of Contents
KVH INDUSTRIES, INC. AND SUBSIDIARIES
NOTES TO CONSOLIDATED FINANCIAL STATEMENTS—(Continued)
December 31, 2010, 2009 and 2008
(in thousands except share and per share amounts)
(16) Fair Value Measurements—(continued)
Assets and liabilities measured at fair value are based on one or more of four valuation techniques. The four valuation techniques are identified in the table below and are as follows:
| (a) | Market approach—prices and other relevant information generated by market transactions involving identical or comparable assets or liabilities |
| (b) | Cost approach—amount that would be required to replace the service capacity of an asset (replacement cost) |
| (c) | Income approach—techniques to convert future amounts to a single present amount based on market expectations (including present value techniques, option-pricing and excess earnings models) |
| (d) | The valuations of the interest rate swaps intended to mitigate the Company’s interest rate risk are determined with the assistance of a third party financial institution using widely accepted valuation techniques, including discounted cash flow analysis on the expected cash flows of each instrument. This analysis utilizes observable market-based inputs, including interest rate curves and interest rate volatility, and reflects the contractual terms of these instruments, including the period to maturity. |
The following tables present financial assets at December 31, 2010 and December 31, 2009 for which the Company measures fair value on a recurring basis, by level, within the fair value hierarchy:
| December 31, 2010 |
Total | Level 1 | Level 2 | Level 3 | Valuation Technique |
|||||||||||||||
| Assets |
||||||||||||||||||||
| Money market mutual funds |
$ | 14,607 | $ | 14,607 | $ | — | $ | — | (a | ) | ||||||||||
| Government agency bonds |
11,021 | 11,021 | — | — | (a | ) | ||||||||||||||
| Certificates of deposit |
2,572 | 2,572 | — | — | (a | ) | ||||||||||||||
| Corporate notes |
1,866 | 1,866 | — | — | (a | ) | ||||||||||||||
| Liabilities |
||||||||||||||||||||
| Interest rate swaps |
$ | 243 | $ | — | $ | 243 | $ | — | (d | ) | ||||||||||
| December 31, 2009 |
Total | Level 1 | Level 2 | Level 3 | Valuation Technique |
|||||||||||||||
| Assets |
||||||||||||||||||||
| Government agency bonds |
$ | 12,064 | $ | 12,064 | $ | — | $ | — | (a | ) | ||||||||||
| United States treasuries |
11,623 | 11,623 | — | — | (a | ) | ||||||||||||||
| Money market mutual funds |
5,977 | 5,977 | — | — | (a | ) | ||||||||||||||
| Government agency discount notes |
3,499 | 3,499 | — | — | (a | ) | ||||||||||||||
| Certificates of deposit |
2,270 | 2,270 | — | — | (a | ) | ||||||||||||||
Certain financial instruments are carried at cost on the consolidated balance sheets, which approximates fair value due to their short-term, highly liquid nature. These instruments include cash and cash equivalents, accounts receivable, accounts payable and accrued expenses.
| (17) | Derivative Instruments and Hedging Activities |
Effective April 1, 2010, in order to reduce the volatility of cash outflows that arise from changes in interest rates, the Company entered into two interest rate swap agreements. These interest rate swap agreements are intended to hedge the Company’s mortgage loan related to its headquarters facility in Middletown, Rhode Island
79
Table of Contents
KVH INDUSTRIES, INC. AND SUBSIDIARIES
NOTES TO CONSOLIDATED FINANCIAL STATEMENTS—(Continued)
December 31, 2010, 2009 and 2008
(in thousands except share and per share amounts)
| (17) | Derivative Instruments and Hedging Activities—(continued) |
by fixing the interest rates specified in the mortgage loan to 5.91% for half of the principal amount outstanding and 6.07% for the remaining half of the principal amount outstanding as of April 1, 2010 until the mortgage loan expires on April 16, 2019.
As required by ASC Topic 815, Derivatives and Hedging, the Company records all derivatives on the balance sheet at fair value. As of December 31, 2010, the fair value of the derivatives is included in other accrued liabilities and the unrealized loss is included in other comprehensive income (loss).
As of December 31, 2010, the Company had the following outstanding interest rate derivatives that were designated as cash flow hedges of interest rate risk:
| Interest Rate Derivatives |
Notional (in thousands) |
Asset (Liability) |
Effective Date | Maturity Date | Index | Strike Rate | ||||||||||||||||||
| Interest rate swap |
$ | 1,904 | (111 | ) | April 1, 2010 | April 1, 2019 | 1-month LIBOR | 5.91 | % | |||||||||||||||
| Interest rate swap |
$ | 1,904 | (132 | ) | April 1, 2010 | April 1, 2019 | 1-month LIBOR | 6.07 | % | |||||||||||||||
| (18) | Legal Matters |
From time to time, the Company is involved in litigation incidental to the conduct of its business. In the ordinary course of business, KVH is a party to inquiries, legal proceedings and claims including, from time to time, disagreements with vendors and customers. The Company is not a party to any lawsuit or proceeding that, in management’s opinion, is likely to materially harm the Company’s business, results of operations, financial condition or cash flows.
| (19) | Quarterly Financial Results (Unaudited) |
Financial information for interim periods was as follows:
| First Quarter |
Second Quarter |
Third Quarter |
Fourth Quarter |
|||||||||||||
| (in thousands, except per share amounts) | ||||||||||||||||
| 2010 |
||||||||||||||||
| Product sales |
$ | 24,033 | $ | 24,379 | $ | 21,598 | $ | 22,049 | ||||||||
| Service sales |
3,948 | 5,118 | 6,165 | 4,953 | ||||||||||||
| Gross profit |
11,804 | 11,495 | 11,538 | 9,973 | ||||||||||||
| Net income |
$ | 2,066 | $ | 5,324 | $ | 637 | $ | 245 | ||||||||
| Net income per share (a): |
||||||||||||||||
| Basic |
$ | 0.15 | $ | 0.37 | $ | 0.04 | $ | 0.02 | ||||||||
| Diluted |
$ | 0.14 | $ | 0.36 | $ | 0.04 | $ | 0.02 | ||||||||
| 2009 |
||||||||||||||||
| Product sales |
$ | 15,565 | $ | 18,129 | $ | 18,620 | $ | 22,878 | ||||||||
| Service sales |
2,710 | 3,727 | 4,023 | 3,408 | ||||||||||||
| Gross profit |
5,498 | 7,779 | 8,936 | 10,097 | ||||||||||||
| Net (loss) income |
$ | (2,557 | ) | $ | 191 | $ | 385 | $ | 1,847 | |||||||
| Net (loss) income per share (a): |
||||||||||||||||
| Basic and diluted |
$ | (0.18 | ) | $ | 0.01 | $ | 0.03 | $ | 0.13 | |||||||
80
Table of Contents
KVH INDUSTRIES, INC. AND SUBSIDIARIES
NOTES TO CONSOLIDATED FINANCIAL STATEMENTS—(Continued)
December 31, 2010, 2009 and 2008
(in thousands except share and per share amounts)
(19) Quarterly Financial Results (Unaudited)—(continued)
| (a) | Net income (loss) per share is computed independently for each of the quarters. Therefore, the net income (loss) per share for the four quarters may not equal the annual income (loss) per share data. |
See note 8 for more information regarding the impact of a change in the valuation allowance for the Company’s deferred tax assets in the year ended December 31, 2010. See note 9 for information regarding the Company’s acquisition of Virtek Communication in the third quarter of 2010.
81