Attached files
| file | filename |
|---|---|
| EX-31.2 - EXHIBIT 31.2 - A. M. Castle & Co. | c13962exv31w2.htm |
| EX-32.1 - EXHIBIT 32.1 - A. M. Castle & Co. | c13962exv32w1.htm |
| EX-31.1 - EXHIBIT 31.1 - A. M. Castle & Co. | c13962exv31w1.htm |
| EX-23.1 - EXHIBIT 23.1 - A. M. Castle & Co. | c13962exv23w1.htm |
| EX-21.1 - EXHIBIT 21.1 - A. M. Castle & Co. | c13962exv21w1.htm |
Table of Contents
UNITED STATES
SECURITIES AND EXCHANGE COMMISSION
SECURITIES AND EXCHANGE COMMISSION
WASHINGTON, D.C. 20549
FORM 10-K
ANNUAL REPORT PURSUANT TO SECTION 13 OR 15(d) OF
THE SECURITIES EXCHANGE ACT OF 1934
THE SECURITIES EXCHANGE ACT OF 1934
| For the fiscal year ended December 31, 2010 | Commission File Number: 1-5415 |
A. M. CASTLE & CO.
(Exact name of registrant as specified in its charter)
| Maryland | 36-0879160 | |
| (State or other jurisdiction of | (I.R.S. Employer Identification No.) | |
| incorporation or organization) |
| 3400 North Wolf Road, Franklin Park, Illinois | 60131 | |
| (Address of principal executive offices) | (Zip Code) |
Registrant’s telephone number, including area code
(847) 455-7111
Securities registered pursuant to Section 12(b) of the Act:
| Title of each class | Name of each exchange on which registered | |
| Common Stock - $0.01 par value | New York Stock Exchange |
Securities registered pursuant to Section 12(g) of the Act: None
Indicate by check mark if the registrant is a well-known seasoned issuer, as defined in Rule 405 of
the Securities Act. Yes o No þ
Indicate by check mark if the registrant is not required to file reports pursuant to Section 13 or
15(d) of the Act.
Yes o No þ
Indicate by check mark whether the registrant (1) has filed all reports required to be filed by
Section 13 or 15(d) of the Securities Exchange Act of 1934 during the preceding 12 months (or for
such shorter period that the registrant was required to file such reports), and (2) has been
subject to such filing requirements for the past 90 days.
Yes
þ No o
Indicate by check mark whether the registrant has submitted electronically and posted on its
corporate Web site, if any, every Interactive Data File required to be submitted and posted
pursuant to Rule 405 of Regulation S-T during the preceding 12 months (or for such shorter period
that the registrant was required to submit and post such files). Yes
o No
o
Indicate by check mark if disclosure of delinquent filers pursuant to Item 405 of Regulation S-K is
not contained herein, and will not be contained, to the best of registrant’s knowledge, in
definitive proxy or information statements incorporated by reference in Part III of this Form 10-K
or any amendment to this Form 10-K. o
Indicate by check mark whether the registrant is a large accelerated filer, an accelerated filer, a
non-accelerated filer, or a smaller reporting company. See the definitions of “large accelerated
filer,” “accelerated filer” and “smaller reporting company” in Rule 12b-2 of the Exchange Act.
(check one):
| Large Accelerated Filer o | Accelerated Filer þ | Non-Accelerated Filer o | Smaller Reporting Company o |
Indicate by check mark whether the registrant is a shell company (as defined in Rule 12b-2 of the
Exchange Act). Yes o No þ
The aggregate market value of the voting and non-voting common equity held by non-affiliates
computed by reference to the price at which the common equity was last sold, or the average bid and
asked price of such common equity, as of the last business day of the registrant’s most recently
completed second fiscal quarter is $230,163,537.
The number of shares outstanding of the registrant’s common stock on March 1, 2011 was 22,979,410
shares.
DOCUMENTS INCORPORATED BY REFERENCE
| Documents Incorporated by Reference | Applicable Part of Form 10-K | |
Proxy Statement furnished to Stockholders in connection with registrant’s Annual Meeting of Stockholders to be held April 28, 2011. |
Part III |
TABLE OF CONTENTS
Table of Contents
Disclosure Regarding Forward-Looking Statements
Information provided and statements contained in this report that are not purely historical are
forward-looking statements within the meaning of Section 27A of the Securities Act of 1933, as
amended (“Securities Act”), Section 21E of the Securities Exchange Act of 1934, as amended
(“Exchange Act”), and the Private Securities Litigation Reform Act of 1995. Such forward-looking
statements only speak as of the date of this report and the Company assumes no obligation to update
the information included in this report. Such forward-looking statements include information
concerning our possible or assumed future results of operations, including descriptions of our
business strategy. These statements often include words such as “believe,” “expect,” “anticipate,”
“intend,” “predict,” “plan,” or similar expressions. These statements are not guarantees of
performance or results, and they involve risks, uncertainties, and assumptions. Although we
believe that these forward-looking statements are based on reasonable assumptions, there are many
factors that could affect our actual financial results or results of operations and could cause
actual results to differ materially from those in the forward-looking statements, including those
risk factors identified in Item 1A “Risk Factors” of this report. All future written and oral
forward-looking statements by us or persons acting on our behalf are expressly qualified in their
entirety by the cautionary statements contained or referred to above. Except for our ongoing
obligations to disclose material information as required by the federal securities laws, we do not
have any obligations or intention to release publicly any revisions to any forward-looking
statements to reflect events or circumstances in the future or to reflect the occurrence of
unanticipated events.
INDUSTRY AND MARKET DATA
In this report, we rely on and refer to information and statistics regarding the metal service
center industry and general manufacturing markets. We obtained this information and these
statistics from sources other than us, such as Purchasing magazine and the Institute of Supply
Management, which we have supplemented where necessary with information from publicly available
sources and our own internal estimates. We have used these sources and estimates and believe them
to be reliable.
PART I
| ITEM 1 | — Business |
In this annual report on Form 10-K, “the Company,” “we” or “our” refer to A. M. Castle & Co., a
Maryland corporation, and its subsidiaries included in the consolidated financial statements,
except as otherwise indicated or as the context otherwise requires.
Business and Markets
Company Overview
The Company is a specialty metals (89% of net sales) and plastics (11% of net sales) distribution
company serving customers on a global basis. The Company provides a broad range of products and
value-added processing and supply chain services to a wide array of customers, principally within
the producer durable equipment, oil and gas, aerospace, heavy industrial equipment, industrial
goods, construction equipment, retail, marine and automotive sectors of the global economy.
Particular focus is placed on the aerospace and defense, oil and gas, power generation, mining,
heavy industrial equipment manufacturing, marine, office furniture and fixtures, safety products,
life sciences applications, transportation and general manufacturing industries.
The Company’s primary metals service center and corporate headquarters are currently located in
Franklin Park, Illinois. In January 2011, the Company executed a new lease agreement to move
the Company’s corporate headquarters to Oakbrook, Illinois during the second quarter of 2011.
The Company has 47 operational service centers located throughout North America (43), Europe
(3) and Asia (1). The Company’s service centers hold inventory and process and distribute
products to both local and export markets.
2
Table of Contents
Industry and Markets
Service centers act as supply chain intermediaries between primary producers, which deal in bulk
quantities in order to achieve economies of scale, and end-users in a variety of industries that
require specialized products in significantly smaller quantities and forms. Service centers also
manage the differences in lead times that exist in the supply chain. While original equipment
manufacturers (“OEM”) and other customers often demand delivery within hours, the lead time
required by primary producers can be as long as several months. Service centers also provide value
to customers by aggregating purchasing, providing warehousing and distribution services, and
processing material to meet specific customer needs.
The principal markets served by the Company are highly competitive. Competition is based on
service, quality, processing capabilities, inventory availability, timely delivery, ability to
provide supply chain solutions and price. The Company competes in a highly fragmented industry.
Competition in the various markets in which the Company participates comes from a large number of
value-added metals processors and service centers on a regional and local basis, some of which have
greater financial resources and some of which have more established brand names in the local
markets served by the Company.
The Company also competes to a lesser extent with primary metals producers who typically sell to
larger customers requiring shipments of large volumes of metal.
In order to capture scale efficiencies and remain competitive, many primary metal producers are
consolidating their operations and focusing on their core production activities. These producers
have increasingly outsourced metals distribution and inventory management to metals service
centers. This process of outsourcing allows them to work with a relatively small number of
intermediaries rather than many end customers. As a result, metals service centers, including the
Company, are now providing a range of services for their customers, including metal purchasing,
processing and supply chain solutions.
Recent Expansions and Consolidations
During May 2010, the Company opened a new branch in Lafayette, Louisiana to service the Company’s
oil and gas customers in that region.
During the fourth quarter of 2010, the Company consolidated 3 of its facilities into nearby
existing locations in order to effectively manage its operations, reduce operating costs and better
serve its customers.
Procurement
The Company purchases metals and plastics from many producers. Material is purchased in large lots
and stocked at its service centers until sold, usually in smaller quantities and typically with
some value-added processing services performed. The Company’s ability to provide quick delivery of
a wide variety of specialty metals and plastic products, along with its processing capabilities,
allows customers to lower their own inventory investment by reducing their need to order the large
quantities required by producers or their need to perform additional material processing services.
Some of the Company’s purchases are covered by long-term contracts and commitments, which generally
have corresponding customer sales agreements.
Orders are primarily filled with materials shipped from Company stock. The materials required to
fill non-stock orders are obtained from other sources, such as direct mill shipments to customers
or purchases from other distributors. Deliveries are made principally by third party logistics
providers. Common carrier delivery is used in areas not serviced directly by the Company’s fleet.
Employees
At December 31, 2010, the Company had 1,619 full-time employees. Of these, 284 are represented by
collective bargaining units, principally the United Steelworkers of America and International
Brotherhood of Teamsters.
3
Table of Contents
Business Segments
The Company distributes and performs processing on both metals and plastics. Although the
distribution processes are similar, the customer markets, supplier bases and types of products are
different. Additionally, the Company’s Chief Executive Officer, the chief operating
decision-maker, reviews and manages these two businesses separately. As such, these businesses are
considered reportable segments and are reported accordingly in the Company’s various public
filings. Neither of the Company’s reportable segments has any unusual working capital
requirements.
In the last three years, the percentages of total sales of the two segments were as follows:
| 2010 | 2009 | 2008 | ||||||||||
Metals |
89 | % | 89 | % | 92 | % | ||||||
Plastics |
11 | % | 11 | % | 8 | % | ||||||
| 100 | % | 100 | % | 100 | % | |||||||
Metals Segment
In its Metals segment, the Company’s marketing strategy focuses on distributing highly
engineered specialty grades and alloys of metals as well as providing specialized processing
services designed to meet very precise specifications. Core products include alloy, aluminum,
stainless, nickel, titanium and carbon. Inventories of these products assume many forms such
as plate, sheet, extrusions, round bar, hexagon bar, square and flat bar, tubing and coil.
Depending on the size of the facility and the nature of the markets it serves, a service center
is equipped as needed with bar saws, plate saws, oxygen and plasma arc flame cutting machinery,
water-jet cutting equipment, stress relieving and annealing furnaces, surface grinding
equipment, and sheet shearing equipment.
The Company’s customer base is well diversified and therefore, the Company does not have
dependence upon any single customer, or a few customers. Our customer base includes many
Fortune 500 companies as well as thousands of medium and smaller sized firms.
The Company’s broad network of locations provides same or next-day delivery to most of the
segment’s markets, and two-day delivery to virtually all of the rest.
Plastics Segment
The Company’s Plastics segment consists exclusively of a wholly-owned subsidiary that operates
as Total Plastics, Inc. (“TPI”), headquartered in Kalamazoo, Michigan, and its wholly-owned
subsidiaries. The Plastics segment stocks and distributes a wide variety of plastics in forms
that include plate, rod, tube, clear sheet, tape, gaskets and fittings. Processing activities
within this segment include cut-to-length, cut-to-shape, bending and forming according to
customer specifications.
The Plastics segment’s diverse customer base consists of companies in the retail
(point-of-purchase), marine, office furniture and fixtures, safety products, life sciences
applications, transportation and general manufacturing industries. TPI has locations throughout
the upper northeast and midwest regions of the U.S. and one facility in Florida from which it
services a wide variety of users of industrial plastics.
Joint Venture
The Company holds a 50% joint venture interest in Kreher Steel Co. (“Kreher”), a metals
distributor of bulk quantities of alloy, special bar quality and stainless steel bars,
headquartered in Melrose Park, Illinois. The Company’s equity in the earnings of this joint
venture is reported separately in the Company’s consolidated statements of operations.
4
Table of Contents
Access to SEC Filings
The Company makes available free of charge on or through its Web site at www.amcastle.com the
annual
report on Form 10-K, quarterly reports on Form 10-Q, current reports on Form 8-K and all amendments
to those reports as soon as reasonably practicable after such material is electronically filed with
or furnished to the U.S. Securities and Exchange Commission (the “SEC”). Information on our
website does not constitute part of this annual report on Form 10-K.
| ITEM 1A | — Risk Factors |
Our business, operations and financial condition are subject to various risks and uncertainties.
Current or potential investors should carefully consider the risks and uncertainties described
below, together with all other information in this annual report on Form 10-K and other documents
filed with the SEC, before making any investment decisions with respect to the Company’s
securities.
Our future operating results depend on the volatility of the prices of metals and plastics,
which could cause our results to be adversely affected.
The prices we pay for raw materials, both metals and plastics, and the prices we charge for
products may fluctuate depending on many factors, including general economic conditions (both
domestic and international), competition, production levels, import duties and other trade
restrictions and currency fluctuations. To the extent metals prices decline, we would generally
expect lower sales and possibly lower net income, depending on the timing of the price changes and
the ability to pass price changes onto our customers. To the extent we are not able to pass on to
our customers any increases in our raw materials prices, our operating results may be adversely
affected. In addition, because we maintain substantial inventories of metals in order to meet
short lead-times and the just-in-time delivery requirements of our customers, a reduction in our
selling prices could result in lower profitability or, in some cases, losses, either of which could
adversely impact our ability to remain in compliance with certain financial covenants in our loan
facilities, as well as result in us incurring impairment charges.
Disruptions or shortages in the supply of raw materials could adversely affect our operating
results and our ability to meet our customer demands.
Our business requires materials that are sourced from third party suppliers. If for any reason our
primary suppliers of metals should curtail or discontinue their delivery of raw materials to us at
competitive prices and in a timely manner, our operating results could suffer. Unforeseen
disruptions in our supply bases could materially impact our ability to deliver products to
customers. The number of available suppliers could be reduced by factors such as industry
consolidation and bankruptcies affecting steel, metals and plastics producers, or suppliers may be
unwilling or unable to meet our demand due to industry supply conditions generally. If we are
unable to obtain sufficient amounts of raw materials from our traditional suppliers, we may not be
able to obtain such raw materials from alternative sources at competitive prices to meet our
delivery schedules, which could have an adverse impact on our operating results. To the extent we
have quoted prices to customers and accepted orders for products prior to purchasing necessary raw
materials, or have existing contracts, we may be unable to raise the price of products to cover all
or part of the increased cost of the raw materials to our customers.
In some cases the availability of raw materials requires long lead times. As a result, we may
experience delays or shortages in the supply of raw materials. If unable to obtain adequate and
timely deliveries of required raw materials, we may be unable to timely supply customers with
sufficient quantities of products. This could cause us to lose sales, incur additional costs, or
suffer harm to our reputation.
Increases in freight and energy prices would increase our operating costs and we may be unable
to pass these increases on to our customers in the form of higher prices, which may adversely
affect our operating results.
We use energy to process and transport our products. The prices for and availability of energy
resources are subject to volatile market conditions, which are affected by political, economic and
regulatory factors beyond our control. Our operating costs increase if energy costs, including
electricity, diesel fuel and natural gas, rise. During periods of higher freight and energy costs,
we may not be able to recover our operating cost increases through price increases without reducing
demand for our products. In addition, we typically do not hedge our exposure to higher freight or
energy prices.
5
Table of Contents
We service industries that are highly cyclical, and any downturn in our customers’ industries
could reduce our revenue and profitability.
Many of our products are sold to customers in industries that experience significant fluctuations
in demand based on economic conditions, energy prices, consumer demand, availability of adequate
credit and financing, customer inventory levels, changes in governmental policies (including those
that would limit or reduce defense spending) and other factors beyond our control. As a result of
this volatility in the industries we serve, when one or more of our customers’ industries
experiences a decline, we may have difficulty increasing or maintaining our level of sales or
profitability if we are not able to divert sales of our products to customers in other industries.
We have made a strategic decision to focus sales resources on certain industries, specifically the
aerospace and defense and oil and gas industries. A downturn in these industries has had, and may
in the future continue to have, an adverse effect on our operating results. We are also
particularly sensitive to market trends in the manufacturing sector of the North American economy.
Our industry is highly competitive, which may force us to lower our prices and may have an
adverse effect on our operating results.
The principal markets that we serve are highly competitive. Competition is based principally on
price, service, quality, processing capabilities, inventory availability and timely delivery. We
compete in a highly fragmented industry. Competition in the various markets in which we
participate comes from a large number of value-added metals processors and service centers on a
regional and local basis, some of which have greater financial resources than we do and some of
which have more established brand names in the local markets we serve. We also compete to a lesser
extent with primary metals producers who typically sell to very large customers requiring shipments
of large volumes of metal. Increased competition could force us to lower our prices or to offer
increased services at a higher cost to us, which could have an adverse effect on our operating
results.
Our operating results are subject to the seasonal nature of our customers’ businesses.
A portion of our customers experience seasonal slowdowns. Historically, our revenues in the months
of July, November and December have been lower than in other months because of a reduced number of
shipping days and holiday or vacation closures for some customers. Consequently, our sales in the
first two quarters of the year are usually higher than in the third and fourth quarters. As a
result, analysts and investors may inaccurately estimate the effects of seasonality on our
operating results in one or more future quarters and, consequently, our operating results may fall
below expectations.
We may not be able to retain or expand our customer base if the United States manufacturing
industry continues to relocate production operations internationally.
Our customer base primarily includes manufacturing and industrial firms in the United States, some
of which are, or have considered, relocating production operations outside the United States or
outsourcing particular functions to locations outside the United States. Some customers have
closed their businesses as they were unable to compete successfully with foreign competitors.
Although we have facilities in Canada, Mexico, France, the United Kingdom, Singapore and China, the
majority of our facilities are located in the United States. To the extent our customers close or
relocate operations to locations where we do not have a presence, we could lose all or a portion of
their business.
General global economic, credit and capital market conditions have had and could continue to
have an adverse impact on our business, operating results and financial condition.
We are susceptible to macroeconomic downturns in the United States and abroad which has had, and in
the future may continue to have, an adverse effect on demand for our products and consequently the
operating results, financial condition and cash flows. Future negative economic conditions, as
well as a slow recovery period, could lead to reduced demand for our products, increased price
competition, reduced gross margins, increased risk of obsolete inventories and higher operating
costs as a percentage of revenue.
Disruption of the capital and credit markets may negatively impact our business, including our
ability to access additional financing at a time when we would like, or need, to access those
markets to run or expand our business. These events may also make it more costly for us to raise
capital through the issuance of our equity securities and could reduce our net income by increasing
our interest expense and other costs of capital. The diminished availability of credit and other
capital could also affect the industries we serve and could result in reduction in sales volumes
and increased credit and collection risks.
6
Table of Contents
We are vulnerable to interest rate fluctuations on our indebtedness, which could hurt our
operating results.
We are exposed to various interest rate risks that arise in the normal course of business. We
finance our operations with fixed and variable rate borrowings. Market risk arises from changes in
variable interest rates. Under our revolving credit facility, our interest rate on borrowings is
subject to changes based on fluctuations in the LIBOR and prime rates of interest. If interest
rates significantly increase, we could be unable to service our debt which could have an adverse
effect on our operating results.
We operate in international markets, which expose us to a number of risks.
Although a substantial majority of our business activity takes place in the United States, we serve
and operate in certain international markets, which expose us to political, economic and currency
related risks, including the potential for adverse change in the local political or social climate
or in government policies, laws and regulations, difficulty staffing and managing geographically
diverse operations, restrictions on imports and exports or sources of supply, and change in duties
and taxes. We operate in Canada, Mexico, France, and the United Kingdom, with limited operations
in Spain, Singapore and China. An act of war or terrorism or major pandemic event could disrupt
international shipping schedules, cause additional delays in importing our products into the United
States or increase the costs required to do so. In addition, acts of crime or violence in these
international markets could adversely affect our operating results. Fluctuations in the value of
the U.S. dollar versus foreign currencies could reduce the value of these assets as reported in our
financial statements, which could reduce our stockholders’ equity. If we do not adequately
anticipate and respond to these risks and the other risks inherent in international operations, it
could have a material adverse effect on our operating results.
We may not be able to realize the benefits we anticipate from our acquisitions.
Some of our growth has been through acquisitions, and we intend to continue to seek attractive
opportunities to acquire businesses in the future. Achieving the benefits of these acquisitions
depends on the timely, efficient and successful execution of a number of post-acquisition events,
including our integration of the acquired businesses. We may not be able to realize the benefits
we anticipate from our acquisitions. Factors that could affect our ability to achieve these
benefits include:
| • | difficulties in integrating and managing personnel, financial reporting and other systems used by the acquired businesses; |
| • | the failure of the acquired businesses to perform in accordance with our expectations; |
| • | failure to achieve anticipated synergies between our business units and the acquired businesses; |
| • | the loss of the acquired businesses’ customers; and |
| • | cyclicality of business. |
The presence of any of the above factors individually or in combination could result in future
impairment charges against the assets of the acquired businesses.
If the acquired businesses do not operate as we anticipate, it could adversely affect our operating
results and financial condition. As a result, there can be no assurance that the acquisitions will
be successful or will not, in fact, adversely affect our business.
Our business could be adversely affected by a disruption to our primary distribution hub.
Our largest facility, in Franklin Park, Illinois, serves as a primary distribution center that
ships product to our other facilities as well as external customers. Our business could be
adversely impacted by a major disruption at this facility due to unforeseen developments occurring
in or around the facility, such as:
| • | damage to or inoperability of our warehouse or related systems; |
| • | a prolonged power or telecommunication failure; |
| • | a natural disaster, environmental or public health issue; or |
| • | an airplane crash or act of war or terrorism on-site or nearby as the facility is located within seven miles of O’Hare International Airport (a major U.S. airport) and lies below certain take-off and landing flight patterns. |
A prolonged disruption of the services and capabilities of our Franklin Park facility and operation
could adversely impact our operating results.
7
Table of Contents
Damage to or a disruption in our information technology systems could impact our ability to
conduct business and/or report our financial performance.
We are implementing new enterprise-wide resources planning (“ERP”) systems over a period of several
years. While we have completed the conversions of substantially all of the Company’s North
American locations onto the new ERP system, we can provide no assurance that the continued
phased-implementation at the Company’s remaining facilities will be successful or will occur as
planned. Difficulties associated with the design and implementation of the new ERP system could
adversely affect our business, our customer service and our operating results.
We rely on information technology systems to provide inventory availability to our sales and
operating personnel, improve customer service through better order and product reference data and
monitor operating results. Difficulties associated with upgrades or integration with new systems
could lead to business interruption that could harm our reputation, increase our operating costs
and decrease profitability. In addition, any significant disruption relating to our current or new
information technology systems, whether due from such things as fire, flood, tornado and other
natural disasters, power loss, network failures, loss of data, security breaches and computer
viruses, or otherwise, may have an adverse effect on our business, our operating results and our
ability to report our financial performance in a timely manner.
A portion of our workforce is represented by collective bargaining units, which may lead to
work stoppages.
Approximately 18% of our U.S. employees are represented by unions under collective bargaining
agreements, including hourly warehouse employees at our primary distribution center in Franklin
Park, Illinois. As these agreements expire, there can be no assurance that we will succeed in
concluding collective bargaining agreements with the union to replace those that expire. Although
we believe that our labor relations have generally been satisfactory, we cannot predict how stable
our relationships with these labor organizations will be or whether we will be able to meet union
requirements without impacting our operating results and financial condition. The unions may also
limit our flexibility in dealing with our workforce. Work stoppages and instability in our union
relationships could negatively impact the timely processing and shipment of our products, which
could strain relationships with customers and adversely affect our operating results.
Market volatility could result in future asset impairments, which could have an adverse effect
on our operating results.
We review the recoverability of goodwill annually or whenever significant events or changes occur
which might impair the recovery of recorded costs, making certain assumptions regarding future
operating performance. We review the recoverability of definite lived intangible assets and other
long-lived assets whenever significant events or changes occur which might impair the recovery of
recorded costs, making certain assumptions regarding future operating performance. The results of
these calculations may be affected by the current or further declines in the market conditions for
our products, as well as interest
rates and general economic conditions. If impairment is determined to exist, we will incur
impairment losses, which will have an adverse effect on our operating results and our ability to
remain in compliance with certain financial covenants in our loan facilities.
8
Table of Contents
We could incur substantial costs in order to comply with, or to address any violations under,
environmental and employee health and safety laws, which could adversely affect our operating
results.
Our operations are subject to various environmental statutes and regulations, including laws and
regulations governing materials we use. In addition, certain of our operations are subject to
international, federal, state and local environmental laws and regulations that impose limitations
on the discharge of pollutants into the air and water and establish standards for the treatment,
storage and disposal of solid and hazardous wastes. Our operations are also subject to various
employee safety and health laws and regulations, including those concerning occupational injury and
illness, employee exposure to hazardous materials and employee complaints. Certain of our
facilities are located in industrial areas, have a history of heavy industrial use and have been in
operation for many years and, over time, we and other predecessor operators of these facilities
have generated, used, handled and disposed of hazardous and other regulated wastes. Currently
unknown cleanup obligations at these facilities, or at off-site locations at which materials from
our operations were disposed, could result in future expenditures that cannot be currently
quantified but which could have an adverse effect on our operating results.
We may face risks associated with current or future litigation and claims.
From time to time, we are involved in a variety of lawsuits, claims and other proceedings relating
to the conduct of our business. These suits concern issues including contract disputes, employment
actions, employee benefits, taxes, environmental, health and safety, personal injury and product
liability matters. Due to the uncertainties of litigation, we can give no assurance that we will
prevail on all claims made against us in the lawsuits that we currently face or that additional
claims will not be made against us in the future. While it is not feasible to predict the outcome
of all pending lawsuits and claims, we do not believe that the disposition of any such pending
matters is likely to have an adverse effect on our financial condition or liquidity, although the
resolution in any reporting period of one of more of these matters could have an adverse effect on
our operating results for that period. Also, we can give no assurance that any other lawsuits or
claims brought in the future will not have an adverse effect on our financial condition, liquidity
or operating results.
Increased regulation associated with climate change and greenhouse gas emissions could impose significant costs on the operations of our customers and suppliers, which could have a material
adverse impact on our results of operations, financial condition and cash flows.
Climate change regulation or some form of legislation aimed at reducing greenhouse gas, or GHG,
emissions is currently being considered in the United States as well as globally. As a metals and
plastics distributor, our operations do not emit significant amounts of GHG. However, the
manufacturing processes of many of our suppliers and customers are energy intensive and generate
carbon dioxide and other GHG emissions. Any adopted future climate change and GHG regulations may
impose significant costs on the operations of our customers and suppliers and indirectly impact
our operations. Until the timing, scope and extent of any future regulation becomes known, we
cannot predict the effect on our results of operations, financial condition and cash flows.
Ownership of our stock is concentrated, which may limit stockholders’ ability to influence
corporate matters.
Patrick J. Herbert, III, one of our directors, may be deemed to beneficially own approximately 23%
of our common stock. Accordingly, Mr. Herbert and his affiliates may have the voting power to
substantially control the outcome of matters requiring a stockholder vote including the election of
directors and the approval of significant corporate matters. Such a concentration of control could
adversely affect the market price of our common stock or prevent a change in control or other
business combinations that might be beneficial to the Company.
9
Table of Contents
We have various mechanisms in place that may prevent a change in control that stockholders may
otherwise consider favorable.
In addition to the high concentration of insider ownership described above, our charter and by-laws
and the Maryland General Corporation Law, or the MGCL, include provisions that may be deemed to
have antitakeover effects and may delay, defer or prevent a takeover attempt that stockholders
might consider to be in their best interests. For example, the MGCL, our charter and bylaws
require the approval of the holders of two-thirds of the votes entitled to be cast on the matter to
amend our charter (unless our Board of Directors has unanimously approved the amendment, in which
case the approval of the holders of a majority of such votes is required), contain certain advance
notice procedures for nominating candidates for election to our Board of Directors, and permit our
Board of Directors to issue up to 10,000,000 shares of preferred stock.
Furthermore, we are subject to the anti-takeover provisions of the MGCL that prohibit us from
engaging in a “business combination” with an “interested stockholder” for a period of five years
after the date of the transaction in which the person first becomes an “interested stockholder,”
unless the business combination or stockholder interest is approved in a prescribed manner. The
application of these and certain other provisions of our charter could have the effect of delaying
or preventing a change of control of the Company, which could adversely affect the market price of
our common stock.
| ITEM 1B | — Unresolved Staff Comments |
None.
10
Table of Contents
| ITEM 2 | — Properties |
The Company’s principal executive offices are currently located in its Franklin Park, Illinois
facility near Chicago, Illinois. During January 2011, the Company executed a new lease agreement
to move the Company’s corporate headquarters to Oakbrook, Illinois during the second quarter of
2011. All properties and equipment are sufficient for the Company’s current level of activities.
Distribution centers and sales offices are maintained at each of the following locations, most of
which are leased, except as indicated:
| Approximate | ||||
| Floor Area in | ||||
| Locations | Square Feet | |||
Metals Segment |
||||
North America |
||||
Arlington, Texas |
74,880 | (2) | ||
Bedford Heights, Ohio |
374,400 | (1) | ||
Birmingham, Alabama |
76,000 | (1) | ||
Blaine, Minnesota |
65,200 | (1) | ||
Charlotte, North Carolina |
116,500 | (1) | ||
Edmonton, Alberta |
50,553 | |||
Fairfield, Ohio |
138,000 | (2) | ||
Fairless Hills, Pennsylvania |
71,600 | (1) | ||
Franklin Park, Illinois |
522,600 | (1) | ||
Gardena, California |
117,000 | |||
Grand Prairie, Texas |
78,000 | (1) | ||
Hammond, Indiana (H-A Industries) |
243,000 | |||
Houston, Texas |
109,100 | (1) | ||
Kansas City, Missouri |
118,000 | |||
Kennesaw, Georgia |
87,500 | |||
Kent, Washington |
53,000 | |||
Lafayette, Louisiana |
5,000 | (1) | ||
Mississauga, Ontario |
60,000 | |||
Orange, Connecticut |
57,389 | |||
Paramount, California |
155,500 | |||
Point Claire, Quebec |
38,760 | |||
Santa Cantarina, Nuevo Leon, Mexico |
55,000 | |||
Saskatoon, Saskatchewan |
15,000 | |||
Selkirk, Manitoba |
50,000 | (1) | ||
Stockton, California |
60,000 | |||
Twinsburg, Ohio |
120,000 | |||
Wichita, Kansas |
148,800 | |||
Worcester, Massachusetts |
53,500 | (1) | ||
Europe (3) |
||||
Blackburn, England |
62,139 | |||
Letchworth, England |
40,000 | |||
Montoir de Bretagne, France |
38,944 | |||
Asia |
||||
Shanghai, China |
45,700 | |||
Sales Offices |
||||
Bilbao, Spain |
(Intentionally left blank) | |||
Fairfield, Ohio |
||||
Milwaukee, Wisconsin |
||||
Phoenix, Arizona |
||||
Singapore |
||||
Tulsa, Oklahoma |
||||
Total Metals Segment |
3,301,065 | |||
11
Table of Contents
| Approximate | ||||
| Floor Area in | ||||
| Locations | Square Feet | |||
Plastics Segment |
||||
Baltimore, Maryland |
24,000 | |||
Cleveland, Ohio |
8,600 | |||
Cranston, Rhode Island |
14,990 | |||
Detroit, Michigan |
22,000 | |||
Elk Grove Village, Illinois |
22,500 | |||
Fort Wayne, Indiana |
17,600 | |||
Grand Rapids, Michigan |
42,500 | (1) | ||
Harrisburg, Pennsylvania |
13,900 | |||
Indianapolis, Indiana |
13,500 | |||
Kalamazoo, Michigan |
81,000 | |||
Knoxville, Tennessee |
16,530 | |||
Maple Shade, New Jersey |
12,480 | |||
Mt. Vernon, New York |
30,000 | |||
New Philadelphia, Ohio |
15,700 | |||
Pittsburgh, Pennsylvania |
12,800 | |||
Rockford, Michigan |
53,600 | |||
Tampa, Florida |
17,700 | |||
Worcester, Massachusetts |
2,500 | |||
Total Plastics Segment |
421,900 | |||
GRAND TOTAL |
3,722,965 | |||
| (1) | Represents owned facility. | |
| (2) | During the fourth quarter of 2010, the Company consolidated these facilities into existing locations. Therefore, these locations were vacant at December 31, 2010. | |
| (3) | Upon the termination of the lease for one of the Company’s facilities in England during the fourth quarter of 2010, such facility was consolidated into an existing location. |
12
Table of Contents
| ITEM 3 | — Legal Proceedings |
The Company is a defendant in several lawsuits arising from the operation of its business. These
lawsuits are incidental and occur in the normal course of the Company’s business affairs. It is
the opinion of management, based on current knowledge, that no uninsured liability will result from
the outcome of this litigation that would have a material adverse effect on the consolidated
results of operations, financial condition or cash flows of the Company.
| ITEM 4 | — [Removed and reserved] |
Executive Officers of The Registrant
The following selected information for each of our current executive officers (as defined by
regulations of the SEC) was prepared as of March 7, 2011.
| Name and Title | Age | Business Experience | ||||
Michael H. Goldberg President and Chief Executive Officer |
57 | Mr. Goldberg was elected President and Chief Executive Officer in 2006. Prior to joining the registrant, he was Executive Vice President of Integris Metals (an aluminum and stainless steel metal service center) from 2001 to 2005. From 1998 to 2001, Mr. Goldberg was Executive Vice President of North American Metals Distribution Group, a division of Rio Algom LTD. | ||||
Stephen V. Hooks Executive Vice President and President, Castle Metals |
59 | Mr. Hooks began his employment with the registrant in 1972. He was elected to the position of Vice President — Midwest Region in 1993, Vice President - Merchandising in 1998, Senior Vice President—Sales & Merchandising in 2002 and Executive Vice President of the registrant and Chief Operating Officer of Castle Metals in 2004. In 2005, Mr. Hooks was appointed President of Castle Metals. | ||||
Scott F. Stephens Vice President, Chief Financial Officer and Treasurer |
41 | Mr. Stephens began his employment with the registrant in 2008 and was elected to the position of Vice President, Chief Financial Officer, and Treasurer. Formerly, he served as the CFO of Lawson Products, Inc. (a distributor of services, systems and products to the MRO and OEM marketplace) since 2004, and CFO of The Wormser Company from 2001 to 2004. | ||||
Patrick R. Anderson Vice President, Corporate Controller and Chief Accounting Officer |
39 | Mr. Anderson began his employment with the registrant in 2007 and was appointed to the position of Vice President, Corporate Controller and Chief Accounting Officer. Prior to joining the registrant, he was employed as a Senior Manager with Deloitte & Touche LLP (a global accounting firm) where he was employed from 1994 to 2007. | ||||
Albert J. Biemer Vice President, Corporate Supply Chain |
49 | Mr. Biemer began his employment with the registrant in 2001 and was appointed to the position of Vice President — Supply Chain. He was appointed Vice President, ERP Business Executive in 2007 and in 2010 was appointed as Vice President — Corporate Supply Chain. Prior to joining the registrant, he was employed as Vice President — Logistics for CSC, Ltd (a producer of carbon and alloy bar) since 2000. | ||||
Kevin B. Coughlin Vice President, Operations |
60 | Mr. Coughlin began his employment with the registrant in 2005 and was appointed to the position of Vice President-Operations. Prior to joining the registrant he was Director of Commercial Vehicle Electronics and Automotive Starter Motor Groups for Robert Bosch-North America from 2001 to 2004 and Vice President of Logistics and Services for the Skill-Bosch Power Tool Company from 1997 to 2000. | ||||
13
Table of Contents
| Name and Title | Age | Business Experience | ||||
Kevin P. Fitzpatrick Vice President, Human Resources |
46 | Mr. Fitzpatrick began his employment with the registrant in 2009 and was elected to the position of Vice President-Human Resources. Prior to joining the registrant he was Vice President-North American Human Resources and Administration for UPM-Kymmene Corporation (a forest industry company) since 2001. | ||||
Thomas L. Garrett Vice President and President, Total Plastics, Inc. |
48 | Mr. Garrett began his employment with Total Plastics, Inc., a wholly owned subsidiary of the registrant, in 1988 and was appointed to the position of Controller. In 1996, he was elected to the position of Vice President and in 2001 was appointed to the position of Vice President of the registrant and President of Total Plastics, Inc. | ||||
Kevin H. Glynn Vice President and Chief Information Officer |
47 | Mr. Glynn began his employment with the registrant in October 2010 as the Interim Chief Information Officer. In January 2011 he was appointed Vice President and Chief Information Officer. Prior to joining the registrant, he was employed as a Managing Principal at Laminar Group LLC (a management consulting company) from 2009 to 2010, Chief Operating Officer at IRON Solutions, Inc. (an information technology company specializing in data, software and media services for the agriculture equipment market) from 2008 to 2009 and as Senior Vice President and Chief Information Officer at CNH America, LLC (a manufacturer of agricultural and construction equipment) from 2006 to 2007. | ||||
G. Nicholas Jones Vice President and President, Castle Metals Oil & Gas |
43 | Mr. Jones began his employment with the registrant in December 2010 and was appointed to the position of Vice President, President Castle Metals Oil & Gas. Prior to beginning employment with the registrant, he was Vice President and GM — Eastern Hemisphere for Energy Alloys LLC (a global supplier of oilfield metals, services and solutions) since 2004. | ||||
Robert J. Perna Vice President, General Counsel and Secretary |
47 | Mr. Perna began his employment with the registrant in 2008 and was elected to the position of Vice President-General Counsel and Secretary. Prior to joining the registrant he was General Counsel, North America, CNH America, LLC (a manufacturer of agricultural and construction equipment) since 2007, and he also served as Associate General Counsel and Corporate Secretary for Navistar International Corporation (a manufacturer of commercial trucks and diesel engines) since 2001. | ||||
Blain A. Tiffany Vice President and President, Castle Metals Aerospace |
52 | Mr. Tiffany began his employment with the registrant in 2000 and was appointed to the position of District Manager. He was appointed Eastern Region Manager in 2003, Vice President — Regional Manager in 2005 and in 2006 was appointed to the position of Vice President — Sales. In 2007 Mr. Tiffany was appointed to the position of Vice President of the registrant and President of Castle Metals Plate. In 2009 Mr. Tiffany was elected to the Position of Vice President of the registrant and President of Castle Metals Aerospace. | ||||
14
Table of Contents
PART II
| ITEM 5 | — Market for the Registrant’s Common Equity, Related Stockholder Matters and Issuer Purchases of Equity Securities |
The Company’s common stock trades on the New York Stock Exchange under the ticker symbol “CAS”. As
of March 1, 2011 there were approximately 1,081 shareholders of record. The Company used cash of
$1.4 million to pay cash dividends of $0.06 per share on its common stock in 2009. The 2009
dividend payments of $1.4 million were paid during the second quarter of 2009 and the Company
subsequently suspended the payment of dividends until further notice. No cash dividends were paid
on the Company’s common stock in 2010. The payment of dividends, if any, is at the discretion of the
Board of Directors and will depend on the Company’s earnings, capital requirements and financial
condition and such other factors as the Board of Directors may consider.
See Part III, Item 12, “Security Ownership of Certain Beneficial Owners and Management and Related
Stockholder Matters”, for information regarding common stock authorized for issuance under equity
compensation plans.
The Company did not purchase any of its equity securities during the fourth quarter of 2010.
Directors of the Company who are not employees may elect to defer receipt of up to 100% of their
cash retainer. A director who defers board compensation may select either an interest or a stock
equivalent investment option for amounts in the director’s deferred compensation account.
Disbursement of the stock equivalent unit account may be in shares of Company common stock or in
cash as designated by the director. If payment from the stock equivalent unit account is made in
shares of the Company’s common stock, the number of shares to be distributed will equal the number
of full stock equivalent units held in the director’s account. For the period covered by this
report, receipt of approximately 1,803 shares was deferred as payment for the 2010 board
compensation. In each case, the shares were acquired at prices ranging from $12.75 to $17.14 per
share, which represented the closing price of the Company’s common stock on the day as of which
such fees would otherwise have been paid to the director. Exemption from registration of the
shares is claimed by the Company under Section 4(2) of the Securities Act of 1933, as amended.
The following table sets forth the range of the high and low sales prices of shares of the
Company’s common stock for the periods indicated:
| 2010 | 2009 | |||||||||||||||
| Low | High | Low | High | |||||||||||||
First Quarter |
$ | 9.55 | $ | 14.19 | $ | 5.29 | $ | 13.09 | ||||||||
Second Quarter |
$ | 12.17 | $ | 19.29 | $ | 8.25 | $ | 12.87 | ||||||||
Third Quarter |
$ | 12.66 | $ | 16.09 | $ | 9.45 | $ | 13.48 | ||||||||
Fourth Quarter |
$ | 13.11 | $ | 19.20 | $ | 8.74 | $ | 14.41 | ||||||||
15
Table of Contents
The following graph compares the cumulative total stockholder return on our common stock for the
five-year period ended December 31, 2010, with the cumulative total return of the Standard and
Poor’s 500 Index and to a peer group index. The comparison in the graph assumes the investment of
$100 on December 31, 2005. Cumulative total stockholder return means share price increases or
decreases plus dividends paid, with the dividends reinvested, and reflect market capitalization
weighting. The graph does not forecast future performance of our common stock. The Company moved
to a new peer group index during 2010 in conjunction with the establishment of a relative total
shareholder return performance measure under the Company’s long term compensation plan. The
Company believes this new peer group provides a more meaningful comparison of our stock
performance. The new peer group index is made up of companies in the metals industry or in the
industrial products distribution business, although not all of the companies included in the new
peer group index participate in all of the lines of business in which the Company is engaged and
some of the companies included in the peer group index also engage in lines of business in which
the Company does not participate. Additionally, the market capitalizations of many of the
companies in the peer group are quite different from that of the Company.
COMPARISON OF 5 YEAR CUMULATIVE TOTAL RETURN*
Among A.M. Castle & Co., the S&P 500 Index
and Two Peer Group Index
Among A.M. Castle & Co., the S&P 500 Index
and Two Peer Group Index
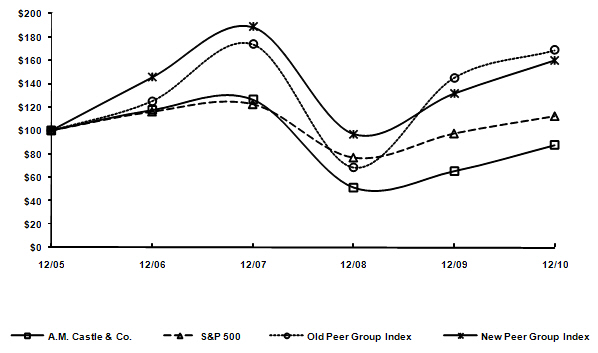
| * | $100 invested on 12/31/05 in stock or index, including reinvestment of dividends. | |
| Fiscal year ending December 31. | ||
| Copyright© 2011 S&P, a division of The McGraw-Hill Companies Inc. All rights reserved. |
| 12/05 | 12/06 | 12/07 | 12/08 | 12/09 | 12/10 | |||||||||||||||||||
A. M. Castle & Co. |
$ | 100.00 | $ | 117.43 | $ | 126.51 | $ | 51.01 | $ | 64.90 | $ | 87.28 | ||||||||||||
S&P 500 |
100.00 | 115.80 | 122.16 | 76.96 | 97.33 | 111.99 | ||||||||||||||||||
Old Peer Group Index (a) |
100.00 | 125.21 | 173.86 | 68.53 | 145.09 | 168.58 | ||||||||||||||||||
Current Peer Group Index (b) |
100.00 | 145.48 | 188.57 | 97.05 | 131.63 | 160.08 | ||||||||||||||||||
| (a) | The Old Peer Group Index consists of Olympic Steel, Inc. and Reliance Steel & Aluminum Co. | |
| (b) | The Current Peer Group Index consists of the following companies: AEP Industries Inc.; AK Steel Holding Corp.; Allegheny Technologies Inc.; Amcol International Corp.; Applied Industrial Technologies Inc.; Carpenter Technology Corp.; Cliffs Natural Resources Inc.; Commercial Metals Company; Fastenal Company; Gibraltar Industries Inc.; Haynes International Inc.; Kaman Corp.; Lawson Products Inc.; MSC Industrial Direct Company Inc.; Nucor Corp.; Olin Corp.; Olympic Steel, Inc.; Quanex Building Products Corp.; Reliance Steel & Aluminum Co.; RTI International Metals Inc.; Schnitzer Steel Industries Inc.; Steel Dynamics Inc.; Stillwater Mining Company; Texas Industries Inc.; United States Steel Corp.; and Worthington Industries Inc. |
16
Table of Contents
| ITEM 6 | — Selected Financial Data |
The Selected Financial Data in the table below includes the results of the September 2006 and
January 2008 acquisitions of Transtar and Metals U.K., respectively, and the October 2007
divestiture of Metal Express.
| (dollars in millions, except per share data) | 2010 | 2009 | 2008 | 2007 | 2006 | |||||||||||||||
For the year ended December 31: |
||||||||||||||||||||
Net sales |
$ | 943.7 | $ | 812.6 | $ | 1,501.0 | $ | 1,420.4 | $ | 1,177.6 | ||||||||||
Net (loss) income from continuing operations |
(5.6 | ) | (26.9 | ) | (17.1 | ) | 51.8 | 55.1 | ||||||||||||
Basic (loss) earnings per common share from
continuing operations |
(0.25 | ) | (1.18 | ) | (0.76 | ) | 2.49 | 2.95 | ||||||||||||
Diluted (loss) earnings per common share from
continuing operations |
(0.25 | ) | (1.18 | ) | (0.76 | ) | 2.41 | 2.89 | ||||||||||||
Cash dividends declared per common share |
— | 0.06 | 0.24 | 0.24 | 0.24 | |||||||||||||||
As of December 31: |
||||||||||||||||||||
Total assets |
529.4 | 558.0 | 679.0 | 677.0 | 655.1 | |||||||||||||||
Long-term debt, less current portion |
61.1 | 67.7 | 75.0 | 60.7 | 90.1 | |||||||||||||||
Total debt |
69.1 | 89.2 | 117.1 | 86.5 | 226.1 | |||||||||||||||
Total stockholders’ equity |
313.5 | 318.2 | 347.3 | 385.1 | 215.9 | |||||||||||||||
17
Table of Contents
| ITEM 7 | — Management’s Discussion and Analysis of Financial Condition and Results of Operations |
Amounts in millions except per share data
Information regarding the business and markets of A.M. Castle & Co. and its subsidiaries
(the “Company”), including its reportable segments, is included in Item 1 “Business” of this
annual report on Form 10-K.
The following discussion should be read in conjunction with Item 6 “Selected Financial Data”
and the Company’s consolidated financial statements and related notes thereto in Item 8
“Financial Statements and Supplementary Data”.
EXECUTIVE OVERVIEW
The Company’s long-term strategy is to become the foremost global provider of specialty metals
products and services and specialized supply chain solutions to targeted global industries.
During 2010, the following significant events occurred which impacted the Company’s operations and
financial results:
| • | Demand for the Company’s products increased in light of improvements in the overall economy resulting in a 16.1% increase in sales over 2009. | ||
| • | Successful management of working capital principally through reducing inventory and debt levels by approximately $40.0 million and $20.0 million, respectively, from 2009 to 2010. | ||
| • | Reduction in average Days’ Sales in Inventories (“DSI”) of approximately 46 days from 2009 to 2010. | ||
| • | Consolidation of 3 of the Company’s facilities into existing locations in order to effectively manage operations, reduce operating costs and better serve customers. |
Recent Market and Pricing Trends
The Company experienced increased demand from its customer base during 2010 in both the Metals and
Plastics segments, reflecting the improvement in the overall global economy compared to 2009.
Industry data indicates that U.S. service center steel and aluminum shipments were up between 20%
and 26% during 2010 compared to 2009 levels. Due to the late-cycle nature of the Company’s
business, results typically lag the general economic cycle by twelve months. Key end-use markets
that experienced significant increases in demand in the Company’s Metals segment include oil and
gas, general equipment and heavy industrial equipment. The Plastics segment experienced increased
demand across its primary end-use markets including office furniture, semiconductor, safety
products, life sciences applications and automotive compared to 2009.
Pricing across the majority of the Company’s markets strengthened throughout the year, albeit with
the usual volatility as a result of fluctuating commodity costs. The combination of factors above
positively impacted the Company’s operating results during 2010.
Changes in pricing can have a more direct impact on the Company’s operating results than changes in
volume due to certain factors including but not limited to:
| • | Changes in volume typically result in corresponding changes to the Company’s variable costs. However, as pricing changes occur, variable expenses are not directly impacted. |
| • | If surcharges are not passed through to the customer or are passed through without a mark-up, the Company’s profitability will be adversely impacted. |
18
Table of Contents
Current Business Outlook
Management uses the Purchaser’s Managers Index (“PMI”) provided by the Institute of Supply
Management (website is www.ism.ws) as an external indicator for tracking the demand outlook and
possible trends in its general manufacturing markets. The table below shows PMI trends from the
first
quarter of 2008 through the fourth quarter of 2010. Generally speaking, an index above 50.0
indicates growth in the manufacturing sector of the U.S. economy, while readings under 50.0
indicate contraction.
| YEAR | Qtr 1 | Qtr 2 | Qtr 3 | Qtr 4 | ||||||||||||
2008 |
49.2 | 49.5 | 47.8 | 36.1 | ||||||||||||
2009 |
35.9 | 42.6 | 51.5 | 54.6 | ||||||||||||
2010 |
58.2 | 58.8 | 55.4 | 56.8 | ||||||||||||
Material pricing and demand in both the Metals and Plastics segments of the Company’s business have
historically proven to be difficult to predict with any degree of accuracy. A favorable PMI trend
suggests that demand for some of the Company’s products and services, in particular those that are
sold to the general manufacturing customer base in the U.S., could potentially be at a higher level
in the near-term. The Company believes that its revenue trends typically correlate to the changes
in PMI on a six to twelve month lag basis.
RESULTS OF OPERATIONS: YEAR-TO-YEAR COMPARISONS AND COMMENTARY
Our discussion of comparative period results is based upon the following components of the
Company’s consolidated statements of operations.
Net Sales —The Company derives its sales from the processing and delivery of metals and plastics.
Pricing is established with each customer order and includes charges for the material, processing
activities and delivery. The pricing varies by product line and type of processing. From time to
time the Company may enter into fixed price arrangements with customers while simultaneously
obtaining similar agreements with its suppliers.
Cost of Materials — Cost of materials consists of the costs we pay suppliers for metals, plastics
and related inbound freight charges, excluding depreciation and amortization which are included in
operating costs and expenses discussed below. The Company accounts for inventory primarily on a
last-in-first-out (“LIFO”) basis. LIFO adjustments are calculated as of December 31 of each year.
Operating Costs and Expenses — Operating costs and expenses primarily consist of:
| • | Warehouse, processing and delivery expenses, including occupancy costs, compensation and employee benefits for warehouse personnel, processing, shipping and handling costs; |
| • | Sales expenses, including compensation and employee benefits for sales personnel; |
| • | General and administrative expenses, including compensation for executive officers and general management, expenses for professional services primarily related to accounting and legal advisory services, bad debt expense, data communication, computer hardware and maintenance and foreign currency gain or loss; and |
| • | Depreciation and amortization expenses, including depreciation for all owned property and equipment, and amortization of various intangible assets. |
19
Table of Contents
2010 Results Compared to 2009
Consolidated results by business segment are summarized in the following table for years 2010 and
2009.
Operating Results by Segment
| Year Ended December 31, | Fav / (Unfav) | |||||||||||||||
| 2010 | 2009 | $ Change | % Change | |||||||||||||
Net Sales |
||||||||||||||||
Metals |
$ | 841.1 | $ | 726.2 | $ | 114.9 | 15.8 | % | ||||||||
Plastics |
102.6 | 86.4 | 16.2 | 18.8 | % | |||||||||||
Total Net Sales |
$ | 943.7 | $ | 812.6 | $ | 131.1 | 16.1 | % | ||||||||
Cost of Materials |
||||||||||||||||
Metals |
$ | 631.1 | $ | 551.9 | $ | (79.2 | ) | (14.4 | )% | |||||||
% of Metals Sales |
75.0 | % | 76.0 | % | ||||||||||||
Plastics |
69.8 | 59.4 | (10.4 | ) | (17.5 | )% | ||||||||||
% of Plastics Sales |
68.0 | % | 68.8 | % | ||||||||||||
Total Cost of Materials |
$ | 700.9 | $ | 611.3 | $ | (89.6 | ) | (14.7 | )% | |||||||
% of Total Sales |
74.3 | % | 75.2 | % | ||||||||||||
Operating Costs and Expenses |
||||||||||||||||
Metals |
$ | 215.5 | $ | 206.4 | $ | (9.1 | ) | (4.4 | )% | |||||||
Plastics |
29.3 | 26.7 | (2.6 | ) | (9.7 | )% | ||||||||||
Other |
7.4 | 5.3 | (2.1 | ) | (39.6 | )% | ||||||||||
Total Operating Costs & Expenses |
$ | 252.2 | $ | 238.4 | $ | (13.8 | ) | (5.8 | )% | |||||||
% of Total Sales |
26.7 | % | 29.3 | % | ||||||||||||
Operating (Loss) Income |
||||||||||||||||
Metals |
$ | (5.5 | ) | $ | (32.1 | ) | $ | 26.6 | 82.9 | % | ||||||
% of Metals Sales |
(0.7 | )% | (4.4 | )% | ||||||||||||
Plastics |
3.6 | 0.3 | 3.3 | 1100 | % | |||||||||||
% of Plastics Sales |
3.5 | % | 0.3 | % | ||||||||||||
Other |
(7.4 | ) | (5.3 | ) | (2.1 | ) | (39.6 | )% | ||||||||
Total Operating (Loss) |
$ | (9.3 | ) | $ | (37.1 | ) | $ | 27.8 | 74.9 | % | ||||||
% of Total Sales |
(1.0 | )% | (4.6 | )% | ||||||||||||
“Other” includes costs of executive, legal and finance departments which are shared by both segments of the Company.
Net Sales:
Consolidated net sales were $943.7 million in 2010, an increase of $131.1 million, or 16.1%, versus
2009. Metals segment net sales during 2010 of $841.1 million were $114.9 million, or 15.8%, higher
than 2009. Higher net sales were primarily the result of higher shipping volumes. Average tons
sold per day increased 14.8% compared to the prior year. The increase in demand experienced in 2010
was driven primarily by alloy bar, carbon bar, SBQ bar and tubing products. Key end-use markets
that experienced increased demand in 2010 compared to 2009 include oil and gas, general equipment
and heavy industrial equipment.
Plastics segment net sales during 2010 of $102.6 million were $16.2 million, or 18.8%, higher than
2009 due to higher sales volume. The Plastics business also experienced increased sales volume
during 2010 reflecting strength in the office furniture and semiconductor end-use markets compared
to 2009.
20
Table of Contents
Cost of Materials:
Cost of materials (exclusive of depreciation and amortization) were $700.9 million, an increase of
$89.6 million, or 14.7%, compared to 2009. Material costs for the Metals segment were $631.1
million or 75.0% as a percent of net sales compared to $551.9 million or 76.0% as a percent of net
sales in 2009. The demand environment in 2010 was better than 2009, reflecting the recovery in the
global economic environment in 2010. The stronger demand experienced in 2010 provided an improved
pricing environment compared to 2009. The Metals segment recorded LIFO expense of $7.7 million,
which resulted in higher cost of materials in 2010, compared to a credit of $14.4 million, which
resulted in lower cost of materials in 2009.
Material costs for the Plastics segment were 68.0% as a percent of net sales in 2010 as compared to
68.8% for the same period last year. The stronger demand experienced in 2010 provided an improved
pricing environment compared to 2009.
During 2010 and 2009, a reduction in inventories resulted in a liquidation of applicable LIFO
inventory quantities carried at lower costs in prior years. On a consolidated basis, cost of
materials for 2010 and 2009 were lower by $12.5 million and $5.6 million, respectively, as a result
of the liquidations.
Operating Expenses and Operating (Loss) Income:
Operating costs and expenses increased $13.8 million, or 5.8%, compared to last year. Operating
costs and expenses for 2010 were $252.2 million, or 26.7% as a percent of net sales, compared to
$238.4 million, or 29.3% as a percent of net sales last year. Operating costs and expenses
included facility consolidation charges of $2.4 million for 2010 and goodwill impairment charges of
$1.4 million during 2009.
In response to the declining demand for its products resulting from continued challenges in the
global economy and the metals and plastics markets, the Company implemented numerous initiatives
during 2009 to align its cost structure with activity levels. The cost reduction actions taken in
2009 primarily focused on payroll related costs, the Company’s largest operating expense category,
resulting in reduced work weeks and furloughs, suspension of the Company’s 401(k) matching
contributions and executive salary reductions of at least 10 percent. Full workweeks and 401(k)
matching contributions were reinstated in January and April 2010, respectively, resulting in
overall increases in payroll related costs in 2010. Other factors that contributed to increased
payroll related costs in 2010 compared to 2009 included merit increases and headcount increases, as
well as higher incentive compensation earned in 2010.
The $13.8 million increase in operating expenses in 2010 compared to 2009 primarily relates to the
following:
| • | Warehouse, processing and delivery costs increased by $13.7 million of which $2.1 million is the result of higher payroll related expenses and facility consolidation charges contributed a $2.4 million increase. The balance of the cost increase is attributed to higher sales volumes as average tons sold per day increased 14.8% compared to the prior year; |
| • | Sales, general and administrative costs increased by $2.1 million. The increase is primarily comprised of $3.7 million of higher payroll related expenses, offset by a decrease of $1.6 million associated with improved customer credit experience in 2010 compared to the prior year; and |
| • | Depreciation and amortization and goodwill impairment charges decreased $0.6 million and $1.4 million, respectively. |
Consolidated operating loss for 2010 was $9.3 million compared to operating loss of $37.1 million
in 2009.
Other Income and Expense, Income Taxes and Net Income:
Interest expense was $5.0 million in 2010, a decrease of $1.5 million versus 2009 as a result of
reduced borrowings.
The Company recorded a tax benefit of $3.1 million and $16.3 million during 2010 and 2009,
respectively. The effective tax rate for 2010 and 2009 was 21.7% and 37.3%, respectively. The effective tax
rate, excluding goodwill impairment charges for 2009, was 38.5%. Higher tax on joint venture
income was offset by the rate differential on foreign income (loss), resulting in a decline in the
effective tax rate compared to 2009.
21
Table of Contents
Equity in earnings of the Company’s joint venture was $5.6 million in 2010 compared to $0.4 million
in 2009. The increase is a result of higher demand in virtually all of the joint venture’s end-use
markets, most notably the automotive and energy sectors, and higher pricing compared to last year.
Consolidated net loss for 2010 was $5.6 million, or $0.25 per diluted share, versus $26.9 million,
or $1.18 per diluted share, for 2009.
2009 Results Compared to 2008
Consolidated results by business segment are summarized in the following table for years 2009 and
2008.
Operating Results by Segment
| Year Ended December 31, | Fav / (Unfav) | |||||||||||||||
| 2009 | 2008 | $ Change | % Change | |||||||||||||
Net Sales |
||||||||||||||||
Metals |
$ | 726.2 | $ | 1,384.8 | $ | (658.6 | ) | (47.6 | )% | |||||||
Plastics |
86.4 | 116.2 | (29.8 | ) | (25.6 | )% | ||||||||||
Total Net Sales |
$ | 812.6 | $ | 1,501.0 | $ | (688.4 | ) | (45.9 | )% | |||||||
Cost of Materials |
||||||||||||||||
Metals |
$ | 551.9 | $ | 1,044.4 | $ | 492.5 | 47.2 | % | ||||||||
% of Metals Sales |
76.0% | 75.4% | ||||||||||||||
Plastics |
59.4 | 79.6 | 20.2 | 25.4 | % | |||||||||||
% of Plastics Sales |
68.8% | 68.5% | ||||||||||||||
Total Cost of Materials |
$ | 611.3 | $ | 1,124.0 | $ | 512.7 | 45.6 | % | ||||||||
% of Total Sales |
75.2% | 74.9% | ||||||||||||||
Operating Costs and Expenses |
||||||||||||||||
Metals |
$ | 206.4 | $ | 328.9 | $ | 122.5 | 37.2 | % | ||||||||
Plastics |
26.7 | 33.4 | 6.7 | 20.1 | % | |||||||||||
Other |
5.3 | 10.6 | 5.3 | 50.0 | % | |||||||||||
Total Operating Costs & Expenses |
$ | 238.4 | $ | 372.9 | $ | 134.5 | 36.1 | % | ||||||||
% of Total Sales |
29.3% | 24.8% | ||||||||||||||
Operating (Loss) Income |
||||||||||||||||
Metals |
$ | (32.1 | ) | $ | 11.5 | $ | (43.6 | ) | (379.1 | )% | ||||||
% of Metals Sales |
(4.4% | ) | 0.8% | |||||||||||||
Plastics |
0.3 | 3.2 | (2.9 | ) | (90.6 | )% | ||||||||||
% of Plastics Sales |
0.3% | 2.8% | ||||||||||||||
Other |
(5.3 | ) | (10.6 | ) | 5.3 | 50.0 | % | |||||||||
Total Operating (Loss) Income |
$ | (37.1 | ) | $ | 4.1 | $ | (41.2 | ) | (1,004.9 | )% | ||||||
% of Total Sales |
(4.6% | ) | 0.3% | |||||||||||||
“Other” includes costs of executive, legal and finance departments which are shared by both segments of the Company.
Net Sales:
Consolidated net sales were $812.6 million in 2009, a decrease of $688.4 million, or 45.9%, versus
2008.
22
Table of Contents
Metals segment net sales during 2009 of $726.2 million were $658.6 million, or 47.6%, lower than
2008. Decreased revenues were primarily the result of lower shipping volumes in light of continued
challenges in the global economy and the metals and plastics markets. Average tons sold per day
decreased 43.5% compared to the prior year. The softness experienced during 2009 was broad-based,
impacting virtually all end-markets and products compared to 2008. The Company also experienced
lower sales prices for its products during 2009; however, the impact of these price decreases on
net sales was partially mitigated by a changing sales mix as compared to 2008.
Plastics segment net sales during 2009 of $86.4 million were $29.8 million, or 25.6%, lower than
2008 due to lower sales volume. The Plastics business also experienced softer demand during 2009
across its primary end markets including retail, marine and automotive when compared to 2008.
Cost of Materials:
Cost of materials (exclusive of depreciation and amortization) were $611.3 million, a decrease of
$512.7 million, or 45.6%, compared to 2008. Material costs for the Metals segment were 76.0% as a
percent of net sales in 2009, an increase of 0.6% as a percent of net sales, from 2008. In 2009,
cost of materials included obsolete inventory charges of approximately $6.8 million, an increase of
$6.6 million compared to 2008. Approximately $4.3 million of the 2009 obsolete inventory charges
were recorded during the fourth quarter. The low-demand business environment in 2009 created
intense competitive pricing pressures throughout much of 2009, which was also a factor that
increased material costs as a percent of net sales in 2009 compared to 2008 and compared to the
Company’s historical range for material costs as a percent of net sales of 71% to 75%.
Material costs for the Plastics segment were 68.8% as a percent of net sales in 2009 as compared to
68.5% for the same period last year. The slight increase in material costs as a percent of net
sales in 2009 was primarily due to the Plastics segment lowering their prices given the competitive
pricing in the marketplace.
For 2009, the Company experienced LIFO income of approximately $16.9 million, with LIFO income of
approximately $25.6 million being recorded for the first three quarters of 2009, reduced by LIFO
expense of approximately $8.7 million recorded in the fourth quarter of 2009. The LIFO income of
approximately $16.9 million for the full-year 2009 was primarily a result of a reduction in
inventory costs and quantities in 2009 compared to 2008.
Operating Expenses and Operating (Loss) Income:
Operating costs and expenses decreased $134.5 million, or 36.1%, compared to last year. Operating
costs and expenses for 2009 were $238.4 million, or 29.3% as a percent of net sales, compared to
$372.9 million, or 24.8% as a percent of net sales last year. The decrease in operating costs and
expenses was $77 million excluding goodwill impairment charges of $1.4 million and $58.9 million in
2009 and 2008, respectively.
In response to lower sales activity resulting from the decline in the global economy and the metals
and plastics markets, the Company implemented several initiatives during 2009 to align its cost
structure with lower activity levels. The cost reduction actions primarily focused on payroll
related costs, the Company’s largest operating expense category, resulting in reduced work weeks
and furloughs, suspension of the Company’s 401(k) contributions and executive salary reductions of
10 percent.
The $77 million decrease in operating expenses for 2009 compared to 2008, excluding goodwill
impairment charges, primarily relates to the following:
| • | Warehouse, processing and delivery costs decreased by $44.6 million of which $24.4 million is the result of lower sales volume and $20.2 million is due to decreased payroll costs associated with workforce reductions, reduced workweeks and suspension of the Company 401(k) contributions; |
| • | Sales, general and administrative costs decreased by $30.4 million primarily due to lower ERP implementation costs of $5.9 million and decreased payroll related costs of $15.2 million associated with workforce reductions and reduced workweeks, reduced incentive compensation and suspension of Company 401(k) contributions; and |
| • | Depreciation and amortization expense was $2.0 million lower due to a decrease in capital expenditures across the Company and certain intangible assets of Metals U.K. and Transtar becoming fully amortized in 2008 and the third quarter of 2009, respectively. |
23
Table of Contents
Operating costs and expenses included goodwill impairment charges of $1.4 million during 2009 and
$58.9 million during 2008.
Consolidated operating loss for 2009 was $37.1 million compared to operating income of $4.1 million
in 2008. The Company’s 2009 operating (loss) income as a percentage of net sales decreased to
(4.6)% from 0.3% in 2008, primarily due to decreased sales volume in light of the current business
environment.
Other Income and Expense, Income Taxes and Net Income:
Interest expense was $6.4 million in 2009, a decrease of $2.9 million versus 2008. The decrease in
interest expense in 2009 is a result of reduced borrowings and lower weighted average interest
rates in 2009 compared to 2008.
The Company recorded a $16.3 million tax benefit and a $20.7 million tax provision during 2009 and
2008, respectively. The effective tax rate for 2009 and 2008 was 37.3% and (394.8)%, respectively.
The effective tax rate, excluding goodwill impairment charges for 2009 and 2008, was 38.5% and
38.6%, respectively. The effective tax rate, excluding goodwill impairment charges, compared to
2008 remained relatively unchanged as decreases in the effective rate due to lower tax on
joint-venture income were offset by increases in the rate for state taxes and the rate differential
on foreign income (loss).
Equity in earnings of the Company’s joint venture was $0.4 million in 2009, $8.4 million lower than
2008, reflecting overall weaker demand for Kreher’s products due to the economic decline over the
past year.
Consolidated net loss for 2009 was $26.9 million, or $1.18 per diluted share, versus $17.1 million,
or $0.76 per diluted share, for 2008.
Liquidity and Capital Resources
The Company’s principal sources of liquidity are earnings from operations, management of working
capital and available borrowing capacity to fund working capital needs and growth initiatives.
During 2010 and 2009, the Company focused on reducing working capital, primarily inventories,
resulting in net cash flow from operations of $34.4 million and $53.1 million, respectively.
During 2010, net sales exceeded cash receipts from customers. The resulting increase in
receivables generated a cash outflow of $22.5 million compared to a $57.0 million cash inflow for
2009. Net sales increased 16.1% from 2009. Average receivable days outstanding was 49.9 days for
2010 compared to 54.8 days for 2009, reflecting faster collections.
During 2010, sales of inventory exceeded inventory purchases. The resulting reduction in
inventories generated a cash inflow of $39.7 million compared to a $74.0 million cash inflow for
2009. Average DSI was 142.9 days for 2010 versus 189.3 days for 2009.
During 2010, cash paid for inventories and other goods and services exceeded purchases. The
resulting decrease in accounts payable and accrued liabilities generated a cash outflow of $0.3
million compared to $60.8 million cash outflow in 2009.
The Company received its 2009 federal income tax refund of approximately $6.3 million during
January 2011.
On November 5, 2009 the Company filed a universal shelf registration statement with the Securities
and Exchange Commission, which was declared effective on November 23, 2009. The registration
statement gives the Company the flexibility to offer and sell from time to time in the future up to
$100 million of equity, debt or other types of securities as described in the registration
statement, or any combination of such securities. If securities are issued, the Company may use the
proceeds for general corporate purposes, including acquisitions, capital expenditures, working
capital and repayment of debt.
24
Table of Contents
Available revolving credit capacity is primarily used to fund working capital needs. Taking into
consideration the most recent borrowing base calculation as of December 31, 2010, which reflects
trade receivables, inventory, letters of credit and other outstanding secured indebtedness,
available credit capacity consisted of the following:
| Weighted Average | ||||||||||||
| Outstanding | Interest Rate for the | |||||||||||
| Borrowings as of | Availability as of | Year Ended | ||||||||||
| Debt type | December 31, 2010 | December 31, 2010 | December 31, 2010 | |||||||||
U.S. Revolver A |
$ | — | $ | 72.7 | 2.78 | % | ||||||
U.S. Revolver B |
25.7 | 24.3 | 1.55 | % | ||||||||
Canadian facility |
— | 9.8 | 0.21 | % | ||||||||
As of December 31, 2010, the Company had no short-term debt outstanding under its revolving credit
facilities.
Management believes the Company will be able to generate sufficient cash from operations and
planned working capital improvements to fund its ongoing capital expenditure programs and meet its
debt obligations for at least the next twelve months. In addition, the Company has available
borrowing capacity, as discussed above.
As of December 31, 2010 the Company remained in compliance with the covenants of its credit
agreements, which require it to maintain certain funded debt-to-capital and working capital-to-debt
ratios, and a minimum adjusted consolidated net worth, as defined in the Company’s credit
agreements and outlined in the table below:
| Requirement per | Actual at | |||||||
| Covenant Description | Credit Agreement | December 31, 2010 | ||||||
Funded debt-to-capital ratio |
less than 0.55 | 0.15 | ||||||
Working capital-to-debt ratio |
greater than 1.0 | 4.26 | ||||||
Minimum adjusted consolidated net worth |
$ | 261.6 | $ | 325.5 | ||||
As of December 31, 2010, the Company had $2.9 million of irrevocable letters of credit outstanding,
which primarily consisted of $2.2 million for compliance with the insurance reserve requirements of
its workers’ compensation insurance carriers.
Capital Expenditures
Capital expenditures for 2010 were $7.6 million compared to $8.7 million in 2009. The expenditures
during 2010 were comprised of approximately $2.6 million of ERP and other information technology
enhancements, with the balance resulting from normal equipment upgrades throughout the year.
Management believes that capital expenditures will approximate $14 million in 2011.
Contractual Obligations and Other Commitments
The following table includes information about the Company’s contractual obligations that impact
its short-term and long-term liquidity and capital needs. The table includes information about
payments due under specified contractual obligations and is aggregated by type of contractual
obligation. It includes the maturity profile of the Company’s consolidated long-term debt,
operating leases and other long-term liabilities.
25
Table of Contents
At December 31, 2010, the Company’s contractual obligations, including estimated payments by
period, were as follows:
| Less | One to | More | ||||||||||||||||||
| Than One | Three | Three to | Than Five | |||||||||||||||||
| Payments Due In | Total | Year | Years | Five Years | Years | |||||||||||||||
Long-term debt obligations (excluding
capital lease obligations) |
$ | 68.5 | $ | 7.6 | $ | 42.3 | $ | 18.6 | $ | — | ||||||||||
Interest payments on debt obligations (a) |
11.2 | 3.6 | 5.7 | 1.9 | — | |||||||||||||||
Capital lease obligations |
0.6 | 0.4 | 0.2 | — | — | |||||||||||||||
Operating lease obligations |
71.1 | 11.9 | 20.7 | 18.1 | 20.4 | |||||||||||||||
Purchase obligations (b) |
329.6 | 302.2 | 27.4 | — | — | |||||||||||||||
Other (c) |
4.9 | 4.1 | 0.8 | — | — | |||||||||||||||
Total |
$ | 485.9 | $ | 329.8 | $ | 97.1 | $ | 38.6 | $ | 20.4 | ||||||||||
| a) | Interest payments on debt obligations represent interest on all Company debt outstanding as of December 31, 2010. The interest payment amounts related to the variable rate component of the Company’s debt assume that interest will be paid at the rates prevailing at December 31, 2010. Future interest rates may change, and therefore, actual interest payments could differ from those disclosed in the table above. | |
| b) | Purchase obligations consist of raw material purchases made in the normal course of business. The Company has contracts to purchase minimum quantities of material with certain suppliers. For each contractual purchase obligation, the Company generally has a purchase agreement from its customer for the same amount of material over the same time period. | |
| c) | “Other” is comprised of i) deferred revenues that represent commitments to deliver products, ii) obligations related to recognizing and measuring tax positions taken or expected to be taken in a tax return that directly or indirectly affect amounts reported in financial statements and iii) contingent purchase price payable related to Metals U.K. acquisition which was paid in January 2011 based on the achievement of performance targets related to the three year period ended December 31, 2010. The uncertain tax positions included in the Company’s obligations are related to temporary differences and uncertain tax positions where the Company anticipates a high probability of settlement within a given timeframe. The years for which the temporary differences related to the uncertain tax positions will reverse have been estimated in scheduling the obligations within the table. |
The table and corresponding footnotes above do not include $10.8 million of other non-current
liabilities recorded on the consolidated balance sheets. These non-current liabilities consist of
liabilities related to the Company’s non-funded supplemental pension plan and postretirement
benefit plans for which payment periods cannot be determined. Non-current liabilities also include
$26.8 million of deferred income taxes and the deferred gain on the sale of certain assets,
resulting from previous sale-leaseback transactions.
Pension Funding
The Company’s funding policy on its defined benefit pension plans is to satisfy the minimum funding
requirements of the Employee Retirement Income Security Act (“ERISA”). Future funding requirements
are dependent upon various factors outside the Company’s control including, but not limited to,
fund asset performance and changes in regulatory or accounting requirements. Based upon factors
known and considered as of December 31, 2010, the Company does not anticipate making significant
cash contributions to the pension plans in 2011.
The investment target portfolio allocation for the Company-sponsored pension plans and supplemental
pension plan focuses primarily on corporate fixed income securities that match the overall duration
and term of the Company’s pension liability structure. Refer to “Retirement Plans” within Critical
Accounting Policies and Note 5 to the consolidated financial statements for additional details
regarding other plan assumptions.
26
Table of Contents
Off-Balance Sheet Arrangements
With the exception of letters of credit and operating lease financing on certain equipment used in
the operation of the business, it is not the Company’s general practice to use off-balance sheet
arrangements, such as third-party special-purpose entities or guarantees of third parties.
As of December 31, 2010, the Company had $2.9 million of irrevocable letters of credit
outstanding which primarily consisted of $2.2 million for compliance with the insurance reserve
requirements of its workers’ compensation insurance carriers.
Obligations of the Company associated with its leased equipment are disclosed under the
“Contractual Obligations and Other Commitments” section above.
Critical Accounting Policies
The consolidated financial statements have been prepared in accordance with accounting principles
generally accepted in the United States of America, and include amounts that are based on
management’s estimates, judgments and assumptions that affect the reported amounts of assets and
liabilities and disclosure of contingent assets and liabilities at the date of the financial
statements and the reported amounts of revenue and expenses during the reporting period. The
following is a description of the Company’s accounting policies that management believes require
the most significant judgments and estimates when preparing the Company’s consolidated financial
statements:
Revenue Recognition and Accounts Receivable — Revenue from the sales of products is recognized
when the earnings process is complete and when the risk and rewards of ownership have passed to the
customer, which is primarily at the time of shipment. Revenue recognized other than at the time of
shipment represents less than 5% of the Company’s consolidated net sales. Revenue from shipping
and handling charges is recorded in net sales. Provisions for allowances related to sales
discounts and rebates are recorded based on terms of the sale in the period that the sale is
recorded. Management utilizes historical information and the current sales trends of the business
to estimate such provisions. Actual results could differ from these estimates. The provisions
related to discounts and rebates due to customers are recorded as a reduction within net sales in
the Company’s consolidated statements of operations.
The Company maintains an allowance for doubtful accounts resulting from the inability of our
customers to make required payments. The allowance for doubtful accounts is maintained at a level
considered appropriate based on historical experience and specific identification of customer
receivable balances for which collection is unlikely. The provisions for doubtful accounts are
recorded in sales, general and administrative expense in the Company’s consolidated statements of
operations. Estimations for the doubtful accounts are based upon historical write-off experience
as a percentage of net sales and judgments about the probable effects of economic conditions on
certain customers, which can fluctuate significantly from year to year. The Company cannot be
certain that the rate of future credit losses will be similar to past experience.
The Company also maintains an allowance for credit memos for estimated credit memos to be issued
against current sales. Credit memos are primarily issued to correct order entry and billing
errors. Estimations for the allowance for credit memos are based upon the application of a
historical issuance lag period to the average credit memos issued each month. If actual results
differ from historical experience, there could be a negative impact on the Company’s operating
results.
Inventories — Approximately eighty percent of the Company’s inventories are valued using the
last-in, first-out inventory costing method. Under this method, the current value of materials
sold is recorded as cost of materials rather than the cost in the order in which it was purchased.
This method of costing is subject to year-to-year fluctuations in cost of material sold, which is
influenced by the inflation or deflation existing within the metals or plastics industries and the
quantities and mix of inventory on hand. The use of LIFO for inventory valuation was selected to
better match replacement cost of inventory with the current pricing used to bill customers.
The Company maintains allowances for excess and obsolete inventory and physical inventory losses.
The excess and obsolete inventory allowance is determined based on specific identification of
material, adjusted for expected scrap value to be received. The allowance for physical inventory
losses is determined based on historical physical inventory experience. The Company’s operating
results could be impacted if scrap value received or physical inventory experience differs from
estimates.
27
Table of Contents
Income Taxes — The Company’s income tax expense, deferred tax assets and liabilities and
reserve for uncertain tax positions reflect management’s best estimate of estimated taxes to be
paid. The Company is subject to income taxes in the U.S. and several foreign jurisdictions. The
determination of the consolidated income tax expense requires significant judgment and estimation
by management. It is possible that actual results could differ from the estimates that management
has used to determine its consolidated income tax expense.
The Company accounts for income taxes under the asset and liability method, which requires the
recognition of deferred tax assets and liabilities for the expected future tax consequences of
events that have been included in the financial statements. Under this method, deferred tax assets
and liabilities are determined based on the differences between the financial statements and the
tax basis of assets and liabilities using enacted tax rates in effect for the year in which the
differences are expected to reverse. The effect of a change in tax rates on deferred tax assets
and liabilities is recognized in income in the period that includes the enactment date. The
Company has not provided deferred taxes relative to undistributed earnings of foreign subsidiaries
as such undistributed earnings are considered to be permanently reinvested based on management’s
overall business strategy. Undistributed earnings may become taxable upon their remittance as
dividends or upon the sale or liquidation of foreign subsidiaries. It is not practicable to
determine the amounts of net additional income tax that may be payable if such earnings were
repatriated.
The Company records valuation allowances against its deferred tax assets when it is more likely
than not that the amounts will not be realized. In making such determination, the Company
considers all available positive and negative evidence, including scheduled reversals of deferred
tax liabilities, projected future taxable income, tax planning strategies and recent financial
operations. In the period a determination is made that the Company will not be able to realize its
deferred income tax assets, an adjustment to the valuation allowance will be made which will
increase the provision for income taxes. Based upon available evidence, including forecasted
financial statements, the Company has determined that it is more likely than not that the deferred
tax assets will be realized due to the fact that the Company believes it will either be able to
carry its net operating losses back to prior years or have sufficient earnings in future years to
use the carryforwards prior to expiration. As a result, the Company has not recorded a valuation
allowance on its deferred tax assets as of December 31, 2010. As of December 31, 2010, the Company
is in an overall net deferred tax liability position in most of its tax jurisdictions.
The Company recognizes the tax benefits for uncertain tax positions only if those benefits are more
likely than not to be sustained upon examination by the relevant tax authorities. Unrecognized tax
benefits are subsequently recognized at the time the recognition threshold is met, the tax matter
is effectively settled or the statute of limitations expires for the return containing the tax
position, whichever is earlier. Due to the complexity of some of these uncertainties, the ultimate
resolution may result in a payment that is materially different from the current estimate. These
differences will be reflected in the Company’s income tax expense in the period in which they are
determined. Due to the potential expiration of statutes of limitations, it is reasonably possible
that the gross unrecognized tax benefits may potentially decrease within the next 12 months by a
range of approximately $0 to $0.7 million.
Retirement Plans — The Company values retirement plan liabilities based on assumptions and
valuations established by management. Future valuations are subject to market changes, which are
not in the control of the Company and could differ materially from the amounts currently reported.
The Company evaluates the discount rate and expected return on assets at least annually and
evaluates other assumptions involving demographic factors, such as retirement age, mortality and
turnover periodically, and updates them to reflect actual experience and expectations for the
future. Actual results in any given year will often differ from actuarial assumptions because of
economic and other factors.
Accumulated and projected benefit obligations are expressed as the present value of future cash
payments which are discounted using the weighted average of market-observed yields for high quality
fixed income securities with maturities that correspond to the payment of benefits. Lower discount
rates increase present values and subsequent-year pension expense; higher discount rates decrease
present values and subsequent-year pension expense. Discount rates used for determining the
Company’s projected benefit obligation for retirement plans were 5.25% and 5.75% at December 31,
2010 and 2009.
28
Table of Contents
The Company’s pension plan asset portfolio as of December 31, 2010 is primarily invested in fixed
income securities, which generally fall within Level 2 of the fair value hierarchy. Assets in the
Company’s pension plans have earned approximately 12% since inception in 1979. The target
investment asset allocation for the pension plans’ funds focuses primarily on corporate fixed
income securities that match the overall duration and term of the Company’s pension liability
structure. As of December 31, 2010 and 2009, the funding surplus was approximately 10% and 12%,
respectively. The Company estimates that a 0.5% change in its discount rate would change its 2011
net periodic pension cost by less than $1.0 million. To determine the expected long-term rate of
return on the pension plans’ assets, current and expected asset allocations are considered, as well
as historical and expected returns on various categories of plan assets.
Goodwill and Other Intangible Assets Impairment — Goodwill is subject to an annual
impairment test using a two-step process. The carrying value of the Company’s goodwill is
evaluated annually on January 1st of each fiscal year or when certain triggering events
occur which require a more current valuation. The Company assesses, at least quarterly, whether
any triggering events have occurred.
A two-step method is used for determining goodwill impairment. The first step (“Step I”) of the
goodwill impairment test is used to identify potential impairment. The evaluation is based on the
comparison of each reporting unit’s fair value to its carrying value. If the carrying value
exceeds the fair value, the second step (“Step II”) of the goodwill impairment test must be
performed to measure the amount of impairment loss, if any. Step II of the goodwill impairment
test compares the implied fair value of reporting unit goodwill to the carrying amount of that
goodwill. The implied fair value of goodwill is determined in the same manner as the amount of
goodwill recognized in a business combination. The allocation of fair value to reporting units
requires several analyses to determine fair value of assets and liabilities including, among
others, customer relationships, non-compete agreements, trade names and property, plant and
equipment (valued at replacement cost). If the carrying amount of the reporting unit goodwill
exceeds the implied fair value of that goodwill, an impairment loss is recognized in the amount
equal to the excess.
Fair value is determined using a combination of an income approach, which estimates fair value
based on a discounted cash flow analysis using historical data and management estimates of future
cash flows, and a market approach, which estimates fair value using market multiples of various
financial measures of comparable public companies.
The determination of the fair value of the reporting units requires significant estimates and
assumptions to be made by management. These estimates and assumptions primarily include, but are
not limited to: the selection of appropriate peer group companies; control premiums appropriate for
acquisitions in the industry in which the Company competes; discount rates; terminal growth rates;
long-term projections of future financial performance; and relative weighting of income and market
approaches. The long-term projections used in the valuation are developed as part of the Company’s
annual budgeting and strategic planning process. The discount rates used to determine the fair
values of the reporting units are those of a hypothetical market participant which are developed
based upon an analysis of comparable companies and include adjustments made to account for any
individual reporting unit specific attributes such as, size and industry. The estimated discount
rate is a key assumption that impacts the estimated fair value of the reporting units. The
discount rate for each reporting unit was estimated to be between 16% and 18% as of January 1,
2010. Although the Company believes its estimates of fair value are reasonable, actual financial
results could differ from those estimates due to the inherent uncertainty involved in making such
estimates. Changes in assumptions concerning future financial results or other underlying
assumptions could have a significant impact on either the fair value of the reporting units, the
amount of the goodwill impairment charge, or both. Future declines in the overall market value of
the Company’s equity may also result in a conclusion that the fair value of one or more reporting
units has declined below its carrying value.
29
Table of Contents
One measure of the sensitivity of the amount of goodwill impairment charges to key assumptions is
the amount by which each reporting unit “passed” (fair value exceeds the carrying amount) or
“failed” (carrying amount exceeds the fair value) Step I of the goodwill impairment test. Based on
the impairment test performed on January 1, 2010, a 10% decrease in the fair value estimates of the
reporting units would have caused the Plate and Aerospace reporting units to fall below their
respective carrying values. The Aerospace and Plate reporting unit fair values exceeded the
carrying values by approximately 6% and 5%, respectively. The Company could be subject to an
impairment charge in the Plate and Aerospace reporting units, which have approximately $9 million
and $21 million in goodwill, respectively, as of December 31, 2010, in future periods if market
conditions worsen or the economic recovery differs significantly from projections.
The majority of the Company’s recorded intangible assets were acquired as part of the Transtar and
Metals U.K. acquisitions in September 2006 and January 2008, respectively, and consist primarily of
customer relationships and non-compete agreements. The initial values of the intangible assets
were based on a discounted cash flow valuation using assumptions made by management as to future
revenues from select customers, the level and pace of attrition in such revenues over time and
assumed operating income amounts generated from such revenues. These intangible assets are
amortized over their useful lives, which are 4 — 11 years for customer relationships and 3 years
for non-compete agreements. Useful lives are estimated by management and determined based on the
timeframe over which a significant portion of the estimated future cash flows are expected to be
realized from the respective intangible assets. Furthermore, when certain conditions or certain
triggering events occur, a separate test of impairment, similar to the impairment test for
long-lived assets discussed below, is performed. If the intangible asset is deemed to be impaired,
such asset will be written down to its fair value.
See Note 8 to the consolidated financial statements for detailed information on goodwill and
intangible assets.
Long-Lived Assets — The Company’s long-lived assets are reviewed for impairment whenever events or
changes in circumstances indicate that the carrying amount of an asset may not be recoverable.
Recoverability of assets to be held and used is measured by a comparison of the carrying amount of
an asset to future net cash flows (undiscounted and without interest charges) expected to be
generated by the asset. If such assets are impaired, the impairment charge is calculated as the
amount by which the carrying amount of the assets exceeds the fair value of the assets.
Determining whether impairment has occurred typically requires various estimates and assumptions,
including determining which undiscounted cash flows are directly related to the potentially
impaired asset, the useful life over which cash flows will occur, their amount, and the asset’s
residual value, if any. The Company derives the required undiscounted cash flow estimates from
historical experience and internal business plans. Measurement of an impairment loss requires a
determination of fair value, which is based on available information. The Company uses an income
approach, which estimates fair value based on estimates of future cash flows discounted at an
appropriate interest rate.
Share-Based Compensation — The Company offers share-based compensation to executive and other key
employees, as well as its directors. Share-based compensation expense is recorded over the vesting
period based on the grant date fair value of the stock award when granted. Stock options have an
exercise price equal to the market price of the Company’s stock on the grant date (options granted
prior to 2010) or the average closing price of the Company’s stock for the ten trading days
preceding the grant date (options granted in 2010) and have a contractual life of eight to ten
years. Options and restricted stock generally vest in one to five years for executives and
employees and one year for directors. The Company may either issue shares from treasury or new
shares upon share option exercise.
Stock options are valued based on the market price of the Company’s stock on the grant date, using
a Black-Scholes option-pricing model. The expense associated with stock option awards is recorded
on a straight-line basis over the vesting period, net of estimated forfeitures.
30
Table of Contents
The grant date fair value for stock options granted during 2010 was estimated using the
Black-Scholes option-pricing model with the following assumptions:
| 2010 | ||||
Expected volatility |
58.5 | % | ||
Risk-free interest rate |
2.3 | % | ||
Expected life (in years) |
5.5 | |||
Expected dividend yield |
1.2 | % | ||
Share-based compensation expense for non-vested shares and restricted share units in the long-term
incentive plans (“LTI Plans”) and long-term compensation plan (“LTC Plan”) is established using the
market price of the Company’s common stock on the date of grant.
The fair value of performance units granted under the LTI Plans is based on the market price of the
Company’s stock on the date of grant adjusted to reflect the fact that the participants do not
participate in dividends during the vesting period. The grant date fair value of performance
shares awarded under the LTC Plan was estimated using a Monte Carlo simulation with the following
assumptions as the potential award is dependent upon a market condition:
| 2010 | ||||
Expected volatility |
61.6 | % | ||
Risk-free interest rate |
1.45 | % | ||
Expected life (in years) |
2.8 | |||
Expected dividend yield |
— | |||
Management estimates the probable number of shares which will ultimately vest when calculating the
share-based compensation expense for the LTI and LTC Plans. As of December 31, 2010, the Company’s
weighted average forfeiture rate is approximately 21%. The actual number of shares that vest may
differ from management’s estimate. Final award vesting and distribution of performance awards
granted under the LTI and LTC Plans are determined based on the Company’s actual performance versus
the target goals for a three-year consecutive period as defined in each plan. Partial awards can
be earned for performance less than the target goal, but in excess of minimum goals; and award
distributions above the target can be achieved if the maximum goals are met or exceeded.
The performance goals for the 2008 and 2009 LTI Plans are three-year cumulative net income and
average return on total capital for the same three-year period. If the performance goals are not
expected to be met for the LTI Plans, no compensation expense is recognized and any previously
recognized compensation expense is reversed. No share-based compensation expense was recorded
during 2010 related to performance awards under the LTI Plans as performance goals are not expected
to be met.
Under the 2010 LTC Plan, the potential award for the performance shares granted is dependent on the
Company’s relative total shareholder return (“RTSR”), which represents a market condition. RTSR is
measured against a group of peer companies either in the metals industry or in the industrial
products distribution industry. Compensation expense for performance awards containing a market
condition is recognized regardless of whether the market condition is achieved to the extent the
requisite service period condition is met.
Unless covered by a specific change-in-control or severance arrangement, participants to whom
restricted stock units, performance shares and other non-vested shares have been granted must be
employed by the Company on the vesting date or at the end of the performance period, respectively,
or the award will be forfeited.
Fair Value of Financial Instruments — The three-tier value hierarchy the Company utilizes, which
prioritizes the inputs used in the valuation methodologies, is:
Level 1—Valuations based on quoted prices for identical assets and liabilities in active
markets.
Level 2—Valuations based on observable inputs other than quoted prices included in Level
1, such as quoted prices for similar assets and liabilities in active markets, quoted prices
for identical or similar assets and liabilities in markets that are not active, or other inputs
that are observable or can be corroborated by observable market data.
31
Table of Contents
Level 3—Valuations based on unobservable inputs reflecting our own assumptions,
consistent with reasonably available assumptions made by other market participants.
The fair value of cash, accounts receivable and accounts payable approximate their carrying values.
The fair value of cash equivalents are determined using the fair value hierarchy described above.
Cash equivalents consisting of money market funds are valued based on quoted prices in active
markets and as a result are classified as Level 1. The Company’s pension plan asset portfolio as of
December 31, 2010 is primarily invested in fixed income securities, which generally fall within
Level 2 of the fair value hierarchy. Fair value disclosures for fixed rate debt are determined
using a market approach, which estimates fair value based on companies with similar credit quality
and size of debt issuances.
Recent Accounting Pronouncements
Effective January 1, 2010, the Company adopted new consolidation guidance that applies to variable
interest entities.
See Note 1 to the consolidated financial statements for detailed information on recent accounting
pronouncements.
| ITEM 7a | — Quantitative and Qualitative Disclosures about Market Risk |
The Company is exposed to interest rate, commodity price, and foreign exchange rate risks that
arise in the normal course of business.
Interest Rate Risk — The Company finances its operations with fixed and variable rate borrowings.
Market risk arises from changes in variable interest rates. The Company’s interest rate on
borrowings under the $230 million five-year secured revolver is subject to changes in the LIBOR and
Prime interest rate. Based on the Company’s variable rate debt instruments at December 31, 2010,
if interest rates were to increase hypothetically by 100 basis points, 2010 interest expense would
have increased by approximately $0.3 million.
Commodity Price Risk — The Company’s raw material costs are comprised primarily of engineered
metals and plastics. Market risk arises from changes in the price of steel, other metals and
plastics. Although average selling prices generally increase or decrease as material costs
increase or decrease, the impact of a change in the purchase price of materials is more immediately
reflected in the Company’s cost of materials than in its selling prices. The ability to pass
surcharges on to customers immediately can be limited due to contractual provisions with those
customers. Therefore, a lag may exist between when the surcharge impacts net sales and cost of
materials, respectively, which could result in a higher or lower operating profit.
Foreign Currency Risk — The Company conducts the majority of its business in the United States but
also has operations in Canada, Mexico, France, the United Kingdom, China and Singapore. The
Company’s results of operations are not materially affected by fluctuations in these foreign
currencies and, therefore, the Company has no financial instruments in place for managing the
exposure to foreign currency exchange rates.
32
Table of Contents
ITEM 8 — Financial Statements and Supplementary Data
Amounts in thousands, except par value and per share data
Consolidated Statements of Operations
| Year Ended December 31, | ||||||||||||
| 2010 | 2009 | 2008 | ||||||||||
Net sales |
$ | 943,706 | $ | 812,638 | $ | 1,501,036 | ||||||
Costs and expenses: |
||||||||||||
Cost of materials (exclusive of depreciation and amortization) |
700,854 | 611,352 | 1,123,977 | |||||||||
Warehouse, processing and delivery expense |
123,318 | 109,627 | 154,189 | |||||||||
Sales, general and administrative expense |
108,223 | 106,140 | 136,551 | |||||||||
Depreciation and amortization expense |
20,649 | 21,291 | 23,327 | |||||||||
Impairment of goodwill |
— | 1,357 | 58,860 | |||||||||
Operating (loss) income |
(9,338 | ) | (37,129 | ) | 4,132 | |||||||
Interest expense, net |
(4,988 | ) | (6,440 | ) | (9,373 | ) | ||||||
Loss before income taxes and equity in earnings of joint venture |
(14,326 | ) | (43,569 | ) | (5,241 | ) | ||||||
Income taxes |
3,101 | 16,264 | (20,690 | ) | ||||||||
Loss before equity in earnings of joint venture |
(11,225 | ) | (27,305 | ) | (25,931 | ) | ||||||
Equity in earnings of joint venture |
5,585 | 402 | 8,849 | |||||||||
Net loss |
(5,640 | ) | (26,903 | ) | (17,082 | ) | ||||||
Basic loss per share |
$ | (0.25 | ) | $ | (1.18 | ) | $ | (0.76 | ) | |||
Diluted loss per share |
$ | (0.25 | ) | $ | (1.18 | ) | $ | (0.76 | ) | |||
Dividends per common share |
$ | — | $ | 0.06 | $ | 0.24 | ||||||
The accompanying notes to consolidated financial statements are an integral part of these statements.
33
Table of Contents
Consolidated Balance Sheets
| December 31, | ||||||||
| 2010 | 2009 | |||||||
Assets |
||||||||
Current assets |
||||||||
Cash and cash equivalents |
$ | 36,716 | $ | 28,311 | ||||
Accounts receivable, less allowances of $3,848 and $4,195 |
128,365 | 105,832 | ||||||
Inventories, principally on last-in first-out basis (replacement cost
higher by $122,340 and $116,816) |
130,917 | 170,960 | ||||||
Other current assets |
6,832 | 5,241 | ||||||
Income tax receivable |
8,192 | 18,970 | ||||||
Total current assets |
311,022 | 329,314 | ||||||
Investment in joint venture |
27,879 | 23,468 | ||||||
Goodwill |
50,110 | 50,072 | ||||||
Intangible assets |
41,427 | 48,575 | ||||||
Prepaid pension cost |
18,580 | 19,913 | ||||||
Other assets |
3,619 | 3,906 | ||||||
Property, plant and equipment, at cost |
||||||||
Land |
5,195 | 5,192 | ||||||
Building |
52,277 | 51,945 | ||||||
Machinery and equipment |
182,178 | 178,545 | ||||||
| 239,650 | 235,682 | |||||||
Less — accumulated depreciation |
(162,935 | ) | (152,929 | ) | ||||
| 76,715 | 82,753 | |||||||
Total assets |
$ | 529,352 | $ | 558,001 | ||||
Liabilities and Stockholders’ Equity |
||||||||
Current liabilities |
||||||||
Accounts payable |
$ | 71,764 | $ | 71,295 | ||||
Accrued payroll and employee benefits |
16,984 | 11,117 | ||||||
Accrued liabilities |
14,336 | 11,302 | ||||||
Income taxes payable |
2,357 | 1,848 | ||||||
Deferred income taxes |
2,461 | 9,706 | ||||||
Current portion of long-term debt |
8,012 | 7,778 | ||||||
Short-term debt |
— | 13,720 | ||||||
Total current liabilities |
115,914 | 126,766 | ||||||
Long-term debt, less current portion |
61,127 | 67,686 | ||||||
Deferred income taxes |
26,754 | 32,032 | ||||||
Other non-current liabilities |
3,390 | 5,281 | ||||||
Pension and post retirement benefit obligations |
8,708 | 8,028 | ||||||
Commitments and contingencies |
||||||||
Stockholders’ equity |
||||||||
Preferred stock, $0.01 par value - 10,000 shares authorized; no shares
issued and outstanding at December 31, 2010 and December 31, 2009 |
— | — | ||||||
Common stock, $0.01 par value - 30,000 shares authorized;
23,149 shares issued and 22,986 outstanding at December 31, 2010
and 23,115 shares issued and 22,906 outstanding at December 31, 2009 |
231 | 230 | ||||||
Additional paid-in capital |
180,519 | 178,129 | ||||||
Retained earnings |
150,747 | 156,387 | ||||||
Accumulated other comprehensive loss |
(15,812 | ) | (13,528 | ) | ||||
Treasury stock, at cost - 163 shares in 2010 and 209 shares in 2009 |
(2,226 | ) | (3,010 | ) | ||||
Total stockholders’ equity |
313,459 | 318,208 | ||||||
Total liabilities and stockholders’ equity |
$ | 529,352 | $ | 558,001 | ||||
The accompanying notes to consolidated financial statements are an integral part of these statements.
34
Table of Contents
Consolidated Statements of Cash Flows
| Years Ended December 31, | ||||||||||||
| 2010 | 2009 | 2008 | ||||||||||
Operating activities: |
||||||||||||
Net loss |
$ | (5,640 | ) | $ | (26,903 | ) | $ | (17,082 | ) | |||
Adjustments to reconcile net loss to net cash from
operating activities: |
||||||||||||
Depreciation and amortization |
20,649 | 21,291 | 23,327 | |||||||||
Amortization of deferred gain |
(890 | ) | (907 | ) | (1,128 | ) | ||||||
Loss on sale of fixed assets |
391 | 2 | 363 | |||||||||
Impairment of goodwill |
— | 1,357 | 58,860 | |||||||||
Equity in earnings of joint venture |
(5,585 | ) | (402 | ) | (8,849 | ) | ||||||
Dividends from joint venture |
1,260 | 485 | 2,955 | |||||||||
Deferred tax (benefit) provision |
(11,386 | ) | 11,208 | (13,578 | ) | |||||||
Share-based compensation expense |
2,411 | 1,370 | 454 | |||||||||
Pension curtailment |
— | — | (472 | ) | ||||||||
Excess tax (benefits) deficiencies from share-based
payment arrangements |
(219 | ) | 132 | (2,881 | ) | |||||||
Increase from changes, net of acquisitions, in: |
||||||||||||
Accounts receivable |
(22,521 | ) | 56,957 | (7,736 | ) | |||||||
Inventories |
39,686 | 73,994 | (32,418 | ) | ||||||||
Other current assets |
(1,718 | ) | 582 | 4,182 | ||||||||
Other assets |
1,084 | (1,543 | ) | 3,364 | ||||||||
Prepaid pension costs |
(1,530 | ) | (913 | ) | (92 | ) | ||||||
Accounts payable |
(1,866 | ) | (53,232 | ) | 13,844 | |||||||
Accrued payroll and employee benefits |
5,827 | 968 | 1,889 | |||||||||
Income taxes payable |
11,536 | (22,882 | ) | 6,985 | ||||||||
Accrued liabilities |
1,586 | (7,561 | ) | (7,900 | ) | |||||||
Postretirement benefit obligations and other liabilities |
1,287 | (873 | ) | (2,340 | ) | |||||||
Net cash from operating activities |
34,362 | 53,130 | 21,747 | |||||||||
Investing activities: |
||||||||||||
Investments and acquisitions, net of cash acquired |
— | — | (26,857 | ) | ||||||||
Capital expenditures |
(7,572 | ) | (8,749 | ) | (26,302 | ) | ||||||
Proceeds from sale of fixed assets |
4 | 19 | 358 | |||||||||
Insurance proceeds |
125 | 1,093 | — | |||||||||
Proceeds from sale of subsidiary |
— | — | 645 | |||||||||
Net cash used in investing activities |
(7,443 | ) | (7,637 | ) | (52,156 | ) | ||||||
Financing activities: |
||||||||||||
Short-term (repayments) borrowings, net |
(13,720 | ) | (17,496 | ) | 12,636 | |||||||
Net (repayments) borrowings on long-term revolving lines
of credit |
2,324 | (2,240 | ) | 29,496 | ||||||||
Repayments of long-term debt |
(7,754 | ) | (10,715 | ) | (6,967 | ) | ||||||
Payment of debt issuance fees |
— | — | (524 | ) | ||||||||
Common stock dividends |
— | (1,361 | ) | (5,401 | ) | |||||||
Exercise of stock options and other |
566 | — | 450 | |||||||||
Payment of withholding taxes from share-based incentive
issuance |
— | — | (6,000 | ) | ||||||||
Excess tax deficiencies (benefits) from share-based
payment arrangements |
219 | (132 | ) | 2,881 | ||||||||
Net cash (used in) from financing activities |
(18,365 | ) | (31,944 | ) | 26,571 | |||||||
Effect of exchange rate changes on cash and cash
equivalents |
(149 | ) | (515 | ) | (3,855 | ) | ||||||
Net increase (decrease) in cash and cash equivalents |
8,405 | 13,034 | (7,693 | ) | ||||||||
Cash and cash equivalents — beginning of year |
28,311 | 15,277 | 22,970 | |||||||||
Cash and cash equivalents — end of year |
$ | 36,716 | $ | 28,311 | $ | 15,277 | ||||||
See Note 1 to the consolidated financial statements for supplemental cash flow disclosures.
The accompanying notes to consolidated financial statements are an integral part of these statements.
35
Table of Contents
Consolidated Statements of Stockholders’ Equity
| Accumulated | ||||||||||||||||||||||||||||||||||||
| Additional | Other | |||||||||||||||||||||||||||||||||||
| Common | Treasury | Preferred | Common | Treasury | Paid-in | Retained | Comprehensive | |||||||||||||||||||||||||||||
| Shares | Shares | Stock | Stock | Stock | Capital | Earnings | Income | Total | ||||||||||||||||||||||||||||
Balance at January 1, 2008 |
22,331 | (233 | ) | $ | — | $ | 223 | $ | (3,487 | ) | $ | 179,707 | $ | 207,134 | $ | 1,498 | $ | 385,075 | ||||||||||||||||||
Comprehensive Loss: |
||||||||||||||||||||||||||||||||||||
Net loss |
(17,082 | ) | (17,082 | ) | ||||||||||||||||||||||||||||||||
Foreign currency
translation |
(13,630 | ) | (13,630 | ) | ||||||||||||||||||||||||||||||||
Defined benefit pension
liability adjustments,
net of tax expense of
$428 |
670 | 670 | ||||||||||||||||||||||||||||||||||
Total comprehensive loss |
(30,042 | ) | ||||||||||||||||||||||||||||||||||
Common stock dividend |
(5,401 | ) | (5,401 | ) | ||||||||||||||||||||||||||||||||
Long-term incentive
plan income |
(728 | ) | (728 | ) | ||||||||||||||||||||||||||||||||
Exercise of stock
options and other |
519 | 36 | 5 | 717 | (2,326 | ) | (1,604 | ) | ||||||||||||||||||||||||||||
Balance at December 31, 2008 |
22,850 | (197 | ) | $ | — | $ | 228 | $ | (2,770 | ) | $ | 176,653 | $ | 184,651 | $ | (11,462 | ) | $ | 347,300 | |||||||||||||||||
Comprehensive Loss: |
||||||||||||||||||||||||||||||||||||
Net loss |
(26,903 | ) | (26,903 | ) | ||||||||||||||||||||||||||||||||
Foreign currency
translation |
2,579 | 2,579 | ||||||||||||||||||||||||||||||||||
Defined benefit pension
liability adjustments,
net of tax benefit
of $2,970 |
(4,645 | ) | (4,645 | ) | ||||||||||||||||||||||||||||||||
Total comprehensive loss |
(28,969 | ) | ||||||||||||||||||||||||||||||||||
Common stock dividend |
(1,361 | ) | (1,361 | ) | ||||||||||||||||||||||||||||||||
Other |
265 | (12 | ) | 2 | (240 | ) | 1,476 | 1,238 | ||||||||||||||||||||||||||||
Balance at December 31, 2009 |
23,115 | (209 | ) | $ | — | $ | 230 | $ | (3,010 | ) | $ | 178,129 | $ | 156,387 | $ | (13,528 | ) | $ | 318,208 | |||||||||||||||||
Comprehensive Loss: |
||||||||||||||||||||||||||||||||||||
Net loss |
(5,640 | ) | (5,640 | ) | ||||||||||||||||||||||||||||||||
Foreign currency
translation |
(536 | ) | (536 | ) | ||||||||||||||||||||||||||||||||
Defined benefit pension
liability adjustments,
net of tax benefit
of $1,116 |
(1,748 | ) | (1,748 | ) | ||||||||||||||||||||||||||||||||
Total comprehensive loss |
(7,924 | ) | ||||||||||||||||||||||||||||||||||
Long-term incentive
plan expense |
1,278 | 1,278 | ||||||||||||||||||||||||||||||||||
Other |
34 | 46 | 1 | 784 | 1,112 | 1,897 | ||||||||||||||||||||||||||||||
Balance at December 31, 2010 |
23,149 | (163 | ) | $ | — | $ | 231 | $ | (2,226 | ) | $ | 180,519 | $ | 150,747 | $ | (15,812 | ) | $ | 313,459 | |||||||||||||||||
The accompanying notes to consolidated financial statements are an integral part of these
statements.
36
Table of Contents
A. M. Castle & Co.
Notes to Consolidated Financial Statements
Amounts in thousands except per share data and percentages
(1) Basis of Presentation and Significant Accounting Policies
Nature of operations — A.M. Castle & Co. and its subsidiaries (the “Company”) is a specialty
metals and plastics distribution company serving principally the North American market, but with a
growing global presence. The Company has operations in the United States, Canada, Mexico, France,
the United Kingdom, China and Singapore. The Company provides a broad range of product inventories
as well as value-added processing and supply chain services to a wide array of customers,
principally within the producer durable equipment, oil and gas, aerospace, heavy industrial
equipment, industrial goods, construction equipment, retail, marine and automotive sectors of the
global economy. Particular focus is placed on the aerospace and defense, oil and gas, power
generation, mining, heavy industrial equipment, marine, office furniture and fixtures, safety
products, life science applications, transportation and general manufacturing industries as well as
general engineering applications.
The Company’s primary metals distribution center and corporate headquarters are located in
Franklin Park, Illinois. During the fourth quarter of 2010, the Company executed a new lease
agreement to move the Company’s corporate headquarters to Oakbrook, Illinois during the second
quarter of 2011. The Company has 47 operational service centers located throughout North
America (43), Europe (3) and Asia (1).
The Company purchases metals and plastics from many producers. Purchases are made in large lots
and held in distribution centers until sold, usually in smaller quantities and often with
value-added processing services performed. Orders are primarily filled with materials shipped from
Company stock. The materials required to fill the balance of sales are obtained from other
sources, such as direct mill shipments to customers or purchases from other distributors.
Thousands of customers from a wide array of industries are serviced primarily through the Company’s
own sales organization.
Basis of presentation — The consolidated financial statements include the accounts of A. M. Castle
& Co. and its subsidiaries over which the Company exhibits a controlling interest. The equity
method of accounting is used for the Company’s 50% owned joint venture, Kreher Steel Company, LLC.
All inter-company accounts and transactions have been eliminated.
Use of estimates — The preparation of the consolidated financial statements in conformity with
accounting principles generally accepted in the United States of America (“U.S. GAAP”) requires
management to make estimates and assumptions that affect the reported amounts of assets and
liabilities and disclosure of contingent assets and liabilities at the date of the financial
statements and the reported amounts of revenue and expenses during the reporting period. Actual
results could differ from those estimates. The principal areas of estimation reflected in the
consolidated financial statements are accounts receivable allowances, inventory reserves, goodwill
and intangible assets, income taxes, pension and other post-employment benefits and share-based
compensation.
Revenue recognition — Revenue from the sales of products is recognized when the earnings process
is complete and when the title and risk and rewards of ownership have passed to the customer, which
is primarily at the time of shipment. Revenue recognized other than at the time of shipment
represents less than 5% of the Company’s consolidated net sales for the years ended December 31,
2010, 2009 and 2008. Provisions for allowances related to sales discounts and rebates are
recorded based on terms of the sale in the period that the sale is recorded. Management utilizes
historical information and the current sales trends of the business to estimate such provisions.
The provisions related to discounts and rebates due to customers are recorded as a reduction within
net sales in the Company’s consolidated statements of operations.
37
Table of Contents
The Company maintains an allowance for doubtful accounts resulting from the inability of our
customers to make required payments. The allowance for doubtful accounts is maintained at a level
considered appropriate based on historical experience and specific identification of customer
receivable balances for which collection is unlikely. The provisions for doubtful accounts are
recorded in sales, general and administrative expense in the Company’s consolidated statements of
operations. Estimates of doubtful accounts are based upon historical write-off experience as a
percentage of net sales and judgments about the probable effects of economic conditions on certain
customers.
The Company also maintains an allowance for credit memos for estimated credit memos to be issued
against current sales. Credit memos are primarily issued to correct order entry and billing
errors. Estimates of allowance for credit memos are based upon the application of a historical
issuance lag period to the average credit memos issued each month.
Allowance for doubtful accounts activity is presented in the table below:
| 2010 | 2009 | 2008 | ||||||||||
Balance, beginning of year |
$ | 4,195 | $ | 3,318 | $ | 3,220 | ||||||
Add — Provision charged to expense |
777 | 2,484 | 1,600 | |||||||||
— Metals U.K. allowance at date of acquisition |
— | — | 523 | |||||||||
— Recoveries |
186 | 186 | 132 | |||||||||
Less — Uncollectible accounts charged against allowance |
(1,310 | ) | (1,793 | ) | (2,157 | ) | ||||||
Balance, end of year |
$ | 3,848 | $ | 4,195 | $ | 3,318 | ||||||
Revenue from shipping and handling charges is recorded in net sales. Costs incurred in connection
with shipping and handling the Company’s products, which are related to third-party carriers or
performed by Company personnel are included in warehouse, processing and delivery expenses. For the
years ended December 31, 2010, 2009 and 2008, shipping and handling costs included in warehouse,
processing and delivery expenses were $31,067, $26,857, and $39,198, respectively.
Cost of materials — Cost of materials consists of the costs the Company pays for metals, plastics
and related inbound freight charges. It excludes depreciation and amortization which are discussed
below. The Company accounts for the majority of its inventory on a last-in, first-out (“LIFO”)
basis and LIFO adjustments are recorded in cost of materials.
Operating expenses — Operating costs and expenses primarily consist of:
| • | Warehouse, processing and delivery expenses, including occupancy costs, compensation and employee benefits for warehouse personnel, processing, shipping and handling costs; |
| • | Sales expenses, including compensation and employee benefits for sales personnel; |
| • | General and administrative expenses, including compensation for executive officers and general management, expenses for professional services primarily attributable to accounting and legal advisory services, bad debt expenses, data communication, computer hardware and maintenance and foreign currency gain or loss; and |
| • | Depreciation and amortization expenses, including depreciation for all owned property and equipment, and amortization of various intangible assets. |
Cash equivalents — Cash equivalents are highly liquid, short-term investments that have an
original maturity of 90 days or less.
38
Table of Contents
Statement of cash flows — Non-cash investing activities and supplemental disclosures of
consolidated cash flow information are as follows:
| Year Ended December 31, | ||||||||||||
| 2010 | 2009 | 2008 | ||||||||||
Non-cash investing and financing activities: |
||||||||||||
Capital expenditures financed by accounts payable |
$ | 100 | $ | 26 | $ | 1,490 | ||||||
Cash paid during the year for: |
||||||||||||
Interest |
4,392 | 5,574 | 7,544 | |||||||||
Income taxes |
1,631 | 10,762 | 29,153 | |||||||||
Inventories — Inventories consist of finished goods. Approximately eighty percent of the
Company’s inventories are valued at the lower of LIFO cost or market at December 31, 2010 and 2009.
Final inventory determination under the LIFO costing method is made at the end of each fiscal year
based on the actual inventory levels and costs at that time. The Company values its LIFO increments
using the cost of its latest purchases during the years reported. Current replacement cost of
inventories exceeded book value by $122,340 and $116,816 at December 31, 2010 and 2009,
respectively. Income taxes would become payable on any realization of this excess from reductions
in the level of inventories.
During 2010 and 2009, a reduction in inventories resulted in a liquidation of applicable LIFO
inventory quantities carried at lower costs in prior years. Cost of materials for 2010 and 2009
were lower by $12,500 and $5,608, respectively, as a result of the liquidations.
The Company maintains allowances for excess and obsolete inventory and physical inventory losses.
The excess and obsolete inventory allowance is determined based on specific identification of
material, adjusted for expected scrap value to be received. The allowance for physical inventory
losses is determined based on historical physical inventory experience.
Insurance plans — In August 2009, the Company became a member of a group captive insurance company
(the “Captive”) domiciled in Grand Cayman Island. The Captive reinsures losses related to certain
of the Company’s workers’ compensation, automobile and general liability risks that occur
subsequent to August 2009. Premiums are based on the Company’s loss experience and are accrued as
expenses for the period to which the premium relates. Premiums are credited to the Company’s “loss
fund” and earn investment income until claims are actually paid. For workers’ compensation,
automobile and general liability claims that were incurred prior to August 2009, the Company is
self-insured. Self-insurance amounts are capped, for individual claims and in the aggregate, for
each policy year by an insurance company. Self-insurance reserves are based on unpaid, known
claims (including related administrative fees assessed by the insurance company for claims
processing) and a reserve for incurred but not reported claims based on the Company’s historical
claims experience and development.
Property, plant and equipment — Property, plant and equipment are stated at cost and include
assets held under capital leases. Expenditures for major additions and improvements are
capitalized, while maintenance and repair costs that do not substantially improve or extend the
useful lives of the respective assets are expensed in the period in which they are incurred. When
items are disposed of, the related costs and accumulated depreciation are removed from the accounts
and any gain or loss is reflected in income.
The Company provides for depreciation of plant and equipment sufficient to amortize the cost over
their estimated useful lives as follows:
Buildings and building improvements |
3 – 40 years | |||
Plant equipment |
3 – 25 years | |||
Furniture and fixtures |
3 – 10 years | |||
Vehicles and office equipment |
3 – 7 years | |||
Leasehold improvements are depreciated over the shorter of their useful lives or the remaining term
of the lease. Depreciation is calculated using the straight-line method and depreciation expense
for 2010, 2009 and 2008 was $13,578, $13,850 and $15,056, respectively.
39
Table of Contents
Long-lived assets — The Company’s long-lived assets are reviewed for impairment whenever events or
changes in circumstances indicate that the carrying amount of an asset may not be recoverable.
Recoverability of assets to be held and used is measured by a comparison of the carrying amount of
an asset to future net cash flows (undiscounted and without interest charges) expected to be
generated by the asset. If such assets are impaired, the impairment charge is calculated as the
amount by which the carrying amount of the assets exceeds the fair value of the assets.
Determining whether impairment has occurred typically requires various estimates and assumptions,
including determining which undiscounted cash flows are directly related to the potentially
impaired asset, the useful life over which cash flows will occur, their amount, and the asset’s
residual value, if any. The Company derives the required undiscounted cash flow estimates from
historical experience and internal business plans. Measurement of an impairment loss requires a
determination of fair value, which is based on available information. The Company uses an income
approach, which estimates fair value based on estimates of future cash flows discounted at an
appropriate interest rate.
Goodwill and intangible assets — Goodwill is subject to an annual impairment test using a two-step
process. The carrying value of the Company’s goodwill is evaluated annually as of January
1st each year or when certain triggering events occur which require a more current
valuation.
A two-step method is used for determining goodwill impairment. The first step (“Step I”) of the
goodwill impairment test is used to identify potential impairment. The evaluation is based on the
comparison of each reporting unit’s fair value to its carrying value. If the carrying value
exceeds the fair value, the second step (“Step II”) of the goodwill impairment test must be
performed to measure the amount of impairment loss, if any. Step II of the goodwill impairment
test compares the implied fair value of reporting unit goodwill to the carrying amount of that
goodwill. The implied fair value of goodwill is determined in the same manner as the amount of
goodwill recognized in a business combination. The allocation of fair value to reporting units
requires several analyses to determine fair value of assets and liabilities including, among
others, customer relationships, non-compete agreements, trade names and property, plant and
equipment (valued at replacement costs). If the carrying amount of the reporting unit goodwill
exceeds the implied fair value of that goodwill, an impairment loss is recognized in the amount
equal to the excess.
Fair value is determined using a combination of an income approach, which estimates fair value
based on a discounted cash flow analysis using historical data and management estimates of future
cash flows, and a market approach, which estimates fair value using market multiples of various
financial measures of comparable public companies.
The determination of the fair value of the reporting units requires significant estimates and
assumptions to be made by management. These estimates and assumptions primarily include, but are
not limited to: the selection of appropriate peer group companies; control premiums appropriate for
acquisitions in the industry in which the Company competes; discount rates; terminal growth rates;
long-term projections of future financial performance; and relative weighting of income and market
approaches. The long-term projections used in the valuation are developed as part of the Company’s
annual budgeting process. The discount rates used for each of the reporting units are those of a
hypothetical market participant which are developed based upon an analysis of comparable companies
and include adjustments made to account for any individual reporting unit specific attributes such
as, size and industry.
The majority of the Company’s recorded intangible assets were acquired as part of the Transtar and
Metals U.K. acquisitions in September 2006 and January 2008, respectively, and consist primarily of
customer relationships and non-compete agreements. The initial values of the intangible assets
were based on a discounted cash flow valuation using assumptions made by management as to future
revenues from select customers, the level and pace of attrition in such revenues over time and
assumed operating income amounts generated from such revenues. These intangible assets are
amortized over their useful lives, which are 4 to 11 years for customer relationships and 3 years
for non-compete agreements. Useful lives are estimated by management and determined based on the
timeframe over which a significant portion of the estimated future cash flows are expected to be
realized from the respective intangible assets. Furthermore, when certain conditions or certain
triggering events occur, a separate test of impairment, similar to the impairment test for
long-lived assets, is performed. If the intangible asset is deemed to be impaired, such asset will
be written down to its fair value.
40
Table of Contents
Income taxes — The Company accounts for income taxes under the asset and liability method, which
requires the recognition of deferred tax assets and liabilities for the expected future tax
consequences of events that have been included in the financial statements. Under this method,
deferred tax assets and liabilities are determined based on the differences between the financial
statements and the tax basis of assets and liabilities using enacted tax rates in effect for the
year in which the differences are expected to reverse. The effect of a change in tax rates on
deferred tax assets and liabilities is recognized in income in the period that includes the
enactment date.
The Company records valuation allowances against its deferred tax assets when it is more likely
than not that the amounts will not be realized. In making such determination, the Company
considers all available positive and negative evidence, including scheduled reversals of deferred
tax liabilities, projected future taxable income, tax planning strategies and recent financial
operations. In the period a determination is made that the Company will not be able to realize its
deferred income tax assets, an adjustment to the valuation allowance will be made which will
increase the provision for income taxes.
The Company recognizes the tax benefits of uncertain tax positions only if those benefits will more
likely than not be sustained upon examination by the relevant tax authorities. Unrecognized tax
benefits are subsequently recognized at the time the recognition threshold is met, the tax matter
is effectively settled or the statute of limitations expires for the return containing the tax
position, whichever is earlier. Due to the complexity of some of these uncertainties, the ultimate
resolution may result in a payment that differs from the current estimate. These differences will
be reflected in the Company’s income tax expense in the period in which they are determined.
Income tax expense includes provisions for amounts that are currently payable and certain changes
in deferred tax assets and liabilities. The Company does not provide for deferred income taxes on
undistributed earnings of foreign subsidiaries as such undistributed earnings are considered to be
permanently reinvested based on management’s overall business strategy. Undistributed earnings may
become taxable upon their remittance as dividends or upon the sale or liquidation of foreign
subsidiaries. It is not practicable to determine the amounts of net additional income tax that may
be payable if such earnings were repatriated.
The Company recognizes interest and penalties related to unrecognized tax benefits within income
tax expense. Accrued interest and penalties are included within other long-term liabilities in the
consolidated balance sheets.
Foreign currency translation — For the majority of the Company’s non-U.S. operations, the
functional currency is the local currency. Assets and liabilities of those operations are
translated into U.S. dollars using year-end exchange rates, and income and expenses are translated
using the average exchange rates for the reporting period. The currency effects of translating
financial statements of the Company’s non-U.S. operations which operate in local currency
environments are recorded in accumulated other comprehensive income (loss), a separate component of
stockholders’ equity. Gains resulting from foreign currency transactions were not material for any
of the years presented.
41
Table of Contents
Earnings per share — Diluted earnings per share is computed by dividing net income by the weighted
average number of shares of common stock plus common stock equivalents. Common stock equivalents
consist of employee and director stock options, restricted stock awards and other share-based
payment awards, which have been included in the calculation of weighted average shares outstanding
using the treasury stock method. The following table is a reconciliation of the basic and diluted
earnings per share calculations:
| 2010 | 2009 | 2008 | ||||||||||
Numerator: |
||||||||||||
Net loss |
$ | (5,640 | ) | $ | (26,903 | ) | $ | (17,082 | ) | |||
Denominator: |
||||||||||||
Denominator for basic loss per share: |
||||||||||||
Weighted average common shares outstanding |
22,708 | 22,862 | 22,528 | |||||||||
Effect of dilutive securities: |
||||||||||||
Outstanding common stock equivalents |
— | — | — | |||||||||
Denominator for diluted loss per share |
22,708 | 22,862 | 22,528 | |||||||||
Basic loss per share |
$ | (0.25 | ) | $ | (1.18 | ) | $ | (0.76 | ) | |||
Diluted loss per share |
$ | (0.25 | ) | $ | (1.18 | ) | $ | (0.76 | ) | |||
Excluded outstanding share-based awards
having an anti-dilutive effect |
471 | 239 | 246 | |||||||||
For the years ended December 31, 2010 and 2009, the undistributed losses attributed to
participating securities, which represent certain non-vested shares granted by the Company, were
approximately one percent of total losses. For the year ended December 31, 2008, the
undistributed losses attributed to participating securities were less than one percent of total
losses.
Concentrations — The Company serves a wide range of customers within the producer durable
equipment, oil and gas, aerospace, heavy industrial equipment, industrial goods, construction
equipment, retail, marine and automotive sectors of the economy from locations throughout the
United States, Canada, Mexico, France, the United Kingdom, Spain, China and Singapore. Its
customer base includes many Fortune 500 companies as well as thousands of medium and smaller
sized firms spread across the entire spectrum of metals and plastics using industries. The
Company’s customer base is well diversified and therefore, the Company does not have dependence
upon any single customer, or a few customers. No single customer represents more than 5% of the
Company’s total net sales. Approximately 80% of the Company’s business is conducted from
locations in the United States.
Share-based compensation — The Company offers share-based compensation to executive and
other key employees, as well as its directors. Share-based compensation expense is recorded over
the vesting period based on the grant date fair value of the stock award. Stock options have an
exercise price equal to the market price of the Company’s stock on the grant date (options granted
prior to 2010) or the average closing price of the Company’s stock for the ten trading days
preceding the grant date (options granted in 2010) and have a contractual life of eight to ten
years. Options and restricted stock generally vest in one to five years for executives and
employees and one year for directors. The Company may either issue shares from treasury or new
shares upon share option exercise.
Stock options are valued based on the market price of the Company’s stock on the grant date, using
a Black-Scholes option-pricing model. The expense associated with stock option awards is recorded
on a straight-line basis over the vesting period, net of estimated forfeitures.
Share-based compensation expense for restricted share units and non-vested shares in the long-term
incentive plans (“LTI Plans”) and long-term compensation plan (“LTC Plan”) is established using the
market price of the Company’s common stock on the date of grant.
The fair value of performance units granted under the LTI Plans is based on the market price of the
Company’s stock on the date of grant adjusted to reflect that the participants in the performance
units do not participate in dividends during the vesting period. The grant date fair value of
performance shares awarded under the LTC Plan was estimated using a Monte Carlo simulation.
42
Table of Contents
Management estimates the probable number of shares which will ultimately vest when calculating the
share-based compensation expense for the LTI and LTC Plans. As of December 31, 2010, the Company’s
weighted average forfeiture rate is approximately 21%. The actual number of shares that vest may
differ from management’s estimate. Final award vesting and distribution of performance awards
granted under the LTI and LTC Plans are determined based on the Company’s actual performance versus
the target goals for a three-year consecutive period as defined in each plan. Partial awards can
be earned for performance less than the target goal, but in excess of minimum goals; and award
distributions above the target can be achieved if the maximum goals are met or exceeded. The
performance goals for the 2008 and 2009 LTI Plans are three-year cumulative net income and average
return on total capital for the same three-year period. No share-based compensation expense was
recorded during 2010 related to performance awards under the LTI Plans as performance goals are not
expected to be met.
Under the 2010 LTC Plan, the potential award for the performance shares granted is dependent on the
Company’s relative total shareholder return (“RTSR”), which represents a market condition. RTSR is
measured against a group of peer companies either in the metals industry or in the industrial
products distribution industry. Compensation expense for performance awards containing a market
condition is recognized regardless of whether the market condition is achieved to the extent the
requisite service period condition is met.
Unless covered by a specific change-in-control or severance arrangement, participants to whom
restricted stock units, performance shares and other non-vested shares have been granted must be
employed by the Company on the vesting date or at the end of the performance period, respectively,
or the award will be forfeited.
Fair Value of Financial Instruments — The three-tier value hierarchy the Company utilizes, which
prioritizes the inputs used in the valuation methodologies, is:
Level 1—Valuations based on quoted prices for identical assets and liabilities in active
markets.
Level 2—Valuations based on observable inputs other than quoted prices included in Level
1, such as quoted prices for similar assets and liabilities in active markets, quoted prices
for identical or similar assets and liabilities in markets that are not active, or other inputs
that are observable or can be corroborated by observable market data.
Level 3—Valuations based on unobservable inputs reflecting our own assumptions,
consistent with reasonably available assumptions made by other market participants.
The fair value of cash, accounts receivable and accounts payable approximate their carrying values.
The fair value of cash equivalents are determined using the fair value hierarchy described above.
Cash equivalents of $6,350 and $7,656 at December 31, 2010 and 2009, respectively, consist of money
market funds that are valued based on quoted prices in active markets and as a result are
classified as Level 1. The Company’s pension plan asset portfolio as of December 31, 2010 is
primarily invested in fixed income securities, which generally fall within Level 2 of the fair
value hierarchy. Fair value disclosures for fixed rate debt are determined using a market
approach, which estimates fair value based on companies with similar credit quality and size of
debt issuances.
New Accounting Standards Updates
Standards Updates Adopted
Effective January 1, 2010, the Company adopted Accounting Standards Update (“ASU”) No. 2009-17,
“Improvements to Financial Reporting by Enterprises Involved with Variable Interest Entities” (“ASU
2009-17”). The revised guidance amends the consolidation guidance that applies to a variable
interest entity (“VIE”). The adoption of the ASU did not have an impact on the Company’s financial
position, results of operations and cash flows.
Standards Updates Issued Not Yet Effective
During December 2010, the FASB issued ASU No. 2010-29, “Disclosure of Supplementary Pro Forma
Information for Business Combinations.” The ASU is effective prospectively for business
combinations whose acquisition date is at or after the beginning of the first annual reporting
period beginning on or after December 15, 2010. The ASU specifies that if a public entity presents
comparative financial statements, the entity should disclose revenue and earnings of the combined
entity as though the business combination that occurred during the current year had occurred as of
the beginning of the comparable prior annual reporting period only. The amendments to this
guidance also expand the supplemental pro forma disclosures to include a description of the nature
and amount of material, nonrecurring pro forma adjustments directly attributable to the business
combination included in the reported pro forma revenue and earnings. The adoption of the ASU will
impact disclosures in future interim and annual financial statements issued if the Company enters
into business combinations.
43
Table of Contents
(2) Acquisition
On January 3, 2008, the Company acquired 100 percent of the outstanding capital stock of Metals
U.K. Group (“Metals U.K.”). The purchase was financed with debt. The acquisition of Metals U.K.
was accounted for using the purchase method. Accordingly, the Company recorded the net assets at
their estimated fair values. The operating results and the assets of Metals U.K. are included in
the Company’s Metals segment from the date of acquisition.
Metals U.K. is a distributor and processor of specialty metals primarily serving the oil and gas,
aerospace, petrochemical and power generation markets worldwide. Metals U.K. has distribution and
processing facilities in Blackburn and Letchworth, England. The acquisition of Metals U.K. will
allow the Company to expand its global reach and service potential high growth industries.
The aggregate purchase price was $29,693, or $28,854, net of cash acquired, and represents the
aggregate cash purchase price paid at closing, contingent consideration paid in January 2011, debt
paid off at closing, and direct transaction costs. The premium paid in excess of the fair value of
the net assets acquired was primarily for the ability to expand the Company’s global reach, as well
as to obtain Metals U.K.’s skilled, established workforce.
(3) Segment Reporting
The Company distributes and performs processing on both metals and plastics. Although the
distribution processes are similar, the customer markets, supplier bases and types of products
are different. Additionally, the Company’s Chief Executive Officer, the chief operating
decision-maker, reviews and manages these two businesses separately. As such, these businesses
are considered reportable segments and are reported accordingly. Neither of the Company’s
reportable segments has any unusual working capital requirements.
In its Metals segment, the Company’s marketing strategy focuses on distributing highly
engineered specialty grades and alloys of metals as well as providing specialized processing
services designed to meet very precise specifications. Core products include alloy, aluminum,
stainless, nickel, titanium and carbon. Inventories of these products assume many forms such as
plate, sheet, extrusions, round bar, hexagon bar, square and flat bar, tubing and coil.
Depending on the size of the facility and the nature of the markets it serves, service centers
are equipped as needed with bar saws, plate saws, oxygen and plasma arc flame cutting machinery,
water-jet cutting, stress relieving and annealing furnaces, surface grinding equipment and sheet
shearing equipment. This segment also performs various specialized fabrications for its
customers through pre-qualified subcontractors that thermally process, turn, polish and
straighten alloy and carbon bar.
The Company’s Plastics segment consists exclusively of a wholly-owned subsidiary that operates
as Total Plastics, Inc. (“TPI”), headquartered in Kalamazoo, Michigan, and its wholly-owned
subsidiaries. The Plastics segment stocks and distributes a wide variety of plastics in forms
that include plate, rod, tube, clear sheet, tape, gaskets and fittings. Processing activities
within this segment include cut-to-length, cut-to-shape, bending and forming according to
customer specifications. The Plastics segment’s diverse customer base consists of companies in
the retail (point-of-purchase), marine, office furniture and fixtures, safety products, life
sciences applications, transportation and general manufacturing industries. TPI has locations
throughout the upper northeast and midwest regions of the U.S. and one facility in Florida from
which it services a wide variety of users of industrial plastics.
44
Table of Contents
The accounting policies of all segments are the same as described in Note 1. Management
evaluates the performance of its business segments based on operating income.
The Company operates locations in the United States, Canada, Mexico, France, the United Kingdom,
China and Singapore. No activity from any individual country outside the United States is
material, and therefore, foreign activity is reported on an aggregate basis. Net sales are
attributed to countries based on the location of the Company’s subsidiary that is selling direct to
the customer. Company-wide geographic data as of and for the years ended December 31, 2010, 2009
and 2008 are as follows:
| 2010 | 2009 | 2008 | ||||||||||
Net sales |
||||||||||||
United States |
$ | 757,052 | $ | 673,918 | $ | 1,236,355 | ||||||
All other countries |
186,654 | 138,720 | 264,681 | |||||||||
Total |
$ | 943,706 | $ | 812,638 | $ | 1,501,036 | ||||||
Long-lived assets |
||||||||||||
United States |
$ | 67,427 | $ | 73,897 | ||||||||
All other countries |
9,288 | 8,856 | ||||||||||
Total |
$ | 76,715 | $ | 82,753 | ||||||||
Segment information as of and for the years ended December 31, 2010, 2009 and 2008 is as
follows:
| Operating | ||||||||||||||||||||
| Net | Income | Total | Capital | Depreciation & | ||||||||||||||||
| Sales | (Loss) | Assets | Expenditures | Amortization | ||||||||||||||||
2010 |
||||||||||||||||||||
Metals segment |
$ | 841,067 | $ | (5,478 | ) | $ | 454,345 | $ | 6,815 | $ | 19,392 | |||||||||
Plastics segment |
102,639 | 3,559 | 47,128 | 757 | 1,257 | |||||||||||||||
Other |
— | (7,419 | ) | 27,879 | — | — | ||||||||||||||
Consolidated |
$ | 943,706 | $ | (9,338 | ) | $ | 529,352 | $ | 7,572 | $ | 20,649 | |||||||||
2009 |
||||||||||||||||||||
Metals segment |
$ | 726,221 | $ | (32,130 | ) | $ | 488,090 | $ | 8,456 | $ | 19,943 | |||||||||
Plastics segment |
86,417 | 282 | 46,443 | 293 | 1,348 | |||||||||||||||
Other |
— | (5,281 | ) | 23,468 | — | — | ||||||||||||||
Consolidated |
$ | 812,638 | $ | (37,129 | ) | $ | 558,001 | $ | 8,749 | $ | 21,291 | |||||||||
2008 |
||||||||||||||||||||
Metals segment |
$ | 1,384,859 | $ | 11,554 | $ | 602,897 | $ | 24,218 | $ | 22,040 | ||||||||||
Plastics segment |
116,177 | 3,182 | 52,797 | 2,084 | 1,287 | |||||||||||||||
Other |
— | (10,604 | ) | 23,340 | — | — | ||||||||||||||
Consolidated |
$ | 1,501,036 | $ | 4,132 | $ | 679,034 | $ | 26,302 | $ | 23,327 | ||||||||||
“Other” — Operating loss includes the costs of executive, legal and finance departments, which
are shared by both the Metals and Plastics segments. The “Other” category’s total assets consist
of the Company’s investment in joint venture.
Below are reconciliations of segment data to the consolidated financial statements:
| 2010 | 2009 | 2008 | ||||||||||
Operating (loss) income |
$ | (9,338 | ) | $ | (37,129 | ) | $ | 4,132 | ||||
Interest expense, net |
(4,988 | ) | (6,440 | ) | (9,373 | ) | ||||||
Loss before income taxes and equity in earnings of joint venture |
(14,326 | ) | (43,569 | ) | (5,241 | ) | ||||||
Equity in earnings of joint venture |
5,585 | 402 | 8,849 | |||||||||
Consolidated (loss) income before income taxes |
$ | (8,741 | ) | $ | (43,167 | ) | $ | 3,608 | ||||
45
Table of Contents
(4) Lease Agreements
The Company has operating and capital leases covering certain warehouse facilities, equipment,
automobiles and trucks, with the lapse of time as the basis for all rental payments, and with a
mileage factor included in the truck leases.
Future minimum rental payments under operating and capital leases that have initial or remaining
non-cancelable lease terms in excess of one year as of December 31, 2010, are as follows:
| Capital | Operating | |||||||
2011 |
$ | 399 | $ | 11,919 | ||||
2012 |
181 | 11,034 | ||||||
2013 |
20 | 9,661 | ||||||
2014 |
— | 9,002 | ||||||
2015 |
— | 9,062 | ||||||
Later years |
— | 20,420 | ||||||
Total future minimum rental payments |
$ | 600 | $ | 71,098 | ||||
Total rental payments charged to expense were $13,712 in 2010, $12,769 in 2009, and $13,049 in
2008. Lease extrication charges of $1,215 associated with the consolidation of two of the
Company’s facilities in the Metals segment were included in total rental payments charged to
expense in 2010 within Warehouse, processing and delivery expense in the consolidated statements of
operations. There were no lease extrication charges in 2009 and 2008. Total gross value of
property, plant and equipment under capital leases was $2,667 and $2,796 in 2010 and 2009,
respectively.
At December 31, 2010 and 2009, the Company had recorded deferred gains associated with sale
leaseback transactions of $2,052 and $2,885, respectively, in other non-current liabilities. The
current portion of the deferred gains associated with the sale leaseback transactions in the amount
of $852 is included in accrued liabilities in the consolidated balance sheets at December 31, 2010
and 2009. The total rental expense associated with these leases for 2010, 2009 and 2008 was
$1,527, $1,529 and $1,525, respectively.
(5) Employee Benefit Plans
Pension Plans
Substantially all employees who meet certain requirements of age, length of service and hours
worked per year are covered by Company-sponsored pension plans and supplemental pension plan
(collectively, the “pension plans”). These pension plans are defined benefit, noncontributory
plans. Benefits paid to retirees are based upon age at retirement, years of credited service and
average earnings. The Company also has a supplemental pension plan, which is a non-qualified,
unfunded plan. The Company uses a December 31 measurement date for the pension plans.
During March 2008, the supplemental pension plan was amended and as a result, a curtailment gain of
$472 was recognized at that time. Effective July 1, 2008, the Company-sponsored pension plans were
frozen.
The assets of the Company-sponsored pension plans are maintained in a single trust account.
The Company’s funding policy is to satisfy the minimum funding requirements of the Employee
Retirement Income Security Act of 1974, commonly called ERISA.
46
Table of Contents
Components of net periodic pension benefit cost are as follows:
| 2010 | 2009 | 2008 | ||||||||||
Service cost |
$ | 623 | $ | 617 | $ | 2,057 | ||||||
Interest cost |
7,456 | 7,511 | 7,216 | |||||||||
Expected return on assets |
(9,342 | ) | (9,010 | ) | (11,124 | ) | ||||||
Amortization of prior service cost |
231 | 240 | 245 | |||||||||
Amortization of actuarial loss |
237 | 151 | 351 | |||||||||
Net periodic pension credit, excluding
impact of curtailment |
$ | (795 | ) | $ | (491 | ) | $ | (1,255 | ) | |||
The expected 2011 amortization of pension prior service cost and actuarial loss is $324 and $229,
respectively.
The status of the plans at December 31, 2010 and 2009 are as follows:
| 2010 | 2009 | |||||||
Change in projected benefit obligation: |
||||||||
Projected benefit obligation at beginning of year |
$ | 132,760 | $ | 123,208 | ||||
Service cost |
623 | 617 | ||||||
Interest cost |
7,456 | 7,511 | ||||||
Plan change |
819 | — | ||||||
Benefit payments |
(6,057 | ) | (5,744 | ) | ||||
Actuarial loss |
8,634 | 7,168 | ||||||
Projected benefit obligation at end of year |
$ | 144,235 | $ | 132,760 | ||||
Change in plan assets: |
||||||||
Fair value of plan assets at beginning of year |
$ | 148,152 | $ | 145,572 | ||||
Actual return on assets |
15,675 | 8,109 | ||||||
Employer contributions |
226 | 215 | ||||||
Benefit payments |
(6,057 | ) | (5,744 | ) | ||||
Fair value of plan assets at end of year |
$ | 157,996 | $ | 148,152 | ||||
Funded status — net prepaid |
$ | 13,761 | $ | 15,392 | ||||
Amounts recognized in the consolidated balance sheets consist of: |
||||||||
Prepaid pension cost |
$ | 18,580 | $ | 19,913 | ||||
Accrued liabilities |
(219 | ) | (206 | ) | ||||
Pension and postretirement benefit obligations |
(4,600 | ) | (4,315 | ) | ||||
Net amount recognized |
$ | 13,761 | $ | 15,392 | ||||
Pre-tax components of accumulated other comprehensive income
(loss): |
||||||||
Unrecognized actuarial loss |
$ | (17,782 | ) | $ | (15,717 | ) | ||
Unrecognized prior service cost |
(2,266 | ) | (1,679 | ) | ||||
Total |
$ | (20,048 | ) | $ | (17,396 | ) | ||
Accumulated benefit obligation |
$ | 143,778 | $ | 132,349 | ||||
For plans with an accumulated benefit obligation in excess of plan assets, the projected benefit
obligation, accumulated benefit obligation and fair value of plan assets were $4,819, $4,819 and
$0, respectively, at December 31, 2010; and $4,522, $4,522 and $0, respectively, at December 31,
2009.
The assumptions used to measure the projected benefit obligations for the Company’s defined benefit
pension plans are as follows:
| 2010 | 2009 | |||||||
Discount rate |
5.25 | % | 5.75 | % | ||||
Projected annual salary increases |
0-3.00 | 0-3.00 | ||||||
47
Table of Contents
The assumptions used to determine net periodic pension benefit costs are as follows:
| 2010 | 2009 | 2008 | ||||||||||
Discount rate |
5.75 | % | 6.25 | % | 6.25 | % | ||||||
Expected long-term rate of return on plan assets |
6.50 | 6.50 | 8.75 | |||||||||
Projected annual salary increases |
0-3.00 | 0-3.00 | 0-4.00 | |||||||||
The assumption on expected long-term rate of return on plan assets for all years was based on a
building block approach. The expected long-term rate of inflation and risk premiums for the various asset
categories are based on the current investment environment. General historical market returns are used
in the development of the long-term expected inflation rates and risk premiums. The target allocations of
assets are used to develop a composite rate of return assumption.
The Company’s pension plan weighted average asset allocations at December 31, 2010 and 2009, by
asset category, are as follows:
| 2010 | 2009 | |||||||
Fixed income securities |
100 | % | 96 | % | ||||
Real estate |
— | 3 | % | |||||
Other |
— | 1 | % | |||||
| 100 | % | 100 | % | |||||
The Company’s pension plans’ funds are managed in accordance with investment policies recommended
by its investment advisor and approved by the Human Resources Committee of the Board of Directors.
The overall target portfolio allocation is 100% fixed income securities. These funds’ conformance
with style profiles and performance is monitored regularly by management, with the assistance of
the Company’s investment advisor. Adjustments are typically made in the subsequent quarters when
investment allocations deviate from the target range. The investment advisor provides quarterly
reports to management and the Human Resource Committee of the Board of Directors.
The fair values of the Company’s pension plan assets fall within the following levels of the fair
value hierarchy as of December 31, 2010:
| Level 1 | Level 2 | Level 3 | Total | |||||||||||||
Fixed income securities (1) |
$ | 4,884 | $ | 157,319 | $ | — | $ | 162,203 | ||||||||
Accounts payable — pending trades |
(4,207 | ) | ||||||||||||||
Total |
$ | 157,996 | ||||||||||||||
| (1) | Fixed income securities are comprised of corporate bonds (75%), government bonds (13%), government agencies securities (9%) and other fixed income securities (3%). For 2010, fixed income assets were primarily classified as Level 2. For 2009, fixed income assets, which were substantially similar to those held in 2010, were incorrectly classified as Level 1 assets when originally reported and were not reclassified as Level 2 assets in this presentation. |
The fair values of the Company’s pension plan assets fall within the following levels of the
fair value hierarchy as of December 31, 2009:
| Level 1 | Level 2 | Level 3 | Total | |||||||||||||
Fixed income securities (1) |
$ | 141,734 | $ | — | $ | — | $ | 141,734 | ||||||||
Real estate (2) |
— | — | 4,863 | 4,863 | ||||||||||||
Other (3) |
— | 1,555 | — | 1,555 | ||||||||||||
Total |
$ | 141,734 | $ | 1,555 | $ | 4,863 | $ | 148,152 | ||||||||
| (1) | Includes corporate and U.S. government debt securities. | |
| (2) | Includes investments in real estate investment trusts that invest in a variety of property types in geographically diverse markets across the U.S. | |
| (3) | Primarily interest rate swaps. |
48
Table of Contents
The following table represents the change in fair value of Level 3 assets:
| 2010 | 2009 | |||||||
Fair value as of January 1 |
$ | 4,863 | $ | 7,319 | ||||
Income earned, net |
60 | 11 | ||||||
Realized gain |
376 | — | ||||||
Unrealized loss |
— | (2,467 | ) | |||||
Purchases, sales, issuances and settlements, net |
(5,299 | ) | — | |||||
Fair value as of December 31 |
$ | — | $ | 4,863 | ||||
The estimated future pension benefit payments are:
2011 |
$ | 6,843 | ||
2012 |
7,106 | |||
2013 |
7,536 | |||
2014 |
7,789 | |||
2015 |
8,479 | |||
2016 — 2020 |
47,577 |
Postretirement Plan
The Company also provides declining value life insurance to its retirees and a maximum of three
years of medical coverage to qualified individuals who retire between the ages of 62 and 65. The
Company does not fund these benefits in advance, and uses a December 31 measurement date.
Components of net periodic postretirement benefit cost for 2010, 2009 and 2008 were as follows:
| 2010 | 2009 | 2008 | ||||||||||
Service cost |
$ | 177 | $ | 169 | $ | 151 | ||||||
Interest cost |
219 | 224 | 207 | |||||||||
Amortization of prior service cost |
29 | 47 | 47 | |||||||||
Amortization of actuarial gain |
(16 | ) | (16 | ) | (18 | ) | ||||||
Net periodic postretirement benefit cost |
$ | 409 | $ | 424 | $ | 387 | ||||||
The expected 2010 amortization of postretirement prior service cost and actuarial gain are
insignificant.
49
Table of Contents
The status of the postretirement benefit plans at December 31, 2010 and 2009 were as follows:
| 2010 | 2009 | |||||||
Change in accumulated postretirement benefit obligations: |
||||||||
Accumulated postretirement benefit obligation at beginning of year |
$ | 3,919 | $ | 3,687 | ||||
Service cost |
177 | 169 | ||||||
Interest cost |
219 | 224 | ||||||
Benefit payments |
(200 | ) | (129 | ) | ||||
Actuarial (gain) loss |
224 | (32 | ) | |||||
Accumulated postretirement benefit obligation at end of year |
$ | 4,339 | $ | 3,919 | ||||
Funded status — net liability |
$ | (4,339 | ) | $ | (3,919 | ) | ||
Amounts recognized in the consolidated balance sheets consist of: |
||||||||
Accrued liabilities |
$ | (231 | ) | $ | (206 | ) | ||
Pension and postretirement benefit obligations |
(4,108 | ) | (3,713 | ) | ||||
Net amount recognized |
$ | (4,339 | ) | $ | (3,919 | ) | ||
Pre-tax components of accumulated other comprehensive income
(loss): |
||||||||
Unrecognized actuarial gain |
$ | 276 | $ | 515 | ||||
Unrecognized prior service cost |
— | (28 | ) | |||||
Total |
$ | 276 | $ | 487 | ||||
The assumed health care cost trend rates for medical plans at December 31 were as follows:
| 2010 | 2009 | 2008 | ||||||||||
Medical cost trend rate |
8.00 | % | 9.00 | % | 10.00 | % | ||||||
Ultimate medical cost trend rate |
5.00 | 5.00 | 5.00 | |||||||||
Year ultimate medical cost trend rate will be reached |
2013 | 2013 | 2013 | |||||||||
A 1% increase in the health care cost trend rate assumptions would have increased the accumulated
postretirement benefit obligation at December 31, 2010 by $286 with no significant impact on the
annual periodic postretirement benefit cost. A 1% decrease in the health care cost trend rate
assumptions would have decreased the accumulated postretirement benefit obligation at December 31,
2010 by $258 with no significant impact on the annual periodic postretirement benefit cost. The
weighted average discount rate used to determine the accumulated postretirement benefit obligation
was 5.25% in 2010 and 5.75% in 2009. The weighted average discount rate used in determining net
periodic postretirement benefit costs were 5.75% in 2010 and 6.25% in 2009 and 2008.
Retirement Savings Plan
Effective July 1, 2008, the Company revised the provisions of its retirement savings plan for the
benefit of salaried and other eligible employees (including officers). The Company’s plan includes
features under Section 401(k) of the Internal Revenue Code. The plan includes a provision whereby
the Company makes a matching contribution on the first 6% of considered earnings that each employee
contributes (“the matching contribution”). The plan also includes a supplemental contribution (the
“supplemental contribution”) feature whereby a fixed contribution of considered earnings is
deposited into each employee’s 401(k) account each pay period, regardless of whether the employee
participates in the plan. Company contributions cliff vest after two years of employment.
Due to cost reduction measures implemented by management during April 2009, the Company’s matching
contribution and supplemental contribution were suspended. During April 2010, the Company’s 401(k)
matching contribution on eligible employee contributions was reinstated together with a portion of
the supplemental contribution.
The amounts expensed are summarized below:
| 2010 | 2009 | 2008 | ||||||||||
Supplemental contributions and 401(k) match |
$ | 1,634 | $ | 2,060 | $ | 3,161 | ||||||
50
Table of Contents
(6) Joint Venture
Kreher Steel Co., LLC (“Kreher”) is a 50% owned joint venture of the Company. It is a metals
distributor of bulk quantities of alloy, special bar quality and stainless steel bars,
headquartered in Melrose Park, Illinois.
The following information summarizes the Company’s participation in the joint venture as of and
for the year ended December 31:
| 2010 | 2009 | 2008 | ||||||||||
Equity in earnings of joint venture |
$ | 5,585 | $ | 402 | $ | 8,849 | ||||||
Investment in joint venture |
27,879 | 23,468 | 23,340 | |||||||||
Sales to joint venture |
973 | 486 | 568 | |||||||||
Purchases from joint venture |
223 | 118 | 1,040 | |||||||||
The following information summarizes financial data for this joint venture as of and for the
year ended December 31:
| 2010 | 2009 | 2008 | ||||||||||
Revenues |
$ | 188,107 | $ | 108,963 | $ | 221,753 | ||||||
Net income |
11,170 | 803 | 17,698 | |||||||||
Current assets |
71,611 | 50,604 | 64,550 | |||||||||
Non-current assets |
17,880 | 17,661 | 19,184 | |||||||||
Current liabilities |
32,828 | 19,852 | 34,864 | |||||||||
Non-current liabilities |
2,872 | 3,137 | 3,428 | |||||||||
Members’ equity |
53,791 | 45,275 | 45,442 | |||||||||
Capital expenditures |
2,271 | 249 | 2,628 | |||||||||
Depreciation and amortization |
1,720 | 1,830 | 1,597 | |||||||||
(7) Income Taxes
Income (loss) before income taxes and equity in earnings of joint venture generated by the
Company’s U.S. and non-U.S. operations were as follows:
| 2010 | 2009 | 2008 | ||||||||||
U.S. |
$ | (19,420 | ) | $ | (40,465 | ) | $ | (13,425 | ) | |||
Non-U.S. |
5,094 | (3,104 | ) | 8,184 | ||||||||
The Company’s income tax (benefit) expense is comprised of the following:
| 2010 | 2009 | 2008 | ||||||||||
Federal — current |
$ | 6,823 | $ | (27,641 | ) | $ | 25,943 | |||||
— deferred |
(11,270 | ) | 14,611 | (11,025 | ) | |||||||
State — current |
17 | (752 | ) | 2,827 | ||||||||
— deferred |
(186 | ) | (1,396 | ) | (2,381 | ) | ||||||
Foreign — current |
1,464 | 970 | 5,498 | |||||||||
— deferred |
51 | (2,056 | ) | (172 | ) | |||||||
| $ | (3,101 | ) | $ | (16,264 | ) | $ | 20,690 | |||||
51
Table of Contents
The reconciliation between the Company’s effective tax rate on income and the U.S. federal
income tax rate of 35% is as follows:
| 2010 | 2009 | 2008 | ||||||||||
Federal income tax at statutory rates |
$ | (5,014 | ) | $ | (15,248 | ) | $ | (1,834 | ) | |||
State income taxes, net of federal income tax benefits |
(313 | ) | (1,561 | ) | 95 | |||||||
Federal and state income tax on joint venture |
2,158 | 154 | 3,460 | |||||||||
Impairment of goodwill |
— | 475 | 20,601 | |||||||||
Rate differential on foreign income |
(755 | ) | — | (1,253 | ) | |||||||
Tax on permanent differences |
326 | 525 | (633 | ) | ||||||||
Unrecognized tax benefits |
424 | (1,422 | ) | 705 | ||||||||
Other |
73 | 813 | (451 | ) | ||||||||
Income tax (benefit) expense |
$ | (3,101 | ) | $ | (16,264 | ) | $ | 20,690 | ||||
Effective income tax expense rate |
21.7 | % | 37.3 | % | (394.8 | %) | ||||||
Significant components of the Company’s deferred tax liabilities and assets are as follows:
| 2010 | 2009 | |||||||
Deferred tax liabilities: |
||||||||
Depreciation |
$ | 5,634 | $ | 7,895 | ||||
Inventory |
5,364 | 13,249 | ||||||
Pension |
6,940 | 7,480 | ||||||
Intangible assets and goodwill |
21,464 | 23,510 | ||||||
Total deferred tax liabilities |
$ | 39,402 | $ | 52,134 | ||||
Deferred tax assets: |
||||||||
Postretirement benefits |
$ | 3,365 | $ | 3,102 | ||||
Deferred compensation |
1,156 | 637 | ||||||
Deferred gain |
603 | 950 | ||||||
Impairments |
1,430 | 803 | ||||||
Net operating loss carryforward |
2,329 | 3,713 | ||||||
Other, net |
1,304 | 1,191 | ||||||
Total deferred tax assets |
$ | 10,187 | $ | 10,396 | ||||
Net deferred tax liabilities |
$ | 29,215 | $ | 41,738 | ||||
As of December 31, 2010 and December 31, 2009, the Company had estimated federal net operating
losses (“NOLs”) of $1,557 and $40,613, respectively, available to offset past and future federal
taxable income. These NOLs expire in year 2030. The Company believes it will be able to carryback
all of the federal NOLs to prior years.
As of December 31, 2010 and December 31, 2009, the Company had estimated state NOLs of $12,165 and
$40,613, respectively. The state NOLs expire in years 2015 to 2030.
As of December 31, 2010 and December 31, 2009, the Company had estimated foreign NOLs of $3,359 and
$8,779, respectively. Foreign NOLs of $85 expire in year 2030 and $3,274 of the foreign NOLs do
not expire. The Company believes it will be able to carryback the $85 of expiring foreign NOLs to
prior years.
Based on all available evidence, including historical and forecasted financial results, the Company
determined that it is more likely than not that the state and foreign NOLs that have expiration
dates will be realized due to the fact that the Company anticipates it will be able to have
sufficient earnings in future years to use the NOL carryforwards prior to expiration. To the
extent that the Company does not generate sufficient state or foreign taxable income within the
statutory carryforward periods to utilize the NOL carryforwards in the respective jurisdictions,
they will expire unused. However, based upon all available evidence, the Company has concluded
that it will utilize these NOL carryforwards prior to the expiration period.
52
Table of Contents
The following table shows the net change in the Company’s unrecognized tax benefits:
| 2010 | 2009 | 2008 | ||||||||||
Balance as of January 1 |
$ | 726 | $ | 2,273 | $ | 1,754 | ||||||
Increases (decreases) in unrecognized tax benefits: |
||||||||||||
Due to tax positions taken in prior years |
729 | 272 | 169 | |||||||||
Due to tax positions taken during the current year |
44 | — | 350 | |||||||||
Due to settlement with tax authorities |
(34 | ) | (1,187 | ) | — | |||||||
Due to expiration of statute |
— | (632 | ) | — | ||||||||
Balance as of December 31 |
$ | 1,465 | $ | 726 | $ | 2,273 | ||||||
Unrecognized tax benefits of $950, $468 and $1,775 would impact the effective tax rate if
recognized as of December 31, 2010, 2009 and 2008, respectively. The Company had accrued interest
and penalties related to unrecognized tax benefits of $171 and $87 at December 31, 2010 and 2009,
respectively. The interest and penalties recorded by the Company were insignificant for the years
ended December 31, 2010, 2009 and 2008. It is reasonably possible that the gross unrecognized tax
benefits may decrease within the next 12 months by a range of approximately $0 to $650.
During 2009 the statute expired on an unrecognized tax benefit for a pre-acquisition period of one
of the Company’s subsidiaries. The reversal of the reserve for this unrecognized tax benefit was
recorded as a component of overall income tax benefit for the year ended December 31, 2009.
The Company or its subsidiaries files income tax returns in the U.S., 29 states and 7 foreign
jurisdictions. During 2009, the Internal Revenue Service (“IRS”) completed the examination of the
Company’s 2005 and 2006 U.S. federal income tax returns. In connection with this examination, the
Company settled with the IRS regarding certain tax positions including the Company’s federal income
tax inventory costing methodologies. As a result of the settlement, the Company did not recognize
a significant amount of additional tax expense during the year ended December 31, 2009. The tax
years 2007 through 2010 remain open to examination by the major taxing jurisdictions to which the
Company is subject.
(8) Goodwill and Intangible Assets
The changes in carrying amounts of goodwill during the years ended December 31, 2010 and 2009 were
as follows:
| 2010 | 2009 | |||||||||||||||||||||||
| Metals | Plastics | Metals | Plastics | |||||||||||||||||||||
| Segment | Segment | Total | Segment | Segment | Total | |||||||||||||||||||
Balance as of January 1 |
||||||||||||||||||||||||
Goodwill |
97,316 | 12,973 | 110,289 | $ | 97,208 | $ | 12,973 | $ | 110,181 | |||||||||||||||
Accumulated impairment losses |
(60,217 | ) | — | (60,217 | ) | (58,860 | ) | — | (58,860 | ) | ||||||||||||||
| $ | 37,099 | $ | 12,973 | $ | 50,072 | 38,348 | 12,973 | 51,321 | ||||||||||||||||
Acquisition
of Metals U.K. |
— | — | — | — | — | — | ||||||||||||||||||
Impairment losses |
— | — | — | (1,357 | ) | — | (1,357 | ) | ||||||||||||||||
Currency valuation |
38 | — | 38 | 108 | — | 108 | ||||||||||||||||||
Balance as of December 31 |
||||||||||||||||||||||||
Goodwill |
97,354 | 12,973 | 110,327 | 97,316 | 12,973 | 110,289 | ||||||||||||||||||
Accumulated impairment losses |
(60,217 | ) | — | (60,217 | ) | (60,217 | ) | — | (60,217 | ) | ||||||||||||||
| $ | 37,137 | $ | 12,973 | $ | 50,110 | $ | 37,099 | $ | 12,973 | $ | 50,072 | |||||||||||||
53
Table of Contents
The Company’s annual test for goodwill impairment is completed as of January 1st each
year. Based on its January 1, 2010 test, the Company determined that there was no impairment of
goodwill.
During the fourth quarter of 2009, the Company thoroughly reviewed its long-term forecasts as part
of its annual budgeting process. As a result of this process, the Company determined that it was
more likely than not that goodwill was impaired and therefore, the Company performed an interim
goodwill impairment analysis as of December 31, 2009. The Company recorded a non-cash charge of
$1,357 related to the Oil & Gas reporting unit during the fourth quarter of 2009. The charge was
non-deductible for tax purposes.
During the fourth quarter of 2008, the Company determined that the weakening of the U.S. economy
and the global credit crisis resulted in a reduction of the Company’s market capitalization below
its total shareholder’s equity value for a sustained period of time, which was an indication that
it was more likely than not that goodwill was impaired. As a result, the Company performed an
interim goodwill impairment analysis as of December 31, 2008. The Company recorded a non-cash
charge of $58,860 for goodwill impairment during the fourth quarter of 2008. The charge was
non-deductible for tax purposes. Of this amount, $49,823 and $9,037 related to the Aerospace and
Metals U.K. reporting units, respectively, within the Metals segment.
The following summarizes the components of intangible assets at December 31, 2010 and 2009:
| 2010 | 2009 | |||||||||||||||
| Gross Carrying | Accumulated | Gross Carrying | Accumulated | |||||||||||||
| Amount | Amortization | Amount | Amortization | |||||||||||||
Customer relationships |
$ | 69,452 | $ | 28,025 | $ | 69,549 | $ | 21,435 | ||||||||
Non-compete agreements |
2,888 | 2,888 | 2,938 | 2,477 | ||||||||||||
Trade name |
378 | 378 | 378 | 378 | ||||||||||||
Total |
$ | 72,718 | $ | 31,291 | $ | 72,865 | $ | 24,290 | ||||||||
The weighted-average amortization period for the intangible assets is 10.5 years, 10.8 years for
customer relationships and 3 years for non-compete agreements. Substantially all of the Company’s
intangible assets were acquired as part of the acquisitions of Transtar on September 5, 2006 and
Metals U.K. on January 3, 2008.
For the years ended December 31, 2010, 2009, and 2008, the aggregate amortization expense was
$7,071, $7,441 and $8,271, respectively.
The following is a summary of the estimated annual amortization expense for each of the next 5
years:
2011 |
$ | 6,614 | ||
2012 |
6,142 | |||
2013 |
6,142 | |||
2014 |
6,142 | |||
2015 |
6,142 |
54
Table of Contents
(9) Debt
Short-term and long-term debt consisted of the following at December 31, 2010 and 2009:
| 2010 | 2009 | |||||||
SHORT-TERM DEBT |
||||||||
U.S. Revolver A (a) |
$ | — | $ | 5,000 | ||||
Trade acceptances (c) |
— | 8,720 | ||||||
Total short-term debt |
— | 13,720 | ||||||
LONG-TERM DEBT |
||||||||
6.76% insurance company loan due in scheduled
installments through 2015 (b) |
42,835 | 50,026 | ||||||
U.S. Revolver B (a) |
25,704 | 24,246 | ||||||
Other, primarily capital leases |
600 | 1,192 | ||||||
Total long-term debt |
69,139 | 75,464 | ||||||
Less current portion |
(8,012 | ) | (7,778 | ) | ||||
Total long-term portion |
61,127 | 67,686 | ||||||
TOTAL SHORT-TERM AND LONG-TERM DEBT |
$ | 69,139 | $ | 89,184 | ||||
(a) The Company’s amended and Restated Credit Agreement (the “2008 Senior Credit Facility”)
provides a $230,000 five-year secured revolver consisting of (i) a $170,000 revolving “A” loan (the
“U.S. Revolver A”), (ii) a $50,000 multicurrency revolving “B” loan (the “U.S. Revolver B“ and with
the U.S. Revolver A, the “U.S. Facility”), and (iii) a Canadian dollar $9,784 revolving loan
(corresponding to $10,000 in U.S. dollars as of the amendment closing date; availability expressed
in U.S. dollars changes based on movement in the exchange rate between the Canadian dollar and U.S.
dollar) (the “Canadian Facility”). The maturity date of the 2008 Senior Credit Facility is January
2, 2013. The obligations of the U.K. subsidiary under the U.S. Revolver B are guaranteed by the
Company and its material domestic subsidiaries (the “Guarantee Subsidiaries”) pursuant to a U.K.
Guarantee Agreement entered into by the Company and the Guarantee Subsidiaries on January 2, 2008.
The U.S. Facility is guaranteed by the material domestic subsidiaries of the Company and is
secured by substantially all of the assets of the Company and its domestic subsidiaries. The
obligations of the Company rank pari passu in right of payment with the Company’s long-term notes.
The U.S. Facility contains a letter of credit sub-facility providing for the issuance of letters of
credit up to $20,000. Depending on the type of borrowing selected by the Company, the applicable
interest rate for loans under the U.S. Facility is calculated as a per annum rate equal to (i)
LIBOR plus a variable margin or (ii) “Base Rate”, which is the greater of the U.S. prime rate or
the federal funds effective rate plus 0.5%, plus a variable margin. The margin on LIBOR or Base
Rate loans may fall or rise as set forth in the 2008 Senior Credit Facility depending on the
Company’s debt-to-capital ratio as calculated on a quarterly basis.
The Canadian Facility is guaranteed by the Company and is secured by substantially all of the
assets of the Canadian subsidiary. The Canadian Facility provides for a letter of credit
sub-facility providing for the issuance of letters of credit in an aggregate amount of up to
Canadian dollar $2,000. Depending on the type of borrowing selected by the Canadian subsidiary,
the applicable interest rate for loans under the Canadian Facility is calculated as a per annum
rate equal to (i) for loans drawn in U.S. dollars, the rate plus a variable margin is the same as
the U.S. Facility and (ii) for loans drawn in Canadian dollars, the applicable Canadian Deposit
Offer Rate (“CDOR”) rate for banker’s acceptances of the applicable face value and tenor or the
greater of (a) the Canadian prime rate or (b) the one-month CDOR rate plus 0.5%. The margin on the
loans drawn under the Canadian Facility may fall or rise as set forth in the agreement depending on
the Company’s debt-to-total capital ratio as calculated on a quarterly basis.
The U.S. Facility and the Canadian Facility are each an asset-based loan with a borrowing base that
fluctuates primarily with the Company’s and the Canadian subsidiary’s receivable and inventory
levels.
The covenants and events of default contained in the 2008 Senior Credit Facility, including
financial covenants, match those set forth in the Company’s long-term note agreements. These
covenants limit certain matters, including the incurrence of liens, the sale of assets, and mergers
and consolidations, and include a maximum debt-to-working capital ratio, a maximum debt-to-total
capital ratio and a minimum net worth provision. There is also a provision to release liens on the
assets of the Company and all of its subsidiaries should the Company achieve an investment grade
credit rating. The events of default include the failure to pay principal or interest when due,
failure to comply with covenants and other agreements, defaults under other material debt
instruments of the Company or its subsidiaries, certain judgments against the Company or its
subsidiaries or events of bankruptcy involving the Company or its subsidiaries, the failure of the
guarantees or security documents to be in full force and effect or a default under those
agreements, or the Company’s entry into a receivables securitization facility. Upon the occurrence
of an event of default, the Company’s obligations under the agreements may be accelerated.
55
Table of Contents
The U.S. Revolver A is classified as short-term based on the Company’s ability and intent to
repay amounts outstanding under this instrument within the next 12 months. U.S. Revolver B is
classified as long-term as the Company’s cash projections indicate that amounts outstanding (which
are denominated in British pounds) under this instrument are not expected to be repaid within the
next 12 months. The Company had availability of $72,701 under its U.S. Revolver A and $24,296
under its U.S. Revolver B as of December 31, 2010. The Company’s Canadian subsidiary had
availability of $9,829 in U.S. dollars. The weighted average interest rate for borrowings under
the U.S. Revolver A and U.S. Revolver B for the year ended December 31, 2010 was 2.78% and 1.55%,
respectively. The weighted average interest rate under the Canadian Revolver for the year ended
December 31, 2010 was 0.21% and represents unused credit line fees.
(b) On November 17, 2005, the Company entered into a ten year note agreement (the “Note
Agreement”) with an insurance company and its affiliate pursuant to which the Company issued and
sold $75,000 aggregate principal amount of the Company’s 6.26% senior secured notes due in
scheduled installments through November 17, 2015 (the “Notes”). On January 2, 2008, the Company
and its material domestic subsidiaries entered into a Second Amendment with its insurance company
and affiliate to amend the covenants on the Notes so as to be substantially the same as the 2008
Senior Credit Facility.
Interest on the Notes accrues at the rate 6.76% annually, payable semi-annually. This rate will
remain in effect until the Company achieves an investment grade credit rating on its senior
indebtedness, at which time the interest rate on the Notes reverts back to 6.26%.
The Company’s annual debt service requirements under the Notes, including annual interest payments,
will approximate $10,223 to $10,510 per year over their remaining term. The Notes may not be
prepaid without a premium.
The Notes are senior secured obligations of the Company and are pari passu in right of payment with
the Company’s other senior secured obligations, including the 2008 Senior Credit Facility. The
Notes are secured, on an equal and ratable basis with the Company’s obligations under the 2008
Senior Credit Facility, by first priority liens on all of the Company’s and its U.S. subsidiaries’
material assets and a pledge of all of the Company’s equity interests in certain of its
subsidiaries. The Notes are guaranteed by all of the Company’s material U.S. subsidiaries.
(c) A trade acceptance purchase agreement which was a 364-day facility expired by its terms on
August 27, 2010. The outstanding trade acceptances were paid in their entirety on their respective
maturity dates during the fourth quarter of 2010.
Aggregate annual principal payments required on the Company’s total long-term debt for each of the
next five years and beyond are as follows:
2011 |
$ | 8,012 | ||
2012 |
8,181 | |||
2013 |
34,319 | |||
2014 |
9,052 | |||
2015 |
9,575 | |||
2016 and beyond |
— | |||
Total debt |
$ | 69,139 | ||
Net interest expense reported on the consolidated statements of operations was reduced by interest
income from investment of excess cash balances of $201 in 2010, $163 in 2009 and $841 in 2008.
56
Table of Contents
The fair value of the Company’s fixed rate debt as of December 31, 2010, including current
maturities, was estimated to be $42,300 compared to a carrying value of $42,835. The fair value of
the fixed rate debt was determined using a market approach, which estimates fair value based on
companies with similar credit quality and size of debt issuances. As of December 31, 2010, the
estimated fair value of the Company’s debt outstanding under its revolving credit facility is
$23,627, assuming the current amount of debt outstanding at the end of the year was outstanding
until the maturity of the Company’s facility in January 2013. Although borrowings could be
materially greater or less than the current amount of borrowings outstanding at the end of the
year, it is not practical to estimate the amounts that may be outstanding during the future periods
since there is no predetermined borrowing or repayment schedule. The estimated fair value of the
Company’s debt outstanding under its revolving credit facility is lower than the carrying value of
$25,704 since the terms of this facility are more favorable than those that might be expected to be
available in the current lending environment.
As of December 31, 2010, the Company remained in compliance with the covenants of its financing
agreements, which require it to maintain certain funded debt-to-capital and working capital-to-debt
ratios and a minimum adjusted consolidated net worth as defined within the agreements.
(10) Share-based Compensation
The Company accounts for its share-based compensation arrangements by recognizing compensation
expense for the fair value of the share awards granted ratably over their vesting period. The
consolidated compensation cost recorded for the Company’s share-based compensation arrangements was
$2,411, $1,370 and $454 for 2010, 2009 and 2008, respectively. The total income tax benefit
recognized in the consolidated statements of operations for share-based compensation arrangements
was $831, $530 and $177 in 2010, 2009 and 2008, respectively. All compensation expense related to
share-based compensation arrangements is recorded in sales, general and administrative expense.
The unrecognized compensation cost as of December 31, 2010 associated with all share-based payment
arrangements is $4,075 and the weighted average period over which it is to be expensed is 1.5
years.
Restricted Stock, Stock Option and Equity Compensation Plans — The Company maintains certain
long-term stock incentive and stock option plans for the benefit of officers, directors and other
key management employees. A summary of the authorized shares under these plans is detailed below:
| Plan Description | Authorized Shares | |||
1995 Directors Stock Option Plan |
188 | |||
1996 Restricted Stock and Stock Option Plan |
938 | |||
2000 Restricted Stock and Stock Option Plan |
1,200 | |||
2004 Restricted Stock, Stock Option and Equity Compensation Plan |
1,350 | |||
2008
Restricted Stock, Stock Option and Equity Compensation Plan (amended and restated as of December 9, 2010) |
2,000 | |||
Long-Term Compensation and Incentive Plans
On March 18, 2010, the Human Resources Committee (the “Committee”) of the Board of Directors of the
Company approved equity awards under the Company’s 2010 Long-Term Compensation Plan (“2010 LTC
Plan”) for executive officers and other select personnel. The 2010 LTC Plan awards included
restricted stock units (“RSUs”), performance share units, and stock options. All 2010 LTC Plan
awards are subject to the terms of the Company’s 2008 Restricted Stock, Stock Option and Equity
Compensation Plan, amended and restated as of December 9, 2010. In addition to the 2010 LTC Plan,
the Company maintains 2008 and 2009 Long-Term Incentive Plans (“LTI Plans”) for executive officers
and other select personnel under which they may receive share-based awards.
Unless covered by a specific change-in-control or severance agreement, participants to whom RSUs,
performance shares and other non-vested shares have been granted must be employed by the Company on
the vesting date or at the end of the performance period, respectively, or the award will be
forfeited. However, for stock option awards, unless a participant is covered by a specific
change-in-control or severance agreement, options are forfeited in the event of the termination of
employment other than by reason of disability or a retirement.
57
Table of Contents
Compensation expense is recognized based on management’s estimate of the total number of
share-based awards expected to vest at the end of the service period.
Restricted Share Units and Non-Vested Shares
The RSUs granted under the 2010 LTC Plan will cliff vest on December 31, 2012. Each RSU that
becomes vested entitles the participant to receive one share of the Company’s common stock. The
number of shares delivered may be reduced by the number of shares required to be withheld for
federal and state withholding tax requirements (determined at the market price of Company shares at
the time of payout). The Company’s 2009 LTI Plan also included issuance of approximately 187
non-vested share awards which cliff vest on December 31, 2011. Approximately 155 shares associated
with the 2009 LTI Plan are outstanding as of December 31, 2010. The remaining outstanding
non-vested share balance primarily consists of shares issued to the Board of Directors during the
second quarter of 2010. The Director shares vest during the second quarter of 2011.
The fair value of the RSUs and non-vested shares is established using the market price of the
Company’s stock on the date of grant.
A summary of the RSU and non-vested share activity is as follows:
| Shares | Units | |||||||||||||||
| Weighted- | Weighted- | |||||||||||||||
| Average Grant | Average Grant | |||||||||||||||
| Shares | Date Fair Value | Units | Date Fair Value | |||||||||||||
Outstanding at January 1, 2010 |
262 | $ | 10.76 | — | — | |||||||||||
Granted |
48 | $ | 17.88 | 150 | $ | 12.07 | ||||||||||
Forfeited |
(22 | ) | $ | 6.37 | (9 | ) | $ | 12.07 | ||||||||
Vested |
(54 | ) | $ | 11.19 | — | |||||||||||
Outstanding at December 31, 2010 |
234 | $ | 13.52 | 141 | $ | 12.07 | ||||||||||
Expected to vest at December 31, 2010 |
224 | $ | 13.73 | 126 | $ | 12.07 | ||||||||||
The unrecognized compensation cost as of December 31, 2010 associated with RSU and non-vested
share awards is $1,834. The total fair value of shares vested during the years ended December 31,
2010, 2009 and 2008 was $600, $1,392 and $665, respectively. The fair value of the non-performance
based restricted stock awards is established using the market price of the Company’s stock on the
date of grant.
Performance Shares
Under the 2010 LTC Plan, the potential award for the performance shares granted is dependent on the
Company’s relative total shareholder return (“RTSR”), which represents a market condition, over a
three-year performance period, beginning January 1, 2010 and ending December 31, 2012. RTSR is
measured against a group of peer companies either in the metals industry or in the industrial
products distribution industry (the “RTSR Peer Group”). The 2010 LTC Plan provides with respect to
performance shares for (1) a threshold level up to which the threshold level of performance shares
will vest, a target performance level at which the target number of performance shares will vest, a
maximum performance level at or above which the maximum number of performance shares will vest, and
pro rata vesting between the threshold and maximum performance levels and (2) minimum and maximum
vesting opportunities ranging from one-half up to two times the target number. The threshold,
target and maximum performance levels for RTSR are the 25th, 50th and 75th percentile,
respectively, relative to RTSR Peer Group performance. The number of performance shares, if any,
that vest based on the performance achieved during the three-year performance period, will vest at
the end of the three-year performance period. Compensation expense for performance awards
containing a market condition is recognized regardless of whether the market condition is achieved
to the extent the requisite service period condition is met. Each performance share that becomes
vested entitles the participant to receive one share of the Company’s common stock. The number of
shares delivered may be reduced by the number of shares required to be withheld for federal and
state withholding tax requirements (determined at the market price of Company shares at the time of
payout).
58
Table of Contents
The grant date fair value of $12.26 for each performance share awarded under the 2010 LTC Plan
was estimated using a Monte Carlo simulation with the following assumptions:
| 2010 | ||||
Expected volatility |
61.6 | % | ||
Risk-free interest rate |
1.45 | % | ||
Expected life (in years) |
2.8 | |||
Expected dividend yield |
— | |||
Final award vesting and distribution of performance awards granted under the 2009 and 2008 LTI
Plans are determined based on the Company’s actual performance versus the target goals for a
three-year consecutive period (as defined in the 2008 and 2009 Plans). Partial performance awards
can be earned for performance less than the target goal, but in excess of minimum goals; and award
distributions twice the target can be achieved if the maximum goals are met or exceeded. The
performance goals are three-year cumulative net income and average return on total capital for the
same three-year period. Compensation expense recognized is based on management’s expectation of
future performance compared to the pre-established performance goals. If the performance goals are
not expected to be met under the LTI Plans, no compensation expense is recognized and any
previously recognized compensation expense is reversed. The grant date fair-value of performance
awards under the 2008 and 2009 LTI Plans was established using the market price of the Company’s
stock on the date of grant.
The status of performance shares that have been awarded as part of the active LTC and LTI Plans is
summarized below as of December 31, 2010:
| Estimated Number of | Maximum Number of | |||||||||||
| Grant Date Fair | Performance Shares | Performance Shares that | ||||||||||
| Plan Year | Value | to be Issued | could Potentially be Issued | |||||||||
2010 LTC Plan |
$ | 12.26 | 147 | 283 | ||||||||
2009 LTI Plan |
$ | 5.66 | — | 619 | ||||||||
2008 LTI Plan |
$ | 22.90 – $28.17 | — | 317 | ||||||||
As of December 31, 2010, the Company exceeded the threshold level at which shares would vest for
the 2010 LTC Plan.
The unrecognized compensation cost as of December 31, 2010 associated with the 2010 LTC Plan
performance shares is $1,109.
Stock Options
The stock options issued under the 2010 LTC Plan vest and become exercisable three years from the
date of the grant. The term of the options is eight years. The exercise price of the options is
$12.79 per share (which is based on the average closing price of the Company’s common stock for the
10 trading days preceding the date on which the options were granted).
59
Table of Contents
The grant date fair value of $5.71 per share was estimated using the Black-Scholes option-pricing
model with the following assumptions:
| 2010 | ||||
Expected volatility |
58.5 | % | ||
Risk-free interest rate |
2.3 | % | ||
Expected life (in years) |
5.5 | |||
Expected dividend yield |
1.2 | % | ||
A summary of the stock option activity is as follows:
| Weighted | Weighted Average | |||||||||||||||
| Average | Intrinsic | Remaining | ||||||||||||||
| Shares | Exercise Price | Value | Contractual Life | |||||||||||||
Stock options outstanding at January 1, 2010 |
239 | $ | 11.37 | |||||||||||||
Granted |
303 | $ | 12.79 | |||||||||||||
Exercised |
(52 | ) | $ | 10.99 | ||||||||||||
Forfeited |
(17 | ) | $ | 12.79 | ||||||||||||
Expired |
(2 | ) | $ | 10.00 | ||||||||||||
Stock options outstanding at December 31, 2010 |
471 | $ | 12.28 | $ | 3,089 | 5.7 years | ||||||||||
Stock options exercisable at December 31, 2010 |
185 | $ | 11.48 | $ | 1,485 | 3.2 years | ||||||||||
Stock options vested or expected to vest as of
December 31, 2010 |
440 | $ | 12.24 | $ | 2,914 | 5.6 years | ||||||||||
The total intrinsic value of options exercised during the years ended December 31, 2010, 2009 and
2008, was $219, $0 and $677, respectively. The unrecognized compensation cost as of December 31,
2010 associated with stock options is $1,132.
Deferred Compensation Plan
The Company maintains a Board of Director’s Deferred Compensation Plan for directors who are not
officers of the Company. Under this plan, directors have the option to defer payment of their
retainer into either a stock equivalent unit account or an interest account. Disbursement of the
interest account and the stock equivalent unit account can be made only upon a director’s
resignation, retirement or death, or otherwise as a lump sum or in installments on one or more
distribution dates at the directors election made at the time of the election to defer
compensation. Disbursement is generally made in cash, but the stock equivalent unit account
disbursement may be made in common shares at the director’s option. Fees deferred into the stock
equivalent unit account are a form of share-based payment and are accounted for as a liability
award which is re-measured at fair value at each reporting date. As of December 31, 2010, a total
of 31 common share equivalent units are included in the director stock equivalent unit accounts.
Compensation benefit related to the fair value re-measurement associated with this plan for the
years ended December 31, 2010, 2009 and 2008 was $142, $90 and $396, respectively.
60
Table of Contents
(11) Commitments and Contingent Liabilities
As of December 31, 2010, the Company had $2,898 of irrevocable letters of credit outstanding
which primarily consisted of $2,248 for compliance with the insurance reserve requirements of
its workers’ compensation insurance carriers.
The Company is a defendant in several lawsuits arising from the operation of its business.
These lawsuits are incidental and occur in the normal course of the Company’s business affairs.
It is the opinion of the management, based on current knowledge that no uninsured liability will
result from the outcome of this litigation that would have a material adverse effect on the
consolidated results of operations, financial condition or cash flows of the Company.
(12) Accumulated Other Comprehensive Loss
Accumulated other comprehensive loss as reported in the consolidated balance sheets as of
December 31, 2010 and 2009 was comprised of the following:
| 2010 | 2009 | |||||||
Foreign currency translation losses |
$ | (3,750 | ) | $ | (3,214 | ) | ||
Unrecognized pension and postretirement benefit
costs, net of tax |
(12,062 | ) | (10,314 | ) | ||||
Total accumulated other comprehensive loss |
$ | (15,812 | ) | $ | (13,528 | ) | ||
(13) Selected Quarterly Data
(Unaudited)
| First | Second | Third | Fourth | |||||||||||||
| Quarter | Quarter | Quarter | Quarter | |||||||||||||
2010 |
||||||||||||||||
Net sales |
$ | 222,996 | $ | 240,132 | $ | 244,938 | $ | 235,640 | ||||||||
Gross profit (a) |
19,899 | 26,090 | 27,111 | 25,785 | ||||||||||||
Net (loss) income |
(4,622 | ) | 408 | 72 | (1,498 | ) | ||||||||||
Basic (loss) earnings per share |
$ | (0.20 | ) | $ | 0.02 | $ | 0.00 | $ | (0.07 | ) | ||||||
Diluted (loss) earnings per share |
$ | (0.20 | ) | $ | 0.02 | $ | 0.00 | $ | (0.07 | ) | ||||||
Common stock dividends declared |
$ | — | $ | — | $ | — | $ | — | ||||||||
2009 |
||||||||||||||||
Net sales |
$ | 252,244 | $ | 195,103 | $ | 183,960 | $ | 181,331 | ||||||||
Gross profit (a) |
33,722 | 18,275 | 14,980 | 3,390 | ||||||||||||
Net income (loss) |
480 | (5,521 | ) | (6,337 | ) | (15,525 | ) | |||||||||
Basic earnings (loss) per share |
$ | 0.02 | $ | (0.24 | ) | $ | (0.28 | ) | $ | (0.68 | ) | |||||
Diluted earnings (loss) per share |
$ | 0.02 | $ | (0.24 | ) | $ | (0.28 | ) | $ | (0.68 | ) | |||||
Common stock dividends declared |
$ | 0.06 | $ | — | $ | — | $ | — | ||||||||
| (a) | Gross profit equals net sales minus cost of materials, warehouse, processing, and delivery costs and less depreciation and amortization expense. |
61
Table of Contents
REPORT OF INDEPENDENT REGISTERED PUBLIC ACCOUNTING FIRM
To the Board of Directors and Stockholders of A.M. Castle & Co.
Franklin Park, Illinois
Franklin Park, Illinois
We have audited the accompanying consolidated balance sheets of A.M. Castle & Co. and subsidiaries
(the “Company”) as of December 31, 2010 and 2009, and the related consolidated statements of
operations, stockholders’ equity, and cash flows for each of the three years in the period ended
December 31, 2010. These consolidated financial statements are the responsibility of the Company’s
management. Our responsibility is to express an opinion on the consolidated financial statements
based on our audits.
We conducted our audits in accordance with the standards of the Public Company Accounting Oversight
Board (United States). Those standards require that we plan and perform the audit to obtain
reasonable assurance about whether the financial statements are free of material misstatement. An
audit includes examining, on a test basis, evidence supporting the amounts and disclosures in the
financial statements. An audit also includes assessing the accounting principles used and
significant estimates made by management, as well as evaluating the overall financial statement
presentation. We believe that our audits provide a reasonable basis for our opinion.
In our opinion, such consolidated financial statements present fairly, in all material respects,
the financial position of A.M. Castle & Co. and subsidiaries as of December 31, 2010 and 2009, and
the results of their operations and their cash flows for each of the three years in the period
ended December 31, 2010, in conformity with accounting principles generally accepted in the United
States of America.
We have also audited, in accordance with the standards of the Public Company Accounting Oversight
Board (United States), the Company’s internal control over financial reporting as of December 31,
2010, based on the criteria established in Internal Control—Integrated Framework issued by the
Committee of Sponsoring Organizations of the Treadway Commission and our report dated March 11,
2011, expressed an unqualified opinion on the Company’s internal control over financial reporting.
/s/ Deloitte & Touche LLP |
||
Chicago, Illinois
March 11, 2011
March 11, 2011
62
Table of Contents
| ITEM 9 | — Changes In and Disagreements With Accountants on Accounting and Financial Disclosure |
None.
| ITEM 9A | — Controls & Procedures |
Disclosure Controls and Procedures
A review and evaluation was performed by the Company’s management, including the Chief Executive
Officer (CEO) and Chief Financial Officer (CFO), of the effectiveness of the design and operation
of the Company’s disclosure controls and procedures (as defined in Rule 13a-15(e) of the Security
Exchange Act of 1934). Based upon that review and evaluation, the CEO and CFO have concluded that
the Company’s disclosure controls and procedures were effective as of December 31, 2010.
(a) Management’s Annual Report on Internal Control Over Financial Reporting
The Company’s management is responsible for establishing and maintaining adequate internal control
over financial reporting as such term is defined in the Securities Exchange Act of 1934 rule
240.13a-15(f). The Company’s internal control over financial reporting is a process designed under
the supervision of the Company’s Chief Executive Officer and Chief Financial Officer to provide
reasonable assurance regarding the preparation of financial statements for external purposes in
accordance with U.S. generally accepted accounting principles.
Internal control over financial reporting, no matter how well designed, has inherent limitations
and may not prevent or detect misstatements. Therefore, even effective internal control over
financial reporting can only provide reasonable assurance with respect to the financial statement
preparation and presentation. Also, projections of any evaluation of effectiveness to future
periods are subject to risk that controls may become inadequate because of changes in conditions,
or that the degree of compliance with the policies or procedures may deteriorate.
The Company, under the direction of its Chief Executive Officer and Chief Financial Officer,
conducted an evaluation of the effectiveness of its internal control over financial reporting as of
December 31, 2010 based upon the framework published by the Committee of Sponsoring Organizations
of the Treadway Commission, referred to as the Internal Control — Integrated Framework.
Based on our evaluation under the framework in Internal Control — Integrated Framework, the
Company’s management has concluded that our internal control over financial reporting was effective
as of December 31, 2010.
The effectiveness of the Company’s internal control over financial reporting as of December 31,
2010 has been audited by Deloitte & Touche LLP, an independent registered public accounting firm,
as stated in their attestation report included in Item 9A of this annual report.
63
Table of Contents
(b) Report of Independent Registered Public Accounting Firm
To the Board of Directors and Stockholders of A.M. Castle & Co.
Franklin Park, Illinois
Franklin Park, Illinois
We have audited the internal control over financial reporting of A.M. Castle & Co. and subsidiaries
(the “Company”) as of December 31, 2010, based on criteria established in Internal Control —
Integrated Framework issued by the Committee of Sponsoring Organizations of the Treadway
Commission. The Company’s management is responsible for maintaining effective internal control
over financial reporting and for its assessment of the effectiveness of internal control over
financial reporting, included in the accompanying Management’s Annual Report on Internal Control
Over Financial Reporting. Our responsibility is to express an opinion on the Company’s internal
control over financial reporting based on our audit.
We conducted our audit in accordance with the standards of the Public Company Accounting Oversight
Board (United States). Those standards require that we plan and perform the audit to obtain
reasonable assurance about whether effective internal control over financial reporting was
maintained in all material respects. Our audit included obtaining an understanding of internal
control over financial reporting, assessing the risk that a material weakness exists, testing and
evaluating the design and operating effectiveness of internal control based on the assessed risk,
and performing such other procedures as we considered necessary in the circumstances. We believe
that our audit provides a reasonable basis for our opinion.
A company’s internal control over financial reporting is a process designed by, or under the
supervision of, the company’s principal executive and principal financial officers, or persons
performing similar functions, and effected by the company’s board of directors, management, and
other personnel to provide reasonable assurance regarding the reliability of financial reporting
and the preparation of financial statements for external purposes in accordance with generally
accepted accounting principles. A company’s internal control over financial reporting includes
those policies and procedures that (1) pertain to the maintenance of records that, in reasonable
detail, accurately and fairly reflect the transactions and dispositions of the assets of the
company; (2) provide reasonable assurance that transactions are recorded as necessary to permit
preparation of financial statements in accordance with generally accepted accounting principles,
and that receipts and expenditures of the company are being made only in accordance with
authorizations of management and directors of the company; and (3) provide reasonable assurance
regarding prevention or timely detection of unauthorized acquisition, use, or disposition of the
company’s assets that could have a material effect on the financial statements.
Because of the inherent limitations of internal control over financial reporting, including the
possibility of collusion or improper management override of controls, material misstatements due to
error or fraud may not be prevented or detected on a timely basis. Also, projections of any
evaluation of the effectiveness of the internal control over financial reporting to future periods
are subject to the risk that the controls may become inadequate because of changes in conditions,
or that the degree of compliance with the policies or procedures may deteriorate.
In our opinion, the Company maintained, in all material respects, effective internal control over
financial reporting as of December 31, 2010, based on the criteria established in Internal Control
— Integrated Framework issued by the Committee of Sponsoring Organizations of the Treadway
Commission.
We have also audited, in accordance with the standards of the Public Company Accounting Oversight
Board (United States), the consolidated financial statements as of and for the year ended December
31, 2010 of the Company and our report dated March 11, 2011, expressed an unqualified opinion on
those consolidated financial statements.
/s/ Deloitte & Touche LLP |
||
Chicago, Illinois
March 11, 2011
March 11, 2011
64
Table of Contents
(c) Change in Internal Control Over Financial Reporting
An evaluation was performed by the Company’s management, including the CEO and CFO, of any changes
in internal controls over financial reporting that occurred during the last fiscal quarter and that
materially affected, or is reasonably likely to materially affect, the Company’s internal controls
over financial reporting. The evaluation did not identify any change in the Company’s internal
control over financial reporting that occurred during the latest fiscal quarter and that has
materially affected, or is reasonably likely to materially affect, the Company’s internal controls
over financial reporting.
| Item 9B | — Other Information |
None.
65
Table of Contents
PART III
| ITEM 10 | — Directors, Executive Officers and Corporate Governance |
Information regarding our executive officers is included under the heading “Executive Officers of
the Registrant” in Part I of this Annual Report on Form 10-K. All additional information required
to be filed in Part III, Item 10, Form 10-K, has been included in the sections of the Company’s
Definitive Proxy Statement for its 2011 annual meeting of shareholders (fiscal 2010 Proxy
Statement) dated and to be filed with the Securities and Exchange Commission on or about March 23,
2011, entitled “Proposal 1- Election of Directors,” “Certain Governance Matters,” and “Section
16(A) Beneficial Ownership Reporting Compliance,” and is hereby incorporated by this specific
reference.
| ITEM 11 | — Executive Compensation |
All information required to be filed in Part III, Item 11, Form 10-K, has been included in the
sections of the fiscal 2010 Proxy Statement entitled “Compensation Discussion and Analysis,”
“Report of the Human Resources Committee,” “Non-Employee Director Compensation,” and “Executive
Compensation and Other Information” and is hereby incorporated by this specific reference.
| ITEM 12 | — Security Ownership of Certain Beneficial Owners and Management and Related Stockholder Matters |
The information required to be filed in Part III, Item 12, Form 10-K, has been included in the
sections of the fiscal 2010 Proxy Statement entitled “Stock Ownership of Directors, Management and
Principal Stockholders” and “Equity Compensation Plan Information” and is hereby incorporated by
this specific reference.
| ITEM 13 | — Certain Relationships and Related Transactions, and Director Independence |
All information required to be filed in Part III, Item 13, Form 10-K, has been included in the
sections of the fiscal 2010 Proxy Statement entitled “Related Party Transactions” and “Director
Independence; Financial Experts” and is hereby incorporated by this specific reference.
| ITEM 14 | — Principal Accountant Fees and Services |
All information required to be filed in Part III, Item 14, Form 10-K, has been included in the
sections of the fiscal 2010 Proxy Statement entitled “Audit and Non-Audit Fees” and “Pre-Approval
Policy for Audit and Non-Audit Services” and is hereby incorporated by this specific reference.
66
Table of Contents
PART IV
| ITEM 15 | — Exhibits |
A. M. Castle & Co.
Index To Financial Statements
Index To Financial Statements
| Page | |||||
| 33 | |||||
| 34 | |||||
| 35 | |||||
| 36 | |||||
| 37-61 | |||||
| 62 | |||||
67
Table of Contents
The following exhibits are filed herewith or incorporated by reference.
| Exhibit | ||||
| Number | Description of Exhibit | |||
| 2.1 | Stock Purchase Agreement dated as of August 12, 2006 by and among A. M. Castle &
Co. and Transtar Holdings #2, LLC. Filed as Exhibit 2.1 to Form 8-K filed August
17, 2006. Commission File No. 1-5415. |
|||
| 3.1 | Articles of Incorporation of the Company. Filed as Appendix D to Proxy Statement
filed March 23, 2001. Commission File No. 1-5415. |
|||
| 3.2 | By-Laws of the Company as amended on October 28, 2010. Filed as Exhibit 3.2 to
Quarterly Report on Form 10-Q for the period ended September 30, 2010, which was
filed on November 5, 2010. Commission File No. 1-5415. |
|||
| 3.3 | Articles Supplementary of the Company. Filed as Exhibit 3.3 to Form 8-K filed on
July 29, 2009. Commission File No. 1-5415. |
|||
| 4.1 | Note Agreement dated November 17, 2005 for 6.26% Senior Secured Note Due November
17, 2005 between the Company as issuer and the Prudential Insurance Company of
American and Prudential Retirement Insurance and Annuity Company as Purchasers.
Filed as Exhibit 10 to Form 8-K filed November 21, 2005. Commission File No.
1-5415. |
|||
| 4.2 | Amendment No. 1 to Note Agreement, dated September 5, 2006, between the Company and
The Prudential Insurance Company of America and Prudential Retirement Insurance and
Annuity Company Amendment. Filed as Exhibit 10.16 to Form 8-K filed September 8,
2006. Commission File No. 1-5415. |
|||
| 4.3 | Amendment No. 2 to Note Agreement, dated January 2, 2008, between the Company and
The Prudential Insurance Company of America and Prudential Retirement Insurance and
Annuity Company Amendment. Filed as Exhibit 10.14 to Form 8-K filed January 4,
2008. Commission File No. 1-5415. |
|||
| 4.4 | Amended and Restated Credit Agreement, dated September 5, 2006, by and between A.
M. Castle & Co. and Bank of America, N.A., as U.S. Agent, Bank of America, N.A.,
Canada Branch, as Canadian Agent, JPMorgan Chase Bank, N.A. as Syndication Agent
and LaSalle Business Credit, LLC as Documentation Agent. Filed as Exhibit 10.11 to
Form 8-K filed September 8, 2006. Commission File No. 1-5415. |
|||
| 4.5 | First Amendment to Credit Agreement, dated January 2, 2008, by and between A. M.
Castle & Co., A.M. Castle & Co. (Canada) Inc., A.M. Castle Metals UK, Limited,
certain subsidiaries of the Company, the lenders party thereto, Bank of America,
N.A.. as U.S. Agent and Bank of America, N.A., Canada Branch, as Canadian Agent.
Filed as Exhibit 10.11 to Form 8-K filed January 4, 2008. Commission File No.
1-5415. |
|||
| 4.6 | Guarantee Agreement, dated September 5, 2006, by and between the Company and the
Guarantee Subsidiaries. Filed as Exhibit 10.12 to Form 8-K filed September 8, 2006.
Commission File No. 1-5415. |
|||
| 4.7 | U.K. Guarantee Agreement, dated January 2, 2008, by the Company and the Guarantee
Subsidiaries. Filed as Exhibit 10.12 to Form 8-K filed January 4, 2008. Commission
File No. 1-5415. |
|||
| 4.8 | Amended and Restated Collateral Agency and Intercreditor Agreement, dated September
5, 2006 by and among A.M. Castle & Co., Bank of America, N.A., as Collateral Agent,
The Prudential Insurance Company of America and Prudential Retirement Insurance and
Annuity Company and The Northern Trust Company. Filed as Exhibit 10.13 to Form 8-K
filed September 8, 2006. Commission File No. 1-5415. |
|||
68
Table of Contents
| Exhibit | ||||
| Number | Description of Exhibit | |||
| 4.9 | First Amendment to Amended and Restated Collateral Agency and Intercreditor
Agreement, dated January 2, 2008 by and among A.M. Castle & Co., Bank of America,
N.A., as Collateral Agent, The Prudential Insurance Company of America and
Prudential Retirement Insurance and Annuity Company and The Northern Trust Company.
Filed as Exhibit 10.13 to Form 8-K filed January 4, 2008. Commission File No.
1-5415. |
|||
| 4.10 | Amended and Restated Security Agreement, dated September 5, 2006, among the Company
and the Guarantee Subsidiaries. Filed as Exhibit 10.14 to Form 8-K filed September
8, 2006. Commission File No. 1-5415. |
|||
| 4.11 | Guarantee Agreement, dated September 5, 2006, by and between the Company and
Canadian Lenders and Bank of America, N.A. Canadian Branch, as Canadian Agent.
Filed as Exhibit 10.15 to Form 8-K filed September 8, 2006. Commission File No.
1-5415. |
|||
Instruments defining the rights of holders of other unregistered long-term debt of
A.M. Castle & Co. and its subsidiaries have been omitted from this exhibit index
because the amount of debt authorized under any such instrument does not exceed 10%
of the total assets of the Registrant and its consolidated subsidiaries. The
Registrant agrees to furnish a copy of any such instrument to the Commission upon
request. |
||||
| 10.1 | * | A.M. Castle & Co. Non-Employee Director Restricted Stock Award Agreement. Filed as
Exhibit 10.1 to Form 8-K filed April 27, 2009. Commission File No. 1-5415. |
||
| 10.2 | * | Form of Severance Agreement which is executed with all executive officers, except
the CEO. Filed as Exhibit 10.4 to Annual Report on Form 10-K for the period ended
December 31, 2008, which was filed on March 12, 2009. Commission File No. 1-5415. |
||
| 10.3 | * | Form of Change of Control Agreement which is executed with all executive officers.
Filed as Exhibit 10.5 to Annual Report on Form 10-K for the period ended December
31, 2008, which was filed on March 12, 2009. Commission File No. 1-5415. |
||
| 10.4 | * | A. M. Castle & Co. 1995 Director Stock Option Plan. Filed as Exhibit A to Proxy
Statement filed March 7, 1995. Commission File No. 1-5415. |
||
| 10.5 | * | A. M. Castle & Co. 1996 Restricted Stock and Stock Option Plan. Filed as Exhibit A
to Proxy Statement filed March 8, 2006. Commission File No. 1-5415. |
||
| 10.6 | * | A. M. Castle & Co. 2000 Restricted Stock and Stock Option Plan. Filed as Appendix
B to Proxy Statement filed March 23, 2001. Commission File No. 1-5415. |
||
| 10.7 | * | A. M. Castle & Co. 2004 Restricted Stock, Stock Option and Equity Compensation
Plan. Filed as Exhibit D to Proxy Statement filed March 12, 2004. Commission File
No. 1-5415. |
||
| 10.8 | * | A. M. Castle & Co. 2008 Restricted Stock, Stock Option and Equity Compensation
Plan, as amended and restated as of December 9, 2010. Filed as Exhibit 10.25 to
Annual Report on Form 8-K filed on December 15, 2010. Commission File No. 1-5415. |
||
| 10.9 | * | Form of Restricted Stock Award Agreement under A. M. Castle & Co. 2008 Restricted
Stock, Stock Option and Equity Compensation Plan. Filed as Exhibit 10.11 to Annual
Report on Form 10-K for the period ended December 31, 2008, which was filed on
March 12, 2009. Commission File No. 1-5415. |
||
| 10.10 | * | Form of Performance Share Award Agreement under A. M. Castle & Co. 2008 Restricted
Stock, Stock Option and Equity Compensation Plan. Filed as Exhibit 10.12 to Annual
Report on Form 10-K for the period ended December 31, 2008, which was filed on
March 12, 2009. Commission File No. 1-5415. |
||
69
Table of Contents
| Exhibit | ||||
| Number | Description of Exhibit | |||
| 10.11 | * | A. M. Castle & Co. Directors Deferred Compensation Plan, as amended and restated as
of October 22, 2008. Filed as Exhibit 10.13 to Annual Report on Form 10-K for the
period ended December 31, 2008, which was filed on March 12, 2009. Commission File
No. 1-5415. |
||
| 10.12 | * | A. M. Castle & Co. Supplemental 401(k) Savings and Retirement Plan, as amended and
restated, effective as of January 1, 2009. Filed as Exhibit 10.14 to Annual Report
on Form 10-K for the period ended December 31, 2008, which was filed on March 12,
2009. Commission File No. 1-5415. |
||
| 10.13 | * | A. M. Castle & Co. Supplemental Pension Plan, as amended and restated, effective as
of January 1, 2009. Filed as Exhibit 10.15 to Annual Report on Form 10-K for the
period ended December 31, 2008, which was filed on March 12, 2009. Commission File
No. 1-5415. |
||
| 10.14 | * | First Amendment to the A. M. Castle & Co. Supplemental 401(k) Savings and
Retirement Plan, executed April 15, 2009 (as effective April 27, 2009). Filed as
Exhibit 10.1 to Form 8-K filed on April 16, 2009. Commission File No. 1-5415. |
||
| 10.15 | * | Form of Non-Employee Director Restricted Stock Award Agreement. Filed as Exhibit
10.1 to Form 8-K filed on April 27, 2009. Commission File No. 1-5415. |
||
| 10.16 | * | Form of A.M. Castle & Co. Indemnification Agreement to be executed with all
directors and executive officers. Filed as Exhibit 10.16 to Form 8-K filed on July
29, 2009. Commission File No. 1-5415. |
||
| 10.17 | * | Board of Directors resolutions adopted July 23, 2009, approving changes to the
Company’s non-employee director compensation program. Filed as Exhibit 10.19 to
Quarterly Report on Form 10-Q for the period ended June 30, 2009, which was filed
on July 30, 2009. Commission File No. 1-5415. |
||
| 10.18 | * | Form of Restricted Stock Award Agreement under A. M. Castle & Co. 2008 Restricted
Stock, Stock Option and Equity Compensation Plan. Filed as Exhibit 10.20 to Form
8-K filed on March 24, 2010. Commission File No. 1-5415. |
||
| 10.19 | * | Form of Performance Share Award Agreement under A. M. Castle & Co. 2008 Restricted
Stock, Stock Option and Equity Compensation Plan. Filed as Exhibit 10.21 to Form
8-K filed on March 24, 2010. Commission File No. 1-5415. |
||
| 10.20 | * | Form of Incentive Stock Option Award Agreement under A. M. Castle & Co. 2008
Restricted Stock, Stock Option and Equity Compensation Plan. Filed as Exhibit
10.22 to Form 8-K filed on March 24, 2010. Commission File No. 1-5415. |
||
| 10.21 | * | Form of Non-Qualified Stock Option Award Agreement under A. M. Castle & Co. 2008
Restricted Stock, Stock Option and Equity Compensation Plan. Filed as Exhibit
10.23 to Form 8-K filed on March 24, 2010. Commission File No. 1-5415. |
||
| 10.22 | * | Form of Non-Employee Director Restricted Stock Award Agreement. Filed as Exhibit
10.1 to Form 8-K filed on April 27, 2010. Commission File No. 1-5415. |
||
| 10.23 | * | Form of Amended and Restated Change of Control Agreement for all executive officers
other than the CEO. Filed as Exhibit 10.24 to Form 8-K filed on September 21,
2010. Commission File No. 1-5415. |
||
70
Table of Contents
| Exhibit | ||||
| Number | Description of Exhibit | |||
| 10.24 | * | Form of Amended and Restated Severance Agreement for executive officers other than
the CEO. Filed as Exhibit 10.26 to Form 8-K filed on December 23, 2010.
Commission File No. 1-5415. |
||
| 10.25 | * | CEO Change in Control Agreement, as amended and restated December 22, 2010. Filed
as Exhibit 10.27 to Form 8-K filed on December 23, 2010. Commission File No.
1-5415. |
||
| 10.26 | * | CEO Employment/Non-Competition Agreement, as amended and restated December 22,
2010. Filed as Exhibit 10.28 to Form 8-K filed on December 23, 2010. Commission
File No. 1-5415. |
||
| 10.27 | * | Form of Performance Share Award Agreement, adopted March 2, 2011, under A.M. Castle
& Co. 2008 Restricted Stock, Stock Option and Equity Compensation Plan. Filed as
Exhibit 10.29 to Form 8-K filed March 8, 2011. Commission File No. 1-5415. |
||
| 21.1 | Subsidiaries of Registrant |
|||
| 23.1 | Consent of Deloitte & Touche LLP |
|||
| 31.1 | CEO Certification Pursuant to Section 302 of the Sarbanes Oxley Act of 2002. |
|||
| 31.2 | CFO Certification Pursuant to Section 302 of the Sarbanes Oxley Act of 2002. |
|||
| 32.1 | CEO and CFO Certification Pursuant to Section 906 of the Sarbanes Oxley Act of 2002. |
|||
| * | These agreements are considered a compensatory plan or arrangement. |
71
Table of Contents
SIGNATURES
Pursuant to the requirements of Section 13 or 15(d) of the Securities Exchange Act of 1934, the
registrant has duly caused this report to be signed on its behalf by the undersigned, thereunto
duly authorized.
| A. M. Castle & Co. (Registrant) |
||||
By:
|
/s/ Patrick R. Anderson | |||
| Vice President — Controller and | ||||
| Chief Accounting Officer | ||||
| (Principal Accounting Officer) | ||||
| Date: March 11, 2011 | ||||
Pursuant to the requirements of the Securities Exchange Act of 1934, this report has been signed
below by the following persons on behalf of the registrant and in the capacities as shown following
their name on this 11th day of March, 2011.
/s/ Brian P. Anderson
|
/s/ Thomas A. Donahoe | /s/ Ann M. Drake | ||
Brian P. Anderson, Chairman of the Board |
Thomas A. Donahoe, Director |
Ann M. Drake, Director |
||
/s/ Michael H. Goldberg
|
/s/ William K. Hall | /s/ Robert S. Hamada | ||
Michael H. Goldberg, President, Chief Executive Officer and Director (Principal Executive Officer) |
William K. Hall, Director |
Robert S. Hamada, Director |
||
/s/ Patrick J. Herbert, III
|
/s/ Terrence J. Keating | /s/ James D. Kelly | ||
Patrick J. Herbert, III, Director |
Terrence J. Keating, Director |
James D. Kelly, Director |
||
/s/ Pamela Forbes Lieberman
|
/s/ John McCartney | /s/ Michael Simpson | ||
Pamela Forbes Lieberman, Director |
John McCartney, Director |
Michael Simpson, Director |
||
/s/ Scott F. Stephens |
||||
Scott F. Stephens, Vice President and Chief Financial Officer (Principal Financial Officer) |
72