Attached files
Table of Contents
UNITED STATES
SECURITIES AND EXCHANGE COMMISSION
Washington, D.C. 20549
FORM 10-K
x ANNUAL REPORT PURSUANT TO SECTION 13 OR 15(d) OF THE
SECURITIES EXCHANGE ACT OF 1934
For the fiscal year ended December 31, 2010
OR
¨ TRANSITION REPORT PURSUANT TO SECTION 13 OR 15(d) OF THE
SECURITIES EXCHANGE ACT OF 1934
For the transition period from to
Commission File No. 1-9321
UNIVERSAL HEALTH REALTY INCOME TRUST
(Exact name of registrant as specified in its charter)
| Maryland | 23-6858580 | |
| (State or other jurisdiction of incorporation or organization) |
(I.R.S. Employer Identification Number) | |
| Universal Corporate Center 367 South Gulph Road P.O. Box 61558 King of Prussia, Pennsylvania |
19406-0958 (Zip Code) | |
| (Address of principal executive offices) | ||
Registrant’s telephone number, including area code: (610) 265-0688
Securities registered pursuant to Section 12(b) of the Act:
| Title of each Class Shares of beneficial interest, $.01 par value |
Name of each exchange on which registered New York Stock Exchange |
Securities registered pursuant to Section 12(g) of the Act: None
Indicate by check mark if the registrant is a well-known seasoned issuer, as defined in Rule 405 of the Securities Act.
Yes ¨ No x
Indicate by check mark if the registrant is not required to file reports pursuant to Section 13 or Section 15(d) of the Act.
Yes ¨ No x
Indicate by check mark whether the registrant (1) has filed all reports required to be filed by Section 13 or 15(d) of the Securities Exchange Act of 1934 during the preceding 12 months (or for such shorter period that the registrant was required to file such reports), and (2) has been subject to such filing requirements for the past 90 days.
Yes x No ¨
Indicate by check mark whether the registrant has submitted electronically and posted on its corporate Web site, if any, every Interactive Data File required to be submitted and posted pursuant to Rule 405 of Regulation S-T during the preceding 12 months (or for such shorter period that the registrant was required to submit and post such files).
Yes ¨ No ¨
Indicate by check mark if disclosure of delinquent filers pursuant to Item 405 of Regulation S-K is not contained herein, and will not be contained, to the best of registrant’s knowledge, in definitive proxy or information statements incorporated by reference in Part III of this Form 10-K or any amendment to this Form 10-K. x
Indicate by check mark whether the registrant is a large accelerated filer, an accelerated filer, a non-accelerated filer or a smaller reporting company. See the definitions of “large accelerated filer,” “accelerated filer” and “smaller reporting company” in Rule 12b-2 of the Exchange Act. (Check one):
| Large accelerated filer ¨ | Accelerated filer x | Non-accelerated filer ¨ | Smaller reporting company ¨ | |||||||
| (Do not check if a smaller reporting company) |
Indicate by check mark whether the registrant is a shell company (as defined in Rule 12b-2 of the Act)
Yes ¨ No x
Aggregate market value of voting shares and non-voting shares held by non-affiliates as of June 30, 2010: $387,771,444. Number of shares of beneficial interest outstanding of registrant as of January 31, 2011: 12,653,250
DOCUMENTS INCORPORATED BY REFERENCE
Portions of the registrant’s definitive proxy statement for our 2011 Annual Meeting of Shareholders, which will be filed with the Securities and Exchange Commission within 120 days after December 31, 2010 (incorporated by reference under Part III).
Table of Contents
UNIVERSAL HEALTH REALTY INCOME TRUST
2010 FORM 10-K ANNUAL REPORT
| PART I | ||||||
| Item 1 |
1 | |||||
| Item 1A |
10 | |||||
| Item 1B |
18 | |||||
| Item 2 |
19 | |||||
| Item 3 |
24 | |||||
| Item 4 |
24 | |||||
| PART II | ||||||
| Item 5 |
24 | |||||
| Item 6 |
26 | |||||
| Item 7 |
Management’s Discussion and Analysis of Financial Condition and Results of Operations |
27 | ||||
| Item 7A |
48 | |||||
| Item 8 |
49 | |||||
| Item 9 |
Changes in and Disagreements With Accountants on Accounting and Financial Disclosure |
49 | ||||
| Item 9A |
49 | |||||
| Item 9B |
52 | |||||
| PART III | ||||||
| Item 10 |
52 | |||||
| Item 11 |
52 | |||||
| Item 12 |
Security Ownership of Certain Beneficial Owners and Management and Related Stockholder Matters |
52 | ||||
| Item 13 |
Certain Relationships and Related Transactions, and Director Independence |
52 | ||||
| Item 14 |
52 | |||||
| PART IV | ||||||
| Item 15 |
53 | |||||
| 55 | ||||||
| 56 | ||||||
| 84 | ||||||
| Exhibit 31.1—Section 302 Certification of the Chief Executive Officer |
||||||
| Exhibit 31.2—Section 302 Certification of the Chief Financial Officer |
||||||
| Exhibit 32.1—Section 906 Certification of the Chief Executive Officer |
||||||
| Exhibit 32.2—Section 906 Certification of the Chief Financial Officer |
||||||
Table of Contents
This Annual Report on Form 10-K is for the year ended December 31, 2010. This Annual Report modifies and supersedes documents filed prior to this Annual Report. Information that we file with the Securities and Exchange Commission (the “SEC”) in the future will automatically update and supersede information contained in this Annual Report. In this Annual Report, “we,” “us,” “our” and the “Trust” refer to Universal Health Realty Income Trust. In this Annual Report, the term “revenues” does not include the revenues of the unconsolidated limited liability companies (“LLCs”) in which we have various non-controlling equity interests ranging from 33% to 99%. We currently account for our share of the income/loss from these investments by the equity method (see Note 8 to the Consolidated Financial Statements included herein).
Table of Contents
| ITEM 1. | Business |
General
We are a real estate investment trust (“REIT”) which commenced operations in 1986. We invest in health care and human service related facilities including acute care hospitals, behavioral healthcare facilities, rehabilitation hospitals, sub-acute facilities, surgery centers, childcare centers and medical office buildings (“MOBs”). As of December 31, 2010 we have fifty-two real estate investments or commitments located in fifteen states in the United States consisting of: (i) seven hospital facilities including three acute care, one behavioral healthcare, one rehabilitation and two sub-acute; (ii) forty-one MOBs (including thirty-two owned by various LLCs), and; (iii) four preschool and childcare centers.
Available Information
We have our principal executive offices at Universal Corporate Center, 367 South Gulph Road, King of Prussia, PA 19406. Our telephone number is (610) 265-0688. Our website is located at http://www.uhrit.com. Copies of the annual, quarterly and current reports we file with the SEC, and any amendments to those reports, are available free of charge on our website. Additionally, we have adopted governance guidelines, a Code of Business Conduct and Ethics applicable to all of our officers and directors, a Code of Ethics for Senior Officers and charters for each of the Audit Committee, Compensation Committee and Nominating and Corporate Governance Committee of the Board of Trustees. These documents are also available free of charge on our website. Copies of such reports and charters are available in print to any shareholder who makes a request. Such requests should be made to our Secretary at our King of Prussia, PA corporate headquarters. We intend to satisfy the disclosure requirement under Item 10 of Form 8-K relating to amendments to or waivers of any provision of our Code of Ethics for Senior Officers by promptly posting this information on our website. The information posted on our website is not incorporated into this Annual Report.
In accordance with Section 303A.12(a) of The New York Stock Exchange Listed Company Manual, we submitted our CEO’s Certification to the New York Stock Exchange in 2010. Additionally, contained in Exhibits 31.1 and 31.2 of this Annual Report are our CEO’s and CFO’s certifications regarding the quality of our public disclosure under Section 302 of the Sarbanes-Oxley Act of 2002.
Overview of Facilities
As of December 31, 2010, we have investments or commitments in fifty-two facilities, located in fifteen states and consisting of the following:
| Facility Name |
Location | Type of Facility | Ownership | Guarantor | ||||
| Southwest Healthcare System, Inland Valley Campus(A) |
Wildomar, CA | Acute Care | 100% | Universal Health Services, Inc. | ||||
| McAllen Medical Center(A) |
McAllen, TX | Acute Care | 100% | Universal Health Services, Inc. | ||||
| Wellington Regional Medical Center(A) |
W. Palm Beach, FL | Acute Care | 100% | Universal Health Services, Inc. | ||||
| The Bridgeway(A) |
N.Little Rock, AR | Behavioral Health | 100% | Universal Health Services, Inc. | ||||
| Kindred Hospital Chicago Central(B) |
Chicago, IL | Sub-Acute Care | 100% | Kindred Healthcare, Inc. | ||||
| Kindred Hospital Corpus Christi(B) |
Corpus Christi, TX | Sub-Acute Care | 100% | Kindred Healthcare, Inc. | ||||
| HealthSouth Deaconess Rehabilitation Hospital(E) |
Evansville, IN | Rehabilitation | 100% | HealthSouth Corporation | ||||
| Family Doctor’s Medical Office Bldg.(B) |
Shreveport, LA | MOB | 100% | Christus Health Northern Louisiana | ||||
| Kelsey-Seybold Clinic at Kings Crossing(B) |
Kingwood, TX | MOB | 100% | Kelsey-Seybold Medical Group, PLLC | ||||
| Professional Bldgs. at Kings Crossing(B) |
Kingwood, TX | MOB | 100% | — | ||||
| Chesterbrook Academy(B) |
Audubon, PA | Preschool & Childcare | 100% | Nobel Learning Comm. & Subs. | ||||
| Chesterbrook Academy(B) |
New Britain, PA | Preschool & Childcare | 100% | Nobel Learning Comm. & Subs. | ||||
| Chesterbrook Academy(B) |
Newtown, PA | Preschool & Childcare | 100% | Nobel Learning Comm. & Subs. |
1
Table of Contents
| Facility Name |
Location | Type of Facility | Ownership | Guarantor | ||||
| Chesterbrook Academy(B) |
Uwchlan, PA | Preschool & Childcare | 100% | Nobel Learning Comm. & Subs. | ||||
| Southern Crescent Center I(B,I) |
Riverdale, GA | MOB | 100% | — | ||||
| Southern Crescent Center, II(B,I) |
Riverdale, GA | MOB | 100% | — | ||||
| Desert Samaritan Hospital MOBs(C) |
Mesa, AZ | MOB | 76% | — | ||||
| Suburban Medical Plaza II(C) |
Louisville, KY | MOB | 33% | — | ||||
| Desert Valley Medical Center(C,G) |
Phoenix, AZ | MOB | 90% | — | ||||
| Thunderbird Paseo Medical Plaza I & II(C) |
Glendale, AZ | MOB | 75% | — | ||||
| Cypresswood Professional Center(B) |
Spring, TX | MOB | 100% | — | ||||
| Papago Medical Park(C) |
Phoenix, AZ | MOB | 89% | — | ||||
| Edwards Medical Plaza(C,G) |
Phoenix, AZ | MOB | 90% | — | ||||
| Desert Springs Medical Plaza(D) |
Las Vegas, NV | MOB | 99% | — | ||||
| Orthopaedic Specialists of Nevada Bldg.(B) |
Las Vegas, NV | MOB | 100% | — | ||||
| Santa Fe Professional Plaza(C,G) |
Scottsdale, AZ | MOB | 90% | — | ||||
| Sheffield Medical Building(B) |
Atlanta, GA | MOB | 100% | — | ||||
| Centinela Medical Building Complex(C,G) |
Inglewood, CA | MOB | 90% | — | ||||
| Summerlin Hospital MOB(D,H) |
Las Vegas, NV | MOB | 95% | — | ||||
| Summerlin Hospital MOB II |
Las Vegas, NV | MOB | 98% | — | ||||
| Medical Center of Western Connecticut(B) |
Danbury, CT | MOB | 100% | — | ||||
| Mid Coast Hospital MOB(C) |
Brunswick, ME | MOB | 74% | — | ||||
| Deer Valley Medical Office II(C) |
Phoenix, AZ | MOB | 90% | — | ||||
| Rosenberg Children’s Medical Plaza(C) |
Phoenix, AZ | MOB | 85% | — | ||||
| 700 Shadow Lane & Goldring MOBs(D) |
Las Vegas, NV | MOB | 98% | — | ||||
| St. Mary’s Professional Office Building(C) |
Reno, NV | MOB | 75% | — | ||||
| Apache Junction Medical Plaza(C) |
Apache Junction, AZ | MOB | 85% | — | ||||
| Spring Valley Medical Office Building(D) |
Las Vegas, NV | MOB | 95% | — | ||||
| Spring Valley Hospital Medical Office Building II(D) |
Las Vegas, NV | MOB | 95% | — | ||||
| Sierra San Antonio Medical Plaza(C) |
Fontana, CA | MOB | 95% | — | ||||
| Phoenix Children’s East Valley Care Center(C) |
Phoenix, AZ | MOB | 95% | — | ||||
| Centennial Hills Medical Office Building I(D) |
Las Vegas, NV | MOB | 95% | — | ||||
| Canyon Springs Medical Plaza(C) |
Gilbert, AZ | MOB | 95% | — | ||||
| Palmdale Medical Plaza(F) |
Palmdale, CA | MOB | 95% | — | ||||
| Cobre Valley Medical Plaza(C) |
Globe, AZ | MOB | 95% | — | ||||
| Deer Valley Medical Office Building III(C) |
Phoenix, AZ | MOB | 95% | — | ||||
| Summerlin Hospital Medical Office Building III |
Las Vegas, NV | MOB | 95% | — | ||||
| Vista Medical Terrace & The Sparks Medical Building(D) |
Sparks, NV | MOB | 95% | — | ||||
| Auburn Medical Office Building II(D) |
Auburn, WA | MOB | 95% | — | ||||
| Texoma Medical Plaza(J) |
Denison, TX | MOB | 95% | — | ||||
| BRB Medical Office Building(K) |
Kingwood, TX | MOB | 95% | — | ||||
| North Valley Medical Plaza (L) |
Phoenix, AZ | MOB | 95% | — |
| (A) | Real estate assets owned by us and leased to subsidiaries of Universal Health Services, Inc. (“UHS”). |
| (B) | Real estate assets owned by us and leased to an unaffiliated third-party or parties. |
| (C) | Real estate assets owned by a limited liability company (“LLC”) in which we have a non-controlling ownership interest as indicated above. |
| (D) | Real estate assets owned by an LLC in which we have a non-controlling interest as indicated above and include tenants who are unaffiliated third-parties or subsidiaries of UHS. |
| (E) | The lessee on the HealthSouth Deaconess Rehabilitation Hospital (“Deaconess”) is HealthSouth/Deaconess L.L.C., a joint venture between HealthSouth Properties Corporation and Deaconess Hospital, Inc. The lease with Deaconess was renewed during 2008 and is scheduled to expire on May 31, 2014. |
| (F) | Real estate assets owned by an LLC in which we have a non-controlling ownership interest as indicated above. Tenants of this medical office building include subsidiaries of UHS. As a result of our related party relationship with UHS and a master lease agreement between UHS and this property, this LLC is considered to be a variable interest entity. Consequently, we consolidate the results of operations of this LLC in our consolidated financial statements. |
| (G) | The membership interests of this entity are held by a master LLC in which we hold a 90% non-controlling ownership interest. |
| (H) | The membership interests of this entity are held by a master LLC in which we hold a 95% non-controlling ownership interest. |
| (I) | A property impairment charge was recorded on this MOB during 2008, as discussed herein. |
| (J) | This MOB includes tenants which are subsidiaries of UHS and was completed and opened during the first quarter of 2010. |
| (K) | This MOB was completed and opened during the fourth quarter of 2010. |
| (L) | This MOB was acquired during the first quarter of 2010. |
2
Table of Contents
Other Information
Included in our portfolio at December 31, 2010 are seven hospital facilities with an aggregate investment of $142.0 million. The leases with respect to these hospital facilities comprised approximately 66% of our revenue in 2010, approximately 61% of our revenue in 2009 and approximately 65%, of our revenue in 2008. As of December 31, 2010, these leases have fixed terms with an average of 3.5 years remaining and include renewal options ranging from two to five, five-year terms. The remaining lease terms for each hospital facility, which vary by hospital, are included herein in Item 2. Properties.
We believe a facility’s earnings before interest, taxes, depreciation, amortization and lease rental expense (“EBITDAR”) and a facility’s EBITDAR divided by the sum of minimum rent plus additional rent payable to us (“Coverage Ratio”), which are non-GAAP financial measures, are helpful to us and our investors as a measure of the operating performance of a hospital facility. EBITDAR, which is used as an indicator of a facility’s estimated cash flow generated from operations (before rent expense, capital additions and debt service), is used by us in evaluating a facility’s financial viability and its ability to pay rent. For the hospital facilities owned by us at the end of each respective year, the combined weighted average Coverage Ratio was approximately 5.1 (ranging from 2.3 to 11.4) during 2010, 6.7 (ranging from 2.9 to 10.4) during 2009 and 6.1 (ranging from 2.5 to 8.7) during 2008. The Coverage Ratio for individual facilities varies. See “Relationship with Universal Health Services, Inc.” below for Coverage Ratio information related to the four hospital facilities leased to subsidiaries of UHS.
Pursuant to the terms of our leases for our hospital facilities and the preschool and childcare centers, each lessee, including subsidiaries of UHS, is responsible for building operations, maintenance, renovations and property insurance. We, or the LLCs in which we have invested, are responsible for the building operations, maintenance and renovations of the MOBs, however, a portion, or in some cases all, of the expenses associated with the MOBs are passed on directly to the tenants. Cash reserves have been established to fund required building maintenance and renovations at the multi-tenant MOBs. Lessees are required to maintain all risk, replacement cost and commercial property insurance policies on the leased properties and we, or the LLC in which we have invested, are also named insureds on these policies. In addition, we, UHS or the LLCs in which we have invested, maintain property insurance on all properties. For additional information on the terms of our leases, see “Relationship with Universal Health Services, Inc.”
See our consolidated financial statements and accompanying notes to the consolidated financial statements included in this Annual Report for our total assets, liabilities, debt, revenues, income and other operating information.
Relationship with Universal Health Services, Inc. (“UHS”)
Leases: We commenced operations in 1986 by purchasing properties of certain subsidiaries from UHS and immediately leasing the properties back to the respective subsidiaries. Most of the leases were entered into at the time we commenced operations and provided for initial terms of 13 to 15 years with up to six additional 5-year renewal terms. The current base rentals and lease and rental terms for each facility are provided below. The base rents are paid monthly and each lease also provides for additional or bonus rents which are computed and paid on a quarterly basis based upon a computation that compares current quarter revenue to a corresponding quarter in the base year. The leases with subsidiaries of UHS are unconditionally guaranteed by UHS and are cross-defaulted with one another.
The combined revenues generated from the leases on the UHS hospital facilities accounted for approximately 54% of our total revenue for the five years ended December 31, 2010 (approximately 56%, 51% and 55% for the years ended December 31, 2010, 2009 and 2008, respectively). Including 100% of the revenues generated at the unconsolidated LLCs in which we have various non-controlling equity interests ranging from 33% to 99%, the leases on the UHS hospital facilities accounted for approximately 21% of the combined consolidated and unconsolidated revenue for the five years ended December 31, 2010 (approximately 19%, 20%
3
Table of Contents
and 21% for the years ended December 31, 2010, 2009 and 2008, respectively). In addition, twelve MOBs, owned by LLCs in which we hold various non-controlling equity interests, include or will include tenants which are subsidiaries of UHS.
Pursuant to the Master Lease Document by and among us and certain subsidiaries of UHS, dated December 24, 1986 (the “Master Lease”), which governs the leases of all hospital properties with subsidiaries of UHS, UHS has the option to renew the leases at the lease terms described below by providing notice to us at least 90 days prior to the termination of the then current term. In addition, UHS has rights of first refusal to: (i) purchase the respective leased facilities during and for 180 days after the lease terms at the same price, terms and conditions of any third-party offer, or; (ii) renew the lease on the respective leased facility at the end of, and for 180 days after, the lease term at the same terms and conditions pursuant to any third-party offer. UHS also has the right to purchase the respective leased facilities at the end of the lease terms or any renewal terms at the appraised fair market value. In addition, the Master Lease, as amended during 2006, includes a change of control provision whereby UHS has the right, upon one month’s notice should a change of control of the Trust occur, to purchase any or all of the four leased hospital properties at their appraised fair market value.
The table below details the renewal options and terms for each of the four UHS hospital facilities:
| Hospital Name |
Type of Facility | Annual Minimum Rent |
End of Lease Term |
Renewal Term (years) |
||||||||||
| McAllen Medical Center |
Acute Care | $ | 5,485,000 | December, 2011 | 20 | (a) | ||||||||
| Wellington Regional Medical Center |
Acute Care | $ | 3,030,000 | December, 2011 | 20 | (b) | ||||||||
| Southwest Healthcare System, Inland Valley Campus |
Acute Care | $ | 2,648,000 | December, 2011 | 20 | (b) | ||||||||
| The Bridgeway |
Behavioral Health | $ | 930,000 | December, 2014 | 10 | (c) | ||||||||
| (a) | UHS has four 5-year renewal options at existing lease rates (through 2031). |
| (b) | UHS has two 5-year renewal options at existing lease rates (through 2021) and two 5-year renewal options at fair market value lease rates (2022 through 2031). |
| (c) | UHS has two 5-year renewal options at fair market value lease rates (2015 through 2024). |
Advisory Agreement: UHS of Delaware, Inc. (the “Advisor”), a wholly-owned subsidiary of UHS, serves as Advisor to us under an Advisory Agreement (the “Advisory Agreement”) dated December 24, 1986. Pursuant to the Advisory Agreement, the Advisor is obligated to present an investment program to us, to use its best efforts to obtain investments suitable for such program (although it is not obligated to present any particular investment opportunity to us), to provide administrative services to us and to conduct our day-to-day affairs. All transactions between us and UHS must be approved by the Trustees who are unaffiliated with UHS (the “Independent Trustees”). In performing its services under the Advisory Agreement, the Advisor may utilize independent professional services, including accounting, legal, tax and other services, for which the Advisor is reimbursed directly by us. The Advisory Agreement may be terminated for any reason upon sixty days written notice by us or the Advisor. The Advisory Agreement expires on December 31 of each year; however, it is renewable by us, subject to a determination by the Independent Trustees, that the Advisor’s performance has been satisfactory. In December of 2009, based upon a review of our advisory fee and other general and administrative expenses, as compared to an industry peer group, the fee was increased, effective January 1, 2010, to 0.65% (from 0.60%) of our average invested real estate assets, as derived from our consolidated balance sheet. The Advisory Agreement was renewed for 2011 at the same terms and conditions.
The average real estate assets for advisory fee calculation purposes exclude certain items from our consolidated balance sheet such as, among other things, accumulated depreciation, cash and cash equivalents, base and bonus rent receivables, deferred charges and other assets. The advisory fee is payable quarterly, subject to adjustment at year-end based upon our audited financial statements. In addition, the Advisor is entitled to an annual incentive fee equal to 20% of the amount by which cash available for distribution to shareholders for each
4
Table of Contents
year, as defined in the Advisory Agreement, exceeds 15% of our equity as shown on our consolidated balance sheet, determined in accordance with generally accepted accounting principles without reduction for return of capital dividends. The Advisory Agreement defines cash available for distribution to shareholders as net cash flow from operations less deductions for, among other things, amounts required to discharge our debt and liabilities and reserves for replacement and capital improvements to our properties and investments. No incentive fees were paid during 2010, 2009 or 2008 since the incentive fee requirements were not achieved. Advisory fees incurred and paid (or payable) to UHS amounted to $1.9 million during 2010 and $1.6 million during each of 2009 and 2008 and were based upon average invested real estate assets of $285 million, $268 million and $261 million during 2010, 2009 and 2008, respectively.
Officers and Employees: Our officers are all employees of UHS and although as of December 31, 2010 we had no salaried employees, our officers do receive stock-based compensation.
Share Ownership: As of December 31, 2010 and 2009, UHS owned 6.2% and 6.5% of our outstanding shares of beneficial interest, respectively.
SEC reporting requirements of UHS: UHS is subject to the reporting requirements of the SEC and is required to file annual reports containing audited financial information and quarterly reports containing unaudited financial information. Since the leases on the hospital facilities leased to wholly-owned subsidiaries of UHS comprised approximately 56%, 51% and 55% of our consolidated revenues for the years ended December 31, 2010, 2009 and 2008, respectively, and since a subsidiary of UHS is our Advisor, you are encouraged to obtain the publicly available filings for Universal Health Services, Inc. from the SEC’s website at www.sec.gov. These filings are the sole responsibility of UHS and are not incorporated by reference herein.
UHS Other Matters:
Southwest Healthcare System: During the third quarter of 2009, UHS advised us that Southwest Healthcare System (“SWHCS”), a wholly-owned subsidiary of UHS which operates Rancho Springs Medical Center (the real property of which is not owned by the Trust) and Inland Valley Regional Medical Center (“Inland Valley”, the real property of which is owned by the Trust) located in Riverside County, California, entered into an agreement with the Center for Medicare and Medicaid Services (“CMS”). The agreement required SWHCS to engage an independent quality monitor to assist SWHCS in meeting all CMS’ conditions of participation. Further, the agreement provided that, during the last 60 days of the agreement, CMS would conduct a full Medicare certification survey. That survey took place the week of January 11, 2010.
In April, 2010, SWHCS received notification from CMS that it intended to effectuate the termination of SWHCS’s Medicare provider agreement effective June 1, 2010. In May, 2010, UHS entered into an agreement with CMS which abated the termination action scheduled for June 1, 2010. The agreement is one year in duration and required SWHCS to engage independent experts in various disciplines to analyze and develop implementation plans for SWHCS to meet the Medicare conditions of participation. At the conclusion of the agreement, CMS will conduct a full certification survey to determine if SWHCS has achieved substantial compliance with the Medicare conditions of participation. During the term of the agreement, SWHCS remains eligible to receive reimbursements from Medicare for services rendered to Medicare beneficiaries.
Also in April, 2010, SWHCS received notification from the California Department of Public Health (“CDPH”) indicating that it planned to initiate a process to revoke SWHCS’s hospital license. In May, 2010, SWHCS received the formal document related to the revocation action. In September, 2010, SWHCS entered into an agreement with CDPH relating to the license revocation. The terms of the CDPH agreement are substantially similar to those contained in the agreement with CMS. As a result of the agreement, SWHCS’s hospital license remains in effect pending the outcome of the CMS full certification survey which will occur at the end of the agreement. Pursuant to the results of the CMS full certification survey, which SWHCS anticipates occurring in mid-year, 2011, should SWHCS be deemed to have achieved substantial compliance with the
5
Table of Contents
Medicare conditions of participation, CDPH shall deem SWHCS’s license to be in good standing. Failure of SWHCS to achieve substantial compliance with the Medicare conditions of participation, pursuant to CMS’s full certification survey, will likely have a material adverse impact on SWHCS’s ability to continue to operate the facilities.
As a result of the matters discussed above, SWHCS had not been permitted to open newly constructed capacity at Rancho Springs Medical Center and Inland Valley Medical Center. However, in February, 2011, SWHC received permission from CDPH to begin accessing the new capacity. Unrelated to these developments, SWHCS expects a competitor to open a newly constructed acute care hospital during the first quarter of 2011. UHS is unable to predict the net impact of these developments on SWHCS’s results of operations in 2011 and beyond.
UHS has advised us that Rancho Springs Medical Center and Inland Valley Regional Medical Center remain fully committed to providing high-quality healthcare to their patients and the communities they serve. UHS therefore intends to work expeditiously and collaboratively with both CMS and CDPH in an effort to resolve these matters, although there can be no assurance they will be able to do so. Failure to resolve these matters could have a material adverse effect on UHS and, in turn, us. While the $2.6 million annual base rentals on Inland Valley are guaranteed by UHS through the end of the existing lease term (December, 2011), should this matter, or the opening of the above-mentioned newly constructed acute care facility by a competitor, adversely impact the future revenues and/or operating results of SWHCS, the future bonus rental earned by us on Inland Valley, as well as the underlying value of the property, may be materially adversely impacted. At December 31, 2010, the book value of the property was $19.0 million. Bonus rental revenue earned by us from Inland Valley amounted to $1.1 million during each of the years ended December 31, 2010 and 2009 and $1.0 million during the year ended December 31, 2008.
Psychiatric Solutions, Inc.: In connection with the acquisition of Psychiatric Solutions, Inc. (“PSI”) by UHS, UHS has substantially increased its level of indebtedness which could, among other things, adversely affect its ability to raise additional capital to fund operations, limit its ability to react to changes in the economy or its industry and could potentially prevent it from meeting its obligations under the agreements related to its indebtedness. If UHS experiences financial difficulties and, as a result, operations of its existing facilities suffer, or UHS otherwise fails to make payments to us, our revenues will significantly decline.
Although we do not expect to be directly impacted by UHS’ acquisition of PSI, UHS is substantially more leveraged and we cannot assure you that UHS will continue to satisfy its obligations to us. The failure or inability of UHS to satisfy its obligations to us could materially reduce our revenues and net income, which could in turn reduce the amount of dividends we pay and cause our stock price to decline.
Taxation
We believe we have operated in such a manner as to qualify for taxation as a REIT under Sections 856 through 860 of the Internal Revenue Code of 1986, and we intend to continue to operate in such a manner. If we qualify for taxation as a REIT, we will generally not be subject to federal corporate income taxes on our net income that is currently distributed to shareholders. This treatment substantially eliminates the “double taxation”, e.g. at the corporate and shareholder levels, that usually results from investment in the stock of a corporation. Please see the heading “If we fail to maintain our REIT status, we will become subject to federal income tax on our taxable income at regular corporate rates” under “Risk Factors” for more information.
Competition
We compete for the acquisition, leasing and financing of health care related facilities. Our competitors include, but are not limited to, other REITs, banks and other companies, including UHS. Some of these competitors are larger and may have a lower cost of capital than we do. These developments could result in fewer investment opportunities for us and lower spreads over the cost of our capital, which would hurt our growth.
6
Table of Contents
In most geographical areas in which our facilities operate, there are other facilities that provide services comparable to those offered by our facilities. In addition, some competing facilities are owned by tax-supported governmental agencies or by nonprofit corporations and may be supported by endowments and charitable contributions and exempt from property, sales and income taxes. Such exemptions and support are not available to certain operators of our facilities. In some markets, certain competing facilities may have greater financial resources, be better equipped and offer a broader range of services than those available at our facilities. Certain hospitals that are located in the areas served by our facilities are specialty hospitals that provide medical, surgical and behavioral health services, facilities and equipment that are not available at our hospitals. The increase in outpatient treatment and diagnostic facilities, outpatient surgical centers and freestanding ambulatory surgical centers also increases competition for us.
In addition, the number and quality of the physicians on a hospital’s staff are important factors in determining a hospital’s success and competitive advantage. Typically, physicians are responsible for making hospital admissions decisions and for directing the course of patient treatment. The operators of our facilities also compete with other health care providers in recruiting and retaining qualified hospital management, nurses and other medical personnel. From time-to-time, the operators of our acute care and behavioral health care facilities may experience the effects of a shortage of skilled nursing staff nationwide, which has caused and may continue to cause an increase in salaries, wages and benefits expense in excess of the inflation rate. Our operators may experience difficulties attracting and retaining qualified physicians, nurses and medical support personnel. We anticipate that our operators, including UHS, will continue to encounter increased competition in the future that could lead to a decline in patient volumes and harm their businesses, which in turn, could harm our business.
A large portion of our non-hospital properties consist of MOBs which are located either close to or on the campuses of hospital facilities. These properties are either directly or indirectly affected by the factors discussed above as well as general real estate factors such as the supply and demand of office space and market rental rates. To improve our competitive position, we anticipate that we will continue investing in additional healthcare related facilities and leasing the facilities to qualified operators, perhaps including UHS and subsidiaries of UHS.
Regulation and Other Factors
During 2010, 2009 and 2008, 52%, 48% and 51%, respectively, of our revenues were earned pursuant to leases with operators of acute care services hospitals, all of which are subsidiaries of UHS. A significant portion of the revenue earned by the operators of our acute care hospitals is derived from federal and state healthcare programs, including Medicare and Medicaid (excluding managed Medicare and Medicaid programs).
The healthcare industry is subject to numerous laws, regulations and rules including, among others, those related to government healthcare participation requirements, various licensure and accreditations, reimbursement for patient services, health information privacy and security rules, and Medicare and Medicaid fraud and abuse provisions (including, but not limited to, federal statutes and regulations prohibiting kickbacks and other illegal inducements to potential referral sources, false claims submitted to federal health care programs and self-referrals by physicians). Providers that are found to have violated any of these laws and regulations may be excluded from participating in government healthcare programs, subjected to significant fines or penalties and/or required to repay amounts received from the government for previously billed patient services. This government regulation of the healthcare industry affects us because:
| (i) | The financial ability of lessees to make rent payments to us may be affected by governmental regulations such as licensure, certification for participation in government programs, and government reimbursement, and; |
| (ii) | Our bonus rents are based on our lessees’ net revenues which in turn are affected by the amount of reimbursement such lessees receive from the government. |
Although UHS and the other operators of our acute care facilities believe that their policies, procedures and practices comply with governmental regulations, no assurance can be given that they will not be subjected to additional governmental inquiries or actions, or that they would not be faced with sanctions, fines or penalties if
7
Table of Contents
so subjected. Even if they were to ultimately prevail, a significant governmental inquiry or action under one of the above laws, regulations or rules could have a material adverse effect upon them, and in turn, us. See Relationship with Universal Health Services, Inc.-UHS Other Matters for disclosure related to Southwest Healthcare System.
A significant portion of the revenue earned by the operators of our acute care hospitals is derived from federal and state healthcare programs, including Medicare and Medicaid. Under the statutory framework of the Medicare and Medicaid programs, many of the general acute care operations are subject to administrative rulings, interpretations and discretion that may affect payments made under either or both of such programs as well as by other third party payors. The federal government makes payments to participating hospitals under its Medicare program based on various formulas. For inpatient services, the operators of our acute care hospitals are subject to a inpatient prospective payment system (“IPPS”). Under IPPS, hospitals are paid a predetermined fixed payment amount for each hospital discharge. The fixed payment amount is based upon each patient’s Medicare severity diagnosis related group (“MS-DRG”). Every MS-DRG is assigned a payment rate based upon the estimated intensity of hospital resources necessary to treat the average patient with that particular diagnosis. These rates are based upon historical national average costs and do not consider the actual costs incurred by a hospital in providing care. The MS-DRG rates are adjusted annually based on geographic region and are weighted based upon a statistically normal distribution of severity.
For outpatient services, both general acute and behavioral health hospitals are paid under an outpatient PPS according to ambulatory procedure codes. Outpatient services were traditionally paid at the lower of customary charges or on a reasonable cost basis. The outpatient PPS rate is an unadjusted national payment amount that includes the Medicare payment and the beneficiary co-payment. Special payments under the outpatient PPS may be made for certain new technology items and services through transitional pass-through payments and special reimbursement rates.
Three of our acute care hospital facilities operated by subsidiaries of UHS and two sub-acute care hospital facilities operated by an unaffiliated third-party are located in Texas, Florida, California and Illinois. The majority of these states have reported significant budget deficits that have resulted in reductions of Medicaid funding for 2009 and 2010. Furthermore, many states are currently working to effectuate further significant reductions in the level of Medicaid funding due to significant state budget deficits projected for 2011, which could adversely affect future levels of Medicaid reimbursement received by certain operators of our facilities, including the operators of our hospital facilities. We can provide no assurance that reductions to Medicaid revenues earned by operators of certain of our facilities, particularly our hospital operators in the above-mentioned states, will not have a material adverse effect on the future operating results of those operators which, in turn, could have a material adverse effect on us. In addition, the uncertainty and fiscal pressures placed upon the federal government as a result of, among other things, the War on Terrorism, economic recovery stimulus packages, responses to natural disasters, the expansion of a Medicare drug benefit and the federal budget deficit in general may affect the availability of federal funds to provide additional relief to the operators of our facilities in the future. We are unable to predict the effect of future policy changes on the operators of our facilities.
In March, 2010, the Health Care and Education Reconciliation Act of 2010 (H.R. 4872, P.L. 111-152), (the “Reconciliation Act”) and the Patient Protection and Affordable Care Act (P.L. 111-148), (the “Affordable Care Act”), were enacted into law and created significant changes to health insurance coverage for U.S. citizens as well as material revisions to the federal Medicare and state Medicaid programs. Medicare, Medicaid and other health care industry changes which are scheduled to be implemented at various times during this decade are noted below. We cannot predict the effect, if any, these enactments will have on the operators of our facilities and, thus, our business.
Immediate Medicare Reductions:
The Reconciliation Act reduced the market basket update for inpatient and outpatient hospitals and inpatient behavioral health facilities in each of 2010 and 2011 by 0.25%. Further, the Affordable Care Act implements certain reforms to Medicare Advantage payments, effective in 2011.
8
Table of Contents
Future Medicare Reductions:
Future changes to the Medicare program include:
| • | Implement a Medicare shared savings program (effective 2012) |
| • | Implement a hospital readmissions reduction program (effective 2012) |
| • | Implement a national pilot program on payment bundling (effective 2013) |
| • | Implement a value-based purchasing program for hospitals (effective 2012) |
| • | Reduction to Medicare disproportionate share hospital (“DSH”) payments (effective 2014) |
Medicaid Revisions:
| • | Expanded Medicaid eligibility and related special federal payments (effective 2014) |
| • | Reduction to Medicaid DSH (effective 2014) |
Health Insurance Revisions:
| • | Large employer insurance reforms (effective 2014) |
| • | Individual insurance mandate and related federal subsidies (effective 2014) |
| • | Federally mandated insurance coverage reforms (2010 and forward) |
Executive Officers of the Registrant
| Name |
Age |
Position | ||
| Alan B. Miller |
73 | Chairman of the Board, Chief Executive Officer and President | ||
| Charles F. Boyle |
51 | Vice President and Chief Financial Officer | ||
| Cheryl K. Ramagano |
48 | Vice President, Treasurer and Secretary | ||
| Timothy J. Fowler |
55 | Vice President, Acquisition and Development | ||
Mr. Alan B. Miller has been our Chairman of the Board and Chief Executive Officer since our inception in 1986 and was appointed President in February of 2003. He had previously served as our President until 1990. Mr. Miller has been Chairman of the Board and Chief Executive Officer of UHS since its inception in 1978. He previously held the title of President of UHS as well, until 2009 when Marc D. Miller was elected as President of UHS. Mr. Miller also serves as a Director of Penn Mutual Life Insurance Company. He is the father of Marc D. Miller, who was elected to our Board of Trustees in December, 2008 and also serves as President and a member of the Board of Directors of UHS.
Mr. Charles F. Boyle was appointed Chief Financial Officer in February of 2003 and had served as our Vice President and Controller since 1991. Mr. Boyle has held various positions at UHS since 1983 and currently serves as its Vice President and Controller. He was appointed Controller of UHS in 2003 and had served as its Assistant Vice President-Corporate Accounting since 1994.
Ms. Cheryl K. Ramagano was appointed Secretary in February of 2003 and served as our Vice President and Treasurer since 1992. Ms. Ramagano has held various positions at UHS since 1983 and currently serves as its Vice President and Treasurer. She was appointed Treasurer of UHS in 2003 and had served as its Assistant Treasurer since 1994.
Mr. Timothy J. Fowler was elected as our Vice President of Acquisition and Development upon the commencement of his employment with UHS in 1993.
9
Table of Contents
| ITEM 1A. | Risk Factors |
We are subject to numerous known and unknown risks, many of which are described below and elsewhere in this Annual Report. Any of the events described below could have a material adverse effect on our business, financial condition and results of operations. Additional risks and uncertainties that we are not aware of, or that we currently deem to be immaterial, could also impact our business and results of operations.
A worsening of the economic and employment conditions in the United States could materially affect our business and future results of operations of the operators of our facilities which could, in turn, materially reduce our revenues and net income.
Our future results of operations could be unfavorably impacted by continued deterioration in general economic conditions which could result in increases in the number of people unemployed and/or uninsured. Our operators’ patient volumes, revenues and financial results depend significantly on the universe of patients with health insurance, which to a large extent is dependent on the employment status of individuals in certain markets. A continuation or worsening of economic conditions may result in a continued increase in the unemployment rate which will likely increase the number of individuals without health insurance. As a result, the operators of our facilities may experience a decrease in patient volumes. Should that occur, it may result in decreased occupancy rates at our medical office buildings as well as a reduction in the revenues earned by the operators of our hospital facilities which would unfavorably impact our future bonus rentals (on the UHS hospital facilities) and may potentially have a negative impact on the future lease renewal terms and the underlying value of the hospital properties. Additionally, the general real estate market has been unfavorably impacted by the deterioration in economic and credit market conditions which may adversely impact the underlying value of our properties.
The revenues and results of operations of the tenants of our hospital facilities, including UHS, and our medical office buildings, are significantly affected by payments received from the government and other third party payors.
The operators of our hospital facilities and tenants of our medical office buildings derive a significant portion of their revenue from third party payors, including the Medicare and Medicaid programs. Changes in these government programs in recent years have resulted in limitations on reimbursement and, in some cases, reduced levels of reimbursement for health care services. Payments from federal and state government programs are subject to statutory and regulatory changes, administrative rulings, interpretations and determinations, requirements for utilization review, and federal and state funding restrictions, all of which could materially increase or decrease program payments, as well as affect the cost of providing service to patients and the timing of payments to facilities. Our tenants are unable to predict the effect of future policy changes on their operations.
Three of our acute care hospital facilities operated by subsidiaries of UHS and two sub-acute care hospital facilities operated by an unaffiliated third-party are located in Texas, Florida, California and Illinois. The majority of these states have reported significant budget deficits that have resulted in reductions of Medicaid funding for 2009 and 2010. Furthermore, many states are currently working to effectuate further significant reductions in the level of Medicaid funding due to significant state budget deficits projected for 2011, which could adversely affect future levels of Medicaid reimbursement received by certain operators of our facilities, including the operators of our hospital facilities. We can provide no assurance that reductions to Medicaid revenues earned by operators of certain of our facilities, particularly our hospital operators in the above-mentioned states, will not have a material adverse effect on the future operating results of those operators which, in turn, could have a material adverse effect on us. In addition, the uncertainty and fiscal pressures placed upon federal and state governments as a result of, among other things, the substantial deterioration in general economic conditions, the funding requirements from the federal government’s stimulus package, the War on Terrorism and the relief efforts related to hurricanes and other disasters, may affect the availability of taxpayer funds for Medicare and Medicaid programs. If the rates paid or the scope of services covered by government payors are reduced, there could be a material adverse effect on our tenants’ business, financial position and results of operations, and in turn, ours.
10
Table of Contents
In addition to changes in government reimbursement programs, the ability of our hospital operators to negotiate favorable contracts with private payors, including managed care providers, significantly affects the revenues and operating results of those facilities. Private payors, including managed care providers, increasingly are demanding that hospitals accept lower rates of payment. Our hospital operators expect continued third party efforts to aggressively manage reimbursement levels and cost controls. Reductions in reimbursement amounts received from third party payors could have a material adverse effect on the financial position and results of operations of our hospital operators.
The uncertainties of health care reform could materially affect the business and future results of operations of the operators of our facilities, including UHS, which could, in turn, materially reduce our revenues and net income.
In March, 2010, the Health Care and Education Reconciliation Act of 2010, (the “Reconciliation Act”) and the Patient Protection and Affordable Care Act, (the “Affordable Care Act”), were enacted into law and created significant changes to health insurance coverage for U.S. citizens as well as material revisions to the federal Medicare and state Medicaid programs. The two combined primary goals of these Acts are to provide for increased access to coverage for healthcare and to reduce healthcare-related expenses. Medicare, Medicaid and other health care industry changes are scheduled to be implemented at various times during this decade. We cannot predict the effect, if any, these enactments will have on operators and, thus, our business.
Increased competition in the health care industry has resulted in lower revenues and higher costs for our operators, including UHS, and may affect our revenues, property values and lease renewal terms.
The health care industry is highly competitive and competition among hospitals and other health care providers for patients has intensified in recent years. In most geographical areas in which our facilities are operated, there are other facilities that provide services comparable to those offered by our facilities. In addition, some competing facilities are owned by tax-supported governmental agencies or by nonprofit corporations and may be supported by endowments and charitable contributions and exempt from property, sales and income taxes. Such exemptions and support are not available to certain operators of our facilities. In some markets, certain competing facilities may have greater financial resources, be better equipped and offer a broader range of services than those available at our facilities. Certain hospitals that are located in the areas served by our operators’ facilities are specialty or large hospitals that provide medical, surgical and behavioral health services, facilities and equipment that are not available at our operators’ hospitals. The increase in outpatient treatment and diagnostic facilities, outpatient surgical centers and freestanding ambulatory surgical centers also increases competition for our operators.
In addition, the number and quality of the physicians on a hospital’s staff are important factors in determining a hospital’s competitive advantage. Typically, physicians are responsible for making hospital admissions decisions and for directing the course of patient treatment. The operators of our facilities also compete with other health care providers in recruiting and retaining qualified hospital management, nurses and other medical personnel. The operators of our acute care and behavioral health care facilities are experiencing the effects of a shortage of skilled nursing staff nationwide, which has caused and may continue to cause an increase in salaries, wages and benefits expense in excess of the inflation rate. Our operators may experience difficulties attracting and retaining qualified physicians, nurses and medical support personnel. We anticipate that our operators, including UHS, will continue to encounter increased competition in the future that could lead to a decline in patient volumes and harm their businesses, which in turn, could harm our business.
Operators that fail to comply with governmental reimbursement programs such as Medicare or Medicaid, licensing and certification requirements, fraud and abuse regulations or new legislative developments may be unable to meet their obligations to us.
Our operators, including UHS and its subsidiaries, are subject to numerous federal, state and local laws and regulations that are subject to frequent and substantial changes (sometimes applied retroactively) resulting from
11
Table of Contents
legislation, adoption of rules and regulations, and administrative and judicial interpretations of existing law. The ultimate timing or effect of these changes cannot be predicted. Government regulation may have a dramatic effect on our operators’ costs of doing business and the amount of reimbursement received by both government and other third-party payors. The failure of any of our operators to comply with these laws, requirements and regulations could adversely affect their ability to meet their obligations to us. These regulations include, among other items: hospital billing practices and prices for service; relationships with physicians and other referral sources; adequacy of medical care; quality of medical equipment and services; qualifications of medical and support personnel; the implementation of an electronic health records application by 2015; confidentiality, maintenance and security issues associated with health-related information and patient medical records; the screening, stabilization and transfer of patients who have emergency medical conditions; certification, licensure and accreditation of our facilities; operating policies and procedures, and; construction or expansion of facilities and services.
If our operators fail to comply with applicable laws and regulations, they could be subjected to liabilities, including criminal penalties, civil penalties (including the loss of their licenses to operate one or more facilities), and exclusion of one or more facilities from participation in the Medicare, Medicaid and other federal and state health care programs. The imposition of such penalties could jeopardize that operator’s ability to make lease or mortgage payments to us or to continue operating its facility. In addition, our bonus rents are based on our operators net revenues, which in turn are affected by the amount of reimbursement that such lessees receive from the government.
Although UHS and the other operators of our acute care facilities, believe that their policies, procedures and practices comply with governmental regulations, no assurance can be given that they will not be subjected to governmental inquiries or actions, or that they would not be faced with sanctions, fines or penalties if so subjected. Because many of these laws and regulations are relatively new, in many cases, our operators don’t have the benefit of regulatory or judicial interpretation. In the future, it is possible that different interpretations or enforcement of these laws and regulations could subject their current or past practices to allegations of impropriety or illegality or could require them to make changes in the facilities, equipment, personnel, services, capital expenditure programs and operating expenses. Even if they were to ultimately prevail, a significant governmental inquiry or action under one of the above laws, regulations or rules could have a material adverse effect upon them, and in turn, us.
UHS’s Southwest Healthcare System: During the third quarter of 2009, UHS advised us that Southwest Healthcare System (“SWHCS”), a wholly-owned subsidiary of UHS which operates Rancho Springs Medical Center (the real property of which is not owned by the Trust) and Inland Valley Regional Medical Center (“Inland Valley”, the real property of which is owned by the Trust) located in Riverside County, California, entered into an agreement with the Center for Medicare and Medicaid Services (“CMS”). The agreement required SWHCS to engage an independent quality monitor to assist SWHCS in meeting all CMS’ conditions of participation. Further, the agreement provided that, during the last 60 days of the agreement, CMS would conduct a full Medicare certification survey. That survey took place the week of January 11, 2010.
In April, 2010, SWHCS received notification from CMS that it intended to effectuate the termination of SWHCS’s Medicare provider agreement effective June 1, 2010. In May, 2010, UHS entered into an agreement with CMS which abated the termination action scheduled for June 1, 2010. The agreement is one year in duration and required SWHCS to engage independent experts in various disciplines to analyze and develop implementation plans for SWHCS to meet the Medicare conditions of participation. At the conclusion of the agreement, CMS will conduct a full certification survey to determine if SWHCS has achieved substantial compliance with the Medicare conditions of participation. During the term of the agreement, SWHCS remains eligible to receive reimbursements from Medicare for services rendered to Medicare beneficiaries.
Also in April, 2010, SWHCS received notification from the California Department of Public Health (“CDPH”) indicating that it planned to initiate a process to revoke SWHCS’s hospital license. In May, 2010, SWHCS received the formal document related to the revocation action. In September, 2010, SWHCS entered
12
Table of Contents
into an agreement with CDPH relating to the license revocation. The terms of the CDPH agreement are substantially similar to those contained in the agreement with CMS. As a result of the agreement, SWHCS’s hospital license remains in effect pending the outcome of the CMS full certification survey which will occur at the end of the agreement. Pursuant to the results of the CMS full certification survey, which SWHCS anticipates occurring in mid-year, 2011, should SWHCS be deemed to have achieved substantial compliance with the Medicare conditions of participation, CDPH shall deem SWHCS’s license to be in good standing. Failure of SWHCS to achieve substantial compliance with the Medicare conditions of participation, pursuant to CMS’s full certification survey, will likely have a material adverse impact on SWHCS’s ability to continue to operate the facilities.
As a result of the matters discussed above, SWHCS had not been permitted to open newly constructed capacity at Rancho Springs Medical Center and Inland Valley Medical Center. However, in February, 2011, SWHC received permission from CDPH to begin accessing the new capacity. Unrelated to these developments, SWHCS expects a competitor to open a newly constructed acute care hospital during the first quarter of 2011. UHS is unable to predict the net impact of these developments on SWHCS’s results of operations in 2011 and beyond.
UHS has advised us that Rancho Springs Medical Center and Inland Valley Regional Medical Center remain fully committed to providing high-quality healthcare to their patients and the communities they serve. UHS therefore intends to work expeditiously and collaboratively with both CMS and CDPH in an effort to resolve these matters, although there can be no assurance they will be able to do so. Failure to resolve these matters could have a material adverse effect on UHS and, in turn, us. While the $2.6 million annual base rentals on Inland Valley are guaranteed by UHS through the end of the existing lease term (December, 2011), should this matter, or the opening of the above-mentioned newly constructed acute care facility by a competitor, adversely impact the future revenues and/or operating results of SWHCS, the future bonus rental earned by us on Inland Valley, as well as the underlying value of the property, may be materially adversely impacted. At December 31, 2010, the book value of the property was $19.0 million. Bonus rental revenue earned by us from Inland Valley amounted to $1.1 million during each of the years ended December 31, 2010 and 2009 and $1.0 million during the year ended December 31, 2008.
The deterioration of credit and capital markets may adversely affect our access to sources of funding and we cannot be certain of the availability and terms of capital to fund the growth of our business when needed.
To retain our status as a REIT, we are required to distribute 90% of our taxable income to shareholders and, therefore, we generally cannot use income from operations to fund our growth. Accordingly, our growth strategy depends, in part, upon our ability to raise additional capital at reasonable costs to fund new investments. We believe we will be able to raise additional debt and equity capital at reasonable costs to refinance our debts (including third-party debt held by various LLCs in which we own non-controlling equity interests) at or prior to their maturities and to invest at yields which exceed our cost of capital. Although the tightening in the credit markets has not had a material impact on us, we can provide no assurance that financing will be available to us on satisfactory terms when needed, which could harm our business. Given these uncertainties, our growth strategy is not assured and may fail.
To fund all or a portion of our future financing needs, we rely on borrowings from various sources including fixed rate, long-term debt as well as borrowings pursuant to our revolving credit agreement. If any of the lenders were unable to fulfill their future commitments, our liquidity could be impacted, which could have a material unfavorable impact our results of operations and financial condition.
In addition, the degree to which we are, or in the future may become, leveraged, our ability to obtain financing could be adversely impacted and could make us more vulnerable to competitive pressures. Our ability to meet existing and future debt obligations, depends upon our future performance and our ability to secure additional financing on satisfactory terms, each of which is subject to financial, business and other factors that are beyond our control. Any failure by us to meet our financial obligations would harm our business.
13
Table of Contents
In addition, global capital markets have experienced volatility that has tightened access to capital markets and other sources of funding. In the event we need to access the capital markets or other sources of financing, there can be no assurance that we will be able to obtain financing on acceptable terms or within an acceptable time. Our inability to obtain financing on terms acceptable to us could have a material unfavorable impact on our results of operations, financial condition and liquidity.
A substantial portion of our revenues are dependent upon one operator. If UHS experiences financial difficulties, or otherwise fails to make payments to us, our revenues will significantly decline.
For the year ended December 31, 2010, UHS accounted for 60% of our consolidated revenues. In addition, as of December 31, 2010, subsidiaries of UHS leased four of the seven hospital facilities owned by us with terms expiring in 2011 or 2014. We cannot assure you that UHS will renew the leases or continue to satisfy its obligations to us. The failure or inability of UHS to satisfy its obligations to us could materially reduce our revenues and net income, which could in turn reduce the amount of dividends we pay and cause our stock price to decline.
UHS’s acquisition of Psychiatric Solutions, Inc.
In connection with the acquisition of Psychiatric Solutions, Inc. (“PSI”) by UHS during the fourth quarter of 2010, UHS has substantially increased its level of indebtedness which could, among other things, adversely affect its ability to raise additional capital to fund operations, limit its ability to react to changes in the economy or its industry and could potentially prevent them from meeting their obligations under the agreements related to their indebtedness. If UHS experiences financial difficulties and, as a result, operations of its existing facilities suffer, or UHS otherwise fails to make payments to us, our revenues will significantly decline.
Although we do not expect to be directly impacted by UHS’ acquisition of PSI, UHS is substantially more leveraged and we cannot assure you that UHS will continue to satisfy its obligations to us. The failure or inability of UHS to satisfy its obligations to us could materially reduce our revenues and net income, which could in turn reduce the amount of dividends we pay and cause our stock price to decline.
Our relationship with UHS may create conflicts of interest.
In addition to being dependent upon UHS for a substantial portion of our revenues and leases, since 1986, UHS of Delaware, Inc. (the “Advisor”), a wholly-owned subsidiary of UHS, has served as our Advisor. Pursuant to our Advisory Agreement, the Advisor is obligated to present an investment program to us, to use its best efforts to obtain investments suitable for such program (although it is not obligated to present any particular investment opportunity to us), to provide administrative services to us and to conduct our day-to-day affairs. Further, all of our officers are employees of UHS. As of December 31, 2010, we had no salaried employees although our officers do receive stock-based compensation. We believe that the quality and depth of the management and advisory services provided to us by our Advisor and UHS could not be replicated by contracting with unrelated third parties or by being self-advised without considerable cost increases. We believe that these relationships have been beneficial to us in the past, but we cannot guarantee that they will not become detrimental to us in the future.
All transactions with UHS must be approved by a majority of our Independent Trustees. We believe that our current leases and business dealings with UHS have been entered into on commercially reasonable terms. However, because of our historical and continuing relationship with UHS and its subsidiaries, in the future, our business dealings may not be on the same or as favorable terms as we might achieve with a third party with whom we do not have such a relationship. Disputes may arise between us and UHS that we are unable to resolve or the resolution of these disputes may not be as favorable to us as a resolution we might achieve with a third party.
14
Table of Contents
We hold significant, non-controlling equity ownership interests in various LLCs.
For the year ended December 31, 2010, 66% of our consolidated and unconsolidated revenues were generated by LLCs in which we hold a majority, non-controlling equity ownership interest. Our level of investment and lack of control exposes us to potential losses of our investments and revenues. Although our ownership arrangements have been beneficial to us in the past, we cannot guarantee that they will continue to be beneficial in the future.
Pursuant to the operating agreements of most of the LLCs, the third-party member and the Trust, at any time, have the right to make an offer (“Offering Member”) to the other member(s) (“Non-Offering Member”) in which it either agrees to: (i) sell the entire ownership interest of the Offering Member to the Non-Offering Member (“Offer to Sell”) at a price as determined by the Offering Member (“Transfer Price”), or; (ii) purchase the entire ownership interest of the Non-Offering Member (“Offer to Purchase”) at the equivalent proportionate Transfer Price. The Non-Offering Member has 60 days to either: (i) purchase the entire ownership interest of the Offering Member at the Transfer Price, or; (ii) sell its entire ownership interest to the Offering Member at the equivalent proportionate Transfer Price. The closing of the transfer must occur within 60 days of the acceptance by the Non-Offering Member.
In addition to the above-mentioned rights of the third-party members, from time to time, we have had discussions with third-party members about purchasing or selling the interests to each other or a third party. If we were to sell our interests, we may not be able to redeploy the proceeds into assets at the same or greater return as we currently receive. During any such time that we were not able to do so, our ability to increase or maintain our dividend at current levels could be adversely affected which could cause our stock price to decline.
The bankruptcy, default, insolvency or financial deterioration of our tenants could significantly delay our ability to collect unpaid rents or require us to find new operators.
Our financial position and our ability to make distributions to our shareholders may be adversely affected by financial difficulties experienced by any of our major tenants, including bankruptcy, insolvency or a general downturn in the business. We are exposed to the risk that our operators may not be able to meet their obligations, which may result in their bankruptcy or insolvency. Although our leases and loans provide us the right to terminate an investment, evict an operator, demand immediate repayment and other remedies, the bankruptcy laws afford certain rights to a party that has filed for bankruptcy or reorganization. An operator in bankruptcy may be able to restrict our ability to collect unpaid rents or interest during the bankruptcy proceeding.
Real estate ownership creates risks and liabilities that may result in unanticipated losses or expenses.
Our business is subject to risks associated with real estate acquisitions and ownership, including:
| • | general liability, property and casualty losses, some of which may be uninsured; |
| • | the illiquid nature of real estate and the real estate market that impairs our ability to purchase or sell our assets rapidly to respond to changing economic conditions; |
| • | real estate market factors, such as the supply and demand of office space and market rental rates, changes in interest rates as well as an increase in the development of medical office condominiums in certain markets; |
| • | costs that may be incurred relating to maintenance and repair, and the need to make expenditures due to changes in governmental regulations, including the Americans with Disabilities Act; |
| • | environmental hazards at our properties for which we may be liable, including those created by prior owners or occupants, existing tenants, mortgagors or other persons, and; |
| • | defaults and bankruptcies by our tenants. |
15
Table of Contents
In addition to the foregoing risks, we cannot predict whether the leases on our properties, including the leases on the properties leased to subsidiaries of UHS, which have options to purchase the respective leased facilities at the end of the lease or renewal terms at the appraised fair market value, will be renewed at their current rates at the end of the lease terms in 2011 or 2014. If the leases are not renewed, we may be required to find other operators for these facilities and/or enter into leases with less favorable terms. The exercise of purchase options for our facilities may result in a less favorable rate of return for us than the rental revenue currently earned on such facilities. Further, the purchase options and rights of first refusal granted to the respective lessees to purchase or lease the respective leased facilities, after the expiration of the lease term, may adversely affect our ability to sell or lease a facility, and may present a potential conflict of interest between us and UHS since the price and terms offered by a third-party are likely to be dependent, in part, upon the financial performance of the facility during the final years of the lease term.
Significant potential liabilities and rising insurance costs and availability may have an adverse effect on the operations of our operators, which may negatively impact their ability to meet their obligations to us.
As is typical in the healthcare industry, in the ordinary course of business, our operators, including UHS, are subject to medical malpractice lawsuits, product liability lawsuits, class action lawsuits and other legal actions. Some of these actions may involve large claims, as well as significant defense costs. If their ultimate liability for professional and general liability claims could change materially from current estimates, if such policy limitations should be partially or fully exhausted in the future, or payments of claims exceed estimates or are not covered by insurance, it could have a material adverse effect on the operations of our operators.
In addition, the malpractice expenses of our operators, including UHS, have increased in recent years which may increase their self-insured exposure for professional and general liability claims. There can be no assurance that insurance will continue to be available at reasonable prices that allow them to maintain adequate coverage. If these trends continue, they could have a material adverse effect on their operations. Property insurance rates, particularly for earthquake insurance in California, have also continued to increase. Three LLCs that own properties in California, in which we have various non-controlling equity interests, could not obtain earthquake insurance at rates which are economically beneficial in relation to the risks covered.
Our tenants and operators, including UHS, may be unable to fulfill their insurance, indemnification and other obligations to us under their leases and mortgages and thereby potentially expose us to those risks. In addition, our tenants and operators may be unable to pay their lease or mortgage payments, which could potentially decrease our revenues and increase our collection and litigation costs. Moreover, to the extent we are required to foreclose on the affected facilities, our revenues from those facilities could be reduced or eliminated for an extended period of time. In addition, we may in some circumstances be named as a defendant in litigation involving the actions of our operators. Although we have no involvement in the activities of our operators and our standard leases generally require our operators to carry insurance to cover us in certain cases, a significant judgment against us in such litigation could exceed our and our operators’ insurance coverage, which would require us to make payments to cover the judgment.
If we fail to maintain our REIT status, we will become subject to federal income tax on our taxable income at regular corporate rates.
In order to qualify as a REIT, we must comply with certain highly technical and complex Internal Revenue Code provisions. Although we believe we have been qualified as a REIT since our inception, there can be no assurance that we have been so qualified or will remain qualified in the future. Failure to qualify as a REIT may subject us to income tax liabilities, including federal income tax at regular corporate rates. The additional income tax incurred may significantly reduce the cash flow available for distribution to shareholders and for debt service. In addition, if disqualified, we might be barred from qualification as a REIT for four years following disqualification.
16
Table of Contents
Dividends paid by REITs generally do not qualify for reduced tax rates.
In general, the maximum U.S. federal income tax rate for dividends paid to individual U.S. shareholders is 15% (through 2010). Unlike dividends received from a corporation that is not a REIT, our distributions to individual shareholders generally are not eligible for the reduced rates.
Should we be unable to comply with the strict income distribution requirements applicable to REITs utilizing only cash generated by operating activities, we would be required to generate cash from other sources which could adversely affect our financial condition.
To obtain the favorable tax treatment associated with qualifying as a REIT, in general, we are required each year to distribute to our shareholders at least 90% of our net taxable income. In addition, we are subject to a tax on any undistributed portion of our income at regular corporate rates and might also be subject to a 4% excise tax on this undistributed income. To meet the distribution requirements necessary to achieve the tax benefits associated with qualifying as a REIT, we could be required to: (i) seek borrowed funds even if conditions are not favorable for borrowing; (ii) issue equity which could have a dilutive effect on the future dividends and share value of our existing shareholders; (iii) divest assets that we might have otherwise decided to retain, and/or; (iv) forgo attractive investment opportunities that we might have otherwise pursued. Securing funds through these other non-operating means could adversely affect our financial condition and future results of operations.
The market value of our common stock could be substantially affected by various factors.
Many factors, certain of which are outside of our control, could have an adverse effect on the share price of our common stock. These factors include certain of the risks discussed herein, our financial condition, performance and prospects, the market for similar securities issued by REITs, demographic changes, operating results of our operators and other hospital companies, changes in our financial estimates or recommendations of securities analysts, speculation in the press or investment community, the possible effects of war, terrorist and other hostilities, adverse weather conditions, the level of seasonal illnesses, changes in general conditions in the economy or the financial markets, or other developments affecting the health care industry.
Ownership limitations and anti-takeover provisions in our declaration of trust and bylaws and under Maryland law and in our Leases with UHS may delay, defer or prevent a change in control or other transactions that could provide shareholders with a take-over premium. We are subject to significant anti-takeover provisions.
In order to protect us against the risk of losing our REIT status for federal income tax purposes, our declaration of trust permits our Trustees to redeem shares acquired or held in excess of 9.8% of the issued and outstanding shares of our voting stock and, which in the opinion of the Trustees would jeopardize our REIT status. In addition, any acquisition of our common or preferred shares that would result in our disqualification as a REIT is null and void. The right of redemption may have the effect of delaying, deferring or preventing a change in control of our company and could adversely affect our shareholders’ ability to realize a premium over the market price for the shares of our common stock.
Our declaration of trust authorizes our Board of Trustees to issue additional shares of common and preferred stock and to establish the preferences, rights and other terms of any series of preferred stock that we issue. Although our Board of Trustees has no intention to do so at the present time, it could establish a series of preferred stock that could delay, defer or prevent a transaction or a change in control that might involve the payment of a premium over the market price for our common stock or otherwise be in the best interests of our shareholders.
Pursuant to the Master Lease Document by and among us and certain subsidiaries of UHS, which governs the leases of all hospital properties with subsidiaries of UHS includes a change of control provision. The change of control provision grants UHS the right, upon one month’s notice should a change of control of the Trust occur,
17
Table of Contents
to purchase any or all of the four leased hospital properties at their appraised fair market values. The exercise of this purchase option may result in a less favorable rate of return than the rental revenue currently earned on such facilities.
These provisions could discourage unsolicited acquisition proposals or make it more difficult for a third-party to gain control of us, which could adversely affect the market price of our securities and prevent shareholders from receiving a take-over premium.
We depend heavily on key management personnel and the departure of one or more of our key executives or a significant portion of our operators’ local hospital management personnel could harm our business.
The expertise and efforts of our senior executives and key members of our operators’ local hospital management personnel are critical to the success of our business. The loss of the services of one or more of our senior executives or of a significant portion of our operators’ local hospital management personnel could significantly undermine our management expertise and our operators’ ability to provide efficient, quality health care services at our facilities, which could harm their business, and in turn, harm our business.
Increasing investor interest in our sector and consolidation at the operator or REIT level could increase competition and reduce our profitability.
Our business is highly competitive and we expect that it may become more competitive in the future. We compete for the acquisition, leasing and financing of health care related facilities. Our competitors include, but are not limited to, other REITs, banks and other companies, including UHS, some of which are larger and may have a lower cost of capital than we do. These developments could result in fewer investment opportunities for us and lower spreads over our cost of our capital, which would hurt our growth.
We are subject to significant corporate regulation as a public company and failure to comply with all applicable regulations could subject us to liability or negatively affect our stock price.
As a publicly traded company, we are subject to a significant body of regulation, including the Sarbanes-Oxley Act of 2002. While we have developed and instituted a corporate compliance program based on what we believe are the current best practices in corporate governance and continue to update this program in response to newly implemented or changing regulatory requirements, we cannot provide assurance that we are or will be in compliance with all potentially applicable corporate regulations. For example, we cannot provide assurance that in the future our management will not find a material weakness in connection with its annual review of our internal control over financial reporting pursuant to Section 404 of the Sarbanes-Oxley Act. We also cannot provide assurance that we could correct any such weakness to allow our management to assess the effectiveness of our internal control over financial reporting as of the end of our fiscal year in time to enable our independent registered public accounting firm to state that we have maintained effective internal control over financial reporting as of the end of our fiscal year. If we fail to comply with any of these regulations, we could be subject to a range of regulatory actions, fines or other sanctions or litigation. If we must disclose any material weakness in our internal control over financial reporting, our stock price could decline.
Different interpretations of accounting principles could have a material adverse effect on our results of operations or financial condition.
Generally accepted accounting principles are complex, continually evolving and may be subject to varied interpretation by us, our independent registered public accounting firm and the SEC. Such varied interpretations could result from differing views related to specific facts and circumstances. Differences in interpretation of generally accepted accounting principles could have a material adverse effect on our financial position or results of operations.
| Item 1B. | Unresolved Staff Comments |
None.
18
Table of Contents
| ITEM 2. | Properties |
The following table shows our investments in hospital facilities leased to UHS and other non-related parties. The table on the next page provides information related to various properties in which we have significant investments, some of which are accounted for by the equity method. The capacity in terms of beds (for the hospital facilities) and the five-year occupancy levels are based on information provided by the lessees.
| Lease Term | ||||||||||||||||||||||||||||||||||||||
| Type of facility |
Number of available beds @ 12/31/10 |
2010 | Average Occupancy(1) | Minimum rent |
End of initial or renewed term |
Renewal term (years) |
||||||||||||||||||||||||||||||||
| Hospital Facility Name and Location |
2009 | 2008 | 2007 | 2006 | ||||||||||||||||||||||||||||||||||
| Southwest Healthcare System: Inland Valley Campus(2) Wildomar, California |
Acute Care | 122 | 78 | % | 77 | % | 77 | % | 67 | % | 85 | % | $ | 2,648,000 | 2011 | 20 | ||||||||||||||||||||||
| McAllen Medical Center(3) McAllen, Texas |
Acute Care | 428 | 47 | % | 50 | % | 50 | % | 51 | % | 52 | % | 5,485,000 | 2011 | 20 | |||||||||||||||||||||||
| Wellington Regional Medical Center West Palm Beach, Florida |
Acute Care | 158 | 70 | % | 71 | % | 74 | % | 78 | % | 77 | % | 3,030,000 | 2011 | 20 | |||||||||||||||||||||||
| The Bridgeway North Little Rock, Arkansas |
Behavioral Health |
112 | 77 | % | 79 | % | 83 | % | 94 | % | 92 | % | 930,000 | 2014 | 10 | |||||||||||||||||||||||
| HealthSouth Deaconess Rehabilitation Hospital Evansville, Indiana |
Rehabilitation | 80 | 71 | % | 60 | % | 55 | % | 57 | % | 53 | % | 775,000 | 2014 | 10 | |||||||||||||||||||||||
| Kindred Hospital Corpus Christi Corpus Christi, Texas | Sub-Acute Care | 74 | 64 | % | 61 | % | 63 | % | — | — | 687,000 | 2019 | 25 | |||||||||||||||||||||||||
| Kindred Hospital Chicago Central Chicago, Illinois |
Sub-Acute Care | 84 | 40 | % | 45 | % | 44 | % | 38 | % | 46 | % | 1,412,000 | 2016 | 10 | |||||||||||||||||||||||
| Facility Name and Location |
Lease Term | |||||||||||||||||||||||||||||||||||
| Type of facility |
Average Occupancy(1) | Minimum rent(5) |
End of initial or renewed term(4) |
Renewal term (years) |
||||||||||||||||||||||||||||||||
| 2010 | 2009 | 2008 | 2007 | 2006 | ||||||||||||||||||||||||||||||||
| Desert Springs Medical Plaza(4) |
MOB | 65 | % | 74 | % | 78 | % | 77 | % | 96 | % | 1,105,000 | 2011-2025 | Various | ||||||||||||||||||||||
| Deer Valley Medical Office I |
MOB | 95 | % | 100 | % | 100 | % | 100 | % | 100 | % | 2,006,000 | 2012-2017 | Various | ||||||||||||||||||||||
| Deer Valley Medical Office II |
MOB | 78 | % | 53 | % | — | — | — | 1,475,000 | 2017-2024 | Various | |||||||||||||||||||||||||
| Spring Valley MOB I(4) |
MOB | 93 | % | 96 | % | 96 | % | 95 | % | 91 | % | 732,000 | 2011-2018 | Various | ||||||||||||||||||||||
| Spring Valley MOB II(4) |
MOB | 53 | % | 51 | % | 50 | % | 50 | % | — | 861,000 | 2014-2020 | Various | |||||||||||||||||||||||
| Summerlin Hospital MOB I(4) |
MOB | 91 | % | 95 | % | 98 | % | 98 | % | 98 | % | 1,459,000 | 2011-2016 | Various | ||||||||||||||||||||||
| Summerlin Hospital MOB II(4) |
MOB | 97 | % | 100 | % | 100 | % | 100 | % | 100 | % | 1,301,000 | 2011-2015 | Various | ||||||||||||||||||||||
| Summerlin Hospital MOB III(4) |
MOB | 63 | % | 63 | % | — | — | — | 1,299,000 | 2014-2021 | Various | |||||||||||||||||||||||||
| Sheffield Medical Building |
MOB | 66 | % | 73 | % | 77 | % | 82 | % | 86 | % | 1,170,000 | 2011-2021 | Various | ||||||||||||||||||||||
| St. Mary’s Professional |
MOB | 99 | % | 99 | % | 97 | % | 95 | % | 92 | % | 4,182,000 | 2012-2025 | Various | ||||||||||||||||||||||
| Rosenberg Children’s |
MOB | 100 | % | 100 | % | 99 | % | 97 | % | 94 | % | 1,948,000 | 2012-2018 | Various | ||||||||||||||||||||||
| Palmdale Medical Plaza |
MOB | 75 | % | 75 | % | — | — | — | 1,090,000 | 2013-2014 | Various | |||||||||||||||||||||||||
19
Table of Contents
N/A—Not Applicable
| (1) | Average occupancy rate for the hospital facilities is based on the average number of available beds occupied during each of the five years ended December 31, 2010. Average available beds is the number of beds which are actually in service at any given time for immediate patient use with the necessary equipment and staff available for patient care. A hospital may have appropriate licenses for more beds than are in service for a number of reasons, including lack of demand, incomplete construction and anticipation of future needs. The average occupancy rate of a hospital is affected by a number of factors, including the number of physicians using the hospital, changes in the number of beds, the composition and size of the population of the community in which the hospital is located, general and local economic conditions, variations in local medical and surgical practices and the degree of outpatient use of the hospital services. Average occupancy rate for the multi-tenant medical office buildings is based on the occupied square footage of each building, including any applicable master leases. |
| (2) | In July, 2002, the operations of Inland Valley Regional Medical Center (“Inland Valley”) were merged with the operations of Rancho Springs Medical Center (“Rancho Springs”), an acute care hospital located in California and also operated by UHS, the real estate assets of which are not owned by us. Inland Valley, our lessee, was merged into Universal Health Services of Rancho Springs, Inc. The merged entity is now doing business as Southwest Healthcare System (“Southwest Healthcare”). As a result of merging the operations of the two facilities, the revenues of Southwest Healthcare include the revenues of both Inland Valley and Rancho Springs. Although we do not own the real estate assets of the Rancho Springs facility, Southwest Healthcare became the lessee on the lease relating to the real estate assets of the Inland Valley facility. Since the bonus rent calculation for the Inland Valley campus is based on net revenues and the financial results of the two facilities are no longer separable, the lease was amended during 2002 to exclude from the bonus rent calculation the estimated net revenues generated at the Rancho Springs campus (as calculated pursuant to a percentage based allocation determined at the time of the merger). The average occupancy rates shown for this facility for all years were based on the combined number of beds occupied at the Inland Valley and Rancho Springs campuses. |
| (3) | During the first quarter of 2001, UHS purchased the assets and operations of the 60-bed McAllen Heart Hospital located in McAllen, Texas. Upon the acquisition by UHS, the Heart Hospital began operating under the same license as an integrated department of McAllen Medical Center. As a result of combining the operations of the two facilities, the revenues of McAllen Medical Center include revenues generated by the Heart Hospital, the real property of which is not owned by us. Accordingly, since the bonus rent calculation for McAllen Medical Center is based on the combined net revenues of the two facilities, the McAllen Medical Center lease was amended during 2001 to exclude from the bonus rent calculation, the estimated net revenues generated at the Heart Hospital (as calculated pursuant to a percentage based allocation determined at the time of the merger). In addition, during 2000, UHS purchased the South Texas Behavioral Health Center, a behavioral health care facility located in McAllen, Texas. In 2006, a newly constructed replacement facility for the South Texas Behavioral Health Center was completed and opened. The license for this facility, the real property of which is not owned by us, was also merged with the license for McAllen Medical Center. There was no amendment to the McAllen Medical Center lease related to the operations of the South Texas Behavioral Health Center. The revenues of South Texas Behavioral Health Center are excluded from the bonus rent calculation. No assurance can be given as to the effect, if any, the consolidation of the facilities as mentioned above, had on the underlying value of McAllen Medical Center. Base rental commitments and the guarantee by UHS under the original lease continue for the remainder of the lease terms. The average occupancy rates shown for this facility prior to 2009 were based on the combined number of beds at McAllen Medical Center, McAllen Heart Hospital and South Texas Behavioral Health Center. For 2009 and 2010, the occupancy rates were based upon the combined numbers of beds at McAllen Medical Center and McAllen Heart Hospital. |
| (4) | The real estate assets of this facility are owned by an LLC in which we own a non-controlling equity interest and include tenants who are unaffiliated third-parties or subsidiaries of UHS. |
| (5) | Minimum rent amounts include impact of straight-line rent adjustments. |
20
Table of Contents
Set forth is information detailing the rentable square feet (“RSF”) associated with each of our investments and the percentage of RSF on which leases expire during the next five years and thereafter:
| Percentage of RSF with lease expirations | ||||||||||||||||||||||||||||||||
| Total RSF | Available for Lease Jan. 1, 2011 |
2011 | 2012 | 2013 | 2014 | 2015 | 2016 and Later |
|||||||||||||||||||||||||
| Hospital Investments |
||||||||||||||||||||||||||||||||
| McAllen Medical Center |
422,276 | 0 | % | 100 | % | 0 | % | 0 | % | 0 | % | 0 | % | 0 | % | |||||||||||||||||
| Wellington Regional Medical Center |
196,489 | 0 | % | 100 | % | 0 | % | 0 | % | 0 | % | 0 | % | 0 | % | |||||||||||||||||
| Southwest Healthcare System—Inland Valley Campus. |
124,644 | 0 | % | 100 | % | 0 | % | 0 | % | 0 | % | 0 | % | 0 | % | |||||||||||||||||
| Kindred Hospital Chicago Central |
115,554 | 0 | % | 0 | % | 0 | % | 0 | % | 0 | % | 0 | % | 100 | % | |||||||||||||||||
| The Bridgeway |
77,901 | 0 | % | 0 | % | 0 | % | 0 | % | 100 | % | 0 | % | 0 | % | |||||||||||||||||
| HealthSouth Deaconess Rehab. Hospital |
77,440 | 0 | % | 0 | % | 0 | % | 0 | % | 100 | % | 0 | % | 0 | % | |||||||||||||||||
| Kindred Hospital Corpus Christi |
69,700 | 0 | % | 0 | % | 0 | % | 0 | % | 0 | % | 0 | % | 100 | % | |||||||||||||||||
| Subtotal Hospitals |
1,084,004 | 0 | % | 69 | % | 0 | % | 0 | % | 14 | % | 0 | % | 17 | % | |||||||||||||||||
| Other Investments |
||||||||||||||||||||||||||||||||
| Medical Office Buildings: |
||||||||||||||||||||||||||||||||
| Desert Samaritan Hospital MOBs |
201,108 | 28 | % | 21 | % | 15 | % | 8 | % | 7 | % | 4 | % | 17 | % | |||||||||||||||||
| Saint Mary’s Professional Office Building |
190,754 | 0 | % | 0 | % | 2 | % | 1 | % | 0 | % | 4 | % | 93 | % | |||||||||||||||||
| Edwards Medical Plaza |
141,034 | 11 | % | 11 | % | 30 | % | 20 | % | 7 | % | 5 | % | 16 | % | |||||||||||||||||
| 700 Shadow Lane and Goldring MOBs |
116,834 | 11 | % | 11 | % | 20 | % | 35 | % | 3 | % | 5 | % | 15 | % | |||||||||||||||||
| Texoma Medical Plaza(b) |
115,284 | 25 | % | 0 | % | 0 | % | 0 | % | 0 | % | 27 | % | 48 | % | |||||||||||||||||
| Centinela Medical Buildings |
103,388 | 27 | % | 27 | % | 9 | % | 11 | % | 19 | % | 6 | % | 1 | % | |||||||||||||||||
| Suburban Medical Plaza II |
102,818 | 0 | % | 21 | % | 6 | % | 0 | % | 21 | % | 10 | % | 42 | % | |||||||||||||||||
| Desert Springs Medical Plaza |
102,579 | 31 | % | 5 | % | 19 | % | 11 | % | 0 | % | 19 | % | 15 | % | |||||||||||||||||
| Centennial Hills Medical Office Building I |
96,713 | 30 | % | 0 | % | 0 | % | 20 | % | 15 | % | 8 | % | 27 | % | |||||||||||||||||
| Thunderbird Paseo Medical Plaza I & II |
96,569 | 1 | % | 16 | % | 27 | % | 18 | % | 5 | % | 8 | % | 25 | % | |||||||||||||||||
| Summerlin Hospital Medical Office Building II |
92,313 | 16 | % | 17 | % | 34 | % | 16 | % | 7 | % | 2 | % | 8 | % | |||||||||||||||||
| Canyon Springs Medical Plaza |
91,957 | 2 | % | 0 | % | 14 | % | 0 | % | 2 | % | 6 | % | 76 | % | |||||||||||||||||
| Summerlin Hospital Medical Office Building I |
89,636 | 15 | % | 21 | % | 14 | % | 26 | % | 10 | % | 12 | % | 2 | % | |||||||||||||||||
| Vista Medical Terrace & The Sparks Medical Building. |
85,668 | 36 | % | 16 | % | 22 | % | 3 | % | 2 | % | 7 | % | 14 | % | |||||||||||||||||
| North Valley Medical Plaza |
80,304 | 58 | % | 6 | % | 2 | % | 7 | % | 4 | % | 14 | % | 9 | % | |||||||||||||||||
| Papago Medical Park |
79,247 | 9 | % | 0 | % | 5 | % | 48 | % | 17 | % | 9 | % | 12 | % | |||||||||||||||||
| Summerlin Hospital Medical Office Building III |
77,713 | 37 | % | 0 | % | 0 | % | 0 | % | 18 | % | 2 | % | 43 | % | |||||||||||||||||
| Deer Valley Medical Office II |
77,264 | 8 | % | 1 | % | 46 | % | 7 | % | 0 | % | 18 | % | 20 | % | |||||||||||||||||
| Deer Valley Medical Office III |
76,921 | 19 | % | 0 | % | 0 | % | 0 | % | 0 | % | 0 | % | 81 | % | |||||||||||||||||
| Mid Coast Hospital MOB |
74,629 | 0 | % | 16 | % | 0 | % | 12 | % | 0 | % | 0 | % | 72 | % | |||||||||||||||||
| Sheffield Medical Building |
71,940 | 33 | % | 8 | % | 31 | % | 6 | % | 4 | % | 3 | % | 15 | % | |||||||||||||||||
| Rosenberg Children’s Medical Plaza |
66,231 | 0 | % | 0 | % | 7 | % | 53 | % | 0 | % | 3 | % | 37 | % | |||||||||||||||||
| Sierra San Antonio Medical Plaza |
59,160 | 32 | % | 18 | % | 0 | % | 12 | % | 0 | % | 4 | % | 34 | % | |||||||||||||||||
| Palmdale Medical Plaza(a) |
58,150 | 25 | % | 0 | % | 0 | % | 59 | % | 16 | % | 0 | % | 0 | % | |||||||||||||||||
| Spring Valley Medical Office Building |
57,828 | 18 | % | 16 | % | 30 | % | 24 | % | 5 | % | 4 | % | 3 | % | |||||||||||||||||
| Spring Valley Medical Office Building II |
57,635 | 24 | % | 0 | % | 0 | % | 0 | % | 10 | % | 0 | % | 66 | % | |||||||||||||||||
| Desert Valley Medical Center |
53,734 | 28 | % | 9 | % | 8 | % | 9 | % | 5 | % | 7 | % | 34 | % | |||||||||||||||||
| Southern Crescent Center II |
53,680 | 82 | % | 0 | % | 8 | % | 0 | % | 0 | % | 0 | % | 10 | % | |||||||||||||||||
| Southern Crescent Center I |
41,400 | 30 | % | 0 | % | 22 | % | 4 | % | 22 | % | 0 | % | 22 | % | |||||||||||||||||
| Auburn Medical II |
41,311 | 16 | % | 0 | % | 0 | % | 0 | % | 0 | % | 0 | % | 84 | % | |||||||||||||||||
| BRB Medical Office Building |
40,733 | 10 | % | 0 | % | 0 | % | 0 | % | 0 | % | 17 | % | 73 | % | |||||||||||||||||
| Cypresswood Professional Center |
40,082 | 13 | % | 0 | % | 17 | % | 0 | % | 12 | % | 58 | % | 0 | % | |||||||||||||||||
| Medical Center of Western Connecticut |
36,341 | 6 | % | 5 | % | 0 | % | 5 | % | 17 | % | 0 | % | 67 | % | |||||||||||||||||
| Phoenix Children’s East Valley Care Center |
30,960 | 0 | % | 0 | % | 0 | % | 0 | % | 0 | % | 0 | % | 100 | % | |||||||||||||||||
| Apache Junction Medical Plaza |
26,901 | 9 | % | 13 | % | 13 | % | 34 | % | 0 | % | 31 | % | 0 | % | |||||||||||||||||
| Santa Fe Professional Plaza |
25,294 | 39 | % | 11 | % | 27 | % | 17 | % | 0 | % | 0 | % | 6 | % | |||||||||||||||||
| Professional Bldg at King’s Crossing |
24,318 | 32 | % | 0 | % | 6 | % | 0 | % | 0 | % | 25 | % | 37 | % | |||||||||||||||||
| Cobre Valley Medical Plaza |
21,882 | 0 | % | 20 | % | 63 | % | 17 | % | 0 | % | 0 | % | 0 | % | |||||||||||||||||
| Kelsey-Seybold Clinic at King’s Crossing |
20,470 | 0 | % | 0 | % | 0 | % | 0 | % | 0 | % | 0 | % | 100 | % | |||||||||||||||||
| Orthopaedic Specialists of Nevada Building |
11,000 | 100 | % | 0 | % | 0 | % | 0 | % | 0 | % | 0 | % | 0 | % | |||||||||||||||||
| Family Doctor’s MOB |
9,155 | 0 | % | 100 | % | 0 | % | 0 | % | 0 | % | 0 | % | 0 | % | |||||||||||||||||
| Preschool and Childcare Centers: |
||||||||||||||||||||||||||||||||
| Chesterbrook Academy—Audubon |
8,300 | 0 | % | 0 | % | 0 | % | 0 | % | 0 | % | 0 | % | 100 | % | |||||||||||||||||
| Chesterbrook Academy—Uwchlan |
8,163 | 0 | % | 0 | % | 0 | % | 0 | % | 0 | % | 0 | % | 100 | % | |||||||||||||||||
| Chesterbrook Academy—Newtown |
8,100 | 0 | % | 0 | % | 0 | % | 0 | % | 0 | % | 0 | % | 100 | % | |||||||||||||||||
| Chesterbrook Academy—New Britain |
7,998 | 0 | % | 0 | % | 0 | % | 0 | % | 0 | % | 0 | % | 100 | % | |||||||||||||||||
| Sub-total Other Investments |
2,973,499 | 19 | % | 9 | % | 13 | % | 12 | % | 6 | % | 8 | % | 33 | % | |||||||||||||||||
| Total |
4,057,503 | 14 | % | 25 | % | 9 | % | 9 | % | 8 | % | 6 | % | 29 | % | |||||||||||||||||
21
Table of Contents
| a) | The Palmdale Medical Plaza has a 75% master lease commitment from UHS that expires at the earlier of the commitment threshold being met or the scheduled expiration in June, 2013. |
| b) | The Texoma Medical Plaza has a 75% master lease commitment from UHS that expires at the earlier of the commitment threshold being met or the scheduled expiration in February 14, 2015. |
The average effective annual rental per square foot for our hospital properties was $17.64 during 2010 as compared to $17.81 during 2009, based upon consolidated revenues and total square footage for the hospital facilities. The average effective annual rental per square foot related to our MOBs and childcare centers was $26.96 during 2010 as compared to $26.67 during 2009, based upon the consolidated and unconsolidated revenues and the estimated average occupied square footage for all of our MOBs and childcare centers. On a combined basis, based upon all consolidated and unconsolidated revenues and estimated average occupied square footage, the average effective annual rental per square foot for our properties on a portfolio basis was $24.08 during 2010 as compared to $23.84 during 2009. The estimated average occupied square footage for 2010 was calculated by averaging the unavailable rentable square footage on January 1, 2010 and January 1, 2011. The estimated average occupied square footage for 2009 was calculated by averaging the unavailable rentable square footage on January 1, 2009 and January 1, 2010.
During 2010, each of three UHS-related hospitals (McAllen Medical Center, Wellington Regional Medical Center and Southwest Healthcare System-Inland Valley Campus) generated revenues that comprised more than 10% of our consolidated revenues. As of December 31, 2010, McAllen Medical Center and Wellington Regional Medical Center had book values of approximately 10% or greater of our total assets. Including 100% of the revenues generated at the properties owned by our unconsolidated LLCs, none of our unconsolidated LLCs had revenues greater than 10% of the combined consolidated and unconsolidated revenues during 2010. Including 100% of the book values of the properties owned by our unconsolidated LLCs, none of the properties had book values greater than 10% of the consolidated and unconsolidated assets.
The following table sets forth the average effective annual rental per square foot for 2010, based upon average occupied square feet for McAllen Medical Center, Wellington Regional Medical Center and Southwest Healthcare System-Inland Valley Campus:
| Property |
2010 Average Occupied Square Feet |
2010 Revenues |
2010 Average Effective Rental Per Square Foot |
|||||||||
| McAllen Medical Center |
422,276 | $ | 7,070,000 | $ | 16.74 | |||||||
| Wellington Regional Medical Center |
196,489 | $ | 4,242,000 | $ | 21.59 | |||||||
| Southwest Healthcare System-Inland Valley Campus |
124,644 | $ | 3,768,000 | $ | 30.23 | |||||||
22
Table of Contents
The following table sets forth lease expirations for each of the next ten years:
| Expiring Square Feet |
Number of Tenants |
Annual Rental of Expiring Leases(1) |
Percentage of Annual Rental(2) |
|||||||||||||
| Hospital properties |
||||||||||||||||
| 2011 |
858,963 | 4 | $ | 12,563,000 | 16 | % | ||||||||||
| 2012 |
0 | 0 | $ | 0 | 0 | % | ||||||||||
| 2013 |
0 | 0 | $ | 0 | 0 | % | ||||||||||
| 2014 |
155,341 | 2 | $ | 1,705,000 | 2 | % | ||||||||||
| 2015 |
0 | 0 | $ | 0 | 0 | % | ||||||||||
| 2016 |
0 | 0 | $ | 0 | 0 | % | ||||||||||
| 2017 |
0 | 0 | $ | 0 | 0 | % | ||||||||||
| 2018 |
0 | 0 | $ | 0 | 0 | % | ||||||||||
| 2019 |
69,700 | 1 | $ | 668,000 | 1 | % | ||||||||||
| 2020 |
0 | 0 | $ | 0 | 0 | % | ||||||||||
| Thereafter |
0 | 0 | $ | 0 | 0 | % | ||||||||||
| Subtotal-hospital facilities |
1,084,004 | 7 | $ | 14,936,000 | 19 | % | ||||||||||
| Other consolidated properties |
||||||||||||||||
| 2011 |
18,682 | 7 | $ | 644,000 | 1 | % | ||||||||||
| 2012 |
43,516 | 13 | $ | 1,240,000 | 2 | % | ||||||||||
| 2013 |
8,094 | 5 | $ | 254,000 | 0 | % | ||||||||||
| 2014 |
32,598 | 7 | $ | 877,000 | 1 | % | ||||||||||
| 2015 |
31,487 | 6 | $ | 791,000 | 1 | % | ||||||||||
| 2016 |
30,377 | 6 | $ | 678,000 | 1 | % | ||||||||||
| 2017 |
6,588 | 1 | $ | 233,000 | 0 | % | ||||||||||
| 2018 |
12,670 | 3 | $ | 294,000 | 0 | % | ||||||||||
| 2019 |
19,200 | 2 | $ | 677,000 | 1 | % | ||||||||||
| 2020 |
22,514 | 2 | $ | 514,000 | 1 | % | ||||||||||
| Thereafter |
20,738 | 3 | $ | 462,000 | 1 | % | ||||||||||
| Subtotal-other consolidated properties |
246,464 | 55 | $ | 6,664,000 | 9 | % | ||||||||||
| Other unconsolidated properties (MOBs) |
||||||||||||||||
| 2011 |
242,402 | 106 | $ | 6,602,000 | 8 | % | ||||||||||
| 2012 |
328,569 | 102 | $ | 9,027,000 | 11 | % | ||||||||||
| 2013 |
319,178 | 100 | $ | 8,551,000 | 11 | % | ||||||||||
| 2014 |
134,558 | 49 | $ | 3,576,000 | 4 | % | ||||||||||
| 2015 |
174,073 | 57 | $ | 4,680,000 | 6 | % | ||||||||||
| 2016 |
147,100 | 29 | $ | 3,906,000 | 5 | % | ||||||||||
| 2017 |
144,429 | 23 | $ | 4,425,000 | 5 | % | ||||||||||
| 2018 |
85,236 | 17 | $ | 2,187,000 | 3 | % | ||||||||||
| 2019 |
46,760 | 12 | $ | 1,639,000 | 2 | % | ||||||||||
| 2020 |
191,616 | 31 | $ | 5,327,000 | 7 | % | ||||||||||
| Thereafter |
253,485 | 24 | $ | 7,369,000 | 10 | % | ||||||||||
| Subtotal-other unconsolidated properties |
2,067,406 | 550 | $ | 57,289,000 | 72 | % | ||||||||||
| Total all properties |
3,397,874 | 612 | $ | 78,889,000 | 100 | % | ||||||||||
| (1) | Based upon 2010 rental revenue excluding the bonus rental revenue earned on the UHS hospital facilities and including 100% of the revenues generated at the unconsolidated LLCs in which we hold various non-controlling ownership interests. |
| (2) | Percentages based upon 2010 rental revenues, excluding the bonus rental earned on the UHS hospital facilities and including 100% of the revenues generated at the unconsolidated LLCs in which we hold various non-controlling ownership interests. |
23
Table of Contents
| ITEM 3. | Legal Proceedings |
None
| ITEM 4. | [Reserved] |
| ITEM 5. | Market for Registrant’s Common Equity, Related Stockholder Matters and Issuer Purchases of Equity Securities |
Market Information
Our shares of beneficial interest are listed on the New York Stock Exchange. The high and low closing sales prices for our shares of beneficial interest for each quarter in the years ended December 31, 2010 and 2009 are summarized below:
| 2010 | 2009 | |||||||||||||||
| High Price |
Low Price |
High Price |
Low Price |
|||||||||||||
| First Quarter |
$ | 36.54 | $ | 31.92 | $ | 34.32 | $ | 25.11 | ||||||||
| Second Quarter |
$ | 36.00 | $ | 30.79 | $ | 33.94 | $ | 30.08 | ||||||||
| Third Quarter |
$ | 34.53 | $ | 31.50 | $ | 35.28 | $ | 29.49 | ||||||||
| Fourth Quarter |
$ | 38.40 | $ | 34.78 | $ | 32.55 | $ | 30.27 | ||||||||
Holders
As of January 31, 2011, there were approximately 462 shareholders of record of our shares of beneficial interest.
Dividends
It is our intention to declare quarterly dividends to the holders of our shares of beneficial interest so as to comply with applicable sections of the Internal Revenue Code governing REITs. Our revolving credit facility limits our ability to increase dividends in excess of 95% of cash available for distribution, as defined in our revolving credit agreement, unless additional distributions are required to be made so as to comply with applicable sections of the Internal Revenue Code and related regulations governing REITs. In each of the past two years, dividends per share were declared as follows:
| 2010 | 2009 | |||||||
| First Quarter |
$ | .600 | $ | .590 | ||||
| Second Quarter |
.605 | .595 | ||||||
| Third Quarter |
.605 | .595 | ||||||
| Fourth Quarter |
.605 | .600 | ||||||
| $ | 2.415 | $ | 2.38 | |||||
24
Table of Contents
Stock Price Performance Graph
The following graph compares our performance with that of the S&P 500 and a group of peer companies, where performance has been weighted based on market capitalization. Companies in our peer group are as follows: HCP, Inc., Nationwide Health Properties, Inc., Omega Healthcare Investors, Inc., Health Care REIT, Inc., Healthcare Realty Trust, Inc., LTC Properties, Inc., National Health Investors, Inc. and National Health Realty, Inc. (included through 2006).
The Stock Price Performance Graph shall not be deemed incorporated by reference by any general statement incorporating by reference in this Form 10-K into any filing under the Securities Act of 1933 or under the Securities Exchange Act of 1934, except to the extent we specifically incorporate this information by reference, and shall not otherwise be deemed filed under such Acts.
The total cumulative return on investment (change in the year-end stock price plus reinvested dividends) for each of the periods for us, the peer group and the S&P 500 composite is based on the stock price or composite index at the end of fiscal 2005.
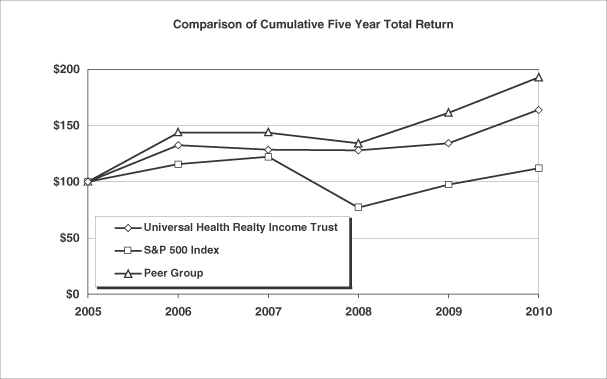
| Company Name/Index |
Base Period Dec 2005 |
INDEXED RETURNS Years Ending |
||||||||||||||||||||||
| Dec 2006 | Dec 2007 | Dec 2008 | Dec 2009 | Dec 2010 | ||||||||||||||||||||
| Universal Health Realty Income Trust |
$ | 100 | $ | 132.50 | $ | 128.58 | $ | 127.97 | $ | 134.29 | $ | 164.16 | ||||||||||||
| S&P 500 Index |
$ | 100 | $ | 115.79 | $ | 122.16 | $ | 76.96 | $ | 97.33 | $ | 111.99 | ||||||||||||
| Peer Group |
$ | 100 | $ | 143.55 | $ | 143.45 | $ | 134.10 | $ | 161.33 | $ | 192.94 | ||||||||||||
25
Table of Contents
| ITEM 6. | Selected Financial Data |
The following table contains our selected financial data for, or at the end of, each of the five years ended December 31, 2010. You should read this table in conjunction with our consolidated financial statements and related notes contained elsewhere in this Annual Report and Part II, Item 7, Management’s Discussion and Analysis of Financial Condition and Results of Operations.
| (000s, except per share amounts) | ||||||||||||||||||||
| 2010 | 2009 | 2008 | 2007 | 2006 | ||||||||||||||||
| Operating Results: |
||||||||||||||||||||
| Total revenue(1) |
$ | 28,878 | $ | 31,914 | $ | 29,184 | $ | 27,960 | $ | 31,714 | ||||||||||
| Income from continuing operations |
16,310 | 18,576 | 11,653 | 19,664 | 34,428 | |||||||||||||||
| Income from discontinued operations, net (including gain on sale of real property of $2,270 during 2007) |
— | — | — | 2,527 | 269 | |||||||||||||||
| Net income |
$ | 16,310 | $ | 18,576 | $ | 11,653 | $ | 22,191 | $ | 34,697 | ||||||||||
| Balance Sheet Data: |
||||||||||||||||||||
| Real estate investments, net of accumulated depreciation(1) |
$ | 125,257 | $ | 154,540 | $ | 154,649 | $ | 143,797 | $ | 143,363 | ||||||||||
| Investments in LLCs(1) |
80,442 | 61,934 | 56,462 | 52,030 | 47,223 | |||||||||||||||
| Total assets(1) |
216,135 | 228,825 | 221,056 | 199,749 | 194,139 | |||||||||||||||
| Total indebtedness(1)(2) |
67,563 | 84,267 | 71,692 | 36,617 | 26,337 | |||||||||||||||
| Other Data: |
||||||||||||||||||||
| Funds from operations(3) |
$ | 32,582 | $ | 33,325 | $ | 24,996 | $ | 29,066 | $ | 28,930 | ||||||||||
| Cash provided by (used in): |
||||||||||||||||||||
| Operating activities |
23,049 | 24,984 | 21,769 | 22,767 | 24,702 | |||||||||||||||
| Investing activities |
(17,302 | ) | (12,362 | ) | (26,923 | ) | (4,336 | ) | (2,404 | ) | ||||||||||
| Financing activities |
(7,798 | ) | (10,202 | ) | 4,641 | (18,098 | ) | (23,217 | ) | |||||||||||
| Per Share Data: |
||||||||||||||||||||
| Basic earnings per share: |
||||||||||||||||||||
| From continuing operations |
$ | 1.33 | $ | 1.56 | $ | 0.98 | $ | 1.66 | $ | 2.92 | ||||||||||
| From discontinued operations |
— | — | — | 0.21 | 0.02 | |||||||||||||||
| Total basic earnings per share |
$ | 1.33 | $ | 1.56 | $ | 0.98 | $ | 1.87 | $ | 2.94 | ||||||||||
| Diluted earnings per share: |
||||||||||||||||||||
| From continuing operations |
$ | 1.33 | $ | 1.56 | $ | 0.98 | $ | 1.66 | $ | 2.90 | ||||||||||
| From discontinued operations |
— | — | — | 0.21 | 0.02 | |||||||||||||||
| Total diluted earnings per share |
$ | 1.33 | $ | 1.56 | $ | 0.98 | $ | 1.87 | $ | 2.92 | ||||||||||
| Dividends per share |
$ | 2.415 | $ | 2.380 | $ | 2.340 | $ | 2.300 | $ | 2.260 | ||||||||||
| Other Information (in thousands) |
||||||||||||||||||||
| Weighted average number of shares outstanding—basic |
12,259 | 11,891 | 11,851 | 11,818 | 11,784 | |||||||||||||||
| Weighted average number of shares and share equivalents outstanding—diluted |
12,262 | 11,897 | 11,882 | 11,875 | 11,866 | |||||||||||||||
| (1) | As discussed in Note 1 “Summary of Significant Accounting Policies—Investments in Limited Liability Companies”, our consolidated financial statements include the consolidated accounts of our consolidated investments and those investments that meet the criteria of a variable interest entity. Please see Note 1 for further discussions. |
| (2) | Excludes third-party debt that is non-recourse to us, incurred by unconsolidated LLCs in which we hold various non-controlling equity interests as follows: $271.7 million as of December 31, 2010, $251.4 million |
26
Table of Contents
| as of December 31, 2009, $230.5 million as of December 31, 2008, $214.9 million as of December 31, 2007, and $180.9 million as of December 31, 2006. (See Note 8 to the consolidated financial statements). |
| (3) | Our funds from operations (“FFO”) during 2008 includes a reduction for a $4.6 million provision for asset impairment recorded during 2008, as mentioned herein. |
Funds from operations is a widely recognized measure of performance for Real Estate Investment Trusts (“REITs”). We believe that funds from operations (“FFO”) and funds from operations per diluted share, which are non-GAAP financial measures (“GAAP” is Generally Accepted Accounting Principles in the United States of America), are helpful to our investors as measures of our operating performance. We compute FFO in accordance with standards established by the National Association of Real Estate Investment Trusts (“NAREIT”), which may not be comparable to FFO reported by other REITs that do not compute FFO in accordance with the NAREIT definition, or that interpret the NAREIT definition differently than we interpret the definition. FFO does not represent cash generated from operating activities in accordance with GAAP and should not be considered to be an alternative to net income determined in accordance with GAAP. In addition, FFO should not be used as: (i) an indication of our financial performance determined in accordance with GAAP; (ii) an alternative to cash flow from operating activities determined in accordance with GAAP; (iii) a measure of our liquidity, or; (iv) an indicator of funds available for our cash needs, including our ability to make cash distributions to shareholders.
A reconciliation of our reported net income to FFO is shown below:
| (000s) | ||||||||||||||||||||
| 2010 | 2009 | 2008 | 2007 | 2006 | ||||||||||||||||
| Net income |
$ | 16,310 | $ | 18,576 | $ | 11,653 | $ | 22,191 | $ | 34,697 | ||||||||||
| Depreciation and amortization expense: |
||||||||||||||||||||
| Consolidated investments |
6,156 | 6,283 | 5,832 | 5,167 | 5,314 | |||||||||||||||
| Unconsolidated affiliates |
10,116 | 8,466 | 7,511 | 5,990 | 4,613 | |||||||||||||||
| Discontinued operations |
— | — | — | — | 124 | |||||||||||||||
| Less gains: |
||||||||||||||||||||
| Previously deferred gain on sale of our interest in an unconsolidated LLC |
— | — | — | — | (1,860 | ) | ||||||||||||||
| Gain on asset exchange and substitution agreement with UHS—Chalmette |
— | — | — | (1,748 | ) | (13,958 | ) | |||||||||||||
| Property damage recovered from UHS-Wellington |
— | — | — | — | — | |||||||||||||||
| Gains recorded by unconsolidated affiliates |
— | — | — | (264 | ) | — | ||||||||||||||
| Gain on sale of real property, included in income from discontinued operations |
— | — | — | (2,270 | ) | — | ||||||||||||||
| FFO |
$ | 32,582 | $ | 33,325 | $ | 24,996 | $ | 29,066 | $ | 28,930 | ||||||||||
| ITEM 7. | Management’s Discussion and Analysis of Financial Condition and Results of Operations |
Overview
We are a real estate investment trust (“REIT”) that commenced operations in 1986. We invest in healthcare and human service related facilities including acute care hospitals, behavioral healthcare facilities, rehabilitation hospitals, sub-acute facilities, surgery centers, childcare centers and medical office buildings (“MOBs”). As of December 31, 2010, we have fifty-two real estate investments or commitments in fifteen states consisting of:
| • | seven hospital facilities including three acute care, one behavioral healthcare, one rehabilitation and two sub-acute; |
| • | forty-one medical office buildings, and; |
| • | four preschool and childcare centers. |
27
Table of Contents
Forward Looking Statements
This Annual Report contains “forward-looking statements” that reflect our current estimates, expectations and projections about our future results, performance, prospects and opportunities. Forward-looking statements include, among other things, the information concerning our possible future results of operations, business and growth strategies, financing plans, expectations that regulatory developments or other matters will not have a material adverse effect on our business or financial condition, our competitive position and the effects of competition, the projected growth of the industry in which we operate, and the benefits and synergies to be obtained from our completed and any future acquisitions, and statements of our goals and objectives, and other similar expressions concerning matters that are not historical facts. Words such as “may,” “will,” “should,” “could,” “would,” “predicts,” “potential,” “continue,” “expects,” “anticipates,” “future,” “intends,” “plans,” “believes,” “estimates,” “appears,” “projects” and similar expressions, as well as statements in future tense, identify forward-looking statements.
Forward-looking statements should not be read as a guarantee of future performance or results, and will not necessarily be accurate indications of the times at, or by which, such performance or results will be achieved. Forward-looking information is based on information available at the time and/or our good faith belief with respect to future events, and is subject to risks and uncertainties that could cause actual performance or results to differ materially from those expressed in the statements. Such factors include, among other things, the following:
| • | a substantial portion of our revenues are dependent upon one operator, Universal Health Services, Inc., (“UHS”); |
| • | a number of legislative initiatives have recently been passed into law that may result in major changes in the health care delivery system on a national or state level to the operators of our facilities, including UHS. No assurances can be given that the implementation of these new laws will not have a material adverse effect on the business, financial condition or results of operations of our operators; |
| • | a subsidiary of UHS is our Advisor and our officers are all employees of UHS, which may create the potential for conflicts of interest; |
| • | lost revenues from purchase option exercises and lease expirations and renewals, loan repayments and other restructuring; |
| • | the availability and terms of capital to fund the growth of our business; |
| • | the outcome of known and unknown litigation, government investigations, and liabilities and other claims asserted against us or the operators of our facilities; |
| • | UHS’s acquisition of Psychiatric Solutions, Inc. has required UHS to substantially increase its level of indebtedness which could, among other things, adversely affect its ability to raise additional capital to fund operations, limit its ability to react to changes in the economy or its industry and could potentially prevent it from meeting its obligations under the agreements related to its indebtedness. If UHS experiences financial difficulties and, as a result, operations of its existing facilities suffer, or UHS otherwise fails to make payments to us, our revenues will significantly decline; |
| • | failure of the operators of our hospital facilities to comply with governmental regulations related to the Medicare and Medicaid licensing and certification requirements could have a material adverse impact on our future revenues and the underlying value of the property (see Item 1A. Risk Factors for disclosure related to Southwest Healthcare System’s regulatory matters with the Center for Medicare and Medicaid Services and the California Department of Public Health); |
| • | the potential unfavorable impact on our business of continued deterioration in national, regional and local economic and business conditions, including a continuation or worsening of unfavorable credit and/or capital market conditions, which may adversely affect, on acceptable terms, our access to sources of capital which may be required to fund the future growth of our business and refinance existing debt with near term maturites; |
28
Table of Contents
| • | further deterioration in general economic conditions which could result in increases in the number of people unemployed and/or insured and likely increase the number of individuals without health insurance; as a result, the operators of our facilities may experience decreases in patient volumes which could result in decreased occupancy rates at our medical office buildings; |
| • | a worsening of the economic and employment conditions in the United States could materially affect the business of our operators, including UHS which may unfavorably impact our future bonus rentals (on the UHS hospital facilities) and may potentially have a negative impact on the future lease renewal terms and the underlying value of the hospital properties; |
| • | our majority ownership interests in various LLCs in which we hold non-controlling equity interests. In addition, pursuant to the operating agreements of most of the LLCs (consisting of substantially all of the LLCs that own MOBs in Arizona, Nevada and California), the third-party member and the Trust, at any time, have the right to make an offer (“Offering Member”) to the other member(s) (“Non-Offering Member”) in which it either agrees to: (i) sell the entire ownership interest of the Offering Member to the Non-Offering Member (“Offer to Sell”) at a price as determined by the Offering Member (“Transfer Price”), or; (ii) purchase the entire ownership interest of the Non-Offering Member (“Offer to Purchase”) at the equivalent proportionate Transfer Price. The Non-Offering Member has 60 days to either: (i) purchase the entire ownership interest of the Offering Member at the Transfer Price, or; (ii) sell its entire ownership interest to the Offering Member at the equivalent proportionate Transfer Price. The closing of the transfer must occur within 60 days of the acceptance by the Non-Offering Member; |
| • | real estate market factors, including without limitation, the supply and demand of office space and market rental rates, changes in interest rates as well as an increase in the development of medical office condominiums in certain markets; |
| • | government regulations, including changes in the reimbursement levels under the Medicare and Medicaid program resulting from, among other things, the various health care reform initiatives being implemented; |
| • | the issues facing the health care industry that affect the operators of our facilities, including UHS, such as: changes in, or the ability to comply with, existing laws and government regulations; unfavorable changes in the levels and terms of reimbursement for our charges by third party payors or government programs, including Medicare or Medicaid; demographic changes; the ability to enter into managed care provider agreements on acceptable terms; an increase in uninsured and self-pay patients which unfavorably impacts the collectibility of patient accounts; decreasing in-patient admission trends; technological and pharmaceutical improvements that may increase the cost of providing, or reduce the demand for, health care, and; the ability to attract and retain qualified medical personnel, including physicians; |
| • | three LLCs that own properties in California, in which we have various non-controlling equity interests, could not obtain earthquake insurance at rates which are economically beneficial in relation to the risks covered; |
| • | competition for our operators from other REITs; |
| • | competition from other health care providers, including physician owned facilities and other facilities owned by UHS, including, but not limited to, McAllen, Texas, the site of our largest acute care facility (McAllen Medical Center), and Wildomar, California (Inland Valley Regional Medical Center); |
| • | changes in, or inadvertent violations of, tax laws and regulations and other factors than can affect REITs and our status as a REIT; |
| • | should we be unable to comply with the strict income distribution requirements applicable to REITs, utilizing only cash generated by operating activities, we would be required to generate cash from other sources which could adversely affect our financial condition; |
| • | fluctuations in the value of our common stock, and; |
| • | other factors referenced herein or in our other filings with the Securities and Exchange Commission. |
29
Table of Contents
Given these uncertainties, risks and assumptions, you are cautioned not to place undue reliance on such forward-looking statements. Our actual results and financial condition, including the operating results of our lessees and the facilities leased to subsidiaries of UHS, could differ materially from those expressed in, or implied by, the forward-looking statements.
Forward-looking statements speak only as of the date the statements are made. We assume no obligation to publicly update any forward-looking statements to reflect actual results, changes in assumptions or changes in other factors affecting forward-looking information, except as may be required by law. All forward-looking statements attributable to us or persons acting on our behalf are expressly qualified in their entirety by this cautionary statement.
Critical Accounting Policies and Estimates
The preparation of financial statements in conformity with accounting principles generally accepted in the United States of America requires us to make estimates and assumptions that affect the amounts reported in our consolidated financial statements and accompanying notes.
A summary of our critical accounting policies is outlined in Note 1 to the consolidated financial statements. We consider our critical accounting policies to be those that require us to make significant judgments and estimates when we prepare our financial statements, including the following:
Revenue Recognition: Our revenues consist primarily of rentals received from tenants, which are comprised of minimum rent (base rentals), bonus rentals and reimbursements from tenants for their pro-rata share of expenses such as common area maintenance costs, real estate taxes and utilities.
The minimum rent for all hospital facilities is fixed over the initial term or renewal term of the respective leases. Rental income recorded by our consolidated and unconsolidated medical office buildings (“MOBs”) relating to leases in excess of one year in length, is recognized using the straight-line method under which contractual rents are recognized evenly over the lease term regardless of when payments are due. The amount of rental revenue resulting from straight-line rent adjustments is dependent on many factors including the nature and amount of any rental concessions granted to new tenants, scheduled rent increases under existing leases, as well as the acquisitions and sales of properties that have existing in-place leases with terms in excess of one year. As a result, the straight-line adjustments to rental revenue may vary from period-to-period. Bonus rents are recognized when earned based upon increases in each facility’s net revenue in excess of stipulated amounts. Bonus rentals are determined and paid each quarter based upon a computation that compares the respective facility’s current quarter’s net revenue to the corresponding quarter in the base year. Tenant reimbursements for operating expenses are accrued as revenue in the same period the related expenses are incurred.
Real Estate Investments: On the date of acquisition, the purchase price of a property is allocated to the property’s land, buildings and intangible assets based upon our estimates of their fair values. Depreciation is computed using the straight-line method over the useful lives of the buildings and capital improvements. The value of intangible assets is amortized over the remaining lease term.
Asset Impairment: Real estate investments and related intangible assets are reviewed for impairment whenever events or changes in circumstances indicate that the carrying amount of the property might not be recoverable. A property to be held and used is considered impaired only if management’s estimate of the aggregate future cash flows, less estimated capital expenditures, to be generated by the property, undiscounted and without interest charges, are less than the carrying value of the property. This estimate takes into consideration factors such as expected future operating income, trends and prospects, as well as the effects of demand, competition, local market conditions and other factors.
The determination of undiscounted cash flows requires significant estimates by management, including the expected course of action at the balance sheet date that would lead to such cash flows. Subsequent changes in
30
Table of Contents
estimated undiscounted cash flows arising from changes in anticipated action to be taken with respect to the property could impact the determination of whether an impairment exists and whether the effects could materially impact our net income. To the extent estimated undiscounted cash flows are less than the carrying value of the property, the loss will be measured as the excess of the carrying amount of the property over the fair value of the property.
Assessment of the recoverability by us of certain lease related costs must be made when we have reason to believe that a tenant might not be able to perform under the terms of the lease as originally expected. This requires us to make estimates as to the recoverability of such costs.
An other than temporary impairment of an investment in an unconsolidated joint venture is recognized when the carrying value of the investment is not considered recoverable based on evaluation of the severity and duration of the decline in value, including projected declines in cash flows. To the extent impairment has occurred, the excess carrying value of the asset over its estimated fair value is charged to income.
Investments in Limited Liability Companies (“LLCs”): Our consolidated financial statements include the consolidated accounts of our controlled investments and those investments that meet the criteria of a variable interest entity where we are the primary beneficiary. In accordance with the FASB’s standards and guidance relating to accounting for investments and real estate ventures, we account for our unconsolidated investments in LLCs which we do not control using the equity method of accounting. The third-party members in these investments have equal voting rights with regards to issues such as, but not limited to: (i) divestiture of property; (ii) annual budget approval, and; (iii) financing commitments. These investments, which represent 33% to 99% non-controlling ownership interests, are recorded initially at our cost and subsequently adjusted for our net equity in the net income, cash contributions to, and distributions from, the investments. Pursuant to certain agreements, allocations of profits and losses of some of the LLC investments may be allocated disproportionately as compared to ownership interests after specified preferred return rate thresholds have been satisfied.
At December 31, 2010, we have non-controlling equity investments or commitments in thirty-two LLCs which own medical office buildings (“MOBs”). As of December 31, 2010, we accounted for: (i) thirty-one of these LLCs on an unconsolidated basis pursuant to the equity method since they are not variable interest entities, and; (ii) one of these LLCs (Palmdale Medical Properties) on a consolidated basis, as discussed below, since it is considered to be a variable interest entity where we are the primary beneficiary by virtue of its master lease with a subsidiary of Universal Health Services, Inc. (“UHS”), a related party to us.
The majority of these LLCs are joint-ventures between us and a non-related party that manages and holds minority ownership interests in the entities. Each LLC is generally self-sustained from a cash flow perspective and generates sufficient cash flow to meet its operating cash flow requirements and service the third-party debt (if applicable) that is non-recourse to us. Although there is typically no ongoing financial support required from us to these entities since they are cash-flow sufficient, we may, from time to time, provide funding for certain purposes such as, but not limited to, significant capital expenditures and/or leasehold improvements. Although we are not obligated to do so, if approved by us at our sole discretion, additional cash fundings are typically advanced as equity or short to intermediate term loans.
Summerlin Medical Office Building III, which is located in Las Vegas, Nevada on the campus of Summerlin Hospital Medical Center (a majority-owned subsidiary of Universal Health Services, Inc.), completed construction and opened during the first quarter of 2009. In connection with this MOB, which is owned by an LLC in which we hold a majority, non-controlling ownership interest, Summerlin Hospital Medical Center committed to a master lease agreement for a specified portion of the space. As a result of this master lease agreement, the LLC was considered a variable interest entity. Since we were the primary beneficiary, the financial results of this MOB were included in our financial statements on a consolidated basis prior to January 1, 2010. During the first quarter of 2010, the master lease threshold was met and, as a result, this MOB is accounted for as an unconsolidated LLC under the equity method beginning on January 1, 2010. There was no material impact on our net income as a result of the deconsolidation of this LLC.
31
Table of Contents
Summerlin Medical Office Building II is also located in Las Vegas, Nevada on the campus of Summerlin Hospital Medical Center. In connection with this MOB, which is owned by an LLC in which we hold a majority, non-controlling ownership interest, Summerlin Hospital Medical Center committed to a master lease agreement for a specified portion of the space. As a result of this master lease agreement, the LLC was considered a variable interest entity. Since we were the primary beneficiary, the financial results of this MOB were included in our financial statements on a consolidated basis prior to October 1, 2010. During the fourth quarter of 2010, the master lease arrangement expired and, as a result, this MOB is accounted for as an unconsolidated LLC under the equity method beginning on October 1, 2010. There was no material impact on our net income as a result of the deconsolidation of this LLC.
Palmdale Medical Properties has a master lease with a subsidiary of UHS. Additionally, UHS of Delaware, a wholly-owned subsidiary of UHS, serves as advisor to us under the terms of an advisory agreement and manages our day-to-day affairs. All of our officers are officers or employees of UHS. As a result of our related-party relationship with UHS and the master lease, lease assurance or lease guarantee arrangements with subsidiaries of UHS, we account for this LLC on a consolidated basis since it is a variable interest entity and we are deemed to be the primary beneficiary.
The LLCs that we accounted for on a consolidated basis during 2010 (either entire year or partial year) are as follows:
| LLC |
Facility Name |
Non-controlling Ownership Interest |
Date of Consolidation | |||||
| 653 Town Center Phase II |
Summerlin Hospital MOB II | 98 | % | First quarter of 2004(a) | ||||
| Palmdale Medical Properties |
Palmdale Medical Plaza | 95 | % | Fourth quarter of 2007(b) | ||||
| (a) | This MOB had a master lease provision that expired on September 30, 2010; therefore, beginning in the fourth quarter of 2010, this MOB was no longer deemed a variable interest entity and is accounted for on an unconsolidated basis pursuant to the equity method. |
| (b) | This MOB was completed and opened during the third quarter of 2008. The master lease threshold on this MOB has not yet been met and is not expected to be met in the near future. |
The other LLCs in which we hold various non-controlling ownership interests are not variable interest entities and therefore are not subject to consolidation requirements.
Federal Income Taxes: No provision has been made for federal income tax purposes since we qualify as a REIT under Sections 856 to 860 of the Internal Revenue Code of 1986, and intend to continue to remain so qualified. As such, we are exempt from federal income taxes and we are required to distribute at least 90% of our real estate investment taxable income to our shareholders.
We are subject to a federal excise tax computed on a calendar year basis. The excise tax equals 4% of the amount by which 85% of our ordinary income plus 95% of any capital gain income for the calendar year exceeds cash distributions during the calendar year, as defined. No provision for excise tax has been reflected in the financial statements as no tax was due.
Earnings and profits, which determine the taxability of dividends to shareholders, will differ from net income reported for financial reporting purposes due to the differences for federal tax purposes in the cost basis of assets and in the estimated useful lives used to compute depreciation and the recording of provision for investment losses.
32
Table of Contents
Relationship with UHS and Related Party Transactions
UHS is our principal tenant and through UHS of Delaware, Inc., a wholly owned subsidiary of UHS, serves as our advisor (the “Advisor”) under an Advisory Agreement dated December 24, 1986 between the Advisor and us (the “Advisory Agreement”). Our officers are all employees of UHS and although as of December 31, 2010 we had no salaried employees, our officers do receive stock-based compensation from time-to-time.
Pursuant to the Advisory Agreement, the Advisor is obligated to present an investment program to us, to use its best efforts to obtain investments suitable for such program (although it is not obligated to present any particular investment opportunity to us), to provide administrative services to us and to conduct our day-to-day affairs. All transactions between us and UHS must be approved by the Trustees who are unaffiliated with UHS (the “Independent Trustees”). In performing its services under the Advisory Agreement, the Advisor may utilize independent professional services, including accounting, legal, tax and other services, for which the Advisor is reimbursed directly by us. The Advisory Agreement may be terminated for any reason upon sixty days written notice by us or the Advisor. The Advisory Agreement expires on December 31 of each year; however, it is renewable by us, subject to a determination by the Independent Trustees, that the Advisor’s performance has been satisfactory. In December of 2010, based upon a review of our advisory fee and other general and administrative expenses, as compared to an industry peer group, the Advisory Agreement was renewed for 2011. During 2010, the fee was increased to 0.65% (from 0.60%) of our average invested real estate assets, as derived from our consolidated balance sheet. See “Relationship with Universal Health Services, Inc.” in Item 1 and Note 2 to the consolidated financial statements for additional information on the Advisory Agreement and related fees.
The combined revenues generated from the leases on the UHS hospital facilities comprised approximately 56%, 51% and 55% of our revenues for the years ended December 31, 2010, 2009 and 2008, respectively. Including 100% of the revenues generated at the unconsolidated LLCs in which we have various non-controlling equity interests ranging from 33% to 99%, the leases on the UHS hospital facilities accounted for 19%, 20% and 21% of the combined consolidated and unconsolidated revenues for the year ended December 31, 2010, 2009 and 2008, respectively. In addition, twelve of the MOBs, owned by LLCs in which we hold various non-controlling equity interests, include or will include tenants which are subsidiaries of UHS. The leases to the hospital facilities of UHS are guaranteed by UHS and cross-defaulted with one another. For additional disclosure related to our relationship with UHS, please refer to Note 2 to the consolidated financial statements—Relationship with Universal Health Services, Inc. (“UHS”) and Related Party Transactions.
Recent Accounting Pronouncements: For a summary of recent accounting pronouncements, please see Note 1 to the Consolidated Financial Statements as included in this Annual Report on Form 10-K for the year ended December 31, 2010.
33
Table of Contents
Results of Operations
Year ended December 31, 2010 as compared to the year ended December 31, 2009:
Our Consolidated Statement of Income for the year ended December 31, 2010 includes nine months of revenue and expenses associated with Summerlin II which was deconsolidated effective October 1, 2010, as mentioned above. Our Consolidated Statement of Income for the year ended December 31, 2009 includes the revenue and expenses associated with Summerlin III and Summerlin II which were deconsolidated on January 1, 2010 and October 1, 2010, respectively, as mentioned above. The table below reflects the “As Adjusted” Statement of Income for the year ended December 31, 2009 which reflects the revenue and expense impact of the deconsolidations for the corresponding periods of 2009 thereby presenting both years on a comparable basis. There was no material impact on our net income as a result of the deconsolidation of these LLCs.
| (amounts in thousands)
Year Ended December 31, 2010 |
As reported in Consolidated Statements of Income |
Adjustments | “As Adjusted” | |||||||||
| Revenues |
$ | 28,878 | $ | — | $ | 28,878 | ||||||
| Expenses: |
||||||||||||
| Depreciation and amortization |
6,286 | — | 6,286 | |||||||||
| Advisory fee to UHS |
1,852 | — | 1,852 | |||||||||
| Other operating expenses |
5,439 | — | 5,439 | |||||||||
| 13,577 | — | 13,577 | ||||||||||
| Income before equity in limited liability companies (“LLCs”) and interest expense |
15,301 | — | 15,301 | |||||||||
| Equity in income of unconsolidated LLCs |
2,948 | — | 2,948 | |||||||||
| Interest expense |
(1,939 | ) | — | (1,939 | ) | |||||||
| Net income |
$ | 16,310 | — | $ | 16,310 | |||||||
| Year Ended December 31, 2009 |
As reported in Consolidated Statements of Income |
Combined Statements of Income for Summerlin II & III(A) |
“As Adjusted” | |||||||||
| Revenues |
$ | 31,914 | $ | 1,817 | $ | 30,097 | ||||||
| Expenses: |
||||||||||||
| Depreciation and amortization |
6,399 | 383 | 6,016 | |||||||||
| Advisory fee to UHS |
1,606 | — | 1,606 | |||||||||
| Other operating expenses |
5,977 | 699 | 5,278 | |||||||||
| 13,982 | 1,082 | 12,900 | ||||||||||
| Income before equity in limited liability companies (“LLCs”) and interest expense |
17,932 | 735 | 17,197 | |||||||||
| Equity in income of unconsolidated LLCs |
3,092 | 300 | 3,392 | |||||||||
| Interest expense |
(2,448 | ) | 435 | (2,013 | ) | |||||||
| Net income |
$ | 18,576 | — | $ | 18,576 | |||||||
| (A) | Represents the operating results for Summerlin III for the twelve-month period ended December 31, 2009 and the operating results for Summerlin II for the three-month period ended December 31, 2009. Summerlin III was deconsolidated on January 1, 2010 and Summerlin II was deconsolidated on October 1, 2010. |
34
Table of Contents
During 2010, net income was $16.3 million, or $1.33 per diluted share, as compared to $18.6 million, or $1.56 per diluted share, during 2009.
The $2.3 million decrease in net income during 2010, as compared to 2009, was primarily attributable to the following as computed on an As Adjusted basis using the tables above:
| • | a decrease of approximately $1.2 million in revenues, as discussed below; |
| • | a net decrease of $444,000 in equity in income of unconsolidated LLCs, as discussed below; |
| • | a decrease of $270,000 due to increased depreciation and amortization expense due primarily to the expense recorded in connection with capital improvements completed at certain consolidated MOBs; |
| • | a decrease of $246,000 due to an increase in the advisory fee paid to UHS (fee increased to 0.65% of average invested real estate assets during 2010 as compared to 0.60% during 2009); |
| • | a decrease of $161,000 due to an increase in other operating expenses, as discussed below, and; |
| • | an increase of $74,000 due to a decrease in interest expense resulting primarily from an decrease in the effective borrowing rate on our revolving credit facility (to 1.1% during 2010 from 1.4% during 2009), partially offset by an increase in the average outstanding borrowings (to $52.9 million during 2010 from $45.8 million during 2009). |
During 2010, total revenue decreased by $1.2 million (As Adjusted basis), as compared to 2009, resulting primarily from: (i) a $700,000 decrease due to the June, 2010 expiration of a master lease agreement on Southern Crescent II MOB located in Georgia (see additional disclosure below); (ii) a $200,000 decrease at a certain MOB located in Georgia due to decreased occupancy rates; (iii) a $175,000 decrease at a single-tenant MOB located in Las Vegas, Nevada, which was vacated during the second quarter of 2010, and; (iv) other combined net decreases of $125,000, including a $100,000 decrease in bonus rental revenue earned on the UHS hospital facilities.
During 2010, on an As Adjusted basis, equity in income of unconsolidated LLCs decreased $444,000, as compared to 2009 due primarily to: (i) a net decrease of approximately $200,000, resulting primarily from reserves established in connection with certain tenant receivables at LLCs that own MOBs in Nevada and Arizona; (ii) a net decrease of approximately $330,000 resulting from decreased income due to decreasing occupancy at a MOB located in California; (iii) a decrease of approximately $380,000 at two MOBs in Phoenix, Arizona, due in part to low occupancy levels at a MOB which was acquired in March, 2010 by an unconsolidated LLC, partially offset by; (iv) a net increase of $466,000 from other combined net favorable changes at various other unconsolidated LLCs, including approximately $250,000 from increased combined income generated at two MOBs which were completed and opened during the second quarter of 2009 and the first quarter of 2010.
During 2010, on an As Adjusted basis, other operating expenses increased $161,000 due primarily to an increase in general maintenance expenses at certain MOBs. Included in our other operating expenses are expenses related to the consolidated medical office buildings, which totaled $4.3 million during 2010 and $4.2 million during 2009 (on an As Adjusted basis in both years). A portion of the expenses associated with our consolidated medical office buildings is passed on directly to the tenants. Tenant reimbursements for operating expenses are accrued as revenue in the same period the related expenses are incurred and are included as tenant reimbursement revenue in our condensed consolidated statements of income. During 2010, $2.1 million, or 49% of the expenses related to consolidated medical office buildings were passed on directly to the tenants. During 2009, $2.9 million, or 59% of the expenses related to consolidated medical office buildings were passed on directly to the tenants. The decrease in the operating expenses passed on directly to tenants during 2010, as compared to 2009, was primarily due to building repairs and maintenance completed during 2010 which were non-reimbursable, as well as the master lease arrangement at Palmdale Medical Plaza which does not include expense reimbursement pursuant to the portion of the revenue covered by the master lease arrangement.
During 2008, we recorded an asset impairment charge of $4.6 million in connection with two medical office buildings (Southern Crescent Centers I and II) located on a medical campus in Clayton County (Riverdale),
35
Table of Contents
Georgia. This asset impairment charge was recorded after evaluation of property and location-specific factors including: (i) the future expiration of a master lease which occurred in June, 2010, and; (ii) the occupancy and projected occupancy of the buildings. As expected and previously disclosed, the master lease, which has been in effect since 2000 on Southern Crescent II (which generated approximately $1.1 million of annual revenues, net income and net cash provided by operating activities), was not renewed upon its expiration in June, 2010. The combined fair value of these properties was determined based upon the present value of their expected future cash flows. Since the master lease on Southern Crescent II was not renewed, we continue to actively market the available space in this MOB which is currently 80% vacant.
Funds from operations is a widely recognized measure of performance for Real Estate Investment Trusts (“REITs”). We believe that funds from operations (“FFO”) and funds from operations per diluted share, which are non-GAAP financial measures (“GAAP” is Generally Accepted Accounting Principles in the United States of America), are helpful to our investors as measures of our operating performance. We compute FFO in accordance with standards established by the National Association of Real Estate Investment Trusts (“NAREIT”), which may not be comparable to FFO reported by other REITs that do not compute FFO in accordance with the NAREIT definition, or that interpret the NAREIT definition differently than we interpret the definition. FFO does not represent cash generated from operating activities in accordance with GAAP and should not be considered to be an alternative to net income determined in accordance with GAAP. In addition, FFO should not be used as: (i) an indication of our financial performance determined in accordance with GAAP; (ii) an alternative to cash flow from operating activities determined in accordance with GAAP; (iii) a measure of our liquidity, or; (iv) an indicator of funds available for our cash needs, including our ability to make cash distributions to shareholders.
Below is a reconciliation of our reported net income to FFO for 2010 and 2009 (in thousands):
| 2010 | 2009 | |||||||
| Net income |
$ | 16,310 | $ | 18,576 | ||||
| Depreciation and amortization expense: |
||||||||
| Consolidated investments |
6,156 | 6,283 | ||||||
| Unconsolidated affiliates |
10,116 | 8,466 | ||||||
| Funds From Operations |
$ | 32,582 | $ | 33,325 | ||||
The $743,000 decrease in FFO during 2010, as compared to 2009, was due to the $2.3 million decrease in net income, as discussed above, partially offset by the favorable effect of adding back $1.5 million of increased depreciation and amortization expense incurred by us and our unconsolidated affiliates related to newly constructed and recently opened MOBs and capital expenditures at various other properties.
Year ended December 31, 2009 as compared to the year ended December 31, 2008:
During 2009, net income was $18.6 million, or $1.56 per diluted share, as compared to $11.7 million, or $0.98 per diluted share, during 2008.
The increase in net income of $6.9 million during 2009, as compared to 2008, was primarily attributable to:
| • | an increase of $4.6 million resulting from the provision for asset impairment recorded during 2008 on a certain medical office building complex, as discussed above; |
| • | an increase of $1.0 million resulting from an increase in equity in income of unconsolidated LLCs resulting primarily from increased income generated at several of our unconsolidated LLCs, including the effect of a favorable adjustment resulting from a change in estimate to the accrued operating expenses of a certain LLC; |
| • | an increase of approximately $250,000 resulting from an increase in bonus rentals from UHS hospital facilities; |
36
Table of Contents
| • | an increase of approximately $400,000 resulting from a decrease in interest expense incurred on our revolving credit facility resulting from a decrease in borrowing rates, partially offset by an increase in the average outstanding borrowings; |
| • | a net increase of approximately $150,000 resulting from the increased net income generated at two consolidated, newly constructed MOBs that were completed and opened during the third quarter of 2008 and first quarter of 2009, and; |
| • | other combined net increases of approximately $500,000. |
Total revenue increased approximately $2.7 million to $31.9 million during 2009 as compared to $29.2 million during 2008. The increase was primarily attributable to: (i) an increase of approximately $600,000 in revenues generated at Palmdale Medical Plaza, which opened during the third quarter of 2008; (ii) approximately $1.2 million of revenues generated at Summerlin Hospital Medical Office Building III, which opened during the first quarter of 2009; (iii) an increase of approximately $250,000 in bonus rental revenue from the UHS hospital facilities, and; (iv) an increase of approximately $650,000 in combined net favorable changes at various other consolidated MOBs.
Depreciation and amortization expense increased approximately $500,000 during 2009 as compared to 2008, due primarily to the expense recorded in connection with the above-mentioned MOBs that were completed and opened during the third quarter of 2008 and first quarter of 2009.
Interest expense, net of interest income, increased $57,000 during 2009 as compared to 2008. The net increase in interest expense was primarily due to: (i) a decrease of approximately $400,000 incurred on our revolving credit facility resulting from a decrease in borrowing rates, partially offset by an increase in the average outstanding borrowings, and; (ii) an increase of approximately $500,000 resulting from the debt associated with the Palmdale Medical Plaza and Summerlin Hospital Medical Office Building III. The increased borrowings under our revolving credit agreement were primarily attributable to the funding of investments in LLCs and additions to real estate investments.
The $800,000 increase in other operating expenses during 2009, as compared to 2008, is primarily attributable to: (i) the opening of Palmdale Medical Plaza during the third quarter of 2008; (ii) the opening of Summerlin Hospital Medical Office Building III during the first quarter of 2009, and; (iii) an increase in general maintenance expenses at various MOBs. Included in our other operating expenses are expenses related to the consolidated medical office buildings, which totaled $4.9 million (on an unadjusted basis) and $4.0 million during 2009 and 2008, respectively. A portion of the expenses associated with our consolidated medical office buildings is passed on directly to the tenants. Tenant reimbursements for operating expenses are accrued as revenue in the same period the related expenses are incurred and are included as tenant reimbursement revenue in our consolidated statements of income. During 2009, $2.9 million, or 59% of the expenses related to consolidated medical office buildings were passed on directly to the tenants. During 2008, $2.5 million, or 62% of the expenses related to consolidated medical office buildings were passed on directly to the tenants. The decrease in the percentage of operating expenses passed on directly to tenants during 2009, as compared to 2008, was primarily due to the opening of the Palmdale Medical Plaza and Summerlin Hospital MOB II during the third quarter of 2008 and first quarter of 2009, respectively, which have no expense reimbursements pursuant to the portion of revenue covered by the master lease arrangements.
During 2009 and 2008, we recorded equity in income of unconsolidated LLCs of $3.1 million and $2.1 million, respectively. The $1.0 million increase during 2009, as compared to 2008, is primarily due to increased income generated at several of our unconsolidated LLCs, including the effect of a favorable adjustment resulting from a change in estimate to the accrued operating expenses of an LLC.
Our funds from operations (“FFO”) increased $8.3 million to $33.3 million during 2009 as compared to $25.0 million during 2008. The increase was due to: (i) the $4.6 million provision for asset impairment recorded
37
Table of Contents
during 2008, as mentioned above; (ii) a favorable change of $2.0 million resulting from an increase in equity in income of unconsolidated LLCs, as discussed above, which includes the add-back of increased depreciation expense associated with these entities, and; (iii) $1.7 million of other combined net favorable changes including the a net increase of approximately $600,000 resulting from the increased net income, which includes the add-back of depreciation expense, associated with two consolidated, newly constructed MOBs that were completed and opened during the third quarter of 2008 and first quarter of 2009.
Below is a reconciliation of our reported net income to FFO for 2009 and 2008 (in thousands):
| 2009 | 2008 | |||||||
| Net income |
$ | 18,576 | $ | 11,653 | ||||
| Depreciation and amortization expense: |
||||||||
| Consolidated investments |
6,283 | 5,832 | ||||||
| Unconsolidated affiliates |
8,466 | 7,511 | ||||||
| Funds From Operations |
$ | 33,325 | $ | 24,996 | ||||
Effects of Inflation
Inflation has not had a material impact on our results of operations over the last three years. However, since the healthcare industry is very labor intensive and salaries and benefits are subject to inflationary pressures, as are supply and other costs, we and the operators of our hospital facilities cannot predict the impact that future economic conditions may have on our/their ability to contain future expense increases. Depending on general economic and labor market conditions, the operators of our hospital facilities may experience unfavorable labor market conditions, including a shortage of nurses which may cause an increase in salaries, wages and benefits expense in excess of the inflation rate. Their ability to pass on increased costs associated with providing healthcare to Medicare and Medicaid patients is limited due to various federal, state and local law which have been enacted that, in certain cases, limit their ability to increase prices. Therefore, there can be no assurance that these factors will not have a material adverse effect on the future results of operations of the operators of our facilities which may affect their ability to make lease payments to us.
Most of our leases contain provisions designed to mitigate the adverse impact of inflation. Our hospital leases require all building operating expenses, including maintenance, real estate taxes and other costs, to be paid by the lessee. In addition, certain of the hospital leases contain bonus rental provisions, which require the lessee to pay additional rent to us based on increases in the revenues of the facility over a base year amount. In addition, most of our MOB leases require the tenant to pay an allocable share of operating expenses, including common area maintenance costs, insurance and real estate taxes. These provisions may reduce our exposure to increases in operating costs resulting from inflation. To the extent that some leases do not contain such provisions, our future operating results may be adversely impacted by the effects of inflation.
Liquidity and Capital Resources
Year ended December 31, 2010 as compared to December 31, 2009:
Net cash provided by operating activities
Net cash provided by operating activities was $23.0 million during 2010 as compared to $25.0 million during 2009. The $2.0 million decrease was attributable to:
| • | an unfavorable change of $2.3 million due to a decrease in net income plus the adjustments to reconcile net income to net cash provided by operating activities (depreciation and amortization and restricted/stock-based compensation) as discussed above in Results of Operations; |
| • | a favorable change of $503,000 in accrued expenses and other liabilities; |
| • | a favorable change of $150,000 in rent receivable; |
38
Table of Contents
| • | an unfavorable change of $254,000 in tenant reserves, escrows, deposits and prepaid rents related primarily to decreases in prepaid rents and deposits at certain MOBs; |
| • | a favorable change of $97,000 in accrued interest, and; |
| • | other combined net unfavorable changes of $109,000. |
The $503,000 favorable change in accrued expenses and other liabilities resulted from: (i) an increase in property taxes accrued at certain MOBs, and; (ii) an increase in accrued payables at a certain MOB relating to building maintenance and general repairs.
Net cash used in investing activities
Net cash used in investing activities was $17.3 million during 2010 as compared to $12.4 million during 2009.
2010:
During 2010, we used $17.3 million of net cash in investing activities as follows:
| • | We spent $15.6 million to fund equity investments in unconsolidated LLCs as follows: |
| • | $3.0 million invested in the LLC that owns the Suburban Medical Plaza II, in which we have a 33% non-controlling equity interest; |
| • | $2.6 million invested in the LLC that owns the Auburn Medical Office Building II, in which we have a 95% non-controlling equity interest; |
| • | $1.9 million invested in the LLC that owns the Deer Valley Medical Office Building III, in which we have a 95% non-controlling equity interest; |
| • | $1.8 million invested in the LLC that purchased the North Valley Medical Plaza, in which we have a 95% non-controlling equity interest; |
| • | $1.3 million invested in the LLC that owns the BRB Medical Office Building, in which we have a 95% non-controlling equity interest; |
| • | $1.0 million invested in the master LLC which governs four unconsolidated LLCs, in which we have a 90% non- controlling equity interest; |
| • | $850,000 invested in the LLC that owns the Centennial Hills Medical Office Building, in which we have a 95% non-controlling equity interest; |
| • | $685,000 invested in the LLC that owns the Summerlin Hospital MOB III, in which we have a 95% non-controlling equity interest; |
| • | $494,000 invested in the LLC that owns the Desert Samaritan Hospital MOBs, in which we have a 76% non-controlling equity interest; |
| • | $470,000 invested in the LLC that owns the Vista Medical Terrace and the Sparks Medical Building, in which we have a 95% non-controlling equity interest; |
| • | $454,000 invested in the LLC that owns the Spring Valley Hospital Medical Office Building II, in which we have a 95% non-controlling equity interest, and; |
| • | $1.0 million invested in various other LLCs, in which we own a non-controlling equity interest. |
| • | We spent $9.5 million to fund advances to unconsolidated LLCs as follows: |
| • | $3.8 million advance made to an LLC that acquired the North Valley Medical Plaza, in which we have a 95% non-controlling equity interest; |
39
Table of Contents
| • | $2.6 million advance made to an LLC that owns the Centennial Hills Medical Office Building, in which we have a 95% non-controlling equity interest; |
| • | $1.5 million advance made to an LLC that owns the Vista Medical Terrace and the Sparks Medical Building, in which we have a 95% non-controlling equity interest; |
| • | $1.3 million advance made to an LLC that owns the Sierra San Antonio Medical Plaza, in which we have a 95% non-controlling equity interest; |
| • | $192,000 advance made to an LLC that owns Deer Valley Medical Office Building III, in which we have a 95% non-controlling equity interest, and; |
| • | $142,000 advance made to an LLC that owns the Deer Valley Medical Office II, in which we have a 90% non-controlling equity interest. |
| • | We spent $969,000 on additions to real estate investments as follows: |
| • | $502,000 funded for refurbishments of a certain MOB; |
| • | $337,000 funded for building refurbishments and tenant improvements at a certain MOB, and; |
| • | $130,000 funded for other capital improvements |
Additionally, the cash balance reflected on our Consolidated Balance Sheet as of December 31, 2010 was reduced by $2.1 million resulting from the above-mentioned deconsolidation of Summerlin Hospital Medical Office Building III on January 1, 2010 and the deconsolidation of Summerlin Hospital Medical Office Building II on October 1, 2010. This amount represents the aggregate cash balances for both entities as of the respective dates of deconsolidation.
| • | We received $6.9 million of cash proceeds in connection with refinancing of third-party debt by unconsolidated LLCs as follows: |
| • | $4.1 million received from the LLC that owns the Summerlin Hospital Medical Office Building II, in which we have a 98% non-controlling equity interest; |
| • | $2.5 million received from the LLC that owns the Deer Valley Medical Office II, in which we have a 90% non-controlling equity interest; |
| • | $221,000 received from the LLC that owns Deer Valley Medical Office Building III, in which we have a 95% non-controlling equity interest, and; |
| • | $29,000 received from the LLC that owns the Phoenix Children’s East Valley Care Center, in which we have a 95% non-controlling equity interest. |
| • | We received $3.4 million of cash distributions in excess of income related to our unconsolidated LLCs ($6.3 million of cash distributions received less $2.9 million of equity in income of unconsolidated LLCs). |
| • | We received $604,000 in repayments of advances previously provided to unconsolidated LLCs. |
2009:
During 2009, we used $12.4 million of net cash in investing activities as follows:
| • | We spent $11.0 million to fund equity investments in unconsolidated LLCs as follows: |
| • | $3.5 million invested in the LLC that owns the Deer Valley Medical Office Building III, in which we have a 95% non-controlling equity interest; |
| • | $1.9 million invested in the LLC that owns the Auburn Medical Office Building II, in which we have a 95% non-controlling equity interest; |
40
Table of Contents
| • | $1.4 million invested in the LLC that owns the Centennial Hills Medical Office Building in which we have a 95% non-controlling equity interest; |
| • | $1.4 million invested in the master LLC which governs four unconsolidated LLCs in which we have a 90% non- controlling equity interest; |
| • | $736,000 invested in the LLC that owns the Vista Medical Terrace and the Sparks Medical Building in which we have a 95% non-controlling equity interest; |
| • | $707,000 invested in the LLC that owns the Spring Valley Hospital Medical Office Building II in which we have a 95% non-controlling equity interest; |
| • | $610,000 invested in the LLC that owns the BRB Medical Office Building in which we have a 95% non-controlling equity interest, and; |
| • | $762,000 invested in various other LLCs in which we own a non-controlling equity interest. |
| • | We spent $6.9 million on additions to real estate investments as follows: |
| • | $2.6 million funded to complete construction on the Summerlin Hospital Medical Office Building III, which was completed and opened during the first quarter of 2009; |
| • | $1.9 million funded to complete construction on the Palmdale Medical Plaza which opened during the third quarter of 2008; |
| • | $1.5 million funded for refurbishments of an MOB that were completed during the first quarter of 2010; |
| • | $400,000 funded for tenant improvements at an MOB, and; |
| • | $500,000 in other capital additions. |
| • | We spent $2.1 million to fund advances to unconsolidated LLCs as follows: |
| • | $1.0 million advance made to an LLC that owns the Desert Samaritan Hospital MOBs located in Mesa, Arizona, in which we have a 76% non-controlling equity interest, none of which has been repaid at December 31, 2010; |
| • | $529,000 advance made to an LLC that owns the Texoma Medical Plaza located in Denison, Texas, in which we have a 95% non-controlling equity interest, all of which was repaid at December 31, 2009; |
| • | $467,000 advanced to an LLC that owns the Sierra San Antonio Medical Plaza in which we have a 95% non-controlling equity interest, none of which has been repaid at December 31, 2010, and; |
| • | $146,000 advanced made to an LLC that owns the Mid Coast Hospital MOB located in Brunswick, Maine, in which we have a 74% non-controlling equity interest, $125,000 of which has been repaid at December 31, 2010. |
| • | We received $2.8 million of cash proceeds in connection with refinancing of third-party debt by unconsolidated LLCs as follows: |
| • | $2.6 million received from the LLC that owns the Summerlin Hospital Medical Office Building, in which we have a 95% non-controlling equity interest, and; |
| • | $229,000 received from the LLC that owns the Phoenix Children’s East Valley Care Center, in which we have a 95% non-controlling equity interest. |
| • | We received $4.1 million of cash distributions in excess of income related to our unconsolidated LLCs ($7.2 million of cash distributions received less $3.1 million of equity in income of unconsolidated LLCs). |
| • | We received $781,000 in repayments of advances previously provided to unconsolidated LLCs. |
41
Table of Contents
Net cash used in financing activities
Net cash used in financing activities was $7.8 million during 2010 as compared to $10.2 million during 2009.
During 2010, we received: (i) $3.8 million of additional net borrowings on our revolving line of credit; (ii) received $5.3 million of proceeds related to a new mortgage note payable, that is non-recourse to us, related to a consolidated MOB, and; (iii) generated $17.8 million of net cash from the issuance of shares of beneficial interest, $17.6 million of which related to our at-the-market equity issuance program (as discussed below) and approximately $200,000 of which was related to our dividend reinvestment program. Additionally, during 2010, we paid: (i) $3.5 million on mortgage notes payable that are non-recourse to us (representing the pay-off of a mortgage note payable that was refinanced during 2010 resulting in the $5.3 million of proceeds, as mentioned above); (ii) $191,000 on mortgage notes payable of a consolidated LLC that are non-recourse to us; (iii) $529,000 on a loan payable of a consolidated LLC that is non-recourse to us; (iv) $398,000 of financing costs on mortgage notes payable that are non-recourse to us; (v) $134,000 as settlement of accrued dividend equivalent rights, as discussed below, and; (vi) $29.9 million of dividends.
During the fourth quarter of 2009, we commenced an at-the-market (“ATM”) equity issuance program pursuant to the terms of which we may sell, from time-to-time, common shares of our beneficial interest up to an aggregate sales price of $50 million to or through Merrill Lynch, Pierce, Fenner and Smith Incorporated, as sales agent and/or principal. Pursuant to this ATM program, we issued 184,600 shares at an average price of $31.28 per share during the fourth quarter of 2009 which generated approximately $5.3 million of net cash proceeds (net of approximately $440,000 consisting of compensation of approximately $175,000 to Merrill Lynch as well as approximately $265,000 of various other fees and expenses). During 2010 we issued 548,900 shares under this ATM program at an average price of $33.44 per share, which generated approximately $17.6 million of net cash proceeds (net of approximately $800,000 consisting of compensation of $550,000 to Merrill Lynch as well as approximately $250,000 of other various fees and expenses). Since inception of this program, we have issued 733,500 shares at an average price of $32.90 per share, which generated approximately $22.9 million of net cash proceeds (net of approximately $1.2 million, consisting of compensation of $725,000 to Merrill Lynch as well as approximately $515,000 of various other fees and expenses).
During 2009, we received: (i) $9.8 million of net borrowings on our revolving line of credit; (ii) $3.2 million of additional net borrowings from other loans payable of consolidated LLCs that are non-recourse to us; (iii) $5.9 million, net of expenses, from the issuance of shares of beneficial interest, $5.3 million of which related to our equity issuance program (as discussed above) and the majority of the remaining $600,000 was related to our dividend reinvestment program; (iv) $51,000 of capital contributions from non-controlling interests. Additionally, during 2009, we paid: (i) $215,000 on mortgage notes payable that are non-recourse to us; (ii) $346,000 as settlement of accrued dividend equivalent rights, as discussed below; (iii) $237,000 of repayments on mortgage notes payable of consolidated LLCs, and; (iv) $28.4 million of dividends.
Year ended December 31, 2009 as compared to December 31, 2008:
Net cash provided by operating activities
Net cash provided by operating activities was $25.0 million during 2009 as compared to $21.8 million during 2008. The $3.2 million increase was attributable to:
| • | a favorable change of $2.9 million due to an increase in net income plus the adjustments to reconcile net income to net cash provided by operating activities (depreciation and amortization, restricted/stock-based compensation and provision for asset impairment). This increase was primarily due to: (i) an increase of $1.0 million in our equity in income of LLCs, as discussed above in Results of Operations; (ii) a $400,000 decrease in interest expense on our revolving credit facility, as discussed above; (iii) an increase of approximately $250,000, resulting from an increase in bonus rental from the UHS hospital |
42
Table of Contents
| facilities; (iv) a net increase of approximately $600,000 resulting from the increased net income, which includes the add-back of depreciation expense, associated with two consolidated, newly constructed MOBs that were completed and opened during the third quarter of 2008 and first quarter of 2009, and; (v) other combined net favorable changes of approximately $650,000. |
| • | a favorable change of approximately $1.1 million in rent receivable primarily resulting from the timing of base rental payments from UHS; |
| • | an unfavorable change of $477,000 in accrued expenses and other liabilities, as discussed below, and; |
| • | other combined unfavorable changes of approximately $300,000. |
The $477,000 unfavorable change in accrued expenses and other liabilities resulted primarily from the partial settlement of accrued dividend equivalent rights (“DERs”) during 2009, partially offset by various other net favorable changes. In order to meet certain recent changes in tax law requirements, the current payment of DERs will be made in the years in which dividends are declared and paid, or, if later, when the DERs become vested. DERs that were accrued as of December 31, 2008 with respect to previously vested DERs, were paid in January, 2009. DERs that were accrued as of December 31, 2009, with respect to vested DERs, were paid in December, 2009.
Net cash used in investing activities
Net cash used in investing activities was $12.4 million during 2009, as discussed above, as compared to $26.9 million during 2008.
2008:
During 2008, we used $26.9 million of net cash in investing activities as follows:
| • | We spent $13.8 million on additions to real estate investments as follows: |
| • | $9.8 million funded at a consolidated LLC that constructed the Summerlin Hospital Medical Office Building III, which was completed and opened during the first quarter of 2009; |
| • | $3.9 million funded to complete construction on the Palmdale Medical Plaza which opened during the third quarter of 2008, and; |
| • | $100,000 in other capital additions. |
| • | We spent $7.2 million to fund equity investments in unconsolidated LLCs as follows: |
| • | $2.3 million invested for a 95% non-controlling ownership interest in the LLC that purchased the Vista Medical Terrace and the Sparks Medical Building, located in Sparks, Nevada; |
| • | $1.3 million invested in the LLC that owns the Deer Valley Medical Office Building III, in which we have a 95% non-controlling equity interest; |
| • | $1.2 million invested in the LLC that owns the Centennial Hills Medical Office Building I, in which we have a 95% non-controlling equity interest; |
| • | $720,000 invested in the master LLC which governs four unconsolidated LLCs in which we have a 90% non- controlling equity interest; |
| • | $658,000 invested in the LLC that owns the Deer Valley Medical Office Building II in which we have a 90% non-controlling equity interest, and; |
| • | $938,000 invested to various LLCs in which we own a non-controlling equity interest. |
| • | We spent $4.7 million on the acquisition of Kindred Hospital-Corpus Christi, during the first quarter of 2008. |
43
Table of Contents
| • | We spent $4.0 million as an advance to our third-party partners, as discussed below. |
| • | We spent $3.1 million to fund advances to unconsolidated LLCs as follows: |
| • | $1.6 million advance made to an LLC that owns Sierra San Antonio Medical Plaza located in Fontana, California, in which we have a 95% non-controlling equity interest; |
| • | $1.0 million advance made to an LLC that owns the Desert Samaritan Hospital MOBs located in Mesa, Arizona, in which we have a 76% non-controlling equity interest, and; |
| • | $540,000 advance made to an LLC that owns the Mid Coast Hospital MOB located in Brunswick, Maine, in which we have a 74% non-controlling equity interest. |
| • | We received $2.5 million of cash proceeds in connection with refinancing of third-party debt by unconsolidated LLCs as follows: |
| • | $1.3 million received from the LLC that owns the Papago Medical Park, in which we have a 89% non-controlling equity interest, and; |
| • | $1.2 million received from the LLC that owns the Canyon Spring Medical Plaza, in which we have a 95% non-controlling equity interest. |
| • | We received $3.1 million of cash distributions in excess of income related to our unconsolidated LLCs. |
| • | We received $232,000 in repayments of advances previously provided to unconsolidated LLCs. |
During 2008, we advanced $4.0 million to our third-party partners in a certain LLC in connection with a $4.0 million loan agreement. Interest on this non-amortizing loan is paid to us on a quarterly basis. The interest rate on this loan will be: (i) 4.25% plus LIBOR, or; (ii) if information to determine LIBOR is not available, three hundred seventy-five basis points over the then existing borrowing cost. The loan has a stated maturity date of 2012, although it may be prepaid without penalty and is secured by various forms of collateral, including personal guarantees from each of the partners to the loan, as well as their ownership interest in the LLC. Interest on this loan agreement has been paid to us through December 31, 2010.
Net cash (used in) provided by financing activities
Net cash (used in) provided by financing activities was ($10.2 million) during 2009, as discussed above, and $4.6 million during 2008.
During 2008, we had $4.6 million of net cash provided by financing activities as follows: (i) borrowed $22.2 million, net of repayments, on our revolving line of credit; (ii) paid $27.7 million in dividends; (iii) borrowed $9.9 million pursuant to term and construction loans payable of consolidated LLCs that are non-recourse to us; (iv) borrowed $68,000, net of repayments, from a third-party partner; (v) repaid $218,000 of mortgage notes payable of a consolidated LLC that is non-recourse to us; (vi) repaid $189,000 of mortgage notes payable that is non-recourse to us; (vii) received $73,000 of capital contributions from non-controlling interests, and; (viii) generated $529,000 from the issuance of shares of beneficial interest from our dividend reinvestment plan.
Additional cash flow and dividends paid information for 2010, 2009 and 2008:
As indicated on our consolidated statements of cash flows, we generated net cash provided by operating activities of $23.1 million during 2010, $25.0 million during 2009 and $21.8 million during 2008. As also indicated on our statements of cash flows, noncash expenses such as depreciation and amortization expense, restricted/stock-based compensation expense and provision for asset impairment are the primary differences between our net income and net cash provided by operating activities for each year. In addition, as reflected in the cash flows from investing activities section, we received $3.4 million during 2010, $4.1 million during 2009 and $3.1 million during 2008, of cash distributions in excess of income from various unconsolidated LLCs which represent our share of the operating cash flow distributions from these entities. These cash distributions in excess of income represent operating cash flows net of capital expenditures and debt repayments made by the LLCs.
44
Table of Contents
We generated $26.5 million during 2010, $29.1 million during 2009 and $24.9 million during 2008 related to the operating activities of our properties recorded on a consolidated and an unconsolidated basis. We paid dividends of $29.9 million during 2010, $28.4 million during 2009 and $27.7 million during 2008. The $3.4 million difference between the $26.5 million of net cash generated related to operating activities during 2010 and the $29.9 million of dividends paid, was due primarily to certain factors, as discussed above in Results of Operations, that had an unfavorable impact on our operating results during the year ended December 31, 2010. The $2.8 million difference between the $24.9 million of net cash generated related to operating activities during 2008 and the $27.7 million of dividends paid, was due primarily to an asset impairment charge of $4.6 million, as discussed above in Results of Operations.
As indicated in the cash flows from investing activities and cash flows from financing activities sections of the statements of cash flows, there were various other sources and uses of cash during each of the last three years. Therefore, the funding source for our dividend payments is not wholly dependent on the operating cash flow generated by our properties in any given period. Rather, our dividends, as well as our capital reinvestments into our existing properties, acquisitions of real property and other investments are funded based upon the aggregate net cash inflows or outflows from all sources and uses of cash from the properties we own either in whole or through LLCs, as outlined above.
In determining and monitoring our dividend level on a quarterly basis, our management and Board of Trustees consider many factors in determining the amount of dividends to be paid each period. These considerations primarily include: (i) the minimum required amount of dividends to be paid in order to maintain our REIT status; (ii) the current and projected operating results of our properties, including those owned in LLCs, and; (iii) our future capital commitments and debt repayments, including those of our LLCs. Based upon the information discussed above, as well as consideration of projections and forecasts of our future operating cash flows, management and the Board of Trustees have determined that our operating cash flows have been sufficient to fund our dividend payments. Future dividend levels will be determined based upon the factors outlined above with consideration given to the potential impact that the operating pressures experienced during 2010 may have on our future results of operations, as well as the potential impact of anticipated improved operating results at certain of our properties that are either relatively newly constructed and opened or currently experiencing greater than expected vacancy rates.
Included in the various sources of cash were: (i) funds generated from the repayments of advances made from us to LLCs ($604,000 in 2010, $781,000 in 2009 and $232,000 in 2008); (ii) cash distributions of refinancing proceeds from LLCs ($6.9 million in 2010, $2.8 million in 2009 and $2.5 million in 2008); (iii) net borrowings from mortgage, construction and third-party partners and other loans payable of consolidated MOBs and LLCs, net of financing costs ($604,000 during 2010, $2.8 million during 2009 and $9.6 million during 2008); (iv) net borrowings on our revolving credit agreement ($3.8 million during 2010, $9.8 million in 2009 and $22.2 million in 2008), and; (v) issuance of shares of beneficial interest ($17.8 million during 2010, $5.9 million in 2009 and $500,000 in 2008).
In addition to the dividends paid, the following were also included in the various uses of cash: (i) investments in LLCs ($15.6 million during 2010, $11.0 million in 2009 and $7.2 million in 2008); (ii) advances made to LLCs/third-party partners ($9.5 million in 2010, $2.1 million in 2009 and $7.1 million in 2008), and; (iii) additions to real estate investments and acquisition of real property ($969,000 in 2010, $6.9 million in 2009 and $18.5 million in 2008).
We expect to finance all capital expenditures and acquisitions and pay dividends utilizing internally generated and additional funds. Additional funds may be obtained through: (i) the issuance of equity pursuant to our at-the-market equity issuance program; (ii) borrowings under our existing revolving credit facility or through refinancing the existing revolving credit agreement; (iii) borrowings under or refinancing of existing third-party debt pursuant to mortgage and construction loan agreements entered into by our LLCs, and/or; (iv) the issuance of other long-term debt.
45
Table of Contents
There can be no assurance that such additional funds will be available in the preferred amounts or from the preferred sources. We believe that our net cash provided by operations will be sufficient to allow us to make distributions necessary to enable us to continue to qualify as a REIT under Sections 856 to 860 of the Internal Revenue Code of 1986.
Credit facilities and mortgage debt
In January 2007, we entered into an unsecured $100 million revolving credit agreement (the “Agreement”) which expires on January 19, 2012. We have a one-time option, which can be exercised at any time, subject to bank approval, to increase the amount by $50 million for a total commitment of $150 million. The Agreement provides for interest at our option, at the Eurodollar rate plus 0.75% to 1.125%, or the prime rate plus zero to .125%. A fee of 0.15% to 0.225% is paid on the unused portion of the commitment. The margins over the Eurodollar, prime rate and the commitment fee are based upon our debt to total capital ratio as defined by the Agreement. As of December 31, 2010, the applicable margin over the Eurodollar rate was 0.75%, the margin over the prime rate was zero, and the commitment fee was 0.15%.
At December 31, 2010, we had $52.6 million of outstanding borrowings and $18.9 million of letters of credit outstanding against the Agreement. We had $28.5 million of available borrowing capacity, net of the outstanding borrowings and letters of credit outstanding as of December 31, 2010. There are no compensating balance requirements. The average amounts outstanding under our revolving credit agreement were $52.9 million in 2010, $45.8 million in 2009, and $27.0 million in 2008 with corresponding effective interest rates, including commitment fees of 1.1% in 2010, 1.4% in 2009, and 3.9% in 2008. The carrying amount and fair value of borrowings outstanding pursuant to our revolving credit agreement were $52.6 million and $50.9 million, respectively, at December 31, 2010.
Covenants relating to the Agreement require the maintenance of a minimum tangible net worth and specified financial ratios, limit our ability to incur additional debt, limit the aggregate amount of mortgage receivables and limit our ability to increase dividends in excess of 95% of cash available for distribution, unless additional distributions are required to comply with the applicable section of the Internal Revenue Code and related regulations governing real estate investment trusts. We were in compliance with all of the covenants as of and for the year ended December 31, 2010. We also believe that we would remain in compliance if the full amount of our commitment was borrowed.
The following table includes a summary of the required compliance ratios (dollar amounts in thousands):
| Covenant | December 31, 2010 |
|||||||
| Tangible net worth |
>$ | 136,450 | $ | 145,510 | ||||
| Debt to total capital(A) |
< 55 | % | 27 | % | ||||
| Debt service coverage ratio(A) |
> 1.25x | 3.86x | ||||||
| Debt to cash flow ratio(A) |
< 3.50x | 1.58x | ||||||
| (A) | Excludes third-party debt that is non-recourse to us and related debt service. |
46
Table of Contents
We have three mortgages, all of which are non-recourse to us, included on our consolidated balance sheet as of December 31, 2010, with a combined outstanding balance of $15.0 million. The following table summarizes our outstanding mortgage loans at December 31, 2010 (amounts in thousands):
| Facility Name |
Outstanding Balance (in thousands) |
Interest Rate |
Maturity Date |
|||||||||
| Medical Center of Western Connecticut fixed rate mortgage loan(a) |
$ | 5,202 | 6.00 | % | 2017 | |||||||
| Kindred Hospital-Corpus Christi fixed rate mortgage loan(a) |
3,197 | 6.50 | % | 2019 | ||||||||
| Palmdale Medical Plaza mortgage loan |
6,564 | 5.10 | % | 2013 | ||||||||
| Total |
$ | 14,963 | ||||||||||
| (a) | Amortized principal payments made on a monthly basis. |
The following table summarizes the schedule maturities of our outstanding borrowing under our revolving credit facility, the outstanding mortgages and term loan applicable to our properties recorded on a consolidated basis and our other contractual obligations as of December 31, 2010 (amounts in thousands):
| Payments Due by Period (dollars in thousands) | ||||||||||||||||||||
| Debt and Contractual Obligation |
Total | Less than 1 Year | 1-3 years | 3-5 years | More than 5 years |
|||||||||||||||
| Long-term debt—fixed(a): |
||||||||||||||||||||
| Medical Center of Western Connecticut mortgage loan |
$ | 5,202 | $ | 95 | $ | 208 | $ | 236 | $ | 4,663 | ||||||||||
| Kindred Hospital-Corpus Christi mortgage loan |
3,197 | 67 | 147 | 167 | 2,816 | |||||||||||||||
| Palmdale Medical Plaza mortgage loan |
6,564 | 184 | 6,380 | — | — | |||||||||||||||
| Subtotal long-term debt fixed |
14,963 | 346 | 6,735 | 403 | 7,479 | |||||||||||||||
| Long-term debt-variable(b) |
52,600 | — | 52,600 | — | — | |||||||||||||||
| Estimated future interest payments on debt outstanding as of December 31, 2010(c) |
4,919 | 1,386 | 1,539 | 960 | 1,034 | |||||||||||||||
| Equity and debt financing commitments(d) |
20,146 | 20,146 | — | — | — | |||||||||||||||
| Total contractual obligations |
$ | 92,628 | $ | 21,878 | $ | 60,874 | $ | 1,363 | $ | 8,513 | ||||||||||
| (a) | The mortgages are secured by the real property of the buildings as well as property leases and rents. The mortgages and other loans, which are non-recourse to us, have a combined fair value of approximately $15.3 million as of December 31, 2010. Changes in market rates on our fixed rate debt impacts the fair value of debt, but it has no impact on interest incurred or cash flow. Excludes $271.7 million of combined third-party debt outstanding as of December 31, 2010, that is non-recourse to us, at the unconsolidated LLCs in which we hold various non-controlling ownership interests (see Note 8 to the consolidated financial statements). |
| (b) | Consists of $52.6 million of borrowings outstanding as of December 31, 2010 under the terms of our $100 million revolving credit agreement which matures of January 19, 2012. |
| (c) | Assumes that all debt outstanding as of December 31, 2010, including borrowings under the revolving credit agreement, three mortgage notes payable and two term loans, which are non-recourse to us, remain outstanding until the stated maturity date of the debt agreements at the same interest rates which were in effect as of December 31, 2010. We have the right to repay borrowings under the revolving credit agreement and term loans at any time during the terms of the agreements, without penalty. Interest payments are expected to be paid utilizing cash flows from operating activities or borrowings under our revolving credit facility. |
47
Table of Contents
| (d) | As of December 31, 2010, we have equity investment and debt financing commitments remaining in connection with our investments in various LLCs. As of December 31, 2010, we had outstanding letters of credit amounting to $18.9 million which secured the majority of these equity and debt financing commitments. The $28.5 million of available borrowing capacity as of December 31, 2010, pursuant to the terms of our revolving credit facility, is net of the $18.9 million of standby letters of credit outstanding at that time. Our remaining financing commitments are as follows (in thousands): |
| Amount | ||||
| Arlington Medical Properties |
$ | 1,157 | ||
| Palmdale Medical Properties |
3,829 | |||
| Spring Valley Medical Properties II |
1,208 | |||
| Centennial Hills Medical Properties |
1,914 | |||
| Banburry Medical Properties |
4,263 | |||
| Sparks Medical Properties |
1,352 | |||
| Grayson Properties |
4,496 | |||
| Auburn Medical Properties |
218 | |||
| BRB/E Building One |
1,067 | |||
| 3811 Bell Medical Properties |
642 | |||
| Total |
$ | 20,146 | ||
2010 Acquisition
During March of 2010, we invested $5.1 million in debt financing and equity for a 95% non-controlling ownership interest in an LLC (3811 Bell Medical Properties) that purchased the North Valley Medical Plaza, a medical office building located in Phoenix, Arizona.
Off Balance Sheet Arrangements
As of December 31, 2010, we are party to certain off balance sheet arrangements consisting of standby letters of credit and equity and debt financing commitments as detailed on the above “Contractual Obligations” table. Our outstanding letters of credit at December 31, 2010 totaled $18.9 million consisting of: (i) $4.4 million related to Grayson Properties; (ii) $4.1 million related to Banburry Medical Properties; (iii) $2.8 million related to Centennial Hills Medical Properties; (iv) $2.4 million related to Palmdale Medical Properties; (v) $1.3 million related to Sparks Medical Properties; (vi) $908,000 related to Sierra Medical Properties; (vii) $869,000 related to BRB/E Building One; (viii) $764,000 related to Deerval Properties II; (ix) $578,000 related to Auburn Medical Properties; (x) $478,000 related to Arlington Medical Properties; and (xi) $396,000 related to Deerval Properties.
| ITEM 7A. | Quantitative and Qualitative Disclosures About Market Risk |
Market Risks Associated with Financial Instruments
As of December 31, 2010, 2009, and 2008, we had no outstanding interest rate swap agreements.
The sensitivity analysis related to our fixed-rate debt assumes an immediate 100 basis point move in interest rates from their 2010 levels, with all other variables held constant. A 100 basis point increase in market interest rates would result in a decrease in the fair value of our fixed-rate debt by approximately $612,000. A 100 basis point decrease in market interest rates would result in an increase in the fair value of our fixed-rate debt by approximately $647,000. The carrying value of amounts borrowed approximates fair value.
48
Table of Contents
The table below presents information about our financial instruments that are sensitive to changes in interest rates, including debt obligations as of December 31, 2010. For debt obligations, the table presents principal cash flows and related weighted average interest rates by contractual maturity dates.
| Maturity Date, Year Ending December 31 | ||||||||||||||||||||||||||||
| (Dollars in thousands) |
2011 | 2012 | 2013 | 2014 | 2015 | Thereafter | Total | |||||||||||||||||||||
| Long-term debt: |
||||||||||||||||||||||||||||
| Fixed rate(a) |
$ | 346 | $ | 365 | $ | 6,370 | $ | 195 | $ | 208 | $ | 7,479 | $ | 14,963 | ||||||||||||||
| Weighted average interest rates |
5.7 | % | 5.8 | % | 4.8 | % | 6.3 | % | 6.2 | % | 5.3 | % | 5.7 | % | ||||||||||||||
| Variable rate long-term debt (b) |
$ | — | $ | 52,600 | $ | — | $ | — | $ | — | $ | — | $ | 52,600 | ||||||||||||||
| Weighted average interest rates |
1.02 | % | 1.00 | % | — | — | — | — | 1.01 | % | ||||||||||||||||||
| (a) | Consists of non-recourse mortgage notes payable. |
| (b) | Consists of $52.6 million of outstanding borrowings under the terms of our $100 million revolving credit agreement as amended in January of 2007. |
| ITEM 8. | Financial Statements and Supplementary Data |
Our Consolidated Balance Sheets, Consolidated Statements of Income, Shareholders’ Equity and Cash Flows, together with the report of KPMG LLP, an independent registered public accounting firm, are included elsewhere herein. Reference is made to the “Index to Financial Statements and Schedule.”
| ITEM 9. | Changes in and Disagreements With Accountants on Accounting and Financial Disclosure |
None.
| ITEM 9A. | Controls and Procedures |
Conclusion Regarding the Effectiveness of Disclosure Controls and Procedures
As of December 31, 2010, under the supervision and with the participation of our management, including our Chief Executive Officer (“CEO”) and Chief Financial Officer (“CFO”), we performed an evaluation of the effectiveness of our disclosure controls and procedures as defined in Rule 13a-15(e) or Rule 15d-15(e) under the Securities and Exchange Act of 1934, as amended (the “1934 Act”). Based on this evaluation, the CEO and CFO have concluded that our disclosure controls and procedures are effective to ensure that material information is recorded, processed, summarized and reported by management on a timely basis in order to comply with our disclosure obligations under the Securities and Exchange Act of 1934 and the SEC rules thereunder.
Changes in Internal Control Over Financial Reporting
There have been no changes in our internal control over financial reporting or in other factors during the fourth quarter of 2010 that have materially affected, or are reasonably likely to materially affect, our internal control over financial reporting.
Management’s Report on Internal Control Over Financial Reporting
Management is responsible for establishing and maintaining an adequate system of internal control over our financial reporting. In order to evaluate the effectiveness of internal control over financial reporting, as required by Section 404 of the Sarbanes-Oxley Act, management has conducted an assessment, including testing, using the criteria in Internal Control—Integrated Framework, issued by the Committee of Sponsoring Organizations of the Treadway Commission (COSO). Our system of internal control over financial reporting is designed to
49
Table of Contents
provide reasonable assurance regarding the reliability of financial reporting and the preparation and fair presentation of financial statements for external purposes in accordance with U.S. generally accepted accounting principles. Because of its inherent limitations, internal control over financial reporting may not prevent or detect misstatements. Also, projections of any evaluation of effectiveness of internal control over financial reporting to future periods are subject to the risk that controls may become inadequate because of changes in conditions, or that the degree of compliance with the policies or procedures may deteriorate.
Based on its assessment, management has concluded that we maintained effective internal control over financial reporting as of December 31, 2010, based on criteria in Internal Control—Integrated Framework, issued by the COSO. The effectiveness of our internal control over financial reporting as of December 31, 2010, has been audited by KPMG LLP, an independent registered public accounting firm, as stated in their report which is included herein.
50
Table of Contents
Report of Independent Registered Public Accounting Firm
The Shareholders and Board of Trustees
Universal Health Realty Income Trust:
We have audited Universal Health Realty Income Trust’s internal control over financial reporting as of December 31, 2010, based on criteria established in Internal Control—Integrated Framework issued by the Committee of Sponsoring Organizations of the Treadway Commission (COSO). Universal Health Realty Income Trust’s management is responsible for maintaining effective internal control over financial reporting and for its assessment of the effectiveness of internal control over financial reporting, included in the accompanying Management’s Report on Internal Control Over Financial Reporting. Our responsibility is to express an opinion on the Company’s internal control over financial reporting based on our audit.
We conducted our audit in accordance with the standards of the Public Company Accounting Oversight Board (United States). Those standards require that we plan and perform the audit to obtain reasonable assurance about whether effective internal control over financial reporting was maintained in all material respects. Our audit included obtaining an understanding of internal control over financial reporting, assessing the risk that a material weakness exists, and testing and evaluating the design and operating effectiveness of internal control based on the assessed risk. Our audit also included performing such other procedures as we considered necessary in the circumstances. We believe that our audit provides a reasonable basis for our opinion.
A company’s internal control over financial reporting is a process designed to provide reasonable assurance regarding the reliability of financial reporting and the preparation of financial statements for external purposes in accordance with generally accepted accounting principles. A company’s internal control over financial reporting includes those policies and procedures that (1) pertain to the maintenance of records that, in reasonable detail, accurately and fairly reflect the transactions and dispositions of the assets of the company; (2) provide reasonable assurance that transactions are recorded as necessary to permit preparation of financial statements in accordance with generally accepted accounting principles, and that receipts and expenditures of the company are being made only in accordance with authorizations of management and directors of the company; and (3) provide reasonable assurance regarding prevention or timely detection of unauthorized acquisition, use, or disposition of the company’s assets that could have a material effect on the financial statements.
Because of its inherent limitations, internal control over financial reporting may not prevent or detect misstatements. Also, projections of any evaluation of effectiveness to future periods are subject to the risk that controls may become inadequate because of changes in conditions, or that the degree of compliance with the policies or procedures may deteriorate.
In our opinion, Universal Health Realty Income Trust maintained, in all material respects, effective internal control over financial reporting as of December 31, 2010, based on criteria established in Internal Control—Integrated Framework issued by the Committee of Sponsoring Organizations of the Treadway Commission.
We also have audited, in accordance with the standards of the Public Company Accounting Oversight Board (United States), the consolidated balance sheets of Universal Health Realty Income Trust and subsidiaries as of December 31, 2010 and 2009, and the related consolidated statements of income, shareholders’ equity, and cash flows for each of the years in the three-year period ended December 31, 2010, and our report dated March 11, 2011 expressed an unqualified opinion on those consolidated financial statements.
/s/ KPMG LLP
Philadelphia, Pennsylvania
March 11, 2011
51
Table of Contents
| ITEM 9B. | Other Information |
None.
| ITEM 10. | Directors, Executive Officers and Corporate Governance |
There is hereby incorporated by reference the information to appear under the captions “Proposal No. 1” (Election of Trustees), “Section 16(a) Beneficial Ownership Reporting Compliance” and “Corporate Governance” in our Proxy Statement to be filed with the Securities and Exchange Commission within 120 days after December 31, 2010. See also “Executive Officers of the Registrant” appearing in Item 1 hereof.
| ITEM 11. | Executive Compensation |
There is hereby incorporated by reference information to appear under the caption “Executive Compensation” in our Proxy Statement to be filed with the Securities and Exchange Commission within 120 days after December 31, 2010.
| ITEM 12. | Security Ownership of Certain Beneficial Owners and Management and Related Stockholder Matters |
There is hereby incorporated by reference the information to appear under the caption “Security Ownership of Certain Beneficial Owners and Management” in our Proxy Statement to be filed with the Securities and Exchange Commission within 120 days after December 31, 2010.
| ITEM 13. | Certain Relationships and Related Transactions, and Director Independence |
There is hereby incorporated by reference the information to appear under the captions “Certain Relationships and Related Transactions” and “Corporate Governance” in our Proxy Statement to be filed with the Securities and Exchange Commission within 120 days after December 31, 2010.
| ITEM 14. | Principal Accounting Fees and Services |
There is hereby incorporated herein by reference the information to appear under the caption “Relationship with Independent Registered Public Accounting Firm” in our Proxy Statement, to be filed with the Securities and Exchange Commission within 120 days after December 31, 2010.
52
Table of Contents
| ITEM 15. | Exhibits, Financial Statement Schedules |
| (a) | Documents filed as part of this report: |
| (1) | Financial Statements: See “Index to Financial Statements and Financial Statement Schedules.” |
| (2) | Financial Statement Schedules: See “Index to Financial Statements and Financial Statement Schedules.” |
| (3) | Exhibits: |
3.1 Declaration of Trust, dated as of August 1986, previously filed as Exhibit 4.1 to the Trust’s Registration Statement on Form S-3 (File No. 333-60638) is incorporated herein by reference.
3.2 Amendment to Declaration of Trust, dated as of June 15, 1993, previously filed as Exhibit 4.2 to the Trust’s Registration Statement on Form S-3 (File No. 333-60638) is incorporated herein by reference.
3.3 Amended and restated bylaws previously filed as Exhibit 4.3 to the Trust’s registration statement on Form S-3 (File No. 333-60638) is incorporated herein by reference.
10.1 Advisory Agreement, dated as of December 24, 1986, between UHS of Delaware, Inc. and the Trust, previously filed as Exhibit 10.2 to the Trust’s Current Report on Form 8-K dated December 24, 1986, is incorporated herein by reference.
10.2 Agreement dated December 6, 2010, to renew Advisory Agreement dated as of December 24, 1986 between Universal Health Realty Income Trust and UHS of Delaware, Inc.
10.3 Contract of Acquisition, dated as of August 1986, between the Trust and certain subsidiaries of Universal Health Services, Inc., previously filed as Exhibit 10.2 to Amendment No. 3 of the Registration Statement on Form S-11 and S-2 of Universal Health Services, Inc. and the Trust (File No. 33-7872), is incorporated herein by reference.
10.4 Form of Leases, including Form of Master Lease Document Leases, between certain subsidiaries of Universal Health Services, Inc. and the Trust, previously filed as Exhibit 10.3 to Amendment No. 3 of the Registration Statement on Form S-11 and Form S-2 of Universal Health Services, Inc. and the Trust (File No. 33-7872), is incorporated herein by reference.
10.5 Corporate Guaranty of Obligations of Subsidiaries Pursuant to Leases and Contract of Acquisition, dated December 1986, issued by Universal Health Services, Inc. in favor of the Trust, previously filed as Exhibit 10.5 to the Trust’s Current Report on Form 8-K dated December 24, 1986, is incorporated herein by reference.
10.6 Lease, dated December 22, 1993, between the Trust and THC-Chicago, Inc., as lessee, previously filed as Exhibit 10.14 to the Trust’s Annual Report on Form 10-K for the year ended December 31, 1993, is incorporated herein by reference.
10.7* Universal Health Realty Income Trust 1997 Incentive Plan, previously filed as Exhibit 10.1 to the Trust’s Form 10-Q for the quarter ended September 30, 1997, is incorporated herein by reference.
10.8 Credit Agreement, dated as of January 19, 2007, by and among the Trust, the financial institutions from time to time party thereto and Wachovia Bank, National Association, as Administrative Agent, previously filed as Exhibit 10.1 to the Trust’s Current Report on Form 8-K dated January 24, 2007, is incorporated herein by reference.
53
Table of Contents
10.9 Dividend Reinvestment and Share Purchase Plan included in the Trust’s Registration Statement Form S-3 (Registration No. 333-81763) filed on June 28, 1999, is incorporated herein by reference.
10.10 Asset Exchange and Substitution Agreement, dated as of April 24, 2006, by and among the Trust and Universal Health Services, Inc. and certain of its subsidiaries, previously filed as Exhibit 10.1 to the Trust’s Current Report on Form 8-K dated April 25, 2006, is incorporated herein by reference.
10.11 Amendment No. 1 to the Master Lease Document, between certain subsidiaries of Universal Health Services, Inc. and the Trust, previously filed as Exhibit 10.2 to the Trust’s Current Report on Form 8-K dated April 25, 2006, is incorporated herein by reference.
10.12* Universal Health Realty Income Trust 2007 Restricted Stock Plan, previously filed as Exhibit 10.1 to the Trust’s Current Report on Form 8-K, dated April 27, 2007, is incorporated herein by reference.
10.13* Form of Restricted Stock Agreement, previously filed as Exhibit 10.2 to the Trust’s Current Report on Form 8-K dated April 27, 2007, is incorporated herein by reference.
11 Statement re computation of per share earnings is set forth on the Consolidated Statements of Income.
21 Subsidiaries of Registrant.
23.1 Consent of Independent Registered Public Accounting Firm.
31.1 Certification from the Trust’s Chief Executive Officer Pursuant to Rule 13a-14(a)/15(d)-14(a) of the Securities Exchange Act of 1934.
31.2 Certification from the Trust’s Chief Financial Officer Pursuant to Rule 13a-14(a)/15(d)-14(a) of the Securities Exchange Act of 1934.
32.1 Certification from the Trust’s Chief Executive Officer pursuant to 18 U.S.C. Section 1350, as adopted pursuant to Section 906 of the Sarbanes-Oxley Act of 2002.
32.2 Certification from the Trust’s Chief Financial Officer pursuant to 18 U.S.C. Section 1350, as adopted pursuant to Section 906 of the Sarbanes-Oxley Act of 2002.
| * | Management contract or compensatory plan or arrangement. |
Exhibits, other than those incorporated by reference, have been included in copies of this Annual Report filed with the Securities and Exchange Commission. Shareholders of the Trust will be provided with copies of those exhibits upon written request to the Company.
54
Table of Contents
Pursuant to the requirements of Section 13 or 15(d) of the Securities Exchange Act of 1934, the registrant has duly caused this report to be signed on its behalf by the undersigned, thereunto duly authorized.
| UNIVERSAL HEALTH REALTY INCOME TRUST | ||
| By: |
/S/ ALAN B. MILLER | |
| Alan B. Miller, Chairman of the Board, Chief Executive Officer and President | ||
Date: March 11, 2011
Pursuant to the requirements of the Securities Exchange Act of 1934, this report has been signed below by the following persons on behalf of the registrant and in the capacities and on the dates indicated.
| Signatures |
Title |
Date | ||
| /S/ ALAN B. MILLER Alan B. Miller |
Chairman of the Board, Chief Executive Officer and President (Principal Executive Officer) | March 11, 2011 | ||
| /S/ JAMES E. DALTON, JR. James E. Dalton, Jr. |
Trustee | March 11, 2011 | ||
| /S/ RANDALL C. STEIN Randall C. Stein |
Trustee | March 11, 2011 | ||
| /S/ MILES L. BERGER Miles L. Berger |
Trustee | March 11, 2011 | ||
| /S/ ELLIOT J. SUSSMAN Elliot J. Sussman, M.D., M.B.A. |
Trustee | March 11, 2011 | ||
| /S/ MARC D. MILLER Marc D. Miller |
Trustee | March 11, 2011 | ||
| /S/ CHARLES F. BOYLE Charles F. Boyle |
Vice President and Chief Financial Officer (Principal Financial and Accounting Officer) |
March 11, 2011 | ||
55
Table of Contents
INDEX TO FINANCIAL STATEMENTS AND SCHEDULE
56
Table of Contents
Report of Independent Registered Public Accounting Firm
The Shareholders and Board of Trustees
Universal Health Realty Income Trust:
We have audited the accompanying consolidated balance sheets of Universal Health Realty Income Trust and subsidiaries (the Company) as of December 31, 2010 and 2009, and the related consolidated statements of income, shareholders’ equity, and cash flows for each of the years in the three-year period ended December 31, 2010. In connection with our audits of the consolidated financial statements, we also have audited financial statement schedule III. These consolidated financial statements and the financial statement schedule are the responsibility of the Company’s management. Our responsibility is to express an opinion on these consolidated financial statements and financial statement schedule based on our audits.
We conducted our audits in accordance with the standards of the Public Company Accounting Oversight Board (United States). Those standards require that we plan and perform the audit to obtain reasonable assurance about whether the financial statements are free of material misstatement. An audit includes examining, on a test basis, evidence supporting the amounts and disclosures in the financial statements. An audit also includes assessing the accounting principles used and significant estimates made by management, as well as evaluating the overall financial statement presentation. We believe that our audits provide a reasonable basis for our opinion.
In our opinion, the consolidated financial statements referred to above present fairly, in all material respects, the financial position of Universal Health Realty Income Trust and subsidiaries as of December 31, 2010 and 2009, and the results of their operations and their cash flows for each of the years in the three-year period ended December 31, 2010, in conformity with U.S. generally accepted accounting principles. Also in our opinion, the related financial statement schedule, when considered in relation to the basic consolidated financial statements taken as a whole, presents fairly, in all material respects, the information set forth therein.
We also have audited, in accordance with the standards of the Public Company Accounting Oversight Board (United States), Universal Health Realty Income Trust’s internal control over financial reporting as of December 31, 2010, based on criteria established in Internal Control—Integrated Framework issued by the Committee of Sponsoring Organizations of the Treadway Commission (COSO), and our report dated March 11, 2011 expressed an unqualified opinion on the effectiveness of the Company’s internal control over financial reporting.
/s/ KPMG LLP
Philadelphia, Pennsylvania
March 11, 2011
57
Table of Contents
UNIVERSAL HEALTH REALTY INCOME TRUST
CONSOLIDATED BALANCE SHEETS
(dollar amounts in thousands)
| December 31, 2010 |
December 31, 2009 |
|||||||
| Assets: |
||||||||
| Real Estate Investments: |
||||||||
| Buildings and improvements |
$ | 180,750 | $ | 207,597 | ||||
| Accumulated depreciation |
(74,683 | ) | (72,405 | ) | ||||
| 106,067 | 135,192 | |||||||
| Land |
19,190 | 19,348 | ||||||
| Net Real Estate Investments |
125,257 | 154,540 | ||||||
| Investments in and advances to limited liability companies (“LLCs”) |
80,442 | 61,934 | ||||||
| Other Assets: |
||||||||
| Cash and cash equivalents |
987 | 3,038 | ||||||
| Base and bonus rent receivable from UHS |
1,964 | 2,039 | ||||||
| Rent receivable—other |
912 | 980 | ||||||
| Deferred charges, notes receivable and intangible and other assets, net |
6,573 | 6,294 | ||||||
| Total Assets |
$ | 216,135 | $ | 228,825 | ||||
| Liabilities: |
||||||||
| Line of credit borrowings |
$ | 52,600 | $ | 48,800 | ||||
| Mortgage notes payable, non-recourse to us |
8,399 | 6,677 | ||||||
| Mortgage, construction and other loans payable of consolidated LLCs, non-recourse to us |
6,564 | 28,790 | ||||||
| Accrued interest |
113 | 142 | ||||||
| Accrued expenses and other liabilities |
2,333 | 2,251 | ||||||
| Tenant reserves, escrows, deposits and prepaid rents |
616 | 981 | ||||||
| Total Liabilities |
70,625 | 87,641 | ||||||
| Equity: |
||||||||
| Preferred shares of beneficial interest, $.01 par value; 5,000,000 shares authorized; none issued and outstanding |
— | — | ||||||
| Common shares, $.01 par value; 95,000,000 shares authorized; issued and outstanding: 2010—12,653,169 2009—12,089,474 |
127 | 121 | ||||||
| Capital in excess of par value |
213,209 | 195,209 | ||||||
| Cumulative net income |
373,604 | 357,294 | ||||||
| Cumulative dividends |
(441,527 | ) | (411,662 | ) | ||||
| Total Universal Health Realty Income Trust Shareholders’ Equity |
145,413 | 140,962 | ||||||
| Non-controlling equity interests |
97 | 222 | ||||||
| Total Equity |
145,510 | 141,184 | ||||||
| Total Liabilities and Equity |
$ | 216,135 | $ | 228,825 | ||||
See the accompanying notes to these consolidated financial statements.
58
Table of Contents
UNIVERSAL HEALTH REALTY INCOME TRUST
CONSOLIDATED STATEMENTS OF INCOME
(amounts in thousands, except per share amounts)
| Year ended December 31, | ||||||||||||
| 2010 | 2009 | 2008 | ||||||||||
| Revenues: |
||||||||||||
| Base rental—UHS facilities |
$ | 13,142 | $ | 14,413 | $ | 12,828 | ||||||
| Base rental—Non-related parties |
9,528 | 10,434 | 9,936 | |||||||||
| Bonus rental—UHS facilities |
4,097 | 4,199 | 3,943 | |||||||||
| Tenant reimbursements and other—Non-related parties |
2,004 | 2,696 | 2,352 | |||||||||
| Tenant reimbursements and other—UHS facilities |
107 | 172 | 125 | |||||||||
| 28,878 | 31,914 | 29,184 | ||||||||||
| Expenses: |
||||||||||||
| Depreciation and amortization |
6,286 | 6,399 | 5,904 | |||||||||
| Advisory fees to UHS |
1,852 | 1,606 | 1,567 | |||||||||
| Other operating expenses |
5,439 | 5,977 | 5,146 | |||||||||
| Provision for asset impairment |
— | — | 4,575 | |||||||||
| 13,577 | 13,982 | 17,192 | ||||||||||
| Income before equity in income/(loss) of unconsolidated limited liability companies (“LLCs”) and interest expense |
15,301 | 17,932 | 11,992 | |||||||||
| Equity in income/(loss) of unconsolidated LLCs |
2,948 | 3,092 | 2,052 | |||||||||
| Interest expense, net |
(1,939 | ) | (2,448 | ) | (2,391 | ) | ||||||
| Net income |
$ | 16,310 | $ | 18,576 | $ | 11,653 | ||||||
| Basic earnings per share |
$ | 1.33 | $ | 1.56 | $ | 0.98 | ||||||
| Diluted earnings per share |
$ | 1.33 | $ | 1.56 | $ | 0.98 | ||||||
| Weighted average number of shares outstanding—Basic |
12,259 | 11,891 | 11,851 | |||||||||
| Weighted average number of share equivalents |
3 | 6 | 31 | |||||||||
| Weighted average number of shares and equivalents outstanding—Diluted |
12,262 | 11,897 | 11,882 | |||||||||
See the accompanying notes to these consolidated financial statements.
59
Table of Contents
UNIVERSAL HEALTH REALTY INCOME TRUST
CONSOLIDATED STATEMENTS OF SHAREHOLDERS’ EQUITY
For the Years Ended December 31, 2010, 2009 and 2008
(amounts in thousands, except per share amounts)
| Common Shares | Capital in excess of par value |
Cumulative net income |
Cumulative dividends |
UHT Shareholders’ Equity |
Non-controlling Interests |
Total Equity |
||||||||||||||||||||||||||
| Number of Shares |
Amount | |||||||||||||||||||||||||||||||
| January 1, 2008 |
11,842 | $ | 118 | $ | 188,638 | $ | 327,065 | ($ | 355,516 | ) | $ | 160,305 | $ | 87 | $ | 160,392 | ||||||||||||||||
| Shares of Beneficial Interest: |
||||||||||||||||||||||||||||||||
| Issued |
24 | 1 | 528 | — | — | 529 | — | 529 | ||||||||||||||||||||||||
| Restricted stock-based compensation expense |
— | — | 44 | — | — | 44 | — | 44 | ||||||||||||||||||||||||
| Stock-based compensation expense |
— | — | 137 | — | — | 137 | — | 137 | ||||||||||||||||||||||||
| Capital contributions from non-controlling interests |
— | — | — | — | — | — | 73 | 73 | ||||||||||||||||||||||||
| Dividends ($2.34/share) |
— | — | — | — | (27,740 | ) | (27,740 | ) | — | (27,740 | ) | |||||||||||||||||||||
| Comprehensive income: |
||||||||||||||||||||||||||||||||
| Net income |
— | — | — | 11,653 | — | 11,653 | 7 | 11,660 | ||||||||||||||||||||||||
| Total—comprehensive income |
— | — | — | 11,653 | — | 11,653 | 167 | 11,820 | ||||||||||||||||||||||||
| January 1, 2009 |
11,866 | 119 | 189,347 | 338,718 | (383,256 | ) | 144,928 | 167 | 145,095 | |||||||||||||||||||||||
| Shares of Beneficial Interest: |
||||||||||||||||||||||||||||||||
| Issued |
223 | 2 | 5,925 | — | — | 5,927 | — | 5,927 | ||||||||||||||||||||||||
| Partial settlement of dividend equivalent rights |
— | — | (349 | ) | — | — | (349 | ) | — | (349 | ) | |||||||||||||||||||||
| Restricted stock-based compensation expense |
— | — | 178 | — | — | 178 | — | 178 | ||||||||||||||||||||||||
| Stock-based compensation expense |
— | — | 108 | — | — | 108 | — | 108 | ||||||||||||||||||||||||
| Capital contributions from non-controlling interests |
— | — | — | — | — | — | 51 | 51 | ||||||||||||||||||||||||
| Dividends ($2.38/share) |
— | — | — | — | (28,406 | ) | (28,406 | ) | — | (28,406 | ) | |||||||||||||||||||||
| Comprehensive income: |
||||||||||||||||||||||||||||||||
| Net income |
— | — | — | 18,576 | — | 18,576 | 4 | 18,580 | ||||||||||||||||||||||||
| Total—comprehensive income |
— | — | — | 18,576 | — | 18,576 | — | — | ||||||||||||||||||||||||
| January 1, 2010 |
12,089 | 121 | 195,209 | 357,294 | (411,662 | ) | 140,962 | 222 | 141,184 | |||||||||||||||||||||||
| Shares of Beneficial Interest: |
||||||||||||||||||||||||||||||||
| Issued |
564 | 6 | 17,791 | — | — | 17,797 | — | 17,797 | ||||||||||||||||||||||||
| Partial settlement of dividend equivalent rights |
— | — | (134 | ) | — | — | (134 | ) | — | (134 | ) | |||||||||||||||||||||
| Restricted stock-based compensation expense |
— | — | 265 | — | — | 265 | — | 265 | ||||||||||||||||||||||||
| Stock-based compensation expense |
— | — | 78 | — | — | 78 | — | 78 | ||||||||||||||||||||||||
| Dividends ($2.415/share) |
— | — | — | — | (29,865 | ) | (29,865 | ) | — | (29,865 | ) | |||||||||||||||||||||
| Deconsolidation of non-controlling interests |
— | — | — | — | — | — | (110 | ) | (110 | ) | ||||||||||||||||||||||
| Comprehensive income: |
||||||||||||||||||||||||||||||||
| Net income (loss) |
— | — | — | 16,310 | — | 16,310 | (15 | ) | 16,295 | |||||||||||||||||||||||
| Total—comprehensive income |
— | — | — | 16,310 | — | 16,310 | — | — | ||||||||||||||||||||||||
| December 31, 2010 |
12,653 | $ | 127 | $ | 213,209 | $ | 373,604 | ($ | 441,527 | ) | $ | 145,413 | $ | 97 | $ | 145,510 | ||||||||||||||||
See the accompanying notes to these consolidated financial statements.
60
Table of Contents
UNIVERSAL HEALTH REALTY INCOME TRUST
CONSOLIDATED STATEMENTS OF CASH FLOWS
(amounts in thousands)
| Year ended December 31, | ||||||||||||
| 2010 | 2009 | 2008 | ||||||||||
| Cash flows from operating activities: |
||||||||||||
| Net income |
$ | 16,310 | $ | 18,576 | $ | 11,653 | ||||||
| Adjustments to reconcile net income to net cash provided by operating activities: |
||||||||||||
| Depreciation and amortization |
6,286 | 6,399 | 5,904 | |||||||||
| Restricted/stock-based compensation expense |
343 | 286 | 181 | |||||||||
| Provision for asset impairment |
— | — | 4,575 | |||||||||
| Changes in assets and liabilities: |
||||||||||||
| Rent receivable |
58 | (92 | ) | (1,221 | ) | |||||||
| Accrued expenses and other liabilities |
419 | (84 | ) | 393 | ||||||||
| Tenant reserves, escrows, deposits and prepaid rents |
(156 | ) | 98 | 142 | ||||||||
| Accrued interest |
49 | (48 | ) | 65 | ||||||||
| Other, net |
(260 | ) | (151 | ) | 77 | |||||||
| Net cash provided by operating activities |
23,049 | 24,984 | 21,769 | |||||||||
| Cash flows from investing activities: |
||||||||||||
| Investments in LLCs |
(15,578 | ) | (10,988 | ) | (7,187 | ) | ||||||
| Repayments of advances made to LLCs |
604 | 781 | 232 | |||||||||
| Advances made to LLCs |
(9,547 | ) | (2,142 | ) | (3,140 | ) | ||||||
| Cash distributions in excess of income from LLCs |
3,436 | 4,100 | 3,127 | |||||||||
| Cash distributions of refinancing proceeds from LLCs |
6,852 | 2,789 | 2,542 | |||||||||
| Advances made to third-party partners |
— | — | (3,960 | ) | ||||||||
| Acquisition of real property |
— | — | (4,714 | ) | ||||||||
| Additions to real estate investments |
(969 | ) | (6,902 | ) | (13,823 | ) | ||||||
| Decrease in cash and cash equivalents due to recording of LLCs on unconsolidated basis |
(2,100 | ) | — | — | ||||||||
| Net cash used in investing activities |
(17,302 | ) | (12,362 | ) | (26,923 | ) | ||||||
| Cash flows from financing activities: |
||||||||||||
| Net borrowings on line of credit |
3,800 | 9,800 | 22,200 | |||||||||
| Net borrowings from third-party partner |
— | — | 68 | |||||||||
| Financing costs on mortgage notes payable |
(398 | ) | — | — | ||||||||
| Repayments of mortgage notes payable of consolidated LLCs |
(191 | ) | (237 | ) | (218 | ) | ||||||
| (Repayments)/borrowings from loans payable of consolidated LLCs |
(529 | ) | 3,227 | 9,918 | ||||||||
| Repayments of mortgage notes payable |
(3,528 | ) | (215 | ) | (189 | ) | ||||||
| Proceeds from mortgage notes payable |
5,250 | — | — | |||||||||
| Dividends paid |
(29,865 | ) | (28,406 | ) | (27,740 | ) | ||||||
| Partial settlement of dividends equivalent rights |
(134 | ) | (349 | ) | — | |||||||
| Issuance of shares of beneficial interest, net |
17,797 | 5,927 | 529 | |||||||||
| Capital contributions from non-controlling interests |
— | 51 | 73 | |||||||||
| Net cash (used in) provided by financing activities |
(7,798 | ) | (10,202 | ) | 4,641 | |||||||
| (Decrease)/increase in cash and cash equivalents |
(2,051 | ) | 2,420 | (513 | ) | |||||||
| Cash and cash equivalents, beginning of period |
3,038 | 618 | 1,131 | |||||||||
| Cash and cash equivalents, end of period |
$ | 987 | $ | 3,038 | $ | 618 | ||||||
| Supplemental disclosures of cash flow information: |
||||||||||||
| Interest paid |
$ | 1,895 | $ | 2,299 | $ | 2,531 | ||||||
| Supplemental disclosures of non-cash transactions: |
||||||||||||
| Debt assumed on acquisition of real estate |
$ | — | $ | — | $ | 3,364 | ||||||
| Deconsolidation of LLCs (note 8): |
||||||||||||
| Net real estate investments |
$ | 23,852 | — | — | ||||||||
| Cash and cash equivalents |
2,100 | — | — | |||||||||
| Other assets |
688 | — | — | |||||||||
| Mortgage and note payable |
21,506 | — | — | |||||||||
| Other liabilities |
755 | — | — | |||||||||
| Non-controlling equity interests |
110 | — | — | |||||||||
| Investment in LLCs |
$ | 4,269 | $ | 0 | $ | 0 | ||||||
See accompanying notes to these consolidated financial statements.
61
Table of Contents
UNIVERSAL HEALTH REALTY INCOME TRUST
NOTES TO CONSOLIDATED FINANCIAL STATEMENTS
December 31, 2010
| (1) | SUMMARY OF SIGNIFICANT ACCOUNTING POLICIES |
Nature of Operations
Universal Health Realty Income Trust and subsidiaries (the “Trust”) is organized as a Maryland real estate investment trust. We invest in healthcare and human service related facilities including acute care hospitals, behavioral healthcare facilities, rehabilitation hospitals, sub-acute facilities, surgery centers, childcare centers and medical office buildings. As of December 31, 2010, we have fifty-two real estate investments or commitments located in fifteen states consisting of:
| • | seven hospital facilities including three acute care, one behavioral healthcare, one rehabilitation and two sub-acute; |
| • | forty-one medical office buildings, including thirty-two owned by various LLCs, and; |
| • | four preschool and childcare centers. |
Our future results of operations could be unfavorably impacted by continued deterioration in general economic conditions which could result in increases in the number of people unemployed and/or uninsured. Should that occur, it may result in decreased occupancy rates at our medical office buildings as well as a reduction in the revenues earned by the operators of our hospital facilities which would unfavorably impact our future bonus rentals (on the UHS hospital facilities) and may potentially have a negative impact on the future lease renewal terms and the underlying value of the hospital properties. Additionally, the general real estate market has been unfavorably impacted by the deterioration in economic and credit market conditions which may adversely impact the underlying value of our properties. The tightening in the credit markets and the instability in the certain banking and financial institutions over the past several years has not had a material impact on us. However, there can be no assurance that unfavorable credit market conditions will not materially increase our cost of borrowings and/or have a material adverse impact on our ability to finance our future growth through borrowed funds.
Management is unable to predict the effect, if any, that the factors discussed above will have on the operating results of our lessees or on their ability to meet their obligations under the terms of their leases with us. Management’s estimate of future cash flows from our leased properties could be materially affected in the near term, if certain of the leases are not renewed or renewed with less favorable terms at the end of their lease terms.
Revenue Recognition
Our revenues consist primarily of rentals received from tenants, which are comprised of minimum rent (base rentals), bonus rentals and reimbursements from tenants for their pro-rata share of expenses such as common area maintenance costs, real estate taxes and utilities.
The minimum rent for all hospital facilities is fixed over the initial term or renewal term of the respective leases. Rental income recorded for our consolidated and unconsolidated medical office buildings (“MOBs”) relating to leases in excess of one year in length, is recognized using the straight-line method under which contractual rents are recognized evenly over the lease term regardless of when payments are due. The amount of rental revenue resulting from straight-line rent adjustments is dependent on many factors including the nature and amount of any rental concessions granted to new tenants, scheduled rent increases under existing leases, as well as the acquisitions and sales of properties that have existing in-place leases with terms in excess of one year. As a result, the straight-line adjustments to rental revenue may vary from period-to-period. Bonus rents are recognized when earned based upon increases in each facility’s net revenue in excess of stipulated amounts. Bonus rentals
62
Table of Contents
are determined and paid each quarter based upon a computation that compares the respective facility’s current quarter’s net revenue to the corresponding quarter in the base year. Tenant reimbursements for operating expenses are accrued as revenue in the same period the related expenses are incurred.
Real Estate Investments
On the date of acquisition, the purchase price of a property is allocated to the property’s land, buildings and intangible assets based upon our estimates of their fair values. Depreciation is computed using the straight-line method over the estimated useful lives of the buildings and capital improvements (ranging from five to forty years). The value of intangible assets is amortized over the remaining lease term.
Cash and Cash Equivalents
We consider all highly liquid investment instruments with original maturities of three months or less to be cash equivalents.
Asset Impairment
Real estate investments and related intangible assets are reviewed for impairment whenever events or changes in circumstances indicate that the carrying amount of the property might not be recoverable. A property to be held and used is considered impaired only if management’s estimate of the aggregate future cash flows, less estimated capital expenditures, to be generated by the property, undiscounted and without interest charges, are less than the carrying value of the property. This estimate takes into consideration factors such as expected future operating income, trends and prospects, as well as the effects of demand, competition, local market conditions and other factors.
The determination of undiscounted cash flows requires significant estimates by management, including the expected course of action at the balance sheet date that would lead to such cash flows. Subsequent changes in estimated undiscounted cash flows arising from changes in anticipated action to be taken with respect to the property could impact the determination of whether an impairment exists. To the extent estimated undiscounted cash flows are less than the carrying value of the property, the loss will be measured as the excess of the carrying amount of the property over the fair value of the property.
Assessment of the recoverability by us of certain lease related costs must be made when we have reason to believe that a tenant might not be able to perform under the terms of the lease as originally expected. This requires us to make estimates as to the recoverability of such costs.
An other than temporary impairment of an investment/advance in an LLC is recognized when the carrying value of the investment is not considered recoverable based on evaluation of the severity and duration of the decline in value, including projected declines in cash flow. To the extent impairment has occurred, the excess carrying value of the asset over its estimated fair value is charged to income.
During 2008, we recorded an asset impairment charge of $4.6 million in connection with two medical office buildings (Southern Crescent Centers I and II) located on a medical campus in Clayton County (Riverdale), Georgia. This asset impairment charge was recorded after evaluation of property and location-specific factors including: (i) the expected future expiration of a master lease which occurred in June, 2010, and; (ii) the occupancy and projected occupancy of the buildings. As expected and previously disclosed, the master lease, which has been in effect since 2000 on Southern Crescent II (which generated approximately $1.1 million of annual revenues, net income and net cash provided by operating activities), was not renewed upon its expiration in June, 2010.
63
Table of Contents
Investments in and Advances to Limited Liability Companies (“LLCs”)
Investments in Limited Liability Companies (“LLCs”): Our consolidated financial statements include the consolidated accounts of our controlled investments and those investments that meet the criteria of a variable interest entity where we are the primary beneficiary. In accordance with the FASB’s standards and guidance relating to accounting for investments and real estate ventures, we account for our unconsolidated investments in LLCs which we do not control using the equity method of accounting. The third-party members in these investments have equal voting rights with regards to issues such as, but not limited to: (i) divestiture of property; (ii) annual budget approval, and; (iii) financing commitments. These investments, which represent 33% to 99% non-controlling ownership interests, are recorded initially at our cost and subsequently adjusted for our net equity in the net income, cash contributions to, and distributions from, the investments. Pursuant to certain agreements, allocations of profits and losses of some of the LLC investments may be allocated disproportionately as compared to ownership interests after specified preferred return rate thresholds have been satisfied.
At December 31, 2010, we have non-controlling equity investments or commitments in thirty-two LLCs which own medical office buildings (“MOBs”). As of December 31, 2010, we accounted for: (i) thirty-one of these LLCs on an unconsolidated basis pursuant to the equity method since they are not variable interest entities, and; (ii) one of these LLCs (Palmdale Medical Properties) on a consolidated basis, as discussed below, since it is considered to be a variable interest entity where we are the primary beneficiary by virtue of its master lease with a subsidiary of Universal Health Services, Inc. (“UHS”), a related party to us.
The majority of these LLCs are joint-ventures between us and a non-related party that manages and holds minority ownership interests in the entities. Each LLC is generally self-sustained from a cash flow perspective and generates sufficient cash flow to meet its operating cash flow requirements and service the third-party debt (if applicable) that is non-recourse to us. Although there is typically no ongoing financial support required from us to these entities since they are cash-flow sufficient, we may, from time to time, provide funding for certain purposes such as, but not limited to, significant capital expenditures and/or leasehold improvements. Although we are not obligated to do so, if approved by us at our sole discretion, additional cash fundings are typically advanced as equity or short to intermediate term loans.
As a result of master lease arrangements between UHS and various LLCs in which we hold majority non-controlling ownership interests, we have consolidated or deconsolidated these LLCs as required in accordance with the FASB’s standards and guidance.
Summerlin Medical Office Building III, which is located in Las Vegas, Nevada on the campus of Summerlin Hospital Medical Center (a majority-owned subsidiary of Universal Health Services, Inc.), completed construction and opened during the first quarter of 2009. In connection with this MOB, which is owned by an LLC in which we hold a majority, non-controlling ownership interest, Summerlin Hospital Medical Center committed to a master lease agreement for a specified portion of the space. As a result of this master lease agreement, the LLC was considered a variable interest entity. Since we were the primary beneficiary, the financial results of this MOB were included in our financial statements on a consolidated basis prior to January 1, 2010. During the first quarter of 2010, the master lease threshold was met and, as a result, this MOB is accounted for as an unconsolidated LLC under the equity method beginning on January 1, 2010. There was no material impact on our net income as a result of the deconsolidation of this LLC.
Summerlin Medical Office Building II is also located in Las Vegas, Nevada on the campus of Summerlin Hospital Medical Center. In connection with this MOB, which is owned by an LLC in which we hold a majority, non-controlling ownership interest, Summerlin Hospital Medical Center committed to a master lease agreement for a specified portion of the space. As a result of this master lease agreement, the LLC was considered a variable interest entity. Since we were the primary beneficiary, the financial results of this MOB were included in our financial statements on a consolidated basis prior to October 1, 2010. During the fourth quarter of 2010, the master lease arrangement expired and, as a result, this MOB is accounted for as an unconsolidated LLC under the equity method beginning on October 1, 2010. There was no material impact on our net income as a result of the deconsolidation of this LLC.
64
Table of Contents
Palmdale Medical Properties has a master lease with a subsidiary of UHS. Additionally, UHS of Delaware, a wholly-owned subsidiary of UHS, serves as advisor to us under the terms of an advisory agreement and manages our day-to-day affairs. All of our officers are officers or employees of UHS. As a result of our related-party relationship with UHS and the master lease, lease assurance or lease guarantee arrangements with subsidiaries of UHS, we account for this LLC on a consolidated basis since it is a variable interest entity and we are deemed to be the primary beneficiary.
The LLCs that we accounted for on a consolidated basis during 2010 (either entire year or partial year) are as follows:
| LLC |
Facility Name |
Non-controlling Ownership Interest |
Date of Consolidation | |||||
| 653 Town Center Phase II |
Summerlin Hospital MOB II | 98 | % | First quarter of 2004(a) | ||||
| Palmdale Medical Properties |
Palmdale Medical Plaza | 95 | % | Fourth quarter of 2007(b) | ||||
| (a) | This MOB had a master lease provision that expired on September 30, 2010; therefore, beginning in the fourth quarter of 2010, this MOB was no longer deemed a variable interest entity and is accounted for on an unconsolidated basis pursuant to the equity method. |
| (b) | This MOB was completed and opened during the third quarter of 2008. The master lease threshold on this MOB has not yet been met and is not expected to be met in the near future. |
The other LLCs in which we hold various non-controlling ownership interests are not variable interest entities and therefore are not subject to consolidation requirements.
Federal Income Taxes
No provision has been made for federal income tax purposes since we qualify as a real estate investment trust under Sections 856 to 860 of the Internal Revenue Code of 1986, and intend to continue to remain so qualified. As such, we are exempt from federal income taxes and we are required to distribute at least 90% of our real estate investment taxable income to our shareholders.
We are subject to a federal excise tax computed on a calendar year basis. The excise tax equals 4% of the amount by which 85% of our ordinary income plus 95% of any capital gain income for the calendar year exceeds cash distributions during the calendar year, as defined. No provision for excise tax has been reflected in the financial statements as no tax was due.
Earnings and profits, which determine the taxability of dividends to shareholders, will differ from net income reported for financial reporting purposes due to the differences for federal tax purposes in the cost basis of assets and in the estimated useful lives used to compute depreciation and the recording of provision for impairment losses.
The aggregate gross cost basis and net book value of the properties for federal income tax purposes are approximately $198 million and $126 million, respectively, at December 31, 2010 and $195 million and $127 million, respectively, at December 31, 2009.
Stock-Based Compensation
We expense the grant-date fair value of stock options. We recognize the grant-date fair value of stock options and other equity-based compensation and account for these transactions using the fair-value based method. We use the Black-Scholes model as our option pricing model for determining the grant-date fair value of our stock options.
65
Table of Contents
The expense associated with share-based compensation arrangements is a non-cash charge. In the Consolidated Statements of Cash Flows, share-based compensation expense is an adjustment to reconcile net income to cash provided by operating activities.
Fair Value of Financial Instruments
Fair value is a market-based measurement, not an entity-specific measurement and determined based upon the assumptions that market participants would use in pricing the asset or liability. In instances when it is necessary to establish the fair value of our real estate investments and investments in LLCs we use unobservable inputs (Level 3) which are typically based on our own assumptions, as there is little, if any, related market activity. The carrying amounts reported in the balance sheet for cash, receivables, and short-term borrowings approximate their fair values due to the short-term nature of these instruments. Accordingly, these items are excluded from the fair value disclosures included elsewhere in these notes to the consolidated financial statements.
Use of Estimates
The preparation of financial statements in conformity with generally accepted accounting principles requires management to make estimates and assumptions that affect the reported amounts of assets and liabilities and disclosure of contingent assets and liabilities at the date of the financial statements and the reported amounts of revenues and expenses during the reporting period. Actual results could differ from those estimates.
Accounting Standards
Transfers of Financial Assets: In June 2009, the FASB issued an amendment to the accounting and disclosure requirements for transfers of financial assets. This amendment requires greater transparency and additional disclosures for transfers of financial assets and the entity’s continuing involvement with them and changes the requirements for derecognizing financial assets. In addition, this amendment eliminates the concept of a qualifying special-purpose entity (“QSPE”). This amendment became effective for us on January 1, 2010. This amendment did not have a material impact on our consolidated financial position or results of operations.
Consolidation of Variable Interest Entities: In June 2009, the FASB also issued an amendment to the accounting and disclosure requirements for the consolidation of variable interest entities (“VIE”s). The elimination of the concept of a QSPE, as discussed above, removes the exception from applying the consolidation guidance within this amendment. This amendment requires an enterprise to perform a qualitative analysis when determining whether or not it must consolidate a VIE. The amendment also requires an enterprise to continuously reassess whether it must consolidate a VIE. Additionally, the amendment requires enhanced disclosures about an enterprise’s involvement with VIEs and any significant change in risk exposure due to that involvement, as well as how its involvement with VIEs impacts the enterprise’s financial statements. Finally, an enterprise will be required to disclose significant judgments and assumptions used to determine whether or not to consolidate a VIE. This amendment became effective for us on January 1, 2010. This amendment did not have a material impact on our consolidated financial position or results of operations.
| (2) | RELATIONSHIP WITH UHS AND RELATED PARTY TRANSACTIONS |
Leases: We commenced operations in 1986 by purchasing properties of certain subsidiaries from UHS and immediately leasing the properties back to the respective subsidiaries. Most of the leases were entered into at the time we commenced operations and provided for initial terms of 13 to 15 years with up to six additional 5-year renewal terms. The current base rentals and lease and rental terms for each facility are provided below. The base rents are paid monthly and each lease also provides for additional or bonus rents which are computed and paid on a quarterly basis based upon a computation that compares current quarter revenue to a corresponding quarter in the base year. The leases with subsidiaries of UHS are unconditionally guaranteed by UHS and are cross-defaulted with one another.
66
Table of Contents
The combined revenues generated from the leases on the UHS hospital facilities accounted for approximately 54% of our total revenue for the five years ended December 31, 2010 (approximately 56%, 51% and 55% for the years ended December 31, 2010, 2009 and 2008, respectively). Including 100% of the revenues generated at the unconsolidated LLCs in which we have various non-controlling equity interests ranging from 33% to 99%, the leases on the UHS hospital facilities accounted for approximately 21% of the combined consolidated and unconsolidated revenue for the five years ended December 31, 2010 (approximately 19%, 20% and 21% for the years ended December 31, 2010, 2009 and 2008, respectively). In addition, twelve MOBs, owned by LLCs in which we hold various non-controlling equity interests, include tenants which are subsidiaries of UHS.
Pursuant to the Master Lease Document by and among us and certain subsidiaries of UHS, dated December 24, 1986 (the “Master Lease”), which governs the leases of all hospital properties with subsidiaries of UHS, UHS has the option to renew the leases at the lease terms described below by providing notice to us at least 90 days prior to the termination of the then current term. In addition, UHS has rights of first refusal to: (i) purchase the respective leased facilities during and for 180 days after the lease terms at the same price, terms and conditions of any third-party offer, or; (ii) renew the lease on the respective leased facility at the end of, and for 180 days after, the lease term at the same terms and conditions pursuant to any third-party offer. UHS also has the right to purchase the respective leased facilities at the end of the lease terms or any renewal terms at the appraised fair market value. In addition, the Master Lease, as amended during 2006, includes a change of control provision whereby UHS has the right, upon one month’s notice should a change of control of the Trust occur, to purchase any or all of the four leased hospital properties at their appraised fair market value.
The table below details the renewal options and terms for each of the four UHS hospital facilities:
| Hospital Name |
Type of Facility | Annual Minimum Rent |
End of Lease Term |
Renewal Term (years) |
||||||||||
| McAllen Medical Center |
Acute Care | $ | 5,485,000 | December, 2011 | 20 | (a) | ||||||||
| Wellington Regional Medical Center |
Acute Care | $ | 3,030,000 | December, 2011 | 20 | (b) | ||||||||
| Southwest Healthcare System, Inland Valley Campus |
Acute Care | $ | 2,648,000 | December, 2011 | 20 | (b) | ||||||||
| The Bridgeway |
Behavioral Health | $ | 930,000 | December, 2014 | 10 | (c) | ||||||||
| (a) | UHS has four 5-year renewal options at existing lease rates (through 2031). |
| (b) | UHS has two 5-year renewal options at existing lease rates (through 2021) and two 5-year renewal options at fair market value lease rates (2022 through 2031). |
| (c) | UHS has two 5-year renewal options at fair market value lease rates (2015 through 2024). |
We are committed to invest up to a total of $8.9 million in equity and debt financing, of which $5.1 million has been funded as of December 31, 2010, in exchange for a 95% non-controlling equity interest in an LLC (Palmdale Medical Properties) that constructed, owns, and operates the Palmdale Medical Plaza, located in Palmdale, California, on the campus of a UHS hospital. This MOB has a triple net, 75% master lease commitment by UHS of Palmdale, Inc., a wholly-owned subsidiary of UHS, pursuant to the terms of which the master lease for each suite will be cancelled at such time that the suite is leased to another tenant acceptable to the LLC and UHS of Palmdale, Inc. This MOB, tenants of which will include subsidiaries of UHS, was completed and opened during the third quarter of 2008 at which time the master lease commenced. As of December 31, 2010, the master lease threshold of 75% has not been met and is not expected to be met in the near future. The LLC has a third-party term loan commitment of $6.6 million, non-recourse to us, which has been borrowed as of December 31, 2010. Please see Note 5 to the Consolidated Financial Statements for further discussion of this term loan. This LLC, which is deemed to be a variable interest entity, is consolidated in our financial statements since we are the primary beneficiary.
67
Table of Contents
We are committed to invest up to $5.2 million in debt or equity, of which $923,000 has been funded as of December 31, 2010, in exchange for a 95% non-controlling equity interest in an LLC (Banburry Medical Properties) that developed, constructed, owns and operates the Summerlin Medical Office Building III, located in Las Vegas, Nevada, on the campus of a UHS hospital. Summerlin Hospital Medical Center (“Summerlin Hospital”), a majority-owned subsidiary of UHS, has committed to lease approximately 25% of this building pursuant to the terms of a 10-year flex lease. In addition, Summerlin Hospital has committed to a 50% master lease on the remaining 75% of the building (representing 37.5% of the building) pursuant to the terms of which the master lease for each suite was cancelled at such time that the suite was leased to another tenant acceptable to the LLC and Summerlin Hospital. This MOB, tenants of which will include subsidiaries of UHS, was completed and opened during the first quarter of 2009 at which time the master lease commenced. As a result of this master lease agreement, the LLC was considered a variable interest entity and since we were the primary beneficiary, the financial results of this MOB were included in our financial statements on a consolidated basis prior to January 1, 2010. During the first quarter of 2010, the master lease threshold was met and, as a result, this MOB is accounted for as an unconsolidated LLC under the equity method beginning on January 1, 2010. The LLC has a third-party term loan of $13.0 million, which is non-recourse to us, outstanding as of December 31, 2010.
We are committed to invest up to $6.4 million in equity and debt financing, of which $5.0 million has been funded as of December 31, 2010, in exchange for a 95% non-controlling equity interest in an LLC (Sparks Medical Properties) that owns and operates the Vista Medical Terrace and The Sparks Medical Building, located in Sparks, Nevada, on the campus of a UHS hospital. These MOBs were acquired by the LLC during the third quarter of 2008. This LLC has a third-party term loan of $5.4 million, which is non-recourse to us, outstanding as of December 31, 2010. As this LLC is not considered to be a variable interest entity, it is accounted for pursuant to the equity method.
We are committed to invest up to $8.4 million in equity and debt financing, of which $6.5 million has been funded as of December 31, 2010, in exchange for a 95% non-controlling equity interest in an LLC that owns and operates the Centennial Hills Medical Office Building I, located in Las Vegas, Nevada, on the campus of a UHS hospital. This MOB was completed and opened during the fourth quarter of 2007. This LLC has a third-party term loan of $12.1 million, which is non-recourse to us, outstanding as of December 31, 2010. As this LLC is not considered to be a variable interest entity, it is accounted for under the equity method.
We are committed to invest up to a total of $4.8 million in equity and debt financing, of which $279,000 has been funded as of December 31, 2010, in exchange for a 95% non-controlling equity interest in an LLC (Texoma Medical Properties) that developed, constructed, owns and operates the Texoma Medical Plaza located in Denison, Texas, which was completed and opened during the first quarter of 2010. This MOB is located on the campus of a newly constructed and recently opened replacement UHS acute care hospital owned and operated by Texoma Medical Center (“Texoma Hospital”), a wholly-owned subsidiary of UHS. Texoma Hospital has committed to lease 75% of this building, pursuant to which the master lease for each suite will be cancelled at such time that the suite is leased to another tenant acceptable to the LLC and Texoma Hospital. The master lease threshold has been met. This MOB will have tenants that include subsidiaries of UHS. This LLC has a third-party construction loan commitment of $13.3 million, which is non-recourse to us, all of which has been borrowed as of December 31, 2010. As this LLC is not considered to be a variable interest entity, it is accounted for pursuant to the equity method.
We are committed to invest up to a total of $4.7 million in equity and debt financing, of which $4.5 million has been funded as of December 31, 2010, in exchange for a 95% non-controlling equity interest in an LLC (Auburn Medical Properties) that developed constructed, owns and operates the Auburn Medical Office Building II, located in Auburn, Washington, on the campus of a UHS hospital. Auburn Regional Medical Center (“Auburn Hospital”), a wholly-owned subsidiary of UHS, has committed to lease 75% of this building, pursuant to which the master lease for each suite will be cancelled at such time that the suite is leased to another tenant acceptable to the LLC and Auburn Hospital. The master lease threshold on this MOB has been met. This MOB, tenants of which include subsidiaries of UHS, was completed and opened in the third quarter of 2009. This LLC has a
68
Table of Contents
third-party construction loan of $8.3 million, which is non-recourse to us, outstanding as of December 31, 2010. As this LLC is not considered to be a variable interest entity, it is accounted for pursuant to the equity method.
Advisory Agreement: UHS of Delaware, Inc. (the “Advisor”), a wholly-owned subsidiary of UHS, serves as Advisor to us under an Advisory Agreement (the “Advisory Agreement”) dated December 24, 1986. Pursuant to the Advisory Agreement, the Advisor is obligated to present an investment program to us, to use its best efforts to obtain investments suitable for such program (although it is not obligated to present any particular investment opportunity to us), to provide administrative services to us and to conduct our day-to-day affairs. All transactions between us and UHS must be approved by the Trustees who are unaffiliated with UHS (the “Independent Trustees”). In performing its services under the Advisory Agreement, the Advisor may utilize independent professional services, including accounting, legal, tax and other services, for which the Advisor is reimbursed directly by us. The Advisory Agreement may be terminated for any reason upon sixty days written notice by us or the Advisor. The Advisory Agreement expires on December 31 of each year; however, it is renewable by us, subject to a determination by the Independent Trustees, that the Advisor’s performance has been satisfactory. In December of 2009, based upon a review of our advisory fee and other general and administrative expenses, as compared to an industry peer group, the fee was increased to 0.65% (from 0.60%) of our average invested real estate assets, as derived from our consolidated balance sheet, effective on January 1, 2010. The Advisory Agreement was renewed for 2011 at same terms and conditions.
The average real estate assets for advisory fee calculation purposes exclude certain items from our consolidated balance sheet such as, among other things, accumulated depreciation, cash and cash equivalents, base and bonus rent receivables, deferred charges and other assets. The advisory fee is payable quarterly, subject to adjustment at year-end based upon our audited financial statements. In addition, the Advisor is entitled to an annual incentive fee equal to 20% of the amount by which cash available for distribution to shareholders for each year, as defined in the Advisory Agreement, exceeds 15% of our equity as shown on our consolidated balance sheet, determined in accordance with generally accepted accounting principles without reduction for return of capital dividends. The Advisory Agreement defines cash available for distribution to shareholders as net cash flow from operations less deductions for, among other things, amounts required to discharge our debt and liabilities and reserves for replacement and capital improvements to our properties and investments. No incentive fees were paid during 2010, 2009 or 2008 since the incentive fee requirements were not achieved. Advisory fees incurred and paid (or payable) to UHS amounted to $1.9 million during 2010 and $1.6 million during each of 2009 and 2008 and were based upon average invested real estate assets of $285 million, $268 million and $261 million during 2010, 2009 and 2008, respectively.
Officers and Employees: Our officers are all employees of UHS and although as of December 31, 2010 we had no salaried employees, our officers do receive stock-based compensation.
Share Ownership: As of December 31, 2010 and 2009, UHS owned 6.2% and 6.5% of our outstanding shares of beneficial interest, respectively.
SEC reporting requirements of UHS: UHS is subject to the reporting requirements of the SEC and is required to file annual reports containing audited financial information and quarterly reports containing unaudited financial information. Since the leases on the hospital facilities leased to wholly-owned subsidiaries of UHS comprised approximately 56%, 51% and 55% of our consolidated revenues for the years ended December 31, 2010, 2009 and 2008, respectively, and since a subsidiary of UHS is our Advisor, you are encouraged to obtain the publicly available filings for Universal Health Services, Inc. from the SEC’s website at www.sec.gov. These filings are the sole responsibility of UHS and are not incorporated by reference herein.
UHS Other Matters:
Southwest Healthcare System: During the third quarter of 2009, UHS advised us that Southwest Healthcare System (“SWHCS”), a wholly-owned subsidiary of UHS which operates Rancho Springs Medical
69
Table of Contents
Center (the real property of which is not owned by the Trust) and Inland Valley Regional Medical Center (“Inland Valley”, the real property of which is owned by the Trust) located in Riverside County, California, entered into an agreement with the Center for Medicare and Medicaid Services (“CMS”). The agreement required SWHCS to engage an independent quality monitor to assist SWHCS in meeting all CMS’ conditions of participation. Further, the agreement provided that, during the last 60 days of the agreement, CMS would conduct a full Medicare certification survey. That survey took place the week of January 11, 2010.
In April, 2010, SWHCS received notification from CMS that it intended to effectuate the termination of SWHCS’s Medicare provider agreement effective June 1, 2010. In May, 2010, UHS entered into an agreement with CMS which abated the termination action scheduled for June 1, 2010. The agreement is one year in duration and required SWHCS to engage independent experts in various disciplines to analyze and develop implementation plans for SWHCS to meet the Medicare conditions of participation. At the conclusion of the agreement, CMS will conduct a full certification survey to determine if SWHCS has achieved substantial compliance with the Medicare conditions of participation. During the term of the agreement, SWHCS remains eligible to receive reimbursements from Medicare for services rendered to Medicare beneficiaries.
Also in April, 2010, SWHCS received notification from the California Department of Public Health (“CDPH”) indicating that it planned to initiate a process to revoke SWHCS’s hospital license. In May, 2010, SWHCS received the formal document related to the revocation action. In September, 2010, SWHCS entered into an agreement with CDPH relating to the license revocation. The terms of the CDPH agreement are substantially similar to those contained in the agreement with CMS. As a result of the agreement, SWHCS’s hospital license remains in effect pending the outcome of the CMS full certification survey which will occur at the end of the agreement. Pursuant to the results of the CMS full certification survey, which SWHCS anticipates occurring in mid-year, 2011, should SWHCS be deemed to have achieved substantial compliance with the Medicare conditions of participation, CDPH shall deem SWHCS’s license to be in good standing. Failure of SWHCS to achieve substantial compliance with the Medicare conditions of participation, pursuant to CMS’s full certification survey, will likely have a material adverse impact on SWHCS’s ability to continue to operate the facilities.
As a result of the matters discussed above, SWHCS had not been permitted to open newly constructed capacity at Rancho Springs Medical Center and Inland Valley. However, in February, 2011, SWHC received permission from CDPH to begin accessing the new capacity. Unrelated to these developments, SWHCS expects a competitor to open a newly constructed acute care hospital during the first quarter of 2011. UHS is unable to predict the net impact of these developments on SWHCS’s results of operations in 2011 and beyond.
UHS has advised us that Rancho Springs Medical Center and Inland Valley remain fully committed to providing high-quality healthcare to their patients and the communities they serve. UHS therefore intends to work expeditiously and collaboratively with both CMS and CDPH in an effort to resolve these matters, although there can be no assurance they will be able to do so. Failure to resolve these matters could have a material adverse effect on UHS and, in turn, us. While the $2.6 million annual base rentals on Inland Valley are guaranteed by UHS through the end of the existing lease term (December, 2011), should this matter, or the opening of the above-mentioned newly constructed acute care facility by a competitor, adversely impact the future revenues and/or operating results of SWHCS, the future bonus rental earned by us on Inland Valley, as well as the underlying value of the property, may be materially adversely impacted. At December 31, 2010, the book value of the property was $19.0 million. Bonus rental revenue earned by us from Inland Valley amounted to $1.1 million during each of the years ended December 31, 2010 and 2009 and $1.0 million during the year ended December 31, 2008.
Psychiatric Solutions, Inc.: In connection with the acquisition of Psychiatric Solutions, Inc. (“PSI”) by UHS, UHS has substantially increased its level of indebtedness which could, among other things, adversely affect its ability to raise additional capital to fund operations, limit its ability to react to changes in the economy or its industry and could potentially prevent it from meeting its obligations under the agreements related to its
70
Table of Contents
indebtedness. If UHS experiences financial difficulties and, as a result, operations of its existing facilities suffer, or UHS otherwise fails to make payments to us, our revenues will significantly decline.
Although we do not expect to be directly impacted by UHS’ acquisition of PSI, UHS is substantially more leveraged and we cannot assure you that UHS will continue to satisfy its obligations to us. The failure or inability of UHS to satisfy its obligations to us could materially reduce our revenues and net income, which could in turn reduce the amount of dividends we pay and cause our stock price to decline.
| (3) | ACQUISITIONS AND DISPOSITIONS |
2010:
Acquisitions:
During March of 2010, we invested $5.1 million in debt financing and equity for a 95% non-controlling ownership interest in an LLC (3811 Bell Medical Properties) that purchased the North Valley Medical Plaza, a medical office building located in Phoenix, Arizona.
There were no dispositions during 2010.
2009:
There were no acquisitions or dispositions during 2009.
2008:
Acquisitions:
During the third quarter of 2008, we invested $2.3 million for a 95% non-controlling ownership interest in an LLC (Sparks Medical Plaza) that purchased the Vista Medical Terrace and The Sparks Medical Building located in Sparks, Nevada. Both of these medical office buildings are located on the campus of Northern Nevada Medical Center, an acute care hospital owned and operated by a wholly-owned subsidiary of UHS. This LLC is not a variable interest entity and therefore is not subject to consolidation.
In February, 2008, we purchased Kindred Hospital-Corpus Christi, an unaffiliated long-term sub-acute care hospital located in Corpus Christi, Texas for a total purchase price of $8.1 million. We paid $4.7 million in cash and assumed $3.4 million of third-party mortgage debt that is non-recourse to us. The lease payments on this facility are unconditionally guaranteed by Kindred Healthcare, Inc. until its scheduled expiration in June, 2019. The proforma effect of this acquisition did not have a material impact on our results of operations. The purchase price of this property was allocated to net tangible and identified intangible assets acquired based on fair value indications. Intangible assets include amounts representing the value of the tenant relationship and the in-place lease at the time of acquisition.
There were no dispositions during 2008.
| (4) | LEASES |
All of our leases are classified as operating leases with initial terms ranging from 3 to 20 years with up to five additional five-year renewal options. Under the terms of the leases, we earn fixed monthly base rents and pursuant to the leases with subsidiaries of UHS, we may earn periodic bonus rents (see Note 1). The bonus rents from the subsidiaries of UHS, which are based upon each facility’s net revenue in excess of base amounts, are computed and paid on a quarterly basis based upon a computation that compares current quarter revenue to the corresponding quarter in the base year.
71
Table of Contents
Minimum future base rents from non-cancelable leases related to properties included in our financial statements on a consolidated basis, excluding increases resulting from changes in the consumer price index and bonus rents, are as follows (amounts in thousands):
| 2011 |
20,751 | |||
| 2012 |
9,170 | |||
| 2013 |
7,997 | |||
| 2014 |
6,885 | |||
| 2015 |
5,102 | |||
| Thereafter |
13,620 | |||
| Total minimum base rents |
$ | 63,525 | ||
Some of the leases contain gross terms where operating expenses are included in the base rent amounts. Other leases contain net terms where the operating expenses are assessed separately from the base rentals. The table above contains a mixture of both gross and net leases, and does not include any separately calculated operating expense reimbursements. Under the terms of the hospital leases, the lessees are required to pay all operating costs of the properties including property insurance and real estate taxes. Tenants of the medical office buildings generally are required to pay their pro-rata share of the property’s operating costs.
| (5) | DEBT |
In January 2007, we entered into an unsecured $100 million revolving credit agreement (the “Agreement”) which expires on January 19, 2012. We have a one-time option, which can be exercised at any time, subject to bank approval, to increase the amount by $50 million for a total commitment of $150 million. The Agreement provides for interest at our option, at the Eurodollar rate plus 0.75% to 1.125%, or the prime rate plus zero to .125%. A fee of 0.15% to 0.225% is paid on the unused portion of the commitment. The margins over the Eurodollar, prime rate and the commitment fee are based upon our debt to total capital ratio as defined by the Agreement. As of December 31, 2010, the applicable margin over the Eurodollar rate was 0.75%, the margin over the prime rate was zero, and the commitment fee was 0.15%.
At December 31, 2010, we had $52.6 million of outstanding borrowings and $18.9 million of letters of credit outstanding, securing our equity and debt financing commitments to various LLCs, against the Agreement. We had $28.5 million of available borrowing capacity, net of the outstanding borrowings and letters of credit outstanding as of December 31, 2010. There are no compensating balance requirements. The average amounts outstanding under our revolving credit agreement were $52.9 million in 2010, $45.8 million in 2009, and $27.0 million in 2008 with corresponding effective interest rates, including commitment fees, of 1.1% in 2010, 1.4% in 2009 and 3.9% in 2008. The carrying value of the amounts borrowed approximates fair market value at December 31, 2010.
Covenants relating to the Agreement require the maintenance of a minimum tangible net worth and specified financial ratios, limit our ability to incur additional debt, limit the aggregate amount of mortgage receivables and limit our ability to increase dividends in excess of 95% of cash available for distribution, unless additional distributions are required to comply with the applicable section of the Internal Revenue Code and related regulations governing real estate investment trusts. We were in compliance with all of the covenants as of and for the year ended December 31, 2010.
72
Table of Contents
The following table includes a summary of the required compliance ratios (dollar amounts in thousands):
| Covenant | December 31, 2010 |
|||||||
| Tangible net worth |
$ | 136,450 | $ | 145,510 | ||||
| Debt to total capital(A) |
< 55 | % | 27 | % | ||||
| Debt service coverage ratio(A) |
> 1.25x | 3.86x | ||||||
| Debt to cash flow ratio(A) |
< 3.50x | 1.58 | % | |||||
| (A) | Excludes third-party debt that is non-recourse to us and related debt service. |
We have three mortgages, all of which are non-recourse to us, included on our consolidated balance sheet as of December 31, 2010, with a combined outstanding balance of $15.0 million. The following table summarizes our outstanding mortgage loans at December 31, 2010 (amounts in thousands):
| Facility Name |
Outstanding Balance (in thousands) |
Interest Rate |
Maturity Date |
|||||||||
| Medical Center of Western Connecticut fixed rate mortgage loan(a) |
$ | 5,202 | 6.00 | % | 2017 | |||||||
| Kindred Hospital-Corpus Christi fixed rate mortgage loan(a) |
3,197 | 6.50 | % | 2019 | ||||||||
| Palmdale Medical Plaza fixed rate term loan |
6,564 | 5.10 | % | 2013 | ||||||||
| Total |
$ | 14,963 | ||||||||||
| (a) | Amortized principal payments made on a monthly basis. |
The mortgages are secured by the real property of the buildings as well as property leases and rents. The mortgages and term loan have a combined fair value of approximately $15.3 million as of December 31, 2010. Changes in market rates on our fixed rate debt impacts the fair value of debt, but it has no impact on interest incurred or cash flow.
As of December 31, 2010, our aggregate consolidated scheduled debt repayments (including mortgages and term loans) are as follows (amounts in thousands):
| 2011 |
$ | 346 | ||
| 2012 |
52,965 | |||
| 2013 |
6,369 | |||
| 2014 |
195 | |||
| 2015 |
208 | |||
| Later |
7,480 | |||
| Total |
$ | 67,563 | ||
| (6) | DIVIDENDS |
Dividends of $2.415 per share were declared and paid in 2010, of which $1.613 per share was ordinary income and $.802 per share was a return of capital distribution. Dividends of $2.38 per share were declared and paid in 2009, of which $1.94 per share was ordinary income and $.44 per share was a return of capital distribution. Dividends of $2.34 per share were declared and paid in 2008, of which $1.605 per share was ordinary income and $.735 per share was a return of capital distribution.
During the fourth quarter of 2009, we commenced an at-the-market (“ATM”) equity issuance program pursuant to the terms of which we may sell, from time-to-time, common shares of our beneficial interest up to an aggregate sales price of $50 million to or through Merrill Lynch, Pierce, Fenner and Smith Incorporated, as sales
73
Table of Contents
agent and/or principal. Pursuant to this ATM program, we issued 184,600 shares at an average price of $31.28 per share during the fourth quarter of 2009 which generated approximately $5.3 million of net cash proceeds (net
of approximately $440,000 consisting of compensation of approximately $175,000 to Merrill Lynch as well as approximately $265,000 of various other fees and expenses). During 2010 we issued 548,900 shares under this ATM program at an average price of $33.44 per share, which generated approximately $17.6 million of net cash proceeds (net of approximately $800,000 consisting of compensation of $550,000 to Merrill Lynch as well as approximately $250,000 of other various fees and expenses). Since inception of this program, we have issued 733,500 shares at an average price of $32.90 per share, which generated approximately $22.9 million of net cash proceeds (net of approximately $1.2 million, consisting of compensation of $725,000 to Merrill Lynch as well as approximately $515,000 of various other fees and expenses).
| (7) | INCENTIVE PLANS |
As discussed in Note 1, we expense the grant-date fair value of stock options and other equity-based compensation under the straight-line method over the stated vesting period of the award using the Black-Scholes option pricing model.
During 2007, upon the expiration of our 1997 Incentive Plan, as discussed below, our Board of Trustees and shareholders approved the Universal Health Realty Income Trust 2007 Restricted Stock Plan (the “2007 Plan”). A total of 75,000 shares were authorized for issuance under this plan and a total of 21,475 shares, net of cancellations have been issued pursuant to the terms of this plan, 6,100 of which have vested as of December 31, 2010. At December 31, 2010, there are 53,525 shares remaining for issuance under the terms of the 2007 Plan. During 2010, there were 8,000 restricted Shares of Beneficial Interest, net of cancellations, issued to the Trustees and officers of the Trust pursuant to the 2007 Plan at a weighted average grant price of $31.59 per share ($252,720 in the aggregate). These restricted shares are scheduled to vest on the second anniversary of the date of grant. In connection with these grants, we recorded compensation expense of approximately $74,000 during 2010 and the remaining expense associated with these grants (approximately $179,000 as of December 31, 2010) will be recorded over the remaining vesting periods of the awards. During 2009, there were 7,375 restricted Shares of Beneficial Interest, net of cancellations, issued to the Trustees and officers of the Trust pursuant to the 2007 Plan at a weighted average grant price of $33.89 per share ($250,000 in the aggregate). These restricted shares are scheduled to vest on the second anniversary of the date of grant. In connection with these grants, we recorded compensation expense of approximately $125,000 during 2010 and $73,000 during 2009 and the remaining expense associated with these grants (approximately $52,000 as of December 31, 2010) will be recorded over the remaining vesting periods of the awards. During 2008, there were 6,100 restricted Shares of Beneficial Interest, net of cancellations, issued to Trustees and officers of the Trust pursuant to the 2007 Plan at a weighted average grant price of $35.23 per share ($215,000 in the aggregate). These restricted shares vested during 2010. In connection with these grants, we recorded compensation expense of approximately $67,000, $105,000 and $43,000 during 2010, 2009 and 2008, respectively. The remaining weighted average vesting period for outstanding restricted Shares of Beneficial Interest as of December 31, 2010 is 1.0 years.
Prior to its expiration in 2007, the Universal Health Realty Income Trust 1997 Incentive Plan (the “1997 Plan”) provided for the granting of stock options and dividend equivalents rights (“DERs”) to employees of the Trust, including officers and trustees. Awards granted pursuant to the 1997 Plan prior to its termination date remain exercisable, in accordance with the terms of the outstanding agreements. All stock options were granted with an exercise price equal to the fair market value on the date of the grant. The options granted vest ratably at 25% per year beginning one year after the date of grant, and expire in ten years. DERs on outstanding awards are earned in amounts equal to the cash or stock dividends declared subsequent to the date of grant. We recorded expenses relating to the dividend equivalent rights of approximately $18,000 in 2010, $36,000 in 2009 and $76,000 in 2008. As of December 31, 2010, there were 45,250 options exercisable under the 1997 Plan with an average exercise price of $33.56 per share.
74
Table of Contents
Compensation costs of $78,000 during 2010, $108,000 during 2009 and $137,000 during 2008 was recognized related to outstanding stock options and DERs that were granted or have vestings after January 1, 2006. As of December 31, 2010, there was approximately $12,000 of unrecognized compensation costs related to unvested options and DERs which is expected to be recognized over the remaining weighted average remaining vesting period of 0.2 years.
During the fourth quarter of 2008, the Board of Trustees of the Trust approved amendments to the outstanding stock option agreements made pursuant to the 1997 Plan. These original agreements provided for the deferred payment of dividend equivalents on shares covered by the options, with payment tied to the date the options were exercised or expire. In order to meet certain recent changes to tax law requirements, the agreements, as amended, provide for the current payment of dividend equivalents in the years in which dividends are declared and paid or, if later, when the related options become vested. Dividend equivalent rights with respect to 51,000 shares were outstanding at each of December 31, 2010 and 2009 and 78,000 shares were outstanding as of December 31, 2008. In January, 2009, $755,563 of dividend equivalents rights, which were accrued as of December 31, 2008 with respect to previously vested options, were paid to officers and Trustees of the Trust. On December 31, 2009, $149,000 of dividend equivalent rights, which were accrued as of December 31, 2009 with respect to vested options were paid to officers and Trustees of the Trust. On December 31, 2010, $150,000 of dividend equivalent rights, which were accrued as of December 31, 2010 with respect to vested options were paid to officers and Trustees of the Trust.
Stock options to purchase shares of beneficial interest have been granted to eligible individuals, including our officers and trustees. Information with respect to these options, before adjustment to the option price to give effect to the dividend equivalent rights, is summarized as follows:
| Outstanding Options |
Number of Shares |
Exercise Weighted- Average Price |
Grant Price Range (High-Low) |
|||||||||
| Balance, January 1, 2008 |
83,000 | $ | 27.51 | $ | 36.53/$14.75 | |||||||
| Exercised |
(5,000 | ) | $ | 20.5313 | $ | 21.4375/$19.625 | ||||||
| Balance, January 1, 2009 |
78,000 | $ | 27.96 | $ | 36.53/$14.75 | |||||||
| Exercised |
(25,000 | ) | $ | 15.27 | $ | 27.65/$14.75 | ||||||
| Cancelled |
(2,000 | ) | $ | 35.30 | $ | 34.07/$36.53 | ||||||
| Balance, January 1, 2010 |
51,000 | $ | 33.89 | $ | 36.53/$26.09 | |||||||
| Exercised |
— | — | — | |||||||||
| Balance, December 31, 2010 |
51,000 | $ | 33.89 | $ | 36.53/$26.09 | |||||||
| Outstanding options vested and exercisable as of December 31, 2010 |
45,250 | $ | 33.56 | $ | 36.53/$26.09 | |||||||
There were no stock options exercised during 2010. The total in-the-money value of all stock options exercised during the years ended December 31, 2009 and December 31, 2008 was approximately $452,000 and $66,000 respectively.
The following table provides information about unvested options as of December 31, 2010:
| Shares | Weighted Average Grant Date Fair Value |
|||||||
| Unvested options as of January 1, 2010 |
11,500 | $ | 14.70 | |||||
| Granted |
— | $ | — | |||||
| Vested |
(5,750 | ) | $ | 14.70 | ||||
| Cancelled |
— | $ | — | |||||
| Unvested options as of December 31, 2010 |
5,750 | $ | 14.70 | |||||
75
Table of Contents
The following table provides information about options outstanding and exercisable options at December 31, 2010:
| Options Outstanding |
Options Exercisable |
Expected to Vest |
||||||||||
| Number |
51,000 | 45,250 | 5,750 | |||||||||
| Weighted average exercise price |
$ | 33.89 | $ | 33.56 | $ | 36.53 | ||||||
| Aggregate intrinsic value |
$ | 134,510 | $ | 134,510 | $ | — | ||||||
| Weighted average remaining contractual life |
4.8 | 4.6 | 6.2 | |||||||||
The weighted average remaining contractual life and weighted average exercise price for options outstanding and the weighted average exercise prices per share for exercisable and expected to vest options at December 31, 2010 were as follows:
| Options Outstanding | Exercisable Options |
Expected to Vest Options |
||||||||||||||||||||||||||
| Exercise Price |
Shares | Weighted Average Exercise Price Per Share |
Weighted Average Remaining Contractual Life (in Years) |
Shares | Weighted Average Exercise Price Per Share |
Shares | Weighted Average Exercise Price Per Share |
|||||||||||||||||||||
| $26.09 -$26.09 |
1,000 | $ | 26.09 | 1.9 | 1,000 | $ | 26.09 | N/A | N/A | |||||||||||||||||||
| $26.25 -$30.06 |
11,000 | 27.85 | 2.4 | 11,000 | 27.85 | N/A | N/A | |||||||||||||||||||||
| $34.07 -$34.90 |
16,000 | 34.74 | 4.5 | 16,000 | 34.74 | N/A | N/A | |||||||||||||||||||||
| $36.53 -$36.53 |
23,000 | 36.53 | 6.2 | 17,250 | 36.53 | 5,750 | 36.53 | |||||||||||||||||||||
| Total |
51,000 | $ | 33.89 | 4.8 | 45,250 | $ | 33.89 | 5,750 | $ | 36.53 | ||||||||||||||||||
| (8) | SUMMARIZED FINANCIAL INFORMATION OF EQUITY AFFILIATES |
Since January 1, 1995 through December 31, 2010, we have invested $109.5 million of cash (including advances to various LLCs) in LLCs in which we own various non-controlling equity interests ranging from 33% to 99% (consolidated and unconsolidated), before reductions for cash distributions received from the LLCs. As of December 31, 2010, short-term unsecured advances aggregated $29.1 million due from eight LLCs. Including the cumulative adjustments for our share of equity in the net income of the LLCs and cash contributions to and distributions from these investments, our net investment in LLCs was $80.4 million and $61.9 million (excluding consolidated investments) as reflected on our consolidated balance sheets as of December 31, 2010 and 2009, respectively.
76
Table of Contents
As of December 31, 2010, we had investments or commitments to invest in thirty-two LLCs, thirty-one of which are accounted for by the equity method and one that is consolidated into the results of operations. The following tables represent summarized financial and other information related to the thirty-one LLCs which were accounted for under the equity method as of December 31, 2010:
| Name of LLC |
Ownership | Property Owned by LLC | ||||
| DSMB Properties |
76 | % | Desert Samaritan Hospital MOBs | |||
| DVMC Properties(a.) |
90 | % | Desert Valley Medical Center | |||
| Suburban Properties |
33 | % | Suburban Medical Plaza II | |||
| Litchvan Investments |
89 | % | Papago Medical Park | |||
| Paseo Medical Properties II |
75 | % | Thunderbird Paseo Medical Plaza I & II | |||
| Willetta Medical Properties(a.) |
90 | % | Edwards Medical Plaza | |||
| Santa Fe Scottsdale(a.) |
90 | % | Santa Fe Professional Plaza | |||
| 575 Hardy Investors(a.) |
90 | % | Centinela Medical Building Complex | |||
| Brunswick Associates |
74 | % | Mid Coast Hospital MOB | |||
| Deerval Properties(d.) |
90 | % | Deer Valley Medical Office II | |||
| PCH Medical Properties |
85 | % | Rosenberg Children’s Medical Plaza | |||
| Gold Shadow Properties(b.) |
98 | % | 700 Shadow Lane & Goldring MOBs | |||
| Arlington Medical Properties |
75 | % | Saint Mary’s Professional Office Building | |||
| ApaMed Properties |
85 | % | Apache Junction Medical Plaza | |||
| Spring Valley Medical Properties(b.) |
95 | % | Spring Valley Medical Office Building | |||
| Sierra Medical Properties |
95 | % | Sierra San Antonio Medical Plaza | |||
| Spring Valley Medical Properties II(b.) |
95 | % | Spring Valley Hospital Medical Office Building II | |||
| PCH Southern Properties |
95 | % | Phoenix Children’s East Valley Care Center | |||
| Centennial Medical Properties(b.) |
95 | % | Centennial Hills Medical Office Building I | |||
| Canyon Healthcare Properties |
95 | % | Canyon Springs Medical Plaza | |||
| 653 Town Center Investments(b.)(c.) |
95 | % | Summerlin Hospital Medical Office Building | |||
| DesMed(b.) |
99 | % | Desert Springs Medical Plaza | |||
| Deerval Properties II(d.) |
95 | % | Deer Valley Medical Office Building III | |||
| Cobre Properties |
95 | % | Cobre Valley Medical Plaza | |||
| Sparks Medical Properties(b.) |
95 | % | Vista Medical Terrace & The Sparks Medical Building | |||
| Auburn Medical Properties II(b.) |
95 | % | Auburn Medical Office Building II | |||
| Grayson Properties(b.)(e.) |
95 | % | Texoma Medical Plaza | |||
| BRB/E Building One(f.) |
95 | % | BRB Medical Office Building | |||
| Banburry Medical Properties(b.)(g.) |
95 | % | Summerlin Hospital MOB III | |||
| 3811 Bell Medical Properties(h.) |
95 | % | North Valley Medical Plaza | |||
| 653 Town Center Phase II(b.)(i.) |
98 | % | Summerlin Hospital MOB II | |||
| (a.) | The membership interests of this entity are held by a master LLC in which we hold a 90% non-controlling ownership interest. |
| (b.) | Tenants of this medical office building include or will include subsidiaries of UHS. |
| (c.) | The membership interests of this entity are held by a master LLC in which we hold a 95% non-controlling ownership interest. |
| (d.) | Deerval Parking Company, LLC, which owns the real property of a parking garage located near Deer Valley Medical Office Buildings II and III, is 50% owned by each of Deerval Properties and Deerval Properties II. |
| (e.) | We have committed to invest up to $4.8 million in equity and debt financing, of which $279,000 has been funded as of December 31, 2010. This building, which is on the campus of a replacement UHS hospital and has tenants that include subsidiaries of UHS, was completed and opened during the first quarter of 2010. This LLC has a third-party construction loan commitment of $13.3 million, which is non-recourse to us, all of which has been borrowed as of December 31, 2010. |
| (f.) | We have committed to invest up to $3.0 million in equity and debt financing, $1.9 million of which has been funded as of December 31, 2010, in an LLC that will own and operate this MOB which was completed and |
77
Table of Contents
| opened during the fourth quarter of 2010. This LLC obtained a third-party construction loan commitment of $6.2 million, which is non-recourse to us, $5.8 million of which has been borrowed as of December 31, 2010. |
| (g.) | We have committed to invest up to $5.2 million in equity and debt financing, of which $923,000 has been funded as of December 31, 2010. The LLC has a third-party term loan of $13.0 million, which is non-recourse to us, all of which has been borrowed as of December 31, 2010. This facility was completed and opened during the first quarter of 2009 and was accounted for on a consolidated basis through December 31, 2009. During January, 2010, the master lease threshold at this facility was met; therefore, this LLC is no longer deemed to be a variable interest entity and is accounted for on an unconsolidated basis pursuant to the equity method beginning January 1, 2010. |
| (h.) | We have committed to invest up to $6.2 million in equity and debt financing, $5.6 million of which has been funded as of December 31, 2010. This MOB was acquired during the first quarter of 2010. |
| (i.) | This LLC has a third-party loan of $12.8 million, which is non-recourse to us, all of which has been borrowed as of December 31, 2010. This facility was accounted for on a consolidated basis prior to October 1, 2010. During the fourth quarter of 2010, the master lease at this facility expired; therefore, this LLC is no longer deemed to be a variable interest entity and is accounted for on an unconsolidated basis pursuant to the equity method beginning October 1, 2010. |
Below are the combined statements of income for the LLCs accounted for under the equity method (including the three months ended December 31, 2010 for Summerlin Hospital MOB II which we began accounting for under the equity method on October 1, 2010, as discussed above):
| For the Year Ended December 31, | ||||||||||||
| 2010 | 2009 | 2008 | ||||||||||
| (amounts in thousands) | ||||||||||||
| Revenues |
$ | 55,770 | $ | 49,568 | $ | 46,612 | ||||||
| Operating expenses |
24,196 | 21,454 | 21,444 | |||||||||
| Depreciation and amortization |
12,556 | 10,585 | 8,843 | |||||||||
| Interest, net |
17,379 | 14,798 | 14,904 | |||||||||
| Net income |
$ | 1,639 | $ | 2,731 | $ | 1,421 | ||||||
| Our share of net income |
$ | 2,948 | $ | 3,092 | $ | 2,052 | ||||||
| (a.) | Our share of net income during 2010, 2009 and 2008, includes interest income earned by us on various advances made to LLCs of approximately $2.3 million, $1.6 million and $1.4 million, respectively. |
Below are the combined balance sheets for the LLCs accounted for under the equity method:
| December 31, | ||||||||
| 2010 | 2009 | |||||||
| (amounts in thousands) | ||||||||
| Net property, including CIP |
$ | 334,757 | $ | 296,623 | ||||
| Other assets |
27,912 | 21,666 | ||||||
| Total assets |
$ | 362,669 | $ | 318,289 | ||||
| Liabilities |
$ | 12,852 | $ | 13,097 | ||||
| Mortgage notes payable, non-recourse to us |
271,693 | 251,406 | ||||||
| Advances payable to us |
29,082 | 19,084 | ||||||
| Equity |
49,042 | 34,702 | ||||||
| Total liabilities and equity |
$ | 362,669 | $ | 318,289 | ||||
| Our share of equity and advances to LLCs |
$ | 80,442 | $ | 61,934 | ||||
78
Table of Contents
As of December 31, 2010, aggregate principal amounts due on mortgage notes payable by unconsolidated LLCs, which are accounted for under the equity method and are non-recourse to us, are as follows (amounts in thousands):
| 2011 |
$ | 47,796 | ||
| 2012 |
32,123 | |||
| 2013 |
28,216 | |||
| 2014 |
29,813 | |||
| 2015 |
63,570 | |||
| Later |
70,175 | |||
| Total |
$ | 271,693 | ||
| Name of LLC |
Mortgage Balance(b.) |
Maturity Date |
||||||
| PCH Medical Properties(a.) |
$ | 6,291 | 03/31/2011 | |||||
| Auburn Medical Properties(a.) |
8,304 | 04/02/2011 | ||||||
| Santa Fe Scottsdale(a.) |
2,559 | 06/10/2011 | ||||||
| Banburry Medical Properties(a.)(d.) |
12,975 | 06/30/2011 | ||||||
| Grayson Properties(a.)(c.)(e.) |
13,265 | 07/01/2011 | ||||||
| ApaMed Properties |
2,700 | 01/01/2012 | ||||||
| 575 Hardy Investors |
9,503 | 02/01/2012 | ||||||
| Gold Shadow Properties |
6,524 | 04/10/2012 | ||||||
| BRB/E Building One(c.) |
5,763 | 11/01/2012 | ||||||
| Sierra Medical Properties |
3,940 | 12/31/2012 | ||||||
| Centennial Medical Properties |
12,095 | 01/31/2013 | ||||||
| Sparks Medical Properties |
5,433 | 02/12/2013 | ||||||
| Litchvan Investments |
7,779 | 10/01/2013 | ||||||
| Paseo Medical Properties II |
17,000 | 06/08/2014 | ||||||
| 653 Town Center Investments |
9,765 | 07/01/2014 | ||||||
| Brunswick Associates |
8,356 | 01/01/2015 | ||||||
| Spring Valley Medical Properties |
5,667 | 02/10/2015 | ||||||
| DSMB Properties |
24,917 | 09/10/2015 | ||||||
| Arlington Medical Properties |
26,121 | 10/10/2015 | ||||||
| DVMC Properties |
4,267 | 11/01/2015 | ||||||
| Willetta Medical Properties |
13,019 | 10/10/2016 | ||||||
| Deerval Properties |
9,701 | 09/01/2017 | ||||||
| Deerval Properties II |
16,660 | 09/01/2017 | ||||||
| 653 Town Center Phase II |
12,810 | 10/01/2017 | ||||||
| Cobre Properties |
2,519 | 11/01/2017 | ||||||
| Canyon Healthcare Properties |
16,800 | 12/01/2017 | ||||||
| PCH Southern Properties |
6,960 | 12/01/2017 | ||||||
| $ | 271,693 | |||||||
| (a.) | We believe the terms of these loans are within current market underwriting criteria. At this time, we expect to refinance these loans on or before their 2011 maturity dates for three to ten year terms at the then current market interest rates. In the unexpected event that we are unable to refinance these loans on reasonable terms, we will explore other financing alternatives, including, among other things, potentially increasing our equity investment in the property utilizing funds borrowed under our revolving credit facility. |
| (b.) | All mortgage loans, other than construction loans, require monthly principal payments through maturity and include a balloon principal payment upon maturity. |
| (c.) | Construction loans. |
79
Table of Contents
| (d.) | We have the right to extend this loan for an additional six months to December 31, 2011, subject to certain leasing criteria set forth in the loan amendment dated December 29, 2010. Leasing criteria will be reviewed prior to the loan maturity date of June 30, 2011. If the leasing criteria has been met by June 30, 2011, the extension will be exercised and the loan will extend to December 31, 2011. |
| (e.) | We have the right to extend this loan for an additional thirty-six months to July 1, 2014, in the event that the master lease provision has not been met prior to the loan maturity date of July 1, 2011. |
During 2008, we advanced $4.0 million to our third-party partners in a certain LLC in connection with a $4.0 million loan agreement. Interest on this non-amortizing loan is paid to us on a quarterly basis. The interest rate on this loan is: (i) 4.25% plus LIBOR, or; (ii) if information to determine LIBOR is not available, three hundred seventy-five basis points over the then existing borrowing cost. The loan has a stated maturity date of 2012, although it may be prepaid without penalty and is secured by various forms of collateral, including personal guarantees from each of the partners to the loan, as well as their ownership interest in the LLC. Interest on this loan agreement has been paid to us through December 31, 2010.
Pursuant to the operating agreements of the LLCs, the third-party member and the Trust, at any time, have the right to make an offer (“Offering Member”) to the other member(s) (“Non-Offering Member”) in which it either agrees to: (i) sell the entire ownership interest of the Offering Member to the Non-Offering Member (“Offer to Sell”) at a price as determined by the Offering Member (“Transfer Price”), or; (ii) purchase the entire ownership interest of the Non-Offering Member (“Offer to Purchase”) at the equivalent proportionate Transfer Price. The Non-Offering Member has 60 days to either: (i) purchase the entire ownership interest of the Offering Member at the Transfer Price, or; (ii) sell its entire ownership interest to the Offering Member at the equivalent proportionate Transfer Price. The closing of the transfer must occur within 60 days of the acceptance by the Non-Offering Member.
The LLCs in which we have invested maintain property insurance on all properties. Although we believe that generally our properties are adequately insured, three of the LLCs in which we own various non-controlling equity interests, own properties in California that are located in earthquake zones. These properties, in which we have invested or advanced a total of $14.3 million at December 31, 2010, are not covered by earthquake insurance since earthquake insurance is no longer available at rates which are economical in relation to the risks covered.
| (9) | SEGMENT REPORTING |
Our primary business is investing in and leasing healthcare and human service facilities through direct ownership or through joint ventures, which aggregate into a single reportable segment. We actively manage our portfolio of healthcare and human service facilities and may from time to time make decisions to sell lower performing properties not meeting our long-term investment objectives. The proceeds of sales are typically reinvested in new developments or acquisitions, which we believe will meet our planned rate of return. It is our intent that all healthcare and human service facilities will be owned or developed for investment purposes. Our revenue and net income are generated from the operation of our investment portfolio.
Our portfolio is located throughout the United States however, we do not distinguish or group our operations on a geographical basis for purposes of allocating resources or measuring performance. We review operating and financial data for each property on an individual basis; therefore, we define an operating segment as our individual properties. Individual properties have been aggregated into one reportable segment based upon their similarities with regard to both the nature and economics of the facilities, tenants and operational processes, as well as long-term average financial performance.
80
Table of Contents
| (10) | QUARTERLY RESULTS (unaudited) |
| 2010 | ||||||||||||||||||||
| First Quarter |
Second Quarter |
Third Quarter |
Fourth Quarter |
Total | ||||||||||||||||
| (amounts in thousands, except per share amounts) | ||||||||||||||||||||
| Revenues(a.) |
$ | 7,644 | $ | 7,473 | $ | 7,171 | $ | 6,590 | $ | 28,878 | ||||||||||
| Net income |
$ | 4,527 | $ | 4,274 | $ | 3,387 | $ | 4,122 | $ | 16,310 | ||||||||||
| Total basic earnings per share |
$ | 0.37 | $ | 0.35 | $ | 0.27 | $ | 0.33 | $ | 1.33 | ||||||||||
| Total diluted earnings per share |
$ | 0.37 | $ | 0.35 | $ | 0.27 | $ | 0.33 | $ | 1.33 | ||||||||||
| 2009 | ||||||||||||||||||||
| First Quarter |
Second Quarter |
Third Quarter |
Fourth Quarter |
Total | ||||||||||||||||
| (amounts in thousands, except per share amounts) | ||||||||||||||||||||
| Revenues |
$ | 7,880 | $ | 8,023 | $ | 7,924 | $ | 8,087 | $ | 31,914 | ||||||||||
| Net income |
$ | 4,646 | $ | 4,802 | $ | 4,571 | $ | 4,557 | $ | 18,576 | ||||||||||
| Total basic earnings per share |
$ | 0.39 | $ | 0.40 | $ | 0.38 | $ | 0.38 | $ | 1.56 | ||||||||||
| Total diluted earnings per share |
$ | 0.39 | $ | 0.40 | $ | 0.38 | $ | 0.38 | $ | 1.56 | ||||||||||
| (a.) | On October 1, 2010, we began accounting for the Summerlin Hospital MOB II under the equity method, as previously discussed in Note 8. As a result, revenue generated from this MOB during the fourth quarter of 2010 is not included in the fourth quarter, 2010 revenue amounts presented. |
Additionally, on January 1, 2010, we began accounting for the Summerlin Hospital MOB III under the equity method, as previously discussed in Note 8. As a result, revenue generated from this MOB during 2010 is not included in the 2010 revenue amounts presented.
81
Table of Contents
Universal Health Realty Income Trust
Real Estate and Accumulated Depreciation—December 31, 2010
(amounts in thousands)
| Initial Cost to Universal Health Realty Income Trust |
Net cost capitalized/ divested subsequent to acquisition |
Gross amount at which carried at close of period |
Accumulated Depreciation as of Dec. 31, 2010 |
Date of construction, acquisition or most recent significant expansion or renovation |
Date Acquired |
Average Depreciable Life |
||||||||||||||||||||||||||||||||||
| Description |
Land | Building & Improv. |
Amount | Land | Building & Improvements |
Total | ||||||||||||||||||||||||||||||||||
| Inland Valley Regional Medical Center |
$ | 2,050 | $ | 10,701 | $ | 14,596 | $ | 2,050 | $ | 25,297 | $ | 27,347 | $ | 8,332 | 2007 | 1986 | 43 Years | |||||||||||||||||||||||
| McAllen Medical Center |
4,720 | 31,442 | 10,189 | 6,281 | 40,070 | 46,351 | 20,604 | 1994 | 1986 | 42 Years | ||||||||||||||||||||||||||||||
| Wellington Regional Medical Center |
1,190 | 14,652 | 17,370 | 1,663 | 31,549 | 33,212 | 11,955 | 2006 | 1986 | 42 Years | ||||||||||||||||||||||||||||||
| The Bridgeway |
150 | 5,395 | 4,571 | 150 | 9,966 | 10,116 | 4,638 | 2006 | 1986 | 35 Years | ||||||||||||||||||||||||||||||
| HealthSouth Deaconess Rehabilitation Hospital |
500 | 6,945 | 1,062 | 500 | 8,007 | 8,507 | 4,256 | 1993 | 1989 | 40 Years | ||||||||||||||||||||||||||||||
| Kindred Hospital Chicago Central |
158 | 6,404 | 1,838 | 158 | 8,242 | 8,400 | 7,704 | 1993 | 1986 | 25 Years | ||||||||||||||||||||||||||||||
| Family Doctor’s Medical Office Building |
54 | 1,526 | 494 | 54 | 2,020 | 2,074 | 711 | 1991 | 1995 | 45 Years | ||||||||||||||||||||||||||||||
| Kelsey-Seybold Clinic at King’s Crossing |
439 | 1,618 | 256 | 439 | 1,874 | 2,313 | 688 | 1995 | 1995 | 45 Years | ||||||||||||||||||||||||||||||
| Professional Center at King’s Crossing |
439 | 1,837 | 142 | 439 | 1,979 | 2,418 | 677 | 1995 | 1995 | 45 Years | ||||||||||||||||||||||||||||||
| Chesterbrook Academy |
307 | 996 | — | 307 | 996 | 1,303 | 325 | 1996 | 1996 | 45 Years | ||||||||||||||||||||||||||||||
| Chesterbrook Academy |
250 | 744 | — | 250 | 744 | 994 | 243 | 1991 | 1996 | 45 Years | ||||||||||||||||||||||||||||||
| Chesterbrook Academy |
180 | 815 | — | 180 | 815 | 995 | 264 | 1992 | 1996 | 45 Years | ||||||||||||||||||||||||||||||
| Chesterbrook Academy |
195 | 749 | — | 195 | 749 | 944 | 244 | 1992 | 1996 | 45 Years | ||||||||||||||||||||||||||||||
| The Southern Crescent Center I(b.) |
1,130 | 5,092 | (2,374 | ) | 1,130 | 2,718 | 3,848 | 1,687 | 1994 | 1996 | 45 Years | |||||||||||||||||||||||||||||
| The Southern Crescent Center II(b.) |
— | — | 3,859 | 806 | 3,053 | 3,859 | 1,260 | 2000 | 1998 | 35 Years | ||||||||||||||||||||||||||||||
| The Cypresswood Professional Center |
573 | 3,842 | 514 | 573 | 4,356 | 4,929 | 1,669 | 1997 | 1997 | 35 Years | ||||||||||||||||||||||||||||||
| 701 Tonopah Building |
— | 1,579 | — | — | 1,579 | 1,579 | 710 | 1999 | 1999 | 25 Years | ||||||||||||||||||||||||||||||
| Sheffield Medical Building |
1,760 | 9,766 | 3,687 | 1,760 | 13,453 | 15,213 | 5,432 | 1999 | 1999 | 25 Years | ||||||||||||||||||||||||||||||
| Medical Center of Western |
1,151 | 5,176 | 409 | 1,151 | 5,585 | 6,736 | 2,046 | 2000 | 2000 | 30 Years | ||||||||||||||||||||||||||||||
| Palmdale Medical Plaza(c.) |
— | 11,414 | 776 | — | 12,190 | 12,190 | 783 | 2008 | 2008 | 39 Years | ||||||||||||||||||||||||||||||
| Kindred Hospital-Corpus Christi(d.) |
1,104 | 5,508 | — | 1,104 | 5,508 | 6,612 | 455 | 2008 | 2008 | 35 Years | ||||||||||||||||||||||||||||||
| TOTALS |
$ | 16,350 | $ | 126,201 | $ | 57,389 | $ | 19,190 | $ | 180,750 | $ | 199,940 | $ | 74,683 | ||||||||||||||||||||||||||
| (a.) | At December 31, 2010 this property had an outstanding mortgage balance of $5.2 million. The mortgage carries a 6.0% interest rate and matures on June 1, 2017. The mortgage is non-recourse to us and is secured by the real estate assets of Medical Center of Western Connecticut. |
| (b.) | During 2008, a $4.6 million provision for asset impairment was recorded in connection with the real estate assets of Southern Crescent Center I & Southern Crescent Center II. |
| (c.) | At December 31, 2010 this property had an outstanding term loan balance of $6.6 million which carried a 5.1% fixed interest rate and is scheduled to mature on July 31, 2013. The mortgage is non-recourse to us and is secured by the real property of the building as well as property leases and rents. |
| (d.) | At December 31, 2010 this property had an outstanding mortgage balance of $3.2 million. The mortgage carries a 6.5% interest rate and is scheduled to mature in 2019. The mortgage is non-recourse to us and is secured by the Kindred Hospital-Corpus Christi. |
82
Table of Contents
UNIVERSAL HEALTH REALTY INCOME TRUST
NOTES TO SCHEDULE III
DECEMBER 31, 2010
(amounts in thousands)
| (1) | RECONCILIATION OF REAL ESTATE PROPERTIES |
The following table reconciles the Real Estate Properties from January 1, 2008 to December 31, 2010:
| 2010 | 2009 | 2008 | ||||||||||
| Balance at January 1, |
$ | 226,945 | $ | 220,904 | $ | 204,424 | ||||||
| Impact of deconsolidation of two LLCs(a.) |
(27,599 | ) | — | — | ||||||||
| Property additions |
594 | 6,041 | 14,684 | |||||||||
| Acquisitions |
— | — | 6,607 | |||||||||
| Provision for asset impairment |
— | — | (4,575 | ) | ||||||||
| Divestitures/disposals |
— | — | (236 | ) | ||||||||
| Balance at December 31, |
$ | 199,940 | $ | 226,945 | $ | 220,904 | ||||||
| (2) | RECONCILIATION OF ACCUMULATED DEPRECIATION |
The following table reconciles the Accumulated Depreciation from January 1, 2008 to December 31, 2010:
| 2010 | 2009 | 2008 | ||||||||||
| Balance at January 1, |
$ | 72,405 | $ | 66,255 | $ | 60,627 | ||||||
| Impact of deconsolidation of two LLCs(a.) |
(3,747 | ) | — | — | ||||||||
| Other |
— | — | (86 | ) | ||||||||
| Current year depreciation expense |
6,025 | 6,150 | 5,714 | |||||||||
| Balance at December 31, |
$ | 74,683 | $ | 72,405 | $ | 66,255 | ||||||
| (a.) | On October 1, 2010, we began accounting for the Summerlin Hospital MOB II under the equity method, as previously discussed in Note 8. As a result, the property and accumulated depreciation of this MOB are not included in the 2010 property amounts presented. |
83
Table of Contents
| Exhibit No. |
Exhibit | |||
| 3.1 | Declaration of Trust, dated as of August 1986, previously filed as Exhibit 4.1 to the Trust’s Registration Statement on Form S-3 (File No. 333-60638) is incorporated herein by reference. | |||
| 3.2 | Amendment to Declaration of Trust, dated as of June 15, 1993, previously filed as Exhibit 4.2 to the Trust’s Registration Statement on Form S-3 (File No. 333-60638) is incorporated herein by reference. | |||
| 3.3 | Amended and restated bylaws previously filed as Exhibit 4.3 to the Trust’s registration statement on Form S-3 (File No. 333-60638) is incorporated herein by reference. | |||
| 10.1 | Advisory Agreement, dated as of December 24, 1986, between UHS of Delaware, Inc. and the Trust, previously filed as Exhibit 10.2 to the Trust’s Current Report on Form 8-K dated December 24, 1986, is incorporated herein by reference. | |||
| 10.2 | Agreement dated December 6, 2010, to renew Advisory Agreement dated as of December 24, 1986 between Universal Health Realty Income Trust and UHS of Delaware, Inc. | |||
| 10.3 | Contract of Acquisition, dated as of August 1986, between the Trust and certain subsidiaries of Universal Health Services, Inc., previously filed as Exhibit 10.2 to Amendment No. 3 of the Registration Statement on Form S-11 and S-2 of Universal Health Services, Inc. and the Trust (File No. 33-7872), is incorporated herein by reference. | |||
| 10.4 | Form of Leases, including Form of Master Lease Document Leases, between certain subsidiaries of Universal Health Services, Inc. and the Trust, previously filed as Exhibit 10.3 to Amendment No. 3 of the Registration Statement on Form S-11 and Form S-2 of Universal Health Services, Inc. and the Trust (File No. 33-7872), is incorporated herein by reference. | |||
| 10.5 | Corporate Guaranty of Obligations of Subsidiaries Pursuant to Leases and Contract of Acquisition, dated December 1986, issued by Universal Health Services, Inc. in favor of the Trust, previously filed as Exhibit 10.5 to the Trust’s Current Report on Form 8-K dated December 24, 1986, is incorporated herein by reference. | |||
| 10.6 | Lease, dated December 22, 1993, between the Trust and THC-Chicago, Inc., as lessee, previously filed as Exhibit 10.14 to the Trust’s Annual Report on Form 10-K for the year ended December 31, 1993, is incorporated herein by reference. | |||
| 10.7* | Universal Health Realty Income Trust 1997 Incentive Plan, previously filed as Exhibit 10.1 to the Trust’s Form 10-Q for the quarter ended September 30, 1997, is incorporated herein by reference. | |||
| 10.8 | Credit Agreement, dated as of January 19, 2007, by and among the Trust, the financial institutions from time to time party thereto and Wachovia Bank, National Association, as Administrative Agent, previously filed as Exhibit 10.1 to the Trust’s Current Report on Form 8-K dated January 24, 2007, is incorporated herein by reference. | |||
| 10.9 | Dividend Reinvestment and Share Purchase Plan included in the Trust’s Registration Statement Form S-3 (Registration No. 333-81763) filed on June 28, 1999, is incorporated herein by reference. | |||
| 10.10 | Asset Exchange and Substitution Agreement, dated as of April 24, 2006, by and among the Trust and Universal Health Services, Inc. and certain of its subsidiaries, previously filed as Exhibit 10.1 to the Trust’s Current Report on Form 8-K dated April 25, 2006, is incorporated herein by reference. | |||
| 10.11 | Amendment No. 1 to the Master Lease Document, between certain subsidiaries of Universal Health Services, Inc. and the Trust, previously filed as Exhibit 10.2 to the Trust’s Current Report on Form 8-K dated April 25, 2006, is incorporated herein by reference. | |||
84
Table of Contents
| Exhibit No. |
Exhibit | |||
| 10.12 | * | Universal Health Realty Income Trust 2007 Restricted Stock Plan, previously filed as Exhibit 10.1 to the Trust’s Current Report on Form 8-K, dated April 27, 2007, is incorporated herein by reference. | ||
| 10.13 | * | Form of Restricted Stock Agreement, previously filed as Exhibit 10.2 to the Trust’s Current Report on Form 8-K dated April 27, 2007, is incorporated herein by reference. | ||
| 11 | Statement re computation of per share earnings is set forth on the Consolidated Statements of Income. | |||
| 21 | Subsidiaries of Registrant. | |||
| 23.1 | Consent of Independent Registered Public Accounting Firm. | |||
| 31.1 | Certification from the Trust’s Chief Executive Officer Pursuant to Rule 13a-14(a)/15(d)-14(a) of the Securities Exchange Act of 1934. | |||
| 31.2 | Certification from the Trust’s Chief Financial Officer Pursuant to Rule 13a-14(a)/15(d)-14(a) of the Securities Exchange Act of 1934. | |||
| 32.1 | Certification from the Trust’s Chief Executive Officer pursuant to 18 U.S.C. Section 1350, as adopted pursuant to Section 906 of the Sarbanes-Oxley Act of 2002. | |||
| 32.2 | Certification from the Trust’s Chief Financial Officer pursuant to 18 U.S.C. Section 1350, as adopted pursuant to Section 906 of the Sarbanes-Oxley Act of 2002. | |||
| * | Management contract or compensatory plan or arrangement. |
85