Attached files
Table of Contents
Index to Financial Statements
UNITED STATES
SECURITIES AND EXCHANGE COMMISSION
WASHINGTON, D.C. 20549
FORM 10-K
| x | ANNUAL REPORT PURSUANT TO SECTION 13 OR 15(d) OF THE SECURITIES EXCHANGE ACT OF 1934 |
For the fiscal year ended DECEMBER 31, 2010
OR
| ¨ | TRANSITION REPORT PURSUANT TO SECTION 13 OR 15(d) OF THE SECURITIES EXCHANGE ACT OF 1934 |
For the transition period from to
Commission file number: 0-31049
TradeStation Group, Inc.
(Exact name of registrant as specified in its charter)
| Florida | 65-0977576 | |
| (State or other jurisdiction of incorporation or organization) |
(I.R.S. Employer Identification No.) | |
| 8050 S.W. 10th Street, Suite 4000, Plantation, Florida |
33324 | |
| (Address of principal executive offices) | (Zip Code) | |
954-652-7000
(Registrant’s telephone number, including area code)
Securities registered pursuant to Section 12(b) of the Act:
| Title of each class |
Name of each exchange on which registered | |
| Common Stock, par value $.01 per share | NASDAQ Global Select Market |
Securities registered pursuant to Section 12(g) of the Act: None
Indicate by check mark if the registrant is a well-known seasoned issuer, as defined in Rule 405 of the Securities Act. ¨ Yes x No
Indicate by check mark if the registrant is not required to file reports pursuant to Section 13 or Section 15(d) of the Act. ¨ Yes x No
Indicate by check mark whether the registrant (1) has filed all reports required to be filed by Section 13 or 15(d) of the Securities Exchange Act of 1934 during the preceding 12 months (or for such shorter period that the registrant was required to file such reports), and (2) has been subject to such filing requirements for the past 90 days. x Yes ¨ No
Indicate by check mark whether the registrant has submitted electronically and posted on its corporate Web site, if any, every Interactive Data File required to be submitted and posted pursuant to Rule 405 of Regulation S-T (§232.405) during the preceding 12 months (or for such shorter period that the registrant was required to submit and post such files). ¨ Yes ¨ No
Indicate by check mark if disclosure of delinquent filers pursuant to Item 405 of Regulation S-K (§229.405) is not contained herein, and will not be contained, to the best of registrant’s knowledge, in definitive proxy or information statements incorporated by reference in Part III of this Form 10-K or any amendment to this Form 10-K. x
Indicate by check mark whether the registrant is a large accelerated filer, an accelerated filer, a non-accelerated filer, or a smaller reporting company. See the definitions of “large accelerated filer,” “accelerated filer” and “smaller reporting company” in Rule 12b-2 of the Exchange Act. (Check one):
| Large accelerated filer | ¨ | Accelerated filer | x | |||
| Non-accelerated filer | ¨ (Do not check if a smaller reporting company) | Smaller reporting company | ¨ | |||
Indicate by check mark whether the registrant is a shell company (as defined in Rule 12b-2 of the Exchange Act). ¨ Yes x No
The aggregate market value of voting stock held by non-affiliates as of June 30, 2010 (based upon the closing price of $6.75 per common share as quoted on The NASDAQ Global Select Market on such date), was approximately $273,586,302.
The registrant had 40,120,210 shares of common stock, $.01 par value, outstanding as of March 1, 2011.
DOCUMENTS INCORPORATED BY REFERENCE
Certain portions of the registrant’s definitive proxy statement to be filed within 120 days after December 31, 2010 in connection with its 2011 annual meeting of shareholders are incorporated by reference in Part III of this report.
Table of Contents
Index to Financial Statements
i
Table of Contents
Index to Financial Statements
| ITEM 9. |
CHANGES IN AND DISAGREEMENTS WITH ACCOUNTANTS ON ACCOUNTING AND FINANCIAL DISCLOSURE | 57 | ||||
| ITEM 9A. |
CONTROLS AND PROCEDURES | 57 | ||||
| ITEM 9B. |
OTHER INFORMATION | 58 | ||||
| ITEM 10. |
DIRECTORS, EXECUTIVE OFFICERS AND CORPORATE GOVERNANCE | 59 | ||||
| ITEM 11. |
EXECUTIVE COMPENSATION | 59 | ||||
| ITEM 12. |
SECURITY OWNERSHIP OF CERTAIN BENEFICIAL OWNERS AND MANAGEMENT AND RELATED STOCKHOLDER MATTERS | 59 | ||||
| Equity Compensation Plan Information | 60 | |||||
| ITEM 13. |
CERTAIN RELATIONSHIPS AND RELATED TRANSACTIONS, AND DIRECTOR INDEPENDENCE | 60 | ||||
| ITEM 14. |
PRINCIPAL ACCOUNTANT FEES AND SERVICES | 60 | ||||
| ITEM 15. |
EXHIBITS AND FINANCIAL STATEMENT SCHEDULES | 61 | ||||
| 65 | ||||||
Table of Contents
Index to Financial Statements
| ITEM 1. | BUSINESS |
Overview and Recent Developments
TradeStation Group, Inc., a Florida corporation formed in 2000, is the successor company to a publicly-held trading software company that was formed in 1982. TradeStation Group is listed on The NASDAQ Global Select Market under the symbol “TRAD.” TradeStation Securities, Inc., a licensed securities broker-dealer and a registered futures commission merchant, and TradeStation Technologies, Inc., a trading technology company, are TradeStation Group’s two established operating subsidiaries. The company has two other subsidiaries. TradeStation Europe Limited, a company organized under the laws of England and Wales, is authorized and regulated by the UK Financial Services Authority (FSA), and holds what is known as a “Passport,” to introduce brokerage accounts for residents of countries within the European Economic Area. TradeStation Forex, Inc., a Florida corporation (“TradeStation Forex”), was recently formed to assume, own and conduct all of our forex brokerage business (such business has historically been owned and conducted by TradeStation Securities using an established forex dealer firm to clear its forex business). In January 2011, TradeStation Forex was registered with the Commodity Futures Trading Commission (CFTC) as a Retail Foreign Exchange Dealer (RFED) and approved by the National Futures Association (NFA) as a forex dealer member (FDM). Later in 2011, TradeStation Forex expects to receive a transfer of all of TradeStation Securities’ forex accounts and commence operations as a forex dealer (at which time TradeStation Securities will cease its forex business). TradeStation Forex’s business model will be what is commonly referred to as “agency execution” or the “agency model”.
The company’s core product/service, which is offered by TradeStation Securities (as well as TradeStation Europe and, soon, TradeStation Forex), is TradeStation, an award-winning electronic trading platform that enables traders to test and automate “rules-based” trading strategies (both technical and fundamental) across multiple asset classes, namely, equities, equity and index options, futures (chiefly electronic futures contracts), and foreign currencies (forex). The TradeStation electronic trading platform seamlessly integrates powerful strategy trading software tools, historical and streaming real-time market data, and electronic order-routing and execution. The TradeStation platform’s electronic order-routing of trades means, with respect to equities, equity and index options, and futures transactions, Internet connections to all major U.S., and some major European, electronic exchanges and marketplaces, or electronic access provided by certain market makers or other third parties who offer or enable ‘best execution.’ In each of these electronic marketplaces, buyers and sellers participating on the network are matched, often instantaneously following the placement of their orders. In addition to strategy trading tools, real-time market data and order placement and routing, the TradeStation electronic trading platform offers powerful automated and manual advanced order placement functions and capabilities, and numerous advanced charting and analytics features.
TradeStation Securities is a leading online brokerage firm that serves the active trader and certain institutional trader markets, and is the company’s principal operating subsidiary. TradeStation Securities is a member and subject to the rules and requirements of the New York Stock Exchange (NYSE), Financial Industry Regulatory Authority (FINRA), Securities Investor Protection Corporation (SIPC), NFA, the Depository Trust & Clearing Corporation (DTCC), Options Clearing Corporation (OCC), Boston Options Exchange (BOX), Chicago Board Options Exchange (CBOE), Chicago Stock Exchange (CHX), International Securities Exchange (ISE), NASDAQ OMX, EDGA Exchange (EDGA), EDGX Exchange (EDGX), and BATS Exchange (BATS). TradeStation Securities’ business
1
Table of Contents
Index to Financial Statements
is also subject to the rules and requirements of the Securities and Exchange Commission (SEC), CFTC and state regulatory authorities (the firm is registered to conduct its brokerage business in all 50 states and the District of Columbia). TradeStation Securities self-clears most of its equities and equity and index options business, and uses an established futures clearing firm to clear its futures business on an omnibus clearance basis.
We believe that our new forex offering through TradeStation Forex will be superior to what we previously provided in many ways. We will now be brokering as principal to our clients (also referred to as “agency execution” or the “agency model”), no longer introducing accounts to a third-party forex dealer, and use systems and relationships designed to offer narrower, more-transparent price spreads. We will no longer charge a monthly service fee to forex customers to gain access to our trading platform, and will charge no fees for forex data and no commissions. Our profit on each trade will be limited to a reasonable mark-up of the spread that we believe will not affect the competitiveness of the spread in the marketplace. We have also built into TradeStation a brand new screen interface for customers to place orders in an intuitive and familiar way, which is seamlessly integrated with the analytics power of our platform. We also will include, at no extra charge, the functionality of our premium RadarScreen product so that our customers can analyze multiple foreign currency pairs simultaneously on one screen. Also, to make the offering more attractive to the large and growing retail forex market outside of the United States, accounts can be funded and monitored in one of several different foreign currencies. We believe this combination of features and pricing produces a forex offering that is superior not only to what we previously offered, but also superior to what is generally available in the market today for retail forex traders.
TradeStation Securities’ TradeStation Prime Services division, based in New York, seeks to provide prime brokerage services, including securities lending, execution platforms (including TradeStation), clearance and settlement of trades, start-up assistance, outsourced/direct access trading, real-time risk management and portfolio reporting to small and mid-sized hedge funds and other firms. In September 2010, TradeStation Securities received final FINRA approval for TradeStation Prime Services to conduct prime services and securities lending business, and its securities lending operations were launched near the end of 2010. We expect securities lending to be a driving force of the division, and it is a brand new source of revenue for TradeStation. Also, unlike firms who have been in this business and seen spreads and revenues contract due to low interest rates, we believe we are entering at or near the floor and see opportunities to grow revenues as and when interest rates and spreads increase. To build a strong offering, we recently licensed the use of an automated stock loan system, and by the end of March 2011 expect to have more than doubled our active counterparty relationships and tripled our aggregate credit limit, including the addition of some very large counterparty firms.
In addition to our anticipated launch of our new forex offering through TradeStation Forex and our new securities lending business through TradeStation Prime Services, we have had three other recent developments worth mentioning: (1) in October 2010 we released TradeStation 9.0, the next generation of our award-winning platform and the most significant software upgrade since TradeStation’s 2001 launch as an online brokerage platform; (2) in the spring and summer of 2010 we made two software technology purchases which, once integrated into TradeStation, should provide our clients with improved back-testing, optimization and strategy building tools, as well as the ability to perform portfolio testing of trading strategies; and (3) we gave our clients the ability to trade on the Eurex Group futures and index exchanges, the second largest futures market, after the CME Group, in the world, including the ability to fund and monitor their accounts in one of several foreign currencies.
2
Table of Contents
Index to Financial Statements
In the Technical Analysis of Stocks and Commodities magazine Readers’ Choice Awards published in February 2011, TradeStation was named, for the seventh consecutive year, best Trading Systems – Stocks and best Trading Systems – Futures. TradeStation was also named, for the ninth year in a row, best Institutional Platform and best Professional Platform. Also in February 2011, TradeStation Securities was ranked the #1 brokerage by TraderPlanet.com and SFO Magazine in their 2010 Superior Trading and Resource (STAR) Awards.
At December 31, 2010, TradeStation Securities had approximately 47,600 equities, futures and forex accounts, the vast majority of which were equities and futures accounts, compared to approximately 46,200 accounts at December 31, 2009. During the 2010 fourth quarter, TradeStation Securities’ brokerage customer account base averaged approximately 73,600 daily average revenue trades (often called “DARTs”), compared to just over 79,000 during the 2009 fourth quarter. During 2010, the average TradeStation Securities account made over 431 revenue trades. As of December 31, 2010, the average asset balance of an equities account was approximately $73,000 and the average asset balance of a futures account was approximately $23,000. As of December 31, 2010, total account assets were approximately $2.4 billion.
During 2010, approximately 59% (as compared to approximately 54% during 2009) of TradeStation Securities’ brokerage commissions and fees, were generated by derivatives trading (financial and commodity futures, equity and index options, and spot forex), as opposed to cash equities trading (stocks and ETFs). These results are consistent with a trend over the past few years towards derivatives trading by TradeStation Securities’ customer account base (when TradeStation Securities launched the TradeStation platform in mid-2001, nearly all of its accounts and customer trades were cash equities).
TradeStation Technologies owns all of our intellectual property. TradeStation Technologies also provides subscription services for TradeStation. The subscription version of TradeStation is an institutional-quality charting and analysis service that offers strategy trading software tools that generate real-time buy and sell alerts based upon the subscriber’s programmed strategies, but does not include order execution or other brokerage services. Subscribers are charged a monthly subscription fee. The TradeStation trading software platform, was named for the eighth year in a row, best Online Analytical Platform in the Technical Analysis of Stocks and Commodities magazine Readers’ Choice Awards published in February 2011.
Economic events during the past few years have had some negative impact on the company. Historically, the company has derived a significant portion of its brokerage revenues from interest income. In 2009, decreases in the federal funds target and daily rates of interest, as well as decreases in U.S. treasury bill and U.S. treasury note rates of interest, began having a negative impact on the company’s interest income (which continues through today) and, consequently, its brokerage revenues and net income. We also believe that high unemployment and other economic and market factors, among other factors, have contributed to our experiencing lower net brokerage account growth during 2010 than the net growth rates we previously achieved.
We have never engaged in, and have no plans to engage in, the business of creating, buying, or selling mortgages, mortgage backed securities or credit default swaps, or any banking or insurance related activities. We do not engage in proprietary trading, so our cash investments are not subject to the risks of sudden market movements. We have no long-term debt and do not utilize a credit facility or any other borrowing mechanism to fund our operations. As a result, the tightening of the credit markets has had no material impact, and is not expected to have any material impact, on the company’s ability to continue its day-to day operations.
3
Table of Contents
Index to Financial Statements
Our principal executive offices are located in The TradeStation Building, 8050 S.W. 10th Street, Suite 4000, Plantation, Florida 33324, and our telephone number is (954) 652-7000. Our Web site is www.tradestation.com.
THIS REPORT (PARTICULARLY “ITEM 1. BUSINESS,” “ITEM 3. LEGAL PROCEEDINGS” AND “ITEM 7. MANAGEMENT’S DISCUSSION AND ANALYSIS OF FINANCIAL CONDITION AND RESULTS OF OPERATIONS”) CONTAINS STATEMENTS THAT ARE FORWARD-LOOKING WITHIN THE MEANING OF SECTION 27A OF THE SECURITIES ACT OF 1933, AS AMENDED, AND SECTION 21E OF THE SECURITIES EXCHANGE ACT OF 1934, AS AMENDED. SEE “ITEM 1A. RISK FACTORS.”
U.S. Active Trader Market
An active trader in the United States was defined by Celent Communications in a February 2009 research report (“Online Brokerages: Trends and Developments – The Online World Changes Investing Yet Again”) as one who trades on average at least 10 times per month, or 120 times per year. Celent estimated in its 2009 report that out of the estimated 30 to 40 million online brokerage accounts in the United States, a little less than 5% (1,500,000 to 2,000,000) of those accounts meets that definition. Similarly, a November 2005 research report by Fox-Pitt, Kelton (a financial advisory firm later acquired by Macquarie) characterized active equities traders as those who tend to trade from 10 to 20 times a month, with account balances in the $25,000 to $75,000 range, and who utilize margin to some degree in their trading. A January 2009 research report by Keefe, Bruyette & Woods, which estimated the total number of online accounts at that time to be 25 million, indicated that about 6%, or 1.5 million, of those accounts are active trader accounts, and that such active trader accounts generate more than 50% of the total revenue generated by all online brokerage accounts. It is generally accepted in our industry that the active trader segment of the retail online or “self-directed” trading market generates the majority of that market’s trade volume and brokerage revenues and has substantially higher account balances.
In July 2010, Celent issued another research report titled “The Self-Directed Investment Market: A Focus on Active Investors.” In this report, Celent repeated its general characterization of the active trader as one who trades over 10 times per month, and described a second segment, the active investor, as one who trades 3 to 10 times per month. While this report was focused mainly on the “active investor” segment (or viewing the active trader and active investor segments as a whole), it noted that active investors and active traders share similar characteristics. They tend: to be more sophisticated and demand enhanced tools, advanced trading capabilities, integrated charting features and real-time market information; to favor sophisticated products (such as options, futures and foreign currencies) that exhibit a large degree of short-term price volatility; and to be comfortable using leverage to enhance returns. The report noted, however, that active traders are more sensitive to commission rates, execution speed and streaming information, while active investors put more weight on services such as education and social networking. The report also described active traders as more directional or event driven (as opposed to using fundamental analysis), in other words, more open to opportunistic situations. This report, generally consistent with Celent’s 2009 report, estimated the active-trader market size to represent about 4% (or 1.6 million) of all online investors, and predicted that by 2012 the active investor market will reach 16 million investors, or 40%, of the estimated self-directed market of 40 million.
4
Table of Contents
Index to Financial Statements
Looking forward, the 2010 Celent report noted it expects that growth rates in the self-directed investor market will improve over the next three years, that access to sophisticated investment products as well as anticipated market volatility will encourage the active trader and active investor segments to grow at a faster rate than the traditional investor segment, that self-directed investors will demand access to a more diverse set of products, including options trading and foreign exchange, that the online brokerage sector will face more consolidation, that high trading volume and use of complex strategies will continue to make the active trader and active investor a very profitable segment for online brokerages, and that, as these segments continue to grow and make up a larger share of the self-directed market, online brokerages will need to enhance their platforms (in the areas discussed above) to remain competitive.
U.S. Institutional Trader Market
We see the institutional trader market in the United States, as it relates to potential customer relationships for electronic brokerage firms like TradeStation Securities (and its TradeStation Prime Services division), consisting of buy side firms such as certain hedge funds, money managers, commodity trading advisors and commodity pool operators, registered investment advisers who use short-term trading strategies, and certain proprietary trading desks at large firms. Many believe that smaller-sized buy side institutional traders have become less and less pleased with Wall Street (traditional sell side brokerage firms) and are moving, to one degree or another, towards using execution management systems (EMS’s) to execute their trading decisions. Also, generally speaking, the large Wall Street firms have, in the past few years, raised considerably the minimum account balance required for a hedge fund to have an account with them and to receive certain types of services, such as portfolio margining. A January 2006 Bear Stearns (now J.P. Morgan Clearing Corp.) report stated that “the impact of financial technology on the securities markets cannot be understated,” noting that “the technologies originally developed to give the ‘day trader’ the ability to trade with professionals is now, ironically, being targeted at institutional customers by most brokerage firms.” Institutional trading currently represents a small percentage of the company’s brokerage revenues. To grow this part of our business, we launched in 2010 our TradeStation Prime Services division, which seeks to fill the need of start-up to mid-sized hedge funds, registered investment advisers, professional traders and asset managers for quality prime brokerage services, including securities lending.
Non-U.S. Markets
We believe there are market opportunities outside of the United States for TradeStation at both the retail and institutional levels. We believe that to compete fully and effectively for active traders in those markets a trading platform needs to be connected to local or regional exchanges for both market data and order placement and execution, and there needs to be language translations of user materials, acceptance of local currencies to fund and monitor accounts (even if all account activity is in U.S. Dollars), and local customer and technical support. We also believe opportunities exist in certain regions to develop what is often called “cross-border” business, meaning online traders outside the U.S. interested in trading U.S. equities, equity options and futures exchange markets. We plan, through both the efforts of our TradeStation Europe Limited subsidiary, TradeStation Forex’s new forex account offering, our recent expansion of our trading platform to the Eurex Group and ICE Europe Group markets, and independent agents in local markets, to expand our penetration of these markets, which to date has been limited. In addition to these steps we have taken, we have also added
5
Table of Contents
Index to Financial Statements
to our brokerage platform, to enable the performance of research and analysis, market data for Xetra and five German regional exchanges, initiated referral localization efforts in Germany and Italy, and now offer to many non-U.S. customers the ability to fund and monitor their futures and forex accounts in their local currencies.
According to Celent’s 2009 report, U.S. investors’ interest in international equities has grown in recent years, as they are increasingly using international equities to diversify their portfolios and reduce risk, gain exposure to foreign currencies, and achieve superior returns offered by some emerging markets. We also believe that our new forex offering (once launched), which is an international market, can, subject to the effect of buying power/margin limits that have been imposed by the CFTC, have appeal to forex traders worldwide.
Overview – TradeStation
Our main product/service offering is the TradeStation electronic trading platform for self-directed, active, including semi-professional, traders and certain segments of the institutional buy side trader market. TradeStation does not provide investment or trading advice or recommendations, or recommend the use of any particular strategy, but rather enables the trader to design, test, optimize and automate his own, custom trading strategies or make trading decisions by using other of the numerous research and analysis tools the platform offers. TradeStation is a registered trademark in the United States, Australia, Canada, the European Community, Indonesia, Korea, Singapore, South Africa and Taiwan.
In addition to offering the TradeStation electronic trading platform to the brokerage customers of our TradeStation Securities and, later this year, TradeStation Forex subsidiaries, we offer, through our TradeStation Technologies subsidiary, TradeStation subscriptions. The difference between the TradeStation electronic trading platform and the TradeStation subscription service is that the subscription service does not include order execution or account management capabilities.
TradeStation has, since its initial release as a strategy trading software program in 1991, been our flagship product. It has also served, and continues to serve, as a strategy trading platform for numerous third-party trading software applications. Its state-of-the-art technology empowers the trader to design and develop a rules-based trading strategy based upon the trader’s objective rules and criteria, test the potential profitability of that trading strategy against historical data, and then computer-automate it to monitor the applicable market and alert the trader in real-time (or instantaneously place the trade order) when the criteria of the trading strategy have been met and an order should, therefore, be placed. The principal feature of TradeStation that enables the trader to design and develop trading strategies is EasyLanguage. EasyLanguage is a proprietary computer language we developed consisting of English-like statements and trading terms which can be input by the trader to describe particular objective rules and criteria. The trader then has considerable flexibility to modify and combine different trading rules and criteria, which ultimately result in the design of the trader’s trading strategies. EasyLanguage is also a registered trademark.
In the 2010 fourth quarter, we announced the launch of TradeStation 9.0. We expect that TradeStation 9.0 will reset the bar for trading platforms in the retail online brokerage industry by empowering customers and trading software developers to automate and test strategies in the equities, options, futures and forex markets unlike anything else currently available. With TradeStation 9.0,
6
Table of Contents
Index to Financial Statements
traders are able to automatically monitor market depth and receive an alert, or even place a trade, the moment the trader’s rule or trigger is met. Traders now may also have TradeStation monitor their open positions and continuously perform risk assessments, so that in a fast market downturn or upturn the appropriate action will automatically be executed. Traders also have the ability to execute code on a fixed time interval, access to all of the details for their orders and positions, and, on RadarScreen® (TradeStation’s state-of-the-art market scanning engine) access to multiple data streams. TradeStation 9.0 also includes dozens of other popular enhancement requests for EasyLanguage, as well as for the TradeStation Development Environment, which is used as the open platform on which third-party developers can add their own trading applications. TradeStation 9.0 also has a new look and feel. We have improved the icons, enhanced some of the graphics and colors, and added a “Quick Start” to help TradeStation users create an optimal workspace. Also, our Options Development Team has, in TradeStation 9.0, added another set of enhancements to OptionStation, the company’s highly-regarded automated research product for options trading analysis and decision-making.
Brokerage Services
Our principal offering today is online brokerage services covering equities (principally stocks and ETFs), equity and index options, financial and commodities futures (principally electronic financial futures contracts, such as e-mini’s) and futures options, and spot forex transactions through the TradeStation electronic trading platform. Our targeted customer base for brokerage services includes active, including semi-professional, traders and certain institutional traders, such as hedge funds, money managers, investment advisors and proprietary trading desks who use short-term trading strategies, where the decision-maker is also the person placing the trade orders. In addition to providing online services through the TradeStation electronic trading platform, we offer personal support services by registered trade-desk representatives who execute customers’ orders through electronic order execution systems if the customer is for some reason unable or unwilling to place the order using his or her own computer, and provide client support, education and training via our website.
Having or using an electronic order execution system, whether accessed directly by the brokerage customer through the TradeStation electronic trading platform or by a registered representative or associate on behalf of the brokerage customer, means that both the online services and the firm’s trading desks are connected to electronic equities, equity and index options, futures and forex market centers, market makers or dealers. This system often results in the simplest, most direct and speediest execution of orders at the best available price. With respect to pit-traded futures contracts, TradeStation is directly connected to its futures clearing agent’s online execution system, which sends the order directly to the trading pit. Approximately 96% of the company’s futures trades are on the electronic futures exchanges. With respect to forex deals, until the new forex offering is launched, the TradeStation electronic trading platform is seamlessly connected to a third-party forex dealer’s system for the placement of forex orders directly from the TradeStation platform. Later in 2011, TradeStation, as described earlier, expects to offer forex account services directly as a CFTC/NFA licensed/member forex dealer.
TradeStation Securities self-clears for its active trader, and some of its institutional, equity securities accounts, including stock, ETF, and equity and index option trades. Other institutional accounts for equity securities are carried on a “fully disclosed” basis by the brokerage’s clearing agents or are given order execution services on a DVP/RVP basis for equities, or a “give-up” basis for futures, in either case with the orders cleared and settled by the client’s prime brokerage firm. In January 2010, we completed a transition of our futures clearance arrangement from a fully-disclosed relationship to
7
Table of Contents
Index to Financial Statements
an omnibus clearance relationship basis with a facilities management agreement. Under the facilities management agreement, our futures clearance agent, as TradeStation’s back-office vendor, provides on behalf of TradeStation many of the back-office services required to support those individual futures accounts which it provided when those accounts were fully disclosed and carried on our clearance agent’s books and records. Over time, TradeStation intends to rely less on the services provided under the facilities management agreement and eventually to provide all such back-office services in a manner similar to what it does for its self-clearing of equities and equity options accounts. Accordingly, when our new forex offering is launched, all of our retail (and some of our institutional) customers will maintain their equities, futures and forex accounts directly with TradeStation, including custody and control by TradeStation of those customers’ account assets and the carrying of those individual accounts on TradeStation’s books and records. TradeStation executes its customers’ securities and futures transactions on an agency basis only, as opposed to a principal basis. That is, it acts as the agent for its customers directly in the market. When brokerage firms perform transactions on a principal basis, they are permitted to accept a customer’s order to purchase, purchase the securities in the market for the brokerage firm, and then sell the securities to the customer, or otherwise act as counterparty to the customer’s transaction. TradeStation Securities does not do this. It charges only an agreed-upon commission and does not earn income from marking up or marking down its customers’ securities, and futures transactions. Under the new forex offering, TradeStation Forex’s profit on each customer forex trade will be limited to a reasonable mark-up of the spread that we believe offers very competitive, and possibly superior, pricing in the retail forex marketplace.
Software Products and Services
In December 2000, we launched the TradeStation electronic subscription service. The TradeStation electronic subscription service includes our award-winning strategy trading features and functions, streaming real-time charts and quotes, streaming news, state-of-the-art analytical charting, and all other features included in the TradeStation electronic trading platform other than trade order placement and other trading or brokerage-related features or services. Effective May 1, 2006, the TradeStation electronic subscription service was offered to new subscribers at the monthly rate of $249.95 and to legacy customers who had “upgraded” at a monthly rate of $179.95. We evaluate our approach to subscription fee pricing on an ongoing basis. TradeStation (both as a subscription service and as a brokerage account trading platform) also offers our OptionStation and RadarScreen functions and features. OptionStation is an options trading analysis product for equity, index and futures options that enables traders to explore options trading strategies. RadarScreen enables traders to scan securities markets to identify potential buying or selling opportunities based upon the traders’ own trading strategies.
We ceased marketing our legacy software products in May 2000 and ceased marketing our subscription software services in December 2000. Accordingly, in 2010, 2009 and 2008 and, we expect, for the foreseeable future, our brokerage operations produced, and should continue to produce, most of our revenues. Revenues from brokerage services (consisting primarily of brokerage commissions and fees and net interest income) accounted for approximately 94%, 93% and 93% of our total consolidated net revenues, and software products and services and “other” revenues accounted for approximately 6%, 7% and 7% of our total consolidated net revenues, for the years ended December 31, 2010, 2009 and 2008, respectively.
8
Table of Contents
Index to Financial Statements
Our marketing in 2010 consisted principally of e-mail, sales seminars, banner and keyword search advertising on financial Web sites, our Web sites, television advertising on financial news channels, print advertising in Active Trader, Futures, Traders, and Technical Analysis of Stocks & Commodities magazines and direct mail. The mix and frequency of television, print, Web-site, Internet, direct-mail and in-person marketing methods that we use to try to achieve results will likely be continually modified as we test and use such methods and mixtures and analyze and interpret the results.
In March 2011, we launched a new marketing campaign designed to build awareness and demand for TradeStation. The central message can be summarized as follows: When it comes to active traders, TradeStation is the firm which has the technology, service and education that can meet them at their level of trading and elevate the way they trade. By having focused our marketing in the past solely on rules-based and strategy traders, we think we have sold ourselves short, as we believe using TradeStation will improve the way active traders trade, and their satisfaction with their trading experience, regardless of how they make their trading decisions. We have, we think, the only complete offering in our industry that is truly focused on the active trader regardless of the level at which he or she currently trades, and this new campaign intends to drive that message home. This new campaign will also communicate to our active trader market the numerous new benefits provided by TradeStation 9.0 and will include focused marketing dedicated to our new forex offering.
Most of our brokerage accounts are opened by prospects who respond to our advertising either by completing and submitting an online account application or calling a sales associate. The majority of our account applications are submitted online, and we are in the process of completing the installation and set-up of a new online account opening process that we believe will greatly reduce the time from account application to approval for most applicants and, in general, be more user friendly and efficient.
In January 2011, TradeStation Technologies began enhancements to TradeStation Strategy Network, an online marketplace of ready-to-trade strategy trading products and trading tools created by independent developers and offered to TradeStation brokerage clients. This enhancement will create, in effect, an “app store” of trading software applications that run seamlessly on the TradeStation platform. Brokerage customers who want to subscribe for and download these applications can do so by entering into an agreement with the independent developer who created the strategy or tool. Our goal is that presenting brokerage customers with numerous trading ideas and methods to evaluate and incorporate into their own self-directed online trading will lead to increased interest and trading activity on the TradeStation platform, but there can be no assurance that brokerage customers will utilize the TradeStation Strategy Network, or, if they do, that such use will increase their trading activities using TradeStation.
As of December 31, 2008, all salespeople were compensated on purely a commission basis. During 2009, a new sales commission plan was implemented for our salespeople. Under this new program, salespeople who assist in account openings from applications that are submitted online or result from referrals are compensated by a base salary and quarterly bonuses (depending on performance during each quarter), and salespeople who assist in opening accounts from calls received in response to advertising or otherwise expend greater efforts to have the account opened are paid in commissions based on the trading activity of those accounts over the first twelve months following account funding by the new customer. Our sales people do not have any involvement in trading activity in our customers’ accounts once the accounts are opened.
Revenues derived from customers outside of the United States for the years ended December 31, 2010, 2009 and 2008, were approximately $19.3 million, $17.5 million, and $22.5 million, or 15%,
9
Table of Contents
Index to Financial Statements
13%, and 14% of net revenues, respectively. International revenues are collected in U.S. dollars. We currently conduct no marketing, sales or other operations, and maintain no assets, outside of the United States, other than relating to our operations in London via our United Kingdom subsidiary, TradeStation Europe Limited.
Clearing Services. For many of our institutional securities accounts, our brokerage firm’s clearing services are currently provided by J.P. Morgan Clearing Corp. pursuant to an industry-standard clearance agreement. Our brokerage firm’s clearing services for our futures accounts are currently provided by R.J. O’Brien & Associates on an omnibus clearance basis pursuant to an industry-standard omnibus clearance agreement and related facilities management agreement. Our server farms have direct connectivity with all major U.S. equities, options and futures exchanges, so we do not, except in limited cases, such as futures pit trading, and certain equities and other markets for institutional traders, use our clearing firms for execution services.
Forex Deal Services. Until our new forex offering is launched, our forex deal services are provided through an arrangement with GAIN Capital Group, Inc. Forex customers can design, test, optimize and automate their forex strategies, including the placement of their orders, using TradeStation, then, when a deal order is placed, GAIN Capital’s electronic dealer system processes the order and GAIN Capital acts as counterparty/principal with respect to the execution and clearing of each forex deal. This relationship is expected to terminate later in 2011 in connection with TradeStation Forex’s anticipated launch of our new forex offering.
We believe that our success depends, in large part, on our ability to offer unique, Internet-based trading technologies with state-of-the-art order execution technologies, and continuously enhance those technologies, as well as develop and implement well-designed and user-friendly Web sites. To date, we have relied primarily on internal development of our products and services, although, as discussed earlier, we did complete two software technology purchases in 2010. In 2010, 2009 and 2008, technology development expenses were approximately $15.5 million, $14.1 million and $11.5 million, respectively. As of December 31, 2010 and December 31, 2009, our technology development team consisted of 134 people.
We view our technology development cycle as a four-step process to achieve technological feasibility. The first step is to conceptualize in detail the defining features and functions that we believe our targeted market requires from the product or service, and to undertake a cost-benefit analysis to determine the proper scope and integration of such features and functions. Once the functional requirements of the product or service have been determined, the second step is to technically design the product or service. The third step is the detailed implementation, or engineering, of this technical design. The fourth step is rigorous quality assurance testing to ensure that the final product or service generally meets the functional requirements determined in the first step. Several refinements are typically added and tested in the quality assurance phase of development. Once this process is completed, technological feasibility has been achieved and the working model is available for release to our customers. Near the end of 2008, we implemented a new approach to our product development, which seeks to synthesize better the functions of code engineering, quality assurance and product management using a multi-department team approach, with the goal of breaking down complex, long-term projects into smaller, more manageable components with shorter release cycles, thus identifying development issues earlier in the process and bringing higher-quality products to market more rapidly.
10
Table of Contents
Index to Financial Statements
The market for strategy trading software tools, streaming real-time market data and news services, and online order execution services is characterized by: rapidly changing technology; evolving industry standards in computer hardware, software architecture, programming tools and languages, operating systems, database technology and information delivery systems; changes in customer requirements; and frequent new product and service introductions and enhancements, as well as technical consolidation of products and services. Our success will depend, in part, upon our ability to develop and maintain competitive technologies and to develop and introduce new products, services and enhancements in a timely and cost-effective manner that meets changing conditions such as evolving customer needs, existing and new competitive product and service offerings, emerging industry standards, changing technology, and increased capacity and stability requirements as we grow our business and as minimum customer acceptability standards for capacity and stability increase in our industry. There can be no assurance that we will be able to develop, introduce and market, on a timely basis, if at all, products, services or enhancements that respond to changing market conditions or that will be accepted by customers. Any failure by us to anticipate or to respond quickly or effectively to changing market conditions, or any significant delays in the introduction of new products and services or enhancements, could cause customers to delay using, or decide against the use of, our products and services and could have a material adverse effect on our business, financial condition and results of operations.
Customer Services and Support and Training
We provide customer services and support and product-use training in the following ways:
Customer Services and Support. Telephone account and technical support service is provided to brokerage customers through a trained customer service team. Advanced EasyLanguage consulting services (services that technically assist customers in the use of EasyLanguage to write the customers’ own trading strategies) are available from internal resources and from unaffiliated, independent EasyLanguage consultants. A substantial amount of technical support information is also provided on our Web sites.
Product-use Training. We consider user education and training important to try to help our customers increase their abilities to use our products and services fully and effectively, and to improve customer account retention. The majority of our training materials consist of extensive online documentation and technical assistance information on our Web sites, including online tutorials and “webinars,” as well as in-person training seminars, so that our customers may learn to use and take full advantage of the sophisticated technology of the TradeStation electronic trading platform. The TradeStation.com Support Center includes access to an interactive community for active traders who engage or have interest in the development, testing and use of objective trading strategies. The community (sometimes known in the industry as “social networking”) provides numerous discussion forums on a variety of topics related to strategy development and technical trading, as well as TradeStation product and service features, articles about trading from industry leaders, and a “library” of strategy indicators, rules and components written in our proprietary EasyLanguage, many of which are donated by third parties. TradeStation Technologies hosts and operates TradeStation Strategy Network, an online marketplace where brokerage customers can search for ready-to-trade strategy trading products and other trading software tools created by independent developers. See “Sales and Marketing” above.
11
Table of Contents
Index to Financial Statements
The market for online brokerage services is intensely competitive and continues to rapidly evolve, and over recent years there has been substantial consolidation in the industry. We believe consolidation is occurring in the four major online execution markets for active traders – equities, equity and index options, futures and forex – meaning that, contrary to specializing in offering services for only one of those market instruments, more and more firms are offering or plan to offer three or four of those services. With our offering of online trading services for all four of these markets, we have embraced this consolidation. Also, there have been numerous acquisitions in our industry, mostly by larger firms that are seeking to increase their ability to compete on both quality and price, and to expand their product offering to include more derivatives.
We believe that competition, as well as consolidation, will continue to increase and intensify in the future. We believe our ability to compete will depend upon many factors both within and outside our control, including: price pressure; the timing and market acceptance of new products and services and enhancements developed by us and our competitors; our ability to design and support efficient, materially error-free Internet-based systems; market conditions, such as recession and volatility; the size of the active trader market today and in the future; the extent to which institutional traders are willing to use electronic brokerage services offered by firms that have traditionally served mostly retail customers; product and service functionality; data availability and cost; execution and clearing costs; ease of use; reliability; financial stability and strength; customer service and support; and sales and marketing decisions and efforts.
We face direct competition from several publicly-traded and privately-held companies, principally online securities brokerages and futures commission merchants, including providers of electronic order execution services. Our competitors include the many online brokerages currently active in the United States, some of which offer both equities (including equity and index options) and futures brokerage services, and some of which offer or will soon offer forex services, including Charles Schwab & Co., E*Trade Securities, Fidelity Brokerage Services, Interactive Brokers, optionsXpress, Scottrade Financial Services and TD Ameritrade. Retail competitors focused exclusively or mainly on forex include FXCM and Gain Capital. Virtually all online brokerage firms are focused on attracting and retaining active traders, who are the most valuable segment of their online trader customer base.
Even though we have consistently been rated as one of the best online brokerage firms in the United States, there can be no assurance that we will be able to maintain such ratings, be rated that highly in the future, compete effectively with our competitors, adequately educate potential customers about the benefits our products and services provide, retain customers, or continue to offer such products and services.
Many of our existing and potential competitors, which include large, online discount and traditional national brokerages and futures commission merchants, and financial institutions that are focusing more closely on online services, including electronic trading services for active traders, have longer operating histories, significantly greater financial, technical and marketing resources, greater name recognition and a larger installed customer base than do we. Further, there is the risk that larger financial institutions, which offer online brokerage services as only one of many financial services, may decide to use extremely low commission pricing or free trades as a “loss leader” to acquire and accumulate customer accounts and assets to derive interest income and income from their other financial services. We do not offer other financial services, and have no plans to do so; therefore, such pricing techniques, should they become common in our industry, could have a material adverse effect on our results of operations, financial condition and business model.
12
Table of Contents
Index to Financial Statements
Generally, competitors may be able to respond more quickly or effectively to new or emerging technologies or changes in customer requirements or to devote greater resources to the development, promotion and sale of their products and services. We need to continue to focus on, and maintain, high-quality technology development resources to improve the quality of our offering, automate and improve certain account opening and customer support services, and the pace at which we release new features, enhancements, products and services. There can be no assurance that our efforts in this regard will succeed, or that existing or potential competitors will not develop products and services comparable or superior to those developed and offered by us or adapt more quickly to new technologies, evolving industry trends or changing customer requirements, or that we will be able to timely and adequately complete the implementation, and appropriately maintain and enhance the operation, of our business model. In recent years, some of our competitors have been adding or emphasizing rules-based or strategy trading products and features to the active trader market. Increased competition could result in price reductions, reduced margins, slower or negative net account growth (net account growth has slowed beginning mid-2009), and failure to build, or loss of, market share, any of which could materially adversely affect our business, prospects, financial condition and results of operations. There can be no assurance that we will be able to compete successfully against current or future competitors, or that competitive pressures faced by us will not have a material adverse effect on our prospects, business, financial condition and results of operations.
Our success is and will be heavily dependent on proprietary software technology, including certain technology currently in development. We view our software technology as proprietary, and rely, and will be relying, on a combination of patent, copyright, trade secret and trademark laws, nondisclosure agreements and other contractual provisions and technical measures to establish and protect our proprietary rights. We currently have patent applications pending for the TradeStation trading platform, and own two patents that cover what we believe to be important product features that have been incorporated into TradeStation. With respect to the pending patent applications, there can be no assurance that we will obtain patents broad enough in scope to have value, or obtain them at all. Also, given recent trends in U.S. patent law relating to software patents, we believe the practical value of these patents generally has diminished and may continue to diminish. We also have registered copyright rights in our EasyLanguage dictionary and documentation and TradeStation software.
We have obtained trademark registrations for the TradeStation mark in the United States, Australia, Canada, the European Community, Indonesia, Korea, Singapore, South Africa and Taiwan. We have obtained registrations for the OptionStation mark in the United States, Canada and the European Community. We have obtained registrations for the EasyLanguage and Strategy Network marks in the United States and the European Community. We have obtained registrations in the United States for the marks ActivityBar, PositionGraphs, PowerEditor, ProbabilityMap, RadarScreen, Strategy Builder, Test Before You Trade, TradeStation Prime Services and other marks.
We use an online subscription agreement for our Internet trading software and data services between TradeStation Technologies and each of the users (whether the users are brokerage customers or monthly subscribers) in order to protect our copyrights and trade secrets and to prevent such users from commercially exploiting such copyrights and trade secrets for their own gain.
13
Table of Contents
Index to Financial Statements
Despite our efforts to protect our proprietary rights, unauthorized parties copy or otherwise obtain, use or exploit our software or technology independently. Policing unauthorized use of our software technology is difficult, and we are unable to determine the extent to which piracy of our software technology exists. Piracy (as well as “reverse engineering”) can be expected to be a persistent problem, particularly in international markets and as a result of the growing use of the Internet. In addition, effective protection of intellectual property rights may be unavailable or limited in certain countries, including some in which we may attempt to expand sales efforts. There can be no assurance that the steps taken by us to protect our proprietary rights will be adequate or that our competitors will not independently develop technologies that are substantially equivalent or superior to ours.
There has been substantial litigation in the software industry involving intellectual property rights. We do not believe that we are infringing, or that any technology in development will infringe, the intellectual property rights of others. However, there can be no assurance that infringement claims will not be asserted by our competitors or others, and, if asserted, there can be no assurance that they would not have a material adverse effect on our business, financial condition and results of operations. In fact, we are currently involved in a lawsuit filed in the United States District Court, Northern District of Illinois, alleging that we are infringing several patents. See Item 3. Legal Proceedings.
To the extent that we acquire or license a portion of the software or data included in our products or services from third parties (some data and software are licensed from third parties), or market products licensed from others generally, our exposure to infringement actions may increase because we must rely upon such third parties for information as to the origin and ownership of such acquired or licensed software or data technology. Software patent infringement cases in financial service industries are becoming more frequent, and we may be subject to litigation to defend against claimed infringement of the rights of others or to determine the scope and validity of the intellectual property rights of others. In fact, as first mentioned in the previous paragraph, we are currently involved in a lawsuit filed in the United States District Court, Northern District of Illinois alleging that we are infringing several patents. In the future, litigation will likely be necessary to establish, define, enforce, defend and protect patents, trade secrets, copyrights, trademarks and other intellectual property rights. Any such litigation is costly and diverts management’s attention, which could have a material adverse effect on our business, financial condition and results of operations. Adverse determinations in such litigation could result in the loss of proprietary rights, subject us to significant liabilities, require us to seek licenses from third parties, which could be expensive, or prevent us from selling our products or services or using our trademarks, any one of which could have a material adverse effect on our business, financial condition and results of operations.
Our U.S. brokerage subsidiaries are, collectively, subject to extensive securities and futures and forex industry regulation under both federal and state laws as a broker-dealer with respect to its equities and securities and index options business, as a futures commission merchant (FCM) with respect to futures business, and as an RFED/FDM with respect to forex business. Broker-dealers, FCMs and RFED/FDMs are subject to regulations related to those businesses, including, among other things: sales methods; trade practices; use and safe-keeping of customers’ funds and securities; clearing, processing and settlement of trades, and arrangements with clearing houses, exchanges and clearing corporations; capital structure; cash deposit or escrow requirements (or their equivalent); record keeping; regulatory reporting; conduct of directors, officers and employees; and supervision. To the extent we solicit orders from customers or make investment recommendations (we currently do not), we are subject to additional rules and regulations governing, among other things, sales practices in that area and the suitability of recommendations to customers. There are also substantial rules and regulations regarding anti-money laundering (AML) and customer privacy that affect brokerage firms.
14
Table of Contents
Index to Financial Statements
Our regulated entities’ mode of operation and profitability may be directly affected by the following: additional legislation; changes in rules promulgated by the SEC, FINRA, NYSE, CFTC, NFA, the Board of Governors of the Federal Reserve System, DTCC, OCC, state regulators, various securities and futures exchanges, other self-regulatory associations and organizations, and legislation that affects taxes or fees payable on or with respect to customer trading activity, volume or account balances; and changes in the interpretation or enforcement of existing rules and laws, particularly any changes focused on online brokerages that target an active trader customer base or market the concepts of rules-based trading, strategy trading or trading systems, high frequency trading, simulated results from historical tests or “paper trading” of strategies, or strategy automation. As a result of the recent economic and market crises, as well as certain recent enforcement actions and investigations, and the stated intentions of governmental entities and regulators, there has been, and we believe there will continue to be, a reasonable likelihood that significant changes will occur to the statutes or regulations that affect our business, new and modified regulations will be enacted, and enforcement of regulations will be broader and more stringent than in the past. There is no way to predict the effect, if they occur, these changes will produce or how they may adversely affect the way we conduct our business or our revenues, costs, employee resources or financial results.
With respect to active trading of equities, FINRA has adopted rules that require, among other things, firms to provide customers with a risk disclosure statement about active trading. Further, FINRA’s margin rules impose more restrictive requirements for “pattern” active traders (also called “day traders”). Governmental concern includes a focus on two basic areas: that the customer has sufficient trading experience and that the customer has sufficient risk capital to engage in active trading. A minimum equities account balance of $25,000 is required. TradeStation Securities’ customer account documentation specifies that being an equities brokerage customer of TradeStation Securities is only for traders who have experience in active trading, are willing to risk considerable amounts of capital (at least $50,000), and are interested in engaging in high-risk, short-term, speculative trading activity. We believe our brokerage firm’s minimum account opening requirements, as well as the extensive user education documentation and tutorials offered on our Web site, are consistent with both the letter and the spirit of current rules and regulations concerning active trading. With respect to the use of investment analysis software tools generally, and simulated performance reports of trading systems or strategies in particular, FINRA, the NFA and NYSE have rules regarding how a broker-dealer or futures commission merchant may market those tools to the public and to existing clients.
With respect to forex trading, retail forex trading in particular, and including the business of TradeStation Forex, the CFTC has imposed a limit on buying power leverage of 50-to-1 on major foreign currency pairs and 20-to-1 for other currency pairs, while the buying power leverage typically offered throughout the world today, outside of the United States, is up to 100-to-1 or 200-to-1. In addition, FINRA has proposed a limit on buying power leverage of 4-to-1 (which would not apply to TradeStation Forex because TradeStation Forex is not a FINRA member).
There has been a trend during the past few years of the SEC imposing new restrictions on short sale transactions. In 2005, the SEC adopted regulations requiring that broker-dealers “locate” shares for short sale transactions and requiring that delivery of those shares take place within a limited time frame. In 2008, the SEC implemented a temporary ban on short selling of financial sector securities. This was followed by more stringent requirements regarding the location and delivery of borrowed
15
Table of Contents
Index to Financial Statements
shares. More recently, in February, 2010, the SEC adopted Rule 201 of Regulation SHO, which restricts short selling when the price of a “covered security” has triggered a “circuit breaker” by falling at least 10 percent from the prior day’s closing price. Firms were required to be in compliance with Rule 201 by February 28, 2011. A significant percentage of our daily client trades on many trading days are short sale transactions. Also, our new securities lending business is dependent on trader demand to make short sale trades. Accordingly, the adoption of rules that restrict, limit or ban short selling could have a significant impact on our business.
TradeStation Europe Limited, which introduces brokerage customers from the European Union to TradeStation Securities and, once it is operational, TradeStation Forex, is authorized and regulated by the FSA, and, in using its “Passport” to conduct such business throughout countries in the European Economic Area, is generally subject to the marketing, solicitation and other customer protection rules in effect in each country in which it conducts such business.
The SEC, FINRA, NYSE, CFTC, NFA, FSA and other self-regulatory associations and organizations (SROs) and state and foreign securities commissions and agencies can censure, fine, enjoin, suspend, expel or issue cease-and-desist orders to a broker-dealer, FCM or RFED, or any of its officers or employees. For information about certain recent and/or pending regulatory inquiries and actions, see Item 3. Legal Proceedings.
Significant aspects of marketing campaigns by TradeStation to bring brand name recognition to its services and to promote the benefit of those services, such as the TradeStation electronic trading platform and its various features, are regulated by FINRA and the NFA, and marketing materials must be, among other things, reviewed by an appropriately-licensed firm principal prior to release, and must conform to standards articulated by the SEC, CFTC, FINRA and NFA, as applicable. FINRA or the NFA may request that revisions be made to marketing materials, or that modifications be made to co-marketing or referral arrangements or relationships, and can impose certain penalties for violations of its advertising regulations, including censures or fines, a requirement of advance regulatory approval of all advertising, the issuance of cease-and-desist orders, and the suspension or expulsion of an entity for which it has oversight, or any of its officers or employees.
The SEC, FINRA, NYSE, CFTC, NFA, DTCC and OCC and various other regulatory associations and organizations have stringent rules with respect to the maintenance of specific levels of net capital or cash deposit requirements and reserves by securities broker-dealers, FCMs and RFEDs. In general, net capital is the net worth of the regulated company (assets minus liabilities), less additional deductions for certain types of assets as well as other charges. If a firm fails to maintain the required net capital it must cease conducting business and, if it does not do so, it may be subject to suspension or revocation of registration by the SEC or the CFTC and suspension or expulsion by FINRA, NYSE or the NFA, and it could ultimately lead to the firm’s liquidation. In order to obtain regulatory approval with respect to TradeStation Forex becoming and operating as an RFED, minimum capitalization of $20 million was required.
TradeStation Securities is registered as a broker-dealer in every U.S. state and the District of Columbia and it is subject to regulation under the laws of those jurisdictions, including registration requirements and being subject to sanctions if a determination of misconduct is made. Recently, several states, including Florida (where the company is headquartered), have enacted and/or have been considering new or modified legislation that could increase the power of state regulatory authorities to sanction or suspend a brokerage firm that fails to comply with regulatory requirements or experiences adverse results in customer arbitrations. There is no way to predict the effect, if they occur, these changes may produce or how they may adversely affect our business.
16
Table of Contents
Index to Financial Statements
TradeStation Securities is a member of the SIPC. SIPC provides protection of up to $500,000 for each securities account brokerage customer, subject to a limitation of $250,000 for cash balances, in the event of the financial failure of a broker-dealer. For securities brokerage accounts the custody and clearing of and for which are handled by TradeStation Securities, an excess SIPC insurance policy placed through Lloyd’s of London provides coverage for loss of securities and/or cash in excess of primary SIPC protection, up to $300 million in the aggregate (and up to $24.5 million per any one account, subject to a $900,000 per account maximum for cash). Based upon the asset size per account and in the aggregate of TradeStation Securities’ securities account customer base as of the date of this report, this excess-SIPC protection, combined with primary SIPC protection, should, while no assurances can be given, be adequate to cover the loss of 100% of those customer assets in the unlikely event that TradeStation Securities experienced financial failure and all customer assets were somehow lost. To the extent TradeStation Securities clears its securities brokerage transactions through J.P. Morgan Clearing Corp. (which, currently, it does only for institutional accounts), we understand that J.P. Morgan Clearing Corp. has obtained excess securities insurance that should, while no assurances can be given, provide protection for any loss of securities and/or cash in excess of the primary SIPC protection. Neither SIPC nor excess-SIPC coverage applies to fluctuations in the market value of securities or any losses other than those directly caused by the financial failure of a securities broker-dealer. SIPC does not apply in any manner to FCMs, RFEDs or FDMs or to futures or forex accounts.
It is possible that other federal or state agencies will attempt to regulate our current and planned online and other electronic service activities with rules that may include compliance requirements relating to record keeping, data processing, other operation methods, privacy, pricing, content, and quality of goods and services as the market for online commerce evolves. Given the continuing growth of the electronic commerce market, federal or state authorities may enact additional laws, rules or regulations, not only with respect to online brokerage services, but to other online services we provide or may in the future provide. Such laws, rules and regulations, if and when enacted, could have a material adverse effect on our business, financial condition, results of operations and prospects.
As of December 31, 2010, we had 392 full-time equivalent employees consisting of 114 in brokerage operations (which include clearing and account services, trade desk service, client service, including technical support, and fulfillment), 134 in technology development (including software engineering, product management and quality assurance), 71 in sales and marketing relating to brokerage services, subscriptions and software products (including 53 in sales and account services and 18 in marketing and user education), and 73 in general and administrative (including executive management, finance, information technology services, compliance and human resources). Our employees are not represented by any collective bargaining organization and we have never experienced a work stoppage and consider our relations with our employees to be good.
Our future success depends, in part, upon the continued service of our key senior management and technology development personnel. While we believe no one at our company is irreplaceable, the loss of the services of one or more of these key employees could have a material adverse effect on us. There can be no assurance that we will be able to retain our key personnel. Departures and additions of personnel, to the extent disruptive, could have a material adverse effect on our business, financial condition and results of operations.
17
Table of Contents
Index to Financial Statements
We offer access to our corporate TradeStation Group Web site via www.tradestation.com. We make available free of charge through our Web site this Annual Report on Form 10-K, Quarterly Reports on Form 10-Q, Current Reports on Form 8-K and amendments to those reports filed or furnished pursuant to Section 13(a) or 15(d) of the Securities Exchange Act of 1934, as amended, as soon as reasonably practicable after we electronically file such material with, or furnish it to, the Securities and Exchange Commission. We also make available, through our Web site, statements of beneficial ownership filed by our directors and executive officers, and shareholders who own more than 10% of our issued and outstanding capital stock, under Section 16 of the Securities Exchange Act of 1934, as amended, as soon as reasonably practicable after such material is filed with, or furnished to, the Securities and Exchange Commission.
| ITEM 1A. | RISK FACTORS |
The Consolidated Financial Statements and Management’s Discussion and Analysis of Financial Condition and Results of Operations contained in this report, as well as the preceding “Business” section of this report, should be read and evaluated together with the issues, uncertainties and risk factors relating to our business described below. While we have been and continue to be confident in our business and business prospects, we believe it is very important that anyone who reads this report consider these issues, uncertainties and risk factors, which include business risks relevant both to our industry and to us in particular. To the best of our knowledge and belief, we have presented, as required by applicable rules, all material risks in this section.
This report also contains statements that are forward-looking within the meaning of Section 27A of the Securities Act of 1933, as amended, and Section 21E of the Securities Exchange Act of 1934, as amended. These forward-looking statements are made pursuant to the safe harbor provisions of the Private Securities Litigation Reform Act of 1995. When used in this report, the words “anticipate(s),” “anticipated,” “anticipation,” “assume(s),” “assumption(s),” “become(s),” “belief(s),” “believe(s),” “believed,” “could,” “designed,” “estimate,” “estimates,” “estimated,” “expect(s),” “expected,” “expectation(s),” “going forward,” “future,” “hopeful,” “hope(s),” “intend(s),” “intended,” “look forward,” “may,” “might,” “opportunity,” “opportunities,” “outlook(s),” “pending,” “plan(s),” “planned,” “potential,” “scheduled,” “shall,” “should,” “think(s),” “to be,” “upcoming,” “well-positioned,” “will,” “wish,” “would,” and similar expressions, if and to the extent used, are intended to identify the forward-looking statements. All forward-looking statements are based on current expectations and beliefs concerning future events that are subject to risks and uncertainties, including the risks and uncertainties described below and elsewhere in this report. Actual results may differ materially from the results suggested in this report. Factors that may cause or contribute to such differences, and our business risks and uncertainties generally, include, but are not limited to, the items described below, as well as those described in other sections of this report, our other public filings and our press releases, conference calls and other public presentations.
18
Table of Contents
Index to Financial Statements
Global Economic Conditions May Impact Our Stock Price
In recent years, the U.S. securities markets have experienced significant price fluctuations. The market prices of securities of companies in the financial services sector were particularly volatile at times and the market price of our common stock decreased significantly during that period. Reduced confidence in the economy in general, or in the stability of the financial services sector, may further negatively impact the market price of our common stock.
There Are Several Factors That May Cause Fluctuations In Our Quarterly Operating Results, Which Could Result In Significant Volatility In Our Stock Price
Quarterly revenues and operating results of TradeStation Group have fluctuated significantly in the past, and our quarterly revenues and operating results are likely to fluctuate in the future. Causes of such significant fluctuations may include, but are not limited to:
| • | negative or positive changes in factors that affect the securities and futures markets, including trade volume, market volatility, market direction or trends, unemployment, the level of confidence and trust in the markets, and seasonality, which, in turn, affect active trading and our brokerage revenues; |
| • | changes in treasury note and/or treasury bill rates of interest (or the federal funds and discount rates that typically influence those rates of interest) – a significant portion of our revenues has historically been derived from interest income, and very low short-term rates have had and are expected to continue to have a material negative impact on the net interest income component of our brokerage revenues (which, since it has no corresponding cost component other than the interest, if any, we offer to our customers and income taxes, also has a material negative impact on our net income and earnings per share); |
| • | the company’s ability (or lack thereof), to achieve significant, or any, net increases in daily average revenue trades (DARTs), brokerage accounts and brokerage commissions and fees sequentially or year over year (for example, TradeStation’s DARTs and its brokerage commissions and fees have both decreased sequentially and year over year starting in the 2009 third quarter, and net account growth substantially slowed beginning in the 2009 third quarter, and these and other items may decrease sequentially or year over year in subsequent periods); |
| • | mark-to-market gains or losses on marketable securities that impact the company’s financial results even though they do not affect the company’s operations (for example, mark-to-market gains on marketable securities increased earnings per share by five cents in the 2010 second quarter and mark-to-market losses decreased earnings per share by one cent in the 2010 third quarter); |
| • | technical difficulties, outages, errors and/or failures in our electronic and software products, services and systems relating to market data, order execution and trade processing and reporting, and other software or system errors and failures, any of which could result in a business or legal requirement to issue large credit amounts to customers, loss of accounts, reduced trading activity, loss of or diminished reputation and recognition in the industry, increased monetary costs and diversion of internal resources, regulatory inquiries, fines and sanctions, and other material adverse consequences (also, although we maintain a redundant back-up system to our order execution systems, that redundancy is not seamless, which could materially intensify the negative consequences described above); |
19
Table of Contents
Index to Financial Statements
| • | market or competitive pressure to lower commissions and fees charged to customers, or to reduce or eliminate monthly platform fees paid by brokerage customers, or to reduce interest rates charged to customers for margin loans or to increase the interest rates used to credit customers’ account cash balances; |
| • | the quality and success of, and potential continuous changes in, sales or marketing strategies (which continue to evolve) and the timing and success of new product, service or marketing initiatives, such as our new 2011 marketing campaign; |
| • | the effect of changes in product mix (how much of customer trading volume is stocks versus equity options versus futures versus forex, etc.), which can affect our revenues, net income and margins, even if overall trading volume remains the same; |
| • | unanticipated infrastructure, capital or other large expenses, and unforeseen or unexpected liabilities and claims, we may face as we seek to grow our U.S. active trader market share in equities, futures and forex business, and our institutional and non-U.S. trader market businesses, including potential acquisition, joint venture or business combination risks, costs and expenses (such as start-up costs and expenses, professional fees and, in the case of an acquisition or “new division”, amortization expense) incurred in the event we develop, acquire, joint venture with or combine with other businesses; |
| • | pending, potential or unforeseen third-party claims or regulatory matters that turn out to be significantly more costly, in terms of both judgment or settlement amounts and legal expenses, or fines, than we currently estimate or expect; |
| • | variations from our expectations with respect to hiring and retention of personnel, sales and marketing expenditures, technology development costs, compliance costs, or other expense items; |
| • | the ability to collect unsecured accounts receivable that may arise from time to time in the ordinary course of business or otherwise; and/or |
| • | if revenues are lower than expected, the negative effects of such lower revenues to our bottom line, including our inability to make in a timely fashion commensurate expense reductions (as a large amount of our expenses are fixed expenses, i.e., do not vary with revenues in the short term). |
Conditions In The Securities And Financial Markets May Affect Our Rates Of Customer Acquisition, Retention And Trading Activity
Our products and services are, and will continue to be, designed for customers who trade actively in the securities and financial markets. To the extent that interest in active trading, or trading generally, decreases due to low trading volumes, lack of volatility, significant downward movement in the securities or financial markets, or negative market sentiment, or future tax law changes, recessions, high unemployment, investor confidence, depressions, wars, terrorism (including “cyberterrorism”), or otherwise, our business, financial condition, results of operations and prospects could be materially
20
Table of Contents
Index to Financial Statements
adversely affected. These risks have heightened considerably as a result of the recent crises in our markets and economy, including high unemployment. Also, unfavorable market conditions have, historically, seemed to severely negatively impact the share price of publicly-held online brokerage firms, and also usually result in more losses for our customers, which could result in increases in quantity and size of errors or omissions or other claims that may be made against us by customers. We do not currently carry any errors or omissions insurance that might cover, in part, some of those potential claims. See “The Nature Of Our Business Results In Potential Liability To Customers” below.
Our Revenue And Net Income Growth Prospects In 2011 Are Dependent Upon the Success Of A Few New and Recent Growth Initiatives
At the time of filing this report, we expect to launch later in 2011 a new forex brokerage offering that is very different from the one we previously offered, as well as a new marketing campaign which sends a different message from the one we have sent historically. We also launched just a few months ago our new securities lending business and our offering to customers to trade Eurex Group markets. The company’s planned revenue and net income growth in 2011 is dependent largely on these new and recent initiatives. The company may not meet its revenue growth or profit expectations, or derive any significant increased revenues or profits, from the new forex offering, securities lending, Eurex trading, or the new marketing campaign as a result of unexpected mistakes, delays and/or costs, less-than-anticipated customer appeal or market interest, and/or other factors.
Our Industry Is Intensely Competitive, Which Makes It Difficult To Attract And Retain Customers
The markets for online brokerage services, trading software tools, and real-time market data services are intensely competitive and continue to rapidly evolve. There has, historically, been substantial consolidation of those three products and services in the industry, as well as, more recently, consolidation of the types of financial instruments (equities, equity and index options, futures and forex) offered by firms. There has also been consolidation of online brokerage firms generally, as well as intense price and quality competition. We believe that competition from large online and other large brokerage firms and smaller brokerage firms focused on active traders, as well as consolidation, will continue. In recent years, some of our competitors have been adding or emphasizing rules-based or strategy trading products and features to focus more on the active trader market. Competition may be further intensified by the size of the active trader market, which is generally thought to be comprised of about 5% of all online brokerage accounts. We believe our ability to compete will depend upon many factors both within and outside our control. Factors outside of our control include: price pressure (on transactional commissions, monthly platform fees and interest rates offered to customers for both credit balances and account borrowings); the timing and market acceptance of new products and services and enhancements developed by our competitors (including strategy back-testing and automation capabilities); market conditions, such as recession and unemployment; the size of the active trader market today and in the future; data availability and cost; and exchange and third-party execution and clearing costs. Factors over which we have more control, but which are subject to substantial risks and uncertainties with respect to our ability to effectively compete, include: timing and market acceptance of new products and services and enhancements we develop; our ability to meet changing market demands for a unified, integrated trading platform that offers customers the ability to trade and manage portfolios containing multiple asset classes; our ability to design, improve and support materially error-free and sufficiently robust Internet-based systems; ease-of-use of our products and services; reliability of our products and services; financial reliability and strength; and
21
Table of Contents
Index to Financial Statements
pricing decisions and other sales and marketing decisions and efforts. Increased competition could result in price reductions, reduced margins, slower or negative net account growth (net account growth has slowed beginning mid-2009), and failure to build, or loss of, market share, any of which could materially adversely affect our business, prospects, financial condition and results of operations.
Attrition Of Customer Accounts And Failure To Maintain Or Increase The Rate Of Growth Of Gross New Account Additions Could Materially Adversely Affect Our Operating Results
We consider an account to be inactive (and exclude it when counting total brokerage accounts) when it has less than a $200 balance and has had no activity for more than 180 consecutive days. Our current indications are that 2011 customer account attrition levels will be the same or greater than 2010 levels. Based on the combination of account attrition and gross accounts added, our net account growth began to slow significantly beginning in the 2009 third quarter and slowed even more significantly throughout 2010. While there is no way to know for certain the specific reasons for these results and indications concerning net account growth (which, again, is determined by the number, if any, that gross new account additions in a quarter exceed our customer account attrition in that quarter), we believe that the principal contributing factors are recent and current market and economic conditions, and there may be other reasons or factors, such as the effectiveness or strength of our sales and marketing efforts and customer support and retention methods, or the effectiveness or strength of our competitors. Our failure or inability to address the underlying issues or causes relating to increased attrition and a decrease in net account growth will likely result in decreased net revenues and net income.
Operation In A Highly-Regulated Industry And Compliance Failures May Result In Severe Penalties And Other Harmful Governmental Or SRO Actions Against Us, Or May Place Limitations On Our Business
The securities and futures industries are subject to extensive regulation covering all aspects of those businesses. Regulation of forex dealer and brokerage services is increasing as well, by the CFTC and NFA and FINRA. The various governmental authorities and industry SROs that supervise and regulate our brokerage firms have broad enforcement powers to censure, fine, suspend, enjoin, expel or issue cease-and-desist orders to our brokerage firms or any of their officers or employees who violate applicable laws, rules or regulations. There have been, and may soon be, several specific rules enacted that affect or could affect our business. For example, rules relating specifically to active traders have been enacted and more may be enacted which severely limit the operations and potential success of our business model. Recently, several states, including Florida (where we are headquartered), have enacted and/or have been considering new or modified legislation that could increase the power of state regulatory authorities to sanction or suspend a brokerage firm that fails to comply with regulatory requirements or experiences adverse results in customer arbitrations. Additionally, any future action that a government agency or SRO might take to tax securities transactions (such as the proposed Congressional bill to impose a transaction tax on the purchase and sale of securities), impose stricter borrowing limits on investors (such as the recently enacted CFTC rule limiting the leverage available to retail investors in the forex market), restrict short sales (such as the temporary ban in 2008 on short selling of financial sector securities and new short sale rules that were adopted by the SEC in February 2010) or in any other way limit or add to the costs associated with trading in one or more types of securities, might negatively impact the number of trades in which our clients engage or the costs of, or how we conduct, our business and, consequently, negatively impact our net revenues and net income.
22
Table of Contents
Index to Financial Statements
Our ability to comply with all applicable laws and rules is largely dependent on our brokerages firms’ maintenance of compliance and reporting systems, as well as their ability to attract and retain qualified compliance and other operations personnel and enter into suitable contractual relationships with appropriate vendors, lenders and counterparties. New or modified regulatory rules or requirements, or increased or more stringent enforcement and higher fines or greater sanctions concerning the way our brokerage firms operate their businesses (including increased regulatory investigations into the accounts of our clients as a result of the recent economic crisis and certain recent enforcement actions and investigations) could materially increase our cash requirements to conduct our business, require substantial increases in compliance, legal and/or brokerage operations costs (or result in fines, penalties or sanctions), limit or reduce our access to, or use of, a significant proportion of our now-available cash, or otherwise limit our ability to operate our business.
Systems Failures May Result In Our Inability To Deliver Accurately, On Time, Or At All, Important And Time-Sensitive Services To Our Customers
The online electronic trading platform we provide to our customers is based upon the integration of our sophisticated front-end software technology with our equally-sophisticated, Internet-based server farm technology. Our server farm technology is the foundation upon which online trading customers receive real-time market data and place buy and sell orders. However, in order for this technology to provide a live, effective, real-time trading platform, it requires integration with real-time market data, which are currently provided directly by the exchanges, other electronic market centers, or by systems of independent third-party market data vendors or other sources (who obtain the data directly from the exchanges or, for forex, from inter-bank markets), the electronic order book systems of electronic communication networks (ECNs), other liquidity providers and electronic systems offered by the exchanges, the clearing and back-office systems we license from SunGard for self-clearance and of the clearance agents we use for trades that we do not self-clear. Accordingly, our ability to offer a platform that enables the development, testing and automation of trading strategies and the placement, execution, clearance and settlement of buy and sell orders depends heavily on the effectiveness, integrity, reliability and consistent performance of all of these systems and technologies. In particular, the stress that is placed on these systems during peak trading times, or by increased trade volume, or highly volatile markets, or upon increases by the exchanges or other market centers of the volume or capacity of data sent to our systems, could cause one or more of these systems to operate too slowly or fail. Outages and other system failures may also be caused by natural disasters and other events and circumstances beyond our control. Also, we do not maintain a seamless, redundant back-up system to our order execution systems, which could materially intensify the negative consequences of any such difficulties, outages, errors or failures. Any major system failure or outage (or series of frequent failures or outages), regardless of the cause, could result in the issuance of large credit amounts to customers, loss of accounts, reduced trading activity, loss of or diminished reputation and recognition in the industry, increased monetary costs and diversion of internal resources, regulatory inquiries, fines and sanctions, and other material adverse consequences.
We have had technical difficulties, outages, errors or failures in our electronic and software products, services and systems, and human or manual errors, relating to our systems. Our failure or inability to address the underlying issues or causes relating to such problems, to adequately correct them and ensure they do not repeat (particularly as the volume of market data received from the exchanges, or the volume of our client base’s trading, requires increased, improved or different hardware and/or software capacity, technology or company domain know-how), or otherwise to ensure the stability, capacity, speed and accuracy of the trading platform’s market data and order placement services, could materially negatively affect our reputation in the online trader market, causing increased attrition and a decrease in new accounts, and decreased net revenues and net income.
23
Table of Contents
Index to Financial Statements
Additionally, as a general matter not applicable only to our company, the integrity of these types of systems may be attacked by persons sometimes referred to as “hackers” who intentionally introduce viruses or other defects to cause damage, inaccuracies or complete failure. Also, “cyberterrorism,” should it occur, may significantly affect people’s willingness to use Internet-based services, particularly ones that involve their personal or company’s assets. See “Our Systems And Our Customers’ Accounts May From Time To Time Be Vulnerable To Security Risks That Could Disrupt Operations, Harm Our Reputation And Expose Us To Potential Liability” below.
During a system outage or failure, our brokerage may be able to take orders by telephone; however, only associates with appropriate licenses, knowledge and experience can accept telephone orders and, given the relatively small size of our trade desk in relation to the number of customers we have and trades we process, an adequate number of associates likely would not be available to take customer calls in the event of a system outage or failure. System delays, errors, outages and failures, depending upon how serious and how often they occur, could have a material adverse effect on our business, financial condition, results of operations and prospects. See “The Nature Of Our Business Results In Potential Liability To Customers” below.
Our TradeStation Prime Services Division May Be Less Profitable, Unprofitable, Or More Costly Than Expected
We launched in 2010 our “prime services” division in order to attempt to fill what we believe is the growing need of start-up to mid-sized hedge funds, registered investment advisers, professional traders and asset managers for quality prime brokerage services. There can be no assurance that our prime services offering, particularly securities lending, will appeal to potential prime services clients to the extent that we believe it will. Our failure to make timely and quality enhancements to our trading platform and/or our size and balance sheet being unacceptably small to mid-size and larger funds or firms may adversely impact our ability to attract prime services clients, resulting in future revenues falling short of current expectations. In addition, we have limited experience in offering prime brokerage services and the operating results of the prime services division may be less favorable than we expect as a result of unanticipated costs and expenses that are not offset by expected revenues as and when planned (or at all), mistakes, the general unpredictability of operating results for a new business division, a regulatory or self-regulatory organization or agency decision to limit or restrict the breadth of the services we plan to offer, or other factors.
We May Need Cash In The Foreseeable Future
While we anticipate having sufficient cash to meet our needs over the next 12 months, our future liquidity and capital requirements will depend upon numerous factors, including: the rate of customer acceptance of our products and services, including the number of new brokerage accounts acquired and the number and volume of trades made by our brokerage customers; the use of cash in acquisitions or other strategic ventures should any occur; significant, increased infrastructure and operating costs as our business grows (through acquisition, joint venture or otherwise); large cash or security deposit requirements (which were approximately $37.5 million as of March 1, 2011, and which are expected to increase as our business grows); increased net capital or excess net capital requirements and unanticipated reserve and settlement requirements (TradeStation Forex is required to have a minimum capitalization of $20 million, which is currently all in cash and treasury bills); and new or modified regulatory requirements. Funds, if and when needed, may be raised through debt financing and/or the
24
Table of Contents
Index to Financial Statements
issuance of equity securities, there being no assurance that any such type of financing on terms satisfactory to us will be available or otherwise occur. Debt financing must be repaid regardless of whether we generate revenues, net income or cash flows from our operations and may be secured by substantially all of our assets. Any equity financing or debt financing which requires issuance of equity securities or warrants to the lender would reduce the percentage ownership of the shareholders of the company. Shareholders also may, if issuance of equities occurs, experience additional dilution in net book value per share, or the issued equities may have rights, preferences or privileges senior to those of existing shareholders.
Dependence Upon Outside Data Sources And Clearing Relationships Creates Risks Outside Of Our Control Which May Affect Our Ability To Provide, And Our Cost To Provide, Market Data And Clearing And Account Services
Our business is currently dependent upon our ability to maintain contracts with private market and news data vendors and clearing and prime brokerage firms in order to provide certain market data and news, and clearing and account services, respectively, to our customers. We currently obtain equities, options and futures market data directly from all major U.S., and certain major European, exchanges and market centers, but obtain other market data (such as forex data, fundamental data and news pursuant to non-exclusive licenses) from private data vendors who in turn obtain the data from exchanges or other sources. Clearing and back-office account services for our brokerage customers are obtained from established clearing agents and, with respect to our self-clearing operations, our software system licensing agreement with SunGard. There can be no assurance that we will be able to renew or maintain contracts or acceptable clearing cost or vendor fee rates. Changes (or, in some cases, the failure or inability to make changes) in our relationships with one or more of these third parties, involuntary termination of one or more of those relationships, or business interruptions, slowdowns or failures affecting one or more of these third parties (whether caused by adverse economic conditions which cause business failure of the vendor, or other events) could have a material adverse effect on our business, financial condition, results of operations and prospects.
Decreases In Short-term Interest Rates Or In Our Customer Account Balances Reduce Our Interest Income, Which Has Historically Been A Significant Component Of Our Brokerage Revenues, Net Revenues and Net Income
We have historically derived a significant portion of our brokerage revenues from interest income on customers’ credit balances and account borrowings (overnight margin balances). Very low treasury bill and treasury note rates of interest in 2010 have had, and are expected to continue to have, a negative impact on our interest income and, therefore, our brokerage revenues, net revenues and net income. Our Business Outlook for 2011 assumes that treasury bill and treasury note yields we receive will remain constant at 2010 levels throughout all of 2011. Changes in interest rates or in the size of customer account balances and borrowings, depending upon the extent of the change, could materially change, positively or negatively (depending upon the direction of the change) the amount of our interest income.
Our Brokerage Subsidiaries Must Meet Net Capital, Deposit And Other Financial And Regulatory Requirements As Broker-Dealer, Futures Commission Merchant And Retail Exchange Forex Dealer That, If Not Satisfied, Could Result in Severe Penalties Or Other Negative Consequences, And Which Could Reduce Or Limit The Cash We Have Available To Run Our Business
The SEC, FINRA, the CFTC, the NFA, the DTCC, the OCC, certain exchanges and other regulatory and self-regulatory agencies or organizations have stringent rules with respect to the
25
Table of Contents
Index to Financial Statements
maintenance of specific levels of net capital by securities broker-dealers and futures commission merchants, large, fluctuating cash deposit requirements, and reserve, settlement and other financial requirements. Our net capital, deposit and general brokerage cash requirements increase as we seek to grow our new TradeStation Prime Services division, as a futures commission merchant that clears omnibus and moves toward futures self-clearing, and as a forex principal dealer (as opposed to an introducing broker of forex accounts). If a firm fails to maintain the required net capital or satisfy required deposit, settlement, reserve and other financial and regulatory obligations, it may be subject to fines, penalties, limitations on the type or size of business it is permitted to conduct, or suspension or revocation of registration by the SEC or CFTC and suspension or expulsion by FINRA or the NFA, which could ultimately lead to the firm’s liquidation. Record levels and severe swings in market volatility in recent years have resulted in large and frequent changes in our available cash as we comply with these various requirements. In addition, if new or modified regulatory rules or requirements, or increased or more stringent enforcement and higher fines or greater sanctions, concerning required net capital, deposits, reserves, settlement obligations or other uses of cash, or the manner in which we operate our business and monitor and ensure compliance of our business operations with applicable laws, rules and regulations, are enacted or imposed in response to the recent economic crisis and certain recent enforcement actions and investigations, such rules or requirements could materially increase our cash requirements to conduct our business, require substantial increases in compliance, legal and/or brokerage operations costs (or result in fines, penalties or sanctions), limit or reduce our access to, or use of, a significant percentage of our now-available cash, or otherwise limit our ability to expand or even maintain our then-present levels of business, which could have a material adverse effect on our business, financial condition, results of operations and prospects. Also, our ability to withdraw capital from our TradeStation Securities and TradeStation Forex brokerage subsidiaries is subject to applicable regulations, which, particularly if withdrawal rules become more restrictive, could materially impact our available working capital and materially impact or limit our ability to make acquisitions, repay debt as and when due, redeem or purchase shares of our outstanding stock, if required or desirable, and pay dividends in the future. See “We May Need Cash In The Foreseeable Future” above.
If We Are Unable To Accelerate Or Otherwise Improve Our Technology Development Schedule With Respect To Release Or Launch Dates Of Planned Product And Service Initiatives And Enhancements, The Quality Of Our Products And Services And Competitiveness In The Active Trader Market May Decline
We currently have several technology development projects and initiatives in progress to launch new or enhanced features, products and services we believe will increase and improve the quality of our offering, our competitiveness in the marketplace, our ability to penetrate further the active trader market in the U.S. and abroad and certain segments of the buy side institutional trader market, and customer retention. We believe it is important to accelerate or otherwise improve the currently-planned release dates of these products and initiatives. Despite our efforts, if we fail to increase adequately or otherwise use effectively and efficiently our technology development resources to complete and launch these projects and initiatives, we may lose market share or suffer other material adverse consequences.
Our Systems And Our Customers’ Accounts May From Time To Time Be Vulnerable To Security Risks That Could Disrupt Operations, Harm Our Reputation And Expose Us To Potential Liability
Our online electronic trading platform includes security features that are intended to protect the privacy and integrity of customer accounts. Despite these security features, our systems and our
26
Table of Contents
Index to Financial Statements
customers’ accounts may from time to time be vulnerable to security risks such as break-ins and similar problems caused by third parties. We have experienced occurrences of unauthorized intrusion and criminal activity in customer accounts by persons who unlawfully access customer accounts and then place orders or other transactions in those accounts. Although we have taken measures and are in the process of completing measures to limit or prevent similar occurrences in the future, no assurance can be made that any such measures will be successful or that future occurrences will not result in substantial account losses that will ultimately be borne by us. Such intrusions and other disruptions could also disrupt our operations, harm our reputation and subject us to potential liability.
We Are Exposed to Credit Risk
We make margin loans to clients collateralized by client securities, and borrow securities to cover trades. In fact, nearly all of our clients’ accounts are margin, as opposed to cash, brokerage accounts. A portion of our net revenues is derived from interest on margin loans. To the extent that these margin loans exceed client cash balances maintained with us, we must obtain financing from third parties. We may not be able to obtain this financing on favorable terms or in sufficient amounts. By permitting clients to purchase securities on margin, we are subject to risks inherent in extending credit, especially during periods of rapidly declining markets (such as those experienced in 2008) in which the value of the collateral substantially decreases in proportion to the amount of a client’s indebtedness. While we have implemented risk-management procedures designed to reduce this risk, there can be no assurance that we will not experience periodic or frequent unsecured account debits that materially and adversely affect our results of operations. In addition, in accordance with regulatory guidelines, we collateralize borrowings of securities by depositing cash or securities with lenders. Sharp changes in market values of substantial amounts of securities and the failure by parties to the borrowing transactions to honor their commitments could have a material adverse effect on our revenues and profitability.
The Nature Of Our Business Results In Potential Liability To Customers
Many aspects of the securities, futures and forex brokerage business, including online trading services, involve substantial risks of liability. In recent years there has been a high incidence of litigation involving the securities and futures brokerage industry, including both class action and individual suits and arbitrations that generally seek substantial damages, including in some cases punitive damages. The technology we use and rely upon, in addition to offering charting, trade analysis and trade execution services of various kinds, is designed to automatically locate, with immediacy, the best available price in the appropriate market in completing execution of a trade triggered by programmed market entry and exit rules. There are risks that the electronic communications and other systems upon which these products and services rely, and will continue to rely, or our products and services themselves, as a result of flaws or other imperfections or limitations in their designs or performance, may operate too slowly, fail, cause confusion or uncertainty to the user, or operate or produce results not understood or intended by the user. An investor or trader using either our full electronic trading platform or our subscription service might claim that investment or trading losses or lost profits resulted from use of a flawed version of one of our trading software tools or systems, or inaccurate assumptions made by the trading software tools regarding data, or inaccurate data. Major failures of this kind may affect all customers who are online simultaneously. Any such litigation could have a material adverse effect on our business, financial condition, results of operations and prospects. We do not currently carry any errors or omissions insurance that might cover, in part, some of the above-described risks. While our contracts with customers are, we believe, clear that customers who do business with us must knowingly assume all of the risks described above, there can be no assurance that a judge, arbitrator or regulator would enforce or honor such contractual
27
Table of Contents
Index to Financial Statements
provisions. See “Conditions In The Securities And Financial Markets May Affect Our Rates Of Customer Acquisition, Retention And Trading Activity” and “Systems Failures May Result In Our Inability To Deliver Accurately, On Time, Or At All, Important And Time-Sensitive Services To Our Customers” above.
We May Be Subject To Intellectual Property Litigation
There has been substantial litigation in the software industry involving intellectual property rights. Although we do not believe that we are or will be infringing upon the intellectual property rights of others, any infringement case that may be brought against us could result in our being unable to use intellectual property which is integral to our business. In fact, we are currently involved in a lawsuit filed in the United States District Court, Northern District of Illinois, alleging that we are infringing several patents. See Item 3. Legal Proceedings.
We May Not Be Able To Adequately Protect Or Preserve Our Rights In Intellectual Property
Our success is and will continue to be heavily dependent on proprietary technology, including existing trading software, Internet, Web-site and order-execution technology, and those types of technology currently in development. We view our technology as proprietary, and rely, and will be relying, on a combination of copyright, trade secret and trademark laws, patent protection, nondisclosure agreements and other contractual provisions and technical measures to protect our proprietary rights. We own two patents, and also have pending patent applications covering certain aspects of the TradeStation electronic platform, but we do not yet know for certain if the patents will be issued. Policing unauthorized use of our products and services is difficult, however, and we may be unable to prevent, or unsuccessful in attempts to prevent, theft, “reverse-engineering,” copying, infringement or other unauthorized use or exploitation of our product and service technologies. There can be no assurance that the steps taken by us to protect (or defend) our proprietary rights will be adequate or that our competitors will not independently develop technologies that are substantially equivalent or superior to our technologies or products and services.
Self-Clearing Trades Has Risks
Self-clearing operations for our active trader equities accounts (stocks and ETFs) began in September 2004 and for equity and index options trades began in March 2005. Some institutional equities accounts also clear through us. Prior to the September 2004 conversion of clearing services, all of our customers’ equities trades were cleared through Bear Stearns (which was acquired by JP Morgan Chase in 2008), as our clearing agent, which also provided to our active trader clients its short sale borrowing inventory. Later in 2011 we expect to be a forex dealer and no longer rely on a third-party dealer for execution and settlement of forex trades, and as of January 2010 we began to clear futures on an omnibus basis. With respect to all clearing services we provide, errors made by us related to the confirmation, receipt, settlement and delivery functions involved in securities, futures or forex transactions, the custody and control of client securities, contracts and other assets, or otherwise relating to the handling of our clients’ securities, contracts and funds, could lead to civil penalties and increased deposit and other requirements by governmental and self-regulatory organizations, as well as losses and liability in lawsuits relating to client accounts affected by such errors. Also, our savings from self-clearing may be more than offset by account losses or reduced trading activity if we experience difficulties in providing to our clients sufficient short sale borrowing inventory (for equities traders) or if any self-clearing mistakes or failures occur which undermine our customers’ or prospects’ confidence in our ability to conduct reliable self-clearing operations. Also, our equities, equity option
28
Table of Contents
Index to Financial Statements
and new forex self-clearing back-office operations rely on software licensed to us by SunGard, and our business would likely suffer substantial harm if that software fails, fails to be adequately supported by SunGard, or otherwise causes unintended results, or SunGard experiences a sudden business failure.
There Are Risks Relating To Our Ability To Maintain Customer Privacy And Security And That Increased Government Regulation Of Internet Business May Occur
Customers may refuse to transact business over the Internet, particularly business, such as ours, that involves the handling of significant amounts of customers’ funds, due to privacy or security concerns. This risk will grow if, as and to the extent “cyberterrorism” occurs or is perceived to be a viable, prominent threat or likelihood to occur (or recur on a regular basis). We do incorporate security measures into our privacy policies. However, no assurances can be made that a breach of such measures will not occur, and a major breach of customer privacy or security could have serious consequences for our Internet-based operations, which are central to our business. Use of the Internet, particularly for commercial transactions, may not continue to increase as rapidly as it has during the past few years as a result of privacy or security concerns, or for other reasons. If this occurs, the growth of our operations would be materially hindered. If Internet activity becomes heavily regulated in these respects or otherwise, that could also have significant negative consequences for the growth of our current and planned operations. Regulation S-P, an expansive SEC regulation concerning privacy, has many rules and requirements and we risk incurring substantial fines, and other negative regulatory consequences, if we fail to meet those requirements. See “Our Systems and Our Customers’ Accounts May From Time to Time be Vulnerable to Security Risks that Could Disrupt Operations, Harm Our Reputation and Expose Us to Potential Liability” above.
The Loss of Key Employees Could Decrease The Quality of Our Management And Operations
Our future success depends, in part, upon the continued service of our key senior management and technology development personnel. While we believe no one at our company is irreplaceable, the loss of the services of one or more of these key employees could have a material adverse effect on us. There can be no assurance that we will be able to retain our key personnel. Departures and additions of personnel, to the extent disruptive, could have a material adverse effect on our business, financial condition and results of operations.
| ITEM 1B. | UNRESOLVED STAFF COMMENTS |
Not applicable.
| ITEM 2. | PROPERTIES |
We have a ten-year lease expiring in August 2012 (with two 5-year renewal options) that commenced in the summer of 2002 for an approximately 70,000 square-foot headquarters, which includes our brokerage and technology operations, in Plantation, Florida. Plantation is just west of Ft. Lauderdale, Florida (Broward County).
Our brokerage operations also have a 10,400 square foot branch office in Chicago, Illinois, pursuant to a lease that expires at the end of February 2016 and our TradeStation Prime Services division has a lease for a 2,840 square foot (inclusive of imputed common area space) branch office in New York, New York, which expires at the end of May 2015.
29
Table of Contents
Index to Financial Statements
Our technologies subsidiary also has an approximately 13,500 square foot leased facility in Richardson, Texas (expiring July 31, 2012) from which certain technology development and technical operations are conducted. A portion of those facilities serve as a branch office for TradeStation Securities. We also lease exclusive rack space for our data server farms at three sites; one site is in Richardson, Texas (which is currently month-to-month and is expected to terminate in the near future) and the other sites are in Chicago, Illinois and Secaucus, New Jersey (made up of various leases, the last of which expires in December 2012). The Secaucus server farm facility was leased to replace the Richardson server farm facility.
Our United Kingdom subsidiary leases an office in London, England, pursuant to a lease agreement that expires July 1, 2012.
We believe that our facilities are adequate to support our current operations and that, if needed, we will be able to obtain suitable additional facilities on commercially reasonable terms.
| ITEM 3. | LEGAL PROCEEDINGS |
On or about December 20, 2007, TradeStation Technologies was named as one of several defendants in a complaint filed in the United States District Court, Southern District of Texas, styled Amacker, et. al. v. Renaissance Asset Management (RAM), et. al. Other named defendants include Anthony Michael Ramunno, Man Financial Inc., MF Global, Inc., Lind-Waldock & Company, LLC, Vision, LP, Vision Financial Markets, LLC, R.J. O’Brien & Associates, Inc., and FXCM Holdings, LLC. The initial complaint alleged that over forty plaintiffs are entitled to damages because the plaintiffs were investors in a fraudulent commodity pool operated by Mr. Ramunno and RAM. The initial complaint alleged that TradeStation Technologies conducted trades on behalf of and at the request of Mr. Ramunno and RAM. The initial complaint attempted to allege the following claims: (i) violations of the Commodity Exchange Act and accompanying regulations; (ii) common law fraud under Texas law; (iii) statutory fraud under the Texas Business and Commerce Code; (iv) breach of fiduciary duties under Texas law; (v) negligent and intentional misrepresentations under Texas law; and (vi) negligence under Texas law. Plaintiffs filed a Second Amended Complaint that contained similar factual allegations and attempted to allege a single claim for aiding and abetting liability under the Commodity Exchange Act. The Second Amended Complaint asserted actual damages of at least $32.0 million. On October 10, 2008, the court dismissed the case for failure to state a claim upon which relief may be granted. On December 2, 2008, plaintiffs filed a notice of appeal with the United States Court of Appeals for the Fifth Circuit, and, on February 2, 2009, plaintiffs filed their Appellants’ Brief with that court. On March 6, 2009, TradeStation Technologies filed its Opposition Brief. Oral arguments on the appeal were held on September 2, 2009. No decision has yet been issued by the appeals court.
On or about February 9, 2010, TradeStation Securities and TradeStation Group were named as the only defendants in a complaint filed in the United States District Court, Northern District of Illinois, Eastern Division, styled Trading Technologies International, Inc. v. TradeStation Securities, Inc. and TradeStation Group, Inc. The complaint, as amended, alleges that TradeStation Securities and TradeStation Group have infringed and continue to infringe several patents held by Trading Technologies International, Inc. The plaintiff seeks a judgment enjoining the alleged infringement and awarding unspecified damages and costs. TradeStation Securities and TradeStation Group filed their answer on August 31, 2010 generally denying the allegations and asserting a variety of affirmative defenses. The FRCP Rule 26(a)(1) Initial Disclosures have been exchanged, and plaintiff’s Initial Infringement Contentions and Defendants’ Non-Infringement Contentions have been filed. Discovery
30
Table of Contents
Index to Financial Statements
has commenced and trial was initially scheduled for July 16, 2012, but will not go forward at that time because, on February 3, 2011, a Federal Judge granted Trading Technologies’ motion to consolidate 12 similar actions against various defendants, including the case against TradeStation Securities and TradeStation Group, into one case. On February 26, 2011, TradeStation filed a motion to de-consolidate itself. The case had a status conference on February 28, 2011. At that conference, TradeStation was given permission by the judge to file a summary judgment motion that, in our opinion, seeks to eliminate the crux of the plaintiff’s claims. While it is too early to predict the outcome of this matter, management believes the case to be without merit and we intend to defend it vigorously.
In May 2010, TradeStation Securities was served with a CFTC reparations complaint in the case styled ATS Capital Management Corp. v. TradeStation Securities and John Sendlosky, CFTC Docket No. 10-R015. The complaint alleges the wrongful liquidation of two E-Mini futures positions, one in 2007 and the other in 2008, and seeks damages of $529,950. On September 2, 2010, the Administrative Law Judge dismissed the complaint with prejudice on the grounds that the identical case was decided in TradeStation Securities’ favor in a National Futures Association arbitration conducted in May 2009. On September 17, 2010, the complainant filed its Notice of Appeal to the Commodity Futures Trading Commission and the parties have since submitted their legal briefs and are awaiting a decision. While it is too early to predict the outcome of this matter, management believes the appeal to be without merit.
TradeStation Securities is also engaged in routine regulatory matters and civil litigation or other dispute resolution proceedings. The pending regulatory and other matters could ultimately result in censures, sanctions, fines, damage awards, settlement payments and/or other negative consequences.
While no assurances can be given, we do not believe that the ultimate outcome of any of the above legal matters or claims will result in a material adverse effect on our consolidated financial position, results of operations or cash flows.
We decided, as of June 1, 2002, to no longer carry errors or omissions insurance that covers third-party claims made by brokerage customers or software subscribers as a result of alleged human or system errors, failures, acts or omissions. This decision was made based upon our assessment of the potential risks and benefits, including significant increases in premium rates, deductibles and coinsurance amounts, reductions in available per occurrence and aggregate coverage amounts, and the unavailability of policies that sufficiently cover the types of risks that relate to our business. We recently reviewed this insurance with insurance agents and our view remains unchanged.
| ITEM 4. | REMOVED AND RESERVED |
31
Table of Contents
Index to Financial Statements
| ITEM 5. | MARKET FOR REGISTRANT’S COMMON EQUITY, RELATED STOCKHOLDER MATTERS AND ISSUER PURCHASES OF EQUITY SECURITIES |
Our common stock, par value $.01 per share, is listed on The NASDAQ Global Select Market under the symbol “TRAD.” The high and low closing sales prices based on actual transactions on The NASDAQ Global Select Market during each of the quarters presented were as follows:
| Closing Sales Price | ||||||||
| High | Low | |||||||
| 2009: |
||||||||
| First Quarter |
$ | 6.88 | $ | 4.70 | ||||
| Second Quarter |
8.75 | 6.59 | ||||||
| Third Quarter |
8.92 | 7.00 | ||||||
| Fourth Quarter |
8.42 | 7.04 | ||||||
| 2010: |
||||||||
| First Quarter |
$ | 8.07 | $ | 6.41 | ||||
| Second Quarter |
8.44 | 6.70 | ||||||
| Third Quarter |
7.01 | 5.57 | ||||||
| Fourth Quarter |
6.82 | 5.28 | ||||||
| 2011: |
||||||||
| First Quarter (through March 1, 2011) |
$ | 7.19 | $ | 6.54 | ||||
As of March 1, 2011, there were 93 holders of record of our common stock, and, based upon information previously provided to us by depositories and brokers, we believe there are more than 5,661 beneficial owners.
We intend to retain future earnings to finance our growth and development and/or to consider, from time to time, engaging in stock buyback plans or programs, and therefore do not anticipate paying any cash dividends in the foreseeable future. Payment of any future dividends will depend upon our future earnings and capital requirements and other factors we consider appropriate. We did not distribute any dividends during the years ended December 31, 2010, 2009, or 2008.
In October 2006, our Board of Directors authorized, and we announced, the use of up to $60 million of our available and unrestricted cash, over a four-year period, to repurchase shares of our common stock in the open market or through privately-negotiated transactions. The stock repurchases were authorized to be made pursuant to a Rule 10b5-1 plan. The four-year period commenced on November 13, 2006 and ended on November 12, 2010. Pursuant to the buyback plan, up to $1,250,000 of company cash during each full calendar month (and prorated amount during the first and last months) of the four-year period (i.e., up to $15 million per 12-month period and up to $60 million
32
Table of Contents
Index to Financial Statements
for the four-year period) was authorized to be used to purchase company shares at prevailing prices, subject to compliance with applicable securities laws, rules and regulations, including Rules 10b5-1 and 10b-18. The buyback plan did not obligate us to acquire any specific number of shares in any period, and could have been modified, suspended, extended or discontinued at any time without prior notice.
The following table sets forth information on our common stock buyback program for the quarter ended December 31, 2010:
| Total number of shares purchased |
Average price paid per share |
Total number of shares purchased as part of publicly announced plan |
Approximate dollar value of shares that may yet be purchased under the plan |
|||||||||||||
| October 2010 |
200,380 | $ | 6.24 | 6,951,866 | $ | 500,000 | ||||||||||
| November 2010 |
84,606 | 5.91 | 7,036,472 | — | ||||||||||||
| December 2010 |
— | n/a | 7,036,472 | — | ||||||||||||
| Total |
284,986 | $ | 6.14 | |||||||||||||
33
Table of Contents
Index to Financial Statements
The following graph shows an annual comparison for the period covering December 31, 2005 through December 31, 2010 of cumulative total returns to shareholders of TradeStation Group, Inc., NASDAQ Composite Index and Index for NASDAQ Stocks (SIC 6210-6219 U.S. Companies) of U.S. security brokers, dealers, and flotation companies. Shareholders are cautioned that this graph shows total returns to investors only as of the dates noted and may not be representative of the total returns for any other past or future period.
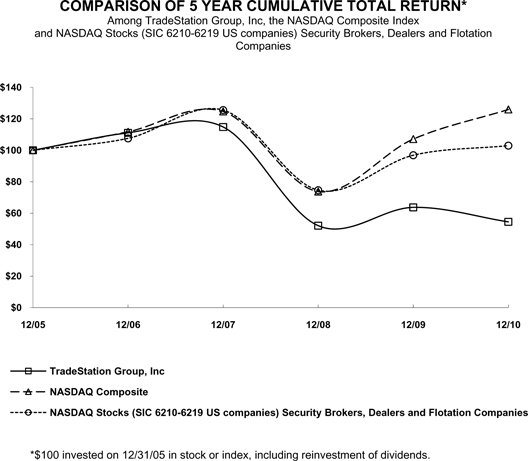
| Total Returns Index for: | 12/31/05 | 12/31/06 | 12/31/07 | 12/31/08 | 12/31/09 | 12/31/10 | ||||||||||||||||||
| TradeStation Group, Inc |
100.00 | 111.07 | 114.78 | 52.10 | 63.73 | 54.52 | ||||||||||||||||||
| NASDAQ Composite |
100.00 | 111.74 | 124.67 | 73.77 | 107.12 | 125.93 | ||||||||||||||||||
| NASDAQ Stocks (SIC 6210-6219 US companies) Security Brokers, Dealers and Flotation Companies |
100.00 | 107.55 | 125.53 | 74.60 | 96.85 | 102.93 | ||||||||||||||||||
34
Table of Contents
Index to Financial Statements
| ITEM 6. | SELECTED FINANCIAL DATA |
The following selected consolidated financial data should be read in conjunction with “MANAGEMENT’S DISCUSSION AND ANALYSIS OF FINANCIAL CONDITION AND RESULTS OF OPERATIONS” and the Consolidated Financial Statements and Notes thereto included in this report. The Consolidated Statement of Income Data presented below for the years ended December 31, 2010, 2009 and 2008, and the Consolidated Balance Sheet Data as of December 31, 2010 and 2009, have been derived from our Consolidated Financial Statements included on pages F-1 through F-38 of this report, which have been audited by Ernst & Young LLP, an independent registered public accounting firm. The Consolidated Statement of Income Data presented below for the years ended December 31, 2007 and 2006, and the Consolidated Balance Sheet Data as of December 31, 2008, 2007 and 2006, have been derived from audited financial statements not included in this report. See also Note 18 of Notes to Consolidated Financial Statements - UNAUDITED QUARTERLY FINANCIAL INFORMATION for quarterly unaudited financial information for fiscal years 2010 and 2009.
| YEAR ENDED DECEMBER 31 | ||||||||||||||||||||
| 2010 | 2009 | 2008 | 2007 | 2006 | ||||||||||||||||
| (In thousands, except per share data and footnotes) | ||||||||||||||||||||
| CONSOLIDATED STATEMENT OF INCOME DATA: |
||||||||||||||||||||
| Revenues: |
||||||||||||||||||||
| Brokerage commissions and fees |
$ | 108,318 | $ | 121,258 | $ | 129,304 | $ | 99,945 | $ | 78,829 | ||||||||||
| Interest income |
10,429 | 5,957 | 25,937 | 47,925 | 44,587 | |||||||||||||||
| Brokerage interest expense |
— | — | 3,166 | 5,121 | 4,635 | |||||||||||||||
| Net interest income |
10,429 | 5,957 | 22,771 | 42,804 | 39,952 | |||||||||||||||
| Subscription fees and other |
6,376 | 7,638 | 8,357 | 8,806 | 9,765 | |||||||||||||||
| Gains (losses) on marketable securities, net |
3,849 | (142 | ) | — | — | — | ||||||||||||||
| Net revenues |
128,972 | 134,711 | 160,432 | 151,555 | 128,546 | |||||||||||||||
| Expenses: |
||||||||||||||||||||
| Employee compensation and benefits |
44,583 | 41,715 | 40,166 | 34,179 | 29,379 | |||||||||||||||
| Clearing and execution |
28,716 | 31,182 | 38,914 | 32,262 | 26,107 | |||||||||||||||
| Data centers and communications |
14,211 | 11,480 | 9,216 | 8,186 | 6,453 | |||||||||||||||
| Marketing |
6,838 | 6,610 | 5,805 | 5,587 | 4,315 | |||||||||||||||
| Professional services |
3,640 | 3,372 | 3,453 | 3,270 | 3,411 | |||||||||||||||
| Occupancy and equipment |
3,188 | 3,072 | 2,989 | 2,802 | 2,549 | |||||||||||||||
| Depreciation and amortization |
5,311 | 4,362 | 4,218 | 4,009 | 2,508 | |||||||||||||||
| Other |
8,692 | 6,849 | 5,632 | 5,161 | 3,854 | |||||||||||||||
| Total expenses |
115,179 | 108,642 | 110,393 | 95,456 | 78,576 | |||||||||||||||
| Income before income taxes |
13,793 | 26,069 | 50,039 | 56,099 | 49,970 | |||||||||||||||
| Income tax provision |
2,353 | 10,279 | 19,402 | 20,728 | 18,951 | |||||||||||||||
| Net income |
$ | 11,440 | $ | 15,790 | $ | 30,637 | $ | 35,371 | $ | 31,019 | ||||||||||
| Earnings per share: |
||||||||||||||||||||
| Basic |
$ | 0.29 | $ | 0.38 | $ | 0.71 | $ | 0.80 | $ | 0.70 | ||||||||||
| Diluted |
$ | 0.28 | $ | 0.38 | $ | 0.70 | $ | 0.78 | $ | 0.67 | ||||||||||
| Dividends declared per share |
— | — | — | — | — | |||||||||||||||
| Weighted average shares outstanding: |
||||||||||||||||||||
| Basic |
39,815 | 41,507 | 43,235 | 44,246 | 44,591 | |||||||||||||||
| Diluted |
40,237 | 41,981 | 43,912 | 45,221 | 45,972 | |||||||||||||||
35
Table of Contents
Index to Financial Statements
| December 31 | ||||||||||||||||||||
| 2010 | 2009 | 2008 | 2007 | 2006 | ||||||||||||||||
| (In thousands, except footnotes) | ||||||||||||||||||||
| CONSOLIDATED BALANCE SHEET DATA: |
||||||||||||||||||||
| Cash and cash equivalents (1) |
$ | 41,888 | $ | 57,405 | $ | 100,314 | $ | 103,699 | $ | 74,539 | ||||||||||
| Cash and investments segregated in compliance with federal regulations (2) |
1,279,734 | 785,208 | 626,103 | 475,969 | 417,501 | |||||||||||||||
| Marketable securities (3) |
63,255 | 76,342 | 8,465 | 8,860 | 9,322 | |||||||||||||||
| Receivables from brokers, dealers, clearing organizations and clearing agents |
80,827 | 32,226 | 11,139 | 23,426 | 34,867 | |||||||||||||||
| Receivables from brokerage customers |
68,268 | 45,034 | 30,316 | 93,932 | 77,022 | |||||||||||||||
| Deposits with clearing organizations and clearing agents |
35,504 | 38,521 | 48,019 | 23,964 | 20,180 | |||||||||||||||
| Total assets |
1,593,166 | 1,049,196 | 837,432 | 744,687 | 649,087 | |||||||||||||||
| Shareholders’ equity |
173,437 | 170,508 | 165,001 | 143,958 | 118,205 | |||||||||||||||
| (1) | Includes restricted cash of $478,000, $717,000, $956,000, $1.2 million, and $1.4 million at December 31, 2010, 2009, 2008, 2007, and 2006, respectively. See Note 16 of Notes to Consolidated Financial Statements – COMMITMENTS AND CONTINGENCIES – Restricted Cash. Based upon the year-end calculation of cash and investments segregated in compliance with federal regulations (see below), cash and cash equivalents may increase or decrease on the first or second business day subsequent to year end. On January 4, 2010, cash and cash equivalents decreased by $7.7 million. On January 2, 2009, cash and cash equivalents increased by $4.1 million. On January 2, 2008, cash and cash equivalents decreased by $7.0 million. On January 3, 2007, cash and cash equivalents increased by $7.6 million. See Note 2 below. |
| (2) | On the first or second business day of each month, if required, this amount is adjusted based upon the month-end calculation. On January 3, 2011, the December 31, 2010 cash and investments segregated in compliance with federal regulations of $1.280 billion was decreased by $3.9 million to $1.276 billion. On January 4, 2010, the December 31, 2009 cash and investments segregated in compliance with federal regulations of $785.2 million was increased by $7.7 million to $792.9 million. On January 2, 2009, the December 31, 2008 cash and investments segregated in compliance with federal regulations of $626.1 million was decreased by $4.1 million to $622.0 million. On January 2, 2008, the December 31, 2007 cash and investments segregated in compliance with federal regulations of $476.0 million was increased by $7.0 million to $483.0 million. On January 3, 2007, the $417.5 million of cash and investments segregated in compliance with federal regulations as of December 31, 2006 was decreased by $7.6 million to $409.9 million. |
| (3) | Based upon the year-end calculation of cash and investments segregated in compliance with federal regulations (see above), marketable securities may increase or decrease on the first or second business day subsequent to year end. On January 3, 2011, marketable securities increased by $3.9 million. |
36
Table of Contents
Index to Financial Statements
| ITEM 7. | MANAGEMENT’S DISCUSSION AND ANALYSIS OF FINANCIAL CONDITION AND RESULTS OF OPERATIONS |
This discussion should be read in conjunction with the Selected Financial Data and the Consolidated Financial Statements and Notes to Consolidated Financial Statements contained in this report and the Risk Factors set forth in Item 1A of this report.
TradeStation Group, Inc., a Florida corporation formed in 2000, is the successor company to a publicly-held trading software company that was formed in 1982. TradeStation Group is listed on The NASDAQ Global Select Market under the symbol “TRAD.” TradeStation Securities, Inc., a licensed securities broker-dealer and a registered futures commission merchant, and TradeStation Technologies, Inc., a trading technology company, are TradeStation Group’s two established operating subsidiaries. The company has two other subsidiaries. TradeStation Europe Limited, a company organized under the laws of England and Wales, is authorized and regulated by the UK Financial Services Authority (FSA), and holds what is known as a “Passport,” to introduce brokerage accounts for residents of countries within the European Economic Area. TradeStation Forex, Inc., a Florida corporation (“TradeStation Forex”), was recently formed to assume, own and conduct all of our forex brokerage business (such business has historically been owned and conducted by TradeStation Securities using an established forex dealer firm to clear its forex business). In January 2011, TradeStation Forex was registered with the Commodity Futures Trading Commission (CFTC) as a Retail Foreign Exchange Dealer (RFED) and approved by the National Futures Association (NFA) as a forex dealer member (FDM). Later in 2011, TradeStation Forex expects to receive a transfer of all of TradeStation Securities’ forex accounts and commence operations as a forex dealer (at which time TradeStation Securities will cease its forex business).
The company’s core product/service, which is offered by TradeStation Securities (as well as TradeStation Europe and, soon, TradeStation Forex), is TradeStation, an award-winning electronic trading platform that enables traders to test and automate “rules-based” trading strategies (both technical and fundamental) across multiple asset classes, namely, equities, equity and index options, futures (chiefly electronic futures contracts), and foreign currencies (forex). The TradeStation electronic trading platform seamlessly integrates powerful strategy trading software tools, historical and streaming real-time market data, and electronic order-routing and execution. The TradeStation platform’s electronic order-routing of trades means, with respect to equities, equity and index options, and futures transactions, Internet connections to all major U.S., and some major European, electronic exchanges and marketplaces, or electronic access provided by certain market makers or other third parties who offer or enable ‘best execution.’ In each of these electronic marketplaces, buyers and sellers participating on the network are matched, often instantaneously following the placement of their orders. In addition to strategy trading tools, real-time market data and order placement and routing, the TradeStation electronic trading platform offers powerful automated and manual advanced order placement functions and capabilities, and numerous advanced charting and analytics features.
TradeStation Securities is a leading online brokerage firm that serves the active trader and certain institutional trader markets, and is the company’s principal operating subsidiary. TradeStation Securities is a member and subject to the rules and requirements of the NYSE, FINRA, SIPC, NFA, DTCC, OCC, BOX, CBOE, CHX, ISE, NASDAQ OMX, EDGA, EDGX, and BATS. TradeStation Securities’ business is also subject to the rules and requirements of the SEC, CFTC and state regulatory authorities (the firm is registered to conduct its brokerage business in all 50 states and the
37
Table of Contents
Index to Financial Statements
District of Columbia). TradeStation Securities self-clears most of its equities and equity and index options business, and uses an established futures clearing firm to clear its futures business on an omnibus clearance basis.
Beginning in September 2004, TradeStation Securities commenced equities self-clearing operations for its active trader client base and, beginning March 29, 2005, following issuance of its membership in the OCC, TradeStation Securities commenced full self-clearing of its standardized equity options trades for its active trader client base. Self-clearing has provided substantial cost savings and efficiencies. TradeStation Securities currently clears most institutional account securities trades through J.P. Morgan Clearing Corp. on a fully-disclosed basis, or provides order execution services on a DVP/RVP basis with the orders cleared and settled by the client’s prime brokerage firm. Through December 31, 2010, futures trades were cleared through R.J. O’Brien & Associates on a fully-disclosed basis and, for certain institutional futures accounts, order execution services are provided on a “give-up” basis with the orders cleared and settled by the client’s prime brokerage firm. Effective January 4, 2010, we converted our futures accounts held at R.J. O’Brien & Associates from a fully disclosed basis to an omnibus relationship and received approximately $349 million in futures customers’ funds, which were appropriately segregated in accordance with the Commodity Exchange Act rules. This omnibus clearance arrangement has a different fixed rate structure then the prior “fully-disclosed” relationship. Forex trades are, until our new forex offering is launched, cleared through GAIN Capital Group, Inc. on a fully-disclosed basis (J.P. Morgan Clearing Corp., R.J. O’Brien & Associates and GAIN Capital Group, Inc. are collectively referred to as “clearing agents” or “clearing agent firms”).
An active brokerage account has been defined as an account that either has a positive asset balance of at least $200 or has had activity within the past 180 days. In other words, an account is deemed inactive and is not included in counting total brokerage accounts if it has less than a $200 balance and has had no activity within the past 180 days. As of December 31, 2010, TradeStation Securities had 47,581 equities, futures and forex accounts (the vast majority of which were equities and futures accounts), a net increase of 1,405 accounts, or 3%, when compared to the 46,176 accounts as of December 31, 2009.
During the year ended December 31, 2010, TradeStation Securities’ brokerage customer account base averaged 80,567 daily average revenue trades (often called “DARTs”), a decrease of 11% when compared to 90,328 during 2009. The following table presents certain brokerage metrics and account information:
| For the Years
Ended December 31, |
% Change | |||||||||||||||||||
| 2010 | 2009 | 2008 | 2010 vs. 2009 |
2009 vs. 2008 |
||||||||||||||||
| Daily average revenue trades (DARTs) |
80,567 | 90,328 | 107,434 | (11 | )% | (16 | )% | |||||||||||||
| Client Trading Activity – Per Account |
||||||||||||||||||||
| Trades |
431 | 510 | 727 | (15 | )% | (30 | )% | |||||||||||||
| Brokerage commissions and fees per account |
$ | 2,301 | $ | 2,716 | $ | 3,224 | (15 | )% | (16 | )% | ||||||||||
| Net revenue per account |
$ | 2,562 | $ | 2,808 | $ | 3,686 | (9 | )% | (24 | )% | ||||||||||
38
Table of Contents
Index to Financial Statements
|
As of |
% Change | |||||||||||||||||||
| Dec 31, 2010 vs. Dec 31, 2009 |
Dec 31, 2009 vs. Dec 31, 2008 |
|||||||||||||||||||
| Dec 31, 2010 |
Dec 31, 2009 |
Dec 31, 2008 |
||||||||||||||||||
| Client Account Information |
||||||||||||||||||||
| Total brokerage accounts |
47,581 | 46,176 | 42,435 | 3 | % | 9 | % | |||||||||||||
| Average assets per account – equities |
$ | 73,107 | $ | 68,844 | $ | 58,631 | 6 | % | 17 | % | ||||||||||
| Average assets per account – futures |
$ | 23,046 | $ | 19,500 | $ | 18,077 | 18 | % | 8 | % | ||||||||||
We compute DARTs as follows: For equities and equity and index options, a revenue trade included to calculate DARTs is a commissionable trade order placed by the customer and executed, regardless of the number of shares or contracts included in the trade order. For futures and forex, a revenue trade included to calculate DARTs is one round-turn commissionable futures contract traded, or one round-turn lot (or forex deal) traded, regardless of the number of individual orders made and executed (i.e., one futures or forex order may contain numerous contracts or deals, but each round-turn contract and deal is counted as a separate revenue trade). When viewing our DARTs, it should be taken into account that, for equities and equity and index options, we charge commissions based on share volume (except for equities customers who opt for our per-trade basis commission structure commonly referred to as “flat-ticket” or “flat-commission”), and number of contracts traded. For futures, we charge commissions on a per contract basis (so each futures revenue trade included to calculate DARTs represents a round-turn commissionable contract traded). It should be noted that all DARTs are not equal. The revenue we derive from each revenue trade depends on the asset in question (equities, equity and index options, futures, forex – each has a different per unit revenue structure and cost structure), and, within each asset class, revenue per equity, contract or deal varies to the extent higher volume traders receive more favorable pricing, which they often do.
TradeStation Technologies, the company’s other established operating subsidiary, owns all of our intellectual property. TradeStation Technologies also provides subscription services for TradeStation. The subscription version of TradeStation is an institutional-quality service that offers strategy trading software tools that generate real-time buy and sell alerts based upon the subscriber’s programmed strategies, but does not include order execution. Subscribers are charged a monthly subscription fee.
TradeStation Europe Limited is our subsidiary in the United Kingdom. In February 2006, TradeStation Europe became authorized by the United Kingdom’s FSA to act as a Securities and Futures Firm in the United Kingdom to introduce accounts to TradeStation Securities. When TradeStation Forex becomes operational, we expect that TradeStation Europe will introduce forex accounts to TradeStation Forex. The FSA category of authorization is “ISD Category D Arranger,” meaning that TradeStation Europe may solicit and introduce UK clients who are active, experienced traders to its US affiliates for equities, options, futures and forex account services. In February 2007, TradeStation Europe obtained its “Passport” pursuant to which the company may use its FSA authorization to qualify to conduct similar business throughout the European Economic Area.
Critical Accounting Policies and Estimates
Our significant accounting policies are described in Note 2 of Notes to Consolidated Financial Statements included in this report – SUMMARY OF SIGNIFICANT ACCOUNTING POLICIES. The preparation of financial statements in conformity with accounting principles generally accepted in
39
Table of Contents
Index to Financial Statements
the United States requires management to make estimates and assumptions that affect the reported amounts of assets and liabilities and disclosure of contingent assets and liabilities at the date of the financial statements, as well as the reported amounts of revenues and expenses during the reporting period. Actual results could differ materially from those estimates.
Brokerage Commissions and Fees and Net Interest Income
Brokerage commissions and fees and net interest income are the key components of our results of operations and are comprised mainly of: (i) brokerage commissions and fees earned from securities, futures and forex transactions and, to a lesser extent, monthly platform fees earned from brokerage customers using the TradeStation online trading platform; and (ii) net interest earned and paid from self-clearing operations (primarily interest earned on brokerage customer cash balances and interest earned from brokerage customer margin debit balances), interest revenue sharing arrangements with clearing agent firms, and interest from corporate cash and cash equivalents and marketable securities. Brokerage commission income and related clearing costs are recorded on a trade date basis as transactions occur. Platform fees are recorded on a monthly basis as services are provided. Interest revenue and interest expense are recorded as interest is earned or incurred.
Income Taxes
We adopted the provisions of the Income Taxes Topic of the Financial Accounting Standards Board (FASB) Accounting Standards Codification (ASC) (the “Income Taxes Topic”). The Income Taxes Topic prescribes the minimum recognition threshold a tax position is required to meet before being recognized in the financial statements. It also provides guidance on derecognition, measurement, classification, interest and penalties, accounting in interim periods, disclosure and transition. As required by the Income Taxes Topic, we recognize the financial statement benefit of a tax position only after determining that the relevant tax authority would more likely than not sustain the position following an audit. For tax positions meeting the more-likely-than-not threshold, the amount recognized in the consolidated financial statements is the largest benefit that has a greater than 50 percent likelihood of being realized upon ultimate settlement with the relevant tax authority. We have evaluated tax positions for which the statute of limitations remain open. As of January 1, 2010, we had a liability for unrecognized tax benefits of $301,000, which was decreased to $111,000 during the 2010 year. If this tax benefit is recognized in the consolidated financial statements, it would not have a material impact to our effective income tax rate because the difference is temporary in nature. We do not anticipate any significant changes in uncertain tax positions over the next twelve months.
In accordance with the Income Taxes Topic, deferred income tax assets should be reduced by a valuation allowance if it is more likely than not that some portion or all of the deferred income tax assets will not be realized. Management evaluates and determines on a periodic basis the amount of the valuation allowance required and adjusts the valuation allowance as needed. As of December 31, 2010 and 2009, we had no valuation allowance on our deferred income tax assets. On a periodic basis, we will continue to evaluate our remaining deferred income tax assets to determine if a valuation allowance is required.
See Note 12 of Notes to Consolidated Financial Statements – INCOME TAXES for additional discussion of income taxes.
40
Table of Contents
Index to Financial Statements
Uninsured Loss Reserves
Effective June 1, 2002, we decided to no longer carry errors or omissions insurance that could cover certain third-party claims made by brokerage customers or software subscribers as a result of alleged human or system errors, failures, acts or omissions. This decision was made based upon our assessment of the potential risks and benefits, including significant increases in premium rates, deductibles and coinsurance amounts, reductions in available per occurrence and aggregate coverage amounts, and the unavailability of policies that sufficiently cover the types of risks that relate to our business. We recently considered this insurance and our view remains unchanged. Each quarter, we continue to evaluate our accruals, if any, for settlements related to claims and potential claims. Estimates of settlements for such potential claims, including related legal fees, are accrued in the consolidated financial statements, as necessary.
For the three years ended December 31, 2010 we operated in two principal business segments: (i) brokerage services; and (ii) software products and services. The brokerage services segment represents the operations of TradeStation Securities and, to a lesser extent, the operations of TradeStation Europe Limited. Once it becomes operational, the brokerage services segment also will include the operations of TradeStation Forex. The software products and services segment represents the operations of TradeStation Technologies. We ceased marketing our legacy software products and subscription software services in 2000. As a result, our primary sources of consolidated net revenues are currently generated from the brokerage services segment, and the brokerage services segment should continue to produce most of our net revenues for the foreseeable future. Approximately 59%, 54%, and 61% of our brokerage commissions and fees during the years ended December 31, 2010, 2009 and 2008, respectively, were generated by derivatives trading (financial and commodity futures, equity and index options, and spot forex), as opposed to cash equities trading (stocks and ETFs). Given the size of the percentage of net revenues from the brokerage services segment, other than our discussion and table in Note 17 of Notes to Consolidated Financial Statements – SEGMENT AND RELATED INFORMATION, we will discuss our results of operations for the overall company instead of on a segmented basis. See also Note 18 of Notes to Consolidated Financial Statements - UNAUDITED QUARTERLY FINANCIAL INFORMATION, for quarterly unaudited financial information for fiscal years 2010 and 2009. The following table summarizes our consolidated statements of income data and presentation of that data as a dollar change and percentage of change from period to period:
41
Table of Contents
Index to Financial Statements
| For the Years
Ended December 31, |
2010 vs. 2009 Variance |
2009 vs. 2008 Variance |
||||||||||||||||||||||||||
| 2010 | 2009 | 2008 | $ | % | $ | % | ||||||||||||||||||||||
| (In thousands, except percentages) | ||||||||||||||||||||||||||||
| Revenues: |
||||||||||||||||||||||||||||
| Brokerage commissions and fees |
$ | 108,318 | $ | 121,258 | $ | 129,304 | $ | (12,940 | ) | (11 | ) | $ | (8,046 | ) | (6 | ) | ||||||||||||
| Interest income |
10,429 | 5,957 | 25,937 | 4,472 | 75 | (19,980 | ) | (77 | ) | |||||||||||||||||||
| Brokerage interest expense |
— | — | 3,166 | — | 0 | (3,166 | ) | (100 | ) | |||||||||||||||||||
| Net interest income |
10,429 | 5,957 | 22,771 | 4,472 | 75 | (16,814 | ) | (74 | ) | |||||||||||||||||||
| Subscription fees and other |
6,376 | 7,638 | 8,357 | (1,262 | ) | (17 | ) | (719 | ) | (9 | ) | |||||||||||||||||
| Gains (losses) on marketable securities, net |
3,849 | (142 | ) | — | 3,991 | (2,811 | ) | (142 | ) | na | ||||||||||||||||||
| Net revenues |
128,972 | 134,711 | 160,432 | (5,739 | ) | (4 | ) | (25,721 | ) | (16 | ) | |||||||||||||||||
| Expenses: |
||||||||||||||||||||||||||||
| Employee compensation and benefits |
44,583 | 41,715 | 40,166 | 2,868 | 7 | 1,549 | 4 | |||||||||||||||||||||
| Clearing and execution |
28,716 | 31,182 | 38,914 | (2,466 | ) | (8 | ) | (7,732 | ) | (20 | ) | |||||||||||||||||
| Data centers and communications |
14,211 | 11,480 | 9,216 | 2,731 | 24 | 2,264 | 25 | |||||||||||||||||||||
| Marketing |
6,838 | 6,610 | 5,805 | 228 | 3 | 805 | 14 | |||||||||||||||||||||
| Professional services |
3,640 | 3,372 | 3,453 | 268 | 8 | (81 | ) | (2 | ) | |||||||||||||||||||
| Occupancy and equipment |
3,188 | 3,072 | 2,989 | 116 | 4 | 83 | 3 | |||||||||||||||||||||
| Depreciation and amortization |
5,311 | 4,362 | 4,218 | 949 | 22 | 144 | 3 | |||||||||||||||||||||
| Other |
8,692 | 6,849 | 5,632 | 1,843 | 27 | 1,217 | 22 | |||||||||||||||||||||
| Total expenses |
115,179 | 108,642 | 110,393 | 6,537 | 6 | (1,751 | ) | (2 | ) | |||||||||||||||||||
| Income before income taxes |
13,793 | 26,069 | 50,039 | (12,276 | ) | (47 | ) | (23,970 | ) | (48 | ) | |||||||||||||||||
| Income tax provision |
2,353 | 10,279 | 19,402 | (7,926 | ) | (77 | ) | (9,123 | ) | (47 | ) | |||||||||||||||||
| Net income |
$ | 11,440 | $ | 15,790 | $ | 30,637 | $ | (4,350 | ) | (28 | ) | $ | (14,847 | ) | (48 | ) | ||||||||||||
Years Ended December 31, 2010 and 2009
Net revenues were $129.0 million for the year ended December 31, 2010, compared to $134.7 million for the year ended December 31, 2009, a decrease of $5.7 million, or 4%. The primary reasons for this decrease were a decrease in brokerage commissions and fees of $12.9 million, or 11%, as a result, we believe, of lower market volatility and slower account growth, partially offset by an increase in net interest income of $4.5 million, or 75%, and a $4.0 million increase in gains on marketable securities. The increase in net interest income was a result primarily of investments in longer-term U.S. Treasury securities, TradeStation’s conversion of its futures business to omnibus clearing (beginning in January 2010 we assumed custody and control of futures client account assets), and an increase in our receivables from brokerage customers (margin balances). Of the $4.0 million increase in gains on marketable securities, $1.5 million was a result of TradeStation Securities marking its securities in the CBOE to market. The remaining $2.5 million increase in gains on marketable securities was primarily composed of net unrealized gains on U.S. Treasury securities. If TradeStation Securities and TradeStation Forex hold their current portfolio of U.S. Treasury securities until maturity, net unrealized gains of $2.0 million will reverse between December 31, 2010 and the maturity of each U.S. Treasury security as unrealized losses. As of December 31, 2010, the weighted
42
Table of Contents
Index to Financial Statements
average remaining maturity term of these investments was approximately seven months. Changes in the fair values of these and future investments may result in unrealized gains and losses or, if such instruments are sold, realized gains or losses. We do not consider any of these unrealized net gains (or future reversals thereof) or any future unrealized gains or losses to be important in evaluating our company or its operations, as ownership of these securities as investments is not core to our business or our business model.
Net income was approximately $11.4 million for the year ended December 31, 2010, compared to approximately $15.8 million for the year ended December 31, 2009, a decrease of approximately $4.4 million, or 28%, due primarily to our $12.9 million, or 11%, year-over-year decrease in brokerage commissions and fees, a $6.5 million increase in total expenses (which includes a $2.5 million, or 8%, decrease in clearing and execution costs resulting from the decrease in brokerage commissions and fees), partially offset by a $4.5 million, or 75%, increase in interest income, a $7.9 million, or 77%, decrease in income taxes, and an increase in gains on marketable securities of $4.0 million. The $7.9 million decrease in our income taxes included $2.9 million of non-recurring net income tax benefits primarily resulting from changes to our allocations of taxable income within various states.
Income before income taxes was $13.8 million (11% of net revenues) for the year ended December 31, 2010, compared to $26.1 million (19% of net revenues) for the year ended December 31, 2009, a decrease of $12.3 million, or 47%. Our $12.3 million decrease in income before income taxes was due primarily to our decrease in brokerage commissions and fees of $12.9 million, our increase in employee compensation and benefits expenses of $2.9 million (mostly resulting from the January 2010 merit salary increases for employees and the expansion of our technology departments and our TradeStation Prime Services division), and our increase in data centers and communications expenses of $2.7 million, partially offset by an increase in net interest income of $4.5 million, an increase in gains and losses on marketable securities of $4.0 million, and a decrease in clearing and execution costs of $2.5 million. Our pre-tax margin (income before income taxes divided by net revenues) decreased from 19% to 11% due primarily to the decrease in brokerage commissions and fees, the increase in employee compensation and benefits expenses, and the increase in data centers and communications expenses, partially offset by an increase in net interest income, an increase in gains and losses on marketable securities, and a decrease in clearing and execution costs. Excluding our $3.9 million of gains on marketable securities, our pre-tax margin for the year ended December 31, 2010 would have been 8%. Excluding $142,000 of net losses on marketable securities, our pre-tax margin for the year ended December 31, 2009 would have been 19%. We believe that excluding the gains and losses from our pre-tax margin calculation provides investors with a more accurate view of the results of our operations since we do not believe those gains and losses are important to our core business.
During the year ended December 31, 2010 we recorded an income tax provision of $2.4 million which resulted in an effective income tax rate of 17%. Our 2010 effective income tax rate was significantly impacted by a $2.9 million non-recurring net benefit primarily resulting from changes to our allocations of taxable income within various states and a research and development credit of $821,000. During the year ended December 31, 2009 we recorded an income tax provision of $10.3 million which resulted in an effective income tax rate of 39%. Our 2009 effective income tax rate included a research and development credit of $376,000.
43
Table of Contents
Index to Financial Statements
Revenues
Brokerage Commissions and Fees – Brokerage commissions and fees are commissions for securities, futures and forex transactions and, to a lesser extent, monthly service and other fees earned from brokerage customers using the TradeStation online trading platform or other brokerage services. For the year ended December 31, 2010, brokerage commissions and fees were approximately $108.3 million, compared to approximately $121.3 million for the year ended December 31, 2009. This $12.9 million, or 11%, decrease was due primarily to a $13.1 million decrease in brokerage commissions from lower trading volume related mostly, we believe, to lower market volatility and slower net account growth during 2010 as compared to 2009 (generally, as market volatility decreases our customer accounts’ trade volume decreases), partially offset by a $554,000 increase in revenues from service fees. We continuously review and assess our pricing, and we may adjust or restructure our commission and fee offerings from time to time in response to competitive pressures if and when they arise or as strategic pricing initiatives. For example, our new forex offering, which we expect will be launched later in 2011, will charge no service fees, premium software fees or commissions to forex customers, and will seek to derive transactional revenue solely by adding a reasonable “mark-up” to the forex spreads (this “mark-up” will be reflected as brokerage commissions and fees in our consolidated statements of income).
Interest Income – Interest income consists of interest earned on securities brokerage customer cash balances and margin lending balances, interest earned on futures brokerage customer cash balances (in 2010) and interest shared with us by our futures clearance agent (prior to 2010), interest shared with us by our forex clearance agent, and interest earned on corporate cash and cash equivalents and certain marketable securities. For the year ended December 31, 2010, interest income was $10.4 million as compared to $6.0 million for the year ended December 31, 2009. This $4.5 million, or 75%, increase was due primarily to investments in longer-term U.S. Treasury securities, TradeStation’s conversion of its futures business to an omnibus relationship with its clearing agent, and an increase in our receivables from brokerage customers (margin balances). The conversion to a futures omnibus relationship with our clearing agent increased our customer funds by $349.0 million on January 4, 2010. As of December 31, 2010, funds in our custody relating to these futures accounts totaled $410.8 million. The average margin balances on our equities accounts increased to an average of $57.0 million during the year ended December 31, 2010, compared to the average balance of $35.6 million during the year ended December 31, 2009. During the 2009 second quarter, the company reallocated most of its investments to U.S. Treasury securities and, to a lesser extent, money market funds that invest primarily in U.S. Treasury securities (collectively, U.S. Treasury Investments). As a result, the company’s interest income is now affected principally by the yields obtained from such investments. Prior to the 2009 second quarter, the weighted average rate of interest for equities accounts was based upon the federal funds daily effective rate of interest and, for futures accounts, was based on the federal funds target rate of interest. We estimate, based on the size and nature of our customer assets as of December 31, 2010 (and assuming for these purposes that the size and nature of our customer assets do not change), that each basis point increase or decrease in the U.S. Treasury Investments yield (based upon the tenure of the U.S. Treasury Investments) will impact our annual net income by approximately $41,000. Interest income for future periods may be materially affected by changes in the U.S. Treasury Investments yield and the extent, if any, to which our customer cash account balances and/or margin lending balances increase or decrease, as well as any decisions we may make to provide more or less favorable debit or credit interest rates to our customers.
Brokerage Interest Expense – Brokerage interest expense consists of amounts paid or payable to brokerage customers based on credit balances maintained in brokerage accounts and other brokerage-related
44
Table of Contents
Index to Financial Statements
interest expense. Brokerage interest expense does not include interest on company borrowings, which, if any, would be included in Expenses – Other below. We did not incur any interest expense during the years ended December 31, 2010 or 2009. Factors that could affect brokerage interest expense in the future include: the growth (if any) and mix of business in our brokerage customer base among equities, futures and forex; average assets per account and the portion of account assets held in cash; and future decisions concerning credit or debit interest rates offered to our equities, futures and forex customers (as a result of changes in short-term interest rates or for other business reasons).
Subscription Fees and Other – Subscription fees and other revenues consist of, primarily, monthly fees earned for providing streaming real-time, Internet-based trading analysis software tools and market data services to non-brokerage customers and, to a lesser extent, fees for our training workshops that are designed to help customers take fuller advantage of the features and functions of the TradeStation electronic trading platform. Subscription fees and other revenues were approximately $6.4 million for the year ended December 31, 2010, compared to approximately $7.6 million for the year ended December 31, 2009, a decrease of $1.3 million, or 17%. This decrease was due primarily to a decrease in the number of subscribers. The amount of subscription fees in the future will depend upon the number of subscription terminations and the number of new subscriptions each month. Subscription services and legacy customer software products have not been marketed in the U.S. since 2000, so it is expected that subscription terminations will continue to exceed new subscriptions.
Gains (Losses) on Marketable Securities, Net – Gains (losses) on marketable securities, net, consist of realized and unrealized gains or losses from TradeStation Securities’ and TradeStation Forex’s investments in U.S. Treasury securities and realized and unrealized gains or losses from TradeStation Securities’ investments in equity securities. For the year ended December 31, 2010, the net gains on marketable securities of $3.8 million included a $2.2 million unrealized gain from marking U.S. Treasury securities to fair value, a $1.5 million unrealized gain from marking our investment in CBOE to market, and a realized gain of $159,000 from TradeStation Securities’ sale of equity securities it owned in NYSE. TradeStation Securities’ unrealized loss of $142,000 during the year ended December 31, 2009 was a result of marking U.S. Treasury securities to market.
Expenses
Employee Compensation and Benefits – Employee compensation and benefits expenses include employee salaries, sales commissions, bonuses, stock-based compensation and, to a lesser extent, payroll taxes, employee benefits (including group health insurance and employer contributions to benefit programs), recruitment, temporary employee services and other related employee costs. Employee compensation and benefits expenses were $44.6 million for the year ended December 31, 2010, compared to $41.7 million for the year ended December 31, 2009, an increase of $2.9 million, or 7%. This increase was due primarily to increases in wages paid of $3.5 million and in stock-based compensation of $411,000, partially offset by decreases in commissions of $554,000 and bonuses of $513,000. The $3.5 million increase in wages paid to employees resulted mostly from the January 2010 merit salary increases for employees and the expansion of our TradeStation Prime Services Division and technology departments. During the year ended December 31, 2010, there was an average of 396 full-time equivalent employees, compared to an average of 381 full-time equivalent employees during the year ended December 31, 2009. Employee compensation and benefits expenses are anticipated to increase during 2011 primarily due to merit wage increases.
Clearing and Execution – Clearing and execution expenses include the costs associated with executing and clearing customer trades, including fees paid to clearing agents and clearing
45
Table of Contents
Index to Financial Statements
organizations, exchanges and other market centers, fees and royalties paid for the licensing of self-clearing, back-office software systems and related services, and commissions paid to third-party broker-dealers. Clearing and execution expenses were $28.7 million for the year ended December 31, 2010, compared to $31.2 million for the year ended December 31, 2009, a decrease of $2.5 million or 8%. The decrease in clearing and execution expenses, which, as a percentage of brokerage commissions and fees, increased to 27% during the year ended December 31, 2010, compared to 26% during the year ended December 31, 2009, was primarily a result of a change in our mix of business among asset classes and a $978,000 increase in the fixed portion of futures clearing costs due to our conversion to a futures omnibus relationship with our clearing agent in January 2010.
Data Centers and Communications – Data centers and communications expenses consist of: (i) data communications costs necessary to connect our server farms directly to electronic marketplaces, data sources and to each other; (ii) data communications costs and rack space at our facilities where the data server farms are located; (iii) data distribution and exchange fees; and (iv) telephone, Internet and other communications costs. In 2010, the company began its expansion to a new (third) server farm in New Jersey. Data centers and communications expenses were $14.2 million for the year ended December 31, 2010, compared to $11.5 million for the year ended December 31, 2009, an increase of $2.7 million, or 24%. The increase was due primarily to a $1.5 million increase in server farm costs, a $753,000 increase in exchange fees, a $287,000 increase in circuit costs to connect our server farms to data providers and electronic market places, and a $222,000 increase in equipment maintenance costs for our servers. The increase in server farm costs resulted from the costs associated with setting up the new server farm and increases in rack space, power, equipment maintenance and bandwidth charges. It is anticipated that, beginning in the 2011 second quarter, the company will have only two server farms, as the New Jersey facility is intended to replace the one we have in Richardson, Texas. If and when this occurs, our expenses for server farm facilities leases and related items should decrease.
Marketing – Marketing expenses come from marketing programs, primarily: advertising in various media, including Internet, direct mail, television and print media; account opening kits, and related postage; brochures; and other promotional items, including exhibit costs for industry events. Marketing expenses for the year ended December 31, 2010 were $6.8 million, compared to $6.6 million for the year ended December 31, 2009, an increase of $228,000, or 3%, due to increased advertising. Our marketing expenses in the future may vary significantly as a result of several factors, which may include the success of current and future sales and marketing campaigns and strategies, the launch or release of new platform versions, products or services, the offering of sales seminars, and economic and market conditions. We expect marketing expenses to increase in 2011 as a result of launching our new marketing campaign, and dedicating advertising to our new forex offering and to marketing in Europe.
Professional Services – Professional services expenses consist of fees for legal, accounting, tax, and other professional and consulting services. Professional services expenses were $3.6 million for the year ended December 31, 2010, compared to $3.4 million for the year ended December 31, 2009, an increase of $268,000, or 8%, due primarily to an increase of $152,000 in legal fees and an increase of $119,000 in professional fees paid for tax work.
Occupancy and Equipment – Occupancy and equipment expenses include rent, utilities, property taxes, repairs, maintenance and other expenses pertaining to our office space. Occupancy and equipment expenses were $3.2 million for the year ended December 31, 2010, compared to $3.1 million for the year ended December 31, 2009, an increase of $116,000, or 4%, due primarily to increased rent.
46
Table of Contents
Index to Financial Statements
Depreciation and Amortization – Depreciation and amortization expenses consist primarily of depreciation on property and equipment and, to a lesser extent, amortization of intangible assets. Depreciation and amortization expenses were $5.3 million for the year ended December 31, 2010, compared to $4.4 million for the year ended December 31, 2009, an increase of $949,000, or 22% due primarily to the purchase of trading analysis software technology and other capital expenditures. Depreciation expense is expected to increase in the future based upon the level of capital spending we deem necessary to support our current business and the growth in our business (assuming that growth occurs – it may not) and to enhance and improve the quality, reliability, speed and capacity of our brokerage services and systems, as well as recent and possible future acquisitions of software technology from third parties. See Liquidity and Capital Resources below.
Other – Other expenses include insurance, regulatory fees and related costs, employee travel and entertainment, settlements for legal matters, costs related to our conferences, training workshops, software maintenance, public company expenses, supplies, postage, exchange memberships, customer debits and errors, bank charges, and other administrative expenses. Other expenses were $8.7 million for the year ended December 31, 2010, compared to $6.8 million for the year ended December 31, 2009, an increase of $1.8 million, or 27%. This increase was due primarily to increases in taxes other than income taxes of $792,000, which pertained primarily to a sales tax accrual, an increase of $311,000 for the cost of an operational issue that replicated certain customer orders, an increase in software maintenance of $290,000, an increase in bank charges of $282,000, an increase in travel and entertainment of $255,000, and an increase in reference materials of $112,000, partially offset by a decrease in customer debits and errors of $472,000.
Years Ended December 31, 2009 and 2008
Net revenues were $134.7 million for the year ended December 31, 2009, compared to $160.4 million for the year ended December 31, 2008, a decrease of $25.7 million, or 16%. The primary reasons for this decrease were a decrease in net interest income of $16.8 million, or 74%, and a decrease in brokerage commissions and fees of $8.0 million, or 6%. The decrease in net interest income was the result of decreases in interest rates and decreased receivables from brokerage customers (margin balances).
Net income was approximately $15.8 million for the year ended December 31, 2009, compared to approximately $30.6 million for the year ended December 31, 2008, a decrease of approximately $14.8 million, or 48%, due primarily to our $16.8 million, or 74%, year-over-year decrease in net interest income, our $8.0 million, or 6%, year-over-year decrease in brokerage commissions and fees, and our $6.0 million, or 8%, increase in total expenses, net of clearing and execution costs, partially offset by our $7.7 million, or 20%, year-over-year decrease in clearing and execution costs, which resulted from the decrease in brokerage commissions and fees and a change in the mix of business among asset classes.
Income before income taxes was $26.1 million (19% of net revenues) for the year ended December 31, 2009, compared to $50.0 million (31% of net revenues) for the year ended December 31, 2008, a decrease of $24.0 million, or 48%. Our decrease in income before income taxes was due primarily to our decrease in net interest income of $16.8 million, our decrease in brokerage commissions and fees of $8.0 million, our increase in data centers and communications expenses of $2.3 million, and our increase in employee compensation and benefits expenses of $1.5 million (mostly in our technology development departments), partially offset by our decrease in clearing and execution costs of $7.7
47
Table of Contents
Index to Financial Statements
million. Our pre-tax margin (income before income taxes divided by net revenues) decreased from 31% to 19% due primarily to the decrease in net interest income, the decrease in brokerage commissions and fees, the increase in data centers and communications expenses, and the increase in employee compensation and benefits expenses, partially offset by the decrease in clearing and execution costs.
During the year ended December 31, 2009, we recorded an income tax provision of $10.3 million, or 39%, of our income before income taxes, compared with $19.4 million, or 39% of our income before income taxes, during the year ended December 31, 2008.
Revenues
Brokerage Commissions and Fees – For the year ended December 31, 2009, brokerage commissions and fees were approximately $121.3 million, compared to approximately $129.3 million for the year ended December 31, 2008. This $8.0 million, or 6%, decrease was due primarily to a $12.6 million decrease in brokerage commissions from lower trading volume related mostly, we believe, to lower market volatility during 2009 as compared to 2008 (generally, as market volatility decreases our customer accounts’ trade volume decreases), and slower net account growth in 2009, partially offset by an increase in platform and other fees of $4.6 million, which includes an increase in platform fees of $2.3 million and forex revenue sharing of $1.8 million (resulting from more favorable terms achieved under our forex contract with the forex dealer to whom we introduced our accounts). We continuously review and assess our pricing – both commissions and platform fees. In July 2008, we began to offer our equities account customers the choice of being charged on a flat-ticket basis for their equities trades (as opposed to a per-share basis).
Interest Income – For the year ended December 31, 2009, interest income was $6.0 million as compared to $25.9 million for the year ended December 31, 2008. This $20.0 million, or 77%, decrease was due primarily to decreases in interest rates and to reduced interest on receivables from brokerage customers (interest on margin balances). During 2009, the company reallocated most of its investments to U.S. Treasury Investments. As a result, beginning in 2009, the company’s interest income is affected principally by the yields obtained from such investments. The company’s interest income historically has been dependent upon the federal funds daily effective rate and the federal funds target rate of interest, but, since the shift to U.S. Treasury Investments in 2009, those rates are relevant only to the extent they influence the renewal rates we are offered on our U.S. Treasury Investments. Historically, the weighted average rate of interest for equities accounts was based upon the federal funds daily effective rate of interest and, for futures accounts, was based on the federal funds target rate of interest.
Brokerage Interest Expense – For the year ended December 31, 2009, brokerage interest expense was $0, compared to $3.2 million for the year ended December 31, 2008. This $3.2 million decrease was due to the elimination of interest rates offered to brokerage customers on their account cash balances. During 2009, the average annual credit interest rate paid to our equities customers on balances in excess of $10,000 was 0%, compared to approximately 0.658% during 2008. Futures and forex customers, consistent with industry customs, have not ever been paid interest on the cash balances in their accounts.
Subscription Fees and Other – Subscription fees and other were approximately $7.6 million for the year ended December 31, 2009, compared to approximately $8.4 million for the year ended December 31, 2008, a decrease of $719,000, or 9%. This decrease in subscription fees and other was due to a decrease in the number of subscribers.
48
Table of Contents
Index to Financial Statements
Gains (Losses) on Marketable Securities, Net – For the year ended December 31, 2009, the net loss of $142,000 were a result of marking TradeStation Securities’ U.S. Treasury securities to fair value.
Expenses
Employee Compensation and Benefits – Employee compensation and benefits expenses were $41.7 million for the year ended December 31, 2009, compared to $40.2 million for the year ended December 31, 2008, an increase of $1.5 million, or 4%. This increase was due primarily to increases in wages paid of $3.4 million, partially offset by decreases in stock-based compensation of $1.2 million, bonuses of $443,000, and recruiting fees, employee events, sales commissions, and temporary help totaling $576,000. The increase in wages was due primarily to increased headcount (mostly in our technology development departments). The decrease in stock-based compensation is due primarily to $860,000 of additional expense in 2008 relating to accelerated vesting of certain officer and director stock options that occurred as a result of the collective beneficial ownership of the company by the company’s co-founders falling below 25%. (See Note 10 of Notes to Consolidated Financial Statements – STOCK-BASED COMPENSATION – Vesting Acceleration of Certain Options for additional discussion regarding this acceleration of vesting). At December 31, 2009, there were 396 full-time equivalent employees, a 9% increase, compared to 363 full-time equivalent employees at December 31, 2008.
Clearing and Execution – Clearing and execution expenses were $31.2 million for the year ended December 31, 2009, compared to $38.9 million for the year ended December 31, 2008, a decrease of $7.7 million, or 20%, due to our decrease in brokerage commissions and fees. The decrease in clearing and execution expenses as a percentage of brokerage commissions and fees (which decreased to 26% during 2009, compared to 30% during 2008) was primarily a result of a change in our mix of business among asset classes.
Data Centers and Communications – Data centers and communications expenses were approximately $11.5 million for the year ended December 31, 2009, compared to $9.2 million for the year ended December 31, 2008, an increase of $2.3 million, or 25%. The increase was due primarily to increases in circuit costs to connect our server farms to data providers and electronic marketplaces of $827,000, increases in exchange fees of $743,000, and increases in rack space, power and bandwidth charges at our server farms of $550,000.
Marketing – Marketing expenses for the year ended December 31, 2009 were $6.6 million, compared to $5.8 million for the year ended December 31, 2008, an increase of $805,000, or 14%, due primarily to increased advertising of $647,000.
Professional Services – Professional services expenses were $3.4 million for the year ended December 31, 2009, compared to $3.5 million for the year ended December 31, 2008, a decrease of $81,000, or 2%.
Occupancy and Equipment – Occupancy and equipment expenses were $3.1 million for the year ended December 31, 2009, compared to $3.0 million for the year ended December 31, 2008, an increase of $83,000, or 3%.
49
Table of Contents
Index to Financial Statements
Depreciation and Amortization – Depreciation and amortization expenses were $4.4 million for the year ended December 31, 2009, compared to $4.2 million for the year ended December 31, 2008, an increase of $144,000, or 3%.
Other – Other expenses were $6.8 million for the year ended December 31, 2009, compared to $5.6 million for the year ended December 31, 2008, an increase of $1.2 million, or 22%. This increase was due primarily to increases in fees to third parties of $633,000, increases in software maintenance of $319,000, and increases in regulatory fees and expenses of $232,000.
During the year ended December 31, 2010 we recorded an income tax provision of $2.4 million which resulted in an effective income tax rate of 17%. Our 2010 effective income tax rate was significantly impacted by a $2.9 million non-recurring net income tax benefit primarily resulting from changes to our allocations of taxable income within various states and a research and development credit of $821,000. During the year ended December 31, 2009 we recorded an income tax provision of $10.3 million which resulted in an effective income tax rate of 39%. Our 2009 effective income tax rate included a research and development credit of $376,000.
In accordance with guidance in the Income Taxes Topic of the FASB ASC, deferred income tax assets should be reduced by a valuation allowance if it is more likely than not that some portion or all of the deferred income tax assets will not be realized. On a periodic basis, management evaluates and determines the amount of the valuation allowance required and adjusts such valuation allowance accordingly. There was no valuation allowance on our deferred income taxes as of December 31, 2010 or 2009. On a periodic basis, we will continue to evaluate our remaining deferred income tax assets to determine if a valuation allowance is required.
As of December 31, 2010, for financial reporting purposes, we estimate that we had available for federal income tax purposes total net operating loss carryforwards of approximately $316,000. These net operating loss carryforwards expire in 2019. We utilized research and development tax credits of approximately $821,000, $376,000 and $282,000 during the years ended December 31, 2010, 2009 and 2008, respectively.
The Income Taxes Topic also provides guidance on derecognition, measurement, classification, interest and penalties, accounting in interim periods, disclosure and transition. As required by the Income Taxes Topic, effective January 1, 2007, we have evaluated tax positions for which the statute of limitations remain open. We recognize the financial statement benefit of a tax position only after determining that the relevant tax authority would more likely than not sustain the position following an audit. For tax positions meeting the more-likely-than-not threshold, the amount recognized in the consolidated financial statements is the largest benefit that has a greater than 50 percent likelihood of being realized upon ultimate settlement with the relevant tax authority. The adoption of provisions under the Income Taxes Topic with respect to tax positions, which were adopted on January 1, 2007, did not require any cumulative effect adjustments to beginning retained earnings and did not have a material effect on the company’s consolidated financial position, results of operations or cash flows. We had a liability for unrecognized tax benefits of $111,000 and $301,000 as of December 31, 2010 and 2009, respectively.
As of December 31, 2010, we were subject to federal income taxes in the U.S. and income taxes in five states, and in the United Kingdom. Tax regulations within each jurisdiction are subject to the
50
Table of Contents
Index to Financial Statements
interpretation of the related tax laws and regulations and require significant judgment to be applied. In July 2009, we were notified by the Internal Revenue Service that we would undergo a routine U.S. federal tax examination for the 2007 fiscal year. In March 2010, we were notified that we would undergo a routine U.S. federal tax examination for the 2008 fiscal year and that we would undergo routine tax examinations by a state tax authority for the 2007 and 2008 fiscal years. In March 2011, we were notified that we would undergo a routine tax examination by another state authority for the 2007 through 2009 fiscal years. The U.S. federal tax examinations for the 2007 and 2008 fiscal years were completed with no significant adjustments. The examinations by one of the state tax authorities for the 2007 and 2008 fiscal years were completed with no adjustments. The company is no longer subject to U.S. federal tax examinations or state and local tax examinations for periods prior to 2006.
See Note 12 of Notes to Consolidated Financial Statements – INCOME TAXES.
The operating results for any quarter are not necessarily indicative of results for any future period or for the full year. Our quarterly revenues and operating results have varied in the past, and are likely to vary in the future. Such fluctuations are likely to result in volatility in the price of our common stock. See Item 1A. Risk Factors and Note 18 of Notes to Consolidated Financial Statements – UNAUDITED QUARTERLY FINANCIAL INFORMATION.
Liquidity and Capital Resources
As of December 31, 2010, we had cash and cash equivalents of $41.9 million, of which $478,000 was restricted in support of a facility lease. On January 3, 2011, as a result of TradeStation Securities’ December 31, 2010 month-end calculation under Rule 15c3-3 of the Securities Exchange Act of 1934 (see below), $3.9 million of the $1.28 billion of cash and investments segregated in compliance with federal regulations shown on our consolidated balance sheet at December 31, 2010 was transferred to marketable securities. We had marketable securities of approximately $63.3 million at December 31, 2010, of which $5.7 million could be tendered for sale upon notice (generally no longer than seven days) to the remarketing agent. The remaining $57.6 million was composed of $55.8 million in U.S. Treasury Bills and Treasury Notes with original maturities greater than three months and $1.8 million in actively-traded, marketable, exchange-listed equity securities. See Note 2 of Notes to Consolidated Financial Statements – SUMMARY OF SIGNIFICANT ACCOUNTING POLICIES – Marketable Securities.
As of December 31, 2010, TradeStation Securities had: $1.28 billion of cash and investments segregated in compliance with federal regulations in special reserve bank accounts for the exclusive benefit of customers under Rule 15c3-3 of the Securities Exchange Act of 1934 and other regulations; receivables from brokerage customers of $68.3 million; and receivables from brokers, dealers, clearing organizations and clearing agents of $80.8 million. Client margin loans are demand loan obligations secured in part by cash and/or readily marketable securities. Receivables from and payables to brokers, dealers, clearing organizations and clearing agents represent primarily current open transactions, which usually settle, or can be closed out, within a few business days.
Liquidity needs relating to client trading and margin borrowing activities are met primarily through cash balances in brokerage client accounts, which were $1.38 billion at December 31, 2010. Management believes that brokerage cash balances and operating earnings will continue to be the primary source of liquidity for TradeStation Securities (and for TradeStation Forex) in the future.
51
Table of Contents
Index to Financial Statements
TradeStation Securities is subject to the net capital requirements of the SEC’s Uniform Net Capital Rule (Rule 15c3-1), which is administered by the SEC and FINRA, and the CFTC financial requirement (Regulation 1.17 under the Commodity Exchange Act), which is administered by the CFTC and the NFA. Under these rules, TradeStation Securities calculates its net capital requirements using the “alternative method,” which requires the maintenance of minimum net capital, as defined by the rules, equal to the highest of: (i) $1,000,000; (ii) 8.0% of domestic and foreign domiciled customer and non-customer (excluding proprietary) risk maintenance margin/performance bond requirements for all domestic and foreign futures, options on futures contracts and cleared over-the-counter derivatives positions excluding the risk margin associated with naked long option positions; or (iii) 2.0% of aggregate customer debit balances. At December 31, 2010, TradeStation Securities had net capital of approximately $68.4 million (51% of aggregate debit items), which was approximately $65.6 million in excess of its required net capital of approximately $2.8 million.
As an RFED, starting in 2011 TradeStation Forex is subject to the Adjusted Net Capital requirements of the CFTC (17 C.F.R. §5.7) and the NFA Financial Requirement Rule (§ 11(a)(i)). Under these rules, TradeStation Forex is required to maintain Adjusted Net Capital of at least $20,000,000. In anticipation of TradeStation being approved as an RFED (which happened in January 2011), we contributed $23.0 million to TradeStation Forex on August 13, 2010.
In addition to net capital requirements, as a self-clearing broker-dealer TradeStation Securities is subject to DTCC, OCC, and other cash deposit requirements, which are and may continue to be large in relation to TradeStation Group’s total liquid assets, and which may fluctuate significantly from time to time based upon the nature and size of TradeStation Securities’ active trader clients’ securities trading activity. As of December 31, 2010, we had security deposits and short-term U.S. Treasury Bills totaling $35.5 million with clearing organizations for the self-clearing of equities and standardized equity option trades.
52
Table of Contents
Index to Financial Statements
As of December 31, 2010, we have no long-term debt obligations or capital lease obligations. A summary of our operating lease obligations and minimum purchase obligations (related to back-office systems and telecommunications services) is as follows (in thousands):
| Payments Due By Period | ||||||||||||||||||||
| Less Than 1 Year |
1-3 Years |
3-5 Years |
More than 5 Years |
|||||||||||||||||
| Contractual Obligations |
Total | 2011 | 2012-2013 | 2014-2015 | After 2015 | |||||||||||||||
| Operating lease obligations |
$ | 10,445 | $ | 5,788 | $ | 3,682 | $ | 918 | $ | 57 | ||||||||||
| Purchase obligations |
5,407 | 4,499 | 862 | 46 | — | |||||||||||||||
| Total |
$ | 15,852 | $ | 10,287 | $ | 4,544 | $ | 964 | $ | 57 | ||||||||||
In addition to the purchase obligations set forth in the table above, we currently anticipate, in order to provide for additional growth of our brokerage business (there being no assurance additional growth will occur), capital expenditures of up to $5.2 million in 2011 (primarily for the purchase of computer hardware and software to support the growth of our data server farms, back-office systems and other infrastructure to support our business). These expenditures are expected to be funded through operating cash flows, capital leases, or a combination of the two.
In October 2006, our Board of Directors authorized, and we announced, the use of up to $60 million of our available and unrestricted cash, over a four-year period, to repurchase shares of our common stock in the open market or through privately-negotiated transactions. The stock repurchases were authorized to be made pursuant to a Rule 10b5-1 plan. The four-year period commenced on November 13, 2006 and ended on November 12, 2010. Pursuant to the buyback plan, up to $1,250,000 of company cash during each full calendar month (and prorated amount during the first and last months) of the four-year period (i.e., up to $15 million per 12-month period and up to $60 million for the four-year period) was authorized to be used to purchase company shares at prevailing prices, subject to compliance with applicable securities laws, rules and regulations, including Rules 10b5-1 and 10b-18. The buyback plan did not obligate us to acquire any specific number of shares in any period, and could have been modified, suspended, extended or discontinued at any time without prior notice.
During the year ended December 31, 2010, we used $13.0 million to purchase 1,886,217 shares of our common stock at an average price of $6.88 per share. Since commencement of this stock buyback plan on November 13, 2006 through November 12, 2010, we used $59.8 million to purchase 7,036,472 shares of our common stock at an average price of $8.50 per share. All shares purchased have been retired. See Item 5. MARKET FOR REGISTRANT’S COMMON EQUITY, RELATED STOCKHOLDER MATTERS AND ISSUER PURCHASES OF EQUITY SECURITIES – Share Repurchases.
We anticipate that our available cash resources and cash flows from operations will be sufficient to meet our presently anticipated working capital and capital expenditure requirements through at least the next twelve months.
53
Table of Contents
Index to Financial Statements
Net cash provided by operating activities totaled approximately $10.3 million during the year ended December 31, 2010. Net cash used in operating activities totaled approximately $1.8 million during the year ended December 31, 2009. Net cash provided in operating activities totaled approximately $13.5 million during the year ended December 31, 2008. The increase of $12.0 million during the year ended December 31, 2010 was due to changes in net brokerage assets of $15.4 million, net changes of $4.0 million in non-brokerage working capital items, partially offset by a decrease in net income, as adjusted for non-cash items, of $7.4 million. The increase in net brokerage assets was primarily a result of an $11.2 million increase in excess reserve deposits transferred from our marketable securities during the year ended December 31, 2010 in connection with TradeStation Securities’ conversion to a futures omnibus arrangement. The decrease of $15.3 million during the year ended December 31, 2009 was due to a decrease in net income, as adjusted for non-cash items, of $13.5 million and net changes of $6.4 million in non-brokerage working capital items, partially offset by an increase in net brokerage assets of $4.6 million.
Investing activities used cash of $13.5 million, $27.7 million and $3.1 million during the years ended December 31, 2010, 2009 and 2008, respectively. The decrease in net cash used of $14.3 million during the year ended December 31, 2010 was primarily due to increases in proceeds from maturities of available-for-sale marketable securities of $31.4 million, partially offset by increases of $9.9 million in capital expenditures and $7.2 million in purchases of available-for-sale marketable securities. The increase in net cash used of $24.6 million during the year ended December 31, 2009 was primarily due to $27.0 million in purchases of available-for-sale marketable securities and increases of $1.5 million in capital expenditures, partially offset by increases in proceeds from maturities of available-for-sale marketable securities of $3.9 million. The increases in capital expenditures are primarily related to purchases of computer hardware to support the growth of our data server farms and computer software to support our growing infrastructure.
Financing activities used cash of $12.1 million, $13.2 million and $13.5 million during the years ended December 31, 2010, 2009 and 2008, respectively. The primary use of cash for financing activities was $13.0 million, $14.9 million, and $15.0 million for the repurchase and retirement of company shares during the years ended December 31, 2010, 2009 and 2008, respectively. Proceeds from the issuance of common stock related to the exercise of stock options from our incentive stock plan, and purchases under our employee stock purchase plan, provided cash of $525,000, $1.5 million and $1.2 million during 2010, 2009 and 2008, respectively. Excess tax benefits from stock-based compensation provided cash of $353,000, $209,000, and $273,000 during the years ended December 31, 2010, 2009 and 2008, respectively.
Our net capital, deposit and general brokerage cash requirements will likely increase as we seek to grow our new TradeStation Prime Services division and as we become a forex dealer that brokers as principal (as opposed to an introducing broker of forex accounts).
Off-Balance Sheet Arrangements
In the ordinary course of business, there are various contingencies which are not reflected in the consolidated financial statements. In addition to the operating leases and purchase commitments discussed above, these include customer activities involving the execution, settlement and financing or provision of leverage for various customer securities, futures, and off-exchange foreign currency (“forex”) transactions. These activities may expose the company to off-balance sheet credit risk in the event the customers are unable to fulfill their contractual obligations.
54
Table of Contents
Index to Financial Statements
Nearly all TradeStation Securities equities customer accounts are margin accounts and all futures and forex accounts use leverage. In margin transactions, TradeStation Securities may be obligated for credit extended to its customers by it or its clearing agents that are collateralized by cash and securities in the customers’ accounts. In connection with securities activities, TradeStation Securities also executes customer transactions involving the sale of securities not yet purchased (short sales), all of which are transacted on a margin basis subject to federal, self-regulatory organization and individual exchange regulations and TradeStation Securities’ and its clearing agents’ internal policies. New short sales rules have been imposed by regulatory authorities and more may be imposed in the near future. Additionally, TradeStation Securities may be obligated for credit extended to its customers by its clearing agents for futures and forex transactions that are collateralized by cash (and futures or forex positions, as the case may be) in the customers’ accounts. In all cases, such transactions may expose TradeStation Securities to significant off-balance sheet credit risk in the event customer collateral is not sufficient to fully cover losses that customers may incur. In the event customers fail to satisfy their obligations, TradeStation Securities may be required to purchase or sell financial instruments at prevailing market prices to fulfill the customers’ obligations. When TradeStation Forex begins operations as a Retail Foreign Exchange Dealer, TradeStation Forex will also have direct responsibility to ensure full compliance with respect to applicable laws and regulations relating to forex leverage (under TradeStation Securities’ contractual relationship with Gain Capital, Gain Capital currently bears this responsibility).
TradeStation Securities seeks to manage the risks associated with its customers’ activities by requiring customers to maintain collateral in their margin and leveraged accounts in compliance with various regulatory requirements, internal requirements, and the requirements of clearing agents. TradeStation Securities and its clearing agents monitor required margin and leverage levels on an intra-day basis and, pursuant to such guidelines, require the customers to timely deposit additional collateral or to reduce positions when necessary. When TradeStation Forex begins operations as a Retail Foreign Exchange Dealer, TradeStation Forex will be solely responsible for monitoring required leverage levels for all forex business.
TradeStation Securities provides guarantees to its clearing organizations and exchanges under their standard membership agreements, which require members to guarantee the performance of other members. Under the agreements, if another member becomes unable to satisfy its obligations to the clearing organization or exchanges, other members would be required to meet shortfalls. TradeStation Securities’ liability under these arrangements is not quantifiable. However, management believes that the possibility of the company being required to make payments under these arrangements is remote, although less remote than it was prior to the recent global economic crisis. No liability has been recorded for these potential events.
Recently Issued Accounting Standards
In January 2010, the FASB issued ASU No. 2010-06, Improving Disclosures about Fair Value Measurements (ASU 2010-06). ASU 2010-06 amends the Fair Value Measurements and Disclosures Topic of the FASB Accounting Standards Codification to require additional disclosures regarding fair value measurements. The amended guidance requires entities to disclose additional information regarding assets and liabilities that are transferred between levels of the fair value hierarchy. Entities are also required to disclose information in the Level 3 Rollforward about purchases, sales, issuances
55
Table of Contents
Index to Financial Statements
and settlements on a gross basis. In addition to these new disclosure requirements, ASU 2010-06 clarifies existing guidance pertaining to the level of disaggregation at which fair value disclosures should be made and the requirements to disclose information about the valuation techniques and inputs used in estimating Level 2 and Level 3 fair value measurements. The guidance in ASU 2010-06 is effective for interim and annual reporting periods beginning after December 15, 2009, except for the requirement to separately disclose purchases, sales, issuances and settlements in the Level 3 Rollforward, which becomes effective for fiscal years (and for interim periods within those fiscal years) beginning after December 15, 2010. Our adoption of ASU 2010-06, effective January 1, 2010, did not have a material impact on our consolidated financial position, results of operations or cash flows during the year ended December 31, 2010. We do not expect the deferred portion of the adoption of ASU 2010-06 to have a material impact on our consolidated financial statements.
| ITEM 7A. | QUANTITATIVE AND QUALITATIVE DISCLOSURES ABOUT MARKET RISK |
Market risk generally represents the risk of loss that may result from the potential change in the value of a financial instrument as a result of fluctuations in interest rates or market prices. We have established policies, procedures and internal processes governing our management of market risks in the normal course of our business operations. We do not engage in proprietary trading and do not hold any market risk sensitive instruments for trading purposes.
TradeStation Securities seeks to manage the risks associated with its customers’ activities by requiring them to maintain margin and leverage collateral levels and reduce concentrated positions in compliance with regulatory and internal guidelines. TradeStation Securities and its clearing agents monitor required margin and leverage levels on an intra-day basis and, pursuant to such guidelines, require customers to deposit additional collateral, or to reduce positions, when necessary.
As a self-clearing broker-dealer, TradeStation Securities holds interest-earning assets, mainly customer funds required to be segregated in compliance with federal regulations. These funds totaled $1.28 billion at December 31, 2010. Interest-earning assets are financed primarily by short-term liabilities, which totaled $1.38 billion at December 31, 2010, in the form of customer cash balances. In addition to earning interest on the customer funds segregated in compliance with federal regulations, TradeStation Securities earns a net interest spread on the difference between amounts earned on customer margin loans and amounts paid on customer cash balances (we are currently not paying any interest to customers on their cash balances). TradeStation Securities also earns interest from interest revenue-sharing arrangements with its clearing agents. Changes in interest rates also affect the interest earned on our cash and cash equivalents, marketable securities and security deposits. As of December 31, 2010: our cash and cash equivalents consisted primarily of U.S. Treasury Investments; our marketable securities consisted primarily of U.S. Treasury Investments and federal tax-exempt variable rate demand note securities that are secured by a letter of credit from Bank of America (which can be tendered for sale upon notice of no longer than seven days); and our security deposits consisted primarily of U.S. Treasury Bills and cash deposits. Most of our cash and investments segregated in compliance with federal regulations are invested in U.S. Treasury Bills and Treasury Notes of various maturities.
We estimate, based on the size and nature of our customer assets as of December 31, 2010 (and assuming for these purposes that the size and nature of those assets do not change), that each basis point increase or decrease in the U.S. Treasury Investment yield, based on current maturities, results in an annual impact of approximately $41,000 to our net income.
56
Table of Contents
Index to Financial Statements
Equity price risk results from exposures to changes in prices and volatilities of individual equities. As of December 31, 2010, we held 80,000 shares in CBOE Holdings, Inc. (CBOE) which had an aggregate market value of $1.8 million. Our shares in CBOE are subject to a lock-up restriction that prohibited the sale of 50% of the shares until December 2010 and the remaining 50% until June 2011. Fluctuations in the price of CBOE stock may affect our results of operations as unrealized gains or losses (or as realized gains or losses if the shares are sold). We do not consider the shares we own in CBOE to be held for trading and, unless we accept the tender offer, we will consider selling them after the restrictions lapse.
TradeStation Securities seeks to manage risks associated with its securities borrowing activities by requiring credit approvals for counterparties, by monitoring the collateral values for securities borrowed on a daily basis and by obtaining additional collateral as needed. See Note 16 of Notes to Consolidated Financial Statements – COMMITMENTS AND CONTINGENCIES – General Contingencies and Guarantees.
Our revenues and financial instruments are denominated primarily in U.S. dollars, and we do not invest in derivative financial instruments.
| ITEM 8. | FINANCIAL STATEMENTS AND SUPPLEMENTARY DATA |
The Consolidated Financial Statements and notes thereto and the reports of the independent registered public accounting firm set forth on pages F-1 through F-38 are filed as part of this report and incorporated herein by reference.
| ITEM 9. | CHANGES IN AND DISAGREEMENTS WITH ACCOUNTANTS ON ACCOUNTING AND FINANCIAL DISCLOSURE |
Not applicable.
| ITEM 9A. | CONTROLS AND PROCEDURES |
As of the end of the period covered by this report, an evaluation of the effectiveness of the design and operation of the company’s disclosure controls and procedures was made under the supervision and with the participation of the company’s management, including the Chief Executive Officer and the Chief Financial Officer. Based on that evaluation, the company’s management, including the Chief Executive Officer and the Chief Financial Officer, concluded that the company’s disclosure controls and procedures were effective at the reasonable assurance level as of the end of the period covered by this report. A system of controls, no matter how well designed and operated, cannot provide absolute assurance that the objectives of the system of controls are met, and no evaluation of controls can provide absolute assurance that all control issues and instances of fraud, if any, within a company have been detected.
See pages F-2 through F-3 of the Consolidated Financial Statements for Management’s Report on Internal Control Over Financial Reporting and the related Report of Independent Registered Public Accounting Firm, each of which is filed as part of this report and incorporated herein by reference.
There have been no changes in the company’s internal control over financial reporting that occurred during the fourth quarter of 2010 that have materially affected, or are reasonably likely to materially affect, the company’s internal control over financial reporting.
57
Table of Contents
Index to Financial Statements
| ITEM 9B. | OTHER INFORMATION |
Not applicable.
58
Table of Contents
Index to Financial Statements
| ITEM 10. | DIRECTORS, EXECUTIVE OFFICERS AND CORPORATE GOVERNANCE |
The information about Directors and Executive Officers, Section 16(a) beneficial ownership reporting compliance, and corporate governance required to be furnished pursuant to this item is incorporated by reference from our definitive proxy statement for our 2011 annual meeting of shareholders to be filed with the SEC pursuant to Regulation 14A within 120 days after December 31, 2010 (“2011 Proxy Statement”).
We have a Code of Ethics and Business Conduct that applies to all directors, officers and employees, including our principal executive officer, our principal financial officer, and our principal accounting officer and corporate controller. You can find our Code of Ethics and Business Conduct in the “Investor Relations” section of www.tradestation.com. We will post any amendments to the Code of Ethics and Business Conduct, and any waivers that are required to be disclosed by the rules of the SEC or any other regulatory agency, on that Web site.
| ITEM 11. | EXECUTIVE COMPENSATION |
The information required to be furnished pursuant to this item is incorporated by reference from our 2011 Proxy Statement.
| ITEM 12. | SECURITY OWNERSHIP OF CERTAIN BENEFICIAL OWNERS AND MANAGEMENT AND RELATED STOCKHOLDER MATTERS |
The information required to be furnished pursuant to this item, with the exception of the equity compensation plan information presented below, is incorporated by reference from our 2011 Proxy Statement.
59
Table of Contents
Index to Financial Statements
Equity Compensation Plan Information
The following sets forth information as of December 31, 2010 with respect to compensation plans under which the Company’s Common Stock is authorized for issuance:
| Plan category |
Number of securities to be issued upon exercise of outstanding options, warrants and rights (a) |
Weighted-average exercise price of outstanding options, warrants and rights (b) |
Number of securities remaining available for future issuance under equity compensation plans (excluding securities reflected in column (a)) (c) |
|||||||||
| Equity compensation plans approved by security holders |
2,773,669 | $ | 8.17 |
|
(1) 3,282,718 |
| ||||||
| Equity compensation plans not approved by security holders |
— | — | — | |||||||||
| Total (1) |
2,773,669 | $ | 8.17 | 3,282,718 | ||||||||
| (1) | Includes 2,650,885, 474,560, and 157,273 shares of common stock available for issuance under the Incentive Stock Plan, 2010 Nonemployee Director Stock Plan and Employee Stock Purchase Plan, respectively. |
| ITEM 13. | CERTAIN RELATIONSHIPS AND RELATED TRANSACTIONS, AND DIRECTOR INDEPENDENCE |
The information required to be furnished pursuant to this item is incorporated by reference from our 2011 Proxy Statement.
| ITEM 14. | PRINCIPAL ACCOUNTANT FEES AND SERVICES |
The information required to be furnished pursuant to this item is incorporated by reference from our 2011 Proxy Statement.
60
Table of Contents
Index to Financial Statements
| ITEM 15. | EXHIBITS AND FINANCIAL STATEMENT SCHEDULES |
| (a) | Documents filed as part of this report. |
| 1. | Financial Statements. The Financial Statements and notes thereto and the reports of the independent registered public accounting firm thereon set forth on pages F-1 through F-38 herein are filed as part of this report and incorporated herein by reference. |
| 2. | Exhibits. |
| Exhibit |
Description | |
| 3.1 | TradeStation Group’s Articles of Incorporation, as amended * | |
| 3.2 | TradeStation Group’s Bylaws * | |
| 4.1 | Form of Specimen Certificate for TradeStation Group’s Common Stock (incorporated by reference to Exhibit 4.1 to OnlineTrading.com Group, Inc.’s Amendment No. 3 to Registration Statement No. 333-34922 on Form S-4 filed with the Commission on November 21, 2000) | |
| 10.1 | onlinetradinginc.com corp. 1999 Stock Option Plan**# | |
| 10.2 | Window On WallStreet Inc. 1997 Long Term Incentive Plan**# | |
| 10.3 | TradeStation Group, Inc. Employee Stock Purchase Plan**# | |
| 10.4 | Amendment to TradeStation Group, Inc. Employee Stock Purchase Plan (incorporated by reference to Exhibit 10.4 to TradeStation Group’s Annual Report on Form 10-K for the fiscal year ended December 31, 2005) # | |
| 10.5 | TradeStation Group, Inc. Amended and Restated Incentive Stock Plan (incorporated by reference to Exhibit “B” to TradeStation Group’s Annual Proxy Statement dated April 28, 2006) # | |
| 10.6 | First Amendment to TradeStation Group, Inc. Amended and Restated Incentive Stock Plan ***# | |
| 10.7 | TradeStation Group, Inc. Amended and Restated Nonemployee Director Stock Option Plan (incorporated by reference to Exhibit 10.5 to TradeStation Group’s Annual Report on Form 10-K for the fiscal year ended December 31, 2001) # | |
| 10.8 | TradeStation Group, Inc. Amended and Restated Nonemployee Director Stock Option Plan effective as of March 8, 2007 ***# | |
| 10.9 | TradeStation Group, Inc. Amended and Restated Nonemployee Director Stock Option Plan effective as of June 2, 2009 (incorporated by reference to Exhibit 10.1 to TradeStation Group’s Quarterly Report on Form 10-Q for the quarter ended June 30, 2009)# | |
61
Table of Contents
Index to Financial Statements
| 10.10 | TradeStation Group, Inc. Nonemployee Director Incentive Stock Plan effective as of June 1, 2010 (incorporated by reference to Exhibit “B” to TradeStation Group’s Annual Proxy Statement dated April 27, 2010) # | |
| 10.11 | First Amendment to TradeStation Group, Inc. Nonemployee Director Incentive Stock Plan (incorporated by reference to Exhibit 10.1 to TradeStation Group’s Quarterly Report on Form 10-Q for the quarter ended September 30, 2010) # | |
| 10.12 | Form of Nonemployee Director Restricted Stock Agreement (incorporated by reference to Exhibit 10.2 to TradeStation Group’s Quarterly Report on Form 10-Q for the quarter ended June 30, 2010) # | |
| 10.13 | Form of Executive Stock Option Agreement (utilized prior to February 2007) (incorporated by reference to Exhibit 10.1 to TradeStation Group’s Current Report on Form 8-K filed with the Commission on January 7, 2009)# | |
| 10.14 | Form of Executive Officer Stock Option Agreement (utilized since February 2007) ***# | |
| 10.15 | Restricted Stock Agreement, dated as of February 20, 2007, between TradeStation Group, Inc. and Salomon Sredni ***# | |
| 10.16 | Form of management continuity agreement, dated December 9, 2005, between TradeStation Group and each of the following executive officers: David H. Fleischman and Marc J. Stone (incorporated by reference to Exhibit 1 to TradeStation Group’s Current Report on Form 8-K filed with the Commission on December 12, 2005) # | |
| 10.17 | Restricted Stock Agreement, dated as of July 24, 2007, between TradeStation Group, Inc. and John Roberts (incorporated by reference to Exhibit 10.1 to TradeStation Group’s Quarterly Report on Form 10-Q for the quarter ended September 30, 2007)# | |
| 10.18 | Form of Restricted Stock Agreement, dated as of July 27, 2007, between TradeStation Group, Inc. and an executive officer (each of Marc J. Stone, David H. Fleischman and T. Keith Black) (incorporated by reference to Exhibit 10.2 to TradeStation Group’s Quarterly Report on Form 10-Q for the quarter ended September 30, 2007)# | |
| 10.19 | Form of Executive Restricted Stock Agreement (incorporated by reference to Exhibit 10.1 to TradeStation Group’s Quarterly Report on Form 10-Q for the quarter ended March 31, 2008)# | |
| 10.20 | Lease Agreement, dated November 13, 2001, between Crossroads Business Park Associates LLP and TradeStation Group, Inc. (without exhibits and schedules) (incorporated by reference to Exhibit 10.27 to TradeStation Group’s Annual Report on Form 10-K for the fiscal year ended December 31, 2001) | |
62
Table of Contents
Index to Financial Statements
| 10.21 | Lease Agreement, dated as of November 22, 2010, between 233 S. Wacker LLC, Landlord, and TradeStation Securities, Inc., Tenant (filed herewith) | |
| 10.22 | Office/Showroom/Warehouse Lease Agreement dated June 12, 1996 between Springcreek Place Ltd. and Window On WallStreet Inc. (then named MarketArts, Inc.), as amended by Addendum to Lease dated October 12, 1998, and as further amended by Addendum to Lease dated May 28, 1999 (incorporated by reference to Exhibit 10.13 to Omega Research, Inc.’s Annual Report on Form 10-K for the fiscal year ended December 31, 1999) | |
| 10.23 | Modification and Ratification of Lease Agreement, dated July 25, 2002, between Springcreek Place Ltd. and TradeStation Technologies, Inc. (incorporated by reference to Exhibit 10.14 to TradeStation Group’s Annual Report on Form 10-K for the fiscal year ended December 31, 2002) | |
| 10.24 | Addendum, dated July 31, 2007, to Lease Agreement between TradeStation Technologies, Inc. (Tenant) and Springcreek Place, Ltd. (Landlord) dated June 12, 1996 and Amended on 10-12-98, 5-28-99 and 7-25-02 (incorporated by reference to Exhibit 10.18 to TradeStation Group’s Annual Report on Form 10-K for the fiscal year ended December 31, 2007) | |
| 10.25 | Agreement of Lease, dated December 14, 2009, between 400 Madison Avenue Owner, LLC (Landlord) and TradeStation Securities, Inc. (Tenant) (incorporated by reference to Exhibit 10.23 to TradeStation Group’s Annual Report on Form 10-K for the fiscal year ended December 31, 2009) | |
| 10.26 | Rule 10b5-1 agreement, dated November 9, 2006, between TradeStation Group, Inc. and Sandler O’Neil & Partners L.P. (incorporated by reference to Exhibit 10.1 to TradeStation Group’s Current Report on Form 8-K filed with the Commission on November 9, 2006) | |
| 10.27 | Asset Purchase Agreement, dated as of August 23, 2010, between TradeStation Technologies, Inc. and RINA Technologies, LLC (incorporated by reference to Exhibit 10.1 to TradeStation Group’s Current Report on Form 8-K filed with the Commission on August 23, 2010) | |
| 10.28 | Form of Non-Competition Agreement + | |
| 10.29 | Form of Indemnification Agreement + | |
| 21.1 | List of Subsidiaries (filed herewith) | |
| 23.1 | Consent of Ernst & Young LLP, Independent Registered Public Accounting Firm (filed herewith) | |
| 31.1 | Certification of Chief Executive Officer Pursuant to Rule 13a-14(a) or Rule 15d-14(a) of the Securities Exchange Act of 1934 (filed herewith) | |
| 31.2 | Certification of Chief Financial Officer Pursuant to Rule 13a-14(a) or Rule 15d-14(a) of the Securities Exchange Act of 1934 (filed herewith) | |
63
Table of Contents
Index to Financial Statements
| 32.1 | Certification of Chief Executive Officer under 18 U.S.C. §1350 (filed herewith) | |
| 32.2 | Certification of Chief Financial Officer under 18 U.S.C. §1350 (filed herewith) | |
| * | Previously filed as part of Registration Statement No. 333-34922 on Form S-4 of OnlineTrading.com Group, Inc. filed with the Commission on April 17, 2000. |
| ** | Previously filed as part of Registration Statement No. 333-53222 on Form S-8 of TradeStation Group, Inc. filed with the Commission on January 5, 2001. |
| *** | Previously filed as part of Form 10-K of TradeStation Group, Inc. for the fiscal period ended December 31, 2006 filed with the Commission on March 9, 2007. |
| + | Previously filed as part of Registration Statement No. 333-32077 on Form S-1 of Omega Research, Inc. filed with the Commission on July 25, 1997. |
| # | Indicates a management contract or compensatory plan or arrangement. |
64
Table of Contents
Index to Financial Statements
Pursuant to the requirements of Section 13 or 15(d) of the Securities Exchange Act of 1934, the registrant has duly caused this report to be signed on its behalf by the undersigned, thereunto duly authorized.
| Dated: March 11, 2011 | TradeStation Group, Inc. | |||||
| By: | /s/ Salomon Sredni | |||||
| Salomon Sredni | ||||||
| Chief Executive Officer | ||||||
Pursuant to the requirements of the Securities Exchange Act of 1934, this report has been signed below by the following persons on behalf of the registrant and in the capacities and on the dates indicated:
| /s/ Salomon Sredni |
Chief Executive Officer, President and Director (Principal Executive Officer) |
March 11, 2011 | ||
| Salomon Sredni | ||||
| /s/ David H. Fleischman |
Chief Financial Officer, Vice President of Finance and Treasurer (Principal Financial Officer) |
March 11, 2011 | ||
| David H. Fleischman | ||||
| /s/ Edward H. Codispoti |
Chief Accounting Officer, Vice President of Accounting and Corporate Controller (Principal Accounting Officer) |
March 11, 2011 | ||
| Edward H. Codispoti | ||||
| /s/ Denise E. Dickins |
Director | March 11, 2011 | ||
| Denise E. Dickins | ||||
| /s/ Michael W. Fipps |
Director | March 11, 2011 | ||
| Michael W. Fipps | ||||
| /s/ Nathan D. Leight |
Director | March 11, 2011 | ||
| Nathan D. Leight | ||||
| /s/ Charles F. Wright |
Director | March 11, 2011 | ||
| Charles F. Wright | ||||
65
Table of Contents
Index to Financial Statements
TRADESTATION GROUP, INC. AND SUBSIDIARIES
INDEX TO CONSOLIDATED FINANCIAL STATEMENTS
F-1
Table of Contents
Index to Financial Statements
MANAGEMENT’S REPORT ON INTERNAL CONTROL OVER FINANCIAL REPORTING
The management of TradeStation Group, Inc. and its subsidiaries (collectively, the “Company”) is responsible for establishing and maintaining adequate internal control over financial reporting, and for performing an assessment, at the reasonable assurance level, of the effectiveness of internal control over financial reporting as of December 31, 2010. Internal control over financial reporting is a process designed to provide reasonable assurance regarding the reliability of financial reporting and the preparation of financial statements for external purposes in accordance with generally accepted accounting principles. The Company’s system of internal control over financial reporting includes those policies and procedures that: (i) pertain to the maintenance of records that, in reasonable detail, accurately and fairly reflect the transactions and dispositions of the assets of the Company; (ii) provide reasonable assurance that transactions are recorded as necessary to permit preparation of financial statements in accordance with generally accepted accounting principles, and that receipts and expenditures of the Company are being made only in accordance with authorizations of management and directors of the Company; and (iii) provide reasonable assurance regarding prevention or timely detection of unauthorized acquisition, use, or disposition of the Company’s assets that could have a material effect on the financial statements.
Our management performed an assessment of the effectiveness of the Company’s internal control over financial reporting as of December 31, 2010, based upon the criteria in Internal Control - Integrated Framework issued by the Committee of Sponsoring Organizations of the Treadway Commission (“COSO”). Based on our assessment in accordance with the criteria in Internal Control-Integrated Framework issued by COSO, our management has concluded that the Company’s internal control over financial reporting was effective at the reasonable assurance level as of December 31, 2010.
All internal control systems, no matter how well designed and tested, have inherent limitations, including, among other things, the possibility of human error, circumvention or disregard. Therefore, even those systems of internal control that have been determined to be effective can provide only reasonable assurance that the objectives of the control system are met and may not prevent or detect misstatements. Also, projections of any evaluation of effectiveness to future periods are subject to the risk that controls may become inadequate because of changes in conditions, or that the degree of compliance with the policies or procedures may deteriorate.
An assessment of the effectiveness of our internal control over financial reporting as of December 31, 2010 has been performed by Ernst & Young LLP, an independent registered public accounting firm, as stated in its report which is included in these consolidated financial statements.
March 11, 2011
/s/ Salomon Sredni
Salomon Sredni
Chief Executive Officer
/s/ David H. Fleischman
David H. Fleischman
Chief Financial Officer
Vice President of Finance and Treasurer
F-2
Table of Contents
Index to Financial Statements
REPORT OF INDEPENDENT REGISTERED PUBLIC ACCOUNTING FIRM
The Board of Directors and Shareholders of TradeStation Group, Inc.
We have audited TradeStation Group, Inc. and subsidiaries’ internal control over financial reporting as of December 31, 2010, based on criteria established in Internal Control - Integrated Framework issued by the Committee of Sponsoring Organizations of the Treadway Commission (the COSO criteria). TradeStation Group, Inc. and subsidiaries’ management is responsible for maintaining effective internal control over financial reporting, and for its assessment of the effectiveness of internal control over financial reporting included in the accompanying Management’s Report on Internal Control Over Financial Reporting. Our responsibility is to express an opinion on the company’s internal control over financial reporting based on our audit.
We conducted our audit in accordance with the standards of the Public Company Accounting Oversight Board (United States). Those standards require that we plan and perform the audit to obtain reasonable assurance about whether effective internal control over financial reporting was maintained in all material respects. Our audit included obtaining an understanding of internal control over financial reporting, assessing the risk that a material weakness exists, testing and evaluating the design and operating effectiveness of internal control based on the assessed risk, and performing such other procedures as we considered necessary in the circumstances. We believe that our audit provides a reasonable basis for our opinion.
A company’s internal control over financial reporting is a process designed to provide reasonable assurance regarding the reliability of financial reporting and the preparation of financial statements for external purposes in accordance with generally accepted accounting principles. A company’s internal control over financial reporting includes those policies and procedures that (1) pertain to the maintenance of records that, in reasonable detail, accurately and fairly reflect the transactions and dispositions of the assets of the company; (2) provide reasonable assurance that transactions are recorded as necessary to permit preparation of financial statements in accordance with generally accepted accounting principles, and that receipts and expenditures of the company are being made only in accordance with authorizations of management and directors of the company; and (3) provide reasonable assurance regarding prevention or timely detection of unauthorized acquisition, use, or disposition of the company’s assets that could have a material effect on the financial statements.
Because of its inherent limitations, internal control over financial reporting may not prevent or detect misstatements. Also, projections of any evaluation of effectiveness to future periods are subject to the risk that controls may become inadequate because of changes in conditions, or that the degree of compliance with the policies or procedures may deteriorate.
In our opinion, TradeStation Group, Inc. and subsidiaries maintained, in all material respects, effective internal control over financial reporting as of December 31, 2010, based on the COSO criteria.
We also have audited, in accordance with the standards of the Public Company Accounting Oversight Board (United States), the consolidated balance sheets of TradeStation Group, Inc. and subsidiaries as of December 31, 2010 and 2009, and the related consolidated statements of income, shareholders’ equity, and cash flows for each of the three years in the period ended December 31, 2010 of TradeStation Group, Inc. and subsidiaries and our report dated March 11, 2011 expressed an unqualified opinion thereon.
| /s/ Ernst & Young LLP |
| Certified Public Accountants |
| Boca Raton, Florida |
| March 11, 2011 |
F-3
Table of Contents
Index to Financial Statements
REPORT OF INDEPENDENT REGISTERED PUBLIC ACCOUNTING FIRM
The Board of Directors and Shareholders of TradeStation Group, Inc.
We have audited the accompanying consolidated balance sheets of TradeStation Group, Inc. and subsidiaries as of December 31, 2010 and 2009, and the related consolidated statements of income, shareholders’ equity, and cash flows for each of the three years in the period ended December 31, 2010. These financial statements are the responsibility of the Company’s management. Our responsibility is to express an opinion on these financial statements based on our audits.
We conducted our audits in accordance with the standards of the Public Company Accounting Oversight Board (United States). Those standards require that we plan and perform the audit to obtain reasonable assurance about whether the financial statements are free of material misstatement. An audit includes examining, on a test basis, evidence supporting the amounts and disclosures in the financial statements. An audit also includes assessing the accounting principles used and significant estimates made by management, as well as evaluating the overall financial statement presentation. We believe that our audits provide a reasonable basis for our opinion.
In our opinion, the financial statements referred to above present fairly, in all material respects, the consolidated financial position of TradeStation Group, Inc. and subsidiaries at December 31, 2010 and 2009, and the consolidated results of their operations and their cash flows for each of the three years in the period ended December 31, 2010, in conformity with U.S. generally accepted accounting principles.
We also have audited, in accordance with the standards of the Public Company Accounting Oversight Board (United States), TradeStation Group, Inc. and subsidiaries’ internal control over financial reporting as of December 31, 2010, based on criteria established in Internal Control - Integrated Framework issued by the Committee of Sponsoring Organizations of the Treadway Commission and our report dated March 11, 2011 expressed an unqualified opinion thereon.
| /s/ Ernst & Young LLP |
| Certified Public Accountants |
| Boca Raton, Florida |
| March 11, 2011 |
F-4
Table of Contents
Index to Financial Statements
TRADESTATION GROUP, INC. AND SUBSIDIARIES
CONSOLIDATED BALANCE SHEETS
(In thousands, except share data)
| December 31, | ||||||||
| 2010 | 2009 | |||||||
| ASSETS: |
||||||||
| Cash and cash equivalents, including restricted cash of $478 at December 31, 2010 and $717 at December 31, 2009 |
$ | 41,888 | $ | 57,405 | ||||
| Cash and investments segregated in compliance with federal regulations |
1,279,734 | 785,208 | ||||||
| Marketable securities |
63,255 | 76,342 | ||||||
| Receivables from brokers, dealers, clearing organizations and clearing agents |
80,827 | 32,226 | ||||||
| Receivables from brokerage customers |
68,268 | 45,034 | ||||||
| Property and equipment, net |
17,974 | 7,578 | ||||||
| Deferred income taxes, net |
— | 1,276 | ||||||
| Deposits with clearing organizations |
35,504 | 38,521 | ||||||
| Other assets |
5,716 | 5,606 | ||||||
| Total assets |
$ | 1,593,166 | $ | 1,049,196 | ||||
| LIABILITIES AND SHAREHOLDERS’ EQUITY: |
||||||||
| LIABILITIES: |
||||||||
| Payables to brokers, dealers and clearing organizations |
$ | 27,770 | $ | 114 | ||||
| Payables to brokerage customers |
1,381,105 | 868,741 | ||||||
| Accounts payable |
3,767 | 2,627 | ||||||
| Accrued expenses |
6,967 | 7,206 | ||||||
| Deferred income taxes, net |
120 | — | ||||||
| Total liabilities |
1,419,729 | 878,688 | ||||||
| COMMITMENTS AND CONTINGENCIES |
||||||||
| SHAREHOLDERS’ EQUITY: |
||||||||
| Preferred stock, $.01 par value; 25,000,000 shares authorized, none issued and outstanding |
— | — | ||||||
| Common stock, $.01 par value; 200,000,000 shares authorized, 39,055,900 and 40,692,328 shares issued and outstanding at December 31, 2010 and December 31, 2009, respectively |
391 | 407 | ||||||
| Additional paid-in capital |
34,237 | 42,728 | ||||||
| Accumulated other comprehensive income |
1 | 5 | ||||||
| Retained earnings |
138,808 | 127,368 | ||||||
| Total shareholders’ equity |
173,437 | 170,508 | ||||||
| Total liabilities and shareholders’ equity |
$ | 1,593,166 | $ | 1,049,196 | ||||
See accompanying notes.
F-5
Table of Contents
Index to Financial Statements
TRADESTATION GROUP, INC. AND SUBSIDIARIES
CONSOLIDATED STATEMENTS OF INCOME
(In thousands, except per share data)
| For the Years
Ended December 31, |
||||||||||||
| 2010 | 2009 | 2008 | ||||||||||
| REVENUES: |
||||||||||||
| Brokerage commissions and fees |
$ | 108,318 | $ | 121,258 | $ | 129,304 | ||||||
| Interest income |
10,429 | 5,957 | 25,937 | |||||||||
| Brokerage interest expense |
— | — | 3,166 | |||||||||
| Net interest income |
10,429 | 5,957 | 22,771 | |||||||||
| Subscription fees and other |
6,376 | 7,638 | 8,357 | |||||||||
| Gains (losses) on marketable securities, net |
3,849 | (142 | ) | — | ||||||||
| Net revenues |
128,972 | 134,711 | 160,432 | |||||||||
| EXPENSES: |
||||||||||||
| Employee compensation and benefits |
44,583 | 41,715 | 40,166 | |||||||||
| Clearing and execution |
28,716 | 31,182 | 38,914 | |||||||||
| Data centers and communications |
14,211 | 11,480 | 9,216 | |||||||||
| Marketing |
6,838 | 6,610 | 5,805 | |||||||||
| Professional services |
3,640 | 3,372 | 3,453 | |||||||||
| Occupancy and equipment |
3,188 | 3,072 | 2,989 | |||||||||
| Depreciation and amortization |
5,311 | 4,362 | 4,218 | |||||||||
| Other |
8,692 | 6,849 | 5,632 | |||||||||
| Total expenses |
115,179 | 108,642 | 110,393 | |||||||||
| Income before income taxes |
13,793 | 26,069 | 50,039 | |||||||||
| INCOME TAX PROVISION |
2,353 | 10,279 | 19,402 | |||||||||
| Net income |
$ | 11,440 | $ | 15,790 | $ | 30,637 | ||||||
| EARNINGS PER SHARE: |
||||||||||||
| Basic |
$ | 0.29 | $ | 0.38 | $ | 0.71 | ||||||
| Diluted |
$ | 0.28 | $ | 0.38 | $ | 0.70 | ||||||
| WEIGHTED AVERAGES SHARES OUTSTANDING: |
||||||||||||
| Basic |
39,815 | 41,507 | 43,235 | |||||||||
| Diluted |
40,237 | 41,981 | 43,912 | |||||||||
See accompanying notes.
F-6
Table of Contents
Index to Financial Statements
TRADESTATION GROUP, INC. AND SUBSIDIARIES
CONSOLIDATED STATEMENTS OF SHAREHOLDERS’ EQUITY
(In thousands)
| Preferred Stock |
Common Stock |
Additional Paid-In Capital |
Retained Earnings |
Accumulated Other Com- prehensive Income |
Total | |||||||||||||||||||||||
| Shares | Amount | |||||||||||||||||||||||||||
| BALANCE, January 1, 2008 |
— | 43,839 | $ | 438 | $ | 62,579 | $ | 80,941 | $ | — | $ | 143,958 | ||||||||||||||||
| Issuance of common stock from exercise of stock options and purchase plan |
— | 233 | 2 | 1,211 | — | — | 1,213 | |||||||||||||||||||||
| Stock-based compensation |
— | — | — | 3,951 | — | — | 3,951 | |||||||||||||||||||||
| Excess tax benefit from stock option exercises |
— | — | — | 240 | — | — | 240 | |||||||||||||||||||||
| Repurchase and retirement of common stock |
— | (1,683 | ) | (16 | ) | (14,982 | ) | — | — | (14,998 | ) | |||||||||||||||||
| Vesting of restricted stock |
— | 32 | — | — | — | — | — | |||||||||||||||||||||
| Net income |
— | — | — | — | 30,637 | — | 30,637 | |||||||||||||||||||||
| BALANCE, December 31, 2008 |
— | 42,421 | 424 | 52,999 | 111,578 | — | 165,001 | |||||||||||||||||||||
| Issuance of common stock from exercise of stock options and purchase plan |
— | 329 | 3 | 1,459 | — | — | 1,462 | |||||||||||||||||||||
| Stock-based compensation |
— | — | — | 2,729 | — | — | 2,729 | |||||||||||||||||||||
| Excess tax benefit from stock option exercises |
— | — | — | 381 | — | — | 381 | |||||||||||||||||||||
| Repurchase and retirement of common stock |
— | (2,090 | ) | (21 | ) | (14,839 | ) | — | — | (14,860 | ) | |||||||||||||||||
| Vesting of restricted stock |
— | 32 | 1 | (1 | ) | — | — | — | ||||||||||||||||||||
| Unrealized gain on available for sale securities, net of taxes |
— | — | — | — | — | 5 | 5 | |||||||||||||||||||||
| Net income |
— | — | — | — | 15,790 | — | 15,790 | |||||||||||||||||||||
| BALANCE, December 31, 2009 |
— | 40,692 | 407 | 42,728 | 127,368 | 5 | 170,508 | |||||||||||||||||||||
| Issuance of common stock from exercise of stock options and purchase plan |
— | 175 | 2 | 523 | — | — | 525 | |||||||||||||||||||||
| Stock-based compensation |
— | — | — | 3,140 | — | — | 3,140 | |||||||||||||||||||||
| Excess tax benefit from stock option exercises |
— | — | — | 353 | — | — | 353 | |||||||||||||||||||||
| Repurchase and retirement of common stock |
— | (1,886 | ) | (19 | ) | (12,956 | ) | — | — | (12,975 | ) | |||||||||||||||||
| Vesting of restricted stock |
— | 75 | 1 | 449 | — | — | 450 | |||||||||||||||||||||
| Unrealized loss on available for sale securities, net of taxes |
— | — | — | — | — | (4 | ) | (4 | ) | |||||||||||||||||||
| Net income |
— | — | — | — | 11,440 | — | 11,440 | |||||||||||||||||||||
| BALANCE, December 31, 2010 |
— | 39,056 | $ | 391 | $ | 34,237 | $ | 138,808 | $ | 1 | $ | 173,437 | ||||||||||||||||
See accompanying notes.
F-7
Table of Contents
Index to Financial Statements
TRADESTATION GROUP, INC. AND SUBSIDIARIES
CONSOLIDATED STATEMENTS OF CASH FLOWS
(In thousands)
| For the Years Ended December 31, | ||||||||||||
| 2010 | 2009 | 2008 | ||||||||||
| CASH FLOWS FROM OPERATING ACTIVITIES: |
||||||||||||
| Net income |
$ | 11,440 | $ | 15,790 | $ | 30,637 | ||||||
| Adjustments to reconcile net income to net cash (used in) provided by operating activities: |
||||||||||||
| Depreciation and amortization |
5,311 | 4,362 | 4,218 | |||||||||
| Stock-based compensation expense |
3,169 | 2,758 | 3,966 | |||||||||
| Deferred income tax provision (benefit) |
1,205 | 1,725 | (461 | ) | ||||||||
| Gain on investments in stock exchanges |
— | — | (130 | ) | ||||||||
| Unrealized (gain) loss on marketable securities, net |
(3,694 | ) | 142 | — | ||||||||
| (Increase) decrease in: |
||||||||||||
| Cash and investments segregated in compliance with federal regulations |
(39,450 | ) | 623,854 | (150,134 | ) | |||||||
| Trading investments transactions, net |
(436,355 | ) | (839,264 | ) | — | |||||||
| Receivables from brokers, dealers, clearing organizations and clearing agents |
(48,601 | ) | (21,087 | ) | 12,287 | |||||||
| Receivables from brokerage customers |
(23,234 | ) | (14,718 | ) | 63,616 | |||||||
| Prepaid income taxes |
— | (971 | ) | — | ||||||||
| Deposits with clearing organizations |
— | 20,499 | (24,055 | ) | ||||||||
| Other assets |
(604 | ) | (1,251 | ) | 1,902 | |||||||
| Increase (decrease) in: |
||||||||||||
| Payables to brokers, dealers and clearing organizations |
27,656 | 27 | (724 | ) | ||||||||
| Payables to brokerage customers |
512,364 | 207,695 | 71,392 | |||||||||
| Accounts payable |
1,140 | (736 | ) | 950 | ||||||||
| Accrued expenses |
(77 | ) | (586 | ) | 35 | |||||||
| Net cash provided by (used in) operating activities |
10,270 | (1,761 | ) | 13,499 | ||||||||
| CASH FLOWS FROM INVESTING ACTIVITIES: |
||||||||||||
| Capital expenditures |
(15,178 | ) | (5,260 | ) | (3,767 | ) | ||||||
| Decrease in restricted cash |
239 | 239 | 239 | |||||||||
| Purchase of available–for-sale marketable securities |
(34,170 | ) | (26,977 | ) | — | |||||||
| Proceeds from sale/maturities of marketable securities |
35,658 | 4,278 | 395 | |||||||||
| Net cash used in investing activities |
(13,451 | ) | (27,720 | ) | (3,133 | ) | ||||||
| CASH FLOWS FROM FINANCING ACTIVITIES: |
||||||||||||
| Proceeds from issuance of common stock |
525 | 1,462 | 1,214 | |||||||||
| Excess tax benefit from stock option exercises |
353 | 209 | 273 | |||||||||
| Repurchase and retirement of common stock |
(12,975 | ) | (14,860 | ) | (14,999 | ) | ||||||
| Net cash used in financing activities |
(12,097 | ) | (13,189 | ) | (13,512 | ) | ||||||
| NET DECREASE IN UNRESTRICTED CASH AND CASH EQUIVALENTS |
(15,278 | ) | (42,670 | ) | (3,146 | ) | ||||||
| UNRESTRICTED CASH AND CASH EQUIVALENTS, beginning of year |
56,688 | 99,358 | 102,504 | |||||||||
| UNRESTRICTED CASH AND CASH EQUIVALENTS, end of year |
$ | 41,410 | $ | 56,688 | $ | 99,358 | ||||||
F-8
Table of Contents
Index to Financial Statements
TRADESTATION GROUP, INC. AND SUBSIDIARIES
CONSOLIDATED STATEMENTS OF CASH FLOWS
(In thousands)
(continued)
| For the Years Ended December 31, | ||||||||||||
| 2010 | 2009 | 2008 | ||||||||||
| SUPPLEMENTAL CASH FLOW INFORMATION: |
||||||||||||
| Cash paid for interest |
$ | — | $ | 8 | $ | 2,724 | ||||||
| Cash paid for income taxes |
$ | 6,335 | $ | 9,728 | $ | 19,417 | ||||||
See accompanying notes.
F-9
Table of Contents
Index to Financial Statements
TRADESTATION GROUP, INC. AND SUBSIDIARIES
NOTES TO CONSOLIDATED FINANCIAL STATEMENTS
(1) DESCRIPTION OF BUSINESS
TradeStation Group, Inc. (the “Company”), a Florida corporation formed in 2000, is the successor company to a publicly-held trading software company that was formed in 1982. TradeStation Group is listed on The NASDAQ Global Select Market under the symbol “TRAD.” TradeStation Securities, Inc., a licensed securities broker-dealer and a registered futures commission merchant, and TradeStation Technologies, Inc., a trading technology company, are the Company’s two established operating subsidiaries. The Company has two other subsidiaries. TradeStation Europe Limited, a company organized under the laws of England and Wales, is authorized and regulated by the UK Financial Services Authority (FSA), and holds what is known as a “Passport,” to introduce brokerage accounts for residents of countries within the European Economic Area. TradeStation Forex, Inc., a Florida corporation, was recently formed to assume, own and conduct all of the Company’s forex brokerage business (such business has historically been owned and conducted by TradeStation Securities using an established forex dealer to clear its forex business). In January 2011, TradeStation Forex was registered with the Commodity Futures Trading Commission (“CFTC”) as a Retail Foreign Exchange Dealer and approved by the National Futures Association (“NFA”) as a forex dealer member. Accordingly, As of January 2011, TradeStation Forex’s minimum net capital requirement was $20 million. Later in 2011, TradeStation Forex expects to receive a transfer of all of TradeStation Securities’ forex accounts and commence operations as a forex dealer (at which time TradeStation Securities will cease its forex business).
The Company’s core product/service, which is offered by TradeStation Securities (as well as TradeStation Europe and, later in 2011, TradeStation Forex), is TradeStation, an award-winning electronic trading platform that enables traders to test and automate “rules-based” trading strategies (both technical and fundamental) across multiple asset classes, namely, equities, equity and index options, futures (chiefly electronic futures contracts), and foreign currencies (forex). The TradeStation electronic trading platform seamlessly integrates powerful strategy trading software tools, historical and streaming real-time market data, and electronic order-routing and execution. The TradeStation platform’s electronic order-routing of trades means, with respect to equities, equity and index options, and futures transactions, Internet connections to all major U.S., and some major European, electronic exchanges and marketplaces, or electronic access provided by certain market makers or other third parties who offer or enable ‘best execution.’ In each of these electronic marketplaces, buyers and sellers participating on the network are matched, often instantaneously following the placement of their orders. In addition to strategy trading tools, real-time market data and order placement and routing, the TradeStation electronic trading platform offers powerful automated and manual advanced order placement functions and capabilities, and numerous advanced charting and analytics features.
TradeStation Securities is a leading online brokerage firm that serves the active trader and certain institutional trader markets, and is the Company’s principal operating subsidiary. TradeStation Securities is a member and subject to the rules and requirements of the New York Stock Exchange (NYSE), Financial Industry Regulatory Authority (FINRA), Securities Investor Protection Corporation (SIPC), NFA, the Depository Trust & Clearing Corporation (DTCC), Options Clearing Corporation (OCC), Boston Options Exchange (BOX), Chicago Board Options Exchange (CBOE), Chicago Stock
F-10
Table of Contents
Index to Financial Statements
Exchange (CHX), International Securities Exchange (ISE), NASDAQ OMX, EDGA Exchange (EDGA), EDGX Exchange (EDGX), and BATS Exchange (BATS). TradeStation Securities’ business is also subject to the rules and requirements of the Securities and Exchange Commission (SEC), CFTC and state regulatory authorities (the firm is registered to conduct its brokerage business in all 50 states and the District of Columbia). TradeStation Securities self-clears most of its equities and equity and index options business, and uses an established futures clearing firm to clear its futures business on an omnibus clearance basis. The DTCC and the OCC, together with other organizations, if any, that perform similar clearing or depository rules for their members, are collectively referred to in this report as “clearing organizations.”
Beginning in September 2004, TradeStation Securities commenced equities self-clearing operations for its active trader client base and, beginning on March 29, 2005, following issuance of its membership in the Options Clearing Corporation (“OCC”), TradeStation Securities commenced self-clearing of its standardized equity options trades for its active trader client base. Clearing operations include the confirmation, settlement, delivery and receipt of securities and funds and record-keeping functions involved in the processing of securities transactions. As the clearing broker for its equities active trader client base, TradeStation Securities maintains custody and control over the assets in those clients’ accounts and provides the following back office functions: maintaining customer accounts; extending credit in a margin account to the customer; settling stock transactions with the National Securities Clearing Corporation (and, for options, with the OCC); settling commissions and clearing fees; preparing customer trade confirmations and statements; performing designated cashier functions, including the delivery and receipt of funds and securities to or from the customer; possession or control of customer securities, safeguarding customer funds, transmitting tax accounting information to the customer and to the applicable tax authorities; and forwarding prospectuses, proxies and other shareholder information to customers.
TradeStation Securities clears most institutional account trades through J.P. Morgan Clearing Corp. on a fully-disclosed basis and provides order execution services on a Delivery Versus Payment/Receipt Versus Payment (“DVP/RVP”) basis with the orders cleared and settled by the client’s prime brokerage firm. Through December 31, 2009, futures trades were cleared through R.J. O’Brien & Associates on a fully-disclosed basis, and for certain institutional futures accounts, order execution services are provided on a “give-up” basis with the orders cleared and settled by the client’s prime brokerage firm. Forex trades are cleared through GAIN Capital Group, Inc. on a fully-disclosed basis (J.P. Morgan Clearing Corp., R.J. O’Brien & Associates, and GAIN Capital are collectively referred to as “clearing agents” or “clearing agent firms”).
Effective January 4, 2010, the Company converted its futures accounts, held at R.J. O’Brien & Associates, from a fully disclosed basis to an omnibus relationship also with R.J. O’Brien & Associates. As such, the Company received approximately $349 million in futures customers’ funds which were appropriately segregated in accordance with the Commodity Exchange Act rules.
TradeStation Technologies develops and offers strategy trading software tools and subscription services. TradeStation Europe Limited introduces United Kingdom and other European accounts to TradeStation Securities.
F-11
Table of Contents
Index to Financial Statements
(2) SUMMARY OF SIGNIFICANT ACCOUNTING POLICIES
When completing the consolidated financial statements included herein, the Company evaluated subsequent events up to and including the date that this Annual Report on Form 10-K was filed with the SEC.
The following is a summary of significant accounting policies adhered to in the preparation of these consolidated financial statements:
Principles of Consolidation – The consolidated financial statements include the accounts of the Company and its wholly-owned subsidiaries. All significant intercompany transactions and balances have been eliminated in consolidation.
Use of Estimates – The preparation of financial statements in conformity with accounting principles generally accepted in the United States requires management to make estimates and assumptions that affect the reported amounts of assets and liabilities and disclosure of contingent assets and liabilities at the date of the financial statements and the reported amounts of revenues and expenses during the reporting period. Actual results could differ from those estimates.
Cash and Cash Equivalents – The Company classifies all highly-liquid investments with an original maturity of three months or less as cash equivalents. Cash and cash equivalents consist primarily of cash and money market funds held primarily at two major financial institutions. Cash and cash equivalents at December 31, 2010 and 2009 include restricted cash of $478,000 and $717,000, respectively, supporting the lease on the Company’s corporate headquarters. Based upon the year-end calculation of cash and investments segregated in compliance with federal regulations (see below), the cash and cash equivalents balance may increase or decrease on the first or second business day subsequent to year end. On January 4, 2010, cash and cash equivalents decreased by $7.7 million. See Cash and Investments Segregated In Compliance With Federal Regulations below, and Note 16 – COMMITMENTS AND CONTINGENCIES – Restricted Cash.
Cash and Investments Segregated In Compliance With Federal Regulations – TradeStation Securities is obligated by rules mandated by two of its primary regulators, the SEC and the CFTC, to set aside cash or qualified securities to satisfy regulations promulgated to protect customer assets. Cash and investments segregated in compliance with federal regulations, consisting primarily of U.S. Treasury securities, of $1.28 billion (which includes $337,000 of interest receivable) and $785.2 million (which includes $349,000 of interest receivable) as of December 31, 2010 and December 31, 2009, respectively, have been segregated in special reserve accounts at JPMorgan Chase ($1.22 billion as of December 31, 2010 and $0 as of December 31, 2009) and R.J. O’Brien ($64.1 million as of December 31, 2010 and $0 as of December 31, 2009) for the exclusive benefit of customers under Rule 15c3-3 under the Securities Exchange Act of 1934 (“Rule 15c3-3”) and the Commodity Exchange Act. Of the $1.28 billion in cash and investments segregated in compliance with federal regulations as of December 31, 2010, $857.4 million was related to Rule 15c3-3 and $421.9 million was related to CFTC requirements. All of the $785.2 million balance as of December 31, 2009 was related to Rule 15c3-3. By the second business day of each week, under Rule 15c3-3, if required, this amount is adjusted based upon the previous week-end or month-end calculation. Based on this requirement, on January 3, 2011 cash and investments segregated in compliance with federal regulations decreased by $3.9 million, and marketable securities increased by $3.9 million. Additionally, on January 4, 2010 cash and investments segregated in compliance with federal regulations increased by $7.7 million and cash and cash equivalents decreased by $7.7 million. On
F-12
Table of Contents
Index to Financial Statements
January 4, 2010, TradeStation Securities converted its futures accounts, held at R.J. O’Brien & Associates as clearance agent, from clearance on a fully-disclosed basis to omnibus clearance. As a result of converting to omnibus clearance, TradeStation Securities received from R.J. O’Brien approximately $349.0 million in futures customers’ funds which were then appropriately segregated in accordance with Commodity Exchange Act rules.
Marketable Securities – The Company’s investments in marketable securities are carried at fair value and are designated as available-for-sale, except for securities owned by the Company’s brokerage subsidiaries, TradeStation Securities and TradeStation Forex, which are required to be accounted for as trading investments. Unrealized gains and losses on available-for-sale investments, net of deferred income taxes, are reflected as accumulated other comprehensive income. Realized gains and losses on available-for-sale investments are determined on the specific identification method and are reflected on the consolidated statements of income. Unrealized and realized gains and losses on securities accounted for as trading investments are reflected on the consolidated statements of income. Declines in fair value of investments that are considered other than temporary are accounted for as realized losses. See Note 3 – FAIR VALUE MEASURES. Based upon the year-end calculation of cash and investments segregated in compliance with federal regulations (see above), the marketable securities balance may increase or decrease on the first or second business day subsequent to year end. On January 3, 2011, marketable securities increased by $3.9 million. See Cash and Investments Segregated In Compliance With Federal Regulations above.
Receivables from Brokers, Dealers, Clearing Organizations and Clearing Agents – Receivables from brokers, dealers, clearing organizations and clearing agents consist primarily of securities borrowed from broker-dealers (see Securities Borrowed and Loaned below). In addition, the Company services some of its securities customer accounts through J.P. Morgan Clearing Corp. and its futures and forex customer accounts through R.J. O’Brien & Associates (through December 31, 2009) and GAIN Capital, Inc., respectively, on a fully-disclosed basis. These clearing agents provide services, handle TradeStation Securities’ customers’ funds, hold securities, futures and forex positions, and remit monthly activity statements to the customers on behalf of TradeStation Securities. The receivables from these clearing agents relate primarily to commissions earned by TradeStation Securities for trades executed and/or cleared by the clearing agents on behalf of TradeStation Securities. See Brokerage Commissions and Fees below, and Note 4 – RECEIVABLES FROM BROKERS, DEALERS, CLEARING ORGANIZATIONS AND CLEARING AGENTS.
Securities Borrowed and Loaned – Securities borrowed and securities loaned transactions are recorded at the amount of cash collateral advanced or received. Securities borrowed transactions require the Company to provide the counterparty with collateral in the form of cash. The Company receives collateral in the form of cash for securities loaned transactions. For these transactions, the fees earned or incurred by the Company are recorded as interest income. The related interest receivable from and the brokerage interest payable to broker-dealers are included in Receivables from Brokers, Dealers, Clearing Organizations and Clearing agents and in Payables to Brokers, Dealers and Clearing Organizations, respectively, on the accompanying consolidated balance sheets. See Note 4 – RECEIVABLES FROM BROKERS, DEALERS, CLEARING ORGANIZATIONS AND CLEARING AGENTS.
Receivables from Brokerage Customers – TradeStation Securities performs periodic credit evaluations and provides allowances for potential credit losses based upon their assessment of specifically identified unsecured receivables and other factors. See Note 5 – RECEIVABLES FROM BROKERAGE CUSTOMERS.
F-13
Table of Contents
Index to Financial Statements
Property and Equipment – Property and equipment are stated at cost less accumulated depreciation and amortization. Property and equipment are depreciated or amortized using the straight-line method over the estimated useful lives of the assets. Maintenance and repairs are charged to expense when incurred; betterments are capitalized and amortized over the lesser of their useful life or the remaining initial term of the lease. Upon the sale or retirement of assets, the cost and accumulated depreciation are removed from the accounts, and any gain or loss is recognized currently. See Note 6 – PROPERTY AND EQUIPMENT, NET.
Impairment of Long-Lived Assets – The Company evaluates long-lived assets for recoverability whenever events or changes in circumstances indicate that the carrying amount may not be recoverable. Impairment losses are recognized if the carrying amount exceeds the sum of the undiscounted cash flows estimated to be generated by those assets. The amount of impairment loss is calculated as the amount by which the carrying value exceeds fair value. No impairment occurred during the years ended December 31, 2010, 2009 or 2008.
Related-Party Loans – Certain directors and executive officers of the Company maintain margin accounts with TradeStation Securities. There were no margin loans to directors or executive officers outstanding as of December 31, 2010 or 2009. Any margin loans made in these accounts are in the ordinary course of TradeStation Securities’ business on terms no more favorable than those available for comparable transactions in other brokerage accounts.
Software Development Costs – In accordance with the Financial Accounting Standards Board (the “FASB”) Accounting Standards Codification (“ASC”) Software Topic and the FASB ASC Intangibles-Goodwill and Other Topic, the Company examines its software development costs after technological feasibility has been established to determine the amount of capitalization that is required. Based on the Company’s technology development process, technological feasibility is established upon completion of a working model. The costs that are capitalized are amortized over the period of benefit of the related products. For the periods presented, the technological feasibility of the Company’s products to be sold and marketed to its customers, and the general release of such software generally coincide, and, as a result, such costs were not capitalized as of December 31, 2010 or 2009. The Company capitalized costs associated with the development of internal-use software of $545,000 and $1.1 million during the years ended December 31, 2010 and 2009, respectively. Such costs are included in property and equipment, net. Amortization related to capitalized internal-use software was $253,000 in 2010. No amortization of these costs was recorded prior to 2010 since the internal-use software was not yet operational. During 2010, the Company also capitalized $5.0 million of software technology purchased from third parties. Amortization expense in 2010 related to these purchases was $576,000. During 2010, 2009 and 2008, total software development costs (comprised primarily of employee compensation and benefits), excluding capitalized internal-use software, were approximately $11.5 million, $10.4 million and $7.1 million, respectively.
Payables to Brokerage Customers – Payables to equities brokerage customers consist primarily of cash balances in brokerage customer accounts. At December 31, 2010 and 2009, payables to customers totaled $1.38 billion and $868.7 million, respectively. These funds are the principal source of funding for margin lending. At December 31, 2010 and 2009, TradeStation Securities was not paying interest on cash balances in brokerage customer accounts.
Fair Value of Financial Instruments – The carrying amounts of cash and cash equivalents; cash and investments segregated in compliance with federal regulations; marketable securities; receivables
F-14
Table of Contents
Index to Financial Statements
from brokers, dealers, clearing organizations and clearing agents; receivables from brokerage customers; deposits with clearing organizations, payables to brokers, dealers and clearing organizations; and payables to brokerage customers approximate fair value as of December 31, 2010 and 2009 due to the short-term nature of these instruments.
Securities and Futures Transactions – Customer securities transactions are recorded on a settlement date basis with such transactions generally settling three business days after the trade date. The Company records revenues and expenses related to customer securities transactions on a trade date basis (see Brokerage Commissions and Fees below). Securities owned by customers, including those that collateralize margin loans or similar transactions, are not reflected in the Company’s consolidated financial statements. Customer futures and forex transactions and related revenues and expenses are recorded on a trade date basis (see Brokerage Commissions and Fees below). Futures and forex positions owned by customers are not reflected in the Company’s consolidated financial statements.
Brokerage Commissions and Fees – Brokerage commissions and related clearing costs are recorded on a trade date basis as transactions occur. Brokerage fees are recorded on an accrual basis when services are provided.
Net Interest Income – Interest income and brokerage interest expense are recorded on an accrual basis as interest is earned or incurred.
Subscription Fees and Other Revenues – The Company provides investment analysis trading tools, including streaming real-time market information, to non-brokerage customers via the Internet in exchange for monthly subscription fee payments. In addition to these services, payment of subscription fees give customers access to certain customer support services such as telephone, electronic mail and web-site support. Revenues are recognized on a monthly basis as the service is provided. Payments received in advance of service are deferred and recognized on a monthly basis as service is provided. Other revenues consist primarily of fees for the Company’s training workshops, sales of training manuals, direct sales of legacy software products, and royalties. Revenues for training workshops are recognized during the period in which the workshop takes place. Revenues from training manuals and direct sales of legacy software products are recognized when the product is shipped. Royalty revenues, which are derived from contracts with market data vendors under which the Company has agreed to enable its trading software products to be technically compatible with the vendors’ data services, are recorded when earned, in accordance with the terms of the applicable contracts.
Advertising – Advertising, which is included within marketing expense, is expensed when the initial advertising activity takes place. Advertising expense was approximately $6.2 million, $6.0 million and $5.3 million for the years ended December 31, 2010, 2009 and 2008, respectively. There were no advertising costs capitalized as of December 31, 2010 and 2009.
Operating Leases – Rental payments, free rent, and leasehold and other incentives are recognized on a straight-line basis over the life of a lease. Leasehold improvements are amortized over the shorter of their economic life or the initial lease term. See Note 16 – COMMITMENTS AND CONTINGENCIES – Operating Leases.
Stock-Based Compensation – The Company accounts for stock-based compensation in accordance with the Compensation-Stock Compensation Topic of the FASB ASC (the “Compensation-Stock Compensation Topic”). This topic requires all share-based payments to employees, including grants of
F-15
Table of Contents
Index to Financial Statements
employee stock options, shares of restricted stock and performance shares, to be recognized in the income statement based on their fair values. It also requires the benefit of tax deductions in excess of recognized compensation costs to be reported as financing cash flow, rather than an operating cash flow. See Note 10 – STOCK-BASED COMPENSATION.
Income Taxes – The Company accounts for income taxes in accordance with the Income Taxes Topic of the FASB ASC (the “Income Taxes Topic”). The Income Taxes Topic requires that deferred income tax balances be recognized based on the differences between the financial statement and income tax bases of assets and liabilities using the enacted tax rates. The Income Taxes Topic also clarifies accounting for income taxes by prescribing the minimum recognition threshold a tax position is required to meet before being recognized in the financial statements. See Note 12 – INCOME TAXES.
Earnings Per Share – Earnings per share is calculated in accordance with the Earnings Per Share Topic of the FASB ASC (the “Earnings Per Share Topic”), which requires presentation of basic and diluted earnings per share. Basic earnings per share is computed by dividing the net income available to common shareholders by the weighted average shares of outstanding common stock during the period. The calculation of diluted earnings per share is similar to basic earnings per share except that the denominator includes dilutive common stock equivalents such as stock options and unvested restricted stock and performance shares. See Note 13 – EARNINGS PER SHARE.
Comprehensive Income – Comprehensive income is defined as the change in a business enterprise’s equity during a period arising from transactions, events or circumstances relating to non-owner sources, such as unrealized holding gains or losses on available-for-sale securities and foreign currency translation adjustments. It includes all changes in equity during a period except those resulting from investments by, or distributions to, owners. See Note 14 – COMPREHENSIVE INCOME.
Segment Information – Segment information is required to be presented in accordance with the Segment Reporting Topic of the FASB ASC (the “Segment Reporting Topic”). The Segment Reporting Topic requires segmentation if warranted by management’s approach to the Company’s business and the Company’s internal organization and disclosure of revenue and operating income based upon internal accounting methods. During each of the three years in the period ended December 31, 2010, management evaluated and operated its business as two segments: (i) brokerage services and (ii) software products and services. See Note 17 – SEGMENT AND RELATED INFORMATION.
Foreign Currency Translation – Management has determined that the functional currency of the United Kingdom subsidiary is the U.S. dollar. Accordingly, monetary accounts maintained in currencies other than the dollar are re-measured into dollars in accordance with the Foreign Currency Matters Topic of the FASB ASC. Therefore, the effects of foreign currency translation adjustments arising from differences in exchange rates from period to period are included in net income.
Recently Issued Accounting Standards
In January 2010, the FASB issued Accounting Standards Update (ASU) No. 2010-06, Improving Disclosures about Fair Value Measurements (ASU 2010-06). ASU 2010-06 amends the Fair Value Measurements and Disclosures Topic of the FASB ASC (the “Fair Value Measurements and Disclosures Topic”) to require additional disclosures regarding fair value measurements. The amended guidance requires entities to disclose additional information regarding assets and liabilities that are
F-16
Table of Contents
Index to Financial Statements
transferred between levels of the fair value hierarchy. Entities are also required to disclose information in the Level 3 Rollforward about purchases, sales, issuances and settlements on a gross basis. In addition to these new disclosure requirements, ASU 2010-06 clarifies existing guidance pertaining to the level of disaggregation at which fair value disclosures should be made and the requirements to disclose information about the valuation techniques and inputs used in estimating Level 2 and Level 3 fair value measurements. The guidance in ASU 2010-06 is effective for interim and annual reporting periods beginning after December 15, 2009, except for the requirement to separately disclose purchases, sales, issuances and settlements in the Level 3 Rollforward, which becomes effective for fiscal years (and for interim periods within those fiscal years) beginning after December 15, 2010. The Company’s adoption of ASU 2010-06, effective January 1, 2010, did not have a material impact on its consolidated financial position, results of operations or cash flows during the year ended December 31, 2010. The Company does not expect the deferred portion of the adoption of ASU 2010-06 to have a material impact on its consolidated financial statements.
(3) FAIR VALUE MEASURES
The Fair Value Measurements and Disclosures Topic establishes a fair value hierarchy which requires an entity to maximize the use of observable inputs and minimize the use of unobservable inputs when measuring fair value. In accordance with guidance under the Fair Value Measurements and Disclosures Topic, three levels of inputs may be used to measure fair value:
Level 1 – Quoted prices in active markets for identical assets or liabilities. The Company’s Level I assets consist of U.S. Treasury Bills and Notes (“U.S. Treasuries“) and actively-traded marketable exchange-listed securities. As of December 31, 2010, the Company’s U.S. Treasuries had maturities ranging from January 2011 to December 2011.
Level 2 – Observable inputs other than Level 1 prices, such as quoted prices for similar assets or liabilities; or other inputs that are observable or can be corroborated by observable market data for substantially the full term of the assets or liabilities. The Company’s Level II assets consist of variable rate demand note (“VRDN”) securities issued by various state agencies throughout Florida. The Company’s VRDN investments are federal tax-exempt instruments of high credit quality, secured by direct-pay letters of credit from a major financial institution. These investments have variable rates tied to short-term interest rates. Interest rates are reset weekly and these VRDN securities can be tendered for sale upon notice (generally no longer than seven days) to the remarketing agent. Although the Company’s VRDN securities are issued and rated as long-term securities (with maturities ranging from 2021 through 2023), they are priced and traded as short-term instruments. The Company classifies these short-term investments as available-for-sale in accordance with the Investments-Debt and Equity Securities Topic of the FASB ASC. The investments are carried at cost or par value, which approximates the fair market value.
Level 3 – Unobservable inputs that are supported by little or no market activity and that are financial instruments whose values are determined using pricing models, discounted cash flow methodologies, or similar techniques, as well as instruments for which the determination of fair value requires significant judgment or estimation. The Company did not hold any Level III assets during the year ended December 31, 2010.
F-17
Table of Contents
Index to Financial Statements
The following table summarizes the basis used to measure the fair value of securities on a recurring basis in the Company’s consolidated balance sheet as of December 31, 2010 (in thousands):
| December 31, 2010 | ||||||||||||||||
| Level I | Level II | Level III | Fair Value | |||||||||||||
| Investments segregated in compliance with federal regulations |
$ | 1,245,410 | $ | — | $ | — | $ | 1,245,410 | ||||||||
| Marketable securities |
$ | 57,555 | $ | 5,700 | $ | — | $ | 63,255 | ||||||||
| Deposits with clearing organizations |
$ | 27,981 | $ | — | $ | — | $ | 27,981 | ||||||||
The Company purchased available-for-sale marketable securities of approximately $34.2 million and had proceeds from the sale or maturity of available-for-sale marketable securities of approximately $35.7 million during the year ended December 31, 2010. As of December 31, 2010, the Company had approximately $29.7 million of available-for-sale marketable securities.
As described in Note 2 – SUMMARY OF SIGNIFICANT ACCOUNTING POLICIES, broker-dealers are required to account for investments in marketable securities as trading investments. The Company’s broker-dealer, TradeStation Securities, had net trading investment transactions (purchases, net of proceeds and interest accreted) of $413.6 million during the year ended December 31, 2010. The Company capitalized its recently formed subsidiary, TradeStation Forex, with $23.0 million of which TradeStation Forex invested $22.7 million in U.S. Treasury securities that had maturities longer than 90 days. As of December 31, 2010, TradeStation Securities and TradeStation Forex had trading investments of approximately $1.30 billion. Unrealized net gains from these trading investments were approximately $3.7 million during the year ended December 31, 2010. Such unrealized net losses and net gains are reflected in the accompanying consolidated statements of income.
The following methods and assumptions were used to estimate the fair value of each class of financial instruments for which it is practicable to estimate that value:
Cash and cash equivalents, brokerage receivables and brokerage payables
For these financial instruments, the carrying amount is a reasonable estimate of fair value.
Marketable securities
For investments in U.S. Treasuries, the fair value equals the quoted market price of each U.S. Treasury Bill or Treasury Note. Investments in VRDN’s are carried at cost or par value, which approximates the fair value. The fair value of equity securities equals the quoted market prices for such securities.
F-18
Table of Contents
Index to Financial Statements
The estimated fair values of the Company’s financial instruments are as follows (in thousands):
| December 31, 2010 | ||||||||
| Carrying Amount |
Fair Value | |||||||
| Financial assets: |
||||||||
| Cash and cash equivalents |
$ | 41,888 | $ | 41,888 | ||||
| Cash and investments segregated in compliance with federal regulations |
1,279,734 | 1,279,734 | ||||||
| Marketable securities |
63,255 | 63,255 | ||||||
| Receivables from brokers, dealers, clearing organizations and clearing agents |
80,827 | 80,827 | ||||||
| Receivables from brokerage customers, net |
68,268 | 68,268 | ||||||
| Deposits with clearing organizations |
35,504 | 35,504 | ||||||
| Financial liabilities: |
||||||||
| Payables to brokers, dealers and clearing organizations |
27,770 | 27,770 | ||||||
| Payables to brokerage customers |
1,381,105 | 1,381,105 | ||||||
(4) RECEIVABLES FROM BROKERS, DEALERS, CLEARING ORGANIZATIONS AND CLEARING AGENTS
Amounts receivable from brokers, dealers, clearing organizations and clearing agents consist of the following as of December 31, 2010 and 2009 (in thousands):
| 2010 | 2009 | |||||||
| Securities borrowed from broker-dealers |
$ | 80,200 | $ | 30,490 | ||||
| Fees and commissions receivable from clearing agents |
313 | 947 | ||||||
| Securities failed to deliver to broker-dealers and other |
314 | 789 | ||||||
| $ | 80,827 | $ | 32,226 | |||||
(5) RECEIVABLES FROM BROKERAGE CUSTOMERS
Receivables from brokerage customers consist primarily of margin loans to TradeStation Securities’ brokerage customers of approximately $68.3 million at December 31, 2010 and approximately $45.0 million at December 31, 2009. Securities owned by brokerage customers are held as collateral for margin loans. Such collateral is not reflected in the consolidated financial statements. TradeStation Securities was charging a base margin debit interest rate of 7.75% per annum as of December 31, 2010 and 2009, on debit balances in brokerage customer accounts.
“Margin” requirements determine the amount of equity required to be held in an account for the purchase of equities on credit. Margin lending is subject to the margin rules of the Board of Governors of the Federal Reserve System, the margin requirements of FINRA, limits imposed by clearing agent firms, and TradeStation Securities’ own internal policies. By permitting customers to purchase and maintain securities positions on margin, TradeStation Securities takes the risk that a market decline will reduce the value of the collateral securing its margin loan to an amount that renders the margin loan unsecured. Under applicable securities laws and regulations, once a margin account has been established, TradeStation Securities is obligated to require from the customer initial margin of no
F-19
Table of Contents
Index to Financial Statements
lower than 50% for purchases of securities and then is obligated to require the customer to maintain its equity in the account equal to at least 25% of the value of the securities in the account. However, TradeStation Securities’ current internal requirement is that the customer’s equity not be allowed to fall below 35% of the value of the securities in the account. If it does fall below 35%, TradeStation Securities requires the customer to increase the account’s equity to 35% of the value of the securities in the account (if not, TradeStation Securities will perform closing transactions to bring the customer account above the maintenance requirement). These requirements can be, and often are, raised as TradeStation Securities deems necessary for certain accounts, groups of accounts, securities or groups of securities. However, there is no assurance that a customer will be willing or able to satisfy a margin call or pay unsecured indebtedness owed to TradeStation Securities.
(6) PROPERTY AND EQUIPMENT, NET
Property and equipment, net, consist of the following as of December 31, 2010 and 2009 (in thousands):
| Estimated Useful Life In Years |
2010 | 2009 | ||||||||||
| Computers and software |
3-5 | $ | 41,039 | $ | 25,857 | |||||||
| Furniture and equipment |
3-7 | 4,039 | 3,720 | |||||||||
| Leasehold improvements |
5-10 | 1,597 | 1,466 | |||||||||
| 46,675 | 31,043 | |||||||||||
| Accumulated depreciation and software amortization |
(28,701 | ) | (23,465 | ) | ||||||||
| $ | 17,974 | $ | 7,578 | |||||||||
Depreciation and amortization expense related to property and equipment was approximately $5.2 million, $4.4 million and $4.2 million, for the years ended December 31, 2010, 2009 and 2008, respectively.
(7) DEPOSITS WITH CLEARING ORGANIZATIONS
As a self-clearing broker-dealer, TradeStation Securities is subject to clearing organization and other cash deposit requirements which are, and may continue to be, large in relation to the Company’s total liquid assets, and which may fluctuate significantly from time to time based upon the nature and size of TradeStation Securities’ active trader and institutional clients’ trading activity. As of December 31, 2010 and 2009, TradeStation Securities had U.S. Treasuries and cash as security deposits totaling approximately $35.5 million and $38.5 million, respectively, with clearing organizations for the self-clearing of stock trades and standardized equity option trades. The decrease in deposits as of December 31, 2010, compared to December 31, 2009, was related to decreased deposit requirements for the self-clearing of standardized equity option trades. Deposits are recorded at market value.
F-20
Table of Contents
Index to Financial Statements
(8) PAYABLES TO BROKERS, DEALERS AND CLEARING ORGANIZATIONS
Amounts payable to brokers, dealers, and clearing organizations consist of the following as of December 31, 2010 and 2009 (in thousands):
| 2010 | 2009 | |||||||
| Securities loaned from brokers-dealers |
$ | 27,170 | $ | — | ||||
| Payables to brokers |
499 | 55 | ||||||
| Payables to clearing organizations |
101 | 59 | ||||||
| $ | 27,770 | $ | 114 | |||||
(9) SHAREHOLDERS’ EQUITY
Preferred Stock
The Company has authorized 25 million shares of preferred stock with a par value of $.01 per share. To date, no specific preferences or rights have been established with respect to any of these shares, nor have any of these shares been issued.
Common Stock
The Company has authorized 200 million shares of common stock with a par value of $.01 per share. As of December 31, 2010 and 2009, 39,055,900 and 40,692,328 shares, respectively, were issued and outstanding.
Common Stock Buyback Plan
In October 2006, the Company’s Board of Directors authorized, and the Company announced, the use of up to $60 million of the Company’s available and unrestricted cash, over a four-year period, to repurchase shares of its common stock in the open market or through privately-negotiated transactions. The stock repurchases were authorized to be made pursuant to a Rule 10b5-1 plan. The four-year period commenced on November 13, 2006 and ended on November 12, 2010. Pursuant to the buyback plan, up to $1,250,000 of company cash during each full calendar month (and prorated amount during the first and last months) of the four-year period (i.e., up to $15 million per 12-month period and up to $60 million for the four-year period) was authorized to be used to purchase company shares at prevailing prices, subject to compliance with applicable securities laws, rules and regulations, including Rules 10b5-1 and 10b-18. The buyback plan did not obligate the Company to acquire any specific number of shares in any period, and could have been modified, suspended, extended or discontinued at any time without prior notice.
During the year ended December 31, 2010, the Company used $13.0 million to purchase 1,886,217 shares of its common stock at an average price of $6.88 per share. Since commencement of this stock buyback plan on November 13, 2006 through November 12, 2010, the Company used $59.8 million to purchase 7,036,472 shares of its common stock at an average price of $8.50 per share. All shares purchased have been retired.
Stock Option Plans
See Note 10 – STOCK-BASED COMPENSATION for discussion of stock plans and employee stock purchase plan.
F-21
Table of Contents
Index to Financial Statements
(10) STOCK-BASED COMPENSATION
The Company believes that stock-based compensation is an integral way to provide incentives which will attract and retain highly-competent persons at all levels of the Company, as employees, as independent directors, and as independent contractors providing consulting or advisory services to the Company, by providing them opportunities to acquire the Company’s common stock or to receive monetary payments based on the value of such shares.
Stock Plans
The Company has reserved 12 million shares of its common stock for issuance under the TradeStation Group Incentive Stock Plan, as amended and restated (the “Incentive Stock Plan”). The Company’s Board of Directors authorized, and in June 2006 the Company’s shareholders approved, an increase in the number of shares to that 12-million number, as well as an extension of the expiration date of the Incentive Stock Plan to June 5, 2016. Under the Incentive Stock Plan, incentive and nonqualified stock options, stock appreciation rights, stock awards, performance shares and performance units are available to employees or consultants. Through December 31, 2010, only stock options, restricted shares and performance shares of common stock had been granted. The terms of each stock option, restricted share agreement and performance share agreement are determined by the Compensation Committee of the Board of Directors. Options under the Incentive Stock Plan are generally granted by the Company at an exercise price equal to the fair value (as defined in the Incentive Stock Plan) at the date of grant, vest over a period of five years, and expire ten years after the grant date. Restricted stock awards under the Incentive Stock Plan have been granted by the Company with vesting terms typically of 50% after three years and 100% after six years (except for one award which vests 50% on the third anniversary of the date of grant and 100% on the fifth anniversary for tax reasons applicable to the United Kingdom), and a small minority of those awards have 20% vesting each one-year anniversary (depending on the award). Performance shares vest 60% on the third anniversary of the date of grant, 20% on the fourth anniversary of the date of grant and 20% on the fifth anniversary of the date of grant. Restricted shares and performance shares contain a provision for 100% acceleration upon retirement, death, disability and change in control of the Company. Restricted shares contain a provision whereby, if employment or service terminates prior to full vesting, the non-vested shares will automatically be forfeited and the Company will reacquire the non-vested shares for no consideration. Upon termination of employment the unvested portion of performance shares shall automatically terminate and become null and void.
Certain stock options granted to the Company’s Chief Executive Officer, Chief Financial Officer, General Counsel and former Chief Growth Officer prior to February 2007 contained a provision resulting in 100% acceleration of vesting if the aggregate beneficial ownership of William Cruz and Ralph Cruz, the Company’s founders and former Co-Chairmen of the Board, fell beneath 25%. See Vesting Acceleration of Certain Options below for a discussion of the effects of this provision during the year ended December 31, 2008.
On October 25, 2005, the Company (i) globally amended the terms of all outstanding stock option agreements pursuant to the Incentive Stock Plan for non-executive employees, and (ii) adopted a new form of stock option agreement for future grants to non-executive employees, in each case, to provide for the accelerated vesting of all unvested options in the event the Company undergoes a change in control and the optionee’s employment is terminated by the Company (or its successor) without cause within one year following the change in control. This change did not result in any additional compensation expense during 2005, as the employees did not receive any additional benefits as a result of the change and the unvested options continued to vest as employees continued to provide services to the Company.
F-22
Table of Contents
Index to Financial Statements
In December 2006, the Company’s Board of Directors authorized an amendment to the Incentive Stock Plan to change the definition of fair market value to the closing price of the Company’s stock on the date of grant (or the closing price on the next trading date if shares were not traded on the date of grant).
At December 31, 2010, there were 2,650,885 shares available for future grants under the Incentive Stock Plan. In February 2011, the Company issued performance shares (more commonly referred to as restricted stock units) representing the right to receive an aggregate of 188,638 shares of common stock. Such performance shares, which had a fair market value of approximately $1.3 million on the date of grant, vest 60% on the third anniversary of the date of grant, 20% on the fourth anniversary of the date of grant and 20% on the fifth anniversary of the date of grant with 100% acceleration upon retirement, death and disability. Performance shares will automatically convert into shares of the Company’s common stock upon vesting. All of the performance shares were granted under the Incentive Stock Plan in the ordinary course. Unvested performance shares will expire upon the termination of an employee’s employment with the Company. In February 2011, the Company also issued options to purchase an aggregate of 213,115 shares of common stock to certain officers of the Company. Such options vest ratably in annual increments over a five-year period, with 100% acceleration upon death, disability and change in control, and are exercisable at $7.11 per share, which was the closing price of the Company’s common stock on the date the options were granted. All of the options were granted under the Incentive Stock Plan in the ordinary course, and expire, if they remain unexercised, on the tenth anniversary of the date on which they were granted. In February 2011, the Company also issued 188,607 restricted shares of Company common stock to certain officers. The restricted shares, which had a fair market value of approximately $1.3 million, were granted as a stock award under the Incentive Stock Plan and vest 50% on the third anniversary of the date of grant and 100% on the sixth anniversary (except for one award which vests 50% on the third anniversary of the date of grant and 100% on the fifth anniversary for tax reasons applicable to the United Kingdom) with 100% acceleration upon retirement, death, disability and change in control of the Company. All of the restricted shares contain a provision whereby, if employment terminates prior to full vesting, the non-vested shares will automatically be forfeited and the Company will reacquire the non-vested shares for no consideration. Upon termination of employment the unvested portion of performance shares shall automatically terminate and become null and void.
The Company had reserved 700,000 shares of its common stock for issuance under the TradeStation Group Amended and Restated Nonemployee Director Stock Option Plan (the “Old Director Plan”). Under the Old Director Plan, non-qualified stock options providing for the purchase of 188,000 shares had been issued which had an exercise price equal to the fair value (as defined in the Old Director Plan) of shares of common stock at the date of grant, vest over a period of 3 years and expire 5 years after the date of grant. On June 1, 2010, the Company adopted, after receiving approval from its shareholders, the TradeStation Group Nonemployee Director Incentive Stock Plan (the “New Director Plan”). The Company has reserved 512,000 shares of its common stock for issuance under the New Director Plan. Under the New Director Plan, an independent director is eligible to be granted one or a combination of (a) stock options, (b) stock appreciation rights, (c) stock awards, (d) performance shares, and (e) performance units. In any calendar year, no awards under the New Director Plan may be granted to any individual director having an aggregate fair market value on the date of grant in excess of $120,000. The terms of each grant are determined by the Board of Directors. To date, only restricted shares of common stock have been issued under the New Director
F-23
Table of Contents
Index to Financial Statements
Plan. During the year ended December 31, 2010, the Company granted 37,440 restricted shares of Company common stock to nonemployee directors. These restricted shares had an aggregate fair market value of approximately $240,000 on the date of grant and vest over a period of three years. All of the restricted shares contain a provision whereby, if service on the board of directors terminates prior to full vesting, the non-vested shares will automatically be forfeited and the Company will reacquire the non-vested shares for no consideration. At December 31, 2010, there were 474,560 shares available for future grants under the New Director Plan.
See General Stock Option Information below for additional information about options outstanding as of December 31, 2010.
Employee Stock Purchase Plan
The Company has reserved 500,000 shares of common stock for issuance under the TradeStation Group Employee Stock Purchase Plan (the “Purchase Plan”). Under the Purchase Plan, participating employees may purchase common stock through accumulated payroll deductions. The exercise price of the options for each six-month Purchase Plan period is equal to 85% of the fair market value of the Company’s common stock on the exercise date (i.e., the end of the six-month period). During the years ended December 31, 2010, 2009 and 2008, 17,492, 29,114 and 20,985 shares of common stock were issued under the Purchase Plan at an average price of $6.42, $6.25 and $10.04, respectively. As of December 31, 2010 there were 157,273 shares available for future grants under the Purchase Plan.
Stock Compensation
The Company currently uses the Black-Scholes option pricing model to determine the fair value of stock option awards. The value of restricted and performance shares is based on the stock price of the award on the date of grant. The determination of the fair value of stock option awards on the date of grant using an option-pricing model is affected by the market price of the stock, exercise price of the award, expected term of the award, estimated volatility of the stock over the term of the award, risk-free interest rate and expected dividend yield. Separate assumptions are used for employee officer options, non-officer employee options (both of which, subject to certain vesting-acceleration events, vest over a five-year period) and non-employee director options (which, subject to certain vesting-acceleration events, vest over a three-year period).
For both employee and non-employee director stock option awards, the expected term of all options granted is estimated by taking a weighted average of the historical holding term from grant date to exercise date and the historical holding term from grant date to post-vest cancellation date. The expected volatility assumptions are based upon a cumulative look-back of historical volatility calculated on a daily basis over the expected term of an award. The risk-free interest rate used in the option valuation model is based upon the U.S. Treasury note yield with a remaining term similar to the expected term of the particular options awarded. The Company does not anticipate paying any cash dividends in the foreseeable future and, therefore, an expected dividend yield of zero is used in the valuation model.
In accordance with the Compensation-Stock Compensation Topic, the Company is required to estimate forfeitures at the time of grant and revise those estimates in subsequent periods if actual forfeitures differ from those estimates. Historical data to estimate stock-based forfeitures are used, and stock-based compensation expense is recorded only for those awards that are expected to vest. All stock-based payment awards are amortized on a straight-line basis over the requisite service periods of the awards, which are generally the vesting periods.
F-24
Table of Contents
Index to Financial Statements
The assumptions used to estimate the fair value of each option grant on the date of grant using the Black-Scholes model are as follows:
| 2010 | 2009 | 2008 | ||||||||||
| Risk free interest rate |
3 | % | 2 | % | 3 | % | ||||||
| Dividend yield |
— | — | — | |||||||||
| Volatility ranges |
55 | % | 51-60 | % | 50-65 | % | ||||||
| Weighted-average volatility |
55 | % | 59 | % | 61 | % | ||||||
| Weighted-average life (years) |
7.3 | 6.4 | 5.2 | |||||||||
The Company’s stock-based compensation expense resulting from guidance in the Compensation-Stock Compensation Topic is included in employee compensation and benefits in its consolidated statements of income for the years ended December 31, 2010, 2009 and 2008. Such stock-based compensation expense was $3.2 million, $2.8 million and $4.0 million for the years ended December 31, 2010, 2009 and 2008, respectively. The $3.2 million and $2.8 million of stock-based compensation expense recorded in 2010 and 2009, respectively, included $1,347,000 and $960,000, respectively, related to restricted stock grants and $140,000 related to performance shares (restricted stock units) in 2010.
In accordance with the Compensation-Stock Compensation Topic, the Company’s stock-based compensation expense includes the cost related to its Purchase Plan. The amount of compensation expense for Purchase Plan transactions is the difference between the fair value of the stock to be purchased and the purchase price of the stock (i.e., the expense recorded is equal to the 15% discount). The stock-based compensation expense related to the Purchase Plan is recognized ratably over the six-month purchase period and the discount amount along with any payroll withholdings is recognized as a liability on the consolidated balance sheet until the related stock is issued. The Company recorded $16,000, $39,000 and $41,000 of expense related to its Purchase Plan during the years ended December 31, 2010, 2009 and 2008, respectively, and such amounts are included in the stock-based compensation expense discussed above. As of December 31, 2010 and 2009, the Company had a stock-based compensation liability of $25,000 associated with its Purchase Plan discounts. Such amounts are recorded in accrued expenses in the accompanying consolidated balance sheets.
As of December 31, 2010, there was total unrecognized compensation cost of approximately $3.3 million, $4.4 million and $732,000, adjusted for estimated forfeitures, related to non-vested stock options, restricted stock and performance shares, respectively, granted to the Company’s employees and non-employee directors. Total unrecognized compensation cost will be adjusted for future changes in estimated forfeitures, and is expected to be recognized over a weighted average period of 1.7 years for stock options, 2.1 years for restricted stock and 2.2 years for performance shares.
Vesting Acceleration of Certain Options
Certain stock options granted prior to February 2007 to the Company’s Chief Executive Officer, Chief Financial Officer, General Counsel and former Chief Growth Officer and certain options granted prior to June 2007 to certain non-employee directors contain a provision resulting in 100% acceleration of vesting if the aggregate beneficial ownership of William Cruz and Ralph Cruz, the Company’s former non-executive Co-Chairmen, falls below 25%. As a result of the aggregate beneficial
F-25
Table of Contents
Index to Financial Statements
ownership of William Cruz and Ralph Cruz falling below 25% in April 2008, the Company recorded compensation expense associated with the accelerated vesting of these options. The additional compensation expense from this acceleration during the year ended December 31, 2008 was $860,000, of which $528,000 was associated with the Company’s Chief Executive Officer. This additional compensation expense of $860,000 is included in the $4.0 million total stock-based compensation expense for the year ended December 31, 2008.
General Stock Option Information
The following table sets forth the summary of option activity under all of the Company’s stock option programs for the years ended December 31, 2010, 2009 and 2008:
| Number of Options |
Weighted Average Exercise Price |
Weighted Average Remaining Contractual Term (Years) |
Aggregate Intrinsic Value |
|||||||||||||
| Outstanding, December 31, 2007 |
2,697,102 | $ | 7.90 | 5.7 | ||||||||||||
| Granted |
372,438 | 10.81 | ||||||||||||||
| Forfeited |
(75,109 | ) | 11.84 | |||||||||||||
| Expired |
(85,173 | ) | 8.99 | |||||||||||||
| Exercised |
(212,213 | ) | 4.52 | |||||||||||||
| Outstanding, December 31, 2008 |
2,697,045 | 8.42 | 6.2 | |||||||||||||
| Granted |
682,540 | 6.07 | ||||||||||||||
| Forfeited |
(55,094 | ) | 9.70 | |||||||||||||
| Expired |
(159,875 | ) | 8.99 | |||||||||||||
| Exercised |
(299,641 | ) | 4.16 | |||||||||||||
| Outstanding, December 31, 2009 |
2,864,975 | 8.25 | 5.8 | |||||||||||||
| Granted |
345,047 | 6.41 | ||||||||||||||
| Forfeited |
(104,722 | ) | 8.66 | |||||||||||||
| Expired |
(174,359 | ) | 10.82 | |||||||||||||
| Exercised |
(157,272 | ) | 2.49 | |||||||||||||
| Outstanding, December 31, 2010 |
2,773,669 | 8.17 | 5.6 | $ | 2,127,332 | |||||||||||
| Vested and expected to vest in the future |
1,068,205 | 7.67 | 7.9 | $ | 504,845 | |||||||||||
| Exercisable, December 31, 2010 |
1,674,328 | 8.50 | 4.1 | $ | 1,603,425 | |||||||||||
F-26
Table of Contents
Index to Financial Statements
The weighted average fair value of options granted, the fair value of shares vested, and the tax benefits and intrinsic value related to total stock options exercised during the years ended December 31, 2010, 2009 and 2008 are as follows (in thousands, except the weighted average of fair value of options granted):
| 2010 | 2009 | 2008 | ||||||||||
| Weighted average fair value of options granted |
$ | 3.80 | $ | 3.29 | $ | 5.98 | ||||||
| Fair value of shares vested |
$ | 1,799 | $ | 1,834 | $ | 3,467 | ||||||
| Tax benefits related to stock options exercised |
$ | 426 | $ | 337 | $ | 323 | ||||||
| Intrinsic value of stock options exercised |
$ | 678 | $ | 947 | $ | 948 | ||||||
The intrinsic value represents the difference between the fair market value of the Company’s common stock on the date of exercise and the exercise price of each option.
Upon the exercise of stock options, the Company issues new shares of common stock from its shares authorized and available for issuance. In October 2006, the Company announced a stock buyback plan, which ended on November 12, 2010. For further discussion, see Note 9 – SHAREHOLDERS’ EQUITY - Common Stock Buyback Plan.
General Restricted Stock Information
The following table sets forth the summary of restricted stock awards during the years ended December 31, 2010, 2009 and 2008:
| Shares of Restricted Stock |
Weighted Average Fair Value |
|||||||
| Outstanding, December 31, 2007 |
245,870 | $ | 12.25 | |||||
| Granted |
105,574 | 11.42 | ||||||
| Vested |
(32,460 | ) | 13.02 | |||||
| Outstanding, December 31, 2008 |
318,984 | 11.90 | ||||||
| Granted |
225,048 | 5.87 | ||||||
| Vested |
(32,464 | ) | 13.02 | |||||
| Forfeited |
(42,466 | ) | 10.99 | |||||
| Outstanding, December 31, 2009 |
469,102 | 9.01 | ||||||
| Granted |
378,801 | 6.45 | ||||||
| Vested |
(57,997 | ) | 12.03 | |||||
| Forfeited |
(49,688 | ) | 7.35 | |||||
| Outstanding, December 31, 2010 |
740,218 | 7.57 | ||||||
F-27
Table of Contents
Index to Financial Statements
Performance Shares
The following table sets forth the summary of performance shares during the year ended December 31, 2010:
| Performance Shares |
Weighted Average Fair Value |
|||||||
| Outstanding, December 31, 2009 |
— | — | ||||||
| Granted |
152,331 | $ | 6.41 | |||||
| Forfeited |
(7,898 | ) | 6.41 | |||||
| Outstanding, December 31, 2010 |
144,433 | 6.41 | ||||||
(11) EMPLOYEE BENEFIT PLANS
The Company provides retirement benefits through a defined contribution 401(k) plan (the “401(k) Plan”) established during 1994. All employees with at least three months of continuous service are eligible to participate and may contribute up to 60% of their compensation up to the annual limit set by the Internal Revenue Service. Employer matching contributions are discretionary, as defined in the 401(k) Plan, and are vested 20% for each year of service. Matching contributions accrued under this plan were approximately $203,000, $373,000 and $337,000 for the years ended December 31, 2010, 2009 and 2008, respectively.
(12) INCOME TAXES
The components of income tax provision for the years ended December 31, 2010, 2009 and 2008, are as follows (in thousands):
| 2010 | 2009 | 2008 | ||||||||||
| Current income tax provision: |
||||||||||||
| Federal |
$ | 4,968 | $ | 7,594 | $ | 17,515 | ||||||
| State |
(3,820 | ) | 1,274 | 2,348 | ||||||||
| 1,148 | 8,868 | 19,863 | ||||||||||
| Deferred income tax (benefit) provision: |
||||||||||||
| Federal |
1,001 | 1,444 | (394 | ) | ||||||||
| State |
204 | (33 | ) | (67 | ) | |||||||
| 1,205 | 1,411 | (461 | ) | |||||||||
| Total income tax provision |
$ | 2,353 | $ | 10,279 | $ | 19,402 | ||||||
F-28
Table of Contents
Index to Financial Statements
Deferred income tax assets (liabilities) are recorded when revenues and expenses are recognized in different periods for financial and income tax reporting purposes. The temporary differences that created deferred income tax assets (liabilities) are as follows as of December 31, 2010 and 2009 (in thousands):
| 2010 | 2009 | |||||||
| Deferred income tax assets: |
||||||||
| Net operating loss carryforwards |
$ | 111 | $ | 301 | ||||
| Deferred revenue and accrued liabilities |
328 | 461 | ||||||
| Reserves and allowances |
33 | 33 | ||||||
| Stock-based compensation |
1,990 | 1,469 | ||||||
| Other |
49 | 68 | ||||||
| Subtotal deferred income tax assets |
2,511 | 2,332 | ||||||
| Deferred income tax (liabilities): |
||||||||
| Property and equipment depreciation |
(1,256 | ) | (1,056 | ) | ||||
| Mark to market loss/(gain) |
(1,375 | ) | — | |||||
| Subtotal deferred income tax (liabilities) |
(2,631 | ) | (1,056 | ) | ||||
| Total deferred income tax (liabilities) assets, net |
$ | (120 | ) | $ | 1,276 | |||
In accordance with the Income Taxes Topic, deferred income tax assets should be reduced by a valuation allowance if it is more likely than not that some portion or all of the deferred income tax assets will not be realized. On a periodic basis, management evaluates and determines the amount of the valuation allowance required and adjusts such valuation allowance accordingly. There was no valuation allowance on the Company’s deferred income tax assets as of December 31, 2010 and 2009. On a periodic basis, management will continue to evaluate its remaining deferred income tax assets to determine if a valuation allowance is required.
As of December 31, 2010, for financial reporting purposes, the Company estimates that it had available for federal income tax purposes total net operating loss carryforwards of approximately $316,000. These net operating loss carryforwards expire in 2019. The Company utilized research and development tax credits of approximately $821,000, $376,000 and $282,000 during the years ended December 31, 2010, 2009 and 2008, respectively. The Company had income taxes receivable of $2.8 million and $971,000 as of December 31, 2010 and 2009, respectively.
The Income Taxes Topic also provides guidance on derecognition, measurement, classification, interest and penalties, accounting in interim periods, disclosure and transition. As required by the Income Taxes Topic, effective January 1, 2007, the Company evaluated its tax positions for which the statute of limitations remain open. The Company recognizes the financial statement benefit of a tax position only after determining that the relevant tax authority would more likely than not sustain the position following an audit. For tax positions meeting the more-likely-than-not threshold, the amount recognized in the consolidated financial statements is the largest benefit that has a greater than 50 percent likelihood of being realized upon ultimate settlement with the relevant tax authority. The Company had a liability for unrecognized tax benefits of $111,000 and $301,000 as of December 31, 2010 and 2009, respectively. If this tax benefit is recognized in the consolidated financial statements, it would not have a material impact to the Company’s annual effective income tax rate because the difference is temporary in nature. The Company does not anticipate any significant changes in uncertain tax positions over the next twelve months.
F-29
Table of Contents
Index to Financial Statements
A reconciliation of the difference between the expected income tax provision using the statutory federal tax rate (35% in 2010, 2009 and 2008) and the Company’s actual income tax provision is as follows (in thousands):
| 2010 | 2009 | 2008 | ||||||||||
| Income tax provision using statutory federal tax rate |
$ | 4,828 | $ | 9,124 | $ | 17,514 | ||||||
| State income tax provision, net of federal income tax benefit |
363 | 870 | 1,624 | |||||||||
| Permanent differences |
855 | 768 | 952 | |||||||||
| Benefit from state apportionment changes, net of federal income tax |
(2,659 | ) | — | — | ||||||||
| Research and development credits |
(821 | ) | (376 | ) | (282 | ) | ||||||
| Other, net |
(213 | ) | (107 | ) | (406 | ) | ||||||
| Total income tax provision |
$ | 2,353 | $ | 10,279 | $ | 19,402 | ||||||
As of December 31, 2010, the Company was subject to federal income taxes in the U.S. and income taxes in five states, and in the United Kingdom. Tax regulations within each jurisdiction are subject to the interpretation of the related tax laws and regulations and require significant judgment to be applied. In July 2009, the Company was notified by the Internal Revenue Service that it would undergo a routine U.S. federal tax examination for the 2007 fiscal year. In March 2010, the Company was notified that it would undergo a routine U.S. federal tax examination for the 2008 fiscal year and that it would undergo routine tax examinations by a state tax authority for the 2007 and 2008 fiscal years. In March 2011, the Company was notified that it will undergo a routine tax examination by another state authority for the 2007 through 2009 fiscal years. The U.S. federal tax examinations for the 2007 and 2008 fiscal years were completed with no significant adjustments. The examinations by one of the state tax authorities for the 2007 and 2008 fiscal years were completed with no adjustments. The Company is no longer subject to U.S. federal tax examinations or state and local tax examinations for periods prior to 2006.
Any interest and penalties, if incurred in connection with any income tax examination, would be recognized as components of income tax expense.
F-30
Table of Contents
Index to Financial Statements
(13) EARNINGS PER SHARE
Weighted average shares outstanding for the years ended December 31, 2010, 2009 and 2008 are calculated as follows (in thousands):
| 2010 | 2009 | 2008 | ||||||||||
| Weighted average shares outstanding - basic |
39,815 | 41,507 | 43,235 | |||||||||
| Impact of dilutive stock-based payments after applying the treasury stock method |
422 | 474 | 677 | |||||||||
| Weighted average shares outstanding - diluted |
40,237 | 41,981 | 43,912 | |||||||||
Stock options and non-vested restricted and performance shares of common stock outstanding for the years ended December 31, 2010, 2009 and 2008, which were not included in the calculation of diluted earnings per share because their weighted average effect would have been anti-dilutive, are as follows (in thousands):
| For the Year Ended December 31, |
||||||||||||
| 2010 | 2009 | 2008 | ||||||||||
| Stock options |
2,416 | 2,255 | 2,139 | |||||||||
| Restricted shares of common stock (non-vested) |
369 | 114 | 319 | |||||||||
| Performance shares of common stock (non-vested) |
126 | — | — | |||||||||
(14) COMPREHENSIVE INCOME
A reconciliation of net income to comprehensive income is as follows (in thousands):
| 2010 | 2009 | 2008 | ||||||||||
| Net income |
$ | 11,440 | $ | 15,790 | $ | 30,637 | ||||||
| Unrealized gain/(loss) on available for sale securities, net of tax |
(4 | ) | 5 | — | ||||||||
| Comprehensive income |
$ | 11,436 | $ | 15,795 | $ | 30,637 | ||||||
(15) NET CAPITAL REQUIREMENTS
TradeStation Securities is subject to the net capital requirements of the SEC’s Uniform Net Capital Rule (Rule 15c3-1), which is administered by the SEC and FINRA, and the CFTC financial requirement (Regulation 1.17 under the Commodity Exchange Act), which is administered by the CFTC and the NFA. Under these rules, TradeStation Securities calculates its net capital requirements using the “alternative method,” which requires the maintenance of minimum net capital, as defined by the rules, equal to the highest of: (i) $1,000,000; (ii) 8.0% of domestic and foreign domiciled customer and non-customer (excluding proprietary) risk maintenance margin/performance bond requirements for all domestic and foreign futures, options on futures contracts and cleared over-the-counter derivatives
F-31
Table of Contents
Index to Financial Statements
positions excluding the risk margin associated with naked long option positions; or (iii) 2.0% of aggregate customer debit balances. At December 31, 2010, TradeStation Securities had net capital of approximately $68.4 million (51% of aggregate debit items), which was approximately $65.6 million in excess of its required net capital of approximately $2.8 million. At December 31, 2009, TradeStation Securities had net capital of approximately $85.6 million (95% of aggregate debit items), which was approximately $83.8 million in excess of its required net capital of approximately $1.8 million.
(16) COMMITMENTS AND CONTINGENCIES
Restricted Cash
The Company had restricted cash of $478,000 and $717,000 as of December 31, 2010 and 2009, respectively, in support of a ten-year lease agreement for its corporate headquarters.
Operating Leases
The Company has a ten-year lease expiring in August 2012 (with two 5-year renewal options) that commenced in the summer of 2002 for an approximately 70,000 square foot corporate headquarters in Plantation, Florida. Rent escalations, free rent, and leasehold and other incentives are recognized on a straight-line basis over the initial term of this lease.
In addition to its corporate headquarters, the Company has seven non-cancelable operating leases for facilities with expirations ranging from June 2011 to February 2016. Future minimum lease payments as of December 31, 2010 under all operating leases are as follows (in thousands):
| 2011 |
$ | 5,788 | ||
| 2012 |
3,190 | |||
| 2013 |
492 | |||
| 2014 |
503 | |||
| 2015 |
415 | |||
| 2016 |
57 | |||
| $ | 10,445 | |||
During 2010, 2009 and 2008, total rent expense (which in the accompanying consolidated statements of income is included in occupancy and equipment and data centers and communications) was approximately $7.0 million, $5.5 million and $4.9 million, respectively.
Purchase Obligations
As of December 31, 2010, the Company had various purchase obligations through December 2014 of approximately $5.4 million as follows: $4.5 million during 2011; $792,000 during 2012; $69,000 during 2013 and $46,000 during 2014, related primarily to telecommunications services, software maintenance and back office systems. The Company recorded $4.3 million, $2.9 million and $2.8 million of expense associated with these purchase obligations (included in the accompanying consolidated statements of income) for the years ended December 31, 2010, 2009 and 2008, respectively.
F-32
Table of Contents
Index to Financial Statements
Litigation and Claims
On or about December 20, 2007, TradeStation Technologies was named as one of several defendants in a complaint filed in the United States District Court, Southern District of Texas, styled Amacker, et. al. v. Renaissance Asset Management (RAM), et. al. Other named defendants include Anthony Michael Ramunno, Man Financial Inc., MF Global, Inc., Lind-Waldock & Company, LLC, Vision, LP, Vision Financial Markets, LLC, R.J. O’Brien & Associates, Inc., and FXCM Holdings, LLC. The initial complaint alleged that over forty plaintiffs are entitled to damages because the plaintiffs were investors in a fraudulent commodity pool operated by Mr. Ramunno and RAM. The initial complaint alleged that TradeStation Technologies conducted trades on behalf of and at the request of Mr. Ramunno and RAM. The initial complaint attempted to allege the following claims: (i) violations of the Commodity Exchange Act and accompanying regulations; (ii) common law fraud under Texas law; (iii) statutory fraud under the Texas Business and Commerce Code; (iv) breach of fiduciary duties under Texas law; (v) negligent and intentional misrepresentations under Texas law; and (vi) negligence under Texas law. Plaintiffs filed a Second Amended Complaint that contained similar factual allegations and attempted to allege a single claim for aiding and abetting liability under the Commodity Exchange Act. The Second Amended Complaint asserted actual damages of at least $32.0 million. On October 10, 2008, the court dismissed the case for failure to state a claim upon which relief may be granted. On December 2, 2008, plaintiffs filed a notice of appeal with the United States Court of Appeals for the Fifth Circuit, and, on February 2, 2009, plaintiffs filed their Appellants’ Brief with that court. On March 6, 2009, TradeStation Technologies filed its Opposition Brief. Oral arguments on the appeal were held on September 2, 2009. No decision has yet been issued by the appeals court.
On or about February 9, 2010, TradeStation Securities and TradeStation Group were named as the only defendants in a complaint filed in the United States District Court, Northern District of Illinois, Eastern Division, styled Trading Technologies International, Inc. v. TradeStation Securities, Inc. and TradeStation Group, Inc. The complaint, as amended, alleges that TradeStation Securities and TradeStation Group have infringed and continue to infringe several patents held by Trading Technologies International, Inc. The plaintiff seeks a judgment enjoining the alleged infringement and awarding unspecified damages and costs. TradeStation Securities and TradeStation Group filed their answer on August 31, 2010 generally denying the allegations and asserting a variety of affirmative defenses. The FRCP Rule 26(a)(1) Initial Disclosures have been exchanged, and plaintiff’s Initial Infringement Contentions and Defendants’ Non-Infringement Contentions have been filed. Discovery has commenced and trial was initially scheduled for July 16, 2012, but will not go forward at that time because, on February 3, 2011, a Federal Judge granted Trading Technologies’ motion to consolidate 12 similar actions against various defendants, including the case against TradeStation Securities and TradeStation Group, into one case. On February 26, 2011, TradeStation filed a motion to de-consolidate itself. The case is scheduled for a status conference on February 28, 2011. At that conference, TradeStation was given permission by the judge to file a summary judgment motion that, in the Company’s opinion, seeks to eliminate the crux of the plaintiff’s claims. While it is too early to predict the outcome of this matter, management believes the case to be without merit.
In May 2010, TradeStation Securities was served with a CFTC reparations complaint in the case styled ATS Capital Management Corp. v. TradeStation Securities and John Sendlosky, CFTC Docket No. 10-R015. The complaint alleges the wrongful liquidation of two E-Mini futures positions, one in 2007 and the other in 2008, and seeks damages of $529,950. On September 2, 2010, the Administrative Law Judge dismissed the complaint with prejudice on the grounds that the identical case was decided in TradeStation Securities’ favor in a National Futures Association arbitration
F-33
Table of Contents
Index to Financial Statements
conducted in May 2009. On September 17, 2010, the complainant filed its Notice of Appeal to the Commodity Futures Trading Commission and the parties have since submitted their legal briefs and are awaiting a decision. While it is too early to predict the outcome of this matter, management believes the appeal to be without merit and intends to oppose it vigorously.
TradeStation Securities is also engaged in routine regulatory matters and civil litigation or other dispute resolution proceedings. The pending regulatory and other matters could ultimately result in censures, sanctions, fines, damage awards, settlement payments and/or other negative consequences.
While no assurances can be given, the Company does not believe that the ultimate outcome of any of the above legal matters or claims will result in a material adverse effect on its consolidated financial position, results of operations or cash flows.
The Company decided, as of June 1, 2002, to no longer carry errors or omissions insurance that covers third-party claims made by brokerage customers or software subscribers as a result of alleged human or system errors, failures, acts or omissions. This decision was made based upon the Company’s assessment of the potential risks and benefits, including significant increases in premium rates, deductibles and coinsurance amounts, reductions in available per occurrence and aggregate coverage amounts, and the unavailability of policies that sufficiently cover the types of risks that relate to the Company’s business. The Company recently reviewed this insurance with insurance agents and its view remains unchanged.
Management Continuity Agreements
In December 2005, the Company entered into a management continuity agreement with three of its executive officers, one of whom is no longer with the Company. Each management continuity agreement provides for potential severance payments during the 100-day period following a change in control, as that term is defined in the agreement, of an amount equal to up to two years of the executive’s annual compensation. The management continuity agreements do not commit the Company to retain any executive’s services for any fixed period of time, do not provide for severance payments unless the Company undergoes a change in control, and did not represent new hires or appointments. As of December 31, 2010, the aggregate potential severance payments under the management continuity agreements were approximately $1.0 million.
General Contingencies and Guarantees
In the ordinary course of business, there are various contingencies which are not reflected in the consolidated financial statements. These include customer activities involving the execution, settlement and financing or provision of leverage for various customer securities and futures transactions. These activities may expose the Company to off-balance sheet credit risk in the event the customers are unable to fulfill their contractual obligations.
In margin transactions, TradeStation Securities may be obligated for credit extended to its customers by TradeStation Securities or its clearing agents that is collateralized by cash and securities in the customers’ accounts. In connection with securities activities, TradeStation Securities also executes customer transactions involving the sale of securities not yet purchased (“short sales”), all of which are transacted on a margin basis subject to federal, self-regulatory organization and individual exchange regulations and TradeStation Securities’ and its clearing agents’ internal policies. New short sales rules have been imposed by regulatory authorities and more may be imposed in the near future.
F-34
Table of Contents
Index to Financial Statements
Additionally, TradeStation Securities may be obligated for credit extended to its customers by its clearing agents for futures transactions that are collateralized by cash and futures positions in the customers’ accounts. In all cases, such transactions may expose TradeStation Securities to significant off-balance sheet credit risk in the event customer collateral is not sufficient to fully cover losses that customers may incur. In the event customers fail to satisfy their obligations, TradeStation Securities may be required to purchase or sell financial instruments at prevailing market prices to fulfill the customers’ obligations.
TradeStation Securities seeks to manage the risks associated with its customers’ activities by requiring customers to maintain collateral in their margin and leveraged accounts in compliance with various regulatory requirements, internal requirements, and the requirements of clearing agents. TradeStation Securities and its clearing agents monitor required margin and leverage levels on an intra-day basis and, pursuant to such guidelines, require the customers to deposit additional collateral or to reduce positions when necessary. For further discussion, see Note 5 – RECEIVABLES FROM BROKERAGE CUSTOMERS.
TradeStation Securities loans securities temporarily to other broker-dealers in connection with its broker-dealer business. TradeStation Securities receives cash as collateral for the securities loaned. Increases in securities prices may cause the market value of the securities loaned to exceed the amount of cash received as collateral. In the event the counterparty to these transactions does not return the loaned securities, TradeStation Securities may be exposed to the risk of acquiring the securities at prevailing market prices in order to satisfy its client obligations. TradeStation Securities mitigates this risk by requiring credit approvals for counterparties, by monitoring the market value of securities loaned on a daily basis and requiring additional cash as collateral when necessary.
TradeStation Securities borrows securities temporarily from other broker-dealers in connection with its broker-dealer business. TradeStation Securities deposits cash as collateral for the securities borrowed. Decreases in securities prices may cause the market value of the securities borrowed to fall below the level of required collateral. In the event the counterparty to these transactions does not return the cash deposited, TradeStation Securities may be exposed to the risk of selling the securities at prevailing market prices. TradeStation Securities seeks to manage this risk by requiring credit approvals for counterparties, by monitoring the collateral values on a daily basis, and by requiring additional collateral as needed.
The customers’ financing and securities settlement activities may require TradeStation Securities and its clearing agents to pledge customer securities as collateral in support of various secured financing sources, which may include bank loans. In the event the counterparty is unable to meet its contractual obligation to return customer securities pledged as collateral, TradeStation Securities may be exposed to the risk of needing to acquire the securities at prevailing market prices in order to satisfy its obligations. TradeStation Securities seeks to manage this risk by monitoring the market value of securities pledged on a daily basis.
TradeStation Securities provides guarantees to its clearing organizations and exchanges under their standard membership agreements, which require members to guarantee the performance of other members. Under the agreements, if another member becomes unable to satisfy its obligations to the clearing organization or exchange, other members would be required to meet shortfalls. TradeStation Securities’ liability under these arrangements is not quantifiable. However, management believes that the possibility of TradeStation Securities being required to make payments under these arrangements is remote. Accordingly, no liability has been recorded for these potential events.
F-35
Table of Contents
Index to Financial Statements
(17) SEGMENT AND RELATED INFORMATION
For each of the three years in the period ended December 31, 2010, the Company operated in two principal business segments: (i) brokerage services and (ii) software products and services. The Company evaluates the performance of its segments based on revenue and income before income taxes. The brokerage services segment represents the operations of TradeStation Securities and the software products and services segment represents the operations of TradeStation Technologies. Intercompany transactions between segments are based upon an intercompany licensing and support agreement and an expense-sharing agreement, which reflect current business relationships and complies with applicable regulatory requirements. All significant intercompany transactions and balances have been eliminated in consolidation.
| For the Years Ended December 31, | ||||||||||||
| 2010 | 2009 | 2008 | ||||||||||
| (in thousands) | ||||||||||||
| Net revenues*: |
||||||||||||
| Brokerage services |
||||||||||||
| Revenues, excluding interest |
$ | 110,845 | $ | 119,871 | $ | 128,235 | ||||||
| Interest income |
10,351 | 5,864 | 25,174 | |||||||||
| Interest expense |
— | — | (3,166 | ) | ||||||||
| 121,196 | 125,735 | 150,243 | ||||||||||
| Software products and services |
||||||||||||
| Revenues, excluding interest |
65,712 | 61,888 | 54,875 | |||||||||
| Interest income |
78 | 93 | 763 | |||||||||
| 65,790 | 61,981 | 55,638 | ||||||||||
| Elimination of intercompany charges to brokerage services |
(58,014 | ) | (53,005 | ) | (45,449 | ) | ||||||
| $ | 128,972 | $ | 134,711 | $ | 160,432 | |||||||
F-36
Table of Contents
Index to Financial Statements
| As of or for the Years Ended December 31, | ||||||||||||
| 2010 | 2009 | 2008 | ||||||||||
| (in thousands) | ||||||||||||
| Income before income taxes: |
||||||||||||
| Brokerage services |
$ | (12,956 | ) | $ | (2,058 | ) | $ | 25,174 | ||||
| Software products and services |
26,749 | 28,127 | 24,865 | |||||||||
| $ | 13,793 | $ | 26,069 | $ | 50,039 | |||||||
| Income tax (benefit) provision: |
||||||||||||
| Brokerage services |
$ | (7,305 | ) | $ | (159 | ) | $ | 10,051 | ||||
| Software products and services |
9,658 | 10,438 | 9,351 | |||||||||
| $ | 2,353 | $ | 10,279 | $ | 19,402 | |||||||
| Identifiable assets: |
||||||||||||
| Brokerage services |
$ | 1,532,723 | $ | 980,147 | $ | 783,783 | ||||||
| Software products and services |
60,443 | 69,049 | 53,649 | |||||||||
| $ | 1,593,166 | $ | 1,049,196 | $ | 837,432 | |||||||
| Depreciation and amortization**: |
||||||||||||
| Brokerage services |
$ | 1,618 | $ | 1,018 | $ | 907 | ||||||
| Software products and services |
3,693 | 3,344 | 3,311 | |||||||||
| $ | 5,311 | $ | 4,362 | $ | 4,218 | |||||||
| Capital expenditures: |
||||||||||||
| Brokerage services |
$ | 1,854 | $ | 205 | $ | 482 | ||||||
| Software products and services |
13,774 | 5,055 | 3,285 | |||||||||
| $ | 15,628 | $ | 5,260 | $ | 3,767 | |||||||
| * | Revenues (all in U.S. dollars) derived from customers outside of the United States for the years ended December 31, 2010, 2009 and 2008 were approximately $19.3 million, $17.5 million, and $22.5 million, respectively. |
| ** | Depreciation expense for certain shared corporate assets held in software products and services is partially allocated to brokerage services. |
F-37
Table of Contents
Index to Financial Statements
(18) UNAUDITED QUARTERLY FINANCIAL INFORMATION
The following tables summarize selected unaudited quarterly financial data for the years ended December 31, 2010 and 2009 (in thousands, except earnings per share data).
| 2010 | ||||||||||||||||||||
| First Quarter |
Second Quarter |
Third Quarter |
Fourth Quarter |
Full Year |
||||||||||||||||
| Net revenues |
$ | 32,090 | $ | 38,369 | $ | 29,577 | $ | 28,936 | $ | 128,972 | ||||||||||
| Total expenses |
27,605 | 30,025 | 29,251 | 28,297 | 115,179 | |||||||||||||||
| Income before income taxes |
4,485 | 8,344 | 326 | 639 | 13,793 | |||||||||||||||
| Net income |
2,674 | 4,940 | 3,056 | 770 | 11,440 | |||||||||||||||
| Earnings per share: |
||||||||||||||||||||
| Basic |
$ | 0.07 | $ | 0.12 | $ | 0.08 | $ | 0.02 | $ | 0.29 | ||||||||||
| Diluted |
0.07 | 0.12 | 0.08 | 0.02 | 0.28 | |||||||||||||||
| Weighted average shares outstanding: |
||||||||||||||||||||
| Basic |
40,502 | 40,044 | 39,624 | 39,105 | 39,815 | |||||||||||||||
| Diluted |
40,940 | 40,508 | 39,996 | 39,523 | 40,237 | |||||||||||||||
| 2009 | ||||||||||||||||||||
| First Quarter |
Second Quarter |
Third Quarter |
Fourth Quarter |
Full Year |
||||||||||||||||
| Net revenues |
$ | 35,970 | $ | 35,198 | $ | 32,356 | $ | 31,187 | $ | 134,711 | ||||||||||
| Total expenses |
28,149 | 27,603 | 26,293 | 26,597 | 108,642 | |||||||||||||||
| Income before income taxes |
7,821 | 7,595 | 6,063 | 4,590 | 26,069 | |||||||||||||||
| Net income |
4,680 | 4,681 | 3,697 | 2,732 | 15,790 | |||||||||||||||
| Earnings per share: |
||||||||||||||||||||
| Basic |
$ | 0.11 | $ | 0.11 | $ | 0.09 | $ | 0.07 | $ | 0.38 | ||||||||||
| Diluted |
0.11 | 0.11 | 0.09 | 0.07 | 0.38 | |||||||||||||||
| Weighted average shares outstanding: |
||||||||||||||||||||
| Basic |
42,202 | 41,658 | 41,285 | 40,882 | 41,507 | |||||||||||||||
| Diluted |
42,561 | 42,210 | 41,792 | 41,361 | 41,981 | |||||||||||||||
F-38
Table of Contents
Index to Financial Statements
EXHIBIT INDEX
| Exhibit |
Description | |
| 3.1 | TradeStation Group’s Articles of Incorporation, as amended * | |
| 3.2 | TradeStation Group’s Bylaws * | |
| 4.1 | Form of Specimen Certificate for TradeStation Group’s Common Stock (incorporated by reference to Exhibit 4.1 to OnlineTrading.com Group, Inc.’s Amendment No. 3 to Registration Statement No. 333-34922 on Form S-4 filed with the Commission on November 21, 2000) | |
| 10.1 | onlinetradinginc.com corp. 1999 Stock Option Plan**# | |
| 10.2 | Window On WallStreet Inc. 1997 Long Term Incentive Plan**# | |
| 10.3 | TradeStation Group, Inc. Employee Stock Purchase Plan**# | |
| 10.4 | Amendment to TradeStation Group, Inc. Employee Stock Purchase Plan (incorporated by reference to Exhibit 10.4 to TradeStation Group’s Annual Report on Form 10-K for the fiscal year ended December 31, 2005) # | |
| 10.5 | TradeStation Group, Inc. Amended and Restated Incentive Stock Plan (incorporated by reference to Exhibit “B” to TradeStation Group’s Annual Proxy Statement dated April 28, 2006) # | |
| 10.6 | First Amendment to TradeStation Group, Inc. Amended and Restated Incentive Stock Plan ***# | |
| 10.7 | TradeStation Group, Inc. Amended and Restated Nonemployee Director Stock Option Plan (incorporated by reference to Exhibit 10.5 to TradeStation Group’s Annual Report on Form 10- K for the fiscal year ended December 31, 2001) # | |
| 10.8 | TradeStation Group, Inc. Amended and Restated Nonemployee Director Stock Option Plan effective as of March 8, 2007 ***# | |
| 10.9 | TradeStation Group, Inc. Amended and Restated Nonemployee Director Stock Option Plan effective as of June 2, 2009 (incorporated by reference to Exhibit 10.1 to TradeStation Group’s Quarterly Report on Form 10-Q for the quarter ended June 30, 2009)# | |
| 10.10 | TradeStation Group, Inc. Nonemployee Director Incentive Stock Plan effective as of June 1, 2010 (incorporated by reference to Exhibit “B” to TradeStation Group’s Annual Proxy Statement dated April 27, 2010) # | |
| 10.11 | First Amendment to TradeStation Group, Inc. Nonemployee Director Incentive Stock Plan (incorporated by reference to Exhibit 10.1 to TradeStation Group’s Quarterly Report on Form 10-Q for the quarter ended September 30, 2010) # | |
i
Table of Contents
Index to Financial Statements
| Exhibit |
Description | |
| 10.12 | Form of Nonemployee Director Restricted Stock Agreement (incorporated by reference to Exhibit 10.2 to TradeStation Group’s Quarterly Report on Form 10-Q for the quarter ended June 30, 2010) # | |
| 10.13 | Form of Executive Stock Option Agreement (utilized prior to February 2007) (incorporated by reference to Exhibit 10.1 to TradeStation Group’s Current Report on Form 8-K filed with the Commission on January 7, 2009)# | |
| 10.14 | Form of Executive Officer Stock Option Agreement (utilized since February 2007) ***# | |
| 10.15 | Restricted Stock Agreement, dated as of February 20, 2007, between TradeStation Group, Inc. and Salomon Sredni ***# | |
| 10.16 | Form of management continuity agreement, dated December 9, 2005, between TradeStation Group and each of the following executive officers: David H. Fleischman and Marc J. Stone (incorporated by reference to Exhibit 1 to TradeStation Group’s Current Report on Form 8- K filed with the Commission on December 12, 2005) # | |
| 10.17 | Restricted Stock Agreement, dated as of July 24, 2007, between TradeStation Group, Inc. and John Roberts (incorporated by reference to Exhibit 10.1 to TradeStation Group’s Quarterly Report on Form 10-Q for the quarter ended September 30, 2007)# | |
| 10.18 | Form of Restricted Stock Agreement, dated as of July 27, 2007, between TradeStation Group, Inc. and an executive officer (each of Marc J. Stone, David H. Fleischman and T. Keith Black) (incorporated by reference to Exhibit 10.2 to TradeStation Group’s Quarterly Report on Form 10-Q for the quarter ended September 30, 2007)# | |
| 10.19 | Form of Executive Restricted Stock Agreement (incorporated by reference to Exhibit 10.1 to TradeStation Group’s Quarterly Report on Form 10-Q for the quarter ended March 31, 2008)# | |
| 10.20 | Lease Agreement, dated November 13, 2001, between Crossroads Business Park Associates LLP and TradeStation Group, Inc. (without exhibits and schedules) (incorporated by reference to Exhibit 10.27 to TradeStation Group’s Annual Report on Form 10-K for the fiscal year ended December 31, 2001) | |
| 10.21 | Lease Agreement, dated as of November 22, 2010, between 233 S. Wacker LLC, Landlord, and TradeStation Securities, Inc., Tenant (filed herewith) | |
| 10.22 | Office/Showroom/Warehouse Lease Agreement dated June 12, 1996 between Springcreek Place Ltd. and Window On WallStreet Inc. (then | |
ii
Table of Contents
Index to Financial Statements
| Exhibit |
Description | |
| named MarketArts, Inc.), as amended by Addendum to Lease dated October 12, 1998, and as further amended by Addendum to Lease dated May 28, 1999 (incorporated by reference to Exhibit 10.13 to Omega Research, Inc.’s Annual Report on Form 10-K for the fiscal year ended December 31, 1999) | ||
| 10.23 | Modification and Ratification of Lease Agreement, dated July 25, 2002, between Springcreek Place Ltd. and TradeStation Technologies, Inc. (incorporated by reference to Exhibit 10.14 to TradeStation Group’s Annual Report on Form 10-K for the fiscal year ended December 31, 2002) | |
| 10.24 | Addendum, dated July 31, 2007, to Lease Agreement between TradeStation Technologies, Inc. (Tenant) and Springcreek Place, Ltd. (Landlord) dated June 12, 1996 and Amended on 10-12-98, 5-28-99 and 7-25-02 (incorporated by reference to Exhibit 10.18 to TradeStation Group’s Annual Report on Form 10-K for the fiscal year ended December 31, 2007) | |
| 10.25 | Agreement of Lease, dated December 14, 2009, between 400 Madison Avenue Owner, LLC (Landlord) and TradeStation Securities, Inc. (Tenant) (incorporated by reference to Exhibit 10.23 to TradeStation Group’s Annual Report on Form 10-K for the fiscal year ended December 31, 2009) | |
| 10.26 | Rule 10b5-1 agreement, dated November 9, 2006, between TradeStation Group, Inc. and Sandler O’Neil & Partners L.P. (incorporated by reference to Exhibit 10.1 to TradeStation Group’s Current Report on Form 8-K filed with the Commission on November 9, 2006) | |
| 10.27 | Asset Purchase Agreement, dated as of August 23, 2010, between TradeStation Technologies, Inc. and RINA Technologies, LLC (incorporated by reference to Exhibit 10.1 to TradeStation Group’s Current Report on Form 8-K filed with the Commission on August 23, 2010) | |
| 10.28 | Form of Non-Competition Agreement + | |
| 10.29 | Form of Indemnification Agreement + | |
| 21.1 | List of Subsidiaries (filed herewith) | |
| 23.1 | Consent of Ernst & Young LLP, Independent Registered Public Accounting Firm (filed herewith) | |
| 31.1 | Certification of Chief Executive Officer Pursuant to Rule 13a-14(a) or Rule 15d-14(a) of the Securities Exchange Act of 1934 (filed herewith) | |
| 31.2 | Certification of Chief Financial Officer Pursuant to Rule 13a-14(a) or Rule 15d-14(a) of the Securities Exchange Act of 1934 (filed herewith) | |
| 32.1 | Certification of Chief Executive Officer under 18 U.S.C. §1350 (filed herewith) | |
iii
Table of Contents
Index to Financial Statements
| Exhibit |
Description | |
| 32.2 | Certification of Chief Financial Officer under 18 U.S.C. §1350 (filed herewith) | |
| * | Previously filed as part of Registration Statement No. 333-34922 on Form S-4 of OnlineTrading.com Group, Inc. filed with the Commission on April 17, 2000. |
| ** | Previously filed as part of Registration Statement No. 333-53222 on Form S-8 of TradeStation Group, Inc. filed with the Commission on January 5, 2001. |
| *** | Previously filed as part of Form 10-K of TradeStation Group, Inc. for the fiscal period ended December 31, 2006 filed with the Commission on March 9, 2007. |
| + | Previously filed as part of Registration Statement No. 333-32077 on Form S-1 of Omega Research, Inc. filed with the Commission on July 25, 1997. |
| # | Indicates a management contract or compensatory plan or arrangement. |
iv