Attached files
| file | filename |
|---|---|
| EX-31.1 - Reis, Inc. | exhibit31-1.htm |
| EX-31.2 - Reis, Inc. | exhibit31-2.htm |
| EX-32.1 - Reis, Inc. | exhibit32-1.htm |
UNITED STATES SECURITIES AND EXCHANGE COMMISSION
Washington, DC 20549
FORM 10-K
 |
ANNUAL REPORT PURSUANT TO SECTION 13 OR 15(d) OF THE SECURITIES EXCHANGE ACT OF 1934
|
||
|
For the fiscal year ended December 31, 2010
|
|||
|
or
|
|||
 |
TRANSITION REPORT PURSUANT TO SECTION 13 OR 15(d) OF THE SECURITIES EXCHANGE ACT OF 1934
|
||
|
For the transition period from to .
|
|||
Commission File Number 001-12917
|
REIS, INC.
|
|
Maryland
|
13-3926898
|
|||
|
(State or Other Jurisdiction of Incorporation or Organization)
|
(I.R.S. Employer Identification No.)
|
|||
|
530 Fifth Avenue, New York, NY
|
10036
|
|||
|
(Address of Principal Executive Offices)
|
(Zip Code)
|
|
(212) 921-1122
|
||
|
(Registrant’s Telephone Number, Including Area Code)
|
|
Securities registered pursuant to Section 12(b) of the Act:
Title of Each Class
|
Name of Each Exchange on Which Registered
|
|||
|
Common Stock, $0.02 par value per share
|
The Nasdaq Market LLC
|
|
Securities registered pursuant to Section 12(g) of the Act:
None
|
||
|
Indicate by check mark if the Registrant is a well-known seasoned issuer, as defined in Rule 405 of the Securities Act. Yes
No Indicate by check mark if the Registrant is not required to file reports pursuant to Section 13 or Section 15(d) of the Act. Yes
No Indicate by check mark whether the Registrant (1) has filed all reports required to be filed by Section 13 or 15(d) of the Securities Exchange Act of 1934 during the preceding 12 months (or such shorter period that the Registrant was required to file such reports) and (2) has been subject to such filing requirements for the past 90 days. Yes
No Indicate by check mark whether the Registrant has submitted electronically and posted on its corporate web site, if any, every Interactive Data File required to be submitted and posted pursuant to Rule 405 of Regulation S-T during the preceding 12 months (or for such shorter period that the Registrant was required to submit and post such files). Yes
No Indicate by check mark if disclosure of delinquent filers pursuant to Item 405 of Regulation S-K is not contained herein, and will not be contained, to the best of Registrant’s knowledge, in definitive proxy or information statements incorporated by reference in Part III of this Form 10-K or any amendment to this Form 10-K.
Indicate by check mark whether the Registrant is a large accelerated filer, an accelerated filer, a non-accelerated filer, or a smaller reporting company. See the definitions of “large accelerated filer,” “accelerated filer” and “smaller reporting company” in Rule 12b-2 of the Exchange Act. (Check one):
|
| Large accelerated filer |
Accelerated filer |
Non-accelerated filer |
Smaller reporting company |
||
| (Do not check if a smaller reporting company) |
|
Indicate by check mark whether the Registrant is a shell company (as defined in Rule 12b-2 of the Act). Yes
No The aggregate market value of the voting and non-voting common equity held by non-affiliates of the Registrant was approximately $50,300,000 based on the closing price on the Nasdaq Global Market for such shares on June 30, 2010. (Please see “Calculation of Aggregate Market Value of Non-Affiliate Shares” within Item 5 of this report for a statement of assumptions upon which this calculation is based.)
The number of the Registrant’s shares of common stock outstanding was 10,587,748 as of March 10, 2011.
DOCUMENTS INCORPORATED BY REFERENCE
Portions of the Registrant’s definitive proxy statement for the 2011 annual stockholders’ meeting are incorporated by reference into Part III of this Annual Report on Form 10-K.
|
|
Item
No.
|
|
Page
No.
|
||||
| PART I | ||||||
|
1.
|
||||||
|
1A.
|
8 | |||||
|
1B.
|
16 | |||||
|
2.
|
17 | |||||
|
3.
|
17 | |||||
|
4.
|
17 | |||||
| PART II | ||||||
|
5.
|
18 | |||||
|
6.
|
19 | |||||
|
7.
|
20 | |||||
|
7A.
|
34 | |||||
|
8.
|
34 | |||||
|
9.
|
34 | |||||
|
9A.
|
34 | |||||
|
9B.
|
35 | |||||
| PART III | ||||||
|
10.
|
36 | |||||
|
11.
|
36 | |||||
|
12.
|
36 | |||||
|
13.
|
36 | |||||
|
14.
|
36 | |||||
| PART IV | ||||||
|
15.
|
37 | |||||
| FINANCIAL STATEMENTS | ||||||
| FINANCIAL STATEMENT SCHEDULES | ||||||
All schedules have been omitted because the required information for such schedules is not present, is not present in amounts sufficient to require submission of the schedule or because the required information is included in the consolidated financial statements.
PART I
Organization
Reis, Inc., which we refer to as either the Company or Reis, is a Maryland corporation. The Company’s primary business is providing commercial real estate market information and analytical tools for its subscribers, through its Reis Services subsidiary. For disclosure and financial reporting purposes, this business is referred to as the Reis Services segment.
Business
Reis Services
Reis Services, including its predecessors, was founded in 1980. Reis maintains a proprietary database containing detailed information on commercial properties in metropolitan markets and neighborhoods throughout the U.S. The database contains information on apartment, office, retail and industrial properties and is used by real estate investors, lenders and other professionals to make informed buying, selling and financing decisions. In addition, Reis data is used by debt and equity investors to assess, quantify and manage the risks of default and loss associated with individual mortgages, properties, portfolios and real estate backed securities. Reis currently provides its information services to many of the nation’s leading lending institutions, equity investors, brokers and appraisers.
Reis, through its flagship institutional product, Reis SE, and through its new small business product, ReisReports, provides online access to a proprietary database of commercial real estate information and analytical tools designed to facilitate debt and equity transactions as well as ongoing evaluations. Depending on the product, users have access to trend and forecast analysis at metropolitan and neighborhood levels throughout the U.S. and/or detailed building-specific information such as rents, vacancy rates, lease terms, property sales, new construction listings and property valuation estimates. Reis’s products are designed to meet the demand for timely and accurate information to support the decision-making of property owners, developers, builders, banks and non-bank lenders, and equity investors. These real estate professionals require access to timely information on both the performance and pricing of assets, including detailed data on market transactions, supply, absorption, rents and sale prices. This information is critical to all aspects of valuing assets and financing their acquisition, development and construction.
Reis’s revenue model is based primarily on annual subscriptions that are paid in accordance with contractual billing terms. Reis recognizes revenue from its contracts on a ratable basis; for example, one-twelfth of the value of a one-year contract is recognized monthly.
Industry Background
Commercial real estate asset values in the United States stabilized in 2010, in lockstep with the economy’s emergence from the recession. In a report released in January 2011, the Real Estate Roundtable estimates that commercial real estate values increased by 10.6% in 2010 to $5.2 trillion. By contrast, the Wilshire 5000, which approximates the total market capitalization of US equity markets, rose by 15.7% to $13.4 trillion in 2010.
Uneven recovery in commercial real estate space and capital markets mirrored relatively weak GDP growth of approximately 3% and moribund job creation during 2010. According to Reis data, office and retail vacancies remained at levels unseen since the early 1990s. Industrial vacancies are at a 30 year high. Apartment properties, on the other hand, benefited from declining homeownership rates, posting the strongest increase in occupied stock in 21 years. For property types that Reis covers, the volume of commercial real estate transactions increased by 61% from the fourth quarter of 2009 to the fourth quarter of 2010, but credit remains tight. The total volume of commercial real estate debt outstanding fell by approximately $184 billion from the third quarter of 2009 to the third quarter of 2010, according to the latest data from the Federal Reserve.
Varied participants in U.S. commercial real estate demand timely and accurate information to support all aspects of decision-making throughout the commercial real estate transaction lifecycle. These participants can range in size from the large domestic and international investment and financial institutions to individual real estate investors. Participants in the asset market, such as property owners, developers and builders, banks and non-bank lenders, and equity investors, require access to information on both the performance and pricing of assets, including detailed data on market transactions, supply and absorption. This information is critical to all aspects of valuing assets and financing their acquisition, development and construction. Additionally, brokers, operators and lessors require access to detailed information concerning current and historical rents, vacancies, concessions, operating expenses, and other market specific and property specific performance measures.
In recent years, corporate governance and other regulatory requirements (such as mark-to-market requirements, the Basel Capital Accord (Basel II and III), guidance from the Federal Reserve System, the Office of the Comptroller of the Currency, and the Federal Deposit Insurance Corporation (FDIC)) have increased the need for market and portfolio monitoring, generating demand for appropriate analytical tools. From mid 2008 to 2010, the commercial banking and investment banking industries have undergone a wave of mergers, reorganizations, FDIC-arranged takeovers and other dislocations, similar to the consolidations which occurred following the savings & loan collapses in the late 1980s and early 1990s. Looking towards the future, approximately $300 billion of commercial real estate debt will mature each year for the next decade. It is expected that replacement financing may not be readily available because of declines in values of the underlying real estate, tighter credit requirements and a significant reduction in the number of lenders willing to lend on commercial real estate. For those lenders who do extend credit, as well as for borrowers seeking commitments, the demand for accurate and timely information as well as access to analytics, valuation tools and support will be necessary to properly evaluate the underlying real estate collateral.
Operations
As commercial real estate markets have grown in size and complexity, Reis, over the last 30 years, has invested in the areas critical to supporting the information needs of real estate professionals in both the asset and space leasing markets. In particular, Reis has:
|
|
•
|
developed expertise in data collection across multiple markets and property types;
|
|
|
•
|
invested in the analytical expertise to develop decision support systems around property valuation, credit analytics, transaction support and risk management;
|
|
|
•
|
created product development expertise to collect market feedback and translate it into new products and reports; and
|
|
|
•
|
invested in a robust technology infrastructure to disseminate these tools to the wide variety of market participants.
|
These investments have established Reis as a leading provider of commercial real estate information and analytical tools to the investment community. Reis continues to develop and introduce new products, expand and add new markets and data, and find new ways to deliver existing information to meet and anticipate client demand, as more fully described below under “—Products and Services.” The depth and breadth of Reis’s data and expertise are critical in allowing Reis to grow its business.
Proprietary Databases
Reis’s commercial real estate databases contain information on competitive, income-producing properties in the U.S. apartment, retail, office and industrial sectors. On an ongoing basis, Reis conducts telephone surveys with building owners, leasing agents and managers to obtain key building performance statistics including, among others, occupancy rates, rents, rent discounts, free rent allowances, tenant improvement allowances, lease terms and operating expenses. In addition to its primary telephone surveys, Reis processes multiple other sources of data on commercial real estate including: public filings databases, tax assessor records, deed transfers, planning boards, and numerous local, regional and national publications and commercial real estate websites. Using proprietary statistical techniques, Reis screens and assembles large volumes of data into integrated supply and demand trends on a monthly basis at the neighborhood (submarket) and city (market) levels. All collected data are subjected to a rigorous quality assurance and validation process developed over many years. At the property level, surveyors compare the data collected in the current period with data previously collected on that property and similar properties, and if any unusual changes in rents and vacancies are identified, follow-up procedures are performed for verification or clarification of the results. All aggregate market data at the submarket and market levels are also subjected to comprehensive quality controls. The following table lists the number of metropolitan markets covered by Reis for each of four types of commercial real estate at December 31, 2010:
|
Number of metropolitan markets:
|
||||||
|
Apartment
|
200 | |||||
|
Retail
|
140 | |||||
|
Office
|
132 | |||||
|
Industrial
|
44 | |||||
At December 31, 2010, these metropolitan markets are further sub-divided into over 1,800 competitive submarkets based on property type.
In addition to the core property database, Reis develops and maintains a new construction database that identifies and monitors projects that are being added to our covered markets. Detailed tracking of the supply side of the commercial real estate market is
critical to projecting performance changes at the market and submarket levels. This database is updated weekly and reports relevant criteria such as project size, property type and location for projects that are planned, proposed, under construction, or nearing completion.
Reis also maintains a sales comparables database containing transactions over $2,000,000 in 203 of our covered markets. The database captures key information on each transaction such as buyer, seller, purchase price, capitalization rate and financing details, where available.
Products and Services
Reis SE, available through the www.reis.com web site, serves as a delivery platform for the thousands of reports containing Reis’s primary research data and forecasts, as well as a number of analytical tools. Access to Reis SE is by secure password only and can be customized to accommodate the needs of subscribers. For example, the product can be tailored to provide access to all or only selected markets, property types and report combinations. The Reis SE interface has been refined over the past several years to accommodate real estate professionals who need to perform market-based trend analysis, property specific research, comparable property analysis, and valuation and credit analysis estimates at the single property and portfolio levels.
On a monthly and quarterly basis, Reis updates thousands of neighborhood and city level reports that cover historical trends and current conditions. In all of the primary markets, five year forecasts are updated quarterly on all key real estate market indicators. Monthly and quarterly updates are supported by property, neighborhood and city data collected during the prior periods.
Reports are retrievable by street address, property type (apartment, office, retail and industrial) or market/submarket and are available as full color, presentation quality documents or in spreadsheet formats. These reports are used by Reis’s subscribers to assist in due diligence and to support commercial real estate transactions, including loan originations, underwriting, acquisitions, risk assessment (such as loan loss reserves and impairment analyses), portfolio monitoring and management, asset management, appraisal and market analysis.
Other significant elements of Reis SE include:
|
|
•
|
property comparables that allow users to identify buildings or new construction projects with similar characteristics (such as square footage, rents or sales price);
|
|
|
•
|
quarterly “First Glance” reports that provide an early assessment of the apartment, office and retail sectors across the U.S. and preliminary commentary on new construction activity;
|
|
|
•
|
“Quarterly Briefings” — two conference calls each quarter attended by hundreds of subscribers, during which Reis provides an overview of its latest high-level findings and forecasts for the commercial real estate space and capital markets;
|
|
|
•
|
real estate news stories chosen by Reis analysts to provide information relevant to a particular market and property type; and
|
|
|
•
|
customizable email alerts that let users receive proactive updates on only those reports and markets that they designate.
|
Reis continuously enhances Reis SE by developing new products and applications, and providing additional content. Recent examples include:
|
|
•
|
the February 2010 expansion of Reis’s custom research and advisory services, which enhances Reis’s ability to provide economic, market and investment advisory services, perform portfolio reviews, deliver custom data feeds, and conduct client-specific surveys of markets and property types that may not fall within the company’s standard coverage areas;
|
|
|
•
|
the September 2010 expansion of apartment market coverage, by 31 markets, increasing the total markets covered for apartment properties to 200 markets and increasing the number of markets where Reis tracks sales comparable information to 203 markets; and
|
|
|
•
|
the September 2010 publishing of market information on a monthly basis, in addition to our traditional quarterly reporting. Monthly information is available as a premium offering for Reis subscribers.
|
During 2010, Reis completed the development of and launched a product tailored to the needs of smaller enterprises and individuals, professional investors, brokers and appraisers, which we refer to as ReisReports, available at www.reisreports.com. ReisReports
utilizes the same proprietary database of information that supports our Reis SE subscribers. Depending on the package chosen by the ReisReports subscriber, a set number of market reports is available on a monthly basis at an affordable price point.
Reis continues to develop new products and applications. Current initiatives include (1) further expansion of both our geographic market coverage and property types, (2) data redistribution relationships with other business information vendors, including the recently announced agreements with FactSet and Capital IQ and (3) an expansion of our sales comparables database for an additional property type and to include property transactions below $2,000,000.
Cost of Service
Reis’s data is made available in five primary ways: (1) annual and multi-year subscriptions to Reis SE, (2) capped subscriptions allowing subscribers to download a limited retail value of reports, (3) online single report credit card purchases, (4) custom data requests and (5) monthly subscriptions to ReisReports, charged to a credit card. Annual subscription fees for Reis SE range from $1,000 to over $1,000,000 depending upon the subscribers line of business, and the combination of markets, property types and reports subscribed to, for which the subscriber is typically allowed to download an unlimited number of reports over a 12-month period. Capped subscriptions generally range from $1,000 to $25,000 and allow clients to download a fixed retail value of reports over a 12-month period. Sales of individual reports typically range from $150 to $695 per report and are available to anyone who visits Reis’s retail web site or contacts Reis via telephone, fax or email. However, certain reports are only available by a subscription or capped subscription account. Custom data deliverables range in price from $1,000 for a specific data element to hundreds of thousands of dollars for custom portfolio valuation and credit analysis. Renewals are negotiated in advance of the expiration of an existing contract. Important factors in determining contract renewal rates include a subscriber’s historical and projected report consumption. The monthly fee for ReisReports is currently $75 or $125 depending on the package chosen by the subscriber.
Subscribers
At December 31, 2010, Reis had approximately 690 companies under signed contracts for its core Reis SE product offerings. Generally, each subscribing company has multiple users entitled to access Reis SE. These numbers do not include users who pay for individual reports by credit card, nor do they include subscribers to our ReisReports product.
The majority of our subscription revenues derive from banks, other financial institutions, investment funds, equity owners and regulators, with the remainder from service providers, including brokers and appraisers.
Customer Service and Training
Reis focuses intensively on proactive training and customer support. Reis’s dedicated customer service team offers customized on-site training and web-based and telephonic support, as well as weekly web-based training seminars open to all Reis SE subscribers. The corporate training team also meets regularly with a large proportion of Reis’s subscribers. Additional points of subscriber contact include mid-year service reviews, a web-based subscriber feedback program and account manager visits. All of these contacts are used to assist subscribers with their utilization of Reis SE to identify opportunities for product adoption and increased usage and to solicit subscriber input for future product enhancements.
Proprietary Rights
To protect our proprietary rights, we rely upon a combination of:
|
|
▪
|
trade secret, copyright, trademark, database protection and other laws at the Federal, state and local levels;
|
|
|
▪
|
non-disclosure, non-competition and other contractual provisions with employees, vendors and consultants;
|
|
|
▪
|
restrictive license agreements with subscribers; and
|
|
|
▪
|
other technical measures.
|
We protect our software’s source code and our database as either trade secrets or under copyright law. We license our services under license agreements that restrict the disclosure and use of our proprietary information and prohibit the unauthorized reproduction, re-engineering or transfer of the information in our products and services.
We also protect the secrecy of our proprietary database, our trade secrets and our proprietary information through confidentiality and noncompetition agreements with our employees, vendors and consultants. Our services also include technical measures designed to deter and detect unauthorized copying of our intellectual property.
We have registered the trademarks for “Reis,” the Reis logo and “Your Window Onto the Real Estate Market.”
Competition
Real estate transactions involve multiple participants who require accurate historical and current market information. Key factors that influence the competitive position of commercial real estate information vendors include: the depth and breadth of underlying databases; price; ease of use, flexibility and functionality of the software; the ability to keep the data up to date and accurate; frequency of reporting; scope of coverage by geography and property type; customer training and support; adoption of the service by industry leaders; consistent product innovation; and recognition by general business and trade media.
Reis’s senior management believes that, on a national level, only a small number of firms serve the property information needs of commercial real estate investors and lenders. Reis competes directly and indirectly for subscribers with online services or web sites targeted to commercial real estate professionals such as CoStar Group, Inc. (or CoStar) (including its Property and Portfolio Research business), Real Capital Analytics, Inc., CBRE Econometric Advisors, a wholly-owned subsidiary of CB Richard Ellis and formerly known as Torto Wheaton Research, and LoopNet, Inc., as well as with in-house real estate research departments.
Residential Development Activities
The Company was originally formed on January 8, 1997. Reis acquired the Reis Services business by merger in May 2007, which we refer to as the Merger. Prior to May 2007, Reis operated as Wellsford Real Properties, Inc., which we refer to as Wellsford. Wellsford’s primary operating activities immediately prior to the Merger were the development, construction and sale of its three residential projects and its approximate 23% ownership interest in the Reis Services business. The Company completed the sale of the remaining units at its Colorado project in September 2009 and sold its Claverack, New York project in February 2010.
At December 31, 2010, the Company’s residential development activities were comprised solely of The Orchards, a single family home development in East Lyme, Connecticut, upon which the Company could build 161 single family homes on 224 acres, which we refer to as East Lyme. An aggregate of 42 homes and lots (29 homes and 13 lots) were sold as of December 31, 2010. At December 31, 2010, the remaining East Lyme inventory included 119 lots. The Company is working with a broker to sell the remaining 119 lots in one or more bulk sale transactions. There can be no assurance that the Company will be able to sell the remaining 119 lots in one or more bulk transactions at acceptable prices, or within a specific time period, or at all. None of the Company’s remaining real estate is encumbered by debt.
Additional Segment Financial Information
See Note 3 of the consolidated financial statements included in this filing for additional information regarding all of the Company’s segments.
Corporate Information
The Company’s executive offices are located at 530 Fifth Avenue, Fifth Floor, New York, New York 10036; telephone: (212) 921-1122; web site: www.reis.com; email: investorrelations@reis.com.
To access investor relations information and the Company’s other documents filed with the Securities and Exchange Commission, or SEC, visit www.reis.com. Copies of our most recent annual report on Form 10-K, any later filed quarterly reports on Form 10-Q and current reports on Form 8-K, as well as any amendments thereto, are available on our website, as soon as reasonably practicable after we electronically file such material with, or furnish it to, the SEC. Please note that information on the Company’s web site is not part of this Form 10-K filing.
The Company had 142 employees as of December 31, 2010.
Cautionary Statement Regarding Forward-Looking Statements
This annual report on Form 10-K contains “forward-looking statements” within the meaning of the U.S. Private Securities Litigation Reform Act of 1995. These forward-looking statements may relate to the Company’s or management’s outlook or expectations for
earnings, revenues, expenses, asset quality, or other future financial or business performance, strategies, prospects or expectations, or the impact of legal, regulatory or supervisory matters on our business, operations or performance. Specifically, forward-looking statements may include:
|
|
•
|
statements relating to future services and product development of the Reis Services segment;
|
|
|
•
|
statements relating to future sales of the Company’s remaining real estate assets;
|
|
|
•
|
statements relating to future business prospects, potential acquisitions, revenue, expenses, income (loss), cash flows, valuation of assets and liabilities and other business metrics of the Company and its businesses, including EBITDA, Adjusted EBITDA and Aggregate Revenue Under Contract; and
|
|
|
•
|
statements preceded by, followed by or that include the words “estimate,” “plan,” “project,” “intend,” “expect,” “anticipate,” “believe,” “seek,” “target” or similar expressions relating to future periods.
|
Forward-looking statements reflect management’s judgment based on currently available information and involve a number of risks and uncertainties that could cause actual results to differ materially from those in the forward-looking statements. With respect to these forward-looking statements, management has made certain assumptions. Future performance cannot be assured. Actual results may differ materially from those contemplated by the forward-looking statements. Some factors that could cause actual results to differ include:
|
|
•
|
revenues may be lower than expected;
|
|
|
•
|
inability to retain and increase the Company’s subscriber base;
|
|
|
•
|
additional adverse changes in the real estate industry and the local market in which the Company owns property;
|
|
|
•
|
inability to dispose of our remaining residential real estate property at expected prices or at all;
|
|
|
•
|
inability to execute properly on new products and services, or failure of subscribers to accept these products and services;
|
|
|
•
|
competition;
|
|
|
•
|
inability to attract and retain sales and senior management personnel;
|
|
|
•
|
difficulties in protecting the security, confidentiality, integrity and reliability of the Company’s data;
|
|
|
•
|
changes in accounting policies or practices;
|
|
|
•
|
legal and regulatory issues; and
|
|
|
•
|
the risk factors listed under “Item 1A. Risk Factors” of this annual report on Form 10-K.
|
You are cautioned not to place undue reliance on any forward-looking statements, which speak only as of the date of this annual report on Form 10-K. Except as required by law, the Company undertakes no obligation to publicly update or release any revisions to these forward-looking statements to reflect any events or circumstances after the date of this annual report on Form 10-K or to reflect the occurrence of unanticipated events.
The following is a discussion of the risk factors that Reis’s management believes are material to Reis at this time. These risks and uncertainties are not the only ones facing Reis and there may be additional matters that Reis is unaware of or that Reis currently considers immaterial. Any or all of these could adversely affect Reis’s business, results of operations, financial condition and cash flows.
Risk Factors Relating to Reis Generally
Our common stock is thinly traded and there may continue to be little or no liquidity for shares of our common stock.
Historically, our common stock has been thinly traded and an active trading market for our common stock may not develop. In the absence of an active public trading market, investors trying to sell their shares may find it difficult to find buyers for their shares at prices quoted in the market or at all.
Our Board may authorize transactions with respect to our common stock. These transactions may include a reverse stock split or odd-lot or other share repurchase programs. Between December 2008 and June 2010, our Board authorized the repurchase of an aggregate of $4,000,000 of our common stock. These repurchases, which were completed in December 2010, resulted in the repurchase of 7.6% of our outstanding shares. All decisions regarding any such transactions will be at the discretion of our Board and will be evaluated from time to time by the Board in light of the price per share of our common stock, the number of shares of our common stock outstanding, applicable Nasdaq rules, applicable law and other factors that our Board deems relevant. If we effect any such transaction, the liquidity of our common stock could be adversely affected by the reduced number of shares that would be outstanding after the transaction. In addition, a share repurchase program requires the payment of cash by Reis to stockholders, which could adversely impact our liquidity. If we effect a reverse stock split, there can be no assurance that the market price per share of our common stock after the reverse stock split will rise or remain constant in proportion to the reduction in the number of shares of our common stock outstanding before the reverse stock split.
Our executive officers and directors own a significant percentage of our stock and have significant control of our management and affairs, and they may take actions which may not be in the best interest of other stockholders.
The executive officers and directors of Reis in the aggregate beneficially owned approximately 27.7% of Reis’s outstanding common stock as of December 31, 2010. Of this total, Lloyd Lynford and Jonathan Garfield, each of whom is an executive officer and a director of the Company, beneficially owned 11.4% and 7.7%, respectively. This significant concentration of share ownership may adversely affect the trading price of our common stock because investors may perceive disadvantages in owning stock in companies where management holds a significant percentage of the voting power. This concentration of ownership may have the effect of delaying or preventing a change of control, including a merger, consolidation or other business combination involving Reis, or discouraging a potential acquirer from making a tender offer or otherwise attempting to obtain control, even if such a change of control might be seen as beneficial to other Reis stockholders.
Our business depends on retaining and attracting capable management and operating personnel.
The implementation and development of Reis’s business plan require the skills and knowledge of our senior executives, sales, technology and operational personnel. Reis may not be able to offset the impact of the loss of the services of these individuals or other key officers or employees because its business requires skilled management, as well as technical, product and technology, and sales and marketing personnel, who are in high demand and are often subject to competing offers. Competition for qualified employees is intense in the information industry, and the loss of a substantial number of qualified employees, or an inability to attract, retain and motivate additional highly skilled employees could have a material adverse impact on Reis.
Although Reis uses various incentive programs to retain and attract key personnel, these measures may not be sufficient to either attract or retain, as applicable, the personnel required to ensure our success. In addition, issuances pursuant to our incentive plans may result in dilution to Reis stockholders.
The loss of one or more of our senior executives, sales, technology and operational personnel could have a material adverse impact on the continuing operations of Reis and could adversely affect the market price of Reis’s common stock.
Our governing documents and Maryland law contain anti-takeover provisions that may discourage acquisition bids or merger proposals, which may adversely affect the market price of our common stock.
Reis’s articles of amendment and restatement contain provisions designed to discourage attempts to acquire control of Reis by merger, tender offer, proxy contest, or removal of incumbent management without the approval of our Board. These provisions may make it more difficult or expensive for a third party to acquire control of Reis even if a change of control might be seen as beneficial by other Reis stockholders. This could discourage potential takeover attempts and could adversely affect the market price of Reis’s common stock. Reis’s governing documents:
|
|
•
|
provide for a classified board of directors, which could discourage potential acquisition proposals and could delay or prevent a change of control; and
|
|
|
•
|
authorize the issuance of blank check stock that could be issued by Reis’s Board to thwart a takeover attempt.
|
In addition, under Maryland law, certain “business combinations” (including certain issuances of equity securities) between a Maryland corporation and any person who beneficially owns 10% or more of the voting power of the corporation’s shares or an affiliate thereof are prohibited for five years after the most recent date on which the interested stockholder becomes an interested stockholder, unless waived by the then existing board. The Board may approve certain transactions or exempt certain interested stockholders at any time prior to a party becoming an interested stockholder. At the time of Wellsford’s initial public offering in 1997, the Board exempted from the Maryland statute any business combinations with Jeffrey Lynford (a director and a 5% stockholder of the Company), Edward Lowenthal (chairman of the Board), or any of their respective affiliates or any other person acting in concert or as a group with any of such persons, and, consequently, the five-year prohibition and the supermajority vote requirements will not apply to business combinations between such persons and Reis.
Increases in interest rates could materially increase our interest expense.
As of December 31, 2010, we had approximately $11,222,000 of variable rate debt outstanding. During the year ended December 31, 2010, the interest rate on our debt was LIBOR + 1.50% and ranged from a low of 1.74% to a high of 1.87% during the year, based upon changes in the 30 day LIBOR. The 30 day LIBOR was 0.26% at December 31, 2010.
We may incur additional variable rate indebtedness in the future. Accordingly, if interest rates increase, so will our interest costs, which may have a material adverse effect on our business, results of operations, cash flows and financial condition. Through June 30, 2010, we limited our exposure to significant interest rate increases on $15,000,000 of our then existing variable rate debt by purchasing an interest rate cap as required by our Bank Loan. In deciding whether to purchase interest rate caps or other hedging instruments, we weigh the value of protection against significant increases in interest rates against the cost of such instruments. Based on the December 31, 2010 debt balance, a 1% increase in the base interest rate on our variable rate debt would result in approximately $112,000 of additional interest being incurred on an annualized basis. The interest rate cap expired at June 30, 2010.
Declines in operational performance could cause financial covenants to be violated on our outstanding debt.
Provisions in the Bank Loan impose restrictions on Reis Services’s ability to, among other things:
|
|
•
|
incur additional debt;
|
|
|
•
|
amend its organizational documents;
|
|
|
•
|
pay for public company costs;
|
|
|
•
|
pay dividends and make distributions to the Company;
|
|
|
•
|
redeem or repurchase outstanding equity;
|
|
|
•
|
make certain investments;
|
|
|
•
|
create certain liens;
|
|
|
•
|
enter into transactions with stockholders and affiliates;
|
|
|
•
|
undergo a change of control; and
|
|
|
•
|
make certain fundamental changes, including engaging in a merger or consolidation.
|
The credit agreement also contains other customary covenants, including covenants which require Reis Services to meet specified financial ratios and financial tests. If Reis Services were not able to comply with these covenants in the future, the failure to do so may result in the declaration of an event of default. Furthermore, certain events, such as the delisting of our common stock from a national stock exchange or the voluntary or involuntary filing by Reis under any bankruptcy, insolvency or similar law (which is not stayed or dismissed within certain time periods), will cause an event of default. In addition, an event of default, if not cured or waived, may
result in the acceleration of the maturity of indebtedness outstanding under these agreements, which would require Reis Services to pay all amounts outstanding. If an event of default occurs, Reis Services may not be able to cure it within any applicable cure period, if at all. If the maturity of this indebtedness is accelerated, Reis Services or Reis may not have the ability to borrow or obtain sufficient funds to replace the accelerated indebtedness on terms acceptable to us, or at all. In particular, the interest rate under the Bank Loan is significantly lower than the interest rate the Company would likely be able to obtain on new financing. Furthermore, the Bank Loan is secured by Reis Services’s assets and, therefore, these assets would not be available to secure additional credit. At December 31, 2010, the Company’s consolidated cash and cash equivalents balance aggregated approximately $20,164,000, including approximately $15,912,000 in the Reis Services segment, and the outstanding balance of the Bank Loan was approximately $11,222,000.
Our ability to use our net tax operating loss carryforwards will be subject to limitation and could be eliminated.
The Company has aggregate NOL carryfowards aggregating approximately $40,400,000 at December 31, 2010. These NOLs include NOLs generated subsequent to the Merger, losses from Private Reis prior to the Merger, losses obtained from the Company’s 1998 merger with Value Property Trust (“VLP”) and the Company’s operating losses prior to the Merger. Approximately $27,300,000 of these NOLs are subject to an annual limitation, whereas $13,100,000 are not subject to such a limitation.
Generally, a change of more than 50% in the ownership of a corporation’s stock, by value, over a three-year period constitutes an ownership change under Section 382 of the Internal Revenue Code of 1986, as amended, which we refer to as the Code. In general, Section 382 imposes an annual limitation on a corporation’s ability to use its net operating losses, or NOLs, from taxable years or periods ending on or before the date of an ownership change to offset U.S. Federal taxable income in any post-change year. The historic Wellsford business experienced such an ownership change as a result of the May 2007 merger and the pre-change NOLs of the historic Wellsford business are subject to the limitation under Section 382. The Section 382 annual limitation on our use of the historic Wellsford NOLs is approximately $2,779,000 per year through 2027.
Moreover, if a corporation experiences an ownership change and does not satisfy the continuity of business enterprise, or COBE, requirement (which generally requires that the corporation continue its historic business or use a significant portion of its historic business assets in a business for the two year period beginning on the date of the ownership change), it cannot, subject to certain exceptions, use any NOL from a pre-change period to offset taxable income in post-change years. Although there can be no assurance that this requirement was definitively met within the two year period subsequent to the May 2007 Merger, with respect to the ownership change effected by the May 2007 Merger, our management believes there is a tax return basis for stating that the COBE requirements were met through the required two year period subsequent to the ownership change.
We have NOL carryforwards, for Federal income tax purposes, resulting from Wellsford’s merger with VLP in 1998 and operating losses in 2004, 2006 and 2007 (prior to the Merger). Assuming we are able to satisfy the COBE requirement described above, we would have approximately $27,300,000 of NOLs at December 31, 2010, which expire from 2017 through 2027 (approximately $5,500,000 of NOLs expire in 2017). The actual ability to utilize the tax benefit of any existing NOLs will be subject to future facts and circumstances with respect to meeting the above described COBE and annual limitation requirements at the time NOLs are being utilized on a tax return. Realization of the Wellsford NOLs does not meet the criteria under GAAP for financial statement recognition, and accordingly, no asset and valuation allowance related thereto has been reflected in the Company’s consolidated financial statements. The Company has utilized an aggregate of approximately $5,800,000 of these NOLs in its Federal tax return filings for 2008 and 2009, with appropriate disclosure.
In addition, the Company and Private Reis have additional NOL carryforwards aggregating approximately $13,100,000 (which amount is also net of approximately $5,800,000 of utilized NOLs in 2008 and 2009) at December 31, 2010, expiring in the years 2019 to 2030 which are not subject to an annual limitation. These losses may be utilized against consolidated taxable income, all of which amount is available for use for financial statement reporting purposes at December 31, 2010.
Risk Factors Relating to Our Commercial Real Estate Information Services Business
A failure to attract and retain subscribers could harm our business.
We must acquire new subscribers and expand our business with our current subscribers in order to grow our business. Our ability to grow our business will be adversely impacted to the extent that current subscribers reduce or discontinue the use of Reis SE, or if we are unable to locate and have prospects subscribe to Reis SE. This may occur due to budgetary constraints, which was particularly true during the economic downturn that began in 2008, or if our product offering is less competitive with those of other companies in our industry. Prior to the economic downturn in 2008, our overall trailing twelve month renewal rates were above 94% for many years. In the latter part of 2008 and in 2009, we experienced an overall decrease in the total number of our subscribers and a reduction in our trailing twelve month renewal rates. The overall trailing twelve month renewal rate hit its low point of 83% at September 30, 2009
and has shown steady improvements since that date through December 31, 2010 as the overall trailing twelve month renewal rate was 91% at December 31, 2010. There can be no assurance that we will be successful in continuing to identify and sell to additional subscribers, expand business from our existing subscribers and experience continuing improvements in our renewal rates to pre-recession levels.
Our revenues are concentrated among certain key subscribers.
Our commercial real estate information services business had approximately 690 subscribers at December 31, 2010. The largest subscriber accounted for 2.5% of Reis Services revenues for the year ended December 31, 2010. If we were to experience a reduction or loss of business from a number of our largest subscribers, it could have a material adverse effect on our revenues and, depending on the significance of the loss, our financial condition, cash flows and profitability. In addition, although we generally impose contractual restrictions limiting our immediate exposure to revenue reductions due to mergers and consolidations and our pricing model is based on actual and projected usage, we may be impacted by consolidation among our subscribers and potential subscribers, as a result of their reduced usage on a combined basis or greater bargaining power.
We may be unable to compete successfully with our current or future competitors.
We have competition from (i) local companies that prepare commercial real estate research with respect to their specific geographic areas and (ii) national companies that prepare national commercial real estate research. Specifically, certain of our products compete with those of CoStar (including its Property and Portfolio Research business), Real Capital Analytics, CBRE Econometric Advisors and LoopNet. Some of our competitors, either alone or with affiliated entities, may have greater access to resources than we do. Competition could negatively impact our revenues and profitability.
We may not be able to grow revenue and increase profitability in our commercial real estate information services business.
Our revenue growth slowed during the latter part of 2008 and we experienced revenue declines on a consecutive quarter basis during the first three quarters of 2009. Revenue stabilized at just over $6,000,000 for each of the first three quarters of 2010 and there was growth in the fourth quarter of 2010 to approximately $6,167,000. There can be no assurance that our revenues will grow in the future.
During 2009, we were able to maintain our EBITDA (which is GAAP net income, before interest, taxes, depreciation and amortization) margins in the low to mid 40% range in the Reis Services business. This was achieved through cost control measures initiated in the fourth quarter of 2008 and in place throughout 2009. In 2010, our margins slipped below 40%, primarily attributable to increased spending for product development and enhancement initiatives. We may continue to incur additional expenses, such as marketing and product development expenses, with the expectation that it will result in revenue growth in the future; however, such additional expenses will likely result in reduced profitability or margins or negatively impact liquidity in the near term, and if not successful, may negatively impact margins and liquidity in the long term. In particular, during 2011, we have budgeted additional spending on our new product initiatives, including ReisReports, and this spending is expected to reduce our margins, at least in the first half of 2011. There can be no assurance that we will be able to maintain or grow EBITDA or EBITDA margins in the future.
We must continue to obtain information from multiple sources.
The quality of Reis SE depends substantially on information provided by a large number of sources, including commercial real estate brokers, agents and property owners, as well as from public sources, such as tax assessors, deed reporters, planning and zoning boards, corporate websites, the business and trade press, and selected third party vendors of business information. If a significant number of these sources choose not to continue providing information to us, our product could be negatively affected, potentially resulting in an increase in subscriber cancellations and a failure to acquire new subscribers.
Our revenues, expenses and operating results could be affected by general economic conditions or by changes in commercial real estate markets, which are cyclical.
Our business is sensitive to trends in the general economy and trends in local, regional and national commercial real estate markets, which are unpredictable. Therefore, operating results, to the extent they reflect changes in the broader commercial real estate industry, may be subject to significant fluctuations. A number of factors could have an effect on our revenues, expenses, operating results or cash flows, such as:
|
|
•
|
periods of economic slowdown or recession in the U.S. or locally;
|
|
|
•
|
budgetary and financial burdens on our subscribers and potential subscribers;
|
|
|
•
|
merger, acquisition, failure or government takeover of our subscribers and potential subscribers;
|
|
|
•
|
governmental intervention in economic policy;
|
|
|
•
|
inflation;
|
|
|
•
|
flows of capital into or out of real estate investment in the U.S. or various regions of the U.S.;
|
|
|
•
|
changes to the manner in which transactions are financed;
|
|
|
•
|
changes in the risk profile of real estate assets and collateral for financings;
|
|
|
•
|
changes in levels of rent or appreciation of asset values;
|
|
|
•
|
changing interest rates;
|
|
|
•
|
tax and accounting policies;
|
|
|
•
|
the cost of capital;
|
|
|
•
|
costs of construction;
|
|
|
•
|
increased unemployment;
|
|
|
•
|
lower consumer confidence;
|
|
|
•
|
lower wage and salary levels;
|
|
|
•
|
war, terrorist attacks or natural disasters; or
|
|
|
•
|
the public perception that any of these conditions may occur.
|
If our subscribers choose not to use Reis SE because of any of these factors, and we are not successful in attracting new subscribers, our revenues, expenses, operating results, cash flows or stock price could be negatively affected.
Our success depends on our ability to introduce new or upgraded services or products.
To continue to attract new subscribers, we may need to introduce new products or services. We may choose to develop new products and services independently or to license or otherwise integrate content and data from third parties. The introduction of new products and services could impose costs on our business and require the use of resources, and there is no guarantee that we will continue to be able to access new content and technologies on commercially reasonable terms or at all. If subscribers or potential subscribers do not recognize the value of our new services or enhancements to existing services, operating results could be negatively affected. We may incur significant costs and experience difficulties in developing and delivering these new or upgraded services or products.
Efforts to enhance and improve the ease of use, responsiveness, functionality and features of our existing and newly developed products and services have inherent risks, and we may not be able to manage these product developments and enhancements successfully or in a cost effective manner. If we are unable to continue to develop new or upgraded services or products, then subscribers may choose not to use our products and services. Our growth would be negatively impacted if we were unable to successfully market and sell any new services or upgrades.
If we fail to protect confidential information against security breaches, or if subscribers are reluctant to use products because of privacy concerns, we might experience a loss in profitability.
Pursuant to the terms and conditions of use on our web sites, as part of our subscriber registration process, we collect and use personally identifiable information. Industry-wide incidents or incidents with respect to our web sites, including theft, alteration, deletion or misappropriation of information, security breaches, computer hackers, viruses (or anything else that may contaminate or cause destruction to our systems), or changes in industry standards, regulations or laws could deter people from using the Internet or
our web sites to conduct transactions that involve the transmission of confidential information, which could harm our business. Under the laws of certain jurisdictions, if there is a breach of our computer systems and we know or suspect that unencrypted personal subscriber data has been stolen, we may be required to inform any subscribers whose data was stolen and we may be subjected to liability, which could harm our reputation and business.
Our business could be harmed if we are unable to maintain the integrity and reliability of our data and forecasts.
Our success depends on our subscribers’ confidence in the comprehensiveness, accuracy, and reliability of the data and forecasts we provide. We believe that we take adequate precautions to safeguard the completeness and accuracy of our data and that the information is generally current, comprehensive and accurate. Nevertheless, we depend to a large degree on information provided to us on a voluntary basis by third parties, including commercial real estate brokers, agents and property owners. Further, data is susceptible to electronic malfeasance including theft, alteration, deletion, viruses and computer hackers. In addition, our reports and conference calls for subscribers may contain forecasts with respect to real estate trends. Although our contracts contain language limiting our liability if any of our data or forecasts are inaccurate or are later not borne out by actual results, for any of the above reasons, demand for our services could diminish and we may be exposed to lawsuits claiming damages resulting from inaccurate data and forecasts.
We may be unable to enforce or defend our ownership or use of intellectual property.
Our business depends in large measure on the intellectual property utilized in our methodologies, software and database. We rely on a combination of trademark, trade secret and copyright laws, registered domain names, contracts which include non-disclosure provisions, work-for-hire provisions, and technical security measures to protect our intellectual property rights. However, we do not hold Federal registrations covering all of our trademarks and copyrightable materials. We also do not own any patents or patent applications. Our business could be significantly harmed if we do not continue to protect our intellectual property. The same would be true if claims are made against us alleging infringement of the intellectual property rights of others. Any intellectual property claims, regardless of merit, could be expensive to litigate or settle, and could require substantial amounts of time and expenditures.
If our web sites or other services experience system failures or malicious attacks, our subscribers may be dissatisfied and our operations could be impaired.
Our business depends upon the satisfactory performance, reliability and availability of our web sites. Problems with the web sites could result in reduced demand for our services. Furthermore, the software underlying our services is complex and may contain undetected errors. Despite testing, we cannot be certain that errors will not be found in our software. Any errors could result in adverse publicity, impaired use of our services, loss of revenues, cost increases or legal claims by subscribers.
Additionally, our services substantially depend on systems provided by third parties, over whom we have little control. Interruptions in service could result from the failure of data providers, telecommunications providers, or other third parties, including due to the actions of computer hackers. We depend on these third-party providers of Internet communication services to provide continuous and uninterrupted service. We also depend on Internet service providers that provide access to our services. Any disruption in the Internet access provided by third-party providers or any failure of third-party providers to handle higher volumes of user traffic could harm our business.
Our internal network infrastructure could be disrupted or penetrated, which could materially impact both our ability to provide services and subscribers’ confidence in our services.
Our operations depend upon our ability to maintain and protect our computer systems, most of which are redundant and independent systems in separate locations. While we believe that our systems are adequate to support our operations, our systems may be vulnerable to damage from break-ins, unauthorized access, computer viruses, vandalism, fire, floods, earthquakes, power loss, telecommunications failures, terrorism, acts of war, and other similarly damaging events. Although we maintain insurance against fires, floods, and general business interruptions, the amount of coverage may not be adequate in any particular case. Furthermore, any damage or disruption could materially impair or block our ability to provide services, which could significantly impact our business.
Experienced computer programmers, or hackers, may attempt to penetrate our network security from time to time. Although we have not experienced any security breaches to date and we maintain a firewall, a hacker who penetrates network security could misappropriate proprietary information or cause interruptions in our services. We might be required to further expend significant capital and resources to protect against, or to alleviate, problems caused by hackers. We also may not have a timely remedy against a hacker who is able to penetrate our network security. In addition to purposeful security breaches, the inadvertent transmission of computer viruses or anything else manifesting contaminating or destructive properties could expose us to litigation or to a material
risk of loss. Any of these incidents could materially impact our ability to provide services as well as materially impact the confidence of our subscribers in our services, either of which could significantly and adversely impact our business.
We may be subject to regulation of advertising and subscriber solicitation or other newly-adopted laws and regulations.
As part of our subscriber registration process, our subscribers agree to receive emails and other communications from us. In addition, we use email and other online marketing techniques to reach potential subscribers for our ReisReports product. We may be subject to restrictions on our ability to communicate through email and phone calls, even with existing subscribers. Several jurisdictions have proposed or adopted privacy-related laws that restrict or prohibit unsolicited email or spam. These laws may impose significant monetary penalties for violations. In addition, laws or regulations that could harm our business could be adopted, or reinterpreted so as to affect our activities, by Federal and state governments, regulatory agencies or by foreign governments or agencies. This could include, for example, laws regulating the source, content or form of information provided on our web sites, the information or services we provide or our transmissions over the Internet. Violations or new interpretations of these laws or regulations may result in penalties, or damage our reputation, or could increase our costs or make our services less attractive.
Our revenue, expenses, operating results and cash flows are subject to fluctuations.
Our revenues, expenses, operating results and cash flows have fluctuated in the past and are likely to continue to do so in the future. These fluctuations could negatively affect our results of operations during that period and future periods. Our revenues, expenses, operating results and cash flows may fluctuate from quarter to quarter due to factors including, among others, those described below:
|
|
•
|
obtaining new subscribers and retaining existing subscribers;
|
|
|
•
|
changes in our marketing or other corporate strategies;
|
|
|
•
|
our introduction of new products and services or changes to existing products and services;
|
|
|
•
|
the amount and timing of our operating expenses and capital expenditures;
|
|
|
•
|
costs related to acquisitions of businesses or technologies; and
|
|
|
•
|
other factors outside of our control.
|
We may be subject to tax audits or other procedures concerning our tax collection policies.
We do not collect sales or other similar taxes in states other than New York. However, one or more states (other than New York) may seek to impose sales tax collection obligations on out-of-state companies, such as Reis, which engage in online commerce. A successful assertion that we should collect sales, use or other taxes on the sale of product or services into these states could subject us to liability for current or past taxes due, and could increase the effective price of our products and services, which could harm our business.
If we are not able to successfully identify or integrate future acquisitions, our business operations and financial condition could be adversely affected, and future acquisitions may divert management’s attention and consume significant resources.
We may in the future attempt to further expand our markets and services in part through acquisitions of other complementary businesses, services, databases and technologies. Mergers and acquisitions are inherently risky, and we cannot assure you that future acquisitions, if any, will be successful. The successful execution of any future acquisition strategy will depend on our ability to identify, negotiate, complete and integrate such acquisitions and, if necessary, obtain satisfactory debt or equity financing to fund those acquisitions, to the extent that the Company requires cash in excess of amounts it may then have on its balance sheet at that time. Any such acquired businesses would generally be subject to the risks described under “Risk Factors Relating to Our Commercial Real Estate Information Services Business” in this section.
Failure to manage and successfully integrate acquired businesses could harm our business. In addition, if we finance acquisitions by incurring additional debt, our financial condition or liquidity could be adversely impacted. If we finance or otherwise complete acquisitions by issuing equity or convertible debt securities, existing stockholders’ ownership may be diluted.
Risk Factors Relating to Our Residential Development Activities
Our remaining real estate asset may continue to decline in value, or we may not realize its value.
The value of our East Lyme project is subject to uncertainty, some of which is inherent to the real estate industry generally and some of which is specific to that property. We recorded aggregate impairment charges of approximately $9,708,000 in December 2008 with respect to certain of the historic Wellsford real estate assets, with $6,999,000 of that attributable to East Lyme. We cannot assure you that we will realize the current recorded value, or any value, on sale of this asset. In addition, continuing ownership of this asset, as well as negotiations regarding a potential sale of the asset, consume valuable management time. The market for bulk sales of residential development projects remains challenging, especially as potential buyers continue to experience difficulty in borrowing. A failure to sell this project and/or other factors could cause further impairment charges to be recorded.
Some of the factors impacting the current and future value of the project and potentially having an adverse effect on our results of operations and financial condition, include:
|
|
•
|
economic conditions;
|
|
|
•
|
the ability of potential buyers to acquire debt or other financing, and increases in interest rates;
|
|
|
•
|
supply and demand of similar and/or competing developments near the project;
|
|
|
•
|
a loss for which we have not purchased adequate insurance;
|
|
|
•
|
increased costs relating to holding the property and potentially the inability to obtain adequate insurance coverage; and
|
|
|
•
|
the cost of complying with current and future environmental, zoning, and other laws.
|
We may be exposed to risks associated with the development, construction and sale of residential units, and the ownership of real property generally.
Reis may be exposed to various claims associated with the development, construction and sale of condominium units, single family homes or lots. Claims related to environmental remediation, dissatisfaction by homeowners and homeowners’ associations with the construction of condominiums, homes and amenities by us and/or our developer partners in any condominium or subdivision development, or other matters, may result in litigation costs, remediation costs, warranty expenses or settlement costs which could be material to Reis’s results of operations and financial condition.
We are subject to various Federal, state, and local laws, ordinances, rules and regulations concerning protection of public health and the environment. These laws may impose liability on property owners or operators for the costs of removal or remediation of hazardous or toxic substances on real property, without regard to whether the owner or operator knew of, or was responsible for, the presence of the hazardous or toxic substances. The presence of, or the failure to properly remediate, such substances may adversely affect the value of a property, as well as our ability to sell the property, or to borrow funds using that property as collateral. Costs associated with the foregoing could be substantial and in extreme cases could exceed the value of the contaminated property. Environmental claims are generally not covered by our insurance programs. In addition, applicable environmental laws create liens on contaminated sites in favor of the government for damages and costs it incurs in connection with a contamination.
The one environmental condition affecting our properties of which we are aware relates to a portion of the East Lyme project. This land requires remediation of pesticides used on the property when it was an apple orchard at a cost of approximately $1,000,000. Remediation costs were considered in the value of the property and are recognized as a liability at December 31, 2010 and 2009.
None.
The Company, through the Residential Development Activities segment, owned the following property (which is not encumbered) at December 31, 2010:
|
Number of
|
Remaining
|
||||||||||||
|
Year
|
Lots/Homes
|
Lots/Homes
|
|||||||||||
|
Location/Property
|
Acquired
|
Zoned
|
Unsold
|
Type
|
|||||||||
|
East Lyme, CT
|
|||||||||||||
|
The Orchards (A)
|
2004
|
101 | 59 |
Single family home lots
|
|||||||||
|
East Lyme Land (B)
|
2005
|
60 | 60 |
Single family home lots
|
|||||||||
|
(A)
|
At December 31, 2010, 42 homes and lots were sold (29 homes and 13 lots). The remaining inventory included 59 lots. Home sales commenced in June 2006.
|
||
|
(B)
|
East Lyme Land is contiguous to The Orchards and is comprised of 60 lots.
|
As of December 31, 2010, the Company leases approximately 33,500 square feet of space in New York, New York, for its principal executive offices, under a lease expiring in 2016.
Neither the Company nor any of its properties are subject to any material litigation.
PART II
Market Information
The Company’s common shares trade on the Nasdaq Global Market under the symbol “REIS”. As of December 31, 2010, there were approximately 380 holders of record of our common stock. This number does not reflect beneficial holders of our common stock through accounts maintained at participants in The Depository Trust Company.
The high and low closing sales prices per share for our common stock for each quarter in the years ended December 31, 2010 and 2009 are as follows:
|
|
2010
|
2009
|
||||||||||||||||
|
Quarter
|
High
|
Low
|
High
|
Low
|
||||||||||||||
|
First
|
$ | 6.44 | $ | 5.70 | $ | 5.00 | $ | 2.69 | ||||||||||
|
Second
|
$ | 6.80 | $ | 5.68 | $ | 4.99 | $ | 3.15 | ||||||||||
|
Third
|
$ | 6.90 | $ | 5.80 | $ | 6.01 | $ | 3.92 | ||||||||||
|
Fourth
|
$ | 7.03 | $ | 6.23 | $ | 6.75 | $ | 5.49 | ||||||||||
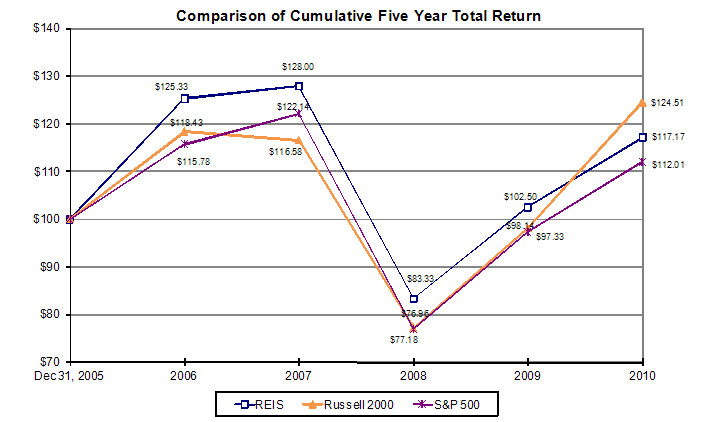
Common Stock Price Performance Graph
The following graph compares the cumulative total stockholder return on Reis’s common stock, which is represented below by “REIS,” for the period commencing December 31, 2005 through December 31, 2010, with the cumulative total return on the Russell 2000 Index, which we refer to as the Russell 2000, and the S&P 500 Index, which we refer to as the S&P 500, for the same period. Reis has chosen the Russell 2000 based on the market capitalization of the issuers contained in that index. Reis has not identified a peer group, due to the limited number of issuers in businesses similar to ours. Total return values were calculated based on cumulative total return assuming (1) the investment of $100 in the Russell 2000, the S&P 500 and Reis common stock on December 31, 2005, and (2) reinvestment of dividends. The total return for Reis common stock from December 31, 2005 to December 31, 2010 was a gain of approximately 17.2% versus gains of approximately 24.5% for the Russell 2000 and 12.0% for the S&P 500.
Dividends
The Company did not declare or distribute any dividends during 2010 or 2009.
Reis does not currently intend to declare or distribute any dividends. All decisions regarding the declaration and payment of dividends will be at the discretion of the Board and will be evaluated from time to time by the Board in light of the Company’s financial condition, earnings, cash flows, growth prospects, restrictions under the Company’s credit agreement, applicable law and other factors that the Board deems relevant.
Recent Sales of Unregistered Securities
The Company has not sold any unregistered securities within the past three years.
Issuer Purchases of Equity Securities
In June 2010, the Board authorized the repurchase of up to an aggregate amount of $1,000,000 of the Company’s common stock. Previously, the Board had authorized the repurchase of an aggregate of $3,000,000 of the Company’s shares. In April 2010, the Company completed repurchases under the initial $3,000,000 authorization. The program permits purchases from time to time in the open market or through privately negotiated transactions. Depending on market conditions, financial developments and other factors, purchases could be commenced or suspended at any time, or from time to time, without prior notice and the program may be expanded with prior notice. The Company may make purchases pursuant to a trading plan under Securities Exchange Act Rule 10b5-1, permitting open market purchases of common stock during blackout periods consistent with the Company’s “Policies for Transactions in Reis Stock and Insider Trading and Tipping.” During the fourth quarter of 2010, the Company repurchased the following shares of common stock:
|
Period
|
Total Number of Shares Purchased
|
Average Price Paid per Share
|
Total Number of Shares Purchased as Part of Publicly Announced Plans or Programs
|
Maximum Dollar Value of Shares That May Yet Be Purchased Under the Plans or Programs
|
||||||||||||||
|
October 1, 2010 to October 31, 2010
|
5,246 | $ | 6.37 | 5,246 | $ | 835,000 | ||||||||||||
|
November 1, 2010 to November 30, 2010
|
109,100 | $ | 6.93 | 109,100 | $ | 79,000 | ||||||||||||
|
December 1, 2010 to December 31, 2010
|
11,695 | $ | 6.72 | 11,695 | $ | — | ||||||||||||
During the year ended December 31, 2010, the Company purchased 175,232 shares of common stock at an average price of $6.71 per share. From the inception of the share repurchase programs in December 2008 through December 17, 2010, the Company purchased an aggregate of 838,076 shares of common stock at an average price of $4.77 per share, for an aggregate of $4,000,000. Under the repurchase programs, the Company repurchased approximately 7.6% of the common shares outstanding at the time of the Board’s initial authorization in December 2008.
Other Security Information
For additional information concerning the Company’s capitalization, see Note 10 to the Company’s consolidated financial statements.
Calculation of Aggregate Market Value of Non-Affiliate Shares
For purposes of calculating the aggregate market value of those common shares of the Company held by non-affiliates, as shown on the cover page of this annual report on Form 10-K, it has been assumed that all of the outstanding shares at June 30, 2010 were held by non-affiliates except for shares held by directors and officers of the Company. However, this should not be deemed to constitute an admission that all of such directors and officers are, in fact, affiliates of the Company, or that there are not other persons who may be deemed to be affiliates of the Company. For further information concerning shareholdings of officers, directors and principal stockholders, see “Item 12. Security Ownership of Certain Beneficial Owners and Management and Related Stockholder Matters.”
We are a smaller reporting company, as defined by Rule 12b-2 under the Securities Exchange Act of 1934, and are not required to provide the information otherwise called for under this item.
The following discussion should be read in conjunction with the consolidated financial statements and notes thereto appearing elsewhere in this annual report on Form 10-K.
Organization and Business
Reis, Inc., which we refer to as either the Company or Reis, is a Maryland corporation. The Company’s primary business is providing commercial real estate market information and analytical tools for its subscribers, through its Reis Services subsidiary. For disclosure and financial reporting purposes, this business is referred to as the Reis Services segment.
Reis Services
Reis Services, including its predecessors, was founded in 1980. Reis maintains a proprietary database containing detailed information on commercial properties in metropolitan markets and neighborhoods throughout the U.S. The database contains information on apartment, office, retail and industrial properties and is used by real estate investors, lenders and other professionals to make informed buying, selling and financing decisions. In addition, Reis data is used by debt and equity investors to assess, quantify and manage the risks of default and loss associated with individual mortgages, properties, portfolios and real estate backed securities. Reis currently provides its information services to many of the nation’s leading lending institutions, equity investors, brokers and appraisers.
Reis, through its flagship institutional product, Reis SE, and through its new small business product, ReisReports, provides online access to a proprietary database of commercial real estate information and analytical tools designed to facilitate debt and equity transactions as well as ongoing evaluations. Depending on the product, users have access to trend and forecast analysis at metropolitan and neighborhood levels throughout the U.S. and/or detailed building-specific information such as rents, vacancy rates, lease terms, property sales, new construction listings and property valuation estimates. Reis’s products are designed to meet the demand for timely and accurate information to support the decision-making of property owners, developers, builders, banks and non-bank lenders, and equity investors. These real estate professionals require access to timely information on both the performance and pricing of assets, including detailed data on market transactions, supply, absorption, rents and sale prices. This information is critical to all aspects of valuing assets and financing their acquisition, development and construction.
Reis’s revenue model is based primarily on annual subscriptions that are paid in accordance with contractual billing terms. Reis recognizes revenue from its contracts on a ratable basis; for example, one-twelfth of the value of a one-year contract is recognized monthly.
Reis continues to develop and introduce new products, expand and add new markets and data, and find new ways to deliver existing information to meet and anticipate client demand.
Residential Development Activities
The Company was originally formed on January 8, 1997. Reis acquired the Reis Services business by merger in May 2007, which we refer to as the Merger. Prior to May 2007, Reis operated as Wellsford Real Properties, Inc., which we refer to as Wellsford. Wellsford’s primary operating activities immediately prior to the Merger were the development, construction and sale of its three residential projects and its approximate 23% ownership interest in the Reis Services business. The Company completed the sale of the remaining units at its Colorado project in September 2009 and sold its Claverack, New York project in February 2010.
At December 31, 2010, the Company’s residential development activities were comprised solely of The Orchards, a single family home development in East Lyme, Connecticut, upon which the Company could build 161 single family homes on 224 acres. An aggregate of 42 homes and lots (29 homes and 13 lots) were sold as of December 31, 2010. At December 31, 2010, the remaining East Lyme inventory included 119 lots. The Company is working with a broker to sell the remaining 119 lots in one or more bulk sale transactions. There can be no assurance that the Company will be able to sell the remaining 119 lots in one or more bulk transactions at acceptable prices, or within a specific time period, or at all. None of the Company’s remaining real estate is encumbered by debt.
Critical Business Metrics of the Reis Services Business
Management considers certain metrics in evaluating the performance of the Reis Services business. These metrics are revenue, EBITDA (which is defined as earnings before interest, taxes, depreciation and amortization) and EBITDA margin. Following is a presentation of these historical metrics for the Reis Services business (for a reconciliation of GAAP net income (loss) to EBITDA and Adjusted EBITDA for both the Reis Services segment and on a consolidated basis for each of the periods presented here, see below).
|
(amounts in thousands, excluding percentages)
|
||||||||||||||||||
|
For the Three Months Ended
|
||||||||||||||||||
|
December 31,
|
Percentage
|
|||||||||||||||||
|
2010
|
2009
|
Increase
|
Increase
|
|||||||||||||||
|
Revenue
|
$ | 6,167 | $ | 5,827 | $ | 340 | 5.8 | % | ||||||||||
|
EBITDA
|
$ | 2,407 | $ | 2,379 | $ | 28 | 1.2 | % | ||||||||||
|
EBITDA margin
|
39.0 | % | 40.8 | % | ||||||||||||||
|
For the Three Months Ended
|
Percentage
|
|||||||||||||||||
|
December 31,
2010
|
September 30,
2010
|
Increase
(Decrease)
|
Increase
(Decrease)
|
|||||||||||||||
|
Revenue
|
$ | 6,167 | $ | 6,013 | $ | 154 | 2.6 | % | ||||||||||
|
EBITDA
|
$ | 2,407 | $ | 2,440 | $ | (33 | ) | (1.4 | %) | |||||||||
|
EBITDA margin
|
39.0 | % | 40.6 | % | ||||||||||||||
|
For the Years Ended
|
Percentage
|
|||||||||||||||||
|
December 31,
|
Increase
|
Increase
|
||||||||||||||||
|
2010
|
2009
|
(Decrease)
|
(Decrease)
|
|||||||||||||||
|
Revenue
|
$ | 24,198 | $ | 23,892 | $ | 306 | 1.3 | % | ||||||||||
|
EBITDA
|
$ | 9,503 | $ | 10,721 | $ | (1,218 | ) | (11.4 | %) | |||||||||
|
EBITDA margin
|
39.3 | % | 44.9 | % | ||||||||||||||
Reis Services’s revenue increased by approximately $340,000 from the fourth quarter of 2009 to the fourth quarter of 2010. This revenue increase over the corresponding prior quarterly period is the third consecutive quarterly increase in revenue over the prior year’s quarter. In addition, revenue increased by approximately $306,000 from the year ended December 31, 2009 to 2010. In general, the improving revenue results in the 2010 period reflect (1) positive improvements in overall renewal rates as the trailing twelve month renewal rate improved to 91% at December 31, 2010 as compared to 86% for the year ended December 31, 2009, (2) reduced budgeting constraints by current and prospective subscribers, which during 2008 and 2009 negatively impacted renewal rates and pricing on subscription contracts entered into at that time, as well as (3) the cumulative impact of the strength of contract signings beginning in the fourth quarter of 2009 and continued throughout 2010.
Our overall trailing twelve month renewal rates improved from 86% to 91% and, for institutional subscribers, the renewal rates improved from 87% to 93% from December 31, 2009 to December 31, 2010, respectively. The fourth quarter and full year of 2010 were record periods for the Company for total contracts signed (based upon the value of annual contracts executed in those periods for both new and renewal business). The fourth quarter of 2010 also represented the best quarter for new business, based upon the value of annual contracts executed in that period, and the 2010 annual period was the second best annual period for new business (trailing only the 2007 annual period). The renewal rate improvements, coupled with new business from both existing and new subscribers, allowed revenue to stabilize in the first nine months of 2010 as older prior year contracts rolled out of the revenue base and a higher percentage of expiring contracts were renewed. The level of contract signings in 2010, and specifically in the fourth quarter of 2010, resulted in revenue growth in the fourth quarter of 2010 and is expected to translate into revenue growth in 2011 over 2010 amounts.
Reis’s revenue model is based primarily on annual subscriptions that are paid in accordance with contractual billing terms. Reis recognizes revenue from its contracts on a ratable basis; for example, one-twelfth of the value of a one-year contract is recognized monthly. Therefore, increases in the dollar value of new contracts are spread evenly over the life of a contract, thereby moderating an immediate impact on revenue. It took over four quarters to realize the full impact of contract declines on revenue in late 2008 and into 2009. These older, lower value contracts will roll and be replaced by renewals with more favorable pricing over a similar time period. This trend is evidenced by our 2010 quarterly revenue, as each of the first three quarters reported stable revenue at slightly over
$6,000,000, followed by growth in the fourth quarter of 2010 to $6,167,000 or an increase of $154,000, or 2.6%, over the third quarter 2010.
Our contract pricing model is based on actual and projected report consumption; we believe it is generally not as susceptible to economic downturns and personnel reductions at our subscribers as a model based upon individual user licenses. We generally impose contractual restrictions limiting our immediate exposure (during existing contract terms) to revenue reductions due to mergers and consolidations. However, we have been, and we may in the future be, impacted by consolidation among our subscribers and potential subscribers, or in the event that subscribers enter bankruptcy or otherwise go out of business. As budget constraints and economic pressures moderate, there has been an overall positive impact on revenue stabilization and growth. These impacts can be seen in the reported results for 2010 in excess of 2009 revenue and the growth on a consecutive quarter basis from the third quarter to fourth quarter 2010.
Two additional metrics management believes are critical in understanding the business and future performance are deferred revenue and Aggregate Revenue Under Contract. Analyzing these amounts can provide additional insight into Reis Services’s financial performance. Deferred revenue, which is a GAAP basis accounting concept and is reported by the Company on the consolidated balance sheet, represents revenue from annual or longer term contracts for which we have billed and/or received payments from our subscribers related to services we will be providing over the period and for which we have charged the subscribers. It does not include future revenue under non-cancellable contracts for which we do not yet have the contractual right to bill; this aggregate number we refer to as Aggregate Revenue Under Contract. Deferred revenue will be recognized as revenue ratably over the life of a contract. The following table reconciles deferred revenue to Aggregate Revenue Under Contract at December 31, 2010 and 2009:
|
December 31,
|
Percentage
|
|||||||||||||||||
|
2010
|
2009
|
Increase
|
Increase
|
|||||||||||||||
|
Deferred revenue (GAAP basis)
|
$ | 15,446,000 | $ | 12,193,000 | $ | 3,253,000 | 26.7 | % | ||||||||||
|
Amounts under non-cancellable contracts for which the Company does not yet have the contractual right to bill at December 31, 2010 (A)
|
11,707,000 | 7,562,000 | 4,145,000 | 54.8 | % | |||||||||||||
|
Aggregate Revenue Under Contract (B)
|
$ | 27,153,000 | $ | 19,755,000 | $ | 7,398,000 | 37.4 | % | ||||||||||
|
(A)
|
Amounts are billable subsequent to December 31, 2010 and represents (i) non-cancellable contracts for subscribers with multi-year subscriptions where the future years are not yet billable, or (ii) subscribers with non-cancellable annual subscriptions with interim billing terms.
|
||
|
(B)
|
Included in Aggregate Revenue Under Contract at December 31, 2010 was approximately $19,527,000 related to amounts under contract for 2011. The remainder reflects amounts under contract for 2012 and 2013. Included in Aggregate Revenue Under Contract at December 31, 2009 was approximately $16,127,000 related to amounts under contract for 2010 at that date, representing an increase of 21.1%.
|
The increases in both the deferred revenue and Aggregate Revenue Under Contract are the result of an improved sale environment for renewals, increased new business and the signing of more multi-year contracts in 2010 over 2009 as described above in the revenue discussion.
EBITDA decreased $1,218,000 from the year ended December 31, 2009 to the year ended December 31, 2010. This is primarily a result of (1) cost increases, primarily in sales and marketing expenses for increases in commissions in 2010 over 2009, (2) salary and benefit increases in 2010 from hiring for product development and enhancement initiatives, (3) wage increases for existing employees, (4) increased marketing expenses related to our ReisReports offering and (5) the continuing increase in the cost of employee benefits, primarily for medical insurance. EBITDA for the fourth quarter of 2010 modestly improved $28,000 over the fourth quarter of 2009, primarily from a revenue increase, in excess of cost increases. However, on a sequential quarter basis, EBITDA declined slightly, by $33,000, primarily from increased commissions on fourth quarter sales.
Management expects that EBITDA and EBITDA margins in 2011 will be negatively impacted in the short term by our continuing product development and enhancement initiatives, as well as marketing expenses for ReisReports. Although this spending is likely to reduce margins for the Reis Services segment into the mid-30% range, at least in the first half of 2011, the expectation is that this spending and investment will support additional revenue growth in the future.
Reconciliations of Net Income (Loss) to EBITDA and Adjusted EBITDA
EBITDA is defined as earnings before interest, taxes, depreciation and amortization. Adjusted EBITDA is defined as earnings before interest, taxes, depreciation, amortization and stock based compensation. Although EBITDA and Adjusted EBITDA are not measures of performance calculated in accordance with GAAP, senior management uses EBITDA and Adjusted EBITDA to measure operational and management performance. Management believes that EBITDA and Adjusted EBITDA are appropriate metrics that may be used by investors as supplemental financial measures to be considered in addition to the reported GAAP basis financial information to assist investors in evaluating and understanding (1) the performance of the Reis Services segment, the primary business
of the Company and (2) the Company’s consolidated results, from year to year or period to period, as applicable. Further, these measures provide the reader with the ability to understand our operational performance while isolating non-cash charges, such as depreciation and amortization expenses, as well as other non-operating items, such as interest income, interest expense and income taxes and, in the case of Adjusted EBITDA, isolates non-cash charges for stock based compensation. Management also believes that disclosing EBITDA and Adjusted EBITDA will provide better comparability to other companies in the information services sector. However, investors should not consider these measures in isolation or as substitutes for net income (loss), operating income (loss), or any other measure for determining operating performance that is calculated in accordance with GAAP. In addition, because EBITDA and Adjusted EBITDA are not calculated in accordance with GAAP, they may not necessarily be comparable to similarly titled measures employed by other companies. Reconciliations of EBITDA and Adjusted EBITDA to the most comparable GAAP financial measure, net income (loss), follow for each identified period:
|
(amounts in thousands)
|
||||||||||||||
|
Reconciliation of Net Income to EBITDA and Adjusted EBITDA
for the Three Months Ended December 31, 2010
|
Reis Services
|
Residential
Development
Activities
and Other*
|
Consolidated
|
|||||||||||
|
Net income
|
$ | 624 | ||||||||||||
|
Income tax (benefit)
|
(254 | ) | ||||||||||||
|
Income (loss) before income taxes
|
$ | 1,117 | $ | (747 | ) | 370 | ||||||||
|
Add back:
|
||||||||||||||
|
Depreciation and amortization expense
|
1,220 | — | 1,220 | |||||||||||
|
Interest expense (income), net
|
70 | (2 | ) | 68 | ||||||||||
|
EBITDA
|
2,407 | (749 | ) | 1,658 | ||||||||||
|
Add back:
|
||||||||||||||
|
Stock based compensation expense, net
|
— | 511 | 511 | |||||||||||
|
Adjusted EBITDA
|
$ | 2,407 | $ | (238 | ) | $ | 2,169 | |||||||
|
Reconciliation of Net Income to EBITDA and Adjusted EBITDA
for the Year Ended December 31, 2010
|
Reis Services
|
Residential
Development
Activities
and Other*
|
Consolidated
|
|||||||||||
|
Net income
|
$ | 668 | ||||||||||||
|
Income tax (benefit)
|
(220 | ) | ||||||||||||
|
Income (loss) before income taxes
|
$ | 4,433 | $ | (3,985 | ) | 448 | ||||||||
|
Add back:
|
||||||||||||||
|
Depreciation and amortization expense
|
4,769 | 27 | 4,796 | |||||||||||
|
Interest expense (income), net
|
301 | (17 | ) | 284 | ||||||||||
|
EBITDA
|
9,503 | (3,975 | ) | 5,528 | ||||||||||
|
Add back:
|
||||||||||||||
|
Stock based compensation expense, net
|
— | 1,712 | 1,712 | |||||||||||
|
Adjusted EBITDA
|
$ | 9,503 | $ | (2,263 | ) | $ | 7,240 | |||||||
|
Reconciliation of Net Income to EBITDA and Adjusted EBITDA
for the Three Months Ended December 31, 2009
|
Reis Services
|
Residential
Development
Activities
and Other*
|
Consolidated
|
|||||||||||
|
Net income
|
$ | 358 | ||||||||||||
|
Income tax (benefit)
|
(507 | ) | ||||||||||||
|
Income (loss) before income taxes
|
$ | 1,020 | $ | (1,169 | ) | (149 | ) | |||||||
|
Add back:
|
||||||||||||||
|
Depreciation and amortization expense
|
1,250 | 9 | 1,259 | |||||||||||
|
Interest expense (income), net
|
109 | (13 | ) | 96 | ||||||||||
|
EBITDA
|
2,379 | (1,173 | ) | 1,206 | ||||||||||
|
Add back:
|
||||||||||||||
|
Stock based compensation expense, net
|
— | 357 | 357 | |||||||||||
|
Adjusted EBITDA
|
$ | 2,379 | $ | (816 | ) | $ | 1,563 | |||||||
|
(amounts in thousands)
|
||||||||||||||
|
Reconciliation of Net Income to EBITDA and Adjusted EBITDA
for the Year Ended December 31, 2009
|
Reis Services
|
Residential
Development
Activities
and Other*
|
Consolidated
|
|||||||||||
|
Net income
|
$ | 1,004 | ||||||||||||
|
Income tax expense
|
6 | |||||||||||||
|
Income (loss) before income taxes
|
$ | 5,397 | $ | (4,387 | ) | 1,010 | ||||||||
|
Add back:
|
||||||||||||||
|
Depreciation and amortization expense
|
4,916 | 69 | 4,985 | |||||||||||
|
Interest expense (income), net
|
408 | (31 | ) | 377 | ||||||||||
|
EBITDA
|
10,721 | (4,349 | ) | 6,372 | ||||||||||
|
Add back:
|
||||||||||||||
|
Stock based compensation expense, net
|
— | 1,570 | 1,570 | |||||||||||
|
Adjusted EBITDA
|
$ | 10,721 | $ | (2,779 | ) | $ | 7,942 | |||||||
|
Reconciliation of Net Income to EBITDA and Adjusted EBITDA
for the Three Months Ended September 30, 2010
|
Reis Services
|
Residential
Development
Activities
and Other*
|
Consolidated
|
|||||||||||
|
Net income
|
$ | 115 | ||||||||||||
|
Income tax expense
|
79 | |||||||||||||
|
Income (loss) before income taxes
|
$ | 1,254 | $ | (1,060 | ) | 194 | ||||||||
|
Add back:
|
||||||||||||||
|
Depreciation and amortization expense
|
1,114 | 1 | 1,115 | |||||||||||
|
Interest expense (income), net
|
72 | (5 | ) | 67 | ||||||||||
|
EBITDA
|
2,440 | (1,064 | ) | 1,376 | ||||||||||
|
Add back:
|
||||||||||||||
|
Stock based compensation expense, net
|
— | 416 | 416 | |||||||||||
|
Adjusted EBITDA
|
$ | 2,440 | $ | (648 | ) | $ | 1,792 | |||||||
|
*
|
Includes Gold Peak, East Lyme, Claverack, the Company’s other developments and corporate level income and expenses (including public company costs), to the extent that such income and expenses existed for such projects during the periods presented.
|
Results of Operations
Comparison of the Results of Operations for the Years Ended December 31, 2010 and 2009
Subscription revenues and related cost of sales were approximately $24,198,000 and $5,845,000, respectively, for the year ended December 31, 2010, resulting in a gross profit for the Reis Services segment of approximately $18,353,000. Amortization expense included in cost of sales (for the database intangible asset) was approximately $2,259,000 during this period. Subscription revenues and related cost of sales were approximately $23,892,000 and $5,568,000, respectively, for the year ended December 31, 2009, resulting in a gross profit for the Reis Services segment of approximately $18,324,000. Amortization expense included in cost of sales was approximately $2,172,000 during this period. See “—Critical Business Metrics of the Reis Services Business” for a discussion of the variances and trends in revenue and EBITDA of the Reis Services segment. The increase in cost of sales of $277,000 is primarily (1) additional amortization expense for the database intangible asset, (2) the effect of increased employee benefits costs, (3) wage increases for existing employees, as 2009 wages were frozen and bonus levels were reduced, and 2010 expenses reflect a return to base salary increases and a normalized employee bonus level, (4) hiring during 2010 and (5) an increase in bad debt expense over the prior period.
Revenue and cost of sales of real estate were approximately $3,378,000 and $2,801,000, respectively, for the year ended December 31, 2010, of which revenue of $2,750,000 is from the sale of the Claverack project in February 2010 and the remainder is the sale of one home and two lots at East Lyme. Revenue and cost of sales of residential units were approximately $7,059,000 and $4,987,000, respectively, for the year ended December 31, 2009 with respect to the sale of the remaining 20 condominium units at the Gold Peak development, thereby completing our sales activity for that project, and six East Lyme sales in the 2009 period (three homes and three lots).
Sales and marketing expenses were approximately $6,057,000 and $5,306,000 for the years ended December 31, 2010 and 2009, respectively, and solely represent costs of the Reis Services segment. Amortization expense included in sales and marketing expenses (for the customer relationships intangible asset) were approximately $1,001,000 and $1,008,000 during the years ended December 31, 2010 and 2009, respectively. The expense increase for sales and marketing expenses between the two periods of approximately $751,000 generally reflects a larger sales force in the 2010 period and increased commissions in the 2010 over 2009 consistent with
the increase in sales activity in the 2010 period. Additionally, increases in 2010 expenses over 2009 expenses reflect wage increases for existing employees, as 2009 wages were frozen and bonus levels were reduced, and 2010 expenses reflect a return to base salary increases and a normalized employee bonus level. Additionally, the 2010 balance includes the effect of increased employee benefits costs.
Product development expenses were approximately $1,811,000 and $1,818,000 for the years ended December 31, 2010 and 2009, respectively, and solely represent costs of the Reis Services segment. Amortization expense included in product development expenses (for the web site intangible asset) were approximately $874,000 and $990,000 during the year ended December 31, 2010 and 2009, respectively. Product development costs decreased $7,000, primarily due to a net reduction in amortization expense from web site costs capitalized at the time of the Merger as part of the purchase price allocation becoming fully amortized in 2010, accounting for $116,000 of the decrease, offset by cost increases from new product initiatives, coupled with compensation and benefit cost increases as described above.
Property operating expenses were $546,000 and $771,000 for the years ended December 31, 2010 and 2009, respectively, and represent the non-capitalizable project costs and other period expenses related to the Company’s residential development projects. The reduction results from the Gold Peak sell out in 2009, the Claverack sale in February 2010 and the cost reduction efforts to operate and maintain the unsold real estate with a minimal cost structure and allocated internal resources.
General and administrative expenses of $9,784,000 for the year ended December 31, 2010 include current period expenses of $7,410,000, depreciation and amortization expense of $662,000 for lease value and furniture, fixtures and equipment, and approximately $1,712,000 of net non-cash compensation expense. The net non-cash compensation expense is comprised of compensation expense resulting from equity awards for employees and directors of approximately $1,658,000 and by an approximate $54,000 increase in the reserve for option liability due to an increase in the market price of the Company’s common stock from $6.15 per share at December 31, 2009 to $7.03 per share at December 31, 2010. General and administrative expenses of $11,215,000 for the year ended December 31, 2009 include current period expenses of $8,830,000, depreciation and amortization expense of $815,000 for lease value and furniture, fixtures and equipment, and approximately $1,570,000 of net non-cash compensation expense. The net non-cash compensation expense is comprised of compensation expense resulting from equity awards for employees and directors of approximately $1,431,000 and additional expense of approximately $139,000 from the increase in the reserve for option liability due to an increase in the market price of the Company’s common stock from $5.00 per share at December 31, 2008 to $6.15 per share at December 31, 2009. Excluding the non-cash items, the reduction in general and administrative expenses is a result of (1) concerted efforts to reduce public company and other administrative costs, (2) a reduction in staffing for management and accounting personnel who supported the Residential Development Activities segment (whose costs were charged to general and administrative expenses and were not allocable to that segment), (3) the completion of certain employment related contractual obligations in May 2010 and (4) the settlement of contingent obligations for amounts less than accrued in prior periods.
Interest and other income was $123,000 and $316,000 for the years ended December 31, 2010 and 2009, respectively, and primarily reflects interest earned on cash. Interest rates in the 2010 period were significantly lower than in the 2009 period and the Company had a lower average cash balance in 2010 as compared to 2009, due in part to mandatory amortization and discretionary prepayments on the Bank Loan.
Interest expense of $407,000 for the year ended December 31, 2010 includes interest and cost amortization on the Bank Loan of $394,000 and interest on other debt of $13,000. Interest expense of $592,000 for the year ended December 31, 2009 includes interest and cost amortization on the Bank Loan of $524,000, non-capitalized interest relating to residential development activities of $40,000 and interest on other debt of $28,000. The reduction in interest expense reflects the reduction in the outstanding debt balance in the 2010 period as compared to the 2009 period.
The income tax benefit during the year ended December 31, 2010 of $220,000 reflects the resolution of an unrecognized tax benefit as a result of the expiration of the applicable state’s statute of limitations. The income tax expense for the year ended December 31, 2009 of $6,000 results from current state and local taxes of $31,000, offset by a net current Federal alternative minimum tax (“AMT”) benefit of $25,000.
Income Taxes
Deferred income taxes reflect the net tax effects of temporary differences between the carrying amount of assets and liabilities for financial reporting purposes and the amounts used for income tax purposes. The net deferred tax liability was approximately $67,000 at December 31, 2010 and 2009 and is reflected as a non-current liability in the accompanying consolidated balance sheets. The significant portion of the deferred tax items relates to (1) the tax benefit of impairment charges before allowances, (2) NOL carryforwards as they relate to deferred tax assets, (3) AMT credit carryforwards as they relate to deferred tax assets, (4) stock based
compensation and (5) the deferred tax liability resulting from the intangible assets recorded at the time of the Merger as they related to deferred tax liabilities.
The Company has aggregate NOL carryfowards aggregating approximately $40,400,000 at December 31, 2010. These NOLs include NOLs generated subsequent to the Merger, losses from Private Reis prior to the Merger, losses obtained from the Company’s 1998 merger with Value Property Trust (“VLP”) and the Company’s operating losses prior to the Merger. Approximately $27,300,000 of these NOLs are subject to an annual limitation, whereas $13,100,000 are not subject to such a limitation. All of these NOLs can potentially be used against consolidated taxable income as further described below.
Private Reis had NOL carryforwards aggregating approximately $6,000,000 at December 31, 2010, which expire in the years 2019 to 2026. During the seven month period subsequent to the Merger, the Company generated NOLs of approximately $4,600,000 and during the year ended December 31, 2010, generated additional NOLs of approximately $2,500,000 which expire in the years 2027 and 2030, respectively. These losses, which aggregate $13,100,000 at December 31, 2010, may be utilized against consolidated taxable income, all of which amounts are available for use for financial statement reporting purposes at December 31, 2010. The taxable loss of $2,500,000 for 2010 primarily reflects the realization of a $4,500,000 loss for tax purposes from the sale of the Claverack project in February 2010. If the Company were able to sell its East Lyme project, an additional loss of approximately $14,900,000 would be realized which could also be utilized against consolidated taxable income without limitation.
The Company separately has NOLs which resulted from the Company’s merger with VLP in 1998 and its operating losses in 2004, 2006 and 2007 (prior to the Merger) aggregating approximately $27,300,000, of which approximately $5,500,000 expires in 2017. There is an annual limitation on the use of such NOLs after an ownership change, pursuant to Section 382 of the Internal Revenue Code (the “Code”). As a result of the Merger, the Company experienced such an ownership change which resulted in a new annual limitation of $2,779,000. A further requirement of the tax rules is that after a corporation experiences an ownership change, it must satisfy the continuity of business enterprise, or COBE, requirement (which generally requires that a corporation continue its historic business or use a significant portion of its historic business assets in its business for the two year period beginning on the date of the ownership change) to be able to utilize NOLs generated prior to such ownership change. Although the Company believes there is a basis for concluding that the COBE requirements were met throughout the required two year period subsequent to the ownership change, management concluded that the Company could not meet the more-likely-than-not criteria for recognizing a deferred tax asset relating to such losses for GAAP accounting purposes. The Company has utilized an aggregate of approximately $5,800,000 of these NOLs in its Federal tax return filings for 2008 and 2009, with appropriate disclosure. Such amounts have also been deducted to arrive at the $13,100,000 of NOLs described above, for financial reporting purposes.
A valuation allowance is required to reduce the deferred tax assets if, based on the weight of the evidence, it is more-likely-than-not that some portion or all of the deferred tax assets will not be realized. Accordingly, management has determined that a valuation allowance of approximately $8,254,000 and $8,651,000 at December 31, 2010 and 2009, respectively, was necessary. The allowances at December 31, 2010 and 2009 relate primarily to AMT credits, NOLs in 2010 and to the excess of a portion of the tax basis of certain real estate development assets over their respective financial statement basis. The decrease in the allowance in 2010 is attributable to the change in the estimate of the realization of the real estate asset basis differences.
The Company’s reserve for unrecognized tax benefits, including estimated interest and penalties, was approximately $145,000 and $435,000 at December 31, 2010 and 2009, respectively. The reserve reduction in 2010 primarily results from a resolution of unrecognized tax benefits and the related estimate for interest and penalties, offset by interest accruals on other unrecognized items. Interest and penalties related to these tax provisions were included in general and administrative expenses and included a benefit of $199,000 in 2010, for the resolution of related unrecognized tax benefits in 2010, and an expense of $80,000 in 2009.
Liquidity and Capital Resources
At December 31, 2010, the Company’s short-term liquidity requirements include: current operating and capitalizable costs; near-term product development and enhancement of the web site and databases; the current portion of long-term debt (comprised of scheduled principal payments of approximately $5,531,000 on the Bank Loan, payable by December 31, 2011); operating and capital leases; warranty costs related to construction; development costs; other capital expenditures; and the potential settlement of certain outstanding stock options in cash (the liability for which was approximately $158,000 at December 31, 2010 based upon the closing stock price of the Company at December 31, 2010 of $7.03 per share). The Company expects to meet these short-term liquidity requirements generally through the use of available cash, cash generated from subscription revenue of Reis Services, sales of the Company’s remaining East Lyme real estate assets either individually or in bulk transactions, releases from property-related escrow reserves and accounts, and the repayment of the Claverack mortgage receivable in February 2011. The Company expects that in the short term, it will be able to utilize its NOLs and that taxes to be paid will be for alternative state and local taxes, and possibly AMT, but not for Federal income taxes.
The Company’s long-term liquidity requirements include: future operating and capitalizable costs; long-term product development and enhancements of the web site and databases; the non-current portion of long-term debt; operating and capital leases and other capital expenditures; and potentially, repurchases of additional shares of Reis common stock. The Company expects to meet these long-term liquidity requirements generally through the use of available cash, cash generated from subscription revenue of Reis Services, sales of the Company’s remaining East Lyme real estate assets either individually or in bulk transactions (to the extent that any remain unsold after 2011), and releases from property-related escrow reserves and accounts. The Company has NOLs that it expects to be able to use in the next few years against future taxable income for Federal, state and local tax purposes (to the extent that taxable income is generated). Tax payments during the next few years are expected to be for alternative state and local taxes and AMT, but not for Federal income taxes.
Cash and cash equivalents aggregated approximately $20,164,000 at December 31, 2010, including approximately $15,912,000 in the Reis Services segment. Management considers such amounts to be adequate and expects its cash balances to continue to be adequate to meet operating, product development and enhancement initiatives and debt service requirements in both the short and long terms at both the Reis Services segment and on a consolidated basis. At December 31, 2010, the Company, on a consolidated basis and at the Reis Services segment level, was net cash positive (defined as cash and cash equivalents, minus total debt) by approximately $8,914,000 and $4,662,000, respectively. At December 31, 2009, the Company, on a consolidated basis, was net cash positive by approximately $3,272,000 and, at the Reis Services segment, had net debt (total debt, minus cash and cash equivalents) of approximately $3,834,000. Net cash on a consolidated basis has grown by approximately $5,642,000 from December 31, 2009 to December 31, 2010, which management believes is a strong indicator of the cash generation power of our business model.
Reis Services Bank Loan
In connection with the Merger agreement, Private Reis entered into a credit agreement, dated October 11, 2006, with the Bank of Montreal, Chicago Branch, as administrative agent, and BMO Capital Markets, as lead arranger, which provided for a term loan of up to an aggregate of $20,000,000 and revolving loans up to an aggregate of $7,000,000. Loan proceeds were used to finance $25,000,000 of the cash portion of the Merger consideration. The balance of the Bank Loan was $11,222,000 and $19,250,000 at December 31, 2010 and 2009, respectively. The interest rate was LIBOR + 1.50% at December 31, 2010 and 2009 (LIBOR was 0.26% and 0.23% at December 31, 2010 and 2009, respectively). The LIBOR spread under the Bank Loan is based on a leverage ratio, as defined in the credit agreement. The interest spread could range from a high of LIBOR + 3.00% (if the leverage ratio is greater than or equal to 4.50 to 1.00) to a low of LIBOR + 1.50% (if the leverage ratio is less than 2.75 to 1.00). Reis Services also pays an annual administration fee of $25,000.
Reis Services is required to (1) make principal payments on the term loan on a quarterly basis commencing on June 30, 2007 in increasing amounts pursuant to the payment schedule provided in the credit agreement and (2) permanently reduce the revolving loan commitments on a quarterly basis commencing on March 31, 2010. Additional principal payments are payable if Reis Services’s annual cash flow exceeds certain amounts, or if certain defined operating ratios are not met, all of which are defined in the credit agreement. The final maturity date of all amounts borrowed pursuant to the credit agreement is September 30, 2012. At December 31, 2010, the Company does not have the ability to borrow any additional amounts under the Bank Loan.
In accordance with the terms of the credit agreement, beginning January 1, 2010 and through the maturity of the Bank Loan, the required leverage ratio was reduced to a maximum of 2.00 to 1.00 from a maximum of 2.50 to 1.00. In order to be in compliance with the leverage ratio test, management made a payment of $3,000,000 at March 31, 2010 in addition to the contractual minimum repayment of $1,000,000 due at that time. Although not required to do so, the Company made additional prepayments of $500,000 at the end of the second, third and fourth quarters of 2010 (aggregating $1,500,000), each of which was in excess of the minimum repayments due at such dates. All of the 2010 prepayments ratably reduced Reis Services’s future quarterly contractual minimum payments through maturity.
The loans are secured by a security interest in substantially all of the assets, tangible and intangible, of Reis Services and a pledge by the Company of its membership interest in Reis Services. The Bank Loan restricts the flow of cash from Reis Services up to the Company. However, commencing in 2009, the Bank Loan allows for a portion of the cash of Reis Services to be distributed to the Company for qualifying operating expenses of the Company if certain ratios are met, as defined in the credit agreement. These ratios have been met; however, no distributions from Reis Services up to the Company were made during 2010 or 2009.
The Bank Loan required interest rate protection in an aggregate notional principal amount of not less than 50% of the outstanding balance of the Bank Loan through June 30, 2010. An interest rate cap was purchased for $109,000 in June 2007, which capped LIBOR at 5.50% on $15,000,000 from June 2007 to June 2010. The cap had no value at December 31, 2009 and expired with no value at June 30, 2010.
Material Contractual Obligations
The following table summarizes material contractual obligations as of December 31, 2010:
|
(amounts in thousands)
|
Payments Due | |||||||||||||||||||||
|
|
For the Years Ended December 31,
|
|||||||||||||||||||||
|
Contractual Obligations
|
2011
|
2012 and 2013
|
2014 and 2015
|
Thereafter
|
Aggregate
|
|||||||||||||||||
|
Principal and interest payments for all debt obligations(A)
|
$ | 5,721 | $ | 5,741 | $ | — | $ | — | $ | 11,462 | ||||||||||||
|
Future minimum lease payments
|
1,413 | 2,912 | 3,030 | 1,164 | 8,519 | |||||||||||||||||
|
Total contractual obligations
|
$ | 7,134 | $ | 8,653 | $ | 3,030 | $ | 1,164 | $ | 19,981 | ||||||||||||
|
(A)
|
Includes interest at applicable spreads to LIBOR, utilizing LIBOR of 0.26%, which was the 30 day rate at December 31, 2010.
|
Other Items Impacting Liquidity
East Lyme
After the initial land purchase at East Lyme, the Company executed an agreement with a homebuilder to construct the homes for this project. The homebuilder was a 5% partner in the project and received other consideration. In March 2009, the Company and the homebuilder/partner terminated the partnership agreement and the related development agreement. As a result of the terminations, the Company paid approximately $343,000 to its partner to satisfy all remaining compensation under the development agreement and to purchase its 5% interest.
Home sales at East Lyme commenced in June 2006. The Company sold two lots and one home during the year ended December 31, 2010 for gross sales proceeds of approximately $628,000 and sold three lots and three homes during the year ended December 31, 2009 for gross sales proceeds of approximately $2,087,000.
The Company is working with a broker to sell the remaining 119 lots in one or more bulk sale transactions. There can be no assurance that the Company will be able to sell the remaining 119 lots in one or more bulk transactions at acceptable prices, or within a specific time period, or at all.
Certain of the lots at East Lyme require remediation of pesticides which were used on the property when it was an apple orchard. Remediation is required prior to the development of those lots. The remediation plan, the cost of which is estimated by management to be approximately $1,000,000, has been approved by the health inspector for the municipality and the town planner. The estimated remediation cost is recognized as a liability in the December 31, 2010 and 2009 consolidated balance sheets. This estimate could change in the future if a change to the remediation plan is made, as contractors are hired and if the bulk sale of lots, as described above, were to occur. An expected time frame for the remediation has not been established as of the date of this report.
Completed Real Estate Projects
Claverack
As of December 31, 2009, the Company owned approximately 235 acres in Claverack, New York, known as The Stewardship, which was subdivided into 48 developable single family home lots. Construction of two model homes (which commenced in 2007), the infrastructure and amenities for The Stewardship were substantially completed during the third quarter of 2008.
In February 2010, the Company sold the Claverack project in a bulk transaction for a gross sales price of $2,750,000, which included two model homes, amenities, 46 additional lots and $450,000 of cash collateralizing certain road completion obligations. Net cash received at closing, after expenses, aggregated approximately $2,187,000. The remaining $450,000 of the purchase price was payable by the purchaser in February 2011 and was secured by the outstanding road bond and a mortgage on the property. As a result of this transaction, the Company recorded gross profit of approximately $263,000 in the first quarter of 2010. On February 17, 2011, the Company received cash of approximately $455,000 in satisfaction of the mortgage note and accrued interest thereon.
Gold Peak
In September 2009, the Company sold the final unit at Gold Peak, the final phase of Palomino Park, a five phase multifamily residential development in Highlands Ranch, Colorado. Gold Peak was a 259 unit condominium project on the remaining 29 acre land parcel at Palomino Park. During the year ended December 31, 2009, the Company sold 20 Gold Peak condominium units for gross sales proceeds of approximately $4,973,000.
Real Estate Contingencies
Reis has purchased insurance with respect to construction defect and completed operations at its real estate projects. Reis is, from time to time, exposed to various claims associated with the development, construction and sale of condominium units, single family homes or lots. These claims have not been material to date. However, claims related to environmental remediation, dissatisfaction by homeowners and homeowners’ associations with the construction of condominiums, homes and amenities by us and/or our developer partners in any condominium or subdivision development, or other matters, may result in litigation costs, remediation costs, warranty expenses or settlement costs which could be material to Reis’s results of operations and financial condition.
Issuer Purchases of Equity Securities
In June 2010, the Board authorized the repurchase of up to an aggregate amount of $1,000,000 of the Company’s common stock. Previously, the Board had authorized the repurchase of an aggregate of $3,000,000 of the Company’s shares. In April 2010, the Company completed repurchases under the initial $3,000,000 authorization. The program permits purchases from time to time in the open market or through privately negotiated transactions. Depending on market conditions, financial developments and other factors, purchases could be commenced or suspended at any time, or from time to time, without prior notice and the program may be expanded with prior notice. The Company may make purchases pursuant to a trading plan under Securities Exchange Act Rule 10b5-1, permitting open market purchases of common stock during blackout periods consistent with the Company’s “Policies for Transactions in Reis Stock and Insider Trading and Tipping.”
During the year ended December 31, 2010, the Company purchased 175,232 shares of common stock at an average price of $6.71 per share. During 2009, the Company purchased 660,444 shares of common stock at an average price of $4.26 per share. From the inception of the share repurchase programs in December 2008 through December 17, 2010, the Company purchased an aggregate of 838,076 shares of common stock at an average price of $4.77 per share, for an aggregate of $4,000,000. Under the repurchase programs, the Company repurchased approximately 7.6% of the common shares outstanding at the time of the Board’s initial authorization in December 2008.
Stock Plans and Options Accounted for As Liability Awards
The Company has adopted certain incentive plans, which we refer to as the Incentive Plans, for the purpose of attracting and retaining the Company’s directors, officers and employees by having the ability to issue options, restricted stock units, or RSUs, or stock awards. Awards granted under the Incentive Plans expire ten years from the date of grant and vest over periods ranging generally from three to five years for employees.
Certain outstanding options allow the option holder to receive from the Company, in cancellation of the holder’s option, a cash payment with respect to each cancelled option equal to the amount by which the fair market value of the share of stock underlying the option exceeds the exercise price of such option. The Company accounts for these options as liability awards. This liability is adjusted at the end of each reporting period to reflect (1) the net cash payments to option holders made during each period, (2) the impact of the exercise and expiration of options and (3) the changes in the market price of the Company’s common stock. Changes in the settlement value of option awards treated under the liability method are reflected as income or expense in the statements of operations. At December 31, 2010, of the 680,896 outstanding options, 70,896 options are accounted for as a liability as these awards provide for settlement in cash or in stock at the election of the option holder. At December 31, 2009, of the 473,620 outstanding options, 88,620 options were accounted for as a liability award.
At December 31, 2010, the liability for option cancellations was approximately $158,000 based upon the difference in the closing stock price of the Company at December 31, 2010 of $7.03 per share and the individual exercise prices of the outstanding 70,896 “in-the-money” options that were accounted for as a liability award at that date. At December 31, 2009, the liability for option cancellations was approximately $126,000 based upon the difference in the closing stock price of the Company at December 31, 2009 of $6.15 per share and the individual exercise prices of the outstanding 88,620 “in-the-money” options that were accounted for as a liability award at that date. The Company recorded compensation expense of approximately $54,000 and $139,000 for the years ended December 31, 2010 and 2009, respectively, in general and administrative expenses in the statements of operations.
An aggregate of 8,862 and 8,862 options were settled with net cash payments aggregating approximately $22,000 and $14,000 during the years ended December 31, 2010 and 2009, respectively.
The liability for option cancellations could materially change from period to period based upon (1) an option holder either (a) exercising the options in a traditional manner or (b) electing the net cash settlement alternative and (2) the changes in the market price of the Company’s common stock. At each period end, an increase in the Company’s common stock price would result in an
increase in compensation expense, whereas a decline in the stock price would reduce compensation expense. In December 2011, an aggregate of 17,724 options accounted for as liability awards are scheduled to expire.
The Effects of Inflation/Declining Prices and Trends
Reis Services
The Company monitors commercial real estate industry and market trends to determine their potential impact on its products and product development initiatives. The volatility and uncertainty in the U.S. and global economy in 2008 and 2009, including the credit markets and real estate markets, negatively affected renewal rates, with the greatest impact on the Company being felt between the beginning of the fourth quarter of 2008 and continuing through June 30, 2009. Because of budget constraints at certain subscribers and potential subscribers, the effective shutdown of the CMBS markets and the flurry of mergers and bankruptcies of financial institutions in the fall of 2008 (some of which were subscribers of the Company), the Company was negatively impacted as exhibited by our revenue reductions throughout 2009. However, in 2010, we experienced a positive trend of revenue growth as the second, third, and fourth quarters of 2010 had revenue growth as compared to the corresponding quarters of 2009 and 2010 revenue exceeded 2009 revenue on an annual basis. Our overall annual renewal rate is 91% for the trailing twelve months ended December 31, 2010; an improvement from 86% for the trailing twelve months ended December 31, 2009. This positive trend in renewal rates will continue to be reflected in future quarterly revenues. The fourth quarter and full year of 2010 were record periods for the Company for total contracts signed (based upon the value of annual subscriptions executed in those periods for both new and renewal business). The fourth quarter of 2010 also represented the best quarter for new business, based upon the value of annual subscriptions executed in that period and the 2010 annual period was the second best annual period for total contracts signed (trailing only the 2007 annual period). The level of contract signings in 2010, and specifically in the fourth quarter of 2010, resulted in revenue growth in the fourth quarter of 2010 and should translate into revenue growth in 2011 over 2010 amounts. These trends and results are evidenced by the significant increase in both our reported amounts of deferred revenue and Aggregate Revenue Under Contract at December 31, 2010. There can be no assurance that the increase in the trailing twelve month renewal rates experienced from the middle of 2009 through December 31, 2010 will further improve or continue and that new or renewal business will continue to grow in the future.
The Company has historically mitigated market pressures by continuing to add new subscribers, selling new products and identifying additional and/or alternative users within the organizations and institutions that are current subscribers. Historically, during periods of economic and commercial real estate market volatility, as was the case during 2008 and 2009, we generally experienced stable or only moderately lower demand for our market information and an increase in demand for our portfolio products, despite (or in many cases, because of) decreased transaction volumes, as investors placed greater emphasis on assessing portfolio risk. Even though we continue to broaden the appeal and utility of our database, tools and functionality, we cannot assure you that the level of demand for Reis Services’s products will be sustained or increase during 2011 or in the future.
Lot and Land Sales in the Residential Development Activities Segment
Although the Company sold its Claverack project in bulk in February 2010, the Company’s operations relating to the sale of individual and bulk lots have been negatively impacted by poor national, regional and local market conditions where the Company owns property. Illiquidity in the residential mortgage and construction/development loan markets has negatively impacted our marketing efforts and the ability of buyers (developers, local builders or land investors) to afford and/or finance the purchase of lots, either individually or in bulk, as well as their inability to finance required infrastructure work, causing us to reduce our asking price. The number and timing of future sales by the Company could be adversely impacted by the lack of availability of credit to potential buyers and, in the case of developers and local builders, the inability to sell inventory they build to individual buyers who may be unable to obtain financing. At December 31, 2010, 119 lots remain in inventory at the East Lyme project. We intend to sell the remaining 119 East Lyme lots in one or more bulk transactions.
Changes in Cash Flows
Comparison of Cash Flows for the Years Ended December 31, 2010 and 2009
Cash flows for the years ended December 31, 2010 and 2009 are summarized as follows:
|
For the Years Ended
December 31,
|
||||||||||
|
2010
|
2009
|
|||||||||
|
Net cash provided by operating activities
|
$ | 9,665,189 | $ | 11,638,181 | ||||||
|
Net cash (used in) investing activities
|
(2,647,161 | ) | (1,437,633 | ) | ||||||
|
Net cash (used in) financing activities
|
(9,589,481 | ) | (11,617,028 | ) | ||||||
|
Net (decrease) in cash and cash equivalents
|
$ | (2,571,453 | ) | $ | (1,416,480 | ) | ||||
Cash flows provided by operating activities decreased $1,973,000 from $11,638,000 provided in the 2009 period to $9,665,000 provided in the 2010 period. The decrease in cash flows from operating activities is a function of increased uses of cash in the 2010 period related to accrued expenses due to the timing of payments and settlement of employment and other contractual obligations previously accrued for and a decrease in real estate sales between the two periods. These decreases were offset by an increase in the cash flows from operating activities of the Reis Services segment of $1,910,000 from $9,243,000 provided in the 2009 period to $11,153,000 provided in the 2010 period primarily due to increased collections in the 2010 period.
Cash flows used in investing activities increased $1,209,000 from $1,438,000 used in the 2009 period to $2,647,000 used in the 2010 period. This change primarily resulted from an increase in cash used in the 2010 period as compared to the 2009 period for web site and database development costs of $870,000 and furniture, fixtures and equipment additions of $17,000, coupled with the 2009 proceeds from the sale of an investment in a variable interest entity of $332,000, offset by $10,000 of furniture, fixtures and equipment dispositions in 2010.
Cash flows used in financing activities decreased $2,028,000 from $11,617,000 used in the 2009 period to $9,589,000 used in the 2010 period. During the 2010 period, $8,028,000 was repaid on the Bank Loan (including $4,500,000 of payments in excess of scheduled payments), whereas only $3,500,000 of scheduled payments were made in the 2009 period. During the 2009 period, $5,077,000 was repaid on the East Lyme construction loan to satisfy that obligation. During the year ended December 31, 2009, the Company repurchased 660,444 shares of its outstanding common stock for approximately $2,816,000 as compared to the 2010 period where the Company repurchased 175,232 shares of its outstanding common stock for approximately $1,175,000. Other debt repayments in the 2009 period exceeded the payments in the 2010 period by $4,000. Payments for option cancellations and restricted stock unit settlements were approximately $240,000 and $35,000 in the 2010 and 2009 periods, respectively. The 2010 period included proceeds received from option exercises of $39,000, with no corresponding exercise in the 2009 period.
Selected Significant Accounting Policies
Management has identified the following accounting policies which it believes are significant in understanding the Company’s activities, financial position and operating results.
Basis of Presentation
The accompanying consolidated financial statements include the accounts of the Company and its majority-owned and controlled subsidiaries. Investments in entities where the Company does not have a controlling interest are accounted for under the equity method of accounting. These investments were initially recorded at cost and were subsequently adjusted for the Company’s proportionate share of the investment’s income (loss) and additional contributions or distributions. All significant inter-company accounts and transactions among the Company and its subsidiaries have been eliminated in consolidation.
Intangible Assets, Amortization and Impairment
Web Site Development Costs
The Company expenses all internet web site costs incurred during the preliminary project stage. Thereafter, all direct external and internal development and implementation costs are capitalized and amortized using the straight-line method over their remaining estimated useful lives, not exceeding three years. The value ascribed to the web site intangible asset acquired at the time of the
Merger was amortized on a straight-line basis over three years, and during 2010, this ascribed value was fully amortized. Amortization of all capitalized web site development costs is charged to product development expense.
Database Costs
The Company capitalizes costs for the development of its database in connection with the identification and addition of new real estate properties and sale transactions which provide a future economic benefit. Amortization is calculated on a straight-line basis over a three or five year period. Costs of updating and maintaining information on existing properties in the database are expensed as incurred. The value ascribed to the database intangible asset acquired at the time of the Merger is amortized on a straight-line basis over three or five years, and during 2010, the ascribed value which had a three year amortizable life was fully amortized. Amortization of all capitalized database costs is charged to cost of sales.
Customer Relationships
The value ascribed to customer relationships acquired at the time of the Merger is amortized over 15 years on an accelerated basis and is charged to sales and marketing expense.
Lease Value
The value ascribed to the below market terms of the office lease existing at the time of the Merger is amortized over the remaining term of the acquired office lease which was approximately nine years. Amortization is charged to general and administrative expenses.
Goodwill and Intangible Asset Impairment
Goodwill and a major portion of the other intangible assets were recorded at the time of the Merger. As a result of the tax treatment of the Merger, goodwill and the acquired intangible assets are not deductible for income tax purposes.
Goodwill is not amortized and is tested for impairment at least annually, or after a triggering event has occurred, requiring such a calculation. The evaluation is based upon a comparison of the estimated fair value of the reporting unit to which the goodwill has been assigned with the reporting unit’s carrying value. The fair values used in this evaluation are estimated based upon market projections for the reporting unit. These market projections utilize a number of estimates and assumptions, such as EBITDA multiples, market comparisons, and quoted market prices. If the fair value of the reporting unit exceeds its carrying value, goodwill is not deemed to be impaired. If the fair value of the reporting unit is less than its carrying value, a second step is required to calculate the implied fair value of goodwill by deducting the fair value of all tangible and intangible net assets of the reporting unit from the fair value of the reporting unit. There was no goodwill impairment identified in 2010 or 2009.
Intangible assets, with determinable useful lives, are amortized over their respective estimated useful lives using a method of amortization that reflects the pattern in which the economic benefits of the intangible assets are consumed or otherwise used up. In addition, the carrying amount of amortizable intangible assets are reviewed annually for impairment. If estimated future undiscounted net cash flows are less than the carrying amount of the asset, the asset would be considered impaired. An impairment charge would be determined by comparing the estimated fair value of the intangible asset to its carrying value, with any shortfall from fair value recognized as an expense in the current period. There was no intangible asset impairment identified in 2010 or 2009.
Real Estate and Impairment
Costs directly related to the acquisition, development and improvement of real estate were capitalized, including interest and other costs incurred during the construction period. Ordinary repairs, maintenance and project operating costs are expensed as incurred.
The Company has historically reviewed its real estate assets for impairment (1) whenever events or changes in circumstances indicate that the carrying amount of an asset may not be recoverable for assets held for use and (2) when a determination is made to sell an asset or investment. If estimated cash flows on an undiscounted basis are insufficient to recover the carrying amount of an asset, an impairment loss equal to the excess of the carrying amount over estimated fair value is recognized. No impairment charges were recorded during 2010 or 2009 related to the Company’s real estate assets.
Revenue Recognition and Related Items
The Company’s subscription revenue is derived principally from subscriptions to its web-based services for its Reis SE product and is recognized as revenue ratably over the related contractual period, which is typically one year but can be as long as 48 months.
Revenues from ad-hoc and custom reports or projects are recognized as completed and delivered to the customers, provided that no significant Company obligations remain. Revenues from the ReisReports product are recognized monthly as billed. Deferred revenue represents the portion of a subscription billed or collected in advance under the terms of the respective contract, which will be recognized in future periods. If a customer does not meet the payment obligations of a contract, any related accounts receivable and deferred revenue are written off at that time and the net amount, after considering any recovery of accounts receivable, is charged to cost of sales.
Cost of sales of subscription revenue principally consists of salaries and related expenses for the Company’s researchers who collect and analyze the commercial real estate data that is the basis for the Company’s information services. Additionally, cost of sales includes the amortization of database technology.
Revenue from sales of real estate, including condominium units, single family homes and sales of lots individually or in bulk are recognized at closing subject to receipt of down payments and other requirements in accordance with applicable accounting guidelines. The percentage of completion method was not used for recording sales on condominium units as downpayments were nominal and collectability of the sales price from such a deposit was not reasonably assured until closing.
Interest revenue is recorded on an accrual basis.
Income Taxes
Deferred income tax assets and liabilities are determined based upon differences between the financial reporting basis and the tax basis of assets and liabilities, and are measured using the enacted tax rates and laws that are estimated to be in effect when the differences are expected to reverse. Valuation allowances with respect to deferred income tax assets are recorded when deemed appropriate and adjusted based upon periodic evaluations.
The Company evaluates its tax positions in accordance with applicable current accounting literature. Recognition of uncertain tax positions (step one) occurs when an enterprise concludes that a tax position, based solely on its technical merits, is more-likely-than-not to be sustained upon examination. Measurement (step two) determines the amount of benefit that more-likely-than-not will be realized upon settlement. Derecognition of a tax position that was previously recognized would occur when a company subsequently determines that a tax position no longer meets the more-likely-than-not threshold of being sustained or there is a satisfactory resolution of the tax position.
Share Based Compensation
The fair market value as of the grant date of awards of stock, restricted stock units or certain stock options is recognized as compensation expense by the Company over the respective vesting periods.
The Company estimated the fair value of each option granted on the date of grant using the Black-Scholes option-pricing model. The following table includes the assumptions that were made and the estimated fair value for option grants in 2010 (no option awards were granted during 2009):
|
2010 Grant
|
||||||
|
Stock price on grant date
|
$ | 6.42 | ||||
|
Exercise price
|
$ | 8.03 | ||||
|
Dividend yield
|
— | |||||
|
Risk-free interest rate
|
1.70 | % | ||||
|
Expected life
|
5.2 years
|
|||||
|
Estimated volatility
|
60.9 | % | ||||
|
Fair value of options granted (per option)
|
$ | 3.08 | ||||
Although the initial fair value of stock options is not adjusted after the grant date, changes in the Company’s assumptions may change the value of, and therefore the expense related to, future stock option grants. The assumptions that cause the greatest variation in fair value are the expected volatility and expected life of the option. Increases or decreases in either the expected volatility or expected life of the option will cause the fair value to increase or decrease, respectively. The volatility assumption of approximately 61% considers both historical and implied volatility and may be impacted by the Company’s performance as well as changes in economic and market conditions. The expected life of 5.2 years for the options was determined based upon historical exercise patterns and a probability weighted exercise analysis. If the estimated volatility used by the Company during 2010 was increased to 66% and the expected life used by the Company during 2010 was increased to 5.6 years, the fair value of the options would have increased to $3.46 per option,
or 12.3%. If the estimated volatility used by the Company during 2010 was decreased to 56% and the expected life used by the Company during 2010 was decreased to 4.8 years, the fair value of the options would have decreased to $2.68 per option, or 13.0%.
The Company’s primary market risk exposure has been to changes in interest rates. This risk is generally managed by limiting the Company’s financing exposures, to the extent possible, by purchasing interest rate caps when deemed appropriate.
At December 31, 2010, the Company’s only exposure to interest rates was variable rate based debt. This exposure has historically been minimized through the use of interest rate caps. The interest rate cap on the Bank Loan expired at June 30, 2010. The following tables present the effect of a 1% increase in the applicable base rates of variable rate debt at December 31, 2010 and 2009, respectively:
|
(amounts in thousands)
|
Balance at
December 31,
2010
|
LIBOR at
December 31,
2010
|
Additional
Interest
Incurred
|
|
|||||||||||
|
Variable rate debt:
|
|||||||||||||||
|
Bank Loan
|
$ | 11,222 | 0.26 | % | $ | 112 | (A) | ||||||||
|
Balance at
December 31,
2009
|
Notional
Amount at
December 31,
2009
|
LIBOR
Cap
|
LIBOR at
December 31,
2009
|
Additional
Interest
Incurred
|
|||||||||||||||||||
|
Variable rate debt with interest rate caps:
|
|||||||||||||||||||||||
|
Bank Loan
|
$ | 19,250 | $ | 15,000 | 5.50 | % | 0.23 | % | $ | 193 | (A) | ||||||||||||
|
(A)
|
Reflects additional interest which could be incurred annually on the loan balance amount as a result of a 1% increase in LIBOR. It does not take into consideration future periodic repayments.
|
Although the interest rate cap expired at June 30, 2010, our interest rate exposure on the Bank Loan will continue to diminish significantly as a result of increased scheduled principal repayments during 2011 of approximately $5,531,000.
Reis holds cash and cash equivalents at various regional and national banking institutions. Management monitors the institutions that hold our cash and cash equivalents. Management’s emphasis is primarily on safety of principal. Management, in its discretion, has diversified Reis’s cash and cash equivalents among banking institutions to potentially minimize exposure to any one of these entities. To date, we have experienced no loss or lack of access to our invested cash or cash equivalents; however, we can provide no assurances that access to invested cash and cash equivalents will not be impacted by adverse conditions in the financial markets.
Cash balances held at banking institutions with which we do business may exceed the Federal Deposit Insurance Corporation insurance limits. While management monitors the cash balances in these bank accounts, such cash balances could be impacted if the underlying banks fail or could be subject to other adverse conditions in the financial markets.
The response to this Item 8 is included as a separate section of this annual report on Form 10-K starting at page F-1 and is incorporated by reference herein.
None.
Evaluation of Disclosure Controls and Procedures
As of December 31, 2010, the Company carried out an evaluation, under the supervision and with the participation of our management, including our Chief Executive Officer and Chief Financial Officer, of the effectiveness of our disclosure controls and procedures (as defined in Rule 13a-15(e) or Rule 15d-15(e) under the Securities Exchange Act of 1934, as amended (the “Exchange Act”)). Based on this evaluation, our Chief Executive Officer and Chief Financial Officer have concluded that our disclosure controls and procedures as of December 31, 2010 were designed at a reasonable assurance level and were effective to ensure that information required to be disclosed by the Company in the reports that the Company files or submits under the Exchange Act is recorded,
processed, summarized and reported within the time periods specified in the SEC rules and forms, and to ensure that such information is accumulated and communicated to the Company's management, including the Chief Executive Officer and Chief Financial Officer, as appropriate, to allow timely decisions regarding required disclosure.
Changes in Internal Control Over Financial Reporting
We regularly review our system of internal control over financial reporting and make changes to our processes and systems to improve controls and increase efficiency, while ensuring that we maintain an effective internal control environment. There were no changes in our internal control over financial reporting that have materially affected, or are reasonably likely to materially affect, our internal control over financial reporting during the fourth quarter of 2010.
Management's Report On Internal Control Over Financial Reporting
Management of the Company is responsible for establishing and maintaining adequate internal control over financial reporting and for the assessment of the effectiveness of internal control over financial reporting. Internal control over financial reporting is defined in Rules 13a-15(f) and 15d-15(f) under the Exchange Act as a process designed by, or under the supervision of, the Company’s principal executive and principal financial officers and effected by the Company’s Board of Directors, management and other personnel to provide reasonable assurance regarding the reliability of financial reporting and the preparation of financial statements for external purposes in accordance with U.S. generally accepted accounting principles. The Company’s internal control system was designed to provide reasonable assurance to our management and Board of Directors regarding the preparation and fair presentation of published financial statements.
All internal control systems, no matter how well designed, have inherent limitations. Therefore, even those systems determined to be effective can provide only reasonable assurance with respect to financial statement preparation and presentation.
The Company’s management assessed the effectiveness of the Company’s internal control over financial reporting as of December 31, 2010. In making this assessment, management used the criteria set forth by Committee of Sponsoring Organizations of the Treadway Commission in “Internal Control - Integrated Framework.” Based upon this assessment, management concluded that, as of December 31, 2010, our internal control over financial reporting is effective in accordance with those criteria.
This annual report does not include an attestation report of the Company’s registered public accounting firm regarding internal control over financial reporting. Management’s report was not subject to attestation by the Company’s registered public accounting firm pursuant to the Securities and Exchange Commission rules and regulations that permit the Company to provide only management’s report in this annual report.
None.
PART III
The executive officers and directors of the Company, their ages and their positions are as follows:
|
Name
|
Age
|
Positions and Offices Held
|
||||
|
Edward Lowenthal
|
66 |
Chairman of the Board and Director**
|
||||
|
Lloyd Lynford
|
55 |
Chief Executive Officer, President and Director*
|
||||
|
Jonathan Garfield
|
54 |
Executive Vice President and Director**
|
||||
|
Mark P. Cantaluppi
|
40 |
Vice President, Chief Financial Officer
|
||||
|
William Sander
|
43 |
Chief Operating Officer, Reis Services
|
||||
|
Thomas J. Clarke Jr.
|
54 |
Director***
|
||||
|
Michael J. Del Giudice
|
68 |
Director***
|
||||
|
Meyer S. Frucher
|
64 |
Director**
|
||||
|
Jeffrey H. Lynford
|
63 |
Director*
|
||||
|
M. Christian Mitchell
|
56 |
Director*
|
||||
|
Byron C. Vielehr
|
47 |
Director***
|
||||
|
*
|
Term expires during 2011.
|
||
|
**
|
Term expires during 2012.
|
||
|
***
|
Term expires during 2013.
|
To the extent responsive to the requirements of this item, information contained in the Company’s definitive proxy statement for the 2011 annual meeting of stockholders is incorporated herein by reference.
To the extent responsive to the requirements of this item, information contained in the Company’s definitive proxy statement for the 2011 annual meeting of stockholders is incorporated herein by reference.
To the extent responsive to the requirements of this item, information contained in the Company’s definitive proxy statement for the 2011 annual meeting of stockholders is incorporated herein by reference.
To the extent responsive to the requirements of this item, information contained in the Company’s definitive proxy statement for the 2011 annual meeting of stockholders is incorporated herein by reference.
To the extent responsive to the requirements of this item, information contained in the Company’s definitive proxy statement for the 2011 annual meeting of stockholders is incorporated herein by reference.
PART IV
(a) (1) Financial Statements
|
Consolidated Balance Sheets at December 31, 2010 and 2009
|
|
|
Consolidated Statements of Operations for the Years Ended December 31, 2010 and 2009
|
|
|
Consolidated Statements of Changes in Stockholders’ Equity for the Years Ended December 31, 2010 and 2009
|
|
|
Consolidated Statements of Cash Flows for the Years Ended December 31, 2010 and 2009
|
|
|
Notes to Consolidated Financial Statements
|
(a) (2) Financial Statement Schedules
All schedules have been omitted because the required information for such schedules is not present, is not present in amounts sufficient to require submission of the schedule or because the required information is included in the consolidated financial statements.
(a) (3) Exhibits
|
Exhibit No.
|
Description
|
||
| 3.1 |
Articles of Amendment and Restatement filed on May 30, 1997 (incorporated by reference to Exhibit 3.1 to the Company’s Registration Statement on Form S-11 (File No. 333-32445) filed on July 30, 1997).
|
||
| 3.2 |
Articles Supplementary (incorporated by reference to Exhibit 3.1 to the Company’s Current Report on Form 8-K filed on December 21, 2006).
|
||
| 3.3 |
Articles of Amendment (incorporated by reference to Exhibit 3.1 to the Company’s Current Report on Form 8-K filed on June 4, 2007).
|
||
| 3.4 |
Articles Supplementary (incorporated by reference to Exhibit 3.2 to the Company’s Current Report on Form 8-K filed on June 30, 2008.)
|
||
| 3.5 |
Amended and Restated Bylaws (incorporated by reference to Exhibit 3.1 to the Company’s Current Report on Form 8-K filed on June 30, 2008).
|
||
| 4.1 |
The rights of the Company’s equity security holders are defined in Articles V and VI of Exhibit 3.1 above.
|
||
| 4.2 |
Specimen certificate for common stock (incorporated by reference to Exhibit 4.1 to the Company’s Registration Statement on Form 8-A filed on November 29, 2007).
|
||
| 4.3 |
Registration Rights Agreement dated as of May 30, 2007 among Wellsford, Lloyd Lynford and Jonathan Garfield (incorporated by reference to Exhibit 3 to the Schedule 13D filed by Jonathan Garfield with respect to the Company on June 8, 2007).
|
||
| 10.1 |
Credit Agreement, dated as of October 11, 2006, among Reis, Inc. (a Delaware corporation), as Borrower, the Lenders listed therein, as Lenders, Bank of Montreal, Chicago Branch, as Administrative Agent, and BMO Capital Markets, as Lead Arranger (incorporated by reference to Exhibit 10.34 to Amendment No. 1 to the Company’s Registration Statement on Form S-4 (File No. 333-139705) filed on March 9, 2007).
|
||
| 10.2 |
Amended and Restated Wellsford Real Properties, Inc. 1998 Management Incentive Plan (incorporated by reference to Exhibit 10.2 to the Company’s Annual Report on Form 10-K for the year ended December 31, 2006). *
|
||
| 10.3 |
Amendment to Amended and Restated Wellsford Real Properties, Inc. 1998 Management Incentive Plan (incorporated by reference to page F-13 of Annex F to the Company’s proxy statement/prospectus (File No. 333-139705) filed on May 2, 2007). *
|
||
| 10.4 |
Reis, Inc. 2008 Omnibus Incentive Plan (incorporated by reference to Annex A to the Company’s proxy statement filed on April 25, 2008). *
|
||
| 10.5 |
Reis, Inc. 2008 Annual Incentive Compensation Plan (incorporated by reference to Annex B to the Company’s proxy statement filed on April 25, 2008). *
|
||
| 10.6 |
Employment Agreement dated as of July 29, 2010, among Reis, Inc., Reis Services, LLC and Lloyd Lynford (incorporated by reference to Exhibit 10.1 to the Company’s Current Report on Form 8-K filed on August 5, 2010).
|
||
| 10.7 |
Employment Agreement dated as of July 29, 2010, among Reis, Inc., Reis Services, LLC and Jonathan Garfield (incorporated by reference to Exhibit 10.2 to the Company’s Current Report on Form 8-K filed on August 5, 2010).
|
||
| 10.8 |
Employment Agreement dated as of July 30, 2010, among Reis, Inc., Reis Services, LLC and Mark P. Cantaluppi (incorporated by reference to Exhibit 10.3 to the Company’s Current Report on Form 8-K filed on August 5, 2010).
|
||
| 10.9 |
Employment Agreement dated as of July 29, 2010, between Reis Services, LLC and William Sander (with Reis, Inc. a party thereto for limited purposes) (incorporated by reference to Exhibit 10.4 to the Company’s Current Report on
|
| Form 8-K filed on August 5, 2010). | |||
| 14.1 |
Reis, Inc. Code of Business Conduct and Ethics for Directors, Senior Financial Officers, Other Officers and All Other Employees (incorporated by reference to Exhibit 14.1 to the Company’s Annual Report on Form 10-K for the year ended December 31, 2007).
|
||
| 21.1 |
Subsidiaries of the Registrant
|
||
| 23.1 |
Consent of Ernst & Young LLP
|
||
| 31.1 |
Chief Executive Officer Certification pursuant to Section 302 of the Sarbanes-Oxley Act of 2002
|
||
| 31.2 |
Chief Financial Officer Certification pursuant to Section 302 of the Sarbanes-Oxley Act of 2002
|
||
| 32.1 |
Chief Executive Officer and Chief Financial Officer Certifications pursuant to Section 906 of the Sarbanes-Oxley Act of 2002
|
||
|
*
|
This document is either a management contract or compensatory plan.
|
|
|
(b)
|
Those exhibits listed in Item 15(a)(3) above and not indicated as “incorporated by reference” are filed as exhibits to this Form 10-K.
|
|
|
(c)
|
Not applicable.
|
|
SIGNATURES
Pursuant to the requirements of Section 13 or 15(d) of the Securities Exchange Act of 1934, the Registrant has duly caused this report to be signed on its behalf by the undersigned, thereunto duly authorized.
|
| REIS, INC. | |||||
| By: | /s/ Mark P. Cantaluppi | ||||
|
|
Mark P. Cantaluppi
Vice President, Chief Financial Officer
|
||||
|
Dated: March 11, 2011
Pursuant to the requirements of the Securities Exchange Act of 1934, this report has been signed below by the following persons on behalf of the Registrant and in the capacities and on the dates indicated.
|
|
Name
|
Title
|
Date
|
||||
|
/s/ Lloyd Lynford
|
Chief Executive Officer, President and Director
|
March 11, 2011
|
||||
|
Lloyd Lynford
|
(Principal Executive Officer) | |||||
| /s/ Mark P. Cantaluppi |
Vice President, Chief Financial Officer
|
March 11, 2011
|
||||
|
Mark P. Cantaluppi
|
(Principal Financial and Accounting Officer) | |||||
| /s/ Edward Lowenthal | Chairman of the Board and Director | March 11, 2011 | ||||
| Edward Lowenthal | ||||||
| /s/ Thomas J. Clarke Jr. | Director | March 11, 2011 | ||||
| Thomas J. Clarke Jr. | ||||||
|
/s/ Michael J. Del Giudice
|
Director
|
March 11, 2011
|
||||
|
Michael J. Del Giudice
|
||||||
|
/s/ Meyer S. Frucher
|
Director
|
March 11, 2011
|
||||
|
Meyer S. Frucher
|
||||||
|
/s/ Jonathan Garfield
|
Director
|
March 11, 2011
|
||||
|
Jonathan Garfield
|
||||||
| /s/ Jeffrey H. Lynford | Director | March 11, 2011 | ||||
| Jeffrey H. Lynford | ||||||
|
/s/ M. Christian Mitchell
|
Director
|
March 11, 2011
|
||||
| M. Christian Mitchell | ||||||
| /s/ Byron C. Vielehr | Director | March 11, 2011 | ||||
| Byron C. Vielehr |
REIS, INC.
INDEX TO CONSOLIDATED FINANCIAL STATEMENTS
|
Report of Independent Registered Public Accounting Firm
|
F-2
|
||
|
Consolidated Balance Sheets at December 31, 2010 and 2009
|
F-3
|
||
|
Consolidated Statements of Operations for the Years Ended December 31, 2010 and 2009
|
F-4
|
||
|
Consolidated Statements of Changes in Stockholders’ Equity for the Years Ended December 31, 2010 and 2009
|
F-5
|
||
|
Consolidated Statements of Cash Flows for the Years Ended December 31, 2010 and 2009
|
F-6
|
||
|
Notes to Consolidated Financial Statements
|
F-7
|
||
|
FINANCIAL STATEMENT SCHEDULES
|
|||
| All schedules have been omitted because the required information for such schedules is not present, is not present in amounts sufficient to require submission of the schedule or because the required information is included in the consolidated financial statements. |
REPORT OF INDEPENDENT REGISTERED PUBLIC ACCOUNTING FIRM
|
The Board of Directors and Stockholders of Reis, Inc.
We have audited the accompanying consolidated balance sheets of Reis, Inc. (the “Company”) as of December 31, 2010 and 2009, and the related consolidated statements of operations, changes in stockholders’ equity and cash flows for the years then ended. These financial statements are the responsibility of the Company’s management. Our responsibility is to express an opinion on these financial statements based on our audits.
We conducted our audits in accordance with the standards of the Public Company Accounting Oversight Board (United States). Those standards require that we plan and perform the audit to obtain reasonable assurance about whether the financial statements are free of material misstatement. We were not engaged to perform an audit of the Company’s internal control over financial reporting. Our audits included consideration of internal control over financial reporting as a basis for designing audit procedures that are appropriate in the circumstances, but not for the purpose of expressing an opinion on the effectiveness of the Company’s internal control over financial reporting. Accordingly we express no such opinion. An audit includes examining, on a test basis, evidence supporting the amounts and disclosures in the financial statements, assessing the accounting principles used and significant estimates made by management, and evaluating the overall financial statement presentation. We believe that our audits provide a reasonable basis for our opinion.
In our opinion, the financial statements referred to above present fairly, in all material respects, the consolidated financial position of the Company at December 31, 2010 and 2009, and the consolidated results of its operations and its cash flows for the years then ended, in conformity with U.S. generally accepted accounting principles.
|
|||
| /s/ Ernst & Young LLP | |||
|
Chicago, Illinois
March 11, 2011
|
|||
|
December 31,
|
||||||||||
|
|
2010
|
2009
|
||||||||
|
ASSETS
|
||||||||||
|
Current assets:
|
||||||||||
|
Cash and cash equivalents
|
$ | 20,163,787 | $ | 22,735,240 | ||||||
|
Restricted cash and investments
|
1,005,483 | 1,507,193 | ||||||||
|
Receivables, prepaid and other assets
|
9,695,817 | 7,430,446 | ||||||||
|
Real estate assets
|
1,297,245 | 3,709,166 | ||||||||
|
Total current assets
|
32,162,332 | 35,382,045 | ||||||||
|
Furniture, fixtures and equipment, net
|
958,505 | 1,267,961 | ||||||||
|
Intangible assets, net of accumulated amortization of $14,891,406 and $10,454,529, respectively
|
18,576,606 | 20,416,385 | ||||||||
|
Goodwill
|
54,824,648 | 54,824,648 | ||||||||
|
Other assets
|
165,868 | 313,389 | ||||||||
|
Total assets
|
$ | 106,687,959 | $ | 112,204,428 | ||||||
|
LIABILITIES AND STOCKHOLDERS’ EQUITY
|
||||||||||
|
Current liabilities:
|
||||||||||
|
Current portion of other debt
|
$ | 27,851 | $ | 185,517 | ||||||
|
Current portion of Bank Loan
|
5,531,050 | 7,933,332 | ||||||||
|
Accrued expenses and other liabilities
|
4,782,026 | 6,317,480 | ||||||||
|
Liability for option cancellations
|
157,744 | 125,840 | ||||||||
|
Deferred revenue
|
15,446,248 | 12,192,751 | ||||||||
|
Total current liabilities
|
25,944,919 | 26,754,920 | ||||||||
|
Non-current portion of Bank Loan
|
5,690,940 | 11,316,668 | ||||||||
|
Other long-term liabilities
|
693,092 | 745,450 | ||||||||
|
Deferred tax liability, net
|
66,580 | 66,580 | ||||||||
|
Total liabilities
|
32,395,531 | 38,883,618 | ||||||||
|
Commitments and contingencies
|
||||||||||
|
Stockholders’ equity:
|
||||||||||
|
Common stock, $0.02 par value per share, 101,000,000 shares authorized, 10,472,010 and 10,398,329 shares issued and outstanding, respectively
|
209,440 | 207,966 | ||||||||
|
Additional paid in capital
|
99,347,837 | 99,045,546 | ||||||||
|
Retained earnings (deficit)
|
(25,264,849 | ) | (25,932,702 | ) | ||||||
|
Total stockholders’ equity
|
74,292,428 | 73,320,810 | ||||||||
|
Total liabilities and stockholders’ equity
|
$ | 106,687,959 | $ | 112,204,428 | ||||||
See Notes to Consolidated Financial Statements
|
|
For the Years Ended
December 31,
|
|||||||||
|
2010
|
2009
|
|||||||||
|
Revenue:
|
||||||||||
|
Subscription revenue
|
$ | 24,198,271 | $ | 23,891,683 | ||||||
|
Revenue from sales of real estate
|
3,377,934 | 7,059,740 | ||||||||
|
Total revenue
|
27,576,205 | 30,951,423 | ||||||||
|
Cost of sales:
|
||||||||||
|
Cost of sales of subscription revenue
|
5,844,888 | 5,568,431 | ||||||||
|
Cost of sales of real estate
|
2,800,974 | 4,986,222 | ||||||||
|
Total cost of sales
|
8,645,862 | 10,554,653 | ||||||||
|
Gross profit
|
18,930,343 | 20,396,770 | ||||||||
|
Operating expenses:
|
||||||||||
|
Sales and marketing
|
6,057,149 | 5,306,481 | ||||||||
|
Product development
|
1,810,845 | 1,818,269 | ||||||||
|
Property operating expenses
|
546,103 | 770,983 | ||||||||
|
General and administrative expenses, inclusive of increased costs attributable to stock based liability amounts of $53,748 and $139,353, respectively
|
9,784,641 | 11,214,457 | ||||||||
|
Total operating expenses
|
18,198,738 | 19,110,190 | ||||||||
|
Other income (expenses):
|
||||||||||
|
Interest and other income
|
123,302 | 315,090 | ||||||||
|
Interest expense
|
(407,054 | ) | (591,558 | ) | ||||||
|
Total other income (expenses)
|
(283,752 | ) | (276,468 | ) | ||||||
|
Income before income taxes
|
447,853 | 1,010,112 | ||||||||
|
Income tax (benefit) expense
|
(220,000 | ) | 6,000 | |||||||
|
Net income
|
$ | 667,853 | $ | 1,004,112 | ||||||
|
Net income per common share:
|
||||||||||
|
Basic
|
$ | 0.06 | $ | 0.09 | ||||||
|
Diluted
|
$ | 0.06 | $ | 0.09 | ||||||
|
Weighted average number of common shares outstanding:
|
||||||||||
|
Basic
|
10,510,699 | 10,693,249 | ||||||||
|
Diluted
|
10,756,482 | 10,920,822 | ||||||||
See Notes to Consolidated Financial Statements
|
Common Shares
|
Paid in
Capital
|
Retained
Earnings
(Deficit)
|
Total
Stockholders’
Equity
|
|||||||||||||||||||
|
Shares
|
Amount
|
|||||||||||||||||||||
|
Balance, January 1, 2009
|
10,988,623 | $ | 219,772 | $ | 100,384,302 | $ | (26,936,814 | ) | $ | 73,667,260 | ||||||||||||
|
Shares issued for vested employee restricted stock units
|
26,087 | 522 | (522 | ) | — | — | ||||||||||||||||
|
Shares issued for settlement of vested director restricted stock units
|
34,816 | 696 | (696 | ) | — | — | ||||||||||||||||
|
Option exercises
|
9,247 | 185 | 55,297 | — | 55,482 | |||||||||||||||||
|
Stock based compensation, net
|
— | — | 1,409,495 | — | 1,409,495 | |||||||||||||||||
|
Stock repurchases
|
(660,444 | ) | (13,209 | ) | (2,802,330 | ) | — | (2,815,539 | ) | |||||||||||||
|
Net income
|
— | — | — | 1,004,112 | 1,004,112 | |||||||||||||||||
|
Balance, December 31, 2009
|
10,398,329 | 207,966 | 99,045,546 | (25,932,702 | ) | 73,320,810 | ||||||||||||||||
|
Shares issued for vested employees restricted stock units
|
240,051 | 4,801 | (4,801 | ) | — | — | ||||||||||||||||
|
Option exercises
|
8,862 | 177 | 39,081 | — | 39,258 | |||||||||||||||||
|
Stock based compensation, net
|
— | — | 1,439,997 | — | 1,439,997 | |||||||||||||||||
|
Stock repurchases
|
(175,232 | ) | (3,504 | ) | (1,171,986 | ) | — | (1,175,490 | ) | |||||||||||||
|
Net income
|
— | — | — | 667,853 | 667,853 | |||||||||||||||||
|
Balance, December 31, 2010
|
10,472,010 | $ | 209,440 | $ | 99,347,837 | $ | (25,264,849 | ) | $ | 74,292,428 | ||||||||||||
See Notes to Consolidated Financial Statements
|
For the Years Ended
December 31,
|
||||||||||
|
2010
|
2009
|
|||||||||
|
cash flows from operating activities:
|
||||||||||
|
Net income
|
$ | 667,853 | $ | 1,004,112 | ||||||
|
Adjustments to reconcile to net cash provided by operating activities:
|
||||||||||
|
Gain on sale of underlying investment in a consolidated variable interest
entity
|
— | (100,519 | ) | |||||||
|
Depreciation
|
359,519 | 512,212 | ||||||||
|
Amortization of intangible assets
|
4,436,877 | 4,472,568 | ||||||||
|
Stock based compensation charges
|
1,657,875 | 1,430,533 | ||||||||
|
Changes in assets and liabilities:
|
||||||||||
|
Restricted cash and investments
|
51,710 | 1,574,276 | ||||||||
|
Real estate assets
|
2,411,921 | 3,138,119 | ||||||||
|
Receivables, prepaid and other assets
|
(1,667,850 | ) | (1,400,894 | ) | ||||||
|
Accrued expenses and other liabilities
|
(1,559,961 | ) | 796,668 | |||||||
|
Liability for option cancellations
|
53,748 | 139,352 | ||||||||
|
Deferred revenue
|
3,253,497 | 71,754 | ||||||||
|
Net cash provided by operating activities
|
9,665,189 | 11,638,181 | ||||||||
|
cash flows from investing activities:
|
||||||||||
|
Web site and database development costs
|
(2,597,098 | ) | (1,727,258 | ) | ||||||
|
Furniture, fixtures and equipment additions
|
(59,969 | ) | (42,743 | ) | ||||||
|
Proceeds from sale of underlying investment in a consolidated variable interest entity
|
— | 332,368 | ||||||||
|
Furniture, fixtures and equipment disposition
|
9,906 | — | ||||||||
|
Net cash (used in) investing activities
|
(2,647,161 | ) | (1,437,633 | ) | ||||||
|
cash flows from financing activities:
|
||||||||||
|
Repayments of construction loans payable
|
— | (5,077,333 | ) | |||||||
|
Repayment of Bank Loan
|
(8,028,010 | ) | (3,500,000 | ) | ||||||
|
Repayments on capitalized equipment leases
|
(185,517 | ) | (189,258 | ) | ||||||
|
Payments for option cancellations and restricted stock units
|
(239,722 | ) | (34,898 | ) | ||||||
|
Proceeds from option exercises
|
39,258 | — | ||||||||
|
Stock repurchases
|
(1,175,490 | ) | (2,815,539 | ) | ||||||
|
Net cash (used in) financing activities
|
(9,589,481 | ) | (11,617,028 | ) | ||||||
|
Net (decrease) in cash and cash equivalents
|
(2,571,453 | ) | (1,416,480 | ) | ||||||
|
Cash and cash equivalents, beginning of year
|
22,735,240 | 24,151,720 | ||||||||
|
Cash and cash equivalents, end of year
|
$ | 20,163,787 | $ | 22,735,240 | ||||||
|
supplemental information:
|
||||||||||
|
Cash paid during the year for interest
|
$ | 323,843 | $ | 509,510 | ||||||
|
Cash paid during the year for income taxes, net of refunds
|
$ | 26,071 | $ | 75,838 | ||||||
|
supplemental schedule of non-cash investing and financing activities:
|
||||||||||
|
Shares issued for settlement of vested employee restricted stock units
|
$ | 4,801 | $ | 522 | ||||||
|
Exercise of stock options through the receipt of tendered shares
|
$ | 55,473 | ||||||||
|
Shares issued for settlement of vested director restricted stock units
|
$ | 696 | ||||||||
|
Mortgage receivable on sale of real estate
|
$ | 450,000 | ||||||||
See Notes to Consolidated Financial Statements
| 1. | Organization and Business |
|
Organization and Business
Reis, Inc. (the “Company” or “Reis”) is a Maryland corporation. The Company’s primary business is providing commercial real estate market information and analytical tools for its subscribers, through its Reis Services subsidiary. For disclosure and financial reporting purposes, this business is referred to as the Reis Services segment.
Reis Services
Reis Services, including its predecessors, was founded in 1980. Reis maintains a proprietary database containing detailed information on commercial properties in metropolitan markets and neighborhoods throughout the U.S. The database contains information on apartment, office, retail and industrial properties and is used by real estate investors, lenders and other professionals to make informed buying, selling and financing decisions. In addition, Reis data is used by debt and equity investors to assess, quantify and manage the risks of default and loss associated with individual mortgages, properties, portfolios and real estate backed securities. Reis currently provides its information services to many of the nation’s leading lending institutions, equity investors, brokers and appraisers.
Reis, through its flagship institutional product, Reis SE, and through its new small business product, ReisReports, provides online access to a proprietary database of commercial real estate information and analytical tools designed to facilitate debt and equity transactions as well as ongoing evaluations. Depending on the product, users have access to trend and forecast analysis at metropolitan and neighborhood levels throughout the U.S. and/or detailed building-specific information such as rents, vacancy rates, lease terms, property sales, new construction listings and property valuation estimates. Reis’s products are designed to meet the demand for timely and accurate information to support the decision-making of property owners, developers, builders, banks and non-bank lenders, and equity investors. These real estate professionals require access to timely information on both the performance and pricing of assets, including detailed data on market transactions, supply, absorption, rents and sale prices. This information is critical to all aspects of valuing assets and financing their acquisition, development and construction.
Reis’s revenue model is based primarily on annual subscriptions that are paid in accordance with contractual billing terms. Reis recognizes revenue from its contracts on a ratable basis; for example, one-twelfth of the value of a one-year contract is recognized monthly.
Residential Development Activities
The Company was originally formed on January 8, 1997. Reis acquired the Reis Services business by merger in May 2007 (the “Merger”). Prior to May 2007, Reis operated as Wellsford Real Properties, Inc. (“Wellsford”). Wellsford’s primary operating activities immediately prior to the Merger were the development, construction and sale of its three residential projects and its approximate 23% ownership interest in the Reis Services business. The Company completed the sale of the remaining units at its Colorado project in September 2009 and sold its Claverack, New York project in February 2010. The Company ceased building new homes in 2008 and is seeking to complete its exit from the residential development business by selling its remaining project in East Lyme, Connecticut, in one or more bulk transactions, in order to focus solely on the Reis Services business.
See Note 3 for additional information regarding the Company’s operating activities by segment.
|
| 2. | Summary of Significant Accounting Policies |
| Basis of Presentation
Principles of Consolidation The accompanying consolidated financial statements include the accounts of the Company and its majority-owned and controlled subsidiaries. Investments in entities where the Company does not have a controlling interest are accounted for under the equity method of accounting. These investments were initially recorded at cost and were subsequently adjusted for the Company’s proportionate share of the investment’s income (loss) and additional contributions or distributions. All significant inter-company accounts and transactions among the Company and its subsidiaries have been eliminated in consolidation.
Codification and the Hierarchy of Generally Accepted Accounting Principles
Effective July 1, 2009, the Company adopted the provisions of the Financial Accounting Standards Board (“FASB”) guidance related to the Accounting Standards Codification and the Hierarchy of Generally Accepted Accounting Principles (“GAAP”). This guidance identifies the sources of accepted accounting principles and the framework for selecting the principles used in the preparation of financial statements of nongovernmental entities that are presented in conformity with GAAP in the United States (the GAAP hierarchy). The Codification superseded all then-existing non-SEC accounting and reporting standards upon the effective date. The adoption of this standard changed how the Company references various elements of GAAP when preparing its financial statement disclosures, but has had no impact on the Company’s consolidated financial statements.
Variable Interests
The Company evaluates its investments and subsidiaries to determine if an entity is a voting interest entity or a variable interest entity (“VIE”). An entity is a VIE when (1) the equity investment at risk is not sufficient to permit the entity from financing its activities without additional subordinated financial support from other parties or (2) equity holders either (a) lack direct or indirect ability to make decisions about the entity, (b) are not obligated to absorb expected losses of the entity or (c) do not have the right to receive expected residual returns of the entity if they occur. If an entity or investment is deemed to be a VIE, an enterprise that absorbs a majority of the expected losses of the VIE or receives a majority of the residual returns is considered the primary beneficiary and must consolidate the VIE. Subsequent to January 1, 2010, as a result of the adoption of the new guidance for VIE’s, the Company identifies the primary beneficiary of a VIE as the enterprise that has both of the following characteristics: (1) the power to direct the activities of the VIE that most significantly impact the entity’s economic performance and (2) the obligation to absorb losses or receive benefits of the VIE that could potentially be significant to the entity. The Company performs this analysis on an ongoing basis.
The Company had one VIE, which was consolidated until the assets of the VIE were sold during December 2009. Consequently, the Company no longer has any VIEs.
Cash and Cash Equivalents
The Company considers all demand and money market accounts and short term investments in government funds with a maturity of three months or less at the date of purchase to be cash and cash equivalents.
Accounts Receivable and Allowance for Doubtful Accounts
Accounts receivables are recorded at invoiced amounts and do not bear interest. The allowance for doubtful accounts reflects the Company’s assessment of collectability of outstanding receivables after consideration of the age of a receivable, customer payment history and other current events or economic factors that could affect a customer’s ability to make payments.
|
|
Summary of Significant Accounting Policies (continued)
Intangible Assets, Amortization and Impairment
Web Site Development Costs
The Company expenses all internet web site costs incurred during the preliminary project stage. Thereafter, all direct external and internal development and implementation costs are capitalized and amortized using the straight-line method over their remaining estimated useful lives, not exceeding three years. The value ascribed to the web site intangible asset acquired at the time of the Merger was amortized on a straight-line basis over three years, and during 2010, the ascribed value was fully amortized. Amortization of all capitalized web site development costs is charged to product development expense.
Database Costs
The Company capitalizes costs for the development of its database in connection with the identification and addition of new real estate properties and sale transactions which provide a future economic benefit. Amortization is calculated on a straight-line basis over a three or five year period. Costs of updating and maintaining information on existing properties in the database are expensed as incurred. The value ascribed to the database intangible asset acquired at the time of the Merger is amortized on a straight-line basis over three or five years, and during 2010, the ascribed value which had a three year amortizable life was fully amortized. Amortization of all capitalized database costs is charged to cost of sales.
Customer Relationships
The value ascribed to customer relationships acquired at the time of the Merger is amortized over 15 years on an accelerated basis and is charged to sales and marketing expense.
Lease Value
The value ascribed to the below market terms of the office lease existing at the time of the Merger is amortized over the remaining term of the acquired office lease which was approximately nine years. Amortization is charged to general and administrative expenses.
Goodwill and Intangible Asset Impairment
Goodwill and a major portion of the other intangible assets were recorded at the time of the Merger. As a result of the tax treatment of the Merger, goodwill and the acquired intangible assets are not deductible for income tax purposes.
Goodwill is not amortized and is tested for impairment at least annually, or after a triggering event has occurred, requiring such a calculation. The evaluation is based upon a comparison of the estimated fair value of the reporting unit to which the goodwill has been assigned with the reporting unit’s carrying value. The fair values used in this evaluation are estimated based upon market projections for the reporting unit. These market projections utilize a number of estimates and assumptions, such as earnings before interest, taxes, depreciation and amortization (EBITDA) multiples, market comparisons, and quoted market prices. If the fair value of the reporting unit exceeds its carrying value, goodwill is not deemed to be impaired. If the fair value of the reporting unit is less than its carrying value, a second step is required to calculate the implied fair value of goodwill by deducting the fair value of all tangible and intangible net assets of the reporting unit from the fair value of the reporting unit. There was no goodwill impairment identified in 2010 or 2009.
Intangible assets, with determinable useful lives, are amortized over their respective estimated useful lives using a method of amortization that reflects the pattern in which the economic benefits of the intangible assets are consumed or otherwise used up. In addition, the carrying amount of amortizable intangible assets are reviewed annually for impairment. If estimated future undiscounted net cash flows are less than the carrying amount of the asset, the asset would be considered impaired. An impairment charge would be determined by comparing the estimated fair value of the intangible asset to its carrying value, with any shortfall from fair value recognized as an expense in the current period. There was no intangible asset impairment identified in 2010 or 2009.
|
|
Summary of Significant Accounting Policies (continued)
Real Estate and Impairment
Costs directly related to the acquisition, development and improvement of real estate were capitalized, including interest and other costs incurred during the construction period. Ordinary repairs, maintenance and project operating costs are expensed as incurred.
The Company has historically reviewed its real estate assets for impairment (1) whenever events or changes in circumstances indicate that the carrying amount of an asset may not be recoverable for assets held for use and (2) when a determination is made to sell an asset or investment. If estimated cash flows on an undiscounted basis are insufficient to recover the carrying amount of an asset, an impairment loss equal to the excess of the carrying amount over estimated fair value is recognized. No impairment charges were recorded during 2010 or 2009 related to the Company’s real estate assets.
Deferred Financing Costs
Deferred financing costs consist of costs incurred to obtain financing or financing commitments. Such costs are amortized by the Company over the expected term of the respective agreements or, in the case of the Company’s development assets, was included in the basis of the project to be expensed as homes/units are sold.
Fair Value Measurements
The current accounting literature provides for a three-level valuation hierarchy for disclosure of fair value measurements. The valuation hierarchy is based upon the transparency of inputs to the valuation of an asset or liability as of the measurement date. A financial instrument’s categorization within the valuation hierarchy is based upon the lowest level of input that is significant to the fair value measurement. The three levels are defined as follows:
|
| ▪ | Level 1 - inputs to the valuation methodology are quoted prices (unadjusted) for identical assets or liabilities in active markets; | ||
| ▪ | Level 2 - inputs to the valuation methodology include quoted prices for similar assets and liabilities in active markets, and inputs that are observable for the asset or liability, either directly or indirectly, for substantially the full term of the financial instrument; and | ||
| ▪ | Level 3 - inputs to the valuation methodology are unobservable and significant to the fair value measurement. |
|
During 2009 and through its June 30, 2010 expiration, the Company’s interest rate cap was valued using models developed internally by the respective counterparty that use as their basis readily observable market parameters and was classified within Level 2 of the valuation hierarchy.
Revenue Recognition and Related Items
The Company’s subscription revenue is derived principally from subscriptions to its web-based services for its Reis SE product and is recognized as revenue ratably over the related contractual period, which is typically one year but can be as long as 48 months. Revenues from ad-hoc and custom reports or projects are recognized as completed and delivered to the customers, provided that no significant Company obligations remain. Revenues from the ReisReports product are recognized monthly as billed. Deferred revenue represents the portion of a subscription billed or collected in advance under the terms of the respective contract, which will be recognized in future periods. If a customer does not meet the payment obligations of a contract, any related accounts receivable and deferred revenue are written off at that time and the net amount, after considering any recovery of accounts receivable, is charged to cost of sales.
Cost of sales of subscription revenue principally consists of salaries and related expenses for the Company’s researchers who collect and analyze the commercial real estate data that is the basis for the Company’s information services. Additionally, cost of sales includes the amortization of database technology.
Revenue from sales of real estate, including condominium units, single family homes and sales of lots individually or in bulk are
|
|
Summary of Significant Accounting Policies (continued)
recognized at closing subject to receipt of down payments and other requirements in accordance with applicable accounting guidelines. The percentage of completion method was not used for recording sales on condominium units as downpayments were nominal and collectability of the sales price from such a deposit was not reasonably assured until closing.
Interest revenue is recorded on an accrual basis.
Share Based Compensation
Equity Awards
The fair market value as of the grant date of awards of stock, restricted stock units or certain stock options is recognized as compensation expense by the Company over the respective vesting periods.
Liability Awards
The Company accrues a liability for cash payments that could be made to option holders for the amount of the market value of the Company’s common stock in excess of the exercise prices of outstanding options accounted for as a liability award. This liability is adjusted at the end of each reporting period to reflect (1) the net cash payments to option holders made during each period, (2) the impact of the exercise and expiration of options and (3) the changes in the market price of the Company’s common stock.
Changes in the settlement value of option awards treated under the liability method are reflected as income or expense in the statements of operations. At December 31, 2010, of the 680,896 outstanding options, 70,896 options are accounted for as a liability as these awards provide for settlement in cash or in stock at the election of the option holder. At December 31, 2009, of the 473,620 outstanding options, 88,620 options were accounted for as a liability award. The liability for option cancellations was approximately $158,000 and $126,000 at December 31, 2010 and 2009, respectively.
The liability for option cancellations could materially change from period to period based upon (1) an option holder either (a) exercising the options in a traditional manner or (b) electing the net cash settlement alternative and (2) the changes in the market price of the Company’s common stock. At each period end, an increase in the Company’s common stock price would result in an increase in compensation expense, whereas a decline in the stock price would reduce compensation expense.
See Note 10 for activity with respect to stock options and restricted stock units.
Income Taxes
Deferred income tax assets and liabilities are determined based upon differences between the financial reporting basis and the tax basis of assets and liabilities, and are measured using the enacted tax rates and laws that are estimated to be in effect when the differences are expected to reverse. Valuation allowances with respect to deferred income tax assets are recorded when deemed appropriate and adjusted based upon periodic evaluations.
The Company evaluates its tax positions in accordance with applicable current accounting literature. Recognition of uncertain tax positions (step one) occurs when an enterprise concludes that a tax position, based solely on its technical merits, is more-likely-than-not to be sustained upon examination. Measurement (step two) determines the amount of benefit that more-likely-than-not will be realized upon settlement. Derecognition of a tax position that was previously recognized would occur when a company subsequently determines that a tax position no longer meets the more-likely-than-not threshold of being sustained or there is a satisfactory resolution of the tax position.
See Note 7 for more information with regards to income taxes.
Per Share Data
Basic earnings per common share are computed based upon the weighted average number of common shares outstanding during
|
|
Summary of Significant Accounting Policies (continued)
the period. Diluted earnings per common share are based upon the increased number of common shares that would be outstanding assuming the exercise of dilutive common share options and the consideration of restricted stock awards. The following table details the computation of earnings per common share, basic and diluted:
|
|
For the Years Ended December 31,
|
||||||||||
|
|
2010
|
2009
|
||||||||
|
Numerator:
|
||||||||||
|
Net income for basic calculation
|
$ | 667,853 | $ | 1,004,112 | ||||||
|
Adjustments to net income for the income statement impact of dilutive securities
|
— | — | ||||||||
|
Net income for dilution calculation
|
$ | 667,853 | $ | 1,004,112 | ||||||
|
Denominator:
|
||||||||||
|
Denominator for net income per common share, basic — weighted average common shares
|
10,510,699 | 10,693,249 | ||||||||
|
Effect of dilutive securities:
|
||||||||||
|
RSUs
|
245,783 | 227,573 | ||||||||
|
Stock options
|
— | — | ||||||||
|
Denominator for net income per common share, diluted — weighted average common shares
|
10,756,482 | 10,920,822 | ||||||||
|
Net income per common share:
|
||||||||||
|
Basic
|
$ | 0.06 | $ | 0.09 | ||||||
|
Diluted
|
$ | 0.06 | $ | 0.09 | ||||||
|
Potentially dilutive securities include all stock based awards. For the years ended December 31, 2010 and 2009, certain equity awards, in addition to the option awards accounted for under the liability method, were antidilutive.
Estimates
The preparation of financial statements in conformity with GAAP requires management to make estimates and assumptions that affect the reported amounts of assets and liabilities and disclosure of contingent assets and liabilities at the date of the financial statements and the reported amounts of revenues and expenses during the reporting period. Actual results could differ from those estimates.
From time to time, the Company has been, is or may in the future be a defendant in various legal actions arising in the normal course of business. The Company records a provision for a liability when it is both probable that a liability has been incurred and the amount of loss can be reasonably estimated. Although the outcome of any litigation is uncertain, management does not believe that any legal actions to which the Company is a party, or which are proposed or threatened, will have a material adverse effect on the consolidated financial statements.
Reclassification
Amounts in certain accounts as presented in the consolidated statements of operations, as well as in Note 3, have been reclassified. These reclassifications do not result in a change to the previously reported net income (loss) or net income (loss) per common share for any of the periods presented to conform to the current period presentation.
Recent Accounting Pronouncements
In January 2010, the FASB issued a pronouncement which requires reporting entities to make new disclosures about recurring or nonrecurring fair-value measurements including significant transfers into and out of Level 1 and Level 2 fair value measurements and information on purchases, sales, issuances, and settlements on a gross basis in the reconciliation of Level 3 fair value measurements. This pronouncement is effective for annual reporting periods beginning after December 15, 2009, except for Level 3 reconciliation disclosures which are effective for annual periods beginning after December 15, 2010. For Level 1 and 2
|
|
Summary of Significant Accounting Policies (continued)
disclosures, the Company’s adoption of this pronouncement did not have a material impact on its consolidated financial statements. For the Level 3 disclosures, the Company does not expect the adoption of this pronouncement to have a material impact on its consolidated financial statements.
In January 2010, the Company adopted an amendment requiring new fair value disclosures on fair value measurements for all nonfinancial assets and liabilities, including separate disclosure of significant transfers into and out of Level 3 and the reasons for the transfers, the amount of transfers between Level 1 and Level 2 and the reasons for the transfers, lower level of disaggregation for fair value disclosures (by class rather than major category) and additional details on the valuation techniques and inputs used to determine Level 2 and Level 3 measurements. The adoption of the amendment had no impact on the Company’s consolidated financial statements.
In January 2010, the Company adopted amendments to the variable interest consolidation model. The amendments were applied to all structures in place at the date of adoption. Key amendment changes include the elimination of the scope exception for qualifying special purpose entities, consideration of kick-out and participation rights in variable interest entity determination, qualitative analysis considerations for primary beneficiary determination, changes in related party considerations and certain disclosure changes. The adoption of these amendments had no impact on the Company’s consolidated financial statements.
In July 2010, the FASB issued a final accounting standards update that requires entities to provide extensive new disclosures in their financial statements about their financing receivables, including credit risk exposures and the allowance for credit losses. Adoption of this accounting standards update is required for public entities for interim or annual reporting periods ending on or after December 15, 2010. The adoption of these disclosure requirements had no impact on the Company’s consolidated financial statements.
|
| 3. | Segment Information |
| The Company is organized into two separately managed segments: the Reis Services segment and the Residential Development Activities segment. The following tables present condensed balance sheet and operating data for these segments: |
|
(amounts in thousands)
|
||||||||||||||||||
|
Condensed Balance Sheet Data
December 31, 2010
|
Reis
Services
|
Residential Development Activities (A)
|
Other (B)
|
Consolidated
|
||||||||||||||
|
Assets
|
||||||||||||||||||
|
Current assets:
|
||||||||||||||||||
|
Cash and cash equivalents
|
$ | 15,912 | $ | 21 | $ | 4,231 | $ | 20,164 | ||||||||||
|
Restricted cash and investments
|
214 | 791 | — | 1,005 | ||||||||||||||
|
Receivables, prepaid and other assets
|
9,230 | 350 | 116 | 9,696 | ||||||||||||||
|
Real estate assets
|
— | 1,297 | — | 1,297 | ||||||||||||||
|
Total current assets
|
25,356 | 2,459 | 4,347 | 32,162 | ||||||||||||||
|
Furniture, fixtures and equipment, net
|
957 | — | 1 | 958 | ||||||||||||||
|
Intangible assets, net
|
18,577 | — | — | 18,577 | ||||||||||||||
|
Goodwill
|
57,203 | — | (2,378 | ) | 54,825 | |||||||||||||
|
Other assets
|
166 | — | — | 166 | ||||||||||||||
|
Total assets
|
$ | 102,259 | $ | 2,459 | $ | 1,970 | $ | 106,688 | ||||||||||
|
Liabilities and stockholders’ equity
|
||||||||||||||||||
|
Current liabilities:
|
||||||||||||||||||
|
Current portion of Bank Loan and other debt
|
$ | 5,559 | $ | — | $ | — | $ | 5,559 | ||||||||||
|
Accrued expenses and other liabilities
|
1,900 | 1,913 | 1,128 | 4,941 | ||||||||||||||
|
Deferred revenue
|
15,446 | — | — | 15,446 | ||||||||||||||
|
Total current liabilities
|
22,905 | 1,913 | 1,128 | 25,946 | ||||||||||||||
|
Non-current portion of Bank Loan
|
5,691 | — | — | 5,691 | ||||||||||||||
|
Other long-term liabilities
|
693 | — | — | 693 | ||||||||||||||
|
Deferred tax liability, net
|
11,785 | — | (11,719 | ) | 66 | |||||||||||||
|
Total liabilities
|
41,074 | 1,913 | (10,591 | ) | 32,396 | |||||||||||||
|
Total stockholders’ equity
|
61,185 | 546 | 12,561 | 74,292 | ||||||||||||||
|
Total liabilities and stockholders’ equity
|
$ | 102,259 | $ | 2,459 | $ | 1,970 | $ | 106,688 | ||||||||||
|
Condensed Balance Sheet Data
December 31, 2009
|
Reis
Services
|
Residential Development Activities (A)
|
Other (B)
|
Consolidated
|
||||||||||||||
|
Assets
|
||||||||||||||||||
|
Current assets:
|
||||||||||||||||||
|
Cash and cash equivalents
|
$ | 15,629 | $ | 80 | $ | 7,026 | $ | 22,735 | ||||||||||
|
Restricted cash and investments
|
213 | 1,294 | — | 1,507 | ||||||||||||||
|
Receivables, prepaid and other assets
|
7,365 | (82 | ) | 148 | 7,431 | |||||||||||||
|
Real estate assets
|
— | 3,709 | — | 3,709 | ||||||||||||||
|
Total current assets
|
23,207 | 5,001 | 7,174 | 35,382 | ||||||||||||||
|
Furniture, fixtures and equipment, net
|
1,229 | 12 | 27 | 1,268 | ||||||||||||||
|
Intangible assets, net
|
20,416 | — | — | 20,416 | ||||||||||||||
|
Goodwill
|
57,203 | — | (2,378 | ) | 54,825 | |||||||||||||
|
Other assets
|
313 | — | — | 313 | ||||||||||||||
|
Total assets
|
$ | 102,368 | $ | 5,013 | $ | 4,823 | $ | 112,204 | ||||||||||
|
Liabilities and stockholders’ equity
|
||||||||||||||||||
|
Current liabilities:
|
||||||||||||||||||
|
Current portion of Bank Loan and other debt
|
$ | 8,119 | $ | — | $ | — | $ | 8,119 | ||||||||||
|
Accrued expenses and other liabilities
|
1,457 | 2,470 | 2,516 | 6,443 | ||||||||||||||
|
Deferred revenue
|
12,193 | — | — | 12,193 | ||||||||||||||
|
Total current liabilities
|
21,769 | 2,470 | 2,516 | 26,755 | ||||||||||||||
|
Non-current portion of Bank Loan
|
11,317 | — | — | 11,317 | ||||||||||||||
|
Other long-term liabilities
|
745 | — | — | 745 | ||||||||||||||
|
Deferred tax liability, net
|
9,997 | — | (9,931 | ) | 66 | |||||||||||||
|
Total liabilities
|
43,828 | 2,470 | (7,415 | ) | 38,883 | |||||||||||||
|
Total stockholders’ equity
|
58,540 | 2,543 | 12,238 | 73,321 | ||||||||||||||
|
Total liabilities and stockholders’ equity
|
$ | 102,368 | $ | 5,013 | $ | 4,823 | $ | 112,204 | ||||||||||
|
(A)
|
Includes the assets and liabilities of the Palomino Park, East Lyme and Claverack projects to the extent that such assets and liabilities existed at December 31, 2010 and 2009.
|
|
|
(B)
|
Includes cash, other assets and liabilities not specifically attributable to or allocable to a specific operating segment.
|
| Segment Information (continued) |
|
(amounts in thousands)
|
||||||||||||||||||
|
Condensed Operating Data for the
Year Ended December 31, 2010
|
Reis
Services
|
Residential Development Activities (A)
|
Other (B)
|
Consolidated
|
||||||||||||||
|
Revenue:
|
||||||||||||||||||
|
Subscription revenue
|
$ | 24,198 | $ | — | $ | — | $ | 24,198 | ||||||||||
|
Revenue from sales of real estate
|
— | 3,378 | — | 3,378 | ||||||||||||||
|
Total revenue
|
24,198 | 3,378 | — | 27,576 | ||||||||||||||
|
Cost of sales:
|
||||||||||||||||||
|
Cost of sales of subscription revenue
|
5,845 | — | — | 5,845 | ||||||||||||||
|
Cost of sales of real estate
|
— | 2,801 | — | 2,801 | ||||||||||||||
|
Total cost of sales
|
5,845 | 2,801 | — | 8,646 | ||||||||||||||
|
Gross profit
|
18,353 | 577 | — | 18,930 | ||||||||||||||
|
Operating expenses:
|
||||||||||||||||||
|
Sales and marketing
|
6,057 | — | — | 6,057 | ||||||||||||||
|
Product development
|
1,811 | — | — | 1,811 | ||||||||||||||
|
Property operating expenses
|
— | 546 | — | 546 | ||||||||||||||
|
General and administrative
|
5,751 | (443 | ) | 4,476 | 9,784 | |||||||||||||
|
Total operating expenses
|
13,619 | 103 | 4,476 | 18,198 | ||||||||||||||
|
Other income (expenses):
|
||||||||||||||||||
|
Interest and other income
|
106 | — | 17 | 123 | ||||||||||||||
|
Interest (expense)
|
(407 | ) | — | — | (407 | ) | ||||||||||||
|
Total other income (expense)
|
(301 | ) | — | 17 | (284 | ) | ||||||||||||
|
Income (loss) before income taxes
|
$ | 4,433 | $ | 474 | $ | (4,459 | ) | $ | 448 | |||||||||
|
Condensed Operating Data for the
Year Ended December 31, 2009
|
Reis
Services
|
Residential
Development
Activities (A)
|
Other (B)
|
Consolidated
|
||||||||||||||
|
Revenue:
|
||||||||||||||||||
|
Subscription revenue
|
$ | 23,892 | $ | — | $ | — | $ | 23,892 | ||||||||||
|
Revenue from sales of real estate
|
— | 7,059 | — | 7,059 | ||||||||||||||
|
Total revenue
|
23,892 | 7,059 | — | 30,951 | ||||||||||||||
|
Cost of sales:
|
||||||||||||||||||
|
Cost of sales of subscription revenue
|
5,568 | — | — | 5,568 | ||||||||||||||
|
Cost of sales of real estate
|
— | 4,987 | — | 4,987 | ||||||||||||||
|
Total cost of sales
|
5,568 | 4,987 | — | 10,555 | ||||||||||||||
|
Gross profit
|
18,324 | 2,072 | — | 20,396 | ||||||||||||||
|
Operating expenses:
|
||||||||||||||||||
|
Sales and marketing
|
5,306 | — | — | 5,306 | ||||||||||||||
|
Product development
|
1,818 | — | — | 1,818 | ||||||||||||||
|
Property operating expenses
|
— | 771 | — | 771 | ||||||||||||||
|
General and administrative expenses
|
5,395 | 687 | 5,133 | 11,215 | ||||||||||||||
|
Total operating expenses
|
12,519 | 1,458 | 5,133 | 19,110 | ||||||||||||||
|
Other income (expenses):
|
||||||||||||||||||
|
Interest and other income
|
144 | 159 | 13 | 316 | ||||||||||||||
|
Interest (expense)
|
(552 | ) | (40 | ) | — | (592 | ) | |||||||||||
|
Total other income (expense)
|
(408 | ) | 119 | 13 | (276 | ) | ||||||||||||
|
Income (loss) before income taxes
|
$ | 5,397 | $ | 733 | $ | (5,120 | ) | $ | 1,010 | |||||||||
|
(A)
|
Primarily includes the operating results of the Palomino Park, East Lyme and Claverack projects to the extent that such revenues and expenses existed during the years ended December 31, 2010 and 2009.
|
|
|
(B)
|
Includes interest and other income, depreciation and amortization expense and general and administrative expenses that have not been allocated to the operating segments.
|
|
Reis Services
See Note 1 for a description of Reis Services’s business and products at December 31,2010.
No individual subscriber accounted for more than 2.5% and 2.7% of Reis Services’s revenue for the years ended December 31, 2010 and 2009, respectively.
|
|
Segment Information (continued)
|
|
December 31,
|
||||||||||
|
2010
|
2009
|
|||||||||
|
Accounts receivables
|
$ | 9,065,000 | $ | 7,236,000 | ||||||
|
Allowance for doubtful accounts
|
(103,000 | ) | (53,000 | ) | ||||||
|
Accounts receivables, net
|
$ | 8,962,000 | $ | 7,183,000 | ||||||
|
Twenty-three subscribers accounted for an aggregate of approximately 64.5% of Reis Services’s accounts receivable at December 31, 2010, including four subscribers in excess of 4.0% with the largest representing 12.6%. As of March 10, 2011, the Company received payments of approximately $6,129,000, or 67.6% against the December 31, 2010 accounts receivable balance. Seventeen subscribers accounted for an aggregate of approximately 53.8% of Reis Services’s accounts receivable at December 31, 2009, including five subscribers in excess of 4.0% with the largest representing 7.0%.
At December 31, 2010 and 2009, no subscriber accounted for more than 7.8% and 4.3%, respectively, of deferred revenue.
|
|
Residential Development Activities
East Lyme
At December 31, 2010, the Company’s residential development activities were comprised solely of The Orchards, a single family home development in East Lyme, Connecticut, upon which the Company could build 161 single family homes on 224 acres (“East Lyme”). An aggregate of 42 homes and lots (29 homes and 13 lots) were sold as of December 31, 2010. At December 31, 2010, the remaining East Lyme inventory included 119 lots. The Company is working with a broker to sell the remaining 119 lots in one or more bulk sale transactions. There can be no assurance that the Company will be able to sell the remaining 119 lots in one or more bulk transactions at acceptable prices, or within a specific time period, or at all.
After the initial land purchase at East Lyme, the Company executed an agreement with a homebuilder to construct the homes for this project. The homebuilder was a 5% partner in the project and received other consideration. In March 2009, the Company and the homebuilder/partner terminated the partnership agreement and the related development agreement. As a result of the terminations, the Company paid approximately $343,000 to its partner to satisfy all remaining compensation under the development agreement and to purchase its 5% interest.
Home sales at East Lyme commenced in June 2006. The Company sold two lots and one home during the year ended December 31, 2010 for gross sales proceeds of approximately $628,000, and sold three lots and three homes during the year ended December 31, 2009 for gross sales proceeds of approximately $2,087,000.
Certain of the lots at East Lyme require remediation of pesticides which were used on the property when it was an apple orchard. Remediation is required prior to the development of those lots. The remediation plan, the cost of which is estimated by management to be approximately $1,000,000, has been approved by the health inspector for the municipality and the town planner. The estimated remediation cost is recognized as a liability in the December 31, 2010 and 2009 consolidated balance sheets. This estimate could change in the future if a change to the remediation plan is made, as contractors are hired and if the bulk sale of lots, as described above, were to occur. An expected time frame for the remediation has not been established as of the date of this report.
|
|
Segment Information (continued)
Completed Real Estate Projects and Other Investments
Claverack
As of December 31, 2009, the Company owned approximately 235 acres in Claverack, New York (“The Stewardship”), which was subdivided into 48 developable single family home lots. Construction of two model homes (which commenced in 2007), the infrastructure and amenities for The Stewardship were substantially completed during the third quarter of 2008.
In February 2010, the Company sold the Claverack project in a bulk transaction for a gross sales price of $2,750,000, which included two model homes, amenities, 46 additional lots and $450,000 of cash collateralizing certain road completion obligations. Net cash received at closing, after expenses, aggregated approximately $2,187,000. The remaining $450,000 of the purchase price was payable by the purchaser in February 2011 and was secured by the outstanding road bond and a mortgage on the property. As a result of this transaction, the Company recorded gross profit of approximately $263,000 in the first quarter of 2010. On February 17, 2011, the Company received cash of approximately $455,000 in satisfaction of the mortgage note and accrued interest thereon.
Gold Peak
In September 2009, the Company sold the final unit at Gold Peak, the final phase of Palomino Park, a five phase multifamily residential development in Highlands Ranch, Colorado. Gold Peak was a 259 unit condominium project on the remaining 29 acre land parcel at Palomino Park. During the year ended December 31, 2009, the Company sold 20 Gold Peak condominium units for gross sales proceeds of approximately $4,973,000.
Real Estate Contingencies
Reis has purchased insurance with respect to construction defect and completed operations at its real estate projects. Reis is, from time to time, exposed to various claims associated with the development, construction and sale of condominium units, single family homes or lots. These claims have not been material to date. However, claims related to environmental remediation, dissatisfaction by homeowners and homeowners’ associations with the construction of condominiums, homes and amenities by us and/or our developer partners in any condominium or subdivision development, or other matters, may result in litigation costs, remediation costs, warranty expenses or settlement costs which could be material to Reis’s results of operations and financial condition.
Wellsford Mantua
In November 2003, the Company made an initial $330,000 investment in the form of a loan, in a company organized to purchase land parcels for rezoning, subdivision and creation of environmental mitigation credits. The loan was secured by a lien on a leasehold interest in a 154 acre parcel in West Deptford, New Jersey which included at least 64.5 acres of wetlands and a maximum of 71 acres of developable land. The Company consolidated Wellsford Mantua at December 31, 2008 and its investment in Wellsford Mantua was approximately $290,000 at that date. In December 2009, the land was sold and the Company received proceeds of approximately $332,000 for the remaining loan balance plus accrued interest and fees.
|
|
|
4.
|
Restricted Cash and Investments
Restricted cash and investments are comprised of the following:
|
|
December 31,
|
||||||||||
|
2010
|
2009
|
|||||||||
|
Deposits and escrows related to residential development activities (A)
|
$ | 791,000 | $ | 1,294,000 | ||||||
|
Certificate of deposit/security for office lease (B)
|
214,000 | 213,000 | ||||||||
| $ | 1,005,000 | $ | 1,507,000 | |||||||
|
(A)
|
The net reduction primarily results from the sale of the Claverack project in February 2010.
|
||
|
(B)
|
In connection with the lease for the 530 Fifth Avenue corporate office space, the Company provided to the lessor a letter of credit through a bank, which is fully collateralized by a certificate of deposit issued by that bank.
|
| 5. |
Intangible Assets
The amount of identified intangible assets, including the respective amounts of accumulated amortization, are as follows:
|
|
December 31,
|
||||||||||
|
|
2010
|
2009
|
||||||||
|
Database
|
$ | 11,395,000 | $ | 10,084,000 | ||||||
|
Accumulated amortization
|
(7,374,000 | ) | (5,115,000 | ) | ||||||
|
Database, net
|
4,021,000 | 4,969,000 | ||||||||
|
Customer relationships
|
14,100,000 | 14,100,000 | ||||||||
|
Accumulated amortization
|
(3,470,000 | ) | (2,469,000 | ) | ||||||
|
Customer relationships, net
|
10,630,000 | 11,631,000 | ||||||||
|
Web site
|
5,173,000 | 3,887,000 | ||||||||
|
Accumulated amortization
|
(2,941,000 | ) | (2,067,000 | ) | ||||||
|
Web site, net
|
2,232,000 | 1,820,000 | ||||||||
|
Acquired below market lease
|
2,800,000 | 2,800,000 | ||||||||
|
Accumulated amortization
|
(1,106,000 | ) | (804,000 | ) | ||||||
|
Acquired below market lease, net
|
1,694,000 | 1,996,000 | ||||||||
|
Intangibles, net
|
$ | 18,577,000 | $ | 20,416,000 | ||||||
| The Company capitalized approximately $1,311,000 and $906,000 to the database intangible asset and $1,286,000 and $822,000 to the web site intangible asset during the years ended December 31, 2010 and 2009, respectively. |
|
Amortization expense for intangible assets aggregated approximately $4,436,000 for the year ended December 31, 2010, of which approximately $2,259,000 related to the database, which is charged to cost of sales, approximately $1,001,000 related to customer relationships, which is charged to sales and marketing expense, approximately $874,000 related to web site development, which is charged to product development expense, and approximately $302,000 related to the value ascribed to the below market terms of the office lease, which is charged to general and administrative expense, all in the Reis Services segment. Amortization expense for intangibles and other assets aggregated approximately $4,473,000 for the year ended December 31, 2009, of which approximately $2,172,000 related to the database, approximately $1,008,000 related to customer relationships, approximately $990,000 related to web site development, and approximately $303,000 related to the value ascribed to the below market terms of the office lease.
The Company’s future amortization expense related to the net intangible asset balance at December 31, 2010 follows:
|
|
(amounts in thousands)
|
||||||
|
For the Year Ended December 31,
|
Amount
|
|||||
|
2011
|
$ | 4,423 | ||||
|
2012
|
3,256 | |||||
|
2013
|
2,144 | |||||
|
2014
|
1,473 | |||||
|
2015
|
1,336 | |||||
|
Thereafter
|
5,945 | |||||
|
Total
|
$ | 18,577 | ||||
| 6. |
Debt
At December 31, 2010 and 2009, the Company’s debt consisted of the following:
|
|
Stated Interest Rate at
|
December 31,
|
|||||||||||||
|
Debt/Project
|
Maturity Date
|
December 31, 2010
|
2010
|
2009
|
||||||||||
|
Debt:
|
||||||||||||||
|
Reis Services Bank Loan
|
September 2012
|
LIBOR + 1.50%(A)
|
$ | 11,222,000 | $ | 19,250,000 | ||||||||
|
Other Reis Services debt
|
Various
|
Fixed/Various
|
28,000 | 213,000 | ||||||||||
|
Total debt
|
$ | 11,250,000 | $ | 19,463,000 | ||||||||||
|
Total assets of Reis Services as a security interest for the Bank Loan
|
$ | 102,259,000 | $ | 102,368,000 | ||||||||||
|
(A)
|
Depending upon the leverage ratio, as defined in the Bank Loan agreement, the spread to LIBOR may range from 3.00% to 1.50% as described below.
|
|
Debt (continued)
The Company’s future scheduled debt repayments as of December 31, 2010 follows:
|
|
(amounts in thousands)
|
||||||
|
For the Year Ended December 31,
|
Amount
|
|||||
|
2011
|
$ | 5,559 | ||||
|
2012
|
5,691 | |||||
|
Total
|
$ | 11,250 | ||||
|
Reis Services Bank Loan
In connection with the Merger agreement, Private Reis entered into a credit agreement, dated October 11, 2006, with the Bank of Montreal, Chicago Branch, as administrative agent, and BMO Capital Markets, as lead arranger, which provided for a term loan of up to an aggregate of $20,000,000 and revolving loans up to an aggregate of $7,000,000. Loan proceeds were used to finance $25,000,000 of the cash portion of the Merger consideration. The interest rate was LIBOR + 1.50% at December 31, 2010 and 2009 (LIBOR was 0.26% and 0.23% at December 31, 2010 and 2009, respectively). The LIBOR spread under the Bank Loan is based on a leverage ratio, as defined in the credit agreement. The interest spread could range from a high of LIBOR + 3.00% (if the leverage ratio is greater than or equal to 4.50 to 1.00) to a low of LIBOR + 1.50% (if the leverage ratio is less than 2.75 to 1.00). Reis Services also pays an annual administration fee of $25,000.
|
|
Reis Services is required to (1) make principal payments on the term loan on a quarterly basis commencing on June 30, 2007 in increasing amounts pursuant to the payment schedule provided in the credit agreement and (2) permanently reduce the revolving loan commitments on a quarterly basis commencing on March 31, 2010. Additional principal payments are payable if Reis Services’s annual cash flow exceeds certain amounts, or if certain defined operating ratios are not met, all of which are defined in the credit agreement. The final maturity date of all amounts borrowed pursuant to the credit agreement is September 30, 2012. At December 31, 2010, the Company does not have the ability to borrow any additional amounts under the Bank Loan.
In accordance with the terms of the credit agreement, beginning January 1, 2010 and through the maturity of the Bank Loan, the required leverage ratio was reduced to a maximum of 2.00 to 1.00 from a maximum of 2.50 to 1.00. In order to be in compliance with the leverage ratio test, management made a payment of $3,000,000 at March 31, 2010 in addition to the contractual minimum repayment of $1,000,000 due at that time. Although not required to do so, the Company made additional prepayments of $500,000 at the end of the second, third and fourth quarters of 2010 (aggregating $1,500,000), each of which was in excess of the minimum repayments due at such dates. All of the 2010 prepayments ratably reduced Reis Services’s future quarterly contractual minimum payments through maturity.
The loans are secured by a security interest in substantially all of the assets, tangible and intangible, of Reis Services and a pledge by the Company of its membership interest in Reis Services. The Bank Loan restricts the flow of cash from Reis Services up to the Company. However, commencing in 2009, the Bank Loan allows for a portion of the cash of Reis Services to be distributed to the Company for qualifying operating expenses of the Company if certain ratios are met, as defined in the credit agreement. These ratios have been met; however, no distributions from Reis Services up to the Company were made during 2010 or 2009.
The Bank Loan required interest rate protection in an aggregate notional principal amount of not less than 50% of the outstanding balance of the Bank Loan through June 30, 2010. An interest rate cap was purchased for $109,000 in June 2007, which capped LIBOR at 5.50% on $15,000,000 from June 2007 to June 2010. The cap had no value at December 31, 2009 and expired with no value at June 30, 2010.
Residential Development Debt
In December 2004, the Company obtained revolving development and construction financing for East Lyme in the aggregate amount of approximately $21,177,000 (the “East Lyme Construction Loan”). The East Lyme Construction Loan was extended, with term modifications, in April 2008. The interest rate for the East Lyme Construction Loan increased from LIBOR + 2.15% to
|
|
Debt (continued)
LIBOR + 2.50% over the extension period which matured in June 2009. The extension terms also required periodic minimum principal repayments if repayments from sales proceeds were not sufficient to meet required repayment amounts. During April 2009, the Company made principal repayments of approximately $4,177,000, thereby retiring the outstanding balance of the East Lyme Construction Loan and eliminating the minimum liquidity requirement.
The lender for the East Lyme Construction Loan initially provided a $3,000,000 letter of credit to a municipality in connection with the construction of public roads at the East Lyme project. In January 2008, the letter of credit requirement was reduced to $1,750,000 by the municipality. The Company initially posted $1,300,000 of restricted cash as collateral for this letter of credit and in April 2009, posted an additional $406,000 of restricted cash to fully collateralize the letter of credit at $1,750,000. By December 31, 2009, the municipality reduced the letter of credit requirement from $1,750,000 to $450,000, and the cash collateral requirement was reduced in a corresponding amount (with the excess cash being released to the Company). During the year ended December 31, 2010, the letter of credit and corresponding cash collateral were reduced to $400,000. The Company continues to work with the municipality to further reduce this and other bonding and escrow requirements. There can be no assurance that the Company will be able to successfully have these amounts further reduced in the near future. As a result of the retirement of the East Lyme Construction Loan and the additional cash collateralization of the letter of credit in April 2009, all of the Company’s remaining residential real estate is unencumbered by debt.
|
| 7. | Income Taxes |
| The components of the income tax expense (benefit) are as follows: |
|
For the Year Ended December 31,
|
||||||||||
|
|
2010
|
2009
|
||||||||
|
Current state and local tax (benefit) expense
|
$ | (220,000 | ) | $ | 31,000 | |||||
|
Current Federal alternative minimum tax (“AMT”) (benefit) expense
|
— | (25,000 | ) | |||||||
|
Deferred Federal tax expense (benefit)
|
— | — | ||||||||
|
Deferred state and local tax expense (benefit)
|
— | — | ||||||||
|
Income tax (benefit) expense
|
$ | (220,000 | ) | $ | 6,000 | |||||
|
The income tax benefit during the year ended December 31, 2010 of $220,000 reflects the resolution of an unrecognized tax benefit as a result of the expiration of the respective state’s statute of limitations.
The reconciliation of income tax computed at the U.S. Federal statutory rate to income tax expense (benefit) for continuing operations is as follows:
|
|
For the Year Ended
December 31,
|
||||||||||||||||||
|
|
2010
|
2009
|
||||||||||||||||
|
|
Amount
|
Percent
|
Amount
|
Percent
|
||||||||||||||
|
Tax expense at U.S. statutory rate
|
$ | 157,000 | 35.00 | % | $ | 354,000 | 35.00 | % | ||||||||||
|
State tax, net of federal impact
|
30,000 | 6.72 | % | 20,000 | 1.99 | % | ||||||||||||
|
Change in valuation allowance, net
|
(283,000 | ) | (63.31 | %) | (347,000 | ) | (34.35 | %) | ||||||||||
|
AMT Taxes
|
— | — | (25,000 | ) | (2.47 | %) | ||||||||||||
|
Other state tax benefit
|
(220,000 | ) | (49.12 | %) | — | — | ||||||||||||
|
Taxes on other state tax benefit
|
91,000 | 20.39 | % | — | — | |||||||||||||
|
Non-deductible items
|
5,000 | 1.20 | % | 4,000 | 0.42 | % | ||||||||||||
| $ | (220,000 | ) | (49.12 | %) | $ | 6,000 | 0.59 | % | ||||||||||
|
Deferred income taxes reflect the net tax effects of temporary differences between the carrying amount of assets and liabilities for financial reporting purposes and the amounts used for income tax purposes. The net deferred tax liability was approximately $67,000 at December 31, 2010 and 2009 and is reflected as a non-current liability in the accompanying consolidated balance sheets. The significant portion of the deferred tax items relates to (1) the tax benefit of impairment charges before allowances, (2) net operating loss (“NOL”) carryforwards as they relate to deferred tax assets, (3) AMT credit carryforwards as they relate to deferred tax assets, (4) stock based compensation, and (5) the deferred tax liability resulting from the intangible assets recorded at the time of the Merger as they related to deferred tax liabilities.
|
|
Income Taxes (continued)
Significant components of the Company’s deferred tax assets and liabilities are as follows:
|
|
|
December 31,
|
|||||||||
|
|
2010
|
2009
|
||||||||
|
Deferred Tax Assets
|
||||||||||
|
Net operating loss carryforwards
|
$ | 5,381,362 | $ | 4,333,176 | ||||||
|
Asset basis differences — tax amount greater than book value
|
6,511,295 | 8,475,443 | ||||||||
|
Liability reserves
|
20,974 | 383,033 | ||||||||
|
Reserve for option cancellations
|
65,464 | 52,224 | ||||||||
|
Stock compensation plans
|
1,160,506 | 1,474,822 | ||||||||
|
AMT credit carryforwards
|
1,139,392 | 1,061,562 | ||||||||
|
Other
|
75,476 | 74,534 | ||||||||
| 14,354,469 | 15,854,794 | |||||||||
|
Valuation allowance
|
(8,253,514 | ) | (8,650,714 | ) | ||||||
|
Total deferred tax assets
|
6,100,955 | 7,204,080 | ||||||||
|
Deferred Tax Liabilities
|
||||||||||
|
Acquired asset differences – book value greater than tax
|
(5,715,045 | ) | (6,717,512 | ) | ||||||
|
Asset basis differences — carrying amount value greater than tax
|
(452,490 | ) | (553,148 | ) | ||||||
|
Total deferred tax liabilities
|
(6,167,535 | ) | (7,270,660 | ) | ||||||
|
Net deferred tax (liability)
|
$ | (66,580 | ) | $ | (66,580 | ) | ||||
|
The Company has aggregate NOL carryfowards aggregating approximately $40,400,000 at December 31, 2010. These NOLs include NOLs generated subsequent to the Merger, losses from Private Reis prior to the Merger, loses obtained from the Company’s 1998 merger with Value Property Trust (“VLP”) and the Company’s operating losses prior to the Merger. Approximately $27,300,000 of these NOLs are subject to an annual limitation, whereas $13,100,000 are not subject to such a limitation. All of these NOLs can potentially be used against consolidated taxable income as further described below.
Private Reis had NOL carryforwards aggregating approximately $6,000,000 at December 31, 2010, which expire in the years 2019 to 2026. During the seven month period subsequent to the Merger, the Company generated NOLs of approximately $4,600,000 and during the year ended December 31, 2010, generated additional NOLs of approximately $2,500,000 which expire in the years 2027 and 2030, respectively. These losses, which aggregate $13,100,000 at December 31, 2010, may be utilized against consolidated taxable income, all of which amounts are available for use for financial statement reporting purposes at December 31, 2010. The taxable loss of $2,500,000 for 2010 primarily reflects the realization of a $4,500,000 loss for tax purposes from the sale of the Claverack project in February 2010. If the Company were able to sell its East Lyme project, an additional loss of approximately $14,900,000 would be realized which could also be utilized against consolidated taxable income without limitation.
The Company separately has NOLs which resulted from the Company’s merger with VLP in 1998 and its operating losses in 2004, 2006 and 2007 (prior to the Merger) aggregating approximately $27,300,000, of which approximately $5,500,000 expires in 2017. There is an annual limitation on the use of such NOLs after an ownership change, pursuant to Section 382 of the Internal Revenue Code (the “Code”). As a result of the Merger, the Company experienced such an ownership change which resulted in a new annual limitation of $2,779,000. A further requirement of the tax rules is that after a corporation experiences an ownership change, it must satisfy the continuity of business enterprise, or COBE, requirement (which generally requires that a corporation continue its historic business or use a significant portion of its historic business assets in its business for the two year period beginning on the date of the ownership change) to be able to utilize NOLs generated prior to such ownership change. Although the Company believes there is a basis for concluding that the COBE requirements were met through the required two year period subsequent to the ownership change, management concluded that the Company could not meet the more-likely-than-not criteria for recognizing a deferred tax asset relating to such losses for GAAP accounting purposes. The Company has utilized an aggregate of approximately $5,800,000 of these NOLs in its Federal tax return filings for 2008 and 2009, with appropriate disclosure. Such amounts have also been deducted to arrive at the $13,100,000 of NOLs described above, for financial reporting purposes.
|
|
Income Taxes (continued)
A valuation allowance is required to reduce the deferred tax assets if, based on the weight of the evidence, it is more-likely-than-not that some portion or all of the deferred tax assets will not be realized. Accordingly, management has determined that a valuation allowance of approximately $8,254,000 and $8,651,000 at December 31, 2010 and 2009, respectively, was necessary. The allowances at December 31, 2010 and 2009 relate primarily to AMT credits, NOLs in 2010 and to the excess of a portion of the tax basis of certain real estate development assets over their respective financial statement basis. The decrease in the allowance in 2010 is attributable to the change in the estimate of the realization of the real estate asset basis differences.
The Company’s reserve for unrecognized tax benefits, including estimated interest and penalties, was approximately $145,000 and $435,000 at December 31, 2010 and 2009, respectively. The reserve reduction in 2010 primarily results from a resolution of unrecognized tax benefits and the related estimate for interest and penalties, offset by interest accruals on other unrecognized items. Interest and penalties related to these tax provisions were included in general and administrative expenses and included a benefit of $199,000 in 2010, for the resolution of related unrecognized tax benefits in 2010, and an expense of $80,000 in 2009. A reconciliation of the unrecognized tax benefits for the years ended December 31, 2010 and 2009 follows:
|
|
For the Years Ended December 31,
|
||||||||||
|
2010
|
2009
|
|||||||||
|
Balance at beginning of period
|
$ | 435,000 | $ | 510,000 | ||||||
|
Additions for provisions related to prior years
|
15,000 | 20,000 | ||||||||
|
Resolution of matters during the period
|
(305,000 | ) | (95,000 | ) | ||||||
|
Balance at end of period
|
$ | 145,000 | $ | 435,000 | ||||||
| The Company expects that approximately $112,000 of the 2010 balance could be resolved in 2011. |
|
The parent company and its subsidiaries have never been audited by the Federal tax authorities and tax returns are open from 2007 to 2009. In addition, acquired VLP net operating loss carryforwards are open for the years 1997 and 1998 for NOLs generated during those periods. Tax returns are open for the parent company and a subsidiary with a state tax authority for the years 2001 to 2009 and several other states and a local tax authority for the years 2007 to 2009. The tax years for another subsidiary, operating in a different state, are open from 2006 to 2009.
Private Reis has been audited by the Federal tax authorities through May 31, 2007. State and local tax returns are open from 2007. In addition, tax returns are open from 2000 to 2002 to the extent that NOLs were generated during these periods by Private Reis.
|
|
| 8. |
Transactions With Affiliates
The homebuilder at East Lyme was a 5% partner in the project and received other consideration upon the completion of home sales. In March 2009, the Company and the homebuilder/partner terminated the partnership agreement and the related development agreement. As a result of the terminations, the Company paid approximately $343,000 to its partner to satisfy all remaining compensation under the development agreement and to purchase its 5% interest.
|
| 9. |
Stockholders’ Equity
In June 2010, the Board authorized the repurchase of up to an aggregate amount of $1,000,000 of the Company’s common stock. Previously, the Board had authorized the repurchase of an aggregate of $3,000,000 of the Company’s shares. In April 2010, the Company completed repurchases under the initial $3,000,000 authorization. The program permits purchases from time to time in the open market or through privately negotiated transactions. Depending on market conditions, financial developments and other factors, purchases could be commenced or suspended at any time, or from time to time, without prior notice and the program may be expanded with prior notice. The Company may make purchases pursuant to a trading plan under Securities Exchange Act Rule 10b5-1, permitting open market purchases of common stock during blackout periods consistent with the Company’s “Policies for Transactions in Reis Stock and Insider Trading and Tipping.”
During the year ended December 31, 2010, the Company purchased 175,232 shares of common stock at an average price of $6.71
|
|
Stockholders’ Equity (continued)
per share. During 2009, the Company purchased 660,444 shares of common stock at an average price of $4.26 per share. From the inception of the share repurchase programs in December 2008 through December 17, 2010, the Company purchased an aggregate of 838,076 shares of common stock at an average price of $4.77 per share, for an aggregate of $4,000,000. Under the repurchase programs, the Company repurchased approximately 7.6% of the common shares outstanding at the time of the Board’s initial authorization in December 2008.
The Company did not declare or distribute any dividends during the years ended December 31, 2010 and 2009.
|
|
| 10. |
Stock Plans and Other Incentives
The Company has adopted certain incentive plans (the “Incentive Plans”) for the purpose of attracting and retaining the Company’s directors, officers and employees by having the ability to issue options, restricted stock units (“RSUs”), or stock awards. Awards granted under the Incentive Plans expire ten years from the date of grant and vest over periods ranging generally from three to five years for employees.
Option Awards
The following table presents the changes in options outstanding for the years ended December 31, 2010 and 2009, as well as other plan data:
|
|
|
For the Year Ended December 31,
|
|||||||||||||||||
|
|
2010
|
2009
|
||||||||||||||||
|
|
Options
|
Weighted-Average
Exercise Price
|
Options
|
Weighted-Average
Exercise Price
|
||||||||||||||
|
Outstanding at beginning of period
|
473,620 | $ | 8.91 | 528,473 | $ | 8.53 | ||||||||||||
|
Granted
|
225,000 | $ | 8.03 | — | $ | — | ||||||||||||
|
Exercised
|
(8,862 | ) | $ | (4.43 | ) | (38,991 | ) | $ | (4.58 | ) | ||||||||
|
Cancelled through cash settlement
|
(8,862 | ) | $ | (4.43 | ) | (8,862 | ) | $ | (4.60 | ) | ||||||||
|
Forfeited/cancelled/expired
|
— | $ | — | (7,000 | ) | $ | (9.57 | ) | ||||||||||
|
Outstanding at end of period
|
680,896 | $ | 8.73 | 473,620 | $ | 8.91 | ||||||||||||
|
Options exercisable at end of period
|
301,896 | $ | 8.68 | 242,620 | $ | 7.99 | ||||||||||||
|
Options exercisable which can be settled in cash
|
70,896 | $ | 4.81 | 88,620 | $ | 4.73 | ||||||||||||
|
Weighted average fair value of options granted per year (per option)
|
$ | 3.08 | $ | — | ||||||||||||||
|
Weighted average remaining contractual life at end of period
|
7.1 years
|
6.6 years
|
||||||||||||||||
|
Certain outstanding options allow the option holder to receive from the Company, in cancellation of the holder’s option, a cash payment with respect to each cancelled option equal to the amount by which the fair market value of the share of stock underlying the option exceeds the exercise price of such option. The Company accounts for these options as liability awards. This liability is adjusted at the end of each reporting period to reflect (1) the net cash payments to option holders made during each period, (2) the impact of the exercise and expiration of options and (3) the changes in the market price of the Company’s common stock. Changes in the settlement value of option awards treated under the liability method are reflected as income or expense in the statements of operations.
At December 31, 2010, the liability for option cancellations was approximately $158,000 based upon the difference in the closing stock price of the Company at December 31, 2010 of $7.03 per share and the individual exercise prices of the outstanding 70,896 “in-the-money” options that were accounted for as a liability award at that date. At December 31, 2009, the liability for option cancellations was approximately $126,000 based upon the difference in the closing stock price of the Company at December 31, 2009 of $6.15 per share and the individual exercise prices of the outstanding 88,620 “in-the-money” options that were accounted for as a liability award at that date. The Company recorded compensation expense of approximately $54,000 and $139,000 for the years ended December 31, 2010 and 2009, respectively, in general and administrative expenses in the statements of operations related to the liability for option cancellations.
An aggregate of 8,862 and 8,862 options were settled with net cash payments aggregating approximately $22,000 and $14,000 during the years ended December 31, 2010 and 2009, respectively.
|
|
Stock Plans and Other Incentives (continued)
The following table presents additional option details at December 31, 2010 and 2009:
|
|
Options Outstanding and Exercisable
at December 31, 2010
|
Options Outstanding and Exercisable
at December 31, 2009
|
|||||||||||||||||||||||||||||||||
|
Range of Exercise Prices
|
Outstanding
|
Remaining
Contractual
Life (Years)
|
Weighted
Average
Exercise Price
|
Intrinsic Value (A)
|
Outstanding
|
Remaining
Contractual
Life (Years)
|
Weighted
Average
Exercise Price
|
Intrinsic Value (A)
|
||||||||||||||||||||||||||
| $ | 4.09 to $4.55 | (B) | 35,448 | 2.86 | $ | 4.28 | $ | 97,659 | 53,172 | 2.89 | $ | 4.33 | $ | 96,950 | ||||||||||||||||||||
| $ | 5.24 to $5.43 | (B) | 35,448 | 1.97 | 5.34 | 60,085 | 35,448 | 2.97 | 5.34 | 28,890 | ||||||||||||||||||||||||
| $ | 7.50 | 70,000 | 6.63 | 7.50 | — | 70,000 | 7.63 | 7.50 | — | |||||||||||||||||||||||||
| $ | 8.03 | 225,000 | 9.59 | 8.03 | — | — | — | — | — | |||||||||||||||||||||||||
| $ | 10.40 | 315,000 | 6.41 | 10.40 | — | 315,000 | 7.41 | 10.40 | — | |||||||||||||||||||||||||
| 680,896 | 7.07 | 8.73 | $ | 157,744 | 473,620 | 6.60 | 8.91 | $ | 125,840 | |||||||||||||||||||||||||
|
(A)
|
The intrinsic value is the amount by which the fair value of the Company’s stock price exceeds the exercise price of an option at December 31, 2010 and 2009, respectively. For purposes of this calculation, the Company’s closing stock prices were $7.03 and $6.15 per share on December 31, 2010 and 2009, respectively.
|
|
(B)
|
These options are the remaining options accounted for as liability awards at December 31, 2010. In December 2011, an additional 17,724 options with an exercise price of $5.43 are scheduled to expire.
|
|
The Company estimated the fair value of each option granted on the date of grant using the Black-Scholes option-pricing model. The following table includes the assumptions that were made and the estimated fair value for option grants in 2010 (no option awards were granted during 2009):
|
|
2010 Grant
|
||||||
|
Stock price on grant date
|
$ | 6.42 | ||||
|
Exercise price
|
$ | 8.03 | ||||
|
Dividend yield
|
— | |||||
|
Risk-free interest rate
|
1.70 | % | ||||
|
Expected life
|
5.2 years
|
|||||
|
Estimated volatility
|
60.9 | % | ||||
|
Fair value of options granted (per option)
|
$ | 3.08 | ||||
| RSU Awards
The following table presents the changes in RSUs outstanding for the years ended December 31, 2010 and 2009: |
|
December 31,
|
||||||||||
|
2010
|
2009
|
|||||||||
|
Outstanding at beginning of period
|
507,668 | 343,320 | ||||||||
|
Granted
|
293,170 | 238,896 | ||||||||
|
Common stock delivered (A) (B)
|
(275,559 | ) | (66,148 | ) | ||||||
|
Forfeited
|
(1,800 | ) | (8,400 | ) | ||||||
|
Outstanding at end of period
|
523,479 | 507,668 | ||||||||
|
Intrinsic value (C)
|
$ | 3,680,100 | $ | 3,122,200 | ||||||
|
(A)
|
Includes 17,431 shares which were used to settle minimum employee withholding tax obligations for 12 employees of approximately $105,000 in the first quarter of 2010, 16,870 shares which were used to settle minimum employee withholding tax obligations for 63 employees of approximately $105,000 in the second quarter of 2010 and 1,207 shares which were used to settle minimum employee withholding tax obligations for one employee of approximately $8,000 in the third quarter of 2010. A net of 240,051 shares of common stock were delivered in the year ended December 31, 2010.
|
||
|
(B)
|
Includes 5,245 shares which were used to settle employee withholding tax obligations for three employees of approximately $21,000 in 2009. A net of 26,087 shares of common stock were delivered at that time.
|
||
|
(C)
|
For purposes of this calculation, the Company’s closing stock prices were $7.03 per share and $6.15 per share on December 31, 2010 and 2009, respectively.
|
|
Stock Plans and Other Incentives (continued)
In February and July 2010, an aggregate of 185,000 RSUs and 75,000 RSUs, respectively, were granted to employees which vest one-third a year over three years and had a weighted average grant date fair value of $5.97 and $6.52, respectively, per RSU (which was determined based on the closing stock price of the Company’s common stock on February 19, 2010, and for the July 2010 grants, the closing stock prices on July 29, 2010 and July 30, 2010). In February and September 2009, an aggregate of 169,500 RSUs and 10,000 RSUs, respectively, were granted to employees which vest one-third a year over three years and had a grant date fair value of $4.76 and $5.55, respectively, per RSU (which was determined based on the closing price of the Company’s common stock on February 4, 2009 and September 22, 2009, respectively). The awards granted to employees in 2010 and 2009 are treated as equity awards and the grant date fair value is charged to compensation expense at the corporate level on a straight-line basis over the vesting periods.
During the year ended December 31, 2010, an aggregate of 33,170 RSUs were granted to non-employee directors (with a weighted average grant date fair value of $6.17 per RSU) related to the equity component of their compensation for the period October 1, 2009 to September 30, 2010. During the year ended December 31, 2009, an aggregate of 59,396 RSUs were granted to non-employee directors (with a weighted average grant date fair value of $4.19 per RSU) related to the equity component of their compensation for the period October 1, 2008 to September 30, 2009. In each case, the grant date fair value was determined as of the last trading day of the quarter for which the RSUs were being received as compensation. The RSUs are immediately vested, but are not deliverable to non-employee directors until six months after termination of their service as a director. The Company issued 34,816 shares in December 2009, to satisfy the settlement of RSUs related to directors that retired from the Board in June 2009.
|
|
Option and RSU Expense Information
The Company recorded non-cash compensation expense of approximately $1,658,000 and $1,431,000, respectively, including approximately $239,000 and $226,000 related to non-employee director equity compensation, for the years ended December 31, 2010 and 2009, respectively, related to all stock options and RSUs accounted for as equity awards, as a component of general and administrative expenses in the statement of operations.
At December 31, 2010, the total compensation cost related to outstanding, non-vested equity awards of options and RSUs that is expected to be recognized as compensation cost in the future aggregates approximately $2,507,000. It does not include any awards granted subsequent to December 31, 2010.
|
|
For the Year Ended December 31,
|
Options
|
RSUs
|
Total
|
|||||||||||
|
2011
|
$ | 509,000 | $ | 826,000 | $ | 1,335,000 | ||||||||
|
2012
|
358,000 | 545,000 | 903,000 | |||||||||||
|
2013
|
119,000 | 150,000 | 269,000 | |||||||||||
| $ | 986,000 | $ | 1,521,000 | $ | 2,507,000 | |||||||||
| 11. |
Commitments and Contingencies
From time to time, the Company has been, is or may in the future be a defendant in various legal actions arising in the normal course of business. The Company records a provision for a liability when it is both probable that a liability has been incurred and the amount of loss can be reasonably estimated. Although the outcome of any litigation is uncertain, management does not believe that any legal actions to which the Company is a party, or which are proposed or threatened, will have a material adverse effect on the consolidated financial statements.
The Company is a tenant under one operating lease for office space in New York which expires in September 2016. Rent expense was approximately $1,610,000 and $1,592,000 for the years ended December 31, 2010 and 2009, respectively, which includes base rent plus other charges including, but not limited to, real estate taxes and maintenance costs in excess of base year amounts. In connection with the lease, the Company provided a letter of credit through a bank, to the lessor. The letter of credit requirement is approximately $212,000 which is collateralized by a certificate of deposit issued by that bank. The certificate of deposit is included in Restricted Cash and Investments in the consolidated balance sheets at December 31, 2010 and 2009.
|
|
Commitments and Contingencies (continued)
Future minimum lease payments under operating leases at December 31, 2010 are as follows:
|
|
|
For the Year Ended December 31,
|
Amount
|
|||||
|
2011
|
$ | 1,413,000 | ||||
|
2012
|
1,442,000 | |||||
|
2013
|
1,470,000 | |||||
|
2014
|
1,500,000 | |||||
|
2015
|
1,530,000 | |||||
|
Thereafter
|
1,164,000 | |||||
|
Total
|
$ | 8,519,000 | ||||
|
Through December 31, 2009, the Company had two separate defined contribution savings plans pursuant to Section 401 of the Internal Revenue Code. For the historic Wellsford plan, employer contributions, if any, were made based upon a discretionary amount determined by the Company’s management. The Company made contributions to this plan of approximately $13,000 for the year ended December 31, 2009. As of the end of 2009, the Company terminated the historic Wellsford plan and all employees that had been participating in the Wellsford plan were transferred to the historic Private Reis plan. For the historic Private Reis plan, the Company matches contributions up to 1% of employees’ salaries (calculated as 25% of the employee’s contribution, capped at 4% of the employee’s salary). The Company made contributions to this plan of approximately $70,000 and $64,000 for the years ended December 31, 2010 and 2009, respectively.
|
|
| 12. |
Fair Value of Financial Instruments
At December 31, 2010 and 2009, the Company’s financial instruments included receivables, payables, accrued expenses, other liabilities and debt. The fair values of these financial instruments, excluding the Bank Loan, were not materially different from their recorded values at December 31, 2010 and 2009. Other than capital leases, all of the Company’s debt at December 31, 2010 and 2009 was floating rate based. Regarding the Bank Loan, the fair value of this debt is estimated to be approximately $10,905,000 and $18,316,000 at December 31, 2010 and 2009, respectively, which is lower than the recorded amounts of $11,222,000 and $19,250,000 at December 31, 2010 and 2009, respectively. The estimated fair value reflects the effect of higher interest rate spreads on debt being issued under current market conditions, as compared to the conditions that existed when the Bank Loan was obtained. Regarding the East Lyme Construction Loan, this debt was retired in April 2009. The Company’s interest rate cap had no value at December 31, 2009 and expired with no value at June 30, 2010. See Note 6 for more information about the Company’s debt.
|
| 13. |
Summarized Consolidated Quarterly Information (Unaudited)
Summarized consolidated and condensed quarterly financial information is as follows:
|
|
(amounts in thousands)
|
2010
|
|||||||||||||||||
|
For the Three Months Ended March 31
|
For the Three Months Ended June 30
|
For the Three Months Ended September 30
|
For the Three Months Ended December 31
|
|||||||||||||||
|
Revenue:
|
||||||||||||||||||
|
Subscription revenue
|
$ | 6,014 | $ | 6,004 | $ | 6,013 | $ | 6,167 | ||||||||||
|
Revenue from sales of real estate
|
2,750 | 468 | 160 | — | ||||||||||||||
|
Total revenue
|
8,764 | 6,472 | 6,173 | 6,167 | ||||||||||||||
|
Cost of sales:
|
||||||||||||||||||
|
Cost of sales of subscription revenue
|
1,463 | 1,536 | 1,403 | 1,443 | ||||||||||||||
|
Cost of sales of real estate (A)
|
2,487 | 468 | 96 | (250 | ) | |||||||||||||
|
Total cost of sales
|
3,950 | 2,004 | 1,499 | 1,193 | ||||||||||||||
|
Gross profit
|
4,814 | 4,468 | 4,674 | 4,974 | ||||||||||||||
|
Total operating expenses
|
4,968 | 4,281 | 4,413 | 4,536 | ||||||||||||||
|
Total other (expenses) income
|
(83 | ) | (66 | ) | (67 | ) | (68 | ) | ||||||||||
|
(Loss) income before income taxes
|
(237 | ) | 121 | 194 | 370 | |||||||||||||
|
Income tax (benefit) expense (B)
|
(60 | ) | 15 | 79 | (254 | ) | ||||||||||||
|
Net (loss) income
|
$ | (177 | ) | $ | 106 | $ | 115 | $ | 624 | |||||||||
|
Net (loss) income per common share (C):
|
||||||||||||||||||
|
Basic
|
$ | (0.02 | ) | $ | 0.01 | $ | 0.01 | $ | 0.06 | |||||||||
|
Diluted
|
$ | (0.02 | ) | $ | 0.01 | $ | 0.01 | $ | 0.06 | |||||||||
|
Weighted average number of common shares outstanding:
|
||||||||||||||||||
|
Basic
|
10,421 | 10,495 | 10,594 | 10,530 | ||||||||||||||
|
Diluted
|
10,490 | 10,780 | 10,816 | 10,806 | ||||||||||||||
|
2009
|
||||||||||||||||||
|
For the Three Months Ended March 31
|
For the Three Months Ended June 30
|
For the Three Months Ended September 30
|
For the Three Months Ended December 31
|
|||||||||||||||
|
Revenue:
|
||||||||||||||||||
|
Subscription revenue
|
$ | 6,355 | $ | 5,909 | $ | 5,801 | $ | 5,827 | ||||||||||
|
Revenue from sales of real estate
|
1,548 | 4,261 | 898 | 352 | ||||||||||||||
|
Total revenue
|
7,903 | 10,170 | 6,699 | 6,179 | ||||||||||||||
|
Cost of sales:
|
||||||||||||||||||
|
Cost of sales of subscription revenue
|
1,406 | 1,362 | 1,386 | 1,414 | ||||||||||||||
|
Cost of sales of real estate
|
1,011 | 2,990 | 654 | 332 | ||||||||||||||
|
Total cost of sales
|
2,417 | 4,352 | 2,040 | 1,746 | ||||||||||||||
|
Gross profit
|
5,486 | 5,818 | 4,659 | 4,433 | ||||||||||||||
|
Total operating expenses
|
4,885 | 4,845 | 4,793 | 4,587 | ||||||||||||||
|
Total other (expenses) income
|
(119 | ) | (64 | ) | (98 | ) | 5 | |||||||||||
|
Income (loss) before income taxes
|
482 | 909 | (232 | ) | (149 | ) | ||||||||||||
|
Income tax expense (benefit)
|
205 | 378 | (70 | ) | (507 | ) | ||||||||||||
|
Net income (loss)
|
$ | 277 | $ | 531 | $ | (162 | ) | $ | 358 | |||||||||
|
Net income (loss) per common share (C):
|
||||||||||||||||||
|
Basic
|
$ | 0.03 | $ | 0.05 | $ | (0.02 | ) | $ | 0.03 | |||||||||
|
Diluted
|
$ | 0.02 | $ | 0.05 | $ | (0.02 | ) | $ | 0.03 | |||||||||
|
Weighted average number of common shares outstanding:
|
||||||||||||||||||
|
Basic
|
10,963 | 10,776 | 10,661 | 10,380 | ||||||||||||||
|
Diluted
|
11,132 | 11,009 | 10,661 | 10,739 | ||||||||||||||
|
(A)
|
The benefit in cost of sales of $250 in the three months ended December 31, 2010 reflects the reversal of previously recorded warranty and construction liabilities.
|
||
|
(B)
|
The $254 income tax benefit for the three months ended December 31, 2010 reflects the resolution of an unrecognized tax benefit of $220 as a result of the expiration of the respective state’s statute of limitations.
|
||
|
(C)
|
Aggregate quarterly earnings per share amounts may not equal annual or period to date amounts presented elsewhere in these consolidated financial statements due to rounding differences.
|
| Exhibit 21.1 | ||
|
Subsidiaries of the Registrant
|
||
| The following is a list of subsidiaries of the Registrant, Reis, Inc. with the respective state of organization as of December 31, 2010: |
|
Subsidiary
|
State
|
|||
|
Wellsford Capital
|
Maryland
|
|||
|
Wellsford Capital Properties, L.L.C.
|
Delaware
|
|||
|
Wellsford Finance, L.L.C.
|
Delaware
|
|||
|
Wellsford CRC Holding Corp.
|
Maryland
|
|||
|
Clairborne Fordham Tower, LLC
|
Delaware
|
|||
|
Creamer Vitale Wellsford L.L.C.
|
Delaware
|
|||
|
Wellsford Fordham Tower, L.L.C.
|
Delaware
|
|||
|
Wellsford Park Highlands Corp.
|
Colorado
|
|||
|
Park at Highlands L.L.C.
|
Colorado
|
|||
|
Red Canyon at Palomino Park L.L.C.
|
Colorado
|
|||
|
Silver Mesa at Palomino Park L.L.C.
|
Colorado
|
|||
|
Green River at Palomino Park L.L.C.
|
Colorado
|
|||
|
Gold Peak at Palomino Park L.L.C.
|
Colorado
|
|||
|
Palomino Park Telecom L.L.C.
|
Colorado
|
|||
|
Parkside Café at Palomino Park, Inc.
|
Colorado
|
|||
|
Palomino Park Owners Association
|
Colorado
|
|||
|
Palomino Park Public Improvements Corp.
|
Colorado
|
|||
|
Wellsford Commercial Properties Trust
|
Maryland
|
|||
|
Wellsford Ventures, Inc.
|
Maryland
|
|||
|
Reis Services, LLC
|
Maryland
|
|||
|
Wellsford Mantua LLC
|
Delaware
|
|||
|
East Lyme Housing Ventures, LLC
|
Delaware
|
|||
|
Claverack Housing Ventures, LLC
|
Delaware
|
|||
|
Orchards II Ventures LLC
|
Delaware
|
|
Exhibit 23.1
|
|||
|
Consent of Independent Registered Public Accounting Firm
We consent to the incorporation by reference in (i) the Registration Statement (Form S-8 No. 333-80539) of Reis, Inc. (the “Company”), pertaining to the Company’s 1998 Management Incentive Plan, and (ii) the Registration Statement (Form S-8 No. 333-151410) of the Company pertaining to the Company’s 2008 Omnibus Incentive Plan, of our report dated March 11, 2011 with respect to the consolidated financial statements of the Company, included in this Annual Report (Form 10-K) for the year ended December 31, 2010.
|
|||
|
/s/ ERNST & YOUNG LLP
|
|||
|
Chicago, Illinois
March 11, 2011
|
|||