Attached files
Table of Contents
UNITED STATES
SECURITIES AND EXCHANGE COMMISSION
Washington, D.C. 20549
FORM 10-K
| x | ANNUAL REPORT PURSUANT TO SECTION 13 OR 15(d) OF THE SECURITIES EXCHANGE ACT OF 1934 |
For the fiscal year ended: December 31, 2010
or
| ¨ | TRANSITION REPORT PURSUANT TO SECTION 13 OR 15(d) OF THE SECURITIES EXCHANGE ACT OF 1934 |
Commission file number: 001-34292
ORRSTOWN FINANCIAL SERVICES, INC.
(Exact name of registrant as specified in its charter)
| Pennsylvania | 23-2530374 | |
| (State or other jurisdiction of incorporation or organization | (I.R.S. Employer Identification No.) | |
| 77 East King Street, P. O. Box 250, Shippensburg, Pennsylvania |
17257 | |
| (Address of principal executive offices) | (Zip Code) | |
Registrant’s telephone number, including area code: (717) 532-6114
Securities registered pursuant to Section 12(b) of the Act:
| Title of each class |
Name of Each Exchange on which Registered | |
| Common Stock, No Par Value | NASDAQ Stock Market LLC |
Securities registered pursuant to Section 12(g) of the Act: None
Indicate by check mark if the registrant is a well-known seasoned issuer, as defined in Rule 405 of the Securities Act. Yes ¨ No x
Indicate by check mark if the registrant is not required to file reports pursuant to Section 13 or Section 15(d) of the Act. Yes ¨ No x
Indicate by check mark whether the registrant (1) has filed all reports required to be filed by Section 13 or 15(d) of the Securities Exchange Act of 1934 during the preceding 12 months (or for such shorter period that the registrant was required to file such reports), and (2) has been subject to such filing requirements for the past 90 days. Yes x No ¨
Indicate by check mark whether the registrant has submitted electronically and posted on its corporate Website, if any, every Interactive Data File required to be submitted and posted pursuant to Rule 405 of Regulation S-T (§232,405 of this chapter) during the preceding 12 months (or for such shorter period that the registrant was required to submit and post such files). Yes ¨ No ¨
Indicate by check mark if disclosure of delinquent filers pursuant to Item 405 of Regulation S-K (§229.405 of this chapter) is not contained herein and will not be contained, to the best of registrant’s knowledge, in definitive proxy or information statements incorporated by reference in Part III of this Form 10-K or any amendment to this Form 10-K. x
Indicate by check mark whether the registrant is a large accelerated filer, an accelerated filer, a non-accelerated filer, or a smaller reporting company. See the definitions of “accelerated filer,” “large accelerated filer” and “smaller reporting company” in Rule 12b-2 of the Exchange Act.
| Large accelerated filer ¨ |
Accelerated filer x |
Non-accelerated filer ¨ |
Smaller reporting company ¨ | |||
| (Do not check if a smaller reporting company) |
||||||
Indicate by check mark whether the registrant is a shell company (as defined in Rule 12b-2 of the Act.) Yes ¨ No x
Aggregate market value of the common stock held by non-affiliates computed by reference to the price at which the common equity was last sold on June 30, 2010 was $171,393,309.
Number of shares outstanding of the registrant’s common stock as of March 1, 2011: 7,989,556.
DOCUMENTS INCORPORATED BY REFERENCE
Portions of the Proxy Statement for the 2011 Annual Meeting of Shareholders are incorporated by reference in Part III of this Form 10-K.
Table of Contents
ORRSTOWN FINANCIAL SERVICES, INC.
FORM 10-K
| Page | ||||||
| Part I |
||||||
| Item 1. |
3 | |||||
| Item 1A |
13 | |||||
| Item 1B |
20 | |||||
| Item 2. |
21 | |||||
| Item 3. |
22 | |||||
| Item 4. |
22 | |||||
| Part II |
||||||
| Item 5. |
23 | |||||
| Item 6. |
26 | |||||
| Item 7. |
Management’s Discussion and Analysis of Financial Condition and Results of Operation |
28 | ||||
| Item 7A. |
63 | |||||
| Item 8. |
64 | |||||
| Item 9. |
Changes in and Disagreements with Accountants on Accounting and Financial Disclosure |
108 | ||||
| Item 9A. |
108 | |||||
| Item 9B. |
108 | |||||
| Part III |
||||||
| Item 10. |
109 | |||||
| Item 11. |
109 | |||||
| Item 12. |
Security Ownership of Certain Beneficial Owners and Management and Related Stockholder Matters |
109 | ||||
| Item 13. |
Certain Relationships and Related Transactions, and Director Independence |
110 | ||||
| Item 14. |
110 | |||||
| Part IV |
||||||
| Item 15. |
111 | |||||
| 114 | ||||||
- 2 -
Table of Contents
PART I
Orrstown Financial Services, Inc. (the Company) is a financial holding company registered under the Gramm-Leach-Bliley Act. The executive offices of Orrstown Financial Services, Inc. are located at 77 East King Street, Shippensburg, Pennsylvania, 17257. Orrstown Financial Services, Inc. was organized on November 17, 1987, under the laws of the Commonwealth of Pennsylvania for the purpose of acquiring Orrstown Bank, Shippensburg, Pennsylvania, and such other banks and bank related activities as are permitted by law and desirable. Orrstown Bank is engaged in providing banking and bank related services in South Central Pennsylvania, principally Franklin, Perry and Cumberland Counties in Pennsylvania and in Washington County, Maryland. The twenty offices of Orrstown Bank are located in Shippensburg (2), Carlisle (4), Spring Run, Orrstown, Chambersburg (3), Greencastle, Mechanicsburg (2), Camp Hill, Newport (2), Duncannon, and New Bloomfield, Pennsylvania and Hagerstown, Maryland.
The Company files periodic reports with the Securities and Exchange Commission (SEC) in the form of quarterly reports on Form 10-Q, annual reports on Form 10-K, annual proxy statements and current reports on Form 8-K for any significant events that may arise during the year. Copies of these reports, and any amendments to such reports filed or furnished pursuant to Section 13(a) or 15(d) of the Securities Exchange Act of 1934, as amended, may be obtained free of charge through the SEC’s internet site at www.sec.gov or by accessing the Company’s website at www.orrstown.com as soon as reasonably practicable after such reports are electronically filed with, or furnished to, the Securities and Exchange Commission. Information on our website shall not be considered a part of this Form 10-K.
History and Acquisitions
Orrstown Bank was originally organized in 1919 as a state-chartered bank. On March 8, 1988, in a bank holding company reorganization transaction, Orrstown Financial Services, Inc. acquired 100% ownership of Orrstown Bank, issuing 131,455 shares of Orrstown Financial Services, Inc.’s common stock to the former Orrstown Bank shareholders.
On May 1, 2006, the Company completed its acquisition of The First National Bank of Newport (First National), a national banking institution with $120 million in assets at the time of the acquisition. The final consideration paid in the transaction to stockholders of First National consisted of approximately 699,949 shares of the Company’s common stock and $8.9 million in cash. The transaction was valued at approximately $34 million in the aggregate. As a result of this transaction, the Company added four branches located in Perry County, Pennsylvania, $120 million in assets, $72 million in loans and $106 million in deposits to its franchise. First National remained a separate subsidiary banking institution of the Company until June 15, 2007 when First National merged with and into Orrstown Bank with Orrstown Bank as the surviving institution.
Business
Orrstown Financial Services, Inc.’s primary activity consists of owning and supervising its subsidiary, Orrstown Bank (the Bank). The day-to-day management of the Bank is conducted by the subsidiary’s officers. Orrstown Financial Services, Inc. derives a majority of its current income through dividends from Orrstown Bank. As of December 31, 2010, the Company, on a consolidated basis, had total assets of approximately $1.512 billion, total shareholders’ equity of approximately $160 million and total deposits of approximately $1.188 billion.
Orrstown Financial Services, Inc. has no employees. Its five officers are employees of its subsidiary bank. On December 31, 2010, Orrstown Bank had 275 full-time and 36 part-time employees.
The Bank is engaged in commercial banking and trust business as authorized by the Pennsylvania Banking Code of 1965. This involves accepting demand, time and savings deposits, and granting loans. The Bank grants
- 3 -
Table of Contents
commercial, residential, consumer and agribusiness customers in its market area of Franklin, Perry and Cumberland Counties of Pennsylvania and Washington County, Maryland. The concentrations of credit by type of loan are set forth in Note 4, “Loans Receivable and Allowance for Loan Losses” filed herewith in Part II, Item 8, “Financial Statements and Supplementary Data”. The Bank maintains a diversified loan portfolio and evaluates each customer’s credit-worthiness on a case-by-case basis. The amount of collateral obtained, if deemed necessary by the Bank upon the extension of credit, is based on management’s credit evaluation of the customer and collateral standards established in the Bank’s lending policies and procedures.
Lending
All secured loans are supported with appraisals or evaluations of collateral. Business equipment and machinery, inventories, accounts receivable, and farm equipment are considered appropriate security, provided they meet acceptable standards for liquidity and marketability. Loans secured by equipment and/or other non real estate collateral generally do not exceed 70% of appraised value or cost, whichever is lower. Loans secured by residential real estate generally do not exceed 80% of the appraised value of the property. Loan to collateral values are monitored as part of the loan review process, and appraisals are updated as deemed appropriate under the circumstances.
Commercial Lending
A majority of the Company’s loan assets are loans for business purpose. Approximately 75% of the loan portfolio is comprised of commercial loans. The Bank makes commercial real estate, equipment, working capital and other commercial purpose loans as required by the broad range of borrowers across the Bank’s various markets. The average size loan in the Bank’s commercial loan portfolio is approximately $259,000.
The Bank’s loan policy dictates the underwriting requirements for the various types of loans the Bank would extend to borrowers. The policy covers such requirements as debt coverage ratios, advance rate against different forms of collateral LTV and maximum term.
Approximately 47% of the Bank’s commercial portfolio is owner occupied or non owner occupied commercial real estate loans including multi family. The typical loan in this type is secured by a commercial property with a maximum LTV of 75% of the appraised value of the property. The maximum term and amortization typically does not exceed 20 years. Interest rates charged on these loans are primarily fixed for a period of 3 to 7 years and then adjust to an index and spread after the fixed rate period. The average size of a loan in this type is approximately $406,000.
Approximately 37% of the Bank’s commercial portfolio are loans for general commercial purpose and include permanent working capital, short term working capital, machinery and equipment financing. These types of loans can either be in the form of lines of credit or term loans. These loans are secured by the borrower’s accounts receivable, inventory and machinery and equipment. In a majority of these loans, the collateral also includes the business real estate or the business owner’s personal real estate or assets. The personal guarantee of the business owner is also to be taken. In the case of term loans, the average term of a loan would be primarily driven by the use of the loan proceeds and the useful life of the collateral. Interest rates charged are either fixed or variable. If the interest rate is or will become variable at any point in the loans life, an interest rate floor is placed on the loan. The average size of a loan in this type is approximately $160,000.
Consumer Lending
The Bank provides home equity loans, home equity lines of credit and other consumer loans through its branch network. A large majority of the consumer loans are secured by either a first or second lien position on the borrower’s primary residential real estate. The Bank requires a LTV of no greater than 90% of the value of the real estate being taken as collateral. Underwriting standards typically require a borrower have a debt to income ratio of 38% or less.
- 4 -
Table of Contents
Residential Lending
The Bank provides residential mortgages throughout its various markets through a network of mortgage loan officers. A majority of the residential mortgages originated are sold to secondary market investors, primarily Fannie Mae and the Federal Home Loan Bank of Pittsburgh. All mortgages, regardless of being sold or held in the Bank’s portfolio, are underwritten to secondary market industry standards for prime mortgages. The Bank requires a LTV of no greater than 80% of the value of the real estate being taken as collateral, without the borrower obtaining private mortgage insurance.
Loan Review
Administration and supervision over the lending process is provided by the Bank’s Credit Administration Committee which is comprised of outside directors. Executive officers and loan department personnel regularly meet with and report to the Credit Administration Committee. The loan review process is continuous, commencing with the approval of a loan. Each new loan is reviewed by the Loan Department for compliance with banking regulations and lending policy requirements for documentation, collateral standards, and approvals. Orrstown Bank employs a Loan Review Officer, who is independent from the loan origination function and reports directly to the Credit Administration Committee. The Loan Review Officer continually monitors and evaluates loan customers utilizing risk-rating criteria established in the Loan Policy in order to spot deteriorating trends and detect conditions which might indicate potential problem loans. The Loan Review Officer reports the results of the loan reviews at least quarterly to the Credit Administration Committee for approval and provides the basis for evaluating the adequacy of the allowance for loan losses.
During 2010, we implemented a centralized consumer underwriting solution, which enables us to process loans more efficiently, providing our customers with faster turnaround times. As a result, we increased our mortgage origination sales force and plan to add additional talent in 2011. Our team is supported by a state of the art system that enables them to take applications at the customer’s home or business via laptop. Additionally, we added several new mortgage products including Federal Home Administration (FHA), Veterans Administration (VA) and USDA Guaranteed Rural Housing programs. During 2010, customers now have the ability to apply for mortgages electronically. Consumer loan pre-approvals are instant, and most loan decisions are made within 24 hours. After approval, the entire process is simplified and expedited, enabling Orrstown Bank to handle a much larger volume of lending without significant increases in support staff.
A new website is also slated for 2011 that will provide the platform for the new consumer loan and mortgage products and other enhancements to improve the customer experience. A customer relationship management (CRM) system will also be implemented which will enable our sales staff to more effectively meet all our customers’ needs. The new system will provide real time sales management tools and metrics to support the growth of all our lines of business.
Orrstown Financial Advisors (OFA)
Through its trust department, Orrstown Bank renders services as trustee, executor, administrator, guardian, managing agent, custodian, investment advisor, and other fiduciary activities authorized by law under the trade name “Orrstown Financial Advisors.” OFA offers retail brokerage services through a third party broker/dealer arrangement with Financial Network Investment Company (FNIC). As of December 31, 2010, trust assets under management were $570 million.
Regulation and Supervision
Orrstown Financial Services, Inc. is a financial holding company, and is registered as such with the Board of Governors of the Federal Reserve System (the Federal Reserve Board). As a registered bank holding company and financial holding company, the Company is subject to regulation under the Bank Holding Company Act of 1956 and to inspection, examination, and supervision by the Federal Reserve Board.
- 5 -
Table of Contents
The operations of the Bank are subject to federal and state statutes applicable to banks chartered under the banking laws of the United States, and to banks whose deposits are insured by the Federal Deposit Insurance Company. The Bank’s operation is also subject to regulations of the Pennsylvania Department of Banking, the Federal Reserve Board and the Federal Deposit Insurance Company (FDIC).
Several of the more significant regulatory provisions applicable to banks and financial holding companies to which the Company and its subsidiary are subject, are discussed below, along with certain regulatory matters concerning the Company and its subsidiary. To the extent that the following information describes statutory or regulatory provisions, it is qualified in its entirety by reference to the particular statutory provisions. Any change in applicable law or regulation may have a material effect on the business and prospects of the Company and its subsidiary.
Financial and Bank Holding Company Activities
As a financial holding company, the Company may engage in, and acquire companies engaged in, activities that are considered “financial in nature”, as defined by the Gramm-Leach-Bliley Act and Federal Reserve Board interpretations. These activities include, among other things, securities underwriting, dealing and market-making, sponsoring mutual funds and investment companies, insurance underwriting and agency activities, and merchant banking. If any banking subsidiary of the Company ceases to be “well capitalized” or “well managed” under applicable regulatory standards, the Federal Reserve Board may, among other things, place limitations on the Company’s ability to conduct the broader financial activities permissible for financial holding companies or, if the deficiencies persist, require the Company to divest the banking subsidiary. In addition, if any banking subsidiary of the Company receives a Community Reinvestment Act rating of less than satisfactory, the Company would be prohibited from engaging in any additional activities other than those permissible for bank holding companies that are not financial holding companies. The Company may engage directly or indirectly in activities considered financial in nature, either de novo or by acquisition, as long as it gives the Federal Reserve Board after-the-fact notice of the new activities.
Interstate Banking and Branching
As a bank holding company, the Company is required to obtain prior Federal Reserve Board approval before acquiring more than 5% of the voting shares, or substantially all of the assets, of a bank holding company, bank or savings association. Under the Riegle-Neal Interstate Banking and Branching Efficiency Act (the “Riegle-Neal Act”), subject to certain concentration limits and other requirements, bank holding companies such as the Company may acquire banks and bank holding companies located in any state. The Riegle-Neal Act also permits banks to acquire branch offices in other states, and establish de novo branch offices in other states, contingent upon the host state having adopted legislation “opting in” to those provisions of the Riegle-Neal Act. Pursuant to the Dodd-Frank Wall Street Reform and Consumer Protection Act (the “Dodd-Frank Act”), banks now may acquire or establish branch offices in another state to the same extent as a bank chartered in that state would be permitted to establish branch offices. The Company has expanded its market south into Hagerstown, Maryland with its first branch opening in March 2006.
FDIC Insurance and Assessments
The Bank’s deposits are insured to applicable limits by the FDIC. Under the Dodd-Frank Act, the maximum deposit insurance amount has been permanently increased from $100,000 to $250,000 and unlimited deposit insurance has been extended to non-interest-bearing transaction accounts until December 31, 2012. Prior to the Dodd-Frank Act, the FDIC had established a Temporary Liquidity Guarantee Program under which, for the payment of an additional assessment by insured banks that did not opt out, the FDIC fully guaranteed all non-interest-bearing transaction accounts until December 31, 2010 (the “Transaction Account Guarantee Program”) and all senior unsecured debt of insured depository institutions or their qualified holding companies issued between October 14, 2008 and October 31, 2009, with the FDIC’s guarantee expiring by December 31,
- 6 -
Table of Contents
2012 (the “Debt Guarantee Program”). The Company and the Bank opted out of the Debt Guarantee Program. The Bank did not opt out of the Transaction Account Guarantee Program.
The FDIC has adopted a risk-based premium system that provides for quarterly assessments based on an insured institution’s ranking in one of four risk categories based on regulatory capital ratios and other supervisory factors. The Bank is currently in Risk Category 1, the lowest risk category.
Starting in 2009, the FDIC significantly raised the assessment rate in order to restore the reserve ratio of the Deposit Insurance Fund to the statutory minimum of 1.15%. For the quarter beginning January 1, 2009, the FDIC raised the base annual assessment rate for institutions in Risk Category 1 to between 12 and 14 basis points. For the quarter beginning April 1, 2009 the FDIC set the base annual assessment rate for institutions in Risk Category 1 to between 12 and 16 basis points. An institution’s assessment rate could be lowered by as much as five basis points based on the ratio of its long-term unsecured debt to deposits or, for smaller institutions, based on the ratio of certain amounts of Tier 1 capital to adjusted assets. The assessment rate may be adjusted for Risk Category 1 institutions that have a high level of brokered deposits and have experienced higher levels of asset growth (other than through acquisitions).
The FDIC imposed a special assessment equal to five basis points of assets less Tier 1 capital as of June 30, 2009, payable on September 30, 2009, and reserved the right to impose additional special assessments. Instead of imposing additional special assessments during 2009, the FDIC required all insured depository institutions to prepay their estimated risk-based assessments for the fourth quarter of 2009, and for all of 2010, 2011 and 2012 on December 30, 2009. For purposes of estimating the future assessments, each institution’s base assessment rate in effect on September 30, 2009 was used, increased by three basis points beginning in 2011, and the assessment base was increased at a 5% annual growth rate. The prepaid assessment will be applied against actual quarterly assessments until exhausted. Any funds remaining after June 30, 2013 will be returned to the institution. This prepaid assessment does not preclude the FDIC from changing assessment rates or from further revising the risk-based assessment system.
The Dodd-Frank Act requires the FDIC to take such steps as necessary to increase the reserve ratio of the Deposit Insurance Fund from 1.15% to 1.35% of insured deposits by 2020. In setting the assessments, the FDIC is required to off set the effect of the higher reserve ratio against insured depository institutions with total consolidated assets of less than $10 billion. The Dodd-Frank Act also broadens the base for FDIC insurance assessments so that assessments will be based on the average consolidated total assets less average tangible equity capital of a financial institution rather than on its insured deposits. The FDIC has adopted a new restoration plan to increase the reserve ratio to 1.15% by September 30, 2020 with additional rulemaking scheduled for 2011 regarding the method to be used to achieve a 1.35% reserve ratio by 2020 and offset the effect on institutions with assets less than $10 billion in assets. Pursuant to the new restoration plan, the FDIC will forgo the 3 basis point increase in assessments scheduled to take effect on January 1, 2011. The FDIC has proposed new assessment regulations that would redefine the assessment base as average consolidated assets less average tangible equity. The proposed regulations would use the current assessment rate schedule with modifications to the unsecured debt and brokered deposit adjustments and the elimination of the secured liability adjustment.
In addition, all FDIC-insured institutions are required to pay assessments to the FDIC to fund interest payments on bonds issued by the Financing Corporation (“FICO”), an agency of the Federal government established to recapitalize the Federal Savings and Loan Insurance Corporation. The FICO assessment rates, which are determined quarterly, averaged .0108% of insured deposits on an annualized basis in fiscal year 2009. These assessments will continue until the FICO bonds mature in 2017.
Dodd-Frank Wall Street Reform and Consumer Protection Act
On July 21, 2010, the Dodd-Frank Act was signed into law. The Dodd-Frank Act is intended to effect a fundamental restructuring of federal banking regulation. Among other things, the Dodd-Frank Act creates a new
- 7 -
Table of Contents
Financial Stability Oversight Council to identify systemic risks in the financial system and gives federal regulators new authority to take control of and liquidate financial firms. The Dodd-Frank Act additionally creates a new independent federal regulator to administer federal consumer protection laws. The Dodd-Frank Act is expected to have a significant impact on our business operations as its provisions take effect. Among the provisions that may affect us are the following:
Holding Company Capital Requirements. The Dodd-Frank Act requires the Federal Reserve Board to apply consolidated capital requirements to depository institution holding companies that are no less stringent than those currently applied to depository institutions. Under these standards, trust preferred securities will be excluded from Tier 1 capital unless such securities were issued prior to May 19, 2010 by a bank holding company with less than $15 billion in assets. The Dodd-Frank Act additionally requires capital requirements to be countercyclical so that the required amount of capital increases in times of economic expansion and decreases in times of economic contraction, consistent with safety and soundness. The capital requirements that the Company and Bank are currently subject to are noted in “Note 14. Shareholders’ Equity and Regulatory Capital”, in the Notes to the Consolidated Financial Statements included under Item 8 of this Report.
Corporate Governance. The Dodd-Frank Act will require publicly traded companies to give stockholders a non-binding vote on executive compensation at their first annual meeting taking place six months after the date of enactment and at least every three years thereafter (“Say-On-Pay”) and on so-called “golden parachute” payments in connection with approvals of mergers and acquisitions unless previously voted on by shareholders. The new legislation also authorizes the SEC to promulgate rules that would allow stockholders to nominate their own candidates using a company’s proxy materials. Additionally, the Dodd-Frank Act directs the federal banking regulators to promulgate rules prohibiting excessive compensation paid to executives of depository institutions and their holding companies with assets in excess of $1.0 billion, regardless of whether the company is publicly traded or not. The Dodd-Frank Act gives the SEC authority to prohibit broker discretionary voting on elections of directors and executive compensation matters.
Prohibition Against Charter Conversions of Troubled Institutions. Effective one year after enactment, the Dodd-Frank Act prohibits a depository institution from converting from a state to federal charter or vice versa while it is the subject of a cease and desist order or other formal enforcement action or a memorandum of understanding with respect to a significant supervisory matter unless the appropriate federal banking agency gives notice of the conversion to the federal or state authority that issued the enforcement action and that agency does not object within 30 days. The notice must include a plan to address the significant supervisory matter. The converting institution must also file a copy of the conversion application with its current federal regulator which must notify the resulting federal regulator of any ongoing supervisory or investigative proceedings that are likely to result in an enforcement action and provide access to all supervisory and investigative information relating hereto.
Limits on Derivatives. Effective 18 months after enactment, the Dodd-Frank Act prohibits state-chartered banks from engaging in derivatives transactions unless the loans to one borrower limits of the state in which the bank is chartered takes into consideration credit exposure to derivatives transactions. For this purpose, a derivatives transaction includes any contract, agreement, swap, warrant, note or option that is based in whole or in part on the value of, any interest in, or any quantitative measure or the occurrence of any event relating to, one or more commodities, securities, currencies, interest or other rates, indices or other assets.
Transactions with Affiliates and Insiders. Effective one year from the date of enactment, the Dodd-Frank Act expands the definition of affiliate for purposes of quantitative and qualitative limitations of Section 23A of the Federal Reserve Act to include mutual funds advised by a depository institution or its affiliates. The Dodd-Frank Act will apply section 23A and Section 22(h) of the Federal Reserve Act (governing transactions with insiders) to derivative transactions, repurchase agreements and securities lending and borrowing transactions that create credit exposure to an affiliate or an insider. Any such transactions with affiliates must be fully secured. The current exemption from Section 23A for transactions with financial subsidiaries will be
- 8 -
Table of Contents
eliminated. The Dodd-Frank Act will additionally prohibit an insured depository institution from purchasing an asset from or selling an asset to an insider unless the transaction is on market terms and, if representing more than 10% of capital, is approved in advance by the disinterested directors.
Debit Card Interchange Fees. Effective July 21, 2011, the Dodd-Frank Act requires that the amount of any interchange fee charged by a debit card issuer with respect to a debit card transaction must be reasonable and proportional to the cost incurred by the issuer. Within nine months of enactment, the Federal Reserve Board is required to establish standards for reasonable and proportional fees which may take into account the costs of preventing fraud. The restrictions on interchange fees, however, do not apply to banks that, together with their affiliates, have assets of less than $10 billion.
Interest on Demand Deposits. Effective July 21, 2011, the Dodd-Frank Act repealed all federal prohibitions on the ability of financial institutions to pay interest on demand deposits.
Consumer Financial Protection Bureau. The Dodd-Frank Act creates a new, independent federal agency called the Consumer Financial Protection Bureau (“CFPB”), which is granted broad rulemaking, supervisory and enforcement powers under various federal consumer financial protection laws, including the Equal Credit Opportunity Act, Truth in Lending Act, Real Estate Settlement Procedures Act, Fair Credit Reporting Act, Fair Debt Collection Act, the Consumer Financial Privacy provisions of the Gramm-Leach-Bliley Act and certain other statutes. The CFPB will have examination and primary enforcement authority with respect to depository institutions with $10 billion or more in assets. Smaller institutions will be subject to rules promulgated by the CFPB but will continue to be examined and supervised by federal banking regulators for consumer compliance purposes. The CFPB will have authority to prevent unfair, deceptive or abusive practices in connection with the offering of consumer financial products. The Dodd-Frank Act authorizes the CFPB to establish certain minimum standards for the origination of residential mortgages including a determination of the borrower’s ability to repay. In addition, the Dodd-Frank Act will allow borrowers to raise certain defenses to foreclosure if they receive any loan other than a “qualified mortgage” as defined by the CFPB. The Dodd-Frank Act permits states to adopt consumer protection laws and standards that are more stringent than those adopted at the federal level and, in certain circumstances, permits state attorneys general to enforce compliance with both the state and federal laws and regulations.
Control Acquisitions
The Change in Bank Control Act prohibits a person or group of persons from acquiring “control” of a bank holding company, unless the Federal Reserve Board has been notified and has not objected to the transaction. Under a reputable presumption established by the Federal Reserve Board, the acquisition of 10% or more of a class of voting stock of a bank holding company with a class of securities registered under Section 12 of the Exchange Act, such as the Company, would, under the circumstances set forth in the presumption, constitute acquisition of control of the bank holding company. In addition, a company is required to obtain the approval of the Federal Reserve Board under the Bank Holding Company Act before acquiring 25% (5% in the case of an acquirer that is a bank holding company) or more of any class of outstanding voting stock of a bank holding company, or otherwise obtaining control or a “controlling influence” over that bank holding company.
Liability for Banking Subsidiaries
Under Federal Reserve Board policy, a bank holding company is expected to act as a source of financial and managerial strength to each of its subsidiary banks and to commit resources to their support. This support may be required at times when the bank holding company may not have the resources to provide it. Similarly, under the cross-guarantee provisions of the Federal Deposit Insurance Act, the FDIC can hold any FDIC-insured depository institution liable for any loss suffered or anticipated by the FDIC in connection with (1) the “default” of a commonly controlled FDIC-insured depository institution; or (2) any assistance provided by the FDIC to a commonly controlled FDIC-insured depository institution “in danger of default”.
- 9 -
Table of Contents
Capital Requirements
Information concerning the Company and its subsidiary with respect to capital requirements is incorporated by reference from Note 14, “Shareholders’ Equity and Regulatory Capital”, of the “Notes to Consolidated Financial Statements” included under Item 8 of this report, and from the “Capital Adequacy and Regulatory Matters” section of the “Management’s Discussion and Analysis of Consolidated Financial Condition and Results of Operations”, included under Item 7 of this report.
FDICIA
The Federal Deposit Insurance Company Improvement Act of 1991 (FDICIA), and the regulations promulgated under FDICIA, among other things, established five capital categories for insured depository institutions—well capitalized, adequately capitalized, undercapitalized, significantly undercapitalized and critically undercapitalized—and requires federal bank regulatory agencies to implement systems for “prompt corrective action” for insured depository institutions that do not meet minimum capital requirements based on these categories. Unless a bank is well capitalized, it is subject to restrictions on its ability to offer brokered deposits and on certain other aspects of its operations. An undercapitalized bank must develop a capital restoration plan and its parent bank holding company must guarantee the bank’s compliance with the plan up to the lesser of 5% of the bank’s assets at the time it became undercapitalized and the amount needed to comply with the plan. As of December 31, 2010, the Bank was considered well capitalized based on the guidelines implemented by the bank’s regulatory agencies.
Dividend Restrictions
The Company’s funding for cash distributions to its shareholders is derived from a variety of sources, including cash and temporary investments. One of the principal sources of those funds is dividends received from its subsidiary, Orrstown Bank. Various federal and state laws limit the amount of dividends the Bank can pay to the Company without regulatory approval. In addition, federal bank regulatory agencies have authority to prohibit the Bank from engaging in an unsafe or unsound practice in conducting its business. The payment of dividends, depending upon the financial condition of the bank in question, could be deemed to constitute an unsafe or unsound practice. The ability of the Bank to pay dividends in the future is currently, and could be further, influenced by bank regulatory policies and capital guidelines. The Federal Reserve Board in 2009 notified all bank holding companies that dividends should be eliminated, deferred or significantly reduced if the bank holding company’s net income for the past four quarters, net of dividends paid during that period, is not sufficient to fully fund the dividends; the bank holding company’s prospective rate of earnings retention is not consistent with the bank holding company’s capital needs and overall, current and prospective financial conditions; or the bank holding company will not meet, or is in danger of meeting, its minimum regulatory capital adequacy ratios. Additional information concerning the Company and its banking subsidiary with respect to dividends is incorporated by reference from Note 15, “Restrictions on Dividends, Loans and Advances”, of the “Notes to Consolidated Financial Statements” included under Item 8 of this report, and the “Capital Adequacy and Regulatory Matters” section of “Management’s Discussion and Analysis of Consolidated Financial Condition and Results of Operations”, included under Item 7 of this report.
Deposit or Preference Statute
In the “liquidation or other resolution” of an institution by any receiver, U.S. federal legislation provides that deposits and certain claims for administrative expenses and employee compensation against the insured depository institution would be afforded a priority over the general unsecured claims against that institution, including federal funds and letters of credit.
- 10 -
Table of Contents
Other Federal Laws and Regulations
The Company’s operations are subject to additional federal laws and regulations applicable to financial institutions, including, without limitation:
| • | Privacy provisions of the Gramm-Leach-Bliley Act and related regulations, which require us to maintain privacy policies intended to safeguard customer financial information, to disclose the policies to our customers and to allow customers to “opt out” of having their financial service providers disclose their confidential financial information to non-affiliated third parties, subject to certain exceptions; |
| • | Right to Financial Privacy Act, which imposes a duty to maintain confidentiality of consumer financial records and prescribes procedures for complying with administrative subpoenas of financial records; |
| • | Consumer protection rules for the sale of insurance products by depository institutions, adopted pursuant to the requirements of the Gramm-Leach-Bliley Act; and |
| • | USA Patriot Act, which requires financial institutions to take certain actions to help prevent, detect and prosecute international money laundering and the financing of terrorism. |
Sarbanes-Oxley Act of 2002
On July 30, 2002, the Sarbanes-Oxley Act of 2002 was enacted. The Sarbanes-Oxley Act represents a comprehensive revision of laws affecting corporate governance, accounting obligations and corporate reporting. The Sarbanes-Oxley Act is applicable to all companies with equity securities registered or that file reports under the Securities Exchange Act of 1934. In particular, the Sarbanes-Oxley Act established: (i) new requirements for audit committees, including independence, expertise, and responsibilities; (ii) additional responsibilities regarding financial statements for the Chief Executive Officer and Chief Financial Officer of the reporting company; (iii) new standards for auditors and regulation of audits; (iv) increased disclosure and reporting obligations for the reporting company and its directors and executive officers; and (v) new and increased civil and criminal penalties for violations of the securities laws. Many of the provisions were effective immediately while other provisions become effective over a period of time and are subject to rulemaking by the SEC. Because the Company’s common stock is registered with the SEC, it is subject to this Act. As an accelerated filer as defined in Rule 12b-2 of the Securities Exchange Act of 1934, the Company was subject to section 404 of the Sarbanes-Oxley Act starting in the year ended December 31, 2004.
Government Actions and Legislation
The Emergency Economic Stabilization Act of 2008 (the “EES Act”), effective October 2008, allocated up to $700 billion towards purchasing and insuring assets held by financial institutions for the purpose of stabilizing and providing liquidity to the U.S. financial markets. Pursuant to authority granted under the EES Act, the U.S. Treasury announced the Capital Purchase Program whereby the U.S. Treasury agreed to purchase senior preferred shares from qualifying U.S. financial institutions. Each participating institution may sell to the U.S. Treasury an amount of senior preferred shares ranging from 1.0 percent to 3.0 percent of its September 30, 2008 risk-weighted assets. The preferred shares are generally nonvoting and pay an initial dividend rate of 5.0 percent per year for the first five years, increasing to 9.0 percent per year after year five. As part of the consideration for the shares, the U.S. Treasury requires the receipt of Warrants to acquire common stock from the participating institution having an aggregate market price equal to 15.0 percent of the amount of capital invested by the U.S. Treasury in the senior preferred shares, at an exercise price equal to the average trailing 20-trading day market price of the institution’s common stock at the time of issuance. Participating institutions must agree to certain limitations on executive compensation, repurchases of junior preferred or common stock and increases in common stock dividend payments. The Company, after careful analysis, chose not to participate in the Capital Purchase Program.
The government has also implemented the Homeowner Affordability and Stability Plan (“HASP”), a $75 billion federal program intended to support recovery in the housing market and ensure that eligible homeowners
- 11 -
Table of Contents
are able to continue to fulfill their mortgage obligations. HASP includes the following initiatives: (i) a refinance option for homeowners that are current in their mortgage payments and whose mortgages are owned by Fannie Mae or Freddie Mac; (ii) a homeowner stability initiative to prevent foreclosures and help eligible borrowers stay in their homes by offering loan modifications that reduce mortgage payments to more sustainable levels; and (iii) an increase in U.S. Treasury funding to Fannie Mae and Freddie Mac to allow them to lower mortgage rates. HASP also offers monetary incentives to mortgage holders for certain modifications of at-risk loans and would establish an insurance fund designed to reduce foreclosures.
Future Legislation
Changes to the laws and regulations in the states where the Company and the Bank do business can affect the operating environment of both the bank holding company and its subsidiaries in substantial and unpredictable ways. The Company cannot accurately predict whether those changes in laws and regulations will occur, and, if those changes occur, the ultimate effect they would have upon the financial condition or results of operations of the Company. This is also true of federal legislation particularly given the current volatile environment.
NASDAQ Capital Market
The Company’s common stock is listed on The NASDAQ Capital Market under the trading symbol “ORRF” and is subject to NASDAQ’s rules for listed companies.
Forward Looking Statements
Additional information concerning the Company and its banking subsidiaries with respect to forward looking statements is incorporated by reference from the “Important Factors Relating to Forward Looking Statements” section of the “Management’s Discussion and Analysis of Financial Condition and Results of Operations,” included in this Report under Item 7.
Competition
The Bank’s principal market area consists of Franklin County, Perry County and Cumberland County, Pennsylvania, with a presence in Washington County, Maryland. It services a substantial number of depositors in this market area, with the greatest concentration within a radius of Chambersburg, Shippensburg, and Carlisle, Pennsylvania.
The Bank, like other depository institutions, has been subjected to competition from less heavily regulated entities such as credit unions, brokerage firms, money market funds, consumer finance and credit card companies, and other commercial banks, many of which are larger than the Bank. The principal methods of competing effectively in the financial services industry include improving customer service through the quality and range of services provided, improving efficiencies and pricing services competitively. Orrstown Bank is competitive with the financial institutions in its service areas with respect to interest rates paid on time and savings deposits, service charges on deposit accounts and interest rates charged on loans.
The Bank continues to implement strategic initiatives focused on expanding our core businesses and to explore, on an ongoing basis, acquisition, divestiture, and joint venture opportunities. We analyze each of our products and businesses in the context of customer demands, competitive advantages, industry dynamics, and growth potential.
- 12 -
Table of Contents
Our financial conditions and results of operations may be adversely affected by various factors, many of which are beyond our control. These risk factors include the following:
Unfavorable economic and market conditions due to the current global financial crisis may materially and adversely affect us.
Economic and market conditions in the United States and around the world have deteriorated significantly and may remain depressed for the foreseeable future. Conditions such as slowing or negative growth and the sub-prime debt devaluation crisis have resulted in a low level of liquidity in many financial markets and extreme volatility in credit, equity and fixed income markets. These economic developments could have various effects on us, including insolvency of major customers and a negative impact on the investment income we are able to earn on our investment portfolio.
Since lending money is an essential part of our business, due to the current economic conditions, customers may be unable or unwilling to borrow money or repay funds already borrowed. The risk of non-payment is affected by credit risks of a particular customer, changes in economic conditions, the duration of the loan and, in the case of a collateralized loan, uncertainties as to the future value of the collateral and other factors. The potential effects of the current global financial crisis are difficult to forecast and mitigate. As a consequence, our operating results for a particular period are difficult to predict. The impact of this situation, together with concerns regarding the financial strength of financial institutions, has led to distress in credit markets and liquidity issues for financial institutions. Some financial institutions around the world have failed; others have been forced to seek acquisition partners. The United States and other governments have taken unprecedented steps to try to stabilize the financial system, including investing in financial institutions. Our business and our financial condition and results of operations could be adversely affected by (1) continued or accelerated disruption and volatility in financial markets, (2) continued capital and liquidity concerns regarding financial institutions generally and our counterparties specifically, (3) limitations resulting from further governmental action in an effort to stabilize or provide additional regulation of the financial system, or (4) recessionary conditions that are deeper or last longer than currently anticipated.
We operate in a highly regulated environment and may be adversely affected by changes in laws or regulations.
We are subject to extensive regulation and supervision under federal and state laws and regulations. The requirements and limitations imposed by such laws and regulations limit the manner in which we conduct our business, undertake new investments and activities and obtain financing. These regulations are designed primarily for the protection of the deposit insurance funds and consumers and not to benefit our shareholders. Financial institution regulation has been the subject of significant legislation in recent years and may be the subject of further significant legislation in the future, none of which is within our control. Federal and state regulatory agencies also frequently adopt changes to their regulations or change the manner in which existing regulations are applied or enforced. We cannot predict the substance or impact of pending or future legislation, regulation or the application thereof. Compliance with such current and potential regulation and scrutiny may significantly increase our costs, impede the efficiency of our internal business processes, require us to increase our regulatory capital and limit our ability to pursue business opportunities in an efficient manner.
The Dodd-Frank Wall Street Reform and Consumer Protection Act may affect our financial condition, results of operations, liquidity and stock price.
On July 21, 2010, the Dodd-Frank Wall Street Reform and Consumer Protection Act, or the Dodd-Frank Act, was signed into law. The Dodd-Frank Act includes provisions affecting large and small financial institutions, including several provisions that will profoundly affect how community banks and bank holding companies will be regulated in the future. Among other things, these provisions relax rules regarding interstate
- 13 -
Table of Contents
branching, allow financial institutions to pay interest on business checking accounts, change the scope of federal deposit insurance coverage and impose new capital requirements on bank holding companies. In addition, there is significant uncertainty about the full impact of the Dodd-Frank Act because many of its provisions require subsequent regulatory rule making.
The Dodd-Frank Act establishes the Bureau of Consumer Financial Protection as an independent entity within the Federal Reserve, which will be given authority to promulgate consumer protection regulations applicable to all entities offering financial services or products, including banks. Additionally, the Dodd-Frank Act includes a series of provisions covering mortgage loan origination standards affecting, among other things, originator compensation, minimum repayment standards and pre-payments.
The Dodd-Frank Act contains numerous other provisions affecting financial institutions of all types, many of which may have an impact on the Company’s operating environment in substantial and unpredictable ways. Consequently, the Dodd-Frank Act is likely to affect our cost of doing business, it may limit or expand the activities in which Orrstown permissibly may engage and it may affect the competitive balance within the Company’s industry and market areas.
The Dodd-Frank Act and the regulations to be adopted thereunder are expected to subject Orrstown and other financial institutions to additional restrictions, oversight and costs that may have an adverse impact on its business, financial condition, results of operations or the price of Orrstown common stock and the Company’s ability to continue to conduct business consistent with historical practices.
The recent repeal of federal prohibitions on the payment of interest on demand deposits could increase our interest expense and reduce our net interest margin.
All federal prohibitions on the ability of financial institutions to pay interest on demand deposit accounts were repealed as part of the Dodd-Frank Act. As a result, beginning on July 21, 2011, financial institutions could commence offering interest on demand deposits to compete for clients. We do not know what interest rates or products other institutions may offer. Our interest expense could increase and our net interest margin could decrease if we begin offering interest on demand deposits to attract additional customers or maintain current customers. Consequently, our business, financial condition or results of operations could be adversely affected.
We may be required to make further increases in our provisions for loan losses and to charge off additional loans in the future, which could materially adversely affect us.
There is no precise method of predicting loan losses. We can give no assurance that our allowance for loan losses is or will be sufficient to absorb actual loan losses. We maintain an allowance for loan losses, which is a reserve established through a provision for loan losses charged to expense, that represents management’s best estimate of probable incurred losses within the existing portfolio of loans. The level of the allowance reflects management’s evaluation of, among other factors, the status of specific impaired loans, trends in historical loss experience, delinquency trends, credit concentrations and economic conditions within our market area. The determination of the appropriate level of the allowance for loan losses inherently involves a high degree of subjectivity and judgment and requires us to make significant estimates of current credit risks and future trends, all of which may undergo material changes. Changes in economic conditions affecting borrowers, new information regarding existing loans, identification of additional problem loans and other factors, both within and outside of our control, may require us to increase our allowance for loan losses. Increases in nonperforming loans have a significant impact on our allowance for loan losses.
In addition, bank regulatory agencies periodically review our allowance for loan losses and may require us to increase the provision for loan losses or to recognize further loan charge-offs, based on judgments that differ from those of management. If loan charge-offs in future periods exceed our allowance for loan losses, we will need to record additional provisions to increase our allowance for loan losses. Furthermore, growth in our loan
- 14 -
Table of Contents
portfolio would generally lead to an increase in the provision for loan losses. Generally, increases in our allowance for loan losses will result in a decrease in net income and stockholders’ equity, and may have a material adverse effect on our financial condition, results of operations and cash flows.
Our allowance for loan losses was 1.66% of total loans and 106% of non-performing loans at December 31, 2010, compared to 1.26% of total loans and 259% of non-performing loans at December 31, 2009. Material additions to our allowance could materially decrease our net income. In addition, at December 31, 2010, our top 25 lending relationships individually had commitments in excess of $6,600,000, and a total outstanding loan balance of $189,335,000, or nearly 20% of the loan portfolio. The deterioration of one or more of these loans could result in a significant increase in our nonperforming loans and our provisions for loan losses, which would negatively impact our results of operations.
Changes in interest rates could adversely impact our financial condition and results of operations.
Our operating income, net income and liquidity depend to a great extent on our net interest margin, i.e., the difference between the interest yields we receive on loans, securities and other interest earning assets and the interest rates we pay on interest-bearing deposits, borrowings and other liabilities. These rates are highly sensitive to many factors beyond our control, including competition, general economic conditions and monetary and fiscal policies of various governmental and regulatory authorities, including the Board of Governors of the Federal Reserve System, or the Federal Reserve. If the rate of interest we pay on our interest-bearing deposits, borrowings and other liabilities increases more than the rate of interest we receive on loans, securities and other interest earning assets, our net interest income, and therefore our earnings, and liquidity could be materially adversely affected. Our earnings and liquidity could also be materially adversely affected if the rates on our loans, securities and other investments fall more quickly than those on our deposits, borrowings and other liabilities. Our operations are subject to risks and uncertainties surrounding our exposure to change in interest rate environment.
Additionally, based on our analysis of the interest rate sensitivity of our assets, an increase in the general level of interest rates will negatively affect the market value of our investment portfolio because of the relatively long duration of the securities included in our investment portfolio.
Changes in interest rates also can affect: (1) our ability to originate loans; (2) the value of our interest-earning assets, which would negatively impact stockholders’ equity, and our ability to realize gains from the sale of such assets; (3) our ability to obtain and retain deposits in competition with other available investment alternatives; and (4) the ability of our borrowers to repay adjustable or variable rate loans.
Increases in FDIC insurance premiums may have a material adverse effect on our results of operations.
During the past few years, higher levels of bank failures have dramatically increased resolution costs of the Federal Deposit Insurance Company, or the FDIC, and depleted the deposit insurance fund. In addition, the FDIC and the U.S. Congress have taken action to increase federal deposit insurance coverage, placing additional stress on the deposit insurance fund.
In order to maintain a strong funding position and restore reserve ratios of the deposit insurance fund, the FDIC increased assessment rates of insured institutions uniformly by seven cents for every $100 of deposits beginning with the first quarter of 2009, with additional changes beginning April 1, 2009, which require riskier institutions to pay a larger share of premiums by factoring in rate adjustments based on secured liabilities and unsecured debt levels.
To further support the rebuilding of the deposit insurance fund, the FDIC imposed a special assessment on each insured institution, equal to five basis points of the institution’s total assets minus Tier 1 capital as of September 30, 2009. For Orrstown Bank, this represented an aggregate charge of approximately $515,000. In
- 15 -
Table of Contents
lieu of imposing an additional special assessment, the FDIC required all institutions to prepay their assessments for all of 2010, 2011 and 2012, which for us totaled $4.4 million. The FDIC has indicated that future special assessments are possible, although it has not determined the magnitude or timing of any future assessments.
In 2011, the FDIC finalized its new assessment for insurance, as required by the Dodd-Frank Act. The final rule, which takes effect April 1, 2011, bases the assessment on what the Bank holds in assets, minus tangible equity, instead of the current method which is based on deposit holdings.
We are generally unable to control the amount of premiums that we are required to pay for FDIC insurance. If there are additional bank or financial institution failures, we may be required to pay even higher FDIC premiums. Our expenses for the year ended December 31, 2010, have been significantly and adversely affected by these increased premiums and the special assessment. These increases and assessment and any future increases in insurance premiums or additional special assessments may materially adversely affect our results of operations.
We are a holding company dependent for liquidity on payments from Orrstown Bank, our sole our subsidiary, which are subject to restrictions.
We are a holding company and depend on dividends, distributions and other payments from Orrstown Bank, our only subsidiary to fund dividend payments and to fund all payments on obligations. Orrstown Bank is subject to laws that restrict dividend payments or authorize regulatory bodies to block or reduce the flow of funds from it to us. Restrictions or regulatory action of that kind could impede access to funds that we need to make payments on our obligations, dividend payments or stock repurchases. In addition, our right to participate in a distribution of assets upon our subsidiary’s liquidation or reorganization is subject to the prior claims of the subsidiary’s creditors.
Because our business is concentrated in South Central Pennsylvania and Washington County, Maryland, our financial performance could be materially adversely affected by economic conditions and real estate values in these market areas.
Our operations and the properties securing our loans are primarily in South Central Pennsylvania (principally Franklin, Perry and Cumberland Counties) and in Washington County, Maryland. Our operating results depend largely on economic and real estate valuations in these and surrounding areas. A further deterioration in the economic conditions in these market areas could materially adversely affect our operations and increase loan delinquencies, increase problem assets and foreclosures, increase claims and lawsuits, decrease the demand for our products and services and decrease the value of collateral securing loans, especially real estate, in turn reducing customers’ borrowing power, the value of assets associated with nonperforming loans and collateral coverage.
Our commercial real estate lending may expose us to a greater risk of loss and hurt our earnings and profitability.
Our business strategy involves making loans secured by commercial real estate. These types of loans generally have higher risk-adjusted returns and shorter maturities than traditional one-to-four family residential mortgage loans. At December 31, 2010, our loans secured by commercial real estate totaled approximately $340 million, which represented 35% of total loans. Loans secured by commercial real estate properties are generally for larger amounts and may involve a greater degree of risk than one-to-four family residential mortgage loans. Payments on loans secured by these properties are often dependent on the income produced by the underlying properties which, in turn, depends on the successful operation and management of the properties. Accordingly, repayment of these loans is subject to adverse conditions in the real estate market or the local economy. In addition, many economists believe that deterioration in income producing commercial real estate is likely to worsen as vacancy rates continue to rise and absorption rates of existing square footage continue to decline.
- 16 -
Table of Contents
Because of the current general economic slowdown, these loans represent higher risk, could result in an increase in our total net-charge offs and could require us to increase our allowance for loan losses, which could have a material adverse effect on our financial condition or results of operations. While we seek to minimize these risks in a variety of ways, there can be no assurance that these measures will protect against credit-related losses.
Our construction loans and land development loans involve a higher degree of risk than other segments of our loan portfolio.
Construction financing typically involves a higher degree of credit risk than financing on improved, owner-occupied real estate. Risk of loss on a construction loan is largely dependent upon the accuracy of the initial estimate of the property’s value at completion of construction and the bid price and estimated cost (including interest) of construction. If the estimate of construction costs proves to be inaccurate, we may be required to advance funds beyond the amount originally committed to permit completion of the project. If the estimate of the value proves to be inaccurate, we may be confronted, at or prior to the maturity of the loan, with a project whose value is insufficient to assure full repayment. When lending to builders, the cost of construction breakdown is provided by the builder, as well as supported by the appraisal. Although our underwriting criteria are designed to evaluate and minimize the risks of each construction loan, there can be no guarantee that these practices will safeguard against material delinquencies and losses to our operations. At December 31, 2010, we had loans of approximately $117 million, or 12% of total loans, outstanding to finance construction and land development. Construction and land development loans are dependent on the successful completion of the projects they finance, however, in many cases such construction and development projects in our primary market areas are not being completed in a timely manner, if at all.
We are required to make a number of judgments in applying accounting policies and different estimates and assumptions in the application of these policies could result in a decrease in capital and/or other material changes to our reports of financial condition and results of operations. Also, changes in accounting standards can be difficult to predict and can materially impact how we record and report our financial condition and results of operations.
Material estimates that are particularly susceptible to significant change relate to the determination of the allowance for loan losses and reserve for unfunded lending commitments and the fair value of certain financial instruments (securities, derivatives, and privately held investments). While we have identified those accounting policies that are considered critical and have procedures in place to facilitate the associated judgments, different assumptions in the application of these policies could result in a decrease to net income and, possibly, capital and may have a material adverse effect on our financial condition and results of operations.
Our accounting policies and methods are fundamental to how we record and report our financial condition and results of operations. From time to time, the Financial Accounting Standards Board changes the financial accounting and reporting standards that govern the preparation of our financial statements. These changes can be hard to predict and can materially impact how we record and report our financial condition and results of operations.
Competition from other banks and financial institutions in originating loans, attracting deposits and providing various financial services may adversely affect our profitability and liquidity.
We have substantial competition in originating loans, both commercial and consumer, in our market area. This competition comes principally from other banks, savings institutions, mortgage banking companies and other lenders. Some of our competitors enjoy advantages, including greater financial resources and access to capital, stronger regulatory ratios, and higher lending limits, a wider geographic presence, more accessible branch office locations, the ability to offer a wider array of services or more favorable pricing alternatives, as well as lower origination and operating costs. This competition could reduce our net income and liquidity by decreasing the number and size of loans that we originate and the interest rates we may charge on these loans.
- 17 -
Table of Contents
In attracting business and consumer deposits, we face substantial competition from other insured depository institutions such as banks, savings institutions and credit unions, as well as institutions offering uninsured investment alternatives, including money market funds. Some of our competitors enjoy advantages, including greater financial resources and access to capital, stronger regulatory ratios, stronger asset quality and performance, more aggressive marketing campaigns, better brand recognition and more branch locations. These competitors may offer higher interest rates than we do, which could decrease the deposits that we attract or require us to increase our rates to retain existing deposits or attract new deposits. Increased deposit competition could materially adversely affect our ability to generate the funds necessary for lending operations. As a result, we may need to seek other sources of funds that may be more expensive to obtain and could increase our cost of funds.
Impairment of investment securities, goodwill, other intangible assets, or deferred tax assets could require charges to earnings, which could result in a negative impact on our results of operations.
In assessing the impairment of investment securities, we consider the length of time and extent to which the fair value has been less than cost, the financial condition and near-term prospects of the issuers, and our intent and ability to retain its investment in the issuer for a period of time sufficient to allow for any anticipated recovery in fair value in the near term. Under current accounting standards, goodwill and certain other intangible assets with indeterminate lives are no longer amortized but, instead, are assessed for impairment periodically or when impairment indicators are present. Assessment of goodwill and such other intangible assets could result in circumstances where the applicable intangible asset is deemed to be impaired for accounting purposes. Under such circumstances, the intangible asset’s impairment would be reflected as a charge to earnings in the period during which such impairment is identified. In assessing the reliability of deferred tax assets, management considers whether it is more likely than not that some portion or all of the deferred tax assets will not be realized. The ultimate realization of deferred tax assets is dependent upon the generation of future taxable income during the periods in which those temporary differences become deductible. The impact of each of these impairment matters could have a material adverse effect on our business, results of operations, and financial condition.
Our business strategy includes the continuation of moderate growth plans, and our financial condition and results of operations could be negatively affected if we fail to grow or fail to manage our growth effectively.
Our assets increased $910.3 million, or 151%, from $601.5 million at January 1, 2006, to $1.511 billion at December 31, 2010, primarily due to our acquisition of First National in 2006 and organic growth through increases in residential mortgage loans and commercial real estate loans and securities available for sale funded by growth in deposits. Over the long term, we expect to continue to experience growth in the amount of our assets, the level of our deposits and the scale of our operations. However, achieving our growth targets requires us to successfully execute our business strategies, which include continuing to grow our loan portfolio thereby recognizing the value of our investments in personnel in that area. Our ability to successfully grow will also depend on the continued availability of loan opportunities that meet our stringent underwriting standards. In addition, we may consider the acquisition of other financial institutions and branches within or outside of our market area, the success of which will depend on a number of factors, including our ability to integrate the acquired branches into the current operations of the Company, our ability to limit the outflow of deposits held by customers of the acquired institution or branch locations, our ability to control the incremental increase in non-interest expense arising from any acquisition and our ability to retain and integrate the appropriate personnel of the acquired institution or branches. While we believe we have the resources and internal systems in place to successfully achieve and manage our future growth, there can be no assurance growth opportunities will be available or that we will successfully manage our growth. If we do not manage our growth effectively, we may not be able to achieve our business plan, and our business and prospects could be harmed.
- 18 -
Table of Contents
If we want to, or are compelled to, raise additional capital in the future, that capital may not be available when it is needed and on terms favorable to current shareholders.
Federal banking regulators require us and our banking subsidiaries to maintain adequate levels of capital to support our operations. These capital levels are determined and dictated by law, regulation and banking regulatory agencies. In addition, capital levels are also determined by our management and board of directors based on capital levels that, they believe, are necessary to support our business operations. At December 31, 2010, all three capital ratios for us and our banking subsidiary were above “well capitalized” levels under current bank regulatory guidelines. To be “well capitalized,” banking companies generally must maintain a tier 1 leverage ratio of at least 5%, a Tier 1 risk-based capital ratio of at least 6%, and a total risk-based capital ratio of at least 10%. However, our regulators may require us or our banking subsidiary to operate with higher capital levels. For example, regulators recently have required some banks to attain a Tier 1 leverage ratio of at least 8%, a Tier 1 risk-based capital ratio of at least 10%, and a total risk-based capital ratio of at least 12%.
Our ability to raise additional capital will depend on conditions in the capital markets at that time, which are outside of our control, and on our financial performance. Accordingly, we cannot assure you of our ability to raise additional capital on terms and time frames acceptable to us or to raise additional capital at all. If we cannot raise additional capital in sufficient amounts when needed, our ability to comply with regulatory capital requirements could be materially impaired. Additionally, the inability to raise capital in sufficient amounts may adversely affect our operations, financial condition and results of operating. Our ability to borrow could also be impaired by factors that are nonspecific to us, such as severe disruption of the financial markets or negative news and expectations about the prospects for the financial services industry as a whole as evidenced by recent turmoil in the domestic and worldwide credit markets. If we raise capital through the issuance of additional shares of our common stock or other securities, we would likely dilute the ownership interests of current investors and could dilute the per share book value and earnings per share of our common stock. Furthermore, a capital raise through issuance of additional shares may have an adverse impact on our stock price.
We may be adversely affected by technological advances.
Technological advances impact our business. The banking industry is undergoing technological changes with frequent introductions of new technology-driven products and services. In addition to improving customer services, the effective use of technology increases efficiency and enables financial institutions to reduce costs. Our future success will depend, in part, on our ability to address the needs of our customers by using technology to provide products and services that will satisfy customer demands for convenience as well as to create additional efficiencies in operations. Many competitors have substantially greater resources to invest in technological improvements. We may not be able to effectively implement new technology-driven products and services or successfully market such products and services to its customers.
The soundness of other financial institutions could adversely affect us.
Our ability to engage in routine funding and other transactions could be adversely affected by the actions and commercial soundness of other financial institutions. Financial services institutions are interrelated as a result of trading, clearing, counterparty or other relationships. As a result, defaults by, or even rumors or questions about, one or more financial services institutions, or the financial services industry generally, have led to market-wide liquidity problems, losses of depositor, creditor and counterparty confidence and could lead to losses or defaults by us or by other institutions. We could experience increases in deposits and assets as a result of other banks’ difficulties or failure, which would increase the capital we need to support such growth.
A substantial decline in the value of our Federal Home Loan Bank of Pittsburgh common stock may adversely affect our financial condition.
We own common stock of the Federal Home Loan Bank of Pittsburgh, or the FHLB, in order to qualify for membership in the Federal Home Loan Bank system, which enables us to borrow funds under the Federal Home
- 19 -
Table of Contents
Loan Bank advance program. The carrying value and fair market value of our FHLB common stock was approximately $7.0 million as of December 31, 2010.
Published reports indicate that certain member banks of the Federal Home Loan Bank system may be subject to asset quality risks that could result in materially lower regulatory capital levels. In December 2008, the FHLB had notified its member banks that it had suspended dividend payments and the repurchase of capital stock until further notice is provided. In an extreme situation, it is possible that the capitalization of a Federal Home Loan Bank, including the FHLB, could be substantially diminished or reduced to zero. Consequently, given that there is no market for our FHLB common stock, we believe that there is a risk that our investment could be deemed other-than-temporarily impaired at some time in the future. If this occurs, it may adversely affect our results of operations and financial condition. If the FHLB were to cease operations, or if we were required to write-off our investment in the FHLB, our business, financial condition, liquidity, capital and results of operations may be materially adversely affected.
An interruption or breach in security with respect to our information system, or our outsourced service providers, could adversely impact our reputation and have an adverse impact on our financial condition or results of operations.
We rely on software, communication, and information exchange on a variety of computing platforms and networks and over the Internet. Despite numerous safeguards, we cannot be certain that all of our systems are entirely free from vulnerability to attack or other technological difficulties or failures. We rely on the services of a variety of vendors to meet our data processing and communication needs. If information security is breached or other technology difficulties or failures occur, information may be lost or misappropriated, services and operations may be interrupted and we could be exposed to claims from customers. Any of these results could have a material adverse effect on our financial condition, results of operations or liquidity.
If we fail to maintain an effective system of internal control over financial reporting and disclosure controls and procedures, we may be unable to accurately report our financial results and comply with the reporting requirements under the Securities Exchange Act of 1934. As a result, current and potential shareholders may lose confidence in our financial reporting and disclosure required under the Securities Exchange Act of 1934, which could adversely affect our business and could subject us to regulatory scrutiny.
Pursuant to Section 404 of the Sarbanes-Oxley Act of 2002, referred to as Section 404, we are required to include in our Annual Reports on Form 10-K, our management’s report on internal control over financial reporting. While we have reported no “material weaknesses” in the Form 10-K for the fiscal year ended December 31, 2010, we cannot guarantee that we will not have any “material weaknesses” reported in our management’s report on internal control or by our independent registered public accounting firm in the future. Compliance with the requirements of Section 404 is expensive and time-consuming. If, in the future, we fail to complete this evaluation in a timely manner, or if our independent registered public accounting firm cannot timely attest to our evaluation, we could be subject to regulatory scrutiny and a loss of public confidence in our internal control over financial reporting. In addition, any failure to establish an effective system of disclosure controls and procedures could cause our current and potential shareholders and customers to lose confidence in our financial reporting and disclosure required under the Securities Exchange Act of 1934, which could adversely affect our business.
ITEM 1B—UNRESOLVED STAFF COMMENTS
None
- 20 -
Table of Contents
Orrstown Bank owns and leases properties in Cumberland, and Franklin Counties, Pennsylvania and Washington County, Maryland as branch banking offices, and an operations center. The Company and Orrstown Bank maintain headquarters at the Bank’s King Street Office in Shippensburg, Pennsylvania. A summary of these properties is as follows:
- 21 -
Table of Contents
Orrstown Financial Services, Inc. is an occasional party to legal actions arising in the ordinary course of its business. In the opinion of management, the Company has adequate legal defenses and/or insurance coverage respecting any and each of these actions and does not believe that they will materially affect the Company’s operations or financial position.
None
- 22 -
Table of Contents
PART II
ITEM 5—MARKET FOR REGISTRANT’S COMMON EQUITY, RELATED SECURITY HOLDER MATTERS AND ISSUER PURCHASES OF EQUITY SECURITIES
Market Information
Our common stock began trading on The NASDAQ Capital Market under the symbol “ORRF” as of April 28, 2009, and continues to be listed there as of the date hereof. Before such listing, our common stock was quoted on the OTC Bulletin Board (“OTCBB”). The OTCBB is a regulated quotation service that displays real-time quotes, last-sale prices and volume information in over-the-counter equity securities. Unlike The NASDAQ Capital Market, the OTCBB does not impose listing standards and does not provide automated trade executions. Historical trading in the Company’s stock has not been extensive and such trades cannot be characterized as constituting an active trading market. At the close of business on March 7, 2011, there were approximately 3,111 shareholders of record.
The following table sets forth, for the fiscal periods indicated, the high and low sales prices or closing bid prices for our common stock for the two most recent fiscal years. The quotations for the periods in which our common stock traded on the OTCBB reflect inter-dealer prices, without retail mark-up, markdown or commission and may not represent actual transactions. Trading prices are based on published financial sources.
| 2010 | 2009 | |||||||||||||||||||||||
| Market Price | Quarterly Dividend |
Market Price | Quarterly Dividend |
|||||||||||||||||||||
| High | Low | High | Low | |||||||||||||||||||||
| First quarter |
$ | 36.50 | $ | 24.92 | $ | 0.22 | $ | 29.25 | $ | 23.50 | $ | 0.22 | ||||||||||||
| Second quarter |
26.64 | 20.45 | 0.22 | 40.00 | 22.00 | 0.22 | ||||||||||||||||||
| Third quarter |
24.59 | 20.00 | 0.225 | 39.00 | 34.26 | 0.22 | ||||||||||||||||||
| Fourth quarter |
27.95 | 22.82 | 0.225 | 39.39 | 27.77 | 0.22 | ||||||||||||||||||
| $ | 0.89 | $ | 0.88 | |||||||||||||||||||||
The Company expects to continue its policy of paying regular cash dividends declared from time to time by the Board of Directors, although there is no assurance as to future dividends because they depend on future earnings, capital requirements, financial condition and other factors deemed relevant by the Board of Directors. See Note 15, “Restrictions on Dividends, Loans and Advances,” in the “Notes to Consolidated Financial Statements” included in Item 8 for the year ended December 31, 2010 for restrictions on the payment of dividends.
- 23 -
Table of Contents
Issuer Purchases of Equity Securities
The table below summarizes the Company’s repurchase of common equity securities during the quarter ended December 31, 2010. The maximum number of shares that may yet be purchased under the plan is 191,926 shares at December 31, 2010.
| Total Number of Shares Purchased |
Average Price Paid per Share |
Total Number of Shares Purchased as Part of Publicly Announced Plans or Programs(1) |
Maximum Number of Shares that may Yet be Purchased Under the Plans or Programs(1) |
|||||||||||||
| 10/1/10 through 10/31/10 |
0 | $ | 0 | 0 | 193,001 | |||||||||||
| 11/1/10 through 11/30/10 |
0 | 0 | 0 | 193,001 | ||||||||||||
| 12/1/10 through 12/31/10 |
1,075 | 25.36 | 1,075 | 191,926 | ||||||||||||
| Total |
1,075 | $ | 25.36 | |||||||||||||
| (1) | On April 27, 2006, Orrstown Financial Services, Inc. announced a Stock Repurchase Plan approving the purchase of up to 150,000 shares as conditions allow. 106,999 shares were repurchased pursuant to that program. On September 23, 2010, Orrstown Financial Services, Inc. announced an extension of the Stock Repurchase Plan authorizing the repurchase of an additional 150,000 shares, including the 43,001 shares remaining to be purchased under the plan as originally approved. The plan may be suspended at any time without prior notice and has no prescribed time limit in which to fill the authorized repurchase amount. As of December 31, 2010, 108,074 shares have been purchased under the program. |
- 24 -
Table of Contents
PERFORMANCE GRAPH
The following graph shows a five-year comparison of the cumulative total return on the Company’s common stock as compared to other indexes: the SNL index of banks with assets between $1 billion and $5 billion, the S&P 500 Index, and the NASDAQ Composite index. Shareholder returns on the Company’s common stock are based upon trades on the NASDAQ Stock Market. The shareholder returns shown in the graph are not necessarily indicative of future performance.
Orrstown Financial Services, Inc.
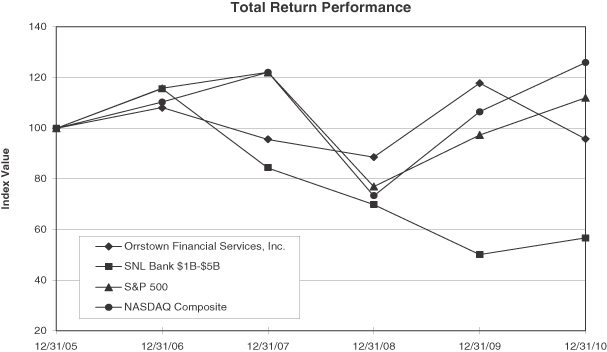
| Period Ending | ||||||||||||||||||||||||
| Index |
12/31/05 | 12/31/06 | 12/31/07 | 12/31/08 | 12/31/09 | 12/31/10 | ||||||||||||||||||
| Orrstown Financial Services, Inc. |
100.00 | 108.24 | 95.62 | 88.58 | 117.84 | 95.85 | ||||||||||||||||||
| SNL Bank $1B-$5B |
100.00 | 115.72 | 84.29 | 69.91 | 50.11 | 56.81 | ||||||||||||||||||
| S&P 500 |
100.00 | 115.79 | 122.16 | 76.96 | 97.33 | 111.99 | ||||||||||||||||||
| NASDAQ Composite |
100.00 | 110.39 | 122.15 | 73.32 | 106.57 | 125.91 | ||||||||||||||||||
In accordance with the rules of the SEC, this section captioned “Performance Graph” shall not be incorporated by reference into any of our future filings made under the Securities Exchange Act of 1934 or the Securities Act of 1933. The Performance Graph and its accompanying table are not deemed to be soliciting material or to be filed under the Exchange Act or the Securities Act.
Recent Sales of Unregistered Securities
The Company has not sold any securities within the past three years which were not registered under the Securities Act of 1933.
- 25 -
Table of Contents
ITEM 6—SELECTED FINANCIAL DATA
| Year Ended December 31, | ||||||||||||||||||||
| (Dollars in thousands) |
2010 | 2009 | 2008 | 2007 | 2006** | |||||||||||||||
| Summary of Operations |
||||||||||||||||||||
| Interest income |
$ | 58,423 | $ | 53,070 | $ | 52,313 | $ | 53,106 | $ | 44,788 | ||||||||||
| Interest expense |
12,688 | 16,500 | 19,408 | 22,986 | 17,371 | |||||||||||||||
| Net interest income |
45,735 | 36,570 | 32,905 | 30,120 | 27,417 | |||||||||||||||
| Provision for loan losses |
8,925 | 4,865 | 1,450 | 750 | 390 | |||||||||||||||
| Net interest income after provision for loan losses |
36,810 | 31,705 | 31,455 | 29,370 | 27,027 | |||||||||||||||
| Securities gains (losses) |
3,636 | 1,661 | (27 | ) | 58 | 41 | ||||||||||||||
| Other operating income |
20,157 | 16,024 | 15,322 | 13,186 | 10,984 | |||||||||||||||
| Other operating expenses |
37,552 | 31,967 | 28,165 | 24,859 | 21,570 | |||||||||||||||
| Income before income taxes |
23,051 | 17,423 | 18,585 | 17,755 | 16,482 | |||||||||||||||
| Income tax expense |
6,470 | 4,050 | 5,482 | 5,197 | 4,850 | |||||||||||||||
| Net income |
$ | 16,581 | $ | 13,373 | $ | 13,103 | $ | 12,558 | $ | 11,632 | ||||||||||
| Per Common Share Data* |
||||||||||||||||||||
| Income before taxes |
$ | 3.03 | $ | 2.72 | $ | 2.89 | $ | 2.76 | $ | 2.66 | ||||||||||
| Applicable income taxes |
0.85 | 0.63 | 0.85 | 0.81 | 0.78 | |||||||||||||||
| Net income |
2.18 | 2.09 | 2.04 | 1.95 | 1.87 | |||||||||||||||
| Diluted net income |
2.17 | 2.07 | 2.03 | 1.94 | 1.86 | |||||||||||||||
| Cash dividend paid |
0.89 | 0.88 | 0.87 | 0.82 | 0.743 | |||||||||||||||
| Book value at December 31 |
20.10 | 17.21 | 16.18 | 14.97 | 13.88 | |||||||||||||||
| Tangible book value at December 31 |
17.50 | 13.96 | 12.87 | 11.64 | 10.53 | |||||||||||||||
| Average shares outstanding—basic |
7,609,933 | 6,406,106 | 6,421,022 | 6,428,853 | 6,201,978 | |||||||||||||||
| Average shares outstanding—diluted |
7,637,824 | 6,458,752 | 6,466,391 | 6,480,710 | 6,257,647 | |||||||||||||||
| Stock Price Statistics* |
||||||||||||||||||||
| Close |
$ | 27.41 | $ | 34.88 | $ | 27.00 | $ | 30.00 | $ | 34.81 | ||||||||||
| High |
36.50 | 40.00 | 33.96 | 36.19 | 37.14 | |||||||||||||||
| Low |
20.00 | 22.00 | 27.00 | 28.00 | 30.29 | |||||||||||||||
| Price earnings ratio at close |
12.6 | 16.7 | 13.2 | 15.4 | 18.6 | |||||||||||||||
| Diluted price earnings ratio at close |
12.6 | 16.8 | 13.3 | 15.5 | 18.7 | |||||||||||||||
| Price to book at close |
1.4 | 2.0 | 1.7 | 2.0 | 2.5 | |||||||||||||||
| Price to tangible book at close |
1.6 | 2.5 | 2.1 | 2.6 | 3.3 | |||||||||||||||
| Year-End Balance Sheet Data |
||||||||||||||||||||
| Total assets |
$ | 1,511,722 | $ | 1,196,432 | $ | 1,051,783 | $ | 884,979 | $ | 809,031 | ||||||||||
| Total loans |
966,986 | 881,074 | 820,468 | 701,964 | 618,827 | |||||||||||||||
| Total investment securities |
440,570 | 204,309 | 128,353 | 96,355 | 91,393 | |||||||||||||||
| Deposits—noninterest bearing |
104,646 | 90,676 | 84,261 | 91,365 | 85,420 | |||||||||||||||
| Deposits—interest bearing |
1,083,731 | 824,494 | 673,107 | 554,991 | 553,299 | |||||||||||||||
| Total deposits |
1,188,377 | 915,170 | 757,368 | 646,356 | 638,719 | |||||||||||||||
| Repurchase agreements |
87,850 | 64,614 | 63,407 | 55,580 | 40,953 | |||||||||||||||
| Borrowed money |
65,178 | 64,858 | 118,887 | 78,453 | 33,190 | |||||||||||||||
| Total shareholders’ equity |
160,484 | 110,886 | 103,347 | 96,124 | 89,388 | |||||||||||||||
| Trust assets under management—market value |
$ | 570,000 | $ | 414,000 | $ | 354,000 | $ | 415,000 | $ | 404,000 | ||||||||||
- 26 -
Table of Contents
| Year Ended December 31, | ||||||||||||||||||||
| (Dollars in thousands) |
2010 | 2009 | 2008 | 2007 | 2006** | |||||||||||||||
| Performance Statistics |
||||||||||||||||||||
| Average equity / average assets |
10.76 | % | 9.55 | % | 10.45 | % | 10.98 | % | 10.66 | % | ||||||||||
| Return on average equity |
11.22 | % | 12.48 | % | 13.20 | % | 13.64 | % | 15.10 | % | ||||||||||
| Return on average tangible equity |
13.19 | % | 15.73 | % | 17.02 | % | 18.02 | % | 18.98 | % | ||||||||||
| Return on average assets |
1.21 | % | 1.19 | % | 1.38 | % | 1.50 | % | 1.61 | % | ||||||||||
| Return on average tangible assets |
1.23 | % | 1.23 | % | 1.43 | % | 1.56 | % | 1.66 | % | ||||||||||
| ** | Per share amounts have been restated to reflect a 5% stock dividend paid June 15, 2007. |
Supplemental Reporting of Non-GAAP-Based Financial Measures
Return on average tangible assets and return on average tangible equity is a non-GAAP-based financial measure calculated using non-GAAP-based amounts. The most directly comparable measure is return on average assets and return on average equity, which are calculated using GAAP-based amounts. The Company calculates the return on average tangible assets and equity by excluding the balance of intangible assets and their related amortization expense from the calculation of return on average assets and equity. Management uses the return on average tangible assets and equity to assess the Company’s core operating results and believes that this is a better measure of our operating performance as it is based on the Company’s tangible assets and capital. Further we believe that by excluding the impact of purchase accounting adjustments it allows for a meaningful comparison with the Company’s peers, particularly those that may not have acquired other companies. In addition, this is consistent with the treatment by bank regulatory agencies, which exclude goodwill and other intangible assets from the calculation of risk-based capital ratios. However, these non-GAAP financial measures are supplemental and are not a substitute for an analysis based on GAAP measures. A reconciliation of return on average assets and equity to the return on average tangible assets and equity, respectively, is set forth below.
| Year Ended December 31, | ||||||||||||||||||||
| 2010 | 2009 | 2008 | 2007 | 2006 | ||||||||||||||||
| Return on average assets (GAAP basis) |
1.21 | % | 1.19 | % | 1.38 | % | 1.50 | % | 1.61 | % | ||||||||||
| Effect of excluding average intangible assets and related amortization, net of tax |
0.02 | % | 0.04 | % | 0.05 | % | 0.06 | % | 0.05 | % | ||||||||||
| Return on average tangible assets |
1.23 | % | 1.23 | % | 1.43 | % | 1.56 | % | 1.66 | % | ||||||||||
| Return on average equity (GAAP basis) |
11.22 | % | 12.48 | % | 13.20 | % | 13.64 | % | 15.10 | % | ||||||||||
| Effect of excluding average intangible assets and related amortization, net of tax |
1.97 | % | 3.25 | % | 3.82 | % | 4.38 | % | 3.88 | % | ||||||||||
| Return on average tangible equity |
13.19 | % | 15.73 | % | 17.02 | % | 18.02 | % | 18.98 | % | ||||||||||
Tangible book value is computed by dividing shares outstanding into tangible common equity. Management uses tangible book value per share because it believes such ratio is useful in understanding the Company’s capital position and ratios. See reconciliation of book value per share to tangible book value per share below.
| Year Ended December 31, | ||||||||||||||||||||
| (Dollars in thousands, except per share data) |
2010 | 2009 | 2008 | 2007 | 2006 | |||||||||||||||
| Shareholders’ equity |
$ | 160,484 | $ | 110,886 | $ | 103,347 | $ | 96,124 | $ | 89,388 | ||||||||||
| Less: Intangible assets |
20,698 | 20,938 | 21,186 | 21,368 | 21,567 | |||||||||||||||
| Tangible equity |
$ | 139,786 | $ | 89,948 | $ | 82,161 | $ | 74,756 | $ | 67,821 | ||||||||||
| Book value per share |
$ | 20.10 | $ | 17.21 | $ | 16.18 | $ | 14.97 | $ | 13.88 | ||||||||||
| Less: Intangible assets per share |
2.60 | 3.25 | 3.31 | 3.33 | 3.35 | |||||||||||||||
| Tangible book value per share |
$ | 17.50 | $ | 13.96 | $ | 12.87 | $ | 11.64 | $ | 10.53 | ||||||||||
- 27 -
Table of Contents
ITEM 7—MANAGEMENT’S DISCUSSION AND ANALYSIS OF FINANCIAL CONDITION AND RESULTS OF OPERATION
Overview
The following is a discussion of our consolidated financial condition and results of operations for each of the three years ended December 31, 2010, 2009 and 2008. The following discussion and analysis should be read in conjunction with our Consolidated Financial Statements and Notes to Consolidated Financial Statements presented in this report to assist in the evaluation of Orrstown Financial Services, Inc.’s 2010 performance. Certain prior period amounts, presented in this discussion and analysis, have been reclassified to conform to current period classifications.
Important Factors Relating to Forward Looking Statements
This Report contains statements that are considered “forward-looking statements” as defined in the Private Securities Litigation Reform Act of 1995. In addition, the Company may make other written and oral communications, from time to time, that contain such statements. Forward-looking statements, including statements as to industry trends, future expectations and other matters that do not relate strictly to historical facts, are based on certain assumptions by management, and are often identified by words or phrases such as “anticipated”, “believe”, “expect”, “intend”, “seek”, “plan”, “objective”, “trend”, and “goal”. Forward-looking statements are subject to various assumptions, risks, and uncertainties, which change over time, and speak only as of the date they are made.
In addition to factors mentioned elsewhere in this Report or previously disclosed in our SEC reports (accessible on the SEC’s website at www.sec.gov or on our website at www.orrstown.com), the following factors, among others, could cause actual results to differ materially from forward-looking statements and future results could differ materially from historical performance:
| • | general political and economic conditions may be less favorable than expected; |
| • | developments concerning credit quality in various corporate lending industry sectors as well as consumer and other types of credit, may result in an increase in the level of our provision for credit losses, nonperforming assets, net charge-offs and reserve for credit losses; |
| • | customer borrowing, repayment, investment, and deposit practices generally may be less favorable than anticipated; and interest rate and currency fluctuations, equity and bond market fluctuations, and inflation may be greater than expected; |
| • | changes in interest rates or the mix of interest rates and maturities of our interest earning assets and interest bearing liabilities (primarily loans and deposits) may be less favorable than expected; |
| • | competitive product and pricing pressures among financial institutions within our markets may increase; |
| • | legislative or regulatory developments, including changes in laws or regulations concerning taxes, banking, securities, capital requirements and risk-based capital guidelines, reserve methodologies, deposit insurance and other aspects of the financial services industry, may adversely affect the businesses in which we are engaged or our financial results; |
| • | legal and regulatory proceedings, included changes resulting from the Dodd-Frank Wall Street Reform and Consumer Protection Act and related matters with respect to the financial services industry, including those directly involving the Company and its subsidiaries, could adversely affect the Company or the financial services industry generally; |
| • | pending and proposed changes in accounting rules, policies, practices, and procedures could adversely affect our financial results; |
- 28 -
Table of Contents
| • | instruments and strategies used to manage exposure to various types of market and credit risk could be less effective than anticipated, and we may not be able to effectively mitigate our risk exposures in particular market environments or against particular types of risk; |
| • | terrorist activities or other hostilities, including the situation surrounding Iraq, may adversely affect the general economy, financial and capital markets, specific industries, and the Company; and |
| • | technological changes may be more difficult or expensive than anticipated. |
The Company undertakes no obligation to update any forward-looking statements. Actual results could differ materially from those anticipated in forward-looking statements and future results could differ materially from historical performance.
Critical Accounting Policies
Orrstown’s consolidated financial statements are prepared in accordance with accounting principles generally accepted in the United States (GAAP) and follow general practices within the financial services industry in which it operates. Management, in order to prepare the Company’s consolidated financial statements, is required to make estimates, assumptions and judgments that affect the amounts reported in the financial statements and accompanying notes. These estimates, assumptions, and judgments are based on information available as of the balance sheet date through the date the financial statements are filed with the Commission. As this information changes, the consolidated financial statements could reflect different estimates, assumptions, and judgments. Certain policies inherently have a greater reliance on the use of estimates, assumptions, and judgments and as such have a greater possibility of producing results that could be materially different than originally reported. Estimates, assumptions, and judgments are necessary when assets and liabilities are required to be recorded at fair value, when a decline in the value of an asset not carried on the financial statements at fair value warrants an impairment write-down or valuation reserve to be established, or when an asset or liability needs to be recorded contingent upon a future event. Carrying assets and liabilities at fair value inherently results in more financial statement volatility. The fair values and the information used to record valuation adjustments for certain assets and liabilities are based either on quoted market prices or are provided by other third-party sources.
The most significant accounting policies followed by the Company are presented in Note 1 to the consolidated financial statements. These policies, along with the disclosures presented in the other financial statement notes, provide information on how significant assets and liabilities are valued in the financial statements and how those values are determined. Based on the valuation techniques used and the sensitivity of financial statement amounts to the methods, assumptions, and estimates underlying those amounts, the Company has identified the adequacy of the allowance for loan losses, evaluation of goodwill for potential impairment, and accounting for income taxes as critical accounting policies.
The allowance for loan losses represents Management’s estimate of probable credit losses inherent in the loan portfolio. Determining the amount of the allowance for loan losses is considered a critical accounting estimate because it requires significant judgment and the use of estimates related to the amount and timing of expected future cash flows on impaired loans, estimated losses on pools of homogeneous loans based on historical loss experience, and consideration of current economic trends and conditions, all of which may be susceptible to significant change. The loan portfolio also represents the largest asset type on the consolidated balance sheet.
Goodwill and other intangible assets have been recorded on the books of the Company in connection with its acquisitions. Goodwill and other intangible assets are reviewed for potential impairment on an annual basis, or more often if events or circumstances indicate that there may be impairment. Goodwill is tested for impairment at the reporting unit level and an impairment loss is recorded to the extent that the carrying amount of goodwill exceeds its implied fair value. Various market valuation methodologies are used to determine the fair value of the
- 29 -
Table of Contents
reporting unit. If the fair values of the reporting units exceed their book values, no write-downs of recorded goodwill are necessary. If the fair value of the reporting unit is less than its book value, an impairment expense may be required to be recorded to write down the related goodwill to the proper carrying value. To date, the Company has not had to take an impairment charge on its goodwill.
The Company recognizes deferred tax assets and liabilities for the future effects of temporary differences and tax credits. Enacted tax rates are applied to cumulative temporary differences based on expected taxable income in the periods in which the deferred tax asset or liability is anticipated to be realized. Future tax rate changes could occur that would require the recognition of income or expense in the statement of operations in the period in which they are enacted. Deferred tax assets must be reduced by a valuation allowance if in management’s judgment it is “more likely than not” that some portion of the asset will not be realized. Management may need to modify their judgments in this regard from one period to another should a material change occur in the business environment, tax legislation, or in any other business factor that could impair the Company’s ability to benefit from the asset in the future. As of December 31, 2010, Management has concluded that a valuation allowance is not needed on its net deferred tax asset.
Readers of the consolidated financial statements should be aware that the estimates and assumptions used in the Company’s current financial statements may need to be updated in future financial presentations for changes in circumstances, business or economic conditions in order to fairly represent the condition of the Company at that time.
Corporate Profile and Significant Developments
Orrstown Financial Services, Inc. is a financial holding company headquartered in Shippensburg, Pennsylvania with consolidated assets of $1.512 billion at December 31, 2010. The consolidated financial information presented herein reflects the Company and its wholly-owned commercial bank subsidiary, Orrstown Bank.
Orrstown Bank, with total assets of $1.491 billion at December 31, 2010, is a Pennsylvania chartered commercial bank with 20 offices. Nineteen of those offices are located in Pennsylvania and one in Maryland. On May 21, 2006, the Company acquired The First National Bank of Newport, located in Perry County, Pennsylvania. On June 15, 2007, The First National Bank of Newport was merged into Orrstown Bank. Orrstown Bank’s deposit services include a variety of checking, savings, time and money market deposits along with related debit card and merchant services. Lending services include commercial loans, residential loans, commercial mortgages and various forms of consumer lending. Orrstown Financial Advisors, a division of Orrstown Bank, offers a diverse line of financial services to our customers, including, but not limited to, brokerage, mutual funds, trusts, estate planning, investments and insurance products. At December 31, 2010, approximately $929 million of assets under management were serviced by Orrstown Financial Advisors.
At the May 2008, annual shareholders’ meeting President and Chief Executive Officer, Kenneth R. Shoemaker announced his retirement effective after the May 5, 2009 annual shareholder’s meeting. On February 13, 2009, it was announced that Thomas R. Quinn, Jr. had been selected to succeed Mr. Shoemaker effective May 5, 2009.
On October, 29, 2007, Orrstown Bank purchased a facility to utilize as its Operations Center located at 2605 – 2695 Philadelphia Avenue, Chambersburg, Pennsylvania, in the North Pointe Business Center. During May 2008, this facility was completed. The loan operations, EFT department, deposit operations, information technology, human resources and other support staff moved into the renovated building. The reclamation and refurbishment of the largely unoccupied former strip shopping center has been positively recognized in the Chambersburg area.
On September 2, 2008, Orrstown Bank opened its flagship office in Hagerstown, Maryland at 1020 Professional Court, off Eastern Boulevard. Growth in Hagerstown has been above expectations and justified a flagship office.
- 30 -
Table of Contents
The Company achieved a milestone during 2010’s fourth quarter by surpassing $1.5 billion in assets.
Orrstown Financial Services, Inc. moved from the OTC Bulletin Board to The NASDAQ Capital Market during 2009. Trading began on The NASDAQ Capital Market under the symbol “ORRF” on April 28, 2009.
The Company joined the broad market Russell 3000 ® Index on June 26, 2009 when Russell Investments reconstituted its U.S. and global indexes. The Company is also part of the Russell 2000 Index, a subset of the Russell 3000 that measures the performance of companies ranked 1,001 – 3,000 by market capitalization.
Economic Climate, Inflation and Interest Rates
During 2008, the U.S. economy faced significant challenges resulting in an overall economic downturn. Poor economic conditions, which were initially evident within the residential housing market beginning in 2007, spread throughout most sectors of the economy in 2008. The economic malaise has continued through the early stages of 2011.
The majority of the assets and liabilities of a financial institution are monetary in nature, and therefore, differ greatly from most commercial and industrial companies that have significant investments in fixed assets or inventories. However, inflation does have an impact on the growth of total assets and on noninterest expenses, which tend to rise during periods of general inflation. Inflationary pressures over the last five years have been modest, although the potential for future inflationary pressure is present given changing trends in the economy.
As the Company’s balance sheet consists primarily of financial instruments, interest income and interest expense is greatly influenced by the interest rates and the slope of the interest rate curve. During the five years presented in this financial statement review, interest rates were relatively high when the economy was perceived as strong; however, as the national and local economy began experiencing financial difficulties and higher levels of unemployment, rates decreased quickly. One example of this is the prime lending rate, which reached a high during the five-year period of 8.25% in September 2007. However, the prime lending rate was reduced 500 basis points over a 15 month period, coinciding with the country’s economic struggles, and ended 2008 with a published prime lending rate of 3.25%. The published prime lending rate remains at 3.25% at December 31, 2010. Management recognizes that asset/liability management, including the effect of rate changes on interest earning assets and interest bearing liabilities, is of critical importance.
Despite the challenging economic conditions during 2009 and into 2010, the Company believes it is positioned to withstand these conditions through its strong capital and liquidity positions, high quality loan and debt securities portfolios and prudent management of credit and interest rate risk.
Results of Operations
For the year ended December 31, 2010, the Company recorded net income of $16,581,000, an increase of 24.0% over 2009 earnings of $13,373,000, which was a 2.06% increase over net income of $13,103,000 realized in 2008. Basic earnings per share have increased over the last three years from $2.04 in 2008 to $2.09 in 2009 and $2.18 in 2010. Diluted earnings per share have increased as well, from $2.03 in 2008, to $2.07 in 2009 and to $2.17 in 2010.
The Company’s earnings performance continues to exceed peer group averages as measured by various ratio analyses. Two widely recognized performance indicators are the return on average assets (ROA) and the return on average equity (ROE). The average publicly traded banking company and the average $1 billion to $5 billion in assets banking company generated ROAs of approximately 0.50% and 0.55%, respectively, during 2010 per SNL Financial, a provider of financial information for the banking industry. The average return on equity for the average traded banking company and the average $1 billion to $5 billion in assets was 4.72% and 5.16%, respectively. The Company’s ROA and ROE compares favorably to this peer information. Return on average
- 31 -
Table of Contents
tangible assets (ROTA) and return on average tangible equity (ROTE) ratios exclude intangibles from the balance sheet and related amortization and tax expense from net income and is also presented. The Company has goodwill and intangibles from the acquisition of companies and purchased deposits. The following table compares the last three years’ performance ratios.
| Performance Statistics |
2010 | 2009 | 2008 | |||||||||
| Return on average assets |
1.21 | % | 1.19 | % | 1.38 | % | ||||||
| Return on average tangible assets |
1.23 | % | 1.23 | % | 1.43 | % | ||||||
| Return on average equity |
11.22 | % | 12.48 | % | 13.20 | % | ||||||
| Return on average tangible equity |
13.19 | % | 15.73 | % | 17.02 | % | ||||||
| Average equity / average assets |
10.76 | % | 9.55 | % | 10.45 | % | ||||||
Net Interest Income
The primary component of the Company’s revenue is net interest income, which is the difference between interest income and fees on interest-earning assets and interest expense on interest-bearing liabilities. Earning assets include loans, securities and federal funds sold. Interest bearing liabilities include deposits and borrowed funds. To compare the tax-exempt yields to taxable yields, amounts are adjusted to pretax equivalents based on a 35% federal corporate tax rate.
Net interest income is affected by changes in interest rates, volumes of interest-earning assets and interest-bearing liabilities and the composition of those assets and liabilities. The “net interest spread” and “net interest margin” (NIM) are two common statistics related to changes in net interest income. The net interest rate spread represents the difference between the yields earned on interest-earning assets and the rates paid for interest-bearing liabilities. The net interest margin is defined as the ratio of net interest income to average earning assets. Through the use of demand deposits and stockholders’ equity, the net interest margin exceeds the net interest rate spread, as these funding sources are non-interest bearing.
The “Analysis of Net Interest Income” table presents net interest income on a fully taxable equivalent basis, net interest rate spread and net interest margin for the years ending December 31, 2010, 2009 and 2008. The “Changes in Taxable Equivalent Net Interest Income” below analyzes the changes in net interest income for the same periods broken down by their rate and volume components.
2010 versus 2009
For the year ended December 31, 2010 net interest income, measured on a full tax equivalent basis, increased $9,828,000, or 26.0%, to $47,676,000 from $37,848,000 in 2009. The primary reason for the increase in net interest income was an increase in average earning assets from $1,033,105,000 in 2009 to $1,280,530,000 in 2010. Supplementing the growth in volume, was an increase in net interest margin of 7 basis points (b. p.), from 3.66% in 2009 to 3.73% for 2010. As summarized on the rate/volume table, $7,338,000 of the growth in net interest income was achieved from volume, and $2,490,000 was achieved through an increase in NIM.
The largest portion of the increase in interest income was the result of interested earned on the securities portfolio, which totaled $10,927,000 for the year ended December 31, 2010, an increase of $4,861,000, or 80%, over 2009. Year-over-year, average securities increased $181,344,000, or 111%. Partially offsetting the increase on securities earnings due to volume was a reduction in the interest rate earned of 3.72% in 2009 to 3.17% in 2010.
The growth in securities was funded principally through the growth in money market and time deposit accounts. Average interest bearing deposits increased $201,216,000, or 22.0%, resulting from the Company’s overall customer service model, its market position in several attractive markets, and due to the favorable rating
- 32 -
Table of Contents
the Bank has received from IDC Financial Publishing, Inc. (IDC), an independent bank safety rating agency which uses its unique rankings of financial ratios to determine the quality ratings of financial institutions. This strong rating facilitates the Company’s ability to attract time deposits and brokered deposits. Despite an increase in the average balance of time deposits of $145,349,000 for the year ended December 31, 2010 compared to 2009, the total interest expense was lowered by $1,108,000. The average volume resulted in an increase of interest expense of $3,635,000, which was more than offset by a decrease in interest expense that resulted from a decrease in the yield paid on time deposits, of 93 basis points from 2009 to 2010, of $4,743,000. The Company recognizes that brokered funds are more volatile funding source than core deposits. However, given the current interest rate environment and the steepness of the interest rate curve, the Company elected to collect these funds and earn a spread on them in order to enhance net interest income. Given the increased volatility in brokered deposits, the Company invested a large portion of these amounts in mortgage backed securities, which provide a regular stream of monthly cash flows, which can be used to meet the maturity needs of time and brokered deposits. We have matched cash flows from the debt securities portfolio with nontraditional cash flows to enable us to unwind the strategy if loan demand continues to increase or if the yield curve flattens.
The growth in the loan portfolio also contributed to the increase in net interest income. Year-over-year, average loans increased $61,676,000, or 7.3%, from the year ended December 31, 2009 to December 31, 2010. The increase in average loans is the result of the Company’s desire to continue to grow its loan portfolio and deploy its capital. This growth has come principally in some of the Company’s less mature markets, in which we have hired additional lending officers, which has increased opportunities in these markets served. The growth experienced in the loan portfolio was achieved primarily in the second half of the year, in which approximately two-thirds of the 2010 growth was achieved. The $61,676,000 growth in average balance in loans contributed $3,600,000 in additional interest income in 2010 compared to 2009. However, the rate earned on loans of 5.42% was 26 b.p. less than in 2009, and offset interest income by $2,492,000. The Company continues to have $30,000,000 in notional amount of interest rate swaps which serve as a hedge against variable rate commercial loans linked to prime and converts them to a fixed rate of interest. The interest rate swaps that the Company had outstanding during 2010 yielded $778,000, which was credited and included as commercial loan interest income.
As noted above, the Company has been able to increase its deposit base. As a result, less reliance has been placed on more costly long-term borrowings. Interest expense on long-term debt has decreased $2,065,000 from $3,584,000 for the year ended December 31, 2009 to $1,519,000 in 2010. Reduction in average daily balance of $48,458,000 for 2010 compared to 2009 reduced interest expense by $1,731,000, and the reduction in the rate paid on long-term borrowing of 64 b.p. reduced interest expense by $334,000.
The growth that the Company has experienced, and its ability to lower its cost of funding by an amount greater than its reduction in rates earned on interest-earning assets, has resulted in a slight improvement in both the interest rate spread and net interest margin. The average rates earned on assets were 4.71% for the year ended December 31, 2010 compared to 5.26% in 2009, whereas the rates paid on interest bearing liabilities declined from 1.60% in 2009 to 0.98% in 2010. This resulted in a net interest rate spread of 3.57% in 2010 compared to 3.46% in 2009.
2009 versus 2008
For the year ended December 31, 2009 net interest income, measured on a fully tax equivalent basis, increased $3,941,000, or 11.6%, to $37,848,000 from $33,907,000 in 2008. The primary reason for the increase in net interest income was an increase in average earning assets from $864,780,000 in 2008 to $1,033,105,000 in 2009. Offsetting the growth in volume was a decrease in net interest margin of 27 basis points from 3.93% to 3.66%. Net interest margin compacted appreciably beginning in the fourth quarter of 2008 given the Federal Reserve Bank’s significant cut to the federal funds rates. Those cuts served to lower the prime lending rate by similar amounts and the Company had approximately one-third of its assets tied to Wall Street Journal Prime. Actions taken by management at that time included the installation of interest rate floors on all new commercial loans, and the placement of $60,000,000 notional amount of prime for fixed interest rate swaps. The Company was able to stabilize its net interest margin during the latter half of 2009 as a result of the actions taken, which continued through 2010.
- 33 -
Table of Contents
Going forward, the Company’s ability to maintain its historically strong growth trend in net interest income will be challenged by expected pressure in net interest income. This pressure could be attributable to the following factors:
| • | The cash flows that result from deposit maturities will not experience the same magnitude of downward re-pricing experienced in 2008 and 2009, as many of these deposits have matured once already in the low rate environment. |
| • | Presently the interest rate yield curve is relatively steep, with the spread between the two and ten year treasuries being 2.69% at December 31, 2010. If the yield curve were to flatten some, net interest margin could be negatively impacted. |
The Company expects to mitigate these factors by continuing to improve the mix of earning assets through loan growth and a disciplined approach to the pricing of loans and deposits.
- 34 -
Table of Contents
ANALYSIS OF NET INTEREST INCOME
The following table presents interest income on a fully taxable equivalent basis, net-interest spread and net interest margin for the years ended December 31:
| 2010 | 2009 | 2008 | ||||||||||||||||||||||||||||||||||
| (Dollars in thousands) |
Average Balance |
Tax Equivalent Interest |
Tax Equivalent Rate |
Average Balance |
Tax Equivalent Interest |
Tax Equivalent Rate |
Average Balance |
Tax Equivalent Interest |
Tax Equivalent Rate |
|||||||||||||||||||||||||||
| Assets |
| |||||||||||||||||||||||||||||||||||
| Federal funds sold and interest bearing bank balances |
$ | 25,864 | $ | 116 | 0.45 | % | $ | 21,459 | $ | 69 | 0.32 | % | $ | 10,356 | $ | 227 | 2.19 | % | ||||||||||||||||||
| Taxable securities |
290,328 | 7,744 | 2.67 | 135,851 | 4,260 | 3.14 | 76,413 | 2,862 | 3.75 | |||||||||||||||||||||||||||
| Tax-exempt securities |
53,940 | 3,183 | 5.90 | 27,073 | 1,806 | 6.67 | 23,679 | 1,692 | 7.15 | |||||||||||||||||||||||||||
| Total securities |
344,268 | 10,927 | 3.17 | 162,924 | 6,066 | 3.72 | 100,092 | 4,554 | 4.55 | |||||||||||||||||||||||||||
| Taxable loans |
874,226 | 46,958 | 5.37 | 822,054 | 46,370 | 5.64 | 738,552 | 47,362 | 6.41 | |||||||||||||||||||||||||||
| Tax-exempt loans |
36,172 | 2,363 | 6.53 | 26,668 | 1,843 | 6.91 | 15,780 | 1,172 | 7.43 | |||||||||||||||||||||||||||
| Total Loans |
910,398 | 49,321 | 5.42 | 848,722 | 48,213 | 5.68 | 754,332 | 48,534 | 6.43 | |||||||||||||||||||||||||||
| Total interest-earning assets |
1,280,530 | 60,364 | 4.71 | 1,033,105 | 54,348 | 5.26 | 864,780 | 53,315 | 6.17 | |||||||||||||||||||||||||||
| Cash and due from banks |
13,230 | 13,950 | 13,857 | |||||||||||||||||||||||||||||||||
| Bank premises and equipment |
28,662 | 30,382 | 29,144 | |||||||||||||||||||||||||||||||||
| Other assets |
65,157 | 51,973 | 48,542 | |||||||||||||||||||||||||||||||||
| Allowance for loan losses |
(13,562 | ) | (7,618 | ) | (6,421 | ) | ||||||||||||||||||||||||||||||
| Total |
$ | 1,374,017 | $ | 1,121,792 | $ | 949,902 | ||||||||||||||||||||||||||||||
| Liabilities and Shareholders’ Equity |
| |||||||||||||||||||||||||||||||||||
| Interest bearing demand deposits |
$ | 400,474 | $ | 2,517 | 0.63 | $ | 307,968 | $ | 3,171 | 1.03 | $ | 251,547 | $ | 3,845 | 1.53 | |||||||||||||||||||||
| Savings deposits |
63,763 | 167 | 0.26 | 60,494 | 204 | 0.34 | 61,881 | 618 | 1.00 | |||||||||||||||||||||||||||
| Time deposits |
509,426 | 7,998 | 1.57 | 364,077 | 9,106 | 2.50 | 279,127 | 9,558 | 3.42 | |||||||||||||||||||||||||||
| Short term borrowings |
91,872 | 487 | 0.53 | 83,322 | 435 | 0.52 | 67,175 | 1,248 | 1.86 | |||||||||||||||||||||||||||
| Long term debt |
51,886 | 1,519 | 2.93 | 100,344 | 3,584 | 3.57 | 94,737 | 4,139 | 4.37 | |||||||||||||||||||||||||||
| Total interest bearing liabilities |
1,117,421 | 12,688 | 1.14 | 916,205 | 16,500 | 1.80 | 754,467 | 19,408 | 2.57 | |||||||||||||||||||||||||||
| Demand deposits |
99,636 | 89,797 | 87,537 | |||||||||||||||||||||||||||||||||
| Other |
9,229 | 8,652 | 8,657 | |||||||||||||||||||||||||||||||||
| Total Liabilities |
1,226,286 | 1,014,654 | 850,661 | |||||||||||||||||||||||||||||||||
| Shareholders’ Equity |
147,731 | 107,138 | 99,241 | |||||||||||||||||||||||||||||||||
| Total |
$ | 1,374,017 | 0.98 | % | $ | 1,121,792 | 1.60 | $ | 949,902 | 2.24 | % | |||||||||||||||||||||||||
| Net interest income (FTE)/ net interest spread |
47,676 | 3.57 | 37,848 | 3.46 | 33,907 | 3.60 | % | |||||||||||||||||||||||||||||
| Net interest margin |
3.73 | % | 3.66 | % | 3.93 | % | ||||||||||||||||||||||||||||||
| Tax-equivalent adjustment |
(1,941 | ) | (1,278 | ) | (1,002 | ) | ||||||||||||||||||||||||||||||
| Net interest income |
$ | 45,735 | $ | 36,570 | $ | 32,905 | ||||||||||||||||||||||||||||||
Note: Yields and interest income on tax-exempt assets have been computed on a fully taxable equivalent basis assuming a 35% tax rate. For yield calculation purposes, nonaccruing loans are included in the average loan balance.
- 35 -
Table of Contents
CHANGES IN TAXABLE EQUIVALENT NET INTEREST INCOME
The following table analyzes the changes in tax equivalent net interest income for the periods presented, broken down by their rate and volume components:
| 2010 Versus 2009 Increase (Decrease) Due to Change in |
2009 Versus 2008 Increase (Decrease) Due to Change in |
|||||||||||||||||||||||
| (Dollars in thousands) |
Average Volume |
Average Rate |
Total Increase (Decrease) |
Average Volume |
Average Rate |
Total Increase (Decrease) |
||||||||||||||||||
| Interest Income |
||||||||||||||||||||||||
| Federal funds sold & interest bearing deposits |
$ | 14 | $ | 33 | $ | 47 | $ | 243 | $ | (402 | ) | $ | (159 | ) | ||||||||||
| Loans |
3,600 | (2,492 | ) | 1,108 | 6,163 | (6,484 | ) | (321 | ) | |||||||||||||||
| Taxable securities |
4,844 | (1,360 | ) | 3,484 | 2,226 | (828 | ) | 1,398 | ||||||||||||||||
| Tax-exempt securities |
1,792 | (415 | ) | 1,377 | 243 | (130 | ) | 113 | ||||||||||||||||
| Total interest income |
10,250 | (4,234 | ) | 6,016 | 8,875 | (7,844 | ) | 1,031 | ||||||||||||||||
| Interest Expense |
||||||||||||||||||||||||
| Interest bearing demand deposits |
952 | (1,606 | ) | (654 | ) | 861 | (1,535 | ) | (674 | ) | ||||||||||||||
| Savings deposits |
11 | (48 | ) | (37 | ) | (14 | ) | (400 | ) | (414 | ) | |||||||||||||
| Time deposits |
3,635 | (4,743 | ) | (1,108 | ) | 2,909 | (3,361 | ) | (452 | ) | ||||||||||||||
| Short-term borrowings |
45 | 7 | 52 | 300 | (1,113 | ) | (813 | ) | ||||||||||||||||
| Long-term debt |
(1,731 | ) | (334 | ) | (2,065 | ) | 245 | (802 | ) | (557 | ) | |||||||||||||
| Total interest expense |
2,912 | (6,724 | ) | (3,812 | ) | 4,301 | (7,211 | ) | (2,910 | ) | ||||||||||||||
| Net Interest Income |
$ | 7,338 | $ | 2,490 | $ | 9,828 | $ | 4,574 | $ | (633 | ) | $ | 3,941 | |||||||||||
Note: The change attributed to volume is calculated by taking the average change in average balance times the prior year’s average rate and the remainder is attributable to rate.
Provision for Loan Losses
The provision for loan losses has increased from $4,865,000 for the year ended December 31, 2009 to $8,925,000 for the same period in 2010, an increase of 83.5%, or $4,060,000. In 2009, the provision for loan losses increased $3,415,000 from that expensed in 2008, which totaled $1,450,000.
The increases that the Company has experienced in its provision for loan losses have partially resulted from the growth it has experienced in its loan portfolio. In addition, the increase in the provision for loan losses for the periods presented can be attributed to declining asset quality and higher charge-offs during his time period. Increases in non-performing assets and charge-offs has been an industry wide trend both at the national and local levels.
See further discussion in the Asset Quality and Credit Risk Management section of this Management’s Discussion and Analysis.
- 36 -
Table of Contents
Other Income
The following provides information regarding noninterest income changes over the past three years.
| % Change | ||||||||||||||||||||
| (Dollars in thousands) |
2010 | 2009 | 2008 | 2010-2009 | 2009-2008 | |||||||||||||||
| Service charges on deposit accounts |
$ | 7,506 | $ | 6,905 | $ | 6,758 | 8.7 | % | 2.2 | % | ||||||||||
| Other service charges, commissions and fees |
3,878 | 3,186 | 2,473 | 21.7 | % | 28.8 | % | |||||||||||||
| Trust department income |
3,606 | 2,645 | 2,840 | 36.3 | % | -6.9 | % | |||||||||||||
| Brokerage income |
1,450 | 1,327 | 1,413 | 9.3 | % | -6.1 | % | |||||||||||||
| Gains on sale of loans |
1,304 | 832 | 461 | 56.7 | % | 80.5 | % | |||||||||||||
| Earnings on life insurance |
1,192 | 745 | 683 | 60.0 | % | 9.1 | % | |||||||||||||
| Other income |
1,221 | 384 | 694 | 218.0 | % | -44.7 | % | |||||||||||||
| Subtotal before securities gains |
20,157 | 16,024 | 15,322 | 25.8 | % | 4.6 | % | |||||||||||||
| Securities gains (losses) |
3,636 | 1,661 | (27 | ) | 118.9 | % | Not meaningful | |||||||||||||
| Total other income |
$ | 23,793 | $ | 17,685 | $ | 15,295 | 34.5 | % | 15.6 | % | ||||||||||
2010 v. 2009’s Results
Noninterest income increased to $23,793,000 for the twelve months ended December 31, 2010, as compared to $17,685,000 in the same prior year period. Excluding the increase in securities gains of $1,975,000 in 2010 compared to 2009, noninterest income increased $4,133,000, or 25.8%. Noninterest income generation increased across all business lines including Orrstown Financial Advisors, mortgage originations and retail fees generated from deposit accounts. These business lines have been able to capitalize on favorable market conditions, which include:
| • | The Company continues to see an increase in its deposit accounts and other customer related services, which has resulted in an increase in service charges. Total service charges totaled $11,384,000 for the twelve months ended December 31, 2010, an increase of $1,293,000, or 12.8% over 2009. An increase in customer use of the Mastermoney debit card program contributed $383,000 of the favorable increase. Consumer habits continued to change and the popularity of the reward checking product increased. This product requires a minimum number of debit card transactions to qualify for the highest interest rate and the accordance of certain account and transaction related fees, resulting in an increase in non-interest income when minimums are not met. |
| • | An increase in trust department and brokerage income of $1,084,000, or 27.3% for the twelve months ended December 31, 2010 compared to 2009 were the result of increases in trust and brokerage activity as the stock market has started to show signs of recovery, and additional trust and brokerage assets under management, which increased from $740,028,000 at December 31, 2009 to $929,327,000 at December 31, 2010. |
| • | The continued decline in mortgage interest rates has led to an increase in new mortgage loan applications as well as refinancing activities. Given these low interest rates, the Company generally sells its 30-year conforming loans to investors. The increase in activity has resulted in gains on sales of loans increasing to $1,304,000 for the twelve months ended December 31, 2010 compared to $832,000 in 2009. |
| • | Earnings on life insurance increased 60%, from $745,000 for the year ended December 31, 2009 to $1,192,000 in 2010. The increase was principally the result of $296,000 in life insurance death benefits that was realized upon the deaths of former directors in 2010, with no similar gains noted in 2009. |
| • | Included in other income for the twelve months ended December 31, 2010 was the gain on the sale of a fixed for prime floating rate swap, with a notional value of $30,000,000, that was recorded in the second quarter totaling $778,000. In connection with the Company’s asset liability management, it was |
- 37 -
Table of Contents
| determined this swap would be settled in order to protect earnings in the event interest rates would rise. No similar gain on the settlement of swaps occurred in 2009. |
| • | The Company continued to harvest gains on securities available for sale when it was strategically determined that the gains afforded on certain securities was more beneficial than the interest rate earned. Accordingly, gains on securities were $3,636,000 for the year ended December 31, 2010 compared to $1,661,000 in 2009. |
The Company continues to advertise and market itself in order for consumers to recognize the broad range of financial services and products the Company has to offer, and to increase its brand recognition. Through the use of enhanced technology, the Company expects it will be able to reach a broader market which will allow it to continue to grow its customer base. In the fourth quarter of 2010, the Company began offering its mortgage product through on-line applications.
The Dodd-Frank bill currently contains provisions that may limit the Company’s ability to earn debit card interchange fees in the second half of 2010. Despite the fact the Bank is below $10 billion in assets and would not be subject to limitations on fees charged to customers, its service provider exceeds the $10 billion threshold. In the event the service provider is not able to differentiate between banks above and below the threshold, interchange fee income would be negatively impacted. The Company continues to discuss this matter with the service provider, and is exploring other alternatives in the event a satisfactory resolution to the matter is not achieved. In addition, because the Company’s competitors having assets in excess of $10 billion will not be able to charge debit card interchange fees, competitive pressures may cause the Company to reduce or eliminate its interchange fee charges.
2009 v. 2008’s Results
Total other income increased by $2,390,000, or 15.6% in 2009 compared to 2008’s results. Securities gains were a large reason for the increase, which increased from a loss of $27,000 in 2008 to gains of $1,661,000. Gains from the available for sale securities portfolio were strategically exercised at times to support other corporate initiatives. The Company increased its deposit accounts and other customer related services, which has resulted in an increase in service charges. Total service charges totaled $10,091,000 for the year ended December 31, 2009, an increase of $860,000, or 9.3% over 2009. The Company began seeing an increase in customer’s use of the Mastermoney debit card program in order to allow customers to earn a higher interest rate on their deposits. This change in consumer habits contributed $277,000 to the increase in customer service charges. Gains on sales of loans increased $371,000, or 80.5% for the year ended December 31, 2009 compared to 2008. Mortgage originators were added during 2009 to take advantage of the refinancing boom that resulted from lower interest rates.
- 38 -
Table of Contents
Other Expenses
The following provides information regarding noninterest expense over the past three years.
| % Change | ||||||||||||||||||||
| (Dollars in thousands) |
2010 | 2009 | 2008 | 2010-2009 | 2009-2008 | |||||||||||||||
| Salaries and employee benefits |
$ | 19,120 | $ | 16,040 | $ | 14,315 | 19.2 | % | 12.1 | % | ||||||||||
| Occupancy expense |
2,200 | 2,169 | 1,964 | 1.4 | % | 10.4 | % | |||||||||||||
| Furniture and equipment |
2,742 | 2,637 | 2,287 | 4.0 | % | 15.3 | % | |||||||||||||
| Data processing |
1,278 | 1,077 | 999 | 18.7 | % | 7.8 | % | |||||||||||||
| Telephone |
730 | 731 | 679 | -0.1 | % | 7.7 | % | |||||||||||||
| Advertising and bank promotions |
1,208 | 1,111 | 1,238 | 8.7 | % | -10.3 | % | |||||||||||||
| FDIC insurance |
1,798 | 1,278 | 296 | 40.7 | % | 331.8 | % | |||||||||||||
| Professional services |
856 | 667 | 560 | 28.3 | % | 19.1 | % | |||||||||||||
| Taxes other than income |
764 | 554 | 577 | 37.9 | % | -4.0 | % | |||||||||||||
| Intangible asset amortization |
240 | 252 | 251 | -4.8 | % | 0.4 | % | |||||||||||||
| Other operating expenses |
6,616 | 5,451 | 4,999 | 21.4 | % | 9.0 | % | |||||||||||||
| Total operating expenses |
$ | 37,552 | $ | 31,967 | $ | 28,165 | 17.5 | % | 13.5 | % | ||||||||||
2010 v. 2009’s Results
As a result of the growth the Company has experienced, other expenses rose from $31,967,000 during the first twelve months of 2009 to $37,552,000 for the same period in 2010, an increase of $5,585,000, or 17.5%. The following contributed to the increase in other expenses.
| • | The largest increase was in salaries and employee benefits, which was $19,120,000 for the twelve months ended December 31, 2010, an increase of $3,080,000 over 2009’s results. The increase was attributable to the growth in the number of staff, which grew from 262 full-time equivalents at December 31, 2009 to 275 at December 31, 2010. The addition of these employees directly contributed to the revenue growth the Company experienced, as many were revenue producers. Additional support staff was also required to handle the additional business volume. Additional increases in employee benefits were noted, particularly health and welfare costs, which increased consistent with national trends. Further, the Company recorded expense related to its share-based compensation for employees of $360,000 for the twelve months ended December 31, 2010, compared to $113,000 in 2009. |
| • | Advertising and bank promotions increased $97,000 in 2010 compared to 2009. The increase was the result of the Company continuing to enhance its brand in the markets it serves. Contributions, included in advertising and bank promotions expense, for the year ended December 31, 2010 totaled $332,000, or $37,000 higher than in 2009. The increase in expense is a result of commitments to the communities that the Bank serves as we continue to build relationships and expand our presence in these market areas. |
| • | FDIC insurance totaled $1,798,000 for the twelve months ended December 31, 2010, an increase of 40.7%, or $520,000 over 2009. The increase is the result of additional deposits that the Bank has been able to generate in 2010, combined with higher assessments in 2010 than in 2009. The Company expects that FDIC insurance will continue to increase in 2011. |
| • | Collection and real estate owned expenses, included in other operating expenses, increased approximately $424,000 from $258,000 for the twelve months ended December 31, 2009 to $682,000 for the same period in 2010. The increase is commensurate with the increase in risk assets discussed in the provision and allowance for loan losses section. |
| • | In the third quarter of 2010, the Bank incurred additional expenses associated with its investments in low-income housing projects. This resulted in incremental expense of $166,000 recorded in the year ended December 31, 2010 over the same period in 2009. These charges are included in other operating expenses. |
- 39 -
Table of Contents
| • | Fees associated with the Bank’s Mastermoney Card totaled $605,000 for the year ended December 31, 2010, an increase of $124,000 over 2009’s expense. The increase in expense is consistent with an increase in Mastermoney fee income of $383,000. These expenses are included in other operating expenses. |
| • | The remainder of the increase in other expenses is primarily the result of the growth experienced by the Company. |
Despite an increase in the other expenses, the Company was able to improve on its efficiency ratio, which was 54.9% for the twelve months ended December 31, 2010, compared to 58.9% in 2009.
2009 v. 2008’s Results
Other expenses rose $3,802,000, or 13.5%, for year ended December 31, 2009 over 2008’s results. A new operations center in Chambersburg, PA and a new flagship branch in Hagerstown, MD were brought online during 2008, resulting in a full twelve months of occupancy expense in these facilities in 2009. Systems were upgraded in connection with these new facilities, which led to a 15.3% increase in furniture and equipment expense for the year ended 2009 compared to the same period in 2008. Employees were added to handle the growth, leading to an increase in salaries and employee benefits expense from $14,315,000 in 2008 to $16,040,000 in 2009.
The largest increase in noninterest expense in percentage terms was the 331.8% increase in FDIC insurance premiums, which increased from $296,000 for the year ended December 31, 2008 to $1,278,000 in 2009. The insurance assessment included a special assessment of $515,000 that the Company expensed in 2009, which was on top of the increase in quarterly assessments to the Company. The increased FDIC insurance expense burdened the entire banking industry during 2009.
Federal Income Taxes
The Company recognized income taxes of $6,470,000, $4,050,000 and $5,482,000 for the years ended December 31, 2010, 2009 and 2008. The fluctuation in income tax expense is consistent with the increase in pretax income in 2010 over 2009’s results, and a decrease in pretax income from 2008 to 2009.
A more meaningful comparison is the effective tax rate, a measurement of income tax expense as a percent of pretax income, which was 28.1%, 23.2%, and 29.5% for the years ended December 31, 2010, 2009 and 2008. The Company’s effective tax rate is less than the 35% federal statutory rate, primarily due to tax-exempt loan and security income, life insurance earnings and tax credits associated with low-income housing and historic projects, offset by certain non-deductible expenses and state income taxes.
The 23.2% effective tax rate in 2009 was pushed down due to $620,000 of historic credits that resulted from a senior housing project in our market area. The Company has made contributions and additional commitments to 2 additional low income housing projects during 2009/2010. However, the tax credits on these two projects will not be realized until 2011, when the properties are placed in service and available for lease. The Company actively seeks tax free investment opportunities, when the yield, on a tax equivalent basis, is favorable compared to taxable investments.
Financial Condition
The quality of the Company’s asset structure continues to be strong. A substantial amount of time is devoted by management to overseeing the investment of funds in loans and securities and the formulation of policies directed toward the profitability and minimization of risk associated with such investments.
- 40 -
Table of Contents
Securities Available for Sale
The Company utilizes securities available for sale as a tool for managing interest rate risk, enhancing income through interest and dividend income, to provide liquidity and to provide collateral for certain deposits and borrowings. As of December 31, 2010, securities available for sale were $431,772,000, a $235,519,000 increase from the December 31, 2009 balance of $196,253,000.
The Company has established investment policies and an asset management policy to assist in administering its investment portfolio. Decisions to purchase or sell these securities are based on economic conditions and management’s strategy to respond to changes in interest rates, liquidity, securitization of deposits and repurchase agreements and other factors while obtaining the maximum return on the investments. Under generally accepting accounting principles, the Company may segregate its investment portfolio into three categories: “securities held to maturity”, “trading securities” and “securities available for sale”. Management has classified the full securities portfolio as available for sale. Securities available for sale are to be accounted for at their current market value with unrealized gains and losses on such securities to be excluded from earnings and reported as a net amount in other comprehensive income.
The Company’s securities available for sale include debt and equity instruments that are subject to varying degrees of credit and market risk. This risk arises from general market conditions, factors impacting specific industries, as well as corporate news that may impact specific issues. Management continuously monitors its debt securities, including updates of credit ratings, monitoring market, industry and segment news, as well as volatility in market prices. The Company uses various indicators in determining whether a debt security is other-than- temporarily-impaired, including the extent of time the security has been in an unrealized loss position, and the extent of the unrealized loss. In addition, management assesses whether it is likely the Company will have to sell the security prior to recovery, or if it is able to hold the security until the price recovers. For those debt securities in which management concludes the security is other than temporarily impaired, it will recognize the credit component of an other-than-temporary impairment in earnings and the remaining portion in other comprehensive income. Given the strong asset quality of the debt security portfolio, management has not had to take an other than temporary impairment charge in 2010.
For equity securities, when the Company has decided to sell an impaired available-for-sale security and does not expect the fair value of the security to fully recover before the expected time of sale, the security is deemed other-than-temporarily impaired in the period in which the decision to sell is made. The Company recognizes an impairment loss when the impairment is deemed other than temporary even if a decision to sell has not been made. The Company recorded $0, $36,000 and $84,000 of other than temporary impairment expense on equity securities for the years ended December 31, 2010, 2009 and 2008.
The following table shows the fair value of securities available for sale at December 31:
| (Dollars in thousands) |
2010 | 2009 | 2008 | |||||||||
| U.S. Government Sponsored Enterprises (GSE) |
$ | 120,286 | $ | 119,416 | $ | 59,399 | ||||||
| States and political subdivisions |
97,148 | 37,384 | 23,426 | |||||||||
| GSE residential mortgage-backed securities |
212,176 | 37,873 | 36,482 | |||||||||
| Total debt securities |
429,610 | 194,673 | 119,307 | |||||||||
| Equity securities |
2,162 | 1,580 | 1,333 | |||||||||
| Totals |
$ | 431,772 | $ | 196,253 | $ | 120,640 | ||||||
As noted in the net interest income discussion above, the Company has significantly increased its securities available for sale portfolio in order to enhance net interest income given the current interest rate environment and slope to the interest rate yield curve. The growth in the securities portfolio was the result of $515,381,000 of securities purchased, offset by maturities repayments and calls of $68,412,000 and the sales of securities totaling
- 41 -
Table of Contents
$210,687,000 during the year ended December 31, 2010. Sales of securities were taken in anticipation of rising interest rates, in order to protect earnings. In addition, given the growth in the portfolio, management had to reposition a portion of its portfolio for interest rate risk management purposes.
The majority of the growth in the securities available for sale portfolio was in the U.S. Government sponsored enterprises residential mortgage-backed securities, which grew from $37,873,000 at December 31, 2009 to $212,176,000, an increase of $174,303,000. Given the increased volatility in brokered deposits that were used to fund the growth in securities, the Company invested a large portion of these amounts in residential mortgage backed securities, which provide a regular stream of cash flows, which can be used to meet the maturity needs of the time and brokered deposits.
The following table shows the maturities of investment securities at book value as of December 31, 2010, and weighted average yields of such securities. Yields are shown on a tax equivalent basis, assuming a 35% federal income tax rate.
| (Dollars in thousands) |
Within 1 year |
After 1 year but within 5 years |
After 5 years but within 10 years |
After 10 years |
Total | Average Maturity (in years) |
Weighted Average Yield |
|||||||||||||||||||||
| U.S. Government Sponsored Enterprises (GSE) |
$ | 6,015 | $ | 12,344 | $ | 88,553 | $ | 13,406 | $ | 120,318 | 7.0 | 2.87 | % | |||||||||||||||
| States and political subdivisions |
5,241 | 9,451 | 16,305 | 67,136 | 98,133 | 11.3 | 5.02 | % | ||||||||||||||||||||
| GSE Residential Mortgage-backed securities |
1 | 299 | 20,884 | 191,076 | 212,260 | 18.6 | 2.15 | % | ||||||||||||||||||||
| Total amortized cost |
$ | 11,257 | $ | 22,094 | $ | 125,742 | $ | 271,618 | $ | 430,711 | 13.7 | 3.00 | % | |||||||||||||||
| Percentage of total portfolio |
2.61 | % | 5.13 | % | 29.19 | % | 63.07 | % | 100.00 | % | ||||||||||||||||||
| Weighted average yield |
1.79 | % | 2.28 | % | 3.15 | % | 3.08 | % | 3.00 | % | ||||||||||||||||||
The above maturity is based on contractual terms of the debt or mortgage backed securities, and does not factor in required repayments or anticipated prepayments that may exist. As of December 31, 2010, the weighted average estimated life of the residential mortgage-backed securities portfolio is less than 4 years based on current interest rates and anticipated prepayment speeds.
Loan Portfolio
The Company offers various products to meet the credit needs of our borrowers, and principally consists of commercial real estate loans, commercial and industrial loans, and retail loans consisting of loans securitized by residential properties, and to a lesser extent, installment loans. Generally speaking, the Company follows conservative lending practices and continues to carry a high quality loan portfolio with no unusual or undue concentrations of credit. No loans are extended to non domestic borrowers or governments.
With certain exceptions, we are permitted under applicable law to make loans to single borrowers (including certain related persons and entities) in aggregate amounts of up to 15% of the sum of total capital and the allowance for loan losses. The Company’s legal lending limit to one borrower was approximately $19,000,000 at December 31, 2010; however, our largest exposure to any one borrower as of that date was approximately $16,000,000.
The Company’s loan portfolio is broken down into segments to an appropriate level of disaggregation to allow management to monitor the performance by the borrower and to monitor the yield on the portfolio. In 2010, management incorporated the provisions of ASU 2010-20, Disclosures about the Credit Quality of Financing Receivables and the Allowance for Loan Losses, resulting in the refinement in its portfolio segregation. Consistent with this standard, the segments were further broken down into classes, to allow for differing risk characteristics within a segment.
- 42 -
Table of Contents
Management feels that non-owner occupied commercial real estate, consisting of nonresidential properties, pose a greater risk than owner-occupied and multi-family residential properties. Likewise, a 1-4 family residential construction class is broken out of the acquisition and development loan segment, leaving a commercial and land development class that presents a higher risk profile. In commercial and land development projects, many times the ultimate buyer of the property is not known at the time the project is started, and the real estate collateral cannot generally be subdivided into smaller parcels to diversify the developer’s risk. First lien residential mortgage loans generally are less susceptible to loss than home equity loans, which generally have higher loan-to-values associated with them.
Balances as of December 31, 2009 have been reclassified to be consistent with 2010’s presentation. However, 2006 – 2008 have not been reclassified, and are presented separately.
The loan portfolio, excluding residential loans held for sale, broken out by classes as of December 31 is as follows:
| (Dollars in thousands) |
2010 | 2009 | ||||||
| Commercial real estate: |
||||||||
| Owner-occupied |
$ | 172,000 | $ | 149,149 | ||||
| Non-owner occupied |
143,372 | 122,287 | ||||||
| Multi-family |
24,649 | 24,898 | ||||||
| Acquisition and development: |
||||||||
| 1-4 family residential construction |
29,297 | 21,977 | ||||||
| Commercial and land development |
88,105 | 88,902 | ||||||
| Commercial and industrial |
263,943 | 246,335 | ||||||
| Residential mortgage: |
||||||||
| First lien |
119,450 | 100,413 | ||||||
| Home equity—term |
40,818 | 55,993 | ||||||
| Home equity—Lines of credit |
71,547 | 58,146 | ||||||
| Installment and other loans |
11,112 | 12,380 | ||||||
| $ | 964,293 | $ | 880,480 | |||||
In addition to the Company monitoring its loan portfolio by type, it also monitors concentrations to one industry. The Bank’s Lending Policy defines an industry concentration as one that exceeds 25% of the Bank’s shareholders’ equity. The following industries meet the concentration criteria defined by the Bank’s Lending Policy at December 31, 2010:
| (Dollars in thousands) |
Balance | % of Total Loans |
% of Bank’s Equity |
|||||||||
| Land subdivision |
$ | 72,380 | 8 | % | 53 | % | ||||||
| Lessors of residential buildings and dwellings |
138,680 | 14 | % | 101 | % | |||||||
| Lessors of nonresidential buildings |
117,707 | 12 | % | 86 | % | |||||||
| Hotels (except casinos and motels) |
55,528 | 6 | % | 40 | % | |||||||
- 43 -
Table of Contents
The loan portfolio as of December 31, 2008, 2007 and 2006, generally broken down by the underlying security of the loans, is as follows:
| (Dollars in thousands) |
2008 | 2007 | 2006 | |||||||||
| Commercial, financial and agricultural |
$ | 78,880 | $ | 55,698 | $ | 59,593 | ||||||
| Real estate—Commercial |
250,485 | 243,210 | 221,460 | |||||||||
| Real estate—Construction |
131,509 | 92,050 | 46,947 | |||||||||
| Real estate—Mortgage |
351,426 | 302,419 | 281,902 | |||||||||
| Consumer |
8,168 | 8,587 | 8,925 | |||||||||
| Total loans |
$ | 820,468 | $ | 701,964 | $ | 618,827 | ||||||
The loan portfolio at December 31, 2010 has grown 9.5% from December 31, 2009, from $880.5 million to $964.3 million. The Company continued to experience growth in its commercial real estate and commercial portfolios, which grew 14.7% and 7.1% in 2010. Several experienced lenders have joined the Company in the past two years, which has led to additional opportunities in some of the Company’s emerging markets. First-lien residential mortgage loans have grown $19.0 million from $100.4 million at December 31, 2009 to $119.5 million at December 31, 2010. This growth is principally the result of management’s intention to retain some of the shorter lived mortgages, generally with maturities of 10-20 years, in its portfolio. This strategy is to help diversify the loan portfolio, and as these mortgages earn more attractive rates than alternative investments, including federal funds sold and securities available for sale. Longer termed residential mortgage loans continue to be sold on the secondary market, as they present greater interest rate risk. Installment loans and combined home equity loans have decreased since 2009, as consumer spending and related borrowing has declined in this uncertain economy.
Presented below are the approximate maturities of the loans types specified, and whether they are fixed-rate-adjustable floating rates as of December 31, 2010.
| Due In | Total | |||||||||||||||
| (Dollars in Thousands) |
One Year or Less |
Year Through Five Years |
After Five Year |
|||||||||||||
| Acquisition and development: |
||||||||||||||||
| 1-4 family residential construction |
||||||||||||||||
| Fixed rate |
$ | — | $ | — | $ | — | $ | — | ||||||||
| Adjustable and floating rate |
16,105 | 3,683 | 9,509 | 29,297 | ||||||||||||
| Total |
16,105 | 3,683 | 9,509 | 29,297 | ||||||||||||
| Commercial and land development |
||||||||||||||||
| Fixed rate |
3,061 | 220 | 5,872 | 9,153 | ||||||||||||
| Adjustable and floating rate |
26,979 | 26,441 | 25,532 | 78,952 | ||||||||||||
| Total |
30,040 | 26,661 | 31,404 | 88,105 | ||||||||||||
| Commercial and industrial |
||||||||||||||||
| Fixed rate |
1,317 | 17,230 | 30,465 | 49,012 | ||||||||||||
| Adjustable and floating rate |
48,444 | 9,126 | 157,361 | 214,931 | ||||||||||||
| Total |
49,761 | 26,356 | 187,826 | 263,943 | ||||||||||||
| $ | 95,906 | $ | 56,700 | $ | 228,739 | $ | 381,345 | |||||||||
The variable rate loans shown above include semi-fixed loans that contractually will adjust with prime after the interest lock period which may be up to seven years. At December 31, 2010 there were approximately $114,274,000 of such loans.
- 44 -
Table of Contents
Asset Quality
Risk Elements
The Company’s loan portfolios are subject to varying degrees of credit risk. Credit risk is mitigated through conservative underwriting standards, on-going credit review, and monitoring asset quality measures. Additionally, loan portfolio diversification, limiting exposure to a single industry or borrower, and requiring collateral also mitigate the Company’s risk of credit loss.
The Company’s loan portfolio is principally to borrowers in south central Pennsylvania and Washington County, Maryland. As the majority of loans are concentrated in this geographic region, a substantial portion of the debtor’s ability to honor their obligations may be affected by the level of economic activity in the market area.
Nonperforming assets include nonaccrual and restructured loans and foreclosed real estate. In addition, loans past due 90 days or more and still accruing are also deemed to be a risk asset. The accrual of interest income on loans ceases when principal or interest is past due 90 days or more and collateral is inadequate to cover principal and interest or immediately if, in the opinion of management, full collection is unlikely. Interest accrued, but not collected, as of the date of placement on nonaccrual status, is generally reversed and charged against interest income, unless fully collateralized. Subsequent payments received are either applied to the outstanding principal balance or recorded as interest income, depending on management’s assessment of the ultimate collectability of principal. Past due status is based on contract terms of the loan. A loan is considered restructured if the terms of a loan, such as the interest rate or repayment schedule, or both, are modified to terms that the Company would not have granted originally due to the financial difficulties of the borrower.
The following table presents the Company’s risk elements, including information concerning the aggregate balances of nonaccrual, restructured, loans past due 90 days or more, and foreclosed real estate as of December 31. Additionally, relevant asset quality ratios are also presented.
| (Dollars in thousands) |
2010 | 2009 | 2008 | 2007 | 2006 | |||||||||||||||
| Nonaccrual loans (cash basis) |
$ | 13,896 | $ | 4,267 | $ | 341 | $ | 118 | $ | 120 | ||||||||||
| Restructured loans |
1,180 | 0 | 0 | 0 | 0 | |||||||||||||||
| Total nonperforming loans |
15,076 | 4,267 | 341 | 118 | 120 | |||||||||||||||
| Foreclosed real estate |
1,112 | 1,065 | 608 | 199 | 318 | |||||||||||||||
| Total nonperforming assets |
16,188 | 5,332 | 949 | 317 | 438 | |||||||||||||||
| Loans past due 90 days or more and still accruing |
2,248 | 6,155 | 6,176 | 3,586 | 1,084 | |||||||||||||||
| Total risk assets |
$ | 18,436 | $ | 11,487 | $ | 7,125 | $ | 3,903 | $ | 1,522 | ||||||||||
| Asset quality ratios: |
||||||||||||||||||||
| Nonperforming loans to loans |
1.56 | % | 0.48 | % | 0.04 | % | 0.02 | % | 0.02 | % | ||||||||||
| Nonperforming assets to assets |
1.07 | % | 0.45 | % | 0.09 | % | 0.04 | % | 0.05 | % | ||||||||||
| Total risk assets to total loans and foreclosed real estate |
1.90 | % | 1.30 | % | 0.87 | % | 0.56 | % | 0.25 | % | ||||||||||
| Total risk assets to total assets |
1.22 | % | 0.96 | % | 0.68 | % | 0.44 | % | 0.19 | % | ||||||||||
| Allowance for loan losses to nonperforming loans |
106.26 | % | 259.36 | % | 2093.84 | % | 5204.24 | % | 4600.00 | % | ||||||||||
- 45 -
Table of Contents
A further breakdown of nonaccrual loans and loans past due 90 days or more still accruing as of December 31, 2010 and 2009 is as follows:
| Nonaccrual Loans | Past Due 90 Days or More Still Accruing |
|||||||||||||||
| 2010 | 2009 | 2010 | 2009 | |||||||||||||
| Commercial real estate: |
||||||||||||||||
| Owner-occupied |
$ | 686 | $ | 403 | $ | 466 | $ | 2,884 | ||||||||
| Non-owner occupied |
2,064 | 1,115 | 0 | 237 | ||||||||||||
| Multi-family |
90 | — | 0 | — | ||||||||||||
| Acquisition and development: |
||||||||||||||||
| Commercial and land development |
93 | — | 0 | 245 | ||||||||||||
| Commercial and industrial |
10,625 | 2,644 | 420 | 1,713 | ||||||||||||
| Residential mortgage: |
||||||||||||||||
| First lien |
279 | 43 | 1,095 | 620 | ||||||||||||
| Home equity |
58 | 58 | 217 | 447 | ||||||||||||
| Installment and other loans |
1 | 4 | 50 | 9 | ||||||||||||
| $ | 13,896 | $ | 4,267 | $ | 2,248 | $ | 6,155 | |||||||||
As noted in the above tables, the Company has experienced an increase in risk assets from 2006 – 2010, which coincides with the downturn in the state and local economy, and softness that has been experienced in the real estate market. Improvement was made since March 2010 principally through the reduction in the level of non-accrual loans, loans past due 90 or more days and still accruing, and total delinquency. The Company continues to be diligent in its handling of nonperforming and other risk assets and has been able to reduce the level of risk assets from a high of $32,822,000 at March 31, 2010 to $18,436,000 at December 31, 2010. Total risk assets have increased $6,949,000 from December 31, 2009. Two large credits, totaling $7,600,000 million, have been worked off the books since March 2010, which resulted in a $2.0 million charge-off in the second quarter of 2010.
As a result of the increase in risk assets, the Company has experienced an increase in its ratio of total risk assets to total assets from 0.96% at December 31, 2009 to 1.22% at December 31, 2010. Increases in risk assets have been experienced by financial institutions both at a national and local level and the Company has seen increases as well. It should be noted that the ratio of total risk assets to total assets reached its high of 2.49% at March 31, 2010, and the Company has been able to continue to work through its problem assets.
As of December 31, 2010, the Company has 11 commercial relationships that are included in the nonaccrual loan balance of $13,896,000. The largest of these relationships has total outstanding loan balances of $8,598,000, consisting of advances under a line of credit to a company that finances interim construction financing for mortgages, residential manufactured, modular and site-built homes. As a result of the downturn in the housing market, the company experienced financial difficulties and declared bankruptcy in the first quarter of 2010. The Bank is in the process of pursuing a recovery of the amounts owed to it in the Bankruptcy Court proceedings as well as through other avenues of recovery that may be available to it including, without limitation, the guarantees provided by the principals and other potential claims against third parties.
A second relationship in nonaccrual status at December 31, 2010, with an outstanding loan balance of $1,258,000, is to a professional service firm that provides services in the construction industry. Again, as result of the downturn in the economy, this firm has experienced financial difficulties and has not been able to meet their debt service requirements, resulting in the loan being placed in nonaccrual status. The Bank is in process of working out this relationship with the borrower, and will pursue recovery methods. The loan is secured by the commercial real estate, personal residences of the guarantors and UCC filings on the Company’s assets.
- 46 -
Table of Contents
A third relationship at December 31, 2010 included in the nonaccrual balance consists of a mixed use building, consisting of residential apartments and commercial retail space that has had difficulties in securing leases from tenants that will enable it to meet its debt service requirements. The Bank is working with the borrower through the lease up period, in order to allow sufficient time to increase the building’s occupancy. This loan is secured by the commercial real estate property and has a loan balance at December 31, 2010 of $1,100,000.
A fourth relationship consists of a motel which is presently closed, but has a pending contract on the sale of the property. The Company continues to work through this loan, with a balance of $964,000 at December 31, 2010.
The Company believes through the combination of the collateral securing the loans and the reserves allocated for these nonaccrual loans totaling $4,343,000, it has provided for the potential losses that it may incur on these relationships as of December 31, 2010. However, as additional time passes on these relationships, additional information may become known that could result in additional reserve allocations, or, alternatively, it may be deemed that the reserve allocations exceed that which is needed.
In 2010, the Company restructured two residential mortgages in order to assist the borrowers who were experiencing financial difficulties. The restructured loans resulted in concessions that the Bank made in interest rates for a short (less than twelve months) period of the remaining amortization schedule, and resulted in a reduction of the discounted cash flows of the loans, based on the original loans’ interest rate, of approximately $20,000.
The Company experienced a slight increase in foreclosed real estate balances at December 31, 2010 of $1,112,000, compared to December 31, 2009 of $1,065,000. As of December 31, 2010, nine properties are owned by the Company, two of which are commercial properties and total $492,000, and the remaining seven consisting of residential properties and total $620,000. Of the seven residential properties, four were owned by the Company for over 16 months. For the year ended December 31, 2010, the Company updated its fair value assessment of these four properties which have been owned for over 16 months, and recorded a lower of cost or market adjustment of $123,000. As of December 31, 2010, the Company believes the value of foreclosed assets represents their fair values, but if the real estate market continues to remain soft, additional charges may be needed.
Credit Risk Management
Allowance for Loan Losses
Historically, the Company has had an enviable record regarding its control of loan losses, but lending is a banking service that inherently contains elements of risk. The allowance for loan losses is established as losses are estimated to have occurred through a provision for loan losses charged to earnings. Loan losses are charged against the allowance when management believes the uncollectability of a loan balance is confirmed. Subsequent recoveries, if any, are credited to the allowance.
The allowance for loan losses is evaluated on a regular basis by management and is based upon management’s periodic review of the collectability of the loans in light of historical experience, the nature and volume of the loan portfolio, adverse situations that may affect the borrower’s ability to repay, estimated value of any underlying collateral and prevailing economic conditions. This evaluation is inherently subjective as it requires estimates that are susceptible to significant revision as more information becomes available.
The Company maintains the allowance for loan losses at a level believed adequate by management to absorb losses inherent in the portfolio. It is established and maintained through a provision for loan losses charged to earnings. Quarterly, management assesses the adequacy of the allowance for loan losses utilizing a defined methodology, which considers specific credit evaluation of impaired loans as discussed above, past loan loss
- 47 -
Table of Contents
historical experience, and qualitative factors. Management believes the approach properly addresses the requirements of ASC Section 310-10-35 for loans individually identified as impaired, and ASC Subtopic 450-20 for loans collectively evaluated for impairment, and other bank regulatory guidance.
In order to monitor ongoing risk associated with its loan portfolio and specific credits within the segments, management uses an eight point internal grading system. The first four rating categories, representing the lowest risk to the bank, are combined and given a “Pass” rating. The “Special Mention” category includes loans that have potential weaknesses that may, if not monitored or corrected, weaken the asset or inadequately protect the Bank’s position at some future date. These assets pose elevated risk, but their weakness does not yet justify a more severe, or criticized rating. Bank’s management generally follows regulatory definitions in assigning criticized ratings to loans, including substandard, doubtful or loss. “Substandard” loans are classified as they have a well-defined weakness, or weaknesses that jeopardize the liquidation of the debt. These loans are characterized by the distinct possibility that the Bank will sustain some loss if the deficiencies are not corrected. Generally loans greater than 90 days past due are assigned a “substandard” rating. A “doubtful” loan has a high probability of total or substantial loss, but because of specific pending events that may strengthen the asset, its classification of loss is deferred. “Loss” assets are considered uncollectible, as the underlying borrowers are often in bankruptcy, have suspended debt repayments, or ceased business operations. Once a loan is classified as “Loss”, there is little prospect of collecting the loan’s principal or interest and it is generally written off.
The Bank has a loan review policy and program which is designed to reduce and control risk in the lending function. The Credit Administration Committee, comprised of members of the Board, is charged with the overall credit quality and risk exposure of the Company’s loan portfolio. This includes the monitoring of the lending activities of all bank personnel with respect to underwriting and processing new loans and the timely follow-up and corrective action for loans showing signs of deterioration in quality. The loan review program provides the Bank with an internal, independent review of the Bank’s loan portfolio on an ongoing basis. Generally, consumer and residential mortgage loans are included in the Pass categories unless a specific action, such as extended delinquencies, bankruptcy, repossession or death of the borrower occurs, which heightens awareness as to a possible credit event.
The Loan Review department performs annual reviews of all commercial relationships with a committed loan balance in excess of $750,000, with ratification of the rating from the Board of Directors’ Credit Administration Committee for loans between $750,000 – $1,000,000. Loans reviewed in excess of $1,000,000 are presented to the Credit Administration Committee with a formal review and rating. All relationships rated Substandard, Doubtful or Loss are reviewed by the Credit Administration Committee on a quarterly basis, including reaffirmation of the rating, review of detailed collateral analysis and the development of an action plan.
- 48 -
Table of Contents
The following summarizes the Bank’s ratings based on its internal risk rating system as of December 31, 2010:
| (Dollars in thousands) |
Pass | Special Mention |
Substandard | Doubtful | Loss | Total | ||||||||||||||||||
| Commercial real estate: |
||||||||||||||||||||||||
| Owner-occupied |
$ | 162,968 | $ | 2,035 | $ | 6,311 | $ | 686 | $ | — | $ | 172,000 | ||||||||||||
| Non-owner occupied |
120,633 | 4,274 | 18,465 | — | — | 143,372 | ||||||||||||||||||
| Multi-family |
20,030 | 676 | 3,853 | 90 | 24,649 | |||||||||||||||||||
| Acquisition and development: |
||||||||||||||||||||||||
| 1-4 family residential construction |
24,199 | 2,297 | 2,801 | — | — | 29,297 | ||||||||||||||||||
| Commercial and land development |
79,391 | 2,487 | 6,227 | — | — | 88,105 | ||||||||||||||||||
| Commercial and industrial: |
221,111 | 17,062 | 24,762 | 1,008 | — | 263,943 | ||||||||||||||||||
| Residential mortgage: |
||||||||||||||||||||||||
| First lien |
117,607 | — | 1,843 | 119,450 | ||||||||||||||||||||
| Home equity—term |
39,279 | — | 1,539 | — | — | 40,818 | ||||||||||||||||||
| Home equity—lines of credit |
71,364 | — | 183 | — | — | 71,547 | ||||||||||||||||||
| Installment and other loans |
11,062 | — | 50 | — | — | 11,112 | ||||||||||||||||||
| $ | 867,644 | $ | 28,831 | $ | 66,034 | $ | 1,784 | $ | — | $ | 964,293 | |||||||||||||
Classified loans may also be evaluated for impairment. A loan is considered impaired when, based on current information and events, it is probable that the Bank will be unable to collect the scheduled payments of principal or interest when due according to the contractual terms of the loan agreement. Factors considered by management in determining impairment include payment status, collateral value, and the probability of collecting scheduled principal and interest payments when due. Loans that experience insignificant payment delays and payment shortfalls generally are not classified as impaired. Management determines the significance of payment delays and payment shortfalls on a case-by-case basis, taking into consideration all of the circumstances surrounding the loan and the borrower, including the length of the delay, the reasons for the delay, the borrower’s prior payment record, and the amount of the shortfall in relation to the principal and interest owed. Impairment is measured on a loan-by-loan basis for commercial, construction and restructured loans by either the present value of the expected future cash flows discounted at the loan’s effective interest rate, the loan’s obtainable market price, or the fair value of the collateral if the loan is collateral dependent. During the year, the Bank modified its criteria for identifying impaired loans, as performing substandard loans were no longer considered impaired.
Larger groups of smaller balance homogenous loans are collectively evaluated for impairment. Accordingly, the Bank does not separately identify individual consumer and residential loans for impairment disclosures, unless such loans are the subject of a restructuring agreement due to financial difficulties of the borrower.
- 49 -
Table of Contents
The following summarizes impaired loans by class, segregated by those for which a specific allowance was required and those for which a specific allowance was not required as of December 31:
| Impaired Loans with a Specific Allowance | Impaired Loans with No Specific Allowance | |||||||||||||||||||||||||||
| (Dollars in thousands) |
Recorded Investment (Book Balance) |
Unpaid Principal Balance (Legal Balance) |
Related Allowance |
Interest Income Recognized on Cash Basis |
Recorded Investment (Book Balance) |
Unpaid Principal Balance (Legal Balance) |
Interest Income Recognized on Cash Basis |
|||||||||||||||||||||
| December 31, 2010 |
||||||||||||||||||||||||||||
| Commercial real estate: |
||||||||||||||||||||||||||||
| Owner-occupied |
$ | 686 | $ | 687 | $ | 181 | $ | 0 | $ | 0 | $ | 0 | $ | 0 | ||||||||||||||
| Non-owner occupied |
2,064 | 2,065 | 980 | 0 | 0 | 0 | 0 | |||||||||||||||||||||
| Multi-family |
90 | 90 | 90 | 0 | 0 | 0 | 0 | |||||||||||||||||||||
| Commercial and industrial |
9,600 | 10,191 | 3,232 | 0 | 1,118 | 1,118 | 6 | |||||||||||||||||||||
| Residential mortgage: |
||||||||||||||||||||||||||||
| First lien |
470 | 470 | 12 | 32 | 0 | 0 | 0 | |||||||||||||||||||||
| Home equity—term |
711 | 711 | 8 | 44 | 0 | 0 | 0 | |||||||||||||||||||||
| $ | 13,621 | $ | 14,214 | $ | 4,503 | $ | 76 | $ | 1,118 | $ | 1,118 | $ | 6 | |||||||||||||||
| Impaired Loans with Specific Allowance |
Impaired Loans with No Specific Allowance |
|||||||||||
| (Dollars in thousands) |
Recorded Investment |
Related Allowance |
||||||||||
| December 31, 2009 |
||||||||||||
| Commercial real estate: |
||||||||||||
| Owner-occupied |
$ | 2,399 | $ | 214 | $ | 4,192 | ||||||
| Non-owner occupied |
1,267 | 537 | 934 | |||||||||
| Multi-family |
642 | 15 | 114 | |||||||||
| Acquisition and development: |
||||||||||||
| 1-4 family residential construction |
— | — | — | |||||||||
| Commercial and land development |
5,063 | 2,000 | 3,191 | |||||||||
| Commercial and industrial |
6,132 | 2,035 | 7,766 | |||||||||
| $ | 15,503 | $ | 4,801 | $ | 16,197 | |||||||
The following presents impaired loans that are troubled debt restructurings as of December 31, 2010. The Bank did not have any troubled debt restructurings at December 31, 2009.
| Troubled Debt Restructurings at December 31, 2010 |
New Troubled Debt Restructurings During Current YTD Period |
|||||||||||||||
| (Dollars in thousands) |
Number of Contracts |
Recorded Investment |
Number of Contracts |
Recorded Investment |
||||||||||||
| Residential mortgage: |
||||||||||||||||
| First lien |
1 | $ | 470 | 1 | $ | 470 | ||||||||||
| Home equity—term |
1 | 711 | 1 | 711 | ||||||||||||
| 2 | $ | 1,181 | 2 | $ | 1,181 | |||||||||||
No additional commitments have been made to borrowers whose loans are considered trouble debt restructurings.
Potential problem loans are defined as performing loans, which have characteristics that cause management to have serious doubts as to the ability of the borrower to perform under present loan repayment terms and which
- 50 -
Table of Contents
may result in the reporting of these loans as non-performing loans in the future. Generally, management feels that “substandard” loans that are currently performing and not considered impaired, result in some doubt as to the borrower’s ability to continue to perform under the terms of the loan, and represent potential problem loans.
Management further monitors the performance and credit quality of the loan portfolio by analyzing the length of time a portfolio is past due, by aggregating loans based on its delinquencies. The following table presents the classes of loan portfolio summarized by aging categories of performing loans and nonaccrual loans as of December 31, 2010:
| Current | Days Past Due | Total Past Due (still accruing) |
Non-Accrual | Total Loans |
||||||||||||||||||||||||
| (Dollars in thousands) |
30-59 | 60-89 | 90+ (still accruing) |
|||||||||||||||||||||||||
| Commercial real estate: |
||||||||||||||||||||||||||||
| Owner-occupied |
$ | 169,030 | $ | 986 | $ | 832 | $ | 466 | $ | 2,284 | $ | 686 | $ | 172,000 | ||||||||||||||
| Non-owner occupied |
141,095 | 213 | — | — | 213 | 2,064 | 143,372 | |||||||||||||||||||||
| Multi-family |
24,559 | — | — | — | — | 90 | 24,649 | |||||||||||||||||||||
| Acquisition and development: |
||||||||||||||||||||||||||||
| 1-4 family residential construction |
29,297 | — | — | — | — | — | 29,297 | |||||||||||||||||||||
| Commercial and land development |
87,995 | 1 | 16 | — | 17 | 93 | 88,105 | |||||||||||||||||||||
| Commercial and industrial |
252,144 | 287 | 466 | 420 | 1,173 | 10,625 | 263,943 | |||||||||||||||||||||
| Residential mortgage: |
||||||||||||||||||||||||||||
| First lien |
116,182 | 1,359 | 535 | 1,095 | 2,989 | 279 | 119,450 | |||||||||||||||||||||
| Home equity—term |
40,503 | 161 | 62 | 75 | 298 | 17 | 40,818 | |||||||||||||||||||||
| Home equity—Lines of credit |
71,215 | 60 | 89 | 142 | 291 | 41 | 71,547 | |||||||||||||||||||||
| Installment and other loans |
10,793 | 251 | 17 | 50 | 318 | 1 | 11,112 | |||||||||||||||||||||
| $ | 942,813 | $ | 3,318 | $ | 2,017 | $ | 2,248 | $ | 7,584 | $ | 13,896 | $ | 964,293 | |||||||||||||||
General allowances are provided for loans that are collectively evaluated for impairment, which is based on quantitative factors, principally historical loss trends for the respective loan class, adjusted for qualitative factors. As of December 31, 2010, the historical loss trend is based on rolling 8 quarters with a two-third weight to the most recent four quarters, and a one-third weight for the furthest four quarters. Prior to December 31, 2010, the historical loss factor was based on an equally weighted rolling 12 quarters. Additional qualitative factors are used by management to adjust the historical loss percentage to the anticipated losses within the portfolio, and include: national and local economic trends, levels and trends of delinquency rates and nonaccrual loans; effects of changes in underwriting policies; experience, ability and depth of lending and loan review staff, trends in values of underlying collateral including the real estate market; and concentrations of credit from loan type, or shifts in industry or geographic region.
- 51 -
Table of Contents
A summary of the activity in the allowance for loan losses, for the years ended before December 31, 2010 based on the updated segmentation, is as follows:
| Balance, beginning of year |
$ | 11,067 | ||
| Loans charged off: |
||||
| Commercial real estate: |
||||
| Owner-occupied |
726 | |||
| Acquisition and development: |
||||
| Commercial and land development |
1,218 | |||
| Commercial and industrial |
1,786 | |||
| Residential mortgage: |
||||
| First lien |
44 | |||
| Home equity |
239 | |||
| Installment and other loans |
54 | |||
| Total loans charged- off |
4,067 | |||
| Recoveries of loans previously charged off: |
||||
| Commercial real estate: |
||||
| Owner-occupied |
2 | |||
| Commercial and industrial |
63 | |||
| Residential mortgage: |
||||
| First lien |
3 | |||
| Home equity |
4 | |||
| Installment and other loans |
23 | |||
| Total recoveries |
95 | |||
| Provision for loan losses |
8,925 | |||
| Balance, end of year |
$ | 16,020 | ||
| Ratio of net charge-offs to average loans outstanding |
0.44 | % | ||
| Provision for loan losses to net charge-offs |
224.70 | % | ||
| Ratio of reserve to gross loans outstanding at December 31 |
1.66 | % |
- 52 -
Table of Contents
A summary of the activity in the allowance for loan losses, for the years ended before December 31, 2010 based on the prior approach, is as follows:
| (Dollars in thousands) |
2009 | 2008 | 2007 | 2006 | ||||||||||||
| Balance, beginning of year |
$ | 7,140 | $ | 6,141 | $ | 5,520 | $ | 4,428 | ||||||||
| Loans charged off: |
||||||||||||||||
| Commercial, financial and agricultural |
470 | 2 | 8 | 12 | ||||||||||||
| Real estate—Commercial |
0 | 228 | 0 | 0 | ||||||||||||
| Real estate—Mortgage |
416 | 187 | 53 | 0 | ||||||||||||
| Consumer |
72 | 80 | 120 | 85 | ||||||||||||
| Total loans charged off |
958 | 497 | 181 | 97 | ||||||||||||
| Recoveries of loans previously charged off: |
||||||||||||||||
| Commercial, financial and agricultural |
2 | 0 | 3 | 50 | ||||||||||||
| Real estate—Commercial |
1 | 3 | 0 | 1 | ||||||||||||
| Real estate—Mortgage |
6 | 16 | 13 | 6 | ||||||||||||
| Consumer |
11 | 27 | 36 | 22 | ||||||||||||
| Total recoveries |
20 | 46 | 52 | 79 | ||||||||||||
| Provision for loan losses |
4,865 | 1,450 | 750 | 390 | ||||||||||||
| Additions established for acquired credit risk |
0 | 0 | 0 | 720 | ||||||||||||
| Balance, end of year |
$ | 11,067 | $ | 7,140 | $ | 6,141 | $ | 5,520 | ||||||||
| Ratio of net charge-offs to average loans outstanding |
0.11 | % | 0.06 | % | 0.02 | % | 0.00 | % | ||||||||
| Provision for loan losses to net charge-offs |
518.66 | % | 321.51 | % | 581.40 | % | 2166.67 | % | ||||||||
| Ratio of reserve to gross loans outstanding at December 31 |
1.26 | % | 0.87 | % | 0.87 | % | 0.89 | % | ||||||||
Consistent with the trends in the national and local economies, as well as declines in real estate values in the Company’s market, the allowance for loan losses has continued to grow for the period from 2006 through 2010, consistent with the increase in the ratio of net charge-offs to average loans outstanding. Net charge-offs increased from $938,000 for the year ended December 31, 2009 to $3,972,000 for the year ended December 31, 2010, with the majority of the charge-offs coming in the commercial and industrial, commercial real estate and commercial and land development loan portfolios.
During 2010, the Company recorded provision for loan losses totaling $8,925,000, as compared to $4,865,000 for the year ended December 31, 2009. The increase in the 2010 provision was a direct result of the higher level of net charge-offs, combined with the growth that Company has experienced in its loan portfolio. The provision for loan losses covered 2010’s net charge-offs 2.25 times. Management believes the resultant level of provision for and allowance for loan losses to be adequate, given the growth in the Company’s loan portfolio, level of credit quality indicators, and related mix of loans.
- 53 -
Table of Contents
The allocation of the allowance for loan losses, as well as the percent of each loan type in relation to the total loan balance, is as follows:
| 2010 | 2009 | |||||||||||||||
| (Dollars in thousands) |
Amount | % of Loan Type to Total Loans |
Amount | % of Loan Type to Total Loans |
||||||||||||
| Commercial real estate: |
||||||||||||||||
| Owner-occupied |
$ | 1,852 | 18 | % | $ | 1,660 | 18 | % | ||||||||
| Non-owner occupied |
3,034 | 15 | % | 932 | 14 | % | ||||||||||
| Multi-family |
438 | 3 | % | 15 | 3 | % | ||||||||||
| Acquisition and development: |
||||||||||||||||
| 1-4 family residential construction |
314 | 3 | % | 364 | 2 | % | ||||||||||
| Commercial and land development |
1,453 | 9 | % | 2,339 | 10 | % | ||||||||||
| Commercial and industrial |
6,795 | 27 | % | 2,518 | 28 | % | ||||||||||
| Residential mortgage: |
||||||||||||||||
| First lien |
1,033 | 12 | % | 1,234 | 11 | % | ||||||||||
| Home equity |
830 | 12 | % | 647 | 13 | % | ||||||||||
| Installment and other loans |
106 | 1 | % | 96 | 1 | % | ||||||||||
| Unallocated |
165 | 1,262 | ||||||||||||||
| $ | 16,020 | 100 | % | $ | 11,067 | 100 | % | |||||||||
| 2008 | 2007 | 2006 | ||||||||||||||||||||||
| (Dollars in thousands) |
Amount | % of Loan Type to Total Loans |
Amount | % of Loan Type to Total Loans |
Amount | % of Loan Type to Total Loans |
||||||||||||||||||
| Commercial, financial and agricultural |
$ | 319 | 10 | % | $ | 1,227 | 8 | % | $ | 1,206 | 10 | % | ||||||||||||
| Real estate—Commercial |
2,393 | 30 | % | 1,990 | 35 | % | 1,584 | 36 | % | |||||||||||||||
| Real estate—Construction |
598 | 16 | % | 45 | 13 | % | 42 | 8 | % | |||||||||||||||
| Real estate—Mortgage |
2,567 | 43 | % | 2,115 | 43 | % | 1,553 | 45 | % | |||||||||||||||
| Consumer |
265 | 1 | % | 30 | 1 | % | 13 | 1 | % | |||||||||||||||
| Unallocated |
998 | 0 | % | 734 | 0 | % | 1,122 | 0 | % | |||||||||||||||
| Total |
$ | 7,140 | 100 | % | $ | 6,141 | 100 | % | $ | 5,520 | 100 | % | ||||||||||||
- 54 -
Table of Contents
The following summarizes the ending loan balance individually or collectively evaluated for impairment based upon loan type, as well as the allowance for loan loss allocation for each at December 31, 2010.
| Ending Loan Balance | Allowance for Loan Losses Ending Balance for |
|||||||||||||||||||||||
| Individually Evaluated for Impairment |
Collectively Evaluated for Impairment |
Total | Loans Individually Evaluated for Impairment |
Loans Collectively Evaluated for Impairment |
Total | |||||||||||||||||||
| Commercial real estate: |
||||||||||||||||||||||||
| Owner-occupied |
$ | 686 | $ | 171,314 | $ | 172,000 | $ | 181 | $ | 1,671 | $ | 1,852 | ||||||||||||
| Non-owner occupied |
2,064 | 141,308 | 143,372 | 980 | 2,054 | 3,034 | ||||||||||||||||||
| Multi-family |
90 | 24,559 | 24,649 | 90 | 348 | 438 | ||||||||||||||||||
| Acquisition and development: |
||||||||||||||||||||||||
| 1-4 family residential construction |
— | 29,297 | 29,297 | — | 314 | 314 | ||||||||||||||||||
| Commercial and land development |
— | 88,105 | 88,105 | — | 1,453 | 1,453 | ||||||||||||||||||
| Commercial and industrial |
10,718 | 253,225 | 263,943 | 3,232 | 3,563 | 6,795 | ||||||||||||||||||
| Residential mortgage: |
— | |||||||||||||||||||||||
| First lien |
470 | 118,980 | 119,450 | 12 | 1,021 | 1,033 | ||||||||||||||||||
| Home equity—term |
711 | 40,107 | 40,818 | 8 | 336 | 344 | ||||||||||||||||||
| Home equity—Lines of credit |
— | 71,547 | 71,547 | — | 486 | 486 | ||||||||||||||||||
| Installment and other loans |
11,112 | 11,112 | 106 | 106 | ||||||||||||||||||||
| Unallocated |
— | — | 165 | 165 | ||||||||||||||||||||
| $ | 14,739 | $ | 949,554 | $ | 964,293 | $ | 4,503 | $ | 11,517 | $ | 16,020 | |||||||||||||
Management believes the allocation of the allowance for loan losses between the various loan segments adequately reflects the inherent risk in each portfolio, and is based on the methodology previously discussed. As previously noted, in 2010 management re-evaluated and made certain modifications to its methodology in establishing a reserve to better account for risks inherent in the different segments of the portfolio, particularly in light of increased charge-offs, with noticeable differences between the different loan segments. Management believes these periodic enhancements to the allowance for loan losses methodology improves the accuracy of quantifying losses presently inherent in the portfolio, and does not impact the trends or comparability of the periods presented above. Management charges actual loan losses to the reserve and bases the provision for loan losses on the overall analysis taking the methodology into account.
The largest component of the reserve as of the last two years has been allocated to the commercial and industrial portfolio. This reflects the inherent greater risk associated with this portfolio, as evidenced by the greater amounts of net charge-offs within the portfolio. Further, as noted in the Risk Elements discussion, the amount of commercial and industrial loans on nonaccrual status has increased from $2,644,000 at December 31, 2009 to $10,625,000 at December 31, 2010. An increase in the reserve allocated to non-owner occupied commercial real estate of $2,102,000 was also provided, reflective of continued softening of real estate prices, increased vacancies, and the resulting strain it has caused on the borrowers cash flows. One segment that has had a reduction in its allocation of the allowance for loan losses is commercial and land development, which was $2,339,000 at December 31, 2009 compared to $1,453,000 at December 31, 2010. This reduction is principally the result of one large relationship that was charged-off in 2010 in the amount of $1,220,000.
The unallocated portion of the allowance for loan losses reflects estimated inherent losses within the portfolio that have not been detected. This reserve results due to risk of error in the specific and general reserve allocation, other potential exposure in the loan portfolio, variances in management’s assessment of national and local economic conditions and other factors management believes appropriate at the time. The unallocated portion of the allowance has declined in 2010, driven by the enhancements implemented in 2010, which resulted in additional qualitative amounts being allocated to each portfolio, thereby reducing the amount of unallocated that was required for imprecision in the calculation.
- 55 -
Table of Contents
While management believes the Company’s allowance for loan losses is adequate based on information currently available, future adjustments to the reserve and enhancements to the methodology may be necessary due to changes in economic conditions, regulatory guidance, or management’s assumptions as to future delinquencies or loss rates.
Deposit Products
On an average daily basis, total deposits grew 30.5% or $250,963,000 over 2009, which continued on the trend of 2009, in which average daily balance increased 20.9%. At December 31, 2010, total deposits grew to $1,188,377,000 compared to $915,170,000 at year end 2009, or a 29.9% increase.
Each category of time deposits experienced growth on an average daily basis in 2010 as compared to 2009. The two categories that have experienced the most significant growth were interest bearing demand deposits, which grew $92,506,000, or 30.0%, and time deposits, which grew by $145,349,000 or 39.9% on an average daily balance basis. Given current economic times and market conditions, it has been noted that consumers are saving more, combined with our strong capital position, strong focus on our customer needs and service, and competitive pricing has allowed the Company to attract more demand deposits, including checking and money market products.
Additionally, the Company has a strong IDC Financial Publishing, Inc. (IDC) rating, an independent bank safety rating which uses unique rankings of financial ratios to determine the quality ratings of financial institutions. This strong rating allows the Company to attract larger types of deposits, including time deposits, those in excess of $100,000, and brokered deposits. As of December 31, 2010, the Company had brokered deposits totaling $171,589,000, which was a significant increase over the balance of $44,147,000 at December 31, 2009. As noted above, the Bank’s IDC rating has led to an opportunity to obtain this relatively cheap funding source, which it can use to reduce its reliance on more expensive other borrowing types, or invest in loans or securities. The Company recognizes that brokered funds result in greater volatility as a funding source, but given the current interest rate environment and the steepness of the interest rate curve, elected to use these funds and earn a spread on them to increase net interest as previously discussed. Given the increased volatility in brokered deposits, the Company invested a large portion of these amounts in mortgage backed securities, which provide a steady stream of cash flows, which are used to meet the maturity needs of time and brokered deposits.
Management continually evaluates interest rate conditions, including the interest rate curve. Brokered and other time deposit balances may be less emphasized in the future if interest rate conditions are less advantageous to the Company’s net interest income.
The average amounts of deposits are summarized below for the years ended December 31:
| (Dollars in thousands) |
2010 | 2009 | 2008 | |||||||||
| Demand deposits |
$ | 99,636 | $ | 89,797 | $ | 87,537 | ||||||
| Interest bearing demand deposits |
400,474 | 307,968 | 251,547 | |||||||||
| Savings deposits |
63,763 | 60,494 | 61,881 | |||||||||
| Time deposits |
509,426 | 364,077 | 279,127 | |||||||||
| Total deposits |
$ | 1,073,299 | $ | 822,336 | $ | 680,092 | ||||||
- 56 -
Table of Contents
The following is a breakdown of maturities of time deposits of $100,000 or more as of December 31, 2010.
| (Dollars in thousands) |
Total | |||
| Three months or less |
$ | 104,828 | ||
| Over three months through six months |
55,148 | |||
| Over six months through one year |
65,562 | |||
| Over one year |
58,531 | |||
| Total |
$ | 284,069 | ||
Short Term Borrowings
In addition to deposit products, the Company also uses short term borrowings as a funding source. The largest component of short-term borrowings include securities sold under agreements to repurchase with deposit customers, in which the customer sweeps a portion of its deposit balance into a repurchase agreement, which is a secured borrowing as a pool of securities are pledged against the balances.
Information concerning securities sold under agreements to repurchase as of and for the years ended December 31 is as follows:
| (Dollars in thousands) |
2010 | 2009 | 2008 | |||||||||
| Balance at year end |
$ | 87,850 | $ | 64,614 | $ | 63,407 | ||||||
| Average balance during the year |
74,824 | 59,904 | 59,432 | |||||||||
| Average interest rate during the year |
0.59 | % | 0.57 | % | 1.69 | % | ||||||
| Maximum month-end balance during the year |
124,869 | 74,293 | 83,889 | |||||||||
| Securities underlying the agreements at year-end: |
||||||||||||
| Carrying value |
150,966 | 74,816 | 81,528 | |||||||||
| Estimated fair value |
151,767 | 74,877 | 82,625 | |||||||||
Additional short-term borrowing sources include borrowings from the Federal Home Loan Bank of Pittsburgh, federal funds purchased, and to a lesser extent, the U.S. Treasury’s discount window and the Federal Reserve’s Term Auction Facility (TAF), which the Company participated in for portions of 2009 and early 2010.
Information concerning the use of these other short term borrowings as of and for the years ended December 31 is summarized as follows:
| (Dollars in thousands) |
2010 | 2009 | 2008 | |||||||||
| Balance at year end |
$ | 0 | $ | 33,300 | $ | 600 | ||||||
| Average balance during the year |
17,048 | 23,418 | 7,743 | |||||||||
| Average interest rate during the year |
0.43 | % | 0.36 | % | 3.11 | % | ||||||
| Maximum month-end balance during the year |
65,300 | 43,470 | 17,000 | |||||||||
Long-Term Debt
The Company also utilizes long term debt, consisting principally of Federal Home Loan Bank fixed and amortizing advances to fund its loan and security portfolio. As of December 31, 2010, long-term debt totaled $65,178,000, which was consistent with 2009’s year-end balance of $64,858,000. However, during the year, the Company’s reliance on long-term debt was less due its growth in the deposit and repurchase agreement balances. For the year ended December 31, 2010, the average daily balance of long term debt was $51,886,000, which was significantly less than 2009’s balance of $100,340,000.
- 57 -
Table of Contents
Capital Adequacy and Regulatory Matters
The management of capital in a regulated financial services industry must properly balance return on equity to its stockholders while maintaining sufficient levels of capital and related risk-based regulatory capital ratios to satisfy statutory regulatory requirements. Orrstown’s capital management strategies have been developed to provide attractive rates of returns to its shareholders, while maintaining a “well capitalized” position of regulatory strength.
Total shareholders’ equity increased $49,598,000 from $110,886,000 at December 31, 2009 to $160,484,000 at December 31, 2010. Historically, earnings retention, defined as net income, less dividends declared, has served as a primary source of capital to the Company and has been accomplished with a dividend payout ratio of less than 43% over the last five years. Earnings retained during 2010 totaled $9,823,000.
On February 9, 2010, the Company filed a shelf registration statement on Form S-3, with the Securities and Exchange Commission, that provided the Company the ability to raise capital, from time to time, up to an aggregate of $80 million, through the sale of stock, preferred stock, debt securities, warrants and other securities. The Company completed a public stock offering of 1,481,481 shares of common stock at a price of $27.00 per share, for gross proceeds of approximately $40,000,000 during the first quarter of 2010. Net proceeds after underwriting commissions and expenses were $37,585,000. Although the Company recognized this offering would initially dilute earnings per share and reduce return on equity and tangible equity performance measurements, management felt it was necessary in order to support the continued growth of the Company. The additional capital allowed the Company to bolster its regulatory capital ratios during a time of an uncertain economy and the potential for increased government oversight and perhaps higher regulatory capital requirements. As noted below, the Company’s capital ratios have increased significantly as a result of the stock offering. The Company feels with this additional capital, it positions itself well to weather the economy and take advantage of future opportunities that may arise. The Company has no current plans to issue additional shares of common stock.
In addition to the increase in shareholders’ equity that resulted from the stock offering and earnings retention, shareholders’ equity increased $2,190,000 through the issuance of new shares for stock compensation and dividend reinvestments plans, and changes in accumulated other comprehensive income, as more fully outlined on the Statement of Shareholders’ Equity included in Item 8, “Financial Statements and Supplementary Data”.
The Company (on a consolidated basis) and the Bank are subject to various regulatory capital requirements administered by the federal banking agencies. Failure to meet minimum capital requirements can initiate certain mandatory and possibly additional discretionary actions by regulators that, if undertaken, could have a direct material effect on the Company’s and Bank’s financial statements. Under capital adequacy guidelines and the regulatory framework for prompt corrective action, the Company and the Bank must meet specific guidelines that involve quantitative measures of assets, liabilities and certain off-balance sheet items as calculated under regulatory accounting practices. Prompt corrective action provisions are not applicable to financial holding companies.
- 58 -
Table of Contents
As of December 31, 2010, the most recent notification from the Federal Deposit Insurance Corporation categorized the Bank as well capitalized under the regulatory framework for prompt corrective action. To be categorized as well capitalized, an institution must maintain minimum total risk-based, Tier 1 risk-based and Tier 1 leverage ratios as set forth in the following table. There are no conditions or events since the notification that management believes have changed the Bank’s category. The Company and the Bank’s actual capital ratios as of December 31, 2010 and 2009 are presented as follows:
| Actual | Minimum Capital Requirement |
Minimum to Be Well Capitalized Under Prompt Corrective Action Provisions |
||||||||||||||||||||||
| (Dollars in thousands) |
Amount | Ratio | Amount | Ratio | Amount | Ratio | ||||||||||||||||||
| December 31, 2010 |
||||||||||||||||||||||||
| Total capital to risk weighted assets |
||||||||||||||||||||||||
| Orrstown Financial Services, Inc. |
$ | 152,550 | 14.8 | % | $ | 82,486 | 8.0 | % | n/a | n/a | ||||||||||||||
| Orrstown Bank |
129,844 | 12.7 | % | 81,808 | 8.0 | % | $ | 102,260 | 10.0 | % | ||||||||||||||
| Tier 1 capital to risk weighted assets |
||||||||||||||||||||||||
| Orrstown Financial Services, Inc. |
139,623 | 13.5 | % | 41,243 | 4.0 | % | n/a | n/a | ||||||||||||||||
| Orrstown Bank |
117,027 | 11.4 | % | 40,904 | 4.0 | % | 61,356 | 6.0 | % | |||||||||||||||
| Tier 1 capital to average assets |
||||||||||||||||||||||||
| Orrstown Financial Services, Inc. |
139,623 | 9.4 | % | 59,385 | 4.0 | % | n/a | n/a | ||||||||||||||||
| Orrstown Bank |
117,027 | 8.0 | % | 58,629 | 4.0 | % | 73,287 | 5.0 | % | |||||||||||||||
| December 31, 2009 |
||||||||||||||||||||||||
| Total capital to risk weighted assets |
||||||||||||||||||||||||
| Orrstown Financial Services, Inc. |
99,494 | 11.4 | % | 70,136 | 8.0 | % | n/a | n/a | ||||||||||||||||
| Orrstown Bank |
96,819 | 11.1 | % | 70,019 | 8.0 | % | 87,524 | 10.0 | % | |||||||||||||||
| Tier 1 capital to risk weighted assets |
||||||||||||||||||||||||
| Orrstown Financial Services, Inc. |
88,534 | 10.1 | % | 35,068 | 4.0 | % | n/a | n/a | ||||||||||||||||
| Orrstown Bank |
85,877 | 9.8 | % | 35,009 | 4.0 | % | 52,514 | 6.0 | % | |||||||||||||||
| Tier 1 capital to average assets |
||||||||||||||||||||||||
| Orrstown Financial Services, Inc. |
88,534 | 7.6 | % | 46,503 | 4.0 | % | n/a | n/a | ||||||||||||||||
| Orrstown Bank |
85,877 | 7.4 | % | 46,457 | 4.0 | % | 58,071 | 5.0 | % | |||||||||||||||
Additional relevant financial information pertaining to shareholders’ equity for the years ended December 31 is as follows:
| (Dollars in thousands) |
2010 | 2009 | 2008 | |||||||||
| Average shareholders’ equity |
$ | 147,731 | $ | 107,138 | $ | 99,241 | ||||||
| Net Income |
16,581 | 13,373 | 13,103 | |||||||||
| Cash dividends paid |
6,758 | 5,636 | 5,588 | |||||||||
| Equity to asset ratio |
10.76 | % | 9.55 | % | 10.45 | % | ||||||
| Dividend payout ratio |
40.83 | % | 42.11 | % | 42.65 | % | ||||||
| Return on average equity |
11.22 | % | 12.48 | % | 13.20 | % | ||||||
| Return on average tangible equity |
13.19 | % | 15.73 | % | 17.02 | % | ||||||
Liquidity, Rate Sensitivity and Interest Rate Risk Analysis
The primary function of asset/liability management is to assure adequate liquidity and sensitivity to changing interest rates. Liquidity management involves the ability to meet the cash flow requirements of customers who may be either depositors wanting to withdraw funds or borrowers needing assurance that sufficient funds will be available to meet their credit needs. Our primary sources of funds consist of deposit inflows, loan repayments, maturities and sales of investment securities and borrowings from the Federal Home
- 59 -
Table of Contents
Loan Bank of Pittsburgh. While maturities and scheduled amortization of loans and securities are predictable sources of funds, deposit flows and mortgage prepayments are greatly influenced by general interest rates, economic conditions and competition.
We regularly adjust our investments in liquid assets based upon our assessment of (1) expected loan demand, (2) expected deposit flows, (3) yields available on interest-earning deposits and securities and (4) the objectives of our asset/liability management policy.
Our most liquid assets are cash and cash equivalents and interest-bearing deposits. The levels of these assets depend on our operating, financing, lending and investing activities during any given period. At December 31, 2010, cash and cash equivalents totaled $19,200,000. Securities classified as available-for-sale provide additional sources of liquidity, totaled $431,772,000 at December 31, 2010. In addition, at December 31, 2010, we had the ability to borrow a total of approximately $463,000,000 from the Federal Home Loan Bank of Pittsburgh, of which we had $64,863,000 in advances and $3,030,000 in letters of credit. On that date, we had no overnight advances outstanding.
At December 31, 2010, we had $253,388,000 in loan commitments outstanding, which included $59,802,000 in undisbursed loans, $68,490,000 in unused home equity lines of credit and $95,538,000 in commercial lines of credit, and $29,558,000 in standby letters of credit. Certificates of deposit due within one year of December 31, 2010 totaled $397,123,000, or 67% of certificates of deposit. The large percentage of certificates of deposit that mature within one year reflects customers’ hesitancy to invest their funds for long periods in the current low interest rate environment. If these maturing deposits do not remain with us, we will be required to seek other sources of funds, including other certificates of deposit and lines of credit. Depending on market conditions, we may be required to pay higher rates on such deposits or other borrowings than we currently pay on the certificates of deposit due on or before December 31, 2011. We believe, however, based on past experience that a significant portion of our certificates of deposit will remain with us. We have the ability to attract and retain deposits by adjusting the interest rates offered.
The Company is a separate legal entity from the Bank and must provide for its own liquidity. In addition to its operating expenses, the Company is responsible for paying any dividends declared to its shareholders. The Company also has repurchased shares of its common stock. The Company’s primary source of income is dividends received from the Bank. For restrictions on the Bank’s ability to dividend funds to the Company, see Note 15, “Restrictions on Dividends, Loans and Advances,” to the Consolidated Financial Statements included in Item 8.
Interest rate sensitivity management requires the maintenance of an appropriate balance between interest sensitive assets and liabilities. Interest bearing assets and liabilities that are maturing or repricing should be adequately balanced to avoid fluctuating net interest margins and to enhance consistent growth of net interest income through periods of changing interest rates.
The Company has consistently followed a strategy of pricing assets and liabilities according to prevailing market rates while largely matching maturities, within the guidelines of sound marketing and competitive practices. The goal is to maintain a predominantly matched position with very few planned mismatches. Rate spreads will be sacrificed at times in order to enable the overall rate sensitivity position to stay within the guidelines called for by asset/liability management policy. Rate sensitivity is measured by monthly gap analyses, quarterly rate shocks, and periodic simulation. Investment and pricing decisions are made using both liquidity and sensitivity analyses as tools.
The schedule that follows reflects the degree to which the Company can adjust its various portfolios to meet interest rate changes. Additionally, the Bank is a Federal Home Loan Bank (FHLB) member, and standard credit arrangements available to FHLB members provide increased liquidity.
- 60 -
Table of Contents
RATE SENSITIVITY ANALYSIS AT DECEMBER 31, 2010
| Interest Sensitivity Period | ||||||||||||||||||||
| (Dollars in thousands) |
Within 3 Months |
After 3 Within 6 Months |
After 6 Within 12 Months |
After 1 Year |
Total | |||||||||||||||
| Rate Sensitive Assets (RSA) |
||||||||||||||||||||
| Loans |
$ | 428,347 | $ | 35,298 | $ | 56,210 | $ | 447,131 | $ | 966,986 | ||||||||||
| Investment securities |
23,147 | 12,948 | 22,340 | 382,135 | 440,570 | |||||||||||||||
| Other earning assets |
9,725 | 0 | 2,728 | 0 | 12,453 | |||||||||||||||
| Total RSA |
461,219 | 48,246 | 81,278 | 829,266 | 1,420,009 | |||||||||||||||
| Rate Sensitive Liabilities (RSL) |
||||||||||||||||||||
| Interest bearing deposits |
295,704 | 96,204 | 130,742 | 561,081 | 1,083,731 | |||||||||||||||
| Short term borrowings |
87,850 | 0 | 0 | 0 | 87,850 | |||||||||||||||
| Long-term debt |
45,111 | 314 | 640 | 19,113 | 65,178 | |||||||||||||||
| Total RSL |
428,665 | 96,518 | 131,382 | 580,194 | 1,236,759 | |||||||||||||||
| Rate Sensitive GAP |
||||||||||||||||||||
| Period |
32,554 | (48,272 | ) | (50,104 | ) | 249,072 | 183,250 | |||||||||||||
| Cumulative |
32,554 | (15,718 | ) | (65,822 | ) | 183,250 | ||||||||||||||
| GAP as a Percent of Total Assets |
||||||||||||||||||||
| Period |
2.15 | % | -3.19 | % | -3.31 | % | 16.48 | % | ||||||||||||
| Cumulative |
2.15 | % | -1.04 | % | -4.35 | % | 12.12 | % | ||||||||||||
| RSA/RSL cumulative |
1.08 | % | 0.97 | % | 0.90 | % | 1.15 | % | ||||||||||||
The gap position is very closely balanced but slightly liability biased, or negative, after three but within a 12 month time frame. The position is very closely balanced, though, so no strong bias exists. The cumulative RSA/RSL at December 31, 2010 is 1.08% at three months, 0.97% at six months and 0.90% at twelve months, so the Company is not at undue risk under any interest rate scenario. This indicates that the balance sheet is well positioned to be maintained in the current low rate environment and to react to any rate increases in the future. Many of the interest bearing deposits that are variable rate are subject to discretionary pricing so management retains flexibility with those funds which will enhance earnings in a rising rate environment. The majority of the loan portfolio is tied to prime, but the use of three to seven year rate locks as well as placing rate floors on any new loans helps to maintain the yield in a falling rate environment.
During 2010, the Company has been able to migrate away from the slightly liability sensitive position at Decembers 31, 2009, which had RSA/RSL cumulative RASA/RSL positions were 0.89%, 0.86% and 0.88% at three month, six month and twelve month categories. The Company was more liability sensitive at September 30, 2010, but funding extensions and an increase in variable rate lending have enabled the Company to move to an asset sensitive position at 3 months and less and a slightly liability sensitive cumulative position at 6 months and 12 months.
Management will closely monitor the fiscal policies of our government and will react to any changes quickly in order to maintain a healthy earning asset / interest bearing liability balance.
- 61 -
Table of Contents
Contractual Obligations
The Company enters into contractual obligations in its normal course of business to fund loan growth, for asset/liability management purposes, to meet required capital needs and for other corporate purposes. The following table presents significant fixed and determinable contractual obligations of principal by payment date as of December 31, 2010. Further discussion of the nature of each obligation is included in the referenced note to the consolidated financial statements, under Item 8.
| Note Reference |
Payments Due | Total | ||||||||||||||||||||||
| (Dollars in thousands) |
Less than 1 year |
2 - 3 years | 4 - 5 years | More than 5 years |
||||||||||||||||||||
| Time deposits |
11 | $ | 397,123 | $ | 143,417 | $ | 39,606 | $ | 9,835 | $ | 589,981 | |||||||||||||
| Short-term borrowings |
12 | 87,850 | — | — | — | 87,850 | ||||||||||||||||||
| Long-term debt |
13 | 41,065 | 17,722 | 1,582 | 4,809 | 65,178 | ||||||||||||||||||
| Operating lease obligation |
5 | 193 | 231 | 216 | 439 | 1,079 | ||||||||||||||||||
| Total |
$ | 526,230 | $ | 161,370 | $ | 41,404 | $ | 15,083 | $ | 744,087 | ||||||||||||||
The Company is a party to derivative instruments in the normal course of business, to assist in asset liability management and reduce exposure in earnings volatility caused by fluctuations in interest and market conditions. Derivative contracts are carried at fair value on the consolidated balance sheet with the fair value representing the net present value of the expected future cash receipts or payments based on market and interest rate conditions as of the balance sheet date. The fair values of the contracts can change daily as market and interest rate conditions fluctuate. These derivative contracts require monthly cash settlement. Because the derivative assets recorded on the balance sheet do not represent the amounts that will ultimately be paid under the contract, they are not included in the table of contractual obligations discussed above. Further discussion of derivative instruments is included in Note 19 to the consolidated financial statements, under Item 8.
Off-balance Sheet Arrangements
The Company is party to financial instruments with off-balance sheet risk in the normal course of business to meet the financing needs of its customers. These financial instruments include commitments to extend credit and to a lesser extent, letters of credit.
A schedule of significant commitments at December 31, 2010 is as follows:
| Contract or Notional Amount |
||||
| (Dollars in thousands) |
2010 | |||
| Commitments to fund: |
||||
| Revolving, open ended home equity loans |
$ | 68,490 | ||
| Commercial real estate, construction and land development loans |
59,802 | |||
| Commercial, industrial and other loans |
95,538 | |||
| Standby letters of credit |
29,558 | |||
Further discussion of these commitments to extend credit is included in Note18 to the consolidated financial statements, under Item 8. Because these commitments generally have fixed expiration dates and many will expire without being drawn upon, the total commitment does not necessarily represent future cash requirements, and are therefore excluded from the contractual obligations discussed above.
- 62 -
Table of Contents
New Financial Accounting Standards
Note 1 to the consolidated financial statements under Item 8 discusses the expected impact on the Company’s financial condition or results of operations for recently issued or proposed accounting standards that have not been adopted as of December 31, 2010. To the extent we anticipate significant impact to the Company’s financial condition or results of operations, appropriate discussion is included in the disclosure.
ITEM 7A—QUANTITATIVE AND QUALITATIVE DISCLOSURES ABOUT MARKET RISK
Market risk is defined as the exposure to interest rate risk, foreign currency exchange rate risk, commodity price risk, and other relevant market rate or price risks. For domestic banks, the majority of market risk is related to interest rate risk.
Interest rate sensitivity management requires the maintenance of an appropriate balance between interest sensitive assets and liabilities. Interest bearing assets and liabilities that are maturing or repricing should be adequately balanced to avoid fluctuating net interest margins and to enhance consistent growth of net interest income through periods of changing interest rates. The Company has consistently followed a strategy of pricing assets and liabilities according to prevailing market rates while largely matching maturities, within the guidelines of sound marketing and competitive practices. Interest-earning assets are substantially made up of loans and securities. Loans are priced by management with current market rates as guidelines while achieving a positive interest rate spread and limiting credit risk. A significant part of the loan portfolio is made up of variable rate loans and loans that will become variable after a fixed term and will reprice as market rates move. The Bank maintains two interest rate swap agreements to better balance our market risk of variable vs. fixed rate loans. Securities are purchased using liquidity and maturity terms as guidelines to obtain a more matched position. The deposit base is a mix of transaction accounts and time deposits. Many of the interest bearing transaction accounts have discretionary pricing so great flexibility exists for deposit side price adjustments. Time deposits have set maturities as do short term and long term borrowings. Although deposit product cycles and growth are driven by the preferences of our customers, borrowings are structured with specific terms that, when aggregated with the terms for deposits and matched with interest-earning assets, mitigate our exposure to interest rate sensitivity. Rate sensitivity is measured by monthly gap analysis, quarterly rate shocks, and periodic simulation.
At December 31, 2010, the twelve month cumulative gap was a negative $65,882,000 and the RSA/ RSL cumulative ratio was 0.90% which has increased slightly from 0.88% since December 31, 2009. Further discussion related to the quantitative and qualitative disclosures about market risk is included under the heading of Liquidity, Rate Sensitivity and Interest Rate Risk Analysis in Item 7 of Management’s Discussion and Analysis of Financial Condition and Results of Operations.
- 63 -
Table of Contents
ITEM 8—FINANCIAL STATEMENTS AND SUPPLEMENTARY DATA
SUMMARY OF QUARTERLY FINANCIAL DATA
The unaudited quarterly results of operations for the years ended December 31, are as follows:
| 2010 | 2009 | |||||||||||||||||||||||||||||||
| Quarter Ended | Quarter Ended | |||||||||||||||||||||||||||||||
| (Dollars in thousands) |
December | September | June | March | December | September | June | March | ||||||||||||||||||||||||
| Interest income |
$ | 15,324 | $ | 14,780 | $ | 14,536 | $ | 13,783 | $ | 13,813 | $ | 13,538 | $ | 13,142 | $ | 12,577 | ||||||||||||||||
| Interest expense |
(3,054 | ) | (3,112 | ) | (3,236 | ) | (3,286 | ) | (3,556 | ) | (4,059 | ) | (4,330 | ) | (4,555 | ) | ||||||||||||||||
| Net interest income |
12,270 | 11,668 | 11,300 | 10,497 | 10,257 | 9,479 | 8,812 | 8,022 | ||||||||||||||||||||||||
| Provision for loan losses |
(1,375 | ) | (1,130 | ) | (5,000 | ) | (1,420 | ) | (3,600 | ) | (750 | ) | (300 | ) | (215 | ) | ||||||||||||||||
| Net interest income after provision for loan losses |
10,895 | 10,538 | 6,300 | 9,077 | 6,657 | 8,729 | 8,512 | 7,807 | ||||||||||||||||||||||||
| Securities gains |
383 | 1,074 | 1,781 | 398 | 865 | 338 | 293 | 165 | ||||||||||||||||||||||||
| Other income |
5,153 | 5,133 | 5,828 | 4,043 | 4,222 | 4,024 | 3,997 | 3,781 | ||||||||||||||||||||||||
| Other expense |
(10,450 | ) | (9,703 | ) | (8,645 | ) | (8,754 | ) | (8,045 | ) | (7,984 | ) | (8,284 | ) | (7,654 | ) | ||||||||||||||||
| Income before income taxes |
5,981 | 7,042 | 5,264 | 4,764 | 3,699 | 5,107 | 4,518 | 4,099 | ||||||||||||||||||||||||
| Applicable income taxes |
(1,606 | ) | (2,146 | ) | (1,360 | ) | (1,358 | ) | (685 | ) | (1,227 | ) | (1,064 | ) | (1,074 | ) | ||||||||||||||||
| Net income |
$ | 4,375 | $ | 4,896 | $ | 3,904 | $ | 3,406 | $ | 3,014 | $ | 3,880 | $ | 3,454 | $ | 3,025 | ||||||||||||||||
| Per Common Share Data |
||||||||||||||||||||||||||||||||
| Net income |
$ | 0.55 | $ | 0.61 | $ | 0.49 | $ | 0.52 | $ | 0.47 | $ | 0.61 | $ | 0.54 | $ | 0.47 | ||||||||||||||||
| Diluted net income |
0.55 | 0.61 | 0.49 | 0.52 | 0.46 | 0.60 | 0.54 | 0.47 | ||||||||||||||||||||||||
| Dividends |
0.225 | 0.225 | 0.22 | 0.22 | 0.22 | 0.22 | 0.22 | 0.22 | ||||||||||||||||||||||||
| Performance Statistics |
||||||||||||||||||||||||||||||||
| Return on average assets |
1.15 | % | 1.36 | % | 1.18 | % | 1.12 | % | 1.01 | % | 1.36 | % | 1.26 | % | 1.15 | % | ||||||||||||||||
| Return on average tangible assets |
1.18 | % | 1.39 | % | 1.22 | % | 1.15 | % | 1.04 | % | 1.40 | % | 1.30 | % | 1.19 | % | ||||||||||||||||
| Return on average equity |
10.59 | % | 12.18 | % | 10.20 | % | 12.18 | % | 10.68 | % | 14.33 | % | 13.14 | % | 11.84 | % | ||||||||||||||||
| Return on average tangible equity |
12.22 | % | 14.03 | % | 12.02 | % | 15.12 | % | 13.32 | % | 18.01 | % | 16.61 | % | 15.08 | % | ||||||||||||||||
| Average equity / average assets |
10.89 | % | 11.20 | % | 11.56 | % | 9.17 | % | 9.45 | % | 9.50 | % | 9.58 | % | 9.68 | % | ||||||||||||||||
| Supplemental Reporting of Non-GAAP-Based Financial Measures |
| |||||||||||||||||||||||||||||||
| Return on average assets (GAAP basis) |
1.15 | % | 1.36 | % | 1.18 | % | 1.12 | % | 1.01 | % | 1.36 | % | 1.26 | % | 1.15 | % | ||||||||||||||||
| Effect of excluding average intangible assets and related amortization |
0.03 | % | 0.03 | % | 0.04 | % | 0.03 | % | 0.03 | % | 0.04 | % | 0.04 | % | 0.04 | % | ||||||||||||||||
| Return on average tangible equity |
1.18 | % | 1.39 | % | 1.22 | % | 1.15 | % | 1.04 | % | 1.40 | % | 1.30 | % | 1.19 | % | ||||||||||||||||
| Return on average equity (GAAP basis) |
10.59 | % | 12.18 | % | 10.20 | % | 12.18 | % | 10.68 | % | 14.33 | % | 13.14 | % | 11.84 | % | ||||||||||||||||
| Effect of excluding average intangible assets and related amortization |
1.63 | % | 1.85 | % | 1.82 | % | 2.94 | % | 2.64 | % | 3.68 | % | 3.47 | % | 3.24 | % | ||||||||||||||||
| Return on average tangible equity |
12.22 | % | 14.03 | % | 12.02 | % | 15.12 | % | 13.32 | % | 18.01 | % | 16.61 | % | 15.08 | % | ||||||||||||||||
Index to Financial Statements and Supplementary Data
| Page | ||||
| 65 | ||||
| 66 | ||||
| 68 | ||||
| 69 | ||||
| 70 | ||||
| 71 | ||||
| 73 | ||||
- 64 -
Table of Contents
Management’s Report on Internal Control
The management of Orrstown Financial Services, Inc. and its wholly-owned subsidiary has the responsibility for establishing and maintaining an adequate internal control structure and procedures for financial reporting. Management maintains a comprehensive system of internal control to provide reasonable assurance of the proper authorization of transactions, the safeguarding of assets and the reliability of the financial records. The system of internal control provides for appropriate division of responsibility and is documented by written policies and procedures that are communicated to employees. Orrstown Financial Services, Inc. and its wholly-owned subsidiary maintains an internal auditing program, under the supervision of the Audit Committee of the Board of Directors, which independently assesses the effectiveness of the system of internal control and recommends possible improvements.
Under the supervision and with the participation of the Company’s management, including its Chief Executive Officer and Chief Financial Officer, the Company has evaluated the effectiveness of its internal control over financial reporting as of December 31, 2010, using the Internal Control – Integrated Framework issued by the Committee of Sponsoring Organizations of the Treadway Commission. Based upon this evaluation, management has concluded that, at December 31, 2010, the Company’s internal control over financial reporting is effective based on the criteria established in Internal Control-Integrated Framework.
The independent registered public accounting firm, Smith Elliott Kearns & Company, LLC, has issued an audit report on the Company’s internal control over financial reporting as of December 31, 2010. The accounting firm’s audit report on internal control over financial reporting is included in this financial report.
| /S/ THOMAS R. QUINN, JR. | /S/ BRADLEY S. EVERLY | |||
| Thomas R. Quinn, Jr. | Bradley S. Everly | |||
| President and Chief Executive Officer | Executive Vice President and Chief Financial Officer |
March 11, 2011
- 65 -
Table of Contents

Report of Independent Registered Public Accounting Firm
To the Board of Directors and Shareholders of
Orrstown Financial Services, Inc.
We have audited the accompanying consolidated balance sheets of Orrstown Financial Services, Inc. and its wholly-owned subsidiary (“the Company”) as of December 31, 2010 and 2009, and the related consolidated statements of income, changes in shareholders’ equity, and cash flows for each of the years in the three-year period ended December 31, 2010. We also have audited Orrstown Financial Services, Inc. and its wholly-owned subsidiary’s internal control over financial reporting as of December 31, 2010, based on criteria established in Internal Control – Integrated Framework issued by the Committee of Sponsoring Organizations of the Treadway Commission (COSO). Orrstown Financial Services, Inc. and its wholly-owned subsidiary’s management is responsible for these financial statements, for maintaining effective internal control over financial reporting, and for its assessment of the effectiveness of internal control over financial reporting, included in the accompanying Management’s Report on Internal Control. Our responsibility is to express an opinion on these financial statements and an opinion on the Company’s internal control over financial reporting based on our audits.
We conducted our audits in accordance with the standards of the Public Company Accounting Oversight Board (United States). Those standards require that we plan and perform the audits to obtain reasonable assurance about whether the financial statements are free of material misstatement and whether effective internal control over financial reporting was maintained in all material respects. Our audits of the financial statements included examining, on a test basis, evidence supporting the amounts and disclosures in the financial statements, assessing the accounting principles used and significant estimates made by management, and evaluating the overall financial statement presentation. Our audit of internal control over financial reporting included obtaining an understanding of internal control over financial reporting, assessing the risk that a material weakness exists, and testing and evaluating the design and operating effectiveness of internal control based on the assessed risk. Our audits also included performing such other procedures as we considered necessary in the circumstances. We believe that our audits provide a reasonable basis for our opinions.
A company’s internal control over financial reporting is a process designed to provide reasonable assurance regarding the reliability of financial reporting and the preparation of financial statements for external purposes in accordance with generally accepted accounting principles. A company’s internal control over financial reporting includes those policies and procedures that (1) pertain to the maintenance of records that, in reasonable detail, accurately and fairly reflect the transactions and dispositions of the assets of the company; (2) provide reasonable assurance that transactions are recorded as necessary to permit preparation of financial statements in accordance with generally accepted accounting principles, and that receipts and expenditures of the company are being made only in accordance with authorizations of management and directors of the company; and (3) provide reasonable assurance regarding prevention or timely detection of unauthorized acquisition, use, or disposition of the company’s assets that could have a material effect on the financial statements.
Because of its inherent limitations, internal control over financial reporting may not prevent or detect misstatements. Also, projections of any evaluation of effectiveness to future periods are subject to the risk that controls may become inadequate because of changes in conditions, or that the degree of compliance with the policies or procedures may deteriorate.
- 66 -
Table of Contents
In our opinion, the financial statements referred to above present fairly, in all material respects, the financial position of Orrstown Financial Services, Inc. and its wholly-owned subsidiary as of December 31, 2010 and 2009, and the results of their operations and their cash flows for each of the years in the three-year period ended December 31, 2010 in conformity with accounting principles generally accepted in the United States of America. Also, in our opinion, Orrstown Financial Services, Inc. and its wholly-owned subsidiary maintained, in all material respects, effective internal control over financial reporting as of December 31, 2010, based on criteria established in Internal Control – Integrated Framework issued by the Committee of Sponsoring Organizations of the Treadway Commission (COSO).
/s/ Smith Elliott Kearns & Company, LLC
Chambersburg, Pennsylvania
March 11, 2011
- 67 -
Table of Contents
ORRSTOWN FINANCIAL SERVICES, INC. AND ITS WHOLLY-OWNED SUBSIDIARY
| December 31, | ||||||||
| (Dollars in thousands, Except per Share Data) |
2010 | 2009 | ||||||
| Assets |
||||||||
| Cash and due from banks |
$ | 10,400 | $ | 13,940 | ||||
| Federal funds sold |
8,800 | 8,000 | ||||||
| Cash and cash equivalents |
19,200 | 21,940 | ||||||
| Short term investments |
2,728 | 6,388 | ||||||
| Interest bearing deposits with banks |
925 | 601 | ||||||
| Restricted investments in bank stock |
8,798 | 8,056 | ||||||
| Securities available for sale |
431,772 | 196,253 | ||||||
| Loans held for sale |
2,693 | 594 | ||||||
| Loans |
964,293 | 880,480 | ||||||
| Allowance for loan losses |
(16,020 | ) | (11,067 | ) | ||||
| Net Loans |
950,966 | 870,007 | ||||||
| Premises and equipment, net |
27,774 | 29,601 | ||||||
| Cash surrender value of life insurance |
22,649 | 21,204 | ||||||
| Goodwill and intangible assets |
20,698 | 20,938 | ||||||
| Accrued interest receivable |
5,715 | 4,605 | ||||||
| Other assets |
20,497 | 16,839 | ||||||
| Total assets |
$ | 1,511,722 | $ | 1,196,432 | ||||
| Liabilities |
||||||||
| Deposits: |
||||||||
| Non-interest bearing |
$ | 104,646 | $ | 90,676 | ||||
| Interest bearing |
1,083,731 | 824,494 | ||||||
| Total deposits |
1,188,377 | 915,170 | ||||||
| Short-term borrowings |
87,850 | 97,914 | ||||||
| Long-term debt |
65,178 | 64,858 | ||||||
| Accrued interest and other liabilities |
9,833 | 7,604 | ||||||
| Total liabilities |
1,351,238 | 1,085,546 | ||||||
| Shareholders’ Equity |
||||||||
| Preferred Stock, $1.25 par value per share; 500,000 shares authorized; no shares issued or outstanding |
0 | 0 | ||||||
| Common stock, no par value—$ .05205 stated value per share |
||||||||
| 50,000,000 shares authorized; 7,986,966 and 6,469,508 shares issued; 7,985,667 and 6,443,195 shares outstanding |
416 | 337 | ||||||
| Additional paid-in capital |
121,508 | 82,895 | ||||||
| Retained earnings |
38,680 | 28,857 | ||||||
| Accumulated other comprehensive income (loss) |
(88 | ) | (501 | ) | ||||
| Treasury stock—common, 1,299 and 26,313 shares, at cost |
(32 | ) | (702 | ) | ||||
| Total shareholders’ equity |
160,484 | 110,886 | ||||||
| Total liabilities and shareholders’ equity |
$ | 1,511,722 | $ | 1,196,432 | ||||
The Notes to Consolidated Financial Statements are an integral part of these statements.
- 68 -
Table of Contents
Consolidated Statements of Income
ORRSTOWN FINANCIAL SERVICES, INC. AND ITS WHOLLY-OWNED SUBSIDIARY
| Years Ended December 31, | ||||||||||||
| (Dollars in thousands, Except per Share Data) |
2010 | 2009 | 2008 | |||||||||
| Interest and dividend income |
||||||||||||
| Interest and fees on loans |
$ | 48,494 | $ | 47,569 | $ | 48,124 | ||||||
| Interest and dividends on investment securities |
||||||||||||
| Taxable |
7,744 | 4,260 | 2,862 | |||||||||
| Tax-exempt |
2,069 | 1,172 | 1,100 | |||||||||
| Short term investments |
116 | 69 | 227 | |||||||||
| Total interest and dividend income |
58,423 | 53,070 | 52,313 | |||||||||
| Interest expense |
||||||||||||
| Interest on deposits |
10,682 | 12,481 | 14,021 | |||||||||
| Interest on short-term borrowings |
487 | 435 | 1,248 | |||||||||
| Interest on long-term debt |
1,519 | 3,584 | 4,139 | |||||||||
| Total interest expense |
12,688 | 16,500 | 19,408 | |||||||||
| Net interest income |
45,735 | 36,570 | 32,905 | |||||||||
| Provision for loan losses |
8,925 | 4,865 | 1,450 | |||||||||
| Net interest income after provision for loan losses |
36,810 | 31,705 | 31,455 | |||||||||
| Other income |
||||||||||||
| Service charges on deposit accounts |
7,506 | 6,905 | 6,758 | |||||||||
| Other service charges, commissions and fees |
3,878 | 3,186 | 2,473 | |||||||||
| Trust department income |
3,606 | 2,645 | 2,840 | |||||||||
| Brokerage income |
1,450 | 1,327 | 1,413 | |||||||||
| Gains on sale of loans |
1,304 | 832 | 461 | |||||||||
| Earnings on life insurance |
1,192 | 745 | 683 | |||||||||
| Other income |
1,221 | 384 | 694 | |||||||||
| Investment securities gains (losses) |
3,636 | 1,661 | (27 | ) | ||||||||
| Total other income |
23,793 | 17,685 | 15,295 | |||||||||
| Other expenses |
||||||||||||
| Salaries and employee benefits |
19,120 | 16,040 | 14,315 | |||||||||
| Occupancy expense |
2,200 | 2,169 | 1,964 | |||||||||
| Furniture and equipment |
2,742 | 2,637 | 2,287 | |||||||||
| Data Processing |
1,278 | 1,077 | 999 | |||||||||
| Telephone |
730 | 731 | 679 | |||||||||
| Advertising and bank promotions |
1,208 | 1,111 | 1,238 | |||||||||
| FDIC Insurance |
1,798 | 1,278 | 296 | |||||||||
| Professional services |
856 | 667 | 560 | |||||||||
| Taxes other than income |
764 | 554 | 577 | |||||||||
| Intangible asset amortization |
240 | 252 | 251 | |||||||||
| Other operating expenses |
6,616 | 5,451 | 4,999 | |||||||||
| Total other expenses |
37,552 | 31,967 | 28,165 | |||||||||
| Income before income tax |
23,051 | 17,423 | 18,585 | |||||||||
| Income tax expense |
6,470 | 4,050 | 5,482 | |||||||||
| Net income |
$ | 16,581 | $ | 13,373 | $ | 13,103 | ||||||
| Per share information: |
||||||||||||
| Basic earnings per share |
$ | 2.18 | $ | 2.09 | $ | 2.04 | ||||||
| Diluted earnings per share |
2.17 | 2.07 | 2.03 | |||||||||
| Dividends per share |
0.89 | 0.88 | 0.87 | |||||||||
The Notes to Consolidated Financial Statements are an integral part of these statements.
- 69 -
Table of Contents
Consolidated Statements of Changes in Shareholders’ Equity
ORRSTOWN FINANCIAL SERVICES, INC. AND ITS WHOLLY-OWNED SUBSIDIARY
| Years Ended December 31, 2010, 2009, and 2008 | ||||||||||||||||||||||||
| (Dollars in thousands, except per share data) |
Common Stock |
Additional Paid-In Capital |
Retained Earnings |
Accumulated Other Comprehensive Income (Loss) |
Treasury Stock |
Total Shareholders’ Equity |
||||||||||||||||||
| Balance, January 1, 2008 |
$ | 336 | $ | 82,488 | $ | 13,868 | $ | 567 | $ | (1,135 | ) | $ | 96,124 | |||||||||||
| Net income |
0 | 0 | 13,103 | 0 | 0 | 13,103 | ||||||||||||||||||
| Net unrealized gains on derivatives |
0 | 0 | 0 | 831 | 0 | 831 | ||||||||||||||||||
| Net unrealized losses on securities |
0 | 0 | 0 | (29 | ) | 0 | (29 | ) | ||||||||||||||||
| Comprehensive income |
13,905 | |||||||||||||||||||||||
| Cash dividends ($0.87 per share) |
0 | 0 | (5,588 | ) | 0 | 0 | (5,588 | ) | ||||||||||||||||
| Post retirement split dollar life insurance |
0 | 0 | (263 | ) | 0 | 0 | (263 | ) | ||||||||||||||||
| Stock-based compensation plans: |
||||||||||||||||||||||||
| Compensation expense |
0 | 123 | 0 | 0 | 0 | 123 | ||||||||||||||||||
| Issuance of stock (2,278 shares) |
0 | 39 | 0 | 0 | 0 | 39 | ||||||||||||||||||
| Purchase of treasury stock (49,294 shares) |
0 | 0 | 0 | 0 | (1,376 | ) | (1,376 | ) | ||||||||||||||||
| Issuance of treasury stock (13,140 shares) |
0 | (95 | ) | 0 | 0 | 478 | 383 | |||||||||||||||||
| Balance, December 31, 2008 |
336 | 82,555 | 21,120 | 1,369 | (2,033 | ) | 103,347 | |||||||||||||||||
| Net income |
0 | 0 | 13,373 | 0 | 0 | 13,373 | ||||||||||||||||||
| Net unrealized losses on derivatives |
0 | 0 | 0 | (833 | ) | 0 | (833 | ) | ||||||||||||||||
| Net unrealized losses on securities |
0 | 0 | 0 | (1,037 | ) | 0 | (1,037 | ) | ||||||||||||||||
| Comprehensive income |
11,503 | |||||||||||||||||||||||
| Cash dividends ($0.88 per share) |
0 | 0 | (5,636 | ) | 0 | 0 | (5,636 | ) | ||||||||||||||||
| Stock-based compensation plans: |
||||||||||||||||||||||||
| Compensation expense |
0 | 117 | 0 | 0 | 0 | 117 | ||||||||||||||||||
| Issuance of stock (14,385 shares) |
1 | 295 | 0 | 0 | 0 | 296 | ||||||||||||||||||
| Purchase of treasury stock (5,883 shares) |
0 | 0 | 0 | 0 | (71 | ) | (71 | ) | ||||||||||||||||
| Issuance of treasury stock (49,027 shares) |
0 | (72 | ) | 0 | 0 | 1,402 | 1,330 | |||||||||||||||||
| Balance, December 31, 2009 |
337 | 82,895 | 28,857 | (501 | ) | (702 | ) | 110,886 | ||||||||||||||||
| Net income |
0 | 0 | 16,581 | 0 | 0 | 16,581 | ||||||||||||||||||
| Net unrealized gains on derivatives |
0 | 0 | 0 | 599 | 0 | 599 | ||||||||||||||||||
| Net unrealized losses on securities |
0 | 0 | 0 | (186 | ) | 0 | (186 | ) | ||||||||||||||||
| Comprehensive income |
16,994 | |||||||||||||||||||||||
| Cash dividends ($0.89 per share) |
0 | 0 | (6,758 | ) | 0 | 0 | (6,758 | ) | ||||||||||||||||
| Stock-based compensation plans: |
||||||||||||||||||||||||
| Compensation expense |
0 | 388 | 0 | 0 | 0 | 388 | ||||||||||||||||||
| Issuance of stock (7,900 shares) |
0 | 150 | 0 | 0 | 0 | 150 | ||||||||||||||||||
| Issuance of stock through DRIP (28,077 shares) |
2 | 666 | 0 | 0 | 0 | 668 | ||||||||||||||||||
| Purchase of treasury stock (10,184 shares) |
0 | 0 | 0 | 0 | (221 | ) | (221 | ) | ||||||||||||||||
| Issuance of treasury stock (35,198 shares) |
0 | (99 | ) | 0 | 0 | 891 | 792 | |||||||||||||||||
| Issuance of common stock (1,481,481 shares) |
77 | 37,508 | 0 | 0 | 0 | 37,585 | ||||||||||||||||||
| Balance, December 31, 2010 |
$ | 416 | $ | 121,508 | $ | 38,680 | $ | (88 | ) | ($ | 32 | ) | $ | 160,484 | ||||||||||
The Notes to Consolidated Financial Statements are an integral part of these statements.
- 70 -
Table of Contents
Consolidated Statements of Cash Flows
ORRSTOWN FINANCIAL SERVICES, INC. AND ITS WHOLLY-OWNED SUBSIDIARY
| Years Ended December 31, | ||||||||||||
| (Dollars in thousands) |
2010 | 2009 | 2008 | |||||||||
| Cash flows from operating activities |
||||||||||||
| Net income |
$ | 16,581 | $ | 13,373 | $ | 13,103 | ||||||
| Adjustments to reconcile net income to net cash provided by operating activities: |
||||||||||||
| Amortization (accretion) of premiums (discounts) on securities available for sale |
4,151 | 1,128 | (28 | ) | ||||||||
| Depreciation and amortization |
2,924 | 2,627 | 2,322 | |||||||||
| Provision for loan losses |
8,925 | 4,865 | 1,450 | |||||||||
| Stock based compensation |
388 | 117 | 123 | |||||||||
| Net change in loans held for sale |
(2,099 | ) | 194 | 676 | ||||||||
| Net loss on disposal of other real estate owned |
74 | (9 | ) | (11 | ) | |||||||
| Write-down of other real estate owned |
123 | 0 | 0 | |||||||||
| Net (gain) loss on disposal of bank premises and equipment |
(75 | ) | 24 | (344 | ) | |||||||
| Deferred income taxes |
(2,471 | ) | (916 | ) | (667 | ) | ||||||
| Investment securities (gains) losses |
(3,636 | ) | (1,661 | ) | 27 | |||||||
| Security impairment loss |
0 | 36 | 84 | |||||||||
| (Gain) on sale of rate swap |
(778 | ) | 0 | 0 | ||||||||
| Earnings on cash surrender value of life insurance |
(1,192 | ) | (745 | ) | (683 | ) | ||||||
| Increase in accrued interest receivable |
(1,110 | ) | (622 | ) | (493 | ) | ||||||
| Increase (decrease) in accrued interest payable |
13 | (125 | ) | (7 | ) | |||||||
| Other, net |
2,990 | (5,775 | ) | (811 | ) | |||||||
| Net cash provided by operating activities |
24,808 | 12,511 | 14,741 | |||||||||
| Cash flows from investing activities |
||||||||||||
| Net (increase) decrease in interest bearing deposits with banks and other short term investments |
3,336 | (6,580 | ) | (178 | ) | |||||||
| Sales of available for sale securities |
210,687 | 76,444 | 1,860 | |||||||||
| Maturities, repayments and calls of available for sale securities |
68,412 | 74,366 | 93,772 | |||||||||
| Purchases of available for sale securities |
(515,381 | ) | (227,393 | ) | (125,683 | ) | ||||||
| Net (purchases) of FHLB & FRB Stock |
(742 | ) | (343 | ) | (1,962 | ) | ||||||
| Net (increase) in loans |
(90,538 | ) | (62,862 | ) | (120,267 | ) | ||||||
| Investment in limited partnerships |
(1,953 | ) | (1,277 | ) | 0 | |||||||
| Purchases of bank premises and equipment |
(610 | ) | (787 | ) | (7,506 | ) | ||||||
| Purchases of intangible assets |
0 | 0 | (69 | ) | ||||||||
| Proceeds from disposal of other real estate owned |
2,608 | 612 | 192 | |||||||||
| Proceeds from disposal of bank premises and equipment |
373 | 0 | 826 | |||||||||
| Proceeds from sale of rate swap |
868 | 0 | 0 | |||||||||
| Purchases of bank owned life insurance |
(1,730 | ) | (3,720 | ) | (207 | ) | ||||||
| Redemption of cash surrender value upon death |
1,476 | 0 | 176 | |||||||||
| Net cash used in investing activities |
(323,194 | ) | (151,540 | ) | (159,046 | ) | ||||||
| Cash flows from financing activities |
||||||||||||
| Net increase in deposits |
273,174 | 157,768 | 110,957 | |||||||||
| Net increase (decrease) in short term purchased funds |
(10,064 | ) | 33,907 | 5,877 | ||||||||
| Proceeds from debt |
29,800 | 27 | 49,000 | |||||||||
| Payments on debt |
(29,480 | ) | (53,456 | ) | (6,616 | ) | ||||||
| Dividends paid |
(6,758 | ) | (5,636 | ) | (5,588 | ) | ||||||
| Proceeds from issuance of common stock |
38,403 | 296 | 39 | |||||||||
| Purchase of treasury stock |
(221 | ) | (71 | ) | (1,376 | ) | ||||||
| Net proceeds from issuance of treasury stock |
792 | 1,330 | 383 | |||||||||
| Net cash provided by financing activities |
295,646 | 134,165 | 152,676 | |||||||||
| Net increase (decrease) in cash and cash equivalents |
(2,740 | ) | (4,864 | ) | 8,371 | |||||||
| Cash and cash equivalents at beginning of period |
21,940 | 26,804 | 18,433 | |||||||||
| Cash and cash equivalents at end of period |
$ | 19,200 | $ | 21,940 | $ | 26,804 | ||||||
The Notes to Consolidated Financial Statements are an integral part of these statements.
- 71 -
Table of Contents
Consolidated Statements of Cash Flows (Continued)
ORRSTOWN FINANCIAL SERVICES, INC. AND ITS WHOLLY-OWNED SUBSIDIARY
| Years Ended December 31, | ||||||||||||
| (Dollars in thousands) |
2010 | 2009 | 2008 | |||||||||
| Supplemental disclosure of cash flow information: |
||||||||||||
| Cash paid during the period for: |
||||||||||||
| Interest |
$ | 12,675 | $ | 16,625 | $ | 19,415 | ||||||
| Income Taxes |
9,400 | 4,375 | 6,425 | |||||||||
| Supplemental schedule of noncash investing and financing activities: |
||||||||||||
| Other real estate acquired in settlement of loans |
2,683 | 1,075 | 608 | |||||||||
The Notes to Consolidated Financial Statements are an integral part of these statements.
- 72 -
Table of Contents
Notes to Consolidated Financial Statements
| NOTE 1. | SUMMARY OF SIGNIFICANT ACCOUNTING POLICIES |
Nature of Operations—Orrstown Financial Services, Inc. (the Company) is a financial holding company whose primary activity consists of supervising its wholly-owned subsidiary, Orrstown Bank (the Bank). The Company operates through its office in Shippensburg, Pennsylvania. Orrstown Bank provides services through its network of offices in Franklin, Cumberland and Perry Counties of Pennsylvania and in Washington County, Maryland. The bank engages in lending services for commercial loans, residential loans, commercial mortgages and various forms of consumer lending. Deposit services include checking, savings, time and money market deposits. Orrstown Bank also provides investment and brokerage services through its Orrstown Financial Advisors division. Orrstown Bank has twenty-one branches located in Shippensburg (2), Carlisle (4), Spring Run, Orrstown, Chambersburg (3), Mechanicsburg (2), Camp Hill, Greencastle, Newport (2), Duncannon, and New Bloomfield, Pennsylvania and Hagerstown, Maryland. The Company and its subsidiary are subject to the regulation of certain federal and state agencies and undergo periodic examinations by such regulatory authorities.
Principles of Consolidation—The consolidated financial statements include the accounts of the Company and its wholly-owned subsidiary, Orrstown Bank. All significant intercompany transactions and accounts have been eliminated.
Use of Estimates—The preparation of financial statements in conformity with generally accepted accounting principles requires management to make estimates and assumptions that affect the reported amounts of assets and liabilities and disclosure of contingent assets and liabilities at the date of the financial statements and the reported amounts of revenues and expenses during the reporting period. Actual results could differ from those estimates.
Material estimates that are particularly susceptible to significant change relate to the determination of the allowance for losses on loans and the valuation of real estate acquired in connection with foreclosures or in satisfaction of loans. In connection with the determination of the allowance for losses on loans and foreclosed real estate, management obtains independent appraisals for significant properties.
While management uses available information to recognize losses on loans and foreclosed real estate; future additions to the allowances may be necessary based on changes in local economic conditions. In addition, regulatory agencies, as an integral part of their examination process, periodically review the Company’s allowance for losses on loans and foreclosed real estate. Such agencies may require the Company to recognize additions to the allowance based on their judgments concerning information available to them at the time of their examination. Because of these factors, management’s estimate of credit losses inherent in the loan portfolio and the related allowance may change in the near term.
Subsequent Events—Generally accepted accounting principles establishes standards for accounting for and disclosure of events that occur after the balance sheet date but before financial statements are issued. The subsequent events principle sets forth the period after the balance sheet date during which management of a reporting entity should evaluate events or transactions that may occur for potential recognition in the financial statements, identifies the circumstances under which an entity should recognize events or transactions occurring after the balance sheet date in its financial statements, and the disclosures that should be made about events or transactions that occur after the balance sheet date. In preparing these financial statements, the Company evaluated the events and transactions that occurred after December 31, 2010, through the date these financial statements were issued.
Concentration of Credit Risk—The Company grants agribusiness, commercial, residential and consumer loans to customers in its market area. Although the Company maintains a diversified loan portfolio, a significant portion of its customers’ ability to honor their contracts is dependent upon economic sectors for construction contractors, residential and non-residential building operators, sales finance, sub-dividers and developers. Management evaluates each customer’s creditworthiness on a case-by-case basis. The amount of collateral
- 73 -
Table of Contents
obtained, if collateral is deemed necessary by the Company upon the extension of credit, is based on management’s credit evaluation of the customer. Collateral held varies, but generally includes real estate and equipment.
The types of securities the Company invests in are included in Note 3, and the type of lending the Company engages in are included in Note 4.
Cash and Cash Equivalents—For purposes of the consolidated statements of cash flows, cash and cash equivalents include cash, balances due from banks and federal funds sold and all of which have original maturities of 90 days or less.
Restricted Investments in Bank Stocks—Restricted investment in bank stocks, which represents required investments in the common stock of correspondent banks, is carried at cost as of December 31, 2010 and 2009, and consists of common stock the Federal Reserve Bank, Atlantic Central Bankers Bank and Federal Home Loan Bank (FHLB) stocks. In December 2008, the FHLB of Pittsburgh notified member banks that it was suspending dividend payments and the repurchase of capital stock. In October 2010, the FHLB of Pittsburgh partially lifted its repurchase of capital suspension.
Management evaluates the restricted investment in bank stocks for impairment in accordance with Accounting Standard Codification (ASC) Topic 942, Accounting by Certain Entities (Including Entities with Trade Receivables) That Lend to or Finance the Activities of Others. Management’s determination of whether these investments are impaired is based on their assessment of the ultimate recoverability of their cost rather than by recognizing temporary declines in value. The determination of whether a decline affects the ultimate recoverability of their cost is influenced by criteria such as (1) the significance of the decline in net assets of the correspondent bank as compared to the capital stock amount for the correspondent bank and the length of time this situation has persisted; (2) commitments by the correspondent bank to make payments required by law or regulation and the level of such payments in relation to the operating performance of the correspondent bank, and (3) the impact of legislative and regulatory changes on institutions and, accordingly, on the customer base of the correspondent bank.
Management believes no impairment charge is necessary related to the restricted investment in bank stocks as of December 31, 2010. However, security impairment analysis is completed quarterly and the determination that no impairment had occurred as of December 31, 2010 is no assurance that impairment may not occur in the future.
Interest-Bearing Deposits in Banks—Interest bearing deposits in banks mature within one year and are carried at cost.
Loans Held for Sale—Loans originated and intended for sale in the secondary market are carried at the lower of aggregate cost or fair value (LOCM). Gains and losses on loan sales (sales proceeds minus carrying value) are recorded in non-interest income.
Securities—Certain debt securities that management has the positive intent and ability to hold to maturity are classified as “held to maturity” and recorded at amortized cost. “Trading” securities are recorded at fair value with changes in fair value included in earnings. As of December 31, 2010 and 2009 the Company has no held to maturity or trading securities. Securities not classified as held to maturity or trading, including equity securities with readily determinable fair values, are classified as “available for sale” and recorded at fair value, with unrealized gains and losses excluded from earnings and reported in other comprehensive income. Purchase premiums and discounts are recognized in interest income using the interest method over the terms of the securities. Gains and losses on the sale of securities are recorded on the trade date and are determined using the specific identification method.
- 74 -
Table of Contents
Effective April 1, 2009, the Company adopted new accounting guidance related to recognition and presentation of other-than-temporary impairment (FASB ASC 320-10). This accounting guidance amended the recognition guidance for other-than-temporary impairments of debt securities and expanded the financial statement disclosures for other-than-temporary impairment losses on debt and equity securities. The recent guidance replaced the “intent and ability” indication in prior guidance by specifying that (a) if a company does not have the intent to sell a debt security prior to recovery and (b) it is more likely than not that it will not have to sell the debt security prior to recovery, the security would not be considered other-than-temporarily impaired unless there is a credit loss. When an entity does not intend to sell the security, and it is more likely than not, the entity will not have to sell the security before recovery of its cost basis, it will recognize the credit component of an other-than-temporary impairment of a debt security in earnings and the remaining portion in other comprehensive income. For held-to-maturity debt securities, the amount of an other-than-temporary impairment recorded in other comprehensive income for the noncredit portion of a previous other-than-temporary impairment should be amortized prospectively over the remaining life of the security on the basis of the timing of future estimated cash flows of the security.
The Company had no debt securities it deemed to be other than temporarily impaired for the years ended December 31, 2010, 2009 or 2008.
Prior to the adoption of the recent accounting guidance on April 1, 2009, management considered, in determining whether other-than-temporary impairment exists, (1) the length of time and the extent to which the fair value has been less than cost, (2) the financial condition and near-term prospects of the issuer, and (3) the intent and ability of the Company to retain its investment in the issuer for a period of time sufficient to allow for any anticipated recovery in fair value.
The Company’s securities are exposed to various risks, such as interest rate, market risk, currency and credit risks. Due to the level of risk associated with certain investments and the level of uncertainty related to changes in the value of investments, it is at least reasonably possible that changes in risks in the near term would materially affect investment assets reported in the consolidated financial statements.
For equity securities, when the Company has decided to sell an impaired available-for-sale security and the entity does not expect the fair value of the security to fully recover before the expected time of sale, the security is deemed other-than-temporarily impaired in the period in which the decision to sell is made. The Company recognizes an impairment loss when the impairment is deemed other than temporary even if a decision to sell has not been made.
Loans—The Company grants commercial, mortgage, and consumer loans to its customers located principally in south-central Pennsylvania and northern Maryland. The ability of the Company’s debtors to honor their contracts is dependent upon the real estate and general economic conditions in this area.
Loans that management has the intent and ability to hold for the foreseeable future or until maturity or pay-off generally are reported at their outstanding unpaid principal balances adjusted for charge-offs, the allowance for loan losses, and any deferred fees or costs on originated loans. Interest income is accrued on the unpaid principal balance. Loan origination fees, net of certain direct origination costs, are deferred and amortized as a yield adjustment over the respective term of the loan.
The accrual of interest income on loans, including impaired loans, ceases when principal or interest is past due 90 days or more or immediately if, in the opinion of management, full collection is unlikely. Interest will continue to accrue on loans past due 90 days or more if the collateral is adequate to cover principal and interest, and the loan is in the process of collection. Interest accrued, but not collected, as of the date of placement on non accrual status, is reversed and charged against current interest income, unless fully collateralized. Subsequent payment received are either applied to the outstanding principal balance or recorded as interest income, depending upon management’s assessment of the ultimate collectability of principal. Past due status is based on contractual terms of the loan.
- 75 -
Table of Contents
Allowance for Loan Losses—The allowance for loan losses is established as losses are estimated to have occurred through a provision for loan losses charged to earnings. Loan losses are charged against the allowance when management believes the uncollectability of a loan balance is confirmed. Subsequent recoveries, if any, are credited to the allowance.
The allowance for loan losses is evaluated on a regular basis by management and is based upon management’s periodic review of the collectability of the loans in light of historical experience, the nature and volume of the loan portfolio, adverse situations that may affect the borrower’s ability to repay, estimated value of any underlying collateral and prevailing economic conditions. This evaluation is inherently subjective as it requires estimates that are susceptible to significant revision as more information becomes available.
See Note 4, “Loans Receivable and Allowance for Loan Losses,” for additional details.
Loans Serviced—The bank administers secondary market mortgage programs available through the Federal Home Loan Bank of Pittsburgh and the Federal National Mortgage Association and offers residential mortgage products and services to customers. The Bank originates single-family residential mortgage loans for immediate sale in the secondary market, and retains the servicing of those loans. At December 31, 2010, 2009 and 2008 the balance of loans serviced for others was and $240,696,000, $183,663,000, $121,099,000, respectively.
Transfers of Financial Assets—Transfers of financial assets are accounted for as sales when control over the assets has been surrendered. Control over transferred assets is deemed to be surrendered when (1) the assets have been isolated from the Company, (2) the transferee obtains the right (free of conditions that constrain it from taking advantage of that right) to pledge or exchange the transferred assets, and (3) the Company does not maintain effective control over the transferred assets through an agreement to repurchase them before their maturity.
Premises and Equipment—Buildings, improvements, equipment, furniture and fixtures are carried at cost less accumulated depreciation and amortization. Land is carried at cost. Depreciation and amortization has been provided generally on the straight-line method and is computed over the estimated useful lives of the various assets as follows: buildings and improvements—10 to 40 years; equipment, furniture and fixtures—3 to 15 years; and computer software—3 years. Repairs and maintenance are charged to operations as incurred, while major additions and improvements are capitalized. Gain or loss on retirement or disposal of individual assets is recorded as income or expense in the period of retirement or disposal.
Goodwill and Other Intangible Assets—Goodwill represents the cost of acquired companies in excess of the fair value of their net assets at the date of acquisition. Goodwill is evaluated at least annually for impairment.
Intangible assets represent purchased assets that lack physical substance but can be distinguished from goodwill because of contractual or other legal rights. The Company’s intangible assets have finite lives and are amortized, on a straight line basis, over their estimated lives, generally 10 years for deposit premiums and 15 years for customer lists.
Mortgage Servicing Rights—The estimated fair value of mortgage servicing rights (MSRs) related to loans sold and serviced by the Company is recorded as an asset upon the sale of such loan. MSRs are amortized as a reduction to servicing income over the estimated lives of the underlying loans. MSRs are evaluated periodically for impairment, by comparing the carrying amount to estimated fair value. Fair value is determined periodically through a discounted cash flows valuation performed by a third party. Significant inputs to the valuation include expected servicing income, net of expense, the discount rate and the expected life of the underlying loans. To the extent the amortized cost of the MSRs exceeds their estimated fair values; a valuation allowance is established for such impairment through a charge against servicing income on the consolidated statement of income. If the Company determines, based on subsequent valuations, that impairment no longer exists or is reduced, the valuation allowance is reduced through a credit to earnings.
- 76 -
Table of Contents
Foreclosed Real Estate—Real estate properties acquired through, or in lieu of, loan foreclosure are to be sold and are initially recorded at the lower of carrying value or fair value less estimated costs to sell the underlying collateral. Capitalized costs include accrued interest and any costs that significantly improve the value of the properties. After foreclosure, valuations are periodically performed by management and the real estate is carried at the lower of carrying amount or fair value less estimated cost to sell. Foreclosed real estate totaled $1,112,000 and $1,065,000 as of December 31, 2010 and 2009 and is included in other assets.
Investments in Real Estate Partnerships—The Company currently has a 99% limited partner interest in several real estate partnerships in central Pennsylvania. These investments are affordable housing projects which entitle the Company to tax deductions and credits that expire through 2021. The Company accounts for its investments in affordable housing projects under the equity method of accounting, and recognizes tax credits when they become available. The recorded investment in these real estate partnerships totaled $4,665,000 and $3,200,000 as of December 31, 2010 and 2009 and are included in other assets in the balance sheet. Losses of $481,000, $315,000 and $244,000 were recorded for the years ended December 31, 2010, 2009 and 2008. During 2010, 2009 and 2008, the Company recognized federal tax credits from the projects totaling $394,000, $301,000 and $94,000.
Advertising—The Company follows the policy of charging costs of advertising to expense as incurred. Advertising expense was $456,000, $541,000 and $578,000, for the years ended December 31, 2010, 2009 and 2008.
Stock Compensation Plans—The Company has two stock option plans; one for employees and a second for non-employee directors. Stock compensation accounting guidance (FASB ASC 718, Compensation—Stock Compensation) requires that the compensation cost relating to share-based payment transactions be recognized in financial statements. That cost is measured based on the grant date fair value of the stock options, using a Black-Scholes model. Compensation cost for all stock awards are calculated and recognized over the employees’ service period, generally defined as the vesting period.
Income Taxes—The Company accounts for Income Taxes in accordance with income tax accounting guidance (FASB ASC 740, Income Taxes). The income tax accounting guidance results in two components of income tax expense: current and deferred. Current income tax expense reflects taxes to be paid or refunded for the current period by applying the provisions of the enacted tax law to the taxable income or excess of deductions over revenues. The Company determines deferred income taxes using the liability (or balance sheet) method. Under this method, the net deferred tax asset or liability is based on the tax effects of the differences between the book and tax bases of assets and liabilities, and enacted changes in tax rates and laws are recognized in the period in which they occur.
Deferred income tax expense results from changes in deferred tax assets and liabilities between periods. Deferred tax assets are recognized if it is more likely than not, based on the technical merits, that the tax position will be realized or sustained upon examination. The term more likely than not means a likelihood of more than 50 percent; the terms examined and upon examination also include resolution of the related appeals or litigation processes, if any. A tax position that meets the more-likely-than-not recognition threshold is initially and subsequently measured as the largest amount of tax benefit that has a greater than 50 percent likelihood of being realized upon settlement with a taxing authority that has full knowledge of all relevant information. The determination of whether or not a tax position has met the more-likely-than-not recognition threshold considers the facts, circumstances, and information available at the reporting date and is subject to management’s judgment. Deferred tax assets are reduced by a valuation allowance if, based on the weight of evidence available, it is more likely than not that some portion or all of a deferred tax asset will not be realized. The Company recognizes interest and penalties, if any, on income taxes as a component of income tax expense.
Treasury Stock—Common stock shares repurchased are recorded as treasury stock at cost.
- 77 -
Table of Contents
Earnings Per Share—Basic earnings per share represent income available to common stockholders divided by the weighted-average number of common shares outstanding during the period. Diluted earnings per share reflect the additional common shares that would have been outstanding if dilutive potential common shares had been issued. Potential common shares that may be issued by the Company relate solely to outstanding stock options. Beginning in 2010, potential common shares that may be issued by the Company were determined using the treasury stock method for all periods presented. On prior annual financial statements, all outstanding stock options were considered fully dilutive by the Company in calculating diluted earnings per share.
Treasury shares are not deemed outstanding for earnings per share calculations.
Comprehensive Income—Comprehensive income consists of net income and other comprehensive income. Other comprehensive income includes unrealized gains on securities available for sale, and unrealized losses related to factors other than credit on debt securities and unrealized gains and losses on cash flow hedges.
Fair Value of Financial Instruments—Fair values of financial instruments are estimated using relevant market information and other assumptions, as more fully disclosed in Note 20. Fair value estimates involve uncertainties and matters of significant judgment. Changes in assumptions or in market conditions could significantly affect the estimates.
Segment Reporting—The Company only operates in one significant segment—Community Banking. The Company’s non-banking activities are insignificant to the consolidated financial statements.
Reclassifications—Certain amounts in the 2009 and 2008 consolidated financial statements have been reclassified to conform to the 2010 presentation.
Recent Accounting Pronouncements
In June 2009, the Financial Accounting Standards Board (FASB) issued new guidance relating to the accounting for transfers of financial assets. The new guidance, which was issued as FASB Statement No. 166, Accounting for Transfers of Financial Assets, an amendment to SFAS No. 140, was adopted into Codification in December 2009 through the issuance of Accounting Standards Update (ASU) 2009-16. The new standard provides guidance to improve the relevance, representational faithfulness, and comparability of the information that an entity provides in its financial statements about a transfer of financial assets; the effects of a transfer on its financial position, financial performance, and cash flows; and a transferor’s continuing involvement, if any, in transferred financial assets. ASU 2009-16 was effective for transfers on or after January 1, 2010. The adoption of the new guidance did not have a material impact on the Company’s consolidated financial statements.
In June 2009, the FASB issued new guidance relating to variable interest entities. The new guidance, which was issued as FASB Statement No. 167, Amendments to FASB Interpretation No. 46(R), was adopted into Codification in December 2009. The objective of the guidance is to improve financial reporting by enterprises involved with variable interest entities and to provide more relevant and reliable information to users of financial statements. This guidance was effective as of January 1, 2010. The adoption of the new guidance did not have a material impact on the Company’s consolidated financial statements.
In January 2010, the FASB issued ASU 2010-04, Accounting for Various Topics—Technical Corrections to SEC Paragraphs. ASU 2010-04 makes technical corrections to existing SEC guidance including the following topics: accounting for subsequent investments, determination of an interest rate swap, issuance of financial statements—subsequent events, use of residential method to value acquired assets other than goodwill, adjustments in assets and liabilities for holding gains and losses, and selections of discount rate used for measuring defined benefit obligation. The adoption of the new guidance did not have a material impact on the Company’s consolidated financial statements.
- 78 -
Table of Contents
In January 2010, the FASB issued ASU 2010-06, Fair Value Measurements and Disclosures (Topic 820): Improving Disclosures about Fair Value Measurements. ASU 2010-06 amends Subtopic 820-10 to clarify existing disclosures, require new disclosures, and includes conforming amendments to guidance on employers’ disclosures about postretirement benefit plan assets. ASU 2010-06 is effective for interim and annual periods beginning after December 15, 2009, except for disclosures about purchases, sales, issuances, and settlements in the roll forward of activity in Level 3 fair value measurements. Those disclosures are effective for fiscal years beginning after December 15, 2010 and for interim periods within those fiscal years. The adoption of the new guidance did not have a material impact on the Company’s consolidated financial statements.
In July 2010, the FASB issued ASU 2010-20, Disclosures about the Credit Quality of Financing Receivables and the Allowance for Credit Losses. The new disclosure guidance significantly expands the existing requirements leading to greater transparency into the company’s exposure to credit losses from lending arrangements. The extensive new disclosures of information as of the end of a reporting period become effective for annual reporting periods ending on or after December 15, 2010 and has been adopted and presented in Note 4 to the Consolidated Financial Statements. Specific disclosures regarding activity that occurred before the issuance of the ASU, such as the allowance roll forward and modification disclosures will be required for periods beginning on or after December 15, 2010.
In December 2010, the FASB issued ASU 2010-28, Intangibles—Goodwill and Other (Topic 350), When to Perform Step 2 of the Goodwill Impairment Test for Reporting Units with Zero or Negative Carrying Amounts. ASU 2010-28 affects all entities that have recognized goodwill and have one or more reporting units whose carrying amount for purposes of performing Step 1 of the goodwill impairment test is zero or negative. ASU 2010-28 modifies Step 1 so that for those reporting units, an entity is required to perform Step 2 of the goodwill impairment test if it is more likely than not that a goodwill impairment exists. In determining whether it is more likely than not that a goodwill impairment exists, an entity should consider whether there are any adverse qualitative factors indicating that impairment may exist. The qualitative factors are consistent with existing guidance, which requires that goodwill of a reporting unit be tested for impairment between annual tests if an event occurs or circumstances change that would more likely than not reduce the fair value of a reporting unit below its carrying amount. This guidance is effective for the Company for fiscal years, and interim periods within those years, beginning after December 15, 2010. Adoption of ASU 2010-28 is not expected to have a significant impact on our consolidated financial statements.
| NOTE 2. | RESTRICTIONS ON CASH AND DUE FROM BANKS |
The Company maintains deposit balances at two correspondent banks which provide check collection and item processing services to the Company. The average balances that are to be maintained either on hand or with the correspondent banks amounted to $814,000 at December 31, 2010.
The balances with these correspondent banks, at times, exceed federally insured limits; however management considers this to be a normal business risk.
- 79 -
Table of Contents
| NOTE 3. | SECURITIES AVAILABLE FOR SALE |
At December 31, 2010 and 2009 the investment securities portfolio was comprised of securities classified as available for sale, resulting in investment securities being carried at fair value. The amortized cost and fair values of investment securities available for sale at December 31 were:
| (Dollars in thousands) |
Amortized Cost |
Unrealized Gains |
Unrealized Losses |
Fair Value | ||||||||||||
| December 31, 2010 |
||||||||||||||||
| U.S. Government Sponsored Enterprises (GSE) |
$ | 120,318 | $ | 1,491 | $ | 1,523 | $ | 120,286 | ||||||||
| States and political subdivisions |
98,133 | 566 | 1,551 | 97,148 | ||||||||||||
| GSE residential mortgage-backed securities |
212,260 | 960 | 1,044 | 212,176 | ||||||||||||
| Total debt securities |
430,711 | 3,017 | 4,118 | 429,610 | ||||||||||||
| Equity securities |
2,114 | 93 | 45 | 2,162 | ||||||||||||
| Totals |
$ | 432,825 | $ | 3,110 | $ | 4,163 | $ | 431,772 | ||||||||
| December 31, 2009 |
||||||||||||||||
| U.S. Government Sponsored Enterprises (GSE) |
$ | 120,772 | $ | 160 | $ | 1,516 | $ | 119,416 | ||||||||
| States and political subdivisions |
36,867 | 760 | 243 | 37,384 | ||||||||||||
| GSE residential mortgage-backed securities |
37,489 | 637 | 253 | 37,873 | ||||||||||||
| Total debt securities |
195,128 | 1,557 | 2,012 | 194,673 | ||||||||||||
| Equity securities |
1,894 | 2 | 316 | 1,580 | ||||||||||||
| Totals |
$ | 197,022 | $ | 1,559 | $ | 2,328 | $ | 196,253 | ||||||||
The following table shows gross unrealized losses and fair value of the Company’s available for sale securities that are not deemed to be other-than-temporarily impaired, aggregated by investment category and length of time that individual securities have been in a continuous unrealized loss position at December 31:
| Less Than 12 Months | 12 Months or More | Total | ||||||||||||||||||||||
| (Dollars in thousands) |
Fair Value | Unrealized Losses |
Fair Value | Unrealized Losses |
Fair Value | Unrealized Losses |
||||||||||||||||||
| December 31, 2010 |
||||||||||||||||||||||||
| U.S. Government Sponsored Enterprises (GSE) |
$ | 44,737 | $ | 1,523 | $ | 0 | $ | 0 | $ | 44,737 | $ | 1,523 | ||||||||||||
| States and political subdivisions |
61,718 | 1,303 | 1,026 | 248 | 62,744 | 1,551 | ||||||||||||||||||
| GSE residential mortgage-backed securities |
124,685 | 1,044 | 0 | 0 | 124,685 | 1,044 | ||||||||||||||||||
| Total debt securities |
231,140 | 3,870 | 1,026 | 248 | 232,166 | 4,118 | ||||||||||||||||||
| Equity securities |
312 | 12 | 312 | 33 | 624 | 45 | ||||||||||||||||||
| Total temporarily impaired securities |
$ | 231,452 | $ | 3,882 | $ | 1,338 | $ | 281 | $ | 232,790 | $ | 4,163 | ||||||||||||
| December 31, 2009 |
||||||||||||||||||||||||
| U.S. Government Sponsored Enterprises (GSE) |
$ | 96,673 | $ | 1,516 | $ | 0 | $ | 0 | $ | 96,673 | $ | 1,516 | ||||||||||||
| States and political subdivisions |
9,889 | 98 | 483 | 145 | 10,372 | 243 | ||||||||||||||||||
| GSE residential mortgage-backed securities |
10,913 | 253 | 0 | 0 | 10,913 | 253 | ||||||||||||||||||
| Total debt securities |
117,475 | 1,867 | 483 | 145 | 117,958 | 2,012 | ||||||||||||||||||
| Equity securities |
182 | 3 | 979 | 313 | 1,161 | 316 | ||||||||||||||||||
| Total temporarily impaired securities |
$ | 117,657 | $ | 1,870 | $ | 1,462 | $ | 458 | $ | 119,119 | $ | 2,328 | ||||||||||||
- 80 -
Table of Contents
The Company has 126 securities and 98 securities at December 31, 2010 and 2009 in which the amortized cost exceeds their values, as discussed below.
U.S. Government Sponsored Enterprises (GSE). 50 GSE securities have amortized costs which exceed their fair values, all of which are in the less than 12 months at December 31, 2010. At December 31, 2009, the Company had 50 GSE with unrealized losses, all of which are less than 12 months. These unrealized losses have been caused by a rise in interest rates from the time the securities were purchased. The contractual terms of those investments do not permit the issuer to settle the securities at a price less than the amortized cost bases of the investments. Because the Company does not intend to sell the investments and it is not more likely than not that the Company will be required to sell the investments before recovery of their amortized cost bases, which may be maturity, the Company does not consider these investments to be other-than-temporarily impaired at December 31, 2010 or 2009.
State and Political Subdivisions. 63 state and political subdivision securities have amortized cost which exceeds their fair value, including 3 of which have been for greater than 12 months at December 31, 2010. At December 31, 2009, 11 state and political subdivisions had unrealized losses, 1 of which was greater than 12 months. These unrealized losses have been caused by a rise in interest rates from the time the securities were purchased. All but two state and political subdivision securities in which the amortized cost exceeds fair value have investment grade ratings. The two without investment grade ratings have had an unrealized loss for less than 12 months, and the unrealized loss is less than 0.50% of carrying value. Management considers the investment rating, the state of the issuer of the security and other credit support in determining whether the security is other-than-temporarily impaired. One security which has had an unrealized loss for over 24 months at December 31, 2010 is a California issue that is carrying a low market value due to it being a zero coupon bond, which is hindered by the state’s economic issues, and not the underlying credit worthiness of the issuer. This security carries an investment grade rating. Because the Company does not intend to sell the investments and it is not more likely than not that the Company will be required to sell the investments before recovery of their amortized cost bases, which may be maturity, the Company does not consider these investments to be other-than-temporarily impaired at December 31, 2010.
Equity Securities. 13 equity securities have cost which exceeds their fair value, including 7 of which has been greater than 12 month at December 31, 2010. These securities are among various industries, including financial, industrial, consumer, energy, health care and a large cap fund, In considering whether the equity securities are other-than-temporarily impaired, management reviews the severity and duration of decline in fair value, research reports, analysts recommendations, credit rating changes, news stories and other relevant information. Management believes the equity securities are not other-than-temporarily impaired and will equal or exceed our cost basis within a reasonable period of time. None of the individual unrealized losses exceed $10,000 at December 31, 2010. At December 31, 2009, 37 equity securities had unrealized losses, of which 33 had unrealized losses for greater than 12 months. 12 of these 33 securities were financial institution securities; management’s approach to these bank holdings was to consider those trading under their book value as temporarily impaired due to extreme market conditions within the financial sector. We also considered the ability to continue paying dividends as a factor in the long-term worth of these securities. 21 of the 33 equity securities were non-financials or industrial securities; and management continued to view these companies as valuable long-term holdings in the diversified portfolio. Factors considered were earnings, the ability to pay a dividend, and the outlook for recovery in the industrial sector long-term. Since these companies are considered viable and carry the possibility of price appreciation in the future, impairments are considered temporary. The Company recorded $0, $36,000 and $84,000 of other than temporary impairment expense on equity securities for the years ended December 31, 2010, 2009 and 2008.
The amortized cost and fair values of securities available for sale at December 31, 2010 by contractual maturity are shown below. Contractual maturities will differ from expected maturities because borrowers may have the right to call or prepay obligations with or without call or prepayment penalties.
- 81 -
Table of Contents
INVESTMENT PORTFOLIO
| (Dollars in thousands) |
Amortized Cost | Fair Value | ||||||
| Due in one year or less |
$ | 11,256 | $ | 11,290 | ||||
| Due after one year through five years |
21,795 | 21,930 | ||||||
| Due after five years through ten years |
104,858 | 105,004 | ||||||
| Due after ten years |
80,542 | 79,210 | ||||||
| GSE residential mortgage-backed securities |
212,260 | 212,176 | ||||||
| Total debt securities |
430,711 | 429,610 | ||||||
| Equity securities |
2,114 | 2,162 | ||||||
| $ | 432,825 | $ | 431,772 | |||||
Proceeds from sales of securities available for sale for the years ended December 31, 2010, 2009 and 2008 were $210,687,000, $76,444,000 and $1,860,000. Gross gains on the sales of securities were $3,811,000, $2,558,000 and $276,000 for the years ended December 31, 2010, 2009 and 2008. Gross losses on securities available for sale were $175,000, $897,000 and $303,000.
Securities with a fair value of $271,689,000 and $143,984,000 at December 31, 2010 and 2009 were pledged to secure public funds and for other purposes as required or permitted by law.
| NOTE 4. | LOANS RECEIVABLE AND ALLOWANCE FOR LOAN LOSSES |
The Bank’s loan portfolio is broken down into segments to an appropriate level of disaggregation to allow management to monitor the performance by the borrower and to monitor the yield on the portfolio. In 2010, management incorporated the provisions of ASU 2010-20, Disclosures about the Credit Quality of Financing Receivables and the Allowance for Loan Losses, resulting in a refinement in its portfolio segregation. Consistent with the standard, the segments were further broken down into classes, to allow for differing risk characteristics within a segment. Balances as of December 31, 2009 have been reclassified to be consistent with 2010’s presentation.
Management feels that non-owner occupied commercial real estate, consisting of nonresidential properties; pose a greater risk than owner-occupied and multi-family residential properties. Likewise, a 1-4 family residential construction class is broken out of the acquisition and development loan segment, leaving a commercial and land development class that presents a higher risk profile. In commercial and land development projects, many times the ultimate buyer of the property is not known at the time the project is started, and cannot generally be subdivided into smaller parcels to diversify the developer’s risk. First lien residential mortgage loans generally are less susceptible to loss than home equity loans, which generally have higher loan-to-values associated with them.
- 82 -
Table of Contents
The loan portfolio, excluding residential loans held for sale, broken out by classes as of December 31 is as follows:
| (Dollars in thousands) |
2010 | 2009 | ||||||
| Commercial real estate: |
||||||||
| Owner-occupied |
$ | 172,000 | $ | 149,149 | ||||
| Non-owner occupied |
143,372 | 122,287 | ||||||
| Multi-family |
24,649 | 24,898 | ||||||
| Acquisition and development: |
||||||||
| 1-4 family residential construction |
29,297 | 21,977 | ||||||
| Commercial and land development |
88,105 | 88,902 | ||||||
| Commercial and industrial |
263,943 | 246,335 | ||||||
| Residential mortgage: |
||||||||
| First lien |
119,450 | 100,413 | ||||||
| Home equity—term |
40,818 | 55,993 | ||||||
| Home equity—Lines of credit |
71,547 | 58,146 | ||||||
| Installment and other loans |
11,112 | 12,380 | ||||||
| $ | 964,293 | $ | 880,480 | |||||
In order to monitor ongoing risk associated with its loan portfolio and specific credits within the segments, management uses an eight point internal grading system. The first four rating categories, representing the lowest risk to the bank, are combined and given a “Pass” rating. The “Special Mention” category includes loans that have potential weaknesses that may, if not monitored or corrected, weaken the asset or inadequately protect the Bank’s position at some future date. These assets pose elevated risk, but their weakness does not yet justify a more severe, or criticized rating. Bank’s management generally follows regulatory definitions in assigning criticized ratings to loans, including substandard, doubtful or loss. “Substandard” loans are classified as they have a well-defined weakness, or weaknesses that jeopardize the liquidation of the debt. These loans are characterized by the distinct possibility that the Bank will sustain some loss if the deficiencies are not corrected. Generally loans greater than 90 days past due are assigned a “substandard” rating. A “doubtful” loan has a high probability of total or substantial loss, but because of specific pending events that may strengthen the asset, its classification of loss is deferred. “Loss” assets are considered uncollectible, as the underlying borrowers are often in bankruptcy, have suspended debt repayments, or ceased business operations. Once a loan is classified as “Loss”, there is little prospect of collecting the loan’s principal or interest and it is generally written off.
The Bank has a loan review policy and program which is designed to reduce and control risk in the lending function. The Credit Administration Committee, comprised of members of the Board, is charged with the overall credit quality and risk exposure of the Company’s loan portfolio. This includes the monitoring of the lending activities of all bank personnel with respect to underwriting and processing new loans and the timely follow-up and corrective action for loans showing signs of deterioration in quality. The loan review program provides the Bank with an internal, independent review of the Bank’s loan portfolio on an ongoing basis. Generally, consumer and residential mortgage loans are included in the Pass categories unless a specific action, such as extended delinquencies, bankruptcy, repossession or death of the borrower occurs, which heightens awareness as to a possible credit event.
The Loan Review department performs annual reviews of all commercial relationships with a committed loan balance in excess of $750,000, with ratification of the rating from the Board of Directors’ Credit Administration Committee for loans between $750,000-$1,000,000. Loans reviewed in excess of $1,000,000 are presented to the Credit Administration Committee with a formal review and rating. All relationships rated Substandard, Doubtful or Loss are reviewed by the Credit Administration Committee on a quarterly basis, including reaffirmation of the rating, review of detailed collateral analysis and the development of an action plan.
- 83 -
Table of Contents
The following summarizes the Bank’s ratings based on its internal risk rating system as of December 31, 2010:
| (Dollars in thousands) |
Pass | Special Mention |
Substandard | Doubtful | Loss | Total | ||||||||||||||||||
| Commercial real estate: |
||||||||||||||||||||||||
| Owner-occupied |
$ | 162,968 | $ | 2,035 | $ | 6,311 | $ | 686 | $ | — | $ | 172,000 | ||||||||||||
| Non-owner occupied |
120,633 | 4,274 | 18,465 | — | — | 143,372 | ||||||||||||||||||
| Multi-family |
20,030 | 676 | 3,853 | 90 | 24,649 | |||||||||||||||||||
| Acquisition and development: |
||||||||||||||||||||||||
| 1-4 family residential construction |
24,199 | 2,297 | 2,801 | — | — | 29,297 | ||||||||||||||||||
| Commercial and land development |
79,391 | 2,487 | 6,227 | — | — | 88,105 | ||||||||||||||||||
| Commercial and industrial |
221,111 | 17,062 | 24,762 | 1,008 | — | 263,943 | ||||||||||||||||||
| Residential mortgage: |
||||||||||||||||||||||||
| First lien |
117,607 | — | 1,843 | 119,450 | ||||||||||||||||||||
| Home equity—term |
39,279 | — | 1,539 | — | — | 40,818 | ||||||||||||||||||
| Home equity—lines of credit |
71,364 | — | 183 | — | — | 71,547 | ||||||||||||||||||
| Installment and other loans |
11,062 | — | 50 | — | — | 11,112 | ||||||||||||||||||
| $ | 867,644 | $ | 28,831 | $ | 66,034 | $ | 1,784 | $ | — | $ | 964,293 | |||||||||||||
Classified loans may also be evaluated for impairment. A loan is considered impaired when, based on current information and events, it is probable that the Bank will be unable to collect the scheduled payments of principal or interest when due according to the contractual terms of the loan agreement. Factors considered by management in determining impairment include payment status, collateral value, and the probability of collecting scheduled principal and interest payments when due. Loans that experience insignificant payment delays and payment shortfalls generally are not classified as impaired. Management determines the significance of payment delays and payment shortfalls on a case-by-case basis, taking into consideration all of the circumstances surrounding the loan and the borrower, including the length of the delay, the reasons for the delay, the borrower’s prior payment record, and the amount of the shortfall in relation to the principal and interest owed. Impairment is measured on a loan-by-loan basis for commercial, construction and restructured loans by either the present value of the expected future cash flows discounted at the loan’s effective interest rate, the loan’s obtainable market price, or the fair value of the collateral if the loan is collateral dependent. During the year, the Bank modified its criteria for identifying impaired loans, as performing substandard loans were no longer considered impaired.
Larger groups of smaller balance homogenous loans are collectively evaluated for impairment. Accordingly, the Bank does not separately identify individual consumer and residential loans for impairment disclosures, unless such loans are the subject of a restructuring agreement due to financial difficulties of the borrower.
- 84 -
Table of Contents
The following summarizes impaired loans by class, segregated by those for which a specific allowance was required and those for which a specific allowance was not required as of December 31:
| Impaired Loans with a Specific Allowance | Impaired Loans with No Specific Allowance | |||||||||||||||||||||||||||
| (Dollars in thousands) |
Recorded Investment (Book Balance) |
Unpaid Principal Balance (Legal Balance) |
Related Allowance |
Interest Income Recognized on Cash Basis |
Recorded Investment (Book Balance) |
Unpaid Principal Balance (Legal Balance) |
Interest Income Recognized on Cash Basis |
|||||||||||||||||||||
| December 31, 2010 |
||||||||||||||||||||||||||||
| Commercial real estate: |
||||||||||||||||||||||||||||
| Owner-occupied |
$ | 686 | $ | 687 | $ | 181 | $ | 0 | $ | 0 | $ | 0 | $ | 0 | ||||||||||||||
| Non-owner occupied |
2,064 | 2,065 | 980 | 0 | 0 | 0 | 0 | |||||||||||||||||||||
| Multi-family |
90 | 90 | 90 | 0 | 0 | 0 | 0 | |||||||||||||||||||||
| Commercial and industrial |
9,600 | 10,191 | 3,232 | 0 | 1,118 | 1,118 | 6 | |||||||||||||||||||||
| Residential mortgage: |
||||||||||||||||||||||||||||
| First lien |
470 | 470 | 12 | 32 | 0 | 0 | 0 | |||||||||||||||||||||
| Home equity—term |
711 | 711 | 8 | 44 | 0 | 0 | 0 | |||||||||||||||||||||
| $ | 13,621 | $ | 14,214 | $ | 4,503 | $ | 76 | $ | 1,118 | $ | 1,118 | $ | 6 | |||||||||||||||
| Impaired Loans with Specific Allowance |
Impaired Loans with No Specific Allowance |
|||||||||||
| (Dollars in thousands) |
Recorded Investment |
Related Allowance |
||||||||||
| December 31, 2009 |
||||||||||||
| Commercial real estate: |
||||||||||||
| Owner-occupied |
$ | 2,399 | $ | 214 | $ | 4,192 | ||||||
| Non-owner occupied |
1,267 | 537 | 934 | |||||||||
| Multi-family |
642 | 15 | 114 | |||||||||
| Acquisition and development: |
||||||||||||
| 1-4 family residential construction |
— | — | — | |||||||||
| Commercial and land development |
5,063 | 2,000 | 3,191 | |||||||||
| Commercial and industrial |
6,132 | 2,035 | 7,766 | |||||||||
| $ | 15,503 | $ | 4,801 | $ | 16,197 | |||||||
The following summarizes the average recorded investment in impaired loans and related interest income recognized for the periods indicated for the years ending December 31:
| (Dollars in thousands) |
2010 | 2009 | 2008 | |||||||||
| Average investment in impaired loans |
$ | 26,066 | $ | 10,748 | $ | 1,815 | ||||||
| Interest income recognized on a cash basis on impaired loans |
82 | 188 | 104 | |||||||||
The following presents impaired loans that are troubled debt restructurings as of December 31, 2010. The Bank did not have any trouble debt restructurings at December 31, 2009.
| Troubled Debt Restructurings at December 31, 2010 |
New Troubled Debt Restructurings During Current YTD Period |
|||||||||||||||
| (Dollars in thousands) |
Number of Contracts |
Recorded Investment |
Number of Contracts |
Recorded Investment |
||||||||||||
| Residential mortgage: |
||||||||||||||||
| First lien |
1 | $ | 470 | 1 | $ | 470 | ||||||||||
| Home equity—term |
1 | 711 | 1 | 711 | ||||||||||||
| 2 | $ | 1,181 | 2 | $ | 1,181 | |||||||||||
- 85 -
Table of Contents
No additional commitments have been made to borrowers whose loans are considered trouble debt restructurings.
Management further monitors the performance and credit quality of the loan portfolio by analyzing the length of time a portfolio is past due, by aggregating loans based on its delinquencies. The following table presents the classes of loan portfolio summarized by aging categories of performing loans and nonaccrual loans as of December 31, 2010:
| Days Past Due | ||||||||||||||||||||||||||||
| (Dollars in thousands) |
Current | 30-59 | 60-89 | 90+ (still accruing) |
Total Past Due (still accruing) |
Non-Accrual | Total Loans |
|||||||||||||||||||||
| Commercial real estate: |
||||||||||||||||||||||||||||
| Owner-occupied |
$ | 169,030 | $ | 986 | $ | 832 | $ | 466 | $ | 2,284 | $ | 686 | $ | 172,000 | ||||||||||||||
| Non-owner occupied |
141,095 | 213 | — | — | 213 | 2,064 | 143,372 | |||||||||||||||||||||
| Multi-family |
24,559 | — | — | — | — | 90 | 24,649 | |||||||||||||||||||||
| Acquisition and development: |
||||||||||||||||||||||||||||
| 1-4 family residential construction |
29,297 | — | — | — | — | — | 29,297 | |||||||||||||||||||||
| Commercial and land development |
87,995 | 1 | 16 | — | 17 | 93 | 88,105 | |||||||||||||||||||||
| Commercial and industrial |
252,144 | 287 | 466 | 420 | 1,173 | 10,625 | 263,943 | |||||||||||||||||||||
| Residential mortgage: |
||||||||||||||||||||||||||||
| First lien |
116,182 | 1,359 | 535 | 1,095 | 2,989 | 279 | 119,450 | |||||||||||||||||||||
| Home equity—term |
40,503 | 161 | 62 | 75 | 298 | 17 | 40,818 | |||||||||||||||||||||
| Home equity—Lines of credit |
71,215 | 60 | 89 | 142 | 291 | 41 | 71,547 | |||||||||||||||||||||
| Installment and other loans |
10,793 | 251 | 17 | 50 | 318 | 1 | 11,112 | |||||||||||||||||||||
| $ | 942,813 | $ | 3,318 | $ | 2,017 | $ | 2,248 | $ | 7,584 | $ | 13,896 | $ | 964,293 | |||||||||||||||
As of December 31, 2009, loans 90 days or more past due and still accruing and nonaccrual loans were $6,155,000 and $4,267,000.
The Bank maintains the allowance for loan losses at a level believed adequate by management to absorb losses inherent in the portfolio. It is established and maintained through a provision for loan losses charged to earnings. Quarterly, management asses the adequacy of the allowance for loan losses utilizing a defined methodology, which considers specific credit evaluation of impaired loans as discussed above, past loan loss historical experience, and qualitative factors. Management believes the approach properly addresses the requirements of ASC Section 310-10-35 for loans individually identified as impaired, and ASC Subtopic 450-20 for loans collectively evaluated for impairment, and other bank regulatory guidance.
General allowances are provided for loans that are collectively evaluated for impairment, which is based on quantitative factors, principally historical loss trends for the respective loan class, adjusted for qualitative factors. As of December 31, 2010, the historical loss trend is based on rolling 8 quarters with a two-third weight to the most recent four quarters, and a one-third weight for the furthest four quarters. Prior to December 31, 2010, the historical loss factor was based on an equally weighted rolling 12 quarters. Additional qualitative factors are used by management to adjust the historical loss percentage to the anticipated losses within the portfolio, and include: national and local economic trends, levels and trends of delinquency rates and nonaccrual loans; effects of changes in underwriting policies; experience, ability and depth of lending and loan review staff, trends in values of underlying collateral including the real estate market; and concentrations of credit from loan type, or shifts in industry or geographic region.
- 86 -
Table of Contents
Activity in the allowance for loan losses for the years ended December 31 is as follows:
| (Dollars in thousands) |
2010 | 2009 | 2008 | |||||||||
| Balance, beginning of year |
$ | 11,067 | $ | 7,140 | $ | 6,141 | ||||||
| Provision for loan losses |
8,925 | 4,865 | 1,450 | |||||||||
| Charge-offs |
(4,067 | ) | (958 | ) | (497 | ) | ||||||
| Recoveries |
95 | 20 | 46 | |||||||||
| Balance, end of year |
$ | 16,020 | $ | 11,067 | $ | 7,140 | ||||||
The following summarizes the ending loan balance individually or collectively evaluated for impairment based upon loan type, as well as the allowance for loan loss allocation for each at December 31, 2010.
| Ending Loan Balance | Allowance for Loan Losses Ending Balance for |
|||||||||||||||||||||||
| Individually Evaluated for Impairment |
Collectively Evaluated for Impairment |
Total | Loans Individually Evaluated for Impairment |
Loans Collectively Evaluated for Impairment |
Total | |||||||||||||||||||
| Commercial real estate: |
||||||||||||||||||||||||
| Owner-occupied |
$ | 686 | $ | 171,314 | $ | 172,000 | $ | 181 | $ | 1,671 | $ | 1,852 | ||||||||||||
| Non-owner occupied |
2,064 | 141,308 | 143,372 | 980 | 2,054 | 3,034 | ||||||||||||||||||
| Multi-family |
90 | 24,559 | 24,649 | 90 | 348 | 438 | ||||||||||||||||||
| Acquisition and development: |
||||||||||||||||||||||||
| 1-4 family residential construction |
— | 29,297 | 29,297 | — | 314 | 314 | ||||||||||||||||||
| Commercial and land development |
— | 88,105 | 88,105 | — | 1,453 | 1,453 | ||||||||||||||||||
| Commercial and industrial |
10,718 | 253,225 | 263,943 | 3,232 | 3,563 | 6,795 | ||||||||||||||||||
| Residential mortgage: |
— | |||||||||||||||||||||||
| First lien |
470 | 118,980 | 119,450 | 12 | 1,021 | 1,033 | ||||||||||||||||||
| Home equity—term |
711 | 40,107 | 40,818 | 8 | 336 | 344 | ||||||||||||||||||
| Home equity—Lines of credit |
— | 71,547 | 71,547 | — | 486 | 486 | ||||||||||||||||||
| Installment and other loans |
11,112 | 11,112 | 106 | 106 | ||||||||||||||||||||
| Unallocated |
— | — | 165 | 165 | ||||||||||||||||||||
| $ | 14,739 | $ | 949,554 | $ | 964,293 | $ | 4,503 | $ | 11,517 | $ | 16,020 | |||||||||||||
| NOTE 5. | LOANS TO RELATED PARTIES |
The Company has granted loans to the officers and directors of the Company and its subsidiary and to their associates. Related party loans are made on substantially the same terms, including interest rates and collateral, as those prevailing at the time for comparable transactions with unrelated persons and do not involve more than normal risk of collectability. The aggregate dollar amount of these loans was $1,594,000 at December 31, 2010, and $1,296,000 at December 31, 2009. During 2010, $1,678,000 of new loans were granted and repayments totaled $1,380,000.
- 87 -
Table of Contents
| NOTE 6. | PREMISES AND EQUIPMENT |
A summary of bank premises and equipment at December 31 is as follows:
| (Dollars in thousands) |
2010 | 2009 | ||||||
| Land |
$ | 5,182 | $ | 5,436 | ||||
| Buildings and improvements |
22,728 | 22,749 | ||||||
| Leasehold improvements |
343 | 341 | ||||||
| Furniture and equipment |
18,318 | 17,844 | ||||||
| Construction in progress |
97 | 42 | ||||||
| Total |
46,668 | 46,412 | ||||||
| Less accumulated depreciation and amortization |
18,894 | 16,811 | ||||||
| Bank premises and equipment, net |
$ | 27,774 | $ | 29,601 | ||||
Depreciation expense amounted to $2,140,000, $2,212,000 and $1,863,000 for the years ended December 31, 2010, 2009 and 2008.
The Company leases land and building space associated with certain branch offices, remote automated teller machines, and certain equipment under agreements which expire at various times through 2024. Total rent expense charged to operations in connection with these leases was $281,000, $298,000 and $299,000 for the years ended December 31, 2010, 2009 and 2008.
The total minimum rental commitments under operating leases with maturities in excess of one year at December 31, 2010 are as follows:
| Due in the Years Ending December 31 | ||||
| (Dollars in thousands) |
||||
| 2011 |
$ | 193 | ||
| 2012 |
114 | |||
| 2013 |
117 | |||
| 2014 |
108 | |||
| 2015 |
108 | |||
| Thereafter |
439 | |||
| $ | 1,079 | |||
- 88 -
Table of Contents
| NOTE 7. | GOODWILL AND INTANGIBLE ASSETS |
No impairment losses have been recognized on goodwill for any periods presented.
The following table shows the amount of goodwill and intangible assets at December 31:
| (Dollars in thousands) |
Gross Amount |
Accumulated Amortization |
Net Amount |
|||||||||
| December 31, 2010 |
||||||||||||
| Goodwill |
$ | 19,447 | $ | 0 | $ | 19,447 | ||||||
| Identifiable intangible assets: |
||||||||||||
| Deposit premiums |
$ | 2,348 | $ | 1,444 | $ | 904 | ||||||
| Customer list |
581 | 234 | 347 | |||||||||
| Other |
66 | 66 | 0 | |||||||||
| Total identifiable intangible assets |
$ | 2,995 | $ | 1,744 | $ | 1,251 | ||||||
| December 31, 2009 |
||||||||||||
| Goodwill |
$ | 19,447 | $ | 0 | $ | 19,447 | ||||||
| Identifiable intangible assets: |
||||||||||||
| Deposit premiums |
2,348 | 1,245 | 1,103 | |||||||||
| Customer list |
581 | 195 | 386 | |||||||||
| Other |
66 | 64 | 2 | |||||||||
| Total identifiable intangible assets |
$ | 2,995 | $ | 1,504 | $ | 1,491 | ||||||
Amortization expense was $240,000, $251,000 and $251,000 for the years ended December 31, 2010, 2009 and 2008, respectively.
The estimated aggregate amortization expense for the next five years is as follows:
| (Dollars in thousands) |
||||
| 2011 |
$ | 210 | ||
| 2012 |
210 | |||
| 2013 |
210 | |||
| 2014 |
208 | |||
| 2015 |
205 | |||
| Thereafter |
208 | |||
| $ | 1,251 | |||
- 89 -
Table of Contents
| NOTE 8. | INCOME TAXES |
Orrstown Financial Services, Inc. files income tax returns in the U.S. federal jurisdiction and the state of Pennsylvania. Orrstown Bank also files an income tax return in the State of Maryland. The Company is no longer subject to U.S. federal, state or local income tax examination by tax authorities for years before 2007.
Included in the balance sheet at December 31, 2010 and 2009, are tax positions related to loan charge offs for which the ultimate deductibility is highly certain but for which there is uncertainty about the timing of such deductibility. Because of the impact of deferred tax accounting, other than interest and penalties, the disallowance of the shorter deductibility period would not affect the annual effective tax rate but would accelerate the payment of cash to the taxing authority to an earlier period.
The components of federal income tax expense for the years ended December 31 are summarized as follows:
| (Dollars in thousands) |
2010 | 2009 | 2008 | |||||||||
| Current year provision: |
||||||||||||
| Federal |
$ | 8,779 | $ | 4,884 | $ | 6,028 | ||||||
| State |
162 | 82 | 121 | |||||||||
| Deferred tax benefit |
(2,471 | ) | (916 | ) | (667 | ) | ||||||
| Net federal income tax expense |
$ | 6,470 | $ | 4,050 | $ | 5,482 | ||||||
A reconciliation of the effective applicable income tax rate to the federal statutory rate is as follows:
| 2010 | 2009 | 2008 | ||||||||||
| Statutory federal tax rate |
35.0 | % | 35.0 | % | 35.0 | % | ||||||
| Increase/(decrease) resulting from: |
||||||||||||
| State taxes, net of federal benefit |
0.2 | % | 0.3 | % | 0.4 | % | ||||||
| Tax exempt interest income |
-5.5 | % | -4.8 | % | -3.5 | % | ||||||
| Earnings from life insurance |
-1.8 | % | -1.5 | % | -1.3 | % | ||||||
| Disallowed interest |
0.3 | % | 0.3 | % | 0.3 | % | ||||||
| Low-income housing credits |
-0.6 | % | -2.4 | % | -1.6 | % | ||||||
| Historic tax credits |
0.0 | % | -3.6 | % | 0.0 | % | ||||||
| Other |
0.5 | % | -0.1 | % | 0.2 | % | ||||||
| Effective income tax rate |
28.1 | % | 23.2 | % | 29.5 | % | ||||||
The provision for income taxes includes $1,273,000, $581,000 and ($9,000) of applicable income tax expense (benefit) related to net security gains (losses) for the years ended December 31, 2010, 2009 and 2008.
- 90 -
Table of Contents
The components of the net deferred tax asset, included in other assets, are as follows:
| (Dollars in thousands) |
2010 | 2009 | ||||||
| Deferred tax assets: |
||||||||
| Allowance for loan losses |
$ | 5,607 | $ | 3,710 | ||||
| Net unrealized losses on securities available for sale |
369 | 269 | ||||||
| Deferred compensation |
421 | 391 | ||||||
| Retirement plans and salary continuation |
1,196 | 1,070 | ||||||
| Stock compensation |
162 | 219 | ||||||
| Nonaccrual loan interest |
210 | 0 | ||||||
| Unrealized losses on derivatives |
0 | 1 | ||||||
| Other |
113 | 13 | ||||||
| Total deferred tax assets |
8,078 | 5,673 | ||||||
| Deferred tax liabilities: |
||||||||
| Depreciation |
1,492 | 1,628 | ||||||
| Goodwill |
174 | 147 | ||||||
| Purchase accounting adjustments |
762 | 851 | ||||||
| Other |
33 | 0 | ||||||
| Unrealized gains on derivatives |
321 | 0 | ||||||
| Total deferred tax liabilities |
2,782 | 2,626 | ||||||
| Net deferred tax asset |
$ | 5,296 | $ | 3,047 | ||||
| NOTE 9. | RETIREMENT PLANS |
The Company maintains a 401(k) profit-sharing plan for those employees who meet the eligibility requirements set forth in the plans. Employer contributions to the plans are based on performance and are at the discretion of the subsidiary bank’s Board of Directors. The plans contain limited match or safe harbor provisions. Substantially all of the Company’s employees are covered by the plans and the contributions charged to operations were $2,018,000, $1,807,000 and $1,582,000 for the years ended December 31, 2010, 2009, and 2008.
The Company has a deferred compensation arrangement with certain present and former board directors, whereby a director or his beneficiaries will receive a monthly retirement benefit at age 65. The arrangement is funded by an amount of life insurance on the participating director calculated to meet the Company’s obligations under the compensation agreement. The cash value of the life insurance policies is an unrestricted asset of the Company. The estimated present value of future benefits to be paid, which is included in other liabilities, amounted to $111,000 and $107,000 at December 31, 2010 and 2009. Total annual expense for this deferred compensation plan was $11,000, $16,000 and $4,000 for the years ended December 31, 2010, 2009 and 2008.
The Company also has supplemental discretionary deferred compensation plans for directors and executive officers. The plans are funded annually with director fees and salary reductions which are either placed in a trust account invested by the Company’s Orrstown Financial Advisors division or recognized as a liability. The trust account balance was $1,093,000 and $1,009,000 at December 31, 2010 and 2009, respectively, and is included in other assets on the balance sheets, offset by other liabilities in the same amount. Total amounts contributed to these plans were $72,000, $72,000 and $74,000, for the years ended December 31, 2010, 2009, and 2008.
The Company has also adopted three supplemental retirement and salary continuation plans for directors and executive officers. These plans are funded with single premium life insurance on the plan participants. The cash value of the life insurance policies is an unrestricted asset of the Company. The estimated present value of future benefits to be paid totaled $3,416,000 and $3,058,000 at December 31, 2010 and 2009, which is included in other liabilities. Total annual expense for these plans amounted to $562,000, $372,000 and $498,000, for the years ended December 31, 2010, 2009, and 2008.
- 91 -
Table of Contents
The Company has promised a continuation of life insurance coverage to persons post-retirement. Generally accepted accounting principles requires the recording of post-retirement costs and a liability equal to the present value of the cost of post retirement insurance during the insured employees’ term of service. The Company adopted this provision of generally accepted accounting principles on January 1, 2008 and recorded a $263,000 liability and corresponding decrease in retained earnings at that time. The estimated present value of future benefits to be paid totaled $387,000 and $353,000 at December 31, 2010 and 2009 which is included in other liabilities. Total annual expense for this plan amounted to $34,000, $48,000 and $42,000 for the years ended December 31, 2010, 2009 and 2008.
| NOTE 10. | STOCK COMPENSATION PLANS |
Two stock option plans are maintained by the Company. The Company reserved 72,931 and 486,203 shares of its common stock to be issued under the non-employee director and employee stock option plans. As of December 31, 2010, 27,349 and 54,571 shares were available to be issued under the plans. Under the non-employee director stock option plan, each non-employee director is entitled to receive shares of the Company’s common stock each April 1, with the number of options issued to purchase determined based on a formula defined in the plan. The options granted to directors are nonqualified under the IRS code. Under the employee stock option plan, options to purchase shares may be issued to employees at the Board’s discretion as either incentive or nonqualified stock options.
The exercise price of each option equals the market price of the Company’s stock on the date of grant and an option’s maximum term is ten years. All options are fully vested upon issuance.
A roll forward of the Company’s stock option plans for the years ended December 31 is presented below:
| 2010 | ||||||||
| Shares | Weighted Average Exercise Price |
|||||||
| Outstanding at beginning of year |
336,882 | $ | 29.75 | |||||
| Granted |
64,782 | 21.34 | ||||||
| Exercised |
(20,116 | ) | 16.99 | |||||
| Forfeited |
(3,817 | ) | 33.93 | |||||
| Options outstanding and exercisable at year end |
377,731 | $ | 28.94 | |||||
Information pertaining to options outstanding and exercisable at December 31, 2010 is as follows:
| Range of Exercise Prices |
Number Outstanding |
Weighted Average Remaining Contractual Life (Years) |
Weighted Average Exercise Price |
|||||||||
| $15.00 - $16.99 |
33,610 | 0.57 | 16.54 | |||||||||
| $17.00 - $19.99 |
26,728 | 1.49 | 19.00 | |||||||||
| $20.00 - $24.99 |
108,493 | 6.70 | 22.50 | |||||||||
| $25.00 - $29.99 |
2,792 | 9.26 | 25.76 | |||||||||
| $30.00 - $34.99 |
67,110 | 6.87 | 31.21 | |||||||||
| $35.00 - $39.99 |
93,588 | 4.91 | 36.73 | |||||||||
| $40.00 - $40.14 |
45,410 | 4.48 | 40.14 | |||||||||
| $15.43 - $40.14 |
377,731 | 5.12 | 28.94 | |||||||||
The total intrinsic value of options outstanding and exercisable at December 31, 2010 was $1,127,000. The total intrinsic value of options exercised was $197,000, $335,000 and $28,000 during the years ended December 31, 2010, 2009 and 2008.
- 92 -
Table of Contents
The fair value of each option granted is estimated on the date of grant using the Black-Scholes option-pricing model with the following weighted-average assumptions:
| Grant-Date Fair Value |
Dividend Yield |
Expected Volatility |
Risk Free Interest Rate |
Expected Life (Yrs) |
||||||||||||||||
| Nonemployee director stock option plan |
||||||||||||||||||||
| 2010 |
$ | 9.50 | 3.42 | % | 47.44 | % | 3.32 | % | 7 | |||||||||||
| 2009 |
2.82 | 3.63 | 18.28 | 2.28 | 7 | |||||||||||||||
| 2008 |
5.94 | 2.76 | 23.14 | 2.88 | 7 | |||||||||||||||
| Employee stock option plan |
||||||||||||||||||||
| 2010 |
$ | 5.81 | 4.16 | % | 45.46 | % | 1.66 | % | 5 | |||||||||||
| 2009 |
9.31 | 2.38 | 30.66 | 2.65 | 5 | |||||||||||||||
| 2008 |
4.91 | 2.93 | 21.24 | 3.27 | 5 | |||||||||||||||
The expected volatility is based on historical volatility. The risk-free interest rates for periods within the contractual life of the awards are based on the U.S. Treasury yield curve in effect at the time of the grant. The expected life is based on historical exercise experience. The dividend yield assumption is based on the Company’s history and expectation of dividend payouts. For the years ended December 31, 2010, 2009 and 2008, share-based compensation expense applicable to the Plans was $388,000, $117,000 and $123,000.
The Company also maintains an employee stock purchase plan, in order to provide employees of the Company and its subsidiaries and opportunity to purchase stock of the Company. Under the plan, eligible employees may purchase shares in an amount that does not exceed 10% of their annual salary at the lower of 85% of the fair market value of the shares on the semi-annual offering date, or related purchase date. The Company reserved 182,325 shares of its common stock to be issued under the employee stock purchase plan. As of December 31, 2010, 99,128 shares were available to be issued under the plan. Employees purchased 12,681, 22,882 and 6,199 shares at a weighted average price of $20.19, $20.36 and $25.59 per share in 2010, 2009 and 2008.
The Company uses a combination of issuing new shares or treasury shares to meet stock compensation exercises depending on market conditions.
| NOTE 11. | DEPOSITS |
The composition of deposits at December 31 is as follows:
| (Dollars in thousands) |
2010 | 2009 | ||||||
| Non-interest bearing |
$ | 104,646 | $ | 90,676 | ||||
| Now and money market |
427,087 | 353,428 | ||||||
| Savings |
66,663 | 60,032 | ||||||
| Time—less than $100,000 |
305,912 | 206,790 | ||||||
| Time—greater than $100,000 |
284,069 | 204,244 | ||||||
| Total |
$ | 1,188,377 | $ | 915,170 | ||||
- 93 -
Table of Contents
The scheduled maturities of time deposits for the years ending December 31 are as follows:
| Due in the Years Ending December 31, | ||||
| (Dollars in thousands) |
||||
| 2010 |
$ | 397,123 | ||
| 2011 |
113,046 | |||
| 2012 |
30,371 | |||
| 2013 |
18,189 | |||
| 2014 |
21,417 | |||
| thereafter |
9,835 | |||
| $ | 589,981 | |||
The Company accepts deposits of the officers and directors of the Company and its subsidiary on the same terms, including interest rates, as those prevailing at the time for comparable transactions with unrelated persons. The aggregate dollar amount of deposits of officers and directors totaled $952,000 and $911,000 at December 31, 2010 and 2009, respectively.
| NOTE 12. | SHORT-TERM BORROWINGS |
The Company has several short-term borrowings available to it, including short-term borrowings from the Federal Home Loan Bank of Pittsburgh (FHLB), federal funds purchased, U.S. Treasury’s discount window, and the Federal Reserve’s Term Auction Facility (TAF) which it participated in during 2009 and the beginning of 2010. The TAF funds were secured primarily by pledged commercial loans and some U.S. Agency securities, and as of December 31, 2009 loans with a fair value of $39,622,000 and securities with a fair value of $11,014,000 were pledged to secure these funds.
Information concerning the use of these short-term borrowings as of and for the years ended December 31, is summarized as follows:
| (Dollars in thousands) |
2010 | 2009 | 2008 | |||||||||
| Balance at year end |
$ | 0 | $ | 33,300 | $ | 600 | ||||||
| Average balance during the year |
17,048 | 23,418 | 7,743 | |||||||||
| Average interest rate during the year |
0.43 | % | 0.36 | % | 3.11 | % | ||||||
| Maximum month-end balance during the year |
65,300 | 43,470 | 17,000 | |||||||||
In addition, the Company has repurchase agreements with certain of its deposit customers. The Company is required to hold U.S. Treasury and Agency issues to be held as underlying securities for repurchase agreements. Information concerning securities sold under agreements to repurchase for the years ended December 31 is summarized as follows:
| (Dollars in thousands) |
2010 | 2009 | 2008 | |||||||||
| Balance at year end |
$ | 87,850 | $ | 64,614 | $ | 63,407 | ||||||
| Average balance during the year |
74,824 | 59,904 | 59,432 | |||||||||
| Average interest rate during the year |
0.59 | % | 0.57 | % | 1.69 | % | ||||||
| Maximum month-end balance during the year |
124,869 | 74,293 | 83,889 | |||||||||
| Securities underlying the agreements at year-end: |
||||||||||||
| Carrying value |
150,966 | 74,816 | 81,528 | |||||||||
| Estimated fair value |
151,767 | 74,877 | 82,625 | |||||||||
Federal funds purchased and securities sold under agreements to repurchase generally mature within one day from the transaction date.
- 94 -
Table of Contents
| NOTE 13. | LONG-TERM DEBT |
At December 31, the Company’s long-term debt consisted of the following:
| Amount | Weighted Average rate | |||||||||||||||
| (Dollars in thousands) |
2010 | 2009 | 2010 | 2009 | ||||||||||||
| FHLB fixed rate advances maturing: |
||||||||||||||||
| 2010 |
$ | 0 | $ | 28,000 | 0.00 | % | 3.64 | % | ||||||||
| 2011 |
19,800 | 0 | 0.48 | % | 0.00 | % | ||||||||||
| 2012 |
10,000 | 0 | 0.89 | % | 0.00 | % | ||||||||||
| 2020 |
350 | 350 | 7.40 | % | 7.40 | % | ||||||||||
| 30,150 | 28,350 | 0.70 | % | 3.69 | % | |||||||||||
| FHLB amortizing advance requiring monthly principal and interest payments, maturing: |
||||||||||||||||
| 2010 |
0 | 131 | 0.00 | % | 2.85 | % | ||||||||||
| 2014 |
4,125 | 5,081 | 4.86 | % | 4.86 | % | ||||||||||
| 2025 |
5,588 | 5,838 | 4.74 | % | 4.74 | % | ||||||||||
| 9,713 | 11,050 | 4.79 | % | 4.77 | % | |||||||||||
| FHLB variable rate advances maturing: |
||||||||||||||||
| 2011 |
20,000 | 20,000 | 1.48 | % | 1.48 | % | ||||||||||
| 2012 |
5,000 | 5,000 | 4.70 | % | 4.70 | % | ||||||||||
| 25,000 | 25,000 | 2.12 | % | 2.12 | % | |||||||||||
| Total FHLB Advances: |
64,863 | 64,400 | 1.86 | % | 3.27 | % | ||||||||||
| Other |
315 | 458 | 8.00 | % | 8.00 | % | ||||||||||
| $ | 65,178 | $ | 64,858 | |||||||||||||
The FHLB variable rate advances maturing in 2011 float with the prime lending rate (3.25% at December 31, 2010), with a blended rate of prime minus 1.77% The FHLB variable rate advance maturing in 2012 will reset to 3 month LIBOR plus 0.20% if the 3 month LIBOR rate is greater than 8.0%.
Except for amortizing loans, interest only is paid on a quarterly basis. The notes contain prepayment penalty charges, but management has no intention to pay off early.
The aggregate amount of future principal payments required on these borrowings at December 31, 2010 is as follows:
| Years Ending December 31, | ||||
| (Dollars in thousands) |
||||
| 2011 |
$ | 41,065 | ||
| 2012 |
16,328 | |||
| 2013 |
1,394 | |||
| 2014 |
1,265 | |||
| 2015 |
317 | |||
| Thereafter |
4,809 | |||
| $ | 65,178 | |||
The Bank is a member of the Federal Home Loan Bank of Pittsburgh (FHLB) and, as such, can take advantage of the FHLB program of overnight and term advances. Under terms of a blanket collateral agreement, advances, lines and letters of credit from the FHLB are collateralized by first mortgage loans and securities.
- 95 -
Table of Contents
Collateral for all outstanding advances, lines and letters of credit consisted of the Banks’ 1-4 family mortgage loans totaling $462.7 million and $455.0 million at December 31, 2010 and 2009, respectively. Orrstown Bank had additional availability of $397.9 million and $349.8 million at the FHLB on December 31, 2010 and 2009, respectively, based on qualifying collateral.
Orrstown Bank has available a line of credit with Atlantic Central Bankers Bank (ACBB) of $10,000,000 million at December 31, 2010 and 2009. The ACBB line of credit is unsecured and the rate is based on the daily Federal Funds rate. There were no borrowings under these lines of credit at December 31, 2010 and 2009.
Orrstown Bank has $24,000,000 in available federal funds lines of credit with correspondent banks at December 31, 2010. The lines of credit are unsecured and the rate is based on the daily Federal Funds rate. There were no borrowings under these lines of credit at December 31, 2010 and 2009.
At December 31, 2009, the Parent Company had a $5 million unsecured line of credit with a correspondent bank. At December 31, 2009, $300,000 was borrowed against this line. This line expired in 2010 and was not renewed.
Included in other long-term debt are borrowings against certain life insurance policies that are used to fund deferred compensation benefits for certain directors. Interest rates are fixed at 8.0%. Collateral is the cash surrender value of the policies.
The Company has $3,030,000 in letters of credit outstanding with the FHLB in favor of third parties utilized for general banking purposes.
| NOTE 14. | SHAREHOLDERS’ EQUITY AND REGULATORY CAPITAL |
On February 9, 2010, the Company filed a shelf registration statement on Form S-3 with the Securities and Exchange Commission that provided the Company the ability to raise capital, from time to time, up to an aggregate of $80,000,000, through the sale of stock, preferred stock, debt securities, warrants and other securities. The Company completed a public stock offering of 1,481,481 shares of common stock at a price of $27.00 per share, for gross proceeds of approximately $40,000,000 during the first quarter of 2010. Net proceeds after underwriting commissions and expenses were $37,585,000. The Company feels with this additional capital, it positions itself well to weather the economy and take advantage of future opportunities that may arise. The Company has no current plans to issue additional shares of common stock.
The Company maintains a stockholder dividend reinvestment and stock purchase plan. Under the plan, shareholders may purchase additional shares of the Company’s common stock at the prevailing market prices with reinvestment dividends and voluntary cash payments. The Company reserved 1,045,000 shares of its common stock to be issued under the dividend reinvestment and stock purchase plan. As of December 31, 2010, 696,000 shares were available to be issued under the plan.
On April 27, 2006, the Company announced a Stock Repurchase Plan approving the purchase of up to 150,000 shares as conditions allow. The plan may be suspended at any time without prior notice and has no prescribed time limit in which to fill the authorized repurchase amount. On September 27, 2010, the Company announced the extension of the Stock Repurchase Plan, which allows it to purchase an additional 150,000 shares as conditions allow. As of December 31, 2010, 108,074 shares have been purchased under the program, and 191,926 may yet be purchased.
The Company (on a consolidated basis) and the Bank are subject to various regulatory capital requirements administered by the federal banking agencies. Failure to meet minimum capital requirements can initiate certain mandatory and possibly additional discretionary actions by regulators that, if undertaken, could have a direct material effect on the Company’s and Bank’s financial statements. Under capital adequacy guidelines and the
- 96 -
Table of Contents
regulatory framework for prompt corrective action, the Company and the Bank must meet specific guidelines that involve quantitative measures of assets, liabilities and certain off-balance sheet items as calculated under regulatory accounting practices. The capital amounts and classification are also subject to qualitative judgments by the regulators about components, risk weightings, and other factors. Prompt corrective actions provisions are not applicable to financial holding companies.
Quantitative measures established by regulators to ensure capital adequacy require the Company and the Bank to maintain minimum amounts and ratios (as set forth in the following table) of total and Tier 1 capital (as defined in regulations) to risk-weighted assets (as defined) and of Tier 1 capital (as defined) to average assets (as defined). Management believes, as of December 31, 2010 and 2009 that the Company and the Bank meet all capital adequacy requirements to which they are subject to.
As of December 31, 2010, the most recent notification from the Federal Deposit Insurance Corporation categorized the Bank as well capitalized under the regulatory framework for prompt corrective action. To be categorized as well capitalized, an institution must maintain minimum total risk-based, Tier 1 risk-based and Tier 1 leverage ratios as set forth in the following table. There are no conditions or events since the notification that management believes have changed the Bank’s category. The Company and the Bank’s actual capital ratios as of December 31, 2010 and 2009, are also presented in the table.
| Actual | Minimum
Capital Requirement |
Minimum to Be
Well Capitalized Under Prompt Corrective Action Provisions |
||||||||||||||||||||||
| (Dollars in thousands) |
Amount | Ratio | Amount | Ratio | Amount | Ratio | ||||||||||||||||||
| December 31, 2010 |
||||||||||||||||||||||||
| Total capital to risk weighted assets |
||||||||||||||||||||||||
| Orrstown Financial Services, Inc. |
$ | 152,550 | 14.8 | % | $ | 82,486 | 8.0 | % | n/a | n/a | ||||||||||||||
| Orrstown Bank |
129,844 | 12.7 | % | 81,808 | 8.0 | % | $ | 102,260 | 10.0 | % | ||||||||||||||
| Tier 1 capital to risk weighted assets |
||||||||||||||||||||||||
| Orrstown Financial Services, Inc. |
139,623 | 13.5 | % | 41,243 | 4.0 | % | n/a | n/a | ||||||||||||||||
| Orrstown Bank |
117,027 | 11.4 | % | 40,904 | 4.0 | % | 61,356 | 6.0 | % | |||||||||||||||
| Tier 1 capital to average assets |
||||||||||||||||||||||||
| Orrstown Financial Services, Inc. |
139,623 | 9.4 | % | 59,385 | 4.0 | % | n/a | n/a | ||||||||||||||||
| Orrstown Bank |
117,027 | 8.0 | % | 58,629 | 4.0 | % | 73,287 | 5.0 | % | |||||||||||||||
| December 31, 2009 |
||||||||||||||||||||||||
| Total capital to risk weighted assets |
||||||||||||||||||||||||
| Orrstown Financial Services, Inc. |
99,494 | 11.4 | % | 70,136 | 8.0 | % | n/a | n/a | ||||||||||||||||
| Orrstown Bank |
96,819 | 11.1 | % | 70,019 | 8.0 | % | 87,524 | 10.0 | % | |||||||||||||||
| Tier 1 capital to risk weighted assets |
||||||||||||||||||||||||
| Orrstown Financial Services, Inc. |
88,534 | 10.1 | % | 35,068 | 4.0 | % | n/a | n/a | ||||||||||||||||
| Orrstown Bank |
85,877 | 9.8 | % | 35,009 | 4.0 | % | 52,514 | 6.0 | % | |||||||||||||||
| Tier 1 capital to average assets |
||||||||||||||||||||||||
| Orrstown Financial Services, Inc. |
88,534 | 7.6 | % | 46,503 | 4.0 | % | n/a | n/a | ||||||||||||||||
| Orrstown Bank |
85,877 | 7.4 | % | 46,457 | 4.0 | % | 58,071 | 5.0 | % | |||||||||||||||
| NOTE 15. | RESTRICTIONS ON DIVIDENDS, LOANS AND ADVANCES |
Federal and state banking regulations place certain restrictions on dividends paid and loans or advances made by the Bank to the Company. Further, regulatory mandates may impose more stringent restrictions on the extent of dividends that may be paid by the Bank to the Company. As the Company is a Financial Holding Company, the Bank may not declare a dividend to the Company if the results of such dividend would drop the Bank below the minimum capital required in order to be classified as “well capitalized.” The Bank has approximately $27,584,000 of retained earnings available that could be paid in a dividend to the Company at December 31, 2010.
- 97 -
Table of Contents
Under current Federal Reserve regulations, the Bank is limited to the amounts it may loan to its affiliates, including the Company. Covered transactions, including loans, with a single affiliate, may not exceed 10%, and the aggregate of all covered transactions with all affiliates may not exceed 20%, of the Bank’s subsidiary and surplus (as defined by regulation). At December 31, 2010, the maximum amount the Bank has available to loan the Company is approximately $24,000,000.
In 2009, the Federal Reserve Board notified all bank holding companies that dividends should be eliminated, deferred or reduced if the bank holding company’s net income for the past four quarters, net of dividends paid, is not sufficient to fully fund the dividends; the bank holding company’s prospective rate of earnings retentions is not consistent with the bank holding company’s capital needs and overall current and prospective financial conditions, or the bank holding company will not meet, or is in danger of not meeting its minimum regulatory capital adequacy ratios. This guidance is considered in the Company’s dividend setting process.
| NOTE 16. | EARNINGS PER SHARE |
Earnings per share for the years ended December 31, were as follows:
| (In thousands, except per share data) |
2010 | 2009 | 2008 | |||||||||
| Net income |
$ | 16,581 | $ | 13,373 | $ | 13,103 | ||||||
| Weighted average shares outstanding |
7,610 | 6,406 | 6,421 | |||||||||
| Impact of common stock equivalents |
29 | 53 | 45 | |||||||||
| Weighted average shares outstanding (diluted) |
7,639 | 6,459 | 6,466 | |||||||||
| Per share information: |
||||||||||||
| Basic earnings per share |
$ | 2.18 | $ | 2.09 | $ | 2.04 | ||||||
| Diluted earnings per share |
2.17 | 2.07 | 2.03 | |||||||||
Stock options of 206,000, 141,000 and 208,000 for the years ended December 31, 2010, 2009 and 2008 have been excluded from diluted earnings per share calculations, as their exercise would have been anti-dilutive, as the exercise price exceeded the average market price.
| NOTE 17. | COMPREHENSIVE INCOME |
The Company’s other comprehensive income (loss) items are limited to unrealized gains (losses) on securities available for sale and unrealized gains (losses) on derivatives used for cash flow hedges. The components of other comprehensive income (loss) for the years ended December 31 were as follows:
| 2010 | 2009 | 2008 | ||||||||||
| Unrealized holding gains (losses) on securities available for sale arising during the period |
$ | 3,352 | $ | 41 | $ | (160 | ) | |||||
| Reclassification adjustment for (gains) losses realized in net income |
(3,636 | ) | (1,625 | ) | 111 | |||||||
| Net unrealized losses |
(284 | ) | (1,584 | ) | (49 | ) | ||||||
| Tax effect |
98 | 547 | 20 | |||||||||
| (186 | ) | (1,037 | ) | (29 | ) | |||||||
| Unrealized holding gains (losses) in fair value of derivatives used for cash flow hedges |
1,699 | (1,282 | ) | 1,279 | ||||||||
| Reclassification adjustment for (gains) realized in net income |
(778 | ) | 0 | 0 | ||||||||
| Net unrealized gains (losses) |
921 | (1,282 | ) | 1,279 | ||||||||
| Tax effect |
(322 | ) | 449 | (448 | ) | |||||||
| 599 | (833 | ) | 831 | |||||||||
| Total other comprehensive income (loss), net of tax and reclassification adjustments |
$ | 413 | $ | (1,870 | ) | $ | 802 | |||||
- 98 -
Table of Contents
The components of accumulated other comprehensive income (loss), net of taxes, at December 31, 2010 and 2009 are as follows:
| 2010 | 2009 | |||||||
| Unrealized losses on securities available for sale |
$ | (685 | ) | $ | (499 | ) | ||
| Unrealized gains (losses) on derivatives |
597 | (2 | ) | |||||
| $ | (88 | ) | $ | (501 | ) | |||
| NOTE 18. | FINANCIAL INSTRUMENTS WITH OFF-BALANCE-SHEET RISK |
The Company is a party to financial instruments with off-balance-sheet risk in the normal course of business to meet the financial needs of its customers and to reduce its own exposure to fluctuations in interest rates. These financial instruments include commitments to extend credit and standby letters of credit. Those instruments involve, to varying degrees, elements of credit and interest rate risk in excess of the amount recognized in the balance sheets. The contract amounts of those instruments reflect the extent of involvement the Company has in particular classes of financial instruments.
The Company’s exposure to credit loss in the event of nonperformance by the other party to the financial instrument for commitments to extend credit and standby letters of credit and financial guarantees written is represented by the contractual amount of those instruments. The Company uses the same credit policies in making commitments and conditional obligations as it does for on-balance-sheet instruments.
| Contract or Notional Amount | ||||||||
| (Dollars in thousands) |
2010 | 2009 | ||||||
| Commitments to fund: |
||||||||
| Revolving, open ended home equity loans |
$ | 68,490 | $ | 57,030 | ||||
| Commercial real estate, construction and land development loans |
59,802 | 32,070 | ||||||
| Commercial, industrial and other loans |
95,538 | 84,714 | ||||||
| Standby letters of credit |
29,558 | 30,418 | ||||||
Commitments to extend credit are agreements to lend to a customer as long as there is no violation of any condition established in the contract. Commitments generally have fixed expiration dates or other termination clauses and may require payment of a fee. Since many of the commitments are expected to expire without being drawn upon, the total commitment amounts do not necessarily represent future cash requirements. The Company evaluates each customer’s credit-worthiness on a case-by-case basis. The amount of collateral obtained, if deemed necessary by the Company upon extension of credit, is based on management’s credit evaluation of the customer. Collateral held varies but may include accounts receivable, inventory, equipment, residential real estate, and income-producing commercial properties.
Standby letters of credit and financial guarantees written are conditional commitments issued by the Company to guarantee the performance of a customer to a third party. Those guarantees are primarily issued to support public and private borrowing arrangements. The credit risk involved in issuing letters of credit is essentially the same as that involved in extending loans to customers. The Company holds collateral supporting those commitments when deemed necessary by management. The current amount of liability, as of December 31, 2010 and 2009, for guarantees under standby letters of credit issued is not material.
| NOTE 19. | DERIVATIVE INSTRUMENTS AND HEDGING ACTIVITY |
The Company entered into three (3) rate swap agreements—two on November 24, 2008, and one on May 22, 2009 related to fixed rate loans. The Company uses these interest rate swaps to reduce interest rate risks and to manage interest income. By entering into these agreements, the Company converts floating rate assets into
- 99 -
Table of Contents
fixed rate assets. These interest rate swap agreements are considered cash flow hedge derivative instruments that qualify for hedge accounting. A portion of the amount included in other comprehensive income is reclassified from other comprehensive income to the appropriate income statement line item as net settlements occur.
The notional amounts of the interest rate swaps are not exchanged and do not represent exposure to credit loss. In the event of default by a counter party, the risk in these transactions is the cost of replacing the agreements at current market rates. During the year ended December 31, 2010, The Company sold one of its rate swaps and received $868,000 as total proceeds from the sale, and recognized a $778,000 gain on the sale, which is included in the ineffective portion of the following table, once it no longer qualified as a hedge.
The balances of the derivative instruments on the consolidated financial statements as of December 31, 2010 and 2009 are as follows:
| (Dollars in thousands) |
Notional/ Contract Amount |
Estimated Net Fair Value |
Fair Value Balance Sheet Location |
Expiration Date |
Fixed Rate |
|||||||||||||||
| December 31, 2010 |
||||||||||||||||||||
| Interest rate swap—5 year cash flow |
$ | 20,000 | $ | 804 | Other assets | 11/26/2013 | 5.28 | % | ||||||||||||
| Interest rate swap—4 year cash flow |
10,000 | 209 | Other assets | 05/27/2013 | 4.54 | % | ||||||||||||||
| $ | 30,000 | $ | 1,013 | 5.03 | % | |||||||||||||||
| December 31, 2009 |
||||||||||||||||||||
| Interest rate swap—4 year cash flow |
$ | 30,000 | $ | 225 | Other assets | 11/26/2012 | 4.97 | % | ||||||||||||
| Interest rate swap—5 year cash flow |
20,000 | 39 | Other assets | 11/26/2013 | 5.28 | % | ||||||||||||||
| Interest rate swap—4 year cash flow |
10,000 | (146 | ) | Other assts | 05/27/2013 | 4.54 | % | |||||||||||||
| $ | 60,000 | $ | 118 | 5.00 | % | |||||||||||||||
The effects of the interest rate swaps on the Company’s income statement for the years ended December 31 are as follows:
| Derivatives in cash flow hedging (Dollars in thousands) |
Amount of Gain (Loss) Recognized in OCI on Derivatives (Effective Portion) |
Location of Gain (Loss) Reclassified from accumulated OCI into income (effective portion) |
Amount of Gain (Loss) Reclassified from accumulated OCI into income (realized portion) |
|||||||||||||||||||||||||
| 2010 | 2009 | 2008 | 2010 | 2009 | 2008 | |||||||||||||||||||||||
| Interest rate swap—4 year cash flow |
$ | 91 | $ | (498 | ) | $ | 649 | Interest income | $ | 243 | $ | 534 | $ | 38 | ||||||||||||||
| Interest rate swap—5 year cash flow |
1,124 | (638 | ) | 630 | Interest income | 406 | 406 | 33 | ||||||||||||||||||||
| Interest rate swap—4 year cash flow |
484 | (146 | ) | 0 | Interest income | 129 | 79 | 0 | ||||||||||||||||||||
| $ | 1,699 | ($ | 1,282 | ) | $ | 1,279 | $ | 778 | $ | 1,019 | $ | 71 | ||||||||||||||||
| (Dollars in thousands) |
Location of Gain or (Loss) Recognized in Income on Derivative (Ineffective Portion) |
Amount of Pretax Gain (Loss) Recognized in Income on Derivative (Ineffective Portion) |
||||||||||||||
| 2010 | 2009 | 2008 | ||||||||||||||
| Interest rate swap—4 year cash flow |
Other income | $ | 795 | $ | 72 | $ | 1 | |||||||||
| Interest rate swap—5 year cash flow |
Other income | 47 | 47 | 0 | ||||||||||||
| Interest rate swap—4 year cash flow |
Other income | 0 | 0 | 0 | ||||||||||||
| $ | 842 | $ | 119 | $ | 1 | |||||||||||
Under the terms of the agreement, the Bank pays interest monthly at the rate equivalent to Wall Street Journal prime and receives interest income monthly at the fixed rate shown above. The estimated net amount of the existing gains at December 31, 2010 that is expected to be reclassified into interest income over the next twelve months is approximately $535,000.
- 100 -
Table of Contents
| NOTE 20. | FAIR VALUE DISCLOSURES |
Fair Value Measurements under generally accepted accounting principles defines fair value, describes a framework for measuring fair value and requires disclosures about fair value measurements by establishing a three-level hierarchy that prioritizes the inputs to valuation techniques used to measure fair value. The fair value hierarchy gives the highest priority to quoted prices in active markets for identical assets or liabilities (Level 1) and the lowest priority to unobservable inputs (Level 3). If the inputs used to measure the assets or liabilities fall within different levels of the hierarchy, the classification is based on the lowest level input that is significant to the fair value measurement of the asset or liability. Classification of assets and liabilities within the hierarchy considers the markets in which the assets and liabilities are traded and the reliability and transparency of the assumptions used to determine fair value.
The three levels are defined as follows: Level 1—inputs to the valuation methodology are quoted prices (unadjusted) for identical assets or liabilities in active markets. Level 2—inputs to the valuation methodology include quoted prices for similar assets and liabilities in active markets, quoted prices for identical or similar instruments in markets that are not active or by model-based techniques in which all significant inputs are observable in the market for the asset or liability, for substantially the full term of the financial instrument. Level 3—the valuation methodology is derived from model-based techniques in which at least one significant input is unobservable to the fair value measurement and based on the Company’s own assumptions about market participants’ assumptions.
Following is a description of the valuation methodologies used for instruments measured on a recurring basis at estimated fair value, as well as the general classification of such instruments pursuant to the valuation hierarchy:
Securities
Where quoted prices are available in an active market, securities are classified within Level 1 of the valuation hierarchy. Level 1 securities would include highly liquid government bonds, mortgage products and exchange traded equities. If quoted market prices are not available, securities are classified within Level 2 and fair values are estimated by using pricing models, quoted prices of securities with similar characteristics or discounted cash flow. Level 2 securities would include U.S. agency securities, mortgage-backed agency securities, obligations of states and political subdivisions and certain corporate, asset backed and other securities. In certain cases where there is limited activity or less transparency around inputs to the valuation, securities are classified within Level 3 of the valuation hierarchy. All of the Company’s securities are classified as available for sale.
Interest Rate Swaps
Cash flow interest rate swaps are classified within Level 2 with fair values determined by quoted market prices and mathematical models using current and historical data.
- 101 -
Table of Contents
The Company had no fair value liabilities at December 31, 2010 or 2009. A summary of assets at December 31, 2010 and 2009, measured at estimated fair value on a recurring basis were as follows:
| (Dollars in Thousands) |
Level 1 | Level 2 | Level 3 | Total Fair Value Measurements |
||||||||||||
| December 31, 2010 |
||||||||||||||||
| Securities available for sale: |
||||||||||||||||
| U.S. Government Sponsored Enterprises (GSE) |
$ | 0 | $ | 120,286 | $ | 0 | $ | 120,286 | ||||||||
| States and political subdivisions |
0 | 97,148 | 0 | 97,148 | ||||||||||||
| GSE residential mortgage-backed securities |
0 | 212,176 | 0 | 212,176 | ||||||||||||
| Total debt securities |
0 | 429,610 | 0 | 429,610 | ||||||||||||
| Equity securities: |
||||||||||||||||
| Diversified |
267 | 0 | 0 | 267 | ||||||||||||
| Energy |
60 | 0 | 0 | 60 | ||||||||||||
| Financial services |
351 | 279 | 0 | 630 | ||||||||||||
| Industrials |
208 | 0 | 0 | 208 | ||||||||||||
| Technology |
147 | 0 | 0 | 147 | ||||||||||||
| Other |
784 | 66 | 0 | 850 | ||||||||||||
| Total equity securities |
1,817 | 345 | 0 | 2,162 | ||||||||||||
| Total securities |
1,817 | 429,955 | 0 | 431,772 | ||||||||||||
| Interest rate swaps |
$ | 0 | $ | 1,013 | $ | 0 | $ | 1,013 | ||||||||
| December 31, 2009 |
||||||||||||||||
| Securities available for sale: |
||||||||||||||||
| U.S. Government Sponsored Enterprises (GSE) |
$ | 0 | $ | 119,416 | $ | 0 | $ | 119,416 | ||||||||
| States and political subdivisions |
0 | 37,384 | 0 | 37,384 | ||||||||||||
| GSE residential mortgage-backed securities |
0 | 37,873 | 0 | 37,873 | ||||||||||||
| Total debt securities |
0 | 194,673 | 0 | 194,673 | ||||||||||||
| Equity securities: |
||||||||||||||||
| Diversified |
308 | 0 | 0 | 308 | ||||||||||||
| Energy |
159 | 0 | 0 | 159 | ||||||||||||
| Financial services |
127 | 230 | 0 | 357 | ||||||||||||
| Industrials |
486 | 0 | 0 | 486 | ||||||||||||
| Other |
215 | 55 | 0 | 270 | ||||||||||||
| Total equity securities |
1,295 | 285 | 0 | 1,580 | ||||||||||||
| Total securities |
$ | 1,295 | $ | 194,958 | $ | 0 | $ | 196,253 | ||||||||
| Interest rate swaps |
$ | 0 | $ | 118 | $ | 0 | $ | 118 | ||||||||
Certain financial assets are measured at fair value on a nonrecurring basis in accordance with accounting principles generally accepted in the United States. Adjustments to the fair value of these assets usually result from the application of lower-of-cost-or-market accounting or write-downs of individual assets.
The following describes the valuation techniques used by the Company to measure certain financial assets recorded at fair value on a nonrecurring basis in the financial statements:
Impaired Loans
Loans are designated as impaired when, in the judgment of management based on current information and events, it is probable that all amounts due, according to the contractual terms of the loan agreement, will not be
- 102 -
Table of Contents
collected. The measurement of loss associated with impaired loans can be based on either the observable market price of the loan or the fair value of the collateral. Fair value is measured based on the value of the collateral securing the loan, less estimated costs to sell. Collateral may be in the form of real estate or business assets including equipment, inventory, and accounts receivable. The value of the real estate collateral is determined utilizing an income or market valuation approach based on an appraisal conducted by an independent, licensed appraiser outside of the Company using observable market data (Level 2). However, if the collateral is a house or building in the process of construction, or if management adjusts the appraisal value, then the fair value is considered Level 3. The value of business equipment is based upon an outside appraisal, if deemed significant, or the net book value on the applicable business’ financial statements if not considered significant using observable market data. Likewise, values for inventory and accounts receivables collateral are based on financial statement balances or aging reports (Level 3). Impaired loans with an allocation to the allowance for loan losses are measured at fair value on a nonrecurring basis. Any fair value adjustments are recorded in the period incurred as provision for loan losses on the consolidated statement of income. Specific allocations to the allowance for loan losses were $4,503,000 and $4,801,000 at December 31, 2010 and 2009.
Foreclosed Real Estate
Other real estate property acquired through foreclosure is initially recorded at fair value of the property at the transfer date less estimated selling cost. Subsequently, other real estate owned is carried at the lower of its carrying value or the fair value less estimated selling cost. Fair value is usually determined based upon an independent third-party appraisal of the property or occasionally upon a recent sales offer. There were three other real estate owned properties with write-downs totaling $123,000 for the years ended December 31, 2010.
Mortgage Servicing Rights
The fair value of mortgage servicing rights is estimated to be equal to its carrying value, unless the quarterly valuation model calculates the present value of the estimated net servicing income is less than its carrying value, in which as a lower of cost or market change is taken. For the year ended December 31, 2010, a $200,000 lower of cost or market charge was taken on the mortgage servicing right portfolio.
A summary of assets at December 31 measured at fair value on a nonrecurring basis is as follows:
| (Dollars in Thousands) |
Level 1 | Level 2 | Level 3 | Total Fair Value Measurements |
||||||||||||
| December 31, 2010 |
||||||||||||||||
| Impaired loans, net |
$ | 0 | $ | 0 | $ | 9,118 | $ | 9,118 | ||||||||
| Foreclosed real estate |
0 | 0 | 259 | 259 | ||||||||||||
| Mortgage servicing rights |
0 | 0 | 2,057 | 0 | ||||||||||||
| December 31, 2009 |
||||||||||||||||
| Impaired loans, net |
0 | 0 | 10,702 | 10,702 | ||||||||||||
| Foreclosed real estate |
0 | 1,065 | 0 | 1,065 | ||||||||||||
Fair values of financial instruments
The Company meets the requirements for disclosure of fair value information about financial instruments, whether or not recognized in the balance sheet. In cases where quoted market prices are not available, fair values are based on estimates using present value or other valuation techniques. Those techniques are significantly affected by the assumptions used, including the discount rate and estimates of future cash flows. In that regard, the derived fair value estimates cannot be substantiated by comparison to independent markets and, in many cases, could not be realized in immediate settlement of the instruments. Certain financial instruments and all non-financial instruments are excluded from disclosure requirements. Accordingly, the aggregate fair value amounts presented do not represent the underlying value of the Company.
- 103 -
Table of Contents
In addition to those disclosed above, the following methods and assumptions were used by the Company in estimating fair values of financial instruments as disclosed herein:
Cash and Due from Banks, Federal Funds Sold, Short-Term Investments and Interest Bearing Deposits with Banks
The carrying amounts of cash and due from banks, short-term investments and interest bearing deposits with banks and federal funds sold approximate their fair value.
Loans Held for Sale
Loans held for sale are carried at the lower of cost or fair value. These loans typically consist of one-to-four family residential loans originated for sale in the secondary market. Fair value is based on the price secondary markets are currently offering for similar loans using observable market data which is not materially different than cost due to the short duration between origination and sale.
Loans Receivable
For variable-rate loans that reprice frequently and have no significant change in credit risk, fair values are based on carrying values. Fair values for fixed rate loans are estimated using discounted cash flow analyses, using interest rates currently being offered in the market for loans with similar terms to borrowers of similar credit quality.
Restricted Investment in Bank Stock
These investments are carried at cost. The Company is required to maintain minimum investment balances in these stocks, which are not actively traded and therefore have no readily determinable market value.
Deposit Liabilities
The fair values disclosed for demand deposits are, by definition, equal to the amount payable on demand at the reporting date (that is, their carrying amounts). The carrying amounts of variable-rate, fixed-term money market accounts and certificates of deposit approximate their fair values at the reporting date. Fair values for fixed-rate certificates of deposits and IRA’s are estimated using a discounted cash flow calculation that applies interest rates currently being offered in the market to a schedule of aggregated expected maturities on time deposits.
Short-Term Borrowings
The carrying amounts of federal funds purchased, borrowings under repurchase agreements, and other short-term borrowings maturing within 90 days approximate their fair values. Fair values of other short-term borrowings are estimated using discounted cash flow analyses based on the Company’s current incremental borrowing rates for similar types of borrowing arrangements.
Long-Term Debt
The fair value of the Company’s fixed rate long-term borrowings is estimated using a discounted cash flow analysis based on the Company’s current incremental borrowing rate for similar types of borrowing arrangements. The carrying amounts of variable-rate long-term borrowings approximate their fair values at the reporting date.
- 104 -
Table of Contents
Accrued Interest
The carrying amounts of accrued interest approximate their fair values.
Off-Balance-Sheet Instruments
The Company generally does not charge commitment fees. Fees for standby letters of credit and other off-balance-sheet instruments are not significant.
The estimated fair values of the Company’s financial statements were as follows at December 31:
| 2010 | 2009 | |||||||||||||||
| (Dollars in thousands) |
Carrying Amount |
Fair Value |
Carrying Amount |
Fair Value |
||||||||||||
| Financial Assets |
||||||||||||||||
| Cash and due from banks |
$ | 10,400 | $ | 10,400 | $ | 13,940 | $ | 13,940 | ||||||||
| Federal funds sold |
8,800 | 8,800 | 8,000 | 8,000 | ||||||||||||
| Short-term investments |
2,728 | 2,728 | 6,388 | 6,388 | ||||||||||||
| Interest bearing deposits with banks |
925 | 925 | 601 | 601 | ||||||||||||
| Restricted investments in bank stock |
8,798 | 8,798 | 8,056 | 8,056 | ||||||||||||
| Securities available for sale |
431,772 | 431,772 | 196,253 | 196,253 | ||||||||||||
| Loans held for sale |
2,693 | 594 | ||||||||||||||
| Loans |
964,293 | 880,480 | ||||||||||||||
| Allowance for loan losses |
(16,020 | ) | (11,067 | ) | ||||||||||||
| Net loans |
950,966 | 937,928 | 870,007 | 858,975 | ||||||||||||
| Accrued interest receivable |
5,715 | 5,715 | 4,605 | 4,605 | ||||||||||||
| Mortgage servicing rights |
2,057 | 2,057 | 1,712 | 1,712 | ||||||||||||
| Interest rate swaps |
1,013 | 1,013 | 118 | 118 | ||||||||||||
| Financial Liabilities |
||||||||||||||||
| Deposits |
$ | 1,188,377 | $ | 1,192,028 | $ | 915,170 | $ | 918,763 | ||||||||
| Short-term borrowings |
87,850 | 87,850 | 97,914 | 97,914 | ||||||||||||
| Long-term debt |
65,178 | 66,397 | 64,858 | 65,382 | ||||||||||||
| Accrued interest payable |
1,053 | 1,053 | 1,040 | 1,040 | ||||||||||||
| Off-balance sheet instruments |
0 | 0 | 0 | 0 | ||||||||||||
- 105 -
Table of Contents
| NOTE 21. | ORRSTOWN FINANCIAL SERVICES, INC. (PARENT COMPANY ONLY) FINANCIAL INFORMATION |
The following are the condensed balance sheets, statements of income and statements of cash flows for the parent company for the years ended December 31:
| Balance Sheet | ||||||||
| (Dollars in thousands) |
2010 | 2009 | ||||||
| Assets |
||||||||
| Cash in Orrstown Bank |
$ | 2,734 | $ | 897 | ||||
| Securities available for sale |
19,489 | 1,581 | ||||||
| Investment in Orrstown Bank |
137,742 | 108,232 | ||||||
| Other assets |
519 | 488 | ||||||
| Total assets |
$ | 160,484 | $ | 111,198 | ||||
| Liabilities |
||||||||
| Other liabilities |
$ | 0 | $ | 12 | ||||
| Short -term borrowings |
0 | 300 | ||||||
| Total liabilities |
0 | 312 | ||||||
| Shareholders’ Equity |
||||||||
| Common stock |
416 | 337 | ||||||
| Additional paid-in capital |
121,508 | 82,895 | ||||||
| Retained earnings |
38,680 | 28,857 | ||||||
| Accumulated other comprehensive income (loss) |
(88 | ) | (501 | ) | ||||
| Treasury stock |
(32 | ) | (702 | ) | ||||
| Total shareholders’ equity |
160,484 | 110,886 | ||||||
| Total liabilities and shareholders’ equity |
$ | 160,484 | $ | 111,198 | ||||
| Statements of Income | ||||||||||||
| (Dollars in thousands) |
2010 | 2009 | 2008 | |||||||||
| Income |
||||||||||||
| Dividends from bank subsidiary |
$ | 5,772 | $ | 5,155 | $ | 7,075 | ||||||
| Other interest and dividend income |
207 | 36 | 81 | |||||||||
| Other income |
54 | 46 | 35 | |||||||||
| Gains (losses) on sale of securities |
8 | (4 | ) | (27 | ) | |||||||
| Total income |
6,041 | 5,233 | 7,164 | |||||||||
| Expenses |
||||||||||||
| Interest on borrowings |
2 | 7 | 9 | |||||||||
| Stock based compensation |
386 | 117 | 123 | |||||||||
| Security impairment expense |
0 | 36 | 84 | |||||||||
| Other expenses |
609 | 532 | 415 | |||||||||
| Total expenses |
997 | 692 | 631 | |||||||||
| Income before income taxes and equity in undistributed income of subsidiaries |
5,044 | 4,541 | 6,533 | |||||||||
| Income tax expense (benefit) |
(135 | ) | (139 | ) | (173 | ) | ||||||
| Income before equity in undistributed income of subsidiaries |
5,179 | 4,680 | 6,706 | |||||||||
| Equity in undistributed income of bank subsidiary |
11,402 | 8,693 | 6,397 | |||||||||
| Net income |
$ | 16,581 | $ | 13,373 | $ | 13,103 | ||||||
- 106 -
Table of Contents
| NOTE 21. | ORRSTOWN FINANCIAL SERVICES, INC. (PARENT COMPANY ONLY) FINANCIAL INFORMATION (Continued) |
| Statements of Cash Flows | ||||||||||||
| (Dollars in thousands) |
2010 | 2009 | 2008 | |||||||||
| Cash flows from operating activities: |
||||||||||||
| Net income |
$ | 16,581 | $ | 13,373 | $ | 13,103 | ||||||
| Adjustments to reconcile net income to cash provided by operating activities: |
||||||||||||
| Gains (losses) on sale of investment securities |
(8 | ) | 4 | 27 | ||||||||
| Equity in undistributed income of subsidiary |
(11,402 | ) | (8,693 | ) | (6,397 | ) | ||||||
| Security impairment losses |
0 | 36 | 84 | |||||||||
| Stock based compensation |
386 | 117 | 123 | |||||||||
| Net change in other liabilities |
(12 | ) | (21 | ) | 19 | |||||||
| Other, net |
(204 | ) | 266 | (185 | ) | |||||||
| Net cash provided by operating activities |
5,341 | 5,082 | 6,774 | |||||||||
| Cash flows from investing activities: |
||||||||||||
| Purchases of securities available for sale |
(20,538 | ) | (790 | ) | (1,770 | ) | ||||||
| Sales of securities available for sale |
3,118 | 876 | 1,943 | |||||||||
| Investment in bank subsidiary |
(18,000 | ) | 0 | 0 | ||||||||
| Net cash provided by (used in) investing activities |
(35,420 | ) | 86 | 173 | ||||||||
| Cash flows from financing activities: |
||||||||||||
| Repayment of short-term borrowings |
(300 | ) | (300 | ) | (450 | ) | ||||||
| Dividends paid |
(6,758 | ) | (5,636 | ) | (5,588 | ) | ||||||
| Proceeds from issuance of common stock |
38,403 | 296 | 39 | |||||||||
| Payments to repurchase common stock |
(221 | ) | (71 | ) | (1,376 | ) | ||||||
| Net proceeds from issuance of treasury stock |
792 | 1,330 | 383 | |||||||||
| Net cash provided by (used in) financing activities |
31,916 | (4,381 | ) | (6,992 | ) | |||||||
| Net increase in cash |
1,837 | 787 | (45 | ) | ||||||||
| Cash, beginning balance |
897 | 110 | 155 | |||||||||
| Cash, ending balance |
$ | 2,734 | $ | 897 | $ | 110 | ||||||
- 107 -
Table of Contents
ITEM 9—CHANGES IN AND DISAGREEMENTS WITH ACCOUNTANTS ON ACCOUNTING AND FINANCIAL DISCLOSURE
None.
ITEM 9A—CONTROLS AND PROCEDURES
The Company’s Chief Executive Officer and Chief Financial Officer have evaluated the effectiveness of the Company’s disclosure controls and procedures (as such term is defined in Rules 13a-14(c) under the Securities Exchange Act of 1934, as amended (the “Exchange Act”)) as of December 31, 2010. Based on such evaluation, such officers have concluded that the Company’s disclosure controls and procedures are effective as of December 31, 2010 in recording, processing, summarizing and reporting information required to be disclosed, within the time periods specified in the SEC’s rules and forms. Management’s Report on internal control over financial reporting for December 31, 2010 is included in Item 8 of this 10-K report and is incorporated by reference into this Item 9A. The audit report of the registered public accounting firm on internal control over financial reporting is included in Item 8 of this 10-K report and is incorporated by reference into this Item 9A. There have not been any changes in the Company’s internal control over financial reporting during the quarter ended December 31, 2010 that materially affected, or are reasonably likely to materially affect, our internal control over financial reporting.
The Company had no other events that should have been disclosed on Form 8-K that were not already disclosed on such forms.
- 108 -
Table of Contents
PART III
ITEM 10—DIRECTORS, EXECUTIVE OFFICERS AND CORPORATE GOVERNANCE
The Company has adopted a code of ethics that applies to all senior financial officers (including its chief executive officer, chief financial officer, chief accounting officer, and any person performing similar functions). The Company’s Code of Ethics for Senior Financial Officers is available on Orrstown Bank’s website at http://www.orrstown.com. Any amendments or waivers to the Company’s Code of Ethics for Senior Financial Officers will be posted to the website in a timely manner.
All other information required by Item 10, is incorporated, by reference, from Orrstown Financial Services, Inc.’s definitive proxy statement for the 2011 Annual Meeting of Shareholders filed pursuant to Regulation 14A, under Proposal 1—Election of Directors—Biographical Summaries of Nominees and Directors; Information About Executive Officers and Other Significant Employees; Section 16(a) Beneficial Ownership Reporting Compliance; and Proposal 1—Election of Directors—Nomination of Directors, and Board Structure, Committees and Meeting Attendance.
ITEM 11—EXECUTIVE COMPENSATION
The information required by Item 11 is incorporated by reference from Orrstown Financial Services, Inc.’s definitive proxy statement for the 2011 Annual Meeting of Shareholders filed pursuant to Regulation 14A, under Proposal 1—Election of Directors—Compensation of Directors, Compensation Discussion and Analysis, Compensation Committee Report, Executive Compensation Tables, Potential Payments Upon Termination or Change in Control and Compensation Committee Interlocks and Insider Participation.
ITEM 12—SECURITY OWNERSHIP OF CERTAIN BENEFICIAL OWNERS AND MANAGEMENT AND RELATED STOCKHOLDER MATTERS
Equity Compensation Plan Information
| Plan Category |
Number of securities to be issued upon exercise of outstanding options |
Weighted-average exercise price of outstanding options |
Number of securities remaining available for future issuance under equity compensation plans (excluding securities reflected in column (a)) |
|||||||||
| (a) | (b) | (c) | ||||||||||
| Equity compensation plan approved by security holders |
327,220 | 28.98 | 69,020 | |||||||||
| Equity compensation plan not approved by security holders(1) |
36,076 | 25.56 | 27,351 | |||||||||
| Total |
363,296 | 28.64 | 96,371 | |||||||||
| (1) | Non-Employee Director Stock Option Plan of 2000. On January 27, 2000, the Board of Directors of the Company approved the Orrstown Financial Services, Inc. Non-Employee Director Stock Option Plan of 2000. The Directors’ Option Plan is a formula plan under which options to purchase shares of the Company’s Common Stock are granted each year to directors in office on April 1. The number of options granted each year is based on the Company’s return on average equity for the most recent fiscal year. All options have a term of 10 years from the regular grant date, are fully exercisable from the regular grant date, and have an exercise price equal to the fair market value of the Company’s Common Stock as of the date of the grant of the option based upon criteria as outlined in the plan. If a director “retires”, whether as a result of reaching mandatory retirement age, or under any other circumstances the Board of Directors, in its discretion, may determine to constitute retirement, the options previously granted to the director will expire at their scheduled expiration date. If a director’s service as a director terminates for any other reason, the options previously granted to the director will expire six months after the date of termination of service unless scheduled to expire sooner. |
- 109 -
Table of Contents
All other information required by Item 12 is incorporated, by reference, from Orrstown Financial Services, Inc.’s definitive proxy statement for the 2011 Annual Meeting of Shareholders filed pursuant to Regulation 14A, under Share Ownership of Management.
ITEM 13—CERTAIN RELATIONSHIPS AND RELATED TRANSACTIONS, AND DIRECTOR INDEPENDENCE
The information required by Item 13 is incorporated by reference from Orrstown Financial Services, Inc.’s definitive proxy statement for the 2011 Annual Meeting of Shareholders filed pursuant to Regulation 14A, under Proposal 1—Election of Directors—Director Independence, and Transactions with Directors and Management.
ITEM 14—PRINCIPAL ACCOUNTING FEES AND SERVICES
The information required by Item 14 is incorporated by reference from Orrstown Financial Services, Inc.’s definitive proxy statement for the 2011 Annual Meeting of Shareholders filed pursuant to Regulation 14A, under Proposal 5—Ratification of the Audit Committee’s selection of Smith Elliott Kearns & Company, LLC, as the Company’s Independent Registered Public Accounting Firm for 2011—Relationship with Independent Registered Public Accounting Firm.
- 110 -
Table of Contents
PART IV
ITEM 15—EXHIBITS, FINANCIAL STATEMENT SCHEDULES
(a) The following documents are filed as part of this report:
(1)—Financial Statements
Consolidated financial statements of Orrstown Financial Services, Inc. and its subsidiary required in response to this Item are incorporated by reference from Item 8 of this report:
(2)—Financial Statement Schedules
All financial statement schedules for which provision is made in the applicable accounting regulations of the Securities and Exchange Commission are not required under the related instructions or are inapplicable and therefore have been omitted.
(3)—Exhibits
| 3.1 | Articles of Incorporation as amended, incorporated by reference to Exhibit 3.1 of the Registrant’s Report on Form 8-K filed on January 29, 2009. | |
| 3.2 | By-laws as amended, incorporated by reference to Exhibit 3.2 to the Registrant’s Report on Form 8-K filed January 29, 2009. | |
| 4 | Instruments defining the rights of security holders including indentures. The rights of the holders of Registrant’s common stock are contained in: | |
| (i) | Articles of Incorporation as amended, incorporated by reference to Exhibit 3.1. | |
| (ii) | By-laws as amended, incorporated by reference to Exhibit 3.2. | |
| 10.1(a) | Form of Change in Control Agreement for selected officers—incorporated by reference to Exhibit 10.1 of the Registrant’s Form 8-K filed May 14, 2008. | |
| 10.1(b) | Change in Control Agreement between Orrstown Financial Services, Inc., Orrstown Bank and Thomas R. Quinn, Jr. incorporated by reference to Exhibit 10.1(b) of the Registrant’s Form 10-K filed March 12, 2009. | |
| 10.2(a) | Amended and Restated Salary Continuation Agreement between Orrstown Bank and Kenneth R. Shoemaker, incorporated by reference to Exhibit 10.2 (a) of the Registrant’s Form 10-K filed March 15, 2010. | |
| 10.2(b) | Amended and Restated Salary Continuation Agreement between Orrstown Bank and Phillip E. Fague, incorporated by reference to Exhibit 10.2 (b) of the Registrant’s Form 10-K filed March 15, 2010. | |
| 10.2(c) | Amended and Restated Salary Continuation Agreement between Orrstown Bank and Bradley S. Everly, incorporated by reference to Exhibit 10.2 (c) of the Registrant’s Form 10-K filed March 15, 2010. | |
| 10.2(d) | Salary Continuation Agreement between Orrstown Bank and Jeffrey W. Embly, incorporated by reference to Exhibit 10.2 (d) of the Registrant’s Form 10-K filed March 15, 2010. | |
| 10.2(e) | Salary Continuation Agreement between Orrstown Bank and Barb Brobst, incorporated by reference to Exhibit 10.2 (e) of the Registrant’s Form 10-K filed March 15, 2010. | |
| 10.2(f) | Salary Continuation Agreement between Orrstown Bank and Benjamin S. Stoops, incorporated by reference to Exhibit 10.2 (f) of the Registrant’s Form 10-K filed March 15, 2010. | |
| 10.2(g) | Salary Continuation Agreement between Orrstown Bank and Thomas R. Quinn, Jr.—incorporated by reference to Exhibit 10.1 to the Registrant’s Form 8-K filed January 8, 2010. | |
| 10.3 | Officer group term replacement plan for selected officers—incorporated by reference to Exhibit 10.2 to Registrant’s Form 10-K for the year ended December 31, 1999 filed March 26, 2000 | |
- 111 -
Table of Contents
| 10.4(a) | Director Retirement Agreement, as amended, between Orrstown Bank and Anthony F. Ceddia, incorporated by reference to Exhibit 10.4(a) to the Registrant’s Form 10-K filed March 15, 2010. | |
| 10.4(b) | Director Retirement Agreement, as amended, between Orrstown Bank and Jeffrey W. Coy, incorporated by reference to Exhibit 10.4(b) to the Registrant’s Form 10-K filed March 15, 2010. | |
| 10.4(c) | Director Retirement Agreement, as amended, between Orrstown Bank and Andrea Pugh, incorporated by reference to Exhibit 10.4(c) to the Registrant’s Form 10-K filed March 15, 2010. | |
| 10.4(d) | Director Retirement Agreement, as amended, between Orrstown Bank and Gregory A. Rosenberry, incorporated by reference to Exhibit 10.4(d) to the Registrant’s Form 10-K filed March 15, 2010. | |
| 10.4(e) | Director Retirement Agreement, as amended, between Orrstown Bank and Kenneth R. Shoemaker, incorporated by reference to Exhibit 10.4(e) to the Registrant’s Form 10-K filed March 15, 2010. | |
| 10.4(f) | Director Retirement Agreement, as amended, between Orrstown Bank and Glenn W. Snoke, incorporated by reference to Exhibit 10.4(f) to the Registrant’s Form 10-K filed March 15, 2010. | |
| 10.4(g) | Director Retirement Agreement, as amended, between Orrstown Bank and John S. Ward, incorporated by reference to Exhibit 10.4(g) to the Registrant’s Form 10-K filed March 15, 2010. | |
| 10.4(h) | Director Retirement Agreement, as amended, between Orrstown Bank and Joel R. Zullinger, incorporated by reference to Exhibit 10.4(h) to the Registrant’s Form 10-K filed March 15, 2010. | |
| 10.5 | Revenue neutral retirement plan—incorporated by reference to Exhibit 10.4 to the Registrant’s Form 10-K for the year ended December 31, 1999 filed March 28, 2000. | |
| 10.6 | Non-employee director stock option plan of 2000—incorporated by reference to the Registrant’s registration statement on Form S-8 filed March 31, 2000. | |
| 10.7 | Employee stock option plan of 2000—incorporated by reference to the Registrant’s registration statement on Form S-8 filed March 31, 2000 | |
| 10.8 | Description of Executive Incentive Plan incorporated by reference to the Registrant’s definitive schedule 14A proxy statement for the 2011 Annual Meeting. | |
| 10.9 | Executive Employment Agreement between Orrstown Financial Services, Inc., Orrstown Bank and Kenneth R. Shoemaker—incorporated by reference to Exhibit 10.1 of the Registrant’s Form 8-K filed May 14, 2008. | |
| 10.10 | Executive Employment Agreement between Orrstown Financial Services, Inc., Orrstown Bank and Thomas R. Quinn, Jr. incorporated by reference to Exhibit 10.10 to Registrant’s Form 10-K filed March 12, 2009. | |
| 10.11 | Brick Plan—Deferred Income Agreement between Orrstown Bank and Joel R. Zullinger, incorporated by reference to Exhibit 10.11 to the Registrant’s Form 10-K filed March 15, 2010. | |
| 10.12 | Form of Executive Employment Agreement for selected officers—incorporated by reference to Exhibit 10.1 to Registrant’s Form 8-K filed January 22, 2010. | |
| 10.13(a) | Director/Executive Officer Deferred Compensation Plan, incorporated by reference to Exhibit 10.13(a) to the Registrant’s Form 10-K filed March 15, 2010. | |
| 10.13(b) | Trust Agreement for Director/Executive Officer Deferred Compensation Plan, incorporated by reference to Exhibit 10.13(b) to the Registrant’s Form 10-K filed March 15, 2010. | |
| 14 | Code of Ethics Policy for Senior Financial Officers posted on Registrant’s website. | |
| 21 | Subsidiaries of the registrant | |
| 23.1 | Consent of Independent Registered Public Accounting Firm | |
- 112 -
Table of Contents
| 31.1 | Rule 13a - 14(a)/15d-14(a) Certification (Chief Executive Officer) | |
| 31.2 | Rule 13a - 14(a)/15d-14(a) Certifications (Chief Financial Officer) | |
| 32.1 | Section 1350 Certifications (Chief Executive Officer) | |
| 32.2 | Section 1350 Certifications (Chief Financial Officer) | |
All other exhibits for which provision is made in the applicable accounting regulations of the Securities and Exchange Commission are not required under the related instructions or are inapplicable and therefore have been omitted.
(b) Exhibits—The exhibits to this Form 10-K begin on page 98.
(c) Financial statement schedules—None required.
- 113 -
Table of Contents
Pursuant to the requirements of Section 13 or 15(d) of the Securities Exchange Act of 1934, the registrant has duly caused this report to be signed on its behalf by the undersigned, thereunto duly authorized.
| ORRSTOWN FINANCIAL SERVICES, INC. (Registrant) | ||||||
| By | /S/ THOMAS R. QUINN, JR. | |||||
| Dated: March 11, 2011 | Thomas R. Quinn, Jr., President | |||||
Pursuant to the requirements of Section 13 or 15(d) of the Securities Exchange Act of 1934, this report has been signed below by the following persons on behalf of the registrant and in the capacities and on the dates indicated.
| Signature |
Title |
Date | ||
| /S/ THOMAS R. QUINN, JR Thomas R. Quinn, Jr |
President and CEO (Principal Executive Officer) and Director |
March 11, 2011 | ||
| /S/ BRADLEY S. EVERLY Bradley S. Everly |
Executive Vice President and Chief Financial Officer (Principal Financial Officer) |
March 11, 2011 | ||
| /S/ DOUGLAS P. BARTON Douglas P. Barton |
Senior Vice President and Chief Accounting Officer (Principal Accounting Officer) |
March 11, 2011 | ||
| /S/ JOEL R. ZULLINGER Joel R. Zullinger |
Chairman of the Board and Director |
March 11, 2011 | ||
| /S/ JEFFREY W. COY Jeffrey W. Coy |
Vice Chairman of the Board and Director |
March 11, 2011 | ||
| /S/ KENNETH R. SHOEMAKER Kenneth R. Shoemaker |
Secretary |
March 11, 2011 | ||
| /S/ ANTHONY F. CEDDIA Dr. Anthony F. Ceddia |
Director |
March 11, 2011 | ||
| /S/ MARK KELLER Mark Keller |
Director |
March 11, 2011 | ||
| /S/ ANDREA PUGH Andrea Pugh |
Director |
March 11, 2011 | ||
| /S/ GREGORY A. ROSENBERRY Gregory A. Rosenberry |
Director |
March 11, 2011 | ||
| /S/ GLENN W. SNOKE Glenn W. Snoke |
Director |
March 11, 2011 | ||
| /S/ JOHN S. WARD John S. Ward |
Director |
March 11, 2011 | ||
- 114 -