Attached files
| file | filename |
|---|---|
| EX-10.2 - EX-10.2 - OMNICELL, Inc | a2202091zex-10_2.htm |
| EX-31.1 - EX-31.1 - OMNICELL, Inc | a2202091zex-31_1.htm |
| EX-23.1 - EX-23.1 - OMNICELL, Inc | a2202091zex-23_1.htm |
| EX-32.1 - EX-32.1 - OMNICELL, Inc | a2202091zex-32_1.htm |
| EX-21.1 - EX 21.1 - OMNICELL, Inc | a2202091zex-21_1.htm |
| EX-31.2 - EX-31.2 - OMNICELL, Inc | a2202091zex-31_2.htm |
| EX-10.30 - EX-10.30 - OMNICELL, Inc | a2202091zex-10_30.htm |
| EX-10.22 - EX-10.22 - OMNICELL, Inc | a2202091zex-10_22.htm |
| EX-10.17 - EX-10.17 - OMNICELL, Inc | a2202091zex-10_17.htm |
| EX-10.10 - EX-10.10 - OMNICELL, Inc | a2202091zex-10_10.htm |
| EX-10.28 - EX-10.28 - OMNICELL, Inc | a2202091zex-10_28.htm |
| EX-10.14 - EX-10.14 - OMNICELL, Inc | a2202091zex-10_14.htm |
| EX-10.18 - EX-10.18 - OMNICELL, Inc | a2202091zex-10_18.htm |
| EX-10.21 - EX10.21 - OMNICELL, Inc | a2202091zex-10_21.htm |
| EX-10.24 - EX-10.24 - OMNICELL, Inc | a2202091zex-10_24.htm |
| EX-10.16 - EX-10.16 - OMNICELL, Inc | a2202091zex-10_16.htm |
Use these links to rapidly review the document
Table of Contents
PART IV
UNITED STATES
SECURITIES AND EXCHANGE COMMISSION
Washington, D.C. 20549
FORM 10-K
| (Mark One) | ||
ý |
ANNUAL REPORT PURSUANT TO SECTION 13 OR 15(d) OF THE SECURITIES EXCHANGE ACT OF 1934 |
|
For the fiscal year ended December 31, 2010 |
||
OR |
||
o |
TRANSITION REPORT PURSUANT TO SECTION 13 OR 15(d) OF THE SECURITIES EXCHANGE ACT OF 1934 |
|
For the transition period from to |
||
Commission File No. 000-33043
OMNICELL, INC.
(Exact name of Registrant as specified in its charter)
| Delaware (State or other jurisdiction of incorporation or organization) |
94-3166458 (IRS Employer Identification No.) |
1201 Charleston Road
Mountain View, CA 94043
(650) 251-6100
(Address of registrant's principal executive offices, including zip code)
(650) 251-6100
(Registrant's telephone number, including area code)
Securities registered pursuant to Section 12(b) of the Act:
| Title of each class | Name of each exchange on which registered | |
|---|---|---|
| Common Stock, $0.001 par value | The NASDAQ Stock Market LLC |
Securities registered pursuant to Section 12(g) of the Act:
None
Indicate by check mark if the registrant is a well-known seasoned issuer, as defined in Rule 405 of the Securities Act. Yes o No ý
Indicate by check mark if the registrant is not required to file reports pursuant to Section 13 or Section 15(d) of the Act. Yes o No ý
Indicate by check mark whether the registrant (1) has filed all reports required to be filed by Section 13 or 15(d) of the Securities Exchange Act of 1934 during the preceding 12 months (or for such shorter period that the registrant was required to file such reports), and (2) has been subject to such filing requirements for the past 90 days. Yes ý No o
Indicate by check mark whether the registrant has submitted electronically and posted on its corporate Website, if any, every Interactive Data File required to be submitted and posted pursuant to Rule 405 of Regulation S-T (§ 232.405 of this chapter) during the preceding 12 months (or for such shorter period that the registrant was required to submit and post such files). Yes o No o
Indicate by check mark if disclosure of delinquent filers pursuant to Item 405 of Regulation S-K is not contained herein, and will not be contained, to the best of registrant's knowledge, in definitive proxy or information statements incorporated by reference in Part III of this Form 10-K or any amendment to this Form 10-K. o
Indicate by check mark whether the registrant is a large accelerated filer, an accelerated filer, a non-accelerated filer, or a smaller reporting company. See the definitions of "large accelerated filer," "accelerated filer" and "smaller reporting company" in Rule 12b-2 of the Exchange Act. (Check one):
| Large accelerated filer o | Accelerated filer ý | Non-accelerated filer o (Do not check if a smaller reporting company) |
Smaller reporting company o |
Indicate by check mark whether the registrant is a shell company (as defined in Rule 12b-2 of the Exchange Act). Yes o No ý
The aggregate market value of the registrant's common stock, $0.001 par value, held by non-affiliates of the registrant as of June 30, 2010 was $372.4 million (based upon the closing sales price of such stock as reported on The NASDAQ Global Select Market on such date) which excludes an aggregate of 782,320 shares of the registrant's common stock held by officers, directors and affiliated stockholders. For purposes of determining whether a stockholder was an affiliate of the registrant at June 30, 2010, the registrant has assumed that a stockholder was an affiliate of the registrant at June 30, 2010 if such stockholder (i) beneficially owned 10% or more of the registrant's common stock and/or (ii) was affiliated with an executive officer or director of the registrant at June 30, 2010. Exclusion of such shares should not be construed to indicate that any such person possesses the power, direct or indirect, to direct or cause the direction of the management or policies of the registrant or that such person is controlled by or under common control with the registrant.
As of March 3, 2011, there were 33,369,590 shares of the registrant's common stock, $0.001 par value, outstanding.
DOCUMENTS INCORPORATED BY REFERENCE
Portions of the registrant's definitive Proxy Statement for the 2011 Annual Meeting of Stockholders to be filed with the Securities and Exchange Commission pursuant to Regulation 14A not later than 120 days after the end of the fiscal year covered by this Form 10-K are incorporated by reference in Part III, Items 10-14 of this Form 10-K.
2
This Annual Report on Form 10-K contains forward-looking statements. The forward-looking statements are contained principally in the sections entitled "Business," "Risk Factors," and "Management's Discussion and Analysis of Financial Condition and Results of Operations." These statements involve known and unknown risks, uncertainties and other factors which may cause our actual results, performance or achievements to be materially different from any future results, performances or achievements expressed or implied by the forward-looking statements. Forward-looking statements include, but are not limited to, statements about:
- •
- the extent and timing of future revenues, including the amounts of our current backlog, which
represents firm orders that have not completed installation and therefore have not been recognized as revenue;
- •
- the size or growth of our market or market
share;
- •
- the opportunity presented by new products or emerging
markets;
- •
- our expectations regarding our future backlog
levels;
- •
- our ability to align our cost structure and headcount with our current business
expectations;
- •
- the operating margins or earnings per share goals we may
set;
- •
- our ability to protect our intellectual property and operate our business without infringing upon
the intellectual property rights of others;
- •
- our ability to generate cash from operations and our estimates regarding the sufficiency of our
cash resources; and
- •
- our ability to acquire companies, businesses, products or technologies on commercially reasonable terms and integrate such acquisitions effectively.
In some cases, you can identify forward-looking statements by terms such as "anticipates," "believes," "could," "estimates," "expects," "intends," "may," "plans," "potential," "predicts," "projects," "should," "will," "would" and similar expressions intended to identify forward-looking statements. Forward-looking statements reflect our current views with respect to future events, are based on assumptions and are subject to risks and uncertainties. We discuss many of these risks in this Annual Report on Form 10-K in greater detail in the section entitled "Risk Factors" under Part I, Item 1A below. Given these uncertainties, you should not place undue reliance on these forward-looking statements. Also, forward-looking statements represent our estimates and assumptions only as of the date of this Annual Report on Form 10-K. You should read this Annual Report on Form 10-K and the documents that we reference in this Annual Report on Form 10-K and have filed as exhibits, completely and with the understanding that our actual future results may be materially different from what we expect. All references in this report to "Omnicell, Inc.," "Omnicell," "our," "us," "we," or the "Company" collectively refer to Omnicell, Inc., a Delaware corporation, and its subsidiaries.
Except as required by law, we assume no obligation to update any forward-looking statements publicly, or to update the reasons actual results could differ materially from those anticipated in any forward-looking statements, even if new information becomes available in the future.
We own various trademarks, copyrights and trade names used in our business, including the following: Omnicell®, the Omnicell logo, OmniRx®, OmniCenter®, OmniSupplier®, OmniBuyer®, SafetyStock®, WorkflowRx™, OmniLinkRx™, SecureVault™, SafetyMed®, Optiflex™, vSuite™, SinglePointe™, AnywhereRN™, Anesthesia Workstation™ ,Savvy™, Pandora®, Pandora Via™, and Executive Advisor™. This report also includes other trademarks, service marks and trade names of other companies. All other trade names used in this report are trademarks of their respective holders.
3
Overview
We are a leading provider of automated solutions for hospital medication and supply management. Our healthcare automation solutions are designed to enable healthcare facilities to acquire, manage, dispense and administer medications and medical-surgical supplies, and are intended to enhance patient safety, reduce medication errors, improve workflow and increase operational efficiency. When used in combination, our products and services provide healthcare facilities with a comprehensive solution designed to enhance patient safety and improve operational efficiency. Approximately 2,300 hospitals utilize one or more of our products, of which more than 1,600 hospitals in the United States have installed our automated hardware/software solutions for controlling, dispensing, acquiring, verifying and tracking medications and medical and surgical supplies.
The medical industry has become increasingly aware that the human element of patient care inevitably creates the risk of medication administration errors. The Institute of Medicine, a non-profit, non-governmental arm of the National Academies, published a landmark report in 2006 that estimated 1.5 million medication errors are made each year in the United States. Acute care facilities are facing increasing medication regulatory controls that we believe cannot be adequately supported by manual tracking systems or partially automated systems. Nursing shortages add an additional challenge to acute care facilities to meet regulatory controls and improve patient safety while still providing adequate patient care. Healthcare reform in the United States is driving the need for further process efficiency to control costs. We provide solutions to help hospitals address these problems. Our systems provide a comprehensive medication control and dispensing solution starting from the point of entry into the hospital, through the central pharmacy, to the nursing station and, ultimately, to the patient's bedside. Our solutions utilize advanced, software-based medication control and tracking algorithms that interact with hardware security features, resulting in a system that provides both the pharmacist and the nurse real-time safety controls. Our solutions also go a step further by providing medication barcode verification at every step of the medication administration process, from entry to the hospital through to administration to a patient. Our systems enable our customers to reduce or eliminate inefficiencies such as manual tracking and reconciliations, nursing time spent in obtaining medications and inventory control and extraneous process steps.
Similar to our medication solutions, our medical and surgical supply systems provide acute care hospitals control over consumable supplies critical to providing quality healthcare. This solution provides inventory control software that is designed to ensure critical supplies are always stocked in the right locations. At the same time, usage tracking helps hospital administrators to ensure that money is not wasted on excessive stores of supplies and helps optimize reimbursement by improving charge capture. Our systems automate the tracking of activities in perioperative areas such as the operating room and catheter lab, including tracking implantable tissue grafts for additional patient safety and regulatory compliance.
Business Strategy
Our strategy is to provide comprehensive patient safety solutions for the medication and medical and surgical supply needs of our customers. We have developed innovative solutions that are designed to meet the needs of the clinicians who use them on a day-to-day basis. We are continually working to enhance our product and service offerings, and we maintain flexibility in system design and the installation process to meet our customers' evolving needs. To meet these needs, we strive to provide proprietary, innovative solutions that help our customers stay focused on their goal of providing quality healthcare. Our solutions are designed to provide everything the customer requires to install and maintain medication and medical and surgical supply control. We believe superior solutions include proactively anticipating and meeting customer needs, listening carefully to our customers' prospective issues and meeting and exceeding their installation and maintenance support expectations.
4
Our goal of improving healthcare for everyone has led us to take certain steps in the development of our business and our long term approach to our market, such as:
- •
- Innovating products to address patient safety and cost-containment pressures facing healthcare facilities
while improving clinician workflow and overall operating efficiency;
- •
- Incorporating a broad range of clinical input into our product solution development to accommodate needs ranging from
those of stand-alone community hospitals to multi-hospital entities and Integrated Delivery Networks, or IDNs;
- •
- Developing new solutions to enhance our customers' existing systems and protect our customers' investments by preserving,
leveraging and upgrading their existing information systems, as well as striving to provide integration of our products with the other healthcare information systems our customers use; and
- •
- Providing a full service, positive experience for our hospital customers in the solution sales process, the timing and implementation of our product installations and the responsiveness of our support services.
We have developed or acquired numerous technologies that provide long-term solutions for our customers. Our own product development activities have brought a number of innovative and proprietary products to the market. Our most recently announced solutions include Savvy, a mobile medication control solution that allows both tracking and physical control of medications to be extended to the patient bedside. Savvy is designed to save nursing time, improve workflow efficiency for both pharmacy and nursing departments, and can significantly improve the safety of the medication administration process. Additionally, we have introduced new solutions to track controlled substances in the central pharmacy and to provide advanced reporting and data analytics, including the identification of possible drug diverters. These solutions are integrated with our overall medical and surgical supply chain inventory management and charge capture systems.
In addition to our own development, we have acquired products that extend patient safety controls to a wider range of applications and departments in the hospital. These include products for the central pharmacy, the operating room, the catheterization lab, the nursing areas and the patient point of care. We believe the breadth of our portfolio of automation products makes our solutions more valuable to our customers, allowing hospital clinicians to automate and control more of the medication and medical and surgical supply distribution processes. Looking forward, we expect to offer products with an even greater ability to improve patient safety for our customers, both through internal development and through acquisitions.
Industry Background
The acute care market in the United States, where most of our sales occur, is comprised of approximately 6,400 hospitals and facilities with a total capacity of approximately 940,000 acute care beds. Our customers include single location community hospitals, government hospitals and regional and national entities.
The delivery of healthcare in the United States still relies on a significant number of manual and paper-based processes. Most hospitals have deployed at least some automation solutions, but few have deployed them throughout the institution. The use of manual and paper-based systems in many hospital departments today results in highly complex and inefficient processes for tracking and delivering medications and supplies. Over the past two decades, healthcare facilities have made relatively small proportional investments in information technology. In addition, many existing healthcare information systems are unable to support the modernization of healthcare delivery processes and address mandated patient safety initiatives. These factors have contributed to medical errors and unnecessary process costs across the healthcare sector.
5
Healthcare providers and facilities are also affected by significant economic pressures. Demand for healthcare services continues to increase, driving shortages in the United States labor market for healthcare professionals, particularly nurses and pharmacists. Rising costs of labor, prescription drugs and new medical technology all contribute to increased spending. Governmental pressures surrounding healthcare reform have led to increased scrutiny of the cost and efficiency with which healthcare providers deliver their services. These factors, combined with the continuing consolidation in the healthcare industry, have significantly increased the need to improve the efficiency of healthcare professionals and to control costs.
Outside the United States, certain healthcare providers also are becoming increasingly aware of the benefits of automation. Many governmental and private entities look to the progress made over the last several years in the United States and are starting to invest significantly in information technology and automation. International growth in our industry is therefore expected to become significant over the next several years.
Key Industry Events and Reports
Reports by the Institute of Medicine, or IOM, the Food and Drug Administration, or FDA, and the Joint Commission for the Accreditation of Healthcare Organizations, also known as The Joint Commission, have increased public and healthcare industry awareness of the dangers caused by medication errors. Regulatory standards and industry guidelines, such as those published by the Institute for Safe Medication Practices, or ISMP, as well as the desire of healthcare organizations to provide premium quality service and avoid liability, have driven acute care facilities to prioritize investment in capital equipment to improve patient safety. Such reports and regulatory standards include:
- •
- In November 1999, the IOM issued a report that highlighted the prevalence of medical errors based on the results of more
than 30 independent studies. The report indicated that medical errors are among the top ten causes of death in the United States and that medication errors specifically were responsible for more than
an estimated 7,000 deaths in 1993.
- •
- In February 2001, the IOM issued a follow-up report that recommended increased investment in information
technology as a means of reducing medical errors and improving the overall quality of patient care.
- •
- In January 2003, the IOM released a report urging private and public organizations to focus on quality-improvement efforts
in 20 priority areas, including medication management.
- •
- On February 25, 2004, the FDA published a rule that requires linear barcodes on most prescription drugs. Drug
manufacturers, re-packagers, re-labelers and private label distributors are subject to the rule. The FDA estimated that the barcode rule, once implemented, would result in a
50% reduction in medication errors, 500,000 fewer adverse drug events over the subsequent 20 years, $93 billion in cost savings and other economic benefits.
- •
- In 2004, The Joint Commission set medication management standard 2.20, which requires that "medications are properly and
safely stored throughout the hospital." The Joint Commission audits all healthcare facilities seeking accreditation for proper medication handling control and reviews all exceptions to control
procedures.
- •
- In June 2006, the IOM issued a report which augmented a series of reports issued between 1999 and 2005 and indicated that
an estimated 1.5 million medication errors occur annually in the United States.
- •
- In 2008, and updated in 2009, the ISMP published guidelines for the Interdisciplinary Safe Use of Automated Dispensing Cabinets.
6
These reports, and the general awareness of patient safety in the medical field, have created a heightened desire to implement solutions that mitigate risks and improve the quality of healthcare. Automated medication distribution systems have become the standard of care and hospitals throughout the country are seeking to implement the most robust medication safety solutions available. Top teaching hospitals are among the early adopters of our new technologies and our customers include 11 of the 14 Honor Roll Hospitals, as rated by US News and World Reports.
Healthcare Reform
In 2009, the U.S. government passed the American Reinvestment and Recovery Act, or ARRA, which provides for, among other things, the funding of incentives for healthcare organizations to implement Electronic Healthcare Records. ARRA establishes minimal requirements for electronic healthcare usage and provides incentives for electronic healthcare adoption through 2015 and penalties for non-adoption after 2015. In 2010, the U.S. Congress passed the Patient Protection and Affordable Care Act, which prescribes broad-based measures designed to provide healthcare to a greater percentage of the population as well as limiting the cost of providing healthcare. We believe that both ARRA and the Patient Protection and Affordable Care Act will drive the need for increased efficiency in providing healthcare without providing reductions in healthcare standards. We believe Omnicell products are well-positioned to obtain certification of some meaningful use criteria, as defined by the Office of National Coordinator, and to assist hospital organizations in achieving the goals of the new laws by allowing them to reduce process steps, to eliminate manual tracking, to reduce waste from expired medications and supplies, to track quality levels and to reduce errors that result in re-admissions.
Our Products and Services
We provide solutions that are designed to enable healthcare professionals to reduce medication errors and improve administrative controls, while simultaneously improving workflow and increasing a healthcare facility's operational efficiency. Our products are designed to enable our customers to enhance and improve the effectiveness of the medication-use process, the efficiency of the medical-surgical supply chain, overall patient care and clinical and financial outcomes of healthcare facilities. From the point at which a medication arrives at the receiving dock to the time it is administered, our systems are capable of storing, packaging, barcoding, ordering and issuing the medication, as well as providing information and controls on its use and reorder. Our medication-use product line includes systems for medication dispensing in acute care nursing departments, central pharmacy automation, physician order management and nursing workflow automation at the bedside. Our supply product lines provide healthcare facilities with cost data which enables detailed quantification of charges for payer reimbursement, inventory management, implant monitoring and timely reorder of supplies. These products range from industrial-grade software-driven carousels for managing large amounts of inventory in the central pharmacy to high-security closed-cabinet systems and software to open-shelf and combination solutions in the nursing unit, catheterization lab and operating room. Our combination medication-use and supply products allow the operating departments to store, track and dispense medications and supplies through a single system while optimizing the workflows for each type of medication or supply managed. We also provide services including customer education and training to help customers to optimize their use of our technology.
Medication Use Products
Our medication-use product line includes our OmniRx, SinglePointe, AnywhereRN, Anesthesia Workstation, WorkflowRx, SecureVault, OmniLinkRx, Savvy Mobile Carts and Pandora products. To provide our customers with end-to-end medication control, our product line incorporates barcode technology throughout. Our solutions incorporate third generation technology, which we believe is the most advanced on the market today. Medication control technology has evolved over the past 30 years.
7
First generation technology provided secure electronic storage and dispensing of medications in distributed locations in the hospital but was only economically viable to deploy with the most frequently used drugs and controlled substances. Second generation technology added specific patient data, electronically transmitted from other hospital information systems that, when combined with information stored in Omnicell systems, guides clinicians to the medications needed to care for specific patients at specific times in the day. Second generation technology was still limited with respect to the number and type of medications that could be tracked. Third generation technology, which we provide in our SinglePointe solution, is able to track medication dispensing and dynamically manage up to 100% of medications specific to individual patients. Used in combination with the rest of our suite of medication use solutions, we believe that SinglePointe provides the highest level of medication management automation available in the market today. Each of the products in our medication-use solution suite is summarized in the table below.
Product
|
Use in Hospital | Description | ||
|---|---|---|---|---|
| OmniRx | Any nursing area in a hospital department that administers medications | Secure dispensing system that automates the management and dispensing of medications at the point of use. | ||
| SinglePointe | Any nursing area in a hospital department that administers medications | Software product for use in conjunction with the OmniRx product that controls medications on a patient-specific basis, allowing automated control of up to 100% of the medications used in a hospital. | ||
| AnywhereRN | Any nursing area in a hospital department that administers medications | Software that allows nurses to remotely operate automated dispensing cabinets from virtually any workstation in the hospital. | ||
| Pandora | Hospital central pharmacy and general hospital management | Advanced reporting and data analytics tools. | ||
| Savvy Mobile Carts | Any nursing area in a hospital department that administers medications | A mobile wireless computer and dispensing system that provides a mobile platform for hospital information systems and a convenient and secure method for nurses to move medication and supplies. | ||
| OmniLinkRx | Hospital central pharmacy | Prescription routing system that allows nurses and doctors to scan handwritten prescription orders for electronic delivery to pharmacists for approval and filling. | ||
| WorkflowRx | Hospital central pharmacy | Automated pharmacy storage, retrieval and packaging systems. | ||
| SecureVault | Hospital central pharmacy | Controlled substance barcode inventory management system. | ||
| Anesthesia Workstation | Operating room | Secure dispensing system for the management of anesthesia supplies and medications. |
Nursing Floor Solutions
The OmniRx solution is the core of our medication control solutions. The OmniRx solution is a dispensing cabinet that automates the management and dispensing of medications at the point of use, featuring biometric fingerprint identification, advanced single-dose dispensing, barcode confirmation and a wide range of drawer modules enabling the establishment of various security levels. Software features of the OmniRx include patient profiling, notification of medications due, a variety of security features, waste management, clinical pharmacology and integration with an Internet browser for clinical reference information.
8
The SinglePointe solution is a software extension to the OmniRx solution that allows pharmacists to automate the distribution of specially handled medications, enabling control of up to 100% of all medications through the automated dispensing system. The SinglePointe solution allows for patient-specific medication control which extends the benefits of automated medication distribution, including increased patient safety, consistency in tracking and inventory control, simplification of procedures and improved monitoring of controlled substances, to a broader range of the medication distribution process in the hospital.
The AnywhereRN solution is a software solution that allows nurses to operate the automated dispensing cabinets from virtually any remote workstation within the hospital. This software enables enhanced workflow for nurses such that they are no longer limited to being directly in front of the cabinet to perform certain medication administration functions. AnywhereRN is intended to reduce nurse distractions in the medication administration process as cabinet operations can be done in private or quieter areas. It is also intended to eliminate congestion at the cabinet by minimizing nurse queuing to withdraw medications.
The Pandora solution is comprised of reports and analytical software for medication diversion detection, customizable user options, hospital inventory management controls and point-of-care data analytics among other features designed to assist hospitals in their efforts to improve patient safety and regulatory compliance.
The Savvy Mobile Cart solution provides a mobile workstation for nurses, equipped with locking drawers for secure transportation of medications and patient supply items. This is a mobile medication control solution that allows both tracking and physical control of medications extended to the patient bedside. Savvy Mobile Cart is designed to provide efficient workflow support, allowing nurses to remotely access the automated dispensing cabinet utilizing AnywhereRN, saving nursing time and minimizing the risk of interruptions to enhance patient safety. This same mobile solution can be used to access hospital applications including electronic medical records and electronic medication administration records.
Central Pharmacy Solutions
The OmniLinkRx solution is a physician order software product that automates communication between nurses and the pharmacy. Used in the central pharmacy, the OmniLinkRx solution simplifies the communication of handwritten physician orders from remote nursing stations to the pharmacy.
The WorkflowRx solution is an automated storage, retrieval, inventory management and repackaging solution for the central pharmacy. It is designed to help pharmacists ensure that the right medications are stored in and retrieved from proper locations, both in the central pharmacy and in automated dispensing cabinets. The WorkflowRx solution is deployed on a storage and retrieval carousel, on a repackaging system or on both. Barcode administration through the WorkflowRx solution is designed to help ensure that medications are stocked correctly from their point of entry into the healthcare facility. Labeling medications with barcodes, using a repackaging system enables bedside medication administration solutions, such as the Savvy solution, to perform barcode checking at the patient bedside.
The SecureVault solution is a controlled substance barcode inventory management system. The SecureVault software, coupled with our automated dispensing technology, enables healthcare facilities to track, monitor and control the movement of controlled substances from the point of initial receipt from the wholesaler throughout internal distribution. The SecureVault solution maintains a perpetual item inventory and complete audit using integrated barcode technology with both fixed and portable scanners. Barcoded forms and labels may also be generated directly from the SecureVault system.
9
Operating Room Solutions
The Anesthesia Workstation solution is a system for the management of anesthesia supplies and medications. The system is tailored for the workflow of the clinician working in the operating room. The Anesthesia TT solution is a fixed-position tabletop unit designed as a medication-only system.
Medical and Surgical Supply Products
Our medical and surgical supply products provide acute care hospitals control over consumable supplies critical to providing quality healthcare. These solutions provide inventory control software that is designed to ensure that critical supplies are always stocked in the right locations. At the same time, usage tracking helps hospital administrators to ensure that money is not wasted on excessive stores of supplies and helps optimize reimbursement by improving charge capture.
Implantable tissue and bone grafts can also be monitored and tracked for additional patient safety and regulatory compliance. The bone and tissue features are integrated with our overall medical and surgical supply chain inventory management and charge capture systems. These solutions are designed for use in the materials management department, the nursing unit and specialty areas such as the catheterization lab and the operating room. They integrate with other information management systems and utilize barcode technology extensively.
Our supply product line includes the Omnicell Supply Cabinet, Supply/Rx Combination Cabinet, Omnicell Tissue Center, OptiFlex SS, OptiFlex CL and OptiFlex MS. Each of the supply-line products is summarized in the table below.
Product
|
Use in Hospital | Description | ||
|---|---|---|---|---|
Omnicell Supply Solution |
Any nursing area in a hospital department that uses patient care supplies | Secure dispensing systems that automate the management and dispensing of medical and surgical supplies at the point of use. | ||
Supply/Rx Combination Solution |
Any nursing area in a hospital department that uses patient care supplies and administers medications |
Secure dispensing systems that manage both supplies and medications from the same cabinets, using the same user interface screens, in medical and surgical units and specialty areas. |
||
Omnicell Tissue Center |
Perioperative areas of the hospital |
Manages the chain of custody for bone and tissue specimens from the donor to the patient in the operating room. |
||
OptiFlex SS |
Perioperative areas of the hospital |
Specialty modules for the perioperative areas. |
||
OptiFlex CL |
Procedure areas in the hospital including the Cardiac Catheterization Lab |
Specialty modules for the cardiac catheterization lab and other procedure areas. |
||
OptiFlex MS |
Any nursing area in a hospital department that administers supplies |
System for the management of medical and surgical supplies that provides the flexibility of utilizing barcode control in an open shelf environment. |
10
The Omnicell Supply Solution is a secure dispensing system that dispenses and tracks medical and surgical supplies at the point of use. Specialty modules are available for a variety of solutions to manage implants and medications used across the hospital as described below.
- •
- Supply/Rx Combination Solution is designed to manage medications and
supplies in one versatile cabinet or group of cabinets. This solution allows each department to manage supplies and medications independently, while tracking transaction data, inventory, expenses and
treatment costs through a single system.
- •
- Omnicell Tissue Center allows the operating room staff to manage the chain
of custody for bone and tissue specimens from the donor to the patient in the operating room. This solution enables compliance with The Joint Commission, requirements and Association of Operating Room
Nurses guidelines regarding the handling of tissue specimens.
- •
- OptiFlex SS manages supplies and preference cards in the perioperative
areas whether the supplies are stored on open shelves or in automated dispensing cabinets. The preference-list system creates a unique barcode for each surgical case, based on physician,
procedure, and patient and provides information on the case for data analysis, reporting and charge capture. The Suture Module is designed to be
integrated into the Omnicell Supply Solution to secure, dispense and automatically track suture usage.
- •
- OptiFlex CL manages supplies and creates cases in the cardiac
catheterization lab, interventional radiology, and other procedure areas. This solution allows real-time point of use data collection and accurate supply tracking regardless of whether
supplies are stored on open shelves or in automated dispensing cabinets. It also improves cost management through automated charge capture and case profiling by physician. The Catheter Module is
designed to be integrated into the Omnicell supply cabinet and allows hospitals to secure, dispense and electronically track accurate
catheter usage. The Implant Tracking Module records expiration date, lot and serial number information to enable compliance with Joint Commission and
FDA requirements regarding surgical implants in the event of a recall.
- •
- OptiFlex MS solution provides control over general medical and surgical supplies stored in open shelves or in automated dispensing cabinets.
Other Products and Services
Services. We provide services that include customer education and training and maintenance and support services, all provided on a time-and-material basis. We also provide fixed period service contracts to our customers for post-installation technical support with phone support, on-site service, parts and access to software upgrades. On-site service is provided by our field service team.
Omnicell Interface Software. Our interface software provides interface and integration between our medication-use products or our supply products and a healthcare facility's in-house information management systems. Interface software is designed to provide integration and communication of patient data, logistical data, inventory information, charge capture and billing information and other healthcare database information.
Sales and Distribution
We sell our medication dispensing and supply automation systems primarily in the United States and Canada. Approximately 97% of our product revenue for 2010 was generated in those markets. Our sales force is organized by geographic region in the United States and Canada. As of December 31, 2010, our combined direct, corporate and international distribution sales teams consisted of approximately 102 staff members. Nearly all of our direct sales team members have hospital capital equipment or clinical systems experience. All of our sales representatives sell the full breadth of the
11
Omnicell product line. Our corporate sales team focuses on large Integrated Delivery Networks, or IDNs, Group Purchasing Organizations, or GPOs, and the U.S. government.
The sales cycle for our automation systems is long and can take in excess of twelve months. This is due in part to the cost of our systems and the number of people within each healthcare facility involved in the purchasing decision. To initiate the selling process, the sales representative generally targets the director of pharmacy, the director of materials management or other decision makers and is responsible for educating each group within the healthcare facility about the benefits of automation. We have contracts with several GPOs that enable us to sell our automation systems to GPO-member healthcare facilities. The primary advantage to customers who buy our products pursuant to a GPO agreement is that they benefit from pre-negotiated contract terms and pricing. The benefit to the GPO is the fee earned as a percentage of sales, which is paid by us. These GPO contracts are typically for multiple years with options to renew or extend for up to two years and some of which can be terminated by either party at any time. Our current GPO contracts include AmeriNet, Inc., Broadlane Inc., HealthTrust Purchasing Group, L.P., MedAssets Supply Chain Systems, Novation, LLC, Premier, Inc. and Resources Optimization & Innovation. We have also contracted with the U.S. General Services Administration, allowing the Department of Veteran Affairs, the Department of Defense and other Federal Government customers to purchase or lease our products.
We offer multi-year, non-cancelable lease payment terms to assist hospitals in purchasing our systems by reducing their cash flow requirements. We sell the majority of our multi-year lease receivables to third-party leasing finance companies, but we also maintain a certain portion of our leases in-house.
Our field operations representatives support our sales force by providing operational and clinical expertise prior to the close of a sale and during installation of our automation systems. This group assists the customer with the technical implementation of our automation systems, including configuring our systems to address the specific needs of each individual customer. After the systems are installed, on-site support is provided by our field service team and technical support group.
We offer telephone technical support through our technical support center in Illinois. The support center is staffed 24 hours a day, 365 days a year. We have found that approximately 60% of our customers' service issues can be addressed either over the phone or by our support center personnel utilizing their on-hand remote diagnostics tools. In addition, we utilize remote dial-in software that monitors customer conditions on a daily basis. We offer a suite of remote monitoring features, our vSuite service programs, which proactively monitor system status and alert service personnel to potential problems before they lead to system failure.
In addition, our international sales team handles sales, installation and service through distribution partners in Asia, Australia, Europe, the Middle East and South America. We have been involved in a growing number of new installations in international markets and expect to continue growing its business in light of the expected increase in global demand for hospital automation solutions.
We have not sold and have no future plans to sell our products either directly or indirectly to customers located in countries that are identified as state sponsors of terrorism by the U.S. Department of State, or those subject to economic sanctions and export controls.
Manufacturing and Inventory
Our manufacturing process allows us to configure hardware and software in unique combinations to meet a wide variety of individual customer requirements. Our manufacturing process consists primarily of the final assembly of components and of subassemblies which are assembled by third-party single source manufacturers. We and our partners test subassemblies and perform a comprehensive inspection to assure the quality and reliability of our products. While many components of our systems
12
are standardized and available from multiple sources, certain components or subsystems are fabricated by a sole supplier according to our specifications and timing requirements.
Our arrangements with our contract manufacturers generally set forth quality, cost and delivery requirements, as well as manufacturing process terms, such as continuity of supply, inventory management, capacity flexibility, quality and cost management, oversight of manufacturing and conditions for the use of our intellectual property.
Our manufacturing organization procures components and schedules production based on the backlog of customer orders. Installation typically occurs between two weeks and nine months after the initial order is received, depending upon the customer's particular needs. We deploy a key operational strategy of operating with backlog levels that approximate the average installation cycle of our customers, which allows us to more efficiently manage our installation teams, improve production efficiencies, reduce inventory scrap and lower shipping costs.
Competition
The medication management and supply chain solutions market is intensely competitive. We compete directly with a number of companies and are affected by evolving and new technologies, changes in industry standards and dynamic customer requirements.
Our current direct competitors in the medication management and supply chain solutions market include CareFusion Corporation (which includes Pyxis Corporation), McKesson Automation Inc. (a business unit of McKesson Corporation), AmerisourceBergen Corporation (through its acquisition of MedSelect, Inc. and Automed), Talyst, Inc., Cerner Corporation, Emerson Electronic Co. (through its acquisitions of Flo Healthcare LLC, Lionville Systems, Inc. and medDispense), Stinger Medical, InfoLogix, Inc. Ergotron, Inc., Capso Solutions (through its acquisition of Artromick International, Inc.), Rubbermaid Medical Solutions (a business unit of Newell Rubbermaid Inc), WaveMark Inc., ParExcellence Systems, Inc., PhACTs LLC and Lawson Software, Inc.
We believe our products and services compare favorably with the offerings of our competitors, particularly with respect to proprietary technological advancements, system performance, system reliability, installation, applications training, service response time and service repair quality.
Intellectual Property and Proprietary Technology
We rely on a combination of patents, trademarks, copyright and trade secret laws, confidentiality procedures and licensing arrangements to protect our intellectual property rights.
We pursue patent protection in the United States and foreign jurisdictions for technology that we believe to be proprietary and that offers a potential competitive advantage for our products. Our issued patents relate to our "See & Touch" methodology used in our medication dispensing and supply automation systems, the use of locking and sensing lids with pharmacy drawers and the methods of restocking these drawers, and the use of guiding lights in the open matrix, locking lid and sensing lid pharmacy drawers. These patents also apply to our unit-dose mechanism and methods, the single-dose dispensing mechanism, the methods for restocking the single-dose drawers using exchange liners, certain methods for loading and unloading mobile carts, the method of use of scanners with a mobile cart, and certain methods for using radio frequency tags with storage items. Our patents expire at various times between 2013 and 2027.
All of our product system software is copyrighted and subject to the protection of applicable copyright laws. We intend to seek additional international and U.S. patents on our technology and to seek registration of our trademarks. We have obtained registration of Omnicell, the Omnicell logo, OmniRx, OmniCenter, OmniSupplier, OmniBuyer, SafetyStock, WorkflowRx, OmniLinkRx, SecureVault, SafetyMed, Optiflex, vSuite, SinglePointe, AnywhereRN, AnethesiaWorkstation, Savvy,
13
Pandora, Pandora Via, Executive Advisor and trademarks through the U.S. Patent and Trademark Office. Trade secrets and other confidential information are also important to our business. We protect our trade secrets through a combination of contractual restrictions and confidentiality and licensing agreements.
Research and Development
We utilize industry standard operating systems and databases, but generally develop our own application and interface software in our research and development facilities. New product development projects are prioritized based on customer input. During 2010, we announced a new version of our central pharmacy solution software, WorkflowRx 7, the new Savvy Mobile Cart product, a new version of our Pandora reporting software, VIA 2.0, a new version of SecureVault, a partnership with Cardinal Health to interface with the CardinalASSIST automatic replenishment program, a partnership with Helmer to provide a new medical grade refrigerator product, and a partnership with RxScan to provide additional barcode verification.
Employees
As of December 31, 2010, we had a total of 753 employees, including 80 in manufacturing, 114 in research and development, 139 in sales, of which 102 comprise our combined direct, corporate and inside sales teams, 18 in sales administration and 19 in field operations who perform pre-sales activity, 149 in customer service, 139 in field operations, 37 in marketing and 95 in general and administration positions. During 2010 we gained efficiency through office consolidations and other organizational changes that allowed the expansion of our sales teams without any overall addition to headcount from 2009. We have rebalanced our staff as needed, at times eliminating some functional positions and at other times adding new functional-specific positions to meet the evolving needs of our marketplace. None of our employees is represented by a collective bargaining agreement, nor have we experienced any work stoppage. We believe that our employee relations are good.
Business Under Government Contracts
A number of our U.S. government-owned or government-run hospital customers sign five-year leases, with payment terms that are subject to one-year government budget funding cycles. Failure of any of our U.S. government customers to receive their annual funding could impair our ability to sell to these customers, or to collect payments on our existing unsold leases. For additional information regarding these leases, see Item 1A, "Risk Factors."
Financing Practices Relating to Working Capital
We assist healthcare facilities in financing their cash outlay requirements for the purchase of our systems by offering multi-year, non-cancelable sales contracts. For additional information regarding these financing activities, see Note 1 of "Notes to Consolidated Financial Statements" included in this Annual Report on Form 10-K.
Product Backlog
Product backlog is the dollar amount of medication and supply dispensing systems for which we have purchase orders from our customers and for which we believe we will install, bill and gain customer acceptance within one year. Due to industry practice that allows customers to change order configurations with limited advance notice prior to shipment and occasional customer changes in installation schedules, we do not believe that backlog as of any particular date is necessarily indicative of future sales. However, we do believe that backlog is an indication of a customer's willingness to
14
install our solutions. As of December 31, 2010 and 2009, our backlog was $126.8 million and $113.6 million, respectively.
Company Information
We were incorporated in California in 1992 under the name of Omnicell Technologies, Inc. and reincorporated in Delaware in 2001 as Omnicell, Inc.
Available Information
We file reports and other information with the Securities and Exchange Commission, or SEC, including annual reports on Form 10-K, quarterly reports on Form 10-Q, current reports on Form 8-K and proxy or information statements. Those reports and statements as well as all amendments to those documents filed or furnished pursuant to Section 13(a) or 15(d) of the Securities and Exchange Act (1) are available at the SEC's Public Reference Room at 100 F Street, N.E., Room 1580, Washington, DC 20549, (2) are available at the SEC's internet site (www.sec.gov), which contains reports, proxy and information statements and other information regarding issuers that file electronically with the SEC and (3) are available free of charge through our website as soon as reasonably practicable after electronic filing with, or furnishing to, the SEC. You may obtain information on the operation of the Public Reference Room by calling the SEC at 1-800-SEC-0330. Our website address is www.omnicell.com. Information on our website is not incorporated by reference nor otherwise included in this report.
Executive Officers of the Registrant
The following table sets forth certain information as of March 11, 2011 about our executive officers:
Name
|
Age | Position | |||
|---|---|---|---|---|---|
Randall A. Lipps |
53 | President, Chief Executive Officer, and Chairman of the Board of Directors | |||
J. Christopher Drew |
45 | Senior Vice President, Field Operations | |||
Robin G. Seim |
51 | Chief Financial Officer and Vice President Finance, Administration and Manufacturing | |||
Dan S. Johnston |
47 | Vice President and General Counsel | |||
Nhat H. Ngo |
38 | Vice President, Strategy and Business Development | |||
Marga Ortigas-Wedekind |
49 | Vice President, Global Marketing and Product Development | |||
Randall A. Lipps was named Chief Executive Officer and President of Omnicell in October 2002. Mr. Lipps has served as Chairman of the Board and a Director of Omnicell since founding Omnicell in September 1992. Mr. Lipps received both a B.S. in economics and a B.B.A. from Southern Methodist University.
J. Christopher Drew joined Omnicell in April 1994 and was named Senior Vice President, Operations in January 2005. In January 2009, Mr. Drew was named Senior Vice President, Field Operations. From April 1994 to January 2005, Mr. Drew served in various management positions with Omnicell, including Vice President of Branded Solutions and Director of Corporate Development. Mr. Drew received a B.A. in economics from Amherst College and an M.B.A. from the Stanford Graduate School of Business.
Robin G. Seim joined Omnicell in February 2006 as Vice President and was named Chief Financial Officer in March 2006. In January 2009, Mr. Seim was named Chief Financial Officer and Vice President Finance, Administration and Manufacturing. From March 2005 to December 2005, Mr. Seim served as Chief Financial Officer of Mirra, Inc., a developer of digital content protection products.
15
From July 2001 to December 2004, Mr. Seim served as Chief Financial Officer of Candera, Inc., a maker of network-based storage controllers. From September 1999 to April 2001, Mr. Seim served as Chief Financial Officer of Villa Montage Systems, Inc., a provider of residential broadband access management systems. Prior to 1999, Mr. Seim held a number of management positions with Nortel Networks, Bay Networks, and IBM. Mr. Seim received a B.S. in accounting from California State University, Sacramento.
Dan S. Johnston joined Omnicell in November 2003 as Vice President and General Counsel. From April 1999 to November 2003, Mr. Johnston was Vice President and General Counsel at Be, Inc., a software company. From September 1994 to March 1999, Mr. Johnston was an attorney with the law firm Cooley LLP. Mr. Johnston received a B.S. in computer information systems from Humboldt State University and a J.D. from the Santa Clara University School of Law.
Nhat H. Ngo joined Omnicell in November 2008 as Vice President of Strategy and Business Development. From January 2007 to October 2008, Mr. Ngo served as Vice President of Business Development and Licensing for a business unit of Covidien, a global healthcare products company. From June 1999 to April 2006, Mr. Ngo worked at BriteSmile, Inc., a direct-to-consumer aesthetic technology company and served in a variety of senior leadership positions in marketing, sales, operations, strategic planning and corporate development. From May 2006 to December 2006 after the sale of BrightSmile, Inc., Mr. Ngo pursued personal interests, before resuming his career. From September 1997 to June 1999, Mr. Ngo practiced corporate law at Shaw Pittman. Mr. Ngo received a B.S. in commerce, with a concentration in finance, from the University of Virginia McIntire School of Commerce and a J.D. from the University of Virginia School of Law.
Marga Ortigas-Wedekind joined Omnicell in January of 2009 as Vice President, Marketing. In May 2009, she was named Vice President, Global Marketing and Product Development. From February 2002 to October 2008, Ms. Ortigas-Wedekind was the Senior Vice President Marketing, Development, and Clinical Affairs of Xoft, Inc., a medical device company. She continued to consult with Xoft, Inc. between her departure and the time she joined Omnicell. From February 2000 to December 2001, she served as Vice President of Sales and Marketing for ProDuct Health, (purchased by Cytyc Corporation) a company involved in early breast cancer diagnosis and risk stratification. From January 1990 to February 2000, she worked at Guidant Corporation's Vascular Intervention division, in various functions covering international and worldwide sales and marketing, culminating in the role of Director, Market Development. She received a B.A. in political economics from Wellesley College and an M.B.A. from the Stanford Graduate School of Business.
We have identified the following risks and uncertainties that may have a material adverse effect on our business, financial condition or results of operations. Our business faces significant risks and the risks described below may not be the only risks we face. Additional risks not presently known to us or that we currently believe are immaterial may also significantly impair our business operations. If any of these risks occur, our business, results of operations or financial condition could suffer and the market price of our common stock could decline.
Unfavorable economic and market conditions, a decreased demand in the capital equipment market and uncertainty regarding the rollout of government legislation in the healthcare industry could adversely affect our operating results.
Our operating results have been and may continue to be adversely affected by unfavorable global economic and market conditions as well as a lessening demand in the capital equipment market. Customer demand for our products is significantly linked to the strength of the economy. If demand for capital equipment caused by weak economic conditions and decreased corporate and government spending, deferrals or delays of capital equipment projects, longer time frames for capital equipment purchasing decisions and generally reduced expenditures for capital solutions continues, we will experience decreased revenues and lower revenue growth rates and our operating results could be materially and adversely affected.
16
Additionally, as the U.S. Federal government rolls out and implements recently enacted healthcare reform legislation, there may be an impact on our business. Healthcare facilities may decide to postpone or scale back spending until the implications of such healthcare reform legislation are more clearly understood, which may affect the demand for our products and harm our business.
The medication management and supply chain solutions market is highly competitive and we may be unable to compete successfully against new entrants and established companies with greater resources.
The medication management and supply chain solutions market is intensely competitive. We expect continued and increased competition from current and future competitors, many of which have significantly greater financial, technical, marketing and other resources than we do. Our current direct competitors in the medication management and supply chain solutions market include CareFusion Corporation (a spinoff from Cardinal Health, Inc., which includes Pyxis Corporation), McKesson Automation Inc. (a business unit of McKesson Corporation), AmerisourceBergen Corporation (through its acquisition of MedSelect, Inc. and Automed), Cerner Corporation, Emerson Electronic Co. (through its acquisitions of Flo Healthcare LLC, Lionville Systems, Inc. and medDispense), MDG Medical, PhACTs LLC, Talyst, Inc., Stinger Medical, Stanley Black and Decker (through their acquisition of InfoLogix, Inc),. Ergotron, Inc., Capso Solutions, (through their acquisition of Artromick International, Inc.), Rubbermaid Medical Solutions (a business unit of Newell Rubbermaid Inc), WaveMark Inc., ParExcellence Systems, Inc. and Lawson Software, Inc.
The competitive challenges we face in the medication management and supply chain solutions market include, but are not limited to, the following:
- •
- our competitors may develop, license or incorporate new or emerging technologies or devote greater resources to the
development, promotion and sale of their products and services;
- •
- certain competitors have greater brand name recognition and a more extensive installed base of medication and supply
dispensing systems or other products and services than we do, and such advantages could be used to increase their market share;
- •
- other established or emerging companies may enter the medication management and supply chain solutions market;
- •
- certain competitors may develop new features or capabilities for their products not previously offered that could compete
directly with our products;
- •
- current and potential competitors may make strategic acquisitions or establish cooperative relationships among themselves
or with third parties, including larger, more established healthcare supply companies, thereby increasing their ability to develop and offer products and services to address the needs of our
prospective customers; and
- •
- our competitors may secure products and services from suppliers on more favorable terms or secure exclusive arrangements with suppliers or buyers that may impede the sales of our products and services.
Competitive pressures could result in increased price competition for our products and services, fewer customer orders and reduced gross margins, any of which could harm our business.
Any reduction in the demand for or adoption of our medication and supply dispensing systems and related services would reduce our revenues.
Our medication and supply dispensing systems represent only one approach to managing the distribution of pharmaceuticals and supplies at healthcare facilities. A significant portion of domestic and international healthcare facilities still use traditional approaches in some form that do not include fully automated methods of medication and supply dispensing management. As a result, we must
17
continuously educate existing and prospective customers about the advantages of our products, which requires significant sales efforts and can cause longer sales cycles. Despite our significant efforts and extensive time commitments in sales to healthcare facilities, we cannot be assured that our efforts will result in sales to these customers.
In addition, our medication and supply dispensing systems typically represent a sizeable initial capital expenditure for healthcare organizations. Changes in the budgets of these organizations and the timing of spending under these budgets can have a significant effect on the demand for our medication and supply dispensing systems and related services. These budgets are often supported by cash flows that can be negatively affected by declining investment income, and influenced by limited resources, increased operational and financing costs, macroeconomic conditions such as unemployment rates and conflicting spending priorities among different departments. Any decrease in expenditures by healthcare facilities could decrease demand for our medication and supply dispensing systems and related services and reduce our revenues.
Changing customer requirements could decrease the demand for our products and services and our new product solutions may not achieve market acceptance.
The medication management and supply chain solutions market is characterized by evolving technologies and industry standards, frequent new product introductions and dynamic customer requirements that may render existing products obsolete or less competitive. The medication management and supply chain solutions market could erode rapidly due to unforeseen changes in the features and functions of competing products, as well as the pricing models for such products. Our future success will depend in part upon our ability to enhance our existing products and services and to develop and introduce new products and services to meet changing customer requirements. The process of developing products and services such as those we offer is extremely complex and is expected to become increasingly more complex and expensive in the future as new technologies are introduced. If we are unable to enhance our existing products or develop new products to meet changing customer requirements, demand for our products could decrease.
In addition, we cannot assure you that we will be successful in marketing any new products or services, that new products or services will compete effectively with similar products or services sold by our competitors or that the level of market acceptance of such products or services will be sufficient to generate expected revenues and synergies with our other products or services. Deployment of new products or services often requires interoperability with other Omnicell products or services as well as with healthcare facilities' existing information management systems. If these products or services fail to satisfy these demanding technological objectives, our customers may be dissatisfied and we may be unable to generate future sales.
Our current and potential customers may have other business relationships with our competitors and consider those relationships when deciding between our products and services and those of our competitors.
Many of our competitors are large companies that sell a variety of products and services into the healthcare market to our current and potential customers and may be better positioned to sell products with similar functionality. As a result, if a potential customer is a customer of one of these competitors, the customer may be motivated to purchase medication and supply dispensing systems or other automation solutions from our competitor in order to maintain or enhance their business relationship with that competitor, regardless of the products' performance or capabilities.
18
If we experience delays in installations of our medication and supply dispensing systems, or delays in the recognition of revenue associated with our medication and supply dispensing systems, our competitive position, results of operations and financial condition could be harmed.
The purchase of our medication and supply dispensing systems is often part of a customer's larger initiative to re-engineer its pharmacy, distribution and materials management systems and as a result, our sales cycles are often lengthy. The purchase of our medication and supply dispensing systems often entail larger strategic purchases by customers that frequently require more complex and stringent contractual requirements and generally involves a significant commitment of management attention and resources by prospective customers. These larger and more complex transactions often require the input and approval of many decision-makers, including pharmacy directors, materials managers, nurse managers, financial managers, information systems managers, administrators, lawyers and boards of directors. For these and other reasons, the sales cycle associated with the sale of our medication and supply dispensing systems is often lengthy and subject to a number of delays over which we have little or no control. A delay in, or loss of, sales of our medication and supply dispensing systems could have an adverse affect upon our operating results and could harm our business.
In addition, and in part as a result of the complexities inherent in larger transactions, the average time between the purchase and installation of our systems has increased over the past few years for reasons that are often outside of our control. Since we recognize revenue only upon installation of our systems at a customer's site, any delay in installation by our customers or delays in the determination that the earnings process is complete also causes a delay in the recognition of revenue for that system.
We may not be able to successfully integrate acquired businesses or technologies into our existing business, which could negatively impact our operating results.
As a part of our business strategy we may seek to acquire businesses, technologies or products in the future. On September 29, 2010, we acquired all of the outstanding capital stock of Pandora Data Systems, Inc. We cannot assure you that any acquisition or any future transaction we complete will result in long-term benefits to us or our stockholders, or that our management will be able to integrate or manage the acquired business effectively. Acquisitions entail numerous risks, including difficulties associated with the integration of operations, technologies, products and personnel that, if realized, could harm our operating results. Risks related to potential acquisitions include, but are not limited to:
- •
- difficulties in combining previously separate businesses into a single unit;
- •
- the substantial costs that may be incurred and the substantial diversion of management's attention from
day-to-day business when evaluating and negotiating such transactions and then integrating an acquired business;
- •
- discovery, after completion of the acquisition, of liabilities assumed from the acquired business or of assets acquired
that are broader in scope and magnitude or are more difficult to manage than originally assumed;
- •
- failure to achieve anticipated benefits such as cost savings and revenue enhancements;
- •
- difficulties related to assimilating the products of an acquired business; and
- •
- failure to understand and compete effectively in markets in which we have limited previous experience.
If we are unable to recruit and retain skilled and motivated personnel, our competitive position, results of operations and financial condition could be harmed.
Our success is highly dependent upon the continuing contributions of our key management, sales, technical and engineering staff. We believe that our future success will depend upon our ability to
19
attract, train and retain highly skilled and motivated personnel. As more of our products are installed in increasingly complex environments, greater technical expertise will be required. As our installed base of customers increases, we will also face additional demands on our customer service and support personnel, requiring additional resources to meet these demands. We may experience difficulty in recruiting qualified personnel. Competition for qualified technical, engineering, managerial, sales, marketing, financial reporting and other personnel can be intense and we cannot assure you that we will be successful in attracting and retaining qualified personnel. Competitors have in the past attempted, and may in the future attempt, to recruit our employees.
In addition, we have historically used stock options and other forms of equity compensation as key components of our employee compensation program in order to align employees' interests with the interests of our stockholders, encourage employee retention and provide competitive compensation packages. The effect of managing share-based compensation expense may make it less favorable for us to grant stock options, or other forms of equity compensation, to employees in the future. In order to continue granting equity compensation at competitive levels, we must seek stockholder approval for any increases to the number of shares reserved for issuance under our equity incentive plans and we cannot assure you that we will receive such approvals. Any failure to receive approval for proposed increases could prevent us from granting equity compensation at market competitive levels and make it more difficult to attract, retain and motivate employees. Further, to the extent that we expand our business or product lines through the acquisition of other businesses, any failure to receive any such approvals could prevent us from securing employment commitments from such newly acquired employees. Failure to attract and retain key personnel could harm our competitive position, results of operations and financial condition.
If we are unable to make effective use of our increased sales staff, we will have higher expenses without the benefits of increased market penetration and profitable sales growth.
During the fourth quarter of 2010, we increased direct territory sales staff by 30%. We expect an increase in the sales productivity of these new hires as they are trained and begin to develop sales leads in their assigned territories, however, there is no guarantee that this increased sales staff will result in a proportional increase in new business. If we encounter obstacles to the effectiveness of our sales staff, we will adjust our efforts to support their success, and this may result in higher expenses without corresponding increases in market penetration or sales growth.
We have experienced substantial changes in our revenue levels and we cannot be sure that we will be able to respond proactively to future changes in customer demand.
Our revenue increased by $8.9 million or 4.2% to $222.4 million for the year ended December 31, 2010 compared to $213.5 million for 2009. However, revenues for the year ended December 31, 2009 declined by $38.4 million or 15.2% from $251.9 million in 2008.
Current macroeconomic and general market conditions have contributed to revenue volatility and an overall decline in our revenues from 2008 levels. Our ability to adjust to rapid reductions in our revenue while still achieving or sustaining profitability is dependent upon our ability to manage costs and control expenses. If macroeconomic and general market conditions improve and return to historical levels, our ability to grow revenue and profitably will also be dependent on our ability to continue to manage costs and control expenses. If our revenue increases rapidly, we may not be able to manage this growth effectively. Future growth is dependent on our ability to continue to receive orders from customers, the volume of installations we are able to complete, our ability to continue to meet our customers' needs and provide a quality installation experience and our flexibility in manpower allocations among customers to complete installations on a timely basis.
20
Our expense control is dependent on our ability to continue to develop and leverage effective and efficient human and information technology systems, our ability to gain efficiencies in our workforce through the local and worldwide labor markets and our ability to grow our outsourced vendor supply model. Our expense growth rate may equal or exceed our revenue growth rate if we are unable to streamline our operations, or fail to reduce the costs or increase the margins of our products. In addition, we may not be able to reduce our expenses to keep pace with a reduction in our revenue, which could harm our results of operations and financial position.
Due to the lack of available credit opportunities, some of our customers may experience more difficulty in securing funds from third-parties to purchase our products, which could adversely affect the demand for our products or require us to extend credit terms to our customers.
Many of the products we sell and lease to our customers are capital equipment, and many of those customers finance their large capital equipment purchases or leases with funds secured from third-party lenders. Any deterioration in the general economic climate and in the credit market could make it more difficult for our customers to secure financing on large capital equipment transactions such as ours. To the extent that a tightening in the credit market results in difficulty for our customers in financing purchases or leases of our products from third-parties, demand for our products could decline and in order to sell our products, we may be required to extend credit to certain customers, which would negatively impact our cash balances, affect the classification of our short and long-term receivables and increase the risk of collections from such customers.
Our quarterly operating results may fluctuate and may cause our stock price to decline.
Our quarterly operating results may vary in the future depending on many factors that include, but are not limited to, the following:
- •
- our ability to successfully install our products on a timely basis and meet other contractual obligations necessary to
recognize revenue;
- •
- the size, product mix and timing of orders for our medication and supply dispensing systems, and their installation and
integration;
- •
- the overall demand for healthcare medication management and supply chain solutions;
- •
- changes in pricing policies by us or our competitors;
- •
- the number, timing and significance of product enhancements and new product announcements by us or our competitors;
- •
- the timing and significance of any acquisition or business development transactions that we may consider or negotiate and
the revenues, costs and earnings that may be associated with these transactions;
- •
- the relative proportions of revenues we derive from products and services;
- •
- fluctuations in the percentage of sales attributable to our international business;
- •
- our customers' budget cycles;
- •
- changes in our operating expenses and our ability to stabilize expenses;
- •
- our ability to generate cash from our accounts receivable on a timely basis;
- •
- the performance of our products;
- •
- changes in our business strategy;
21
- •
- macroeconomic and political conditions, including fluctuations in interest rates and tax increases; and
- •
- volatility in our stock price and its effect on share-based compensation expense.
Due to all of these factors, our quarterly revenues and operating results are difficult to predict and may fluctuate, which in turn may cause the market price of our stock to decline.
If we are unable to maintain our relationships with group purchasing organizations or other similar organizations, we may have difficulty selling our products and services.
Our current Group Purchasing Organization contracts include AmeriNet, Inc., Broadlane Inc., HealthTrust Purchasing Group, L.P., MedAssets Supply Chain Systems, Novation, LLC, Premier, Inc., and Resources Optimization & Innovation. We have also contracted with the U.S. General Services Administration, allowing the Department of Veteran Affairs, the Department of Defense and other Federal Government customers to purchase our products. These contracts enable us to more readily sell our products and services to customers represented by these organizations. Some of our contracts with these organizations are terminable at the convenience of either party. The loss of any of these relationships could impact the breadth of our customer base and could impair our ability to increase our revenues. We cannot assure you that these organizations will renew our contracts on similar terms, if at all, and they may choose to terminate our contracts before they expire.
The healthcare industry faces financial constraints and consolidation that could adversely affect the demand for our products and services.
The healthcare industry has faced, and will likely continue to face, significant financial constraints. For example, the shift to managed care in the 1990s put pressure on healthcare organizations to reduce costs, and the Balanced Budget Act of 1997 significantly reduced Medicare reimbursement to healthcare organizations. Recently enacted legislation such as the American Recovery and Reinvestment Act in 2009, the Patient Protection and Affordable Care Act in 2010 and other health reform legislation may cause customers to postpone purchases of our products while the impact of the legislation on their operations is determined. Our automation solutions often involve a significant financial commitment by our customers and, as a result, our ability to grow our business is largely dependent on our customers' capital and operating budgets. To the extent healthcare spending declines or increases more slowly than we anticipate, demand for our products and services could decline.
Many healthcare providers have consolidated to create larger healthcare delivery organizations to achieve greater market power. If this consolidation continues, it could reduce the number of our target customers. In addition, the resulting organizations could have greater bargaining power, which may lead to price erosion.
Our disclosure controls and procedures for internal control over financial reporting were not effective as of December 31, 2010. Our failure to maintain effective internal control over financial reporting in accordance with Section 404 of the Sarbanes-Oxley Act of 2002 could cause our stock price to decline.
If we fail to maintain effective internal control over financial reporting, as such standards are modified, supplemented or amended from time to time, we may not be able to ensure that we can conclude on an ongoing basis that we have effective internal control over financial reporting. Section 404 of the Sarbanes-Oxley Act of 2002 and the related rules and regulations of the SEC require annual management assessments of the effectiveness of our internal control over financial reporting and a report by our independent registered public accounting firm attesting to and reporting on these assessments
22
As of December 31, 2010 our management determined that our internal control over financial reporting was not effective under the Section 404 criteria, as a result of a material weakness in our income tax accounting. Specifically, our processes, procedures and controls related to the preparation and review of the annual tax provision were not effective to ensure that amounts recorded for the tax provision and the related current and deferred income tax asset and liability accounts were accurate and determined in accordance with U.S. generally accepted accounting principles.
Notwithstanding the above-mentioned material weakness, we believe that the consolidated financial statements are fairly stated in all material respects as of the year ended December 31, 2010. Our management has committed to corrective actions for the current fiscal year to remediate this material weakness, as described in Item 7 "Material Weakness in Internal Control over Financial Reporting".
We will be required to report on the status of our remediation efforts with regard to this material weakness in every future periodic filing, until such material weakness is fully-remediated and attested to by our independent registered public accounting firm. If we cannot in the future favorably assess, or our independent registered public accounting firm is unable to provide an unqualified attestation report on our assessment of, the effectiveness of our internal control over financial reporting, investors may lose confidence in the reliability of our financial reports, which could cause our stock price to decline.
If the market price of our common stock continues to be highly volatile, the value of your investment in our common stock may decline.
During the year ended December 31, 2010, our common stock traded between $10.93 and $15.38 per share. The market price for shares of our common stock has been and may continue to be highly volatile. In addition, our announcements or external events may have a significant impact on the market price of our common stock. These announcements or external events may include:
- •
- changes in our operating results;
- •
- developments in our relationships with corporate customers;
- •
- changes in the ratings of our common stock by securities analysts;
- •
- announcements by us or our competitors of technological innovations or new products;
- •
- announcements by us or our competitors of acquisitions of businesses, products, or technologies; or
- •
- general economic and market conditions.
Furthermore, the stock market as a whole from time to time has experienced extreme price and volume fluctuations, which have particularly affected the market prices for technology companies. These broad market fluctuations may cause the market price of our common stock to decline irrespective of our performance. In addition, sales of substantial amounts of our common stock in the public market could lower the market price of our common stock.
We depend on a limited number of suppliers for our medication and supply dispensing systems and our business may suffer if we were required to change suppliers to obtain an adequate supply of components and equipment on a timely basis.
Although we generally use parts and components for our products with a high degree of modularity, certain components are presently available only from a single source or limited sources. We have generally been able to obtain adequate supplies of all components in a timely manner from existing sources, or where necessary, from alternative sources of supply. We engaged multiple single source third-party manufacturers to build several of our sub-assemblies. The risk associated with changing to alternative vendors, if necessary, for any of the numerous components used to manufacture
23
our products could limit our ability to manufacture our products and harm our business. Our reliance on a few single source partners to build our hardware sub-assemblies, a reduction or interruption in supply from our partners or suppliers, or a significant increase in the price of one or more components could have an adverse impact on our business, operating results and financial condition. In addition, this impact could damage customer relationships and any failure of a contractor to perform adequately could harm our business.
Complications in connection with our ongoing business information system upgrades as well as the adoption of recently issued accounting standards may impact our results of operations, financial condition and cash flows.
We continue to upgrade our enterprise-level business information system with new capabilities. Based upon the complexity of some of the upgrades, there is risk that we will not see the expected benefit from the implementation of these upgrades in accordance with its anticipated timeline and will incur additional costs. In addition, effective for fiscal 2011, we are required to adopt ASU 2009-13 and 2009-14, which we anticipate will require us to modify our revenue recognition policy. We further anticipate that integration of these ASUs will require a substantial amount of management's time and attention and require integration with the recently implemented enterprise resource planning system. The implementation of the system and the adoption of the recently issued ASUs, in isolation as well as together, could result in operating inefficiencies and financial reporting delays, and could impact our ability to record necessary business transactions timely. All of these risks could adversely impact our results of operations, financial condition and cash flows.
Outstanding employee stock options have the potential to dilute stockholder value and cause our stock price to decline.
We frequently grant stock options to our employees. At December 31, 2010, we had options outstanding to purchase approximately 4.7 million shares of our common stock at exercise prices ranging from $2.70 to $29.16 per share, at a weighted-average exercise price of $12.86 per share. If some or all of these shares are sold into the public market over a short time period, the price of our common stock may decline, as the market may not be able to absorb those shares at the prevailing market prices. Such sales may also make it more difficult for us to sell equity securities in the future on terms that we deem acceptable.
If our U.S. government customers that lease our equipment do not receive their annual funding, or if the government contracting mandates require unilateral changes to our contract with government customers that lease, our ability to enter into lease arrangements or to recognize revenues on such future leases to U.S. government customers, to sell our U.S. government receivables to third-party leasing companies or to collect payments on unsold receivables from U.S. government customers could be impaired.
U.S. government customers that lease our equipment typically sign contracts with five-year payment terms that are subject to one-year government budget funding cycles. Further, the government has in certain circumstances mandated unilateral changes in its Federal Supply Services contract that could render our lease terms with the government less attractive. In our judgment and based on our history with these accounts, we believe these receivables are collectable. However, in the future, the failure of any of our U.S. government customers to receive their annual funding, or the government mandating changes to the Federal Supply Services contract could impair our ability to sell lease equipment to these customers or to sell our U.S. government receivables to third-party leasing companies. In addition, the ability to collect payments on unsold receivables could be impaired and may result in a write-down of our unsold receivables from U.S. government customers. As of December 31, 2010, the balance of our unsold leases to U.S. government customers was $13.1 million.
If we fail to manage our inventory properly, our revenue, gross margin and profitability could suffer.
Managing our inventory of components and finished products is a complex task. A number of factors, including, but not limited to, the need to maintain a significant inventory of certain components that are in short supply or that must be purchased in bulk to obtain favorable pricing, the general unpredictability of demand for specific products and customer requests for quick delivery schedules, may result in us maintaining large amounts of inventory. Other factors, including changes in market demand, customer requirements and technology, may cause inventory to become obsolete. Any excess or obsolete inventory could result in inventory write-downs, which in turn could harm our business and results of operations.
24
If we are unable to successfully interface our automation solutions with the existing information systems of our customers, they may choose not to use our products and services.
For healthcare facilities to fully benefit from our automation solutions, our systems must interface with their existing information systems. This may require substantial cooperation, incremental investment and coordination on the part of our customers and may require coordination with third party suppliers of the existing information systems. There is little uniformity in the systems currently used by our customers, which complicates the interfacing process. If these systems are not successfully interfaced, our customers could choose not to use or to reduce their use of our automation solutions, which would harm our business.
Our failure to protect our intellectual property rights could negatively affect our ability to compete.
Our success depends in part on our ability to obtain patent protection for technology and processes and our ability to preserve our trademarks, copyrights and trade secrets. We have pursued patent protection in the United States and foreign jurisdictions for technology that we believe to be proprietary and for technology that offers us a potential competitive advantage for our products. We intend to continue to pursue such protection in the future. Our issued patents relate to various features of our medication and supply dispensing systems. We cannot assure you that we will file any patent applications in the future, and that any of our patent applications will result in issued patents or that, if issued, such patents will provide significant protection for our technology and processes. Furthermore, we cannot assure you that others will not develop technologies that are similar or superior to our technology or that others will not design around the patents we own. All of our system software is copyrighted and subject to the protection of applicable copyright laws. Despite our efforts to protect our proprietary rights, unauthorized parties may attempt to copy aspects of our products or obtain and use information that we regard as proprietary, which could harm our competitive position.
Intellectual property claims against us could harm our competitive position, results of operations and financial condition.
We expect that developers of medication and supply dispensing systems will be increasingly subject to infringement claims as the number of products and competitors in our industry grows and the functionality of products in different industry segments overlaps. In the future, third parties may claim that we have infringed upon their intellectual property rights with respect to current or future products. In July 2009, Medacist Solutions Group LLC filed a lawsuit against us alleging among other things, that certain of our ProServ 1 offerings infringe a patent owned by Medacist. We do not carry special insurance that covers intellectual property infringement claims; however, such claims may be covered under our traditional insurance policies. These policies contain terms, conditions and exclusions that make recovery for intellectual property infringement claims difficult to guarantee. Any infringement claims, with or without merit, could be time-consuming to defend, result in costly litigation, divert management's attention and resources, cause product shipment delays or require us to enter into royalty or licensing agreements. These royalty or licensing agreements, if required, may not be available on terms acceptable to us, or at all, which could harm our competitive position, results of operations and financial condition.
Our software products are complex and may contain defects, which could harm our reputation, results of operations and financial condition.
We market products that contain software and software only products. Although we perform extensive testing prior to releasing software products, these products may contain undetected errors or bugs when first released. These may not be discovered until the product has been used by customers in different application environments. Failure to discover product deficiencies or bugs could require design
25
modifications to previously shipped products or cause unfavorable publicity or negatively impact system shipments, any of which could harm our business, financial condition and results of operations.
Product liability claims against us could harm our competitive position, results of operations and financial condition.
Our products provide medication management and supply chain solutions for the healthcare industry. Despite the presence of healthcare professionals as intermediaries between our products and patients, if our products fail to provide accurate and timely information or operate as designed, customers, patients or their family members could assert claims against us for product liability. Moreover, failure of health care facility employees to use our products for their intended purposes could result in product liability claims against us. Litigation with respect to liability claims, regardless of any outcome, could result in substantial cost to us, divert management's attention from operations and decrease market acceptance of our products. We possess a variety of insurance policies that include coverage for general commercial liability, technology errors and omissions liability, and we attempt to mitigate these risks through contractual terms negotiated with our customers. However, these policies and protective contractual terms may not be adequate against product liability claims. A successful claim brought against us, or any claim or product recall that results in negative publicity about us, could harm our competitive position, results of operations and financial condition. Also, in the event that any of our products is defective, we may be required to recall or redesign those products.
We are dependent on technologies provided by third-party vendors.
Some of our products incorporate technologies owned by third parties that are licensed to us for use, modification, and distribution. If we lose access to third-party technologies, or we lose the ongoing rights to modify and distribute these technologies with our products we will either have to devote resources to independently develop, maintain and support the technologies ourselves, pay increased license costs, or transition to another vendor. Any independent development, maintenance or support of these technologies by us or the transition to alternative technologies could be costly, time consuming and could delay our product releases and upgrade schedules. These factors could negatively and materially affect our ability to market, sell or distribute our products and in turn our business and prospects.
Our international operations may subject us to additional risks that can adversely affect our operating results.
We currently have operations outside of the United States, consisting of customer support activity through a contractor in India, international sales efforts centered in Canada, Europe and Asia and supply chain sourcing in Asia, supported by an office in Hong Kong. Our international operations subject us to a variety of risks, including:
- •
- the difficulty of managing an organization operating in various countries;
- •
- growing political sentiment against international outsourcing of support services;
- •
- reduced protection for intellectual property rights in some countries;
- •
- changes in foreign regulatory requirements;
- •
- the requirement to comply with a variety of international laws and regulations, including local labor ordinances and
changes in tariff rates;
- •
- fluctuations in currency exchange rates and difficulties in transferring funds from certain countries; and
- •
- political unrest, terrorism and the potential for other hostilities in areas in which we have facilities.
26
Our success depends, in part, on our ability to anticipate and address these risks. We cannot assure you that these or other factors will not adversely affect our business or operating results.
Government regulation of the healthcare industry could reduce demand for our products, or substantially increase the cost to produce our products.
While the manufacture and sale of our current products are not regulated by the United States Food and Drug Administration, or FDA, or the Drug Enforcement Administration, or DEA, these products, or our future products, if any, may be regulated in the future by these or other federal agencies due to future legislative and regulatory initiatives or reforms. Direct regulation of our business and products by FDA, DEA or other federal agencies could substantially increase the cost to produce our products and increase the time required to bring those products to market, reduce the demand for our products and reduce our revenues. In addition, healthcare providers and facilities that use our equipment and dispense controlled substances are subject to regulation by the DEA. The failure of these providers and facilities to comply with DEA requirements, including the Controlled Substances Act and its implementing regulations, could reduce demand for our products and harm our competitive position, results of operations and financial condition. Pharmacies are regulated by individual state boards of pharmacy that issue rules for pharmacy licensure in their respective jurisdictions. State boards of pharmacy do not license or approve our medication and supply dispensing systems; however, pharmacies using our equipment are subject to state board approval. The failure of such pharmacies to meet differing requirements from a significant number of state boards of pharmacy could decrease demand for our products and harm our competitive position, results of operations and financial condition. Similarly, hospitals must be accredited by The Joint Commission in order to be eligible for Medicaid and Medicare funds. The Joint Commission does not approve or accredit medication and supply dispensing systems; however, disapproval of our customers' medication and supply dispensing management methods and their failure to meet The Joint Commission requirements could decrease demand for our products and harm our competitive position, results of operations and financial condition.
While we have implemented a Privacy and Use of Information Policy and adhere to established privacy principles, use of customer information guidelines and related federal and state statutes, we cannot assure you that we will be in compliance with all federal and state healthcare information privacy and security laws that we are directly or indirectly subject to, including, without limitation, the Health Insurance Portability and Accountability Act of 1996, or HIPAA. Among other things, this legislation required the Secretary of Health and Human Services, or HHS, to adopt national standards governing the conduct of certain electronic health information transactions and protecting the privacy and security of personally identifiable health information maintained or transmitted by "covered entities," which include pharmacies and other healthcare providers with which we do business.
The standards adopted to date include, among others, the "Standards for Privacy of Individually Identifiable Health Information," which restrict the use and disclosure of personally identifiable health information by covered entities, and the "Security Standards," which require covered entities to implement administrative, physical and technical safeguards to protect the integrity and security of certain electronic health information. Under HIPAA, we are considered a "business associate" in relation to many of our customers that are covered entities, and as such, most of these customers have required that we enter into written agreements governing the way we handle and safeguard certain patient health information we may encounter in providing our products and services and may impose liability on us for failure to meet our contractual obligations. Further, pursuant to recent changes in HIPAA under the American Recovery and Reinvestment Act of 2009, or ARRA, we are now also covered under HIPAA similar to other covered entities and in some cases, subject to the same civil and criminal penalties as a covered entity. A number of states have also enacted privacy and security statutes and regulations that, in some cases, are more stringent than HIPAA and may also apply
27
directly to us. If our past or present operations are found to violate any of these laws, we may be subject to fines, penalties and other sanctions. In addition, we cannot predict the potential impact of future HIPAA standards and other federal and state privacy and security laws that may be enacted at any time on our customers or on Omnicell. These laws could restrict the ability of our customers to obtain, use or disseminate patient information, which could reduce the demand for our products or force us to redesign our products in order to meet regulatory requirements.
We may need additional financing in the future to meet our capital needs and such financing may not be available on favorable terms, if at all, and may be dilutive to existing stockholders.
We intend to continue to expend substantial funds for research and development activities, product development, sales and marketing activities and the potential acquisition and integration of complementary products and businesses. As a consequence, in the future we may need to seek additional financing to meet our working capital needs and to finance capital expenditures, as well as to fund operations or potential acquisitions. We may be unable to obtain any desired additional financing on terms favorable to us, if at all. If adequate funds are not available on acceptable terms, we may be unable to fund our expansion, successfully develop or enhance products, respond to competitive pressures or take advantage of acquisition opportunities, any of which could negatively affect our business. If we raise additional funds through the issuance of equity securities, our stockholders will experience dilution of their ownership interest. If we raise additional funds by issuing debt, we may be subject to certain contractual restrictions on our operations.
Changes in our tax rates, the adoption of new tax legislation or exposure to additional tax liabilities could affect our future results.
We are subject to taxes in the United States and other foreign jurisdictions. Our future effective tax rates could be affected by several factors, many of which are outside of our control, including: changes in the mix of earnings with differing statutory tax rates, changes in the valuation of deferred tax assets and liabilities, or changes in tax laws or their interpretation. We regularly assess the likelihood of adverse outcomes to determine the adequacy of our provision for taxes. We are also subject to examination of our income tax returns by the Internal Revenue Service and other tax authorities. There can be no assurance that the outcomes from these examinations will not materially adversely affect our financial condition and operating results.
Catastrophic events may disrupt our business and harm our operating results.
We rely on our network infrastructure, data centers, enterprise applications, and technology systems for the development, marketing, support and sales of our products, and for the internal operation of our business. These systems are susceptible to disruption or failure in the event of a major earthquake, fire, flood, cyber-attack, terrorist attack, telecommunications failure, or other catastrophic event. Further, many of these systems are housed or supported in or around our corporate headquarters located in California, near major earthquake faults, and where a significant portion of our research and development activities and other critical business operations take place. Disruptions to or the failure of any of these systems, and the resulting loss of critical data, which is not quickly recoverable by the effective execution of disaster recovery plans designed to reduce such disruption, could cause delays in our product development, prevent us from fulfilling our customers' orders, and could severely affect our ability to conduct normal business operations, the result of which would adversely affect our operating results.
28
Anti-takeover provisions in our charter documents, our stockholders' rights plan and under Delaware law may make an acquisition of us, which may be beneficial to our stockholders, more difficult.
We are incorporated in Delaware. Certain anti-takeover provisions of Delaware law and our charter documents as currently in effect may make a change in control of our company more difficult, even if a change in control would be beneficial to the stockholders. Our anti-takeover provisions include provisions in our certificate of incorporation providing that stockholders' meetings may only be called by the board of directors and provisions in our bylaws providing that the stockholders may not take action by written consent and requiring that stockholders that desire to nominate any person for election to the board of directors or to make any proposal with respect to business to be conducted at a meeting of our stockholders be submitted in appropriate form to our Secretary within a specified period of time in advance of any such meeting. Delaware law also prohibits corporations from engaging in a business combination with any holders of 15% or more of their capital stock until the holder has held the stock for three years unless, among other possibilities, the board of directors approves the transaction. Our board of directors may use these provisions to prevent changes in the management and control of our company. Also, under applicable Delaware law, our board of directors may adopt additional anti-takeover measures in the future.
In February 2003, our board of directors adopted a stockholder rights plan that may have the effect of discouraging, delaying or preventing a change in control of our company that is beneficial to our stockholders. Pursuant to the terms of the plan, when a person or group, except under certain circumstances, acquires 15% or more of our outstanding common stock (other than two then current stockholders and their affiliated entities, which will not trigger the rights plan unless they acquire beneficial ownership of 17.5% and 22.5% or more, respectively, of our outstanding common stock) or ten business days after commencement or announcement of a tender or exchange offer for 15% or more of our outstanding common stock, the rights (except those rights held by the person or group who has acquired or announced an offer to acquire 15% or more of our outstanding common stock) would generally become exercisable for shares of our common stock at a discount. Because the potential acquirer's rights would not become exercisable for our shares of common stock at a discount, the potential acquirer would suffer substantial dilution and may lose its ability to acquire us. In addition, the existence of the plan itself may deter a potential acquirer from acquiring us. As a result, either by operation of the plan or by its potential deterrent effect, a change in control of our company that our stockholders may consider in their best interests may not occur.
ITEM 1B. UNRESOLVED STAFF COMMENTS
None.
Our headquarters is located in leased facilities in Mountain View, California, and we believe that these facilities are sufficient for our current operational needs and that suitable additional space will be available on commercially reasonable terms to accommodate expansion of our operations, if necessary. In addition, we maintain leased office space in California, Illinois, Tennessee and China and we believe
29
these facilities are adequate for our current operational requirements. The following is a list of our facilities and their primary functions.
Site
|
Major Activity | |
|---|---|---|
| Mountain View, California | Administration, marketing, research and development and manufacturing | |
| Waukegan, Illinois | Technical support and training facility | |
| Nashville, Tennessee | Research and development and marketing | |
| Scotts Valley, California | Administration, marketing and research and development | |
| Hong Kong, China | Manufacturing support |
For additional information regarding our obligations pursuant to operating leases, see Note 12, "Commitments" to the "Notes to Consolidated Financial Statements" included in this Annual Report on Form 10-K.
Flo Healthcare Solutions, LLC. On December 11, 2007, we acquired Rioux Vision, Inc., which had an existing lawsuit in progress at the time of that acquisition. Omnicell was defending that lawsuit, as Rioux Vision is a wholly-owned subsidiary of Omnicell. On October 26, 2006, Rioux Vision was served with a complaint in a lawsuit entitled Flo Healthcare Solutions, LLC v. Rioux Vision, Inc., Case Number 1:06-cv-02600, in the United States District Court for the Northern District of Georgia, alleging claims of patent infringement regarding certain features of the mobile carts sold by Rioux Vision. On December 11, 2008, we were served with a complaint in a lawsuit entitled Flo Healthcare Solutions, LLC v. Omnicell, Inc., Case Number 1:06-cv-02600, in the same Court alleging similar claims of patent infringement regarding Omnicell's sale of the mobile carts acquired in the Rioux acquisition. In accordance with Accounting Standards Codification, or ASC, 805, "Business Combinations," we recorded a pre-acquisition contingency based on our assessment of its fair value in our preliminary purchase price allocation. The fair value for this pre-acquisition contingency represents the amount we and Rioux agreed to adjust the purchase price as a result of our acceptance of any and all costs and risks relating to this contingency. The pre-acquisition contingency was recorded as an accrued liability as of the acquisition date.
On March 4, 2009, we filed, but did not serve, a complaint against Flo Healthcare Solutions, or Flo, entitled Omnicell, Inc. v. Flo Healthcare Solutions LLC, Case Number C09 00923, in the United States District Court for the Northern District of California, with respect to the infringement of Omnicell's U.S. Patent Number 6,604,019. Flo received a courtesy copy of the complaint. On March 10, 2009, we consented to a motion that Flo filed requesting a stay of the Flo Healthcare Solutions LLC v. Rioux Vision, Inc. lawsuit pending the final outcome, including all appeals, of the inter parties reexamination of U.S. Patent No. 6,721,178, currently before the United States Patent and Trademark Office or the Reexamination, which was granted. We consented to a similar motion filed by Flo with respect to the stay of the Flo Healthcare Solutions LLC v. Omnicell, Inc. lawsuit, which was also granted. Under a tolling agreement between the parties, we agreed to dismiss without prejudice the Omnicell, Inc. v. Flo Healthcare Solutions LLC lawsuit, and Omnicell and Flo agreed to toll further actions under all three lawsuits pending the final outcome, including all appeals, of the Reexamination.
On September 30, 2010, Omnicell settled all pending litigation in the Northern District of Georgia with Flo Healthcare LLC, which is now part of the entity InterMetro Industries Corporation. Additionally, Omnicell paid InterMetro $2.7 million, and entered into a patent cross-license agreement with InterMetro, wherein Omnicell received an ongoing license to the patent at issue in the suits, and InterMetro received licenses to two Omnicell patents. The parties jointly filed a motion of dismissal for each of the cases with the Georgia court on October 25, 2010, and the court dismissed both cases, with prejudice, on January 26, 2011. In connection with this settlement, $2.4 million of previously accrued
30
liabilities were released and this gain was recorded as a reduction to selling, general and administrative expense in the three months ended September, 30, 2010.
Medacist Solutions Group, LLC. On July 8, 2009, Medacist Solutions Group LLC filed a complaint against Omnicell in U.S. District Court in the Southern District of New York, entitled Medacist Solutions Group LLC v. Omnicell, Inc., case number 09 CV 6128, alleging infringement of Medacist's U.S. Patent Number 6,842,736. The complaint also, among other claims, alleges that Omnicell breached the terms of a nondisclosure agreement (NDA) it had entered into with Medacist, and that Omnicell misappropriated Medacist's trade secrets and confidential information in violation of the NDA. Medacist is seeking unspecified monetary damages and an injunction against the Company's infringement of the specified patent and/or misuse of any of Medacist's trade secrets pursuant to the NDA or in violation of California code. Omnicell has responded to the complaint, denies the claims, and intends to defend the matter vigorously. In June 2010, the Court issued its Civil Case Management Plan and Scheduling Order indicating that discovery in the case will be conducted through March 11, 2011.
On October 20, 2010, the Company filed a declaratory judgment complaint against Medacist Solutions Group, LLC in the U.S. District Court in the Northern District of California, entitled Omnicell, Inc. and Pandora Data Systems, Inc. v. Medacist Solutions Group, LLC, Case Number 10-cv-4746 (the "California Action"). Pandora Data Systems, Inc. had entered into a Settlement and License Agreement with Medacist in October 2008 (the "Settlement Agreement") pursuant to which, among other things, Medacist granted to Pandora a non-exclusive license to Medacist's U.S. Patent Number 6,842,736. The Company seeks an order declaring that Omnicell, as now-owner of Pandora Data Systems, Inc., is entitled to certain rights and benefits under the license. On November 12, 2010, Medacist filed a motion to dismiss the California Action, or in the alternative, to transfer venue to the U.S. District Court for the District of Connecticut. On February 10, 2011, the Court granted Medacist's motion and dismissed the California Action without prejudice. On February 14, 2011, Omnicell and Pandora filed a notice of appeal regarding dismissal of the California Action with the U.S. Court of Appeals for the Ninth Circuit (the "California Appeal"). The California Appeal is now pending. Also on November 12, 2010, Medacist filed a motion in the U.S. District Court in the District of Connecticut to reopen a litigation entitled Medacist Solutions Group, LLC v. Pandora Data Systems, Inc., Case Number 3:07-CV-00692(JCH) (the "Connecticut Litigation"), which had been dismissed and administratively closed since October 29, 2008. Medacist seeks, among other things, relief from the Stipulation of Dismissal entered on October 29, 2008 dismissing the Connecticut Litigation for the limited purpose of interpreting and enforcing the Settlement Agreement, the entry of a temporary restraining order and preliminary and permanent injunctions prohibiting breaches of the Settlement Agreement, a finding that Pandora breached the Settlement Agreement and an award of monetary damages resulting from Pandora's alleged breaches. On December 3, 2010, the Company and Pandora filed a response to this motion. At this time, the Connecticut Litigation remains closed, and no hearings have been scheduled on Medacist's motion. While it is reasonably possible the Company could, at some point in the future, incur a loss in connection with this matter, management at this time cannot determine the range of any such potential loss.
As required under ASC 450, "Contingencies," we accrue for contingencies when we believe that a loss is probable and that we can reasonably estimate the amount of any such loss. We have made an assessment of the probability of incurring any such losses and such amounts are reflected in accrued liabilities in our consolidated financial statements. Except as otherwise indicated above, we believe that the outcomes in these matters are not probable and/or reasonably estimable. We believe that we have valid defenses with respect to legal matters pending against us. However, litigation is inherently unpredictable, and it is possible that cash flows or results of operations could be materially affected in any particular period by the unfavorable resolution of one or more of these contingencies or because of the diversion of management's attention and the creation of significant expenses.
ITEM 4. [REMOVED AND RESERVED]
31
ITEM 5. MARKET FOR REGISTRANT'S COMMON EQUITY, RELATED STOCKHOLDER MATTERS AND ISSUER PURCHASES OF EQUITY SECURITIES
Market for Our Common Stock
Our common stock is traded on The NASDAQ Global Select Market under the symbol "OMCL." The following table sets forth for the periods indicated the high and low sales prices per share of our common stock.
Fiscal Year Ended December 31, 2010
|
High | Low | |||||
|---|---|---|---|---|---|---|---|
Fourth Quarter |
$ | 14.97 | $ | 12.64 | |||
Third Quarter |
$ | 13.24 | $ | 10.93 | |||
Second Quarter |
$ | 14.93 | $ | 11.32 | |||
First Quarter |
$ | 15.38 | $ | 11.15 | |||
Fiscal Year Ended December 31, 2009
|
High | Low | |||||
|---|---|---|---|---|---|---|---|
Fourth Quarter |
$ | 12.19 | $ | 9.62 | |||
Third Quarter |
$ | 13.50 | $ | 9.85 | |||
Second Quarter |
$ | 11.39 | $ | 7.19 | |||
First Quarter |
$ | 12.97 | $ | 6.25 | |||
As of March 3, 2011, we had approximately 33,369,590 shares of common stock outstanding held by approximately 165 stockholders of record.
Dividend Policy
We have never declared or paid any cash dividends on our common stock. We currently expect to retain any future earnings for use in the operation and expansion of our business and do not anticipate paying any cash dividends on our common stock in the foreseeable future.
Purchases of Equity Securities By the Issuer and Affiliated Purchasers
The following table sets forth the number of shares of common stock repurchased by the Company during the three months ended December 31, 2010:
Period
|
Total number of shares (or units) purchased(1) |
Average price paid per share (or unit) |
Total number of Shares (or units) purchased as part of publicly announced plans or programs |
Maximum number (or approximate dollar value) of shares (or units) that may yet be purchased under the plans or programs |
||||||||||
|---|---|---|---|---|---|---|---|---|---|---|---|---|---|---|
October 1 - 31, 2010 |
— | $ | — | — | — | |||||||||
November 1 - 30, 2010 |
— | — | — | — | ||||||||||
December 1 - 31, 2010 |
5,533 | 14.25 | — | — | ||||||||||
Total |
5,533 | $ | 14.25 | — | $ | 25.0 million | ||||||||
- (1)
- Represents shares of common stock withheld in satisfaction of tax withholding obligations upon vesting of restricted stock units.
Performance Graph
The following graph compares total stockholder returns for Omnicell's common stock for the past five years to three indices: The NASDAQ Composite Index, the NASDAQ Health Services index and
32
the Standard & Poor's (S&P) Composite 1500 Health Care Sector Index (as calculated using a market cap weighting methodology). The total return for Omnicell's common stock and for each index assumes the reinvestment of all dividends, although cash dividends have never been declared on Omnicell's common stock, and is based on the returns of the component companies weighted according to their capitalizations as of the end of each annual period.
The NASDAQ Composite Index tracks the aggregate price performance of equity securities traded on The NASDAQ Stock Market. The NASDAQ Health Services Index tracks the aggregate price performance of health services equity securities. The S&P Composite 1500 Health Care Sector Index tracks the aggregate price performance of health care equity securities. Omnicell's common stock is traded on The NASDAQ Global Select Market and is a component of all three indices. The stock price performance shown on the graph is not necessarily indicative of future price performance.
Historically, we have used the S&P Composite 1500 Health Care Sector in the Total Return graph as our specific industry benchmark. For this transition year we are reporting both that index as well as the NASDAQ Health Services index, which is replacing it for future years. The NASDAQ Health Services Index is a more appropriate industry-specific benchmark for us, as certain aspects of our executive compensation plans are based on this index.
COMPARISON OF 5 YEAR CUMULATIVE TOTAL RETURN*
Among Omnicell, Inc., The NASDAQ Composite Index, The NASDAQ Health Services Index
and The S&P Composite 1500 Health Care Sector Index(1)
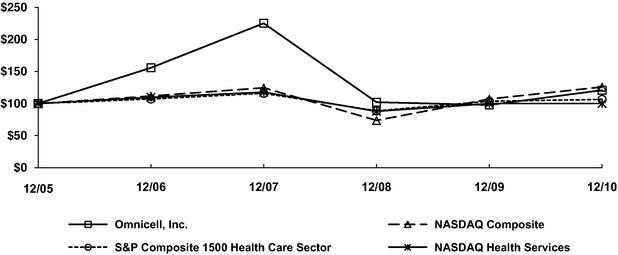
| |
12/05 | 12/06 | 12/07 | 12/08 | 12/09 | 12/10 | |||||||||||||
|---|---|---|---|---|---|---|---|---|---|---|---|---|---|---|---|---|---|---|---|
Omnicell, Inc. |
100.00 | 155.90 | 225.36 | 102.18 | 97.82 | 120.92 | |||||||||||||
NASDAQ Composite |
100.00 | 111.74 | 124.67 | 73.77 | 107.12 | 125.93 | |||||||||||||
S&P Composite 1500 Health Care Sector |
100.00 | 107.17 | 116.02 | 88.63 | 103.62 | 106.54 | |||||||||||||
NASDAQ Health Services |
100.00 | 109.80 | 117.78 | 87.97 | 99.96 | 100.19 | |||||||||||||
- *
- $100
invested on 12/31/05 in the NASDAQ Composite Index, NASDAQ Health Services Index, S&P Composite 1500 Health Care Sector Index and in
Omnicell, Inc. including reinvestment of dividends.
- (1)
- This section is not deemed "filed" with the SEC and is not to be incorporated by reference into any filing of Omnicell, Inc. under the Securities Act of 1933, as amended, or the Securities Exchange Act of 1934, as amended, whether made before or after the date hereof and irrespective of any general incorporation language in any such filing.
33
ITEM 6. SELECTED FINANCIAL DATA
OMNICELL, INC.
SELECTED FINANCIAL DATA
| |
Years Ended December 31, | ||||||||||||||||
|---|---|---|---|---|---|---|---|---|---|---|---|---|---|---|---|---|---|
| |
2010 | 2009 | 2008 | 2007 | 2006 | ||||||||||||
| |
(in thousands, except per share amounts) |
||||||||||||||||
Total revenues |
$ | 222,407 | $ | 213,457 | $ | 251,865 | $ | 213,081 | $ | 154,710 | |||||||
Income from operations(1) |
$ | 9,526 | $ | 669 | $ | 17,340 | $ | 18,224 | $ | 9,256 | |||||||
Net income |
$ | 4,892 | $ | 444 | $ | 12,724 | $ | 43,295 | $ | 10,365 | |||||||
Net income per share: |
|||||||||||||||||
Basic |
$ | 0.15 | $ | 0.01 | $ | 0.40 | $ | 1.35 | $ | 0.38 | |||||||
Diluted |
$ | 0.15 | $ | 0.01 | $ | 0.38 | $ | 1.28 | $ | 0.36 | |||||||
Shares used in per shares calculations: |
|||||||||||||||||
Basic |
32,651 | 31,691 | 32,076 | 32,080 | 27,345 | ||||||||||||
Diluted |
33,513 | 32,063 | 33,108 | 33,820 | 28,902 | ||||||||||||
Cash dividends declared per share |
$ | — | $ | — | $ | — | $ | — | $ | — | |||||||
| |
At December 31, | |||||||||||||||
|---|---|---|---|---|---|---|---|---|---|---|---|---|---|---|---|---|
| |
2010 | 2009 | 2008 | 2007 | 2006 | |||||||||||
| |
(in thousands) |
|||||||||||||||
Total assets |
$ | 343,224 | $ | 322,260 | $ | 308,542 | $ | 328,423 | $ | 154,630 | ||||||
Long-term obligations, net of current portion |
$ | 19,846 | $ | 21,405 | $ | 17,630 | $ | 15,963 | $ | 11,078 | ||||||
Total stockholders' equity |
$ | 265,214 | $ | 242,304 | $ | 233,557 | $ | 254,639 | $ | 89,996 | ||||||
The amounts shown above include the operating results from the following acquisitions: Rioux Vision, Inc. from December 11, 2007 and of Pandora Data Systems, Inc. from September 29, 2010.
- (1)
- Income from operations includes the following items:
| |
Years Ended December 31, | |||||||||||||||
|---|---|---|---|---|---|---|---|---|---|---|---|---|---|---|---|---|
| |
2010 | 2009 | 2008 | 2007 | 2006 | |||||||||||
| |
(in thousands) |
|||||||||||||||
Share-based compensation expense |
$ | 9,015 | $ | 9,725 | $ | 11,165 | $ | 11,162 | $ | 8,129 | ||||||
You should read the selected consolidated financial data above in conjunction with "Management's Discussion and Analysis of Financial Condition and Results of Operations" and the audited financial statements, notes thereto and other financial information included elsewhere in this Annual Report on Form 10-K. The consolidated statements of operations data for the years ended December 31, 2010, 2009, and 2008 and the consolidated balance sheet data at December 31, 2010 and 2009 are derived from our audited consolidated financial statements included elsewhere in this Annual Report on Form 10-K. The consolidated statement of operations data for the years ended December 31, 2007 and 2006, and the consolidated balance sheet data at December 31, 2008, 2007 and 2006 are derived from our consolidated audited financial statements, which are not included in this Annual Report on Form 10-K. Historical results are not necessarily indicative of the results to be expected in the future.
34
OMNICELL, INC.
SUPPLEMENTARY FINANCIAL DATA
| |
Quarters Ended | |||||||||||||
|---|---|---|---|---|---|---|---|---|---|---|---|---|---|---|
| |
March 31, 2010 | June 30, 2010 | September 30, 2010 | December 31, 2010 | ||||||||||
| |
(in thousands, except per share data) (unaudited) |
|||||||||||||
2010 |
||||||||||||||
Total revenues |
$ | 54,160 | $ | 54,693 | $ | 56,286 | $ | 57,268 | ||||||
Gross profit |
$ | 27,586 | $ | 28,868 | $ | 30,100 | $ | 31,363 | ||||||
Income from operations |
$ | 1,509 | $ | 3,492 | $ | 3,003 | $ | 1,522 | ||||||
Net income |
$ | 979 | $ | 1,965 | $ | 1,276 | $ | 672 | ||||||
Net income per share: |
||||||||||||||
Basic(1) |
$ | 0.03 | $ | 0.06 | $ | 0.04 | $ | 0.02 | ||||||
Diluted(1) |
$ | 0.03 | $ | 0.06 | $ | 0.04 | $ | 0.02 | ||||||
| |
March 31, 2009 | June 30, 2009 | September 30, 2009 | December 31, 2009 | ||||||||||
|---|---|---|---|---|---|---|---|---|---|---|---|---|---|---|
| |
(in thousands, except per share data) (unaudited) |
|||||||||||||
2009 |
||||||||||||||
Total revenues |
$ | 52,204 | $ | 52,643 | $ | 53,957 | $ | 54,653 | ||||||
Gross profit |
$ | 23,820 | $ | 26,929 | $ | 27,249 | $ | 27,223 | ||||||
Income (loss) from operations |
$ | (2,971 | ) | $ | 1,317 | $ | 944 | $ | 1,379 | |||||
Net income (loss) |
$ | (1,871 | ) | $ | 904 | $ | 854 | $ | 557 | |||||
Net income (loss) per share: |
||||||||||||||
Basic(1) |
$ | (0.06 | ) | $ | 0.03 | $ | 0.03 | $ | 0.02 | |||||
Diluted(1) |
$ | (0.06 | ) | $ | 0.03 | $ | 0.03 | $ | 0.02 | |||||
- (1)
- Quarterly earnings per share figures may not total to yearly earnings per share, due to rounding and fluctuations in the number of options included or omitted from diluted calculations based on the stock price or option exercise prices and/or net losses recorded in quarterly periods.
35
ITEM 7. MANAGEMENT'S DISCUSSION AND ANALYSIS OF FINANCIAL CONDITION AND RESULTS OF OPERATIONS
The following discussion and analysis should be read in conjunction with our financial statements and related notes included elsewhere in this Annual Report on Form 10-K. This discussion may contain forward-looking statements based upon current expectations that involve risks and uncertainties. Our actual results and the timing of selected events could differ materially from those anticipated in these forward-looking statements as a result of several factors, including those set forth under Item 1A "Risk Factors" and elsewhere in this Annual Report on Form 10-K. Unless otherwise stated, references in this report to particular years or quarters refer to our fiscal year and the associated quarters of those fiscal years.
Overview
We were incorporated in California in 1992 under the name Omnicell Technologies, Inc. and reincorporated in Delaware in 2001 as Omnicell, Inc. Our healthcare automation solutions are designed to enable healthcare facilities to acquire, manage, dispense and administer medications and medical and surgical supplies, and are intended to enhance patient safety, reduce medication errors, improve workflow and increase operational efficiency. We sell our medication dispensing and supply automation systems primarily in the United States. Approximately 3% of our product revenue is from outside the United States and Canada, although we believe adoption of our products internationally will increase in future years. Our sales force is organized by geographic region in the United States and Canada. We also sell through distributors in Asia, Australia, Europe, the Middle East and South America. We have not sold and have no future plans to sell our products either directly or indirectly to customers located in countries that are identified as state sponsors of terrorism by the U.S. Department of State, or those subject to economic sanctions and export controls. In 2010, we manufactured the majority of our systems in our California facility and refurbishment and spare parts activities were conducted in our Illinois facility.
In general, we recognize revenue when our systems are installed. For all of our products except Mobile Carts, installation generally takes place two weeks to nine months after our systems are ordered. Installation of Mobile Carts generally takes place one to three months after the order is received. The installation process at our customers' sites includes internal procedures associated with integrating large capital expenditures and time associated with adopting new technologies. Given the length of time necessary for our customers to plan for and complete the installation of our systems, our focus is on shipping products based on the installation dates requested by our customers and working at the customer's pace. The amount of revenue recognized in future periods may depend on, among other things, the terms and timing of lease contract renewals, timing of customer installations, additional product sales and the size of such transactions. We believe that future revenue will be affected by the competitiveness of our products and services.
Our revenue increased by 4.2% from $213.5 million in 2009 to $222.4 million in 2010. Of the $8.9 million increase in revenues from 2009 to 2010, $7.9 million was attributable to an increase in service revenues due to growth in the installed customer base over time and the later than expected timing of customer purchase orders for service contracts covering service periods commencing in 2009. The modest $1.0 million increase in product revenues for 2010 as compared with 2009 reflects the continued unstable economic environment during both periods as healthcare facilities continued to reduce or postpone their capital spending. We believe that economic conditions are improving and that spending in the healthcare industry and demand for our products will increase in the future. We believe
36
that the following four factors will be responsible for generating demand for our products in future periods:
- •
- We believe that the overall market demand for healthcare services will increase as the population grows, life expectancies
continue to increase, the quality of healthcare services increases and the availability of healthcare services increases;
- •
- We believe that the environment of increased patient safety awareness, increased regulatory control and increased need for
workflow efficiency through the adoption of technology in the healthcare industry will make our solutions a priority in the capital budgets of healthcare facilities;
- •
- We have continued to differentiate ourselves through a strategy intended to provide the best customer experience in the
healthcare industry; and
- •
- We have delivered industry-leading products with differentiated product features that are designed to appeal to nurses, pharmacists, supply chain managers, chief information officers and hospital management.
Our product backlog, consisting of orders accepted but not yet installed, increased from $113.6 million as of December 31, 2009 to $126.8 million at December 31, 2010. While our customers experienced a challenging financial environment caused by macroeconomic conditions, which contributed to decreasing investment returns, decreasing hospital foundation donations and decreasing reimbursement for procedures and services performed, we believe the macroeconomic environment that caused our customers to postpone their acquisition decisions began to improve in the latter half of 2009. Even with this apparent improvement, however, we are likely to continue experiencing delays in closing contracts until economic conditions appreciably improve.
In addition, beginning in 2009 we saw our order mix shift towards larger institutions and replacement of systems sold by our competitors, which caused increased variability in our order rates and size of orders and may cause increased variability in the timing of future revenues. We expect to operate through 2011 with backlog within our objective of six to nine months of forward revenue but we believe there will be variation from time to time in the total dollar value of orders in backlog.
Our key business strategies include:
- •
- Delivering solutions that are designed to provide our customers with the best experience in the healthcare industry
by:
- •
- Proactively anticipating and meeting customer product and service requirements;
- •
- Listening carefully to our customers' prospective issues; and
- •
- Meeting and exceeding our customers' installation and support needs.
- •
- Sustaining technological leadership in our products by:
- •
- Consistently innovating our product and service offerings;
- •
- Bringing new products and technologies to market through acquisitions and partnerships; and
- •
- Maintaining our flexibility in customer product design and in the installation process.
In order to implement these strategies during 2010, we:
- •
- Increased our sales organization to expand coverage of our growing installed base and to expand our reach to new
customers;
- •
- Expanded our proprietary product offerings through the acquisition of Pandora Data Systems;
37
- •
- Continued to announce and deliver new proprietary product offerings such as the Savvy mobile medication system, the
Pandora VIA2.0 analytical software, and the WorkflowRx 7.0 unit-dose packager; and
- •
- Expanded our market presence with new business partnerships with Cardinal Health and RxScan.
Our healthcare customers expect a high degree of partnership from their technology suppliers. Omnicell provides extensive installation planning and consulting as part of every product sale. Our customers medication control systems are mission critical to their success and our customers require the systems to be functional at all times. To help assure the maximum availability of our systems, our customers purchase maintenance and support contracts in one, two or five year increments. Our long-term liabilities, which were $19.8 million as of December 31, 2010 and $21.4 million as of December 31, 2009, are principally composed of long-term deferred service revenue, which was $19.2 million as of December 31, 2010, and $20.8 million as of December 31, 2009. Our deferred service revenue will be amortized to service revenue as the service contracts are executed.
In 2010, we generated positive overall cash flow of $6.4 million primarily due to improved net income, adjusted for non-cash expenses associated with depreciation, amortization and share-based compensation, and proceeds from the issuance of common stock under our employee stock purchase and stock option plans. The increases to cash were offset by $23.0 million in investing cash outflows for purchases of short-term investments, the acquisition of Pandora Data Systems, and the acquisition and development of productive long-lived assets. In 2009, we generated positive overall cash flow of $48.8 million, primarily due to lower accounts receivable, increased deferred service contracts and net income, adjusted for non-cash expenses associated with depreciation, amortization and share-based compensation. Net cash provided by operations continued to be positive for the fifth consecutive year at $20.6 million for the year ended December 31, 2010 and our cash and cash equivalents balance plus short-term investments as of December 31, 2010 was $183.7 million. We expect cash provided by operations to remain positive in 2011.
Our full-time headcount of 753 on December 31, 2010 was the same as our full-time headcount on December 31, 2009, but the functional mix changed including a 30% increase in direct territory sales staff during the fourth quarter of 2010 and offsetting reductions in other functional areas from consolidations and organizational changes earlier in the year. In the first quarter of 2009, we reduced our headcount significantly to align our business with overall demand for our products. Our full-time headcount declined from 844 on December 31, 2008 to 753 on December 31, 2009.
We record compensation costs of share-based awards, options and purchases of our common stock pursuant to our employee stock purchase plan in accordance with ASC 718, "Stock Compensation" (formerly referred to as SFAS No. 123(R)). Total share-based compensation expense for the year ended December 31, 2010 was $9.0 million, down from $9.7 million in 2009. We anticipate that the growth rate of our expenses from share-based compensation, may, at times, exceed the future growth rate of our revenues.
Our gross profit increased 12.1% for the year ended December 31, 2010 as compared to the year ended December 31, 2009 with gross margins increasing by 3.7% to 53.0%. The increases in gross profits and related margins were driven primarily by higher service revenues on an expanded installed base without proportional increases in service costs, favorable product mix to higher margin products and overall operational efficiencies in our production and customer service operations. We expect revenues to increase modestly in 2011 and we do not anticipate any major fluctuations in our gross margin beyond normal fluctuations caused by changes in product mix although revenues and gross margins may be adversely affected as a result of market price reductions and additional costs to expand our business.
38
Net income increased to $4.9 million in 2010 compared to $0.4 million in 2009 due to higher gross profit of $12.7 million as compared with 2009, which included a $7.0 million increase in gross profit from service revenues and $5.7 million from product revenues. This increase was partially offset by a $3.8 million increase in operating expenses primarily due to increased research and development activities, and a $4.3 million increase in income taxes. We also recorded pretax restructuring charges of $1.2 million in 2010 for facilities consolidation and $2.5 million in 2009 for a workforce reduction to align our business with overall demand for our products.
We operate in one business segment, the design, manufacturing, selling and servicing of medication and supply dispensing systems. Our chief operating decision maker, who is our chief executive officer, along with our management team evaluates our profit performance based on company-wide, consolidated results. The September 2010 acquisition of Pandora Data Systems resulted in neither the creation of a new reporting unit nor a new operating segment.
Critical Accounting Policies and Estimates
Our discussion and analysis of our financial condition and results of operations are based on our consolidated financial statements, which have been prepared in accordance with United States generally accepted accounting principles, or GAAP. The preparation of these financial statements requires us to make certain estimates and assumptions that affect the reported amounts of assets and liabilities, disclosure of any contingent assets and liabilities at the date of the financial statements and the reported amounts of revenues and expenses during the reporting periods. We regularly review our estimates and assumptions, which are based on historical experience and various other factors that are believed to be reasonable under the circumstances, the results of which form the basis for making judgments about the carrying values of certain assets and liabilities that are not readily apparent from other sources. Actual results may differ from these estimates and assumptions. We believe the following critical accounting policies are affected by significant judgments and estimates used in the preparation of our consolidated financial statements:
Revenue recognition. Our hardware products are integrated with software that is essential to their functionality. Additionally, we provide unspecified upgrades and enhancements related to our integrated software through our maintenance contracts for most of our products. Accordingly, we account for revenue in accordance with ASC 985, "Software" (formerly referred to as Statement of Position No. 97-2). For arrangements with multiple elements, we allocate revenue to each element using the residual method based on vendor specific objective evidence, or VSOE, of the undelivered elements. VSOE of fair value of the undelivered elements is based on the price charged when the element is sold separately.
Post-installation technical support, such as phone support, on-site service, parts and access to software upgrades, when and if available, is provided by us under separate support services terms. We recognize revenue for support services ratably over the related support services contract period.
We recognize revenue when the earnings process is complete, based upon our evaluation of whether the following four criteria have been met:
- •
- Persuasive evidence of an
arrangement. We use signed customer contracts and signed customer purchase orders as evidence of an arrangement for leases and sales.
For service engagements, we use a signed services agreement and a statement of work to evidence an arrangement.
- •
- Product delivery. Software and hardware product delivery is deemed to occur upon successful installation and receipt of a signed and dated customer confirmation of installation letter providing evidence that we have delivered what the customer ordered. In instances of a customer self-installed installation, product delivery is deemed to have occurred upon receipt of a signed and dated customer confirmation letter.
39
- •
- Fee is fixed or
determinable. We assess whether a fee is fixed or determinable at the outset of the arrangement based on the payment terms associated
with the transaction. We have established a history of collecting under the original contract without providing concessions on payments, products or services.
- •
- Collection is probable. We assess the probability of collecting from each customer at the outset of the arrangement based on a number of factors, including the customer's payment history and its current creditworthiness. If, in our judgment, collection of a fee is not probable, we defer the revenue until the uncertainty is removed, which generally means revenue is recognized upon our receipt of cash payment. Our historical experience has been that collection from our customers is generally probable.
In general, for sales not requiring our installation, we recognize sales on delivery of products to our customers. We recognize sales on shipment to distributors since we do not have further installation obligations and we do not allow for rights of return. We separately sell training and professional services which are not part of multiple element arrangements and not integral to the performance of our systems. We recognize revenue on training and professional services as they are performed. VSOE of training and of professional services is based on the price paid when sold separately.
A portion of our sales are made through multi-year lease agreements. We recognize product related revenue under sales-type leases at the net present value of the lease payment stream under ASC 840, "Leases" (formally referred to as SFAS No. 13), once our installation obligations are met. In order to optimize cash flows, we generally sell our non-U.S. government leases to third-party leasing finance companies on a non-recourse basis. We exclude from revenue any payments we receive for a new sale that relate to the termination of an existing lease. Generally, we have no obligation to the leasing company once the lease is sold. Some of our lease sales, mostly those relating to U.S. government hospitals, are retained in-house as sales-type leases which we account for in accordance with ASC 840. Interest income in sales-type leases is recognized in product revenue using the interest method.
Provision for allowances. We continually monitor and evaluate the collectability of our trade receivables and our net investment in sales-type leases based on a combination of factors. We record specific allowances for doubtful accounts when we become aware of a specific customer's inability to meet its financial obligation to us such as in the case of bankruptcy filings or deterioration of financial position. Estimates are used in determining our allowances for all other customers based on factors such as current trends, the length of time the receivables are past due and historical collection experience.
Valuation and impairment of goodwill, other intangible assets and other long lived assets. We account for goodwill and other intangible assets in accordance with ASC 350, "Intangibles—Goodwill and Other" (formerly referred to as SFAS No. 142). For the initial recognition and measurement of Goodwill and Intangibles resulting from Business Combinations, we use the guidance in ASC 805.
Goodwill and intangible assets with indefinite lives are not amortized; rather, they are tested for impairment at least annually or sooner whenever events or changes in circumstances indicate that they may be impaired. We perform our goodwill impairment tests during the fourth quarter of each year and between annual tests in certain circumstances.
To perform the goodwill impairment test, we determine the fair value of the reporting unit and compare the fair value to the reporting unit's carrying value. We believe we are one reporting unit, and therefore, we compare our fair value to the total net asset value on our balance sheet. If our total net asset value were to exceed our fair value, we would perform the second step of the impairment test. In the second step, we would compare the implied fair value of our goodwill to our carrying amount, taking a write-down to the extent the carrying amount exceeds the implied fair value. If our fair value
40
exceeds the carrying value of our net assets under step one, then no impairment is indicated and the test is complete.
We passed the first step of our annual impairment test for 2010. In addition, there were no indicators of impairment as of December 31, 2010.
We continually monitor events and changes in circumstances that could indicate carrying amounts of long-lived assets may not be recoverable. We review long-lived assets and certain purchased intangibles for impairment whenever events or changes in circumstances indicate that we will not be able to recover the asset's carrying amount. Recoverability of an asset is measured by comparing its carrying amount to the expected future undiscounted cash flows expected to result from the use and eventual disposition of that asset, excluding future interest costs that would be recognized as an expense when incurred. Any impairment to be recognized is measured by the amount by which the carrying amount of the asset exceeds its fair market value. Significant management judgment is required in:
- •
- identifying a triggering event that arises from a change in circumstances;
- •
- forecasting future operating results; and
- •
- estimating the proceeds from the disposition of long-lived or intangible assets.
In future periods, material impairment charges could be necessary should different conditions prevail or different judgments be made.
Significant management judgment is also required for initial recognition and measurement of goodwill and other intangibles assets resulting from Business Combinations per ASC 805. Management must assess the extent to which identified other intangibles assets are properly includable (and with the appropriate fair value) or properly excludable, by applying the recognition criteria. This judgment affects not only the other intangible assets but the remainder calculation of goodwill. The assessment of useful life for each acquired intangible impacts future financial position and operating performance through amortization expense.
Inventory. Inventories are stated at the lower of cost (utilizing standard costs, using the first-in, first-out method) or market. We routinely assess our on-hand inventory for timely identification and measurement of obsolete, slow-moving or otherwise impaired inventory. We write-down inventory for estimated obsolescence, excess or unmarketable quantities equal to the difference between the cost of the inventory and its estimated market value based on assumptions about future demand and market conditions. If actual future demand or market conditions are less favorable than we projected, additional inventory write-downs may be required.
Valuation of share-based awards. We account for share-based compensation in accordance with ASC 718, "Stock Compensation". We estimate the fair value of our employee stock awards at the date of grant using certain subjective assumptions, such as expected volatility which is based on a combination of historical and market-based implied volatility, and the expected term of the awards, which is based on our historical experience of employee stock option exercises including forfeitures. The valuation assumptions we use in estimating the fair value of employee share-based awards may change in future periods. We recognize the fair value of awards over their vesting period or requisite service period. In addition, we calculate our pool of excess tax benefits available within additional paid-in capital in accordance with the provisions of ASC 718.
Accounting for income taxes. We record a tax provision for the anticipated tax consequences of the reported results of operations. In accordance with GAAP, the provision for income taxes is computed using the asset and liability method, under which deferred tax assets and liabilities are recognized for the expected future tax consequences of temporary differences between the financial
41
reporting and tax bases of assets and liabilities, and for operating losses and tax credit carry forwards. Deferred tax assets and liabilities are measured using the enacted tax rates expected to apply to taxable income in the periods in which those tax assets and liabilities are expected to be realized or settled. In the event that these tax rates change, we will incur a benefit or detriment on our income tax expense in the period of change. We can also determine that all or part of the net deferred tax assets are not realizable in the future, we will record a valuation allowance that would be charged to earnings in the period such determination is made.
In accordance with ASC 740, "Income Taxes" (formerly referred to as SFAS No. 109), we recognize the tax benefit from an uncertain tax position if it is more likely than not that the tax position will be sustained on examination by the taxing authorities, based on the technical merits of the position. The tax benefits recognized in the financial statements from such positions are then measured based on the largest benefit that has a greater than 50% likelihood of being realized upon ultimate settlement. The calculation of tax liabilities involves significant judgment in estimating the impact of uncertainties in the application of GAAP and complex tax laws. Resolution of these uncertainties in a manner inconsistent with management's expectations could have a material impact on our financial condition and operating results.
Material Weakness in Internal Control Over Financial Reporting.
Our management concluded that, as of December 31, 2010, our internal control over financial reporting was not effective in providing reasonable assurance that a material misstatement of our financial statements would be prevented or detected on a timely basis, Our evaluation concluded that we have a material weakness related to accounting for income taxes. Specifically, our processes, procedures and controls related to the preparation and review of the annual tax provision were not effective to ensure that amounts recorded for the tax provision and the related current and deferred income tax asset and liability accounts were accurate and determined in accordance with U.S. generally accepted accounting principles.
Notwithstanding the above-mentioned material weakness, we believe that the consolidated financial statements are fairly stated in all material respects as of the year ended December 31, 2010.
Our management has committed to the following corrective actions for the current fiscal year:
- •
- Re-assessing the relationship with our third party consultant to ensure that there is an adequate level of
review of the tax provision performed by the consultant and an appropriate level of oversight and validation by our management;
- •
- Ensuring the internal review processes are carefully executed and monitored to properly account for changes to the
underlying supporting documentation; and
- •
- Implementing and utilizing income tax software to ensure a comprehensive reconciliation of all balance sheet tax accounts to our financial reporting system.
Recently Issued and Adopted Accounting Standards
In October 2009, the Financial Accounting Standards Board, or FASB, issued Accounting Standards Updates, or ASU 2009-13 and 2009-14, or ASU 2009-13 and ASU 2009-14, which amended ASC 605, "Revenue Recognition," and ASC 985-605, "Software-Revenue Recognition," respectively. ASU 2009-13 requires companies to allocate arrangement consideration in multiple-element arrangements based on an element's estimated selling price if vendor-specific or other third-party evidence of selling price is not available. ASU 2009-14 revises the guidance regarding the types of arrangements that fall under the scope of the software recognition guidance, providing a scope exception for many transactions that were previously within the scope of Subtopic ASC 985-605, including tangible products containing software components and non-software components that function
42
together to deliver the product's essential functionality and places them under Subtopic ASC 605-25, thus requiring the new multiple-element revenue allocation under ASU 2009-13. Both ASU 2009-13 and ASU 2009-14 are effective for fiscal years beginning on or after June 15, 2010 and we intend to adopt these ASUs at the beginning of our fiscal year 2011. We are currently evaluating how the adoption of these ASUs will impact our operating results, financial position and cash flows.
In July 2010, the FASB issued "Disclosure about the Credit Quality of Financing Receivables and the Allowance for Credit Losses" as ASU 2010-20, amending ASC 310, "Receivables." ASU 2010-20 requires certain disclosures about the credit quality of financing receivables and the related allowance for credit losses. In addition, disclosures are required related to the nature of credit risk inherent in the portfolio of financing receivables, how the credit risk is analyzed and assessed in arriving at the allowance for credit losses, and the changes and reasons for those changes in the allowance for credit losses. For public entities, the new disclosures for the end of a reporting period are effective for interim and annual reporting periods ending on or after December 15, 2010, with new disclosures about period activity effective for interim and annual reporting periods beginning on or after December 15, 2010. The period end disclosures are effective for us for December 31, 2010, and the period-activity disclosures are effective beginning with the first quarter of 2011. As ASU 2010-20 is a disclosure standard, we do not anticipate the adoption of this standard to have any impact on our operating results, financial position or cash flows.
Results of Operations
| |
For the Years Ended December 31, | ||||||||||||||||||||
|---|---|---|---|---|---|---|---|---|---|---|---|---|---|---|---|---|---|---|---|---|---|
| |
2010 | % of Revenue | 2009 | % of Revenue | 2008 | % of Revenue | |||||||||||||||
| |
(in thousands, except percentages) |
||||||||||||||||||||
Revenues: |
|||||||||||||||||||||
Product revenues |
$ | 171,100 | 76.9 | % | $ | 170,068 | 79.7 | % | $ | 211,461 | 84.0 | % | |||||||||
Service and other revenues |
51,307 | 23.1 | % | 43,389 | 20.3 | % | 40,404 | 16.0 | % | ||||||||||||
Total revenues |
222,407 | 100.0 | % | 213,457 | 100.0 | % | 251,865 | 100.0 | % | ||||||||||||
Cost of revenues: |
|||||||||||||||||||||
Cost of product revenues |
76,372 | 34.3 | % | 80,016 | 37.5 | % | 97,461 | 38.7 | % | ||||||||||||
Cost of service and other revenues |
28,079 | 12.7 | % | 27,011 | 12.7 | % | 25,770 | 10.2 | % | ||||||||||||
Restructuring charges |
39 | 0.0 | % | 1,209 | 0.6 | % | — | 0.0 | % | ||||||||||||
Total cost of revenues |
104,490 | 47.0 | % | 108,236 | 50.7 | % | 123,231 | 48.9 | % | ||||||||||||
Gross profit |
117,917 | 53.0 | % | 105,221 | 49.3 | % | 128,634 | 51.1 | % | ||||||||||||
Operating expenses: |
|||||||||||||||||||||
Research and development |
21,007 | 9.4 | % | 17,569 | 8.2 | % | 18,196 | 7.2 | % | ||||||||||||
Selling, general and administrative |
86,227 | 38.8 | % | 85,668 | 40.2 | % | 93,098 | 37.0 | % | ||||||||||||
Restructuring charges |
1,157 | 0.5 | % | 1,315 | 0.6 | % | — | 0.0 | % | ||||||||||||
Total operating expenses |
108,391 | 48.7 | % | 104,552 | 49.0 | % | 111,294 | 44.2 | % | ||||||||||||
Income from operations |
9,526 | 4.3 | % | 669 | 0.3 | % | 17,340 | 6.9 | % | ||||||||||||
Interest income, net |
431 | 0.2 | % | 523 | 0.3 | % | 3,382 | 1.3 | % | ||||||||||||
Income before provision for income taxes |
9,957 | 4.5 | % | 1,192 | 0.6 | % | 20,722 | 8.2 | % | ||||||||||||
Provision for income taxes |
5,065 | 2.3 | % | 748 | 0.4 | % | 7,998 | 3.1 | % | ||||||||||||
Net income |
$ | 4,892 | 2.2 | % | $ | 444 | 0.2 | % | $ | 12,724 | 5.1 | % | |||||||||
43
Product Revenues, Cost of Product Revenues and Gross Profit
The table below shows our product revenues, cost of product revenues and gross profit for the years ended December 31, 2010, 2009 and 2008 and the percentage change between those years:
| |
For the Years Ended December 31, |
Percentage Change | ||||||||||||||
|---|---|---|---|---|---|---|---|---|---|---|---|---|---|---|---|---|
| |
2010 to 2009 | 2009 to 2008 | ||||||||||||||
| |
2010 | 2009 | 2008 | |||||||||||||
| |
(in thousands) |
|
|
|||||||||||||
Product revenues |
$ | 171,100 | $ | 170,068 | $ | 211,461 | 0.6 | % | (19.6 | )% | ||||||
Cost of product revenues |
76,372 | 80,016 | 97,461 | (4.6 | )% | (17.9 | )% | |||||||||
Restructuring charges |
— | 1,008 | — | (100.0 | )% | — | ||||||||||
Gross profit |
$ | 94,728 | $ | 89,044 | $ | 114,000 | 6.4 | % | (21.9 | )% | ||||||
2010 compared to 2009
Product revenues remained nearly flat in 2010 as compared to 2009.
Cost of product revenues decreased by $3.6 million, or 4.6%, in 2010 as compared to 2009. The decrease was primarily due to a $1.0 million charge to record an inventory reserve in the first quarter of 2009 which did not recur in 2010, a $0.4 million favorable timing effect on expenses due to a reduction in accrued vacation in the second quarter of 2010, the overall favorable shift in product mix to revenues with lower associated costs along with the favorable results of outsourcing initiatives, ongoing cost reduction programs, and general operational efficiencies.
Gross profit on product revenue increased by $5.7 million, or 6.4%, in 2010 as compared to 2009, primarily as a result of lower product costs. Gross margin as a percent of revenues was 55.4%, compared to 52.4% in 2009. Product gross margin increased 3.0% due to the aforementioned $1.0 million inventory reserve recorded in the first quarter of 2009 which did not recur in 2010, a $1.0 million restructuring charge in the first quarter of 2009, a $0.4 million favorable timing effect on expenses due to a reduction in accrued vacation in the second quarter of 2010, and the overall favorable shift in product mix to revenues with lower associated costs along with the favorable results of outsourcing initiatives, ongoing cost reduction programs, and general operational efficiencies.
We expect product revenues to increase modestly in 2011 and we do not anticipate any significant fluctuations in our gross margin beyond normal fluctuations caused by changes in product mix.
2009 compared to 2008
Product revenues decreased $41.4 million, or 19.6%, in 2009 as compared to 2008. The decrease in product revenue was primarily due to a decrease in the number of installations of medication and supply automation systems and central pharmacy products, from both existing and new customers in our U.S. domestic markets which was due to general economic conditions affecting hospital capital purchasing.
Cost of product revenues decreased by $17.4 million, or 17.9%, in 2009 as compared to 2008. The decrease was primarily due to the reduction in product revenue resulting in a $17.9 million decrease in direct standard cost, and a decrease in spending of $1.9 million which was driven by lower headcount as a result of restructuring relating to our workforce reduction in the first quarter of 2009 and associated headcount related expenses such as travel. This was partially offset by an increase of $2.4 million in other costs, including $1.0 million related to reserves for excess and obsolete inventory.
Gross profit on product revenue decreased by $25.0 million, or 21.9%, in 2009 as compared to 2008, primarily as a result of lower product revenues. Gross margin as a percent of revenues was 52.4% compared to 53.9% in 2009. Direct product margins increased 2.1% due to both product mix and
44
better supply management. This increase was offset by increases in other costs primarily due to reserves for excess and obsolete inventory and increased depreciation expenses related to the implementation of our new accounting and materials system. In addition, we incurred a $1.0 million restructuring charge in the first quarter of 2009.
Service and Other Revenues, Cost of Service and Other Revenues and Gross Profit
Service and other revenues include revenues from service and maintenance contracts and rentals of automation systems. The table below shows our service and other revenues, cost of service and other revenues and gross profit for the years ended December 31, 2010, 2009 and 2008 and the percentage change between those years:
| |
For the Years Ended December 31, |
Percentage Change | ||||||||||||||
|---|---|---|---|---|---|---|---|---|---|---|---|---|---|---|---|---|
| |
2010 to 2009 | 2009 to 2008 | ||||||||||||||
| |
2010 | 2009 | 2008 | |||||||||||||
| |
(in thousands) |
|
|
|||||||||||||
Service and other revenues |
$ | 51,307 | $ | 43,389 | $ | 40,404 | 18.2 | % | 7.4 | % | ||||||
Cost of service and other revenues |
28,079 | 27,011 | 25,770 | 4.0 | % | 4.8 | % | |||||||||
Restructuring charges |
39 | 201 | — | (80.6 | )% | — | ||||||||||
Gross profit |
$ | 23,189 | $ | 16,177 | $ | 14,634 | 43.3 | % | 10.5 | % | ||||||
2010 compared to 2009
Service and other revenues increased by $7.9 million, or 18.2%, in 2010 as compared to 2009. The increase was primarily due to normal growth on an expanded installed base, as well as later than expected receipts of customer purchase orders for service contracts covering service periods starting in 2009, for which service revenues were recognized retrospectively from their commencement dates.
Cost of service and other revenues increased by $1.1 million, or 4.0%, in 2010 as compared to 2009. The increase was primarily due to an increase in spending of $1.0 million primarily related to salaries and related benefits costs and replacement part costs in support of the expanded service base.
Gross profit on service and other revenues increased by $7.0 million, or 43.3%, in 2010 as compared to 2009. The increase in gross margin on service and other revenues was due to the aforementioned revenue growth from service contracts initiated in 2009 with purchase orders received in 2010 and from normal growth on an expanded installed base without a proportional growth in service costs as these were incurred in prior periods.
We expect our service and other revenues and the associated gross profit to increase for 2011, in line with the continued expansion of our installed base of automation systems and service and maintenance contracts, the addition of service revenues associated with our recent acquisition of Pandora Data Systems. and continued cost controls.
2009 compared to 2008
Service and other revenues increased by $3.0 million, or 7.4%, in 2009 as compared to 2008. The increases in service and other revenues was primarily due to the result of an expansion in our installed base of automation systems and a resulting increase in number of support service contracts.
Cost of service and other revenues increased by $1.2 million, or 4.8%, in 2009 as compared to 2008. The increase was primarily due to increases in spare parts usage to support the larger installed base.
Gross profit on service and other revenues increased by $1.5 million, or 10.5%, in 2009 as compared to 2008. The increase in gross margin on service and other revenues was due primarily to
45
faster revenue growth from an expanded installed base without a proportionate increase in labor costs to support the expanded install base.
Operating Expenses
The table below shows our operating expenses for the years ended December 31, 2010, 2009 and 2008 and the percentage change between those years:
| |
|
|
|
Percentage Change | ||||||||||||
|---|---|---|---|---|---|---|---|---|---|---|---|---|---|---|---|---|
| |
For the Years Ended December 31, | |||||||||||||||
| |
2010 to 2009 | 2009 to 2008 | ||||||||||||||
| |
2010 | 2009 | 2008 | |||||||||||||
| |
(in thousands) |
|
|
|||||||||||||
Research and development |
$ | 21,007 | $ | 17,569 | $ | 18,196 | 19.6 | % | (3.4 | )% | ||||||
Selling, general and administrative |
86,227 | 85,668 | 93,098 | 0.7 | % | (8.0 | )% | |||||||||
Restructuring charges |
1,157 | 1,315 | — | (12.0 | )% | — | ||||||||||
Total operating expenses |
$ | 108,391 | $ | 104,552 | $ | 111,294 | 3.7 | % | (6.1 | )% | ||||||
2010 compared to 2009
Research and development. Research and development expenses increased by $3.4 million, or 19.6%, in 2010 as compared to 2009. Research and development expenses represented 9.4% and 8.2% of total revenues in 2010 and 2009, respectively.
The increase in research and development expenses in 2010 was due to an increase of $1.9 million in consulting expenses, an increase of $0.7 million of labor and related costs, both of which are related to new hardware and software product development, and a decrease of $0.8 million of software capitalization in 2010 compared to 2009 primarily due the release in 2010 of two major software releases used in our products.
We expect research and development expenses to increase slightly as we continue to invest in new products. The amount of research and development expense can fluctuate based on the amount of proto type expenses for hardware and or the amount of capitalized software development costs.
Selling, general and administrative. Selling, general and administrative expenses increased by $0.6 million, or 0.7%, in 2010 as compared to 2009. Selling, general and administrative expenses represented 38.8% and 40.2% of total revenues in 2010 and 2009, respectively.
Three areas of spending increased the selling, general and administrative expenses. These were $1.9 million of fees related to potential acquisition assessment activities, $1.3 million related to marketing programs to increase brand awareness, and $2.4 million associated with rising costs of operations, including $1.0 million increase in employee health and dental benefits, $0.5 million increase in Group Purchasing Organization fees associated with higher sales volume to Group Purchasing Organization affiliated customers, and $0.4 million increase in travel. These increases were offset by a decrease of $2.9 million in legal fees which included a $2.4 million benefit from the settlement of a litigation claim for less than the amount previously accrued and a decrease of bad debt expense of $1.7 million primarily due to the recovery of a fully reserved accounts receivable balance and lower non-specific bad debt reserve requirements based on improved historical experience.
We expect selling, general and administrative costs to increase in 2011, in both dollars and as a percentage of revenues due to an increase of direct territory sales representatives.
Restructuring charges. Restructuring charges of $1.2 million incurred in 2010 related to the closure of facilities in The Woodlands, Texas and Bangalore, India. Costs recorded related primarily to severance and relocation pay, lease terminations, asset impairment charges, consulting, and travel.
46
Restructuring charges of $1.3 million incurred in 2009 related primarily to severance pay, continuation of benefits and outplacement services associated with reduction in force activities.
2009 compared to 2008
Research and development. Research and development expenses decreased by $0.6 million, or 3.4%, in 2009 as compared to 2008. Research and development expenses represented 8.2% and 7.2% of total revenues in 2009 and 2008, respectively. The decrease in research and development expenses was due primarily to a $1.8 million increase in capitalized software, primarily due to the development of two major releases of our software used in our products, which moved expenditures from expenses to capital projects, offset by an increase of $1.1 million in outside services.
Selling, general and administrative. Selling, general and administrative expenses decreased by $7.4 million, or 8.0%, in 2009 as compared to 2008. Selling, general and administrative expenses represented 40.2% and 37.0% of total revenues in 2009 and 2008, respectively. The decrease in selling, general and administrative expenses was primarily due to $6.3 million of decreases associated with lower sales volume and headcount, a decrease of $1.0 million in bad debt expense associated with the decrease in accounts receivable balances, and a decrease of $1.3 million in expenses related to share based compensation charges associated with ASC 718. These decreases were partially offset by increased investment in the marketing of our products.
Restructuring charges. The decrease in research and development and selling, general and administrative expenses in 2009 was partially the result of our work force reduction during the first quarter of 2009, which lowered headcount by 43 employees, but resulted in a restructuring charge of $1.3 million. These restructuring costs were primarily severance pay, continuation of benefits and outplacement services.
Interest Income and Other Expense
The table below shows our interest income and other expense for the years ended December 31, 2010, 2009 and 2008 and the percentage change between those years:
| |
For the Years Ended December 31, |
Percentage Change | ||||||||||||||
|---|---|---|---|---|---|---|---|---|---|---|---|---|---|---|---|---|
| |
2010 to 2009 | 2009 to 2008 | ||||||||||||||
| |
2010 | 2009 | 2008 | |||||||||||||
| |
(in thousands) |
|
|
|||||||||||||
Interest income |
$ | 424 | $ | 619 | $ | 3,420 | (31.5 | )% | (81.9 | )% | ||||||
Other income (expense) |
7 | (96 | ) | (38 | ) | (107.3 | )% | 152.6 | % | |||||||
The decrease in interest income for 2010 as compared to 2009 was primarily due to lower interest rates. Although average cash, cash equivalents, and short-term investment balances averaged approximately $45.0 million higher in 2010, average interest rates decreased by 25 basis points compared to 2009 rates, resulting in $0.2 million lower interest income. We expect interest income to remain at approximately 2010 levels during 2011.
The decrease in interest income for 2009 as compared to 2008 was primarily due to lower interest rates. The average cash, cash equivalent balances were approximately $134.0 million for 2009 and 2008, but the effective interest rate in 2009 was approximately 50 basis points compared to approximately 250 basis points in 2008.
47
Income taxes
| |
Years Ended December 31, | |||||||||
|---|---|---|---|---|---|---|---|---|---|---|
| |
2010 | 2009 | 2008 | |||||||
| |
(in thousands) |
|||||||||
Provision for income taxes |
$ | 5,065 | $ | 748 | $ | 7,998 | ||||
We recorded a provision for income taxes of approximately $5.1 million and an effective tax rate of 50.8% for the year ended December 31, 2010 compared to $0.7 million and 62.8% effective tax rate for the year ended December 31, 2009. The 2010 annual tax rate differs from the statutory tax rate of 35% primarily due to the impact of state income taxes and a one-time tax adjustment of approximately $0.8 million for the tax effect of undistributed foreign earnings, triggered by the closure of our India subsidiary as part of our third quarter restructuring program.
We recorded a provision for income taxes of approximately $0.7 million and an effective tax rate of 62.8% for the year ended December 31, 2009 compared to $8.0 million and 38.6% effective tax rate for the year ended December 31, 2008. The increase in the effective tax rate was primarily due to prior year true-up of approximately $0.7 million and the re-measurement of our California deferred tax assets to reflect the enactment of California tax legislation, effective January 1, 2011.
Refer to Note 14 "Income Taxes" for discussion of factors affecting realizability of deferred tax assets.
Liquidity and Capital Resources
Cash Flows
The table below shows our cash flows for the years ended December 31, 2010, 2009 and 2008:
| |
For the Years Ended December 31, |
|||||||||
|---|---|---|---|---|---|---|---|---|---|---|
| |
2010 | 2009 | 2008 | |||||||
| |
(in thousands) |
|||||||||
Net cash provided by operating activities |
$ | 20,599 | $ | 46,169 | $ | 14,298 | ||||
Net cash used in investing activities |
(23,057 | ) | (6,795 | ) | (13,037 | ) | ||||
Net cash provided by (used in) financing activities |
8,863 | 9,417 | (50,634 | ) | ||||||
Net increase (decrease) in cash and cash equivalents |
$ | 6,405 | $ | 48,791 | $ | (49,373 | ) | |||
2010 compared to 2009
Net cash provided by operating activities decreased by $25.6 million in 2010 to $20.6 million from the 2009 amount of $46.2 million. The major driver of this decrease was accounts receivable collections returning to normal trends compared to 2009, resulting in a net change between the years of $18.5 million. Other uses of cash were balance sheet changes in prepaids, accrued liabilities and deferred service revenue, reducing $3.7 million, $3.8 million and $5.6 million, respectively, of operating cash flows in 2010 compared to 2009. Offsetting these decreases in sources of operating cash flows were higher net income of $4.4 million and a combination of tax related operating cash flows that increased cash provided by operating activities between 2010 and 2009 by $7.5 million. The largest tax related item was a benefit from employee stock plans which changed from a use of operating cash in 2009 to a source of operating cash in 2010 for a net increase of cash provided of $7.5 million.
Net cash used in investing activities increased by $16.3 million in 2010 to $23.1 million from the 2009 amount of $6.8 million. This was primarily due to purchases of $8.1 million of California revenue anticipation notes and the acquisition of Pandora Data Systems for $5.7 million, net of cash acquired.
48
Purchases of capital assets increased $2.5 million primarily due to continued efforts in 2010 to increase information technology capabilities, including a customer relationship management systems installation project.
Net cash provided by financing activities decreased by $0.5 million in 2010 compared to net cash provided by financing activities of $9.4 million in 2009. This was due to an increase in proceeds of $3.0 million from shares issued under stock option and employee stock purchase plans offset by a decrease of $3.5 million in excess tax benefits from employee stock plans.
2009 compared to 2008
Net cash provided by operating activities increased by $31.9 million in 2009 from $14.3 million in 2008 to $46.2 in 2009. The major driver of this increase was lower accounts receivable due to increased collections, resulting in a net change between the years of $39.1 million. Other sources of cash were balance sheet changes in accrued liabilities and other current assets, adding $5.8 million and $3.6 million, respectively, of additional operating cash flows in 2009 compared to 2008. Offsetting these increases in sources of operating cash flows were lower net income of $12.3 million and a combination of tax related operating cash flows that reduced cash provided by operating activities between 2009 and 2008 by $4.7 million. The largest tax related item was from employee stock plans which changed from a source of operating cash in 2008 to a use of operating cash in 2009 for a net reduction of cash provided of $17.7 million. This was offset by increases in cash provided by deferred income taxes, which changed from a use of operating cash in 2008 to a source of operating cash in 2009, of $11.9 million and a reduction of use of operating cash by excess tax benefits from employee stock plans of $1.1 million.
Net cash used in investing activities decreased by $6.2 million in 2009 to $6.8 million from the 2008 amount of $13.0 million. This was primarily due to lower purchases of capital assets.
Net cash provided by financing activities increased by $60.1 million in 2009 to $9.4 million from the 2008 amount of net cash used in financing activities of $50.6 million. This was primarily due to the absence of stock repurchases in 2009 as compared to stock repurchases in 2008 totaling $65.1 million. Refer to Treasury Stock under Note 15 for discussion of the share repurchase program.
Liquidity
Our future uses of cash are expected to be primarily for working capital, capital expenditures and other contractual obligations. We alsoexpect a continued use of cash for potential acquisition assessment activities. Additionally, as described in Note 15, on December 31, 2010, we had $25.0 million of remaining authorized funds to repurchase additional shares under stock repurchase programs, which may, in the future, result in additional use of cash. We had cash and cash equivalents of $175.6 million at December 31, 2010 as compared to $169.2 million at December 31, 2009. Additionally, we owned $8.1 million of short-term investments at December 31, 2010. Based on our current business plan and revenue backlog, we believe that our existing cash, cash equivalents and our anticipated cash flows from operations as well as cash generated from the exercise of employee stock options and purchases under our employee stock purchase plan will be sufficient to meet our working capital, capital expenditures and other contractual obligations for at least the next twelve months. For periods beyond the next twelve months, we also anticipate that our net operating cash flows plus existing balances of cash, cash equivalents, and short-term investments will suffice to fund the continued growth of our business.
49
Off-Balance Sheet Arrangements
As of December 31, 2010, we had no off-balance sheet arrangements as defined under Regulation S-K 303(a)(4) of the Securities Exchange Act of 1934, as amended, and the instructions thereto.
Contractual Obligations
As of December 31, 2010 we had $11.5 million in contractual commitments to third parties for non-cancelable operating leases, commitments to contract manufacturers and suppliers and other purchase commitments. See Note 12, "Commitments," to our consolidated financial statements included in this Annual Report on Form 10-K for further information with respect to these commitments.
The following table summarizes our contractual obligations at December 31, 2010 (in thousands):
| |
Total | Less than one year |
One to three years |
Three to five years |
More than five years |
|||||||||||
|---|---|---|---|---|---|---|---|---|---|---|---|---|---|---|---|---|
Operating leases(1) |
$ | 6,570 | $ | 3,875 | $ | 2,166 | $ | 529 | $ | — | ||||||
Commitments to contract manufacturers and suppliers(2) |
4,925 | 4,925 | — | — | — | |||||||||||
Total |
$ | 11,495 | $ | 8,800 | $ | 2,166 | $ | 529 | $ | — | ||||||
- (1)
- Commitments
under operating leases relate primarily to leasehold property and office equipment. In April 2010, we entered into a lease agreement to replace
certain expiring leases with approximately 25,000 square feet of office space in Nashville, Tennessee. The new lease is for a term of 60 months, and commenced July 2010, with two
five-year renewal options. The base rental commitment for the initial five-year term totals $1.7 million. Rent expense was $3.6 million, $3.5 million and
$3.4 million for the years ended December 31, 2010, 2009 and 2008, respectively.
- (2)
- We purchase components from a variety of suppliers and use contract manufacturers to provide manufacturing services for our products. During the normal course of business, we issue purchase orders with estimates of our requirements several months ahead of the delivery dates.
ITEM 7A. QUANTITATIVE AND QUALITATIVE DISCLOSURES ABOUT MARKET RISK
We are only exposed to market risk from changes in interest rates to the extent our interest income might decrease.
As of December 31, 2010, we had $175.6 million of cash and cash equivalents. We invest our cash in cash investments with original or remaining maturities of three months or less and whose principal is not subject to market rate fluctuations. Accordingly, interest rate declines would adversely affect our interest income but would not affect the carrying value of our cash investments. Our fourth quarter 2010 weighted interest rate was 0.18%. If interest rates were to decline to zero, we would generate $0.1 million less interest income per quarter. Management considers this interest rate exposure immaterial.
ITEM 8. FINANCIAL STATEMENTS AND SUPPLEMENTARY DATA
The information required by this item is set forth beginning at page F-1.
50
ITEM 9. CHANGES IN AND DISAGREEMENTS WITH ACCOUNTANTS ON ACCOUNTING AND FINANCIAL DISCLOSURE
Not applicable.
ITEM 9A. CONTROLS AND PROCEDURES
Evaluation of Disclosure Controls and Procedures
Our management, with the participation of our principal executive officer and principal financial officer, evaluated the effectiveness of our disclosure controls and procedures (as such term is defined in Rules 13a-15(e) and 15d-15(e) under the Securities Exchange Act of 1934, as amended, which we refer to as the Exchange Act) as of the end of the period covered by this Annual Report. These disclosure controls and procedures are designed to ensure that the information required to be disclosed by us in this Annual Report on Form 10-K was (i) recorded, processed, summarized and reported within the time periods specified in the SEC's rules and regulations and (ii) accumulated and communicated to our management, including our principal executive officer and principal financial officer, to allow timely decisions regarding required disclosure.
Based on such evaluation, our principal executive officer and principal financial officer have concluded that, as of December 31, 2010, our disclosure controls and procedures were not effective at the reasonable assurance level, due to a material weakness in internal control over financial reporting related to accounting for income taxes. Notwithstanding the above-mentioned material weakness, we believe that the consolidated financial statements included in this report fairly represent our consolidated financial position as of December 31, 2010, and consolidated results of operations for the year ended December 31, 2010.
Management's Report on Internal Control Over Financial Reporting
Our management is responsible for establishing and maintaining adequate internal control over financial reporting (as such term is defined in Rules 13a-15(f) and 15d-15(f) under the Exchange Act). Our internal control system is designed to provide reasonable assurance regarding the preparation and fair presentation of financial statements for external purposes in accordance with U.S. generally accepted accounting principles. All internal control systems, no matter how well designed, have inherent limitations and can provide only reasonable assurance that the objectives of the internal control system are met.
Under the supervision and with the participation of our management, including our principal executive officer and principal financial officer, we conducted an evaluation of the effectiveness of our internal control over financial reporting as of December 31, 2010 using the criteria for effective internal control over financial reporting as described in "Internal Control—Integrated Framework," issued by the Committee of Sponsoring Organization of the Treadway Commission. Our management has concluded that, as of December 31, 2010, our internal control over financial reporting was not effective based on these criteria, due to a material weakness related to our accounting for income taxes.
A material weakness is a deficiency, or combination of control deficiencies, in internal control over financial reporting, such that there is a reasonable possibility that a material misstatement of the company's interim or annual financial statements will not be prevented or detected on a timely basis.
Our evaluation concluded that we did not maintain effective internal control over accounting for income taxes. Specifically, our processes, procedures and controls related to the preparation and review of the annual tax provision were not effective to ensure that amounts recorded for the tax provision and the related current and deferred income tax asset and liability accounts were accurate and determined in accordance with U.S. generally accepted accounting principles. Additionally, we did not
51
maintain effective controls over the review and analysis of supporting work papers for such tax balances.
This material weakness was primarily caused by:
- •
- Inadequate management review of the income tax provision calculation, supporting assumptions and workpapers; and
- •
- An inadequate system of document management or version control over the multiple files used for calculation and review of the income tax provision.
Our independent registered public accounting firm, Ernst & Young LLP, has issued an audit report on our internal control over financial reporting. Their audit report is included elsewhere in this Annual Report on Form 10-K.
Changes in Internal Control Over Financial Reporting
Other than the material weakness noted above, there have been no changes in our internal control over financial reporting (as such term is defined in Rules 13a-15(f) and 15d-15(f) under the Exchange Act) during the three months ended December 31, 2010 that have materially affected, or are reasonably likely to materially affect, our internal control over financial reporting.
Attestation Report of the Registered Public Accounting Firm
The report required by this item is set forth below:
52
REPORT OF INDEPENDENT REGISTERED PUBLIC ACCOUNTING FIRM
The Board of Directors and Stockholders of Omnicell, Inc.
We have audited Omnicell, Inc.'s internal control over financial reporting as of December 31, 2010, based on criteria established in Internal Control—Integrated Framework issued by the Committee of Sponsoring Organizations of the Treadway Commission (the COSO criteria). Omnicell, Inc.'s management is responsible for maintaining effective internal control over financial reporting, and for its assessment of the effectiveness of internal control over financial reporting included in the accompanying Management's Report on Internal Control Over Financial Reporting. Our responsibility is to express an opinion on the company's internal control over financial reporting based on our audit.
We conducted our audit in accordance with the standards of the Public Company Accounting Oversight Board (United States). Those standards require that we plan and perform the audit to obtain reasonable assurance about whether effective internal control over financial reporting was maintained in all material respects. Our audit included obtaining an understanding of internal control over financial reporting, assessing the risk that a material weakness exists, testing and evaluating the design and operating effectiveness of internal control based on the assessed risk, and performing such other procedures as we considered necessary in the circumstances. We believe that our audit provides a reasonable basis for our opinion.
A company's internal control over financial reporting is a process designed to provide reasonable assurance regarding the reliability of financial reporting and the preparation of financial statements for external purposes in accordance with generally accepted accounting principles. A company's internal control over financial reporting includes those policies and procedures that (1) pertain to the maintenance of records that, in reasonable detail, accurately and fairly reflect the transactions and dispositions of the assets of the company; (2) provide reasonable assurance that transactions are recorded as necessary to permit preparation of financial statements in accordance with generally accepted accounting principles, and that receipts and expenditures of the company are being made only in accordance with authorizations of management and directors of the company; and (3) provide reasonable assurance regarding prevention or timely detection of unauthorized acquisition, use or disposition of the company's assets that could have a material effect on the financial statements.
Because of its inherent limitations, internal control over financial reporting may not prevent or detect misstatements. Also, projections of any evaluation of effectiveness to future periods are subject to the risk that controls may become inadequate because of changes in conditions, or that the degree of compliance with the policies or procedures may deteriorate.
A material weakness is a deficiency, or combination of deficiencies, in internal control over financial reporting, such that there is a reasonable possibility that a material misstatement of the company's annual or interim financial statements will not be prevented or detected on a timely basis. The following material weakness has been identified and included in management's assessment. Management has identified a material weakness in the controls over the preparation and review of the provision for income tax expense. We have also audited in accordance with the standards of the Public Company Accounting Oversight Board (United States), the 2010 consolidated financial statements. This material weakness was considered in determining the nature, timing and extent of audit tests applied in our audit of the 2010 financial statements and this report does not affect our report dated March 11, 2011, which expressed an unqualified opinion on those financial statements.
In our opinion, because of the effect of the material weakness described above on the achievement of the objectives of the control criteria, Omnicell, Inc. has not maintained effective internal control over financial reporting as of December 31. 2010, based on the COSO criteria.
|
/s/ Ernst & Young LLP |
San
Jose, California
March 11, 2011
53
None.
54
Certain information required by Part III is omitted from this Annual Report on Form 10-K because the registrant will file with the U.S. Securities and Exchange Commission a definitive proxy statement pursuant to Regulation 14A in connection with the solicitation of proxies for the Company's Annual Meeting of Stockholders expected to be held in May 2011 (the "Proxy Statement") not later than 120 days after the end of the fiscal year covered by this Annual Report on Form 10-K, and certain information included therein is incorporated herein by reference.
ITEM 10. DIRECTORS, EXECUTIVE OFFICERS AND CORPORATE GOVERNANCE
The information required by this Item with respect to directors and executive officers may be found under the heading "Executive Officers of the Registrant" in Part I, Item 1 of this Annual Report on Form 10-K, and in the section entitled "Election of Directors" appearing in the Proxy Statement. Such information is incorporated herein by reference.
The information required by this Item with respect to our audit committee and audit committee financial expert may be found in the section entitled "Information Regarding the Board of Directors and Corporation Governance—Audit Committee" appearing in the Proxy Statement. Such information is incorporated herein by reference.
The information required by this Item with respect to compliance with Section 16(a) of the Securities Exchange Act of 1934 may be found in the sections entitled "Section 16(a) Beneficial Ownership Reporting Compliance" appearing in the Proxy Statement. Such information is incorporated herein by reference.
Our written Code of Ethics applies to all our directors and employees, including executive officers, including without limitation our principal executive officer, principal financial officer, principal accounting officer or controller or persons performing similar functions. The Code of Ethics is available on our website at www.omnicell.com under the hyperlink titled "Corporate Governance." Changes to or waivers of the Code of Ethics will be disclosed on the same website. We intend to satisfy the disclosure requirement under Item 5.05 of Form 8-K regarding any amendment to, or waiver of, any provision of the Code of Ethics by disclosing such information on the same website.
ITEM 11. EXECUTIVE COMPENSATION
The information required by this Item with respect to director and executive officer compensation is incorporated by reference to the section of our Proxy Statement under the section entitled "Executive Compensation—Compensation Discussion and Analysis".
The information required by this Item with respect to Compensation Committee interlocks and insider participation is incorporated herein by reference to the information from the Proxy Statement under the section entitled "Information Regarding the Board of Directors and Corporate Governance—Compensation Committee Interlocks and Insider Participation."
The information required by this Item with respect to our Compensation Committee's review and discussion of the Compensation Discussion and Analysis included in the Proxy Statement is incorporated herein by reference to the information from the Proxy Statement under the section entitled "Executive Compensation—Compensation Discussion and Analysis—Compensation Committee Report."
55
ITEM 12. SECURITY OWNERSHIP OF CERTAIN BENEFICIAL OWNERS AND MANAGEMENT AND RELATED STOCKHOLDERS MATTERS
The information required by this Item with respect to security ownership of certain beneficial owners and management is incorporated herein by reference to the information from the Proxy Statement under the section entitled "Security Ownership of Certain Beneficial Owners and Management."
The information required by this Item with respect to securities authorized for issuance under our equity compensation plans is incorporated herein by reference to the information from the Proxy Statement under the section entitled "Equity Compensation Plan Information."
ITEM 13. CERTAIN RELATIONSHIPS, RELATED TRANSACTIONS AND DIRECTOR INDEPENDENCE
The information required by this Item with respect to related party transactions is incorporated herein by reference to the information from the Proxy Statement under the section entitled "Certain Relationships and Related Transactions."
The information required by this Item with respect to director independence is incorporated herein by reference to the information from the Proxy Statement under the section entitled "Information Regarding the Board of Directors and Corporate Governance—Independence of the Board of Directors."
ITEM 14. PRINCIPAL ACCOUNTANT FEES AND SERVICES
The information required by this Item is incorporated herein by reference to the section from the Proxy Statement under the section entitled "Ratification of Selection of Independent Registered Public Accounting Firm—Principal Accountant Fees and Services."
56
ITEM 15. EXHIBITS AND FINANCIAL STATEMENT SCHEDULES
- (a)
- The following documents are included as part of this Annual Report on
Form 10-K.
- (1)
- All financial statements.
Index to Financial Statements:
|
Page | |
|---|---|---|
Report of Independent Registered Public Accounting Firm |
F-1 | |
Consolidated Balance Sheets as of December 31, 2010 and 2009 |
F-2 | |
Consolidated Statements of Operations for the years ended December 31, 2010, 2009 and 2008 |
F-3 | |
Consolidated Statements of Stockholders' Equity for the years ended December 31, 2010, 2009 and 2008 |
F-4 | |
Consolidated Statements of Cash Flows for the years ended December 31, 2010, 2009 and 2008 |
F-5 | |
Notes to Consolidated Financial Statements |
F-6 | |
The foregoing additional financial statement schedule should be considered in conjunction with our consolidated financial statements. All other schedules have been omitted because the required information is either not applicable or not sufficiently material to require submission of the schedule. |
||
Financial Statement Schedule II |
F-38 | |
(2) Exhibits required by Item 601 of Regulation S-K. |
||
The information required by this item is set forth on the exhibit index which follows the signature page of this report. |
57
REPORT OF INDEPENDENT REGISTERED PUBLIC ACCOUNTING FIRM
The Board of Directors and Stockholders of Omnicell, Inc.
We have audited the accompanying consolidated balance sheets of Omnicell, Inc. as of December 31, 2010 and 2009, and the related consolidated statements of operations, stockholders' equity, and cash flows for each of the three years in the period ended December 31, 2010. Our audits also included the financial statement schedule listed in the index at Item 15(a)(1). These financial statements and schedule are the responsibility of the Company's management. Our responsibility is to express an opinion on these financial statements and schedule based on our audits.
We conducted our audits in accordance with the standards of the Public Company Accounting Oversight Board (United States). Those standards require that we plan and perform the audit to obtain reasonable assurance about whether the financial statements are free of material misstatement. An audit includes examining, on a test basis, evidence supporting the amounts and disclosures in the financial statements. An audit also includes assessing the accounting principles used and significant estimates made by management, as well as evaluating the overall financial statement presentation. We believe that our audits provide a reasonable basis for our opinion.
In our opinion, the financial statements referred to above present fairly, in all material respects, the consolidated financial position of Omnicell, Inc. at December 31, 2010 and 2009, and the consolidated results of its operations and its cash flows for each of the three years in the period ended December 31, 2010, in conformity with U.S. generally accepted accounting principles. Also, in our opinion, the related financial statement schedule, when considered in relation to the basic financial statements taken as a whole, presents fairly in all material respects the information set forth therein.
We also have audited, in accordance with the standards of the Public Company Accounting Oversight Board (United States), Omnicell, Inc.'s internal control over financial reporting as of December 31, 2010, based on criteria established in Internal Control—Integrated Framework issued by the Committee of Sponsoring Organizations of the Treadway Commission and our report dated March 11, 2011 expressed an adverse opinion thereon.
|
/s/ Ernst & Young LLP |
San
Jose, California
March 11, 2011
F-1
OMNICELL, INC.
CONSOLIDATED BALANCE SHEETS
(in thousands, except par value and share amounts)
| |
December 31, | ||||||||
|---|---|---|---|---|---|---|---|---|---|
| |
2010 | 2009 | |||||||
ASSETS |
|||||||||
Current assets: |
|||||||||
Cash and cash equivalents |
$ | 175,635 | $ | 169,230 | |||||
Short-term investments |
8,074 | — | |||||||
Accounts receivable, net of allowances of $497 and $868 at December 31, 2010 and 2009, respectively |
42,732 | 40,826 | |||||||
Inventories |
9,785 | 10,502 | |||||||
Prepaid expenses |
11,959 | 8,780 | |||||||
Deferred tax assets |
13,052 | 15,247 | |||||||
Other current assets |
7,266 | 6,159 | |||||||
Total current assets |
268,503 | 250,744 | |||||||
Property and equipment, net |
14,351 | 13,209 | |||||||
Non-current net investment in sales-type leases |
9,224 | 10,104 | |||||||
Goodwill |
28,543 | 24,982 | |||||||
Other intangible assets |
4,672 | 4,233 | |||||||
Non-current deferred tax assets |
9,566 | 9,666 | |||||||
Other assets |
8,365 | 9,322 | |||||||
Total assets |
$ | 343,224 | $ | 322,260 | |||||
LIABILITIES AND STOCKHOLDERS' EQUITY |
|||||||||
Current liabilities: |
|||||||||
Accounts payable |
$ | 13,242 | $ | 10,313 | |||||
Accrued compensation |
7,731 | 8,095 | |||||||
Accrued liabilities |
8,684 | 11,997 | |||||||
Deferred service revenue |
16,788 | 14,457 | |||||||
Deferred gross profit |
11,719 | 13,689 | |||||||
Total current liabilities |
58,164 | 58,551 | |||||||
Long-term deferred service revenue |
19,171 | 20,810 | |||||||
Other long-term liabilities |
675 | 595 | |||||||
Total liabilities |
78,010 | 79,956 | |||||||
Commitments and contingencies |
|||||||||
Stockholders' equity: |
|||||||||
Preferred stock, $0.001 par value; 5,000,000 shares authorized; none issued |
— | — | |||||||
Common stock, $0.001 par value; 100,000,000 shares authorized; 37,148,706 and 33,027,583 shares issued and outstanding, respectively, at December 31 2010 and 36,072,776 and 31,977,470 shares issued and outstanding, respectively, at December 31, 2009 |
37 | 36 | |||||||
Treasury stock, at cost, outstanding: 4,121,123 share and 4,095,306 shares at December 31, 2010 and 2009, respectively |
(65,064 | ) | (65,064 | ) | |||||
Additional paid-in capital |
342,272 | 324,255 | |||||||
Accumulated deficit |
(12,031 | ) | (16,923 | ) | |||||
Total stockholders' equity |
265,214 | 242,304 | |||||||
Total liabilities and stockholders' equity |
$ | 343,224 | $ | 322,260 | |||||
See Notes to Consolidated Financial Statements
F-2
OMNICELL, INC.
CONSOLIDATED STATEMENTS OF OPERATIONS
(in thousands, except per share amounts)
| |
Years Ended December 31, | |||||||||||
|---|---|---|---|---|---|---|---|---|---|---|---|---|
| |
2010 | 2009 | 2008 | |||||||||
Revenues: |
||||||||||||
Product revenues |
$ | 171,100 | $ | 170,068 | $ | 211,461 | ||||||
Service and other revenues |
51,307 | 43,389 | 40,404 | |||||||||
Total revenues |
222,407 | 213,457 | 251,865 | |||||||||
Cost of revenues: |
||||||||||||
Cost of product revenues |
76,372 | 80,016 | 97,461 | |||||||||
Cost of service and other revenues |
28,079 | 27,011 | 25,770 | |||||||||
Restructuring charges |
39 | 1,209 | — | |||||||||
Total cost of revenues |
104,490 | 108,236 | 123,231 | |||||||||
Gross profit |
117,917 | 105,221 | 128,634 | |||||||||
Operating expenses: |
||||||||||||
Research and development |
21,007 | 17,569 | 18,196 | |||||||||
Selling, general and administrative |
86,227 | 85,668 | 93,098 | |||||||||
Restructuring charges |
1,157 | 1,315 | — | |||||||||
Total operating expenses |
108,391 | 104,552 | 111,294 | |||||||||
Income from operations |
9,526 | 669 | 17,340 | |||||||||
Interest income |
424 | 619 | 3,420 | |||||||||
Interest expense |
(4 | ) | (15 | ) | (15 | ) | ||||||
Other income (expense) |
11 | (81 | ) | (23 | ) | |||||||
Income before provision for income taxes |
9,957 | 1,192 | 20,722 | |||||||||
Provision for income taxes |
5,065 | 748 | 7,998 | |||||||||
Net income |
$ | 4,892 | $ | 444 | $ | 12,724 | ||||||
Net income per share—basic |
$ | 0.15 | $ | 0.01 | $ | 0.40 | ||||||
Net income per share—diluted |
$ | 0.15 | $ | 0.01 | $ | 0.38 | ||||||
Weighted average shares outstanding: |
||||||||||||
Basic |
32,651 | 31,691 | 32,076 | |||||||||
Diluted |
33,513 | 32,063 | 33,108 | |||||||||
See Notes to Consolidated Financial Statements
F-3
OMNICELL, INC.
CONSOLIDATED STATEMENTS OF STOCKHOLDERS' EQUITY
(in thousands, except share amounts)
| |
Common | Treasury | |
|
|
|
||||||||||||||||||||
|---|---|---|---|---|---|---|---|---|---|---|---|---|---|---|---|---|---|---|---|---|---|---|---|---|---|---|
| |
|
|
Accumulated Other Comprehensive Income (Loss) |
|
||||||||||||||||||||||
| |
Shares | Stock Amount |
Shares | Stock Amount |
Additional Paid In Capital |
Accumulated Deficit |
Total Stockholders' Equity |
|||||||||||||||||||
Balance at December 31, 2007 |
34,625,489 | $ | 35 | (1,759 | ) | $ | — | $ | 284,695 | $ | (30,091 | ) | $ | — | $ | 254.639 | ||||||||||
Net income and comprehensive income |
— | — | — | — | — | 12,724 | — | 12,724 | ||||||||||||||||||
Share-based compensation |
— | — | — | — | 11,062 | — | — | 11,062 | ||||||||||||||||||
Common stock issued under stock option and stock award plans |
558,300 | — | (10,396 | ) | — | 4,563 | — | — | 4,563 | |||||||||||||||||
Issuance of stock under employee stock purchase plan |
238,889 | — | — | — | 3,387 | — | — | 3,387 | ||||||||||||||||||
Purchase of treasury stock, net of commissions |
— | — | (4,066,296 | ) | (65,064 | ) | — | — | — | (65,064 | ) | |||||||||||||||
Income tax benefits realized from employee stock plans |
— | — | — | — | 12,246 | — | — | 12,246 | ||||||||||||||||||
Balance at December 31, 2008 |
35,422,678 | 35 | (4,078,451 | ) | (65,064 | ) | 315,953 | (17,367 | ) | — | 233,557 | |||||||||||||||
Net income and comprehensive income |
— | — | — | — | — | 444 | — | 444 | ||||||||||||||||||
Share-based compensation |
— | — | — | — | 9,725 | — | — | 9,725 | ||||||||||||||||||
Common stock issued under stock option and stock award plans |
257,939 | — | (16,855 | ) | — | 1,113 | — | — | 1,113 | |||||||||||||||||
Issuance of stock under employee stock purchase plan |
392,159 | 1 | — | — | 2,928 | — | — | 2,929 | ||||||||||||||||||
Income tax charges realized from employee stock plans |
— | — | — | — | (5,464 | ) | — | — | (5,464 | ) | ||||||||||||||||
Balance at December 31, 2009 |
36,072,776 | 36 | (4,095,306 | ) | (65,064 | ) | 324,255 | (16,923 | ) | — | 242,304 | |||||||||||||||
Net income and comprehensive income |
— | — | — | — | — | 4,892 | — | 4,892 | ||||||||||||||||||
Share-based compensation |
— | — | — | — | 9,015 | — | — | 9,015 | ||||||||||||||||||
Common stock issued under stock option and stock award plans |
624,916 | 1 | (25,817 | ) | — | 3,637 | — | — | 3,638 | |||||||||||||||||
Issuance of stock under employee stock purchase plan |
451,014 | — | — | — | 3,364 | — | — | 3,364 | ||||||||||||||||||
Income tax benefits realized from employee stock plans |
— | — | — | — | 2,001 | — | — | 2,001 | ||||||||||||||||||
Balance at December 31, 2010 |
37,148,706 | $ | 37 | (4,121,123 | ) | $ | (65,064 | ) | $ | 342,272 | $ | (12,031 | ) | $ | — | $ | 265,214 | |||||||||
See Notes to Consolidated Financial Statements
F-4
OMNICELL, INC.
CONSOLIDATED STATEMENTS OF CASH FLOWS
(in thousands)
| |
Years Ended December 31, | ||||||||||||
|---|---|---|---|---|---|---|---|---|---|---|---|---|---|
| |
2010 | 2009 | 2008 | ||||||||||
Cash flows from operating activities |
|||||||||||||
Net income |
$ | 4,892 | $ | 444 | $ | 12,724 | |||||||
Adjustments to reconcile net income to net cash provided by operating activities: |
|||||||||||||
Depreciation and amortization |
8,619 | 9,428 | 8,954 | ||||||||||
(Recovery of) provision for receivable allowance |
(1,259 | ) | 428 | 1,384 | |||||||||
Asset impairment charge |
— | 267 | 182 | ||||||||||
Loss(gain) on sale of property and equipment |
191 | — | (119 | ) | |||||||||
(Gain) on legal settlement |
(2,439 | ) | — | — | |||||||||
Share-based compensation expense |
9,015 | 9,725 | 11,165 | ||||||||||
Provision for excess and obsolete inventories |
640 | 3,119 | 384 | ||||||||||
Deferred tax assets and liabilities |
2,403 | 5,847 | (6,049 | ) | |||||||||
Income tax benefits(charges) from employee stock plans |
2,001 | (5,464 | ) | 12,246 | |||||||||
Excess tax benefits from employee stock plans |
(1,861 | ) | (5,375 | ) | (6,480 | ) | |||||||
Changes in operating assets and liabilities, net of effect of acquired company |
|||||||||||||
Accounts receivable |
(1,317 | ) | 17,190 | (21,866 | ) | ||||||||
Inventories |
77 | (693 | ) | 174 | |||||||||
Prepaid expenses |
(3,179 | ) | 531 | 172 | |||||||||
Other current assets |
209 | 3,772 | 190 | ||||||||||
Net investment in sales-type leases |
1,412 | (446 | ) | 1,249 | |||||||||
Other assets |
519 | 243 | 139 | ||||||||||
Accounts payable |
2,859 | 936 | (853 | ) | |||||||||
Accrued compensation |
(529 | ) | (794 | ) | 583 | ||||||||
Accrued liabilities |
(2,131 | ) | 1,640 | (4,195 | ) | ||||||||
Deferred service revenue |
2,367 | 7,945 | 1,621 | ||||||||||
Deferred gross profit |
(1,970 | ) | (2,320 | ) | 2,082 | ||||||||
Other long-term liabilities |
80 | (254 | ) | 611 | |||||||||
Net cash provided by operating activities |
20,599 | 46,169 | 14,298 | ||||||||||
Cash flows from investing activities |
|||||||||||||
Purchases of short-term investments |
(8,059 | ) | — | — | |||||||||
Acquisition of intangible assets and intellectual property |
(198 | ) | (111 | ) | (200 | ) | |||||||
Acquisition of privately held company, net of cash acquired |
(5,703 | ) | — | — | |||||||||
Software development for external use |
(2,207 | ) | (3,039 | ) | (1,243 | ) | |||||||
Purchases of property and equipment |
(6,890 | ) | (3,645 | ) | (12,130 | ) | |||||||
Proceeds from the sale of property and equipment |
— | — | 536 | ||||||||||
Net cash used in investing activities |
(23,057 | ) | (6,795 | ) | (13,037 | ) | |||||||
Cash flows from financing activities |
|||||||||||||
Proceeds from issuance of common stock under employee stock purchase plan and option exercises |
7,002 | 4,042 | 7,950 | ||||||||||
Excess tax benefits from employee stock plans |
1,861 | 5,375 | 6,480 | ||||||||||
Repurchases of treasury stock, net |
— | — | (65,064 | ) | |||||||||
Net cash provided by (used in) financing activities |
8,863 | 9,417 | (50,634 | ) | |||||||||
Net increase(decrease) in cash and cash equivalents |
6,405 | 48,791 | (49,373 | ) | |||||||||
Cash and cash equivalents at beginning of year |
169,230 | 120,439 | 169,812 | ||||||||||
Cash and cash equivalents at end of year |
$ | 175,635 | $ | 169,230 | $ | 120,439 | |||||||
Supplemental disclosures of cash flow informational |
|||||||||||||
Cash paid for interest |
$ | 4 | $ | 11 | $ | 15 | |||||||
Cash paid for taxes |
$ | 1,513 | $ | 320 | $ | 1,240 | |||||||
Supplemental disclosures of non-cash operating activity |
|||||||||||||
Indemnification asset / acquired legal contingency (Note 18) |
$ | 200 | $ | — | $ | — | |||||||
See Notes to Consolidated Financial Statements
F-5
OMNICELL, INC.
NOTES TO CONSOLIDATED FINANCIAL STATEMENTS
Note 1. Organization & Summary of Significant Accounting Policies
Description of the Company. Omnicell, Inc. ("Omnicell," "our," "us," "we," or the "Company") was incorporated in California in 1992 under the name Omnicell Technologies, Inc. and reincorporated in Delaware in 2001 as Omnicell, Inc. Our major products are medication and supply dispensing systems which are sold in our principal market, which is the healthcare industry. Our market is primarily located in the United States.
Principles of consolidation. The consolidated financial statements include the accounts of our wholly-owned subsidiaries. All significant inter-company accounts and transactions have been eliminated in consolidation.
In 2010, we completed an acquisition of Pandora Data Systems. The consolidated financial statements include the results of operations from this business combination from September 29, 2010, the date of acquisition. Additional disclosure related to the acquisition is provided in Note 2, "Acquisition."
Reclassifications. Certain reclassifications have been made to the prior year consolidated statement of cash flows to conform to the current period presentation, including software development for external use as investing cash flows instead of operating cash flows. None of these reclassifications are material to the consolidated financial statements.
Use of estimates. The preparation of financial statements in accordance with U.S. generally accepted accounting principles ("GAAP") requires management to make estimates and assumptions that affect the amounts reported in our consolidated financial statements and accompanying notes. Management bases its estimates on historical experience and various other assumptions believed to be reasonable. Although these estimates are based on management's best knowledge of current events and actions that may impact the company in the future, actual results may be different from the estimates. Our critical accounting policies are those that affect our financial statements materially and involve difficult, subjective or complex judgments by management. Those policies are revenue recognition, share- based compensation, inventory valuation, valuation of goodwill and purchased intangibles, valuation of long-lived assets and accounting for income taxes.
Cash and cash equivalents. We classify investments as cash equivalents if their original or remaining contractual maturity is three months or less at the date of purchase. Cash equivalents are stated at cost, which approximates fair value. Our cash and cash equivalents are maintained in demand deposit accounts with financial institutions of high credit quality and are invested in institutional money market funds, short-term bank time deposits and similar short duration instruments with fixed maturities from overnight to three months. We continuously monitor the creditworthiness of the financial institutions and institutional money market funds in which we invest our surplus funds. We have not experienced any credit losses from our cash investments.
We classify investments as short-term investments if their original or remaining maturities at purchase are greater than three months and their remaining maturities are one year or less.
Fair value of financial instruments. We value our financial assets and liabilities on a recurring basis using the fair value hierarchy established in Accounting Standards Codification ("ASC") 820, "Fair Value Measurements and Disclosures" (formerly referred to as SFAS No. 157).
F-6
OMNICELL, INC.
NOTES TO CONSOLIDATED FINANCIAL STATEMENTS (Continued)
Note 1. Organization & Summary of Significant Accounting Policies (Continued)
ASC 820 describes three levels of inputs that may be used to measure fair value, as follows:
Level 1 inputs, which include quoted prices in active markets for identical assets or liabilities;
Level 2 inputs, which include observable inputs other than Level 1 inputs, such as quoted prices for similar assets or liabilities; quoted prices for identical or similar assets or liabilities in markets that are not active; or other inputs that are observable or can be corroborated by observable market data for substantially the full term of the asset or liability; and
Level 3 inputs, which include unobservable inputs that are supported by little or no market activity and that are significant to the fair value of the underlying asset or liability. Level 3 assets and liabilities include those whose fair value measurements are determined using pricing models, discounted cash flow methodologies or similar valuation techniques, as well as significant management judgment or estimation.
At December 31, 2010 and December 31, 2009, our financial assets utilizing Level 1 inputs included cash equivalents. For these items, quoted market prices are readily available and fair value approximates carrying value. At December 31, 2010 we had a short term investment in California revenue anticipation notes the valuation inputs of which are classified as Level 2. We do not currently have any material financial instruments utilizing Level 3 inputs.
Classification of marketable securities. Marketable securities for which we have the intent and ability to hold to maturity are classified as Held-to-maturity, with carrying value at amortized cost, including accrued interest. At December, 31, 2010 we held $8.1 million of non-U.S. Government securities as a Held-to-maturity short-term investment. We do not hold securities for purposes of trading. However, securities held as investment for the indefinite future, pending future spending requirements are classified as Available-for-sale, with carrying value at Fair Value and any unrealized gain or loss recorded to Other comprehensive income until realized. As of December 31, 2010 and 2009 we held $150.4 million and $153.7 million, respectively of money market mutual funds as Available-for-sale cash equivalents.
Derivatives. We have no instruments that, in whole or in part, are accounted for derivative instruments under ASC 815 "Derivatives and Hedging" (formally referred to as SFAS No. 133).
Revenue recognition. Our products include hardware equipment integrated with software that is essential to the functionality of the equipment. Additionally, we provide unspecified upgrades and enhancements related to our integrated software through our maintenance contracts for most of our products. Accordingly, we account for revenue in accordance with ASC 985, "Software" (formerly referred to as SOP No. 97-2), and all related interpretations. For arrangements with multiple elements, we allocate revenue to each element using the residual method based on vendor specific objective evidence, or VSOE, of the undelivered elements. VSOE of fair value of the undelivered elements is based on the price charged when the element is sold separately.
Post-installation technical support, such as phone support, on-site service, parts and access to software upgrades, when and if available, is provided by us under separate support services terms. We recognize revenue for support services ratably over the related support services contract period.
F-7
OMNICELL, INC.
NOTES TO CONSOLIDATED FINANCIAL STATEMENTS (Continued)
Note 1. Organization & Summary of Significant Accounting Policies (Continued)
We recognize revenue when the earnings process is complete, based upon our evaluation of whether the following four criteria have been met:
- •
- Persuasive evidence of an
arrangement. We use signed customer contracts and signed customer purchase orders as evidence of an arrangement for leases and sales.
For service engagements, we use a signed services agreement and a statement of work to evidence an arrangement.
- •
- Product
delivery. Software and hardware product delivery is deemed to occur upon successful installation and receipt of a signed and dated
customer confirmation of installation letter providing evidence that we have delivered what the customer ordered. In instances of a customer self-installed installation, product delivery
is deemed to have occurred upon receipt of a signed and dated customer confirmation letter.
- •
- Fee is fixed or
determinable. We assess whether a fee is fixed or determinable at the outset of the arrangement based on the payment terms associated
with the transaction. We have established a history of collecting under the original contract without providing concessions on payments, products or services.
- •
- Collection is probable. We assess the probability of collecting from each customer at the outset of the arrangement based on a number of factors, including the customer's payment history and its current creditworthiness. If, in our judgment, collection of a fee is not probable, we defer the revenue until the uncertainty is removed, which generally means revenue is recognized upon our receipt of cash payment. Our historical experience has been that collection from our customers is generally probable.
In general, for sales not requiring our installation or modification, we recognize sales on delivery of products to our customers. We recognize sales on shipment to distributors since we do not allow for rights of return. We separately sell training and professional services which are not part of multiple element arrangements and not integral to the performance of our systems. We recognize revenue on training and professional services as they are performed.
A portion of our sales are made through multi-year lease agreements. We recognize product related revenue under sales-type leases at the net present value of the lease payment stream under ASC 840, "Leases" (formerly SFAS No. 13) once our installation obligations are met. We optimize cash flows by generally selling our non-U.S. government leases to third-party leasing finance companies on a non-recourse basis. We exclude from revenues any amounts paid to us related to the termination of an existing lease. Generally, we have no obligation to the leasing company once the lease is sold. Some of our lease sales, mostly those relating to U.S. government hospitals, are retained in-house as sales-type leases which we account for in accordance with ASC 840. Interest income in sales-type leases is recognized in product revenue using the interest method.
Accounts receivable, net and net investment in sales type leases. We actively manage our accounts receivable to minimize credit risk. We typically sell to customers for which there is a history of successful collection. New customers are subject to a credit review process, which evaluates the customers' financial position and ability to pay. We continually monitor and evaluate the collectability of our trade receivables based on a combination of factors. We record specific allowances for doubtful accounts when we become aware of a specific customer's impaired ability to meet its financial obligation to us, such as in the case of bankruptcy filings or deterioration of financial position.
F-8
OMNICELL, INC.
NOTES TO CONSOLIDATED FINANCIAL STATEMENTS (Continued)
Note 1. Organization & Summary of Significant Accounting Policies (Continued)
Uncollectible amounts are charged off against trade receivables and the allowance for doubtful accounts when we make a final determination there is no reasonable expectation of recovery. Estimates are used in determining our allowances for all other customers based on factors such as current trends, the length of time the receivables are past due and historical collection experience. While we believe that our allowance for doubtful accounts receivable is adequate and that the judgment applied is appropriate, such amounts estimated could differ materially from what will actually be uncollectible in the future.
The retained in-house leases discussed above are considered financing receivables. Our credit policies and evaluation of credit risk and write-off policies are applied alike to trade receivables and the net-investment in sales-type leases. For both, an account is generally past due after thirty days. The financing receivables also have customer-specific reserves for accounts identified for specific impairment, and a non-specific reserve applied to the remaining population, based on factors such as current trends, the length of time the receivables are past due and historical collection experience. The retained in-house leases are not stratified by portfolio or class. Financing receivables which are reserved are generally transferred to cash-basis accounting, so that revenue is recognized only as cash is received. However, the cash basis accounts continue to accrue interest.
Sales of accounts receivable. We offer our customers multi-year, non-cancelable payment terms. Generally we sell non-U.S. government receivables to third-party leasing companies on a non-recourse basis. We reflect the financing costs on the sale of these receivables as a component of our revenue. We record the sale of our accounts receivables as "true sales" in accordance with ASC 860, "Transfers and Servicing" (formerly referred to as SFAS No. 140). During the years ended 2010, 2009 and 2008, we transferred non-recourse accounts receivable totaling $51.4 million, $53.7 million and $61.4 million, respectively, which approximated fair value, to leasing companies on a non-recourse basis. At December 31, 2010 and 2009, accounts receivable included approximately $0.3 million and $1.6 million, respectively, due from third party leasing companies for transferred non-recourse accounts receivable.
Concentration of credit risk. At December 31, 2010 and 2009, no single customer accounted for more than 10% of our combined accounts receivable balance.
Commissions. Sales commissions generally are earned upon order receipt, but are recognized in income at the time of revenue recognition. Before they are recognized as expense they are recorded as prepaid commissions, which are a component of prepaid expenses.
Geographic risk. Approximately 3% of our product revenue for the year ended December 31, 2010 and 6% of our product revenue for the year ended December 31, 2009 was from foreign countries. Less than 1% of our net assets were located in foreign countries at both December 31, 2010 and December 31, 2009.
Dependence on suppliers. We have supply agreements for construction and supply of several sub-assemblies and inventory management of sub-assemblies used in our hardware products. Our contracts with our suppliers may generally be terminated by either the supplier or by us without cause and at any time upon delivery of notice that typically ranges from two months to six months. While many components of our systems are standardized and available from multiple sources, certain components or subsystems are fabricated by a sole supplier according to our specifications and timing requirements. A critical supplier may have modest annual deliveries to us, and yet be significant in
F-9
OMNICELL, INC.
NOTES TO CONSOLIDATED FINANCIAL STATEMENTS (Continued)
Note 1. Organization & Summary of Significant Accounting Policies (Continued)
terms of potential for disrupting production schedules for particular products. In terms of overall concentration, in 2010 and 2009 there was one high-volume supplier and in 2008 two high-volume suppliers. Purchases from these suppliers for the years ended December 31, 2010, 2009 and 2008 were approximately $19.1 million, $19.7 million and $25.2 million, respectively.
Inventory. Inventories are stated at the lower of cost (utilizing standard costs, using the first-in, first-out method) or market. Cost elements included in inventory are direct labor and materials plus applied overhead. We routinely assess on-hand inventory for timely identification and measurement of obsolete, slow-moving or otherwise impaired inventory. We write down our inventory for estimated obsolescence, excess or unmarketable quantities equal to the difference between the cost of the inventory and its estimated market value based on assumptions about future demand and market conditions. If actual future demand or market conditions are less favorable than we projected, additional inventory write-downs may be required.
Property and equipment. Property and equipment less accumulated depreciation are stated at historical cost. We develop molds and dies for long-term supply arrangements and capitalize those development costs as equipment. There were $1.4 million and $0.5 million of these pre-production costs related to long-term supply arrangements capitalized at December 31, 2010 and 2009, respectively. There were no pre-production costs in 2008. Depreciation and amortization of property and equipment are provided over their estimated useful lives, using the straight-line method, as follows:
Computer equipment and related software |
3 - 5 years | |
Leasehold and building improvements |
Shorter of the lease term or the estimated useful life |
|
Furniture and fixtures |
5 years |
|
Equipment and vehicles |
2 - 5 years |
Internal use software. We capitalize costs related to computer software developed or obtained for internal use in accordance with ASC 350-40, "Internal-Use Software" (formerly referred to as SOP 98-1). Software obtained for internal use has generally been enterprise-level business and finance software that we customize to meet our specific operational needs. Costs incurred in the application development phase are capitalized and amortized over their useful lives, which is generally five years. Costs recognized in the preliminary project phase and the post-implementation phase are expensed as incurred. At December 31, 2010 and December 31, 2009, we had $7.0 million and $7.6 million of costs related to application development of enterprise-level software included in property and equipment, respectively.
Software development costs. We capitalize software development costs in accordance with ASC 985-20, "Costs of Software to Be Sold, Leased, or Marketed" (formerly referred to as SFAS No. 86), under which certain software development costs incurred subsequent to the establishment of technological feasibility may be capitalized and amortized over the estimated lives of the related products. We establish feasibility when we complete a working model and amortize development costs over the estimated lives of the related products ranging from three to five years. During 2010 and 2009, we capitalized software development costs of $2.2 million and $3.0 million, respectively, which are
F-10
OMNICELL, INC.
NOTES TO CONSOLIDATED FINANCIAL STATEMENTS (Continued)
Note 1. Organization & Summary of Significant Accounting Policies (Continued)
presented in other assets. For the years ended December 31, 2010, 2009 and 2008, we charged to cost of revenues $0.9 million, $0.5 million and $0.5 million, respectively, for amortization of capitalized software development costs. All development costs prior to the completion of a working model are recognized as research and development expense.
Valuation and impairment of goodwill, other intangible assets and other long lived assets. We account for goodwill and other intangible assets in accordance with ASC 350, "Intangibles—Goodwill and Other" (formerly referred to as SFAS No. 142). For the initial recognition and measurement of Goodwill and Intangibles resulting from acquisitions, we use the guidance in ASC 805, "Business Combinations" (formerly referred to as SFAS No. 141-(R)).
Goodwill and intangible assets with indefinite lives are not amortized; rather, they are tested for impairment at least annually or sooner whenever events or changes in circumstances indicate that they may be impaired. We perform our goodwill impairment test during the fourth quarter of each year and between the annual test in certain circumstances.
To perform the goodwill impairment test, we determine the fair value of the reporting unit and compare the fair value to the reporting unit's carrying value. We believe we are one reporting unit, and therefore, we compare our fair value to the total net asset value on our balance sheet. If our total net asset value were to exceed our fair value, we would perform the second step of the impairment test. In the second step, we would compare the implied fair value of our goodwill to our carrying amount, taking a write-down to the extent the carrying amount exceeds the implied fair value. If our fair value exceeds the carrying value of our net assets under step one, then no impairment is indicated and the test is complete.
We passed the first step of our annual impairment test for 2010. In addition, there were no indicators of impairment as of December 31, 2010.
We continually monitor events and changes in circumstances that could indicate carrying amounts of long-lived assets may not be recoverable. We review long-lived assets and certain purchased intangibles for impairment whenever events or changes in circumstances indicate that we will not be able to recover the asset's carrying amount. Recoverability of an asset is measured by comparing its carrying amount to the expected future undiscounted cash flows expected to result from the use and eventual disposition of that asset, excluding future interest costs that would be recognized as an expense when incurred. Any impairment to be recognized is measured by the amount by which the carrying amount of the asset exceeds its fair market value. Significant management judgment is required in:
- •
- identifying a triggering event that arises from a change in circumstances;
- •
- forecasting future operating results; and
- •
- estimating the proceeds from the disposition of long-lived or intangible assets.
Significant management judgment is also required for initial recognition and measurement of goodwill and other intangibles assets resulting from Business Combinations per ASC 805. Management must assess the extent to which identified other intangibles assets are properly includable (and with the appropriate fair value) or properly excludable, by applying the recognition criteria. This judgment affects not only the other intangible assets but the remainder calculation of goodwill. The assessment of
F-11
OMNICELL, INC.
NOTES TO CONSOLIDATED FINANCIAL STATEMENTS (Continued)
Note 1. Organization & Summary of Significant Accounting Policies (Continued)
useful life for each acquired intangible impacts future financial position and operating performance through amortization expense.
Deferred revenue and deferred gross profits. Deferred revenue arises when customers are billed for products and/or services in advance of revenue recognition. Our deferred revenue consists primarily of unearned revenue on sale of equipment for which installation has not been completed, and software licenses for which revenue is recognized over the duration of the license and the unearned portion of support service contracts.
Valuation of share-based awards. We account for share-based compensation plans in accordance to the provisions of ASC 718, "Stock Compensation" (formerly referred to as SFAS No. 123(R)). We estimate the fair value of our employee stock awards at the date of grant using certain subjective assumptions, such as expected volatility, which is based on a combination of historical and market- based implied volatility, and the expected term of the awards which is based on our historical experience of employee stock option exercises including forfeitures. Our valuation assumptions used in estimating the fair value of share-based awards may change in future periods. We recognize the fair value of awards over their vesting period or requisite service period. In addition, we calculate our pool of excess tax benefits available within additional paid-in capital in accordance with the provisions of ASC 718.
Accounting for income taxes. We record a tax provision for the anticipated tax consequences of the reported results of operations. In accordance with GAAP, the provision for income taxes is computed using the asset and liability method, under which deferred tax assets and liabilities are recognized for the expected future tax consequences of temporary differences between the financial reporting and tax bases of assets and liabilities, and for operating losses and tax credit carry forwards. Deferred tax assets and liabilities are measured using the enacted tax rates expected to apply to taxable income in the periods in which those tax assets and liabilities are expected to be realized or settled. In the event that these tax rates change, we will incur a benefit or detriment to our income tax expense in the period of change. We can also determine that all or part of the net deferred tax assets are not realizable in the future, we will record a valuation allowance that would be charged to earnings in the period such determination is made.
In accordance with ASC 740, "Income Taxes" (formerly referred to as SFAS No. 109), we recognize the tax benefit from an uncertain tax position if it is more likely than not that the tax position will be sustained on examination by the taxing authorities, based on the technical merits of the position. The tax benefits recognized in the financial statements from such positions are then measured based on the largest benefit that has a greater than 50% likelihood of being realized upon ultimate settlement. The calculation of tax liabilities involves significant judgment in estimating the impact of uncertainties in the application of GAAP and complex tax laws. Resolution of these uncertainties in a manner inconsistent with management's expectations could have a material impact on our financial condition and operating results.
Please refer to Note 14, "Income Taxes" for further information.
Shipping and handling costs. Our shipping and handling costs charged to customers are included in net revenue and the associated expense is recorded in selling, general and administrative expenses
F-12
OMNICELL, INC.
NOTES TO CONSOLIDATED FINANCIAL STATEMENTS (Continued)
Note 1. Organization & Summary of Significant Accounting Policies (Continued)
for all periods presented. Shipping and handling costs amounted to $2.1 million, $1.9 million and $2.6 million for the years ended December 31, 2010, 2009 and 2008, respectively.
Advertising. Advertising costs are expensed as incurred and amounted to $1.1 million, $0.7 million and $0.6 million for the years ended December 31, 2010, 2009 and 2008, respectively.
Operating leases. We lease our buildings under operating leases accounted for in accordance with ASC 840, "Leases" (formerly referred to as SFAS No. 13).
Sales taxes. Sales taxes collected from customers and remitted to governmental authorities are not included in our revenue.
Net income per share. Basic net income per share is computed by dividing net income—the numerator—by the weighted average number of shares outstanding—the denominator—during the period excluding the dilutive effect of stock options and other employee stock plans. Diluted net income per share gives effect to all potentially dilutive common stock equivalents outstanding during the period. In computing diluted net income per share under the treasury stock method, the average stock price for the period is used in determining the number of shares assumed to be purchased from the proceeds of stock option exercises.
Foreign currency translation. The functional currency of our foreign subsidiary is the U.S. dollar. Non-functional currency monetary balances are re-measured into the functional currency of the subsidiary with any related gain or loss recorded in other income, in the accompanying Consolidated Statements of Operations.
Segment information. We manage our business on the basis of a single operating segment, and a single reporting unit within that segment per ASC 280, "Segment reporting" (formerly referred to as SFAS No. 131). Our products and technologies share similar distribution channels and customers and are sold primarily to hospitals and healthcare facilities to improve patient safety and care and enhance operational efficiency. Our sole operating segment is medication and supply dispensing systems. The September 2010 acquisition of Pandora Data Systems resulted in neither the creation of a new reporting unit nor a new operating segment. Substantially all of our long-lived assets are located in the United States. For the years ended December 31, 2010, 2009 and 2008, all of our total revenues and gross profits were generated by the medication and supply dispensing systems operating segment from customers in the United States and no one customer accounted for greater than 10% of our revenues.
Recently Issued and Adopted Accounting Standards
In October 2009, the Financial Accounting Standards Board ("FASB") issued Accounting Standards Updates ("ASU") 2009-13 and 2009-14, or ASU 2009-13 and ASU 2009-14, which amended ASC 605, "Revenue Recognition," and ASC 985-605, "Software-Revenue Recognition," respectively. ASU 2009-13 requires companies to allocate arrangement consideration in multiple-element arrangements based on an element's estimated selling price if vendor-specific or other third-party evidence of selling price is not available. ASU 2009-14 revises the guidance regarding the types of arrangements that fall under the scope of the software recognition guidance, providing a scope exception for many transactions that were previously within the scope of Subtopic ASC 985-605, including tangible products containing software components and non-software components that function together to deliver the product's essential functionality and places them under Subtopic ASC 605-25,
F-13
OMNICELL, INC.
NOTES TO CONSOLIDATED FINANCIAL STATEMENTS (Continued)
Note 1. Organization & Summary of Significant Accounting Policies (Continued)
thus requiring the new multiple-element revenue allocation under ASU 2009-13. Both ASU 2009-13 and ASU 2009-14 are effective for fiscal years beginning on or after June 15, 2010 and we intend to adopt these ASUs at the beginning of our fiscal year 2011. We are currently evaluating the how the adoption of these ASUs will impact our operating results, financial position and cash flows.
In July 2010, the FASB issued "Disclosure about the Credit Quality of Financing Receivables and the Allowance for Credit Losses" as ASU 2010-20, amending ASC 310, "Receivables." ASU 2010-20 requires certain disclosures about the credit quality of financing receivables and the related allowance for credit losses. In addition, disclosures are required related to the nature of credit risk inherent in the portfolio of financing receivables, how the credit risk is analyzed and assessed in arriving at the allowance for credit losses, and the changes and reasons for those changes in the allowance for credit losses. For public entities, the new disclosures for the end of a reporting period are effective for interim and annual reporting periods ending on or after December 15, 2010, with new disclosures about period activity effective for interim and annual reporting periods beginning on or after December 15, 2010. The period end disclosures are effective for us for December 31, 2010, with the period-activity disclosures are effective beginning with the first quarter of 2011. As ASU 2010-20 is a disclosure standard, we do not anticipate the adoption of this standard to have any impact on our operating results, financial position or cash flows.
Note 2. Acquisition
On September 29, 2010, we completed the acquisition of all of the outstanding capital stock of Pandora Data Systems, Inc. ("Pandora"), a provider of analytical software for medication diversion detection and regulatory compliance, for $6.0 million in cash. Pandora solutions are installed in over 700 acute care hospitals in the United States and interface with all major medication management systems in the market.
In connection with the acquisition, we recorded $3.6 million of goodwill, equal to the excess of the purchase price over the fair values of the net tangible and intangible assets acquired, which is tax-
F-14
OMNICELL, INC.
NOTES TO CONSOLIDATED FINANCIAL STATEMENTS (Continued)
Note 2. Acquisition (Continued)
deductible over a fifteen-year period. The following table summarizes the Fair Value acquisition accounting for Pandora on the September 29, 2010 purchase date (amounts in thousands of dollars):
| |
Fair Values Acquired |
||||
|---|---|---|---|---|---|
Cash |
$ | 297 | |||
Accounts receivable |
416 | ||||
Indemnification asset (see Note 18) |
1,000 | ||||
Intangibles |
2,420 | ||||
Goodwill |
3,561 | ||||
Deferred tax asset |
108 | ||||
Total assets |
7,802 | ||||
Accrued compensation/other |
292 |
||||
Deferred service revenue |
510 | ||||
Litigation contingency (see Note 18) |
1,000 | ||||
Total liabilities |
1,802 | ||||
Net assets acquired |
$ |
6,000 |
|||
Cash consideration |
$ | 6,000 | |||
The $0.4 million fair value of accounts receivable consists of gross contractual commitments from customers less the amount not expected to be collected. The $0.5 million of deferred service revenue represents the fair value, using estimated discounted cash flows, of acquired remaining performance obligations under service contracts.
Additionally, an acquired legal contingency related to a contractual dispute between Pandora and a third party resulted in a liability accrual of $1.0 million, measured under ASC 450 Contingencies guidance. An indemnification asset of $1.0 million was also recorded, since the former shareholders of Pandora had agreed to indemnify Omnicell against losses related to the litigation and a portion of the purchase price was placed in escrow to secure the indemnification obligations of the former Pandora shareholders. As discussed in Note 18, this lawsuit was settled February 17, 2011 for $1.2 million, to be paid entirely from the selling shareholders' escrow account. As this is considered a new development since there was no evidence of conditions existing at the September 29, 2010 acquisition date, the disclosure of these amounts in the original purchase price allocation has not been adjusted. However, our balance sheet as of December 31, 2010 reflects the updated $1.2 million values for the acquired legal contingency and the indemnification asset, as required for recognized subsequent events. There was no impact on net income.
F-15
OMNICELL, INC.
NOTES TO CONSOLIDATED FINANCIAL STATEMENTS (Continued)
Note 2. Acquisition (Continued)
The fair values and useful lives for the identified intangible assets in the table below were determined by management, with assistance of valuation specialists. No residual values were assumed for the acquired intangible assets.
| |
Thousands of Dollars | Useful Life (years) | |||||
|---|---|---|---|---|---|---|---|
Trade name |
$ | 90 | 3 | ||||
Customer relationships |
1,290 | 16 | |||||
Non-compete agreements |
60 | 3 | |||||
Acquired technology |
980 | 7 | |||||
Finite-lived intangibles acquired |
$ | 2,420 | |||||
Weighted avg. life of intangibles |
11.5 | ||||||
Operating results of Pandora have been combined with our operating results from the date of acquisition. Pro forma combined operating results for Omnicell and Pandora for the years ended December 31, 2010 and 2009 have been omitted since the results of operations of Pandora were not material.
Note 3. Net Income Per Share
Basic net income per share is computed by dividing net income for the period by the weighted average number of shares outstanding during the period, less shares subject to repurchase. Diluted net income per share is computed by dividing net income for the period by the weighted average number of shares less shares subject to repurchase plus, if dilutive, potential common stock outstanding during the period. Potential common stock includes the effect of outstanding dilutive stock options, restricted stock awards and restricted stock units computed using the treasury stock method. Potential common stock which is anti-dilutive is excluded. Since their impact is anti-dilutive, the total number of shares excluded from the calculations of diluted net income per share for the years ended December 31, 2010, December 31, 2009 and December 31, 2008 were 2,005,642 shares, 4,061,857 shares and 1,713,276 shares, respectively.
F-16
OMNICELL, INC.
NOTES TO CONSOLIDATED FINANCIAL STATEMENTS (Continued)
Note 3. Net Income Per Share (Continued)
The calculation of basic and diluted net income per share is as follows (in thousands, except per share amounts):
| |
Years Ended December 31, | ||||||||||
|---|---|---|---|---|---|---|---|---|---|---|---|
| |
2010 | 2009 | 2008 | ||||||||
Basic: |
|||||||||||
Net income |
$ | 4,892 | $ | 444 | $ | 12,724 | |||||
Weighted average shares outstanding—basic |
32,651 | 31,691 | 32,076 | ||||||||
Net income per share—basic |
$ | 0.15 | $ | 0.01 | $ | 0.40 | |||||
Diluted: |
|||||||||||
Net income |
$ | 4,892 | $ | 444 | $ | 12,724 | |||||
Weighted average shares outstanding—basic |
32,651 | 31,691 | 32,076 | ||||||||
Dilutive effect of employee stock plans |
862 | 372 | 1,032 | ||||||||
Weighted average shares outstanding—diluted |
33,513 | 32,063 | 33,108 | ||||||||
Net income per share—diluted |
$ | 0.15 | $ | 0.01 | $ | 0.38 | |||||
Note 4. Cash and Cash Equivalents, Short-term Investments and Fair Value of Financial Instruments
Cash and cash equivalents and short-term investments consist of the following significant investment asset classes, with disclosure of carrying cost, gross unrealized gains and losses, and fair value as of December 31, 2010 and 2009, respectively (in thousands):
| |
December 31, 2010 | |
|||||||||||||||||||||
|---|---|---|---|---|---|---|---|---|---|---|---|---|---|---|---|---|---|---|---|---|---|---|---|
| |
Carrying Cost | Unrealized Gains |
Unrealized Losses |
Fair Value | Cash / cash equivalents |
Short-term investments |
Security classification |
||||||||||||||||
Cash |
$ | 25,593 | — | — | $ | 25,593 | $ | 25,593 | — | N/A | |||||||||||||
Money market funds |
150,042 | — | — | 150,042 | 150,042 | — | Available for sale | ||||||||||||||||
Non-U.S. government securities |
8,074 | $ | 12 | — | 8,086 | — | $ | 8,074 | Held-to-maturity | ||||||||||||||
Total cash, cash equivalents and short-term investments |
$ | 183,709 | $ | 12 | — | $ | 183,721 | $ | 175,635 | $ | 8,074 | ||||||||||||
| |
December 31, 2009 | |
|||||||||||||||||||||
|---|---|---|---|---|---|---|---|---|---|---|---|---|---|---|---|---|---|---|---|---|---|---|---|
| |
Carrying Cost | Unrealized Gains |
Unrealized Losses |
Fair Value | Cash / cash equivalents |
Short-term investments |
Security classification |
||||||||||||||||
Cash |
$ | 15,530 | — | — | $ | 15,530 | $ | 15,530 | — | N/A | |||||||||||||
Money market funds |
153,700 | — | — | 153,700 | 153,700 | — | Available for sale | ||||||||||||||||
Total cash, cash equivalents and short-term investments |
$ | 169,230 | — | — | $ | 169,230 | $ | 169,230 | — | ||||||||||||||
F-17
OMNICELL, INC.
NOTES TO CONSOLIDATED FINANCIAL STATEMENTS (Continued)
Note 4. Cash and Cash Equivalents, Short-term Investments and Fair Value of Financial Instruments (Continued)
The money market fund is a daily-traded cash equivalent with price of $1.00, making it a Level 1 asset class; its carrying cost closely approximates fair value. As the demand deposit (cash) balances vary with the timing of collections and payments, the money market fund can cover any surplus or deficit, and thus is considered available-for-sale.
The short term investments purchased in November 2010 are comprised of California revenue anticipation notes, which mature in June 2011. They are recorded at their carrying cost as held-to-maturity as we have both the ability and intent to keep these investments until they mature. The notes are a Level 2 asset class, because their pricing is drawn from multiple market-related inputs, but in general not from same-day, same-security trades.
The following table displays the financial assets measured at fair value, on a recurring basis (in thousands):
| |
Quoted Prices in Active Markets for Identical Instruments (Level 1) |
Significant Other Observable Inputs (Level 2) |
Significant Unobservable Inputs (Level 3) |
Total Fair Value |
||||||||||
|---|---|---|---|---|---|---|---|---|---|---|---|---|---|---|
At December 31, 2010 |
||||||||||||||
Money market funds |
$ | 150,042 | — | — | $ | 150,042 | ||||||||
Total |
$ | 150,042 | — | — | $ | 150,042 | ||||||||
At December 31, 2009 |
||||||||||||||
Money market funds |
$ | 153,700 | — | — | $ | 153,700 | ||||||||
Total |
$ | 153,700 | — | — | $ | 153,700 | ||||||||
Current assets and current liabilities are recorded at amortized cost, which approximates fair value due to the short maturities implied.
The following table displays the financial assets measured at carrying cost, but for which disclosure of fair value is required on a recurring basis (in thousands):
| |
Quoted Prices in Active Markets for Identical Instruments (Level 1) |
Significant Other Observable Inputs (Level 2) |
Significant Unobservable Inputs (Level 3) |
Total Fair Value |
||||||||||
|---|---|---|---|---|---|---|---|---|---|---|---|---|---|---|
At December 31, 2010 |
||||||||||||||
Non-U.S. Government securities |
— | $ | 8,086 | — | $ | 8,086 | ||||||||
Total |
— | $ | 8,086 | — | $ | 8,086 | ||||||||
At December 31, 2009 |
||||||||||||||
Non-U.S. Government securities |
— | — | — | — | ||||||||||
Total |
— | — | — | — | ||||||||||
F-18
OMNICELL, INC.
NOTES TO CONSOLIDATED FINANCIAL STATEMENTS (Continued)
Note 5. Inventories
Inventories consist of the following (in thousands):
| |
December 31, | |||||||
|---|---|---|---|---|---|---|---|---|
| |
2010 | 2009 | ||||||
Raw materials |
$ | 4,252 | $ | 3,589 | ||||
Work in process |
153 | 171 | ||||||
Finished goods |
5,380 | 6,742 | ||||||
Total |
$ | 9,785 | $ | 10,502 | ||||
Note 6. Property and Equipment
Property and equipment consist of the following (in thousands):
| |
December 31, | ||||||
|---|---|---|---|---|---|---|---|
| |
2010 | 2009 | |||||
Equipment and vehicles |
$ | 20,045 | $ | 17,942 | |||
Furniture and fixtures |
1,681 | 1,236 | |||||
Leasehold improvements |
3,182 | 3,248 | |||||
Purchased software |
18,095 | 15,042 | |||||
Capital in process |
1,689 | 2,746 | |||||
|
44,692 | 40,214 | |||||
Accumulated depreciation and amortization |
(30,341 | ) | (27,005 | ) | |||
Property and equipment, net |
$ | 14,351 | $ | 13,209 | |||
Depreciation and amortization of property and equipment was approximately $5.6 million, $6.6 million and $5.7 million for the years ended December 31, 2010, 2009 and 2008, respectively.
Note 7. Net Investment in Sales-Type Leases
Our sales-type leases are for terms generally ranging up to five years. Sales-type lease receivables are collateralized by the underlying equipment. The components of our net investment in sales-type leases are as follows (in thousands):
| |
December 31, | ||||||
|---|---|---|---|---|---|---|---|
| |
2010 | 2009 | |||||
Net minimum lease payments to be received |
$ | 16,284 | $ | 17,164 | |||
Less unearned interest income portion |
1,843 | 2,001 | |||||
Net investment in sales-type leases |
14,441 | 15,163 | |||||
Less current portion(1) |
5,217 | 5,059 | |||||
Non-current net investment in sales-type leases(2) |
$ | 9,224 | $ | 10,104 | |||
- (1)
- A component of other current assets. This amount is net of allowance for doubtful accounts of $0.1 million at December 31, 2010 and $0 at December 31, 2009.
F-19
OMNICELL, INC.
NOTES TO CONSOLIDATED FINANCIAL STATEMENTS (Continued)
Note 7. Net Investment in Sales-Type Leases (Continued)
- (2)
- Net of allowance for doubtful accounts of $0.3 million and $0.6 million as of December 31, 2010 and December 31, 2009, respectively.
The minimum lease payments for each of the five succeeding fiscal years are as follows (in thousands):
2011 |
$ | 6,425 | |||
2012 |
4,704 | ||||
2013 |
2,781 | ||||
2014 |
1,660 | ||||
2015 |
690 | ||||
Thereafter |
24 | ||||
Total |
$ | 16,284 | |||
The following table summarizes the credit losses and recorded investment in sales-type leases, excluding unearned interest, as of December 31, 2010 (in thousands):
| |
Allowance for credit losses | Recorded investment in sales- type leases-Gross |
Recorded investment in sales- type leases-Net |
|||||||
|---|---|---|---|---|---|---|---|---|---|---|
Accounts individually evaluated for impairment |
$ | 283 | $ | 283 | $ | — | ||||
Accounts collectively evaluated for impairment |
128 | 14,569 | 14,441 | |||||||
Ending balances: December 31, 2010 |
$ | 411 | $ | 14,852 | $ | 14,441 | ||||
Note 8. Goodwill and Other Intangible Assets
Under ASC 350, "Intangibles—Goodwill and Other," goodwill is not subject to amortization. We evaluate goodwill for impairment at least annually or more frequently if events and changes in circumstances suggest that the carrying amount may not be recoverable. In 2010, the increase in goodwill of $3.6 million was due to the acquisition of Pandora Data Systems. In 2008, the increase in goodwill of $1.9 million was due to finalizing the working capital valuation, the discovery of pre-existing liabilities and revised estimates of liabilities assumed relating to the acquisition of Rioux Vision. No goodwill impairment was recognized in 2010, 2009 or 2008.
F-20
OMNICELL, INC.
NOTES TO CONSOLIDATED FINANCIAL STATEMENTS (Continued)
Note 8. Goodwill and Other Intangible Assets (Continued)
Goodwill and other intangible assets consist of the following (in thousands):
| |
December 31, 2010 | December 31, 2009 | |
||||||||||||||||||
|---|---|---|---|---|---|---|---|---|---|---|---|---|---|---|---|---|---|---|---|---|---|
| |
Gross Carrying Amount |
Accumulated Amortization |
Net Carrying Amount |
Gross Carrying Amount |
Accumulated Amortization |
Net Carrying Amount |
Amortization Life |
||||||||||||||
Finite-lived intangibles: |
|||||||||||||||||||||
Customer relationships |
$ | 4,230 | $ | 1,142 | $ | 3,088 | $ | 3,184 | $ | 999 | $ | 2,185 | 5 - 16 years | ||||||||
Acquired technology |
5,660 | 4,715 | 945 | 9,364 | 7,888 | 1,476 | 3 - 7 years | ||||||||||||||
Patents |
654 | 152 | 502 | 455 | 110 | 345 | 20 years | ||||||||||||||
Non-compete agreements |
780 | 725 | 55 | 720 | 493 | 227 | 3 years | ||||||||||||||
Trade name |
90 | 8 | 82 | — | — | — | 3 year | ||||||||||||||
Total finite-lived intangibles |
11,414 | 6,742 | 4,672 | 13,723 | 9,490 | 4,233 | |||||||||||||||
Goodwill |
28,543 | — | 28,543 | 24,982 | — | 24,982 | Indefinite | ||||||||||||||
Net other intangible assets & goodwill |
$ | 39,957 | $ | 6,742 | $ | 33,215 | $ | 38,705 | $ | 9,490 | $ | 29,215 | |||||||||
During 2010, 2009 and 2008, we capitalized third-party costs associated with internally developed patent costs of $0.2 million, $0.1 million and $0.2 million, respectively. Additionally, in 2008, we recorded an impairment charge of approximately $0.2 million to write-off capitalized patents costs due to certain technologies either being abandoned or product lines being discontinued. The impairment charge is recorded as a selling, general and administrative expense in our Consolidated Statements of Operations.
Amortization expense of other intangible assets totaled $2.2 million, $2.4 million and $2.8 million for the years ended December 31, 2010, 2009 and 2008, respectively. Amortization expenses are recorded in cost of product revenues and also in selling, general and administrative expenses, based on the nature of the underlying intangible asset. Estimated future amortization expense of the finite-lived intangible assets at December 31, 2010 is as follows (in thousands):
2011 |
$ | 653 | |||
2012 |
653 | ||||
2013 |
641 | ||||
2014 |
601 | ||||
2015 |
579 | ||||
Thereafter |
1,545 | ||||
Total |
$ | 4,672 | |||
F-21
OMNICELL, INC.
NOTES TO CONSOLIDATED FINANCIAL STATEMENTS (Continued)
Note 8. Goodwill and Other Intangible Assets (Continued)
The following goodwill roll-forward table consists of a single segment / single reporting unit (in thousands):
| |
Gross Carrying Amount |
Accumulated Impairment Losses |
Net Carrying Amount |
||||||||
|---|---|---|---|---|---|---|---|---|---|---|---|
Beginning balance, January 1, 2010 and 2009 |
$ | 24,982 | $ | — | $ | 24,982 | |||||
Goodwill acquired during year |
3,561 | — | 3,561 | ||||||||
Impairment losses |
— | — | — | ||||||||
Ending balance, December 31, 2010 |
$ | 28,543 | $ | — | $ | 28,543 | |||||
Note 9. Other Assets
Other assets consist of the following (in thousands):
| |
December 31, | ||||||
|---|---|---|---|---|---|---|---|
| |
2010 | 2009 | |||||
Long-term deposits |
$ | 383 | $ | 473 | |||
Capitalized software development costs, net of accumulated amortization of $3,441 and $2,569 in 2010 and 2009, respectively |
5,462 | 4,127 | |||||
Non-current deferred service billings receivable |
2,162 | 4,347 | |||||
Other assets |
358 | 375 | |||||
Total |
$ | 8,365 | $ | 9,322 | |||
Note 10. Accrued Liabilities
Accrued liabilities consist of the following (in thousands):
| |
December 31, | |||||||
|---|---|---|---|---|---|---|---|---|
| |
2010 | 2009 | ||||||
Accrued GPO (Group Purchasing Organization) fees |
$ | 2,272 | $ | 2,932 | ||||
Advance payments from customers |
1,978 | 662 | ||||||
Rebates and lease buyouts |
1,923 | 1,140 | ||||||
Pre-acquisition contingency |
1,200 | 5,269 | ||||||
Other |
1,311 | 1,994 | ||||||
Total |
$ | 8,684 | $ | 11,997 | ||||
F-22
OMNICELL, INC.
NOTES TO CONSOLIDATED FINANCIAL STATEMENTS (Continued)
Note 11. Deferred Gross Profit
Deferred gross profit consists of the following (in thousands):
| |
December 31, | ||||||
|---|---|---|---|---|---|---|---|
| |
2010 | 2009 | |||||
Sales of medication and supply dispensing systems, which have been delivered and invoiced but not yet installed |
$ | 18,739 | $ | 20,876 | |||
Cost of sales, excluding installation costs |
(7,020 | ) | (7,187 | ) | |||
Deferred gross profit |
$ | 11,719 | $ | 13,689 | |||
Note 12. Commitments
The minimum payments under our operating leases for each of the five succeeding fiscal years are as follows (in thousands):
2011 |
$ | 3,875 | |||
2012 |
1,667 | ||||
2013 |
500 | ||||
2014 |
350 | ||||
2015 |
178 | ||||
Total |
6,570 | ||||
Commitments under operating leases relate primarily to leasehold property and office equipment. For 2011, we have $0.5 million of non-cancellable sublease income. In April 2010, we entered into a lease agreement to replace certain expiring leases with approximately 25,000 square feet of office space in Nashville, Tennessee. The new lease is for a term of 60 months, and commenced July 2010, with two five-year renewal options. The base rental commitment for the initial five-year term totals $1.7 million. Rent expense totaled $3.6 million, $3.5 million and $3.4 million for the years ended December 31, 2010, 2009 and 2008, respectively.
We purchase components from a variety of suppliers and use contract manufacturers to provide manufacturing services for our products. During the normal course of business, we issue purchase orders with estimates of our requirements several months ahead of the delivery dates. Our near-term commitments to our contract manufacturers and suppliers totaled $4.9 million as of December 31, 2010.
Note 13. Contingencies
Legal Proceedings
Flo Healthcare Solutions, LLC. On December 11, 2007, we acquired Rioux Vision, Inc., which had an existing lawsuit in progress at the time of that acquisition. Omnicell was defending that lawsuit, as Rioux Vision is a wholly-owned subsidiary of Omnicell. On October 26, 2006, Rioux Vision was served with a complaint in a lawsuit entitled Flo Healthcare Solutions, LLC v. Rioux Vision, Inc., Case Number 1:06-cv-02600, in the United States District Court for the Northern District of Georgia, alleging claims of patent infringement regarding certain features of the mobile carts sold by Rioux Vision. On December 11, 2008, we were served with a complaint in a lawsuit entitled Flo Healthcare
F-23
OMNICELL, INC.
NOTES TO CONSOLIDATED FINANCIAL STATEMENTS (Continued)
Note 13. Contingencies (Continued)
Solutions, LLC v. Omnicell, Inc., Case Number 1:06-cv-02600, in the same Court alleging similar claims of patent infringement regarding Omnicell's sale of the mobile carts acquired in the Rioux acquisition. In accordance with Accounting Standards Codification, or ASC, 805, "Business Combinations," we recorded a pre-acquisition contingency based on our assessment of its fair value in our preliminary purchase price allocation. The fair value for this pre-acquisition contingency represents the amount we and Rioux agreed to adjust the purchase price as a result of our acceptance of any and all costs and risks relating to this contingency. The pre-acquisition contingency was recorded as an accrued liability as of the acquisition date.
On March 4, 2009, we filed, but did not serve, a complaint against Flo Healthcare Solutions, or Flo, entitled Omnicell, Inc. v. Flo Healthcare Solutions LLC, Case Number C09 00923, in the United States District Court for the Northern District of California, with respect to the infringement of Omnicell's U.S. Patent Number 6,604,019. Flo received a courtesy copy of the complaint. On March 10, 2009, we consented to a motion that Flo filed requesting a stay of the Flo Healthcare Solutions LLC v. Rioux Vision, Inc. lawsuit pending the final outcome, including all appeals, of the inter parties reexamination of U.S. Patent No. 6,721,178, currently before the United States Patent and Trademark Office or the Reexamination, which was granted. We consented to a similar motion filed by Flo with respect to the stay of the Flo Healthcare Solutions LLC v. Omnicell, Inc. lawsuit, which was also granted. Under a tolling agreement between the parties, we agreed to dismiss without prejudice the Omnicell, Inc. v. Flo Healthcare Solutions LLC lawsuit, and Omnicell and Flo agreed to toll further actions under all three lawsuits pending the final outcome, including all appeals, of the Reexamination.
On September 30, 2010, Omnicell settled all pending litigation in the Northern District of Georgia with Flo Healthcare LLC, which is now part of the entity InterMetro Industries Corporation. Additionally, Omnicell paid InterMetro $2.7 million, and entered into a patent cross-license agreement with InterMetro, wherein Omnicell received an ongoing license to the patent at issue in the suits, and InterMetro received licenses to two Omnicell patents. The parties jointly filed a motion of dismissal for each of the cases with the Georgia court on October 25, 2010, and the court dismissed both cases, with prejudice, on January 26, 2011. In connection with this settlement, $2.4 million of previously accrued liabilities were released and this gain was recorded as a reduction to selling, general and administrative expense in the three months ended September, 30, 2010.
Medacist Solutions Group, LLC. On July 8, 2009, Medacist Solutions Group LLC filed a complaint against Omnicell in U.S. District Court in the Southern District of New York, entitled Medacist Solutions Group LLC v. Omnicell, Inc., case number 09 CV 6128, alleging infringement of Medacist's U.S. Patent Number 6,842,736. The complaint also, among other claims, alleges that Omnicell breached the terms of a nondisclosure agreement it had entered into with Medacist, and that Omnicell misappropriated Medacist's trade secrets and confidential information in violation of the NDA. Medacist is seeking unspecified monetary damages and an injunction against the Company's infringement of the specified patent and/or misuse of any of Medacist's trade secrets pursuant to the NDA or in violation of California code. Omnicell has responded to the complaint, denies the claims, and intends to defend the matter vigorously. In June 2010, the Court issued its Civil Case Management Plan and Scheduling Order indicating that discovery in the case will be conducted through March 11, 2011.
On October 20, 2010, the Company filed a declaratory judgment complaint against Medacist Solutions Group, LLC in the U.S. District Court in the Northern District of California, entitled
F-24
OMNICELL, INC.
NOTES TO CONSOLIDATED FINANCIAL STATEMENTS (Continued)
Note 13. Contingencies (Continued)
Omnicell, Inc. and Pandora Data Systems, Inc. v. Medacist Solutions Group, LLC, Case Number 10-cv-4746 (the "California Action"). Pandora Data Systems, Inc. had entered into a Settlement and License Agreement with Medacist in October 2008 (the "Settlement Agreement") pursuant to which, among other things, Medacist granted to Pandora a non-exclusive license to Medacist's U.S. Patent Number 6,842,736. The Company seeks an order declaring that Omnicell, as now-owner of Pandora Data Systems, Inc., is entitled to certain rights and benefits under the license. On November 12, 2010, Medacist filed a motion to dismiss the California Action, or in the alternative, to transfer venue to the U.S. District Court for the District of Connecticut. On February 10, 2011, the Court granted Medacist's motion and dismissed the California Action without prejudice. On February 14, 2011, Omnicell and Pandora filed a notice of appeal regarding dismissal of the California Action with the U.S. Court of Appeals for the Ninth Circuit (the "California Appeal"). The California Appeal is now pending. Also on November 12, 2010, Medacist filed a motion in the U.S. District Court in the District of Connecticut to reopen a litigation entitled Medacist Solutions Group, LLC v. Pandora Data Systems, Inc., Case Number 3:07-CV-00692(JCH) (the "Connecticut Litigation"), which had been dismissed and administratively closed since October 29, 2008. Medacist seeks, among other things, relief from the Stipulation of Dismissal entered on October 29, 2008 dismissing the Connecticut Litigation for the limited purpose of interpreting and enforcing the Settlement Agreement, the entry of a temporary restraining order and preliminary and permanent injunctions prohibiting breaches of the Settlement Agreement, a finding that Pandora breached the Settlement Agreement and an award of monetary damages resulting from Pandora's alleged breaches. On December 3, 2010, the Company and Pandora filed a response to this motion. At this time, the Connecticut Litigation remains closed, and no hearings have been scheduled on Medacist's motion. While it is reasonably possible the Company could, at some point in the future, incur a loss in connection with this matter, management at this time cannot determine the range of any such potential loss.
As required under ASC 450, "Contingencies," we accrue for contingencies when we believe that a loss is probable and that we can reasonably estimate the amount of any such loss. We have made an assessment of the probability of incurring any such losses and such amounts are reflected in accrued liabilities in our consolidated financial statements. Except as otherwise indicated above, we believe that the outcomes in these matters are not probable or reasonably estimable. We believe that we have valid defenses with respect to legal matters pending against us. However, litigation is inherently unpredictable, and it is possible that cash flows or results of operations could be materially affected in any particular period by the unfavorable resolution of one or more of these contingencies or because of the diversion of management's attention and the creation of significant expenses.
Guarantees
As permitted under Delaware law and our certificate of incorporation and bylaws, we have agreed to indemnify our directors and officers against certain losses that they may suffer by reason of the fact that such persons are, were or become our directors or officers. The term of the indemnification period is for the director's or officer's lifetime and there is no limit on the potential amount of future payments that we could be required to make under these indemnification agreements. We have purchased directors' and officers' liability insurance policy that may enable us to recover a portion of any future payments that we may be required to make under these indemnification agreements. Assuming the applicability of coverage and the willingness of the insurer to assume coverage and subject to certain retention, loss limits and other policy provisions, we believe it is unlikely that we will
F-25
OMNICELL, INC.
NOTES TO CONSOLIDATED FINANCIAL STATEMENTS (Continued)
Note 13. Contingencies (Continued)
be required to pay any material amounts pursuant to these indemnification obligations. However, no assurances can be given that the insurers will not attempt to dispute the validity, applicability or amount of coverage without expensive and time-consuming litigation against the insurers.
Additionally, we undertake indemnification obligations in our ordinary course of business in connection with, among other things, the licensing of our products and the provision of our support services. In the ordinary course of our business, we have in the past and may in the future agree to indemnify another party, generally our business affiliates or customers, against certain losses suffered or incurred by the indemnified party in connection with various types of claims, which may include, without limitation, claims of intellectual property infringement, certain tax liabilities, our gross negligence or intentional acts in the performance of support services and violations of laws. The term of these indemnification obligations is generally perpetual. In general, we attempt to limit the maximum potential amount of future payments that we may be required to make under these indemnification obligations to the amounts paid to us by a customer, but in some cases the obligation may not be so limited. In addition, we have in the past and may in the future warrant to our customers that our products will conform to functional specifications for a limited period of time following the date of installation (generally not exceeding 30 days) or that our software media is free from material defects. From time to time, we may also warrant that our professional services will be performed in a good and workmanlike manner or in a professional manner consistent with industry standards. We generally seek to disclaim most warranties, including any implied or statutory warranties such as warranties of merchantability, fitness for a particular purpose, title, quality and non-infringement, as well as any liability with respect to incidental, consequential, special, exemplary, punitive or similar damages. In some states, such disclaimers may not be enforceable. If necessary, we would provide for the estimated cost of product and service warranties based on specific warranty claims and claim history. We have not been subject to any significant claims for such losses and have not incurred any material costs in defending or settling claims related to these indemnification obligations. Accordingly, we believe it is unlikely that we will be required to pay any material amounts pursuant to these indemnification obligations or potential warranty claims and, therefore, no liabilities have been recorded for such indemnification obligations as of December 31, 2010 or 2009.
Note 14. Income Taxes
The following is a geographical breakdown of income before the provision for income taxes (in thousands):
| |
Year Ended December 31, | ||||||||||
|---|---|---|---|---|---|---|---|---|---|---|---|
| |
2010 | 2009 | 2008 | ||||||||
Domestic |
$ | 9,551 | $ | 844 | $ | 20,205 | |||||
Foreign |
406 | 348 | 517 | ||||||||
Total income before provision for income taxes |
$ | 9,957 | $ | 1,192 | $ | 20,722 | |||||
F-26
OMNICELL, INC.
NOTES TO CONSOLIDATED FINANCIAL STATEMENTS (Continued)
Note 14. Income Taxes (Continued)
The provision for income taxes consists of the following (in thousands):
| |
Year Ended December 31, | |||||||||||
|---|---|---|---|---|---|---|---|---|---|---|---|---|
| |
2010 | 2009 | 2008 | |||||||||
Current: |
||||||||||||
Federal |
$ | 196 | $ | 504 | $ | 4,437 | ||||||
State |
207 | 360 | 1,394 | |||||||||
Foreign |
369 | 27 | 54 | |||||||||
Total current |
771 | 891 | 5,885 | |||||||||
Deferred: |
||||||||||||
Federal |
3,757 | 20 | 2,510 | |||||||||
State |
473 | (163 | ) | (351 | ) | |||||||
Foreign |
64 | — | (46 | ) | ||||||||
Total deferred |
4,294 | (143 | ) | 2,113 | ||||||||
Total provision for income taxes |
$ | 5,065 | $ | 748 | $ | 7,998 | ||||||
The provision for income taxes differs from the amount computed by applying the statutory federal tax rate as follows (in thousands):
| |
Year Ended December 31, | |||||||||
|---|---|---|---|---|---|---|---|---|---|---|
| |
2010 | 2009 | 2008 | |||||||
U.S. federal tax provision at statutory rate |
$ | 3,485 | $ | 417 | $ | 7,253 | ||||
State taxes |
543 | 198 | 678 | |||||||
Non-deductible expenses |
350 | 97 | 356 | |||||||
Share-based compensation expense |
244 | 281 | 1,276 | |||||||
Research tax credits |
(137 | ) | 10 | (1,223 | ) | |||||
Repatriation of foreign earnings |
560 | — | — | |||||||
Other |
20 | (255 | ) | (342 | ) | |||||
Total |
$ | 5,065 | $ | 748 | $ | 7,998 | ||||
F-27
OMNICELL, INC.
NOTES TO CONSOLIDATED FINANCIAL STATEMENTS (Continued)
Note 14. Income Taxes (Continued)
Significant components of our deferred tax assets (liabilities) are as follows (in thousands):
| |
December 31, | |||||||
|---|---|---|---|---|---|---|---|---|
| |
2010 | 2009 | ||||||
Deferred tax assets (liabilities): |
||||||||
Tax credit carry forwards |
$ | 3,135 | $ | 2,845 | ||||
Inventory related items |
2,998 | 3,085 | ||||||
Reserves and accruals |
(963 | ) | 92 | |||||
Deferred revenue |
11,010 | 11,912 | ||||||
Depreciation and amortization |
(1,863 | ) | 251 | |||||
Stock compensation |
8,177 | 6,567 | ||||||
Other, net |
124 | 161 | ||||||
Total deferred tax assets (liabilities) |
22,618 | 24,913 | ||||||
Valuation allowance |
— | — | ||||||
Net deferred tax assets (liabilities) |
$ | 22,618 | $ | 24,913 | ||||
Deferred income tax assets (liabilities) are provided for temporary differences that will result in future tax deductions or future taxable income, as well as the future benefit of tax credit carry forwards. In 2010, our deferred tax assets, before valuation allowance, decreased by approximately $2.3 million.
Management believes that deferred tax assets are more likely than not to be realized in accordance with ASC 740-10-30. In the event that the Company determines all or part of the net deferred tax assets are not realizable in the future, the Company will make an adjustment to the valuation allowance that would be charged to earnings in the period such determination is made.
Pursuant to the requirements of ASC 718, we do not include unrealized stock option attributes as components of our gross deferred tax assets. The tax effected amounts of gross unrealized net operating loss and business tax credit carry forwards excluded under ASC 718 for the year ended December 31, 2010 are approximately $7.7 million, which will result in increases to additional paid in capital if and when realized as a reduction in income taxes otherwise paid.
As of December 31, 2010, the federal and state net operating loss carry forwards available for income tax purposes are approximately $6.6 million and $7.5 million, respectively. These net operating losses begin to expire in the years 2025 and 2017 for federal and state, respectively. For income tax purposes, we have federal and California research tax credits of approximately $6.3 million and $5.1 million, respectively. Federal research tax credits carry forwards will expire in years 2017 through 2030. California credits are available indefinitely to reduce cash taxes otherwise payable. The benefits of all net operating loss and tax credit carryovers, if realized will be recognized as additional paid in capital.
We file income tax returns in the U.S. Federal jurisdiction, various states and foreign jurisdictions. In the normal course of business, we are subject to examination by taxing authorities, including major jurisdiction as the United States, California and India. Our tax years beginning in 2007 and 2006 remain effectively open to audit by the Internal Revenue Service and various states and local tax authorities, respectively. However, since we have tax attribute carryforwards from these years that could
F-28
OMNICELL, INC.
NOTES TO CONSOLIDATED FINANCIAL STATEMENTS (Continued)
Note 14. Income Taxes (Continued)
be subject to adjustment, if and when utilized, federal and California remain open through 1995 and 1992, respectively. The India statute of limitations remains open for years 2006 through 2010.
Effective January 1, 2007, we adopted FIN 48, codified as ASC 740-10, which prescribes a comprehensive model for how a company should recognize, measure, present, and disclose in its financial statements uncertain tax positions that we have taken or expect to take on a tax return.
The aggregate changes in the balance of gross unrecognized tax benefits, which excludes interest and penalties, for the two years ended December 31, 2010 is as follows (in thousands):
Balance as of December 31, 2007 |
$ | 35 | |||
Increases related to tax positions taken during a prior period |
3,051 | ||||
Increases related to tax positions taken during the current period |
573 | ||||
Balance as of December 31, 2008 |
3,659 | ||||
Increases related to tax positions taken during a prior period |
448 | ||||
Increases related to tax positions taken during the current period |
346 | ||||
Decreases related to expiration of statute of limitations |
(158 | ) | |||
Balance as of December 31, 2009 |
4,295 | ||||
Increases related to tax positions taken during a prior period |
795 | ||||
Decreases related to tax positions taken during the prior period |
(80 | ) | |||
Increases related to tax positions taken during the current period |
421 | ||||
Balance as of December 31, 2010 |
$ | 5,431 | |||
During 2010, we recorded total gross unrecognized tax expense of approximately $0.1 million. As of December 31, 2010, the total amount of gross unrecognized tax benefits, if realized, would affect our tax expense by approximately $4.3 million. We recognize interest and/or penalties related to uncertain tax positions in operating expenses, which for 2010 and 2009 were immaterial. We do not believe there will be any material changes in our unrecognized tax positions over the next twelve months.
Note 15. Stockholders' Equity
Treasury Stock
During 2008, our board of directors authorized stock repurchase programs for the repurchase of up to $90.0 million of our common stock. For the year ended December 31, 2008, shares with an aggregate value of $65.0 million, excluding broker commissions of $0.1 million, were repurchased. All repurchased shares were recorded as treasury stock and were accounted for under the cost method. No repurchased shares have been retired. The timing, price and volume of the repurchases will be based on market conditions, relevant securities laws and other factors. The stock repurchase program does not obligate us to repurchase any specific number of shares, and we may terminate or suspend the repurchase program at any time. Through December 31, 2010, a total of 4,066,296 shares at an average cost of $16.00 per share were repurchased through a combination of open market purchases and pursuant to a 10b5-1 trading plan. No shares have been repurchased during the years ended December 31, 2010 and 2009. As of December 31, 2010, we had $25.0 million of remaining authorized funds to repurchase additional shares under the stock repurchase programs. Additionally, for the years
F-29
OMNICELL, INC.
NOTES TO CONSOLIDATED FINANCIAL STATEMENTS (Continued)
Note 15. Stockholders' Equity (Continued)
ended December 31, 2010, 2009 and 2008, we withheld 25,817 shares, 16,855 shares and 10,396 shares, respectively from employees to satisfy tax withholding obligations on the vesting of restricted stock.
Share Purchase Rights Plan
On February 6, 2003, our board of directors approved the adoption of a Share Purchase Rights Plan, or the Rights Plan. Terms of the Rights Plan provide for a dividend distribution of one preferred share purchase right, or a Right, for each outstanding share of our common stock, par value $0.001 per share. The dividend was payable on February 27, 2003 to the stockholders of record on that date.
The Rights are not exercisable until the distribution date, which is the earlier of the date of a public announcement that a person, entity or group of affiliated or associated persons have acquired beneficial ownership of 15% or more of the outstanding share of our common stock (an "Acquiring Person") or (ii) 10 business days (or such later date as may be determined by action of the board of directors prior to such time as any person or entity becomes an Acquiring Person) following the commencement of, or announcement of an intention to commence, a tender offer or exchange offer the consummation of which would result in any person or entity becoming an Acquiring Person. In the event that any person or group of affiliated or associated persons becomes an Acquiring Person or a tender offer is commenced or announced to commence, each stockholder holding a Right will thereafter have the right to receive upon exercise of the Right that number of shares of Common Stock having a market value of two times the exercise price of the Right. The description and terms of the Rights are set forth in a Rights Agreement, dated as of February 6, 2003 entered into between us and EquiServe Trust Company, N.A., as rights agent. Sutter Hill Ventures and ABS Capital Partners and their respective affiliated entities will be exempt from the Rights Plan, unless they acquire beneficial ownership of 17.5% or 22.5% or more, respectively, of our common stock. At no time will the Rights have any voting power. The Rights will expire on February 27, 2013, unless the Rights are earlier redeemed or exchanged by Omnicell.
Note 16. Stock Option Plans, Share-based Compensation and 401(k) Plan
Description of Share-Based Plans
Equity Incentive Plan. On May 19, 2009, at the Company's 2009 Annual Meeting of Stockholders, or the 2009 Annual Meeting, our stockholders approved the Omnicell, Inc. 2009 Equity Incentive Plan, or the 2009 Plan, which authorized 2,100,000 shares to be issued. The 2009 Plan succeeded the 1999 Equity Incentive Plan, as amended, the 2003 Equity Incentive Plan, as amended, and the 2004 Equity Incentive Plan, together the Prior Plans. No additional awards will be granted under any of the Prior Plans; however, all outstanding stock awards granted under the Prior Plans continue to be subject to the terms and conditions as set forth in the agreements evidencing such stock awards. For purposes of determining future common shares available for grant, for each share granted as a full-value award, including restricted stock and restricted stock units, or RSUs, performance stock awards, the shares available for grant were reduced by 1.4 shares. Equity awards granted as stock options and stock appreciation rights reduce the shares available for grant by one share.
F-30
OMNICELL, INC.
NOTES TO CONSOLIDATED FINANCIAL STATEMENTS (Continued)
Note 16. Stock Option Plans, Share-based Compensation and 401(k) Plan (Continued)
On December 16, 2010, at a Special Meeting of Stockholders, our stockholders approved an amendment to increase the number of shares of common stock authorized for issuance under the 2009 Plan by 2,600,000 shares and to provide that the number of common stock shares available for issuance under the 2009 Plan be reduced by 1.8 shares for each share granted as a full-value award granted on and after October 1, 2010. For each share granted as a full-value award granted prior to October 1, 2010, future shares available for grants under the 2009 Plan were reduced by 1.4 shares. Awards granted as stock options and stock appreciation rights continue to reduce the number of shares available for issuance under the 2009 Plan on a one-for-one basis. At December 31, 2010, 3,457,443 shares of common stock were reserved for future issuance under the 2009 Plan.
Options granted under the 2009 Plan generally become exercisable over periods of up to four years, generally with one-fourth of the shares vesting one year from the vesting commencement date with respect to initial grants, and the remaining shares vesting in 36 equal monthly installments thereafter; however our board of directors may impose different vesting terms at its discretion on any award. Options under the 2009 Plan generally expire ten years from the date of grant. We also grant both restricted stock and restricted stock units to participants under the 2009 Plan. The board of directors determines the award amount, the vesting provisions and the expiration period (not to exceed ten years) for each grant. Grants of restricted stock to non-employee directors are granted on the date of our annual meeting of stockholders and vest in full on the date of our next annual meeting of stockholders, provided such non-employee director remains a director on such date. The fair value of the stock on the date of issuance is amortized to expense from the date of grant to the date of vesting. RSUs granted to employees generally vest over a period of four years and are expensed ratably on a straight-line basis over the vesting period. We consider the dilutive impact of options, restricted stock and restricted stock units in our diluted net income per share calculation.
The board of directors shall administer the 2009 Plan unless and until the board of directors delegates administration to a committee. The Board has delegated administration of the 2009 Plan to the Compensation Committee of the Board and the 2009 Plan is generally administered by such committee. The board of directors may suspend or terminate the 2009 Plan at any time. The board of directors may also amend the 2009 Plan at any time or from time to time. However, no amendment will be effective unless approved by our stockholders after its adoption by the board of directors to the extent stockholder approval is necessary to satisfy the applicable listing requirements of NASDAQ.
If we sell, lease or dispose of all or substantially all of our assets, or we are acquired pursuant to a merger or consolidation, then the surviving entity may assume or substitute all outstanding awards under the 2009 Plan. If the surviving entity does not assume or substitute these awards, then generally the stock awards will immediately and fully vest.
1997 Employee Stock Purchase Plan. We have an Employee Stock Purchase Plan, or ESPP, under which employees can purchase shares of our common stock based on a percentage of their compensation, but not greater than 15% of their earnings, up to a maximum of $25,000 of fair value per year. The purchase price per share must be equal to the lower of 85% of the fair value of the common stock at the beginning of a 24-month offering period or the end of each six-month purchasing period. As of December 31, 2010, 2,959,030 shares had been issued under the ESPP. At our 2009 Annual Meeting, the stockholders approved an amendment to the ESPP, which added 2,622,426 shares to the reserve for future issuance. As of December 31, 2010, there were a total of 2,372,525 shares
F-31
OMNICELL, INC.
NOTES TO CONSOLIDATED FINANCIAL STATEMENTS (Continued)
Note 16. Stock Option Plans, Share-based Compensation and 401(k) Plan (Continued)
reserved for future issuance under the ESPP. During the year ended December 31, 2010, 451,014 shares of common stock were purchased under the ESPP.
401(k) Plan
We have established a 401(k) tax-deferred savings plan, whereby eligible employees may contribute a percentage of their eligible compensation, but not greater than 75% of their earnings, up to the maximum as required by law. On January 1, 2009, the company began matching 401(k) contributions, up to 3% maximum of employee contributions or $1000, whichever is lower. The total company 401(k) contributions for the years ended December 31, 2010 and 2009 were $0.5 million and $0.5 million, respectively.
Share-Based Compensation-Measurement and Disclosure
We adopted ASC 718, "Stock Compensation" using the modified prospective transition method beginning January 1, 2006. For awards granted prior to but not yet vested as of January 1, 2006, share-based compensation expense was based on the grant-date fair value previously estimated in accordance with the original provisions of SFAS 123 and adjusted for estimated forfeitures. We have recognized compensation expense based on the estimated grant date fair value method required under ASC 718 using straight-line amortization method. As ASC 718 requires that share-based compensation expense be based on awards that are ultimately expected to vest, estimated share-based compensation in 2010, 2009 and 2008 has been reduced for estimated forfeitures.
Total share-based compensation resulting from stock option grants, restricted stock awards, restricted stock units and shares purchased under our ESPP were included in our consolidated statements of operations as follows (in thousands, except per share data):
| |
Year Ended December 31, | ||||||||||
|---|---|---|---|---|---|---|---|---|---|---|---|
| |
2010 | 2009 | 2008 | ||||||||
Cost of revenues |
$ | 1,350 | $ | 1,478 | $ | 1,610 | |||||
Research and development |
755 | 1,184 | 1,204 | ||||||||
Selling, general and administrative |
6,910 | 7,063 | 8,351 | ||||||||
Total share-based compensation expense |
$ | 9,015 | $ | 9,725 | $ | 11,165 | |||||
We did not capitalize any share-based compensation into inventory during 2010, 2009 and 2008 as it was not material. Income tax (charges) benefits realized from share-based compensation and resulting increases (decreases) to additional paid in capital during 2010, 2009 and 2008 were $2.0 million, $(5.5) million and $12.2 million, respectively.
Valuation Assumptions
The fair value of each option grant is estimated on the date of grant using the Black-Scholes-Merton option-pricing model. The fair value of shares issued under the employee stock purchase plans
F-32
OMNICELL, INC.
NOTES TO CONSOLIDATED FINANCIAL STATEMENTS (Continued)
Note 16. Stock Option Plans, Share-based Compensation and 401(k) Plan (Continued)
is estimated on the date of issuance using the Black-Scholes-Merton model. The weighted average assumptions used for options granted and ESPP in 2010, 2009 and 2008 were as follows:
| |
Year Ended December 31, | |||||||||
|---|---|---|---|---|---|---|---|---|---|---|
Stock Option Plans
|
2010 | 2009 | 2008 | |||||||
Risk-free interest rate(1) |
2.3 | % | 2.3 | % | 2.9 | % | ||||
Dividend yield |
0 | % | 0 | % | 0 | % | ||||
Volatility(2) |
50.3 | % | 60.2 | % | 53.6 | % | ||||
Expected life(3) |
5.2 yrs | 5.0 yrs | 4.7 yrs | |||||||
| |
Year Ended December 31, | |||||||||
|---|---|---|---|---|---|---|---|---|---|---|
Employee Stock Purchase Plan
|
2010 | 2009 | 2008 | |||||||
Risk-free interest rate(1) |
0.4 | % | 0.7 | % | 2.1 | % | ||||
Dividend yield |
0 | % | 0 | % | 0 | % | ||||
Volatility(2) |
48.5 | % | 67.6 | % | 55.1 | % | ||||
Expected life(3) |
0.5 - 2 yrs | 0.5 - 2 yrs | 0.5 - 2 yrs | |||||||
- (1)
- The
risk-free interest rate for both stock options and the ESPP is based on the zero-coupon U.S. Treasury rate curve in effect at
the time of the option grant or at the beginning of the ESPP offering period.
- (2)
- Expected
volatility for both stock options and the ESPP reflects a combination of historical and market-based implied volatility consistent with ASC 718 and
Securities and Exchange Commission Staff Accounting Bulletin 107. In 2007, we determined that the combination of historical and market-based implied volatility provides a more accurate reflection of
our market conditions and is more representative of future stock price trends than employing solely historical volatility.
- (3)
- Represents the period of time that options granted are expected to be outstanding, which is derived from historical data on employee exercise and post-vesting employment termination behavior.
F-33
OMNICELL, INC.
NOTES TO CONSOLIDATED FINANCIAL STATEMENTS (Continued)
Note 16. Stock Option Plans, Share-based Compensation and 401(k) Plan (Continued)
Share-Based Payment Award Activity
A summary of option activity under the 2009 Plan for the years ended December 31, 2010, 2009 and 2008 is presented below:
Options:
|
Number of Shares | Weighted Average Exercise Price |
||||||
|---|---|---|---|---|---|---|---|---|
| |
(in thousands) |
|
||||||
Outstanding at December 31, 2007 |
4,633 | $ | 12.87 | |||||
Granted |
751 | $ | 16.05 | |||||
Exercised |
(478 | ) | $ | 9.55 | ||||
Expired |
(31 | ) | $ | 16.60 | ||||
Forfeited |
(164 | ) | $ | 19.99 | ||||
Outstanding at December 31, 2008 |
4,711 | $ | 13.45 | |||||
Granted |
788 | $ | 8.72 | |||||
Exercised |
(126 | ) | $ | 8.81 | ||||
Expired |
(183 | ) | $ | 17.23 | ||||
Forfeited |
(442 | ) | $ | 13.81 | ||||
Outstanding at December 31, 2009 |
4,748 | $ | 12.61 | |||||
Granted |
666 | $ | 12.99 | |||||
Exercised |
(431 | ) | $ | 8.46 | ||||
Expired |
(164 | ) | $ | 16.50 | ||||
Forfeited |
(79 | ) | $ | 14.80 | ||||
Outstanding at December 31, 2010 |
4,740 | $ | 12.86 | |||||
Vested and expected to vest at December 31, 2010 |
4,740 | $ | 12.86 | |||||
Exercisable at December 31, 2010 |
3,501 | $ | 12.93 | |||||
Outstanding options at December 31, 2010 had a weighted-average remaining contractual life of 6.1 years and an aggregate intrinsic value of $15.5 million. Vested and expected to vest options had a weighted-average remaining contractual life of 6.1 years and an aggregate intrinsic value of $15.5 million. Exercisable options at December 31, 2010 had a weighted-average remaining contractual life of 5.1 years and an aggregate intrinsic value of $12.3 million.
F-34
OMNICELL, INC.
NOTES TO CONSOLIDATED FINANCIAL STATEMENTS (Continued)
Note 16. Stock Option Plans, Share-based Compensation and 401(k) Plan (Continued)
The ranges of outstanding and exercisable options for equity share-based payment awards as of December 31, 2010 were as follows:
Range of Exercise Prices
|
Number Outstanding |
Weighted Average Exercise Price of Outstanding Options |
Number Exercisable |
Weighted Average Exercise Price of Exercisable Options |
|||||||||
|---|---|---|---|---|---|---|---|---|---|---|---|---|---|
| |
(in thousands) |
(Years) |
|
(in thousands) |
|||||||||
$2.70 - $7.40 |
565 | $ | 5.22 | 565 | $ | 5.22 | |||||||
$7.89 - $9.25 |
570 | $ | 8.24 | 328 | $ | 8.46 | |||||||
$9.34 - $10.58 |
732 | $ | 10.28 | 657 | $ | 10.32 | |||||||
$10.60 - $11.58 |
594 | $ | 10.99 | 523 | $ | 11.04 | |||||||
$11.63 - $12.48 |
498 | $ | 12.25 | 171 | $ | 12.02 | |||||||
$12.53 - $13.92 |
474 | $ | 13.31 | 194 | $ | 13.14 | |||||||
$13.97 - $20.00 |
487 | $ | 16.66 | 318 | $ | 17.25 | |||||||
$20.23 - $21.07 |
477 | $ | 20.92 | 450 | $ | 20.93 | |||||||
$22.63 - $26.99 |
253 | $ | 24.26 | 222 | $ | 24.10 | |||||||
$29.16 - $29.16 |
90 | $ | 29.16 | 73 | $ | 29.16 | |||||||
$2.70 - $29.16 |
4,740 | $ | 12.86 | 3,501 | $ | 12.93 | |||||||
As of December 31, 2010, $8.1 million of total unrecognized compensation costs related to unvested options is expected to be recognized over a weighted average period of 2.7 years. The weighted average fair value of options granted was $6.13, $4.57 and $7.69 during 2010, 2009 and 2008, respectively. The intrinsic value of options exercised during 2010, 2009 and 2008 was $2.1 million and $0.3 million and $4.5 million, respectively. The total fair value of shares vested during 2010, 2009 and 2008 was $4.9 million, $5.6 million and $7.6 million, respectively.
Restricted Stock and Restricted Stock Units
A summary of activity of restricted stock granted under the 2009 Plan as of December 31, 2010 is presented below:
| |
Shares of Restricted Stock |
Weighted-Average Grant Date Fair Value Per Share |
|||||
|---|---|---|---|---|---|---|---|
| |
(in thousands) |
|
|||||
Nonvested at December 31, 2007 |
14 | 22.63 | |||||
Granted |
41 | 11.91 | |||||
Vested |
(14 | ) | 22.63 | ||||
Nonvested at December 31, 2008 |
41 | 11.91 | |||||
Granted |
52 | 9.25 | |||||
Vested |
(41 | ) | 11.91 | ||||
Nonvested at December 31, 2009 |
52 | 9.25 | |||||
Granted |
79 | 12.91 | |||||
Vested |
(54 | ) | 9.40 | ||||
Nonvested at December 31, 2010 |
77 | 12.91 | |||||
F-35
OMNICELL, INC.
NOTES TO CONSOLIDATED FINANCIAL STATEMENTS (Continued)
Note 16. Stock Option Plans, Share-based Compensation and 401(k) Plan (Continued)