Attached files
| file | filename |
|---|---|
| EX-3.02 - EXHIBIT 3.02 - Bank of Marin Bancorp | ex3_02.htm |
| EX-32.01 - EXHIBIT 32.01 - Bank of Marin Bancorp | ex32_01.htm |
| EX-31.01 - EXHIBIT 31.01 - Bank of Marin Bancorp | ex31_01.htm |
| EX-31.02 - EXHIBIT 31.02 - Bank of Marin Bancorp | ex31_02.htm |
| EX-23.01 - EXHIBIT 23.01 - Bank of Marin Bancorp | ex23_01.htm |
BANK OF MARIN BANCORP
UNITED STATES SECURITIES AND EXCHANGE COMMISSION
Washington, D.C. 20549
FORM 10-K
|
T
|
ANNUAL REPORT PURSUANT TO SECTION 13 OR 15(d) OF THE SECURITIES EXCHANGE ACT OF 1934
|
For the fiscal year ended: December 31, 2010
or
|
£
|
TRANSITION REPORT PURSUANT TO SECTION 13 OR 15(d) OF THE SECURITIES EXCHANGE ACT OF 1934
|
For the transition period from __________________ to __________________
Commission File number: 001-33572
Bank of Marin Bancorp
(Exact name of Registrant as specified in its charter)
|
California
|
20-8859754
|
|
(State or other jurisdiction of incorporation)
|
(IRS Employer Identification No.)
|
|
504 Redwood Blvd., Suite 100, Novato, CA
|
94947
|
|
(Address of principal executive office)
|
(Zip Code)
|
(415) 763-4520
(Registrant’s telephone number, including area code)
Securities registered pursuant to Section 12 (b) of the Act:
None
Securities registered pursuant to section 12(g) of the Act:
|
Common Stock, No Par Value,
and attached Share Purchase Rights
|
NASDAQ Capital Market
|
|
(Title of each class)
|
(Name of each exchange on which registered)
|
Indicate by check mark if the registrant is a well-known seasoned issuer, as defined in Rule 405 of the Securities Act.
|
Yes £
|
No T
|
Indicate by check mark if the registrant is not required to file reports pursuant to Section 13 or Section 15(d) of the Act.
|
Yes £
|
No T
|
Note – checking the box above will not relieve any registrant required to file reports pursuant to section 13 or 15(d) of the Exchange Act from their obligations under these sections.
Indicate by check mark whether the registrant (1) has filed all reports to be filed by Section 13 or 15(d) of the Securities Exchange Act of 1934 during the preceding 12 months (or for such shorter period that the registrant was required to file such reports), and (2) has been subject to such filing requirements for the past 90 days.
|
Yes T
|
No £
|
Indicate by check mark whether the registrant has submitted electronically and posted on its corporate Web site, if any, every Interactive Data File required to be submitted and posted pursuant to Rule 405 of Regulation S-T during the preceding 12 months (or for such shorter period that the registrant was required to submit and post such files).
|
Yes £
|
No £
|
Indicate by check mark if disclosure of delinquent filers pursuant to Item 405 of Regulation S-K is not contained herein, and will not be contained, to the best of the registrant’s knowledge, in definitive proxy or information statements incorporated by reference in Part III of this form 10-K or any amendment to this Form 10-K. £
Indicate by check mark whether the registrant is a large accelerated filer, an accelerated filer, or a non-accelerated filer. See definition of “accelerated filer and large accelerated filer” in Rule 12b-2 of the Exchange Act. (Check One):
|
Large accelerated filer £
|
Accelerated filer T
|
|
Non-accelerated filer £
|
Smaller reporting company £
|
Indicate by check mark if the registrant is a shell company, as defined in Rule 12b(2) of the Exchange Act.
Yes £ No T
As of June 30, 2010, the last business day of the registrant’s most recently completed second fiscal quarter, the aggregate market value of the voting and non-voting common equity held by non-affiliates, based upon the closing price per share of the registrant’s common stock as reported by the NASDAQ, was approximately $163 million. For the purpose of this response, directors and officers of the Registrant are considered the affiliates at that date.
As of February 28, 2011 there were 5,300,685 shares of common stock outstanding.
DOCUMENTS INCORPORATED BY REFERENCE
Portions of the registrant’s Proxy Statement for the Annual Meeting of Shareholders to be held on May 17, 2011 are incorporated by reference into Part III.
Page - 2
BANK OF MARIN BANCORP
TABLE OF CONTENTS
|
5
|
||
|
5
|
||
|
5
|
||
|
12
|
||
|
20
|
||
|
20
|
||
|
20
|
||
|
20
|
||
|
21
|
||
|
21
|
||
|
23
|
||
|
24
|
||
|
24
|
||
|
24
|
||
|
25
|
||
|
28
|
||
|
29
|
||
|
33
|
||
|
33
|
||
|
34
|
||
|
36
|
||
|
37
|
||
|
37
|
||
|
38
|
||
|
41
|
||
|
44
|
||
|
44
|
||
|
45
|
||
|
45
|
||
|
45
|
||
|
46
|
||
|
46
|
||
|
46
|
||
|
ITEM 7A.
|
48
|
|
|
ITEM 8.
|
50
|
|
|
56
|
||
|
56
|
||
|
62
|
||
|
65
|
||
|
69
|
||
|
71
|
||
|
71
|
||
|
71
|
||
|
72
|
||
|
73
|
||
|
77
|
||
|
80
|
||
|
80
|
||
|
82
|
||
|
82
|
||
|
83
|
||
|
84
|
||
|
85
|
||
|
86
|
||
|
87
|
||
|
89
|
||
|
90
|
||
|
90
|
||
|
91
|
||
|
91
|
||
|
91
|
||
|
91
|
||
|
91
|
||
|
91
|
||
|
91
|
||
|
92
|
||
|
94
|
||
|
96
|
||
Forward-Looking Statements
This discussion of financial results includes forward-looking statements within the meaning of Section 27A of the Securities Act of 1933, as amended, (the "1933 Act") and Section 21E of the Securities Exchange Act of 1934, as amended, (the "1934 Act"). Those sections of the 1933 Act and 1934 Act provide a "safe harbor" for forward-looking statements to encourage companies to provide prospective information about their financial performance so long as they provide meaningful, cautionary statements identifying important factors that could cause actual results to differ significantly from projected results.
Our forward-looking statements may include descriptions of plans or objectives of Management for future operations, products or services, and forecasts of our revenues, earnings or other measures of economic performance. Forward-looking statements can be identified by the fact that they do not relate strictly to historical or current facts. They often include the words "believe," "expect," "intend," "estimate" or words of similar meaning, or future or conditional verbs such as "will," "would," "should," "could" or "may."
Forward-looking statements are based on Management's current expectations regarding economic, legislative, and regulatory issues that may impact our earnings in future periods. A number of factors - many of which are beyond Management’s control - could cause future results to vary materially from current Management’s expectations. Such factors include, but are not limited to, general economic conditions, the current financial turmoil in the United States and abroad, changes in interest rates, deposit flows, real estate values and competition; changes in accounting principles, policies or guidelines; changes in legislation or regulation; and other economic, competitive, governmental, regulatory and technological factors affecting our operations, pricing, products and services. These and other important factors are detailed in Item 1A Risk Factors section of this report. Forward-looking statements speak only as of the date they are made. We do not undertake to update forward-looking statements to reflect circumstances or events that occur after the date the forward-looking statements are made or to reflect the occurrence of unanticipated events.
|
ITEM 1.
|
BUSINESS
|
Bank of Marin (the “Bank”) was incorporated in August 1989, received its charter from the California Superintendent of Banks (now the California Department of Financial Institutions or “DFI”) and commenced operations in January 1990. The Bank is an insured bank under the Federal Deposit Insurance Act (“FDIC”). On July 1, 2007 (the “Effective Date”), a bank holding company reorganization was completed whereby Bank of Marin Bancorp (“Bancorp”) became the parent holding company for the Bank, the sole and wholly-owned subsidiary of Bancorp. On the Effective Date, each outstanding share of Bank of Marin common stock was converted into one share of Bank of Marin Bancorp common stock. Bancorp assumed the ticker symbol BMRC, which was formerly used by the Bank. Prior to the Effective Date, the Bank filed reports and proxy statements with the FDIC pursuant to Sections 12 of the Securities Exchange Act of 1934 (the “1934 Act”). Upon formation of the holding company, Bancorp became subject to regulation under the Bank Holding Company Act of 1956, as amended, which subjects Bancorp to Federal Reserve Board reporting and examination requirements.
References in this report to “Bancorp” mean Bank of Marin Bancorp, parent holding company for the Bank. References to “we,” “our,” “us” mean the holding company and the Bank that are consolidated for financial reporting purposes.
Virtually all of our business is conducted through Bancorp’s sole subsidiary, the Bank, which is headquartered in Novato, California. As of December 31, 2010, we operated through sixteen offices in San Francisco, Marin and Sonoma counties with a strong focus on supporting the local community. As discussed in Note 19 to the Consolidated Financial Statements in Item 8 of this report, in February 2011, we expanded our community banking footprint to Napa County through an FDIC-assisted acquisition of certain assets and assumption of certain liabilities of the former Charter Oak Bank. Our customer base is made up of business and personal banking relationships from the communities near the branch office locations. Our business banking focus is on small to medium-sized businesses, professionals and not-for-profit organizations.
We offer a broad range of commercial and retail deposit and lending programs designed to meet the needs of our target markets. Our loan products include commercial loans and lines of credit, construction financing, consumer loans, and home equity lines of credit. Merchant card services are available for our customers in retail businesses. Through a third party vendor, we offer a proprietary Visa® credit card product combined with a rewards program to our customers, as well as a Business Visa® program for business and professional customers. We also offer cash management sweep to business clients through a third party vendor.
We offer a variety of personal and business checking and savings accounts, and a number of time deposit alternatives, including time certificates of deposit, Individual Retirement Accounts (“IRAs”), Health Savings Accounts, and Certificate of Deposit Account Registry Service (“CDARS®”). CDARS® is a network through which we offer full FDIC insurance coverage in excess of the regulatory maximum by placing deposits in multiple banks participating in the network. We also offer remote deposit capture, direct deposit of payroll, social security and pension checks, fraud prevention services including an insurance protected Identity Theft Prevention Program and image lockbox services. A valet deposit pick-up service is available to our professional and business clients. Automatic teller machines (“ATM's”) are available at each branch location.
Our ATM network is linked to the PLUS and NYCE networks. In January 2009, we began offering free access to a network of nation-wide surcharge-free ATM’s called MoneyPass. We also offer our depositors 24-hour access to their accounts by telephone and through our internet banking products available to personal and business account holders.
We offer Wealth Management and Trust Services (“WMTS”) which include customized investment portfolio management, financial planning, trust administration, estate settlement and custody services, and advice of charitable giving. We also offer 401(k) plan services to small and medium businesses through a third party vendor.
We offer branch-based Private Banking as a natural extension of our services. Our Private Banking includes deposit services and loans, as well as a full range of banking services.
We do not directly offer international banking services, but do make such services available to our customers through other financial institutions with whom we have correspondent banking relationships.
We hold no patents, licenses (other than licenses required by the appropriate banking regulatory agencies), franchises or concessions. The Bank has registered the service marks "The Spirit of Marin", the words “Bank of Marin”, the Bank of Marin logo, and the Bank of Marin tagline “Committed to your business and our community” with the United States Patent & Trademark Office. In addition, Bancorp has registered the service marks for the words “Bank of Marin Bancorp” and for the Bank of Marin Bancorp logo with the United States Patent & Trademark Office.
All service marks registered by Bancorp or the Bank are registered on the United States Patent & Trademark Office Principal Register, with the exception of the words "Bank of Marin Bancorp" which is registered on the United States Patent & Trademark Office Supplemental Register.
Market Area
Our primary market area reaches from Sonoma County to San Francisco and lies between the Pacific Ocean on the west and San Francisco Bay to the east. See also Note 19 to the Consolidated Financial Statements in Item 8 of this report regarding our subsequent expansion into Napa County in February 2011. Our customer base is made up of business and personal banking relationships from the communities near the branch office locations.
We attract deposit relationships from individuals, merchants, small to medium-sized businesses, not-for-profit organizations and professionals who live and/or work in the communities comprising our market areas. As of December 31, 2010, approximately 82% of our deposits are in Marin and southern Sonoma counties, and approximately 56% of our deposits are from businesses and 44% are from individuals.
Competition
The banking business in California generally, and in our market area specifically, is highly competitive with respect to attracting both loan and deposit relationships. The increasingly competitive environment is impacted by changes in regulation, interest rate environment, technology and product delivery systems, and the consolidation among financial service providers. The banking industry is seeing extreme competition for quality loans. Larger banks are seeking to expand lending to small businesses, which are traditionally community bank customers. The Marin County market area is dominated by two major nation-wide banks, each of which has more branch offices than us in the defined service area. Additionally, there are several thrifts, credit unions and other independent banks.
As of June 30, 2010, the latest data available shows 89 banking offices with $8.8 billion in total deposits served the Marin County market. As of that same date, there were approximately 3 thrift offices in Marin with $0.6 billion in total deposits. We have the largest business core deposit market share, representing 24.3% of business core deposits in Marin County1. A significant driver of our franchise value is the growth and stability of our checking and savings deposits, which are a low cost funding source for our loan portfolio. We have also gained overall deposit market share in our primary market area in 20101. The four financial institutions with the greatest deposit market share in Marin County are Wells Fargo Bank, Bank of America, Bank of Marin, and Westamerica Bank with deposit market shares of 26.0% and 17.9%, 9.9%, and 8.6%, respectively1.
In the southern Sonoma County area of Petaluma, there are approximately 25 banking and thrift offices with $1.5 billion in total deposits as of June 30, 2010. Compared with our share of 4.5%, the four banking institutions with the greatest overall market share, Wells Fargo Bank, Bank of America, Bank of the West, and First Community Bank had deposit market shares in Petaluma of 28.7%, 15.6%, 9.3%, and 8.9%, respectively1.
We also compete for depositors' funds with money market mutual funds and with non-bank financial institutions such as brokerage firms and insurance companies. Among the competitive advantages held by some of these non-bank financial institutions are their ability to finance extensive advertising campaigns, and to allocate investment assets to regions of California or other states with areas of highest demand and, therefore, often higher yield.
Nationwide banks have the competitive advantages of national advertising campaigns and technology infrastructure to achieve economies of scale. Large commercial banks also have substantially greater lending limits and have the ability to offer certain services which are not offered directly by us.
In order to compete with the numerous, and often larger, financial institutions in our primary market area, we use, to the fullest extent possible, the flexibility and rapid response capabilities which are accorded by our independent status. Our competitive advantages also include an emphasis on personalized services, community involvement, philanthropic giving, local promotional activities and personal contacts. The commitment and dedication of our organizers, directors, officers and staff have also contributed greatly to our success in competing for business.
Employees
At December 31, 2010, we employed 203 full-time equivalent (“FTE”) staff. The actual number of employees, including part-time employees, at year-end 2010 included 4 executive officers, 77 other corporate officers and 142 staff. None of our employees are presently represented by a union or covered by a collective bargaining agreement. We believe that our employee relations are good. We have been recognized as one of the “Best Places to Work in the San Francisco Bay Area” by the San Francisco Business Times and the “Best Places to Work” by North Bay Business Journal.
SUPERVISION AND REGULATION
Bank holding companies and banks are extensively regulated under both federal and state law. The following discussion summarizes certain significant laws, rules and regulations affecting Bancorp and the Bank.
Bank Holding Company Regulation
Upon formation of the bank holding company on July 1, 2007, we became subject to regulation under the Bank Holding Company Act of 1956, as amended (“BHCA”) which subjects Bancorp to Federal Reserve Board reporting and examination requirements. Under the Federal Reserve Board’s regulations, a bank holding company is required to serve as a source of financial and managerial strength to its subsidiary banks.
_______________________________
1 Based on the latest available FDIC deposit market share data as of June 30, 2010.
The BHCA regulates the activities of holding companies including acquisitions, mergers and consolidations and, together with the Gramm-Leach Bliley Act of 1999, the scope of allowable banking activities.
Bank Regulation
Banking regulations are primarily intended to protect depositors’ funds, federal deposit insurance funds and the banking system as a whole. These regulations affect our lending practices, consumer protections, capital structure, investment practices and dividend policy.
As a state chartered bank, we are subject to regulation and examination by the DFI. We are also subject to regulation, supervision and periodic examination by the FDIC. If, as a result of an examination of the Bank, the FDIC or the DFI should determine that the financial condition, capital resources, asset quality, earnings prospects, management, liquidity, or other aspects of our operations are unsatisfactory, or that we have violated any law or regulation, various remedies are available to those regulators including issuing a “cease and desist” order, restricting our growth or removing officers and directors.
Dividends
The payment of cash dividends by the Bank to Bancorp is subject to restrictions set forth in the California Financial Code (the “Code”). Prior to any distribution from the Bank to Bancorp, a calculation is made to ensure compliance with the provisions of the Code and to ensure that the Bank remains within capital guidelines set forth by the DFI and the FDIC. As the Bank made a $28 million distribution to Bancorp in March 2009 in connection with Bancorp’s repurchase of preferred stock discussed in Note 9 to the Consolidated Financial Statements in Item 8 of this report, distributions from the Bank to Bancorp are subject to advance regulatory approval from the DFI for three years beginning in 2010. Management anticipates that there will be sufficient earnings at the Bank level to provide dividends to Bancorp to meet its funding requirements for the foreseeable future. See also Note 9 to the Consolidated Financial Statements, under the heading “Dividends” in Item 8 of this report.
FDIC Insurance Assessments
Our deposits are insured by the FDIC to the maximum amount permitted by law, which is currently $250,000 per depositor. The 2010 enacted Dodd-Frank Wall Street Reform and Consumer Protection Act (the “Dodd-Frank Act”) made the deposit insurance coverage permanent at the $250,000 level retroactive to January 1, 2008. The Dodd-Frank act also provides depositors at all FDIC-insured institutions with unlimited deposit insurance coverage on traditional checking accounts that do not pay interest and Interest on Lawyers Trust Accounts beginning December 31, 2010 through the end of 2012.
During 2009 and 2010, we elected to participate in the Temporary Transaction Account Guarantee Program, which provided full deposit insurance coverage to non-interest bearing transaction accounts (including low-interest negotiable order of withdrawal accounts and interest on lawyer trust accounts), by paying a 10 basis point surcharge on the non-interest bearing transaction accounts over $250,000 through December 31, 2009, and a 15 basis point surcharge through December 31, 2010, when the program ended.
Effective April 1, 2009, the FDIC revised its risk-based insurance assessment system, effectively increasing the overall assessment rate. The revised base assessment rates for banks in the best risk category range from twelve to sixteen cents annually for every $100 of domestic deposits held. In addition, the FDIC also imposed a one-time special Deposit Insurance assessment of five basis points on all insured institutions’ total assets minus Tier 1 capital at June 30, 2009 in order to replenish the Deposit Insurance Fund. On November 12, 2009, the FDIC finalized a Deposit Insurance Fund restoration plan that required banks to prepay, on December 30, 2009, their estimated quarterly risk-based assessments for the fourth quarter of 2009 and for all of 2010, 2011 and 2012. Under the plan, banks were assessed through 2010 according to the risk-based premium schedule adopted in April 2009.
On February 7, 2010, as required by the Dodd-Frank Act, the FDIC approved a rule that changes the FDIC insurance assessment base from adjusted domestic deposits to a bank’s average consolidated total assets minus average tangible equity, defined as Tier 1 capital. Since the new base is larger than the current base, the new rule lowers assessment rates to between 2.5 and 9 basis points on the broader base for banks in the lowest risk category, and 30 to 45 basis points for banks in the highest risk category. The change will be effective beginning with the second quarter of 2011 and payable at the end of September 2011. The new rule is expected to lower our FDIC insurance by more than 30%. Since we have a solid core deposit base and do not rely heavily on borrowings and brokered deposits, the benefit of the lower assessment rate (which is expected to drop by half for us) will significantly outweigh the effect of a wider assessment base.
The following discussion summarizes certain significant laws, rules and regulations affecting both Bancorp and the Bank
Community Reinvestment Act
We are subject to the provisions of the Community Reinvestment Act (“CRA”), under which all banks and thrifts have a continuing and affirmative obligation, consistent with safe and sound operations, to help meet the credit needs of their entire communities, including low and moderate income neighborhoods. The act requires a depository institution’s primary federal regulator, in connection with its examination of the institution, to assess the institution’s record in meeting the requirements in CRA. The regulatory agency’s assessment of the institution’s record is made available to the public. The record is taken into consideration when the institution establishes a new branch that accepts deposits, relocates an office, applies to merge or consolidate, or expands into other activities. CRA performance is evaluated by the FDIC under the intermediate small bank requirements. The FDIC’s last CRA and consumer compliance examination performed on us was completed on May 7, 2009 with a rating of “Satisfactory,” which is the highest rating possible.
Anti Money–Laundering Regulations
A series of banking laws and regulations beginning with the Bank Secrecy Act in 1970 require banks to prevent, detect, and report illicit or illegal financial activities to the federal government to prevent money laundering, international drug trafficking, and terrorism. Under the Uniting and Strengthening America by Providing Appropriate Tools Required to Intercept and Obstruct Terrorism Act of 2001, financial institutions are subject to prohibitions against specified financial transactions and account relationships as well as enhanced due diligence and “know your customer” standards in their dealings with high risk customers, foreign financial institutions, and foreign individuals and entities. We have extensive controls in place to comply with these requirements.
Privacy and Data Security
The Gramm-Leach Bliley Act (“GLBA”) of 1999 imposes requirements on financial institutions with respect to consumer privacy. The GLBA generally prohibits disclosure of consumer information to non-affiliated third parties unless the consumer has been given the opportunity to object and has not objected to such disclosure. Financial institutions are further required to disclose their privacy policies to consumers annually. The GLBA also directs federal regulators, including the FDIC, to prescribe standards for the security of consumer information. We are subject to such standards, as well as standards for notifying consumers in the event of a security breach. We must disclose our privacy policy to consumers and permit consumers to “opt out” of having non-public customer information disclosed to third parties. We are required to have an information security program to safeguard the confidentiality and security of customer information and to ensure proper disposal of information that is no longer needed. Customers must be notified when unauthorized disclosure involves sensitive customer information that may be misused.
Consumer Protection Regulations
Our lending activities are subject to a variety of statutes and regulations designed to protect consumers, including the Fair Credit Reporting Act, Equal Credit Opportunity Act, the Fair Housing Act, and the Truth-in-Lending Act. Our deposit operations are also subject to laws and regulations that protect consumer rights including Funds Availability, Truth in Savings, and Electronic Funds Transfers. Additional rules govern check writing ability on certain interest earning accounts and prescribe procedures for complying with administrative subpoenas of financial records. Additionally, the provision of the Federal Reserve Regulation E has been changed effective July 1, 2010. It puts restrictions on institutions assessing overdraft fees on consumer’s accounts relating to electronic funds transfers. As a result, our overdraft fee income has been negatively impacted.
Restriction on Transactions between Member Banks and their Affiliates
Transactions between Bancorp and the Bank are quantitatively and qualitatively restricted under Sections 23A and 23B of the Federal Reserve Act and Federal Reserve Regulation W. Section 23A places restrictions on the Bank’s “covered transactions” with Bancorp, including loans and other extensions of credit, investments in the securities of, and purchases of assets from Bancorp. Section 23B requires that certain transactions, including all covered transactions, be on market terms and conditions. Federal Reserve Regulation W combines statutory restrictions on transactions between the Bank and Bancorp with Board interpretations in an effort to simplify compliance with Sections 23A and 23B.
Capital Requirements
The Federal Reserve and the FDIC have adopted risk-based capital guidelines for bank holding companies and banks. Bancorp’s ratios exceed the required minimum ratios for capital adequacy purposes and the Bank meets the definition for well capitalized. Undercapitalized depository institutions may be subject to significant restrictions. Payment of interest and principal on subordinated debt of the Bank could be restricted or prohibited, with some exceptions, if the Bank were categorized as "critically undercapitalized" under applicable FDIC regulations. For further information on risk-based capital, see Note 16 to the Consolidated Financial Statements in Item 8 of this Form 10-K.
Sarbanes-Oxley Act of 2002
We are subject to the requirements of the Sarbanes-Oxley Act of 2002 which implemented legislative reforms intended to address corporate and accounting improprieties.
Emergency Economic Stabilization Act of 2009 (the “EESA”)
In response to the financial crisis affecting the banking system and financial markets and going concern threats of investment banks and other financial institutions, on October 3, 2008, the EESA was signed into law, which gave the U.S. Treasury the authority to, among other things, inject $700 billion capital into the market to stabilize the financial industry. Pursuant to the EESA, the U.S. Treasury also purchased senior preferred shares from the largest nine financial institutions in the nation and the other financial institutions in a program known as the Treasury Capital Purchase Program (“TCPP”) that was carved out of the Troubled Asset Relief Program (“TARP”). As a result of our participation in the TCPP, we were subject to restrictions on executive compensation and limitations on dividends and stock repurchases from December 5, 2008 to March 31, 2009, the period that the preferred stock issued to the U.S. Treasury was outstanding.
The American Recovery and Reinvestment Act of 2009 (the “Recovery Act”)
The Recovery Act was signed into law on February 17, 2009 in an effort, among other things, to jumpstart the U.S. economy, prevent job losses, expand educational opportunities, and provide affordable health care and tax relief. Among the various measures in the Recovery Act, it imposes further restriction on executive compensation and corporate expenditure limits of recipients of the TCPP funds, while allowing them to repurchase the preferred stock at liquidation amount without regard to the original TCPP transaction terms. See Note 9 to the Consolidated Financial Statements in Item 8 of this report for discussion regarding our repurchase of preferred stock issued under the TCPP.
The Dodd-Frank Wall Street Reform and Consumer Protection Act
On July 21, 2010, President Obama signed into law the Dodd-Frank Wall Street Reform and Consumer Protection Act, a landmark financial reform bill comprised of massive volume of new rules and restrictions that will impact banks going forward. It includes key provisions aimed at preventing a repeat of the 2008 financial crisis and a new process for winding down failing, systemically important institutions in a manner as close to a controlled bankruptcy as possible. The Act includes other key provisions as follows:
(1) The Act establishes a new Financial Stability Oversight Council to monitor systemic financial risks. The Board of Governors of the Federal Reserve (“Fed”) are given extensive new authorities to impose strict controls on large bank holding companies with total consolidated assets equal to or in excess of $50 billion and systemically significant nonbank financial companies to limit the risk they might pose for the economy and to other large interconnected companies. The Fed can also take direct control of troubled financial companies that are considered systemically significant.
The Act restricts the amount of trust preferred securities (“TPS”) that may be considered as Tier 1 Capital. For bank holding companies below $15 billion in total assets, TPS issued before May 19, 2010 will be grandfathered, so their status as Tier 1 capital does not change. Beginning January 1, 2013, bank holding companies above $15 billion in assets will have a three-year phase-in period to fill the capital gap caused by the disallowance of the TPS issued before May 19, 2010. However going forward, TPS will be disallowed as Tier 1 capital.
(2) The Act creates a new process to liquidate failed financial firms in an orderly manner, including giving the FDIC broader authority to operate or liquidate a failing financial company.
(3) The Act also establishes a new independent Federal regulatory body for consumer protection within the Federal Reserve System known as the Bureau of Consumer Financial Protection (the "Bureau"), which will assume responsibility for most consumer protection laws (except the Community Reinvestment Act). It will also be in charge of setting appropriate consumer banking fees and caps. The Office of Comptroller of the Currency will continue to have authority to preempt state banking and consumer protection laws if these laws "prevent or significantly" interfere with the business of banking.
(4) The Act effects changes in the FDIC assessment as discussed in section “FDIC Insurance Assessments” above.
(5) The Act places certain limitations on investment and other activities by depository institutions, holding companies and their affiliates, including comprehensive regulation of all over-the-counter derivatives.
The impact of the Act on our banking operations is still uncertain due to the massive volume of new rules still subject to adoption and interpretation.
Available Information
On our internet web site, www.bankofmarin.com, we post the following filings as soon as reasonably practicable after they are filed with or furnished to the SEC: Annual Report on Form 10-K, Proxy Statement for the Annual Meeting of Shareholders, quarterly reports on Form 10-Q, current reports on Form 8-K, and any amendments to those reports filed or furnished pursuant to Section 13(a) or 15(d) of the Securities and Exchange Act of 1934. The text of the Code of Ethical Conduct for Bancorp and the Bank is also included on the website. All such filings on our website are available free of charge. This website address is for information only and is not intended to be an active link, or to incorporate any website information into this document. In addition, copies of our filings are available by requesting them in writing or by phone from:
Corporate Secretary
Bank of Marin
504 Redwood Blvd., Suite 100
Novato, CA 94947
415-763-4523
|
ITEM 1A.
|
RISK FACTORS
|
An investment in our common stock is subject to risks inherent to our business. The material risks and uncertainties that Management believes may affect our business are described below. Before making an investment decision, investors should carefully consider the risks and uncertainties described below together with all of the other information included or incorporated by reference in this report. The risks and uncertainties described below are not the only ones facing our business. Additional risks and uncertainties that Management is not aware of or focused on or that Management currently deems immaterial may also impair business operations. This report is qualified in its entirety by these risk factors.
If any of the following risks actually occur, our financial condition and results of operations could be materially and adversely affected.
Our Earnings are Significantly Influenced by General Business and Economic Conditions
We are operating in an uncertain economic environment. While the economic recession ended in 2009 and there are signs of economic conditions improving, the persistent high unemployment rate, weak business and consumer spending, and the U.S. budget deficit underline that the economy remains very fragile. Economic recovery is expected to be slow and long. The housing market is not expected to recover soon amid a bleak job market. Business activity across a wide range of industries and regions is greatly affected. Local and state governments are in difficulty due to the reduction in sales taxes resulting from the lack of consumer spending and property taxes resulting from declining property values. Financial institutions continue to be affected by the contraction of the real estate market, elevated foreclosure rates, high unemployment rates and a stricter regulatory environment. While our service area has not experienced the same degree of challenge in unemployment as other areas2, the effects of these issues have trickled down to households and businesses in our markets. There can be no assurance that the recent economic improvement is sustainable and credit worthiness of our borrowers will not deteriorate.
Continued declines in real estate values and home sale volumes, financial stress on borrowers, including job losses, and customers’ inability to pay debt could adversely affect our financial condition and results of operations in the following aspects:
|
|
·
|
Demand for our products and services may decline
|
|
|
·
|
Low cost or non-interest bearing deposits may decrease
|
|
|
·
|
Collateral for our loans, especially real estate, may decline further in value
|
|
|
·
|
Loan delinquencies, problem assets and foreclosures may increase
|
Our deposit growth level has outpaced our loan growth recently, which leads to excess liquidity earning a less favorable yield. As the economy is still fragile, consumers are wary of their debts and are reducing their borrowing activities. We have noticed a decrease in loan demand due to an unfavorable economic climate and intensified competition for creditworthy borrowers, all of which could impact our ability to generate profitable loans.
_______________________________
2 Based on the latest available labor market information from Employment Development Department. Preliminary December 2010 results show that the unemployment rate in Marin County was the lowest in California at 7.9% and in Sonoma County at 10.0%, compared to the state of California at 12.3%.
Nonperforming Assets Take Significant Time To Resolve And Adversely Affect Our Results Of Operations And Financial Condition.
Our nonperforming assets have been maintained at a manageable level historically. As discussed in Note 19 to the Consolidated Financial Statements in Item 8 of this report, we acquired certain assets of the failed Charter Oak Bank on February 18, 2011. The acquisition may expose us to credit issues of acquired assets, which may become nonperforming in the future.
Nonperforming assets may adversely affect our net income in various ways. Until economic and market conditions improve, we expect to continue to incur additional losses relating to nonperforming assets. We do not record interest income on non-accrual loans, thereby adversely affecting our income and increasing our loan administration costs. When we take collateral in foreclosures and similar proceedings, we are required to mark the related loan to the then fair market value of the collateral, which may result in a loss. While we have tried to reduce our problem assets through workouts, restructurings and otherwise, decreases in the value of these assets, or the underlying collateral, or in these borrowers’ performance or financial conditions, whether or not due to economic and market conditions beyond our control, could adversely affect our business, results of operations and financial condition. In addition, the resolution of nonperforming assets requires significant commitments of time from management, which can be detrimental to the performance of other responsibilities. There can be no assurance that we will not experience further increases in nonperforming loans in the future.
Recently Enacted Legislation and Other Measures Undertaken by the Government May not Help Stabilize the U.S. Financial System and The Impact of New Financial Reform Legislation is Yet to be Determined
As discussed in Item 1, Section captioned “Supervision and Regulation” above, in 2010, President Obama signed into law a landmark financial reform bill—the Dodd-Frank Act. The current rules and interpretations being considered under the Dodd-Frank Act may change banking statutes and the operating environment of Bancorp and the Bank in substantial and unpredictable ways, and could increase the cost of doing business, decrease our revenues, limit or expand permissible activities or affect the competitive balance depending upon whether or how regulations are implemented. We may be forced to invest significant management attention and resources to make any necessary changes related to the Dodd-Frank Act and any regulations promulgated there under. The ultimate effect of the changes would have on the financial condition or results of operations of Bancorp or the Bank is uncertain at this time.
The actual impact of the recently enacted legislation and such related measures undertaken to alleviate the aftermaths of the credit crisis is unknown. The capital and credit markets have experienced volatility and disruption at an unprecedented level in the past few years. In some cases, the markets have produced downward pressure on credit availability for certain issuers without regard to those issuers’ underlying financial strength. If the recent years’ disruption and volatility return, there can be no assurance that we will not experience an adverse effect on our ability to access credit or capital.
In addition to changes resulting from the Dodd-Frank Act, recent proposals published by the Basel Committee on Banking Supervision, if adopted, could lead to significantly higher capital requirements, higher capital charges and more restrictive leverage and liquidity ratios. On September 12, 2010, the Basel Committee announced an agreement on additional capital reforms that increases required Tier 1 capital and minimum Tier 1 common equity capital and requires banks to maintain an additional capital conservation buffer during times of economic prosperity. If adopted, it could restrict our ability to grow or require us to raise additional capital. As a result, it may affect the result of our financial condition, or business’ prospects in the future.
The Recent Repeal of Federal Prohibitions on Payment of Interest on Demand Deposits Could Increase Our Interest Expense
The Dodd-Frank Act has lifted the prohibitions on payment of interest on demand deposits. Beginning on July 21, 2011, financial institutions can start paying interest on demand deposits in an effort to compete for deposits. Although we do not know what interest rates will be offered by our competitors, we would increase our interest expense and interest rate sensitivity and experience an overall decrease in the net interest margin if we were to offer interest on demand deposits to attract or retain customers. As a result, it may affect the result of our financial condition, or business’ prospects in the future.
We May Experience Unfavorable Outcomes with Growth
We seek to expand our franchise safely and consistently. A successful growth strategy requires us to manage multiple aspects of the business simultaneously, such as following adequate loan underwriting standards, balancing loan and deposit growth without increasing interest rate risk or compressing our net interest margin, maintaining sufficient capital, and recruiting, training and retaining qualified professionals. We have recently expanded into Santa Rosa and plan to expand to the town of Sonoma through a new branch opening. These new markets may have characteristics unfamiliar to us. We also expect significant increase in non-interest expenses associated with new branches with a lag in profitability.
Our growth strategy also includes merger and acquisition opportunities that either enhance our market presence or have potential for improved profitability through financial management, economies of scale or expanded services. As discussed in Note 19 to the Consolidated Financial Statement in Item 8 of this report, we acquired certain assets and certain liabilities of Napa-based Charter Oak Bank on February 18, 2011 through an FDIC-assisted transaction. While FDIC-assisted acquisitions provide attractive opportunities in part due to loans purchased at significant discounts, acquiring other banks or branches involves risks such as exposure to potential asset quality issues of the target company, potential disruption to our normal business activities and diversion of Management’s time and attention due to integration and conversion efforts. If we pursue our growth strategy too aggressively and fail to execute integration properly, we may not be able to achieve expected synergies or other anticipated benefits.
Interchange Reimbursement Fees and Related Practices Have Been Receiving Significant Legal and Regulatory Scrutiny, and the Resulting Regulations Could Have a Significant Impact on Interchange Fees We Earn
The Dodd-Frank Act includes provisions that will regulate the debit interchange rates and certain other network industry practices (the “Durbin Amendment”). In addition, the Federal Reserve now has the power to regulate network fees to the extent necessary to prevent evasion of the new rules on interchange rates. The Federal Reserve has proposed rules to restrict interchange fees on debit cards to about 12 cents per transaction for institutions with $10 billion or more in assets. Interchange represents a transfer of value between the financial institutions participating in a payments network such as Visa and NYCE, in which we participate. In connection with transactions initiated with cards in a payments system, interchange reimbursement fees are typically paid to issuers, the financial institutions such as us that issue debit cards to cardholders. They are typically paid by owners, the financial institutions that offer network connectivity and payment acceptance services to merchants.
In January 2010, Visa announced that it will implement a two-tiered pricing system for debit interchange -- one for banks with more than $10 billion in assets, and one for all those under the $10 billion threshold. However, it may still not alleviate the negative consequences that the Durbin amendment and the Federal Reserve’s proposed rules will have for banks of all sizes and consumers. Despite the statutory attempt to separate out smaller banks from the price controls embodied in the Durbin amendment, the marketplace may drive business to the lowest cost option. Merchants may switch to lower-cost cards and accounts of larger institutions, applying downward pressure on the fees paid to small institutions to compete. Community banks such as us may ultimately be harmed as a result. We may be forced to charge lower fees to customers, affecting our profitability. Owners of networks in which we do not participate could elect to charge higher discount rates to merchants, leading merchants not to accept cards for payment, or to steer Visa cardholders to alternate payment systems, hence reducing our transaction volumes.
Negative Conditions Affecting Real Estate May Harm Our Business
Concentration of our lending activities in the California real estate sector could negatively impact our results of operations if the adverse changes in the real estate market in our lending area intensify. Although we do not offer traditional first mortgages, nor have sub-prime or Alt-A residential loans or significant amount of securities backed by such loans in the portfolio, we are not immune from the effect of the set-back of the real estate market. Approximately 86% of our loans were secured by real estate at December 31, 2010, of which 65% were secured by commercial real estate and the remaining 21% by residential real estate. Real estate valuations are impacted by demand, and demand is driven by factors such as employment; when unemployment rises, demand drops. The unemployment rate has stayed at an elevated level since 2009. Most of the properties that secure our loans are located within Marin and Sonoma Counties. While we have seen improvement in real estate sales statistics3 after a few years of falling prices, there is no guarantee that the recent trend will continue.
_______________________________
3 Based on the latest available real estate information from Keegan & Coppin Company, Inc.
Loans secured by commercial real estate include those secured by small office buildings, owner-user office/warehouses, mixed-use residential/commercial properties and retail properties. In 2010, office vacancy rates in Marin County have fallen slightly from 26.3% to 25.7%, while industrial and retail rates have risen slightly from approximately 4% to 6%4. In Sonoma County, vacancy rates are generally higher than in Marin County: the rate of industrial, retail, and office vacancies decreased from 15.5%, 9.2%, and 24.8% in 2009 to 13.9%, 8.5%, and 22.3% in 2010, respectively4. There can be no assurance that the companies or properties securing our loans will generate sufficient cash flows to allow the borrowers to make full and timely loan payments to us.
In late 2006, Federal banking regulators issued final guidance regarding commercial real estate lending to address a concern that rising commercial real estate lending concentrations may expose institutions to unanticipated earnings and capital volatility in the event of adverse changes in the investor commercial real estate market. This guidance suggests that institutions that are potentially exposed to significant commercial real estate concentration risk will be subject to increased regulatory scrutiny. Institutions that have experienced rapid growth in commercial real estate lending, have notable exposure to a specific type of commercial real estate lending, or are approaching or exceed certain supervisory criteria that measure an institution’s commercial real estate portfolio against its capital levels, may be subject to such increased regulatory scrutiny. Although regulators have not notified us of any concern, there is no assurance that we will not be subject to additional scrutiny in the future.
We are Subject to Interest Rate Risk
Our earnings and cash flows are largely dependent upon our net interest income. Net interest income is the difference between interest income earned on interest-earning assets, such as loans and securities, and interest expense paid on interest-bearing liabilities, such as deposits and borrowed funds. Interest rates are sensitive to many factors outside our control, including general economic conditions and policies of various governmental and regulatory agencies and, in particular, the Board of Governors of the Federal Reserve System, which regulates the supply of money and credit in the United States. Changes in monetary policy, including changes in interest rates, could influence not only the interest we receive on loans and securities and interest we pay on deposits and borrowings, but could also affect (i) our ability to originate loans and obtain deposits, (ii) the fair value of our financial assets and liabilities, and (iii) the average duration of our mortgage-backed securities portfolio. Our portfolio of securities is subject to interest rate risk and will generally decline in value if market interest rates increase, and generally increase in value if market interest rates decline. Our mortgage-backed security portfolio is also subject to prepayment risk in a low interest rate environment.
In response to the recessionary state of the national economy, the gloomy housing market and the volatility of financial markets, the Federal Open Market Committee of the Federal Reserve Board (“FOMC”) started a series of decreases in Federal funds target rate with seven decreases in 2008, bringing the target rate to a historically low range of 0% to 0.25% through December 2010.
In the current environment of historically low interest rates, it is imperative for us to mitigate exposure to potential increases in interest rates. If interest rates rise by more than 100 basis points, we anticipate that net interest income will rise assuming no additional deposit rate sensitivity. However, it may still take several upward market rate movements for variable rate loans at floors to move above their floor rates. Further, a rise in index rates leads to lower debt service coverage of variable rate loans if the borrower’s operating cash flow doesn’t also rise. This creates a leveraged paradox of an improving economy (leading to higher interest rates), but lower credit quality as short-term rates move up faster than the cash flow or income of the borrowers. Higher interest rates may also depress loan demand, making it more difficult for us to grow loans.
_______________________________
4 Median price for single-family re-sales homes were up 3.3% in Marin County and 3.2% in Sonoma County in 2010.
Interest rate changes can create fluctuations in the net interest margin due to an imbalance in the timing of repricing or maturity of assets or liabilities. We manage interest rate risk exposure with the goal of minimizing the impact of interest rate volatility on the net interest margin. Although we believe we have implemented effective asset and liability management strategies, any substantial, prolonged low interest rate environment could have an adverse effect on our financial condition and results of operations. See the sections captioned “Net Interest Income” in Management’s Discussion and Analysis of Financial Condition and Results of Operations in Item 7 and Quantitative and Qualitative Disclosures about Market Risk in Item 7A of this report for further discussion related to management of interest rate risk.
We are Subject to Significant Credit Risk and Loan Losses May Exceed Our Allowance for Loan Losses in the Future
We maintain an allowance for loan losses, which is a reserve established through a provision for loan losses charged to expense, that represents Management’s best estimate of probable losses that may be incurred within the existing portfolio of loans. The level of the allowance reflects Management’s continuing evaluation of industry concentrations, specific credit risks, loan loss experience, current loan portfolio quality and present economic, political and regulatory conditions. The determination of the appropriate level of the allowance for loan losses inherently involves a high degree of subjectivity and requires us to make significant estimates of current credit risks and future trends, all of which may undergo material changes. Further, we generally rely on appraisals of the collateral or comparable sales data to determine the level of specific reserve and/or the charge-off amount on certain collateral dependent loans. Inaccurate assumptions in the appraisals or an inappropriate choice of the valuation techniques may lead to an inadequate level of specific reserve or charge-offs.
Changes in economic conditions affecting borrowers, new information regarding existing loans and their collateral, identification of additional problem loans and other factors, may require an increase in our allowance for loan losses. In addition, bank regulatory agencies periodically review our allowance for loan losses and may require an increase in the provision for loan losses or the recognition of further loan charge-offs. In addition, if charge-offs in future periods exceed the allowance for loan losses, we will need to record additional provision for loan losses. Any increases in the allowance for loan losses will result in an adverse impact on net income and capital.
We Face Intense Competition with Other Financial Institutions to Attract and Retain Banking Customers
We are facing significant competition for customers from other banks and financial institutions located in the markets we serve. We compete with commercial banks, saving banks, credit unions, non-bank financial services companies and other financial institutions operating within or near our serving areas. Many of our non-bank competitors are not subject to the same extensive regulations as ours, thus, are able to offer greater flexibility in competing for business. We anticipate intense competition will be continued for the coming year due to the recent consolidation of many financial institutions and more changes in legislature, regulation and technology.
Going forward, we may see tighter competition in the industry as banks seek to take market share in the most profitable customer segments, particularly the small business segment and the mass-affluent segment, which offers a rich source of deposits as well as more profitable and less risky customer relationships. Further, with the rebound of the equity markets, our deposit customers may perceive alternative investment opportunities as providing superior expected returns. Technology and other changes have made it more convenient for bank customers to transfer funds into alternative investments or other deposit accounts such as online virtual banks and non-bank service providers. The current low interest rate environment could increase such transfers of deposits to higher yielding deposits or other investments. Efforts and initiatives we undertake to retain and increase deposits, including deposit pricing, can increase our costs. When our customers move money into higher yielding deposits or in favor of alternative investments, we can lose a relatively inexpensive source of funds, thus increasing our funding costs.
We also compete with nationwide and regional banks much larger than our size, which may be able to benefit from economies of scale through their wider branch network, national advertising campaigns and sophisticated technology infrastructure.
We intend to seek additional deposits by continuing to establish and strengthen our personal relationships with our existing customers and by offering deposit products that are competitive with those offered by other financial institutions in our markets. If these efforts are unsuccessful, we may need to fund our asset growth through borrowings, other non-core funding or public offerings of our common stock which could be leveraged. Increased debt would further increase our leverage, reduce our borrowing capacity and increase our reliance on non-core funds and counterparties’ credit availability. A public offering may have a dilutive effect on earnings per share and share ownership.
Our Ability to Access Markets for Funding and Acquire and Retain Customers Could be Adversely Affected by the Deterioration of Other Financial Institutions or the Financial Service Industry’s Reputation.
Reputation risk is the risk to liquidity, earnings and capital arising from negative publicity regarding the financial services industry. The financial services industry continues to be featured in negative headlines about their roles in the past global and national credit crisis and the resulting stabilization legislation enacted by the U.S. federal government. These reports can be damaging to the industry’s image and potentially erode consumer confidence in insured financial institutions. Recent bank failures in California, including in our own markets, have had a negative impact and additional failures are expected. In addition, our ability to engage in routine funding and other transactions could be adversely affected by the actions and commercial soundness of other financial institutions. Financial services institutions are interrelated as a result of trading, clearing, counterparty or other relationships. As a result, defaults by, or even rumors or questions about, one or more financial services institutions, or the financial services industry generally, have led to market-wide liquidity problems, losses of depositor, creditor and counterparty confidence and could lead to losses or defaults by us or by other institutions. We could experience increases in deposits and assets as a direct or indirect result of other banks’ difficulties or failure, which would increase the capital we need to support such growth or we could experience severe and unexpected decreases in deposits which could adversely impact our liquidity and heighten regulatory concern.
Bancorp and the Bank are Subject to Extensive Government Regulation and Supervision
Bancorp and the Bank are subject to extensive federal and state governmental supervision, regulation and control. Holding company regulations affect the range of activities in which Bancorp is engaged. Banking regulations affect the Bank’s lending practices, capital structure, investment practices and dividend policy among other controls. Future legislative changes or interpretations may also alter the structure and competitive relationship among financial institutions.
The historic disruptions in the financial marketplace over the past few years have prompted the Obama administration to reform the financial market regulation. This proposed reform includes additional regulations over consumer financial products, bond rating agencies and the creation of a regime for regulating systemic risk across all types of financial service firms. In light of recent economic conditions as well as regulatory and congressional criticism, further restrictions on financial service companies may adversely impact our results of operations and financial condition, as well as increase our compliance risk.
Compliance risk is the current and prospective risk to earnings or capital arising from violations of, or nonconformance with, laws, rules, regulations, prescribed practices, internal policies, and procedures, or ethical standards set forth by regulators. Compliance risk also arises in situations where the laws or rules governing certain bank products or activities of our clients may be ambiguous or untested. This risk exposes Bancorp and the Bank to potential fines, civil money penalties, payment of damages and the voiding of contracts. Compliance risk can lead to diminished reputation, reduced franchise value, limited business opportunities, reduced expansion potential and an inability to enforce contracts.
For further information on supervision and regulation, see the section captioned “Supervision and Regulation” in Item 1 above.
Bancorp Relies on Dividends from the Bank to Pay Cash Dividends to Shareholders
Bancorp is a separate legal entity from its subsidiary, the Bank. Bancorp receives substantially all of its revenue from the Bank in the form of dividends, which is Bancorp’s principal source of funds to pay cash dividends to Bancorp’s common shareholders. Various federal and state laws and regulations limit the amount of dividends that the Bank may pay to Bancorp. In the event that the Bank is unable to pay dividends to Bancorp, Bancorp may not be able to pay dividends to its shareholders. As a result, it could have an adverse effect on Bancorp’s stock price and investment value.
Under federal law, capital distributions from the Bank would become prohibited, with limited exceptions, if the Bank were categorized as "undercapitalized" under applicable Federal Reserve or FDIC regulations. In addition, as a California bank, the Bank is subject to state law restrictions on the payment of dividends. Distributions from the Bank to Bancorp are subject to advance regulatory approval for three years beginning in 2010. For further information on the distribution limit from the Bank to Bancorp, see the section captioned “Bank Regulation” in Item 1 above and “Dividends” in Note 9 to the Consolidated Financial Statements in Item 8 below.
The Trading Volume of Bancorp’s Common Stock is Less than That of Other Larger Financial Services Companies
Our common stock is listed on the NASDAQ’s Capital Market. Our trading volume is less than that of nationwide or regional financial institutions. A public trading market having the desired characteristics of depth, liquidity and orderliness depends on the presence of willing buyers and sellers of common stock at any given time. This presence depends on the individual decisions of investors and general economic and market conditions over which we have no control. Given the lower trading volume of our common stock, significant trades of our stock in a given time, or the expectations of these trades, could cause the stock price to be more volatile.
Failure of Correspondent Banks and Counterparties May Affect our Liquidity
In the past few years, the financial services industry in general was materially and adversely affected by the credit crises. We have witnessed failure of banks in the industry in recent years and the trend is expected to continue. We rely on our correspondent banks for lines of credit. We also have two correspondent banks as counterparties in our derivative transactions (see Note 15 to the Consolidated Financial Statements). While we continually monitor the financial health of our correspondent banks and we have diverse sources of liquidity, should any one of our correspondent banks become financially impaired, our available credit may decline and/or they may be unable to honor their commitments.
Unexpected Early Termination of Our Interest Rate Swap Agreements May Impact Our Earnings
We have entered into interest-rate swap agreements, primarily as an asset/liability management strategy, in order to mitigate the changes in the fair value of specified long-term fixed-rate loans and firm commitments to enter into long-term fixed-rate loans caused by changes in interest rates. These hedges allow us to offer long-term fixed rate loans to customers without assuming the interest rate risk of a long-term asset by swapping our fixed-rate interest stream for a floating-rate interest stream. In the event of default by the borrowers on our hedged loans, we may have to terminate these designated interest-rate swap agreements early, resulting in severe prepayment penalties charged by our counterparties. On the other hand, when these interest-rate swap agreements are in an asset position, we are subject to the credit risk of our counterparties, who may default on the interest-rate swap agreements, leaving us vulnerable to interest rate movements.
Securities May Lose Value due to Credit Quality of the Issuers
We hold securities issued and/or guaranteed by Federal National Mortgage Association (“FNMA”) and Federal Home Loan Mortgage Corporation (“FHLMC”). In 2008, the U.S. Government placed both FNMA and FHLMC under conservatorship. Starting in December 2008, the U.S. Government also began purchasing mortgage-backed securities (“MBS”) issued by FNMA. Further, in December 2009, the U.S. Treasury also announced unlimited capital support for FNMA and FHLMC for the next three years. As a result, the MBS issued by FNMA and FHLMC has experienced an increase in fair value and our available-for-sale security portfolio has benefitted from this government support. However, the Obama administration released its report to Congress on reforming the housing-finance market on February 11, 2011. The proposal would wind down FNMA and FHLMC and incrementally shrink the government’s housing-finance footprint by, among other things, gradually increasing the firms’ guarantee pricing, reducing their conforming loan limits, and phasing in a 10-percent down-payment requirement. When the U.S. Government starts selling the MBS securities issued by FNMA and FHLMC, when the government support is phased-out or completely withdrawn, or if either the FNMA or FHLMC comes under further financial stress or deteriorates in their credit worthiness, the fair value of our securities issued or guaranteed by these entities could be negatively affected.
We also invest in obligations of state and political subdivisions, some of which are experiencing financial difficulties in part due to loss of property tax from falling home values and declines in sales tax revenues from a reduction in retail activities. The 2009 federal stimulus funds that flowed out to state governments across the country is running down and is expected to drop to $89.4 billion for 2011, $23.3 billion in 2012 and $14.3 billion in 2013. State and political subdivisions are expected to undergo further financial stress due to the reduced federal funding. While we seek to minimize our exposure by diversifying geographic location of our portfolio and investing in investment grade securities, there is no guarantee that the issuers will remain financially sound to be current with their payments on these debentures.
Deterioration of Credit Quality or Insolvency of Insurance Companies May Impede our Ability to Recover Losses
The recent financial crisis has led certain major insurance companies to the verge of bankruptcy. We have property, casualty and financial institution risk coverage underwritten by several insurance companies, who may not avoid the insolvency risk permeating in the insurance industry. In addition, some of our investment in obligations of state and political subdivisions is insured by several insurance companies. While we closely monitor credit ratings of our insurers and insurers of our municipality securities, and we are poised to make quick changes if needed, we cannot predict an unexpected inability to honor commitments. We also invest in bank-owned life insurance policies on certain members of senior management, which may lose value in the event of the carriers’ insolvency. In the event that our bank-owned life insurance policy carriers’ credit ratings fall below investment grade, we may exchange policies underwritten by them to another carrier at a cost charged by the original carrier, or we may terminate the policies which may result in adverse tax consequences.
Our loan portfolio is also primarily secured by properties located in earthquake or fire-prone zones. In the event of a disaster that causes pervasive damage to the region in which we operate, not only the Bank, but also the loan collateral may suffer losses not recovered by insurance.
We Rely on Technology and Continually Encounter Technological Change
The financial services industry is continually undergoing rapid technological change with frequent introductions of new technology-driven products and services. The effective use of technology will enable efficiency and meeting customer’s changing needs. Our future success depends, in part, upon our ability to address the needs of our customers by using technology to provide products and services that will satisfy customer demands, as well as to create additional efficiencies in our operations. Many of our competitors have substantially greater resources to invest in technological improvements. We may not be able to effectively implement new technology-driven products and services or be successful in marketing these products and services to retain and compete for customers. Failure to successfully keep pace with technological change affecting the financial services industry could have a material adverse impact of the long-term aspect our business and, in turn, our financial condition and results of operations.
We May Experience a Breach in Security
Our business requires the secure handling of sensitive client information. We also rely heavily on communications and information systems to conduct our business. A breach of security in the Bank, at our vendors or customers, or widely publicized breaches of other financial institutions could significantly harm our reputation, result in a loss of customer business, subject us to additional regulatory scrutiny, or expose us to civil litigation and possible financial liability. While we have systems and procedures designed to prevent security breaches, we cannot be certain that advances in criminal capabilities, physical system or network break-ins or inappropriate access will not compromise or breach the technology protecting our networks or proprietary client information.
We Rely on Third-Party Vendors for Important Aspects of Our Operation
We depend on the accuracy and completeness of information provided by certain key vendors, including but not limited to, data processing, payroll processing, technology support, investment security safekeeping and accounting. Our ability to operate, as well as the our financial condition and results of operations, could be negatively affected in the event of an interruption of an information system, an undetected error, or in the event of a natural disaster whereby certain vendors are unable to maintain business continuity.
We May Not Be Able To Attract and Retain Key Employees
Our success depends, in large part, on our ability to attract and retain key people. Competition for the best people in most activities engaged by us can be intense and we may not be able to hire skilled people or retain them. We do not currently have non-competitive agreements with any of our senior officers. The unexpected loss of services of key personnel could have a material adverse impact on our business because of the skills, knowledge of our market, years of industry experience and the difficulty of promptly finding qualified replacement personnel.
Severe Weather, Natural Disasters or Other Climate Change Related Matters Could Significantly Impact Our Business
Our primary market is located in an earthquake-prone zone in northern California. Other severe weather or disasters, such as severe rainstorms, wildfire or flood, could interrupt our business operations unexpectedly. Climate-related physical changes and hazards could also pose credit risks for us. For example, our borrowers may have collateral properties located in coastal areas at risk to rise in sea level. The properties pledged as collateral on our loan portfolio could also be damaged by tsunamis, floods, earthquake or wildfires and thereby the recoverability of our loan could be impaired. A number of factors affect our credit losses, including the extent of damage to the collateral, the extent of damage not covered by insurance, the extent to which unemployment and other economic conditions caused by the natural disaster adversely affect the ability of borrowers to repay their loans, and the cost of collection and foreclosure to us. Lastly, there could be increased insurance premiums and deductibles, or a decrease in the availability of coverage, due to severe weather-related losses. The ultimate impact on our business of a natural disaster, whether or not caused by climate change, is difficult to predict.
|
ITEM 1B.
|
UNRESOLVED STAFF COMMENTS
|
None.
|
ITEM 2.
|
PROPERTIES
|
We lease our corporate headquarters building, which houses our primary loan production, operations, and administrative offices, in Novato, California. We also lease other branch or office facilities within our primary market areas in the cities of Corte Madera, San Rafael, Novato, Sausalito, Mill Valley, Greenbrae, Petaluma, Santa Rosa, Sonoma, Napa and San Francisco, California. We consider our properties to be suitable and adequate for our present needs. For additional information on properties, see Notes 5 and 13 to the Consolidated Financial Statements included in Item 8 of this Form 10-K.
|
ITEM 3.
|
LEGAL PROCEEDINGS
|
There are no pending, or to Management's knowledge any threatened, material legal proceedings to which we are a party, or to which any of our properties are subject. There are no material legal proceedings to which any director, any nominee for election as a director, any executive officer, or any associate of any such director, nominee or officer is a party adverse to us.
We are responsible for our proportionate share of certain litigation indemnifications provided to Visa U.S.A. by its member banks in connection with lawsuits related to anti-trust charges and interchange fees. For further details, see Note 13 to the Consolidated Financial Statements in Item 8 of this Form 10-K.
|
ITEM 4.
|
REMOVED AND RESERVED
|
|
ITEM 5.
|
MARKET FOR REGISTRANT’S COMMON EQUITY, RELATED STOCKHOLDER MATTERS AND ISSUER PURCHASES OF EQUITY SECURITIES
|
Bancorp common stock trades on the NASDAQ Capital Market under the symbol BMRC. At February 28, 2011, 5,300,685 shares of Bancorp’s common stock, no par value, were outstanding and held by approximately 2,300 holders of record. The following table sets forth, for the periods indicated, the range of high and low sales prices of Bancorp’s common stock.
|
Calendar
Quarter
|
2010
|
2009
|
||||||||||||||
|
High
|
Low
|
High
|
Low
|
|||||||||||||
|
1st Quarter
|
$ | 33.60 | $ | 29.19 | $ | 24.44 | $ | 17.01 | ||||||||
|
2nd Quarter
|
$ | 36.14 | $ | 30.80 | $ | 29.25 | $ | 21.10 | ||||||||
|
3rd Quarter
|
$ | 35.50 | $ | 30.08 | $ | 33.81 | $ | 26.55 | ||||||||
|
4th Quarter
|
$ | 36.00 | $ | 31.69 | $ | 35.75 | $ | 30.20 | ||||||||
The table below shows cash dividends paid to common shareholders on a quarterly basis in the last two fiscal years.
|
Calendar
Quarter
|
2010
|
2009
|
||||||||||||||
|
Per Share
|
Dollars
|
Per Share
|
Dollars
|
|||||||||||||
|
1st Quarter
|
$ | 0.15 | $ | 785,000 | $ | 0.14 | $ | 722,000 | ||||||||
|
2nd Quarter
|
$ | 0.15 | $ | 787,000 | $ | 0.14 | $ | 724,000 | ||||||||
|
3rd Quarter
|
$ | 0.15 | $ | 789,000 | $ | 0.14 | $ | 730,000 | ||||||||
|
4th Quarter
|
$ | 0.16 | $ | 844,000 | $ | 0.15 | $ | 784,000 | ||||||||
For additional information regarding our ability to pay dividends, see discussion in Note 9 to the Consolidated Financial Statement, under the heading “Dividends,” in Item 8 of this report.
During the first nine months of 2008, Bancorp repurchased 88,316 shares at an average price of $28.55, plus commissions, for a total cost of $2.5 million. In September 2008, the repurchases were discontinued to preserve capital during a time of extreme economic turbulence.
There were no purchases made by or on behalf of Bancorp or any “affiliated purchaser” (as defined in Rule 10b-18(a)(3) under the Securities Exchange Act of 1934), of the Bancorp’s common stock during the fourth quarter of 2010.
On July 2, 2007, Bancorp executed a shareholder rights agreement (“Rights Agreement”) designed to discourage takeovers that involve abusive tactics or do not provide fair value to shareholders. Refer to Exhibit 4.1 to Registration Statement on Form 8-A12B filed with the Securities and Exchange Commission on July 2, 2007.
Securities Authorized for Issuance under Equity Compensation Plans
The following table summarizes information as of December 31, 2010, with respect to equity compensation plans. All plans have been approved by the shareholders.
|
(A)
|
(B)
|
(C)
|
||||||||||
|
Shares to be issued upon exercise of outstanding options
|
Weighted average exercise price of outstanding options
|
Shares available for future issuance (Excluding shares in column A)
|
||||||||||
|
Equity compensation plans approved by shareholders
|
317,804 | 1 | $ | 29.27 | 499,584 | 2 | ||||||
1 Represents shares of common stock issuable upon exercise of outstanding options under the Bank of Marin 1990 Stock Option Plan, the Bank of Marin 1999 Stock Option Plan and the Bank of Marin Bancorp 2007 Equity Plan.
2 Represents shares of common stock available for future grants under the 2007 Equity Plan and the 2010 Director Share Plan.
Stock Price Performance Graph
The following graph, provided by Keefe, Bruyette, & Woods, Inc., shows a comparison of cumulative total shareholder return on our common stock during the five fiscal years ended December 31, 2010 compared to Russell 2000 Stock index and peer group index of other financial institutions. We have been part of the Russell 2000 index since July 2009. The comparison assumes $100 was invested on December 31, 2005 in our common stock and all of the dividends were reinvested. The performance graph represents past performance and should not be considered to be an indication of future performance. Ticker symbol BMRC represents the common stock of Bank of Marin Bancorp subsequent to its formation July 1, 2007 and represents the common stock of Bank of Marin for periods prior to the formation of the bank holding company.
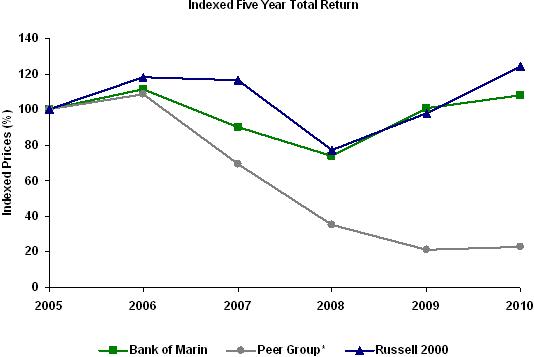
|
2005
|
2006
|
2007
|
2008
|
2009
|
2010
|
|||||||||||||||||||
|
BMRC
|
100 | 111 | 90 | 74 | 101 | 108 | ||||||||||||||||||
|
Peer Group1
|
100 | 109 | 69 | 35 | 21 | 23 | ||||||||||||||||||
|
Russell 2000
|
100 | 118 | 117 | 77 | 98 | 125 | ||||||||||||||||||
1BMRC Peer Group represents public California banks with assets between $500 million to $2 billion as of December 31, 2010: FMCB, EXSR, AMBZ, BOCH, BBNK, CVCY, FNRN, FNBG, UBFO, SAEB, CWBC, SWBC, CUNB, AMRB, OVLY, PFCF, FCAL, HTBK, HEOP, NOVB, PMBC, PPBI, PFBC, RCBC, BSRR. The peer group composite index is weighted by market capitalization and reinvests dividends on the ex-date and adjusts for stock splits, if applicable.
Source: Company Reports, FactSet, and SNL
|
ITEM 6.
|
SELECTED FINANCIAL DATA
|
|
As of For the Year Ended December 31,
|
2010
|
2009
|
2008
|
2007
|
2006
|
2009/2010 | ||||||||||||||||||
|
(Dollars in thousands, except per share data)
|
% change
|
|||||||||||||||||||||||
|
At December 31
|
||||||||||||||||||||||||
|
Total assets
|
$ | 1,208,150 | $ | 1,121,672 | $ | 1,049,557 | $ | 933,901 | $ | 876,578 | 7.7 | % | ||||||||||||
|
Total loans
|
941,400 | 917,748 | 890,544 | 724,878 | 719,778 | 2.6 | % | |||||||||||||||||
|
Total deposits
|
1,015,739 | 944,061 | 852,290 | 834,642 | 736,697 | 7.6 | % | |||||||||||||||||
|
Total stockholders' equity
|
121,920 | 109,051 | 125,546 | 87,774 | 89,525 | 11.8 | % | |||||||||||||||||
|
Equity-to-asset ratio
|
10.1 | % | 9.7 | % | 12.0 | % | 9.4 | % | 10.2 | % | 3.8 | % | ||||||||||||
|
For year ended December 31
|
||||||||||||||||||||||||
|
Net interest income
|
$ | 54,909 | $ | 52,567 | $ | 48,359 | $ | 42,742 | $ | 41,733 | 4.5 | % | ||||||||||||
|
Provision for loan losses
|
5,350 | 5,510 | 5,010 | 685 | 1,266 | -2.9 | % | |||||||||||||||||
|
Non-interest income
|
5,521 | 5,182 | 5,356 | 5,718 | 3,972 | 6.5 | % | |||||||||||||||||
|
Non-interest expense
|
33,357 | 31,696 | 28,677 | 27,673 | 25,891 | 5.2 | % | |||||||||||||||||
|
Net income
|
13,552 | 12,765 | 12,150 | 12,324 | 11,883 | 6.2 | % | |||||||||||||||||
|
Net income per share (diluted)
|
2.55 | 2.19 | 2.31 | 2.31 | 2.11 | 16.4 | % | |||||||||||||||||
|
Cash dividend payout ratio on common stock 1
|
23.6 | % | 25.8 | % | 23.9 | % | 21.4 | % | 20.8 | % | -8.5 | % | ||||||||||||
1 Calculated as dividends on common share divided by basic net income per common share.
|
ITEM 7.
|
MANAGEMENT’S DISCUSSION AND ANALYSIS OF FINANCIAL CONDITION AND RESULTS OF OPERATIONS
|
The following discussion of financial condition as of December 31, 2010 and 2009 and results of operations for each of the years in the three-year period ended December 31, 2010 should be read in conjunction with our consolidated financial statements and related notes thereto, included in Part II Item 8 of this report. Average balances, including balances used in calculating certain financial ratios, are generally comprised of average daily balances.
Forward-Looking Statements
The disclosures set forth in this item are qualified by important factors detailed in Part I captioned Forward-Looking Statements and Item 1A captioned Risk Factors of this report and other cautionary statements set forth elsewhere in the report.
Executive Summary
We reported record annual earnings of $13.6 million in 2010, an increase of $787 thousand, or 6.2% from $12.8 million a year ago. Earnings growth reflects a lower level of credit losses, continued focus on cost controls, and growth in interest earning assets. Our continued focus on responsible community banking fundamentals and our strong customer relationships has led to higher deposits, a core funding source for our loan portfolio. Deposit growth in 2010 was substantial at $71.7 million, or 7.6%, over a year ago without compromising our pricing discipline. Demand deposits grew $51.6 million or 22.4% over a year ago and comprised 27.8% of total deposits at December 31, 2010.
Diluted earnings per share for the year ended December 31, 2010 totaled $2.55, up $0.36 from $2.19 in the prior year. 2009 diluted earnings per share were reduced by $0.25 related to Bancorp’s participation and withdrawal from the TCPP and $0.06 related to an FDIC special assessment, as discussed later.
We are committed to actively lend with a focus in our local community. Total loans reached $941.4 million at December 31, 2010, representing an increase of $23.7 million, or 2.6%, over December 31, 2009. This growth primarily reflects growth in our San Francisco and Santa Rosa markets and represents an increase in commercial real estate loans, partially offset by decreases in construction and commercial loans.
Our focus on prudent lending standards, proactive management of credit risk and discipline in operating within markets that we know have kept our loan losses to a minimal level. Non-accrual loans totaled $12.9 million, or 1.37% of the Bank’s loan portfolio at December 31, 2010, compared to $11.6 million or 1.26% a year ago. Accruing loans past due 30 to 89 days decreased to $352 thousand at December 31, 2010 from $835 thousand a year ago.
The provision for loan losses totaled $5.4 million and $5.5 million in 2010 and 2009, respectively. The allowance for loan losses of $12.4 million totaled 1.32% of loans at December 31, 2010 compared to $10.6 million or 1.16% at December 31, 2009. The increase in the allowance for loan losses as a percentage of loans reflects a higher level of non-performing loans and the related specific reserves. Net charge-offs in 2010 decreased to $3.6 million in 2010 from $4.8 million in 2009, and primarily related to construction loans secured by real property where the value of collateral has declined. Net loans charged off in 2010 represent 0.38% of average loans compared to 0.53% in 2009.
On March 31, 2009, Bancorp repurchased all 28,000 shares of outstanding preferred stock issued in December 2008 under the TCPP program. We determined that continued participation in the TCPP was not in the best interest of our common shareholders, customers or our employees, and it would impede our ability to compete after the U.S government’s actions, interpretations, and commentary regarding various aspects of the TCPP program. The warrant issued to the U.S. Treasury to purchase 154,242 shares of our common stock remains outstanding.
After the repurchase of the preferred stock under the TCPP, we continued to grow our capital during 2009 and 2010. The total risk-based capital ratio for Bancorp at December 31, 2010 totaled 13.3% compared to 12.3% at December 31, 2009, exceeding industry standards for being well-capitalized.
The tax-equivalent net interest margin was 4.95% in 2010 compared to 5.17% in 2009. Decreases in the tax-equivalent net interest margin were primarily due to lower yields on investment securities (as a result of increased prepayments and lower yields on recent purchases) and a shift in the relative composition of interest-earning assets from higher-yielding loans to lower-yielding cash held at the Federal Reserve Bank and other short-term investments. The excess liquidity from deposit inflows has not been deployed fully into higher yielding loans as the banking industry as a whole is experiencing challenges with loan demand from qualified borrowers.
The largest factors likely to affect our net interest margin in 2011 will be our ability to generate profitable loans to creditworthy borrowers, as well as our responsiveness to competitive pricing on loans and deposits in our market. In the current environment of historically low short-term interest rates, it is imperative for us to continue to mitigate exposure to potential increases in interest rates. If interest rates increase, we anticipate that net interest income will rise. The increase in interest income from asset repricing may be partially offset by deposit rate sensitivity. Additionally, it may take several upward market rate movements for variable rate loans at floors to move above the floor rates. As such, if interest rates increase by less than 100 basis points, we anticipate little impact on our net interest income. Further, we expect loan demand to continue to be challenging due to the uncertain economic climate and the intensifying competition for creditworthy borrowers, both of which could lead to loan rate concession pressure and could impact our ability to generate profitable loans.
As discussed in Note 19, the Bank acquired certain assets and assumed certain liabilities of Napa-based Charter Oak Bank on February 18, 2011. This transaction was completed under a modified whole-bank purchase and assumption agreement with the FDIC without loss share. At December 31, 2010, Charter Oak Bank reported gross loans totaling $107.0 million and deposits totaling $105.3 million. The purchase price reflects an asset discount of $19.8 million and no deposit premium. Loans at the former Charter Oak Bank’s book values totaling approximately $28.5 million as of the bid valuation date (October 18, 2010) were retained by the FDIC. The excluded loans mainly represent loans delinquent more than sixty days or more as of the bid valuation date and certain types of land and construction loans. Balances are subject to change based upon the activities between the bid valuation date and the purchase date. The assets acquired and liabilities assumed are also subject to fair value adjustments in accordance with FASB ASC 805, Business Combinations upon finalizing the valuation process.
We have also expanded our community banking footprint into Sonoma County. On October 14, 2010, the Bank opened a loan production office in Santa Rosa, which will be converted to a full service commercial banking office in the second quarter of 2011. In addition, in December 2010, the Bank signed a lease for a branch in downtown Sonoma. This office is expected to open by mid-summer 2011.
We expect our non-interest expenses to continue to increase in 2011 as we continue our expansion into Sonoma and Napa counties. We expect that these strategic initiatives will contribute to our profitability in the long term.
Critical Accounting Policies
Critical accounting policies are those that are both most important to the portrayal of our financial condition and results of operations and require Management’s most difficult, subjective, or complex judgments, often as a result of the need to make estimates about the effect of matters that are inherently uncertain.
Management has determined the following five accounting policies to be critical: Allowance for Loan Losses, Other-than-temporary Impairment of Investment Securities, Share-Based Payment, Accounting for Income Taxes and Fair Value Measurements.
Allowance for Loan Losses
Allowance for loan losses is based upon estimates of loan losses and is maintained at a level considered adequate to provide for probable losses inherent in the outstanding loan portfolio. The allowance is increased by provisions charged to expense and reduced by net charge-offs. In periodic evaluations of the adequacy of the allowance balance, Management considers our past loan loss experience by type of credit, known and inherent risks in the portfolio, adverse situations that may affect the borrower's ability to repay, the estimated value of any underlying collateral, current economic conditions and other factors. We formally assess the adequacy of the allowance for loan losses on a quarterly basis. These assessments include the periodic re-grading of loans based on changes in their individual credit characteristics including delinquency, seasoning, recent financial performance of the borrower, economic factors, changes in the interest rate environment, and other factors as warranted. Loans are initially graded when originated. They are reviewed as they are renewed, when there is a new loan to the same borrower and/or when identified facts demonstrate heightened risk of default. Confirmation of the quality of our grading process is obtained by independent reviews conducted by outside consultants specifically hired for this purpose and by periodic examination by various bank regulatory agencies. Management monitors delinquent loans continuously and identifies problem loans to be evaluated individually for impairment testing. For loans that are determined impaired, formal impairment measurement is performed at least quarterly on a loan-by-loan basis.
Our method for assessing the appropriateness of the allowance includes specific allowances for identified problem loans, an allowance factor for categories of credits, and allowances for changing environmental factors (e.g., portfolio trends, concentration of credit, growth, economic factors). Allowances for identified problem loans are based on specific analysis of individual credits. Loss estimation factors for loan categories are based on an analysis of local economic factors applicable to each loan category, including consideration of the Bank’s historical charge-off history. Allowances for changing environmental factors are Management's best estimate of the probable impact these changes have had on the loan portfolio as a whole.
Other-than-temporary Impairment of Investment Securities
At each financial statement date, we assess whether declines in the fair value of held-to-maturity and available-for-sale securities below their costs are deemed to be other than temporary. We consider, among other things, (i) the length of time and the extent to which the fair value has been less than cost, (ii) the financial condition and near-term prospects of the issuer, and (iii) our intent and ability to retain the investment for a period of time sufficient to allow for any anticipated recovery in fair value. Evidence evaluated includes, but is not limited to, the remaining payment terms of the instrument and economic factors that are relevant to the collectability of the instrument, such as: current prepayment speeds, the current financial condition of the issuer(s), industry analyst reports, credit ratings, credit default rates, interest rate trends and the value of any underlying collateral. Credit-related other-than-temporary-impairment results in a charge to earnings and the corresponding establishment of a new cost basis for the security. Non-credit-related other-than-temporary impairment results in a charge to other comprehensive income, net of applicable taxes, and the corresponding establishment of a new cost basis for the security. The other-than-temporary impairment recognized in other comprehensive income for debt securities classified as held-to-maturity is accreted from other comprehensive income to the amortized cost of the debt security over the remaining life of the debt security in a prospective manner on the basis of the amount and timing of future estimated cash flows.
Share-Based Payment
We recognize all share-based payments, including stock options and non-vested restricted common shares, as an expense in the statement of income based on the grant-date fair value of the award with a corresponding increase to common stock.
We determine the fair value of stock options at the grant date using the Black-Scholes pricing model that takes into account the stock price at the grant date, the exercise price, the expected dividend yield, stock price volatility and the risk-free interest rate over the expected life of the option. The Black-Scholes model requires the input of highly subjective assumptions, including the expected life of the stock-based award (derived from historical data on employee exercise and post-vesting employment termination behavior) and stock price volatility (based on the historical volatility of the common stock). The estimates used in the model involve inherent uncertainties and the application of Management’s judgment. As a result, if other assumptions had been used, our recorded stock-based compensation expense could have been materially different from that reflected in these financial statements. The fair value of non-vested restricted common shares generally equals the stock price at grant date. In addition, we are required to estimate the expected forfeiture rate and only recognize expense for those share-based awards expected to vest. If our actual forfeiture rate is materially different from the estimate, the share-based compensation expense could be materially different.
Accounting for Income Taxes
Income taxes reported in the financial statements are computed based on an asset and liability approach. We recognize the amount of taxes payable or refundable for the current year, and deferred tax assets and liabilities for the expected future tax consequences that have been recognized in the financial statements. Under this method, deferred tax assets and liabilities are determined based on the differences between the financial statements and tax basis of assets and liabilities using enacted tax rates in effect for the year in which the differences are expected to reverse. We record net deferred tax assets to the extent it is more likely than not that they will be realized. In evaluating our ability to recover the deferred tax assets, Management considers all available positive and negative evidence, including scheduled reversals of deferred tax liabilities, projected future taxable income, tax planning strategies and recent financial operations. In projecting future taxable income, Management develops assumptions including the amount of future state and federal pretax operating income, the reversal of temporary differences, and the implementation of feasible and prudent tax planning strategies. These assumptions require significant judgment about the forecasts of future taxable income and are consistent with the plans and estimates being used to manage the underlying business. Bancorp files consolidated federal and combined state income tax returns.
We recognize the financial statement effect of a tax position when it is more likely than not, based on the technical merits, that the position will be sustained upon examination. For tax positions that meet the more-likely-than-not threshold, we may recognize only the largest amount of tax benefit or least amount of tax expense that is greater than fifty percent likely of being realized upon ultimate settlement with the taxing authority. Management believes that all of our tax positions taken meet the more-likely-than-not recognition threshold. To the extent tax authorities disagree with these tax positions, our effective tax rates could be materially affected in the period of settlement with the taxing authorities.
Fair Value Measurements
We use fair value measurements to record fair value adjustments to certain assets and liabilities and to determine fair value disclosures. We base our fair values on the price that would be received to sell an asset or paid to transfer a liability in an orderly transaction between market participants at the measurement date. Securities available for sale, derivatives, and loans held for sale, if any, are recorded at fair value on a recurring basis. Additionally, from time to time, we may be required to record certain assets at fair value on a non-recurring basis, such as certain impaired loans held for investment and securities held to maturity that are other-than-temporarily impaired. These non-recurring fair value adjustments typically involve write-downs of individual assets due to application of lower-of-cost or market accounting.
We have established and documented a process for determining fair value. We maximize the use of observable inputs and minimize the use of unobservable inputs when developing fair value measurements. Whenever there is no readily available market data, Management uses its best estimate and assumptions in determining fair value, but these estimates involve inherent uncertainties and the application of Management’s judgment. As a result, if other assumptions had been used, our recorded earnings or disclosures could have been materially different from those reflected in these financial statements. For detailed information on our use of fair value measurements and our related valuation methodologies, see Note 10 to the Consolidated Financial Statements in Item 8 of this Form 10-K.
RESULTS OF OPERATIONS
Overview
Highlights of the financial results are presented in the following table:
|
As of and for the years ended December 31,
|
||||||||||||
|
(Dollars in thousands, except per share data)
|
2010
|
2009
|
2008
|
|||||||||
|
For the period:
|
||||||||||||
|
Net income
|
$ | 13,552 | $ | 12,765 | $ | 12,150 | ||||||
|
Net income per share
|
||||||||||||
|
Basic
|
$ | 2.59 | $ | 2.21 | $ | 2.34 | ||||||
|
Diluted
|
$ | 2.55 | $ | 2.19 | $ | 2.31 | ||||||
|
Return on average equity
|
11.67 | % | 11.46 | % | 12.73 | % | ||||||
|
Return on average assets
|
1.14 | % | 1.16 | % | 1.28 | % | ||||||
|
Common stock dividend payout ratio
|
23.55 | % | 25.79 | % | 23.93 | % | ||||||
|
Efficiency ratio
|
55.20 | % | 54.89 | % | 53.39 | % | ||||||
|
At period end:
|
||||||||||||
|
Book value per common share
|
$ | 23.05 | $ | 20.85 | $ | 19.14 | ||||||
|
Total assets
|
$ | 1,208,150 | $ | 1,121,672 | $ | 1,049,557 | ||||||
|
Total loans
|
$ | 941,400 | $ | 917,748 | $ | 890,554 | ||||||
|
Total deposits
|
$ | 1,015,739 | $ | 944,061 | $ | 852,290 | ||||||
|
Loan-to-deposit ratio
|
92.68 | % | 97.21 | % | 104.49 | % | ||||||
Summary of Quarterly Results of Operations
Table 1 sets forth the quarterly results of operations for 2010 and 2009:
|
Table 1
|
Summarized Statement of Income
|
|
2010 Quarters Ended
|
2009 Quarters Ended
|
|||||||||||||||||||||||||||||||
|
(Dollars in thousands, unaudited)
|
Dec. 31
|
Sept. 30
|
Jun. 30
|
Mar. 31
|
Dec. 31
|
Sept. 30
|
Jun. 30
|
Mar. 31
|
||||||||||||||||||||||||
|
Interest income
|
$ | 15,364 | $ | 15,601 | $ | 15,505 | $ | 14,887 | $ | 15,204 | $ | 15,116 | $ | 14,837 | $ | 14,577 | ||||||||||||||||
|
Interest expense
|
1,305 | 1,636 | 1,748 | 1,759 | 1,814 | 1,780 | 1,804 | 1,769 | ||||||||||||||||||||||||
|
Net interest income
|
14,059 | 13,965 | 13,757 | 13,128 | 13,390 | 13,336 | 13,033 | 12,808 | ||||||||||||||||||||||||
|
Provision for loan losses
|
1,050 | 1,400 | 1,350 | 1,550 | 2,525 | 1,100 | 700 | 1,185 | ||||||||||||||||||||||||
|
Net interest income after provision for loan losses
|
13,009 | 12,565 | 12,407 | 11,578 | 10,865 | 12,236 | 12,333 | 11,623 | ||||||||||||||||||||||||
|
Non-interest income
|
1,360 | 1,307 | 1,505 | 1,349 | 1,341 | 1,331 | 1,273 | 1,237 | ||||||||||||||||||||||||
|
Non-interest expense
|
8,037 | 8,507 | 8,591 | 8,222 | 7,763 | 7,776 | 8,600 | 7,557 | ||||||||||||||||||||||||
|
Income before provision for income taxes
|
6,332 | 5,365 | 5,321 | 4,705 | 4,443 | 5,791 | 5,006 | 5,303 | ||||||||||||||||||||||||
|
Provision for income taxes
|
2,424 | 2,006 | 1,983 | 1,758 | 1,641 | 2,190 | 1,873 | 2,074 | ||||||||||||||||||||||||
|
Net income
|
$ | 3,908 | $ | 3,359 | $ | 3,338 | $ | 2,947 | $ | 2,802 | $ | 3,601 | $ | 3,133 | $ | 3,229 | ||||||||||||||||
|
Preferred stock dividends and accretion
|
--- | --- | --- | --- | --- | --- | --- | $ | (1,299 | ) | ||||||||||||||||||||||
|
Net income available to common stockholders
|
$ | 3,908 | $ | 3,359 | $ | 3,338 | $ | 2,947 | $ | 2,802 | $ | 3,601 | $ | 3,133 | $ | 1,930 | ||||||||||||||||
|
Net income per common share
|
||||||||||||||||||||||||||||||||
|
Basic
|
$ | 0.74 | $ | 0.64 | $ | 0.64 | $ | 0.56 | $ | 0.54 | $ | 0.69 | $ | 0.61 | $ | 0.38 | ||||||||||||||||
|
Diluted
|
$ | 0.73 | $ | 0.63 | $ | 0.63 | $ | 0.56 | $ | 0.53 | $ | 0.68 | $ | 0.60 | $ | 0.37 | ||||||||||||||||
Net Interest Income
Net interest income is the difference between the interest earned on loans, investments and other interest-earning assets and the interest expense incurred on deposits and other interest-bearing liabilities. Net interest income is impacted by changes in general market interest rates and by changes in the amounts and composition of interest-earning assets and interest-bearing liabilities. Interest rate changes can create fluctuations in the net interest margin due to an imbalance in the timing of repricing or maturity of assets or liabilities. We manage interest rate risk exposure with the goal of minimizing the impact of interest rate volatility on net interest margin.
Net interest margin is expressed as net interest income divided by average interest-earning assets. Net interest rate spread is the difference between the average rate earned on total interest-earning assets and the average rate incurred on total interest-bearing liabilities. Both of these measures are reported on a taxable-equivalent basis. Net interest margin is the higher of the two because it reflects interest income earned on assets funded with non-interest-bearing sources of funds, which include demand deposits and stockholders’ equity.
Table 2, Distribution of Average Statements of Condition and Analysis of Net Interest Income, compares interest income and average interest-earning assets with interest expense and average interest-bearing liabilities for the three years ended December 31, 2010, 2009 and 2008. The table also indicates net interest income, net interest margin and net interest rate spread for each period presented.
|
Table 2
|
Distribution of Average Statements of Condition and Analysis of Net Interest Income
|
Average Statements of Condition and Analysis of Net Interest Income
|
2010
|
2009
|
2008
|
||||||||||||||||||||||||||||||||||
|
(Dollars in thousands; unaudited)
|
Average
Balance |
Interest
Income/ |
Yield/
Rate |
Average
Balance |
Interest
Income/ |
Yield/
Rate |
Average
Balance |
Interest
Income/ |
Yield/
Rate |
|||||||||||||||||||||||||||
|
Assets
|
||||||||||||||||||||||||||||||||||||
|
Interest-bearing due from banks (1)
|
$ | 43,028 | $ | 143 | 0.33 | % | $ | 164 | $ | 1 | 0.60 | % | $ | --- | $ | --- | --- | % | ||||||||||||||||||
|
Federal funds sold
|
3,049 | 2 | 0.07 | 1,752 | 4 | 0.23 | 4,212 | 138 | 3.22 | |||||||||||||||||||||||||||
|
Investment securities
|
||||||||||||||||||||||||||||||||||||
|
U.S. Government agencies (2)
|
91,869 | 3,234 | 3.52 | 70,268 | 3,304 | 4.70 | 72,606 | 3,555 | 4.90 | |||||||||||||||||||||||||||
|
Corporate CMOs and other (2)
|
13,675 | 593 | 4.34 | 7,397 | 506 | 6.84 | 6,124 | 273 | 4.46 | |||||||||||||||||||||||||||
|
Obligations of state and political subdivisions (3)
|
30,893 | 1,741 | 5.64 | 29,221 | 1,677 | 5.74 | 19,541 | 1,106 | 5.66 | |||||||||||||||||||||||||||
|
Loans and banker's acceptances (1) (3) (4)
|
929,755 | 56,542 | 6.00 | 910,456 | 55,071 | 5.97 | 798,369 | 54,475 | 6.82 | |||||||||||||||||||||||||||
|
Total interest-earning assets (1)
|
1,112,269 | 62,255 | 5.52 | 1,019,258 | 60,563 | 5.86 | 900,852 | 59,547 | 6.61 | |||||||||||||||||||||||||||
|
Cash and non-interest-bearing due from banks
|
34,383 | 46,954 | 21,990 | |||||||||||||||||||||||||||||||||
|
Bank premises and equipment, net
|
8,259 | 8,140 | 8,354 | |||||||||||||||||||||||||||||||||
|
Interest receivable and other assets, net
|
31,262 | 26,041 | 17,325 | |||||||||||||||||||||||||||||||||
|
Total assets
|
$ | 1,186,173 | $ | 1,100,393 | $ | 948,521 | ||||||||||||||||||||||||||||||
|
Liabilities and Stockholders' Equity
|
||||||||||||||||||||||||||||||||||||
|
Interest-bearing transaction accounts
|
$ | 98,168 | $ | 110 | 0.11 | % | $ | 90,159 | $ | 115 | 0.13 | % | $ | 78,672 | $ | 344 | 0.44 | % | ||||||||||||||||||
|
Savings accounts
|
51,738 | 104 | 0.20 | 45,944 | 94 | 0.20 | 40,238 | 300 | 0.75 | |||||||||||||||||||||||||||
|
Money market accounts
|
390,575 | 2,467 | 0.63 | 391,571 | 3,235 | 0.83 | 390,383 | 6,610 | 1.69 | |||||||||||||||||||||||||||
|
CDARS® time accounts
|
71,432 | 842 | 1.18 | 51,248 | 721 | 1.41 | 9,039 | 200 | 2.21 | |||||||||||||||||||||||||||
|
Other time accounts
|
124,631 | 1,495 | 1.20 | 97,924 | 1,541 | 1.57 | 83,735 | 2,466 | 2.95 | |||||||||||||||||||||||||||
|
Overnight borrowings (1)
|
2 | --- | 0.29 | 10,659 | 28 | 0.26 | 15,629 | 295 | 1.89 | |||||||||||||||||||||||||||
|
FHLB fixed-rate advances
|
55,000 | 1,281 | 2.33 | 53,794 | 1,253 | 2.33 | 14,440 | 306 | 2.12 | |||||||||||||||||||||||||||
|
Subordinated debenture (1)
|
5,000 | 149 | 2.94 | 5,000 | 180 | 3.55 | 5,000 | 296 | 5.92 | |||||||||||||||||||||||||||
|
Total interest-bearing liabilities
|
796,546 | 6,448 | 0.81 | 746,299 | 7,167 | 0.96 | 637,136 | 10,817 | 1.70 | |||||||||||||||||||||||||||
|
Demand accounts
|
263,742 | 232,502 | 208,320 | |||||||||||||||||||||||||||||||||
|
Interest payable and other liabilities
|
9,791 | 9,873 | 7,624 | |||||||||||||||||||||||||||||||||
|
Stockholders' equity
|
116,094 | 111,359 | 95,441 | |||||||||||||||||||||||||||||||||
|
Total liabilities & stockholders' equity
|
$ | 1,186,173 | $ | 1,100,033 | $ | 948,521 | ||||||||||||||||||||||||||||||
|
Tax-equivalent net interest income/margin (1)
|
$ | 55,807 | 4.95 | % | $ | 53,396 | 5.17 | % | $ | 48,730 | 5.41 | % | ||||||||||||||||||||||||
|
Reported net interest income/margin
|
$ | 54,909 | 4.87 | % | $ | 52,567 | 5.09 | % | $ | 48,359 | 5.37 | % | ||||||||||||||||||||||||
|
Tax-equivalent net interest rate spread
|
4.71 | % | 4.90 | % | 4.91 | % | ||||||||||||||||||||||||||||||
(1) Interest income/expense is divided by actual number of days in the period times 360 days to correspond to stated interest rate terms, where applicable.
(2) Yields on available-for-sale securities are calculated based on amortized cost balances rather than fair value, as changes in fair value are reflected as a component of stockholders' equity.
(3) Yields and interest income on tax-exempt securities and loans are presented on a taxable-equivalent basis using the Federal statutory rate of 35 percent.
(4) Average balances on loans outstanding include non-performing loans. The amortized portion of net loan origination fees is included in interest income on loans, representing an adjustment to the yield.
2010 Compared with 2009:
Tax equivalent net interest income totaled $55.8 million and $53.4 million for the years ended December 31, 2010 and 2009, respectively. The $2.4 million or 4.5% increase was due to an increase in volume of interest-earning assets, offset by the effect of lower yields on investment securities.
Average interest-earning assets increased $93.0 million, or 9.1%, in 2010 compared to 2009. This included increases in average interest-bearing due from banks of $42.9 million, average investment securities of $29.6 million and average loan growth of $19.3 million. In October 2010, we opened our Santa Rosa loan production office, which is expected to position the Bank for additional loan growth, particularly in commercial and industrial loans.
The tax-equivalent net interest margin decreased to 4.95% in 2010, down twenty-two basis points from 2009. The decrease in the tax-equivalent net interest margin was primarily due to lower yields on investment securities (as a result of increased prepayments and lower yields on recent additions) and a shift in the relative composition of interest-earning assets from higher-yielding loans to lower-yielding interest-bearing due from banks. The excess liquidity from deposit inflows has not yet been deployed into funding new loans, as the banking industry as a whole is experiencing challenges with loan demand and the competition for qualified borrowers intensified. The net interest spread decreased nineteen basis points from the same period last year for the same reasons.
The average balance of interest-bearing liabilities increased $50.2 million, or 6.7%, in 2010 compared to 2009. The increases are pervasive in all categories of deposit accounts except money market accounts, with the most significant increase in time deposits (including CDARS®), which increased $46.9 million. These increases were partially offset by a decrease in overnight borrowings of $10.7 million. We have experienced a shift in the relative composition of interest-bearing deposits in 2010 compared to 2009 as the proportion of higher-costing time accounts has increased, while the proportion of money market deposit accounts has decreased.
Market interest rates are in part based on the target Federal funds interest rate (the interest rate banks charge each other for short-term borrowings) implemented by the Federal Reserve Open Market Committee. In December of 2008, the target interest rate was brought to a historic low with a range of 0% to 0.25% where it remains as of December 31, 2010.
The yield on the loan portfolio, which comprised 83.6% and 89.3% of average earning assets in 2010 and 2009, respectively, increased three basis points in 2010 compared to 2009. This is mainly due to the shift in the mix of loans from construction and commercial loans to higher-yielding commercial real estate loans. Interest foregone on non-accrual loans represented a seven-basis point reduction to the net interest margin in both 2010 and 2009.
The lower yields on investment securities are a result of increased prepayments resulting in accelerated amortization of premiums, and lower yields on recently purchased securities. The yield on private-label CMOs, agency securities and municipal bonds decreased 250 basis points, 118 basis points and ten basis points, respectively, in 2010.
The rate on interest-bearing liabilities decreased fifteen basis points in 2010 compared to 2009, primarily reflecting lower offering rates on money market accounts, as well as the downward re-pricing of time deposits as they mature. In 2010, the rate on other time deposits, CDARS®, and money market accounts decreased thirty-seven basis points, twenty-three basis points, and twenty basis points, respectively. The rate on the subordinated debenture dropped sixty-one basis points due to a decline in the three-month LIBOR rate, to which the debenture rate is indexed.
2009 Compared with 2008:
The tax-equivalent net interest margin decreased to 5.17% in 2009, down twenty-four basis points from 2008. The decrease in the net interest margin was primarily due to the repricing of our loan portfolio in a declining rate environment, and to a lesser extent, interest foregone on non-accrual loans (representing a seven-basis-point impact on the net interest margin in 2009 versus a two-basis-point effect in 2008).
The net interest rate spread in 2009 is consistent with 2008, reflecting a decrease of seventy-five basis points in the yield on interest-earning assets and a decline of seventy-four basis points in the cost of interest-bearing liabilities.
In 2008, there were seven downward adjustments to the target Federal funds rate totaling 325 basis points, bringing the target interest rate to a historic low with a range of 0% to 0.25%. Market rate changes have a more immediate effect on deposit rates than on loan yields due to our fixed-rate loans (see Table 10 below for our fixed vs. variable loans distribution). In addition, the large majority of our variable loans are tied to the U.S. Treasury Constant Maturity Indices with repricing intervals between one year to five years. The yield on the loan portfolio, which comprised approximately 89% of average earning assets in both 2009 and 2008, decreased eighty-five basis points in 2009 due to the downward repricing of variable-rate loans and new loans originated at lower market rates, as well as maturities and pay downs of higher yielding loans.
The yield on agency securities in 2009 decreased twenty basis points from 2008, mainly reflecting a tighter spread between agency yields and Treasury rates on newly purchased agency securities due to the stabilization of the MBS market in 2009 and increased prepayments of higher-yielding securities which accelerated the amortization of premiums.
Average interest-earning assets increased $118.4 million, or 13.1%, in 2009 compared to 2008. The increase primarily relates to average loan growth of $112.1 million and an increase in average investment securities of $8.6 million, partially offset by a $2.3 million decline in average Federal funds sold. There was no significant shift in the mix of interest-earning assets in 2009.
The overall cost of liabilities is affected by offered rates and the mix of deposits and other liabilities. The overall rate on interest-bearing liabilities decreased seventy-four basis points in 2009 over 2008. The rate on savings and money market accounts, CDARS®, and time deposits decreased 84 basis points, 80 basis points, and 138 basis points, respectively, in 2009 compared to 2008, reflecting lower offered rates on deposits in response to lower market rates.
The average balance of interest-bearing liabilities increased $109.2 million, or 17.1%, in 2009 compared to 2008. The increases are pervasive in all categories of interest-bearing liabilities, most notably in CDARS® deposits and purchased funds, which increased $42.2 million and $34.4 million respectively in 2009. Late in the first quarter of 2008, we began to offer CDARS®, a network through which the Bank offers FDIC insurance coverage in excess of the current $250 thousand regulatory maximum by placing deposits in multiple banks participating in the network. CDARS® contributed to an increase in average deposits of $42.2 million in 2009. We experienced a shift in the relative mix of interest-bearing liabilities in 2009 compared to 2008: the proportion of higher-costing liabilities (mainly CDARS® and purchased funds) has increased from 6.1% of interest-bearing liabilities in 2008 to 15.5% in 2009, while the proportion of money market deposit accounts has decreased from 61.3% in 2008 to 52.5% in 2009.
Table 3, Analysis of Changes in Net Interest Income, separates the change in net interest income into two components: 1 volume – change caused by increases or decreases in the average asset and liability balances outstanding, and 2 yield/rate – changes in average yields on earning assets and average rates for interest-bearing liabilities.
|
Table 3
|
Analysis of Changes in Net Interest Income
|
|
2010 compared to 2009
|
2009 compared to 2008
|
|||||||||||||||||||||||
|
Yield/
|
Yield/
|
|||||||||||||||||||||||
|
(Dollars in thousands)
|
Volume
|
Rate1
|
Total
|
Volume
|
Rate1
|
Total
|
||||||||||||||||||
|
Assets
|
||||||||||||||||||||||||
|
Interest-bearing due from banks
|
$ | 142 | $ | - | $ | 142 | $ | 1 | $ | - | $ | 1 | ||||||||||||
|
Federal funds sold
|
1 | (3 | ) | (2 | ) | (6 | ) | (128 | ) | (134 | ) | |||||||||||||
|
Investment securities
|
||||||||||||||||||||||||
|
U. S. Government agencies
|
760 | (830 | ) | (70 | ) | (112 | ) | (139 | ) | (251 | ) | |||||||||||||
|
Obligations of state and political subdivisions
|
||||||||||||||||||||||||
|
Municipal bonds2
|
272 | (185 | ) | 87 | 65 | 168 | 233 | |||||||||||||||||
|
Corporate CMO
|
94 | (30 | ) | 64 | 556 | 15 | 571 | |||||||||||||||||
|
Loans and bankers’ acceptances2
|
1,174 | 297 | 1,471 | 7,521 | (6,925 | ) | 596 | |||||||||||||||||
|
Total interest-earning assets
|
2,443 | (751 | ) | 1,692 | 8,025 | (7,009 | ) | 1,016 | ||||||||||||||||
|
Liabilities
|
||||||||||||||||||||||||
|
Interest-bearing transaction accounts
|
9 | (14 | ) | (5 | ) | 44 | (273 | ) | (229 | ) | ||||||||||||||
|
Savings accounts
|
12 | (2 | ) | 10 | 12 | (218 | ) | (206 | ) | |||||||||||||||
|
Money market accounts
|
(6 | ) | (762 | ) | (768 | ) | 10 | (3,385 | ) | (3,375 | ) | |||||||||||||
|
CDARS® time deposits
|
238 | (117 | ) | 121 | 619 | (98 | ) | 521 | ||||||||||||||||
|
Other time accounts
|
320 | (366 | ) | (46 | ) | 366 | (1,291 | ) | (925 | ) | ||||||||||||||
|
Overnight borrowings
|
(31 | ) | 3 | (28 | ) | (13 | ) | (254 | ) | (267 | ) | |||||||||||||
|
FHLB fixed-rate advances
|
28 | - | 28 | 917 | 30 | 947 | ||||||||||||||||||
|
Subordinated debenture
|
- | (31 | ) | (31 | ) | - | (116 | ) | (116 | ) | ||||||||||||||
|
Total interest-bearing liabilities
|
570 | (1,289 | ) | (719 | ) | 1,955 | (5,605 | ) | (3,650 | ) | ||||||||||||||
|
Tax-equivalent net interest income
|
$ | 1,873 | $ | 538 | $ | 2,411 | $ | 6,070 | $ | (1,404 | ) | $ | 4,666 | |||||||||||
1 The changes for each category of interest income and expense are divided between the portion of change attributable to the variance in volume and the portion of change attributable to the variance in rate for that category. The unallocated change in rate or volume variance has been allocated between the rate and volume variances on a pro rata basis.
2 Yields and interest income on tax-exempt securities and loans are presented on a taxable-equivalent basis using the Federal statutory rate of 35 percent.
The table indicates that in 2010 and 2009, our net interest income was favorably affected by an increase in the volume of interest-earning assets, partially offset by declines in yields. The decline in our asset yields in 2010 reflected the lower returns on investment securities discussed previously, while the decline in 2009 reflected the downward repricing of our variable loans as their indexed rates reset. Further, net interest income in both 2010 and 2009 benefitted from lower rates on deposits, especially money market and time accounts.
Provision for Loan Losses
Management assesses the adequacy of the allowance for loan losses on a quarterly basis based on several factors including growth of the loan portfolio, analysis of probable losses in the portfolio, recent loss experience and the current economic climate. Actual losses on loans are charged against the allowance, and the allowance is increased through the provision for loan losses charged to expense to bring the allowance to a level, based on Management’s best judgment, to absorb probable losses inherent in the existing loan portfolio. For further discussion, see the section captioned “Critical Accounting Policies.”
Our provision for loan losses totaled $5.4 million in 2010 compared to $5.5 million in 2009, which was relatively unchanged. See the section captioned “Allowance for Loan Losses” below for further analysis of the provision for loan losses.
Non-interest Income
The table below details the components of non-interest income.
|
Table 4
|
Significant Components of Non-interest Income
|
|
2010 compared to 2009
|
2009 compared to 2008
|
|||||||||||||||||||||||||||
|
Year Ended
|
Amount
|
Percent
|
Amount
|
Percent
|
||||||||||||||||||||||||
|
December 31,
|
Increase
|
Increase
|
Increase
|
Increase
|
||||||||||||||||||||||||
|
(Dollars in thousands)
|
2010
|
2009
|
2008
|
(Decrease)
|
(Decrease)
|
(Decrease)
|
(Decrease)
|
|||||||||||||||||||||
|
Service charges on deposit accounts
|
$ | 1,797 | $ | 1,782 | $ | 1,654 | $ | 15 | 0.8 | % | $ | 128 | 7.7 | % | ||||||||||||||
|
Wealth Management and Trust Services
|
1,521 | 1,383 | 1,292 | 138 | 10.0 | 91 | 7.0 | |||||||||||||||||||||
|
Net gain on redemption of shares in Visa, Inc.
|
--- | --- | 457 | --- | --- | (457 | ) |
NM
|
||||||||||||||||||||
|
Other non-interest income
|
||||||||||||||||||||||||||||
|
Earnings on Bank owned life insurance
|
690 | 696 | 640 | (6 | ) | (0.8 | ) | 56 | 8.8 | |||||||||||||||||||
|
Customer banking fees and other charges
|
606 | 466 | 409 | 140 | 30.0 | 57 | 13.9 | |||||||||||||||||||||
|
Merchant interchange income
|
578 | 474 | 329 | 104 | 21.9 | 145 | 44.1 | |||||||||||||||||||||
|
Other income
|
329 | 381 | 575 | (52 | ) | (13.6 | ) | (194 | ) | (33.7 | ) | |||||||||||||||||
|
Total other non-interest income
|
2,203 | 2,017 | 1,953 | 186 | 9.2 | 64 | 3.3 | |||||||||||||||||||||
|
Total non-interest income
|
$ | 5,521 | $ | 5,182 | $ | 5,356 | $ | 339 | 6.5 | % | $ | (174 | ) | (3.2 | %) | |||||||||||||
NM - Not Meaningful
2010 Compared with 2009:
When comparing 2010 to 2009, service charge income on deposit accounts remained relatively unchanged.
The increase in Wealth Management and Trust Services (“WMTS”) income is due to higher estate settlement and trust-services fees received in 2010, as well as the increase in assets under management. As of December 31, 2010 and 2009, assets under management totaled approximately $254.0 million and $252.5 million, respectively.
The increase in customer banking fees, and other charges, is primarily due to higher Visa® debit card fees, attributable to a higher volume of Visa® debit card usage, as well as a Bank-wide Visa® debit card promotion program. As previously discussed in Item 1A Risk Factors, in December 2010, the Federal Reserve proposed a new regulation to restrict interchange fees charged for debit card transactions by card issuers over $10 billion in asset size. Because of the uncertainty of the final outcome of the proposed rule, and its effect on the market pricing of the interchange fees, we can not quantify the ultimate impact of this proposal on our Visa® debit card fees.
Merchant interchange income increased due to the higher transaction volume from our merchant customers as well as one-time billing adjustments. The decrease in other non-interest income is mainly due to a decrease in miscellaneous income, partially offset by an increase in the dividend received on Federal Home Loan Bank of San Francisco (“FHLB”) stock.
2009 Compared with 2008:
In 2008, the mandatory redemption of a portion of our shares of Visa, Inc. generated a net gain of $457 thousand as discussed in Note 2 to Consolidated Financial Statements in Item 8 of this report. Excluding this nonrecurring gain, non-interest income in 2009 increased $283 thousand, or 5.8%, from 2008.
The increase in service charges on deposit accounts in 2009 was primarily due to the increase in the volume of deposit accounts.
The increase in WMTS income in 2009 primarily reflected a higher level of assets under management.
The increase in bank-owned life insurance (“BOLI”) income in 2009 is attributable to the full-year’s worth of income earned on the $2.2 million of policies purchased in August 2008. The increase in customer banking fees in 2009 is primarily due to a $46k increase in Visa® debit fees attributable to a higher volume of Visa® card applications resulting from a promotion, as well as an increase in remote deposit capture fees. Merchant interchange fee income increased $145 thousand in 2009 due to lower interchange costs charged by our data processing vendor resulting from the renegotiation of our data processing contract. The decrease in other income in 2009 is primarily due to decreases of $164 thousand of dividends on FHLB stock and the absence of $42 thousand in interest we received in the second quarter of 2008 on amended tax returns.
Non-interest Expense
Table 5, Significant Components of Non-interest Expense, summarizes the amounts and changes in dollars and percentages. Our efficiency ratio (the ratio of non-interest expense divided by the sum of non-interest income and net interest income) totaled 55.20%, 54.89%, and 53.39% in 2010, 2009 and 2008, respectively.
|
Table 5
|
Significant Components of Non-interest Expense
|
|
2010 compared to 2009
|
2009 compared to 2008
|
|||||||||||||||||||||||||||
|
Year Ended
|
Amount
|
Percent
|
Amount
|
Percent
|
||||||||||||||||||||||||
|
December 31,
|
Increase
|
Increase
|
Increase
|
Increase
|
||||||||||||||||||||||||
|
(Dollars in thousands)
|
2010
|
2009
|
2008
|
(Decrease)
|
(Decrease)
|
(Decrease)
|
(Decrease)
|
|||||||||||||||||||||
|
Salaries and related benefits
|
$ | 18,240 | $ | 17,001 | $ | 16,097 | $ | 1,239 | 7.3 | % | $ | 904 | 5.6 | % | ||||||||||||||
|
Occupancy and equipment
|
3,576 | 3,516 | 3,202 | 60 | 1.7 | 314 | 9.8 | |||||||||||||||||||||
|
Depreciation and amortization
|
1,344 | 1,370 | 1,340 | (26 | ) | (1.9 | ) | 30 | 2.2 | |||||||||||||||||||
|
FDIC Insurance
|
1,506 | 1,800 | 507 | (294 | ) | (16.3 | ) | 1,293 | 255.0 | |||||||||||||||||||
|
Data processing costs
|
1,916 | 1,650 | 1,825 | 266 | 16.1 | (175 | ) | (9.6 | ) | |||||||||||||||||||
|
Professional services
|
1,917 | 1,727 | 1,600 | 190 | 11.0 | 127 | 7.9 | |||||||||||||||||||||
|
Other non-interest expense
|
||||||||||||||||||||||||||||
|
Advertising
|
459 | 528 | 439 | (69 | ) | (13.1 | ) | 89 | 20.3 | |||||||||||||||||||
|
Director expense
|
475 | 420 | 444 | 55 | 13.1 | (24 | ) | (5.4 | ) | |||||||||||||||||||
|
Other expense
|
3,924 | 3,684 | 3,223 | 240 | 6.5 | 461 | 14.3 | |||||||||||||||||||||
|
Total other non-interest expense
|
4,858 | 4,632 | 4,106 | 226 | 4.9 | 526 | 12.8 | |||||||||||||||||||||
|
Total non-interest expense
|
$ | 33,357 | $ | 31,696 | $ | 28,677 | $ | 1,661 | 5.2 | % | $ | 3,019 | 10.5 | % | ||||||||||||||
2010 Compared with 2009:
The increase in salaries and benefits over the same period last year is primarily due to higher personnel-related costs associated with branch expansion, as well as annual merit increases. The number of average FTE totaled 201 and 195 in 2010 and 2009, respectively. In addition, a rise in employee benefit rates contributed to the increase.
The increases in occupancy and equipment expense are mainly due to an increase in rent for our Greenbrae branch in its first full-year of service in 2010, and also the new Santa Rosa loan production office, partially offset by cost savings from the relocation of our Corte Madera branch.
The decrease in 2010 FDIC insurance is due to the absence of a special assessment totaling $496 thousand in the second quarter of 2009, partially offset by a higher FDIC assessment rate and higher deposits. Further, we elected to participate in the FDIC Transaction Account Guarantee Program, which provided unlimited insurance coverage on non-interest-bearing transaction accounts defined by the FDIC, on which we paid a 10 basis point surcharge per $100 covered balances in excess of $250 thousand through 2009. The 10 basis point surcharge on non-interest-bearing transaction accounts over $250 thousand increased to 15 basis points from January to December 2010, at which time the program expired.
As discussed in section the captioned “FDIC Insurance Assessments” in Item 1 Business above, on February 7, 2010, the FDIC adopted a new FDIC insurance assessment base effective in the second quarter of 2011, which is expected to lower our FDIC insurance cost by approximately one-third annually.
The increase in data processing expense is due to process re-engineering costs, an annual contractual rate increase, as well as the outsourcing of certain trust operations.
The increase in professional service expenses in 2010 when compared to 2009 is mainly due to higher costs associated with strategic expansion initiatives and investment advisory fees.
Advertising expenses decreased, primarily due to a decrease in the usage of traditional print advertising channels as part of the marketing program.
Director fees increased due to the director compensation rate increase, partially offset by fewer directors.
The increase in other non-interest expense from a year ago was primarily due to a higher provision for losses on off-balance sheet commitments due to a higher commitment amount, operational losses, printing and stationery costs, charitable contributions and staff relation costs.
2009 Compared with 2008:
The increase in salaries and benefits in 2009 from the prior year primarily reflected annual merit increases, higher personnel costs associated with branch expansion, higher incentive compensation, as well as higher employee insurance. Average FTE totaled 195 and 190 during 2009 and 2008, respectively.
The increase in occupancy and equipment expenses in 2009 from 2008 was primarily related to higher premises rent associated with the new Greenbrae branch opened in September 2009 and increases for renewed leases, as well as a full year of rent for the Mill Valley branch opened in June 2008.
Depreciation and amortization increased slightly in 2009 and reflected amortization of the recently capitalized leasehold improvements of the Greenbrae and Mill Valley branches, partially offset by the effect of certain assets that became fully-depreciated in 2009.
The increase in FDIC insurance in 2009 was due to a higher FDIC assessment rate (which more than doubled from 2008), and higher deposits. Effective April 1, 2009, the FDIC adopted a final rule revising its risk-based insurance assessment system and effectively increasing the overall assessment rate. The revised initial base assessment rates for Risk Category 1 institutions ranged from twelve to sixteen basis points, on an annualized basis. The FDIC also imposed a special deposit insurance assessment of five basis points on all insured institutions’ total assets minus Tier 1 capital at June 30, 2009 in order to replenish the Deposit Insurance Fund. As a result, we recognized $496 thousand from this special assessment in 2009.
Data processing costs decreased in 2009 over 2008 as we benefitted from the renegotiation of our contract with our data processing vendor.
The increase in professional services in 2009 over 2008 was primarily due to an increase in legal expenses relating to the repurchase of preferred shares as well as legal expenses relating to delinquent loans. These increases were partially offset by decreases in other professional fees associated with the discontinuation of a consulting agreement that began in July of 2006 and ended in June of 2008.
The increase in advertising expenses from 2008 is primarily due to fees associated with a new public relations firm. The decrease in director expense in 2009 is primarily due to the departure of two directors who retired in May 2009.
The increase in other expense in 2009 over 2008 reflected operational losses in the second quarter of 2009 as well as the absence of a $242 thousand litigation liability cost reversed in 2008. In 2007, other expense included a pre-tax non-recurring charge of $242 thousand recorded in the fourth quarter for the potential obligation to Visa U.S.A. in connection with certain litigation indemnifications provided to Visa U.S.A. by Visa member banks. Such amount was reversed in 2008 against other expense upon Visa Inc.’s Initial Public Offering in 2008 as discussed in Note 13 to Consolidated Financial Statements.
Provision for Income Taxes
We reported a provision for income taxes of $8.2 million, $7.8 million, and $7.9 million for the years ended December 31, 2010, 2009, and 2008 respectively. The effective tax rates were 37.6%, 37.9%, and 39.3% for those same periods. These provisions reflect accruals for taxes at the applicable rates for federal income tax and California franchise tax based upon reported pre-tax income, and adjusted for the effects of all permanent differences between income for tax and financial reporting purposes (such as earnings on qualified municipal securities, BOLI and certain tax-exempt loans). Therefore, there are normal fluctuations in the effective rate from period to period based on the relationship of net permanent differences to income before tax. We have not been subject to an alternative minimum tax (“AMT”) during these periods.
Bancorp and the Bank have entered into a tax allocation agreement which provides that income taxes shall be allocated between the parties on a separate entity basis. The intent of this agreement is that each member of the consolidated group will incur no greater tax liability than it would have incurred on a stand-alone basis.
FINANCIAL CONDITION
Short-term Investment
At December 31, 2010 and 2009, we had $19.5 million and $15 million held in money market accounts with our correspondent banks, respectively, which earned interest at rates between 0.35% to 0.55% during 2010 and at a rate of 0.60% during 2009.
Investment Securities
We maintain an investment securities portfolio to provide liquidity and to generate earnings on funds that have not been loaned to customers. Management determines the maturities and the types of securities to be purchased based on the liquidity level and the desire to attain a reasonable investment yield balanced with risk exposure. Table 6 shows the makeup of the securities portfolio by expected maturity at December 31, 2010 and 2009. Expected maturities differ from contractual maturities because the issuers of the securities may have the right to call or prepay obligations with or without call or prepayment penalties. Equity securities with a zero cost basis and a fair value of $608 thousand are excluded from the following table because they do not have a stated maturity.
|
Table 6
|
Investment Securities
|
|
Type and Maturity Grouping
|
December 31, 2010
|
December 31, 2009
|
||||||||||||||||||||||||||||||
|
(Dollars in thousands)
|
Principal
Amount |
Amortized
Cost1 |
Fair
Value |
Weighted
Average |
Principal
Amount
|
Amortized
Cost1 |
Fair
Value |
Weighted
Average |
||||||||||||||||||||||||
|
Held to maturity
|
||||||||||||||||||||||||||||||||
|
State and municipal
|
||||||||||||||||||||||||||||||||
|
Due within 1 year
|
$ | 1,624 | $ | 1,478 | $ | 1,500 | 5.81 | % | $ | 665 | $ | 671 | $ | 682 | 4.76 | % | ||||||||||||||||
|
Due after 1 but within 5 years
|
5,471 | 5,304 | 5,440 | 4.41 | 3,770 | 3,863 | 4,017 | 5.41 | ||||||||||||||||||||||||
|
Due after 5 but within 10 years
|
20,905 | 20,589 | 20,784 | 5.11 | 11,840 | 12,403 | 12,831 | 5.72 | ||||||||||||||||||||||||
|
Due after 10 years
|
7,561 | 7,546 | 7,366 | 6.01 | 13,335 | 13,459 | 13,256 | 5.78 | ||||||||||||||||||||||||
|
Total held to maturity
|
35,561 | 34,917 | 35,090 | 5.23 | 29,610 | 30,396 | 30,786 | 5.69 | ||||||||||||||||||||||||
|
Available for sale
|
||||||||||||||||||||||||||||||||
|
U. S. government agencies
|
||||||||||||||||||||||||||||||||
|
Due within 1 year
|
5,946 | 5,839 | 5,873 | 5.16 | 3,264 | 3,270 | 3,289 | 4.62 | ||||||||||||||||||||||||
|
Due after 1 but within 5 years
|
72,509 | 71,899 | 73,700 | 3.56 | 36,986 | 37,339 | 38,672 | 4.99 | ||||||||||||||||||||||||
|
Due after 5 but within 10 years
|
15,518 | 15,483 | 15,685 | 4.10 | 29,563 | 30,674 | 30,373 | 3.84 | ||||||||||||||||||||||||
|
Due after 10 years
|
--- | --- | --- | --- | 10,525 | 10,650 | 10,888 | 5.06 | ||||||||||||||||||||||||
|
Total
|
93,973 | 93,221 | 95,258 | 3.75 | 80,338 | 81,933 | 83,222 | 4.56 | ||||||||||||||||||||||||
|
Corporate CMOs
|
||||||||||||||||||||||||||||||||
|
Due within 1 year
|
--- | --- | --- | --- | 2,088 | 2,103 | 2,075 | 3.91 | ||||||||||||||||||||||||
|
Due after 1 but within 5 years
|
15,869 | 15,849 | 15,870 | 4.27 | 4,637 | 4,646 | 4,628 | 4.89 | ||||||||||||||||||||||||
|
Due after 5 but within 10 years
|
--- | --- | --- | --- | 8,068 | 8,070 | 7,893 | 4.62 | ||||||||||||||||||||||||
|
Total
|
15,869 | 15,849 | 15,870 | 4.27 | 14,793 | 14,819 | 14,596 | 4.60 | ||||||||||||||||||||||||
|
Total available for sale
|
109,842 | 109,070 | 111,128 | 3.83 | 95,131 | 96,752 | 97,818 | 4.57 | ||||||||||||||||||||||||
|
Total
|
$ | 145,403 | $ | 143,987 | $ | 146,218 | 4.17 | % | $ | 124,741 | $ | 127,148 | $ | 128,604 | 4.83 | % | ||||||||||||||||
1 Book value reflects cost, adjusted for accumulated amortization and accretion.
2 Yields on tax-exempt securities are presented on a tax-equivalent basis and weighted average calculation is based on amortized cost of securities.
The carrying amount of our investment securities portfolio, consisting primarily of obligations of U.S. government agencies, state and municipal securities and corporate collateralized mortgage obligations (“CMOs”), increased $18.4 million or 14.4% at December 31, 2010 due to our excess liquidity from deposit inflows that has not been deployed to lending, and the recognition of a zero-cost basis equity security at its fair value of $608 thousand. U.S. government agency securities, which make up 65.0% and 64.9% of the portfolio at December 31, 2010 and 2009 respectively, increased $12.0 million in 2010. State and municipal securities, which represented 23.8% and 23.7% of the portfolio at December 31, 2010 and 2009 respectively, increased $4.5 million. See discussion in section captioned “Securities May Lose Value due to Credit Quality of the Issuers” in Item 1A Risk Factors above. Corporate collateralized mortgage obligation securities increased $1.3 million in 2010. The weighted average maturity of the portfolio at December 31, 2010 was approximately four years.
As a member bank of Visa U.S.A., we hold 16,939 shares of Visa Inc. Class B common stock at a zero cost basis. These shares are restricted from resale until their conversion into Class A (voting) shares on the later of March 25, 2011 or the termination of Visa Inc.’s covered litigation escrow account upon the final resolution of the Visa Inc. covered litigation. The stock was classified as available-for-sale securities and reported at fair value, with the unrealized gain, net of tax, recognized in other comprehensive income. The fair value of the Class B common stock we own was $608 thousand as of December 31, 2010 based on the Class A as-converted rate of 0.5102.
Mortgage-backed securities in the portfolio at December 31, 2010 totaled $111.1 million, which consisted of $16.4 million pass-through securities issued by FNMA and FHLMC, $78.8 million other mortgage backed securities issued or guaranteed by FNMA, FHLMC, or Government National Mortgage Association (“GNMA”), and $15.9 million of corporate CMOs. We generally invest in mortgage-backed securities with borrowers having strong credit scores and/or collateral compositions reflecting low loan-to-value ratios. Any investment securities in our portfolio that may be backed by sub-prime or Alt-A mortgages relate primarily to certain GNMA agency securities, which are guaranteed by the US government, or a portion of our corporate CMOs, which account for approximately 5% of our total security portfolio. See Note 2 to Consolidated Financial Statements and Item 1A, Risk Factors, for more information on investment securities.
|
Table 7
|
Loans Outstanding by Type at December 31
|
|
(Dollars in thousands)
|
2010
|
2009
|
2008
|
2007
|
2006
|
|||||||||||||||
|
Commercial loans
|
$ | 153,836 | $ | 164,643 | $ | 146,483 | $ | 124,336 | $ | 117,391 | ||||||||||
|
Real estate
|
||||||||||||||||||||
|
Commercial owner-occupied
|
142,590 | 146,133 | 140,977 | 132,614 | 123,430 | |||||||||||||||
|
Commercial investor
|
383,553 | 332,752 | 326,193 | 257,127 | 188,262 | |||||||||||||||
|
Construction
|
77,619 | 91,289 | 121,981 | 97,153 | 116,790 | |||||||||||||||
|
Home equity
|
86,932 | 83,977 | 65,076 | 34,295 | 30,558 | |||||||||||||||
|
Other residential 1
|
69,991 | 69,369 | 55,600 | 44,565 | 28,354 | |||||||||||||||
|
Indirect auto loans
|
--- | --- | --- | --- | 84,141 | |||||||||||||||
|
Installment and other consumer loans
|
26,879 | 29,585 | 34,234 | 34,788 | 30,852 | |||||||||||||||
|
Total loans
|
941,400 | 917,748 | 890,544 | 724,878 | 719,778 | |||||||||||||||
|
Allowance for loan losses
|
(12,392 | ) | (10,618 | ) | (9,950 | ) | (7,575 | ) | (8,023 | ) | ||||||||||
|
Total net loans
|
$ | 929,008 | $ | 907,130 | $ | 880,594 | $ | 717,303 | $ | 711,755 | ||||||||||
1 Our residential loan portfolio includes no sub-prime loans, nor is it our normal practice to underwrite loans commonly referred to as "Alt-A mortgages", the characteristics of which are loans lacking full documentation, borrowers having low FICO scores or collateral compositions reflecting high loan-to-value ratios. However, substantially all of our residential loans are indexed to Treasury Constant Maturity Rates and have provisions to reset five years after their origination dates.
Commercial loans decreased $10.8 million in 2010 and increased $18.2 million in 2009. The decrease in 2010 related to increased pay-downs as borrowers de-leveraged, successful resolution of problem loans and reduced demand by qualified borrowers. The growth in 2009 was the result of our continued emphasis on commercial and industrial lending, specifically asset-based lines of credit.
Commercial real estate loans increased $47.3 million in 2010 and $11.7 million in 2009. The increase in 2010 reflects several large new relationships in our newer markets, primarily San Francisco and Santa Rosa. Of the commercial real estate loans at December 31, 2010, 73% are non-owner occupied and 27% are owner occupied. Our commercial real estate loan portfolio is weighted towards term loans for which the primary source of repayment is cash flow from net operating income of the real estate property. The following table summarizes our commercial real estate loan portfolio by the geographic location in which the property is located as of December 31, 2010 and 2009:
|
Table 8
|
Commercial Real Estate Loans Outstanding by Geographic Location
|
|
December 31, 2010
|
December 31, 2009
|
|||||||||||||||
|
(Dollars in thousands)
|
Amount
|
% of Commercial real estate loans
|
Amount
|
% of Commercial real estate loans
|
||||||||||||
|
Marin
|
$ | 235,584 | 44.8 | % | $ | 224,018 | 46.8 | % | ||||||||
|
Sonoma
|
80,563 | 15.3 | 66,329 | 13.8 | ||||||||||||
|
San Francisco
|
78,307 | 14.9 | 58,219 | 12.2 | ||||||||||||
|
Alameda
|
36,083 | 6.8 | 30,265 | 6.3 | ||||||||||||
|
Contra Costa
|
7,855 | 1.5 | 7,909 | 1.6 | ||||||||||||
|
Napa
|
12,117 | 2.3 | 12,282 | 2.6 | ||||||||||||
|
Sacramento
|
11,057 | 2.1 | 12,760 | 2.7 | ||||||||||||
|
Other
|
64,577 | 12.3 | 67,103 | 14.0 | ||||||||||||
|
Total
|
$ | 526,143 | 100.0 | % | $ | 478,885 | 100.0 | % | ||||||||
Construction loans decreased $13.7 million in 2010, primarily due to a slow down in construction activities, as well as a conscious effort to reduce our concentration in construction loans. Construction loans decreased $30.7 million in 2009 primarily due to the successful completion and sell-through of construction development projects booked in prior years. Table 9 below shows an analysis of construction loans by type and location.
|
Table 9
|
Construction Loans Outstanding by Type and Geographic Location
|
|
December 31, 2010
|
December 31, 2009
|
|||||||||||||||
|
Construction loans by type
(Dollars in thousands)
|
Amount
|
% of Construction Loans
|
Amount
|
% of Construction Loans
|
||||||||||||
|
Single family non-owner-occupied
|
$ | 12,453 | 16.0 | % | $ | 14,903 | 16.3 | % | ||||||||
|
Single family owner-occupied
|
3,448 | 4.4 | 6,404 | 7.0 | ||||||||||||
|
Commercial non-owner-occupied
|
7,189 | 9.3 | 6,444 | 7.1 | ||||||||||||
|
Commerical owner-occupied
|
3,386 | 4.4 | 3,204 | 3.5 | ||||||||||||
|
Land non-owner-occupied
|
37,660 | 48.5 | 43,750 | 47.9 | ||||||||||||
|
Land owner-occupied
|
2,595 | 3.4 | - | - | ||||||||||||
|
Tenants-in-common and other
|
10,888 | 14.0 | 16,584 | 18.2 | ||||||||||||
|
Total
|
$ | 77,619 | 100.0 | % | $ | 91,289 | 100.0 | % | ||||||||
|
Construction loans by geographic location
(Dollars in thousands)
|
Amount
|
% of Construction Loans
|
Amount
|
% of Construction Loans
|
||||||||||||
|
Marin
|
$ | 17,710 | 22.8 | % | $ | 19,729 | 21.6 | % | ||||||||
|
Sonoma
|
7,884 | 10.1 | 8,302 | 9.1 | ||||||||||||
|
San Francisco
|
44,310 | 57.1 | 52,641 | 57.7 | ||||||||||||
|
Alameda
|
1,748 | 2.3 | 2,545 | 2.8 | ||||||||||||
|
Contra Costa
|
265 | 0.3 | 320 | 0.3 | ||||||||||||
|
Napa
|
1,002 | 1.3 | 879 | 1.0 | ||||||||||||
|
Riverside
|
4,652 | 6.0 | 4,418 | 4.8 | ||||||||||||
|
Other
|
48 | 0.1 | 2,455 | 2.7 | ||||||||||||
|
Total
|
$ | 77,619 | 100.0 | % | $ | 91,289 | 100.0 | % | ||||||||
Home equity lines of credit increased $3.0 million to $86.9 million in 2010. Other residential real estate loans increased $622 thousand in 2010 and $13.8 million in 2009. The majority of the residential real estate loan growth in 2009 was the result of the conversion from acquisition and development loans in the construction portfolio to loans on tenants-in-common units in San Francisco.
Approximately 86% of our outstanding loans are secured by real estate at both December 31, 2010 and 2009. At December 31, 2010, approximately 16% of our commercial real estate loans and half of our residential real estate loans contain an interest-only feature as part of the loan terms. Approximately 88% of the interest-only commercial real estate loans and 91% of the residential real estate loans are considered to have low credit risk (graded “Pass”) and are current with their payments. Also see Item 1A, Risk Factors, regarding our loan concentration risk. As of December 31, 2010, approximately $41.8 million of our loans have interest reserves, the majority of which are construction loans. When we determine a loan is impaired before the interest reserve has been depleted, the interest funded by the interest reserve is applied against loan principal. As of December 31, 2010, no construction loans having interest reserve balances were determined to be impaired.
Variable rate loans at their established interest rate floors or ceilings are included as fixed rate loans in the following table. Table 10 shows a shift towards fixed rate loans within the portfolio in 2010 when compared to 2009 as variable rate loans continued to re-price down to their floor rates in a low-interest rate environment. The large majority of the variable rate loans are tied to independent indices (such as the Wall Street Journal prime rate or a Treasury Constant Maturity Rate). Substantially all loans with an original term of more than five years have provisions for the fixed rates to reset, or convert to a variable rate, after one, three or five years.
|
Table 10
|
Loan Portfolio Maturity Distribution and Interest Rate Sensitivity
|
|
December 31, 2010
|
December 31, 2009
|
|||||||||||||||||||||||||||||||
|
(Dollars in thousands)
|
Fixed
Rate |
Variable
Rate |
Total
|
Percent
|
Fixed
Rate |
Variable
Rate |
Total
|
Percent
|
||||||||||||||||||||||||
|
Due within 1 year
|
$ | 134,346 | $ | 118,860 | $ | 253,206 | 26.9 | % | $ | 114,727 | $ | 94,534 | $ | 209,261 | 22.8 | % | ||||||||||||||||
|
Due after 1 but within 5 years
|
214,467 | 52,236 | 266,703 | 28.3 | 198,635 | 76,501 | 275,136 | 30.0 | ||||||||||||||||||||||||
|
Due after 5 years
|
421,491 | --- | 421,491 | 44.8 | 336,616 | 96,735 | 433,351 | 47.2 | ||||||||||||||||||||||||
|
Total
|
$ | 770,304 | $ | 171,096 | $ | 941,400 | 100.0 | % | $ | 649,978 | $ | 267,770 | $ | 917,748 | 100.0 | % | ||||||||||||||||
|
Percentage
|
81.83 | % | 18.17 | % | 100.00 | % | 70.82 | % | 29.18 | % | 100.00 | % | ||||||||||||||||||||
Allowance for Loan Losses
Credit risk is inherent in the business of lending. As a result, we maintain an allowance for loan losses to absorb losses inherent in our loan portfolio through a provision for loan losses charged against earnings. All specifically identifiable and quantifiable losses are charged off against the allowance. The balance of our allowance for loan losses is Management’s best estimate of the remaining losses inherent in the portfolio. The ultimate adequacy of the allowance is dependent upon a variety of factors beyond our control, including the real estate market, changes in interest rates and economic and political environments. Based on the current conditions of the loan portfolio, Management believes that the $12.4 million allowance for loan losses at December 31, 2010 is adequate to absorb losses inherent in our loan portfolio. No assurance can be given, however, that adverse economic conditions or other circumstances will not result in increased losses in the portfolio.
The Components of the Allowance for Loan Losses
As stated previously in “Critical Accounting Policies,” and Note 1 to the Consolidated Financial Statements in this report, the overall allowance consists of a specific allowance for individually identified impaired loans, an allowance factor for categories of credits with similar characteristics and trends, and an allowance for changing environmental factors.
The first component, the specific allowance, results from the analysis of identified problem credits and the evaluation of sources of repayment including collateral, as applicable. Through Management’s ongoing loan grading process, individual loans are identified that have conditions that indicate the borrower may be unable to pay all amounts due under the contractual terms. These loans are evaluated individually for impairment by Management and specific allowances for loan losses are established when the discounted cash flows of future payments or collateral value of collateral-dependent loans are lower than the recorded investment in the loan. Impaired loan balances increased from $12.2 million at December 31, 2009 to $14.1 million at December 31, 2010. The specific allowance increased from $45 thousand at December 31, 2009 to $1.1 million at December 31, 2010. The increase in the specific allowance primarily related to commercial, mobile home and home equity loans awaiting resolution of pending events before a determination can be made as to whether or not the loan should be charged-off.
The second component, the allowance factor, is an estimate of the probable inherent losses in each loan pool stratified by major categories or loans with similar characteristics in our loan portfolio. This analysis encompasses loan types and economic and business conditions unique to each segment, including the Bank’s own loss history. This analysis covers our entire loan portfolio but excludes any loans that were analyzed individually for specific allowances as discussed above. For loans graded “Substandard” and not already evaluated for impairment in the first component analysis above, they are also assigned an allowance factor. Confirmation of the quality of our grading process is obtained by independent reviews conducted by consultants specifically hired for this purpose and by various bank regulatory agencies. There are limitations to any credit risk grading process. The number of loans makes it impractical to review every loan at every reporting date. Therefore, it is possible that in the future some currently performing loans not recently graded will not be as strong as their last grading and an insufficient portion of the allowance will have been allocated to them. Grading and loan review often must be done without knowing whether all relevant facts are at hand. Troubled borrowers may deliberately or inadvertently omit important information from reports or conversations with lending officers regarding their financial condition and the diminished strength of repayment sources.
The total amount allocated for the second component is determined by applying loss estimation factors to outstanding loan types. At December 31, 2010 and 2009, the allowance allocated by categories of credits totaled $8.3 million and $7.6 million, respectively. The increase mainly related to an increased allowance factor for non-owner-occupied commercial real estate loans, as Management recognizes increased inherent risk and concentration in these loans, as well as a factor added for loans graded “Substandard”. As disclosed in Note 3 to Consolidated Financial Statements in Item 8 below, loans graded “Substandard” totaled $53.2 million as of December 31, 2010.
The third component of the allowance for loan losses is an economic component that is not allocated to specific loans or groups of loans, but rather is intended to absorb losses caused by portfolio trends, concentration of credit, growth, and economic trends. The general valuation allowance, including the economic component and unallocated allowance, totaled approximately $3.0 million at both December 31, 2010 and 2009. Management proactively evaluates economic and other qualitative loss factors used to determine the adequacy of the allowance for loan losses. After assessing the economic outlook, Management did not revise the economic component in 2010 due to limited signs of economic recovery and continued financial stress experienced by borrowers in our markets. The persistently high unemployment rate and restrained spending by consumers and businesses are expected to prevent rapid economic expansion and recovery of housing prices.
Table 11 shows the allocation of the allowance by loan type as well as the percentage of total loans in each of the same loan types.
|
Table 11
|
Allocation of Allowance for Loan Losses
|
|
December 31, 2010
|
December 31, 2009
|
December 31, 2008
|
December 31, 2007
|
December 31, 2006
|
||||||||||||||||||||||||||||||||||||
|
|
||||||||||||||||||||||||||||||||||||||||
|
|
||||||||||||||||||||||||||||||||||||||||
|
|
||||||||||||||||||||||||||||||||||||||||
|
(Dollars in thousands)
|
Allowance
balance |
Loans as
percent |
Allowance
balance |
Loans as
percent |
Allowance
balance |
Loans as
percent |
Allowance
balance |
Loans as
percent |
Allowance
balance |
Loans as
percent |
||||||||||||||||||||||||||||||
|
Commercial loans
|
$ | 3,114 | 16.3 | % | $ | 2,544 | 17.9 | % | $ | 2,306 | 16.5 | % | $ | 1,811 | 17.2 | % | $ | 1,710 | 16.3 | % | ||||||||||||||||||||
|
Real Estate
|
||||||||||||||||||||||||||||||||||||||||
|
Commercial
|
5,171 | 55.9 | 4,006 | 52.2 | 3,911 | 52.5 | 2,866 | 53.8 | 2,262 | 43.3 | ||||||||||||||||||||||||||||||
|
Construction
|
1,694 | 8.3 | 1,832 | 9.9 | 2,118 | 13.6 | 1,659 | 13.4 | 1,995 | 16.2 | ||||||||||||||||||||||||||||||
|
Home Equity
|
643 | 9.2 | 586 | 9.2 | 453 | 7.3 | 205 | 4.7 | 182 | 4.3 | ||||||||||||||||||||||||||||||
|
Other residential
|
738 | 7.4 | 734 | 7.6 | 588 | 6.2 | 426 | 6.1 | 271 | 3.9 | ||||||||||||||||||||||||||||||
|
Installment and other consumer
|
835 | 2.9 | 662 | 3.2 | 563 | 3.9 | 430 | 4.8 | 1,389 | 16.0 | ||||||||||||||||||||||||||||||
|
Unallocated allowance
|
197 | N/A | 254 | N/A | 11 | N/A | 178 | N/A | 214 | N/A | ||||||||||||||||||||||||||||||
|
Total allowance for loan losses
|
$ | 12,392 | $ | 10,618 | $ | 9,950 | $ | 7,575 | $ | 8,023 | ||||||||||||||||||||||||||||||
|
Total percent
|
100.00 | % | 100.00 | % | 100.00 | % | 100.00 | % | 100.00 | % | ||||||||||||||||||||||||||||||
The allowance for loan losses as a percentage of loans totaled 1.32% at December 31, 2010, compared to 1.16% at December 31, 2009. The increase in the allowance for loan losses as a percentage of loans reflects a higher level of non-performing loans and the related specific reserves.
Table 12 shows the activity in the allowance for loan losses for each of the years in the five-year period ended December 31, 2010. Net charge-offs totaled $3.6 million and $4.8 million in 2010 and 2009, respectively, primarily related to commercial and construction loans secured by real property where the value of collateral has declined, and to a lesser extent, personal loans and home equity loans. Our 2010 and 2009 construction loan losses have stemmed primarily from the land development and single-family residential construction projects in Oregon and Sonoma County, California, where property values have been affected more significantly than in our core market of Marin County. Net charge-offs in 2008 totaling $2.6 million primarily relate to construction loans secured by real property where the value of collateral declined. The percentage of net charge-offs to average loans decreased from 0.53% in 2009 to 0.38% in 2010, primarily due to a lower level of credit losses in the commercial portfolio.
Table 12 Allowance for Loan Losses at December 31
|
(Dollars in thousands)
|
2010
|
2009
|
2008
|
2007
|
2006
|
|||||||||||||||
|
Beginning balance
|
$ | 10,618 | $ | 9,950 | $ | 7,575 | $ | 8,023 | $ | 7,115 | ||||||||||
|
Cumulative-effect adjustment of election of fair value accounting on indirect auto portfolios 1
|
--- | --- | --- | (1,048 | ) | --- | ||||||||||||||
|
Provision for loan losses
|
5,350 | 5,510 | 5,010 | 685 | 1,266 | |||||||||||||||
|
Loans charged off
|
||||||||||||||||||||
|
Commercial
|
(643 | ) | (1,552 | ) | (1,100 | ) | --- | (172 | ) | |||||||||||
|
Real Estate
|
||||||||||||||||||||
|
Commercial
|
(47 | ) | (9 | ) | --- | --- | --- | |||||||||||||
|
Construction
|
(2,628 | ) | (3,046 | ) | (1,508 | ) | --- | --- | ||||||||||||
|
Home equity
|
(150 | ) | (96 | ) | --- | --- | --- | |||||||||||||
|
Installment and other consumer
|
(318 | ) | (659 | ) | (72 | ) | (115 | ) | (424 | ) | ||||||||||
|
Total
|
(3,786 | ) | (5,362 | ) | (2,680 | ) | (115 | ) | (596 | ) | ||||||||||
|
Loan loss recoveries
|
||||||||||||||||||||
|
Commercial
|
95 | 52 | 24 | --- | 35 | |||||||||||||||
|
Real Estate
|
||||||||||||||||||||
|
Construction
|
95 | 397 | --- | --- | --- | |||||||||||||||
|
Installment and other consumer
|
20 | 71 | 21 | 30 | 203 | |||||||||||||||
|
Total
|
210 | 520 | 45 | 30 | 238 | |||||||||||||||
|
Net loans charged off
|
(3,576 | ) | (4,842 | ) | (2,635 | ) | (85 | ) | (358 | ) | ||||||||||
|
Ending balance
|
$ | 12,392 | $ | 10,618 | $ | 9,950 | $ | 7,575 | $ | 8,023 | ||||||||||
|
Total loans outstanding at end of year, before deducting allowance for loan losses
|
$ | 941,400 | $ | 917,748 | $ | 890,544 | $ | 724,878 | $ | 719,778 | ||||||||||
|
Average total loans outstanding during year
|
$ | 929,755 | $ | 910,456 | $ | 798,369 | $ | 703,087 | $ | 701,732 | ||||||||||
|
Ratio of allowance for loan losses to total loans at end of year
|
1.32 | % | 1.16 | % | 1.12 | % | 1.05 | % | 1.11 | % | ||||||||||
|
Net charge-offs to average loans
|
0.38 | % | 0.53 | % | 0.33 | % | 0.01 | % | 0.05 | % | ||||||||||
|
Ratio of allowance for loan losses to net charge-offs
|
346.5 | % | 219.3 | % | 377.6 | % | 8,911.8 | % | 2,241.1 | % | ||||||||||
1 In conjunction with the election of accounting for the indirect auto loan portfolio at fair value in 2007, an unrealized loss of $3.5 million was recorded as a reduction of loans, and the allowance for loan losses was reduced by $1.0 million.
Non-performing assets for each of the past five years are presented below. The ratio of allowance for loan losses to non-accrual loans increased from 91.8% at December 31, 2009 to 95.9% at December 31, 2010. There were no accruing loans past due 90 days or more, nor other real estate owned at the end of the years presented.
|
Table 13
|
Non-performing Assets at December 31
|
|
(Dollars in thousands)
|
2010
|
2009
|
2008
|
2007
|
2006
|
|||||||||||||||
|
Non-performing loans:
|
||||||||||||||||||||
|
Construction
|
$ | 9,297 | $ | 6,520 | $ | 5,804 | $ | --- | $ | --- | ||||||||||
|
Commercial real estate
|
632 | 3,722 | --- | --- | --- | |||||||||||||||
|
Commercial
|
2,486 | 910 | 145 | --- | 49 | |||||||||||||||
|
Installment and other consumer
|
362 | 313 | 455 | --- | --- | |||||||||||||||
|
Home equity line of credit
|
- | 100 | 288 | 144 | --- | |||||||||||||||
|
Other residential
|
148 | --- | --- | --- | --- | |||||||||||||||
|
Total non-accrual loans
|
12,925 | 11,565 | 6,692 | 144 | 49 | |||||||||||||||
|
Repossessed personal properties
|
135 | 96 | --- | --- | --- | |||||||||||||||
|
Total non-performing assets
|
13,060 | 11,661 | 6,692 | 144 | 49 | |||||||||||||||
|
Accruing restructured loans:
|
||||||||||||||||||||
|
Installment and other consumer
|
925 | 566 | 119 | --- | --- | |||||||||||||||
|
Home Equity
|
259 | --- | --- | --- | --- | |||||||||||||||
|
Commercial
|
- | 49 | --- | --- | --- | |||||||||||||||
|
Total accruing restructured loans
|
1,184 | 615 | 119 | --- | --- | |||||||||||||||
|
Total impaired loans
|
14,109 | 12,180 | 6,811 | $ | 144 | $ | 49 | |||||||||||||
|
Allowance for loan losses to non-accrual loans at period end
|
95.9 | % | 91.8 | % | 148.7 | % | 5,260.4 | % |
NM
|
|||||||||||
|
Non-performing loans to total loans
|
1.37 | % | 1.26 | % | 0.75 | % | 0.02 | % | 0.01 | % | ||||||||||
Troubled debt restructured loans, whose contractual terms have been restructured in a manner which grants a concession to a borrower experiencing financial difficulties, totaled $1.2 million and $780 thousand as of December 31, 2010 and 2009, respectively.
Other Assets
As financial institutions continue to fail, the FDIC Deposit Insurance Fund is depleting rapidly. Therefore, in December 2009, the FDIC required banks to prepay their regular insurance premiums for 2010 through 2012. Other assets included $3.0 million and $4.4 million of prepaid FDIC assessments at December 31, 2010 and 2009, respectively. Each quarter for the next two years, the prepaid insurance asset balance will be reduced by the FDIC insurance expense that is applicable to that quarter.
BOLI totaled $18.3 million at December 31, 2010, compared to $17.6 million at December 30, 2009, and is recorded in other assets. Other assets also include net deferred tax assets of $6.6 million and $6.5 million at December 31, 2010 and 2009, respectively. These deferred tax assets consist primarily of tax benefits expected to be realized in future periods related to temporary differences of allowance for loan losses, depreciation, state tax, stock-based compensation and deferred compensation. Management believes these assets to be realizable due to our consistent record of earnings and the expectation that earnings will continue at a level adequate to realize such benefits.
In addition, we held $5.0 million and $4.7 million of FHLB stock recorded at cost in other assets at December 31, 2010 and 2009, respectively. The FHLB paid $16 thousand and $9 thousand in cash dividends in 2010 and 2009, respectively. On February 22, 2011, FHLB declared a cash dividend for the fourth quarter of 2010 at an annualized dividend rate of 0.29%. Management does not believe that FHLB stock is other-than-temporarily-impaired as we expect to be able to redeem the stock at cost.
Deposits
Deposits, which are used to fund our interest earning assets, increased $71.7 million, or 7.6%, in 2010. Failures in a large number of banks have led to increased customer concern over deposit safety. We believe that we have successfully attracted new deposits due to our financial soundness, our personalized customer service, and our focus on relationship-building and cross-selling. The economic downturn also appears to have impacted the general public’s investment behavior, as evidenced by a national trend of increasing household savings and movement away from higher-risk equity investments.
We have experienced a slight shift in the mix of interest-bearing deposits in 2010 compared to 2009. The proportion of money market deposit accounts has decreased while the proportion of time deposits and non-interest bearing deposits have increased slightly. We believe the shift in relative proportions is due to the low interest rate environment as time deposit accounts generally offer higher interest rates and due to customers seeking safety as CDARS® deposits are fully insured by the FDIC. No individual customer accounted for more than 5% of deposits.
Table 14 shows the relative composition of our average deposits for the years 2010, 2009 and 2008.
|
Table 14
|
Distribution of Average Deposits
|
|
Year ended December 31,
|
||||||||||||||||||||||||
|
2010
|
2009
|
2008
|
||||||||||||||||||||||
|
(Dollars in thousands)
|
Amount
|
Percent
|
Amount
|
Percent
|
Amount
|
Percent
|
||||||||||||||||||
|
Non-interest bearing
|
$ | 263,742 | 26.4 | % | $ | 232,502 | 25.6 | % | $ | 208,320 | 25.7 | % | ||||||||||||
|
Interest bearing
|
98,168 | 9.8 | 90,159 | 9.9 | 78,671 | 9.7 | ||||||||||||||||||
|
Savings
|
51,738 | 5.2 | 45,944 | 5.0 | 40,239 | 5.0 | ||||||||||||||||||
|
Money market
|
390,575 | 39.0 | 391,571 | 43.1 | 390,383 | 48.2 | ||||||||||||||||||
|
CDARS®
|
71,432 | 7.1 | 51,248 | 5.6 | 9,039 | 1.1 | ||||||||||||||||||
|
Other Time deposits
|
||||||||||||||||||||||||
|
Less than $100,000
|
43,069 | 4.3 | 36,350 | 4.0 | 39,496 | 4.9 | ||||||||||||||||||
|
$100,000 or more
|
81,562 | 8.2 | 61,574 | 6.8 | 44,239 | 5.4 | ||||||||||||||||||
|
Total other time deposits
|
124,631 | 12.5 | 97,924 | 10.8 | 83,735 | 10.3 | ||||||||||||||||||
|
Total Average Deposits
|
$ | 1,000,286 | 100.00 | % | $ | 909,348 | 100.00 | % | $ | 810,387 | 100.0 | % | ||||||||||||
Table 15 below shows the maturity groupings for time deposits of $100,000 or more, including CDARS® deposits at December 31, 2010, 2009 and 2008.
|
Table 15
|
Maturities of Time Deposits of $100,000 or more at December 31
|
|
December 31,
|
||||||||||||
|
(Dollars in thousands)
|
2010
|
2009
|
2008
|
|||||||||
|
Three months or less
|
$ | 77,173 | $ | 56,456 | $ | 27,985 | ||||||
|
Over three months through six months
|
24,135 | 19,446 | 7,462 | |||||||||
|
Over six months through twelve months
|
35,713 | 30,458 | 15,907 | |||||||||
|
Over twelve months
|
18,699 | 5,830 | 4,105 | |||||||||
|
Total
|
$ | 155,720 | $ | 112,190 | $ | 55,459 | ||||||
Borrowings
We currently have $219.2 million in secured lines of credit with FHLB, $40.2 million with Federal Reserve Bank of San Francisco (“FRB”) and $77.0 million in unsecured lines with correspondent banks to cover any short or long-term borrowing needs. As of December 31, 2010, we had three FHLB fixed-rate advances outstanding totaling $55 million, leaving $164.2 million available borrowing capacity with FHLB. The FRB and correspondent bank lines were unutilized at December 31, 2010. For additional information, see Note 8 to the Consolidated Financial Statements in Item 8 of this Form 10-K.
Deferred Compensation Obligations
We maintain a nonqualified, unfunded deferred compensation plan for certain key management personnel. Under this plan, participating employees may defer compensation, which will entitle them to receive certain payments upon retirement, death, or disability. The plan provides for payments for up to fifteen years commencing upon retirement and reduced benefits upon early retirement, disability, or termination of employment. The participating employee may elect to receive payments over periods not to exceed fifteen years. At December 31, 2010 and 2009, our aggregate payment obligations under this plan totaled $2.8 million and $2.7 million, respectively. For additional information, see Note 11 to the Consolidated Financial Statements in Item 8 below.
Off Balance Sheet Arrangements
We make commitments to extend credit in the normal course of business to meet the financing needs of our customers. For additional information, see Note 17 to the Consolidated Financial Statements in Item 8 below.
Commitments
The following is a summary of our contractual commitments as of December 31, 2010.
|
Table 16
|
Contractual Commitments at December 31, 2010
|
|
Payments due by period
|
||||||||||||||||||||
|
(Dollars in thousands)
|
<1 year
|
1-3 years
|
4-5 years
|
>5 years
|
Total
|
|||||||||||||||
|
Operating leases
|
$ | 2,440 | $ | 4,873 | $ | 4,704 | $ | 15,492 | $ | 27,509 | ||||||||||
|
Federal Home Loan Bank Borrowings
|
15,000 | 40,000 | --- | --- | 55,000 | |||||||||||||||
|
Subordinated debenture
|
--- | --- | --- | 5,000 | 5,000 | |||||||||||||||
|
Total
|
$ | 17,440 | $ | 44,873 | $ | 4,704 | $ | 20,492 | $ | 87,509 | ||||||||||
The contractual amount of loan commitments not reflected on the Consolidated Statement of Condition was $252.7 million and $231.9 million at December 31, 2010 and 2009, respectively.
As permitted or required under California law and to the maximum extent allowable under that law, we have certain obligations to indemnify our current and former officers and directors for certain events or occurrences while the officer or director is, or was serving, at our request in such capacity. These indemnification obligations are valid as long as the director or officer acted in good faith and in a manner the person reasonably believed to be in, or not opposed to, our best interests, and with respect to any criminal action or proceeding, had no reasonable cause to believe his or her conduct was unlawful. The maximum potential amount of future payments we could be required to make under these indemnification obligations is unlimited; however, we have a director and officer insurance policy that mitigates our exposure and enables us to recover a portion of any future amounts paid. We believe the estimated fair value of these indemnification obligations, net of expected insurance recoveries, is minimal.
Capital Adequacy
As discussed in Note 16 to the Consolidated Financial Statements, the Bank’s capital ratios are above regulatory guidelines to be considered "well capitalized" and Bancorp’s ratios exceed the required minimum ratios for capital adequacy purposes. The Bank’s total risk-based capital ratio increased from 11.60% at December 31, 2009, to 12.70% at December 31, 2010, and Bancorp’s total risk-based capital ratio increased from 12.33% at December 31, 2009, to 13.34% at December 31, 2010. The increases in the risk-based capital ratio are primarily due to the accumulation of net income in 2010 of $13.6 million.
We expect to maintain strong capital levels. Our potential sources of capital include future earnings and shares issued upon the exercise of stock options. In addition, the warrant issued under the TCPP to purchase 154,521 shares of our common stock remains outstanding. The warrant, if exercised, would provide us with $4.2 million additional Tier 1 capital. We are also positioned to access capital markets, if necessary, for up to $75 million through a shelf registration filed on Form S-3 in the fourth quarter of 2009.
Liquidity
The goal of liquidity management is to provide adequate funds to meet both loan demand and unexpected deposit withdrawals. We accomplish this goal by maintaining an appropriate level of liquid assets, and formal lines of credit with the FHLB, FRB and correspondent banks that enable us to borrow funds as needed. Our Asset/Liability Management Committee (“ALCO”), which is comprised of certain directors of the Bank, is responsible for establishing and monitoring our liquidity targets and strategies.
Management regularly adjusts our investments in liquid assets based upon our assessment of expected loan demand, expected deposit flows, yields available on interest-earning securities and the objectives of our asset/liability management program. ALCO has also developed a contingency plan should liquidity drop unexpectedly below internal requirements.
We obtain funds from the repayment and maturity of loans as well as deposit inflows, investment security maturities and paydowns, Federal funds purchased FHLB advances, and other borrowings. Our primary uses of funds are the origination of loans, the purchase of investment securities, withdrawals of deposits, maturity of certificate of deposits, repayment of borrowings and dividends to stockholders.
We must retain and attract new deposits, which depends upon the variety and effectiveness of our customer account products, service and convenience, and rates paid to customers, as well as our financial strength. Any long-term decline in retail deposit funding would adversely impact our liquidity. Management does not anticipate significant reliance on Federal funds purchased and FHLB advances in the near future, as our core deposit inflow has provided adequate liquidity to fund our operations. If we were to rely on Federal Funds purchased or FHLB advances in the future, we expect to have the ability to post adequate collateral for such funding requirements.
As presented in the accompanying consolidated statements of cash flows, the sources of liquidity vary between periods. Consolidated cash and cash equivalents at December 31, 2010 totaled $85.2 million, an increase of $46.6 million over December 31, 2009. The primary sources of funds during 2010 included a $71.7 million net increase in deposits, $37.9 million in pay-downs and maturities of investment securities, and $23.5 million net cash provided by operating activities. The primary uses of funds were $56.0 million for investment securities purchases, and $26.9 million in loan originations (net of principal collections). The excess liquidity from deposit inflows has not been deployed. The banking industry, as a whole, is experiencing diminished loan demand from qualified borrowers.
At December 31, 2010, our cash and cash equivalents and unpledged available-for-sale securities maturing within one year totaled $91.1 million. The remainder of the unpledged available-for-sale securities portfolio of $91.4 million provides additional liquidity. These liquid assets equaled 15.1% of our assets at December 31, 2010, compared to 11.9% at December 31, 2009, well in excess of our internal liquidity policy. The increased liquidity at December 31, 2010 was primarily due to deposit growth exceeding loan growth.
We anticipate that cash and cash equivalents on hand and other sources of funds will provide adequate liquidity for our operating, investing and financing needs and our regulatory liquidity requirements for the foreseeable future. Management monitors our liquidity position daily, balancing loan funding/payments with changes in deposit activity and overnight investments. Our emphasis on local deposits combined with our 10.1% equity to assets ratio, provides a very stable funding base. In addition to cash and cash equivalents, we have substantial additional borrowing capacity including unsecured lines of credit totaling $77.0 million with correspondent banks. Further, on March 30, 2009, we pledged a certain residential loan portfolio that increased our borrowing capacity with the FRB, which totaled $40.2 million at December 31, 2010. As of December 31, 2010, there is no debt outstanding to correspondent banks or the FRB. We are also a member of the FHLB and have a line of credit (secured under terms of a blanket collateral agreement by a pledge of essentially all of our financial assets) in the amount of $219.2 million, of which $164.2 million was available at December 31, 2010. Borrowings under the line are limited to eligible collateral. The interest rates on overnight borrowings with both correspondent banks and the FHLB are determined daily and generally approximate the Federal Funds target rate.
Undisbursed loan commitments, which are not reflected on the consolidated statement of condition, totaled $252.7 million at December 31, 2010 at rates ranging from 1.91% to 8.25%. This amount included $143.8 million under commercial lines of credit (these commitments are contingent upon customers maintaining specific credit standards), $73.5 million under revolving home equity lines, $22.7 million under undisbursed construction loans, $8.9 million under personal and other lines of credit, and a remaining $3.8 million under standby letters of credit. These commitments, to the extent used, are expected to be funded primarily through the repayment of existing loans, deposit growth and existing balance sheet liquidity. Over the next twelve months $173.8 million of time deposits will mature. We expect these funds to be replaced with new time or savings accounts.
Since Bancorp is a holding company and does not conduct regular banking operations, its primary sources of liquidity are dividends from the Bank. Under the California Financial Code, payment of a dividend from the Bank to Bancorp is restricted to the lesser of the Bank’s retained earnings or the amount of the Bank’s undistributed net profits from the previous three fiscal years. As the Bank made a $28 million distribution to Bancorp in March 2009 in connection with Bancorp’s repurchase of preferred stock, distributions from the Bank to Bancorp will be subject to advance regulatory approval for three years beginning in 2010. The primary uses of funds for Bancorp are stockholder dividends and ordinary operating expenses. In 2010, after approval by the DFI, the Bank paid a $3 million dividend to Bancorp, which held $6.7 million of cash at December 31, 2010 to cover Bancorp’s operational needs and cash dividends to shareholders for the near future. Management anticipates that there will be sufficient earnings at the Bank level to provide dividends to Bancorp to meet its funding requirements for the foreseeable future.
|
QUANTITATIVE AND QUALITATIVE DISCLOSURES ABOUT MARKET RISK
|
Our most significant form of market risk is interest rate risk. The risk is inherent in our deposit and lending activities. Management, together with ALCO, has sought to manage rate sensitivity and maturities of assets and liabilities to minimize the exposure of our earnings and capital to changes in interest rates. Additionally, interest rate risk exposure is managed with the goal of minimizing the impact of interest rate volatility on our net interest margin. Interest rate changes can create fluctuations in the net interest margin due to an imbalance in the timing of repricing or maturity of assets or liabilities. Interest rate risk exposure is managed with the goal of minimizing the impact of interest rate volatility on the net interest margin.
Activities in asset and liability management include, but are not limited to, lending, borrowing, accepting deposits and investing in securities. Interest rate risk is the primary market risk associated with asset and liability management. Sensitivity of net interest income (“NII”) to interest rate changes results from differences in the maturity or repricing, of asset and liability portfolios. To mitigate interest rate risk, the structure of our assets and liabilities is managed with the objective of correlating the movements of interest rates on loans and investments with those of deposits and borrowings. The asset and liability policy sets limits on the acceptable amount of change to NII in changing interest rate environments. We use simulation models to forecast NII.
Exposure to interest rate risk is reviewed at least quarterly by the ALCO and the Board of Directors. They utilize interest rate sensitivity simulation models as a tool for achieving these objectives and for developing ways in which to improve profitability. A simplified statement of condition is prepared on a quarterly basis as a starting point, using as inputs, actual loans, investments, borrowings and deposits. If potential changes to net equity value and net interest income resulting from hypothetical interest changes are not within the limits established by the Board of Directors, Management may adjust the asset and liability mix to bring interest rate risk within approved limits.
In the following simulation of NII under various interest rate scenarios, the simplified statement of condition is processed against four interest rate change scenarios, in 100 basis point increments. As the Federal funds target rate at December 31, 2010 was already at its historic low of 0-0.25%, it is unlikely that there will be further reductions in the target rate. Therefore, a reduction-in-rate scenario is not considered in the following table at December 31, 2010. Each of these scenarios assumes that the change in interest rates is immediate and interest rates remain at the new levels.
Table 17 summarizes the effect on NII due to changing interest rates as measured against the flat rate scenario.
|
Table 17
|
Effect of Interest Rate Change on Net Interest Income at December 31, 2010
|
|
Changes in Interest
|
Estimated change in NII
|
|
Rates (in basis points)
|
(as percent of NII)
|
|
up 400
|
4.5%
|
|
up 300
|
2.4%
|
|
up 200
|
0.6%
|
|
up 100
|
(0.2)%
|
The above table estimates the impact of interest rate changes. The estimated changes are within our policy guidelines established by ALCO. The table indicates that at December 31, 2010, we were asset sensitive in a rising interest rate environment. The results shown reflect a lag in the upward re-pricing of loans due to loans on floors. We have mitigated earnings sensitivity somewhat through the procurement of fixed-rate borrowings.
As stated previously in the section captioned “Supervision and Regulation” included in Item 1 Business of this report, the Dodd-Frank Act repealed the federal prohibitions on the payment of interest on demand deposits, thereby permitting depository institutions to pay interest on business transaction and other accounts beginning July 21, 2011. Although the ultimate impact of this legislation on us has not yet been determined, we do not expect to incur significant interest expense on business transaction accounts immediately when the legislation takes effect in July 2011. If we were to pay interest on certain deposits that are currently non-interest bearing, causing these deposits to become rate sensitive, we would become less asset sensitive than the model currently indicates.
From time to time, we enter into certain interest rate swap contracts designated as fair value hedges to mitigate the changes in the fair value of specified long-term fixed-rate loans and firm commitments to enter into long-term fixed-rate loans caused by changes in interest rates. See Note 15 to the consolidated financial statements in this Form 10-K.
As with any simulation model or other method of measuring interest rate risk, certain limitations are inherent in the process. For example, although certain of our assets and liabilities may have similar maturities or repricing time frames, they may react differently to changes in market interest rates. In addition, the changes in interest rates on certain categories of either our assets or liabilities may precede or lag changes in market interest rates.
Also, the actual rates and timing of prepayments on loans and investment securities could vary significantly from the assumptions used in the various scenarios. Further, changes in U.S. Treasury rates accompanied by a change in the shape of the yield curve could produce different results from those presented in the table. Accordingly, the results presented should not be relied upon as indicative of actual results in the event of changing market interest rates.
Interest rate sensitivity is a function of the repricing characteristics of our assets and liabilities. One aspect is the time frame within which the interest earning assets and interest bearing liabilities are subject to change in interest rates at repricing or maturity. An analysis of the repricing time frames is called a "gap" analysis because it shows the gap between the amounts of assets and liabilities repricing in each of several periods of time. Another aspect is the relative magnitude of the repricing for each category of interest earning asset and interest bearing liability given various changes in market rates. Gap analysis gives no indication of the relative magnitude of repricing. Interest rate sensitivity management focuses on the maturity of assets and liabilities and their repricing during periods of change in market rates. Interest rate sensitivity gaps are calculated as the difference between the amounts of assets and liabilities that are subject to repricing during various time periods.
Table 18 shows our repricing gaps as of December 31, 2010. Due to the limitations of gap analysis, as described above, we do not generally use it in managing interest rate risk. Instead we rely on the more sophisticated simulation model described above as the primary tool in measuring and managing interest rate risk. Our equity securities (Visa Stock) with a fair value of $608 thousand are excluded from the investment securities in the following table.
|
Table 18
|
Interest Rate Sensitivity
|
| 1-30 | 31-90 | 91-180 | 181-365 |
Over
|
||||||||||||||||||||
|
(Dollars in thousands)
|
Days
|
Days
|
Days
|
Days
|
one year
|
Total
|
||||||||||||||||||
|
At December 31, 2010
|
||||||||||||||||||||||||
|
Interest Earning Assets
|
||||||||||||||||||||||||
|
Investment securities 1
|
$ | --- | $ | --- | $ | --- | $ | 7,351 | $ | 138,694 | $ | 146,045 | ||||||||||||
|
Loans
|
142,340 | 20,942 | 49,614 | 43,762 | 684,742 | 941,400 | ||||||||||||||||||
|
Total
|
142,340 | 20,942 | 49,614 | 51,113 | 823,436 | 1,087,445 | ||||||||||||||||||
|
Interest Bearing Liabilities
|
||||||||||||||||||||||||
|
Transaction, savings and money market deposits
|
533,289 | --- | --- | --- | --- | 533,289 | ||||||||||||||||||
|
CDARS® time deposits
|
15,989 | 35,902 | 5,103 | 10,017 | 250 | 67,261 | ||||||||||||||||||
|
Other time deposits less than $100,000
|
4,937 | 7,560 | 9,200 | 12,129 | 7,966 | 41,792 | ||||||||||||||||||
|
Other time deposits $100,000 or more
|
9,920 | 17,540 | 19,351 | 24,738 | 19,653 | 91,202 | ||||||||||||||||||
|
Federal Home Loan Bank borrowings
|
--- | --- | --- | --- | 55,000 | 55,000 | ||||||||||||||||||
|
Subordinated debenture
|
--- | 5,000 | --- | --- | --- | 5,000 | ||||||||||||||||||
|
Total
|
564,135 | 66,002 | 33,654 | 46,884 | 82,869 | 793,544 | ||||||||||||||||||
|
Sensitivity for period
|
(421,795 | ) | (45,060 | ) | 15,960 | 4,229 | 740,567 | 293,901 | ||||||||||||||||
|
Sensitivity - cumulative
|
$ | (421,795 | ) | $ | (466,855 | ) | $ | (445,895 | ) | $ | (441,666 | ) | $ | 293,901 | ||||||||||
1 Based on estimated maturities due to prepayment options.
|
FINANCIAL STATEMENTS AND SUPPLEMENTARY DATA
|
Report of Independent Registered Public Accounting Firm
The Board of Directors and Stockholders
Bank of Marin Bancorp
We have audited the accompanying consolidated statements of condition of Bank of Marin Bancorp and subsidiary (the “Company”) as of December 31, 2010 and 2009, and the related consolidated statements of income, changes in stockholders’ equity, and cash flows for each of the three years in the period ended December 31, 2010. We also have audited the Company’s internal control over financial reporting as of December 31, 2010, based on criteria established in Internal Control - Integrated Framework issued by the Committee of Sponsoring Organizations of the Treadway Commission. The Company’s management is responsible for these consolidated financial statements, for maintaining effective internal control over financial reporting, and for its assessment of the effectiveness of internal control over financial reporting, included in the accompanying Management’s Report on Internal Control over Financial Reporting and Compliance with Applicable Laws and Regulations. Our responsibility is to express an opinion on these consolidated financial statements and an opinion on the Company’s internal control over financial reporting based on our audits.
We conducted our audits in accordance with the standards of the Public Company Accounting Oversight Board (United States). Those standards require that we plan and perform the audits to obtain reasonable assurance about whether the consolidated financial statements are free of material misstatement and whether effective internal control over financial reporting was maintained in all material respects. Our audits of the consolidated financial statements included examining, on a test basis, evidence supporting the amounts and disclosures in the consolidated financial statements, assessing the accounting principles used and significant estimates made by management, and evaluating the overall consolidated financial statement presentation. Our audit of internal control over financial reporting included obtaining an understanding of internal control over financial reporting, assessing the risk that a material weakness exists, and testing and evaluating the design and operating effectiveness of internal control based on the assessed risk. Our audits also included performing such other procedures as we considered necessary in the circumstances. We believe that our audits provide a reasonable basis for our opinions.
A company’s internal control over financial reporting is a process designed to provide reasonable assurance regarding the reliability of financial reporting and the preparation of financial statements for external purposes in accordance with generally accepted accounting principles. A company’s internal control over financial reporting includes those policies and procedures that (1) pertain to the maintenance of records that, in reasonable detail, accurately and fairly reflect the transactions and dispositions of the assets of the company; (2) provide reasonable assurance that transactions are recorded as necessary to permit preparation of financial statements in accordance with generally accepted accounting principles, and that receipts and expenditures of the company are being made only in accordance with authorizations of management and directors of the company; and (3) provide reasonable assurance regarding prevention or timely detection of unauthorized acquisition, use, or disposition of the company’s assets that could have a material effect on the financial statements.
Because of its inherent limitations, internal control over financial reporting may not prevent or detect misstatements. Also, projections of any evaluation of effectiveness to future periods are subject to the risk that controls may become inadequate because of changes in conditions, or that the degree of compliance with the policies or procedures may deteriorate.
In our opinion, the consolidated financial statements referred to above present fairly, in all material respects, the consolidated financial position of Bank of Marin Bancorp and subsidiary as of December 31, 2010 and 2009, and the consolidated results of their operations and their cash flows each of the three years in the period ended December 31, 2010, in conformity with generally accepted accounting principles in the United States of America. Also in our opinion, Bank of Marin Bancorp maintained, in all material respects, effective internal control over financial reporting as of December 31, 2010, based on criteria established in Internal Control - Integrated Framework issued by the Committee of Sponsoring Organizations of the Treadway Commission.
/s/ Moss Adams LLP
Stockton, California
March 11, 2011
504 Redwood Blvd, Suite 100
Novato, CA 94947
March 11, 2011
To the Stockholders:
Management’s Report on Internal Control over Financial Reporting and Compliance with Applicable Laws and Regulations
Management of the Bank of Marin Bancorp and its subsidiary (”Bancorp”) is responsible for preparing the Bancorp’s annual consolidated financial statements in accordance with generally accepted accounting principles. Management is also responsible for establishing and maintaining internal control over financial reporting, including controls over the preparation of regulatory financial statements, and for complying with the designated safety and soundness laws and regulations pertaining to insider loans and dividend restrictions. Bancorp’s internal control contains monitoring mechanisms, and actions are taken to correct deficiencies identified.
There are inherent limitations in the effectiveness of any internal control, including the possibility of human error and the circumvention or overriding of controls. Accordingly, even effective internal control can provide only reasonable assurance with respect to financial statement preparation. Further, because of changes in conditions, the effectiveness of internal control may vary over time.
Management has assessed Bancorp’s internal control over financial reporting encompassing both financial statements prepared in accordance with generally accepted accounting principles and those prepared for regulatory reporting purposes as of December 31, 2010. The assessment was based on criteria for effective internal control over financial reporting described in Internal Control – Integrated Framework issued by the Committee of Sponsoring Organizations of the Treadway Commission. Based on this assessment, Management believes that, as of December 31, 2010, Bancorp maintained effective internal control over financial reporting encompassing both financial statements prepared in accordance with generally accepted accounting principles and those prepared for regulatory reporting purposes in all material respects. Management also believes that Bancorp complied with the designated safety and soundness laws and regulations pertaining to insider loans and dividend restrictions during 2010.
Management’s assessment of the effectiveness of Bancorp’s internal control over financial reporting as of December 31, 2010 has been audited by Moss Adams LLP, an independent registered public accounting firm, which expresses an unqualified opinion as stated in their report which appears on the previous page.
|
/s/ Russell A. Colombo
|
|
|
Russell A. Colombo, President and Chief Executive Officer
|
|
|
/s/ Christina J. Cook
|
|
|
Christina J. Cook, EVP and Chief Financial Officer
|
|
CONSOLIDATED STATEMENTS OF CONDITION
|
|
at December 31, 2010 and 2009
|
|
(in thousands, except share data)
|
December 31, 2010
|
December 31, 2009
|
||||||
|
Assets
|
||||||||
|
Cash and due from banks
|
$ | 65,724 | $ | 23,660 | ||||
|
Short-term investments
|
19,508 | 15,000 | ||||||
|
Cash and cash equivalents
|
85,232 | 38,660 | ||||||
|
Investment securities
|
||||||||
|
Held to maturity, at amortized cost
|
34,917 | 30,396 | ||||||
|
Available for sale (at fair value, amortized cost $109,070 and $96,752 at December 31, 2010 and 2009, respectively)
|
111,736 | 97,818 | ||||||
|
Total investment securities
|
146,653 | 128,214 | ||||||
|
Loans, net of allowance for loan losses of $12,392 and $10,618 at December 31, 2010 and 2009, respectively
|
929,008 | 907,130 | ||||||
|
Bank premises and equipment, net
|
8,419 | 8,043 | ||||||
|
Interest receivable and other assets
|
38,838 | 39,625 | ||||||
|
Total assets
|
$ | 1,208,150 | $ | 1,121,672 | ||||
|
Liabilities and Stockholders' Equity
|
||||||||
|
Liabilities
|
||||||||
|
Deposits
|
||||||||
|
Non-interest bearing
|
$ | 282,195 | $ | 230,551 | ||||
|
Interest bearing
|
||||||||
|
Transaction accounts
|
105,177 | 89,660 | ||||||
|
Savings accounts
|
56,760 | 47,871 | ||||||
|
Money market accounts
|
371,352 | 416,481 | ||||||
|
CDARS® time accounts
|
67,261 | 51,819 | ||||||
|
Other time accounts
|
132,994 | 107,679 | ||||||
|
Total deposits
|
1,015,739 | 944,061 | ||||||
|
Federal Home Loan Bank borrowings
|
55,000 | 55,000 | ||||||
|
Subordinated debenture
|
5,000 | 5,000 | ||||||
|
Interest payable and other liabilities
|
10,491 | 8,560 | ||||||
|
Total liabilities
|
1,086,230 | 1,012,621 | ||||||
|
Stockholders' Equity
|
||||||||
|
Preferred stock, no par value, $1,000 per share liquidation preference
|
||||||||
|
Authorized - 5,000,000 shares; none issued
|
--- | --- | ||||||
|
Common stock, no par value
|
||||||||
|
Authorized - 15,000,000 shares
|
||||||||
|
Issued and outstanding - 5,290,082 shares and 5,229,529 shares at December 31, 2010 and 2009, respectively
|
55,383 | 53,789 | ||||||
|
Retained earnings
|
64,991 | 54,644 | ||||||
|
Accumulated other comprehensive income, net
|
1,546 | 618 | ||||||
|
Total stockholders' equity
|
121,920 | 109,051 | ||||||
|
Total liabilities and stockholders' equity
|
$ | 1,208,150 | $ | 1,121,672 | ||||
The accompanying notes are an integral part of these consolidated financial statements.
|
CONSOLIDATED STATEMENTS OF INCOME
|
|
for the fiscal years ended December 31, 2010, 2009 and 2008
|
|
Years ended
|
||||||||||||
|
(in thousands, except per share data)
|
December 31, 2010
|
December 31, 2009
|
December 31, 2008
|
|||||||||
|
Interest income
|
||||||||||||
|
Interest and fees on loans
|
$ | 56,239 | $ | 54,816 | $ | 54,475 | ||||||
|
Interest on investment securities
|
||||||||||||
|
Securities of U.S. Government agencies
|
3,234 | 3,304 | 3,555 | |||||||||
|
Obligations of state and political subdivisions
|
1,146 | 1,103 | 735 | |||||||||
|
Corporate debt securities and other
|
593 | 506 | 273 | |||||||||
|
Interest on Federal funds sold and short-term investments
|
145 | 5 | 138 | |||||||||
|
Total interest income
|
61,357 | 59,734 | 59,176 | |||||||||
|
Interest expense
|
||||||||||||
|
Interest on interest bearing transaction accounts
|
110 | 115 | 344 | |||||||||
|
Interest on savings accounts
|
104 | 94 | 300 | |||||||||
|
Interest on money market accounts
|
2,467 | 3,235 | 6,610 | |||||||||
|
Interest on CDARS® time accounts
|
842 | 721 | 200 | |||||||||
|
Interest on other time accounts
|
1,495 | 1,541 | 2,466 | |||||||||
|
Interest on borrowed funds
|
1,430 | 1,461 | 897 | |||||||||
|
Total interest expense
|
6,448 | 7,167 | 10,817 | |||||||||
|
Net interest income
|
54,909 | 52,567 | 48,359 | |||||||||
|
Provision for loan losses
|
5,350 | 5,510 | 5,010 | |||||||||
|
Net interest income after provision for loan losses
|
49,559 | 47,057 | 43,349 | |||||||||
|
Non-interest income
|
||||||||||||
|
Service charges on deposit accounts
|
1,797 | 1,782 | 1,654 | |||||||||
|
Wealth Management and Trust Services
|
1,521 | 1,383 | 1,292 | |||||||||
|
Net gain on redemption of shares in Visa, Inc.
|
--- | --- | 457 | |||||||||
|
Other income
|
2,203 | 2,017 | 1,953 | |||||||||
|
Total non-interest income
|
5,521 | 5,182 | 5,356 | |||||||||
|
Non-interest expense
|
||||||||||||
|
Salaries and related benefits
|
18,240 | 17,001 | 16,097 | |||||||||
|
Occupancy and equipment
|
3,576 | 3,516 | 3,202 | |||||||||
|
Depreciation and amortization
|
1,344 | 1,370 | 1,340 | |||||||||
|
FDIC insurance
|
1,506 | 1,800 | 507 | |||||||||
|
Professional services
|
1,917 | 1,727 | 1,600 | |||||||||
|
Data processing
|
1,916 | 1,650 | 1,825 | |||||||||
|
Other expense
|
4,858 | 4,632 | 4,106 | |||||||||
|
Total non-interest expense
|
33,357 | 31,696 | 28,677 | |||||||||
|
Income before provision for income taxes
|
21,723 | 20,543 | 20,028 | |||||||||
|
Provision for income taxes
|
8,171 | 7,778 | 7,878 | |||||||||
|
Net income
|
$ | 13,552 | $ | 12,765 | $ | 12,150 | ||||||
|
Preferred stock dividends and accretion
|
--- | $ | (1,299 | ) | $ | (113 | ) | |||||
|
Net income available to common stockholders
|
$ | 13,552 | $ | 11,466 | $ | 12,037 | ||||||
|
Net income per common share:
|
||||||||||||
|
Basic
|
$ | 2.59 | $ | 2.21 | $ | 2.34 | ||||||
|
Diluted
|
$ | 2.55 | $ | 2.19 | $ | 2.31 | ||||||
|
Weighted average shares used to compute net income per common share:
|
||||||||||||
|
Basic
|
5,238 | 5,182 | 5,135 | |||||||||
|
Diluted
|
5,314 | 5,242 | 5,217 | |||||||||
|
Dividends declared per common share
|
$ | 0.61 | $ | 0.57 | $ | 0.56 | ||||||
The accompanying notes are an integral part of these consolidated financial statements.
|
CONSOLIDATED STATEMENTS OF CHANGES IN STOCKHOLDERS' EQUITY
|
|
for the fiscal years ended December 31, 20010, 2009 and 2008
|
| Preferred |
Common Stock
|
Retained
|
Accumulated Other
Comprehensive Income (Loss),
|
|||||||||||||||||||||
|
(dollars in thousands)
|
Stock
|
Shares
|
Amount
|
Earnings
|
Net of Taxes
|
Total
|
||||||||||||||||||
|
Balance at December 31, 2007
|
--- | 5,122,971 | 51,059 | 36,983 | (268 | ) | 87,774 | |||||||||||||||||
|
Comprehensive income:
|
||||||||||||||||||||||||
|
Net income
|
--- | --- | --- | 12,150 | --- | 12,150 | ||||||||||||||||||
|
Other comprehensive income
|
||||||||||||||||||||||||
|
Net change in unrealized gain (loss) on available for sale securities (net of tax effect of $475)
|
--- | --- | --- | --- | 656 | 656 | ||||||||||||||||||
|
Comprehensive income
|
--- | --- | --- | 12,150 | 656 | 12,806 | ||||||||||||||||||
|
Issuance of preferred stock
|
27,039 | --- | --- | --- | --- | 27,039 | ||||||||||||||||||
|
Issuance of common stock warrants
|
--- | --- | 961 | --- | --- | 961 | ||||||||||||||||||
|
Stock options exercised
|
--- | 95,298 | 1,384 | --- | --- | 1,384 | ||||||||||||||||||
|
Excess tax benefit - stock-based compensation
|
--- | --- | 380 | --- | --- | 380 | ||||||||||||||||||
|
Stock repurchased, including commission costs
|
--- | (88,316 | ) | (2,526 | ) | --- | --- | (2,526 | ) | |||||||||||||||
|
Stock issued under employee stock purchase plan
|
--- | 1,253 | 32 | --- | --- | 32 | ||||||||||||||||||
|
Stock-based compensation - stock options
|
--- | --- | 404 | --- | --- | 404 | ||||||||||||||||||
|
Restricted stock granted
|
--- | 6,700 | --- | --- | --- | --- | ||||||||||||||||||
|
Stock-based compensation - restricted stock
|
--- | --- | 24 | --- | --- | 24 | ||||||||||||||||||
|
Cash dividends paid on common stock
|
--- | --- | --- | (2,882 | ) | --- | (2,882 | ) | ||||||||||||||||
|
Dividends on preferred stock
|
--- | --- | --- | (97 | ) | --- | (97 | ) | ||||||||||||||||
|
Accretion of preferred stock
|
16 | --- | --- | (16 | ) | --- | --- | |||||||||||||||||
|
Stock issued in payment of director fees
|
--- | 8,892 | 247 | --- | --- | 247 | ||||||||||||||||||
|
Balance at December 31, 2008
|
27,055 | 5,146,798 | 51,965 | 46,138 | 388 | 125,546 | ||||||||||||||||||
|
Net income
|
--- | --- | --- | 12,765 | --- | 12,765 | ||||||||||||||||||
|
Other comprehensive income
|
||||||||||||||||||||||||
|
Net change in unrealized gain on available for sale securities (net of tax effect of $168)
|
--- | --- | --- | --- | 230 | 230 | ||||||||||||||||||
|
Comprehensive income
|
--- | --- | --- | 12,765 | 230 | 12,995 | ||||||||||||||||||
|
Accretion of preferred stock
|
945 | --- | --- | (945 | ) | --- | --- | |||||||||||||||||
|
Repurchase of preferred stock
|
(28,000 | ) | --- | --- | --- | --- | (28,000 | ) | ||||||||||||||||
|
Stock options exercised
|
--- | 61,175 | 873 | --- | --- | 873 | ||||||||||||||||||
|
Excess tax benefit - stock-based compensation
|
--- | --- | 291 | --- | --- | 291 | ||||||||||||||||||
|
Stock issued under employee stock purchase plan
|
--- | 894 | 24 | --- | --- | 24 | ||||||||||||||||||
|
Restricted stock granted
|
--- | 11,575 | --- | --- | --- | --- | ||||||||||||||||||
|
Stock-based compensation - stock options
|
--- | --- | 330 | --- | --- | 330 | ||||||||||||||||||
|
Stock-based compensation - restricted stock
|
--- | --- | 73 | --- | --- | 73 | ||||||||||||||||||
|
Cash dividends paid on common stock
|
--- | --- | --- | (2,960 | ) | --- | (2,960 | ) | ||||||||||||||||
|
Dividends on preferred stock
|
--- | --- | --- | (354 | ) | --- | (354 | ) | ||||||||||||||||
|
Stock issued in payment of director fees
|
--- | 9,087 | 233 | --- | --- | 233 | ||||||||||||||||||
|
Balance at December 31, 2009
|
--- | 5,229,529 | $ | 53,789 | $ | 54,644 | $ | 618 | $ | 109,051 | ||||||||||||||
|
Net income
|
--- | --- | --- | 13,552 | --- | 13,552 | ||||||||||||||||||
|
Other comprehensive income
|
||||||||||||||||||||||||
|
Net change in unrealized gain on available for sale securities (net of tax effect of $672)
|
--- | --- | --- | --- | 928 | 928 | ||||||||||||||||||
|
Comprehensive income
|
--- | --- | --- | 13,552 | 928 | 14,480 | ||||||||||||||||||
|
Stock options exercised
|
--- | 49,940 | 895 | --- | --- | 895 | ||||||||||||||||||
|
Excess tax benefit - stock-based compensation
|
--- | --- | 132 | --- | --- | 132 | ||||||||||||||||||
|
Stock issued under employee stock purchase plan
|
--- | 563 | 17 | --- | --- | 17 | ||||||||||||||||||
|
Restricted stock granted
|
--- | 6,150 | --- | --- | --- | --- | ||||||||||||||||||
|
Restricted stock forfeited / cancelled
|
--- | (2,320 | ) | --- | --- | --- | --- | |||||||||||||||||
|
Stock-based compensation - stock options
|
--- | --- | 241 | --- | --- | 241 | ||||||||||||||||||
|
Stock-based compensation - restricted stock
|
--- | --- | 109 | --- | --- | 109 | ||||||||||||||||||
|
Cash dividends paid on common stock
|
--- | --- | --- | (3,205 | ) | --- | (3,205 | ) | ||||||||||||||||
|
Stock issued in payment of director fees
|
--- | 6,220 | 200 | --- | --- | 200 | ||||||||||||||||||
|
Balance at December 31, 2010
|
--- | 5,290,082 | $ | 55,383 | $ | 64,991 | $ | 1,546 | $ | 121,920 | ||||||||||||||
The accompanying notes are an integral part of these consolidated financial statements.
|
BANK OF MARIN BANCORP
|
|
CONSOLIDATED STATEMENTS OF CASH FLOWS
|
|
for the fiscal years ended December 31, 2010, 2009 and 2008
|
|
Year ended December 31,
|
||||||||||||
|
(in thousands)
|
2010
|
2009
|
2008
|
|||||||||
|
Cash Flows from Operating Activities:
|
||||||||||||
|
Net income
|
$ | 13,552 | $ | 12,765 | $ | 12,150 | ||||||
|
Adjustments to reconcile net income to net cash provided by operating activities:
|
||||||||||||
|
Provision for loan losses
|
5,350 | 5,510 | 5,010 | |||||||||
|
Compensation expense--common stock for director fees
|
200 | 210 | 253 | |||||||||
|
Stock-based compensation expense
|
350 | 403 | 428 | |||||||||
|
Excess tax benefits from exercised stock options
|
(102 | ) | (157 | ) | (207 | ) | ||||||
|
Amortization of investment security premiums, net of accretion of discounts
|
1,194 | 337 | 247 | |||||||||
|
Loss on sale of investment securities
|
--- | 4 | 2 | |||||||||
|
Depreciation and amortization
|
1,344 | 1,370 | 1,340 | |||||||||
|
Net gain on redemption of shares in Visa, Inc.
|
--- | --- | (457 | ) | ||||||||
|
Loss on disposal of furniture and equipment
|
3 | --- | 14 | |||||||||
|
Loss on sale of repossessed assets
|
15 | 29 | --- | |||||||||
|
Net change in operating assets and liabilities:
|
||||||||||||
|
Interest receivable
|
131 | (257 | ) | 4 | ||||||||
|
Interest payable
|
97 | 57 | 123 | |||||||||
|
Deferred rent and other rent-related expenses
|
253 | 260 | 152 | |||||||||
|
Other assets
|
23 | (7,203 | ) | 1,847 | ||||||||
|
Other liabilities
|
1,138 | 675 | 597 | |||||||||
|
Total adjustments
|
9,996 | 1,238 | 9,353 | |||||||||
|
Net cash provided by operating activities
|
23,548 | 14,003 | 21,503 | |||||||||
|
Cash Flows from Investing Activities:
|
||||||||||||
|
Purchase of securities held to maturity
|
(5,464 | ) | (8,706 | ) | (12,621 | ) | ||||||
|
Purchase of securities available for sale
|
(50,517 | ) | (57,814 | ) | (50,677 | ) | ||||||
|
Proceeds from sale of securities
|
--- | 5,343 | 21,489 | |||||||||
|
Proceeds from paydowns/maturity of:
|
||||||||||||
|
Securities held to maturity
|
790 | 320 | 1,125 | |||||||||
|
Securities available for sale
|
37,158 | 36,209 | 38,683 | |||||||||
|
Loans originated and principal collected, net
|
(26,923 | ) | (34,156 | ) | (165,460 | ) | ||||||
|
Purchase of bank owned life insurance policies
|
--- | --- | (2,219 | ) | ||||||||
|
Additions to premises and equipment
|
(1,723 | ) | (1,121 | ) | (1,825 | ) | ||||||
|
Proceeds from sale of repossessed assets
|
216 | 42 | --- | |||||||||
|
Net cash used in investing activities
|
(46,463 | ) | (59,883 | ) | (171,505 | ) | ||||||
|
Cash Flows from Financing Activities:
|
||||||||||||
|
Net increase in deposits
|
71,678 | 91,771 | 17,648 | |||||||||
|
Proceeds from stock options exercised
|
895 | 873 | 1,384 | |||||||||
|
Proceeds from issuance of preferred stock
|
--- | --- | 27,039 | |||||||||
|
Proceeds from issuance of warrants
|
--- | --- | 961 | |||||||||
|
Net (decrease) increase in Federal Funds purchased and Federal Home Loan Bank borrowings
|
--- | (1,800 | ) | 56,800 | ||||||||
|
Preferred stock repurchased
|
--- | (28,000 | ) | --- | ||||||||
|
Common stock repurchased
|
--- | --- | (2,526 | ) | ||||||||
|
Cash dividends paid on common stock
|
(3,205 | ) | (2,960 | ) | (2,882 | ) | ||||||
|
Cash dividends paid on preferred stock
|
--- | (451 | ) | --- | ||||||||
|
Stock issued under employee stock purchase plan
|
17 | 24 | 32 | |||||||||
|
Excess tax benefits from exercised stock options
|
102 | 157 | 207 | |||||||||
|
Net cash provided by financing activities
|
69,487 | 59,614 | 98,663 | |||||||||
|
Net increase (decrease) in cash and cash equivalents
|
46,572 | 13,734 | (51,339 | ) | ||||||||
|
Cash and cash equivalents at beginning of period
|
38,660 | 24,926 | 76,265 | |||||||||
|
Cash and cash equivalents at end of period
|
$ | 85,232 | $ | 38,660 | $ | 24,926 | ||||||
|
Supplemental disclosure of cash flow information:
|
||||||||||||
|
Cash paid for interest
|
$ | 7,246 | $ | 7,110 | $ | 10,694 | ||||||
|
Cash paid for income taxes
|
$ | 7,610 | $ | 8,571 | $ | 8,965 | ||||||
|
Supplemental disclosure of non-cash investing and financing activities:
|
||||||||||||
|
Loans transferred to repossessed assets
|
$ | 270 | $ | 168 | --- | |||||||
|
Accretion of preferred stock
|
--- | $ | 945 | $ | 16 | |||||||
|
Dividend payable to preferred stockholder
|
--- | --- | $ | 97 | ||||||||
|
Stock issued in payment of director fees
|
$ | 200 | $ | 233 | $ | 247 | ||||||
NOTES TO CONSOLIDATED FINANCIAL STATEMENTS
Note 1: Summary of Significant Accounting Policies
Basis of Presentation: The consolidated financial statements include the accounts of Bank of Marin Bancorp (“Bancorp”), a bank holding company, and its sole and wholly-owned bank subsidiary, Bank of Marin (the “Bank”, a California state-chartered commercial bank). All material intercompany transactions have been eliminated. In the opinion of Management, the consolidated financial statements contain all adjustments necessary to present fairly the financial position, results of operations, changes in stockholders’ equity and cash flows. All adjustments are of a normal, recurring nature. We have evaluated subsequent events through the date of filing with the Securities and Exchange Commission (“SEC”) and have determined that there are no subsequent events that require additional recognition or disclosure except as discussed in Note 19.
Nature of Operations: Bancorp, headquartered in Novato, CA, conducts business primarily through its wholly-owned subsidiary, the Bank, which provides a wide range of financial services to customers, who are predominantly professionals, small and middle-market businesses, and individuals who work and/or reside in Marin, San Francisco and Sonoma counties. Besides the headquarter office in Novato, CA, the Bank operates ten branches in Marin County, one in San Francisco and three in southern Sonoma County, as well as a loan production office in Santa Rosa. As discussed in Note 19 below, the Bank also expanded to Napa in February 2011. Our accounting and reporting policies conform to generally accepted accounting principles and general practice within the banking industry. A summary of our significant policies follows.
Cash and Cash Equivalents include cash, due from banks, Federal funds sold and other short-term investments with maturity less than three months at the time of origination.
Investment Securities are classified as "held to maturity," "trading securities" or "available for sale." Investments classified as held to maturity are those that we have the ability and intent to hold until maturity and are reported at cost, adjusted for the amortization or accretion of premiums or discounts. Investments held for resale in anticipation of short-term market movements are classified as trading securities and are reported at fair value, with unrealized gains and losses included in earnings. Investments that are neither held to maturity or trading are classified as available for sale and are reported at fair value. Unrealized gains and losses, net of related tax, are reported as a separate component of comprehensive income and included in stockholders' equity until realized. For discussion of our methodology in determining fair value, see Note 10.
At each financial statement date, Management assesses whether declines in the fair value of held-to-maturity and available-for-sale securities below their costs are deemed to be other-than-temporary. Management considers, among other things, (i) the length of time and the extent to which the fair value has been less than cost, (ii) the financial condition and near-term prospects of the issuer, and (iii) our intent and ability to retain the investment for a period of time sufficient to allow for any anticipated recovery in fair value. Evidence evaluated includes, but is not limited to, the remaining payment terms of the instrument and economic factors that are relevant to the collectability of the instrument, such as: current prepayment speeds, the current financial condition of the issuer(s), industry analyst reports, credit ratings, credit default rates, interest rate trends and the value of any underlying collateral.
For debt securities that are considered other-than-temporarily impaired, are not intended for sale and will not be required to be sold prior to recovery of our amortized cost basis, we separate the amount of the impairment into the amount that is credit related (credit loss component) and the amount due to all other factors. The credit-related other-than-temporary-impairment component is charged to earnings and is calculated as the difference between the security’s amortized cost basis and the present value of its expected future cash flows, which establishes a new cost basis for the security. The remaining difference between the security’s fair value and the present value of future expected cash flows is due to factors that are not credit related and is recognized in other comprehensive income, net of applicable taxes. The other-than-temporary impairment recognized in other comprehensive income for debt securities classified as held-to-maturity is accreted from other comprehensive income to the amortized cost of the debt security over the remaining life of the debt security in a prospective manner on the basis of the amount and timing of future estimated cash flows.
Premiums and discounts are amortized or accreted over the life of the related security as an adjustment to yield using the effective interest method. Dividend and interest income are recognized when earned. Realized gains and losses for securities are included in earnings and are derived using the specific identification method for determining the cost of securities sold.
Loans are reported at the principal amount outstanding net of deferred fees, charge-offs and the allowance for loan losses. Interest income is accrued daily using the simple interest method. Loans are placed on non-accrual status when Management believes that there is doubt as to the collection of principal or interest, generally when they become contractually past due by ninety days or more with respect to principal or interest, except for loans that are well-secured and in the process of collection. When loans are placed on non-accrual status, any accrued but uncollected interest is reversed from current-period interest income and interest income is recorded only after the loan is brought current or after all principal and past due interest has been collected. For loans whose contractual terms have been restructured in a manner which grants a concession to a borrower experiencing financial difficulties (“troubled debt restructuring”), they are returned to accrual status when there has been a sustained period of repayment performance (generally, six consecutive monthly payments) according to the modified terms and there is reasonable assurance of repayment and of performance.
Loan origination fees and commitment fees, offset by certain direct loan origination costs, are deferred and amortized as yield adjustments over the contractual lives of the related loans.
Loan Charge-Off Policy: For all types of loans except overdraft accounts, we generally fully or partially charge down a loan to the net realizable value for a non-collateral-dependent loan, or the fair value of collateral securing the loan for a collateral-dependent loan when: (1) it is deemed uncollectable; (2) the loan has been classified as a loss by either our internal loan review process or external examiners; or (3) the loan is 180 days past due unless both well secured and in the process of collection. For an overdraft account, we generally charge it off when it is more than 90 days old.
Allowance for Loan Losses is based upon estimates of loan losses and is maintained at a level considered adequate to provide for probable losses inherent in the loan portfolio. The allowance is increased by provisions for loan losses charged against earnings and reduced by charge-offs, net of recoveries.
In periodic evaluations of the adequacy of the allowance balance, Management considers current economic conditions, known and inherent risks in the portfolio, adverse situations that may affect the borrower's ability to repay, the estimated value of any underlying collateral, our past loan loss experience and other factors. The allowance for loan losses is based on estimates and ultimate losses may vary from current estimates. Our Asset/Liability Management Committee (“ALCO”) reviews the adequacy of the allowance for loan losses at least quarterly, to include consideration of the relative risks in the portfolio and current economic conditions. The allowance is adjusted based on that review if, in the judgment of the ALCO and Management, changes are warranted.
The overall allowance consists of specific allowances for individually identified impaired loans, an allowance factor for pools of credits and allowances for changing environmental factors (e.g., portfolio trends, concentration of credit, growth, economic factors, etc.).
The first component, the specific allowance, results from the analysis of identified problem credits and the evaluation of sources of repayment including collateral, as applicable. Through Management’s ongoing loan grading and credit monitoring process, individual loans are identified that have conditions that indicate the borrower may be unable to pay all amounts due under the contractual terms. These loans are evaluated for impairment individually by Management. Management considers a loan to be impaired when it is probable we will be unable to collect all amounts due according to the contractual terms of the loan agreement. When the fair value of the impaired loan is less than the recorded investment in the loan, the difference is recorded as the impairment through the establishment of the specific allowance. For loans determined to be impaired, the extent of the impairment is measured based on the present value of expected future cash flows discounted at the loan's original effective interest rate, based on the loan's observable market price, or based on the fair value of the collateral, if the loan is collateral dependent. Generally with problem credits that are collateral-dependent, we obtain appraisals of the collateral at least annually. We may obtain appraisals more frequently if we believe the collateral value is subject to market volatility, if a specific event has occurred to the collateral, or if we believe foreclosure is imminent.
The second component is an estimate of the probable inherent losses in each loan pool stratified by major segments of loans with similar characteristics in our loan portfolio. This analysis encompasses our entire loan portfolio but excludes any loans that were analyzed individually for specific allowances discussed above. Loans are segmented into the following pools: commercial real estate, construction, commercial, and consumer loans. Management also sub-segments these segments into classes based on the associated risks within those segments. Commercial real estate loans are divided into the following two classes: owner-occupied and non-owner-occupied. Consumer loans are divided into three classes: residential real estate, home equity and other consumer loans. The total amount allocated for the second component is determined by applying loss multipliers to outstanding loans in each loan pool. Loss multipliers for loan pools are based on analysis of local economic factors, current loan portfolio quality, historical loss experience and trends applicable to each loan pool. Local economic factors considered include state and local unemployment rates, occupancy rates and sales statistics as external criteria for loan loss estimation. In addition, additional loss factors are applied to substandard loans based on the increased risk of loss inherent in those credits.
The third component of the allowance for loan losses is an economic component, which is Management's best estimate of the probable impact that environmental changes may have on the loan portfolio as a whole. It is not allocated to specific loans or groups of loans, but rather is intended to absorb losses caused by portfolio trends, concentration of credit, growth, and economic trends.
Transfers of Financial Assets: We have entered into certain participation agreements with other organizations. We account for these transfers of financial assets as sales when control over the transferred financial assets has been surrendered. Control over transferred assets is deemed to be surrendered when (1) the assets have been isolated from us, (2) the transferee has the right to pledge or exchange the assets (or beneficial interests) it received, free of conditions that constrain it from taking advantage of that right, and (3) we do not maintain effective control over the transferred financial assets or third-party beneficial interests related to those transferred assets. No gain or loss has been recognized by us on the sale of these participation interests through December 31, 2010.
Premises and Equipment consist of leasehold improvements, furniture, fixtures and equipment and are stated at cost, less accumulated depreciation and amortization, which are calculated on a straight-line basis over the estimated useful life of the property or the term of the lease (if less). Furniture and fixtures are depreciated over eight years and equipment is generally depreciated over three to twenty years. Leasehold improvements are amortized over the lesser of their estimated useful lives or the terms of the leases. When assets are sold or otherwise disposed of, the cost and related accumulated depreciation or amortization are removed from the accounts and any resulting gain or loss is recognized in income for the period. The cost of maintenance and repairs is charged to expense as incurred.
Employee Stock Ownership Plan (“ESOP”) and Related Debt: We recognize compensation cost when funds become committed for the purchase of Bancorp’s common shares into the ESOP. To the extent that the fair value of Bancorp’s ESOP shares committed to be released differ from the cost of those shares, the differential is charged or credited to equity. The ESOP may be externally leveraged and, as such, the ESOP debt is recorded as a liability and interest expense is recognized on such debt. The ESOP shares not yet committed to be released are accounted for as a reduction in stockholders' equity. During 2010 and 2009, the Bank made cash contribution to the ESOP without leveraging.
Income Taxes reported in the consolidated financial statements are computed based on an asset and liability approach. We recognize the amount of taxes payable or refundable for the current year, and deferred tax assets and liabilities for the future tax consequences that have been recognized in the financial statement or tax returns. The measurement of tax assets and liabilities is based on the provisions of enacted tax laws. Bancorp files consolidated federal and combined state income tax returns.
Earnings per share (“EPS”) are based upon the weighted average number of common shares outstanding during each year. The following table shows: (1) weighted average basic shares, (2) potential common shares related to stock options, non-vested restricted stock, and stock warrant, and (3) weighted average diluted shares. Net income available to common stockholders is calculated as net income reduced by dividends accumulated on preferred stock and amortization of discounts on the preferred stock. Basic EPS are calculated by dividing net income available to common stockholders by the weighted average number of common shares outstanding during each period. Diluted EPS are calculated using the weighted average diluted shares. The number of potential common shares included in annual diluted EPS is a year-to-date weighted average of the number of potential common shares included in each quarterly diluted EPS computation under the treasury stock method. Our calculation of weighted average shares includes two classes of our outstanding common stock: common stock and unvested restricted stock awards. Holders of restricted stock awards receive non-forfeitable dividends at the same rate as common stockholders and they both share equally in undistributed earnings.
|
(in thousands, except per share data)
|
2010
|
2009
|
2008
|
|||||||||
|
Weighted average basic shares outstanding
|
5,238 | 5,182 | 5,135 | |||||||||
|
Add: Potential common shares related to stock options
|
46 | 47 | 81 | |||||||||
|
Potential common shares related to non-vested restricted stock
|
4 | 2 | --- | |||||||||
|
Potential common shares related to warrant
|
26 | 11 | 1 | |||||||||
|
Weighted average diluted shares outstanding
|
5,314 | 5,242 | 5,217 | |||||||||
|
Net income
|
$ | 13,552 | $ | 12,765 | $ | 12,150 | ||||||
|
Preferred stock dividends and accretion
|
--- | (1,299 | ) | (113 | ) | |||||||
|
Net income available to common stockholders
|
$ | 13,552 | $ | 11,466 | $ | 12,037 | ||||||
|
Basic EPS
|
$ | 2.59 | $ | 2.21 | $ | 2.34 | ||||||
|
Diluted EPS
|
$ | 2.55 | $ | 2.19 | $ | 2.31 | ||||||
|
Weighted average anti-dilutive shares not included in the calculation of diluted EPS
|
||||||||||||
|
Stock options
|
151 | 156 | 241 | |||||||||
|
Non-vested restricted stock
|
--- | --- | 7 | |||||||||
|
Total anti-dilutive shares
|
151 | 156 | 248 | |||||||||
Share-Based Compensation: All share-based payments granted subsequent to January 1, 2006, including stock options and restricted stock, are recognized as stock-based compensation expense in the statements of income based on the grant-date fair value of the award with a corresponding increase in common stock. The grant-date fair value of the award is amortized over the requisite service period, which is generally the vesting period. The stock-based compensation expense also includes share-based awards granted prior to, but not yet vested as of January 1, 2006, the date we adopted grant-date fair value accounting for share-based payments.
We determine fair value at grant date using the Black-Scholes pricing model that takes into account the stock price at the grant date, the exercise price, the expected life of the option, the volatility of the underlying stock, the expected dividend yield and the risk-free interest rate over the expected life of the option. The Black-Scholes option valuation model requires the input of highly subjective assumptions, including the expected life of the stock-based award and stock price volatility. The assumptions used represent Management’s best estimates based on historical information, but these estimates involve inherent uncertainties and the application of Management’s judgment. As a result, if other assumptions had been used, the recorded stock-based compensation expense could have been materially different from that recorded in its financial statements. In addition, we are required to estimate the expected forfeiture rates. If our actual forfeiture rate is materially different from the estimate, the share-based compensation expense could be materially different.
Derivative Financial Instruments and Hedging Activities:
Fair Value Hedges: All of our interest rate swap contracts are designated and qualified as fair value hedges. We apply shortcut hedge accounting for one of our interest rate swap contracts, as it is structured to mirror all of the provisions of the hedged loan agreement. This interest rate swap is carried on the balance sheet at its fair value in other assets (when the fair value is positive) or in other liabilities (when the fair value is negative). The change in the fair value of the interest rate swap is recorded in other non-interest income. As a result of interest rate fluctuations, the hedged fixed-rate loan also gains or loses market value. The unrealized gain or loss resulting from the change in market value of the hedged-loan is recorded as an adjustment to the hedged loan and offset in other non-interest income. Under shortcut hedge accounting treatment, the change in fair value of the interest rate swap is deemed perfectly offset by the change in fair value of the hedged loan, resulting in zero impact to net income.
Four of our interest rate swap contracts are accounted for using non-shortcut hedge accounting treatment. The interest rate swaps are closely aligned to the terms of the designated fixed-rate loans. The hedging relationships are tested for effectiveness on a quarterly basis. The interest rate swaps are carried on the balance sheet at their fair value in other assets (when the fair value is positive) or in other liabilities (when the fair value is negative). The changes in the fair value of the interest rate swaps are recorded in interest income. The unrealized gains or losses due to changes in fair value of the hedged fixed-rate loans are recorded as an adjustment to the hedged loans and offset in interest income. For derivative instruments executed with the same counterparty under a master netting arrangement, we do not offset fair value amounts of interest rate swaps in liability position with the ones in asset position. For further detail, see Note 15.
Advertising Costs are expensed as incurred. For the years ended December 31, 2010, 2009, and 2008, advertising costs totaled $459 thousand, $528 thousand, and $439 thousand, respectively.
Comprehensive Income for Bancorp includes net income reported on the statement of income and changes in the fair value of investment securities available for sale, net of related taxes, reported as a component of stockholders' equity.
Segment Information: Our two operating segments include the traditional community banking activities provided through our branch network and our Wealth Management and Trust Services (“WMTS”). The activities of these two segments are monitored and reported by Management as separate operating segments. The accounting policies of the segments are the same as those described in this note. We evaluate segment performance based on total segment revenue and do not allocate expenses between the segments. WMTS revenues were $1.5 million, $1.4 million and $1.3 million in 2010, 2009 and 2008, respectively, which are included in non-interest income in the statement of income. Non-interest expenses applicable to WMTS totaled $1.3 million, $1.2 million and $1.1 million in 2010, 2009 and 2008, respectively. The revenues of the community banking segment are reflected in all other income lines in the statement of income.
Use of Estimates: The preparation of financial statements in conformity with accounting principles generally accepted in the United States of America requires Management to make estimates and assumptions that affect the reported amounts of assets and liabilities and disclosure of contingent amounts of revenues and expenses during the reporting period. Actual results could differ from those estimates. Significant accounting estimates reflected in the consolidated financial statements include allowance for loan losses, other-than-temporary impairment of investment securities, share-based payment, accounting for income taxes and fair value measurements as discussed in the Notes herein.
Recently Issued Accounting Standards
In December 2010, the Financial Accounting Standards Board (“FASB”) issued Accounting Standards Update (“ASU”) No. 2010-29, Business Combinations (Topic 805): Disclosure of Supplementary Pro Forma Information for Business Combinations to address diversity in practice about the interpretation of the pro forma revenue and earnings disclosure requirements for business combinations. This ASU is effective prospectively for business combinations for which the acquisition date is on or after the beginning of the first annual reporting period beginning January 1, 2011. It requires a public entity to disclose pro forma revenue and earnings of the combined entity for the current reporting period as though the acquisition date for all business combinations that occurred during the year had been as of the beginning of the annual reporting period. If comparative financial statements are presented, the pro forma revenue and earnings of the combined entity for the comparable prior reporting period should be reported as though the acquisition date for all business combinations that occurred during the current year had been as of the beginning of the comparable prior annual reporting period. The amendments also expand the supplemental pro forma disclosures to include a description of the nature and amount of material, nonrecurring pro forma adjustments directly attributable to the business combination included in the reported pro forma revenue and earnings.
In December 2010, the FASB also issued ASU No. 2010-28, Intangibles—Goodwill and Other (Topic 350), When to Perform Step 2 of the Goodwill Impairment Test for Reporting Units with Zero or Negative Carrying Amounts. The amendments in this ASU affect all entities that have recognized goodwill and have one or more reporting units whose carrying amount for purposes of performing Step 1 of the goodwill impairment test is zero or negative. The amendments in this ASU modify Step 1 so that for those reporting units, an entity is required to perform Step 2 of the goodwill impairment test if it is more likely than not that a goodwill impairment exists. In determining whether it is more likely than not that a goodwill impairment exists, an entity should consider whether there are any adverse qualitative factors indicating that an impairment may exist. The qualitative factors are consistent with existing guidance, which requires that goodwill of a reporting unit be tested for impairment between annual tests if an event occurs or circumstances change that would more likely than not reduce the fair value of a reporting unit below its carrying amount. We do not expect the above two ASUs to have a significant impact on our financial condition or results of operations.
In July 2010, the FASB issued ASU No. 2010-20, Receivables (Topic 310): Disclosures about the Credit Quality of Financing Receivables and the Allowance for Credit Losses. The ASU amends FASB Accounting Standards Codification™ (the “Codification” or “ASC”) Topic 310, Receivables, to improve the disclosures about the credit quality of an entity’s financing receivables and the related allowance for credit losses. As a result of these amendments, an entity is required to disaggregate, by portfolio segment or class of financing receivable, certain existing disclosures and provide certain new disclosures about its financing receivables and related allowance for credit losses.
Existing disclosures are amended to require an entity to provide the following disclosures about its financing receivables on a disaggregated basis:
(1) A rollforward schedule of the allowance for credit losses from the beginning of the reporting period to the end of the reporting period on a portfolio segment basis, with the ending balance further disaggregated on the basis of the impairment method;
(2) For each disaggregated ending balance in item (1) above, the related recorded investment in financing receivables;
(3) The nonaccrual status of financing receivables by class of financing receivables;
(4) Impaired financing receivables by class of financing receivables.
The amendments in the ASU also require an entity to provide the following additional disclosures about its financing receivables:
(1) Credit quality indicators of financing receivables at the end of the reporting period by class of financing receivables;
(2) The aging of past due financing receivables at the end of the reporting period by class of financing receivables;
(3) A description of the entity’s accounting policies and methodology used to estimate the allowance for credit losses by portfolio segments;
(4) The nature and extent of troubled debt restructurings that occurred during the period by class of financing receivables and their effect on the allowance for credit losses, as well as the nature and extent of financing receivables modified as troubled debt restructurings within the previous twelve months that defaulted during the reporting period by class of financing receivables and their effect on the allowance for credit losses; and
(5) Significant purchases and sales of financing receivables during the reporting period disaggregated by portfolio segments.
The disclosures as of the end of a reporting period were effective for interim and annual reporting periods ended December 31, 2010, which we have provided in Note 3 and Note 4. The disclosures about activity that occurs during a reporting period will be effective for interim and annual reporting periods beginning January 1, 2011. As this ASU is disclosure-related only, it did not have an impact on our financial condition or results of operations.
In January 2011, the FASB issued ASU No. 2011-01, Receivables (Topic 310): Deferral of the Effective Date of Disclosures about Troubled Debt Restructurings in Update No. 2010-20. The amendments in this Update temporarily delay the effective date of the disclosures about troubled debt restructurings in ASU No. 2010-20, Receivables (Topic 310): Disclosures about the Credit Quality of Financing Receivables and the Allowance for Credit Losses for public entities. The delay is intended to allow the FASB time to complete its deliberations on what constitutes a troubled debt restructuring. The effective date of the new disclosures about troubled debt restructurings for public entities and the guidance for determining what constitutes a troubled debt restructuring will then be coordinated. Without the deferral, public companies would be required to comply with the new troubled debt restructurings disclosures in financial statements for interim and annual reporting periods beginning after December 15, 2010. The deferral does not extend to any other provisions of the ASU No. 2010-20 about credit quality disclosures.
In April 2010, the FASB issued ASU No. 2010-18, Receivables (Topic 310): Effect of a Loan Modification When the Loan Is Part of a Pool That Is Accounted for as a Single Asset. This ASU codifies the consensus reached in Emerging Issues Task Force (“EITF”) Issue No. 09-I, Effect of a Loan Modification When the Loan Is Part of a Pool That Is Accounted for as a Single Asset. The amendments to the Codification provide that modifications of loans that are accounted for within a pool under Subtopic 310-30 do not result in the removal of those loans from the pool even if the modification of those loans would otherwise be considered a troubled debt restructuring. An entity will continue to be required to consider whether the pool of assets in which the loan is included is impaired if expected cash flows for the pool change. ASU 2010-18 does not affect the accounting for loans under the scope of Subtopic 310-30 that are not accounted for within pools. Loans accounted for individually under Subtopic 310-30 continue to be subject to the troubled debt restructuring accounting provisions within Subtopic 310-40.
ASU 2010-18 was effective prospectively for modifications of loans accounted for within pools under Subtopic 310-30 occurring in the first interim or annual period ended on or after July 15, 2010. Upon initial adoption of ASU 2010-18, an entity may make a one-time election to terminate accounting for loans as a pool under Subtopic 310-30. This election may be applied on a pool-by-pool basis and does not preclude an entity from applying pool accounting to subsequent acquisitions of loans with credit deterioration. This ASU did not have a significant impact on our financial condition or results of operations.
On February 24, 2010, the FASB issued ASU No. 2010-09, Subsequent Events (Topic 855): Amendments to Certain Recognition and Disclosure Requirements. The amendments in this ASU remove the requirement for an SEC filer to disclose a date through which subsequent events have been evaluated in both issued and revised financial statements. Revised financial statements include financial statements revised as a result of either correction of an error or retrospective application of U.S. generally accepted accounting principles. The FASB believes these amendments remove potential conflicts with the SEC’s literature. All of the amendments in the ASU were effective upon issuance.
In January 2010, the FASB issued ASU No. 2010-06, Fair Value Measurements and Disclosures (Topic 820): Improving Disclosures about Fair Value Measurements. This ASU requires: (1) disclosure of the amounts of significant transfers in and out of Level 1 and Level 2 fair value measurement categories and the reasons for the transfers; and (2) separate presentation of purchases, sales, issuances, and settlements in the reconciliation for fair value measurements using significant unobservable inputs (Level 3). In addition, ASU 2010-06 clarifies the requirements of the following existing disclosures set forth in the Codification Subtopic 820-10: (1) For purposes of reporting fair value measurement for each class of assets and liabilities, a reporting entity needs to use judgment in determining the appropriate classes of assets and liabilities; and (2) a reporting entity should provide disclosures about the valuation techniques and inputs used to measure fair value for both recurring and non-recurring fair value measurements. ASU 2010-06 was effective for interim and annual reporting periods that began January 1, 2010, except for the disclosures about purchases, sales, issuances, and settlements in the roll forward of activity in Level 3 fair value measurements, which are effective for fiscal years beginning January 1, 2011, and for interim periods within those fiscal years. As ASU 2010-06 is disclosure-related only, our adoption of this ASU in the first quarter of 2010 did not impact our financial condition or results of operations.
Note 2: Investment Securities
Our investment securities portfolio at December 31, 2010 and 2009 consists primarily of U.S. government agency securities, including mortgage-backed securities (“MBS”) and collateralized mortgage obligations (“CMOs”) issued or guaranteed by FNMA, FHLMC, or GNMA. Our portfolio also includes obligations of state and political subdivisions, as well as, corporate CMOs, and equity securities as reflected in the table below:
|
December 31, 2010
|
December 31, 2009
|
|||||||||||||||||||||||||||||||
|
Amortized
|
Fair
|
Gross Unrealized
|
Amortized
|
Fair
|
Gross Unrealized
|
|||||||||||||||||||||||||||
|
(in thousands)
|
Cost
|
Value
|
Gains
|
(Losses)
|
Cost
|
Value
|
Gains
|
(Losses)
|
||||||||||||||||||||||||
|
Held to maturity
|
||||||||||||||||||||||||||||||||
|
Obligations of state and political subdivisions
|
$ | 34,917 | $ | 35,090 | $ | 666 | $ | (493 | ) | $ | 30,396 | $ | 30,786 | $ | 774 | $ | (384 | ) | ||||||||||||||
|
Available for sale
|
||||||||||||||||||||||||||||||||
|
Securities of U. S. government agencies:
|
||||||||||||||||||||||||||||||||
|
MBS pass-through securities issued by FNMA and FHLMC
|
16,119 | 16,424 | 419 | (114 | ) | 12,882 | 13,086 | 253 | (49 | ) | ||||||||||||||||||||||
|
CMOs issued by FNMA
|
12,770 | 13,236 | 466 | --- | 18,207 | 18,527 | 479 | (159 | ) | |||||||||||||||||||||||
|
CMOs issued by FHLMC
|
19,725 | 20,177 | 452 | --- | 30,664 | 30,912 | 530 | (282 | ) | |||||||||||||||||||||||
|
CMOs issued by GNMA
|
44,607 | 45,421 | 884 | (70 | ) | 15,180 | 15,657 | 477 | --- | |||||||||||||||||||||||
|
Debentures of government sponsored agencies
|
--- | --- | --- | --- | 5,000 | 5,040 | 46 | (6 | ) | |||||||||||||||||||||||
|
Corporate CMOs
|
15,849 | 15,870 | 185 | (164 | ) | 14,819 | 14,596 | 1 | (224 | ) | ||||||||||||||||||||||
|
Equity Securities
|
--- | 608 | 608 | --- | --- | --- | --- | --- | ||||||||||||||||||||||||
|
Total available for sale
|
109,070 | 111,736 | 3,014 | (348 | ) | 96,752 | 97,818 | 1,786 | (720 | ) | ||||||||||||||||||||||
|
Total investment securities
|
$ | 143,987 | $ | 146,826 | $ | 3,680 | $ | (841 | ) | $ | 127,148 | $ | 128,604 | $ | 2,560 | $ | (1,104 | ) | ||||||||||||||
As a member bank of Visa U.S.A., we hold 16,939 shares of Visa Inc. Class B common stock at a zero cost basis. These shares are restricted from resale until their conversion into Class A (voting) shares on the later of March 25, 2011 or the termination of Visa Inc.’s covered litigation escrow account. The conversion rate will be determined upon the final resolution of the Visa Inc. covered litigation described in Note 13. The stock is classified as available-for-sale securities and reported at fair value, with the unrealized gain, net of tax, recognized in other comprehensive income. The fair value of the Class B common stock, based on the current Class A conversion rate of 0.5102, was $608 thousand, at December 31, 2010. In connection with Visa Inc.’s initial public offering (“IPO”) on March 19, 2008, we recognized a $457 thousand gain in 2008 on the mandatory redemption of 10,677 shares of Visa Inc. Class B common stock representing the difference between the cash proceeds received from Visa Inc. and the zero carrying basis of the stock redeemed.
The amortized cost and fair value of investment debt securities by contractual maturity at December 31, 2010 are shown below. Expected maturities will differ from contractual maturities because the issuers of the securities may have the right to call or prepay obligations with or without call or prepayment penalties. Equity securities with a zero cost basis and a fair value of $608 thousand are excluded from the following table.
|
December 31, 2010
|
||||||||||||||||
|
Held to Maturity
|
Available for Sale
|
|||||||||||||||
|
(in thousands)
|
Amortized Cost
|
Fair Value
|
Amortized Cost
|
Fair Value
|
||||||||||||
|
Within one year
|
$ | 1,478 | $ | 1,500 | --- | --- | ||||||||||
|
After one but within five years
|
5,304 | 5,440 | --- | --- | ||||||||||||
|
After five years through ten years
|
20,589 | 20,784 | 15,712 | 16,134 | ||||||||||||
|
After ten years
|
7,546 | 7,366 | 93,358 | 94,994 | ||||||||||||
|
Total
|
$ | 34,917 | $ | 35,090 | $ | 109,070 | $ | 111,128 | ||||||||
In 2010, there were no sales of available-for-sale or held-to-maturity securities. During 2009, four held-to-maturity securities issued by the same issuer with a combined carrying value of $1.1 million, and another held-to-maturity security with a carrying value of $335 thousand were sold due to evidence of significant deterioration of creditworthiness. The proceeds from the sales totaled $1.4 million and the transactions resulted in net losses of $9 thousand recorded against 2009 earnings. In 2008, we sold one held-to-maturity security due to deterioration of the issuer’s creditworthiness. The proceeds from the sale totaled $1.0 million and the transaction resulted in a loss of $2 thousand in 2008. In 2009, we sold one available-for-sale security with a carrying value of $3.9 million. The proceeds from the sale totaled $3.9 million and the sale resulted in a gain of $5 thousand recognized in earnings. In 2008, we sold $20.0 million in available-for-sale securities at no gain or loss as they were very short-term in nature, with an average holding period from seven to twenty-eight days.
At December 31, 2010, investment securities carried at $1.3 million were pledged with the Federal Reserve Bank of San Francisco (“FRB”) to secure our Treasury, Tax and Loan account. At December 31, 2010, investment securities carried at $44.4 million were pledged with the State of California: $42.3 million to secure public deposits in compliance with the Local Agency Security Program, $1.4 million to collateralize an internal WMTS checking account, and $667 thousand to provide collateral for trust services. In addition, investment securities carried at $3.7 million were pledged to collateralize interest rate swaps as discussed in Note 15.
Other-Than-Temporarily Impaired Debt Securities
For each security in an unrealized loss position, we assess whether we intend to sell the security, or it is more likely than not that we will be required to sell the security before recovery of its amortized cost basis less any current-period credit losses. For debt securities that are considered other-than-temporarily impaired and that we do not intend to sell and will not be required to sell prior to recovery of our amortized cost basis, we separate the amount of the impairment into the amount that is credit related (credit loss component) and the amount due to all other factors. The credit loss component is recognized in earnings and is calculated as the difference between the security’s amortized cost basis and the present value of its expected future cash flows. The remaining difference between the security’s fair value and the present value of future expected cash flows is deemed to be due to factors that are not credit related and is recognized in other comprehensive income.
We do not have the intent to sell the securities that are temporarily impaired, and it is more likely than not that we will not have to sell those securities before recovery of the cost basis. Additionally, we have evaluated the credit ratings of our investment securities and their issuers and/or insurers, if applicable. Based on our evaluation, Management has determined that no investment security in our investment portfolio is other-than-temporarily impaired.
Twenty-nine and thirty investment securities were in unrealized loss positions at December 31, 2010 and 2009, respectively. They are summarized and classified according to the duration of the loss period as follows:
|
December 31, 2010
|
< 12 continuous months
|
> 12 continuous months
|
Total Securities in a loss position
|
|||||||||||||||||||||
|
(In thousands)
|
Fair value
|
Unrealized loss
|
Fair value
|
Unrealized loss
|
Fair value
|
Unrealized loss
|
||||||||||||||||||
|
Held-to-maturity
|
||||||||||||||||||||||||
|
Obligations of state & political subdivisions
|
$ | 11,622 | $ | (250 | ) | $ | 1,687 | $ | (243 | ) | $ | 13,309 | $ | (493 | ) | |||||||||
|
Available for sale
|
||||||||||||||||||||||||
|
Securities of U. S. Government Agencies
|
12,888 | (184 | ) | --- | --- | 12,888 | (184 | ) | ||||||||||||||||
|
Corporate CMOs
|
7,070 | (164 | ) | --- | --- | 7,070 | (164 | ) | ||||||||||||||||
|
Total available for sale
|
19,958 | (348 | ) | --- | --- | 19,958 | (348 | ) | ||||||||||||||||
|
Total temporarily impaired securities
|
$ | 31,580 | $ | (598 | ) | $ | 1,687 | $ | (243 | ) | $ | 33,267 | $ | (841 | ) | |||||||||
|
December 31, 2009
|
< 12 continuous months
|
> 12 continuous months
|
Total Securities in a loss position
|
|||||||||||||||||||||
|
(In thousands)
|
Fair value
|
Unrealized loss
|
Fair value
|
Unrealized loss
|
Fair value
|
Unrealized loss
|
||||||||||||||||||
|
Held-to-maturity
|
||||||||||||||||||||||||
|
Obligations of state & political subdivisions
|
$ | 6,351 | $ | (76 | ) | $ | 1,753 | $ | (308 | ) | $ | 8,104 | $ | (384 | ) | |||||||||
|
Available for sale
|
||||||||||||||||||||||||
|
Securities of U. S. Government Agencies
|
25,737 | (496 | ) | --- | --- | 25,737 | (496 | ) | ||||||||||||||||
|
Corporate CMOs
|
14,384 | (224 | ) | --- | --- | 14,384 | (224 | ) | ||||||||||||||||
|
Total available for sale
|
40,121 | (720 | ) | --- | --- | 40,121 | (720 | ) | ||||||||||||||||
|
Total temporarily impaired securities
|
$ | 46,472 | $ | (796 | ) | $ | 1,753 | $ | (308 | ) | $ | 48,225 | $ | (1,104 | ) | |||||||||
The unrealized losses associated with debt securities of U.S. government agencies are primarily driven by changes in interest rates and not due to the credit quality of the securities. Further, securities backed by GNMA, FNMA, or FHLMC have the guarantee of the full faith and credit of the U.S. Federal Government. Obligations of U.S. states and political subdivisions in our portfolio are all investment grade without delinquency history. The security in a loss position for more than twelve continuous months at December 31, 2010 relates to one debenture issued by a local political subdivision with payments collected through property tax assessments in an affluent community. This security is still investment grade without delinquency history. This security will continue to be monitored as part of our ongoing impairment analysis, but is expected to perform. As a result, we concluded that it was not other-than-temporarily impaired at December 31, 2010.
The unrealized losses associated with corporate CMO’s are primarily related to securities backed by residential mortgages. All of these securities were AAA-rated at December 31, 2010 by at least one major rating agency. We estimate loss projections for each security by assessing loans collateralizing the security and determining expected default rates and loss severities. Based upon our assessment of expected credit losses of each security given the performance of the underlying collateral and credit enhancements where applicable, we concluded that these securities were not other-than-temporarily impaired at December 31, 2010.
Securities Carried at Cost
As a member of the FHLB, we are required to maintain a minimum investment in the FHLB capital stock determined by the Board of Directors of the FHLB. The minimum investment requirements can also increase in the event we need to increase our borrowing capacity with the FHLB. Shares cannot be purchased or sold except between the FHLB and its members at its $100 per share par value. We held $5.0 million and $4.7 million of FHLB stock recorded at cost in other assets at December 31, 2010 and December 31, 2009, respectively. On February 22, 2011, FHLB declared a cash dividend for the fourth quarter of 2010 at an annualized dividend rate of 0.29%. Management does not believe that the FHLB stock is other-than-temporarily-impaired, as we expect to be able to redeem this stock at cost.
Note 3: Loans
The majority of our loan activity is with customers located in California, primarily in the counties of Marin, San Francisco and Sonoma. More than half of our loans are for commercial real estate, 75% of which are secured by real estate located in Marin, Sonoma and San Francisco counties, California. Approximately 86% of loans were secured by real estate at both December 31, 2010 and 2009.
Outstanding loans by class and payment aging, net of deferred loan fees of $2.8 million and $2.9 million at December 31, 2010 and 2009, respectively, are as follows:
Credit Quality of Loans
Loan Aging Analysis by Class As of December 31, 2010 and 2009
|
(Dollars in thousands)
|
Commercial
|
Commercial real estate, owner-occupied
|
Commercial real estate, investor
|
Construction
|
Home equity
|
Other residential 1
|
Installment and other consumer
|
Total
|
||||||||||||||||||||||||
|
December 31, 2010
|
||||||||||||||||||||||||||||||||
|
30-59 days past due
|
$ | 20 | $ | - | $ | - | $ | - | $ | 25 | $ | - | $ | 307 | $ | 352 | ||||||||||||||||
|
60-89 days past due
|
- | - | - | - | - | - | - | - | ||||||||||||||||||||||||
|
Greater than 90 days past due (non-accrual) 2
|
2,486 | 632 | - | 9,297 | - | 148 | 362 | 12,925 | ||||||||||||||||||||||||
|
Total past due
|
2,506 | 632 | - | 9,297 | 25 | 148 | 669 | 13,277 | ||||||||||||||||||||||||
|
Current
|
151,330 | 141,958 | 383,553 | 68,322 | 86,907 | 69,843 | 26,210 | 928,123 | ||||||||||||||||||||||||
|
Total loans
|
$ | 153,836 | $ | 142,590 | $ | 383,553 | $ | 77,619 | $ | 86,932 | $ | 69,991 | $ | 26,879 | $ | 941,400 | ||||||||||||||||
|
Non-accrual loans to total loans
|
1.6 | % | 0.4 | % | - | 12.0 | % | - | - | 1.3 | % | 1.4 | % | |||||||||||||||||||
|
Troubled debt restructured loans 3
|
||||||||||||||||||||||||||||||||
|
Accruing
|
$ | - | $ | - | $ | - | $ | - | $ | 259 | $ | - | $ | 925 | $ | 1,184 | ||||||||||||||||
|
Non-accrual
|
- | - | - | - | - | - | 55 | 55 | ||||||||||||||||||||||||
|
Total troubled debt restructed loans
|
$ | - | $ | - | $ | - | $ | - | $ | 259 | $ | - | $ | 980 | $ | 1,239 | ||||||||||||||||
|
December 31, 2009
|
||||||||||||||||||||||||||||||||
|
30-59 days past due
|
$ | 48 | $ | - | $ | - | $ | - | $ | - | $ | - | $ | 22 | $ | 70 | ||||||||||||||||
|
60-89 days past due
|
155 | - | - | 611 | - | - | - | 766 | ||||||||||||||||||||||||
|
Greater than 90 days past due (non-accrual) 2
|
910 | - | 3,722 | 6,520 | 100 | - | 313 | 11,565 | ||||||||||||||||||||||||
|
Total past due
|
1,113 | - | 3,722 | 7,131 | 100 | - | 335 | 12,401 | ||||||||||||||||||||||||
|
Current
|
163,530 | 146,133 | 329,030 | 84,158 | 83,877 | 69,369 | 29,250 | 905,347 | ||||||||||||||||||||||||
|
Total loans
|
$ | 164,643 | $ | 146,133 | $ | 332,752 | $ | 91,289 | $ | 83,977 | $ | 69,369 | $ | 29,585 | $ | 917,748 | ||||||||||||||||
|
Non-accrual loans to total loans
|
0.6 | % | 0.0 | % | 1.1 | % | 7.1 | % | 0.1 | % | - | 1.1 | % | 1.3 | % | |||||||||||||||||
|
Troubled debt restructured loans 3
|
||||||||||||||||||||||||||||||||
|
Accruing
|
$ | 49 | $ | - | $ | - | $ | - | - | $ | - | $ | 566 | $ | 615 | |||||||||||||||||
|
Non-accrual
|
- | - | - | - | - | - | 165 | 165 | ||||||||||||||||||||||||
|
Total troubled debt restructed loans
|
$ | 49 | $ | - | $ | - | $ | - | $ | - | $ | - | $ | 731 | $ | 780 | ||||||||||||||||
1 Our residential loan portfolio includes no sub-prime loans, nor is it our normal practice to underwrite loans commonly referred to as "Alt-A mortgages", the characteristics of which are loans lacking full documentation, borrowers having low FICO scores or collateral compositions reflecting high loan-to-value ratios.
2 There were no accruing loans past due more than 90 days at December 31, 2010 or 2009.
3 Defined as loans whose contractual terms have been restructured in a manner which grants a concession to a borrower experiencing financial difficulties. These balances are included in the impaired loan totals in the table in Note 4 below.
Our commercial loans are generally made to established small businesses to provide financing for their working capital needs or acquisition of fixed-assets. Management examines current and projected cash flows to determine the ability of the borrower to repay their obligations as agreed. Commercial loans are primarily made based on the identified cash flows of the borrower and secondarily on the underlying collateral provided by the borrower. The cash flows of borrowers, however, may not be as expected and the collateral securing these loans may fluctuate in value. Most commercial and industrial loans are secured by the assets being financed or other business assets such as accounts receivable or inventory and incorporate a personal guarantee; however, some short-term loans may be made on an unsecured basis. In the case of loans secured by accounts receivable, the availability of funds for the repayment of these loans may be substantially dependent on the ability of the borrower to collect amounts due from its customers. We target stable local businesses with strong guarantors that have proven to be more resilient in periods of economic stress. Typically the strong guarantors provide an additional source of repayment for our credit extensions.
Commercial real estate loans are subject to underwriting standards and processes similar to commercial loans, in addition to those of real estate loans. These loans are viewed primarily as cash flow loans and secondarily as loans secured by real estate. Repayment of commercial real estate loans is largely dependent on the successful operation of the property securing the loan, or the business conducted on the property securing the loan. Underwriting for these loans must meet a minimum debt coverage ratio of 1.20:1.00, and we also require a conservative loan-to-value of 65% or less. Furthermore, substantially all of our loans are guaranteed by the owners of the properties. Commercial real estate loans may be more adversely affected by conditions in the real estate markets or in the general economy. In the event of a vacancy, strong guarantors have historically carried the loans until a replacement tenant can be found. The owner’s substantial equity investment provides a strong economic incentive to continue to support the commercial real estate projects. As such, we experience nominal delinquencies in this portfolio.
Construction loans are generally made to developers and builders to finance land acquisition as well as the subsequent construction. These loans are underwritten after evaluation of the borrower's financial strength, reputation, prior track record and obtaining independent appraisal reviews. The construction industry can be severely impacted by several major factors, including: 1) the inherent volatility of real estate markets; 2) vulnerability to weather delays, labor, or material shortages and price hikes; and, 3) generally thin margins and tight cash flow. Estimates of construction costs and value associated with the complete project may be inaccurate. Construction loans often involve the disbursement of substantial funds with repayment substantially dependent on the success of the ultimate project.
Consumer loans primarily consist of home equity lines of credit and loans, other residential (tenancy-in-common, or “TIC”) loans and other personal loans. We originate consumer loans utilizing credit score information, debt-to-income ratio and loan-to-value ratio analysis. To monitor and manage consumer loan risk, policies and procedures are developed and modified, as needed. This activity, coupled with relatively small loan amounts that are spread across many individual borrowers, minimizes risk. Additionally, trend and outlook reports are reviewed by Management on a regular basis. Underwriting standards for home equity loans include, but are not limited to, a maximum loan-to-value percentage of 75% of loans that are $1,250,000 or less (and even more conservatively for homes with values in excess of this amount), collection remedies, the number of such loans a borrower can have at one time and documentation requirements. Our underwriting of the other residential loans, mostly secured by TIC units in San Francisco, has been cautious compared to traditional residential mortgages due to the interest-only feature of these loans. However, these borrowers tend to have a larger equity in this category, which mitigates risk. Personal loans are nearly evenly split between mobile home loans and floating home loans along with a small number of direct auto loans and installment loans. Personal unsecured loans are offered to consumers with additional underwriting procedures in place, including net worth, and borrowers’ verified liquid assets analysis. In general, personal loans usually have a higher degree of risk than other types of loans.
We use a risk rating system as a tool used to evaluate asset quality, and to identify and monitor credit risk in individual loans, and ultimately in the portfolio. Definitions of risk grades of Criticized and Classified loans are consistent with those used by the regulators. Our internally assigned grades are as follows:
Pass – Loans to borrowers of acceptable or better credit quality. Borrowers in this category demonstrate fundamentally sound financial positions, repayment capacity, credit history and management expertise. Loans in this category must have an identifiable and stable source of repayment and meet the Bank’s policy regarding debt service coverage ratios. These borrowers are capable of sustaining normal economic, market or operational setbacks without significant financial impacts. Financial ratios and trends are acceptable. Negative external industry factors are generally not present. The loan may be secured, unsecured or supported by non-real estate collateral for which the value is more difficult to determine and/or marketability is more uncertain. This category also includes “Watch” loans, where the primary source of repayment has been delayed. “Watch” is intended to be a transitional grade, with either an upgrade or downgrade within a reasonable period.
Special Mention - Potential weaknesses that deserve close attention. If left uncorrected, those potential weaknesses may result in deterioration of the payment prospects for the asset. Special Mention assets do not present sufficient risk to warrant adverse classification.
Substandard - Inadequately protected by either the current sound worth and paying capacity of the obligor or the collateral pledged, if any. A Substandard asset has a well-defined weakness or weaknesses that jeopardize the liquidation of the debt. Substandard assets are characterized by the distinct possibility that we will sustain some loss if such weaknesses or deficiencies are not corrected. Loss potential, while inherent in the aggregate substandard amount, does not necessarily exist in the individual assets classified Substandard. Well-defined weaknesses include adverse trends or developments of the borrower’s financial condition, managerial weaknesses and/or significant collateral deficiencies.
Doubtful - Critical weaknesses that make collection or liquidation in full improbable. There may be specific pending events that work to strengthen the asset, however, the amount or timing of the loss may not be determinable. Pending events generally occur within one year of the asset being classified as Doubtful. Examples include: merger, acquisition, or liquidation; capital injection; guarantee; perfecting liens on additional collateral; and refinancing. Such loans are placed on non-accrual status and usually are collateral-dependant.
We regularly review our credits for accuracy of risk grades whenever new financial information is received. Borrowers are required to submit financial information at regular intervals:
|
|
·
|
Generally, commercial borrowers with lines of credit are required to submit financial information regularly with reporting intervals ranging from monthly to annually depending on credit size, risk and complexity.
|
|
|
·
|
Investor commercial real estate borrowers with loans greater than $2.5 million are required to submit rent rolls or property income statements at least annually. It has been our practice to require rent rolls or property income statements for loans $750 thousand or greater for approximately the last two years.
|
|
|
·
|
Construction loans are monitored monthly, and assessed on an ongoing basis.
|
|
|
·
|
Home equity and other consumer loans are assessed based on delinquency.
|
|
|
·
|
Loans graded “Watch” or more severe, regardless of loan type, are assessed no less than quarterly.
|
The following table represents our analysis of loans by internally assigned grades as of December 31, 2010:
Credit Quality Indicators As of December 31, 2010
|
(Dollars in thousands)
|
Commercial
|
Commercial real estate, owner-occupied
|
Commercial real estate, investor
|
Construction
|
Home equity
|
Other residential
|
Installment and other consumer
|
Total
|
||||||||||||||||||||||||
|
Credit Risk Profile by Internally Assigned Grade:
|
||||||||||||||||||||||||||||||||
|
Pass
|
$ | 120,428 | $ | 135,443 | $ | 369,976 | $ | 57,779 | $ | 84,830 | $ | 64,570 | $ | 26,280 | $ | 859,305 | ||||||||||||||||
|
Special mention
|
17,009 | 454 | 330 | 10,253 | 447 | - | - | 28,493 | ||||||||||||||||||||||||
|
Substandard
|
16,169 | 6,693 | 13,247 | 9,587 | 1,655 | 5,421 | 427 | 53,200 | ||||||||||||||||||||||||
|
Doubtful
|
230 | - | - | - | - | - | 172 | 402 | ||||||||||||||||||||||||
|
Total loans
|
$ | 153,836 | $ | 142,590 | $ | 383,553 | $ | 77,619 | $ | 86,932 | $ | 69,991 | $ | 26,879 | $ | 941,400 | ||||||||||||||||
Pledged Loans
Our FHLB line of credit is secured under terms of a blanket collateral agreement by a pledge of certain qualifying loans equal to the amount of our line of credit, which totaled $219.2 million and $236.2 million at December 31, 2010 and 2009, respectively, In addition, we pledge a certain residential loan portfolio, which totaled $40.2 million and $38.0 million at December 31, 2010 and 2009, respectively, to secure our borrowing capacity with the FRB. Also see Note 8 below.
Related Party Loans
The Bank has, and expects to have in the future, banking transactions in the ordinary course of its business with directors, officers, principal stockholders and their associates. These transactions, including loans, are granted on substantially the same terms, including interest rates and collateral on loans, as those prevailing at the same time for comparable transactions with persons not related to us. Likewise, these transactions do not involve more than the normal risk of collectability or present other unfavorable features.
An analysis of net loans to related parties for each of the three years ended December 31, 2010, 2009 and 2008 is as follows:
|
(In thousands)
|
2010
|
2009
|
2008
|
|||||||||
|
Balance at beginning of year
|
$ | 7,401 | $ | 7,421 | $ | 7,899 | ||||||
|
Additions
|
95 | 331 | 72 | |||||||||
|
Repayments
|
(499 | ) | (274 | ) | (550 | ) | ||||||
|
Reclassified as unrelated-party loan
|
--- | (77 | ) | --- | ||||||||
|
Balance at end of year
|
$ | 6,997 | $ | 7,401 | $ | 7,421 | ||||||
The undisbursed commitment to related parties was $1.1 million as of December 31, 2010.
Note 4: Allowance for Loan Losses
Impaired loan balances and their related allowance by major classes of loans
|
(Dollars in thousands)
|
Commercial
|
Commercial real estate, owner-occupied
|
Commercial real estate, investor
|
Construction
|
Home equity
|
Other residential
|
Installment and other consumer
|
Total
|
||||||||||||||||||||||||
|
December 31, 2010
|
||||||||||||||||||||||||||||||||
|
Recorded investment in impaired loans:
|
||||||||||||||||||||||||||||||||
|
With no specific allowance recorded
|
$ | 959 | $ | 633 | $ | --- | $ | 8,742 | $ | --- | $ | --- | $ | 73 | $ | 10,407 | ||||||||||||||||
|
With a specific allowance recorded
|
1,526 | --- | $ | --- | 555 | 259 | 148 | 1,214 | 3,702 | |||||||||||||||||||||||
|
Total recorded investment in impaired loans
|
$ | 2,485 | $ | 633 | $ | --- | $ | 9,297 | $ | 259 | $ | 148 | $ | 1,287 | $ | 14,109 | ||||||||||||||||
|
Unpaid principal balance of impaired loans:
|
||||||||||||||||||||||||||||||||
|
With no specific allowance recorded
|
$ | 959 | $ | 689 | $ | --- | $ | 11,485 | $ | --- | $ | --- | $ | 115 | $ | 13,248 | ||||||||||||||||
|
With a specific allowance recorded
|
2,570 | --- | --- | 555 | 259 | 148 | 1,214 | 4,746 | ||||||||||||||||||||||||
|
Total unpaid principal balance of the impaired loans
|
$ | 3,529 | $ | 689 | $ | --- | $ | 12,040 | $ | 259 | $ | 148 | $ | 1,329 | $ | 17,994 | ||||||||||||||||
|
Specific allowance
|
$ | 667 | $ | --- | $ | --- | $ | 3 | $ | 25 | $ | 93 | $ | 290 | $ | 1,078 | ||||||||||||||||
|
Average recorded investment in impaired loans during the year
|
1,326 | 3,086 | --- | 6,326 | 191 | 39 | 1,212 | 12,180 | ||||||||||||||||||||||||
|
Interest income recognized on impaired loans during the year
|
85 | 22 | --- | 336 | 8 | 5 | 66 | 522 | ||||||||||||||||||||||||
|
December 31, 2009
|
||||||||||||||||||||||||||||||||
|
Recorded investment in Impaired loans:
|
||||||||||||||||||||||||||||||||
|
With no specific allowance recorded
|
626 | 3,722 | --- | 6,520 | 100 | --- | 452 | 11,420 | ||||||||||||||||||||||||
|
With a specific allowance recorded
|
333 | --- | --- | --- | --- | --- | 427 | 760 | ||||||||||||||||||||||||
|
Total recorded investment in impaired loans
|
$ | 959 | $ | 3,722 | $ | --- | $ | 6,520 | $ | 100 | $ | --- | $ | 879 | $ | 12,180 | ||||||||||||||||
|
Specific allowance
|
$ | 2 | $ | --- | $ | --- | $ | --- | $ | --- | $ | --- | $ | 43 | $ | 45 | ||||||||||||||||
|
Average recorded investment in impaired loans during the year
|
$ | 8,326 | ||||||||||||||||||||||||||||||
|
Interest income recognized on impaired loans during the year
|
$ | 425 | ||||||||||||||||||||||||||||||
The gross interest income that would have been recorded had non-accrual loans been current totaled $756 thousand, $728 thousand and $180 thousand in the years ended December 31, 2010, 2009 and 2008, respectively. We recognized interest income of $482 thousand, $407 thousand and $367 thousand on these non-accrual loans for cash payments received during the years ended December 31, 2010, 2009 and 2008, respectively.
Generally, we charge off our estimated losses related to specifically-identified impaired loans when it is deemed uncollectible. The charged-off portion of impaired loans outstanding at December 31, 2010 totaled approximately $3.9 million. At December 31, 2010, there were no significant commitments to extend credit on impaired loans, including loans to borrowers whose terms have been modified in troubled debt restructurings.
Management monitors delinquent loans continuously and identifies problem loans, generally loans graded substandard or worse, to be evaluated individually for impairment testing. The following table discloses loans by major portfolio categories and the specific allowance for loan losses disaggregated by impairment evaluation method as of December 31, 2010, as well as activity in the allowance for loan losses for the year ended December 31, 2010:
Allowance for Loan Losses and Recorded Investment in Loans as of and for the year ended December 31, 2010
|
(Dollars in thousands)
|
Commercial
|
Commercial real estate, owner-occupied
|
Commercial real estate, investor
|
Construction
|
Home equity
|
Other residential
|
Installment and other consumer
|
Unallocated
|
Total
|
|||||||||||||||||||||||||||
|
Allowance for loan losses:
|
||||||||||||||||||||||||||||||||||||
|
Beginning balance
|
$ | 2,544 | $ | 1,006 | $ | 3,000 | $ | 1,832 | $ | 586 | $ | 734 | $ | 662 | $ | 254 | $ | 10,618 | ||||||||||||||||||
|
Provision (reversal)
|
1,118 | 78 | 1,134 | 2,395 | 207 | 4 | 471 | (57 | ) | 5,350 | ||||||||||||||||||||||||||
|
Charge-offs
|
(643 | ) | (47 | ) | --- | (2,628 | ) | (150 | ) | --- | (318 | ) | --- | (3,786 | ) | |||||||||||||||||||||
|
Recoveries
|
95 | --- | --- | 95 | --- | --- | 20 | --- | 210 | |||||||||||||||||||||||||||
|
Ending balance
|
$ | 3,114 | $ | 1,037 | $ | 4,134 | $ | 1,694 | $ | 643 | $ | 738 | $ | 835 | $ | 197 | $ | 12,392 | ||||||||||||||||||
|
Ending balance related to loans collectively evaluated for impairment
|
$ | 2,447 | $ | 1,037 | $ | 4,134 | $ | 1,691 | $ | 618 | $ | 645 | $ | 545 | $ | 197 | $ | 11,314 | ||||||||||||||||||
|
Ending balance related to loans individually evaluated for impairment
|
$ | 667 | $ | --- | $ | --- | $ | 3 | $ | 25 | $ | 93 | $ | 290 | $ | --- | $ | 1,078 | ||||||||||||||||||
|
Loans outstanding:
|
||||||||||||||||||||||||||||||||||||
|
Collectively evaluated for impairment
|
$ | 151,351 | $ | 141,957 | $ | 383,553 | $ | 68,322 | $ | 86,673 | $ | 69,843 | $ | 25,592 | --- | $ | 927,291 | |||||||||||||||||||
|
Individually evaluated for impairment
|
2,485 | 633 | --- | 9,297 | 259 | 148 | 1,287 | --- | 14,109 | |||||||||||||||||||||||||||
|
Total
|
$ | 153,836 | $ | 142,590 | $ | 383,553 | $ | 77,619 | $ | 86,932 | $ | 69,991 | $ | 26,879 | $ | --- | $ | 941,400 | ||||||||||||||||||
|
Ratio of allowance for loan losses to total loans at end of year
|
2.02 | % | 0.73 | % | 1.08 | % | 2.18 | % | 0.74 | % | 1.05 | % | 3.11 | % | --- | 1.32 | % | |||||||||||||||||||
|
Allowance for loan losses to non-accrual loans at year end
|
125 | % | 164 | % |
NA
|
18 | % |
NA
|
499 | % | 231 | % | --- | 96 | % | |||||||||||||||||||||
Activity in the allowance for loan losses for each of the two years ended December 31, 2009 and 2008 follows:
|
(Dollars in thousands)
|
2009
|
2008
|
||||||
|
Allowance for loan losses:
|
||||||||
|
Beginning balance
|
$ | 9,950 | $ | 7,575 | ||||
|
Provision
|
5,510 | 5,010 | ||||||
|
Charge-offs
|
(5,362 | ) | (2,680 | ) | ||||
|
Recoveries
|
520 | 45 | ||||||
|
Ending balance
|
$ | 10,618 | $ | 9,950 | ||||
|
Total loans outstanding at end of year, before deducting allowance for loan losses
|
$ | 917,748 | $ | 890,544 | ||||
|
Ratio of allowance for loan losses to total loans at year end
|
1.16 | % | 1.12 | % | ||||
|
Allowance for loan losses to non-accrual loans at year end
|
91.81 | % | 148.68 | % | ||||
|
Non-accrual loans to total loans at year end
|
1.26 | % | 0.75 | % | ||||
Note 5: Bank Premises and Equipment
A summary of Bank premises and equipment at December 31 follows:
|
(Dollars in thousands)
|
2010
|
2009
|
||||||
|
Leasehold improvements
|
$ | 11,052 | $ | 11,011 | ||||
|
Furniture and equipment
|
9,025 | 9,121 | ||||||
|
Subtotal
|
20,077 | 20,132 | ||||||
|
Accumulated depreciation and amortization
|
(11,658 | ) | (12,089 | ) | ||||
|
Bank premises and equipment, net
|
$ | 8,419 | $ | 8,043 | ||||
The amount of depreciation and amortization was $1.3 million, $1.4 million and $1.3 millions for the years ended December 31, 2010, 2009 and 2008, respectively.
In the last three years, we contracted with a construction company managed and owned by a member of the Board of Directors of the Bank and Bancorp for the construction of leasehold improvements to our two newest branch offices. During 2010, 2009 and 2008, we paid $752 thousand, $420 thousand and $611 thousand, respectively, for these improvements.
Note 6: Bank Owned Life Insurance
We have purchased eighty-six life insurance policies on the lives of certain officers designated by the Board of Directors to finance employee benefit programs as of December 31, 2010. Death benefits provided under the specific terms of these programs are estimated to be $41.3 million at December 31, 2010 and the benefits to employees’ beneficiaries are limited to the employee’s active service period. The investment in the Bank owned life insurance (“BOLI”) policies are reported in interest receivable and other assets at their cash surrender value of $18.3 million and $17.6 million at December 31, 2010 and 2009, respectively. The cash surrender value includes both the original premiums we paid in the life insurance policies and the accumulated accretion of policy income since inception of the policies. Income of $690 thousand, $696 thousand and $640 thousand was recognized on the life insurance policies in 2010, 2009 and 2008, respectively, and is reported in other non-interest income. The income is net of mortality costs recognized, which totaled $113 thousand, $102 thousand and $89 thousand for the years ended December 31, 2010, 2009 and 2008, respectively. We regularly monitor the credit ratings of our four insurance carriers to ensure that they are in compliance with our policy.
Note 7: Deposits
Total time deposits were $200.3 million and $159.5 million at December 31, 2010 and 2009, respectively. Of these amounts, $155.7 million and $112.2 million represented time deposits greater than $100,000 at December 31, 2010 and 2009, respectively. Interest on time deposits was $2.3 million, $2.3 million and $2.7 million in 2010, 2009 and 2008, respectively. Scheduled maturities of these deposits at December 31, 2010 are presented as follows:
|
(Dollars in thousands)
|
2011
|
2012
|
2013
|
2014
|
2015
|
Thereafter
|
Total
|
|||||||||||||||||||||
|
Scheduled maturities of time deposits
|
$ | 173,765 | $ | 14,613 | $ | 2,884 | $ | 2,035 | $ | 6,958 | --- | $ | 200,255 | |||||||||||||||
In 2008, we began to offer the CDARS® deposit product, short for Certificate of Deposit Account Registry Service. Through CDARS®, we may accept deposits in excess of the Federal Deposit Insurance Corporation (“FDIC”) insured maximum from a depositor and place the deposits through a network to other member banks in increments of less than the FDIC insured maximum to provide the depositor full FDIC insurance coverage. When we receive an equal dollar amount of deposits from other member banks in exchange for the deposits we place into the network, we record these as CDARS® deposits. At December 31, 2010 and 2009, CDARS® deposits totaled $67.3 million and $51.8 million, respectively.
As of December 31, 2010, $31.6 million in securities held to maturity and $10.8 million in securities available for sale were pledged as collateral for our local agency deposits.
The aggregate amount of deposit overdrafts that have been reclassified as loan balances were $184 thousand and $230 thousand at December 31, 2010 and 2009, respectively. Collectability of these overdrafts is subject to the same credit review process as the other loans.
The Bank accepts deposits from shareholders, directors and employees in the normal course of business, and the terms are comparable to those with non-affiliated parties. The total deposits from directors and their businesses, and executive officers were $7.0 million at both December 31, 2010 and 2009.
Note 8: Borrowings
Federal Funds Purchased– We have unsecured lines of credit totaling $77.0 million with correspondent banks for overnight borrowings. In general, interest rates on these lines approximate the Federal funds target rate. At December 31, 2010 and 2009, we had no borrowings outstanding under these credit facilities.
Federal Home Loan Bank Borrowings – As of December 31, 2010 and 2009, we had lines of credit with the FHLB totaling $219.2 million and $236.2 million, respectively, based on eligible collateral, mainly a portfolio of loans. At December 31, 2010 and 2009, we had no overnight borrowings with the FHLB.
On February 5, 2008, we entered into a ten-year borrowing agreement under the same FHLB line of credit for $15.0 million at a fixed rate of 2.07%. Interest-only payments are required every three months until maturity. Although the entire principal is due on February 5, 2018, the FHLB has the unconditional right to accelerate the due date on February 5, 2011 and every three months thereafter (the “put dates”). If the FHLB exercises its right to accelerate the due date, the FHLB will offer replacement funding at the current market rate, subject to certain conditions. We must comply with the put date, but are not required to accept replacement funding.
On December 16, 2008, we entered into a five-year borrowing agreement under the FHLB line of credit for $20.0 million at a fixed rate of 2.54%. Interest-only payments are required every month until maturity.
On January 23, 2009, we entered into a three-year borrowing agreement under the FHLB line of credit for $20.0 million at a fixed rate of 2.29%. Interest-only payments are required every month until maturity.
At December 31, 2010, $164.2 million remained available for borrowing from the FHLB. The FHLB overnight borrowing and the FHLB line of credit are secured by a certain loan portfolio under a blanket lien.
Federal Reserve Line of Credit – We also have a line of credit with the FRB secured by a certain residential loan portfolio. At December 31, 2010 and December 31, 2009, we had borrowing capacity under this line totaling $40.2 and $38.0 million, respectively, and had no outstanding borrowings with the FRB.
Subordinated Debt – On September 17, 2004 we issued a fifteen-year, $5.0 million subordinated debenture through a pooled trust preferred program, which matures on June 17, 2019. We have the right to redeem the debenture, in whole or in part, at the redemption price at principal amounts in multiples of $1.0 million on any interest payment date on or after June 17, 2009. The interest rate on the debenture changes quarterly and is paid quarterly at the three-month LIBOR plus 2.48%. The rate at December 31, 2010 was 2.78%. The debenture is subordinated to the claims of depositors and our other creditors.
Borrowings at December 31, 2010 and 2009 are summarized as follows:
|
2010
|
2009
|
|||||||||||||||||||||||
|
(Dollars in thousands)
|
Carrying
Value
|
Average
Balance
|
Average
Rate
|
Carrying
Value
|
Average
Balance
|
Average
Rate
|
||||||||||||||||||
|
Overnight borrowings
|
$ | ---- | $ | 2,000 | 0.29 | % | $ | ---- | $ | 10,659 | 0.26 | % | ||||||||||||
|
FHLB fixed-rate advances
|
55,000 | 55,000 | 2.33 | % | 55,000 | 53,794 | 2.33 | % | ||||||||||||||||
|
Subordinated debenture
|
5,000 | 5,000 | 2.94 | % | 5,000 | 5,000 | 3.55 | % | ||||||||||||||||
The maximum amount outstanding at any month end for overnight borrowings was zero and $60.4 million, during 2010 and 2009, respectively.
Note 9: Stockholders' Equity and Stock Option Plans
Preferred Stock
In response to stress in the credit markets and to protect and recapitalize the U.S. financial system, on October 3, 2008, the Emergency Economic Stabilization Act of 2009 (“EESA”) was signed into law. EESA includes provisions of the United States Department of the Treasury Capital Purchase Program (the “TCPP”), which was intended to inject liquidity into, and stabilize the financial industry. On November 19, 2008, we received preliminary approval from the U.S. Treasury to participate in the TCPP. On December 5, 2008 Bancorp issued to the U.S. Treasury 28,000 shares of senior preferred stock with a zero par value and a $1,000 per share liquidation preference, along with a warrant to purchase 154,242 shares of common stock at a per share exercise price of $27.23, in exchange for aggregate consideration of $28.0 million. Dividends were to be paid quarterly in arrears on February 15, May 15, August 15 and November 15 of each year with a 5% coupon dividend rate for the first five years and 9% thereafter. The attached warrant was immediately exercisable and expires ten years after the issuance date.
The proceeds of $28 million were allocated between the preferred stock and the warrant with $27.0 million allocated to preferred stock and $961 thousand allocated to the warrant, based on their relative fair value at the time of issuance. The fair value of the preferred stock was estimated using discounted cash flows with a discount rate of 9%. The fair value of the warrant was estimated using the Black-Scholes option pricing model with the following assumptions: 1) risk-free interest rate of 2.67% (the Treasury ten-year yield rate as of warrant issuance date); 2) estimated life of ten years (contractual term of the warrant); 3) volatility of 29% (historical volatility based on our stock price over the past ten years preceding the warrant issuance date); and 4) dividend yield of 2.59% (expected annual dividend divided by stock price as of warrant issuance date). The difference between the liquidation amount of the preferred stock and its initial carrying amount was to be accreted over the five-year period preceding the 9% perpetual dividend, using effective yield method.
Under the American Recovery and Reinvestment Act of 2009, which allows participants in the TCPP to withdraw from the program, we repurchased all 28,000 shares of outstanding preferred stock from the U.S. Treasury at $28 million plus accrued but unpaid dividends of $179 thousand on March 31, 2009. At the time of repurchase, we also accelerated the remaining accretion of the preferred stock totaling $945 thousand through retained earnings, reducing our net income available to common stockholders. The warrant remains outstanding, and was subsequently adjusted for cash dividend increases to represent a right to purchase 154,521 shares of common stock at $27.18 per share in accordance with Section 13(c) of the Form of Warrant to Purchase Common Stock.
Common Stock
As of December 31, 2010, Bancorp was authorized to issue fifteen million shares of common stock with no par value.
Share-Based Awards
On May 11, 2010, our shareholders approved the 2010 Director Stock Plan to pay director fees in shares of Bancorp common stock up to 150,000 shares. In 2010, our directors were awarded a total of 3,190 common shares from the 2010 Director Stock plan in addition to their cash compensation.
On May 8, 2007, the 2007 Equity Plan was approved by the Bank shareholders. The 2007 Equity Plan was subsequently adopted by Bancorp as part of the holding company formation. All new share-based awards from the approval date forward are granted through the 2007 Equity Plan.
The 2007 Equity plan provides financial incentives for selected employees, advisors and non-employee directors. Terms of the plan provide for the issuance of up to 500,000 shares of common stock for these employees, advisors and non-employee directors. As of December 31, 2010, there were 352,774 shares available for future grants under the 2007 Equity Plan. The Compensation Committee of the Board of Directors has the discretion to determine which employees, advisors and non-employee directors will receive an award, the timing of awards, the vesting schedule for each award, the type of award to be granted, the number of shares of Bancorp stock to be subject to each option and restricted stock award, and any other terms and conditions. In 2010, our directors were awarded a total of 3,030 common shares from the 2007 Equity plan in addition to their cash compensation.
Effective July 1, 2007, we adopted an Employee Stock Purchase Plan whereby our employees may purchase Bancorp common shares through payroll deductions of between one percent and fifteen percent of pay in each pay period. Shares are purchased quarterly at a five percent discount from the closing market price on the last day of the quarter. The plan calls for 200,000 common shares to be set aside for employee purchases, and there were 196,998 shares available for future grants under the plan as of December 31, 2010.
We also have the 1999 Stock Option Plan and the 1989 Stock Option Plan for certain full-time employees and directors who have substantial responsibility for the successful operation of the Bank. Stock options granted pursuant to the 1989 and 1999 Stock Option Plans were subsequently adopted by Bancorp as part of the holding company formation. Stock options under these plans now relate to shares of common stock of Bancorp. Upon approval of the 1999 Stock Option Plan, no new awards were granted under the 1989 Stock Option Plan. Upon approval of the 2007 Equity Plan, no new awards were granted under the 1999 Stock Option Plan.
Options are issued with exercise price equal to the fair market value of the stock at the date of grant. Options to officers and employees granted prior to January 1, 2006 vested 20% immediately and 20% on each anniversary of the grant date for four years. Options granted subsequent to January 1, 2006 and restricted stock vested 20% on each anniversary of the grant date for five years. All officer and employee options expire ten years from the grant date. Options granted to non-employee directors vest 20% immediately and 20% on each anniversary of the grant date for four years. Director options expire seven years from the grant date.
A summary of activity for stock options for the years ended December 31, 2010, 2009 and 2008 is presented below.
|
Number of
Shares |
Weighted
Average |
Aggregate
IntrinsicValue
(in thousands) |
Weighted
Average |
Average
Remaining
Contractual
Term |
||||||||||||||||
|
Options outstanding at December 31, 2007
|
481,975 | $ | 23.64 | $ | 3,593 | $ | 7.98 | 5.47 | ||||||||||||
|
Granted
|
31,651 | 28.06 | --- | 6.83 | --- | |||||||||||||||
|
Cancelled, expired or forfeited
|
(16,370 | ) | 24.25 | 123 | 8.24 | --- | ||||||||||||||
|
Exercised
|
(95,298 | ) | 14.52 | 1,361 | 6.59 | --- | ||||||||||||||
|
Options outstanding at December 31, 2008
|
401,958 | 26.12 | 1,278 | 8.16 | 5.53 | |||||||||||||||
|
Exercisable (vested) at December 31, 2008
|
275,834 | 23.16 | 1,278 | 8.31 | 4.56 | |||||||||||||||
|
Options outstanding at December 31, 2008
|
401,958 | 26.12 | 1,278 | 8.16 | 5.53 | |||||||||||||||
|
Granted
|
36,200 | 22.25 | 373 | 5.31 | --- | |||||||||||||||
|
Cancelled, expired or forfeited
|
(17,188 | ) | 30.48 | 55 | 9.31 | --- | ||||||||||||||
|
Exercised
|
(61,175 | ) | 14.28 | 826 | 6.49 | --- | ||||||||||||||
|
Options outstanding at December 31, 2009
|
359,795 | 27.54 | 2,016 | 8.10 | 5.43 | |||||||||||||||
|
Exercisable (vested) at December 31, 2009
|
245,562 | 26.77 | 1,537 | 8.71 | 4.41 | |||||||||||||||
|
Options outstanding at December 31, 2009
|
359,795 | 27.54 | 2,016 | 8.10 | 5.43 | |||||||||||||||
|
Granted
|
29,601 | 32.74 | 67 | 9.01 | --- | |||||||||||||||
|
Cancelled, expired or forfeited
|
(21,652 | ) | 31.41 | 78 | 8.31 | --- | ||||||||||||||
|
Exercised
|
(49,940 | ) | 17.92 | 782 | 6.70 | --- | ||||||||||||||
|
Options outstanding at December 31, 2010
|
317,804 | 29.27 | 1,828 | 8.39 | 5.18 | |||||||||||||||
|
Exercisable (vested) at December 31, 2010
|
225,246 | 29.12 | 1,330 | 8.84 | 4.30 | |||||||||||||||
The following table summarizes non-vested share-based awards at December 31, 2010, and changes during the year ended December 31, 2010.
|
Options
|
Restricted Stock
|
|||||||||||||||
|
Weighted
|
Weighted
|
|||||||||||||||
|
Average
|
Average
|
|||||||||||||||
|
Number of
|
Grant-Date
|
Number of
|
Grant-Date
|
|||||||||||||
|
Shares
|
Fair Value
|
Shares
|
Fair Value
|
|||||||||||||
|
Nonvested awards at December 31, 2009
|
114,233 | $ | 6.77 | 16,935 | $ | 24.31 | ||||||||||
|
Granted
|
29,601 | 9.01 | 6,150 | 33.10 | ||||||||||||
|
Vested
|
(39,846 | ) | 7.13 | (3,655 | ) | 24.63 | ||||||||||
|
Forfeited
|
(11,430 | ) | 7.19 | (2,320 | ) | 27.02 | ||||||||||
|
Nonvested awards at December 31, 2010
|
92,558 | $ | 7.28 | 17,110 | $ | 27.03 | ||||||||||
As of December 31, 2010, there was $817 thousand of total unrecognized compensation expense related to non-vested stock options and restricted stock. This cost is expected to be recognized over a weighted average period of approximately three years. The total grant-date fair value of option shares vested during the years ended December 31, 2010, 2009 and 2008 was $284 thousand, $375 thousand and $522 thousand, respectively. The total grant-date fair value of restricted stock vested during 2010 and 2009 was $90 thousand and $39 thousand, respectively.
A summary of the options outstanding and exercisable by price range as of December 31, 2010 is presented in the following table:
|
Stock Options Outstanding as of December 31, 2010
|
Stock Options Exercisable as of December 31, 2010
|
|||||||||||||||||||
|
Range of Exercise Prices
|
Stock Options
Outstanding |
Remaining
Contractual Life |
Weighted
Average |
Stock Options
Exercisable |
Weighted
Average |
|||||||||||||||
|
$10.01 - $15.00
|
18,322 | 0.7 | $ | 13.24 | 18,322 | $ | 13.24 | |||||||||||||
|
$15.01 - $20.00
|
10,419 | 2.1 | $ | 16.95 | 10,419 | $ | 16.95 | |||||||||||||
|
$20.01 - $25.00
|
31,190 | 8.2 | $ | 22.25 | 5,990 | $ | 22.25 | |||||||||||||
|
$25.01 - $30.00
|
70,945 | 4.6 | $ | 27.34 | 55,584 | $ | 27.11 | |||||||||||||
|
$30.01 - $35.00
|
146,620 | 5.3 | $ | 32.95 | 109,423 | $ | 32.91 | |||||||||||||
|
$35.01 - $40.00
|
40,308 | 6.1 | $ | 35.21 | 25,508 | $ | 35.22 | |||||||||||||
| 317,804 | 225,246 | |||||||||||||||||||
The fair value of stock options on the grant date is recorded as a stock-based compensation expense in the statements of income over the requisite service period with a corresponding increase in common stock. Stock-based compensation also includes compensation expense related to the issuance of non-vested restricted common shares pursuant to the 2007 Equity Plan. The grant-date fair value of the restricted common shares, which equals its intrinsic value on that date, is being recorded as compensation expense over the requisite service period with a corresponding increase in common stock as the shares vest. In addition, we record excess tax benefits on the exercise of non-qualified stock options, the disqualifying disposition of incentive stock options and vesting of restricted stock as an addition to common stock with a corresponding decrease in current taxes payable.
We determine the fair value of stock options at grant date using the Black-Scholes pricing model that takes into account the stock price at the grant date, the exercise price, the expected life of the option, the volatility of the underlying stock, the expected dividend yield and the risk-free interest rate over the expected life of the option.
The weighted average assumptions used in the pricing model are noted in the table below. The expected term of options granted is derived from historical data on employee exercise and post-vesting employment termination behavior. The risk-free rate for periods within the contractual life of the option is based on the U.S. Treasury yield curve in effect at the time of the grant. Expected volatility is based on the historical volatility of the common stock.
|
Year ended
|
||||||||||||
|
December 31, 2010
|
December 31, 2009
|
December 31, 2008
|
||||||||||
|
Risk-free interest rate
|
2.94 | % | 2.25 | % | 3.50 | % | ||||||
|
Expected dividend yield on common stock
|
1.85 | % | 2.52 | % | 2.00 | % | ||||||
|
Expected life in years
|
6.7 | 6.4 | 6.5 | |||||||||
|
Expected price volatility
|
28.20 | % | 28.99 | % | 23.93 | % | ||||||
For options granted after January 1, 2006, the fair value of the option is expensed on a straight-line basis over the vesting period. Forfeitures are estimated and expense is recognized only for those shares expected to vest. The estimated forfeiture rate over the life of the options, based on historical forfeiture experience, was 5.0% in 2010 and 7.5% in 2009 and 2008.
The Black-Scholes option valuation model requires the input of highly subjective assumptions, including the expected life of the stock based award and stock price volatility. The assumptions listed above represent Management’s best estimates based on historical information, but these estimates involve inherent uncertainties and the application of Management’s judgment. As a result, if other assumptions had been used, the recorded share-based compensation expense could have been materially different from that reflected in these financial statements. If the actual forfeiture rate is materially different from the estimate, the share-based compensation expense could also be materially different.
Dividends
Presented below is a summary of preferred dividends on preferred stock issued under the TCPP, as well as cash dividends paid to common shareholders, both of which were recorded as a reduction of retained earnings.
|
Years ended December 31
|
||||||||||||
|
(in thousands except per share data)
|
2010
|
2009
|
2008
|
|||||||||
|
Preferred dividends
|
$ | --- | $ | 354 | $ | 97 | ||||||
|
Cash dividends to common shareholders
|
$ | 3,205 | $ | 2,960 | $ | 2,882 | ||||||
|
Cash dividends per common share
|
$ | 0.61 | $ | 0.57 | $ | 0.56 | ||||||
The holders of non-vested restricted common shares are entitled to dividends on the same per-share ratio as the holders of common stock. Dividends paid on the portion of share-based awards not expected to vest are included in stock-based compensation expense. Tax benefits on dividends paid on the portion of share-based awards expected to vest are recorded as an increase to common stock with a corresponding decrease in current taxes payable.
Under the California Corporations Code, payment of dividends by Bancorp is restricted to the amount of retained earnings immediately prior to the distribution. Under this restriction, approximately $65.0 million of the retained earnings balance was available for payment of dividends as of December 31, 2010.
Under the California Financial Code, payment of dividends by the Bank to Bancorp is restricted to the lesser of retained earnings or the amount of undistributed net profits of the Bank from the three most recent fiscal years. As we repurchased the preferred stock issued as part of the TCPP discussed earlier, the Bank paid a dividend of $28 million to Bancorp to fund such repurchase. Distributions from the Bank to Bancorp through 2013 will require regulatory approval. In 2010, after approval by the DFI, the Bank paid a total of $3.0 million in dividends to Bancorp to cover Bancorp’s estimated operational needs and cash dividends to shareholders for the next several quarters.
On July 2, 2007, Bancorp executed a shareholder rights agreement (“Rights Agreement”) designed to discourage takeovers that involve abusive tactics or do not provide fair value to shareholders. Refer to Exhibit 4.1 to Registration Statement on Form 8-A12B filed with the Securities and Exchange Commission on July 2, 2007.
Note 10: Fair Value of Assets and Liabilities
Fair Value Hierarchy and Fair Value Measurement
We group our assets and liabilities that are recorded at fair value in three levels, based on the markets in which the assets and liabilities are traded and the reliability of the assumptions used to determine fair value. These levels are:
Level 1: Valuations are based on quoted prices in active markets for identical assets or liabilities. Since valuations are based on quoted prices that are readily and regularly available in an active market, valuation of these products does not entail a significant degree of judgment.
Level 2: Valuations are based on quoted prices for similar instruments in active markets, quoted prices for identical or similar instruments in markets that are not active and model-based valuations for which all significant assumptions are observable or can be corroborated by observable market data.
Level 3: Valuations are based on unobservable inputs that are supported by little or no market activity and that are significant to the fair value of the assets or liabilities. Values are determined using pricing models and discounted cash flow models and include management judgment and estimation which may be significant.
The following table summarizes our assets and liabilities that were required to be recorded at fair value on a recurring basis.
|
(in thousands)
Description of Financial Instruments
|
Carrying Value
|
Quoted Prices in Active Markets for Identical Assets
(Level 1)
|
Significant Other Observable Inputs
(Level 2)
|
Significant Unobservable Inputs
(Level 3)
|
||||||||||||
|
Balance at December 31, 2010:
|
||||||||||||||||
|
Securities available for sale:
|
||||||||||||||||
|
Mortgage-backed securities and collaterized mortgage obligations issued by U.S. government agencies
|
$ | 95,258 | $ | --- | $ | 95,258 | $ | --- | ||||||||
|
Corporate collateralized mortgage obligations
|
$ | 15,870 | $ | --- | $ | 15,870 | $ | --- | ||||||||
|
Equity securities
|
$ | 608 | $ | 608 | $ | --- | $ | --- | ||||||||
|
Derivative financial liabilities (interest rate contracts)
|
$ | 2,470 | $ | --- | $ | 2,470 | $ | --- | ||||||||
|
Balance at December 31, 2009:
|
||||||||||||||||
|
Securities available for sale
|
$ | 97,818 | $ | --- | $ | 97,818 | $ | --- | ||||||||
|
Derivative financial assets
|
$ | 35 | $ | --- | $ | 35 | $ | --- | ||||||||
|
Derivative financial liabilities
|
$ | 1,624 | $ | --- | $ | 1,624 | $ | --- | ||||||||
Securities available for sale are recorded at fair value on a recurring basis. When available, quoted market prices (Level 1) are used to determine the fair value of securities available for sale. If quoted market prices are not available, we obtain pricing information from a reputable third-party service provider, who may utilize valuation techniques that use current market-based or independently sourced parameters, such as bid/ask prices, dealer-quoted prices, interest rates, benchmark yield curves, prepayment speeds, and credit spreads (Level 2). Level 1 securities include those traded on active markets, including U.S. Treasury securities and equity securities (e.g. VISA Inc. common stock). Level 2 securities include U.S. agencies’ debt securities, mortgage-backed securities and corporate collateralized mortgage obligations.
On a recurring basis, derivative financial instruments are recorded at fair value, which is based on the income approach using observable Level 2 market inputs, reflecting market expectations of future interest rates as of the measurement date. Standard valuation techniques are used to calculate the present value of the future expected cash flows assuming an orderly transaction. Valuation adjustments may be made to reflect both our own credit risk and the counterparties’ credit quality in determining the fair value of the derivatives. Level 2 inputs for the valuations are limited to observable market prices for LIBOR cash rates (for the very short term), quoted prices for LIBOR futures contracts, observable market prices for LIBOR swap rates, and one-month and three-month LIBOR basis spreads at commonly quoted intervals. Mid-market pricing of the inputs is used as a practical expedient in the fair value measurements. Key inputs for interest rate valuations are used to project spot rates at resets specified by each swap, as well as to discount those future cash flows to present value at the measurement date. When the value of any collateral placed with counterparties is less than the interest rate derivative liability, the interest rate liability position is further discounted to reflect our potential credit risk to counterparties. We have used the spread between the Standard & Poor’s BBB rated U.S. Bank Composite rate and LIBOR, with maturity terms corresponding to the duration of the swaps, to calculate this credit-risk-related discount of future cash flows.
Certain financial assets may be measured at fair value on a non-recurring basis. These assets are subject to fair value adjustments that result from the application of the lower of cost or fair value accounting or write-downs of individual assets. For example, when a loan is identified as impaired, it is reported at the lower of cost or fair value, measured based on the loan's observable market price (Level 1), the present value of expected future cash flows discounted at a market-based interest rate for similar loans (Level 2), or the current appraised value of the underlying collateral securing the loan, if the loan is collateral dependent (Level 3). Securities held to maturity may be written down to fair value (determined using the same techniques discussed above for securities available for sale) as a result of an other-than-temporary impairment, if any.
The following table presents the carrying value of financial instruments by level within the fair value hierarchy as of December 31, 2010 and 2009, for which a non-recurring change in fair value has been recorded.
|
(in thousands)
Description of Financial Instruments
|
Carrying Value
|
Quoted Prices in Active Markets for Identical Assets
(Level 1)
|
Significant Other Observable Inputs
(Level 2)
|
Significant Unobservable Inputs
(Level 3) (a)
|
Losses for the year ended December 31
(b)
|
|||||||||||||||
|
At December 31, 2010:
|
||||||||||||||||||||
|
Impaired loans carried at fair value (c)
|
$ | 8,635 | $ | --- | $ | --- | $ | 8,635 | $ | 4,610 | ||||||||||
|
At December 31, 2009:
|
||||||||||||||||||||
|
Impaired loans carried at fair value (c)
|
$ | 7,620 | $ | --- | $ | 406 | (d) | $ | 7,214 | $ | 4,887 | |||||||||
(a) Represents collateral-dependent loan principal balances that had been generally written down to the appraised value or estimated market value of the underlying collateral, net of specific valuation allowance of $936 thousand and $11 thousand at December 31, 2010 and 2009, respectively. The carrying value of loans fully charged-off, which includes unsecured lines of credit, overdrafts and all other loans, is zero.
(b) Represents net charge-offs during the period presented and the specific valuation allowance established on loans during the period.
(c) Represents the portion of impaired loans that have been written down to their fair value.
(d) Represents impaired loan principal balances net of specific valuation allowance of $34 thousand at December 31, 2009, determined using the discounted cash flow method.
Disclosures about Fair Value of Financial Instruments
The table below is a summary of fair value estimates for financial instruments as of December 31, 2010 and 2009, excluding financial instruments recorded at fair value on a recurring basis (summarized in a separate table). The carrying amounts in the following table are recorded in the statement of condition under the indicated captions. We have excluded nonfinancial assets and nonfinancial liabilities defined by the Codification (ASC 820-10-15-1A), such as Bank premises and equipment, deferred taxes and other liabilities. In addition, we have not disclosed the fair value of financial instruments specifically excluded from disclosure requirements of the Financial Instruments Topic 825 of the Codification (ASC 825-10-50-8), such as Bank-owned life insurance policies.
|
December 31, 2010
|
December 31, 2009
|
|||||||||||||||
|
Carrying
|
Fair
|
Carrying
|
Fair
|
|||||||||||||
|
(in thousands)
|
Amounts
|
Value
|
Amounts
|
Value
|
||||||||||||
|
Financial assets
|
||||||||||||||||
|
Cash and cash equivalents
|
$ | 85,232 | $ | 85,232 | $ | 38,660 | $ | 38,660 | ||||||||
|
Investment securities held to maturity
|
34,917 | 35,090 | 30,396 | 30,786 | ||||||||||||
|
Loans, net
|
929,008 | 952,763 | 907,130 | 891,117 | ||||||||||||
|
Interest receivable
|
4,207 | 4,207 | 4,338 | 4,338 | ||||||||||||
|
Financial liabilities
|
||||||||||||||||
|
Deposits
|
1,015,739 | 1,016,401 | 944,061 | 944,469 | ||||||||||||
|
Federal Home Loan Bank long-term borrowings
|
55,000 | 57,090 | 55,000 | 54,058 | ||||||||||||
|
Subordinated debenture
|
5,000 | 4,994 | 5,000 | 4,146 | ||||||||||||
|
Interest payable
|
414 | 414 | 317 | 317 | ||||||||||||
Following is a description of methods and assumptions used to estimate the fair value of each class of financial instrument not recorded at fair value but required for disclosure purposes:
Cash and Cash Equivalents – The carrying amounts of cash and cash equivalents approximate their fair value due to the short-term nature of these instruments.
Held-to-maturity Securities - Held-to-maturity securities, which generally consist of obligations of state & political subdivisions, are recorded at their amortized cost. Their fair value for disclosure purposes is determined using methodologies similar to those described above for available-for-sale securities using Level 2 inputs. If Level 2 inputs are not available, we may utilize pricing models that incorporate unobservable inputs that are supported by little or no market activity and that are significant to the fair value of the assets or liabilities (Level 3). As of December 31, 2010, we did not hold any securities whose fair value was measured using significant unobservable inputs.
Loans - The fair value of loans with variable interest rates approximates their current carrying value, because their rates are regularly adjusted to current market rates. The fair value of fixed rate loans or variable loans at negotiated interest rate floors or ceilings with remaining maturities in excess of one year is estimated by discounting the future cash flows using current market rates at which similar loans would be made to borrowers with similar credit worthiness and similar remaining maturities.
Interest Receivable and Payable - The interest receivable and payable balances approximate their fair value due to the short-term nature of their settlement dates.
Deposits - The fair value of non-interest bearing deposits, interest bearing transaction accounts, savings accounts and money market accounts is the amount payable on demand at the reporting date. The fair value of time deposits is estimated by discounting the future cash flows using current rates offered for deposits of similar remaining maturities.
Federal Home Loan Bank Long-Term Borrowings - The fair value is estimated by discounting the future cash flows using current rates offered by the FHLB for similar credit advances corresponding to the remaining duration of our fixed-rate credit advances.
Subordinated Debenture - The fair value of the subordinated debenture is estimated by discounting the future cash flows (interest payment at a rate of three-month LIBOR plus 2.48%) using current market rates at which similar bonds would be issued with similar credit ratings as ours and similar remaining maturities. We have used the spread of the nine-year BBB rated U.S. Bank Composite over LIBOR to calculate this credit-risk-related discount of future cash flows.
Commitments - Loan commitments and standby letters of credit generate ongoing fees, which are recognized over the term of the commitment period. In situations where the borrower's credit quality has declined, we record a reserve for these off-balance sheet commitments. Given the uncertainty in the likelihood and timing of a commitment being drawn upon, a reasonable estimate of the fair value of these commitments is the carrying value of the related unamortized loan fees plus the reserve, which is not material.
Note 11: Benefit Plans
In 2003, we established a Deferred Compensation Plan that allows key executive officers designated by the Board of Directors of the Bank to defer up to 80% of their salary and 100% of their annual bonus. Amounts deferred earn interest at a compounded rate set annually by the Board of Directors. The interest rate was set at 3.25% for both 2010 and 2009, and 7.25% for 2008. Our deferred compensation obligation of $2.8 million and $2.7 million at December 31, 2010 and 2009, respectively, is included in interest payable and other liabilities.
Our 401(k) Defined Contribution Plan (the “401(k) Plan”) commenced in May 1990 and is available to all regular employees at least eighteen years of age who complete ninety days of service. Under this plan employees can defer up to 50% of their total compensation, up to the maximum amount allowed by the Internal Revenue Code. The Bank will match 50% of each participant's contribution up to four thousand dollars annually. Employer contributions totaled $277 thousand, $311 thousand and $358 thousand for the years ended December 31, 2010, 2009 and 2008, respectively.
In 1999, the 401(k) Plan was amended to include an employee stock ownership component and was renamed the Bank of Marin Employee Stock Ownership and Savings Plan (the “Plan”). Under the terms of the Plan, as amended, the Board of Director’s determines a specific portion of the Bank's profits to be contributed to the ESOP each year either in common stock or in cash for the purchase of Bancorp stock to be allocated to all employees based on a set percentage of their salaries, regardless of whether an employee is participating in the 401(k) plan or not. For the years ended December 31, 2010, 2009 and 2008, the Bank contributed $898 thousand, $750 thousand and $749 thousand, respectively, to the ESOP by purchasing Bancorp stock in the open market. Contributions to the Plan for both the 401(k) employer matching contribution and for the ESOP are included in salaries and benefits expenses and vested at a rate of 20% per year over a five-year period. Generally, cash dividends on Bancorp’s stock held by the Plan are used to purchase additional shares in the open market. All shares of the Bancorp’s stock held by the Plan are included in the calculations of basic and diluted earnings per share.
In January 2010, the Plan was bifurcated into a separate 401(k) Plan and a separate ESOP Plan. Same eligibility criteria and employer contribution allocation apply under the ESOP Plan, while employees’ contributions are not permitted. For participants who join the ESOP on or after January 1, 2010, employer contributions vest 0% in year one, 20% in year two and 20% per year after that.
On January 1, 2011, we established a Salary Continuation Plan, the purpose of which is to provide a percentage of salary continuation benefits to a select group of executive management upon retirement. This Plan is unfunded and nonqualified for tax purposes and for purposes of Title I of the Employee Retirement Income Security Act of 1974.
Note 12: Income Taxes
The current and deferred components of the income tax provision for each of the three years ended December 31 are as follows:
|
(in thousands)
|
2010
|
2009
|
2008
|
|||||||||
|
Current tax provision
|
||||||||||||
|
Federal
|
$ | 6,602 | $ | 6,208 | $ | 6,809 | ||||||
|
State
|
2,293 | 2,069 | 2,258 | |||||||||
|
Total current
|
8,895 | 8,277 | 9,067 | |||||||||
|
Deferred tax (benefit) provision
|
||||||||||||
|
Federal
|
(503 | ) | (341 | ) | (902 | ) | ||||||
|
State
|
(221 | ) | (158 | ) | (287 | ) | ||||||
|
Total deferred
|
(724 | ) | (499 | ) | (1,189 | ) | ||||||
|
Total income tax provision
|
$ | 8,171 | $ | 7,778 | $ | 7,878 | ||||||
Income taxes related to changes in the unrealized gains and losses on available for sale securities are recorded directly to other comprehensive income in stockholders’ equity and are not included above. These income tax liabilities amounted to $672 thousand, $168 thousand, and $475 thousand in 2010, 2009 and 2008, respectively.
The following table shows the tax effect of our cumulative temporary differences as of December 31:
|
(in thousands)
|
2010
|
2009
|
||||||
|
Deferred tax assets:
|
||||||||
|
Allowance for loan losses and off-balance sheet commitments
|
$ | 5,423 | $ | 4,659 | ||||
|
Depreciation
|
- | 216 | ||||||
|
State franchise tax
|
787 | 737 | ||||||
|
Deferred compensation
|
1,164 | 1,120 | ||||||
|
Stock-based compensation
|
220 | 177 | ||||||
|
Deferred rent and other
|
438 | 298 | ||||||
|
Total gross deferred tax assets
|
8,032 | 7,207 | ||||||
|
Deferred tax liabilities:
|
||||||||
|
Loan origination costs
|
(275 | ) | (244 | ) | ||||
|
Net unrealized gain on securities available for sale
|
(1,121 | ) | (449 | ) | ||||
|
Depreciation
|
(63 | ) | - | |||||
|
Other
|
(20 | ) | (13 | ) | ||||
|
Total gross deferred tax liabilities
|
(1,479 | ) | (706 | ) | ||||
|
Net deferred tax assets
|
$ | 6,553 | $ | 6,501 | ||||
Based upon the level of historical taxable income and projections for future taxable income over the periods during which the deferred tax assets expect to be deductible, Management believes it is more likely than not we will realize the benefit of the deferred tax assets. Accordingly, no valuation allowance has been established as of December 31, 2010 or 2009.
The effective tax rate for 2010, 2009 and 2008 differs from the current Federal statutory income tax rate as follows:
|
2010
|
2009
|
2008
|
||||||||||
|
Federal statutory income tax rate
|
35.0 | % | 35.0 | % | 35.0 | % | ||||||
|
Increase (decrease) due to:
|
||||||||||||
|
California franchise tax, net of federal tax benefit
|
6.1 | 6.2 | 6.2 | |||||||||
|
Stock based compensation
|
0.2 | 0.4 | 0.7 | |||||||||
|
Tax exempt interest on municipal securities and loans
|
(2.7 | ) | (2.6 | ) | (2.1 | ) | ||||||
|
Tax exempt earnings on bank owned life insurance
|
(1.1 | ) | (1.2 | ) | (1.3 | ) | ||||||
|
Prior year tax adjustments
|
- | 0.3 | 0.9 | |||||||||
|
Other
|
0.1 | (0.2 | ) | (0.1 | ) | |||||||
|
Effective Tax Rate
|
37.6 | % | 37.9 | % | 39.3 | % | ||||||
Bancorp files a consolidated return in the U.S. Federal tax jurisdiction and a combined report in the State of California tax jurisdiction. Prior to the formation of Bancorp in 2007, the Bank filed in the U.S. Federal and California jurisdictions on a stand-alone basis. None of the entities are subject to examination by taxing authorities for years before 2007 for U.S. Federal or before 2006 for California.
We had no tax reserve for uncertain tax positions at December 31, 2010 and 2009. We do not anticipate providing a reserve for uncertain tax positions in the next twelve months. We have elected to record interest and penalties related to unrecognized tax benefits in tax expense. During the years ended December 31, 2010, 2009 and 2008, neither the Bank nor Bancorp had an accrual for interest and penalties associated with uncertain tax positions.
Note 13: Commitments and Contingencies
We rent certain premises and equipment under long-term non-cancelable operating leases expiring at various dates through the year 2024. Most of the leases contain certain renewal options and escalation clauses. At December 31, 2010, the approximate minimum future commitments payable under non-cancelable contracts for leased premises are as follows:
|
(in thousands)
|
2011
|
2012
|
2013
|
2014
|
2015
|
Thereafter
|
Total
|
|||||||||||||||||||||
|
Operating leases
|
$ | 2,440 | $ | 2,441 | $ | 2,432 | $ | 2,317 | $ | 2,387 | $ | 15,492 | $ | 27,509 | ||||||||||||||
Rent expense included in occupancy expense totaled $2.9 million, $2.8 million and $2.5 million in 2010, 2009 and 2008, respectively.
We may be party to legal actions which arise from time to time as part of the normal course of our business. We believe, after consultation with legal counsel, that we have meritorious defenses in these actions, and that litigation contingency liability, if any, will not have a material adverse effect on our financial position, results of operations, or cash flows.
As a member bank of Visa U.S.A., we are responsible for our proportionate share of certain litigation indemnification obligations to Visa U.S.A. In November 2007, Visa Inc. settled an antitrust litigation with American Express Travel Related Services (“AMEX”) for $2.1 billion. We recorded a liability of $242 thousand in the fourth quarter of 2007 representing our proportionate share related to anti-trust charges and interchange fees, including $142 thousand for the AMEX litigation and $100 thousand estimated for other antitrust litigation. In March of 2008, we reversed our liability because, subsequent to Visa Inc.’s IPO on March 19, 2008, it established an escrow account for $3.0 billion from which it paid the initial amount owed under the AMEX settlement and planned to pay the required quarterly AMEX payments and additional identified antitrust settlements as they occurred. The funding of the escrow was accomplished through a reduction in the conversion factor of Visa Inc. Class B shares held by the member banks that are available for conversion to Class A shares as allowed by the Retrospective Responsibility Plan outlined in the Form S-1 filed by Visa Inc. on November 9, 2007.
On October 27, 2008 Visa Inc. announced a settlement with the other major antitrust litigant, Discover Financial Services, Inc., for $1.9 billion, of which $1.7 billion is the responsibility of member banks. On December 19, 2008 Visa Inc. deposited another $1.1 billion directly into the litigation escrow account to cover the settlement through a further reduction in the conversion factor of Visa Inc. Class B shares. In September 2009, Visa’s settlement obligations were fully satisfied to Discover. Our proportionate share of the potential exposure related to the remaining open cases (the Attridge Litigation and other putative class actions) is not expected to be material. We do not expect any future cash settlement payments to be required by us on the covered litigation.
As permitted or required under California law and to the maximum extent allowable under that law, we have certain obligations to indemnify our current and former officers and directors for certain events or occurrences while the officer or director is, or was serving, at our request in such capacity. These indemnification obligations are valid as long as the director or officer acted in good faith and in a manner the person reasonably believed to be in or not opposed to the best interests of the corporation, and, with respect to any criminal action or proceeding, had no reasonable cause to believe his or her conduct was unlawful. The maximum potential amount of future payments we could be required to make under these indemnification obligations is unlimited; however, we have a director and officer insurance policy that mitigates our exposure and enables us to recover a portion of any future amounts paid. We believe the estimated fair value of these indemnification obligations is minimal.
Note 14: Concentrations of Credit Risk
Concentration of credit risk is the risk associated with a lack of diversification, such as having substantial investments in a few individual issuers, thereby exposing us to greater risks resulting from adverse economic, political, regulatory, geographic, industrial or credit developments. Financial instruments that potentially subject us to concentrations of credit risk consist primarily of cash and cash equivalents, investment securities and loans.
Our cash in correspondent bank accounts, at times, may exceed FDIC insured limits. We place cash and cash equivalents with high quality financial institutions, periodically monitor their credit worthiness and limit the amount of credit exposure with any one institution. Concentrations of credit risk with respect to investment securities are limited to the U.S. Government, its agencies and Government Sponsored Enterprises. Our exposure, which primarily results from positions in securities available for sale issued by the U.S. Government, and its agencies, was $95.3 million, or 65% of our total investment portfolio at December 31, 2010.
We also manage our credit exposure related to our loan portfolio to avoid the risk of undue concentration of credits in a particular industry by reducing significant exposure to highly leveraged transactions or to any individual customer or counterparty, and by obtaining collateral as appropriate. No individual borrower accounts for more than 5% of loans held in the portfolio. The largest loan concentration group by industry is real estate, which account for 77% of our loan portfolio at December 31, 2010.
Note 15: Derivative Financial Instruments and Hedging Activities
We have entered into interest rate swap agreements, primarily as an asset/liability management strategy, in order to mitigate the changes in the fair value of specified long-term fixed-rate loans (or firm commitments to enter into long-term fixed-rate loans) caused by changes in interest rates. These hedges allow us to offer long-term fixed rate loans to customers without assuming the interest rate risk of a long-term asset. Converting our fixed-rate interest stream to a floating-rate interest stream, generally benchmarked to the one-month U.S. dollar LIBOR index, protects us against changes in the fair value of our loans otherwise associated with fluctuating interest rates.
The fixed-rate payment features of the interest rate swap agreements are generally structured at inception to mirror all of the provisions of the hedged loan agreements. These interest rate swaps, designated and qualified as fair value hedges, are carried on the balance sheet at their fair value in other assets (when the fair value is positive) or in other liabilities (when the fair value is negative). One of our interest rate swap agreements qualifies for shortcut hedge accounting treatment. The change in fair value of the swap using the shortcut accounting treatment is recorded in other non-interest income, while the change in fair value of swaps using non-shortcut accounting is recorded in interest income. The unrealized gain or loss in fair value of the hedged fixed-rate loan is recorded as an adjustment to the hedged loan and offset in other non-interest income (for shortcut accounting treatment) or interest income (for non-shortcut accounting treatment).
From time to time, we make firm commitments to enter into long-term fixed-rate loans with borrowers backed by yield maintenance agreements and simultaneously enter into forward interest rate swap agreements with correspondent banks to mitigate the change in fair value of the yield maintenance agreement. Prior to loan funding, yield maintenance agreements with net settlement features that meet the definition of a derivative are considered as non-designated hedges and are carried on the balance sheet at their fair value in other assets (when the fair value is positive) or in other liabilities (when the fair value is negative). The offsetting changes in the fair value of the forward swap and the yield maintenance agreement are recorded in interest income. In June 2007 and August 2010, previously undesignated forward swaps were designated to offset the change in fair value of a fixed-rate loan originated in each of those periods. Since designation, the related yield maintenance agreements are no longer considered derivatives. Their fair value at the designation date was recorded in other assets and is amortized using the effective yield method over the life of the respective designated loans.
The net effect of the change in fair value of interest rate swaps, the amortization of the yield maintenance agreement and the change in the fair value of the hedged loans results in an insignificant amount of hedge ineffectiveness recognized in interest income.
Our credit exposure, if any, on interest rate swaps is limited to the net favorable value (net of any collateral pledged) and interest payments of all swaps by each counterparty. Conversely, when an interest rate swap is in a liability position exceeding a certain threshold, we are required to post collateral to the counterparty in an amount determined by the agreements (generally when our derivative liability position is greater than $100 thousand or $1.3 million, depending upon the counterparty). Collateral levels are monitored and adjusted on a regular basis for changes in interest rate swap values. The aggregate fair value of all derivative instruments that are in a liability position and have collateral requirements on December 31, 2010 is $2.5 million, for which we have posted collateral in the form of securities available for sale totaling $3.7 million.
As of December 31, 2010, we had five interest rate swap agreements, which are scheduled to mature in September 2018, April 2019, June 2020, August 2020 and June 2022. All of our derivatives are accounted for as fair value hedges. Our interest rate swaps are settled monthly with counterparties. Accrued interest on the swaps totaled $64 thousand as of December 31, 2010. Information on our derivatives follows:
|
Asset derivatives
|
Liability derivatives
|
|||||||||||||||
|
(in thousands)
|
December 31,
2010
|
December 31,
2009
|
December 31,
2010
|
December 31,
2009
|
||||||||||||
|
Fair value hedges
|
||||||||||||||||
|
Interest rate contracts notional amount
|
--- | $ | 1,905 | $ | 23,132 | $ | 17,076 | |||||||||
|
Credit risk amount
|
--- | 35 | --- | --- | ||||||||||||
|
Interest rate contracts fair value (1)
|
--- | 35 | 2,470 | 1,624 | ||||||||||||
|
Balance sheet location
|
Other assets
|
Other assets
|
Other liabilities
|
Other liabilities
|
||||||||||||
|
Year ended December 31,
|
||||||||||||
|
(in thousands)
|
2010
|
2009
|
2008
|
|||||||||
|
(Decrease) increase in value of designated interest rate swaps recognized in interest income
|
$ | (881 | ) | $ | 1,866 | $ | (2,809 | ) | ||||
|
(Payment) receipt on interest rate swaps recorded in interest income
|
(895 | ) | (849 | ) | (352 | ) | ||||||
|
Increase (decrease) in value of hedged loans recognized in interest income
|
575 | (1,942 | ) | 2,841 | ||||||||
|
Increase (decrease) in value of yield maintenance agreement recognized against interest income
|
254 | (19 | ) | (21 | ) | |||||||
|
Net (loss) gain on derivatives recognized in interest income (2)
|
$ | (947 | ) | $ | (944 | ) | $ | (341 | ) | |||
(1) See Note 10 for valuation methodology.
(2) Ineffectiveness of ($52) thousand, ($95) thousand and $11 thousand was recorded in interest income during the years ended December 31, 2010, 2009 and 2008, respectively. The full change in value of swaps was included in the assessment of hedge effectiveness.
Note 16: Regulatory Matters
We are subject to various regulatory capital requirements administered by the federal banking agencies. Failure to meet minimum capital requirements can initiate certain mandatory, and possibly additional discretionary, actions by regulators that, if undertaken, could have a material effect on our consolidated financial statements. Under capital adequacy guidelines and the regulatory framework for prompt corrective action, we must meet specific capital guidelines that involve quantitative measures of our assets, liabilities, and certain off-balance sheet items as calculated under regulatory accounting practices. The capital amounts and our prompt corrective action classification are also subject to qualitative judgments by the regulators about components, risk weightings and other factors. Prompt corrective action provisions are not applicable to bank holding companies such as Bancorp.
Quantitative measures established by regulation to ensure capital adequacy requires us to maintain minimum amounts and ratios (set forth in the table below) of total and Tier 1 capital to risk weighted assets and of Tier 1 capital to quarterly average assets.
Our capital adequacy ratios are presented in the following tables. Capital ratios are reviewed by Management on a regular basis to ensure that capital exceeds the prescribed regulatory minimums and is adequate to meet our anticipated future needs. For all periods presented, our ratios exceed the regulatory definition of well capitalized under the regulatory framework for prompt corrective action (Bank level) and capital adequacy purposes (Bancorp level).
|
Capital Ratios for the Bancorp:
|
Ratio for Capital
|
|||||||||
|
(Dollars in thousands)
|
Actual Ratio
|
Adequacy Purposes
|
||||||||
|
As of December 31, 2010
|
Amount
|
Ratio
|
Amount
|
Ratio
|
||||||
|
Total Capital (to risk-weighted assets)
|
$ | 138,545 | 13.34 | % |
>$83,068
|
>8.0%
|
||||
|
Tier 1 Capital (to risk-weighted assets)
|
$ | 120,375 | 11.59 | % |
>$41,534
|
>4.0%
|
||||
|
Tier 1 Capital (to average assets)
|
$ | 120,375 | 9.91 | % |
>$48,566
|
>4.0%
|
||||
|
As of December 31, 2009
|
Amount
|
Ratio
|
Amount
|
Ratio
|
||||||
|
Total Capital (to risk-weighted assets)
|
$ | 124,515 | 12.33 | % |
>$80,819
|
>8.0%
|
||||
|
Tier 1 Capital (to risk-weighted assets)
|
$ | 108,433 | 10.73 | % |
>$40,410
|
>4.0%
|
||||
|
Tier 1 Capital (to average assets)
|
$ | 108,433 | 9.43 | % |
>$45,988
|
>4.0%
|
||||
|
Capital Ratios for the Bank:
(Dollars in thousands)
|
Actual Ratio
|
Ratio for Capital
Adequacy Purposes |
Ratio to be Well
Capitalized Under |
|||||||||
|
As of December 31, 2010
|
Amount
|
Ratio
|
Amount
|
Ratio
|
Amount
|
Ratio
|
||||||
|
Total Capital (to risk-weighted assets)
|
$ | 131,817 | 12.70 | % |
>$83,067
|
>8.0%
|
>$103,834
|
>10.0%
|
||||
|
Tier 1 Capital (to risk-weighted assets)
|
$ | 113,647 | 10.95 | % |
>$41,533
|
>4.0%
|
>$62,300
|
>6.0%
|
||||
|
Tier 1 Capital (to average assets)
|
$ | 113,647 | 9.36 | % |
>$48,566
|
>4.0%
|
>$60,708
|
>5.0%
|
||||
|
As of December 31, 2009
|
Amount
|
Ratio
|
Amount
|
Ratio
|
Amount
|
Ratio
|
||||||
|
Total Capital (to risk-weighted assets)
|
$ | 117,189 | 11.60 | % |
>$80,819
|
>8.0%
|
>$101,024
|
>10.0%
|
||||
|
Tier 1 Capital (to risk-weighted assets)
|
$ | 101,107 | 10.01 | % |
>$40,410
|
>4.0%
|
>$60,614
|
>6.0%
|
||||
|
Tier 1 Capital (to average assets)
|
$ | 101,107 | 8.79 | % |
>$45,988
|
>4.0%
|
>$57,485
|
>5.0%
|
||||
Note 17: Financial Instruments with Off-Balance Sheet Risk
We make commitments to extend credit in the normal course of business to meet the financing needs of our customers. These financial instruments include commitments to extend credit in the form of loans or through standby letters of credit. Commitments to extend credit are agreements to lend to a customer as long as there is no violation of any condition established in the contract. Commitments generally have fixed expiration dates or other termination clauses and may require payment of a fee. Since many of the commitments are expected to expire without being drawn upon, the total commitment amount does not necessarily represent future cash requirements.
We are exposed to credit loss equal to the contract amount of the commitment in the event of nonperformance by the borrower. We use the same credit policies in making commitments as we do for on-balance-sheet instruments and we evaluate each customer's creditworthiness on a case-by-case basis. The amount of collateral obtained, if deemed necessary by us, is based on Management's credit evaluation of the borrower. Collateral held varies, but may include accounts receivable, inventory, property, plant and equipment, and real property.
The contract amount of loan commitments and standby letters of credit not reflected on the consolidated statement of condition was $252.7 million at December 31, 2010 at rates ranging from 1.91% to 8.25%. This amount included $143.8 million under commercial lines of credit (these commitments are contingent upon customers maintaining specific credit standards), $73.5 million under revolving home equity lines, $22.7 million under undisbursed construction loans, $8.9 million under personal and other lines of credit, and a remaining $3.8 million under standby letters of credit. We have set aside an allowance for losses in the amount of $505 thousand for these commitments, which is recorded in interest payable and other liabilities. Approximately 38% of the commitments expire in 2011 and approximately 62% expire between 2012 and 2020.
Note 18: Condensed Bank of Marin Bancorp Parent Only Financial Statements
Presented below is financial information for Bank of Marin Bancorp, parent holding company only.
|
CONDENSED UNCONSOLIDATED STATEMENTS OF CONDITION
|
|
at December 31, 2010 and 2009
|
|
(in thousands)
|
December 31, 2010
|
December 31, 2009
|
||||||
|
Assets
|
||||||||
|
Cash and due from Bank of Marin
|
$ | 6,688 | $ | 7,299 | ||||
|
Investment in subsidiary
|
115,192 | 101,725 | ||||||
|
Other assets
|
79 | 73 | ||||||
|
Total assets
|
$ | 121,959 | $ | 109,097 | ||||
|
Liabilities and Stockholders' Equity
|
||||||||
|
Accrued expenses payable
|
$ | 39 | $ | 46 | ||||
|
Total liabilities
|
39 | 46 | ||||||
|
Stockholders' equity
|
121,920 | 109,051 | ||||||
|
Total liabilities and stockholders' equity
|
$ | 121,959 | $ | 109,097 | ||||
CONDENSED UNCONSOLIDATED STATEMENTS OF INCOME
for the years ended December 31, 2010, 2009 and 2008
|
(in thousands)
|
December 31, 2010
|
December 31, 2009
|
December 31, 2008
|
|||||||||
|
Income
|
||||||||||||
|
Dividends from Bank of Marin (a)
|
$ | 3,000 | $ | 37,750 | $ | 3,250 | ||||||
|
Total income
|
3,000 | 37,750 | 3,250 | |||||||||
|
Expense
|
||||||||||||
|
Non-interest expense
|
713 | 698 | 651 | |||||||||
|
Total expense
|
713 | 698 | 651 | |||||||||
|
Income before income taxes and equity in undistributed net income of subsidiary
|
2,287 | 37,052 | 2,599 | |||||||||
|
Income tax benefit
|
300 | 273 | 267 | |||||||||
|
Income before equity in undistributed net income of subsidiary
|
2,587 | 37,325 | 2,866 | |||||||||
|
Equity in undistributed net income of subsidiary
|
10,965 | (24,560 | ) | 9,284 | ||||||||
|
Net income
|
$ | 13,552 | $ | 12,765 | $ | 12,150 | ||||||
|
Preferred stock dividends and accretion
|
--- | (1,299 | ) | (113 | ) | |||||||
|
Net income available to common shareholders
|
$ | 13,552 | $ | 11,466 | $ | 12,037 | ||||||
(a) In 2009, the Bank made a $28.0 million dividend to Bancorp to fund Bancorp's repurchase of preferred stock, as well as $9.8 million dividends to cover Bancorp's operational needs and cash dividends to shareholders.
|
CONDENSED UNCONSOLIDATED STATEMENTS OF CASH FLOWS
|
|
for the years ended December 31, 2010, 2009 and 2008
|
|
(in thousands)
|
December 31, 2010
|
December 31, 2009
|
December 31, 2008
|
|||||||||
|
Cash Flows from Operating Activities:
|
||||||||||||
|
Net income
|
$ | 13,552 | $ | 12,765 | $ | 12,150 | ||||||
|
Adjustments to reconcile net income to net cash used in operating activities:
|
||||||||||||
|
Equity in undistributed and distributed net income of subsidiary
|
(13,965 | ) | (13,190 | ) | (12,534 | ) | ||||||
|
Net change in operating assets and liabilities
|
||||||||||||
|
Other assets
|
(6 | ) | 7 | 99 | ||||||||
|
Other liabilities
|
13 | (18 | ) | 88 | ||||||||
|
Intercompany payable
|
- | (47 | ) | 47 | ||||||||
|
Net cash used in operating activities
|
(406 | ) | (483 | ) | (150 | ) | ||||||
|
Cash Flows from Investing Activities:
|
||||||||||||
|
Capital contribution to subsidiary
|
(912 | ) | (897 | ) | (29,384 | ) | ||||||
|
Net cash used in investing activities
|
(912 | ) | (897 | ) | (29,384 | ) | ||||||
|
Cash Flows from Financing Activities:
|
||||||||||||
|
Repurchase of preferred stock
|
--- | (28,000 | ) | --- | ||||||||
|
Proceeds from issuance of preferred stock
|
--- | --- | 27,039 | |||||||||
|
Proceeds from issuance of warrants
|
--- | --- | 961 | |||||||||
|
Stock options exercised and employee stock purchases
|
912 | 897 | 1,384 | |||||||||
|
Dividends paid on common stock
|
(3,205 | ) | (2,960 | ) | (2,882 | ) | ||||||
|
Dividends received from subsidiary
|
3,000 | 37,750 | 3,250 | |||||||||
|
Preferred stock dividend
|
--- | (451 | ) | --- | ||||||||
|
Stock repurchased
|
--- | --- | (2,526 | ) | ||||||||
|
Net cash provided by financing activities
|
707 | 7,236 | 27,226 | |||||||||
|
Net (decrease) increase in cash and cash equivalents
|
(611 | ) | 5,856 | (2,308 | ) | |||||||
|
Cash and cash equivalents at beginning of period
|
7,299 | 1,443 | 3,751 | |||||||||
|
Cash and cash equivalents at end of period
|
$ | 6,688 | $ | 7,299 | $ | 1,443 | ||||||
|
Supplemental schedule of non-cash financing activities:
|
||||||||||||
|
Accretion of preferred stock
|
$ | --- | $ | 945 | $ | 16 | ||||||
|
Dividend payable to preferred stockholder
|
--- | --- | 97 | |||||||||
|
Stock issued in payment of director fees
|
200 | 233 | 247 | |||||||||
Note 19: Subsequent Event
On February 18, 2011, we entered into a modified whole-bank purchase and assumption agreement without loss share with the FDIC, the receiver of Charter Oak Bank of Napa, California, to purchase certain assets and assume certain liabilities of Charter Oak Bank (the “P&A Agreement”). The purchase price reflected an asset discount of $19.8 million and no deposit premium.
At December 31, 2010, Charter Oak Bank reported gross loans totaling $107.0 million and deposits totaling $105.3 million. Loans at the former Charter Oak Bank’s book values totaling approximately $28.5 million as of the bid valuation date (October 18, 2010) were retained by the FDIC. The excluded loans mainly represent loans delinquent more than sixty days or more as of the bid valuation date and certain types of land and construction loans. Balances are subject to change based upon the activities between the bid valuation date and the purchase date. The assets acquired and liabilities assumed are also subject to fair value adjustments in accordance with FASB ASC 805, Business Combinations upon finalizing the valuation process.
Due to the timing of the acquisition and the substantial effort required to determine the fair values of the assets purchased and liabilities assumed, the accounting for the acquisition is not complete at the time the accompanying consolidated financial statements are filed. Until the fair values are established, any goodwill or bargain purchase gain to be recognized resulting from the acquisition during the first quarter of 2011 has not been determined.
The P&A Agreement only covers designated assets and liabilities of Charter Oak Bank. Common stock of Charter Oak Bank, certain assets and certain liabilities, such as claims against any officer, director, employee, accountant, attorney, or any other person employed by the former Charter Oak Bank, were not purchased or assumed by us.
End of 2010 Audited Consolidated Financial Statements
|
CHANGES IN AND DISAGREEMENTS WITH ACCOUNTANTS ON ACCOUNTING AND FINANCIAL DISCLOSURE
|
None.
|
ITEM 9A.
|
CONTROLS AND PROCEDURES
|
|
(A)
|
Evaluation of Disclosure Controls and Procedures
|
We conducted an evaluation under the supervision and with the participation of our management, including our Chief Executive Officer and Chief Financial Officer, or persons performing similar functions, of the effectiveness of the design and operation of our disclosure controls and procedures (as defined in Rule 13a-15(e) or 15d-15(e) under the Exchange Act of 1934 (the “Act”)) as of December 31, 2010. Based upon that evaluation, our Chief Executive Officer and Chief Financial Officer concluded that our disclosure controls and procedures were effective as of December 31, 2010.
The term disclosure controls and procedures means controls and other procedures that are designed to ensure that information required to be disclosed by us in the reports that we file or submit under the Act (15 U.S.C. 78a et seq.) is recorded, processed, summarized and reported, within the time periods specified in the Commission's rules and forms. Disclosure controls and procedures include, without limitation, controls and procedures designed to ensure that information required to be disclosed by us in the reports that we file or submit under the Act is accumulated and communicated to our Management, including our principal executive and principal financial officers, or persons performing similar functions, as appropriate to allow timely decisions regarding required disclosure.
There are inherent limitations to the effectiveness of any system of disclosure controls and procedures. These limitations include the possibility of human error, the circumvention or overriding of the controls and procedures and reasonable resource constraints. In addition, because we have designed our system of controls based on certain assumptions, which we believe are reasonable, about the likelihood of future events, our system of controls may not achieve its desired purpose under all possible future conditions. Accordingly, our disclosure controls and procedures provide reasonable assurance, but not absolute assurance, of achieving their objectives.
|
(B)
|
Management's Annual Report on Internal Control over Financial Reporting
|
Our Management’s report on Internal Control over Financial Reporting is set forth in Item 8 and is incorporated herein by reference.
Our internal control over financial reporting is designed to provide reasonable, but not absolute, assurance regarding the financial reporting and the preparation of financial statements in accordance with generally accepted accounting principles. There are inherent limitations to the effectiveness of any system of internal control over financial reporting. These limitations include the possibility of human error, the circumvention of overriding of the system and reasonable resource constraints. Because of its inherent limitations, our internal control over financial reporting may not prevent or detect misstatements. Projections of any evaluation of effectiveness to future periods are subject to the risks discussed in Item 1A-Risk Factors in this report.
Our registered public accounting firm has issued an audit report on our internal control over financial reporting. See (C) below.
|
(C)
|
Attestation Report of the Registered Public Accounting Firm
|
The Attestation Report of the Registered Public Accounting firm required to be furnished pursuant to this item is set forth in Item 8 and is incorporated herein by reference.
|
(D)
|
Changes in Internal Controls
|
During the quarter ended December 31, 2010, there was no significant change in our internal control over financial reporting identified in connection with the evaluation mentioned in (B) above, that has materially affected, or is reasonably likely to materially affect, our internal control over financial reporting.
None.
|
DIRECTORS, EXECUTIVE OFFICERS AND CORPORATE GOVERNANCE
|
The information required by this Item is incorporated by reference from our Proxy Statement for the 2011 Annual Meeting of Shareholders. Bancorp and the Bank have adopted a Code of Ethics that applies to all staff including the Chief Executive Officer, Chief Financial Officer and Controller. A copy of the Code of Ethics will be provided to any person, without charge, upon written request to Corporate Secretary, Bank of Marin Bancorp, 504 Redwood Boulevard, Suite 100, Novato, CA 94947.
|
EXECUTIVE COMPENSATION
|
The information required by this Item is incorporated by reference from our Proxy Statement for the 2011 Annual Meeting of Shareholders.
|
SECURITY OWNERSHIP OF CERTAIN BENEFICIAL OWNERS AND MANAGEMENT AND RELATED STOCKHOLDER MATTERS
|
The information required by this Item is incorporated by reference from Item 5 above, Note 9 to our audited consolidated financial statements and our Proxy Statement for the 2011 Annual Meeting of Shareholders.
|
CERTAIN RELATIONSHIPS AND RELATED TRANSACTIONS, AND DIRECTOR INDEPENDENCE
|
The information required by this Item is incorporated by reference from our Proxy Statement for the 2011 Annual Meeting of Shareholders.
|
PRINCIPAL ACCOUNTANT FEES AND SERVICES
|
The information required by this Item is incorporated by reference from our Proxy Statement for the 2011 Annual Meeting of Shareholders.
|
ITEM 15.
|
EXHIBITS AND FINANCIAL STATEMENT SCHEDULES
|
|
(A)
|
Documents Filed as Part of this Report
|
|
|
1.
|
Financial Statements
|
The financial statements and supplementary data listed below are filed as part of this report under Item 8, captioned Financial Statements and Supplementary Data.
Report of Independent Registered Public Accounting Firm for the years ended December 31, 2010, 2009 and 2008
Management’s Report on Internal Control over Financial Reporting
Consolidated Statement of Condition as of December 31, 2010 and 2009
Consolidated Statement of income for the Years Ended December 31, 2010, 2009 and 2008
Consolidated Statement of Changes in Stockholders' Equity for the Years Ended December 31, 2010, 2009 and 2008
Consolidated Statement of Cash Flows for the Years Ended December 31, 2010, 2009 and 2008
Notes to Consolidated Financial Statements
|
|
2.
|
Financial Statement Schedules
|
All financial statement schedules have been omitted, as they are inapplicable or the required information is included in the financial statements or notes thereto.
|
(B)
|
Exhibits Filed
|
|
Number
|
Description of Exhibit
|
|
|
3.01
|
Articles of Incorporation, as amended, is incorporated by reference to Exhibit 3.01 to Bancorp’s Quarterly Report on Form 10-Q for the quarterly period ended September 30, 2007*.
|
|
|
3.02
|
Bylaws, as amended.
|
|
|
4.01
|
Rights Agreement dated as of July 2, 2007 is incorporated by reference to Exhibit 4.1 to Registration Statement on Form 8-A12B filed with the Securities and Exchange Commission on July 2, 2007*.
|
|
|
4.02
|
Form of Warrant for Purchase of Shares of Common Stock, as amended, is incorporated by reference to Exhibit 4.4 to the Post Effective Amendment to Form S-3 filed with the Securities and Exchange Commission on April 28, 2009*.
|
|
|
10.01
|
2007 Employee Stock Purchase Plan is incorporated by reference to Exhibit 4.1 to Registration Statement on Form S-8 filed with the Securities and Exchange Commission on July 24, 2007*.
|
|
|
10.02
|
1989 Stock Option Plan is incorporated by reference to Exhibit 4.1 to Registration Statement on Form S-8 filed with the Securities and Exchange Commission on July 24, 2007*.
|
|
|
10.03
|
1999 Stock Option Plan is incorporated by reference to Exhibit 4.1 to Registration Statement on Form S-8 filed with the Securities and Exchange Commission on July 24, 2007*.
|
|
|
10.04
|
2007 Equity Plan is incorporated by reference to Exhibit 4.1 to Registration Statement on Form S-8 filed with the Securities and Exchange Commission on July 24, 2007*.
|
|
|
10.05
|
Form of Change in Control Agreement is incorporated by reference to Exhibit 10.01 to Current Report on Form 8-K filed with the Securities and Exchange Commission on October 31, 2007*.
|
|
|
10.06
|
Form of Indemnification Agreement for Directors and Executive Officers dated August 9, 2007 is incorporated by reference to Exhibit 10.06 to Bancorp’s Quarterly Report on Form 10-Q for the quarterly period ended September 30, 2007*.
|
|
|
10.07
|
Form of Employment Agreement with Russell Colombo, Chief Executive Officer, dated January 23, 2009 is incorporated by reference to Exhibit 10.1 to Current Report on Form 8-K filed with the Securities and Exchange Commission on January 26, 2009*.
|
|
|
10.08
|
2010 Director Stock Plan is incorporated by reference to Exhibit 4.1 to Registration Statement on Form S-8 filed with the Securities and Exchange Commission on June 21, 2010*.
|
|
|
10.09
|
2010 Annual Individual Incentive Compensation Plan is incorporated by reference to Exhibit 99.1 to Form 8-K filed with the Securities and Exchange Commission on October 21, 2010*.
|
|
|
10.10
|
Salary Continuation Agreement with four executive officers, Russell Colombo, Chief Executive Officer, Christina Cook, Chief Financial Officer, Kevin Coonan, Chief Credit Officer, and Peter Pelham, Director of Retail Banking, dated January 1, 2011 is incorporated by reference to Exhibits 10.1 (Colombo), 10.2 (Cook), 10.3 (Coonan), and 10.4 (Pelham) to Current Report on Form 8-K filed with the Securities and Exchange Commission on January 6, 2011*.
|
|
|
11.01
|
Earnings Per Share Computation - included in Note 1 to the Consolidated Financial Statements.
|
|
|
14.01
|
Code of Ethical Conduct is incorporated by reference to Exhibit 14.01 to Current Report on Form 8-K filed with the Securities and Exchange Commission on June 26, 2008*.
|
|
|
23.01
|
Consent of Moss Adams LLP.
|
|
|
31.01
|
Certification of Principal Executive Officer pursuant to Rule 13a-14(a)/15d-14(a) as adopted pursuant to Section 302 of the Sarbanes-Oxley Act of 2002.
|
|
|
31.02
|
Certification of Principal Financial Officer pursuant to Rule 13a-14(a)/15d-14(a) as adopted pursuant to Section 302 of the Sarbanes-Oxley Act of 2002.
|
|
|
32.01
|
Certification pursuant to 18 U.S.C. Section 1350 as adopted pursuant to Section 906 of the Sarbanes-Oxley Act of 2002.
|
* Previously Filed
Pursuant to the requirements of Section 13 of the Securities Exchange Act of 1934, Bancorp has duly caused this report to be signed on its behalf by the undersigned thereunto duly authorized.
|
Bank of Marin Bancorp
|
|
|
Dated: March 8, 2011
|
/s/ Russell A. Colombo
|
|
Russell A. Colombo
|
|
|
President &
|
|
|
Chief Executive Officer
|
|
|
Dated: March 8, 2011
|
/s/ Christina J. Cook
|
|
Christina J. Cook
|
|
|
Executive Vice President &
|
|
|
Chief Financial Officer
|
|
|
Dated: March 8, 2011
|
/s/ Larry R. Olafson
|
|
Larry R. Olafson
|
|
|
Controller
|
Pursuant to the requirements of the Securities Exchange Act of 1934, this report has been signed below by the following persons on behalf of the registrant and in the capacities and on the dates indicated.
|
Members of Bank of Marin Bancorp's
|
||||||
|
Board of Directors
|
||||||
|
Dated: March 8, 2011
|
/s/ Joel Sklar
|
|||||
|
Joel Sklar, M.D.
|
||||||
|
Chairman of the Board
|
||||||
|
Dated: March 8, 2011
|
/s/ Russell A. Colombo
|
|||||
|
Russell A. Colombo
|
||||||
|
President & Chief Executive Officer
|
||||||
|
Dated: March 8, 2011
|
/s/ Thomas M. Foster
|
|||||
|
Thomas M. Foster
|
||||||
|
Dated: March 8, 2011
|
/s/ Robert Heller
|
|||||
|
Robert Heller
|
||||||
|
Dated: March 8, 2011
|
/s/ Norma J. Howard
|
|||||
|
Norma J. Howard
|
||||||
|
Dated: March 8, 2011
|
/s/ Stuart D. Lum
|
|||||
|
Stuart D. Lum
|
||||||
|
Dated: March 8, 2011
|
/s Joseph D. Martino
|
|||||
|
Joseph D. Martino
|
||||||
|
Dated: March 8, 2011
|
/s/ William H. McDevitt, Jr.
|
|||||
|
William H. McDevitt, Jr.
|
||||||
|
Dated: March 8, 2011
|
/s/ Brian M. Sobel
|
|||||
|
Brian M. Sobel
|
||||||
|
Dated: March 8, 2011
|
/s/ J. Dietrich Stroeh
|
|||||
|
J. Dietrich Stroeh
|
||||||
|
Dated: March 8, 2011
|
/s/ Jan I. Yanehiro
|
|||||
|
Jan I. Yanehiro
|
||||||
|
Exhibit Number
|
Description
|
Location
|
||
|
Bylaws, as amended.
|
Filed herewith.
|
|||
|
Consent of Moss Adams LLP.
|
Filed herewith.
|
|||
|
Certification of Principal Executive Officer pursuant to Rule 13a-14(a)/15d-14(a) as adopted pursuant to §302 of the Sarbanes-Oxley Act of 2002.
|
Filed herewith.
|
|||
|
Certification of Principal Financial Officer pursuant to Rule 13a-14(a)/15d-14(a) as adopted pursuant to §302 of the Sarbanes-Oxley Act of 2002.
|
Filed herewith.
|
|||
|
Certification pursuant to 18 U.S.C. §1350 as adopted pursuant to §906 of the Sarbanes-Oxley Act of 2002.
|
Furnished herewith.
|
Page - 96