Attached files
| file | filename |
|---|---|
| EX-21 - EXHIBIT 21 - ACME UNITED CORP | acme_10k123110ex21.htm |
| EX-31.2 - EXHIBIT 31.2 - ACME UNITED CORP | acme_10k123110ex312.htm |
| EX-31.1 - EXHIBIT 31.1 - ACME UNITED CORP | acme_10k123110ex311.htm |
| EX-32.1 - EXHIBIT 32.1 - ACME UNITED CORP | acme_10k123110ex321.htm |
| EX-23.2 - EXHIBIT 23.2 - ACME UNITED CORP | acme_10k123110ex232.htm |
| EX-23.1 - EXHIBIT 23.1 - ACME UNITED CORP | acme_10k123110ex231.htm |
| EX-32.2 - EXHIBIT 32.2 - ACME UNITED CORP | acme_10k123110ex322.htm |
| EX-10.11 - EXHIBIT 10.11 - ACME UNITED CORP | acme_10k123110ex1011.htm |
| EX-10.10 - EXHIBIT 10.10 - ACME UNITED CORP | acme_10k123110ex1010.htm |
UNITED STATES SECURITIES AND EXCHANGE COMMISSION
Washington, D. C. 20549
FORM 10-K
|
[X]
|
ANNUAL REPORT PURSUANT TO SECTION 13 OR 15 (d) OF
THE SECURITIES EXCHANGE ACT OF 1934
For the fiscal year ended December 31, 2010
OR
|
|
[_]
|
TRANSITION REPORT PURSUANT TO SECTION 13 OR 15 (d) OF
THE SECURITIES EXCHANGE ACT OF 1934
|
Commission file number 01-07698
ACME UNITED CORPORATION
Exact name of registrant as specified in its charter
| Connecticut | 06-0236700 |
| (State or other jurisdiction of | (I.R.S. Employer |
| incorporation or organization) | Identification No.) |
| 60 Round Hill Road | |
| Fairfield, Connecticut | 06824 |
| (Address of principal executive offices) | (Zip Code) |
Registrant's telephone number, including area code (203) 254-6060
Securities registered pursuant to Section 12(b) of the Act:
| Name of each exchange on | |
| Title of each class | which registered |
| $2.50 par value Common Stock | NYSE Amex |
Securities registered pursuant to Section 12 (g) of the Act: None
Indicate by check mark whether the registrant is a well-known seasoned issuer, as defined in Rule 405 of the Securities Act. YES [_] NO [X]
Indicate by check mark if the registrant is not required to file reports pursuant to Section 13 or Section 15(d) of the Act.
YES [_] NO [X]
Indicate by check mark whether the registrant (l) has filed all reports required to be filed by Section 13 or 15 (d) of the Securities Exchange Act of 1934 during the preceding 12 months (or for such shorter period that the registrant was required to file such reports) and (2) has been subject to such filing requirements for the past 90 days.
YES [X] NO [_]
Indicate by check mark if disclosure of delinquent filers pursuant to Item 405 of Regulation S-K is not contained herein, and will not be contained, to the best of registrant's knowledge, in definitive proxy or information statements incorporated by reference in Part III of this Form 10-K or any amendment to this Form 10-K.
YES [X] NO [_]
1
Indicate by check mark whether the Registrant is a large accelerated filer, an accelerated filer, a non-accelerated filer, or a smaller reporting company. See definition of “accelerated filer and large accelerated filer” in Rule 12b-2 of the Exchange Act (Check one).
| Large accelerated filer [_] | Accelerated filer [_] |
| Non-accelerated filer [_] |
Smaller Reporting Company [X]
|
Indicate by check mark whether the registrant is a shell company as defined in Rule 12b-2 of the Exchange Act.
YES [_] NO [X]
The aggregate market value of the voting stock held by non-affiliates of the registrant as of the last business day of the registrant’s most recently completed second fiscal quarter was $27,234,273. Registrant had 3,069,837 shares of its $2.50 par value Common Stock outstanding as of March 2, 2011.
Documents Incorporated By Reference
(1) Certain portions of the Company’s Proxy Statement for the Annual Meeting scheduled for April 25, 2011 is incorporated into the Company’s 2010 Annual Report on Form 10-K, Part III.
2
|
|
Page
|
|||||
| Part I | ||||||
|
Item 1.
|
Business
|
4
|
||||
|
Item 1A.
|
Risk Factors
|
6
|
||||
|
Item 1B.
|
Unresolved Staff Comments
|
8
|
||||
|
Item 2.
|
Properties
|
8
|
||||
|
Item 3.
|
Legal Proceedings
|
9
|
||||
|
Item 4.
|
Reserved
|
9
|
||||
| Part II |
|
|||||
|
Item 5.
|
Market for Registrant’s Common Equity, Related Stockholder Matters and Issuer Purchases of Equity Securities
|
10
|
||||
|
Item 6.
|
Selected Financial Data
|
12
|
||||
|
Item 7.
|
Management’s Discussion and Analysis of Financial Condition and Results of Operations
|
12
|
||||
|
Item 7A.
|
Quantitative and Qualitative Disclosures About Market Risk
|
16
|
||||
|
Item 8.
|
Financial Statements and Supplementary Data
|
17
|
||||
|
Item 9.
|
Changes In and Disagreements with Accountants on Accounting and Financial Disclosure
|
36
|
||||
|
Item 9A.
|
Controls and Procedures
|
36
|
||||
|
Item 9B.
|
Other Information |
36
|
||||
| Part III |
|
|||||
|
Item 10.
|
Directors, Executive Officers and Corporate Governance
|
37
|
||||
|
Item 11.
|
Executive Compensation
|
38
|
||||
|
Item 12.
|
Security Ownership of Certain Beneficial Owners and Management and Related Stockholder Matters
|
38
|
||||
|
Item 13.
|
Certain Relationships and Related Transactions, and Director Independence
|
38
|
||||
|
Item 14.
|
Principal Accountant Fees and Services
|
39
|
||||
| Part IV |
|
|||||
|
Item 15.
|
Exhibits and Financial Statement Schedules
|
39
|
||||
|
|
Signatures
|
42
|
||||
3
PART I
Item 1. Business
General
Acme United Corporation (together with its subsidiaries, the "Company") was organized as a partnership in l867 and incorporated in l882 under the laws of the State of Connecticut. The Company is a leading worldwide supplier of innovative cutting, measuring and safety products to the school, home, office, hardware and industrial markets. The Company's operations are in the United States, Canada, Europe (located in Germany) and Asia (located in Hong Kong and China). The operations in the United States, Canada and Europe are primarily involved in product development, marketing, sales, administrative and distribution activities. The operations in Asia consist of sourcing, product development, production planning, quality control and sales activities. Net sales in 2010 were: United States (including Asia) - $47.2 million, Canada - $7.7 million, and Europe - $8.2 million.
The Company has grouped its operations into three reportable segments based on the Company’s geographical organization and structure: (1) United States (which includes its Asian operations); (2) Canada and (3) Europe. Refer to Note 10 of the Notes to Consolidated Financial Statements for additional segment information.
Business Strategy
The Company’s business strategy includes the following key elements:
· a commitment to technological innovation achieved through consumer insight, creativity and speed to market;
· a broad selection of products in both brand and private label;
· prompt response and same-day shipping;
· superior customer service; and
· value pricing.
Principal Products
The Company markets and sells under four main brands - Westcott®, Clauss®, Camillus® and PhysiciansCare®.
Cutting
Principal products within the cutting device category are scissors, shears, guillotine paper trimmers, rotary paper trimmers, rotary cutters, knives, hobby knives and blades, utility knives, pruners, loppers, saws, manicure products, medical cutting instruments and pencil sharpeners. Products introduced in 2010 included Westcott TrimAir® paper trimmers with patented titanium coating and a proprietary blade change system for rotary and personal trimmers. Products introduced in 2009 included Westcott Ultra Soft Handle scissors with anti-microbial product protection, True Professional™ sewing shears as well as a line of iPoint® pencil sharpeners utilizing the Company’s proprietary non-stick coating. The Company also added to its KleenEarth® family of recycled products by modifying the production process to allow for multi-colored products as opposed to the traditional black. Two years ago, the Company acquired the patents and intellectual property of Camillus Cutlery, the oldest knife company in the United States and in 2009, launched a new family of knives with proprietary designs and high performance titanium carbonitride coatings. In 2010 Camillus expanded the range of knives for tactical outdoor sporting use. In 2010 Clauss introduced high performance marine tools for saltwater fishing. In 2008 the Company began shipping the Clauss Speedpak utility knife with replaceable cartridges.
Measuring
Principal products within the measuring instrument category are rulers, math tools and tape measures. Recent product introductions included Westcott branded erasers, compasses and protractors and rulers and math kits with anti-microbial product protection.
Safety
Principal products within the safety product category are first aid kits, personal protection products and over-the-counter medication refills. The 2010 addition of Physicians Care Antacid followed additions of sinus and cough/cold medications in 2009. Products introduced in 2009 included PhysiciansCare Emergency Care Responder Kits, Flu Care Kits and a line of safety products with Microban.
4
Product Development
Our strong commitment to understanding our consumers and defining products that fulfill their needs through innovation drives our product development strategy, which we believe is and will be a key contributor to our success. The Company incurred research and development costs of $486,778 in 2010 and $440,378 in 2009.
Intellectual Property
The Company has many patents and trademarks that are important to its business. The Company’s success depends in part on its ability to maintain patent protection for its products, to preserve its proprietary technology and to operate without infringing upon the patents or proprietary rights of others. The Company generally files patent applications in the United States and foreign countries where patent protection for its technology is appropriate and available. The Company also considers its trademarks important to the success of its business. The more significant trademarks include Westcott, Clauss, Camillus and PhysiciansCare.
Product Distribution
Independent manufacturer representatives and direct sales are primarily used to sell the Company’s line of consumer products to wholesale, contract and retail stationery distributors, office supply super stores, school supply distributors, industrial distributors, wholesale florists, mass market retailers and hardware chains. In each of 2010 and 2009, the Company had one customer that individually exceeded 10% of consolidated net sales. Net sales to this customer amounted to approximately 21% of consolidated net sales in 2010 and 20% in 2009.
Competition
The Company competes with many companies in each market and geographic area. The major competitor in the cutting category is Fiskars Corporation. The major competitor in the measuring category is Helix International Ltd. The major competitor in the safety category is Johnson and Johnson.
Seasonality
Traditionally, the Company’s sales are stronger in the second and third quarters of the fiscal year due to the seasonal nature of the back-to-school business.
Compliance with Environmental Laws
The Company believes that it is in compliance with applicable environmental laws. The Company believes that there are no environmental matters that would have a material financial impact on the Company. The Company believes that no material adverse financial impact is expected to result from compliance with current environmental rules and regulations. In December 2008, the Company sold property it owned in Bridgeport, CT. Under the terms of the sales agreement, the Company is responsible for environmental remediation on the property in accordance with the Connecticut Transfer Act. See Note 16 of the Notes to Consolidated Financial Statements for additional information regarding the sale of the Bridgeport property.
Employees
As of December 31, 2010, the Company employed 132 people, all of whom are full time and none of whom is covered by union contracts. Employee relations are considered good and no foreseeable problems with the work force are evident.
Available Information
The Company files its annual reports on Form 10-K, quarterly reports on Form 10-Q and current reports on Form 8-K pursuant to Section 13(a) of the Securities Exchange Act of 1934 with the SEC electronically. The public may read or copy any materials filed by the Company with the SEC at the SEC’s Public Reference Room at 100 F Street, NE, Washington, DC 20549 on official business days during the hours of 10:00 a.m. and 3:00 p.m. The public may obtain information on the operation of the Public Reference Room by calling the SEC at 1-800-SEC-0330. The SEC maintains a website that contains reports, proxy and information statements, and other information regarding issuers that file electronically with the SEC. The address of that site is http://www.sec.gov.
5
You may obtain a free copy of the Company’s annual reports on Form 10-K, quarterly reports on Form 10-Q and current reports on Form 8-K and amendments to those reports on the Company’s website at http://www.acmeunited.com or by contacting the Investor Relations Department at the Company’s corporate offices by calling (203) 254-6060. Such reports and other information are made available as soon as reasonably practicable after such material is filed with or furnished to the SEC.
Item 1A. Risk Factors
The Company is subject to a number of significant risks that might cause the Company’s actual results to vary materially from its forecasts, targets or projections, including:
|
·
|
achieving planned revenue and profit growth in each of the Company's business segments;
|
|
·
|
changes in customer requirements and in the volume of sales to principal customers;
|
|
·
|
the timing of orders and shipments;
|
|
·
|
emergence of new competitors or consolidation of existing competitors; and
|
|
·
|
industry demand fluctuations.
|
The Company’s expectations for both short- and long-term future net revenues are based on the Company’s estimates of future demand. Orders from the Company’s principal customers are ultimately based on demand from end-users and end-user demand can be difficult to predict. Low end-user demand would negatively affect orders the Company receives from distributors and other principal customers which could, in turn adversely affect the Company’s revenues in any fiscal period. If the Company’s estimates of sales are not accurate and the Company experiences unforeseen variability in its revenues and operating results, the Company may be unable to adjust its expense levels accordingly and its profit margins could be adversely affected.
A number of the Company’s products are sold through distributors and large retailers. No assurances can be given that any or all of such distributors or retailers will continue their relationships with the Company. Distributors and other significant retail customers cannot easily be replaced and the loss of revenues and the Company’s inability to reduce expenses to compensate for the loss of revenues could adversely affect the Company’s net revenues and profit margins.
Uncertainty in the global economy could negatively impact our business.
Uncertainty in the global economy could adversely affect our customers and our suppliers and businesses such as ours. In addition, any uncertainty could have a variety of negative effects on the Company such as reduction in revenues, increased costs, lower gross margin percentages, increased allowances for doubtful accounts and/or write-offs of accounts receivable and could otherwise have material adverse effects on our business, results of operations, financial condition and cash flows.
Loss of a major customer could result in a decrease in the Company’s future sales and earnings.
In 2010 and 2009, the Company had one customer that individually exceeded 10% of consolidated net sales. Net sales to this customer amounted to approximately 21% in 2010 and 20% in 2009. The Company anticipates that a limited number of customers may account for a substantial portion of its total net revenues for the foreseeable future. The loss of a major customer or a disruption in sales to such a customer could result in a decrease of the Company’s future sales and earnings.
6
Reliance on foreign suppliers could adversely affect the Company’s business.
The Company purchases the majority of its products from foreign manufacturing partners and, as a result, its business is exposed to risks due to:
|
·
|
Increases in transportation costs;
|
|
·
|
New or increased import duties;
|
|
·
|
Transportation delays;
|
|
·
|
Work stoppages;
|
|
·
|
Capacity constraints;
|
|
·
|
Poor quality; and
|
|
·
|
Inflation and exchange rate fluctuations that could increase the cost of foreign manufactured goods.
|
The loss of key management could adversely affect the Company’s ability to run its business.
The Company’s success depends, to a large extent, on the continued service of its executive management team, operating officers and other key personnel. The Company must therefore continue to recruit, retain and motivate management and operating personnel sufficient to maintain its current business and support its projected growth.
The Company’s inability to meet its staffing requirements in the future could adversely affect its results of operations.
Failure to protect the Company’s proprietary rights or the costs of protecting these rights could adversely affect its business.
The Company’s success depends in part on its ability to obtain patents and licenses and to preserve other intellectual property rights covering its products and processes. The Company has obtained certain domestic and foreign patents, and intends to continue to seek patents on its inventions when appropriate. The process of seeking patent protection can be time consuming and expensive. There can be no assurance that pending patents related to any of the Company’s products will be issued, in which case the Company may not be able to legally prevent others from producing similar and/or compatible competing products. If other companies were to sell similar and/or compatible competing products, the Company’s results of operations could be adversely affected. Furthermore, there can be no assurance that the Company’s efforts to protect its intellectual property will be successful. Any infringement of the Company’s intellectual property or legal defense of such action could have a material adverse effect on the Company.
The Company may need to raise additional capital to fund its operations.
The Company’s management believes that, under current conditions, the Company’s current cash and cash equivalents, cash generated by operations, together with the borrowing availability under its revolving loan agreement with Wells Fargo Bank, will be sufficient to fund planned operations for the next twelve months. However, if the Company is unable to generate sufficient cash from operations, it may be required to find additional funding sources. If adequate financing is unavailable or is unavailable on acceptable terms, the Company may be unable to maintain, develop or enhance its operations, products and services, take advantage of future opportunities or adequately respond to competitive pressures.
The Company may not be able to maintain or to raise prices in response to inflation and increasing costs.
Future market and competitive pressures may prohibit the Company from raising prices to offset increased product costs, freight costs and other inflationary items. The inability to pass these costs through to the Company’s customers could have a negative effect on its results of operations.
The Company is subject to intense competition in all of the markets in which it competes.
The Company’s products are sold in highly competitive markets. The Company believes that the principal points of competition in these markets are product innovation, quality, price, merchandising, design and engineering capabilities, product development, timeliness and completeness of delivery, conformity to customer specifications and post-sale support. Competitive conditions may require the Company to match or better competitors’ prices to retain business or market shares. The Company believes that its competitive position will depend on continued investment in innovation and product development, manufacturing and sourcing, quality standards, marketing and customer service and support. The Company’s success will depend in part on its ability to anticipate and offer products that appeal to the changing needs and preferences of our customers in the various market categories in which it competes. The Company may not have sufficient resources to make the investments that may be necessary to anticipate those changing needs and the Company may not anticipate, identify, develop and market products successfully or otherwise be successful in maintaining its competitive position. There are no significant barriers to entry into the markets for most of the Company’s products.
7
Product liability claims or regulatory actions could adversely affect the Company's financial results and reputation.
Claims for losses or injuries allegedly caused by some of the Company’s products arise in the ordinary course of its business. In addition to the risk of substantial monetary judgments, product liability claims or regulatory actions could result in negative publicity that could harm the Company’s reputation in the marketplace or the value of its brands. The Company also could be required to recall possible defective products, which could result in adverse publicity and significant expenses. Although the Company maintains product liability insurance coverage, potential product liability claims are subject to a deductible or could be excluded under the terms of the policy.
The Company’s business is subject to risks associated with seasonality which could adversely affect its cash flow, financial condition, or results of operations.
The Company’s business, historically, has experienced higher sales volume in the second and third quarters of the calendar year, when compared to the first and fourth quarters. The Company is a major supplier of products related to the “back-to-school” season, which occurs principally during the months of May, June, July and August. If this typical seasonal increase in sales of certain portions of the Company’s product line does not materialize, the Company could experience a material adverse effect on its business, financial condition and results of operations.
To compete successfully, the Company must develop and commercialize a continuing stream of innovative new products that create consumer demand.
The Company’s long-term success in the current competitive environment depends on its ability to develop and commercialize a continuing stream of innovative new products that create and maintain consumer demand. The Company also faces the risk that its competitors will introduce innovative new products that compete with the Company’s products. The Company’s strategy includes increased investment in new product development and increased focus on innovation. There are, nevertheless, numerous uncertainties inherent in successfully developing and commercializing innovative new products on a continuing basis, and new product launches may not provide expected growth results.
The Company is subject to environmental regulation and environmental risks.
The Company is subject to national, state, provincial and/or local environmental laws and regulations that impose limitations and prohibitions on the discharge and emission of, and establish standards for the use, disposal and management of, certain materials and waste. These environmental laws and regulations also impose liability for the costs of investigating and cleaning up sites, and certain damages resulting from present and past spills, disposals, or other releases of hazardous substances or materials. Environmental laws and regulations can be complex and may change often. Capital and operating expenses required to comply with environmental laws and regulations can be significant, and violations may result in substantial fines and penalties. In addition, environmental laws and regulations, such as the Comprehensive Environmental Response, Compensation and Liability Act, or CERCLA, in the United States impose liability on several grounds for the investigation and cleanup of contaminated soil, ground water and buildings and for damages to natural resources on a wide range of properties. For example, contamination at properties formerly owned or operated by the Company, as well as at properties it will own and operate, and properties to which hazardous substances were sent by the Company, may result in liability for the Company under environmental laws and regulations. The costs of complying with environmental laws and regulations and any claims concerning noncompliance, or liability with respect to contamination in the future could have a material adverse effect on the Company’s financial condition or results of operations. Refer to Note 16 – Sale of Property - of the Notes to Consolidated Financial Statements for further discussion on the environmental costs related to the sale of property by the Company.
Item 1B. Unresolved Staff Comments
Not applicable to smaller reporting companies.
Item 2. Properties
The Company is headquartered at 60 Round Hill Road, Fairfield, Connecticut in 7,500 square feet of leased space. The Company owns and leases manufacturing and warehousing facilities in the United States totaling 175,000 square feet, and leases 44,000 square feet of warehousing space in Canada. The Company also leases approximately 2,000 square feet of office space in Canada. Distribution for Europe is presently being conducted at a 35,000 square foot facility owned by the Company in Solingen, Germany. The Company also leases office space in Hong Kong and Guangzhou, China.
Management believes that the Company's facilities, whether leased or owned, are adequate to meet its current needs and should continue to be adequate for the foreseeable future.
8
Item 3. Legal Proceedings
The Company is involved, from time to time, in disputes and other litigation in the ordinary course of business and may encounter other contingencies, which may include environmental and other matters. The Company presently believes that none of these matters, individually or in the aggregate, would be likely to have a material adverse impact on its financial position, results of operations or liquidity.
Item 4. Reserved
9
PART II
Item 5. Market for Registrant's Common Equity, Related Stockholder Matters and Issuer Purchases of Equity Securities.
The Company's Common Stock is traded on the NYSE Amex under the symbol "ACU". The following table sets forth the high and low sale prices on the NYSE Amex for the Common Stock for the periods indicated:
|
Year Ended December 31, 2010
|
High
|
Low
|
Dividends
Declared
|
|||||||||
|
Fourth Quarter
|
$ | 10.64 | $ | 9.40 | $ | .06 | ||||||
|
Third Quarter
|
11.00 | 9.62 | .06 | |||||||||
|
Second Quarter
|
13.04 | 10.21 | .05 | |||||||||
|
First Quarter
|
11.73 | 8.55 | .05 | |||||||||
|
Year Ended December 31, 2009
|
||||||||||||
|
Fourth Quarter
|
$ | 10.29 | $ | 8.11 | $ | .05 | ||||||
|
Third Quarter
|
9.30 | 7.82 | .05 | |||||||||
|
Second Quarter
|
8.24 | 6.53 | .05 | |||||||||
|
First Quarter
|
8.37 | 5.95 | .05 | |||||||||
As of March 4, 2011 there were approximately 1,301 holders of record of the Company's Common Stock.
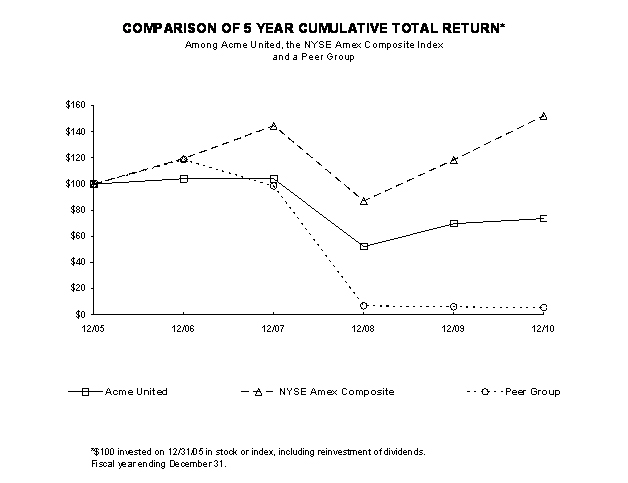
Performance Graph
The graph below compares the yearly cumulative total shareholder return on the Company’s Common Stock with the yearly cumulative total return of the following for the period 2006 to 2010: (a) the NYSE Amex Index and (b) a peer group of companies that, like the Company, (i) are currently listed on the NYSE Amex, and (ii) have a market capitalization of $30 million to $35 million.
The Company does not believe that it can reasonably identify a peer group of companies, on an industry or line-of-business basis, for the purpose of developing a comparative performance index. While the Company is aware that some other publicly-traded companies market products in the Company’s line-of-business, none of these other companies provide most or all of the products offered by the Company, and many offer products or services not offered by the Company. Moreover, some of these other companies that engage in the Company’s line-of-business do so through divisions or subsidiaries that are not publicly-traded. Furthermore, many of these other companies are substantially more highly capitalized than the Company. For these reasons, any such comparison would not, in the opinion of the Company, provide a meaningful index of comparative performance.
The comparisons in the graph below are based on historical data and are not indicative of, or intended to forecast, the possible future performance of the Company’s Common Stock. [Missing Graphic Reference]
10
Issuer Purchases of Equity Securities
During the fourth quarter of 2010, the Company announced a Common Stock repurchase program of 200,000 shares. This program does not have an expiration date. During the twelve months ended December 31, 2010, the Company repurchased 150,072 shares of its Common Stock at an average price of $10.44, all of which were purchased under a previously announced program. As of December 31, 2010, there were 200,000 shares that may be purchased under the repurchase program announced in 2010.
Set forth in the table below is certain information regarding purchases of Common Stock by the Company during the quarter ended December 31, 2010.
|
Period
|
Total Number of Shares Purchased
|
Average Price Paid per Share
|
Total Number of shares Purchased as Part of Publicly Announced Plans or Programs
|
Maximum Number of Shares that May Yet be Purchased Under these Plans or Programs
|
|||
|
October 1 - 31
|
$ -
|
-
|
0
|
||||
|
November 1 - 30
|
$ -
|
-
|
200,000
|
||||
|
December 1 - 31
|
$ -
|
-
|
200,000
|
11
|
Item 6. Selected Financial Data
|
||||||||||||||||||||
|
FIVE YEAR SUMMARY OF SELECTED FINANCIAL DATA
|
||||||||||||||||||||
|
(All figures in thousands except per share data)
|
||||||||||||||||||||
|
2010
|
2009
|
2008
|
2007
|
2006
|
||||||||||||||||
|
Net sales
|
$ | 63,149 | $ | 59,149 | $ | 68,719 | $ | 63,173 | $ | 56,863 | ||||||||||
|
Net income
|
$ | 2,573 | $ | 2,842 | $ | 4,467 | $ | 4,022 | $ | 3,886 | ||||||||||
|
Total assets
|
$ | 49,581 | $ | 42,309 | $ | 45,424 | $ | 42,222 | $ | 35,021 | ||||||||||
|
Long-term debt, less current portion
|
$ | 13,522 | $ | 9,154 | $ | 11,749 | $ | 10,187 | $ | 10,218 | ||||||||||
|
Net income
|
||||||||||||||||||||
|
Per share (Basic)
|
$ | 0.82 | $ | 0.86 | $ | 1.28 | $ | 1.14 | $ | 1.11 | ||||||||||
|
Per share (Diluted)
|
$ | 0.81 | $ | 0.85 | $ | 1.24 | $ | 1.09 | $ | 1.05 | ||||||||||
|
Dividends per share
|
$ | 0.22 | $ | 0.20 | $ | 0.18 | $ | 0.16 | $ | 0.12 | ||||||||||
Item 7. Management’s Discussion and Analysis of Financial Condition and Results of Operations
Forward-Looking Information
The Company may from time to time make written or oral “forward-looking statements” including statements contained in this report and in other communications by the Company, which are made in good faith by the Company pursuant to the “safe harbor” provisions of the Private Securities Litigation Reform Act of 1995.
These forward-looking statements include statements of the Company’s plans, objectives, expectations, estimates and intentions, which are subject to change based on various important factors (some of which are beyond the Company’s control). The following factors, in addition to others not listed, could cause the Company’s actual results to differ materially from those expressed in forward looking statements: the strength of the domestic and local economies in which the Company conducts operations, the impact of uncertainties in global economic conditions, changes in client needs and consumer spending habits, the impact of competition and technological change on the Company, the Company’s ability to manage its growth effectively, including its ability to successfully integrate any business which it might acquire, and currency fluctuations. All forward-looking statements in this report are based upon information available to the Company on the date of this report. The Company undertakes no obligation to publicly update or revise any forward-looking statement, whether as a result of new information, future events, or otherwise, except as required by law.
Critical Accounting Policies
The following discussion and analysis of financial condition and results of operations are based upon the Company’s consolidated financial statements, which have been prepared in conformity with accounting principles generally accepted in the United States of America. The Company’s significant accounting policies are more fully described in Note 2 of the Notes to Consolidated Financial Statements. Certain accounting estimates are particularly important to the understanding of the Company’s financial position and results of operations and require the application of significant judgment by the Company’s management or can be materially affected by changes from period to period in economic factors or conditions that are outside the control of management. The Company’s management uses their judgment to determine the appropriate assumptions to be used in the determination of certain estimates. Those estimates are based on historical operations, future business plans and projected financial results, the terms of existing contracts, the observance of trends in the industry, information provided by customers and information available from other outside sources, as appropriate. The following discusses the Company’s critical accounting policies and estimates.
Estimates. Operating results may be affected by certain accounting estimates. The most sensitive and significant accounting estimates in the financial statements relate to customer rebates, valuation allowances for deferred income tax assets, obsolete and slow moving inventories, potentially uncollectible accounts receivable, and accruals for income taxes. Although the Company’s management has used available information to make judgments on the appropriate estimates to account for the above matters, there can be no assurance that future events will not significantly affect the estimated amounts related to these areas where estimates are required. However, historically, actual results have not been materially different than original estimates.
12
Revenue Recognition. The Company recognizes revenue from the sales of its products when ownership transfers to the customers, which occurs either at the time of shipment or upon delivery based upon contractual terms with the customer. The Company recognizes customer program costs, including rebates, cooperative advertising, slotting fees and other sales related discounts, as a reduction to sales.
Allowance for doubtful accounts. The Company provides an allowance for doubtful accounts based upon a review of outstanding accounts receivable, historical collection information and existing economic conditions. The allowance for doubtful accounts represents estimated uncollectible accounts receivables associated with potential customer defaults on contractual obligations, usually due to potential insolvencies. The allowance includes amounts for certain customers where a risk of default has been specifically identified. In addition, the allowance includes a provision for customer defaults based on historical experience. The Company actively monitors its accounts receivable balances and its historical experience of annual accounts receivable write offs has been negligible.
Customer Rebates. Customer rebates and incentives are a common practice in the office products industry. We incur customer rebate costs to obtain favorable product placement, to promote sell-through of products and to maintain competitive pricing. Customer rebate costs and incentives, including volume rebates, promotional funds, catalog allowances and slotting fees, are accounted for as a reduction to gross sales. These costs are recorded at the time of sale and are based on individual customer contracts. Management periodically reviews accruals for these rebates and allowances, and adjusts accruals when appropriate.
Obsolete and Slow Moving Inventory. Inventories are stated at the lower of cost, determined on the first-in, first-out method, or market. An allowance is established to adjust the cost of inventory to its net realizable value. Inventory allowances are recorded for obsolete or slow moving inventory based on assumptions about future demand and marketability of products, the impact of new product introductions and specific identification of items, such as discontinued products. These estimates could vary significantly from actual requirements if future economic conditions, customer inventory levels or competitive conditions differ from expectations.
Income Taxes. Deferred income tax liabilities or assets are established for temporary differences between financial and tax reporting bases and are subsequently adjusted to reflect changes in tax rates expected to be in effect when the temporary differences reverse. A valuation allowance is recorded to reduce deferred income tax assets to an amount that is more likely than not to be realized.
Intangible Assets. Intangible assets with finite useful lives are recorded at cost upon acquisition and amortized over the term of the related contract, if any, or useful life, as applicable. Intangible assets held by the Company with finite useful lives include patents and trademarks. The weighted average amortization period for intangible assets at December 31, 2010 was 14 years. The Company periodically reviews the values recorded for intangible assets to assess recoverability from future operations whenever events or changes in circumstances indicate that its carrying amount may not be recoverable. At December 31, 2010 and 2009, the Company assessed the recoverability of its long-lived assets and believed that there were no events or circumstances present that would that would require a test of recoverability on those assets. As a result, there was no impairment of the carrying amounts of such assets and no reduction in their estimated useful lives. The net book value of the Company’s intangible assets increased to $1,866,231 as of December 31, 2010, from $1,863,648 as of December 31, 2009.
Pension Obligation. The pension benefit obligation is based on various assumptions used by third-party actuaries in calculating this amount. These assumptions include discount rates, expected return on plan assets, mortality rates and other factors. Revisions in assumptions and actual results that differ from the assumptions affect future expenses, cash funding requirements and obligations. Our funding policy is to fund the Plan in accordance with the Internal Revenue Code and regulations.
These assumptions are reviewed annually and updated as required. The Company has a frozen defined benefit pension plan. Two assumptions, the discount rate and the expected return on plan assets, are important elements of expense and liability measurement.
13
We determine the discount rate used to measure plan liabilities as of the December 31 measurement date. The discount rate reflects the current rate at which the associated liabilities could be effectively settled at the end of the year. In estimating this rate, we look at rates of return on fixed-income investments of similar duration to the liabilities in the plan that receive high, investment grade ratings by recognized ratings agencies. Using these methodologies, we determined a discount rate of 4.42% to be appropriate as of December 31, 2010, which is a decrease of 0.64 percentage points from the rate used as of December 31, 2009. An increase of 1.0% in the discount rate would have decreased our plan liabilities as of December 31, 2010 by $0.5 million.
The expected long-term rate of return on assets considers the Company’s historical results and projected returns for similar allocations among asset classes. In accordance with generally accepted accounting principles, actual results that differ from the Company’s assumptions are accumulated and amortized over future periods and, therefore, affect expense and obligation in future periods. For the U.S. pension plan, our assumption for the expected return on plan assets was 8.25% for 2010. For more information concerning these costs and obligations, see the discussion in Note 6 – Pension and Profit Sharing, in the Notes to the Company’s Consolidated Financial Statements.
Accounting for Stock-Based Compensation. Stock based compensation cost is measured at the grant date fair value of the award and is recognized as expense over the requisite service period. The Company uses the Black-Scholes option - pricing model to determine fair value of the awards, which involves certain subjective assumptions. These assumptions include estimating the length of time employees will retain their vested stock options before exercising them (“expected term”), the estimated volatility of the Company’s common stock price over the expected term (“volatility”) and the number of options for which vesting requirements will not be completed (“forfeitures”). Changes in the subjective assumptions can materially affect estimates of fair value stock-based compensation, and the related amount recognized on the consolidated statements of operations. Refer to Note 11 - Stock Option Plans - in the Notes to Consolidated Financial Statements in this report for a more detailed discussion.
Results of Operations 2010 Compared with 2009
Net Sales
Net sales increased by $4,000,386 or 7% (6% in constant currency) in 2010 to $63,148,933 compared to $59,148,547 in 2009. The U.S. segment sales increased by $2,276,000 or 5% in 2010 compared to 2009. Sales in Canada increased by $687,000 or 10% (constant in local currency) in 2010 compared to 2009. European sales increased by $1,038,000 or 14% in U.S. dollars (22% in local currency) in 2010 compared to 2009.
The increase in net sales for the twelve months ended December 31, 2010 in the U.S. was primarily due to higher sales of the iPoint pencil sharpeners as the result of increased market share and increased sales of the Company’s non stick products. The increase in net sales in Europe for the twelve months ended December 31, 2010 was primarily due to an increase in sales into the mass market and office channels.
Gross Profit
Gross profit was 37% of net sales in 2010 and 2009. The increased leveraging effect from higher sales was offset by higher airfreight expense (approximately 100 bps). The higher airfreight expense was incurred primarily in the second quarter as the result of well publicized labor shortages in southeast China leading to slower production at the Company’s suppliers. The expedited freight costs were necessary to meet customer delivery schedules.
Selling, General and Administrative
Selling, general and administrative expenses were $20,385,000 in 2010 compared with $19,047,000 in 2009, an increase of $1,338,000 or 7%. SG&A expenses were 32% of net sales in 2010 compared to 32% in 2009. The increase in SG&A expenses was primarily related to incremental shipping and commission costs as a result of higher sales as well as higher personnel related expenses.
14
Operating Income
Operating income was $2,980,000 in 2010, compared with $3,027,000 in 2009, a decrease of $47,000. Operating income in the U.S. segment declined by approximately $498,000 mainly due to higher airfreight expense of approximately $500,000. Operating income increased in Canada by $391,000 mainly due to improved gross margins as the result of strong buying power of the Canadian dollar. The European operating loss declined by $59,000.
Interest Expense, Net
Net interest expense for 2010 was $142,000, compared with $26,000 for 2009, an increase of $116,000. The increase in interest expense, net for 2010 was primarily the result of higher average interest rates under the Company's bank revolving loan agreement combined with higher average borrowings during 2010 compared to 2009.
Other Income, Net
Net other income was $72,000 in 2010 compared to $452,000 in 2009. The decrease in other income, net for 2010 was primarily related to a $460,000 benefit recorded for the change in estimated costs associated with the remediation of the Bridgeport property in 2009 compared to $100,000 in 2010.
Income Tax
The effective tax rate in 2010 was 12%, compared to 18% in 2009. The lower effective tax rates in both years compared to historical rates were primarily the result of tax credits associated with donation of property, located in Bridgeport, CT, to the city of Bridgeport.
Off-Balance Sheet Transactions
The Company did not engage in any off-balance sheet transactions during 2010.
Liquidity and Capital Resources
During 2010, working capital increased by approximately $4.4 million compared to December 31, 2009. Inventory increased by approximately $4.9 million in anticipation of seasonal sales in 2011. Inventory turnover, calculated using a twelve month average inventory balance, increased to 2.1 from 1.9 at December 31, 2009.
Receivables increased approximately $1.6 million at December 31, 2010 compared to December 31, 2009. The average number of days sales outstanding in accounts receivable was 65 days in 2010 compared to 61 days in 2009.
|
The Company's working capital, current ratio and long-term debt to equity ratio follow:
|
||||||||
|
2010
|
2009
|
|||||||
|
Working Capital
|
$ | 33,409,776 | $ | 28,952,754 | ||||
|
Current Ratio
|
4.62 | 5.26 | ||||||
|
Long-Term Debt to Equity Ratio
|
53.3% | 37.3% | ||||||
During 2010, total debt outstanding under the Company’s revolving credit facility (referred to below) increased by approximately $4.4 million compared to total debt at December 31, 2009. As of December 31, 2010, $13,522,000 was outstanding and $4,478,000 was available for borrowing under the revolving credit facility.
On February 23, 2011, the Company modified its revolving loan agreement with Wells Fargo Bank; the amendments include an increase in the maximum borrowing amount from $18 million to $20 million; and an extension of the maturity date of the loan from February 1, 2012 to March 31, 2013. Funds borrowed under the Modified Loan Agreement may be used for working capital, general operating expenses, share repurchases and certain other purposes.
15
Under the provisions of the modified loan agreement, the Company, among other things, is restricted with respect to outside borrowings, investments and mergers. Further, the modified loan agreement requires the Company to maintain specific amounts of tangible net worth, a specified debt service coverage ratio and a fixed charge coverage ratio. This modified loan agreement continues to be secured by the assets of the U.S. parent company. This modification did not change the permissible use of funds or the quantitative covenants that the Company is required to comply with. The Company was in compliance with all financial covenants under the revolving loan agreement as of and through December 31, 2010, and believes it will be able to continue to comply with these covenants under the modified moan agreement for the remainder of the term of the credit facility.
Capital expenditures during 2010 and 2009 were $937,083 and $566,939, respectively, which were, in part, financed with borrowings under the Company’s revolving credit facility. Capital expenditures in 2011 are not expected to differ materially from recent years.
The Company believes that cash generated from operating activities, together with funds available under its revolving credit facility, are expected, under current conditions, to be sufficient to finance the Company’s planned operations for the next twelve months.
Recently Issued Accounting Standards
There were no recently issued or newly adopted accounting standards that were applicable to the preparation of our consolidated financial statements for 2010 or that may become applicable to the preparation of our consolidated financial statements in the future.
Item 7A. Quantitative and Qualitative Disclosure about Market Risk
Not applicable to smaller reporting companies.
16
|
Item 8. Financial Statements and Supplementary Data
|
||||||||
|
Acme United Corporation and Subsidiaries
|
||||||||
|
CONSOLIDATED STATEMENTS OF OPERATIONS
|
||||||||
|
For the years ended
December 31,
|
||||||||
|
2010
|
2009
|
|||||||
|
Net sales
|
$ | 63,148,933 | $ | 59,148,547 | ||||
|
Cost of goods sold
|
39,783,509 | 37,075,060 | ||||||
|
Gross profit
|
23,365,424 | 22,073,487 | ||||||
|
Selling, general and administrative expenses
|
20,385,268 | 19,046,864 | ||||||
|
Operating income
|
2,980,156 | 3,026,623 | ||||||
|
Non operating items:
|
||||||||
|
Interest:
|
||||||||
|
Interest expense
|
(301,304 | ) | (155,008 | ) | ||||
|
Interest income
|
159,555 | 129,334 | ||||||
|
Interest expense, net
|
(141,749 | ) | (25,674 | ) | ||||
|
Other income
|
72,440 | 452,005 | ||||||
|
Total other (expense) income , net
|
(69,309 | ) | 426,331 | |||||
|
Income before income tax expense
|
2,910,847 | 3,452,954 | ||||||
|
Income tax expense
|
337,883 | 610,867 | ||||||
|
Net income
|
$ | 2,572,964 | $ | 2,842,087 | ||||
|
Earnings per share:
|
||||||||
|
Basic
|
$ | 0.82 | $ | 0.86 | ||||
|
Diluted
|
$ | 0.81 | $ | 0.85 | ||||
|
See accompanying Notes to Consolidated Financial Statements.
|
||||||||
17
|
Acme United Corporation and Subsidiaries
|
||||||||
|
CONSOLIDATED BALANCE SHEETS
|
||||||||
|
December 31,
|
December 31,
|
|||||||
|
2010
|
2009
|
|||||||
|
ASSETS
|
||||||||
|
Current assets:
|
||||||||
|
Cash and cash equivalents
|
$ | 6,601,416 | $ | 6,519,065 | ||||
|
Accounts receivable, less allowance
|
12,330,665 | 10,703,433 | ||||||
|
Inventories
|
22,292,909 | 17,400,270 | ||||||
|
Deferred income taxes
|
206,732 | 180,241 | ||||||
|
Prepaid expenses and other current assets
|
1,195,613 | 952,946 | ||||||
|
Total current assets
|
42,627,335 | 35,755,955 | ||||||
|
Property, plant and equipment:
|
||||||||
|
Land
|
160,405 | 171,660 | ||||||
|
Buildings
|
2,438,073 | 2,558,572 | ||||||
|
Machinery and equipment
|
8,904,675 | 8,169,641 | ||||||
|
Total property, plant and equipment
|
11,503,153 | 10,899,873 | ||||||
|
Less: accumulated depreciation
|
9,287,397 | 8,811,705 | ||||||
|
Net plant, property and equipment
|
2,215,756 | 2,088,168 | ||||||
|
Note receivable
|
1,839,262 | 1,891,604 | ||||||
|
Intangible assets, less accumulated amortization
|
1,866,231 | 1,863,648 | ||||||
|
Deferred income taxes
|
943,606 | 621,270 | ||||||
|
Other assets
|
88,828 | 88,828 | ||||||
|
Total assets
|
$ | 49,581,018 | $ | 42,309,473 | ||||
|
LIABILITIES
|
||||||||
|
Current liabilities:
|
||||||||
|
Accounts payable
|
$ | 5,678,910 | $ | 3,546,139 | ||||
|
Other accrued liabilities
|
3,538,649 | 3,257,062 | ||||||
|
Total current liabilities
|
9,217,559 | 6,803,201 | ||||||
|
Long-term debt
|
13,522,000 | 9,154,000 | ||||||
|
Other accrued liabilities - non current
|
1,489,648 | 1,811,022 | ||||||
|
Total liabilities
|
24,229,207 | 17,768,223 | ||||||
|
STOCKHOLDERS' EQUITY
|
||||||||
|
Common stock, par value $2.50: authorized 8,000,000
|
||||||||
| shares; issued - 4,374,574 shares in 2010 and 4,313,024 | ||||||||
|
shares in 2009, including treasury stock
|
10,935,676 | 10,782,555 | ||||||
|
Treasury stock, at cost, 1,305,237 shares in 2010
|
||||||||
|
and 1,155,165 shares in 2009
|
(11,710,616 | ) | (10,144,325 | ) | ||||
|
Additional paid-in capital
|
4,603,194 | 4,208,112 | ||||||
|
Accumulated other comprehensive loss
|
(875,157 | ) | (812,970 | ) | ||||
|
Retained earnings
|
22,398,714 | 20,507,878 | ||||||
|
Total stockholders' equity
|
25,351,811 | 24,541,250 | ||||||
|
Total liabilities and stockholders' equity
|
$ | 49,581,018 | $ | 42,309,473 | ||||
|
See accompanying Notes to Consolidated Financial Statements.
|
||||||||
18
|
Acme United Corporation and Subsidiaries
|
||||||||||||||||||||||||||||
|
CONSOLIDATED STATEMENTS OF CHANGES IN STOCKHOLDERS' EQUITY
|
||||||||||||||||||||||||||||
|
Outstanding Shares of Common Stock
|
Common Stock
|
Treasury Stock
|
Additional Paid-In Capital
|
Accumulated Other Comprehensive Income (Loss)
|
Retained Earnings
|
Total
|
||||||||||||||||||||||
|
Balances, December 31, 2008
|
3,343,368 | 10,732,555 | (8,406,722 | ) | 3,906,000 | (1,663,361 | ) | 18,319,191 | 22,887,663 | |||||||||||||||||||
|
Net income
|
2,842,087 | 2,842,087 | ||||||||||||||||||||||||||
|
Translation adjustment
|
709,421 | 709,421 | ||||||||||||||||||||||||||
|
Change in pension plan
|
||||||||||||||||||||||||||||
|
net prior service credit and
|
||||||||||||||||||||||||||||
|
actuarial losses, net of tax
|
||||||||||||||||||||||||||||
|
of $82,218
|
140,970 | 140,970 | ||||||||||||||||||||||||||
|
Comprehensive income
|
3,692,478 | |||||||||||||||||||||||||||
|
Stock compensation expense
|
308,337 | 308,337 | ||||||||||||||||||||||||||
|
Distribution to shareholders
|
(653,400 | ) | (653,400 | ) | ||||||||||||||||||||||||
|
Issuance of common stock
|
20,000 | 50,000 | (6,225 | ) | 43,775 | |||||||||||||||||||||||
|
Purchase of treasury stock
|
(205,509 | ) | (1,737,603 | ) | (1,737,603 | ) | ||||||||||||||||||||||
|
Balances, December 31, 2009
|
3,157,859 | $ | 10,782,555 | $ | (10,144,325 | ) | $ | 4,208,112 | $ | (812,970 | ) | $ | 20,507,878 | $ | 24,541,250 | |||||||||||||
|
Net income
|
2,572,964 | 2,572,964 | ||||||||||||||||||||||||||
|
Translation adjustment
|
(40,237 | ) | (40,237 | ) | ||||||||||||||||||||||||
|
Change in pension plan
|
||||||||||||||||||||||||||||
|
net prior service credit and
|
||||||||||||||||||||||||||||
|
actuarial losses, net of tax
|
||||||||||||||||||||||||||||
|
of $35,049
|
(21,950 | ) | (21,950 | ) | ||||||||||||||||||||||||
|
Comprehensive income
|
2,510,777 | |||||||||||||||||||||||||||
|
Stock compensation expense
|
385,732 | 385,732 | ||||||||||||||||||||||||||
|
Distribution to shareholders
|
(682,128 | ) | (682,128 | ) | ||||||||||||||||||||||||
|
Issuance of common stock
|
61,550 | 153,121 | 9,350 | 162,471 | ||||||||||||||||||||||||
|
Purchase of treasury stock
|
(150,072 | ) | (1,566,290 | ) | (1,566,290 | ) | ||||||||||||||||||||||
|
Balances, December 31, 2010
|
3,069,337 | 10,935,676 | (11,710,616 | ) | 4,603,194 | (875,157 | ) | 22,398,714 | $ | 25,351,811 | ||||||||||||||||||
|
See accompanying Notes to Consolidated Financial Statements.
|
||||||||||||||||||||||||||||
19
|
Acme United Corporation and Subsidiaries
|
||||||||
|
CONSOLIDATED STATEMENTS OF CASH FLOWS
|
||||||||
|
For the years ended December 31,
|
||||||||
|
2010
|
2009
|
|||||||
|
Operating activities:
|
||||||||
|
Net income
|
$ | 2,572,964 | $ | 2,842,087 | ||||
|
Adjustments to reconcile net income to net
|
||||||||
|
cash (used) provided by operating activities
|
||||||||
|
Depreciation
|
755,334 | 803,902 | ||||||
|
Amortization
|
114,822 | 113,987 | ||||||
|
Stock compensation expense
|
385,732 | 308,337 | ||||||
|
Deferred income taxes
|
(348,713 | ) | (280,188 | ) | ||||
|
Change in estimated cost of environmental remediation
|
(100,000 | ) | (457,379 | ) | ||||
|
Changes in operating assets and liabilities
|
||||||||
|
Accounts receivable
|
(1,635,185 | ) | 49,438 | |||||
|
Inventories
|
(5,015,837 | ) | 4,668,500 | |||||
|
Prepaid expenses and other current assets
|
(137,266 | ) | 43,310 | |||||
|
Accounts payable
|
2,208,634 | (149,341 | ) | |||||
|
Other accrued liabilities
|
64,430 | (1,361,210 | ) | |||||
|
Total adjustments
|
(3,708,048 | ) | 3,739,356 | |||||
|
Net cash (used) provided by operating activities
|
(1,135,084 | ) | 6,581,443 | |||||
|
Investing activities:
|
||||||||
|
Purchase of property, plant and equipment
|
(937,083 | ) | (566,939 | ) | ||||
|
Purchase of patents and trademarks
|
(117,405 | ) | (132,244 | ) | ||||
|
Net cash used by investing activities
|
(1,054,488 | ) | (699,183 | ) | ||||
|
Financing activities:
|
||||||||
|
Net borrowings (repayments) of long-term debt
|
4,368,000 | (2,565,000 | ) | |||||
|
Distributions to shareholders
|
(655,832 | ) | (662,547 | ) | ||||
|
Purchase of treasury stock
|
(1,566,290 | ) | (1,737,603 | ) | ||||
|
Issuance of common stock
|
162,475 | 43,775 | ||||||
|
Net cash provided (used) by financing activities
|
2,308,353 | (4,921,375 | ) | |||||
|
Effect of exchange rate changes
|
(36,429 | ) | 333,616 | |||||
|
Net increase in cash and cash equivalents
|
82,351 | 1,294,501 | ||||||
|
Cash and cash equivalents at beginning of year
|
6,519,065 | 5,224,564 | ||||||
|
Cash and cash equivalents at end of year
|
$ | 6,601,416 | $ | 6,519,065 | ||||
|
Supplemental cash flow information
|
||||||||
|
Cash paid for income taxes
|
$ | 464,576 | $ | 1,334,358 | ||||
|
Cash paid for interest expense
|
$ | 278,165 | $ | 165,092 | ||||
See accompanying Notes to Consolidated Financial Statements.
20
Acme United Corporation and Subsidiaries
NOTES TO CONSOLIDATED FINANCIAL STATEMENTS
1. Operations
The operations of Acme United Corporation (the “Company”) consist of three reportable segments. The operations of the Company are structured and evaluated based on geographic location. The three reportable segments operate in the United States (including Asian operations), Canada and Germany. Principal products across all segments are scissors, shears, knives, rulers, pencil sharpeners, first aid kits, and related products which are sold primarily to wholesale, contract and retail stationery distributors, office supply super stores, school supply distributors, drug store retailers, industrial distributors, wholesale florists, mass market retailers and hardware chains.
2. Accounting Policies
Estimates - The preparation of financial statements in conformity with accounting principles generally accepted in the United States requires management to make estimates and assumptions that affect the reported amounts of assets and liabilities and the disclosure of contingent assets and liabilities at the date of the financial statements and the reported amounts of revenues and expenses during the reporting period. The most sensitive and significant accounting estimates relate to customer rebates, valuation allowances for deferred income tax assets, obsolete and slow-moving inventories, potentially uncollectible accounts receivable and accruals for income taxes. Actual results could differ from those estimates.
Principles of Consolidation - The consolidated financial statements include the accounts of the Company and its subsidiaries, all of which are wholly owned by the Company. All significant intercompany accounts and transactions are eliminated in consolidation.
Translation of Foreign Currency - For foreign operations, assets and liabilities are translated at rates in effect at the end of the year; revenues and expenses are translated at average rates in effect during the year. Resulting translation adjustments are made directly to accumulated other comprehensive loss. Foreign currency transaction gains and losses are recognized in operating results. Foreign currency transaction losses, which are included in other income, net, were $58,992 in 2010 and $35,519 in 2009.
Cash Equivalents - Investments with an original maturity of three months or less, as well as time deposits and certificates of deposit that are readily redeemable, at the date of purchase are considered cash equivalents. Included with the cash and equivalents are Certificates of Deposit totaling $3.0 million.
Accounts Receivable - Accounts receivable are shown less an allowance for doubtful accounts of $57,125 in 2010 and $71,629 in 2009.
Inventories - Inventories are stated at the lower of cost, determined by the first-in, first-out method, or market.
Property, Plant and Equipment and Depreciation – Property, plant and equipment is recorded at cost. Depreciation is computed by the straight-line method over the estimated useful lives of the assets, which range from 3 to 30 years.
Intangible Assets– Intangible assets with finite useful lives are recorded at cost upon acquisition, and amortized over the term of the related contract or useful life, as applicable. Intangible assets held by the Company with finite useful lives include patents and trademarks. Patents and trademarks are amortized over their estimated useful lives. The weighted average amortization period for intangible assets at December 31, 2010 was 14 years. The Company periodically reviews the values recorded for intangible assets to assess recoverability from future operations whenever events or changes in circumstances indicate that their carrying amounts may not be recoverable. At December 31, 2010 and 2009, the Company assessed the recoverability of its long-lived assets and believed that there were no events or circumstances present that would that would require a test of recoverability on those assets. As a result, there was no impairment of the carrying amounts of such assets and no reduction in their estimated useful lives.
21
Deferred Income Taxes - Deferred income taxes are provided for the differences between the financial statement and tax bases of assets and liabilities, and on operating loss carryovers, using tax rates in effect in years in which the differences are expected to reverse.
Revenue Recognition – The Company recognizes revenue from the sales of its products when ownership transfers to the customers, which occurs either at the time of shipment or upon delivery based upon contractual terms with the customer. The Company recognizes customer program costs, including rebates, cooperative advertising, slotting fees and other sales related discounts, as a reduction to sales.
Research and Development – Research and development costs ($486,778 in 2010 and $440,378 in 2009) are expensed as incurred.
Shipping Costs – The costs of shipping product to our customers ($2,656,653 in 2010 and $2,529,743 in 2009) are included in selling, general and administrative expenses.
Advertising Costs – The Company expenses the production costs of advertising the first time that the related advertising takes place. Advertising costs ($1,039,302 in 2010 and $1,066,860 in 2009) are included in selling, general and administrative expenses.
Subsequent events - The Company has evaluated events and transactions subsequent to December 31, 2010 through the date our consolidated financial statements were included in this Form 10-K and filed with the SEC.
Concentrations – The Company performs ongoing credit evaluations of its customers and generally does not require collateral for the extension of credit. Allowances for credit losses are provided and have been within management's expectations. In 2010, with respect to concentration risk related to accounts receivable, the Company had one customer that accounted for greater than 10% of total net receivables. In 2010 and 2009, the Company had one customer that individually exceeded 10% of consolidated net sales. Net sales to this customer amounted to approximately 21% in 2010 and 20% in 2009.
|
3. Inventories
|
||||||||
|
Inventories consisted of:
|
2010
|
2009
|
||||||
|
Finished goods
|
$ | 21,108,954 | $ | 16,337,034 | ||||
|
Work in process
|
171,673 | 97,297 | ||||||
|
Materials and supplies
|
1,012,282 | 965,939 | ||||||
| $ | 22,292,909 | $ | 17,400,270 | |||||
Inventories are stated net of valuation allowances for slow moving and obsolete inventory of $470,749 as of December 31, 2010 and $421,685 as of December 31, 2009.
|
4. Intangible Assets
|
||||||||
|
Intangible assets consisted of:
|
2010
|
2009
|
||||||
|
Patents
|
$ | 1,794,754 | $ | 1,695,881 | ||||
|
Trademarks
|
554,590 | 534,058 | ||||||
| 2,349,344 | 2,229,939 | |||||||
|
Accumulated amortization
|
483,113 | 366,291 | ||||||
| $ | 1,866,231 | $ | 1,863,648 | |||||
Amortization expense for patents and trademarks for the years ended December 31, 2010, and 2009 were $114,822 and $113,987, respectively. The estimated aggregate amortization expense for each of the next five succeeding years, calculated on a similar basis, is as follows: 2011 - $118,190; 2012 - $116,733; 2013 - $116,594; 2014 - $103,365; and 2015 - $90,656.
22
|
5. Other Accrued Liabilities
|
||||||||
|
Other current and long-term accrued liabilities consisted of:
|
||||||||
|
2010
|
2009
|
|||||||
|
Customer rebates
|
$ | 2,436,993 | $ | 2,489,410 | ||||
|
Remediation liability
|
343,539 | 681,444 | ||||||
|
Pension liability
|
1,164,217 | 1,308,655 | ||||||
|
Other
|
1,083,548 | 588,575 | ||||||
| $ | 5,028,297 | $ | 5,068,084 | |||||
6. Pension and Profit Sharing
United States employees, hired prior to July 1, 1993, are covered by a funded, defined benefit pension plan. The benefits of this pension plan are based on years of service and the average compensation of the highest three consecutive years during the last ten years of employment. In December 1995, the Company's Board of Directors approved an amendment to the United States pension plan that terminated all future benefit accruals as of February 1, 1996, without terminating the pension plan.
The Company’s funding policy with respect to its qualified plan is to contribute at least the minimum amount required by applicable laws and regulations. In 2010, the Company contributed $265,000 to the plan and expects to contribute approximately $300,000 during 2011.
The plan asset weighted average allocation at December 31, 2010 and December 31, 2009, by asset category, were as follows:
|
Asset Category
|
2010
|
2009
|
|
Equity Securities
|
68%
|
70%
|
|
Fixed Income Securities
|
30%
|
30%
|
|
Other Securities / Investments
|
2%
|
0%
|
|
Total
|
100%
|
100%
|
The Company’s investment policy for the pension plan is to minimize risk by balancing investments between equity securities and fixed income securities, utilizing a weighted average approach of 65% equity securities, 30% fixed income securities, and 5% cash investments. Plan funds are invested in long-term obligations with a history of moderate to low risk.
As of each December 31, 2010 and 2009, equity securities in the pension plan included 10,000 shares of the Company's Common Stock, having a market value of $95,200 and $91,993, respectively.
The pension plan asset information included below is presented at fair value. ASC 820 establishes a framework for measuring fair value and requires disclosures about assets and liabilities measured at fair value. The fair value hierarchy prioritizes the inputs to valuation techniques used to measure fair value into three levels as follows:
|
·
|
Level 1 – Inputs to the valuation methodology based on unadjusted quoted market prices in active markets that are accessible at the measurement date.
|
|
·
|
Level 2 – Inputs to the valuation methodology that include quoted market prices that are not considered to be active or financial instruments for which all significant inputs are observable, either directly or indirectly.
|
|
·
|
Level 3 – Inputs to the valuation methodology are unobservable and significant to the fair value measurement.
|
The following table presents the pension plan assets by level within the fair value hierarchy as of December 31, 2010.
23
|
Level 1
|
Level 2
|
Level 3
|
Total
|
|||||||||||||
|
Money Market Fund
|
$ | 36,002 | $ | - | $ | - | $ | 36,002 | ||||||||
|
Acme United Common Stock
|
95,200 | - | - | 95,200 | ||||||||||||
|
Equity Common and Collected Funds
|
- | 795,384 | - | 795,384 | ||||||||||||
|
Fixed Income Common and Collected Funds
|
- | 388,842 | - | 388,842 | ||||||||||||
|
Total
|
$ | 131,202 | $ | 1,184,226 | $ | - | $ | 1,315,428 | ||||||||
|
Other disclosures related to the pension plan follow:
|
||||||||
|
2010
|
2009
|
|||||||
|
Assumptions used to determine benefit obligation:
|
||||||||
|
Discount rate
|
4.42 | % | 5.06 | % | ||||
|
Changes in benefit obligation:
|
||||||||
|
Benefit obligation at beginning of year
|
$ | (2,555,196 | ) | $ | (2,641,926 | ) | ||
|
Interest cost
|
(122,416 | ) | (151,990 | ) | ||||
|
Service cost
|
(25,000 | ) | (25,000 | ) | ||||
|
Amendment
|
- | - | ||||||
|
Actuarial loss
|
(117,417 | ) | (99,923 | ) | ||||
|
Benefits and plan expenses paid
|
340,384 | 363,643 | ||||||
|
Benefit obligation at end of year
|
(2,479,645 | ) | (2,555,196 | ) | ||||
|
Changes in plan assets:
|
||||||||
|
Fair value of plan assets at beginning of year
|
1,246,541 | 1,261,036 | ||||||
|
Actual return on plan assets
|
144,274 | 241,408 | ||||||
|
Employer contribution
|
264,997 | 107,740 | ||||||
|
Benefits and plan expenses paid
|
(340,384 | ) | (363,643 | ) | ||||
|
Fair value of plan assets at end of year
|
1,315,428 | 1,246,541 | ||||||
|
Funded status
|
$ | (1,164,217 | ) | $ | (1,308,655 | ) | ||
|
Accrued benefits costs are included in other accrued liabilities (non-current).
|
||||||||
| 2010 | 2009 | |||||||
|
Assumptions used to determine net periodic benefit cost:
|
||||||||
|
Discount rate
|
5.06 | % | 6.19 | % | ||||
|
Expected return on plan assets
|
8.25 | % | 8.25 | % | ||||
|
Components of net benefit expense:
|
||||||||
|
Interest cost
|
$ | 122,416 | $ | 151,990 | ||||
|
Service cost
|
25,000 | 25,000 | ||||||
|
Expected return on plan assets
|
(95,422 | ) | (94,951 | ) | ||||
|
Amortization of prior service costs
|
9,154 | 9,154 | ||||||
|
Amortization of actuarial loss
|
154,555 | 167,500 | ||||||
|
Net periodic benefit cost
|
$ | 215,703 | $ | 258,693 | ||||
24
The Company employs a building block approach in determining the long-term rate of return for plan assets. Historical markets are studied and long-term historical relationships between equity securities and fixed income securities are preserved consistent with the widely-accepted capital market principle that assets with higher volatility generate higher returns over the long run. Our expected 8.25% long-term rate of return on plan assets is determined based on long-term historical performance of plan assets, current asset allocation and projected long-term rates of return.
The following table discloses the change recorded in other comprehensive income related to benefit costs:
|
2010
|
2009
|
|||||||
|
Balance at beginning of the year
|
$ | 1,925,609 | $ | 2,148,797 | ||||
|
Change in net loss
|
68,565 | (46,534 | ) | |||||
|
Amortization of actuarial loss
|
(154,555 | ) | (167,500 | ) | ||||
|
Amortization of prior service cost
|
(9,154 | ) | (9,154 | ) | ||||
|
Change recognized in other comprehensive income
|
(95,144 | ) | (223,188 | ) | ||||
|
Total recognized in other comprehensive income
|
$ | 1,830,465 | $ | 1,925,609 | ||||
|
Amounts recognized in Accumulated Other Comprehensive Income:
|
||||||||
|
Net actuarial loss
|
$ | 1,781,982 | $ | 1,867,972 | ||||
|
Prior service cost
|
48,483 | 57,637 | ||||||
|
Total
|
$ | 1,830,465 | $ | 1,925,609 | ||||
In 2011, net periodic benefit cost will include approximately $150,000 of net actuarial loss and $9,000 of prior service cost.
The following benefits are expected to be paid:
|
2011
|
$ | 300,000 | ||
|
2012
|
285,000 | |||
|
2013
|
268,000 | |||
|
2014
|
258,000 | |||
|
2015
|
240,000 | |||
|
Years 2016 - 2020
|
929,000 |
The Company also has a qualified, profit sharing plan covering substantially all of its United States employees. Annual Company contributions to this profit sharing plan are determined by the Company’s Compensation Committee. For the years ended December 31, 2010 and 2009, the Company contributed 50% of employee’s contributions, up to the first 6% of each employee’s contribution. Total contribution expense under this profit sharing plan was $114,085 in 2010 and $99,882 in 2009.
25
|
7. Income Taxes
|
||||||||
|
The amounts of income tax expense (benefit) reflected in operations is as follows:
|
||||||||
|
2010
|
2009
|
|||||||
|
Current:
|
||||||||
|
Federal
|
$ | 103,040 | $ | 246,910 | ||||
|
State
|
11,312 | 28,055 | ||||||
|
Foreign
|
594,110 | 630,500 | ||||||
| 708,462 | 905,465 | |||||||
|
Deferred:
|
||||||||
|
Federal
|
(8,160 | ) | (257,441 | ) | ||||
|
State
|
(356,950 | ) | (22,747 | ) | ||||
|
Foreign
|
(5,469 | ) | (14,410 | ) | ||||
| (370,579 | ) | (294,598 | ) | |||||
| $ | 337,883 | $ | 610,867 | |||||
The current state tax provision was comprised of taxes on income, the minimum capital tax and other franchise taxes related to the jurisdictions in which the Company's facilities are located.
A summary of United States and foreign income before income taxes follows:
|
2010
|
2009
|
|||||||
|
United States
|
$ | 12,481 | $ | 814,582 | ||||
|
Foreign
|
2,898,366 | 2,638,372 | ||||||
| $ | 2,910,847 | $ | 3,452,954 | |||||
|
The following schedule reconciles the amounts of income taxes computed at the United
|
||||||||
|
States statutory rates to the actual amounts reported in operations.
|
||||||||
|
2010
|
2009
|
|||||||
|
Federal income
|
||||||||
|
taxes at
|
||||||||
|
34% statutory rate
|
$ | 989,688 | $ | 1,174,004 | ||||
|
State and local
|
||||||||
|
taxes, net of
|
||||||||
|
federal income
|
||||||||
|
tax effect
|
3,322 | 3,503 | ||||||
|
Permanent items
|
24,316 | 39,505 | ||||||
|
Charitable Donations
|
(350,672 | ) | (345,099 | ) | ||||
|
Foreign tax rate difference
|
(383,179 | ) | (494,861 | ) | ||||
|
Change in deferred income tax
|
||||||||
|
valuation allowance
|
54,358 | 233,815 | ||||||
|
Provision for income taxes
|
$ | 337,833 | $ | 610,867 | ||||
26
The following summarizes deferred income tax assets and liabilities:
|
2010
|
2009
|
|||||||
|
Deferred income tax liabilities:
|
||||||||
|
Plant, property
|
||||||||
|
and equipment
|
$ | 383,875 | $ | 356,726 | ||||
| 383,875 | 356,726 | |||||||
|
Deferred income tax assets:
|
||||||||
|
Asset valuations
|
372,774 | 122,921 | ||||||
|
Contribution carryforward
|
309,818 | 373,925 | ||||||
|
Operating loss
|
||||||||
|
carryforwards and credits
|
2,047,287 | 1,850,929 | ||||||
|
Pension
|
522,903 | 576,114 | ||||||
|
Foreign tax credit
|
- | 142,000 | ||||||
|
Other
|
328,718 | 85,277 | ||||||
| 3,581,500 | 3,151,166 | |||||||
|
Net deferred
|
||||||||
|
income tax asset before valuation allowance
|
3,197,625 | 2,794,440 | ||||||
|
Valuation
|
||||||||
|
allowance
|
(2,047,287 | ) | (1,992,929 | ) | ||||
|
Net deferred
|
||||||||
|
income tax asset
|
$ | 1,150,338 | $ | 801,511 | ||||
In 2010, the Company evaluated its tax positions for years which remain subject to examination by major tax jurisdictions, in accordance with the requirements of ASC 740 and as a result concluded no adjustment was necessary. The Company files income tax returns in the U.S. federal jurisdiction, and various state and foreign jurisdictions. The Company’s evaluation of uncertain tax positions was performed for the tax years ended December 31, 2006 and forward, the tax years which remain subject to examination by major tax jurisdictions as of December 31, 2010.
In accordance with the Company’s accounting policies, any interest and penalties related to uncertain tax positions are recognized as a component of income tax expense.
The Company provides deferred income taxes on foreign subsidiary earnings, which are not considered permanently reinvested. Earnings permanently reinvested would become taxable upon the sale or liquidation of a foreign subsidiary or upon the remittance of dividends. During 2010, the Company repatriated $500,000 of foreign earnings from its Canadian subsidiary and $1,000,000 of foreign earnings from its Asian subsidiary. U.S. income taxes on those repatriated earnings have been partially offset by foreign tax credits. The Company plans to continue to repatriate future earnings of its Canadian subsidiary and will provide for U.S. income taxes accordingly. Foreign subsidiary earnings of $8,616,398 and $7,220,529 are considered permanently reinvested as of December 31, 2010 and 2009, respectively, and no deferred income taxes have been provided on these foreign earnings.
Due to the uncertain nature of the realization of the Company's deferred income tax assets based on past performance and carry forward expiration dates, the Company has recorded a valuation allowance for the amount of deferred income tax assets which are not expected to be realized. This valuation allowance is subject to periodic review, and if the allowance is reduced, the tax benefit will be recorded in future operations as a reduction of the Company's tax expense.
At December 31, 2010, the Company has tax operating loss carry forwards aggregating $6,655,596, all of which are applicable to Germany, and can be carried forward indefinitely.
27
8. Debt
Long term debt consists of borrowings under the Company’s revolving loan agreement with Wells Fargo Bank. As of December 31, 2010, $13,522,000 was outstanding and $4,478,000 was available for borrowing under the Company’s revolving loan agreement.
Under the revolving loan agreement, the Company is required to maintain specific amounts of tangible net worth, a specified debt service coverage ratio, and a fixed charge coverage ratio. The Company was in compliance with these financial covenants at December 31, 2010.
On February 23, 2011, the Company modified its revolving loan agreement with Wells Fargo Bank to amend certain provisions of the original agreement. The amendments include an increase in the maximum borrowing amount from $18 million to $20 million and an extension of the maturity date of the loan from February 1, 2012 to March 31, 2013. This modified loan agreement continues to be secured by the assets of the U.S. parent company. Funds borrowed under the modified loan agreement may be used for working capital, general operating expenses, share repurchases and certain other purposes.
9. Commitments and Contingencies
The Company leases certain office, manufacturing and warehouse facilities and various equipment under non-cancelable operating leases. Total rent expense was $624,734 and $668,297in 2010 and 2009. Minimum annual rental commitments under non-cancelable leases with remaining terms of one year or more as of December 31, 2010: 2011 - $592,694; 2012 - $226, 034; 2013 - $143,014; 2014 - $120,562; and 2015 - $69,437.
The Company is involved, from time to time, in disputes and other litigation in the ordinary course of business, including certain environmental and other matters. The Company presently believes that none of these matters, individually or in the aggregate, would be likely to have a material adverse effect on its financial position, results of operations, or liquidity.
10. Segment Information
The Company reports financial information based on the organizational structure used by management for making operating and investment decisions and for assessing performance. The Company’s reportable business segments include (1) United States; (2) Canada and (3) Europe. The financial results of the Company’s Asian operations have been aggregated with the results of its United States operations to form one reportable segment called the “United States segment”. Each reportable segment derives its revenue from the sales of cutting devices, measuring instruments and safety products for school, office, home, hardware and industrial use.
The Chief Operating Decision Maker evaluates the performance of each operating segment based on segment revenues and operating income. Segment revenues are defined as total revenues, including both external customer revenue and intersegment revenue. Segment operating earnings are defined as segment revenues, less cost of goods sold and operating expenses. Identifiable assets by segment are those assets used in the respective reportable segment’s operations. Intersegment amounts are eliminated to arrive at consolidated financial results.
28
|
Financial data by segment:
|
|||||||||||||||||
| 2010 | |||||||||||||||||
|
(000's omitted)
|
United States
|
Canada
|
Europe
|
Consolidated
|
|||||||||||||
|
Sales to unaffiliated customers
|
$ | 47,184 | $ | 7,720 | $ | 8,245 | $ | 63,149 | |||||||||
|
Operating income (loss)
|
2,660 | 807 | (487 | ) | 2,980 | ||||||||||||
|
Assets
|
37,683 | 6,205 | 5,691 | 49,581 | |||||||||||||
|
Additions to property, plant and equipment
|
788 | 40 | 110 | 937 | |||||||||||||
|
Depreciation and amortization
|
745 | 52 | 73 | 870 | |||||||||||||
| 2009 | |||||||||||||||||
|
Sales to unaffiliated customers
|
$ | 44,908 | $ | 7,033 | $ | 7,207 | $ | 59,149 | |||||||||
|
Operating income (loss)
|
3,158 | 416 | (547 | ) | 3,027 | ||||||||||||
|
Assets
|
31,377 | 5,606 | 5,326 | 42,309 | |||||||||||||
|
Additions to property, plant and equipment
|
534 | 14 | 20 | 567 | |||||||||||||
|
Depreciation and amortization
|
771 | 62 | 85 | 918 | |||||||||||||
The following is a reconciliation of segment operating income to consolidated income before taxes:
|
2010
|
2009
|
|||||||
|
Total operating income
|
$ | 2,980 | $ | 3,027 | ||||
|
Interest expense (income), net
|
142 | 26 | ||||||
|
Other income, net
|
72 | 452 | ||||||
|
Consolidated income before taxes
|
$ | 2,910 | $ | 3,453 | ||||
|
Net Income
|
$ | 2,573 | $ | 2,842 | ||||
11. Stock Option Plans
The Company has two stock option plans: (1) the 2002 Employee Stock Option Plan, as amended (the “Employee Plan”) and (2) the 2005 Non-Salaried Director Stock Option Plan (the “Director Plan”).
The Employee Plan provides for the issuance of incentive and nonqualified stock options at an exercise price equal to the fair market value of the Common Stock on the date the option is granted. The terms of the options granted are subject to the provisions of the Employee Plan. Options granted under the Employee Plan vest 25% one day after the first anniversary of the grant date and 25% one day after each of the next three anniversaries. As of December 31, 2010, the number of shares available for grant under the Employee Plan was 62,438.
The Director Plan provides for the issuance of stock options for up to 50,000 shares of the Company's common stock to non-salaried directors. Under the Director Plan, Directors elected on April 25, 2005 and at subsequent Annual Meetings who have not received any prior grant under this or previous plans receive an initial grant of an option to purchase 5,000 shares of Common Stock (the “Initial Option”). Each year, each elected Director not receiving an Initial Option will receive a 2,500 share option (the “Annual Option”). The Initial Option vests 25% on the date of grant and 25% on the anniversary of the grant date in each of the following 3 years. Each Annual Option becomes fully exercisable one day after the date of grant. The exercise price of all options granted equals the fair market value of the Common Stock on the date the option is granted and expires ten (10) years from the date of grant. As of December 31, 2010, the number of shares available for grant under the Director Plan was 8,500.
29
A summary of changes in options issued under the Company’s stock option plans follows:
|
2010
|
2009
|
|||||||
|
Options outstanding at the
|
||||||||
|
beginning of the year
|
722,500 | 608,500 | ||||||
|
Options granted
|
203,000 | 151,000 | ||||||
|
Options forfeited
|
(25,000 | ) | (17,000 | ) | ||||
|
Options exercised
|
(61,550 | ) | (20,000 | ) | ||||
|
Options outstanding at
|
||||||||
|
the end of the year
|
838,950 | 722,500 | ||||||
|
Options exercisable at the
|
||||||||
|
end of the year
|
499,387 | 482,125 | ||||||
|
Common stock available for future grants at
the end of the year
|
70,938 | 98,938 | ||||||
|
Weighted average exercise price per share:
|
||||||||
|
Granted
|
$ | 10.13 | $ | 7.84 | ||||
|
Forfeited
|
14.77 | 15.36 | ||||||
|
Exercised
|
2.71 | 2.19 | ||||||
|
Outstanding
|
10.38 | 9.96 | ||||||
|
Exercisable
|
10.67 | 9.62 | ||||||
|
A summary of options outstanding at December 31, 2010 is as follows:
|
||||||||||||||||||||||
| Options Outstanding |
Options Exercisable
|
|||||||||||||||||||||
|
Range of Exercise Prices
|
Number Outstanding
|
Weighted-Average Remaining Contractual Life (Years)
|
Weighted-Average Exercise Price
|
Number Exercisable
|
Weighted-Average Exercise Price
|
|||||||||||||||||
| $1.70 to $5.11 | 137,700 |
< 1
|
$ | 3.47 | 137,700 | $ | 3.47 | |||||||||||||||
| $5.12 to $8.51 | 155,500 | 8 | 7.71 | 57,000 | 7.38 | |||||||||||||||||
| $8.52 to $10.21 | 184,000 | 9 | 9.97 | 0 | 0.00 | |||||||||||||||||
| $10.22 to $13.62 | 121,000 | 7 | 12.98 | 86,500 | 12.91 | |||||||||||||||||
| $13.63 to $17.02 | 240,750 | 5 | 15.16 | 218,187 | 15.18 | |||||||||||||||||
| 838,950 | 499,387 | |||||||||||||||||||||
The weighted average remaining contractual life of all outstanding stock options is 6 years.
Stock Based Compensation
Stock-based compensation cost is measured at the grant date based on the fair value of the award and is recognized as expense over the requisite service period, which is generally the vesting period. The Company uses the Black-Scholes option pricing model to determine the fair value of employee and non-employee director stock options. The determination of the fair value of stock-based payment awards on the date of grant, using an option-pricing model, is affected by the Company’s stock price as well as assumptions regarding a number of complex and subjective variables. These assumptions include estimating the length of time employees will retain their vested stock options before exercising them (“expected term”), the estimated volatility of the Company’s common stock price over the expected term (“volatility”) and the number of options that will not fully vest in accordance with applicable vesting requirements (“forfeitures”).
30
The Company estimates the expected term of options granted by evaluating various factors, including the vesting period, historical employee information, as well as current and historical stock prices and market conditions. The Company estimates the volatility of its common stock by calculating historical volatility based on the closing stock price on the last day of each of the 60 months leading up to the month the option was granted. The risk-free interest rate that the Company uses in the option valuation model is the interest rate on U.S. Treasury zero-coupon bond issues with remaining terms similar to the expected term of the options granted. Historical information was the basis for calculating the dividend yield. The Company is required to estimate forfeitures at the time of grant and to revise those estimates in subsequent periods if actual forfeitures differ from those estimates. The Company used a mix of historical data and future assumptions to estimate pre-vesting option forfeitures and to record stock-based compensation expense only for those awards that are expected to vest. All stock-based payment awards are amortized over the requisite service periods of the awards, which are generally the vesting periods.
The assumptions used to value option grants for the twelve months ended December 31, 2010 and December 31, 2009 were as follows:
|
2010
|
2009
|
||
|
Expected life in years
|
5
|
5
|
|
|
Interest rate
|
1.55 – 2.54%
|
1.82 - 2.95%
|
|
|
Volatility
|
.336-.359
|
.384-.386
|
|
|
Dividend yield
|
1.80% - 2.30%
|
2.50%
|
|
Total stock-based compensation recognized in the Company’s consolidated statements of operations for the years ended December 31, 2010 and 2009 was $385,732 and $308,377, respectively. At December 31, 2010, there was approximately $662,758 of unrecognized compensation cost, adjusted for estimated forfeitures, related to non-vested stock-based payments granted to the Company’s employees. As of December 31, 2010, the remaining unamortized expense is expected to be recognized over a weighted average period of 3 years.
The weighted average fair value at the date of grant for options granted during 2010 and 2009 was $2.71 and $2.34 per option, respectively. The aggregate intrinsic value of outstanding options was $1,114,904 at December 31, 2010. The aggregate intrinsic value of exercisable options was $954,524 at December 31, 2010. The aggregate intrinsic value of options exercised during 2010 was $460,923.
12. Earnings Per Share
The calculation of earnings per share follows:
|
2010
|
2009
|
|||||||
|
Numerator:
|
||||||||
|
Net income
|
$ | 2,572,964 | $ | 2,842,087 | ||||
|
Denominator:
|
||||||||
|
Denominator for basic earnings per share:
|
||||||||
|
Weighted average shares outstanding
|
3,128,509 | 3,288,867 | ||||||
|
Effect of dilutive employee stock options
|
65,805 | 63,921 | ||||||
|
Denominator for dilutive earnings per share
|
3,194,314 | 3,352,788 | ||||||
|
Basic earnings per share
|
$ | 0.82 | $ | 0.86 | ||||
|
Dilutive earnings per share
|
$ | 0.81 | $ | 0.85 | ||||
For 2010 and 2009, respectively, 473,750 and 364,250 stock options were excluded from diluted earnings per share calculations because they would have been anti-dilutive.
31
|
13. Accumulated Other Comprehensive (loss) income
|
||||||||||||
|
The components of the accumulated other comprehensive (loss) income follow:
|
||||||||||||
|
Foreign currency translation adjustment
|
Net prior service credit and actuarial losses
|
Total
|
||||||||||
|
Balances, December 31, 2008
|
(388,220 | ) | (1,275,140 | ) | (1,663,361 | ) | ||||||
|
Change in net prior service credit
|
||||||||||||
|
and actuarial losses, net of
|
||||||||||||
|
income tax expense of $82,218,
|
140,970 | 140,970 | ||||||||||
|
Translation adjustment
|
709,421 | 709,421 | ||||||||||
|
Balances, December 31, 2009
|
$ | 321,201 | $ | (1,134,170 | ) | $ | (812,970 | ) | ||||
|
Change in net prior service credit
|
||||||||||||
|
and actuarial losses, net of
|
||||||||||||
|
income tax expense of $35,053,
|
(21,950 | ) | (21,950 | ) | ||||||||
|
Translation adjustment
|
(40,237 | ) | (40,237 | ) | ||||||||
|
Balances, December 31, 2010
|
$ | 280,964 | $ | (1,156,120 | ) | $ | (875,157 | ) | ||||
14. Financial Instruments
The carrying value of bank debt is a reasonable estimate of fair value because of its short term nature. The carrying value of the Company’s note receivable approximates fair value. Fair value was determined using a discounted cash flow analysis.
15. Quarterly Data (unaudited)
|
Quarters (000's omitted, except per share data)
|
||||||||||||||||||||
|
2010
|
First
|
Second
|
Third
|
Fourth
|
Total
|
|||||||||||||||
|
Net sales
|
$ | 13,121 | $ | 20,585 | $ | 16,083 | $ | 13,360 | $ | 63,149 | ||||||||||
|
Cost of goods sold
|
8,008 | 13,034 | 10,426 | 8,316 | 39,784 | |||||||||||||||
|
Net income
|
214 | 1,566 | 612 | 181 | 2,573 | |||||||||||||||
|
Basic earnings per share
|
$ | 0.07 | $ | 0.50 | $ | 0.20 | $ | 0.06 | $ | 0.82 | ||||||||||
|
Diluted earnings per share
|
$ | 0.07 | $ | 0.48 | $ | 0.19 | $ | 0.07 | $ | 0.81 | ||||||||||
|
Dividends per share
|
$ | 0.05 | $ | 0.05 | $ | 0.06 | $ | 0.06 | $ | 0.22 | ||||||||||
|
2009
|
First
|
Second
|
Third
|
Fourth
|
Total
|
|||||||||||||||
|
Net sales
|
$ | 11,297 | $ | 19,161 | $ | 15,269 | $ | 13,422 | $ | 59,149 | ||||||||||
|
Cost of goods sold
|
7,000 | 12,056 | 9,771 | 8,248 | 37,075 | |||||||||||||||
|
Net income
|
42 | 1,341 | 728 | 731 | 2,842 | |||||||||||||||
|
Basic earnings per share
|
$ | 0.01 | $ | 0.40 | $ | 0.22 | $ | 0.23 | $ | 0.86 | ||||||||||
|
Diluted earnings per share
|
$ | 0.01 | $ | 0.40 | $ | 0.22 | $ | 0.22 | $ | 0.85 | ||||||||||
|
Dividends per share
|
$ | 0.05 | $ | 0.05 | $ | 0.05 | $ | 0.05 | $ | 0.20 | ||||||||||
Earnings per share are computed independently for each of the quarters presented. Therefore, the sum of the four quarterly earnings per share amounts may not necessarily equal the earnings per share for the year.
16. Sale of Property
In December 2008, the Company sold property it owned in Bridgeport, Connecticut to B&E Juices, Inc. for $2.5 million. The property consisted of approximately four acres of land and 48,000 sq. feet of warehouse space. The property was the site of the original Acme United scissor factory which opened in 1887 and was closed in 1996.
32
Under the terms of the sale agreement, and as required by the Connecticut Transfer Act, the Company is responsible to remediate any environmental contamination on the property. During 2008, the Company hired an independent environmental consulting firm to conduct environmental studies in order to identify the extent of the environmental contamination on the property and to develop a remediation plan. As a result of those studies and the estimates prepared by the independent environmental consulting firm, the Company recorded an undiscounted liability of approximately $1.8 million in the fourth quarter of 2008, related to the remediation of the property. This accrual included the costs of required investigation, remedial activities, and post-remediation operating and maintenance.
Remediation work on the project began in the third quarter of 2009 and a major portion of the work has been completed. During 2010, the Company had paid approximately $248,000 for work related to the remediation and has approximately $343,000 remaining in its accrual for environmental remediation, of which approximately $191,000 was classified as a current liability.
In addition to the remediation work, the Company, with the assistance of its independent environmental consulting firm, must continue to monitor contaminant levels on the property to ensure they comply with set governmental standards. The Company expects that the monitoring period could last a minimum of three years from the completion of the remediation work.
The change in the accrual for environmental remediation for the year ended December 31, 2010 follows (in thousands):
|
Balance at
December 31, 2009
|
Payments
|
Change in Estimate
|
Balance at
December 31, 2010
|
|
$ 681
|
$ (248)
|
$ (100)
|
$ 343
|
Also, as part of the sale, the Company has provided the buyer with a mortgage of $2.0 million at six percent interest. The mortgage is payable in monthly installments with the outstanding balance due in full, one year after remediation and monitoring on the property have been completed. It is estimated that the remediation project will be completed within five years from the date of the sale.
17. Business Combination
On February 28, 2011, the Company purchased The Pac-Kit Safety Equipment Company, a leading manufacturer of first aid kits for the industrial, safety transportation and marine markets. The Company purchased the accounts receivable, inventory, equipment and brands for approximately $3.4 million. Pac-Kit sells high quality, unitized ANSI kits to a broad range of customers and distributors. Pac-Kit produces its products in a 40,000 square foot FDA facility in Norwalk, CT and employs 33 people.
33
To the Audit Committee of the
Board of Directors and Shareholders
of Acme United Corporation
We have audited the accompanying consolidated balance sheet of Acme United Corporation and Subsidiaries (the “Company”) as of December 31, 2010, and the related consolidated statements of operations, changes in stockholders’ equity, and cash flows for the year then ended. These consolidated financial statements are the responsibility of the Company’s management. Our responsibility is to express an opinion on these financial statements and financial statement schedule based on our audit.
We conducted our audit in accordance with the standards of the Public Company Accounting Oversight Board (United States). Those standards require that we plan and perform the audit to obtain reasonable assurance about whether the financial statements are free of material misstatement. The Company is not required to have, nor were we engaged to perform, an audit of its internal control over financial reporting. Our audit included consideration of internal control over financial reporting as a basis for designing audit procedures that are appropriate in the circumstances, but not for the purpose of expressing an opinion on the effectiveness of the Company’s internal control over financial reporting. Accordingly, we express no such opinion. An audit also includes examining, on a test basis, evidence supporting the amounts and disclosures in the financial statements, assessing the accounting principles used and significant estimates made by management, as well as evaluating the overall financial statement presentation. We believe that our audit provides a reasonable basis for our opinion.
In our opinion, the financial statements referred to above present fairly, in all material respects, the consolidated financial position of Acme United Corporation and Subsidiaries, as of December 31, 2010, and the consolidated results of their operations and their cash flows for the year then ended in conformity with accounting principles generally accepted in the United States of America.
/s/ Marcum llp
marcum llp
New Haven, Connecticut
March 11, 2011
34
REPORT OF UHY LLP, INDEPENDENT REGISTERED PUBLIC ACCOUNTING FIRM
To the Board of Directors and Stockholders of
Acme United Corporation
We have audited the accompanying consolidated balance sheet of Acme United Corporation and subsidiaries (the “Company”) as of December 31, 2009, and the related consolidated statements of operations, changes in stockholders’ equity, and cash flows for the year then ended. These consolidated financial statements are the responsibility of the Company’s management. Our responsibility is to express an opinion on these financial statements based on our audit.
We conducted our audit in accordance with the standards of the Public Company Accounting Oversight Board (United States). Those standards require that we plan and perform the audit to obtain reasonable assurance about whether the financial statements are free of material misstatement. We were not engaged to perform an audit of the Company’s internal control over financial reporting. Our audit included consideration of internal control over financial reporting as a basis for designing audit procedures that are appropriate in the circumstances, but not for the purpose of expressing an opinion on the effectiveness of the Company’s internal control over financial reporting. Accordingly, we express no such opinion. An audit also includes examining, on a test basis, evidence supporting the amounts and disclosures in the financial statements, assessing the accounting principles used and significant estimates made by management, and evaluating the overall financial statement presentation. We believe that our audit provides a reasonable basis for our opinion.
In our opinion, the financial statements referred to above present fairly, in all material respects, the consolidated financial position of the Company as of December 31, 2009, and the consolidated results of its operations and its cash flows for the year then ended in conformity with accounting principles generally accepted in the United States of America.
/s/ UHY LLP
Hartford, Connecticut
March 8, 2010
35
Item 9. Changes In and Disagreements with Accountants on Accounting and Financial Disclosure
There have been no disagreements with accountants related to accounting and financial disclosures in 2010.
For information regarding the change in the Company’s independent registered public accounting firm, see the Form 8-k filed on April 21, 2010.
Item 9A. Controls and Procedures
Evaluation of Internal Controls and Procedures
Under the supervision and with the participation of our management, including the Chief Executive Officer and Chief Financial Officer, we have evaluated the effectiveness of our disclosure controls and procedures as required by Exchange Act Rule 13a-15(b) as of the end of the period covered by this report. Based on that evaluation, the Chief Executive Officer and Chief Financial Officer have concluded that these disclosure controls and procedures are effective.
Management of the Company is responsible for establishing and maintaining adequate internal control over financial reporting. The Company’s internal control over financial reporting is designed to provide reasonable assurance regarding the reliability of financial reporting and the preparation of financial statements for external purposes in accordance with generally accepted accounting principles in the United States of America. The Company’s internal control over financial reporting includes those policies and procedures that: (i) pertain to the maintenance of records that, in reasonable detail, accurately and fairly reflect the transactions and dispositions of the assets of the Company; (ii) provide reasonable assurance that transactions are recorded as necessary to permit preparation of financial statements in accordance with generally accepted accounting principles in the United States of America, and that receipts and expenditures of the Company are being made only in accordance with authorizations of management and directors of the Company; and (iii) provide reasonable assurance regarding prevention or timely detection of unauthorized acquisition, use or disposition of the Company’s assets that could have a material effect on the financial statements.
Any system of internal control, no matter how well designed, has inherent limitations, including the possibility that a control can be circumvented or overridden and misstatements due to error or fraud may occur and not be detected in a timely manner. Also, because of changes in conditions, internal control effectiveness may vary over time. Accordingly, even an effective system of internal control will provide only reasonable assurance with respect to financial statement preparation.
Management assessed the effectiveness of the Company’s internal control over financial reporting as of December 31, 2010. In making this assessment, management used the criteria set forth by the Committee of Sponsoring Organizations of the Treadway Commission (COSO) in "Internal Control-Integrated Framework.” Based on management’s assessment using the COSO criteria, management has concluded that the Company's internal control over financial reporting was effective as of December 31, 2010.
This annual report does not include an attestation report of the Company’s registered public accounting firm regarding internal control over financial reporting. Management’s report was not subject to attestation by the Company’s registered public accounting firm pursuant to the rules of the Securities and Exchange Commission that permit the Company to provide only management’s report in this Annual Report.
Changes in Internal Control over Financial Reporting
During the quarter ended December 31, 2010, there were no changes in the Company’s internal control over financial reporting that materially affected, or was reasonably likely to materially affect, our internal control over financial reporting.
Item 9B. Other Information
None.
36
PART III
Item 10. Directors, Executive Officers and Corporate Governance
The following table sets forth certain information with respect to the directors and executive officers of the Company. All directors of the Company hold office until the next annual meeting of the shareholders or until their successors have been elected and qualified. Executive officers are elected by the Board of Directors to hold office until their successors are elected and qualified.
|
Name
|
Age
|
Position Held with Company
|
|
Walter C. Johnsen
|
60
|
Chairman of the Board and Chief Executive Officer
|
|
Brian S. Olschan
|
54
|
President, Chief Operating Officer and Director
|
|
Paul G. Driscoll
|
50
|
Vice President, Chief Financial Officer, Secretary and Treasurer
|
|
Rex L. Davidson
|
61
|
Director
|
|
Richmond Y. Holden, Jr.
|
57
|
Director
|
|
Susan H. Murphy
|
59
|
Director
|
|
Stevenson E. Ward III
|
65
|
Director
|
Walter C. Johnsen has served as Chairman of the Board and Chief Executive Officer of the Company since January 1, 2007; President and Chief Executive Officer of the Company from November 30, 1995 to December 31, 2006. He formerly served as Vice Chairman and a principal of Marshall Products, Inc., a medical supply distributor. Mr. Johnsen’s qualifications to serve on the Board include the in-depth knowledge of all facets of the Company’s business which he has gained during his more than fifteen years of service as the Company’s Chief Executive Officer.
Brian S. Olschan has served as President and Chief Operating Officer of the Company since January 1, 2007; Executive Vice President and Chief Operating Officer of the Company from January 25, 1999 to December 31, 2006; Senior Vice President - Sales and Marketing of the Company from September 12, 1996 to January 24, 1999; formerly served as Vice President and General Manager of the Cordset and Assembly Business of General Cable Corporation, an electrical wire and cable manufacturer. Mr. Olschan’s qualifications to serve on the Board include his detailed knowledge of the Company’s operations which he has gained in his capacity as a member of senior management for more than eleven years, including as Chief Operating Officer since January 1999 and President since January 2007.
Paul G. Driscoll has served as Vice President and Chief Financial Officer, Secretary and Treasurer since October 2, 2002. Mr. Driscoll joined Acme as Director International Finance on March 19, 2001. From 1997 to 2001 he was employed by Ernest and Julio Gallo Winery including Director of Finance and Operations in Japan. Prior to Gallo he served in several increasingly responsible finance positions in Sterling Winthrop Inc. in New York City and Sanofi S.A. in France.
Rex L. Davidson has served as director since April, 2006. He is currently President of Rex Davidson Associates, LLC, a management consulting service and Executive Director of Las Cumbres Community Services which provides developmental disability and mental health services to children, adults and families in Northern New Mexico. Past President and Chief Executive Officer of Goodwill Industries of Greater New York and Northern New Jersey, Inc., and Past President of Goodwill Industries Housing Corporation. Mr. Davidson’s qualifications to serve on the Board include significant management experience at the highest level, having been responsible for the management of an organization with over 2,000 employees and revenues in excess of $100 million. Mr. Davidson’s experience in the areas of compensation of personnel at all levels, his experience relating to retail matters, such as retail trends and pricing, and diversity policies are of significant benefit to the company.
Richmond Y. Holden, Jr. has served as director since 1998 Since May 2007, Executive Vice President of School Specialty Inc., a distributor of school supplies. He served as President and Chief Executive Officer of J.L. Hammett Co., a reseller of educational products from 1992 to 2006. The qualifications of Mr. Holden to serve on the Board include his senior management level experience of large complex companies in the educational markets. In particular, as a result of his experience with School Specialty Inc., a $1 billion reseller of educational products, Mr. Holden has broad knowledge of educational markets and operational matters relating to educational products, such as marketing, sourcing, pricing and distribution.
37
Susan H. Murphy has served as director since 2003. She is presently Vice President for Student and Academic Services at Cornell University since 1994. From 1985 through 1994, Ms. Murphy served as Dean of Admissions and Financial Aid. Ms. Murphy has been employed at Cornell since 1978. Ms. Murphy received a Ph.D. from Cornell University. Ms. Murphy has broad senior management level experience in a large, complex organization. In particular, her experience in employee compensation matters and the development and implementation of diversity policies is helpful to the Company.
Stevenson E. Ward III has served as director since 2001. He is presently Vice President and Chief Financial Officer of Triton Thalassic Technologies, Inc. From 1999 through 2000, Mr. Ward served as Senior Vice President – Administration of Sanofi-Synthelabo, Inc. He also served as Executive Vice President (1996 – 1999) and Chief Financial Officer (1994 – 1995) of Sanofi, Inc. and Vice President, Pharmaceutical Group, Sterling Winthrop, Inc. (1992 – 1994). Prior to joining Sterling he was employed by General Electric with assignments in Purchasing, Corporate Audit and Financial Management. Mr. Ward’s qualifications for service on the Board include his extensive experience in senior executive level finance positions at Fortune 100 multinational corporations.
Code of Conduct
The Company has adopted a Code of Conduct that is applicable to its employees, including the Chief Executive Officer, Chief Financial Officer and Controller. The Code of Conduct is available in the investor relations section on the Company’s website at www.acmeunited.com
If the Company makes any substantive amendments to the Code of Conduct which apply to its Chief Executive Officer, Chief Financial Officer or Controller, or grants any waiver, including any implicit waiver, from a provision of the Code of Conduct to the Company’s executive officers, the Company will disclose the nature of the amendment or waiver on its website or in a report on Form 8-K.
Information regarding Section 16(a) Beneficial Ownership Reporting Compliance and Corporate Governance is incorporated herein by reference to the sections entitled (i) “Compliance with Section 16(a) of the Securities Exchange Act of 1934”, (ii) “Nominations for Directors”, and (iii) “Audit Committee” contained in the Company’s Proxy Statement to be filed with the Securities and Exchange Commission in connection with its 2010 Annual Meeting of Shareholders.
Item 11. Executive Compensation
Information with respect to executive compensation is incorporated herein by reference to the section entitled “Executive Compensation” contained in the Company’s Proxy Statement to be filed with the Securities and Exchange Commission in connection with the Company’s 2011 Annual Meeting of Shareholders.
Item 12. Security Ownership of Certain Beneficial Owners and Management
Information regarding security ownership of certain beneficial owners, directors and executive officers is incorporated herein by reference to the information in the section entitled “Security Ownership of Directors and Officers” contained in the Company’s Proxy Statement to be filed with the Securities and Exchange Commission in connection with its 2011 Annual Meeting of Shareholders.
Item 13. Certain Relationships and Related Transactions, and Director Independence
The Company has not engaged in any transactions with related persons in the fiscal year ended December 31, 2010 and there are no transactions with related persons currently proposed.
Information regarding Director Independence is incorporated herein by reference to the section entitled “Independence Determinations” contained in the Company’s Proxy Statement to be filed with the Securities and Exchange Commission in connection with the Company’s 2011 Annual Meeting of Shareholders
38
Item 14. Principal Accountant Fees and Services
Information regarding principal accountant fees and services is incorporated herein by reference to the section entitled “Fees to Auditors” contained in the Company’s Proxy Statement to be filed with the Securities and Exchange Commission in connection with its 2011 Annual Meeting of Shareholders.
PART IV
Item 15. Exhibits and Financial Statement Schedules
(a)(1) Financial Statements.
|
·
|
Consolidated Balance Sheets
|
|
·
|
Consolidated Statements of Operations
|
|
·
|
Consolidated Statements of Changes in Stockholders’ Equity
|
|
·
|
Consolidated Statements of Cash Flows
|
|
·
|
Notes to Consolidated Financial Statements
|
|
·
|
Reports of Independent Registered Public Accounting Firms
|
(a)(2) Financial Statement Schedules
|
·
|
Schedules other than those listed above have been omitted because of the absence of conditions under which they are required or because the required information is presented in the Financial Statements or Notes thereto.
|
(a)(3) The exhibits listed under Item 15(b) are filed or incorporated by reference herein.
(b) Exhibits.
The exhibits listed below are filed as part of this Annual Report on Form 10-K. Certain of the exhibits, as indicated, have been previously filed and are incorporated herein by reference.
|
Exhibit No.
|
Identification of Exhibit
|
|
3(i)
|
Certificate of Organization of the Company (1)
|
|
Amendment to Certificate of Organization of Registrant dated September 24, 1968 (1)
|
|
|
Amendment to Certificate of Incorporation of the Company dated April 27, 1971 (2)
|
|
|
Amendment to Certificate of Incorporation of the Company dated June 29, 1971 (2)
|
|
|
3(ii)
|
Amendment to the Company’s Bylaws (10)
|
|
4
|
Specimen of Common Stock certificate (2)
|
|
10.1
|
Non-Salaried Director Stock Option Plan dated April 22, 1996* (3)
|
|
10.1(a)
|
Amendment No. 1 to the Non-Salaried Director Stock Option Plan *(4)
|
|
10.1(b)
|
Amendment No. 2 to the Non-Salaried Director Stock Option Plan *(5)
|
39
|
10.2
|
1992 Amended and Restated Stock Option Plan* (6)
|
|
10.2(a)
|
Amendment No. 1 to the Amended and Restated Stock Option Plan* (7)
|
|
10.2(b)
|
Amendment No. 2 to the Amended and Restated Stock Option Plan* (8)
|
|
10.2(c)
|
Amendment No. 3 to the Amended and Restated Stock Option Plan* (9)
|
|
10.2(d)
|
Amendment No. 4 to the Amended and Restated Stock Option Plan* (9)
|
|
10.3
|
Acme United Employee Stock Option Plan dated February 26, 2002* as amended (11)
|
|
10.4
|
Severance Pay Plan dated September 28, 2004*
|
|
10.5(a)
|
Salary Continuation Plan dated September 28, 2004, as amended (13)*
|
|
10.6
|
2005 Non-Salaried Director Stock Option Plan (12)
|
|
10.8
|
Deferred Compensation Plan dated October 2, 2007
|
|
10.9
|
Fifth Modification to Revolving Promissory Note and Revolving Credit and Security Agreement, and Reaffirmation of Guaranty
|
| 10.10 | Sixth Modification to Revolving Promissory Note and Revolving Credit and Security Agreement, and Reaffirmation of Guaranty* |
|
Change in Control Plan dated February 24, 2011*
|
|
|
Subsidiaries of the Registrant
|
|
|
Consent of MARCUM LLP, Independent Registered Public Accounting Firm
|
|
|
Consent of UHY LLP, Independent Registered Public Accounting Firm
|
|
|
Certification of Walter Johnsen pursuant to Rule 13a-14(a) and 15d-14(a) and Section 302 of the Sarbanes-Oxley Act of 2002
|
|
|
Certification of Paul Driscoll pursuant to Rule 13a-14(a) and 15d-14(a) and Section 302 of the Sarbanes-Oxley Act of 2002
|
|
|
Certification of Walter Johnsen pursuant to Section 906 of the Sarbanes-Oxley Act of 2002
|
|
|
Certification of Paul Driscoll pursuant to Section 906 of the Sarbanes-Oxley Act of 2002
|
* Indicates a management contract or a compensatory plan or arrangement
|
(1)
|
Previously filed in S-1 Registration Statement No. 230682 filed with the Commission on November 7, 1968 and amended by Amendment No. 1 on December 31, 1968 and by Amendment No. 2 on January 31, 1969.
|
|
(2)
|
Previously filed as an exhibit to the Company’s Form 10-K filed in 1971.
|
|
(3)
|
Previously filed in the Company’s Form S-8 Registration Statement No. 333-26739 filed with the Commission on May 9, 1997.
|
|
(4)
|
Previously filed in the Company’s Form S-8 Registration Statement No. 333-84505 filed with the Commission on August 4, 1999.
|
40
|
(5)
|
Previously filed in the Company’s Form S-8 Registration Statement No. 333-70348 filed with the Commission on September 21, 2000.
|
|
(6)
|
Previously filed as an exhibit to the Company’s Proxy Statement filed on March 29, 1996.
|
|
(7)
|
Previously filed in the Company’s Form S-8 Registration Statement No. 333-26737 filed with the Commission on May 9, 1997.
|
|
(8)
|
Previously filed in the Company’s Form S-8 Registration Statement No. 333-84499 filed with the Commission on August 4, 1999.
|
|
(9)
|
Previously filed in the Company’s Form S-8 Registration Statement No. 333-70346 filed with the Commission on September 27, 2001.
|
|
(10)
|
Previously filed in the Company’s form 8-K filed on February 28, 2006.
|
|
(11)
|
Previously filed in the Company’s Proxy statement for the 2005 Annual Meeting of Shareholders.
|
|
(12)
|
Previously filed in the Company’s Form S-8 Registration Statement No. 333-126478 filed with the Commission on July 8, 2005.
|
|
(13)
|
Previously filed in the Company’s Form 8-K filed on December 21, 2010.
|
41
Pursuant to the requirements of Section 13 or 15(d) of the Securities Exchange Act of 1934, the registrant has duly caused this report to be signed on its behalf by the undersigned, thereunto duly authorized, on March 11, 2011.
ACME UNITED CORPORATION
(Registrant)
| Signatures | Titles | |
| s/ Walter C. Johnsen | ||
| Walter C. Johnsen | Chairman and Chief Executive Officer | |
| s/ Brian S. Olschan | ||
| Brian S. Olschan | President, Chief Operating Officer and Director | |
| s/ Paul G. Driscoll | ||
| Paul G. Driscoll | Vice President, Chief Financial Officer, | |
| Secretary and Treasurer | ||
| s/ Rex L. Davidson | ||
| Rex Davidson | Director | |
| s/ Richmond Y. Holden, Jr. | ||
| Richmond Y. Holden, Jr. | Director | |
| s/ Susan H. Murphy | ||
| Susan H. Murphy | Director | |
| s/ Stevenson E. Ward III | ||
| Stevenson E. Ward III | Director |
42