Attached files
UNITED STATES
SECURITIES AND EXCHANGE COMMISSION
Washington, D.C. 20549
_________________________________________________________________________
Form 10-K
_________________________________________________________________________
x | ANNUAL REPORT PURSUANT TO SECTION 13 OR 15(d) OF THE SECURITIES EXCHANGE ACT OF 1934 |
For the fiscal year ended December 31, 2010 | |
or | |
o | TRANSITION REPORT PURSUANT TO SECTION 13 OR 15(d) OF THE SECURITIES EXCHANGE ACT OF 1934 |
For the transition period from to | |
Commission file number 0-50854 | |
________________________________________________________________________
Thomas Properties Group, Inc.
(Exact name of registrant as specified in its charter)
_________________________________________________________________________
Delaware | 20-0852352 | |
(State or other jurisdiction of incorporation or organization) | (IRS employer identification number) | |
515 South Flower Street, Sixth Floor, Los Angeles, CA | 90071 | |
(Address of principal executive offices) | Zip Code |
Registrant’s telephone number, including area code
(213) 613-1900
____________________________________________________________
Securities registered pursuant to Section 12(b) of the Act:
Title of Each Class | Name of Each Exchange on Which Registered | |
Common Stock, $0.01 par value | The NASDAQ Stock Market LLC |
Securities registered pursuant to Section 12(g) of the Act: None
Indicate by check mark if the registrant is a well-known seasoned issuer, as defined in Rule 405 of the Securities Act. Yes o No x
Indicate by check mark if the registrant is not required to file reports pursuant to Section 13 or Section 15(d) of the Act. Yes o No x
Indicate by check mark whether the registrant (1) has filed all reports required to be filed by Section 13 or 15(d) of the Securities Exchange Act of 1934 during the preceding 12 months (or for such shorter period that the registrant was required to file such reports), and (2) has been subject to such filing requirements for the past 90 days. Yes x No o
Indicate by check mark whether the registrant has submitted electronically and posted on its corporate Web site, if any, every Interactive Data File required to be submitted and posted pursuant to Rule 405 of Regulation S-T (§232.405 of this chapter) during the preceding 12 months (or for such shorter period that the registrant was required to submit and post such files). Yes o No o
Indicate by check mark if disclosure of delinquent filers pursuant to Item 405 of Regulation S-K is not contained herein, and will not be contained, to the best of registrant’s knowledge, in definitive proxy or information statements incorporated by reference in Part III of this Form 10-K or any amendment to this Form 10-K. o
Indicate by check mark whether the registrant is a large accelerated filer, an accelerated filer, a non-accelerated filer, or a smaller reporting company, See the definitions of “large accelerated filer,” “accelerated filer” and “smaller reporting company” in Rule 12b-2 of the Exchange Act.
Large accelerated filer o | Accelerated filer x | Non-accelerated filer o | Smaller reporting company o | |||
(Do not check if a smaller reporting company) |
Indicate by check mark whether the registrant is a shell company (as defined in Rule 12b-2 of the Act). Yes o No x
The aggregate market value of the voting and non-voting common equity held by non-affiliates of the registrant was approximately $106,208,301
based on the closing price on the NASDAQ Global Market for such shares on June 30, 2010.
Indicate the number of shares outstanding of each of the issuer’s classes of common stock, as of the latest practicable date.
Class | Outstanding at March 9, 2011 | |
Common Stock, $.01 par value per share | 36,943,394 |
DOCUMENTS INCORPORATED BY REFERENCE
Portions of the registrant’s Proxy Statement with respect to its 2011 Annual Meeting of Stockholders to be filed not later than 120 days after the end of the registrant’s fiscal year are incorporated by reference into Part III hereof as noted therein.
THOMAS PROPERTIES GROUP, INC.
FORM 10-K
TABLE OF CONTENTS
Page No. | ||
Item 1. | ||
Item 1A. | ||
Item 1B. | ||
Item 2. | ||
Item 3. | ||
Item 4. | ||
Item 5. | ||
Item 6. | ||
Item 7. | ||
Item 7A. | ||
Item 8. | ||
Item 9. | ||
Item 9A. | ||
Item 9B. | ||
Item 10. | ||
Item 11. | ||
Item 12. | ||
Item 13. | ||
Item 14. | ||
Item 15. | ||
2
PART I
ITEM 1. BUSINESS
General
The terms “Thomas Properties Group,” “we,” “us”, “our Company” and "the Company" refer to Thomas Properties Group, Inc., together with our operating partnership, Thomas Properties Group, L.P. (the “Operating Partnership”). We are a full-service real estate company that owns, acquires, develops and manages primarily office, as well as mixed-use and residential properties on a nationwide basis. Our Company’s primary areas of focus are the acquisition and ownership of premier properties, both on a consolidated basis and through strategic joint ventures, property development and redevelopment, and property management activities. Property operations comprise our primary source of cash flow and provide revenue through rental operations, property management, asset management, leasing and other fee income. Our acquisitions program targets properties purchased both for our own account and that of third parties, targeted at core, core plus, and value-add properties. We engage in property development and redevelopment as market conditions warrant. As part of our investment management activities, we earn fees for advising institutional investors on property portfolios.
Our properties are located in Southern California and Sacramento, California; Philadelphia, Pennsylvania; Northern Virginia; Houston, Texas and Austin, Texas. As of December 31, 2010, we own interests in and asset manage 27 operating properties with 13.2 million rentable square feet and provide asset and/or property management services on behalf of third parties for an additional four operating properties with 2.3 million rentable square feet. We also have a direct and indirect ownership interest in a development pipeline of approximately 7.2 million square feet of primarily office development.
We were incorporated in the State of Delaware on March 9, 2004. On October 13, 2004, we completed our initial public offering. Our operations are carried on through our Operating Partnership of which we are the sole general partner. The Operating Partnership holds our direct and indirect interests in real estate properties, and it carries on our investment advisory, property management, leasing and real estate development operations.
We maintain offices in Los Angeles and Sacramento, California; Austin and Houston, Texas; Northern Virginia and Philadelphia, Pennsylvania. Our corporate headquarters are located at City National Plaza, 515 South Flower Street, Sixth Floor, Los Angeles, California 90,071 and our phone number is (213) 613-1900. Our website is www.tpgre.com. The information contained on our website is not part of this report. We make available free of charge through our website our annual reports on Form 10-K, quarterly reports on Form 10-Q, current reports on Form 8-K, and amendments to such reports filed with or furnished to the Securities and Exchange Commission (“SEC”), as soon as reasonably practicable after we file them with or furnish them to the SEC. You may also read and copy any materials we file with the SEC at the SEC’s Public Reference Room located at 100 F Street NE, Washington, DC 20549. Information on the operations of the Public Reference Room may be obtained by calling the SEC at 1-800-SEC-0330. You may also download these materials from the SEC’s website at www.sec.gov.
Business Focus
Portfolio Enhancement: We focus on increasing net revenues from the properties in which we own an interest or which we manage for third parties through proactive management. As part of portfolio management, we maintain strong tenant relationships through our commitment to service in marketing, lease negotiations, building design and property management.
Property Acquisitions: We seek to acquire “core,” “core plus,” and “value-add” properties for our own account and/or in joint ventures with others where such acquisitions provide us with attractive risk-adjusted returns. Core plus properties consist of under-performing properties that we believe can be brought to market potential through improved management. Value-add properties are characterized by unstable net revenues for an extended period of time, occupancy less than 90% and/or physical or management problems which we believe can be improved by investing additional capital and/or improving management.
Partnerships and Joint Ventures: We leverage our property acquisition and development expertise through partnerships and joint ventures. These entities provide us with additional capital for investment, shared risk exposure, and earned fees for asset management, property management, leasing and other services. We are the general partner and hold an ownership interest in TPG/CalSTRS, LLC (“TPG/CalSTRS”), a joint venture with the California State Teachers’ Retirement System (“CalSTRS”), which owns 12 office properties. In addition, TPG/CalSTRS is the general partner and holds an interest in a joint venture between TPG/CalSTRS, an affiliate of Lehman Brothers Inc. (“Lehman”) and another institutional investor (the “Austin Portfolio Joint Venture”), which owns 10 office properties in Austin, Texas. We are also the general partner and hold an interest in the Thomas High Performance Green Fund, L.P. (the “Green Fund”), which was formed to develop, redevelop and invest in
3
high performance, sustainable commercial buildings.
Development and Redevelopment: We develop and redevelop projects in diversified geographic markets using pre-leasing, guaranteed maximum cost construction contracts and other measures to reduce development risk. We have development properties in Los Angeles and El Segundo, California; Philadelphia, Pennsylvania; and Houston and Austin, Texas.
Our Fee Services: In 2006, we were engaged by NBC Universal (“NBCU”) to entitle and master plan approximately 124 acres on their Universal Studios Hollywood backlot for 2,900 housing units and 180,000 square feet for retail and community-serving uses. In 2010, we were successful in circulating a draft environmental impact report (“EIR”) for the project for public comment. With the circulation of this draft EIR, our services under the contract with NBCU ended; we anticipate providing additional services on the project, including processing of a final EIR for the site, subject to a mutual agreement between the Company and NBCU, following its merger with Comcast. Separately, we have been engaged by Korean Air, a subsidiary of Hanjin Group, as a fee developer for the entitlement, design and redevelopment of the 2.7 acre Wilshire Grand property in downtown Los Angeles, for which we are proposing the development of two buildings to include approximately 1.5 million square feet of office, 560 hotel rooms, and up to 100 residential condominiums, with supporting retail and restaurant uses, for a total project size of up to approximately 2.5 million gross square feet. Additionally, we have been engaged by the County of Los Angeles to provide consulting services to assist with certain real estate rehabilitation and/or development projects associated with real property owned by the County.
Competition
The real estate business is highly competitive. There are numerous other acquirers, developers, managers and owners of commercial and mixed-use real estate that compete with us nationally, regionally and locally, some of whom may have greater financial resources. They compete with us for acquisition opportunities, management and leasing revenues, land for development, tenants for properties and prospective investors in partnerships, joint ventures and funds we may establish through our investment advisory business.
Our properties compete for tenants with similar properties primarily on the basis of property quality, location, total occupancy costs (including base rent and operating expenses), services provided, building quality and the design and condition of any planned improvements or tenant improvements we may negotiate. The number and type of competing properties or available rentable space in a particular market or submarket could have a material effect on our ability to lease space and maintain or increase occupancy or rents in our existing properties. We believe, however, that the quality services and individualized attention that we offer our tenants, together with our property management services on site, enhance our ability to attract and retain tenants for the office properties we own an interest in or manage.
In addition, in many of our submarkets, institutional investors and owners and developers of properties (including other real estate operating companies and REITs) compete for the acquisition and development, or redevelopment, of land and buildings. Many of these entities have substantial resources and experience. We may compete for investors in potential partnerships, joint ventures and funds with other property investment managers with larger or more established operations. Additionally, our ability to compete depends upon trends in the economies of our markets in which we operate or own interests in properties, investment alternatives, financial condition and operating results of current and prospective tenants, availability and cost of capital and debt financing, construction and renovation costs, land availability, completion of construction approvals, taxes and governmental regulations.
Regulatory Issues
Environmental Matters
Under various federal, state and local environmental laws and regulations, a current or previous owner, manager or tenant of real estate may be required to investigate and clean up hazardous or toxic substances at the property, and may be held liable to a government entity or to third parties for property damage and for investigation, clean-up and monitoring costs incurred by the parties in connection with the actual or threatened contamination.
Federal regulations require building owners and those exercising control over a building’s management to identify and warn, via signs and labels, of potential hazards posed by workplace exposure to installed asbestos- containing materials and potentially asbestos-containing materials in their building. The regulations also set forth employee training, record keeping and due diligence requirements pertaining to asbestos-containing materials and potentially asbestos-containing materials. Federal, state and local laws and regulations also govern the removal, encapsulation, disturbance, handling and/or disposal of asbestos-containing materials and potentially asbestos-containing materials when the materials are in poor condition or in the event of
4
construction, remodeling or renovation of a building.
We are aware of potentially environmentally hazardous or toxic materials at two of the properties in which we hold an ownership interest. With respect to asbestos-containing materials present at our City National Plaza and Brookhollow Central properties, these materials have been removed or abated from certain tenant and common areas of the building structures. We continue to remove or abate asbestos-containing materials from various areas of the building structures and as of December 31, 2010, have accrued $1.3 million for estimated future costs of such removal or abatement at City National Plaza and Brookhollow Central.
Americans with Disabilities Act
Our properties must comply with Title III of the Americans with Disabilities Act, or ADA, to the extent that the properties are “public accommodations” as defined by the ADA. The ADA may require removal of structural barriers to access by persons with disabilities in public areas of our properties where the removal is readily achievable. The obligation to make readily achievable accommodations is an ongoing one, and we assess our properties and make alterations as appropriate.
Insurance
We carry comprehensive liability, fire, flood, extended coverage, wind, earthquake, terrorism, pollution legal liability, business interruption and rental loss insurance under our blanket policy covering all of the properties which we own an interest in or manage for third parties, including our development properties (although we carry only liability insurance for the California Environmental Protection Agency (“CalEPA”) headquarters building under our blanket policy because the tenant has the right to provide all other forms of coverage it deems necessary, and it has elected to do so, and we do not insure 816 Congress under our blanket policy because the third party owner has elected to carry it under its policy). We believe the policy specifications and insured limits are appropriate given the relative risk of loss, the cost of the coverage and industry practice. In our opinion, the properties in our portfolio are adequately insured. Our terrorism insurance is subject to exclusions for loss or damage caused by nuclear substances, pollutants, contaminants, and biological and chemical weapons. We carry earthquake insurance on our properties located in seismically active areas, which includes our Southern California properties, wind insurance on our properties located in “tier 1” wind zones, which includes our Houston, Texas properties, and terrorism insurance on all of our properties, in amounts and with deductibles which we believe are commercially reasonable.
Foreign Operations
We do not engage in any non-U.S. operations or derive any revenue from sources outside the United States.
Segment Financial Information
We operate in one business segment: the acquisition, development, ownership and management of commercial and mixed-use real estate. Additionally, we operate in one geographic area: the United States. Our office portfolio generates revenues from the rental of office space to tenants, parking, rental of storage space and other tenant services. Our management activities generate revenues from third parties and joint ventures in which the Operating Partnership is a partner from property and asset management fees, acquisition fees and disposition fees. For a further discussion of segment financial information, see the financial statements in Item 8 of this Report.
Employees
As of December 31, 2010, we had 158 employees. None of our employees are subject to a collective bargaining agreement or represented by a union, and we believe that relations with our employees are good. Our executive management team is based in our Los Angeles and Philadelphia offices.
Forward-Looking Statements
Forward-looking statements are subject to numerous risks and uncertainties that could cause actual results to differ materially from those anticipated and you should not rely on them as predictions of future events. Although information is based on our current estimates, forward-looking statements depend on assumptions, data or methods which may be incorrect or imprecise. You are cautioned not to place undue reliance on this information as we cannot guarantee that any future expectations and events described will happen as described or that they will happen at all. You can identify forward-looking statements by the use of forward-looking terminology such as “believes,” “expects,” “may,” “should,” “seeks,” “approximately,” “intends,” “plans,” “pro forma,” “estimates” or “anticipates” or the negative of these words and phrases or
5
similar words or phrases. You can also identify forward-looking statements by discussions of strategy, plans or intentions.
ITEM 1A. RISK FACTORS
Risks Related to Our Business and Our Properties
We generate a significant portion of our revenues from our joint venture and our separate account management agreements with CalSTRS, and if we were to lose these relationships, our financial results would be significantly negatively affected.
Our joint venture and separate account management agreement relationships with CalSTRS provide us with substantial fee revenues. For the years ended December 31, 2010, 2009 and 2008, approximately 23.8%, 20.2% and 15.0%, respectively, of our revenue has been derived from fees earned from these relationships.
We cannot assure you that our joint venture and separate account management relationships with CalSTRS will continue, and, if they do not, we may not be able to replace these relationships with other strategic alliances that would provide comparable revenues. Our interest in the TPG/CalSTRS joint venture is subject to a buy-sell provision, which permits CalSTRS to purchase our interest in TPG/CalSTRS at any time. Under the buy-sell provision either our Operating Partnership or CalSTRS can initiate a buy-out of the other's interest at any time by delivering a notice to the other specifying a purchase price for all the joint venture's assets; the other venture partner then has the option to sell its joint venture interest or purchase the interest of the initiating venture partner. The purchase price is based on what each venture partner would receive on liquidation if the joint venture's assets were sold for the specified price and the joint venture's liabilities paid and the remaining assets distributed to the joint venture partners.
In addition, upon the occurrence of certain events of default by the Operating Partnership under the joint venture agreement or related management, development service and leasing agreements, upon bankruptcy of our Operating Partnership, or upon the death or disability of either James A. Thomas, our Chairman, President and CEO, or John R. Sischo, our Co-Chief Operating Officer, or the failure of either of them to devote the necessary time to perform their duties (unless replaced by an individual approved by CalSTRS) (each, a “Buyout Default”), CalSTRS may elect to purchase our joint venture interest based on a three percent discount to the appraised fair market value at the time of the Buyout Default.
The joint venture agreement with CalSTRS also prohibits any transfer of securities of the Company or limited partnership units in our Operating Partnership that would result in Mr. Thomas, his immediate family and any entities controlled thereby owning less than 30% of our securities entitled to vote for the election of directors; provided, that in connection with the issuance of additional Company shares in one or more public offerings, Mr. Thomas, his immediate family and controlled entities may reduce their collective ownership interest to no less than 10% of the total common shares and Operating Partnership units and no less than 15.0 million shares and Operating Partnership units on a collective basis.
Most of our fee arrangements under our separate account relationship with CalSTRS are terminable on 30 days' notice. Termination of either our joint venture or separate account relationship with CalSTRS would adversely affect our revenue and profitability and our ability to achieve our business plan by reducing our fee income and access to co-investment capital to acquire additional properties.
Our joint venture investments may be adversely affected by our lack of control or input on decisions or shared decision-making authority or disputes with our co-venturers.
Many of our operating properties are owned through a joint venture or partnership with other parties. As a result, we do not exercise sole decision-making authority regarding such joint venture properties, including with respect to cash distributions or the sale of such properties. Furthermore, we may co-invest in the future through other partnerships, joint ventures or other entities, acquiring non-controlling interests or sharing responsibility for managing the affairs of a property, partnership or joint venture. Investments in partnerships, joint ventures, funds or other entities may, under certain circumstances, involve risks, including partners who may have economic or other business interests or goals which are inconsistent with our business interests or goals and may be in a position to take actions contrary to our policies or objectives. These investments may also have the risk of impasses on significant decisions, because neither we nor our partner or co-venturer would have full control over the partnership or joint venture. Future disputes between us and our partners or co-venturers may result in litigation or arbitration that would increase our expenses and prevent our officers and/or directors from focusing their full time and effort on our business. In addition, under the principles of agency and partnership law, we may in certain circumstances be liable for the actions of our third-party partners or co-venturers, such as if a partner or co-venturer became bankrupt and defaulted on its reimbursement and contribution obligations to us, subjecting the property owned by the partnership or joint venture to liabilities in excess of those contemplated by the partnership or joint venture agreement, or incurred debts or liabilities on behalf of the partnership or joint venture in excess of the authority granted by the partnership or joint venture agreement. In some joint ventures or other investments we make, if the entity in which we invest is a limited partnership, we have acquired and may acquire in the future all or a portion of our interest in such partnership as a general partner. In such event, we may be
6
liable for all the liabilities of the partnership, although we attempt to limit such liability to our investment in such partnership by investing through a subsidiary.
Our joint venture partners have rights under our joint venture agreements that could adversely affect us.
As of December 31, 2010, we held interests in 22 of our properties through TPG/CalSTRS, 10 of which are held indirectly through TPG/CalSTRS' interest in the Austin Portfolio Joint Venture. TPG/CalSTRS requires a unanimous vote of the joint venture's management committee on certain major decisions, including approval of annual business plans and budgets, financings and refinancings, and additional capital calls not in compliance with an approved annual plan. The management committee currently consists of two members appointed by CalSTRS and one member appointed by the Operating Partnership. All other decisions, including sales of properties, are made based upon a majority decision of the management committee. Thus CalSTRS has the ability to control certain decisions for the joint venture that may result in an outcome contrary to our interests. The Operating Partnership has the responsibility and authority to carry out day to day management of the joint venture and to implement the annual plans approved by the management committee. In addition to CalSTRS' ability to control certain decisions relating to the joint venture, our joint venture agreement with CalSTRS includes provisions negotiated for the benefit of CalSTRS that could adversely affect us. Unless otherwise determined by the management committee of the joint venture, we are required to use diligent efforts to sell each joint venture property generally within five years of that property reaching stabilization, except that the holding period for Reflections I and Reflections II will be separately determined by the joint venture management committee. With respect to these two properties, we are required to perform a hold/sell analysis at least annually, and make a recommendation to the management committee regarding the appropriate holding period. We have a right of first offer to purchase a joint venture property upon a required sale at a price we propose, and if CalSTRS accepts our offer we must close within 90 days. If we do not exercise the right of first offer and we subsequently fail to effect a sale by the end of the specified holding period, CalSTRS has the right to assume control of the sale process. This may require us to sell one or more of our assets at an inopportune time, or for prices that are lower than could be achieved if we had more flexibility in the timing for effecting sales.
In June 2007, a wholly-owned subsidiary of TPG/CalSTRS entered into a partnership agreement and syndication agreement with an affiliate of Lehman in relation to the Austin Portfolio Joint Venture. As of December 31, 2010, one-third of the Lehman affiliate's original 75% equity interest in the Austin Portfolio Joint Venture had been sold to an unrelated institutional investor and the Lehman affiliate held 50% of the equity in the Austin Portfolio Joint Venture. The Lehman affiliate has the right to reduce or eliminate certain fees and payments otherwise payable to TPG/CalSTRS under the partnership agreement. The Lehman affiliate has certain approval rights with respect to major decisions of the Austin Portfolio Joint Venture, although the TPG/CalSTRS subsidiary is in charge of operating, leasing and managing the Austin Portfolio Joint Venture assets within approved budgets and guidelines.
The major decision approval rights of the Lehman affiliate include, but are not limited to, the right to approve annual business plans and budgets, financings and refinancings, sales of properties, additional capital calls not in compliance with an approved annual plan, and agreements with affiliates. The other limited partner in the Austin Portfolio Joint Venture also has approval rights over some of these major decisions.
In addition, the Lehman affiliate can require the sale of one Central Business District asset and one suburban asset by the Austin Portfolio Joint Venture at any time after June 1, 2011; further, the Lehman affiliate and its successors and assigns can require the sale of the balance of the Austin Portfolio Joint Venture assets after June 1, 2012, in each case subject to a right of first offer in favor of the other partners in the Austin Portfolio Joint Venture. The limited partners also have the right to remove the general partner under certain circumstances. These rights could adversely affect TPG/CalSTRS and us.
In November 2010, our subsidiaries entered into amended and restated partnership agreements, contribution agreements with subsidiaries of Brandywine Operating Partnership, L.P., a Delaware limited partnership (“Brandywine”), with respect to our One Commerce Square and Two Commerce Square buildings in Philadelphia, Pennsylvania. Brandywine contributed capital, and committed to additional capital contributions to the existing owners of the buildings, in return for a 25% limited partnership interest in each building. Our wholly-owned subsidiaries are the general partners of the Commerce Square partnerships, with authority to manage and carry out the day to day business of the partnerships, subject only to approval by Brandywine of certain specified major decisions, including approval of certain capital budgets, leasing budgets and leasing guidelines, financing or refinancing of each building, and certain major leases. We retained sole approval over the operating budgets and other decisions that are not major decisions. Brandywine has the right to purchase all of the Company's interest in each of the buildings subject to the retention of a nominal interest by the Company with an allocation of mortgage debt for a minimum of five years, which right is exercisable between October 31, 2016 and April 30, 2017. The exercise of such call right triggers certain rights and obligations of the Company, including the right to elect to market our interests in the buildings to third parties to achieve a price for our interests that we deem to be acceptable. If the Company deems a third party bid for our interests to be acceptable, then under certain conditions Brandywine will have a right of first refusal to purchase our
7
interests for the same price and terms offered by the third party. If Brandywine does not exercise, or does not have, such right of first refusal, and if we elect to sell our interests in Commerce Square to a third party, Brandywine has a right to “piggyback” on such sale and sell its interests in Commerce Square to the third party on the same terms. We retain, as general partner, the right to sell the Commerce Square buildings at any time, but Brandywine has certain rights to acquire our interests in Commerce Square in lieu of such a sale of the buildings to a third party, as long as we receive the same amount we would have received on a sale to a third party. Finally, on or after the 10th anniversary of the admission of Brandywine as a partner, either the Company or Brandywine may elect to cause the sale of the Commerce Square buildings and dissolve the partnerships, which will give the other party the right to trigger a buy-sell procedure for the purchase of the electing partner's interest in the partnerships.
We may not receive funding from our joint venture partners in connection with proposed acquisitions, which could adversely affect our growth.
We have entered into, and may enter into in the future, certain joint venture acquisition arrangements with third parties in which we identify potential acquisition properties on behalf of the joint venture, and a portion (in some cases, a substantial portion) of the capital required for each project would be funded by our joint venture partners. Although our joint venture partners have committed to fund property acquisitions, such joint venture partners may decide not to fund a particular or any potential acquisition properties for any number of reasons, including such entities may not have the capital necessary to fund projects at the time of the proposed acquisition. Accordingly, if we identify potential acquisition opportunities in the future for these programs, we may not receive approval and/or funding from joint venture partners, notwithstanding any prior commitments for funding. If we do not make any acquisitions under existing or future joint ventures, it could adversely affect our ability to grow our business in accordance with our business plan.
We depend on significant tenants, and their failure to pay rent could seriously harm our operating results and financial condition.
As of December 31, 2010, the 20 largest tenants for properties in which we held an ownership interest collectively leased 31.9% of the rentable square feet of space at properties in which we hold an ownership interest, representing 37.6% of the total annualized rent generated by these properties.
Any of our tenants may experience a downturn in its business, which may weaken such tenant's financial condition. As a result, tenants may delay lease commencement, fail to make rental payments when due, decline to extend a lease upon its expiration, become insolvent, declare bankruptcy or default under their leases. Certain of our tenants also have termination rights under their leases with us, which they might choose to exercise if they experience a downturn in their business. In addition, current economic and market conditions increase the possibility that one or more of our tenants will become insolvent. Any tenant bankruptcy or insolvency, leasing delay, failure to make rental payments when due, or default under a lease could result in the termination of the tenant's lease and material losses to our Company.
In particular, if a significant tenant becomes insolvent, suffers a downturn in its business and decides not to renew its lease or vacates a property, it may seriously harm our business. Failure on the part of a tenant to comply with the terms of a lease may give us the right to terminate the lease, repossess the applicable property and enforce the payment obligations under the lease. In those circumstances, we would be required to find another tenant. We cannot assure you that we would be able to find another tenant without incurring substantial costs, or at all, or that if another tenant were found, we would be able to enter into a new lease on favorable terms to us or at the same rental rates.
Bankruptcy filings by or relating to one of our tenants could bar us from collecting pre-bankruptcy debts from that tenant or their property. A tenant bankruptcy would delay our efforts to collect past due balances under the relevant leases, and could ultimately preclude full collection of these amounts. If a lease is assumed by the tenant in bankruptcy, all pre-bankruptcy amounts due under the lease must be paid to us in full. However, if a lease is rejected by a tenant in bankruptcy, we would have only a general unsecured claim for damages. Any unsecured claim we hold against a bankrupt entity may be paid only to the extent that funds are available and only in the same percentage as is paid to all other holders of unsecured claims. We may recover substantially less than the full value of any unsecured claim in the event of the bankruptcy of a large tenant, which could adversely impact our financial condition.
Our operating results depend upon the regional economies in which our properties are located and the demand for office and other mixed-use space, and unique or disproportionate economic downturns or adverse regulatory or taxation policies in any of these regions could harm our operating results.
Our operating and development properties are located in three geographic regions of the United States: the West Coast, Southwest and Mid-Atlantic regions. Historically, the largest part of our revenues has been derived from our ownership and management of properties consisting primarily of office buildings.
8
A decrease in the demand for office space in these geographic regions, and for Class A office space in particular, may have a greater adverse effect on our business and financial condition than if we owned a more diversified real estate portfolio. We are also susceptible to disproportionate or unique adverse developments in these regions and in the national office market generally, such as business layoffs or downsizing, industry slowdowns, relocations of businesses, changing demographics, terrorist targeting of high-rise structures, infrastructure quality, increases in real estate and other taxes, costs of complying with government regulations or increased regulation, oversupply of or reduced demand for office space, and other factors. Some of the regional issues we face include the more highly regulated and taxed economy of Southern California and high local and municipal taxes for our Philadelphia properties. Any adverse economic or real estate developments in one or more of our regions, or any decrease in demand for office space resulting from the local regulatory environment, business climate or energy or fiscal problems, could adversely impact our revenue and profitability, thereby causing a significant decline in our financial condition, results of operations, cash flow, the trading price of our common stock and impairing our ability to satisfy our debt service obligations.
Our need for additional debt financing, our existing level of debt and the limitations imposed by our debt agreements could have significant adverse consequences on us.
We may seek to incur additional debt to finance future acquisition and development activities; however debt financing may not be available to us on acceptable terms under current market conditions. In addition, it is possible the required payments of principal and interest on borrowings may leave us with insufficient cash to operate our properties profitably. Our need for debt financing, our existing level of debt and the limitations imposed on us by our debt agreements could have significant adverse consequences, including the following:
• | our cash flow may be insufficient to meet our required principal and interest payments or to pay dividends; |
• | we may be unable to borrow additional funds as needed or on favorable terms; |
• | we may be unable to refinance our indebtedness at maturity or the refinancing terms may be less favorable than the terms of our original indebtedness; |
• | we may be unable to distribute funds from a property to our Operating Partnership or apply such funds to cover expenses related to another property; |
• | we could be required to dispose of one or more of our properties, possibly on disadvantageous terms and/or at disadvantageous times; |
• | we could default on our obligations and the lenders or mortgagees may foreclose on our properties that secure their loans and receive an assignment of rents and leases; |
• | we could violate covenants in our loan documents or our joint venture agreements, including provisions that may limit our ability to further mortgage a property, make distributions, acquire additional properties, repay indebtedness prior to a set date without payment of a premium or other pre-payment penalties, all of which would entitle the lenders to accelerate our debt obligations; |
• | a default under any one of our mortgage loans with cross default provisions could result in a default on other of our indebtedness; and |
• | because we have agreed to use commercially reasonable efforts to maintain certain debt levels to provide the ability for Mr. Thomas and entities controlled by him to guarantee debt of $210 million, including $11 million of debt available for guarantee by Mr. Edward Fox, one of our non-employee directors, and by Mr. Richard Gilchrist, an individual formerly affiliated with Maguire Thomas Partners, we may not be able to refinance our debt when it would otherwise be advantageous to do so or to reduce our indebtedness when our board of directors determines it is prudent. |
If any one or more of these events were to occur, our revenue and profitability could be adversely impacted, causing a significant downturn in our financial condition, results of operations, cash flow, and the trading price of our common stock, and could impair our ability to satisfy our debt service obligations.
Because we have debt at our unconsolidated properties which bears interest at variable rates, our failure to hedge effectively against interest rate changes may adversely affect our results of operations.
As of December 31, 2010, $323.3 million of our unconsolidated debt, excluding loans on properties subject to special servicer oversight, was at variable interest rates; we have purchased interest rate caps covering $186.2 million of the unconsolidated floating rate loans. The interest rate hedging arrangements we enter into to cap our interest rate exposure involve risks, including that our hedging transactions might not achieve the desired effect in eliminating the impact of interest
9
rate fluctuations, or that counterparties may fail to honor their obligations under these arrangements. As a result, these arrangements may not be effective in reducing our exposure to interest rate fluctuations and this could reduce our revenue, require us to modify our leverage strategy, and adversely affect our expected investment returns.
We may be unable to complete acquisitions necessary to grow our business, and even if consummated, we may fail to successfully operate these acquired properties.
Our planned growth strategy includes the acquisition of additional properties as opportunities arise with a focus on the West Coast region of the United States. We regularly evaluate approximately 10 markets in the United States for strategic opportunities to acquire office, mixed-use and other properties. Our ability to acquire properties on favorable terms and successfully operate them is subject to the following significant risks:
• | we may be unable to generate sufficient cash from operations, or obtain the necessary debt or equity to consummate an acquisition or, if obtainable, such financing may not be on favorable terms; |
• | we may need to spend more than budgeted amounts to make necessary improvements or renovations to acquired properties; |
• | we may be unable to acquire a desired property because of competition from other real estate investors with more available capital, including other real estate operating companies, real estate investment trusts and investment funds; |
• | competition from other potential acquirers may significantly increase the purchase price, even if we are able to acquire a desired property; |
• | agreements for the acquisition of office properties are typically subject to customary conditions to closing, including satisfactory completion of due diligence investigations, and we may spend significant time and money on a potential acquisition we eventually decide not to pursue; |
• | we may be unable to quickly and efficiently integrate new acquisitions, particularly acquisitions of portfolios of properties, into our existing operations; |
• | market conditions may result in higher than expected vacancy rates and lower than expected rental rates; and |
• | we may acquire properties subject to liabilities without any recourse, or with only limited recourse, for unknown liabilities such as clean-up of undisclosed environmental contamination, claims by tenants, vendors or other persons dealing with the former owners of the properties and claims for indemnification by general partners, directors, officers and others indemnified by the former owners of the properties. |
If we cannot complete property acquisitions on favorable terms or at all, or operate acquired properties to meet our expectations, our revenue and profitability could be adversely impacted.
Any real estate acquisitions that we consummate may result in disruptions to our business as a result of the burden of integrating operations placed on our management.
Our business strategy includes acquisitions and investments in real estate on an ongoing basis as market conditions warrant. These acquisitions may cause disruptions in our operations and divert management's attention from our other day-to-day operations, which could impair our relationships with our current tenants and employees. If we acquire real estate by acquiring another entity, we may be unable to effectively integrate the operations and personnel of the acquired business. In addition, we may be unable to train, retain and motivate any key personnel from the acquired business. If our management is unable to effectively implement our acquisition strategy, we may experience disruptions to our business, which could harm our results of operations.
We may be unable to successfully complete and operate properties under development, which would impair our financial condition and operating results.
Part of our business is devoted to the development of office, mixed-use and other properties, and the redevelopment of core plus and value-add properties. Our development and redevelopment activities involve the following significant risks:
• | we may be unable to obtain financing on favorable terms or at all; |
• | if we finance projects through construction loans, we may be unable to obtain permanent financing at all or on advantageous terms; |
• | we may not complete projects on schedule or within budgeted amounts; |
• | we may underestimate the expected costs and time necessary to achieve the desired result with a redevelopment |
10
project;
• | we may discover structural, environmental or other feasibility issues with properties acquired as redevelopment projects following our acquisition, which may render the redevelopment as planned not possible; |
• | we may encounter delays or refusals in obtaining all necessary zoning, land use, building, occupancy, and other required governmental permits and authorizations; |
• | occupancy rates and rents, or condominium prices and absorption rates in the case of the Murano, may fluctuate depending on a number of factors, including market and economic conditions, and may result in our investment not being profitable; |
• | adverse weather that damages the project or causes delays; |
• | unanticipated changes to the plans or specifications; |
• | unanticipated shortages of materials and skilled labor; |
• | unanticipated increases in material and labor costs; and |
• | fire, flooding and other natural disasters. |
If we are not successful in our property development initiatives, it could adversely impact our revenue and profitability, causing a significant downturn in our business, including our financial condition, results of operations, and the trading price of our common stock.
We face significant competition, which may decrease or prevent increases of the occupancy and rental rates of our properties.
We face significant competition from other managers and owners of office and mixed-use real estate, many of which own or manage properties similar to ours in the same regional markets in which our properties are located. We also compete with other diversified real estate companies and companies focused solely on offering property investment management and brokerage services. A number of our competitors are larger and better able to take advantage of efficiencies created by size, have better financial resources, or increased access to capital at lower costs, and may be better known in regional markets in which we compete. Our smaller size as compared to some of our competition may increase our susceptibility to economic downturns and pressures on rents. Our failure to compete successfully in our industry would materially affect our business prospects and operating results.
We may be unable to renew leases, lease vacant space or re-lease space as leases expire resulting in increased vacancy rates, lower revenue and an adverse effect on our operating results.
As of December 31, 2010, leases representing 5.8% and 8.0% of the rentable square feet of the office and retail space of our consolidated and unconsolidated properties will expire in 2011 and 2012, respectively. Further, an additional 16.0% of the square feet of these properties was available for lease as of December 31, 2010. Current economic and real estate market conditions have resulted in depressed leasing activity recently as a result of tenant unwillingness to make long term leasing commitments given recent upheaval in the financial markets, and it is unclear how long this market condition may continue. If the rental rates for our properties decrease, our existing tenants do not renew their leases or we do not re-lease a significant portion of our available space and space for which leases will expire, our revenue and profitability could be adversely impacted, causing a significant downturn in our financial condition, results of operations, cash flow, and the trading price of our common stock and impairing our ability to satisfy our debt service obligations.
Our growth depends on external sources of capital, some of which are outside of our control. If we are unable to access capital from external sources, we may not be able to implement our business strategy.
Our business strategy requires us to rely significantly on third-party sources to fund our capital needs. We may not be able to obtain debt or equity on favorable terms or at all. As a result of the recent downturn in the financial markets, we may experience difficulty refinancing some of our existing debt or obtaining new debt to complete acquisitions. Any additional debt we incur will increase our leverage and may impose operating restrictions on us. Any issuance of equity by our Company to fund our portion of equity capital requirements could be dilutive to our existing stockholders, and could have a negative impact on our stock price. Our access to third-party sources of capital depends, in part, on:
• | our current debt levels, which were $300.5 million of consolidated debt and $1.9 billion of unconsolidated debt as of December 31, 2010; |
• | our lack of current cash flow from operating activities, which was a use of cash of $0.5 million for the year ended December 31, 2010; |
• | our current and expected future earnings; |
11
• | the market's perception of our growth potential; |
• | the market price of our common stock; |
• | the perception of the value of an investment in our common stock; and |
• | general market conditions. |
If we cannot obtain capital from third-party sources when needed, we may not be able to acquire or develop properties when strategic opportunities exist, or to repay existing debt as it matures.
As a result of the limited time which we have to perform due diligence of many of our acquired properties, we may become subject to significant unexpected liabilities and our properties may not meet projections.
When we enter into an agreement to acquire a property or portfolio of properties, we often have limited time to complete our due diligence prior to acquiring the property. To the extent we underestimate or fail to investigate or identify risks and liabilities associated with the properties we acquire, we may incur unexpected liabilities or the properties may fail to perform as we expected. If we do not accurately assess the liabilities associated with properties prior to their acquisition, we may pay a purchase price that exceeds the current fair value of the net identifiable assets of the acquired property. As a result, intangible assets would be required to be recorded, which could result in significant accounting charges in future periods. These charges, in addition to the financial impact of significant liabilities that we may assume, and any failure of properties to perform as expected, could adversely impact our revenue and profitability, causing a significant downturn in our financial condition, results of operations and the trading price of our common stock and impairing our ability to satisfy our debt service obligations.
Our efforts to expand our geographic presence and diversify into other regional real estate markets may not be successful, thereby constraining our growth to markets in which we currently operate.
We intend to expand our business to new geographic regions where we expect the ownership and management of property to result in favorable risk-adjusted investment returns. In order for us to achieve economies of scale, we generally target ownership of 500,000 or more rentable square feet in a market. It may be difficult for us to achieve this level of ownership and our initial entry into a particular market may result in higher administrative expenses for us initially. Presently, we do not possess the same level of familiarity with the development, ownership and management of properties in locations other than the West Coast, Southwest and Mid-Atlantic regions in the United States, which lack of familiarity could adversely affect our ability to own, manage or develop properties outside these regions successfully or at all or to achieve expected performance.
As the current or previous owner or operator of real property, we could become subject to liability for environmental contamination, regardless of whether we caused such contamination.
Under various federal, state and local environmental laws, regulations and ordinances, a current or previous owner or operator (e.g., tenant or manager) of real property may be liable for the cost to remove or remediate contamination resulting from the presence or discharge of hazardous or toxic substances, wastes or petroleum products on, under, from or in such property. These costs could be substantial and liability under these laws may attach without regard to fault, or whether the owner or operator knew of, or was responsible for, the presence of the contamination. The liability may be joint and several for the full amount of the investigation, clean-up and monitoring costs incurred or to be incurred or actions to be undertaken, although a party held jointly and severally liable may obtain contributions from other identified, solvent, responsible parties of their fair share toward these costs to the extent such contributions are possible to obtain. In addition, the current or previous owner or operator of property may be subject to damage awards for personal injury or property damage resulting from contamination at or migrating from its property. Previous owners used some of our properties for industrial and retail purposes, so those properties may contain some level of environmental contamination. In addition, the presence of contamination, or the failure to properly remediate contamination on a property may limit the ability of the owner or operator to sell, develop or rent that property or to borrow using the property as collateral, and may cause our investment in that property to decline in value.
As the owner of real property, we could become subject to liability for asbestos-containing building materials in the buildings on our property.
Some of our properties may contain asbestos-containing materials. Environmental laws require that owners or operators of buildings with asbestos-containing building materials properly manage and maintain these materials, adequately inform or train those who may come into contact with asbestos and undertake special precautions, including removal or other abatement, in the event that asbestos is disturbed during building renovation or demolition. These laws may impose fines and penalties on building owners or operators for failure to comply with these requirements. In addition, these laws may also allow third parties to seek recovery from owners or operators for personal injury associated with exposure to asbestos-containing building
12
materials.
We have removed or abated asbestos-containing building materials from certain tenant and common areas at our City National Plaza and Brookhollow Central properties. We continue to remove or abate asbestos from various areas of the building structures and as of December 31, 2010, had accrued approximately $1.3 million for estimated future costs of such removal or abatement at these properties.
Our properties may contain or develop harmful mold or suffer from other adverse conditions, which could lead to liability for adverse health effects and costs of remediation.
When excessive moisture accumulates in buildings or on building materials, mold growth may occur, particularly if the moisture problem remains undiscovered or is not addressed over a period of time. Some molds may produce airborne toxins or irritants. Indoor air quality issues can also stem from inadequate ventilation, chemical contamination from indoor or outdoor sources and other biological contaminants such as pollen, viruses and bacteria. Indoor exposure to airborne toxins or irritants above certain levels can be alleged to cause a variety of adverse health effects and symptoms, including allergic or other reactions. As a result, the presence of significant mold or other airborne contaminants at any of our properties could require us to undertake a costly remediation program to contain or remove the mold or other airborne contaminants from the affected property or increase indoor ventilation. In addition, the presence of significant mold or other airborne contaminants could expose us to liability from our tenants, employees of our tenants and others if property damage or health concerns arise.
As the owner of real property, we could become subject to liability for failure to comply with environmental requirements regarding the handling and disposal of regulated substances and wastes or for non-compliance with health and safety requirements.
Environmental laws and regulations regarding the handling of regulated substances and wastes apply to our properties. The properties in our portfolio are also subject to various federal, state and local health and safety requirements, such as state and local fire requirements. If we or our tenants fail to comply with these various requirements, we might incur governmental fines or private damage awards. Moreover, we do not know whether existing requirements will change or whether future requirements will require us to make significant unanticipated expenditures that will materially adversely impact our financial condition, results of operations, cash flow, cash available for distribution, the per share trading price of our common stock and our ability to satisfy our debt service obligations. Environmental noncompliance liability could also affect a tenant's ability to make rental payments to us.
Tax indemnification obligations that may arise in the event we or our Operating Partnership sell an interest in either of two of our properties could limit our operating flexibility.
We and our Operating Partnership agreed at the time of our public offering to indemnify Mr. Thomas against adverse direct and indirect tax consequences in the event that our Operating Partnership or the underlying property owner directly or indirectly sells, exchanges or otherwise disposes (including by way of merger, sale of assets or otherwise) of any portion of its interests, in a taxable transaction, in either One Commerce Square or Two Commerce Square. These two properties represented 14.8% of annualized rent for properties in which we held an ownership interest as of December 31, 2010. The indemnification obligation currently expires October 13, 2013, which may be further extended to October 13, 2016 provided Mr. Thomas and his controlled entities collectively retain at least 50% of the Operating Partnership units received by them in connection with our formation transactions at the time of our initial public offering.
We also agreed at the time of the initial public offering to use commercially reasonable efforts to make approximately $210 million of debt available to be guaranteed by entities controlled by Mr. Thomas, including $11 million of debt available for guarantee by Mr. Fox, a non-employee member of our board of directors, and by Mr. Gilchrist, an individual formerly affiliated with Maguire Thomas Partners. We agreed to make this debt available for guarantee in order to assist Mr. Thomas and these other persons in preserving their tax position after their contributions at the time of our initial public offering.
Risks Related to the Real Estate Industry
The current economic environment for real estate companies may significantly adversely impact our results of operations and business prospects.
The success of our business and profitability of our operations are dependent on continued investment in the real estate markets and access to capital and debt financing. A long term crisis of confidence in real estate investing and lack of available credit for acquisitions would be likely to constrain our business growth. As part of our business goals, we intend to grow our properties portfolio with strategic acquisitions of core properties at advantageous prices, and core plus and value added properties where we believe we can bring necessary expertise to bear to increase property values. In order to pursue acquisitions, we need access to equity capital and also property-level debt financing. Conditions in the financial markets may
13
adversely impact the availability and cost of credit in the near future. Our ability to make scheduled payments or to refinance our obligations with respect to indebtedness depends on our operating and financial performance, which in turn is subject to prevailing economic conditions.
Illiquidity of real estate investments and the susceptibility of the real estate industry to economic conditions could significantly impede our ability to respond to adverse changes in the performance of our properties.
Our ability to achieve desired and projected results for growth of our business depends on our ability to generate revenues in excess of expenses, and make scheduled principal payments on debt and fund capital expenditure requirements. Events and conditions generally applicable to owners and operators of real property that are beyond our control may adversely impact our results of operations and the value of our properties. These events include:
• | vacancies or our inability to rent space on favorable terms; |
• | inability to collect rent from tenants; |
• | difficulty in accessing credit in the present economic environment, in particular for larger mortgage loans; |
• | inability to finance property development and acquisitions on favorable terms; |
• | increased operating costs, including real estate taxes, insurance premiums and utilities; |
• | local oversupply, increased competition or reduction in demand for office space; |
• | costs of complying with changes in governmental regulations; |
• | the relative illiquidity of real estate investments; |
• | changing submarket demographics; and |
• | the significant transaction costs related to property sales, including a high transfer tax rate in the City of Philadelphia. |
In addition, periods of economic slowdown or recession, rising interest rates or declining demand for real estate, or the public perception that any of these events may occur, could result in a general decline in rents or an increased incidence of defaults under existing leases. If any of these events were to happen, our revenue and profitability could be impaired, causing a significant downturn in our financial condition, results of operations, cash flow, and the trading price of our common stock, and our ability to satisfy our debt service obligations could be impaired.
Compliance with the Americans with Disabilities Act and fire, safety and other regulations may require us to make unintended expenditures that adversely impact our financial condition.
All of our commercial properties are required to comply with the Americans with Disabilities Act, or ADA. The ADA has separate compliance requirements for “public accommodations” and “commercial facilities,” but generally requires that buildings be made accessible to people with disabilities. The obligation to make readily achievable accommodations is an ongoing one, and we assess our properties and make alterations as appropriate. Compliance with the ADA requirements could require removal of access barriers.
If one or more of our properties is not in compliance with the ADA, we would be required to incur additional costs to bring the property or properties into compliance. In addition, non-compliance could result in imposition of fines by the U.S. government or an award of damages to private litigants, or both. Typically, we are responsible for changes to a building structure that are required by the ADA, which can be costly. In addition, we are required to operate our properties in compliance with fire and safety regulations, building codes and other land use regulations. We may be required to make substantial capital expenditures to comply with these requirements thereby limiting the funds available to operate, develop and redevelop our properties and acquire additional properties. As a result, these expenditures could negatively impact our revenue and profitability.
Potential losses to our properties may not be covered by insurance and may result in our inability to repair damaged properties; as a result we could lose invested capital.
We carry comprehensive liability, fire, flood, extended coverage, wind, earthquake, terrorism, pollution legal liability, business interruption and rental loss insurance under our blanket policy covering all of the properties in which we own an interest in or manage for third parties, including our development properties (although we carry only liability insurance for the California Environmental Protection Agency (“CalEPA”) headquarters building under our blanket policy because the tenant has the right to provide all other forms of coverage it deems necessary, and it has elected to do so, and we do not insure 816 Congress under our blanket policy because the third party owner has elected to carry it under its policy). We believe the policy
14
specifications and insured limits are appropriate and adequate given the relative risk of loss, the cost of the coverage and industry practice.
We either own or have interests in a number of properties in Southern California, an area especially prone to earthquakes. We carry earthquake insurance on our properties located in seismically active areas, which includes our Southern California properties, wind insurance on our properties located in “tier 1” wind zones, which includes our Houston, Texas properties, and terrorism insurance on all of our properties. Our terrorism insurance is subject to exclusions for loss or damage caused by nuclear substances, pollutants, contaminants, and biological and chemical weapons as more specifically excluded under the actual terrorism policies. Some of our policies, like those covering losses due to earthquakes and terrorism, are subject to limitations involving deductibles and policy limits which may not be sufficient to cover potential losses.
Under their leases, our tenants are generally required to indemnify us from liabilities resulting from injury to persons, air, water, land or property, on or off the premises due to activities conducted by them on our properties. There is an exception for claims arising from the negligence or intentional misconduct by us or our agents. Additionally, tenants are generally required, with the exception of governmental entities and other entities that are self-insured, to obtain and keep in force during the term of the lease liability and property damage insurance policies issued by companies holding ratings at a minimum level at their own expense.
Although we have not experienced such a loss to date, if we experience a loss that is uninsured or that exceeds policy limits, we could lose the capital invested in the damaged property as well as the anticipated future cash flows from that property, including lost revenue from unpaid rent from tenants. In addition, if the damaged property is subject to recourse indebtedness, we would continue to be liable for the indebtedness, even if the property was irreparably damaged. In the event of a significant loss at one or more of the properties covered by our blanket policy, the remaining insurance under our policy, if any, could be insufficient to adequately insure our remaining properties. In this event, securing additional insurance, if possible, could be significantly more expensive than our current policy.
Risks Related to Our Organization and Structure
Our senior management has existing conflicts of interest with us and our public stockholders that could result in decisions adverse to our Company.
In addition to the common stock owned by Mr. Thomas as of December 31, 2010, he owned or controlled a significant interest in our Operating Partnership consisting of 12,313,331 units, or a 24.9% interest in the Operating Partnership as of such date. In addition, our senior executive officers, excluding Mr. Thomas, collectively held an interest in incentive units (vested and unvested) representing an aggregate 3.6% equity interest in the Operating Partnership.
Members of senior management could make decisions that could have different implications for our Operating Partnership and for us, our stockholders, and our senior executive officers. For example, dispositions of interests in One Commerce Square or Two Commerce Square could trigger our tax indemnification obligations with respect to Mr. Thomas.
Our success depends on key personnel, the loss of whom could impair our ability to operate our business successfully.
We depend on the efforts of key personnel, particularly Mr. Thomas, our Chairman, Chief Executive Officer, and President. Among the reasons that Mr. Thomas is important to our success is that he has an industry reputation developed over more than 30 years in the real estate industry that attracts business and investment opportunities and assists us in negotiations with lenders, existing and potential tenants and industry personnel. If we lost his services, our relationships with these parties could diminish. Mr. Thomas is 74 and, although he has informed us that he does not currently plan to retire, we cannot be certain how long he will continue working on a full-time basis.
Mr. Sischo, our co-Chief Operating Officer, has significant experience in real estate investments including acquisition, financing and capital markets. A departure of either Mr. Thomas or Mr. Sischo could have adverse effects on our joint venture relationship with CalSTRS, including, pursuant to a right granted to CalSTRS in our joint venture agreement with CalSTRS, the possible required sale of our joint venture interest to CalSTRS at 97% of fair value, unless within 180 days the Company names a replacement for such departed executive who is reasonably acceptable to CalSTRS.
We have a holding company structure and rely upon funds received from our Operating Partnership to pay liabilities.
We are a holding company. Our primary asset is our general partnership interest in our Operating Partnership. We have no independent means of generating revenues. To the extent we require funds to pay taxes or other liabilities incurred by us, to pay dividends or for any other purpose, we must rely on funds received from our Operating Partnership. If our Operating Partnership should become unable to distribute funds to us, we would be unable to continue operations after a short period.
15
Most of the properties owned by our subsidiaries and joint ventures are encumbered by loans. These loans generally contain lockbox arrangements and reserve requirements that may affect the amount of cash available for distribution from the subsidiaries that own the properties to the Operating Partnership. Some of the loans include cash sweep and other restrictions and provisions that prior to an event of default may prevent the distribution of funds from the subsidiaries who own these properties to our Operating Partnership. In the event of a default under any of these loans, the defaulting subsidiary or joint venture would be prohibited from distributing cash to our Operating Partnership. As a result, our Operating Partnership may be unable to distribute funds to us and we may be unable to use funds from one property to support the operation of another property. As we acquire new properties and refinance our existing properties, we may finance these properties with new loans that contain similar provisions. Some of the loans to our subsidiaries and joint ventures may contain provisions that restrict us from loaning funds to our other subsidiaries or joint ventures. If we are permitted to loan funds to our subsidiaries or joint ventures, our loans generally will be subordinated to the existing debt on our properties.
Mr. Thomas has a significant vote in certain matters as a result of his control of 100% of our limited voting stock.
Each entity that received Operating Partnership units in our formation transactions received shares of our limited voting stock that are paired with units in our Operating Partnership on a one-for-one basis. All of these entities are directly or indirectly controlled by Mr. Thomas, and, as a result, Mr. Thomas controls 100% of our outstanding limited voting stock, or 31.1% of our outstanding voting stock (including outstanding shares of common stock owned by Mr. Thomas and his affiliates) as of December 31, 2010. These limited voting shares are entitled to vote in the election of directors, for the approval of certain extraordinary transactions including any merger, sale or liquidation of the Company, amendments to our certificate of incorporation and any other matter required to be submitted to a separate class vote under Delaware law. Mr. Thomas may have interests that differ from that of our public stockholders, including by reason of his interests held in Operating Partnership units, and may accordingly vote as a stockholder in ways that may not be consistent with the interests of our public stockholders. This significant voting influence over certain matters may have the effect of delaying, preventing or deterring a change of control of our Company, or could deprive our stockholders of an opportunity to receive a premium for their common stock as part of a sale of our Company.
Some provisions of our certificate of incorporation and bylaws may deter takeover attempts, which may limit the opportunity of our stockholders to sell their shares at a favorable price.
Some of the provisions of our certificate of incorporation and bylaws could make it more difficult for a third party to acquire us, even if doing so might be beneficial to our stockholders by potentially providing them with the opportunity to sell their shares at a premium over the then market price. Our certificate of incorporation and bylaws contain provisions which may deter takeover attempts, including the following:
• | vacancies on our board of directors may only be filled by the remaining directors; |
• | only the board of directors can change the number of directors; |
• | there is no provision for cumulative voting for directors; |
• | directors may only be removed for cause; and |
• | our stockholders are not permitted to act by written consent. |
In addition, our certificate of incorporation authorizes the board of directors to issue up to 25,000,000 shares of preferred stock. The preferred stock may be issued in one or more series, the terms of which will be determined at the time of issuance by our board of directors without further action by our stockholders. These terms may include voting rights, including the right to vote as a series on particular matters, preferences as to dividends and liquidation, conversion rights, redemption rights and sinking fund provisions. The issuance of any preferred stock could diminish the rights of holders of our common stock, and therefore could reduce the value of our common stock. In addition, specific rights granted to future holders of preferred stock could be used to restrict our ability to merge with, or sell assets to, a third party. The ability of our board of directors to issue preferred stock could make it more difficult, delay, discourage, prevent or make it more costly to acquire or effect a change in control, thereby preserving the current stockholders' control of our Company.
Finally, we are also subject to Section 203 of the Delaware General Corporation Law which, subject to certain exceptions, prohibits a Delaware corporation from engaging in any business combination with any "interested stockholder" for a period of three years following the date that such stockholder became an interested stockholder.
The provisions of our certificate of incorporation and bylaws, described above, as well as Section 203 of the Delaware General Corporation Law, could discourage potential acquisition proposals, delay or prevent a change of control and prevent changes in our management, even if these events would be in the best interests of our stockholders.
16
We could authorize and issue stock without stockholder approval, which could cause our stock price to decline and which could dilute the holdings of our existing stockholders.
Our certificate of incorporation authorizes our board of directors to issue authorized but unissued shares of our common stock or preferred stock to classify or reclassify any unissued shares of our preferred stock and to set the preferences, rights and other terms of the classified or unclassified shares. Our board of directors could establish a series of preferred stock that could, depending on the terms of the series, delay, defer or prevent a transaction or a change of control that might involve a premium price for our common stock or otherwise be in the best interests of our stockholders.
The payment of dividends on our common stock is at the discretion of our board of directors and subject to various restrictions and considerations and, consequently, may be changed or discontinued at any time.
Although we historically paid quarterly dividends on our common stock until December 2009, the payment of cash dividends in the future, if any, will be at the discretion of our board of directors and will depend upon such factors as earnings levels, capital requirements, our overall financial condition, and any other factors deemed relevant by our board of directors. In December 2009, our board of directors suspended the quarterly dividends to common stockholders. Until and unless dividend payments are reinstated, the only opportunity to achieve a positive return on an investment in our common stock is if the market price of our common stock appreciates.
ITEM 1B. UNRESOLVED STAFF COMMENTS
None.
ITEM 2. PROPERTIES
Our Ownership Interest Properties
Our properties are located in the West Coast, Southwest, and Mid-Atlantic regions of the United States, consisting primarily of office space and also including mixed-use, multi-family and retail properties. The interests in One Commerce Square and Two Commerce Square which are owned by subsidiaries of Brandywine are reflected as noncontrolling interest. We hold a 50% interest in 2121 Market Street; the other 50% interest is held by an entity owned by Philadelphia Management, an unaffiliated Philadelphia-based real estate developer. We have an ownership interest of 25% in TPG/CalSTRS (except for City National Plaza as to which our ownership is 7.9% interest and Centerpointe I and II as to which we have a 5% interest in the preferred equity and a 25% interest in the residual equity after the preferred equity is returned). TPG/CalSTRS holds a 100% ownership interest in twelve properties and a 25% interest in ten properties in Austin, Texas. Our indirect interest in the ten properties in Austin is 6.25%. As of December 31, 2010, we provide leasing, asset and/or property management services for two properties on behalf of CalSTRS under a separate account relationship, one property on behalf of the City of Sacramento and one property on behalf of an affiliate of Lehman Brothers Inc.
An overview of these operating properties as of December 31, 2010 is presented below:
Consolidated properties: | Location | Percentage Interest | Rentable Square Feet (1) | Percent Leased (2) | Annualized Net Rent (3) | Annualized Net Rent Per Leased Square Foot (4) | |||||||||||||
One Commerce Square | Philadelphia, PA | 75.0 | % | 942,866 | 89.3 | % | $ | 12,257,000 | $ | 14.56 | |||||||||
Two Commerce Square | Philadelphia, PA | 75.0 | 953,276 | 85.2 | 12,936,000 | 15.94 | |||||||||||||
Four Points Centre (office buildings) | Austin, TX | 100.0 | 192,062 | 18.3 | 494,000 | 14.06 | |||||||||||||
Four Points Centre (retail) | Austin, TX | 100.0 | 6,600 | — | — | — | |||||||||||||
Total/Weighted Average: | 2,094,804 | 80.6 | % | $ | 25,687,000 | $ | 15.21 | ||||||||||||
17
Unconsolidated properties: | Location | Percentage Interest | Rentable Square Feet (1) | Percent Leased (2) | Annualized Net Rent (3) | Annualized Net Rent Per Leased Square Foot (4) | |||||||||||||
2121 Market Street (5) | Philadelphia, PA | 50.0 | % | 22,136 | 100.0 | % | $ | 395,000 | $ | 17.84 | |||||||||
City National Plaza | Los Angeles, CA | 7.9 | 2,496,084 | 84.4 | 37,948,000 | 18.02 | |||||||||||||
Reflections I | Reston, VA | 25.0 | 123,546 | — | — | — | |||||||||||||
Reflections II (6) | Reston, VA | 25.0 | 64,253 | 100.0 | 793,000 | 12.34 | |||||||||||||
San Felipe Plaza | Houston, TX | 25.0 | 980,472 | 87.3 | 11,108,000 | 12.98 | |||||||||||||
Brookhollow Central I - III | Houston, TX | 25.0 | 806,004 | 66.2 | 4,452,000 | 8.35 | |||||||||||||
2500 City West | Houston, TX | 25.0 | 578,284 | 90.4 | 5,903,000 | 11.29 | |||||||||||||
City West Place | Houston, TX | 25.0 | 1,473,020 | 99.0 | 20,660,000 | 14.17 | |||||||||||||
Centerpointe I & II | Fairfax, VA | 25.0 | 421,859 | 91.7 | 4,713,000 | 12.18 | |||||||||||||
Fair Oaks Plaza | Fairfax, VA | 25.0 | 179,688 | 87.4 | 3,033,000 | 19.33 | |||||||||||||
San Jacinto Center | Austin, TX | 6.25 | 410,248 | 87.2 | 4,741,000 | 13.25 | |||||||||||||
Frost Bank Tower | Austin, TX | 6.25 | 535,078 | 88.2 | 9,429,000 | 19.97 | |||||||||||||
One Congress Plaza | Austin, TX | 6.25 | 518,385 | 89.3 | 7,533,000 | 16.28 | |||||||||||||
One American Center | Austin, TX | 6.25 | 503,951 | 77.1 | 6,348,000 | 16.33 | |||||||||||||
300 West 6th Street | Austin, TX | 6.25 | 454,225 | 87.2 | 8,163,000 | 20.61 | |||||||||||||
Research Park Plaza I & II | Austin, TX | 6.25 | 271,882 | 90.6 | 4,498,000 | 18.25 | |||||||||||||
Park Centre | Austin, TX | 6.25 | 203,193 | 84.4 | 2,595,000 | 15.13 | |||||||||||||
Great Hills Plaza | Austin, TX | 6.25 | 139,252 | 68.7 | 1,216,000 | 12.72 | |||||||||||||
Stonebridge Plaza II | Austin, TX | 6.25 | 192,864 | 95.5 | 2,821,000 | 15.31 | |||||||||||||
Westech 360 I-IV | Austin, TX | 6.25 | 175,529 | 48.2 | 1,410,000 | 16.67 | |||||||||||||
Total/Weighted Average: | 10,549,953 | 85.0 | % | $ | 137,759,000 | $ | 15.36 | ||||||||||||
Properties with loans subject to special servicer oversight (7): | Location | Percentage Interest | Rentable Square Feet (1) | Percent Leased (2) | Annualized Net Rent (3) | Annualized Net Rent Per Leased Square Foot (4) | |||||||||||||
Oak Hill Plaza | King of Prussia, PA | 25.0 | % | 164,360 | 97.2 | % | $ | 2,563,000 | $ | 16.05 | |||||||||
Walnut Hill Plaza | King of Prussia, PA | 25.0 | 150,573 | 56.2 | 964,000 | 11.38 | |||||||||||||
Four Falls Corporate Center | Conshohocken, PA | 25.0 | 253,985 | 79.8 | 3,807,000 | 18.79 | |||||||||||||
Total/Weighted Average: | 568,918 | 78.6 | % | $ | 7,334,000 | $ | 16.41 | ||||||||||||
________________________
(1) | For purposes of the tables above, both on-site and off-site parking is excluded. Total portfolio square footage includes office properties and mixed-use space (including retail), but excludes 168 apartment units at 2121 Market Street. |
(2) | Percent leased represents the sum of the square footage of the existing leases as a percentage of rentable area described in (1) above. |
(3) | Annualized rent represents the annualized monthly contractual rent under existing leases as of December 31, 2010 (represents 100% of the existing leases even for properties for which our percentage interest is less than 100%). For leases which are subject to rent abatement as of December 31, 2010, no rent is included in the annualized rent. For leases with a remaining term of less than one year, annualized rent includes only the amounts through the expiration of the lease. For any tenant under a partial gross lease (which requires the tenant to reimburse the landlord for its pro-rata share of operating expenses in excess of a stated expense stop) or under a full gross lease (which does not require the tenant to reimburse the landlord for any operating expenses), the unreimbursed portion of current year operating expenses (which may be estimates as of such date) are subtracted from gross rent. |
(4) | Annualized net rent per leased square foot represents annualized rent as computed above, divided by the total square footage under lease as of the same date. |
(5) | The square footage and occupancy information presented for 2121 Market Street represents the information for two |
18
retail/office tenants only, and excludes the 168 residential units comprising 132,823 square feet.
(6) | The Reflections II property is solely occupied by a single tenant whose lease expired in 2010, and who continues to occupy the space on a month-to-month basis. |
(7) | Subsidiaries of TPG/CalSTRS (the "borrowers") elected not to repay the mortgage loans secured by these three properties in the aggregate amount of $96.5 million by the maturity date of March 6, 2010, and therefore, the loans are in default. We are in discussions with the special servicer regarding a cooperative resolution on each of these assets including the likely appointment of a receiver and the judicial transfer of the properties. These loans are non-recourse to the Company. Pending a resolution of these loan defaults, we continue to manage the properties pursuant to our management agreement with the borrowers. For the year ended December 31, 2010, we recognized property management fees from these three properties of $0.7 million. |
Lease Expirations
The following table presents a summary of lease expirations for our consolidated properties (excluding our unconsolidated properties) for leases in place at December 31, 2010, plus available space, for each of the ten calendar years beginning January 1, 2011. This table assumes that none of our tenants exercise renewal options or early termination rights, if any, at or prior to their scheduled expirations.
Years | Total Number of Tenants | Total Area in Square Feet Covered by Expiring Leases | Percentage of Aggregate Square Feet | Annualized Rent (1) | Percentage of Total Annualized Rent | Current Rent per Square Foot (2) | Rent per Square Foot at Expiration (3) | |||||||||||||||||
Available | — | 406,262 | 19.4 | % | $ | — | — | % | $ | — | $ | — | ||||||||||||
2011 | 8 | 50,801 | 2.4 | 509,000 | 2.0 | 10.03 | 13.19 | |||||||||||||||||
2012 | 9 | 88,487 | 4.2 | 1,223,000 | 4.8 | 13.82 | 14.16 | |||||||||||||||||
2013 | 15 | 398,757 | 19.0 | 7,279,000 | 28.3 | 18.25 | 19.37 | |||||||||||||||||
2014 | 5 | 83,697 | 4.0 | 1,275,000 | 5.0 | 15.24 | 17.39 | |||||||||||||||||
2015 | 7 | 417,906 | 19.9 | 6,830,000 | 26.6 | 16.34 | 17.87 | |||||||||||||||||
2016 | 4 | 51,847 | 2.5 | 821,000 | 3.2 | 15.84 | 18.95 | |||||||||||||||||
2017 | 4 | 125,487 | 6.0 | 2,188,000 | 8.5 | 17.44 | 27.68 | |||||||||||||||||
2018 | 3 | 17,129 | 0.8 | 344,000 | 1.3 | 20.09 | 23.76 | |||||||||||||||||
2019 | 3 | 32,842 | 1.6 | 494,000 | 1.9 | 15.04 | 19.34 | |||||||||||||||||
2020 | 4 | 345,461 | 16.5 | 4,018,000 | 15.6 | 11.63 | 21.52 | |||||||||||||||||
Thereafter | 5 | 76,128 | 3.7 | 706,000 | 2.8 | 9.26 | 28.65 | |||||||||||||||||
Total | 67 | 2,094,804 | 100.0 | % | $ | 25,687,000 | 100.0 | % | ||||||||||||||||
The following table presents a summary of lease expirations for our unconsolidated properties (excluding our consolidated properties) for leases in place at December 31, 2010, plus available space, for each of the ten calendar years beginning January 1, 2011. This table assumes that none of the tenants exercise renewal options or early termination rights, if any, at or prior to the scheduled expirations.
19
Years | Total Number of Tenants | Total Area in Square Feet Covered by Expiring Lease | Percentage of Aggregate Square Feet | Annualized Rent (1) | Percentage of Total Annualized Rent | Current Rent per Square Foot (2) | Rent per Square Foot at Expiration (3) | |||||||||||||||||
Available | — | 1,705,293 | 15.3 | % | $ | — | — | % | $ | — | $ | — | ||||||||||||
2011 | 107 | 714,749 | 6.4 | 11,023,000 | 7.6 | 15.42 | 15.69 | |||||||||||||||||
2012 | 77 | 968,715 | 8.7 | 18,252,000 | 12.6 | 18.84 | 19.48 | |||||||||||||||||
2013 | 85 | 729,349 | 6.6 | 13,067,000 | 9.0 | 17.92 | 18.98 | |||||||||||||||||
2014 | 56 | 1,418,237 | 12.8 | 23,608,000 | 16.3 | 16.65 | 18.70 | |||||||||||||||||
2015 | 65 | 797,893 | 7.2 | 10,398,000 | 7.2 | 13.03 | 18.34 | |||||||||||||||||
2016 | 33 | 653,610 | 5.9 | 9,628,000 | 6.6 | 14.73 | 19.01 | |||||||||||||||||
2017 | 14 | 765,336 | 6.9 | 12,419,000 | 8.6 | 16.23 | 21.36 | |||||||||||||||||
2018 | 24 | 800,114 | 7.2 | 10,476,000 | 7.2 | 13.09 | 23.50 | |||||||||||||||||
2019 | 8 | 374,871 | 3.4 | 7,793,000 | 5.4 | 20.79 | 28.83 | |||||||||||||||||
2020 | 5 | 562,808 | 5.1 | 9,338,000 | 6.4 | 16.59 | 23.20 | |||||||||||||||||
Thereafter | 18 | 1,627,896 | 14.5 | 19,089,000 | 13.1 | 11.73 | 23.47 | |||||||||||||||||
Total | 492 | 11,118,871 | 100.0 | % | $ | 145,091,000 | 100.0 | % | ||||||||||||||||
_________________________
(1) | Annualized rent is based on the current rent per leased square foot and excludes the effect of GAAP deferred rent adjustments, tenant reimbursements and parking and other revenues. |
(2) | Current rent per square foot represents the current annualized rent as of December 31, 2010 excluding any future rent increases, divided by total square footage under the lease as of the same date. |
(3) | Rent per square foot at expiration represents the annualized rent that will be in place at lease expiration. |
An overview of our development properties as of December 31, 2010 is presented below.
Pre-Development: | Location | TPGI Percentage Interest | Number of Acres | Actual/Projected Entitlements | Units | Status of Entitlements | TPGI Share | ||||||||||||||||||||||||
Potential Property Types | Square Feet | Costs Incurred to Date | Average Cost Per Square Foot | Loan Balance | |||||||||||||||||||||||||||
Campus El Segundo (1) | El Segundo, CA | 100.0 | % | 23.9 | Office/ Retail/ R&D/ Hotel | 1,700,000 | Entitled | $ | 57,229 | $ | 33.66 | $ | 17,000 | ||||||||||||||||||
MetroStudio@ Lankershim (2) | Los Angeles, CA | NA | 14.4 | Office/ Production Facility | 1,500,000 | Pending | 16,440 | 10.96 | — | ||||||||||||||||||||||
Four Points Centre | Austin, TX | 100.0 | 252.5 | Office/ Retail/ R&D/ Hotel | 1,680,000 | Entitled | 18,038 | 10.74 | — | ||||||||||||||||||||||
2100 JFK Boulevard | Philadelphia, PA | 100.0 | 0.7 | Office/ Retail/ R&D/ Hotel | 366,000 | Entitled | 4,878 | 13.33 | |||||||||||||||||||||||
2500 City West land | Houston, TX | 25.0 | 6.3 | (3) | Office/ Retail/ Residential/ Hotel | 500,000 | Entitled | 1,832 | 14.65 | — | |||||||||||||||||||||
CityWestPlace land | Houston, TX | 25.0 | 25.0 | Office/ Retail/ Residential | 1,500,000 | Entitled | 5,336 | 14.23 | — | ||||||||||||||||||||||
7,246,000 | $ | 103,753 | $ | 17.29 | $ | 17,000 | |||||||||||||||||||||||||
Fee Services: | |||||||||||||||||||||||||||||||
Universal Village (3) | Los Angeles, CA | NA | 124.0 | Residential/ Retail | 180,000 | 2,937 | Pending | — | — | ||||||||||||||||||||||
Wilshire Grand (4) | Los Angeles, CA | NA | 2.7 | Office/ Retail/ Residential/ Hotel | 2,500,000 | 100 | Pending | — | — | ||||||||||||||||||||||
9,926,000 | 3,037 | $ | 103,753 | $ | 17,000 | ||||||||||||||||||||||||||
20
As of December 31, 2010 | ||||||||||||||||||||||||||||||||||||
Condominium Units Held for Sale: | Location | TPGI Percentage Interest | Description | Number of Units Sold To Date | Total Square Feet Sold To Date | Average Sales Price Per Square Foot Sold To Date | Number of Units Remaining To Be Sold (6) | Total Square Feet Remaining To Be Sold | Average List Price Per Square Foot To Be Sold | Book Carrying Value | Loan Balance | |||||||||||||||||||||||||
Murano | Philadelphia, PA | 73.0 | % | (5) | 43-story for-sale condominium project containing 302 units. Certificates of occupancy received for 100% of units. | 220 | 247,365 | $ | 516 | 82 | 104,134 | $ | 811 | (7 | ) | $ | 49,827 | $ | 22,237 | |||||||||||||||||
_________________________
(1) | We have completed infrastructure improvements to our Campus El Segundo development site, including installing underground utilities, rough grading, and streetscape improvements. The first phase of development is anticipated to include a 225,000 square foot, six-story Class A office building and parking structure to be constructed on 2.7 acres, which we are currently marketing to prospective tenants. The number of acres and the costs incurred to date exclude approximately 2.2 acres currently held for sale. TPGI's carrying value of the 2.2 acres is approximately $2.8 million. |
(2) | We are currently entitling this property, targeting approximately 1.5 million square feet. The first phase of this transit-oriented development is planned to become a television production facility and office space, in accordance with the space needs of NBC Universal. We expect to enter into a long-term ground lease with the Los Angeles Metropolitan Transportation Authority, which owns the land, upon completion of entitlements, depending on NBCU's space requirements for the project. |
(3) | Under our contract with NBCU for the Universal Studios Hollywood backlot entitlement, we have a right of first offer (ROFO) to develop approximately 124 acres for residential and related retail and community-serving uses. We are pursuing environmental clearance and governmental approvals for approximately 2,900 residential units and 180,000 square feet of retail and community-serving space. Upon successful completion of the entitlement process and our exercise of the ROFO, it is anticipated this project will be developed in phases over several years, subject to market conditions. |
(4) | We have been engaged by Korean Air to entitle and master plan a 2.7 acre site in downtown Los Angeles for 2.5 million square feet of development that consists of office, hotel, residential and retail uses. |
(5) | After full repayment of the Murano construction loan, which has a balance of $22.2 million at December 31, 2010, net proceeds from the project will be distributed, to the extent available, as follows: |
i. | First, to the Company as repayment of our first priority capital and a return on such capital, which has a balance of $7.3 million as of December 31, 2010; |
ii. | Second, to the Company and our partner equally for repayment of second priority capital and a return on such capital. The Company's share of this tranche is $1.3 million as of December 31, 2010; |
iii. | Third, the next $3.0 million to be split equally between the Company and our partner; |
iv. | Fourth, to the Company for repayment of our original preferred equity contribution and a return on such capital, which has a balance of $30.2 million as of December 31, 2010; |
v. | Fifth, the next $3.0 million to be split equally between the Company and our partner; and |
vi. | Any residual amounts will be allocated to the Company and our partner 73% and 27%, respectively. |
(6) | Of the 82 units remaining to sell as of December 31, 2010, 74 units are on high-rise floors with superior views. |
(7) | The list price per square foot ranges from $386 to $1,747. |
Our portfolio in which we presently have an ownership interest includes approximately 21,550 vehicle spaces which are revenue generating within on-site and off-site parking facilities. The following table presents an overview of these garage properties as of December 31, 2010.
21
On-Site/Off-Site Parking | Square Footage | Vehicle Capacity | Vehicles Under Monthly Contract (1) | Percentage of Vehicle Capacity Under Monthly Contract | ||||||||
On-Site Parking (2) | 6,954,093 | 19,065 | 13,681 | 71.8 | % | |||||||
Off-Site Parking (3) | 1,056,000 | 2,485 | 2,523 | 101.5 | ||||||||
Total | 8,010,093 | 21,550 | 16,204 | 75.2 | % | |||||||
_________________________
(1) | Includes vehicle spaces provided to tenants under lease agreements. |
(2) | Includes garage space at One Commerce Square and Two Commerce Square in which we have a 75.0% ownership interest, at San Felipe Plaza, 2500 City West, Brookhollow Central I, II and III, CityWestPlace, Centerpointe I & II, and Fair Oaks Plaza, in which we have an indirect 25.0% ownership interest, at City National Plaza in which we have an ownership interest of 7.94%, and at San Jacinto Center, Frost Bank Tower, One Congress Plaza, One American Center, and 300 West 6thStreet, in which we have an indirect 6.25% ownership interest. |
(3) | Includes off-site garage space for City National Plaza in which we have an indirect 7.94% ownership interest. |
Our Managed Properties
In addition to our portfolio of operating and development properties in which we hold an ownership interest, we provide asset and/or property management services for four properties on a fee basis for third parties. We asset and property manage two properties, 800 South Hope Street and 1835 Market Street, through our separate account relationship with CalSTRS. We developed and continue to property manage the CalEPA headquarters building, and we provide property management and leasing services for 816 Congress on behalf of an affiliate of Lehman. The table below presents an overview of those properties which we manage for third parties as of December 31, 2010. In addition, we provide asset and/or property management services for twelve properties held by TPG/CalSTRS and ten properties held by the Austin Portfolio Joint Venture as of December 31, 2010.
Managed Properties | Location | Rentable Square Feet (1) | Percent Leased | |||||
800 South Hope Street | Los Angeles, CA | 242,176 | 98.5 | % | ||||
CalEPA Headquarters | Sacramento, CA | 950,939 | 100.0 | |||||
1835 Market Street | Philadelphia, PA | 686,503 | 88.1 | |||||
816 Congress | Austin, TX | 433,024 | 70.8 | |||||
Total/Weighted Average | 2,312,642 | 90.8 | % | |||||
_________________________
(1) | For purposes of the table above, both on-site and off-site parking are excluded. Total portfolio square footage includes office properties and retail space. |
ITEM 3. LEGAL PROCEEDINGS
We are involved in various litigation and other legal matters from time to time, including personal injury claims and administrative proceedings, which we are addressing or defending in the ordinary course of business. Management believes that any liability that may potentially result upon resolution of such matters will not have a material adverse effect on our business, financial condition or results of operations.
ITEM 4. EXECUTIVE OFFICERS OF THE REGISTRANT
Executive officers are elected annually by the Board of Directors and serve at the discretion of the Board. The following table sets forth certain information regarding our executive officers as of March 10, 2011.
22
Name | Age | Position | ||||
James A. Thomas | 74 | Chairman of the Board, President and Chief Executive Officer | ||||
Thomas S. Ricci | 53 | Executive Vice President | ||||
Paul S. Rutter | 57 | Co-Chief Operating Officer and General Counsel | ||||
Randall L. Scott | 55 | Executive Vice President and Director | ||||
John R. Sischo | 54 | Co-Chief Operating Officer and Director | ||||
Diana M. Laing | 56 | Chief Financial Officer and Secretary | ||||
Robert D. Morgan | 45 | Senior Vice President, Accounting and Administration | ||||
Todd L. Merkle | 41 | Chief Investment Officer | ||||
James A. Thomas serves as our Chairman of the Board, President and Chief Executive Officer. Mr. Thomas has served on our Board of Directors since the Company was organized in March 2004. Mr. Thomas founded our predecessor group of entities, and served as the Chairman of the Board and Chief Executive Officer of our predecessor group of entities from 1996 to the commencement of our operations in October 2004. Prior to founding our predecessor group of entities, Mr. Thomas served as a co-managing partner of Maguire Thomas Partners, a national full-service real estate Operating Company from 1983 to 1996. In 1996, Maguire Thomas Partners was divided into two companies with Mr. Thomas forming our predecessor group of entities with other key members of the former executive management at Maguire Thomas Partners. Mr. Thomas also served as Chief Executive Officer and principal owner of the Sacramento Kings National Basketball Association team and the ARCO Arena from 1992 until 1999. He is a member of the Real Estate Roundtable and the National Association of Real Estate Investment Trusts (NAREIT). Mr. Thomas is a current member and a former Chairman of the board of directors of Town Hall Los Angeles, and serves on the board of directors of the SOS Coral Trees, Los Angeles Chamber of Commerce, Center Theatre Group, and the National Advisory Council of the Cleveland Marshall School of Law. He serves on the board of trustees of the Ralph M. Parsons Foundation and I Have a Dream Foundation in Los Angeles, Baldwin Wallace College in Cleveland, and St. John’s Health Center Foundation in Santa Monica, California. Mr. Thomas also serves on the board of governors of the Music Center of Los Angeles County. He is a member of the Chairman's Council of the Weingart Center Association, and the Colonial Williamsburg National Council. Additionally, Mr. Thomas is the Founder and Chairman of Fixing Angelenos Stuck in Traffic (F.A.S.T.). Mr. Thomas received his Bachelor of Arts degree in economics and political science with honors from Baldwin Wallace College in 1959. He graduated magna cum laude with a juris doctorate degree in 1963 from Cleveland Marshall Law School.
Thomas S. Ricci has served us as an Executive Vice President since April 2004. He served as Senior Vice President of our predecessor group of entities from May 1998 with oversight of business development and development services. From February 1992 through May 1998, Mr. Ricci was the vice president of planning and entitlements at Maguire Thomas Partners, Playa Capital Company division. As a senior executive at Maguire Thomas Partners, Mr. Ricci worked on several large mixed-use and commercial projects. Prior to joining Maguire Thomas Partners in 1987, Mr. Ricci was a Captain in the U.S. Air Force, where he was involved in planning, programming, design and construction of medical facilities at locations in the United States and abroad. Mr. Ricci is currently involved in various business, civic and professional organizations and serves as a member of the board of trustees of Marymount College in Rancho Palos Verdes, California. Mr. Ricci holds a bachelor of science degree and a bachelor of architecture degree with honors from the New York Institute of Technology.
Paul S. Rutter serves us as Co-Chief Operating Officer and General Counsel. Mr. Rutter joined our Company in September 2008. After practicing law with James A. Thomas from 1978 to 1983, Mr. Rutter cofounded Gilchrist & Rutter Professional Corporation, a real estate law firm in Los Angeles, in 1983 and served as Managing Shareholder of the firm until 2006. His law practice included negotiating, structuring and documenting transactions and joint ventures involving commercial real estate development, financing, leasing, acquisitions and dispositions. In 2006, he became Executive Vice President, Major Transactions, at Maguire Properties, a NYSE listed real estate investment trust, where he was a member of the Executive Management Committee and oversaw the leasing, acquisition and financing transactions of that company. Mr. Rutter is active in several real estate organizations and has served on the boards of several charitable and non-profit organizations. Mr. Rutter currently is a member of the Board of Advisors of University of California, Los Angeles School of Law and is on the Advisory Board of the UCLA Ziman Center for Real Estate. Mr. Rutter earned his A.B. degree (magna cum laude) from the University of California, Los Angeles, where he received Dean's List honors, and was Pi Gamma Mu and Phi Beta Kappa. Mr. Rutter received his Juris Doctor degree (Order of the Coif) from the University of California, Los Angeles School of Law, where he served as Topic and Comment Editor for the U.C.L.A. Law Review. He is admitted to the bars of the State of California, the U.S. Tax Court, the U.S. Court of Federal Appeals and the United States Supreme Court.
Randall L. Scott serves us as an Executive Vice President and Director. Mr. Scott has been a member of our Board of Directors since April 2004. Mr. Scott directed asset management operations nationally and East Coast development activity for
23
our predecessor group of entities from its inception in 1996 until the commencement of our operations in October 2004. Prior to the formation of our predecessor group of entities, Mr. Scott was with Maguire Thomas Partners from 1986 to August 1996. As a senior executive at Maguire Thomas Partners, Mr. Scott worked on several large-scale development projects, including One Commerce Square in Philadelphia and The Gas Company Tower in Los Angeles. Mr. Scott was also on the pre-development team for the CalEPA project in Sacramento and served in a general business development capacity. Mr. Scott is currently involved in various civic and professional organizations and serves on the board of directors of the Center City District, a Philadelphia non-profit special services organization and the board of trustees of Magee Rehabilitation Hospital, a Philadelphia-based specialty hospital providing medical rehabilitation services to people with physical disabilities. Mr. Scott holds a bachelor’s degree in business administration from Butler University in Indianapolis.
John R. Sischo serves us as Co-Chief Operating Officer of Thomas Properties Group, Inc. Mr. Sischo has been a member of our Board of Directors since April 2004. Mr. Sischo leads the company's acquisition, investment and finance efforts in addition to managing investor relationships which includes major pension funds and financial institutions. As a founding partner of the company, he has lead the firm's effort in the acquisition of approximately $3.8 billion of operating properties and built the company's investment management platform, through the financing of new and existing operating and development properties and fund investment programs, which has resulted in the creation of investment vehicles totaling approximately $1.0 billion of equity capital. Mr. Sischo joined Thomas Properties Group in 1998 as Chief Financial Officer after eight years leading Bankers Trust's real estate practice in Los Angeles. He has executed over $10 billion in real estate transactions both public and private during his 24 year career. He started his real estate banking career with Merrill Lynch Capital Markets and then moved to Security Pacific Corporation. Mr. Sischo received a bachelor's degree in political science from the University of California at Los Angeles.
Diana M. Laing serves as our Chief Financial Officer and Secretary, which positions she has held since May 2004. She is responsible for financial reporting oversight, capital markets transactions and investor relations. Prior to becoming a member of our senior management team, Ms. Laing served as Chief Financial Officer of Triple Net Properties, LLC from January 2004 through April 2004. From December 2001 to December 2003, Ms. Laing served as Chief Financial Officer of New Pacific Realty Corporation, and held this position at Firstsource Corp. from July 2000 to May 2001. Previously, Ms. Laing was Executive Vice President and Chief Financial Officer of Arden Realty, Inc., a publicly-traded REIT, from August 1996 to July 2000. From 1982 to August 1996, she was Chief Financial Officer of Southwest Property Trust, Inc., a publicly-traded multi-family REIT. She is a member of the board of directors, chairman of the audit committee and a member of the compensation committee for The Macerich Company, a publicly-traded REIT. Ms. Laing holds a bachelor of science degree in accounting from Oklahoma State University.
Robert D. Morgan serves us as a Senior Vice President responsible for accounting and administration. He served us as a Vice President from April 2004 to December 2006 in the same capacity. Mr. Morgan joined our predecessor group of entities in March 2000 from Arthur Andersen LLP, where he spent 10 years in the real estate services group. At Arthur Andersen, Mr. Morgan was a Senior Manager specializing in providing audit and transaction due diligence services to real estate developers, owners, lenders and operators. Mr. Morgan earned a bachelor of science degree in business administration with a concentration in accounting from California Polytechnic State University at San Luis Obispo. Mr. Morgan is a certified public accountant, licensed by the State of California.
Todd L. Merkle serves us as our Chief Investment Officer. Prior to joining the Company as a Vice President in 2004, Mr. Merkle spent ten years in the investment banking business at the firms of Merrill Lynch, Lehman Brothers and Houlihan Lokey Howard & Zukin, having been based in both New York, NY and Los Angeles, CA. In this capacity, Mr. Merkle was involved in a variety of investment banking transactions on behalf of both public and private real estate clients, including buy-side and sell-side mergers and acquisitions, special committee representations, fairness opinions, asset and portfolio sales, and public and private equity and debt financings. Mr. Merkle also spent two years as a corporate finance associate at the Irvine Company in Newport Beach, CA. Mr. Merkle received a BS in Applied Economics and Business Management from Cornell University in Ithaca, NY in 1992.
Code of Ethics
We have adopted a Code of Business Conduct and Ethics that applies to all of our directors, officers and employees. This code is publicly available on our web site at www.tpgre.com. Any substantive amendments to the code and any grant of waiver from a provision of the code requiring disclosure under applicable SEC or NASDAQ rules will be disclosed by us in a report on Form 8-K.
24
PART II
ITEM 5. MARKET FOR REGISTRANT’S COMMON EQUITY, RELATED STOCKHOLDER MATTERS AND ISSUER PURCHASES OF EQUITY SECURITIES
Our common stock trades on the NASDAQ Global Market under the symbol “TPGI”. As of March 8, 2011, there were ten stockholders of record. This figure does not reflect the beneficial ownership of shares held in the name of CEDE & Co. The following table sets forth, for the period indicated, the intra-day high and low per share sales prices in dollars on the NASDAQ Global Market for our common stock.
High | Low | ||||||
4th quarter 2010 | $ | 4.60 | $ | 3.44 | |||
3rd quarter 2010 | 3.90 | 2.51 | |||||
2nd quarter 2010 | 5.15 | 3.22 | |||||
1st quarter 2010 | 3.35 | 2.34 | |||||
4th quarter 2009 | 3.74 | 2.06 | |||||
3rd quarter 2009 | 3.00 | 1.18 | |||||
2nd quarter 2009 | 2.50 | 1.15 | |||||
1st quarter 2009 | 3.47 | 1.09 | |||||
The closing price of our common stock as of March 9, 2011 was $3.42.
We paid quarterly dividends of $0.0125 per common share for the first three quarters in 2009. In December 2009, our board of directors suspended our quarterly dividends to common stockholders. The actual amount and timing of distributions is at the discretion of our board of directors and depends upon our financial condition, and no assurance can be given as to the amounts or timing of future distributions. Factors that could influence our ability to declare and pay dividends are discussed in “Management’s Discussion and Analysis of Financial Condition and Results of Operations—Liquidity and Capital Resources.”
There were no issuer purchases of equity securities during the fourth quarter ended December 31, 2010.
During the quarter ended December 31, 2010, we issued 1.5 million shares of common stock, respectively, in redemption of 1.5 million Operating Partnership units by limited partners. The issuance was not dilutive to capitalization as the common shares were issued on a one-for-one basis pursuant to the terms of the partnership agreement of the Operating Partnership.
Equity compensation plan information is discussed under the heading “Security Ownership of Certain Beneficial Owners and Management and Related Stockholder Matters.”
Performance Measurement Comparison
The information below shall not be deemed to be incorporated by reference into any filing under the Securities Act and Exchange Act or deemed to be “soliciting material” or to be “filed” with the U.S. Securities and Exchange Commission or subject to Regulation 14A or 14C, other than as provided in Item 201 of Regulation S-K, or to the liabilities of Section 18 of the Exchange Act, except to the extent we specifically request that such information be treated as soliciting material or specifically incorporate it by reference into a filing under the Securities Act or the Exchange Act.
The following graph provides a comparison of cumulative total stockholder return for the period from December 31, 2005 through December 31, 2010, for the common stock of our Company, Standard & Poor’s 500 Stock Index (S&P 500), NASDAQ Composite Index, Dow Jones US Real Estate Investments & Services TSM and the Dow Jones US Select Real Estate TSM. This is the first year that we are presenting the NASDAQ Composite Index which we think is a more comparable broad equity market index than the S&P 500. As such, this will be the final year that we present the S&P 500. Additionally, we are presenting the Dow Jones US Real Estate Investments & Services TSM in our performance graph because management believes that it provides information to investors about our performance relative to our peer group. Our Company is included in this index. In the future we will no longer present the Dow Jones US Select Real Estate TSM as this index has changed and we no longer believe that it includes our peer group. The stock performance graph assumes an investment of $100.00 in each of our common stock and the four indices, and the reinvestment of any dividends. The historical information reflected in the graph is not necessarily indicative of future performance. The data shown is based on the closing share prices or index values, as applicable, at the end of the last day of each year shown.
25
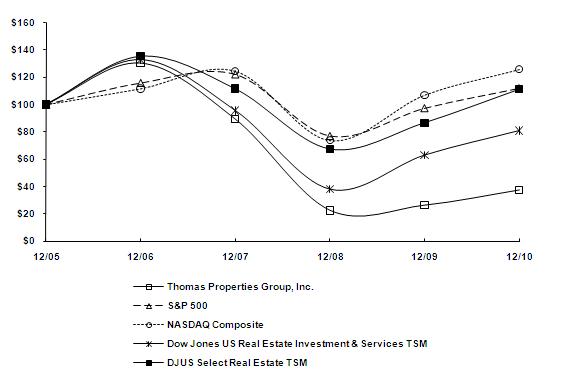
12/31/2005 | 12/31/2006 | 12/31/2007 | 12/31/2008 | 12/31/2009 | 12/31/2010 | ||||||||||||||||||
Thomas Properties Group, Inc. | $ | 100.00 | $ | 130.38 | $ | 89.33 | $ | 22.37 | $ | 26.17 | $ | 37.31 | |||||||||||
S&P 500 | $ | 100.00 | $ | 115.80 | $ | 122.16 | $ | 76.96 | $ | 97.33 | $ | 111.99 | |||||||||||
NASDAQ Composite | $ | 100.00 | $ | 111.74 | $ | 124.67 | $ | 73.77 | $ | 107.12 | $ | 125.93 | |||||||||||
Dow Jones US Real Estate Investment & Services TSM | $ | 100.00 | $ | 132.71 | $ | 95.66 | $ | 38.05 | $ | 63.06 | $ | 80.98 | |||||||||||
DJUS Select Real Estate TSM | $ | 100.00 | $ | 135.67 | $ | 111.71 | $ | 67.21 | $ | 86.71 | $ | 111.40 | |||||||||||
ITEM 6. SELECTED FINANCIAL DATA
The following table sets forth selected consolidated financial and operating data on a historical basis for our Company.
The following data should be read in conjunction with our financial statements and notes thereto and “Management’s Discussion and Analysis of Financial Condition and Results of Operations” included elsewhere in this Form 10-K.
26
Thomas Properties Group, Inc. | |||||||||||||||||||
Year ended December 31, 2010 | Year ended December 31, 2009 | Year ended December 31, 2008 | Year ended December 31, 2007 | Year ended December 31, 2006 | |||||||||||||||
Revenues: | |||||||||||||||||||
Rental | $ | 29,230 | $ | 29,753 | $ | 30,523 | $ | 32,646 | $ | 33,076 | |||||||||
Tenant reimbursements | 20,187 | 21,163 | 25,874 | 26,371 | 25,197 | ||||||||||||||
Parking and other | 3,330 | 2,988 | 3,869 | 3,917 | 3,837 | ||||||||||||||
Investment advisory, management, leasing, and development services | 7,703 | 9,345 | 7,194 | 12,750 | 6,931 | ||||||||||||||
Investment advisory, management, leasing, and development services—unconsolidated real estate entities | 16,470 | 15,023 | 18,263 | 17,921 | 12,603 | ||||||||||||||
Reimbursable property personnel costs | 5,797 | 5,584 | 6,079 | 3,877 | 2,620 | ||||||||||||||
Condominium sales | 14,984 | 30,226 | 79,758 | — | — | ||||||||||||||
Total revenues | 97,701 | 114,082 | 171,560 | 97,482 | 84,264 | ||||||||||||||
Expenses: | |||||||||||||||||||
Property operating and maintenance | 25,049 | 25,339 | 25,608 | 22,690 | 20,805 | ||||||||||||||
Real estate and other taxes | 6,914 | 7,225 | 6,482 | 6,087 | 5,904 | ||||||||||||||
Investment advisory, management, leasing, and development services | 12,221 | 11,910 | 14,800 | 13,093 | 7,139 | ||||||||||||||
Reimbursable property personnel costs | 5,797 | 5,584 | 6,079 | 3,877 | 2,620 | ||||||||||||||
Cost of condominium sales | 10,955 | 26,492 | 62,436 | — | — | ||||||||||||||
Interest | 19,239 | 26,868 | 22,763 | 17,721 | 20,570 | ||||||||||||||
Depreciation and amortization | 14,128 | 12,642 | 11,766 | 11,604 | 12,661 | ||||||||||||||
General and administrative | 14,224 | 17,082 | 16,695 | 17,567 | 17,429 | ||||||||||||||
Impairment loss | 4,500 | 13,000 | 11,023 | — | — | ||||||||||||||
Total expenses | 113,027 | 146,142 | 177,652 | 92,639 | 87,128 | ||||||||||||||
Gain on sale of real estate | — | 1,214 | 3,618 | 4,441 | 10,640 | ||||||||||||||
Gain (loss) from early extinguishment of debt | — | 11,921 | 255 | — | (360 | ) | |||||||||||||
Interest income | 72 | 338 | 2,795 | 6,014 | 2,974 | ||||||||||||||
Equity in net loss of unconsolidated real estate entities | (1,184 | ) | (16,236 | ) | (12,828 | ) | (14,853 | ) | (12,909 | ) | |||||||||
(Loss) income before benefit (provision) for income taxes and noncontrolling interests | (16,438 | ) | (34,823 | ) | (12,252 | ) | 445 | (2,519 | ) | ||||||||||
Benefit (provision) for income taxes | 357 | (683 | ) | 1,885 | (1,221 | ) | (635 | ) | |||||||||||
Net (loss) income | (16,081 | ) | (35,506 | ) | (10,367 | ) | (776 | ) | (3,154 | ) | |||||||||
Noncontrolling interests’ share of net loss (income): | |||||||||||||||||||
Unitholders in the Operating Partnership | 4,843 | 11,535 | 4,683 | (249 | ) | 1,577 | |||||||||||||
Partners in the consolidated real estate entities | (234 | ) | 2,408 | 198 | 122 | (472 | ) | ||||||||||||
4,609 | 13,943 | 4,881 | (127 | ) | 1,105 | ||||||||||||||
TPGI share of net loss | $ | (11,472 | ) | $ | (21,563 | ) | $ | (5,486 | ) | $ | (903 | ) | $ | (2,049 | ) | ||||
Loss per share-basic and diluted | $ | (0.34 | ) | $ | (0.86 | ) | $ | (0.24 | ) | $ | (0.05 | ) | $ | (0.15 | ) | ||||
Weighted average common shares outstanding— basic and diluted | 33,684,101 | 25,173,163 | 23,693,577 | 20,739,371 | 14,339,032 | ||||||||||||||
Cash flows from: | |||||||||||||||||||
Operating activities | $ | (543 | ) | $ | (6,935 | ) | $ | 2,216 | $ | 45,507 | $ | 20,628 | |||||||
Investing activities | 6,584 | 22,474 | (35,543 | ) | (139,921 | ) | (19,084 | ) | |||||||||||
Financing activities | 387 | (48,627 | ) | (24,297 | ) | 156,718 | (1,116 | ) | |||||||||||
27
Thomas Properties Group, Inc. | |||||||||||||||||||
December 31, | |||||||||||||||||||
2010 | 2009 | 2008 | 2007 | 2006 | |||||||||||||||
Balance Sheet Data (at year end): | |||||||||||||||||||
Investments in real estate, net | $ | 416,090 | $ | 440,770 | $ | 478,665 | $ | 463,364 | $ | 336,154 | |||||||||
Total assets | 540,235 | 559,403 | 660,435 | 713,904 | 510,342 | ||||||||||||||
Mortgages, other secured, and unsecured loans | 300,536 | 318,236 | 387,945 | 396,007 | 331,828 | ||||||||||||||
Total liabilities | 332,444 | 357,058 | 439,708 | 478,496 | 375,152 | ||||||||||||||
Equity | 207,791 | 202,345 | 220,727 | 235,408 | 135,190 | ||||||||||||||
Total liabilities and equity | 540,235 | 559,403 | 660,435 | 713,904 | 510,342 | ||||||||||||||
ITEM 7. MANAGEMENT’S DISCUSSION AND ANALYSIS OF FINANCIAL CONDITION AND RESULTS OF OPERATIONS
The following discussion should be read in conjunction with the financial statements and notes thereto appearing elsewhere in this report. We make statements in this section that are forward-looking statements within the meaning of the federal securities laws. For a complete discussion of forward-looking statements, see the section in this Form 10-K entitled “Forward-Looking Statements.” Certain risk factors may cause our actual results, performance or achievements to differ materially from those expressed or implied by the following discussion. For a discussion of such risk factors, see the section in this report entitled “Risk Factors.”
When you read the financial statements and the information included in this report, you should be aware that our operations are significantly affected by both macro and micro economic forces. Our operations are directly affected by actual and perceived trends in various national and regional economic conditions that affect national and regional markets for commercial real estate services, including interest rates, the availability of credit to finance commercial real estate transactions, and the impact of tax laws affecting real estate. Periods of economic slowdown or recession, rising interest rates, tightening of the credit markets, declining demand for or increased supply of real estate, or the public perception that any of these events may occur can adversely affect our business. These conditions could result in a general decline in rents, which in turn would reduce revenue from property management fees and brokerage commissions derived from leases. In addition, these conditions could lead to a decline in property values as well as a decline in funds invested in commercial real estate and related assets, which in turn may reduce revenues from investment advisory, property management, leasing and development fees.
Overview and Background
We are a full-service real estate Operating Company that owns, acquires, develops and manages primarily office, as well as mixed-use and residential properties on a nationwide basis. We conduct our business through our Operating Partnership, of which we own 74.7% as of December 31, 2010 and have control over the major decisions of the Operating Partnership.
Critical Accounting Policies and Estimates
Accounting estimates. The preparation of financial statements in conformity with GAAP requires us to make estimates and assumptions that affect the reported amounts of assets and liabilities, the disclosure of contingent assets and liabilities at the date of the financial statements, and the reported amounts of revenues and expenses for the relevant reporting periods. Certain accounting policies are considered to be critical accounting estimates, as these policies require us to make assumptions about matters that are highly uncertain at the time the estimate is made and changes in the accounting estimate are reasonably likely to occur from period to period. We believe the following accounting policies reflect the more significant estimates used in the preparation of our financial statements. For a summary of significant accounting policies, see note 2 to our financial statements, included elsewhere in this report.
Investments in real estate. The price that we pay to acquire a property is impacted by many factors including the condition of the buildings and improvements, the occupancy of the building, the existence of above and below market tenant leases, the creditworthiness of the tenants, favorable or unfavorable financing, and numerous other factors. Accordingly, we are required to make subjective assessments to allocate the purchase price paid to acquire investments in real estate among the assets acquired and liabilities assumed based on our estimate of the fair values of such assets and liabilities. This includes determining the value of the buildings and improvements, land, any ground leases, tenant improvements, in-place tenant leases, tenant relationships, the value (or negative value) of above (or below) market leases and any debt assumed from the seller or loans made by the seller to us. Each of these estimates requires a great deal of judgment and some of the estimates involve complex calculations. Our calculation methodology is summarized in Note 2 to our consolidated financial statements. These allocation
28
assessments have a direct impact on our results of operations because if we were to allocate more value to land there would be no depreciation with respect to such amount or if we were to allocate more value to the buildings as opposed to allocating to the value of tenant leases, this amount would be recognized as an expense over a much longer period of time, since the amounts allocated to buildings are depreciated over the estimated lives of the buildings whereas amounts allocated to tenant leases are amortized over the terms of the leases. Additionally, the amortization of value (or negative value) assigned to non-market rate leases is recorded as an adjustment to rental revenue as compared to amortization of the value of in-place leases and tenant relationships, which is included in depreciation and amortization in our consolidated statements of operations.
We are required to make subjective assessments as to the useful lives of our properties for purposes of determining the amount of depreciation to record on an annual basis with respect to our investments in real estate. These assessments have a direct impact on our net income because if we were to shorten the expected useful lives of our investments in real estate we would depreciate such investments over fewer years, resulting in more depreciation expense and lower net income on an annual basis.
We evaluate a property for potential impairment when events or changes in circumstances indicate that the current book value of the property may not be recoverable. Indicators of potential impairment include among other things: declining occupancy levels; declining rental rates; increasing number of tenants unable to pay their rent; deterioration in the local rental market; declining market values; our competitors’ beginning to experience financial difficulty or impair similar assets; and our inability or change of intent to hold the property.
In the event that these periodic assessments result in a determination that the carrying amount of a property exceeds the sum of the undiscounted cash flows (excluding interest) that are expected to result from the use and eventual disposition of the property, we would recognize an impairment loss to the extent the carrying amount exceeded the estimated fair value of the property. Estimates of expected future net cash flows are inherently uncertain and are based on assumptions dependent upon future and current market conditions and events that affect the ultimate value of the property. These estimates are highly subjective and require us to make assumptions relating to, among other things: future rental rates; tenant allowances; operating expenditures; property taxes; capital improvements; occupancy levels; the estimated proceeds generated from the future sale of the property or inability to sell the property; holding periods; market conditions; accessibility of capital and credit markets; recent sales activity of similar properties in the same market; our liquidity and ability and intent to hold the properties; development and construction costs; and discount rates. These estimates can change significantly between reporting periods. Due to the fact that estimates included in cash flow models are based on historical results and projected trends, unexpected changes in market conditions may lead to additional impairment charges in the future that cannot be anticipated.
We use the equity method of accounting to account for investments in real estate entities over which we have significant influence, but not control over major decisions. In these situations, the unit of account for measurement purposes is the equity investment and not the real estate. Accordingly, if our joint venture investments meet the other-than-temporary criteria of FASB ASC 323, “Investments—Equity Method and Joint Ventures”, we would recognize an impairment loss to the extent the carrying amount exceeded the estimated fair value of our investment.
With respect to condominium units held for sale, we would recognize an impairment loss to the extent the carrying amount exceeded the estimated fair value less costs to sell the project. Estimates of fair value are often based on expected future net cash flows, which are inherently uncertain and are based on assumptions dependent upon future and current market conditions and events that affect the ultimate value of the project. These estimates require us to make assumptions relating to, among other things, sales absorption rates, selling prices and discount rates.
Refer to the impairment loss discussion in the sections titled "Comparison of the year ended December 31, 2010 to the year ended December 31, 2009" and “Comparison of the year ended December 31, 2009 to the year ended December 31, 2008” found elsewhere herein for further information on the impairment losses recorded in those years.
Revenue recognition. Leases with tenants are accounted for as operating leases. Rental income is recognized as earned based upon the contractual terms of the leases with tenants. Minimum annual rents are recognized on a straight-line basis over the lease term regardless of when the payments are made. The deferred rents asset on our balance sheets represents the aggregate excess rental revenue recognized on a straight-line basis over the cash received under the applicable lease provisions. Our leases generally contain provisions that require tenants to reimburse us for a portion of property operating expenses and real estate related taxes associated with the property. These reimbursements are recognized as revenues in the period the related expenses are incurred. Real estate commissions on leases we charge to third party owners of rental properties are generally recorded as income after we satisfy all obligations under the commission agreement. A typical commission agreement provides that we earn 50% of the lease commission upon the execution of the lease agreement by the tenant. The remaining 50% of the lease commission is earned at a later date, usually upon tenant occupancy. The existence of any significant future contingencies
29
will delay recognition of commission revenue until those contingencies are satisfied. In addition, we eliminate lease commissions we charge on our ownership share of rental properties. Investment advisory, property management and development services fees are recognized when earned under the provisions of the related agreements.
We have one high-rise condominium project for which we used the percentage of completion accounting method to recognize costs and sales during the construction period, up through and including June 30, 2009. Commencing with the third quarter of 2009, we have applied the deposit method of accounting to recognize sales revenue and costs. Under the provisions of FASB ASC 360-20, “Property, Plant and Equipment” subsection “Real Estate and Sales”, revenue and costs for projects are recognized when all parties are bound by the terms of the contract, all consideration has been exchanged, any permanent financing for which the seller is responsible has been arranged and all conditions precedent to closing have been performed. This results in profit from the sale of condominium units recognized at the point of settlement as compared to the point of sale. Revenue is recognized on the contract price of individual units. Total estimated costs, net of impairment charges, are allocated to individual units which have closed on a relative value basis. Total estimated revenue and construction costs are reviewed periodically, and any change is applied to current and future periods.
Allowances for uncollectible current tenant receivables and unbilled deferred rents receivable. Tenant receivables and unbilled deferred rent receivables are carried net of the allowances for estimated uncollectible tenant receivables and unbilled deferred rent. Our determination of the adequacy of these allowances requires significant judgments and estimates. Unbilled deferred rents receivable represents the amount that the cumulative straight-line rental revenue recorded to date exceeds cash rents billed to date under the lease agreements. Given the longer-term nature of these types of receivables, our determination of the adequacy of the allowance for unbilled deferred rents receivables is based primarily on historical loss experience. We evaluate the allowance for unbilled deferred rents receivable using a specific identification methodology for our Company’s significant tenants, assessing a tenant’s financial condition and the tenant’s ability to meet its lease obligations. In addition, the allowance includes a reserve based upon our historical experience and current and anticipated future economic conditions that are not associated with any specific tenant.
Depreciable lives of leasing costs. We incur certain capital costs in connection with leasing our properties. These costs consist primarily of lease commissions and tenant improvements. Lease costs are amortized on the straight-line method over the shorter of the estimated useful life of the asset or the estimated remaining term of the lease, ranging from one to 15 years. We reevaluate the remaining useful life of these costs as the creditworthiness of our tenants changes. If we determine that the estimated remaining life of the respective lease has changed, we adjust the amortization period and, therefore, the amortization or depreciation expense recorded each period may fluctuate. If we experience increased levels of amortization or depreciation expense due to changes in the estimated useful lives of leasing costs, our results of operations may be adversely affected.
Income taxes. We are subject to federal income taxes in the United States, and also in states and local jurisdictions in which we operate. We account for income taxes according to FASB ASC 740, “Income Taxes”. FASB ASC 740 requires the recognition of deferred tax assets, net of applicable reserves, related to net operating loss carryforwards and certain temporary differences. The standard requires recognition of a future tax benefit to the extent that realization of such benefit is more likely than not. Otherwise, a valuation allowance is applied.
FASB ASC 740-10-25, “Income Taxes”, clarifies the accounting for uncertainty in tax positions and requires that we recognize the impact of a tax position in our financial statements if that position would more likely than not be sustained on audit, based on the technical merits of the position. FASB ASC Topic 740, Income Taxes provides that a tax benefit from an uncertain tax position may be recognized when it is more likely than not that the position will be sustained upon examination, including resolutions of any related appeals or litigation processes, based on the technical merits. ASC Topic 740 also provides guidance on measurement, derecognition, classification, interest and penalties, accounting in interim periods, disclosure and transition. We recognize tax liabilities in accordance with ASC Topic 740 and we adjust these liabilities when our judgment changes as a result of the evaluation of new information not previously available. Due to the complexity of some of these uncertainties, the ultimate resolution may result in a payment that is materially different from our current estimate of the tax liabilities. These differences will be reflected as increases or decreases to income tax expense in the period in which they are determined.
Factors That May Influence Future Results of Operations
The following is a summary of the more significant factors we believe may affect our results of operations. For a more detailed discussion regarding the factors that you should consider before making a decision to acquire shares of our common stock, see the information under the caption “Risk Factors” elsewhere in this report.
Rental income. The amount of net rental income generated by our properties depends principally on our ability to maintain
30
the occupancy rates of currently leased space, to lease currently available space as well as space in newly developed or redeveloped properties and space available from unscheduled lease terminations. The amount of rental income we generate also depends on our ability to maintain or increase rental rates in the submarkets where our properties are located.
Los Angeles, Philadelphia, Austin, and Houston—Submarket Information. A significant portion of our income is derived from properties located in Los Angeles, Philadelphia, Austin and Houston. The market conditions in these submarkets have a significant impact on our results of operations.
Development and redevelopment activities. We believe that our development activities present growth opportunities for us over the next several years. We continually evaluate the size, timing and scope of our development and redevelopment initiatives and, as necessary, sales activity to reflect the economic conditions and the real estate fundamentals that exist in our submarkets. However, we may not be able to lease committed development or redevelopment properties at expected rental rates or within projected time frames or complete projects on schedule or within budgeted amounts. The occurrence of one or more of these events could adversely affect our financial condition, results of operations and cash flows. We currently own interests in four development projects, and TPG/CalSTRS owns one redevelopment property and two development sites. As of December 31, 2010, we had incurred, on a consolidated basis, approximately $96.6 million of costs related to land acquisition, predevelopment and infrastructure that are reflected in Land improvements-development properties on our balance sheet. To the extent that we, or joint ventures we are a partner in, do not proceed with projects as planned, development and/or redevelopment costs would need to be evaluated for impairment.
Results of Operations
The results of operations reflect the consolidation of the affiliates that own One Commerce Square, Two Commerce Square, Murano, 2100 JFK Boulevard, Four Points Centre, Campus El Segundo and our investment advisory, property management, leasing and real estate development operations. Included in our investment advisory, property management, leasing and development services operations are development fees we earn from unaffiliated third parties related to two separate entitlement projects—Universal Village and Wilshire Grand. The following properties are accounted for using the equity method of accounting (the date of acquisition is listed for each with the exception of 2121 Market Street whose date represents the year it was co-developed with our joint venture partner):
•2121 Market Street (as of 2001)
•City National Plaza (as of January 2003)
•Reflections I (as of October 2004)
•Reflections II (as of October 2004)
•Four Falls Corporate Center (as of March 2005)
•Oak Hill Plaza (as of March 2005)
•Walnut Hill Plaza (as of March 2005)
•San Felipe Plaza (as of August 2005)
•2500 City West (as of August 2005)
•Brookhollow Central I, II, and III (as of August 2005)
•2500 City West land (as of December 2005)
•CityWestPlace (as of June 2006)
•CityWestPlace land (as of June 2006)
•Centerpointe I & II (as of January 2007)
•Fair Oaks Plaza (as of January 2007)
The following investment entity that held a mortgage loan receivable related to Brookhollow Central was accounted for using the equity method of accounting. The note receivable held by this subsidiary was paid off and this entity was dissolved during the year ended December 31, 2010:
•BH Note B Lender, LLC (as of October 2008, the date of formation)
TPG/CalSTRS, LLC also owns a 25% interest in the Austin Portfolio Joint Venture which owns the following properties (“Austin Portfolio Joint Venture Properties”):
•San Jacinto Center (as of June 2007)
•Frost Bank Tower (as of June 2007)
•One Congress Plaza (as of June 2007)
•One American Center (as of June 2007)
31
•300 West 6th Street (as of June 2007)
•Research Park Plaza I & II (as of June 2007)
•Park Centre (as of June 2007)
•Great Hills Plaza (as of June 2007)
•Stonebridge Plaza II (as of June 2007)
•Westech 360 I-IV (as of June 2007)
Comparison of the year ended December 31, 2010 to the year ended December 31, 2009.
Total revenues. Total revenues decreased by $16.4 million or 14.4%, to $97.7 million for the year ended December 31, 2010 compared to $114.1 million for the year ended December 31, 2009. The significant components of revenue are discussed below.
Rental revenues. Rental revenue decreased by $0.6 million or 2.0%, to $29.2 million for the year ended December 31, 2010 compared to $29.8 million for the year ended December 31, 2009. The decrease was primarily related to a scheduled expiration in June of 2009 of a significant lease (Conrail) at Two Commerce Square representing approximately 378,000 rentable square feet, offset by revenues from former subtenants or new tenants that are now direct tenants of the former Contrail space.
Tenant reimbursements. Tenant reimbursements decreased by $1.0 million, or 4.7%, to $20.2 million for the year ended December 31, 2010 compared to $21.2 million for the year ended December 31, 2009. The decrease was primarily related to a scheduled expiration in June 2009 of a significant lease (Conrail) at Two Commerce Square representing approximately 378,000 rentable square feet, offset by a decrease in refunds to tenants in 2010 as compared to 2009 related to their share of operating expenses.
Parking and other revenues. Parking and other revenues increased by $0.3 million, or 10.0%, to $3.3 million for the year ended December 31, 2010 from $3.0 million for the year ended December 31, 2009. The increase was primarily related to lease termination fees recognized at One Commerce Square.
Investment advisory, management, leasing and development services revenues. This caption represents revenues earned from services provided to unaffiliated entities in which we have no ownership interest. Revenues from these services decreased by $1.6 million, or 17.2%, from $9.3 million for the year ended December 31, 2009, to $7.7 million for the year ended December 31, 2010 primarily due to lower lease commission revenue of $1.6 million relative to the prior period. We also recognized $1.0 million less fee revenue from the Universal Village entitlement project. The decrease is partially offset by a fee we earned of $1.0 million in connection with the successful completion of the City National Plaza refinancing.
Investment advisory, management, leasing and development services revenues-unconsolidated real estate entities. This caption represents revenues earned from services provided to entities for which we use the equity method to account for our ownership interest since we have significant influence, but not control, over the entities. Revenues from these services from unconsolidated real estate entities increased by $1.5 million, or 10.0%, from $15.0 million for the year ended December 31, 2009 to $16.5 million for the year ended December 31, 2010, primarily due an increase in leasing activity resulting in an increase in lease commission revenue.
Reimbursement of property personnel costs. This caption represents the reimbursement for property personnel salary, payroll taxes and benefits. Reimbursement revenue increased by $0.2 million, or 3.6%, from $5.6 million for the year ended December 31, 2009, to $5.8 million for the year ended December 31, 2010, primarily due to increased bonus compensation in 2010.
Condominium sales. This caption represents the revenue recognized for Murano condominium units and parking spaces. The decrease of $15.2 million for the year ended December 31, 2010 compared to the year ended December 31, 2009 is due to the sale of 29 units in 2010 as compared to 75 units in 2009.
Total expenses. Total expenses decreased by $33.1 million, or 22.7%, to $113.0 million for the year ended December 31, 2010 compared to $146.1 million for the year ended December 31, 2009. The significant components of expense are discussed below.
Rental property operating and maintenance expense. Property operating and maintenance expenses decreased by $0.3 million, or 1.2% to $25.0 million for the year ended December 31, 2010 compared to $25.3 million for the year ended December 31, 2009. The decrease was primarily attributable to a decrease in contract cleaning expenses at Commerce Square.
Real estate taxes. Real estate taxes decreased by $0.3 million, or 4.2%, to $6.9 million for the year ended December
32
31, 2010, compared to $7.2 million for the year ended December 31, 2009, primarily due to 2009 special taxes associated with the Murano recorded in 2009 with no comparable expense in 2010, as well as a decrease in property tax expense related to a lower assessed value on our Four Points Centre office buildings.
Investment advisory, management, leasing and development services expenses. Expenses for these services increased by $0.3 million, or 2.5%, to $12.2 million for the year ended December 31, 2010, compared to $11.9 million for the year ended December 31, 2009, as a result of bad debt expense recognized in 2010.
Reimbursable property personnel costs. This caption represents the reimbursement of property personnel salary, payroll taxes and benefits. Reimbursable expenses increased by $0.2 million, or 3.6%, to $5.8 million for the year ended December 31, 2010, compared to $5.6 million for the year ended December 31, 2009, primarily due to increased bonus compensation in 2010.
Cost of condominium sales. The decrease of $15.5 million for the year ended December 31, 2010 compared to the year ended December 31, 2009 is due to fewer sales of 29 units in 2010 compared to 75 units in 2009.
Interest expense. Interest expense decreased by $7.7 million, or 28.6%, to $19.2 million for the year ended December 31, 2010 from $26.9 million for the year ended December 31, 2009. The decrease in interest expense is primarily attributable to the payoff of mezzanine debt at Two Commerce Square in December 2009, which resulted in a decrease of $8.8 million compared to the prior period. Interest expense also decreased at our Murano and Four Points Centre properties as a result of payments made which lowered the principal balances of the related mortgage loans.
Depreciation and amortization expense. Depreciation and amortization increased $1.5 million, or 11.9%, to $14.1 million for the year ended December 31, 2010 compared to $12.6 million for the year ended December 31, 2009. This increase was primarily attributable to assets associated with our Four Points Centre office buildings, which were placed in service in 2010, and by tenant improvements written off early at One Commerce Square.
General and administrative. General and administrative expense decreased by $2.9 million, or 17.0%, to $14.2 million for the year ended December 31, 2010 compared to $17.1 million for the year ended December 31, 2009. This was primarily due to a reduction in compensation expense as a result of cost saving measures.
Impairment Loss. We recognized an impairment charge related to our Murano condominium project whose units are held for sale of $4.5 million for the year ended December 31, 2010 compared to a $13.0 million impairment charge for the year ended December 31, 2009. We are required to record Murano at its estimated fair value as it meets the held for sale criteria of FASB ASC 360, “Property, Plant and Equipment”. The book carrying value of Murano, net of the impairment charges, is reflective of the Company's estimation of future absorption rates and sales prices, which are supported by a third party appraisal. If the actual absorption and sales prices are materially less than the projection, we could potentially need to record additional impairment in future periods.
Gain on sale of real estate. For the year ended December 31, 2009 we recognized a gain of $1.2 million related to the sale of a 1.9 acre land parcel adjacent to our Four Points development project. There was no corresponding gain recognized in the year ended December 31, 2010.
Gain from early extinguishment of debt. We repaid a loan from our former non-controlling partner in Campus El Segundo during 2009, resulting in the recognition of a gain on early extinguishment of debt of $0.5 million related to this loan in the year ended December 31, 2009. There was no corresponding gain recognized in the year ended December 31, 2010.
Interest income. Interest income decreased by $0.2 million, or 66.7% to $0.1 million for the year ended December 31, 2010 compared to $0.3 million for the year ended December 31, 2009. The decrease was primarily attributable to lower average cash balances combined with a decrease in interest rates earned.
Equity in net loss of unconsolidated real estate entities. Our share of the net loss of our unconsolidated real estate entities decreased by $15.0 million, or 92.6%, to a net loss of $1.2 million for the year ended December 31, 2010, compared to a net loss of $16.2 million for the year ended December 31, 2009. Set forth below is a summary of the combined financial information for the unconsolidated real estate entities, our share of net loss and our equity in net loss, after intercompany eliminations, for the years ended December 31, 2010 and 2009 (in thousands):
33
2010 | 2009 | ||||||
Revenue | $ | 316,881 | $ | 324,694 | |||
Expenses: | |||||||
Operating and other expenses | 162,190 | 166,575 | |||||
Interest expense | 108,445 | 104,105 | |||||
Depreciation and amortization | 111,677 | 120,129 | |||||
Impairment loss | — | 59,133 | |||||
Total expenses | 382,312 | 449,942 | |||||
Loss from continuing operations | (65,431 | ) | (125,248 | ) | |||
Gain on early extinguishment of debt | 11,794 | 67,017 | |||||
Impairment loss - unconsolidated real estate entities | — | (4,911 | ) | ||||
Loss from discontinued operations | — | (83 | ) | ||||
Net loss | $ | (53,637 | ) | $ | (63,225 | ) | |
Thomas Properties’ share of net loss | $ | (4,659 | ) | $ | (19,794 | ) | |
Intercompany eliminations | 3,475 | 3,558 | |||||
Equity in net loss of unconsolidated real estate entities | $ | (1,184 | ) | $ | (16,236 | ) | |
Net loss from unconsolidated real estate entities for the year ended December 31, 2010 compared to the year ended December 31, 2009 decreased primarily due to a decrease in impairment charges. In 2009, TPG/CalSTRS recorded an impairment charge of $4.9 million, of which our share was $1.2 million, for its investment in the Austin Joint Venture, which is accounted for by TPG/CalSTRS under the equity method. There was no corresponding impairment charge for the year ended December 31, 2010. Additionally, in 2009 impairment charges of $59.1 million related to certain consolidated properties were recorded by TPG/CalSTRS. Our 25% share of these impairment charges was as follows: Four Falls Corporate Center of $3.1 million; Walnut Hill Plaza of $1.4 million and Centerpointe I & II of $10.3 million. There were no impairment charges recorded for these properties for the year ended December 31, 2010. This variance was offset by a $55.2 million reduction in gain on early extinguishment of debt. The 2009 gain on early extinguishment of debt of $67.0 million was related to the Austin Joint Venture while the $11.8 million recorded in 2010 was attributable to City National Plaza, San Felipe Plaza, 2500 City West and Centerpointe I & II.
(Provision) benefit for income taxes. Provision for income taxes decreased by $1.1 million or 157.1%, to a benefit of $0.4 million for the year ended December 31, 2010 compared to a provision of $0.7 million for the year ended December 31, 2009. This change is attributable primarily to the current year reversal of $1.7 million in accrued interest relating to unrecognized tax benefits for which the statute of limitations period has lapsed.
Comparison of the year ended December 31, 2009 to the year ended December 31, 2008.
Total revenues. Total revenues decreased by $57.5 million, or 33.5%, to $114.1 million for the year ended December 31, 2009 compared to $171.6 million for the year ended December 31, 2008. The significant components of revenue are discussed below.
Rental revenues. Rental revenue decreased by $0.7 million, or 2.3% to $29.8 million for the year ended December 31, 2009 compared to $30.5 million for the year ended December 31, 2008. The decrease was primarily related to a scheduled expiration in June 2009 of a significant lease (Conrail) at Two Commerce Square representing approximately 378,000 rentable square feet. Approximately 91% of the space from the June 2009 Conrail lease expiration has been leased to former subtenants or new tenants at current market rates, which are lower than the expired lease rates.
Tenant reimbursements. Tenant reimbursements decreased by $4.7 million or 18.1% to $21.2 million for the year ended December 31, 2009 compared to $25.9 million for the year ended December 31, 2008. The decrease was primarily related to the scheduled expiration in June 2008 of the Conrail lease at Two Commerce Square. Approximately half or 378,000 rentable square feet expired in June 2008 and the remaining half expired in June 2009. This decrease in reimbursement revenue was offset by revenues from former subtenants that are now direct tenants or new tenants.
Parking and other revenues. Parking and other revenues decreased by $0.9 million or 23.1% to $3.0 million for the year ended December 31, 2009 compared to $3.9 million for the year ended December 31, 2008. The decrease was primarily related to a decrease in transient and monthly parking at Commerce Square.
Investment advisory, management, leasing and development services revenues. This caption represents revenues earned
34
from services provided to unaffiliated entities in which we have no ownership interest. Revenues from these services increased by $2.1 million, or 29.2%, to $9.3 million for the year ended December 31, 2009 compared to $7.2 million for the year ended December 31, 2008. The increase was primarily due to a new development services contract signed with Korean Air and increased leasing activity at our managed properties.
Investment advisory, management, leasing and development services revenues-unconsolidated real estate entities. This caption represents revenues earned from services provided to entities in which we use the equity method to account for our ownership interest since we have significant influence, but not control over the entities. Revenues from these services from unconsolidated real estate entities decreased by $3.3 million, or 18.0%, to $15.0 million for the year ended December 31, 2009 compared to $18.3 million for the year ended December 31, 2008. This decrease was primarily a result of a decrease in leasing commission revenue of $2.0 million and a decrease in development and construction management fee revenue of $1.1 million across the portfolio.
Reimbursement of property personnel costs. This caption represents the reimbursement for property personnel salary, payroll taxes and benefits. The decrease of $0.5 million or 8.2% to $5.6 million for the year ended December 31, 2009 compared to $6.1 million for the year ended December 31, 2008 was primarily a result of paying the 2008 property level bonuses during 2008 which resulted in two years of bonus payments, both 2007 and 2008, being included in 2008 but only one year of expense being included in 2009.
Condominium sales. This caption represents the revenue recognized for Murano condominium units and parking spaces which closed as of December 31, 2009. The decrease of $49.6 million or 62.2% was primarily the result of a reduction in sales volume. For the year ended December 31, 2009 we recognized revenue of $30.2 million, based on the sale of 75 units and 82 parking spaces. For the year ended December 31, 2008 we recognized revenue of $79.8 million, based on the sale of 125 units and 119 parking spaces. Up to and including the quarter ended June 30, 2009, we accounted for units and parking spaces under contract of sale based on the percentage of completion method of accounting.
Total expenses. Total expenses decreased by $31.6 million, or 17.8%, to $146.1 million for the year ended December 31, 2009 compared to $177.7 million for the year ended December 31, 2008. The significant components of expense are discussed below.
Rental property operating and maintenance expense. Rental property operating and maintenance expense remained consistent for each of the years ended December 31, 2009 and 2008.
Real estate taxes. Real estate taxes increased by $0.7 million or 10.8% to $7.2 million for the year ended December 31, 2009 compared to $6.5 million for the year ended December 31, 2008. The increase of $0.7 million was primarily the result of increased Philadelphia business taxes assessed on the sales proceeds of the Murano condominiums.
Investment advisory, management, leasing and development services expenses. These expenses decreased by $2.9 million, or 19.6%, to $11.9 million for the year ended December 31, 2009 as compared to $14.8 million for the year ended December 31, 2008, primarily due to a decrease in the use of consultants for system improvements and development services and a decrease in legal fees related to our formation of the Green Fund.
Reimbursable property personnel costs. This caption represents the reimbursement of property personnel salary, payroll taxes and benefits. The decrease of $0.5 million or 8.2% to $5.6 million for the year ended December 31, 2009 compared to $6.1 million for the year ended December 31, 2008 was primarily a result of paying the 2008 property level bonuses during 2008 which resulted in two years of bonus payments, both 2007 and 2008, being included in 2008 but only one year of expense being included in 2009.
Cost of condominium sales. The decrease of $35.9 million is due to reduced sales of units during 2009. For the year ended December 31, 2009, we recognized costs of $26.5 million, based on sales of 75 units and 82 parking spaces compared with $62.4 million for the year ended December 31, 2008, based on sales of 125 units and 119 parking spaces.
Interest expense. Interest expense increased by $4.1 million or 18.0% to $26.9 million for the year ended December 31, 2009 as compared to $22.8 million for the year ended December 31, 2008. The increase in interest expense is primarily attributable to $5.5 million in interest costs no longer being capitalized on Murano and our Four Points Centre office buildings due to the completion of development on these projects during the year ended December 31, 2008 offset primarily due to a decrease in interest expense relating to the Murano of approximately $1.6 million resulting from payments on of the construction loan.
Depreciation and amortization expense. Depreciation and amortization expense increased by $0.8 million or 6.8% to $12.6 million for the year ended December 31, 2009 compared to $11.8 million for the year ended December 31, 2008. The
35
increase is partially attributable to the purchase of 11% interests in One and Two Commerce Square during 2008. The increase is also attributable to the completion of construction and opening of the marketing center at Campus El Segundo during 2008.
General and administrative. General and administrative expenses increased by $0.3 million or 1.8% to $16.7 million for the year ended December 31, 2009 compared to $16.4 million for the year ended December 31, 2008. The increase is attributable to costs associated with the postponed equity offering during 2009.
Impairment Loss. We recognized an impairment charge related to our Murano condominium project whose units are complete and held for sale of $13.0 million for the year ended December 31, 2009 compared to an $11.0 million impairment charge for the year ended December 31, 2008. We are required to record Murano at its estimated fair value as it meets the held for sale criteria of FASB ASC 360, “Property, Plant and Equipment”. These non-cash impairment charges related to Murano are included in the “Impairment loss” line item in the consolidated statements of operations for the respective years. In addition, we recorded an impairment charge in accordance with the criteria of FASB ASC 323, “Investments-Equity Method and Joint Ventures” for our investment in the Austin Joint Venture, which is accounted for under the equity method, of $1.2 million for the year ended December 31, 2009 compared to a $1.2 million impairment charge for the year ended December 31, 2008. Additionally, we recorded impairment charges related to certain of our other properties accounted for using the equity method of accounting. Our 25 percent share of these impairment charges is as follows: Four Falls Corporate Center of $3.1 million; Walnut Hill Plaza of $1.4 million and Centerpointe I & II of $10.3 million. There were no impairment charges recorded for these properties for the year ended December 31, 2008. These non-cash impairment charges related to both our investment in the Austin Joint Venture and other properties accounted for using the equity method are included in the “Equity in net loss of unconsolidated real estate entities” line item in the consolidated statements of operations for the respective years.
As discussed in our critical accounting policies, the estimates of expected future net cash flows are inherently uncertain, and are based on assumptions dependent upon future and current market conditions and events that affect the ultimate value of the properties. These estimates can change significantly between reporting periods. Due to the fact that estimates included in cash flow models are based on historical results and projected trends, unexpected changes in market conditions may lead to additional impairment charges in the future that cannot be anticipated.
Our Oak Hill Plaza property failed the undiscounted cash flows test at December 31, 2009 using a limited holding period in the test due to uncertainty regarding the maturing debt due in March 2010. The estimated fair market value for Oak Hill Plaza exceeds the book carrying value, though, so there is no impairment loss.
Additionally , the book carrying value of our Murano project, net of the impairment charges recorded as of December 31, 2009, is reflective of the Company's estimation of future absorption rates and sales prices, which are supported by a third party appraisal. If the actual absorption and sales prices are materially less than the projection, we could potentially need to record additional impairment in future periods.
Gain on sale of real estate. Gain on sale of real estate decreased by $2.4 million, or 66.7%, to $1.2 million for the year ended December 31, 2009 compared to $3.6 million for the year ended December 31, 2008. For the year ended December 31, 2009 we recognized a gain of $1.2 million related to the sale of a 1.9 acre land parcel adjacent to our Four Points Centre development project. For the year ended December 31, 2008 we recognized a previously deferred gain of $3.6 million related to the sale of a parcel of land at our Campus El Segundo development project. A 14.1 acre parcel at Campus El Segundo was sold in 2006 for $24.6 million resulting in a total gain of $18.4 million. We were obligated to fund certain infrastructure improvements of approximately $2.7 million with respect to the development of the sold parcel. The remaining deferred gain was recognized upon completion of the remaining infrastructure improvements during the year ended December 31, 2008.
Interest income. Interest income decreased by $2.5 million, or 89.3%, to $0.3 million for the year ended December 31, 2009 compared to $2.8 million for the year ended December 31, 2008, due to declining investment balances and lower interest rates.
Equity in net loss of unconsolidated real estate entities. Equity in net loss of unconsolidated real estate entities increased by $3.4 million, or 26.6%, to a net loss of $16.2 million for the year ended December 31, 2009 compared to a net loss of $12.8 million for the year ended December 31, 2008. Set forth below is a summary of the combined financial information for the unconsolidated real estate entities and our share of net loss and equity in net loss for the years ended December 31, 2009 and 2008 (in thousands):
36
2009 | 2008 | |||||
Revenue | $ | 324,694 | $ | 322,553 | ||
Expenses: | ||||||
Operating and other expenses | 166,575 | 170,019 | ||||
Interest expense | 104,105 | 126,386 | ||||
Depreciation and amortization | 120,129 | 125,565 | ||||
Impairment loss | 59,133 | — | ||||
Total expenses | 449,942 | 421,970 | ||||
Loss from continuing operations | (125,248 | ) | (99,417 | ) | ||
Gain on early extinguishment of debt | 67,017 | — | ||||
Impairment loss - unconsolidated real estate entities | (4,911 | ) | (4,840 | ) | ||
Loss from discontinued operations | (83 | ) | (104 | ) | ||
Net loss | $ | (63,225 | ) | $ | (104,361 | ) |
Thomas Properties' share of net loss | $ | (19,794 | ) | $ | (16,168 | ) |
Intercompany eliminations | 3,558 | 3,340 | ||||
Equity in net loss of unconsolidated real estate entities | $ | (16,236 | ) | $ | (12,828 | ) |
Net loss from unconsolidated real estate entities for the year ended December 31, 2009 compared to the year ended December 31, 2008 decreased, primarily due to the gain of $67.0 million from the extinguishment of debt in the Austin Portfolio Joint Venture and decreased interest expense resulting from lower interest rates on floating rate debt, offset by impairment charges recognized during 2009 on Four Falls Corporate Center of $12.4 million, Walnut Hill Plaza of $5.4 million, and Centerpointe I & II of $41.3 million.
(Provision) benefit for income taxes. Provision for income taxes decreased by $2.6 million, or 136.8%, to a provision of $0.7 million for the year ended December 31, 2009 compared to a benefit of $1.9 million for the year ended December 31, 2008. This change is attributable primarily to the Company recording a valuation allowance of $7.4 million in 2009.
Liquidity and Capital Resources
Analysis of liquidity and capital resources
As of December 31, 2010, we have unrestricted cash and cash equivalents of $42.4 million. We believe that we will have sufficient capital to satisfy our liquidity needs over the next 12 months through working capital. We expect to meet our long-term liquidity requirements, including debt service, property acquisitions and additional future development and redevelopment activity, through cash flow from operations, additional secured and unsecured long-term borrowings, dispositions of non-strategic assets, and the potential issuance of additional debt, or common or preferred equity securities, including convertible securities. During the year ended December 31, 2010, we sold 4.3 million shares of common stock at prices ranging from $3.67 to $5.03 per share in our “at-the-market” equity offering program. These sales resulted in net proceeds of $15.5 million, which are being used for general corporate purposes.
Assuming the exercise of extension options available to us, there is no debt maturing in our portfolio until 2012. With respect to debt maturing in 2012 and thereafter, we will seek to refinance this debt at maturity or retire it through the issuance of securities, as market conditions permit. There can be no assurances that such debt refinancing will be available at the time of such maturities on acceptable terms, if at all, and our cost of capital could increase as a result of any such debt refinancing. If we are unable to obtain debt refinancing for properties in which we own an interest at maturity, we may lose some or all of our equity interests in such properties. Additionally, existing stockholders could experience substantial dilution in the event we are required to issue additional equity capital.
As indicated in the table below under the caption "Contractual Obligations," upon exercise of extension options, we have $2.0 million of scheduled principal payments on consolidated debt remaining in 2011 and $2.2 million in 2012. We believe that we have sufficient capital to satisfy these payments. See "Contractual Obligations" and the corresponding notes to the table thereunder for further detail. With respect to the debt owed by our unconsolidated real estate entities, upon exercise of extension options, there are no remaining maturity dates in 2011 and no additional principal payments due in 2011. See "Off-Balance Sheet Arrangements - Indebtedness of Unconsolidated Real Estate Entities."
On March 6, 2010, an aggregate of $96.5 million in mortgage loans owed by subsidiaries of TPG/CalSTRS (the
37
“borrowers”) on unconsolidated properties at Four Falls Corporate Center, Oak Hill Plaza and Walnut Hill Plaza matured and became due in full. The borrowers elected not to make payment on these loans and they are currently in default. These loans are non-recourse to the borrowers and the Company, both of which do not anticipate making any payments or equity contributions to support the repayment or refinancing of these loans. The borrowers are currently in discussions with the special servicer regarding a cooperative resolution on each of these assets including the likely appointment of a receiver and the judicial transfer of the properties. We do not believe that the loss of our equity interests in these properties will have a material effect on our business or results of operations.
As of December 31, 2010, we have unfunded capital commitments to (1) our joint venture with CalSTRS of $13.9 million; and (2) the Thomas High Performance Green Fund (the “Green Fund”) of $50.0 million. With respect to our joint venture with CalSTRS, we are not obligated to fund our share of the capital commitment for the acquisition of any new project, but we are obligated to fund tenant improvements and other capital improvements for projects that were acquired prior to June 1, 2007. We estimate we will fund $3.8 million between 2011 and 2014 to cover our share of contractual obligations existing at December 31, 2010 for capital improvements, tenant improvements and leasing commissions. Our requirement to fund all or a portion of our commitments to the Green Fund is subject to our identifying properties to acquire at our discretion. Our cash requirements for the Green Fund could be reduced by contributions by us to the fund of assets in which we have an interest. The Green Fund's original investment period expired in December 2010, which we extended together with an institutional investor to December 2011. CalSTRS is no longer a partner in the Green Fund.
In December 2009, our board of directors suspended its quarterly dividends to common stockholders. The availability of funds to pay dividends is impacted by property-level restrictions on cash flows. With respect to our joint venture properties, we do not solely control decision making with respect to these properties, and may not be able to obtain monies from these properties even if funds are available for distribution to us. In addition, we may enter future financing arrangements that contain restrictions on our use of cash generated from our properties. The payment of cash dividends in the future, if any, will be at the discretion of our board of directors and will depend upon such factors as earnings levels, capital requirements, our overall financial condition, and any other factors deemed relevant by our board of directors.
Development and Redevelopment Projects
We own interests in four development projects, and our joint venture with CalSTRS includes one redevelopment property and two development sites.
We anticipate seeking to mitigate our development risk on all of our development projects by obtaining significant pre-leasing and guaranteed maximum cost construction contracts. There can be no assurance we will be able to successfully implement these risk mitigation measures.
We completed construction of the Murano, a 302-unit high-rise residential condominium project in downtown Philadelphia in September 2008. We have closed sales on 220 units as of December 31, 2010. We recorded a $4.5 million non-cash impairment charge for the year ended December 31, 2010 on the Murano based on our estimation of future absorption and sales prices. During the year ended December 31, 2010, we entered into contracts for 24 units and 24 parking spaces, had no forfeitures and recognized a gain on sale of approximately $4.0 million. Murano is classified as condominium units held for sale on our balance sheet.
The amount and timing of costs associated with our development and redevelopment projects is inherently uncertain due to market and economic conditions. We presently intend to fund development and redevelopment expenditures primarily through construction or refurbishment financing.
• | Construction of the Murano was financed in part with a construction loan up to $142.5 million. Repayment of this loan is being made with proceeds from the sales of condominium units. The loan has a balance of $22.2 million as of December 31, 2010. On July 26, 2010, the Company extended the Murano construction loan with the lender, for one year to July 31, 2011, with the right to two six-month extensions. The loan will bear interest at the greater of 9.5% or three month LIBOR plus 3.25%. We have no guarantees on this debt other than the payment of interest through the maturity date. Both six-month extensions require payment of an extension fee equal to 1% of the unpaid principal balance as of July 1, 2011 and January 1, 2012, respectively. The first six-month extension is also subject to a “loan exposure” measurement whereby the outstanding principal balance of the loan divided by saleable square footage of the units yet to settle shall be no greater than $150 per saleable square foot. If the loan exposure measurement is not met, then the borrower must make a payment to achieve the $150 per saleable square foot requirement to qualify for the extension. If the rebalancing had been done as of December 31, 2010 based on the number of units yet to settle as of December 31, 2010, the loan balance would need to be reduced from $22.2 million to $15.6 million to meet the loan exposure limitation. |
• | The completed core and shell construction of two office buildings at our development site at Four Points Centre was financed in part with a construction loan, which has an outstanding balance as of December 31, 2010 of $23.7 million with additional borrowing capacity of $9.0 million to fund tenant improvements and other project costs. The Four |
38
Points Centre construction loan has a maturity date of July 31, 2012 with two one-year extension options subject to certain conditions. We paid down the principal amount of the loan by $3.9 million during the year ended December 31, 2010. The interest rate on the loan is LIBOR plus 3.5% per annum. Additionally, we have guaranteed 46.5% of the balance of the outstanding principal, interest and any other sum payable under this loan, which results in a maximum guarantee amount of $11.0 million. We also provided collateral of approximately 62.4 acres of fully entitled unimproved land, which is immediately adjacent to our Four Points Centre office buildings. As of May 31, 2011, if the Four Points Centre office buildings are not at least 65% leased on terms consistent with the appraisal pro forma, we must pre-fund 18 months of interest into a restricted cash account with the lender; if the buildings are less than 35% leased at that time, we will also have to pay $2.0 million as a principal reduction of the loan.
• | We have a mortgage loan on our Campus El Segundo project in the amount of $17.0 million. Presently, we have not obtained construction financing for this development project. |
If we finance development projects through construction loans and are unable to obtain permanent financing on advantageous terms or at all, we would need to fund these obligations from cash flow from operations or seek alternative capital sources. If unsuccessful, this could adversely impact our financial condition and results of operations and impair our ability to satisfy our debt service obligations. If we are successful in obtaining construction or refurbishment financing and permanent financing, we anticipate that the corresponding interest costs would represent both a significant use of our cash flow and a material component of our results of operations.
We are also involved in managing the following three entitlement projects:
• | We are entitling approximately 14.4 acres in Los Angeles, California, for office, production facility, residential and retail uses. The project, called Metro Studio@Lankershim, will include up to approximately 1.5 million square feet. Upon completion of entitlements, we expect to enter into a long-term ground lease with the Los Angeles County Metropolitan Transportation Authority, which owns the land, depending on NBCU's space requirements for the project. |
• | Under our contract with NBCU for the Universal Studios Hollywood backlot entitlement, we have a right of first offer (ROFO) to develop approximately 124 acres for residential and related retail and community-serving uses. We are pursuing environmental clearance and governmental approvals for approximately 2,900 residential units and 180,000 square feet of retail and community-serving space. Upon successful completion of the entitlement process and our exercise of the ROFO, it is anticipated this project will be developed in phases over several years, subject to market conditions. |
• | Korean Air, a subsidiary of Hanjin Group, has retained us as fee developer for the entitlement, design and redevelopment of the 2.7 acre Wilshire Grand property in downtown Los Angeles. The Wilshire Grand project envisions the development of two buildings, one approximately 65 stories and the other approximately 45 stories, to include approximately 1.5 million square feet of office, 560 hotel rooms, and up to 100 residential condominiums, with supporting retail and restaurant uses, for a total project size of up to approximately 2.5 million gross square feet. |
Leasing, Tenant Improvement and Capital Needs
In addition to our development and redevelopment projects, our One Commerce Square and Two Commerce Square properties require capital maintenance and expenditures for leasing commissions and tenant improvement costs. The level of these expenditures varies from year to year based on several factors, including lease expirations. We are contractually committed to incur expenditures of approximately $3.2 million in capital improvements, tenant improvements, and leasing commissions for the One Commerce Square and Two Commerce Square properties, collectively, during 2011 through 2013. Additionally, we expect to expend additional amounts in connection with a value-enhancement program at Commerce Square. The funding for both the $3.2 million of existing commitments and future expenditures under the value-enhancement program are discussed in the paragraph below.
During November 2010, subsidiaries of TPG and Brandywine entered into two partnerships with respect to our One Commerce Square and Two Commerce Square properties. Brandywine contributed capital of $5 million at closing with the balance to be contributed by December 31, 2012, totaling $25 million of preferred equity in return for a 25% limited partnership interest in each property. The preferred equity will be invested in a value-enhancement program designed to increase rental rates and occupancy at Commerce Square.
Annual capital expenditures may fluctuate in response to the nature, extent and timing of improvements required to maintain our properties. Tenant improvements and leasing costs may also fluctuate depending upon other factors, including the type of property involved, the existing tenant base, terms of leases, types of leases, the involvement of leasing agents and overall market conditions.
39
Contractual Obligations
A summary of our contractual obligations at December 31, 2010 is as follows (in thousands):
2011 | 2012 | 2013 | 2014 | 2015 | Thereafter | Total | |||||||||||||||||||||
Regularly scheduled principal payments (1) | $ | 1,971 | $ | 2,160 | $ | 1,946 | $ | 1,884 | $ | 1,996 | $ | — | $ | 9,957 | |||||||||||||
Balloon payments due at maturity (1)(2)(3) | 39,237 | 23,687 | 106,446 | — | — | 121,209 | 290,579 | ||||||||||||||||||||
Interest payments—fixed rate debt (4) | 14,290 | 14,205 | 10,055 | 7,135 | 7,024 | 591 | 53,300 | ||||||||||||||||||||
Interest payments—variable rate debt (4) | — | — | — | — | — | — | — | ||||||||||||||||||||
Capital commitments (5) | 6,919 | 58 | — | 21 | — | — | 6,998 | ||||||||||||||||||||
Operating lease (6) | 310 | 322 | 335 | 122 | — | — | 1,089 | ||||||||||||||||||||
Obligations associated with uncertain tax positions (7) | — | — | — | — | — | — | — | ||||||||||||||||||||
Total | $ | 62,727 | $ | 40,432 | $ | 118,782 | $ | 9,162 | $ | 9,020 | $ | 121,800 | $ | 361,923 | |||||||||||||
_________________________
(1) Included within these balloon payments are amounts due under the Four Points Centre construction loan, which matures on July 31, 2012 with two one-year extension options subject to certain conditions. We have provided a guarantee for a portion of principal and interest payable. We have also provided collateral of approximately 62.4 acres of fully entitled unimproved land, which is immediately adjacent to our Four Points Centre office buildings. We paid down the principal amount of the loan by $3.9 million during the year ended December 31, 2010. The loan has an unfunded balance of $9.0 million which is available to fund any remaining project costs. The interest rate on the loan is LIBOR plus 3.50% per annum. The balance of the loan as of December 31, 2010 was $23.7 million.
(2) The Murano construction loan has a balance of $22.2 million as of December 31, 2010. On July 26, 2010, the Company extended the loan with the lender for one year to July 31, 2011, with the right to two six-month extensions. The loan will bear interest at the greater of 9.5% or three month LIBOR plus 3.25%. This loan is nonrecourse to the Company, but the Company guarantees the payment of interest during the term of the loan. We amortize the principal balance of the loan with approximately 93% of the sales proceeds as we close on the sale of condominium units.
(3) The Campus El Segundo mortgage loan has a balance of $17.0 million as of December 31, 2010. The loan is scheduled to mature on July 31, 2011 with three one-year extension options, at our election, subject to us complying with certain covenants, with a final maturity date of July 31, 2014 if all extension options are exercised. The interest rate as of December 31, 2010 was 4.1% per annum. We have guaranteed 100% of the principal, interest and any other sum payable under this loan. We have agreed to certain financial covenants on this loan as the guarantor, which we were in compliance with as of December 31, 2010.
(4) As of December 31, 2010, 79.1% of our debt was at contractually fixed rates. The information in the table above reflects our projected interest obligations for the fixed-rate payments based on the contractual interest rates and scheduled maturity dates. The remaining 20.9% of our debt bears interest at variable rates based on LIBOR plus a spread that ranges from 3.25% to 3.75%. The interest payments on the variable rate debt have not been reported in the table above because we cannot reasonably determine the future interest obligations on our variable rate debt as we cannot predict what LIBOR rates will be in the future. As of December 31, 2010, one-month LIBOR was 0.26%.
(5) Capital commitments of our Company and consolidated subsidiaries include approximately $3.2 million of tenant improvements and leasing commissions for certain tenants in One Commerce Square and Two Commerce Square. We have an unfunded capital commitment of $13.9 million to our TPG/CalSTRS joint venture, of which we estimate we will fund $3.7 million in 2011 for contractual obligations existing as of December 31, 2010. We are not obligated to fund our share for the acquisition of any new project, but we are obligated to fund tenant improvements and other capital improvements for projects that were acquired prior to June 1, 2007.
(6) Represents the future minimum lease payments on our operating lease for our corporate office at City National Plaza, which expires in May 2014. The table does not reflect available extension options.
(7) The obligations associated with uncertain tax positions under FASB ASC 740 in the table above should represent amounts associated with uncertain tax positions related to temporary differences. However, reasonable estimates cannot be made about the amount and timing of payment, if any, for these obligations. As of December 31, 2010, $13.4 million of unrecognized tax benefits have been recorded as liabilities in accordance with FASB ASC 740, and we are uncertain as
40
to if and when such amounts may be settled. Additionally, as of December 31, 2010, there is $1.0 million of accrued interest recorded with respect to such unrecognized tax benefits. We have not recorded any penalties with respect to unrecognized tax benefits.
Off-Balance Sheet Arrangements—Indebtedness of Unconsolidated Real Estate Entities
As of December 31, 2010, our Company had investments in entities owning unconsolidated properties with stated ownership percentages ranging from 6.25% to 50.0%. We account for these investments using the equity method of accounting.
The table below summarizes the outstanding debt for these properties as of December 31, 2010 (in thousands). None of these loans are recourse to us other than as noted in footnote 8 below. Some of the loans listed in the table below subject TPG/CalSTRS to customary non-recourse carve out obligations.
Interest Rate at December 31, 2010 | Principal Amount | Maturity Date | Maturity Date at End of Extension Options | |||||||||
City National Plaza (1) | ||||||||||||
Mortgage loan | 5.90 | % | $ | 350,000 | 7/1/2020 | 7/1/2020 | ||||||
Note payable to former partner (2) | 5.75 | % | 19,758 | 7/1/2012 | 1/4/2016 | |||||||
CityWestPlace | ||||||||||||
Fixed | 6.16 | % | 121,000 | 7/6/2016 | 7/6/2016 | |||||||
Floating (3)(4) | 5.03 | % | 95,000 | 3/5/2020 | 3/5/2020 | |||||||
San Felipe Plaza | ||||||||||||
Mortgage loan (5) | 4.78 | % | 110,000 | 12/1/2018 | 12/1/2018 | |||||||
2500 City West | ||||||||||||
Mortgage loan (6) | 5.53 | % | 65,000 | 12/5/2019 | 12/5/2019 | |||||||
Brookhollow Central I, II and III | ||||||||||||
Mortgage loan (3) (7) | LIBOR | + | 2.63 | % | 37,250 | 7/21/2013 | 7/21/2015 | |||||
2121 Market Street mortgage loan (8) | 6.05 | % | 18,169 | 8/1/2033 | 8/1/2033 | |||||||
Reflections I mortgage loan | 5.23 | % | 21,387 | 4/1/2015 | 4/1/2015 | |||||||
Reflections II mortgage loan | 5.22 | % | 8,910 | 4/1/2015 | 4/1/2015 | |||||||
Centerpointe I & II (9) | ||||||||||||
Senior mortgage loan (3) | LIBOR | + | 0.60 | % | 55,000 | 2/9/2012 | 2/9/2012 | |||||
Mezzanine loan-Note C (3) | LIBOR | + | 3.26 | % | 22,162 | 2/9/2012 | 2/9/2013 | |||||
Fair Oaks Plaza | 5.52 | % | 44,300 | 2/9/2017 | 2/9/2017 | |||||||
Austin Portfolio Joint Venture Properties: | ||||||||||||
San Jacinto Center | ||||||||||||
Mortgage loan-Note A | 6.05 | % | 43,000 | 6/11/2017 | 6/11/2017 | |||||||
Mortgage loan-Note B | 6.05 | % | 58,000 | 6/11/2017 | 6/11/2017 | |||||||
Frost Bank Tower | ||||||||||||
Mortgage loan-Note A | 6.06 | % | 61,300 | 6/11/2017 | 6/11/2017 | |||||||
Mortgage loan-Note B | 6.06 | % | 88,700 | 6/11/2017 | 6/11/2017 | |||||||
One Congress Plaza | ||||||||||||
Mortgage loan-Note A | 6.08 | % | 57,000 | 6/11/2017 | 6/11/2017 | |||||||
Mortgage loan-Note B | 6.08 | % | 71,000 | 6/11/2017 | 6/11/2017 | |||||||
One American Center | ||||||||||||
Mortgage loan-Note A | 6.03 | % | 50,900 | 6/11/2017 | 6/11/2017 | |||||||
Mortgage loan-Note B | 6.03 | % | 69,100 | 6/11/2017 | 6/11/2017 | |||||||
300 West 6th Street | 6.01 | % | 127,000 | 6/11/2017 | 6/11/2017 | |||||||
Research Park Plaza I & II | ||||||||||||
Senior mortgage loan (3)(10) | LIBOR | + | 0.55 | % | 23,560 | 6/9/2011 | 6/9/2012 | |||||
Mezzanine loan (3)(10) | LIBOR | + | 2.01 | % | 27,940 | 6/9/2011 | 6/9/2012 | |||||
41
Interest Rate at December 31, 2010 | Principal Amount | Maturity Date | Maturity Date at End of Extension Options | |||||||||
Stonebridge Plaza II | ||||||||||||
Senior mortgage loan (3)(10) | LIBOR | + | 0.63 | % | 19,800 | 6/9/2011 | 6/9/2012 | |||||
Mezzanine loan (3)(10) | LIBOR | + | 1.76 | % | 17,700 | 6/9/2011 | 6/9/2012 | |||||
Austin Portfolio Bank Term Loan (10)(11) | LIBOR | + | 3.25 | % | 119,877 | 6/1/2013 | 6/1/2014 | |||||
Austin Senior Secured Priority Facility (12) | 10% to 20% | 38,746 | 6/1/2012 | 6/1/2012 | ||||||||
Total outstanding debt of unconsolidated properties, excluding loans subject to special servicer oversight | $ | 1,841,559 | ||||||||||
Loans on properties subject to special servicer oversight (13): | ||||||||||||
Four Falls Corporate Center | ||||||||||||
Mortgage loan-Note A | 5.31 | % | $ | 42,200 | 3/6/2010 | 3/6/2010 | ||||||
Mortgage loan-Note B (14)(15) | LIBOR | + | 3.25 | % | 9,867 | 3/6/2010 | 3/6/2010 | |||||
Oak Hill Plaza/Walnut Hill Plaza | ||||||||||||
Mortgage loan-Note A | 5.31 | % | 35,300 | 3/6/2010 | 3/6/2010 | |||||||
Mortgage loan-Note B (14)(16) | LIBOR | + | 3.25 | % | 9,152 | 3/6/2010 | 3/6/2010 | |||||
Total outstanding debt of unconsolidated properties subject to special servicer oversight | $ | 96,519 | ||||||||||
Total outstanding debt of all unconsolidated properties | $ | 1,938,078 | ||||||||||
The 30 day LIBOR rate for the loans above was 0.26% at December 31, 2010, except for the Austin Bank Term Loan (see footnotes 10 and 11).
_________________________
(1) During the first quarter of 2010, CalSTRS, our partner in City National Plaza ("CNP"), acquired all of the property's mezzanine debt. On July 6, 2010, CalSTRS contributed this debt to the equity in TPG/CalSTRS, reducing the leverage on CNP by the full $219.1 million balance on the mezzanine loans. Solely with respect to the interest of TPG/CalSTRS in CNP, CalSTRS' percentage interest increased from 75% to 92.1% and TPG's percentage interest decreased from 25% to 7.9%. We are in discussions with CalSTRS to obtain an option to participate in up to an additional 17.1% interest in CNP acquired by CalSTRS through TPG/CalSTRS. On July 6, 2010, a subsidiary of TPG/CalSTRS that owns CNP entered into a new non-recourse first mortgage loan in the amount of $350.0 million. The loan bears interest at a fixed rate of 5.9% and is for a term of ten years, to mature on July 1, 2020.
(2) During the second quarter of 2009, TPG/CalSTRS redeemed a 15% membership interest held by a noncontrolling owner in the CNP partnership. The redemption price of $19.8 million was financed with a promissory note issued by the former partner and due in 2012. The former partner may extend the maturity date to January 4, 2016 with respect to $0.5 million or more of the principal amount of this promissory note.
(3) The partnership that owns each property has purchased interest rate cap agreements for the funded portion of these loans.
(4) On October 12, 2010, a subsidiary of TPG/CalSTRS that owns CityWestPlace Buildings III and IV closed a new non-recourse first mortgage loan in the amount of $95 million. The loan bears interest at a fixed rate of 5.03% and will mature in March 2020. It replaces a floating rate loan in the amount of $92.4 million, which was scheduled to mature in July 2011.
(5) On July 21, 2010, a subsidiary of TPG/CalSTRS that owns San Felipe Plaza entered into a new mortgage loan in the amount of $110.0 million. The loan bears interest at a fixed rate of 4.8% and is for a term of 8.3 years, to mature in December 2018. This loan replaces the prior $117.7 million mortgage loans, which were retired for $116.0 million pursuant to a discounted payoff agreement.
(6) On July 21, 2010, a subsidiary of TPG/CalSTRS that owns 2500 City West entered into a new mortgage loan in the amount of $65.0 million. The loan bears interest at a fixed rate of 5.5% and is for a term of 9.3 years, to mature in December 2019. This mortgage loan replaces the prior $84.1 million mortgage loans, which were retired for $81.0 million pursuant to a discounted payoff agreement.
(7) On July 21, 2010, a subsidiary of TPG/CalSTRS that owns Brookhollow Central entered into a new mortgage loan in the amount of $55.0 million. At closing, $37.0 million of the loan was funded, with an additional $3.0 million to be funded over three years and $15.0 million available for future funding of construction costs related to the redevelopment of Brookhollow Central I. The loan bears interest at LIBOR plus 2.6% and is for a three-year term plus two one-year extensions, subject to certain conditions, to mature upon final extension in July 2015. The new mortgage loan replaces the prior loans of $48.9 million.
42
(8) The 2121 Market Street mortgage loan is prepayable without penalty after May 1, 2013, at which date the outstanding principal amount of this loan will be approximately $17.2 million. The interest rate will increase to the greater of 8.1% or the treasury rate plus 2.0% on August 1, 2013. Any amounts over the initial interest rate may be deferred to the extent excess cash is not available to make such payments. Provided there is no deferred interest, the loan balance will be fully amortized on August 1, 2033, the maturity date of the loan. The loan is guaranteed by our Operating Partnership and our co-general partner in the partnership that owns 2121 Market Street, up to a maximum amount of $3.3 million.
(9) On October 19, 2010, TPG/CalSTRS restructured the debt and equity capital in our Centerpointe partnership by acquiring the mezzanine A and B notes for approximately $40 million, at a discount to par of approximately $6.6 million or 14%. In addition, the mezzanine C loan was modified to provide us with the right to prepay the loan equal to a 50% discount on the principal plus a participation feature for the lender. The mezzanine C loan was also extended through February 9, 2012 with one additional year of extension available up to February 9, 2013. CalSTRS and TPG, which contributed 95% and 5%, respectively, of the $40 million, created a new class of equity in the Centerpointe partnership in the amount of $46.6 million (the “preferred equity”), which has a priority on distributions of available project cash and capital proceeds. After February 9, 2012, TPG may be required, at the election of CalSTRS, to increase its interest in the preferred equity to 25%, and commensurately reduce CalSTRS' interest to 75%, by contributing an amount equal to approximately $9.3 million.
(10) These loans have a one-year extension option at our election.
(11) The margin above LIBOR on the bank term loan is subject to adjustment under certain circumstances. The term loan is secured by mortgages on three of the Austin Portfolio Joint Venture properties and a pledge of equity interests in the remaining seven Austin Portfolio Joint Venture properties. These mortgage liens and equity pledges also secure the Austin senior secured priority facility, which has a priority right to repayment ahead of the Austin Portfolio Bank Term Loan.
(12) During 2009, the Austin Portfolio Joint Venture entered into agreements pursuant to which (i) an existing $100 million revolving loan was terminated, (ii) a senior secured priority facility of $60 million was established which a subsidiary of TPG/CalSTRS agreed to fund 25% on a pari passu basis with the partners in the Austin Portfolio Joint Venture, and (iii) the venture purchased and retired $80 million of the Austin Portfolio bank term loan at a discount to face value, reducing that loan from $192.5 million to $112.5 million. The new $60 million Austin senior secured priority facility, which has a priority right to repayment ahead of the Austin Portfolio Bank Term Loan, is senior in payment and right to the collateral to the Austin Portfolio Bank Term Loan. The Austin senior secured priority facility bears interest at 10% per annum on the first $24 million, 15% per annum on the next $12 million and 20% per annum on the last $24 million.
(13) Subsidiaries of TPG/CalSTRS (the “borrowers”) elected not to repay the loans by the maturity date of March 6, 2010 and therefore, the loans are in default. We are in discussions with the special servicer regarding a cooperative resolution on each of these assets, including the likely appointment of a receiver and the judicial transfer of the properties. Pending a resolution of these loan defaults, we expect that we will continue to manage the properties pursuant to our management agreement with the borrowers. The management and leasing agreements expired on March 1, 2010, and are automatically renewed for successive periods of one year each, unless we elect not to renew the agreements. Due to the maturity date default, the lender has the authority to terminate us as the property manager. If the borrowers are unable to extend or refinance these loans, the lender could repossess the properties through foreclosure, which would result in a loss of fee revenue for us, which was $0.7 million for the year ended December 31, 2010. The borrowers are accruing interest on these loans at a default rate, which ranges from 10.3% to 10.5% per annum beginning on the maturity date of March 6, 2010.
(14) These loans are subject to exit fees equal to 1% of the loan amounts; however, under certain circumstances the exit fees will be waived. These loans bear interest at the greater of the one month LIBOR or 2.25% per annum, plus the applicable margin. Due to the maturity date default discussed in note 12 above, the borrower is accruing interest at a default rate, which ranges from 10.3% to 10.5% per annum beginning on the maturity date of March 6, 2010.
(15) This loan is secured by both a subordinate lien on the property and a payment guaranty issued by the special purpose entity which owns Oak Hill Plaza/Walnut Hill Plaza.
(16) This loan is secured by both a subordinate lien on the property and a payment guaranty issued by the special purpose entity which owns Four Falls Corporate Center.
Cash Flows
Comparison of year ended December 31, 2010 to year ended December 31, 2009
Cash and cash equivalents were $42.4 million as of December 31, 2010 and $35.9 million as of December 31, 2009.
Operating Activities-Net cash used in operating activities was $0.5 million for the year ended December 31, 2010, which
43
represented a decrease of $6.4 million from the net cash used in operations of $6.9 million for the year ended December 31, 2009. The decrease was primarily the result of a decrease of $19.4 million in the net loss.
Investing Activities-Net cash provided by investing activities decreased by $15.9 million to $6.6 million provided by investing activities for the year ended December 31, 2010 compared to $22.5 million provided by investing activities for the year ended December 31, 2009. The decrease was primarily the result of fewer proceeds from the sale of Murano condominium units of $24.5 million offset by lower expenditures for real estate improvements of $13.5 million.
Financing Activities-Net cash provided by financing activities increased by $49.0 million to $0.4 million for the year ended December 31, 2010 compared to $48.6 million utilized in financing activities for the year ended December 31, 2009. The increase was primarily the result of a reduction of principal payments on mortgages and other secured loans of $51.3 million. The reduced payments result from (1) lower payments on the Murano loan of $22.4 million due to fewer unit settlements in 2010, (2) the payoff of an unsecured loan related to our Campus El Segundo project of $3.4 million in 2009 (there were no loan payments in 2010 on this project), and (3) a decrease in payments of $25.0 million on Two Commerce Square as a result of the mezzanine loan payoff in 2009. The increase was offset by a decrease of $7.6 million related to proceeds from mortgages and other secured loans. In 2009, we received draws from the Murano construction loan of $6.9 million to fund the completion of the project with no corresponding draws in 2010, and we received draws from our Four Points Centre construction loan of $1.2 million to fund tenant improvement and related costs. In 2010, we had similar loan draws for Four Points totaling $0.4 million. Additionally, we received net proceeds of $15.3 million from our "at-the-market" equity offering program in 2010 whereas we received net proceeds of $13.1 million from a registered direct equity offering in 2009. Finally, we received $5.0 million from Brandywine as a capital contribution to Commerce Square in 2010, which is reflected in the "Noncontrolling Interest Contributions" caption in the consolidated statements of cash flows.
Comparison of year ended December 31, 2009 to year ended December 31, 2008
Cash and cash equivalents were $35.9 million as of December 31, 2009 and $69.0 million as of December 31, 2008.
Operating Activities-Net cash used in operating activities was $6.9 million for the year ended December 31, 2009, which represented a decrease of $9.1 million from the net cash provided by operations of $2.2 million for the year ended December 31, 2008. The decrease was primarily the result of an increase in net loss of $25.1 million attributable to the Company.
Investing Activities-Net cash used in investing activities decreased by $58.0 million to $22.5 million provided by investing activities for the year ended December 31, 2009 compared to $35.5 million utilized in investing activities for the year ended December 31, 2008. The increase was primarily the result of a decrease in expenditures for real estate improvements of $86.2 million offset by lower proceeds from the sale of Murano condominiums of $30.8 million
Financing Activities-Net cash used in financing activities increased by $24.3 million to $48.6 million for the year ended December 31, 2009 compared to $24.3 million used in financing activities for the year ended December 31, 2008. The increase was primarily the result of a reduction of proceeds from mortgage and other secured loans of $67.0 million. The increase was offset by a decrease of $19.6 million related to principal payments of mortgage and other secured loans, $13.1 million in proceeds from a registered direct equity offering during the year ended December 31, 2009 and a decrease of $5.6 million related to the payment of dividends to common stockholders and distributions to limited partners of the operating partnership.
Inflation
Substantially all of our office leases provide for tenants to reimburse us for increases in real estate taxes and operating expenses related to the leased space at the applicable property. In addition, many of the leases provide for increases in fixed base rent. We believe that inflationary increases in real estate taxes and operating expenses may be partially offset by the contractual rent increases and expense reimbursements as described above. We have one multi-family residential rental property, which is located in the Philadelphia central business district and subject to short-term leases. Inflationary increases can often be offset by increased rental rates; however, a weak economic environment may restrict our ability to raise rental rates.
ITEM 7A. QUANTITATIVE AND QUALITATIVE DISCLOSURES ABOUT MARKET RISK
A primary market risk faced by our Company is interest rate risk. Our strategy is to match as closely as possible the expected holding periods and income streams of our assets with the terms of our debt. In general, we use floating rate debt on assets with higher growth prospects and less stability to their income streams. Correspondingly, with respect to stabilized assets with lower growth rates, we will generally use longer-term fixed-rate debt. As of December 31, 2010, our Company had $62.9
44
million of outstanding consolidated floating rate debt, which is not subject to an interest rate cap.
The unconsolidated real estate entities have total debt, excluding loans on properties subject to special servicer oversight, of $1.8 billion, of which $0.3 billion bears interest at floating rates. As of December 31, 2010, interest rate caps have been purchased for $0.2 billion of the floating rate loans.
Our fixed and variable rate consolidated long-term debt at December 31, 2010 consisted of the following (in thousands):
Year of Maturity | Fixed Rate | Variable Rate | Total | |||||||||
2011 | $ | 1,971 | $ | 39,237 | $ | 41,208 | ||||||
2012 | 2,160 | 23,687 | 25,847 | |||||||||
2013 | 108,392 | — | 108,392 | |||||||||
2014 | 1,884 | — | 1,884 | |||||||||
2015 | 1,996 | — | 1,996 | |||||||||
Thereafter | 121,209 | — | 121,209 | |||||||||
Total | $ | 237,612 | $ | 62,924 | $ | 300,536 | ||||||
Weighted average interest rate | 5.95 | % | 5.89 | % | 5.94 | % | ||||||
We utilize sensitivity analyses to assess the potential effect on interest costs of our variable rate debt. At December 31, 2010, our variable rate long-term debt represents 20.9% of our total long-term debt. If interest rates were to increase by 75 basis points, or by approximately 12.7% of the weighted average variable rate at December 31, 2010, the net impact would be increased interest costs of $0.5 million per year.
Our estimates of the fair value of debt instruments at December 31, 2010 and 2009, respectively, were determined by performing discounted cash flow analyses using an appropriate market discount rate. Considerable judgment is necessary to interpret market data and develop the estimated fair value. The use of different market assumptions or estimation methods may have a material effect on the estimated fair value amounts.
As of December 31, 2010 and 2009, the estimated fair value of our mortgage and other secured loans and unsecured loan aggregates $285.6 million and $285.9 million, respectively, compared to the aggregate carrying value of $300.5 million and $318.2 million, respectively.
ITEM 8. FINANCIAL STATEMENTS AND SUPPLEMENTARY DATA
All information required by this item is listed in the Index to Financial Statements in Part IV, Item 15(a).
ITEM 9. CHANGES IN AND DISAGREEMENTS WITH ACCOUNTANTS ON ACCOUNTING AND FINANCIAL DISCLOSURE
None.
ITEM 9A. CONTROLS AND PROCEDURES
Evaluation of Disclosure Controls and Procedures
We have adopted and maintain disclosure controls and procedures that are designed to ensure that information required to be disclosed in the reports that we file or submit under the Securities Exchange Act, as amended (the “Exchange Act”), is recorded, processed, summarized and reported within the time periods specified in the rules and forms of the Securities and Exchange Commission (“SEC”) and that such information is accumulated and communicated to our management, including our Chief Executive Officer and Chief Financial Officer, as appropriate, to allow for timely decisions regarding required disclosure. In designing and evaluating the disclosure controls and procedures, management recognizes that any controls and procedures, no matter how well designed and operated, can provide only reasonable assurance of achieving the desired control objectives, and management is required to apply its judgment in evaluating the cost-benefit relationship of possible controls and procedures.
As required by Rule 13a-15(b), promulgated by the SEC under the Exchange Act, we have carried out an evaluation, under
45
the supervision and with the participation of management, including our Chief Executive Officer and Chief Financial Officer, of the effectiveness of the design and operation of our disclosure controls and procedures as of the end of the period covered by this report. Based on the foregoing, our Chief Executive Officer and Chief Financial Officer concluded that our disclosure controls and procedures are effective to provide reasonable assurance that information required to be disclosed in the reports that we file or submit under the Exchange Act is recorded, processed, summarized, and reported within the time periods specified in the SEC’s rules and forms.
Management’s Annual Report on Internal Control over Financial Reporting
Management is responsible for establishing and maintaining adequate internal control over financial reporting (as defined in Exchange Act Rules 13a-15(f) and 15d-15(f)). Our management evaluated the effectiveness of our internal control over financial reporting based on the framework set forth in Internal Control—Integrated Framework issued by the Committee of Sponsoring Organizations of the Treadway Commission (COSO). Based on this evaluation, our management concluded that our internal control over financial reporting was effective as of December 31, 2010. Ernst & Young LLP, our independent registered public accounting firm, has audited our internal control over financial reporting as of December 31, 2010 and their attestation report is included in this Annual Report on Form 10-K.
Changes in Internal Controls over Financial Reporting
There were no changes in our internal control over financial reporting as defined in Rules 13a-15(f) or 15(d)-15(f) under the Exchange Act that occurred during the quarter ended December 31, 2010 that has materially affected, or is reasonably likely to materially affect, our internal control over financial reporting.
Limitations on Controls
Management does not expect that our disclosure controls and procedures or our internal control over financial reporting will prevent or detect all error and fraud. Any control system, no matter how well designed and operated, is based upon certain assumptions and can provide only reasonable, not absolute, assurance that its objectives will be met. Further, no evaluation of controls can provide absolute assurance that misstatements due to error or fraud will not occur or that all control issues and instances of fraud, if any, within the Company have been detected.
46
REPORT OF INDEPENDENT REGISTERED PUBLIC ACCOUNTING FIRM
To the Board of Directors and Stockholders of Thomas Properties Group, Inc.:
We have audited Thomas Properties Group, Inc. and Subsidiaries’ (the “Company”) internal control over financial reporting as of December 31, 2010, based on criteria established in Internal Control—Integrated Framework issued by the Committee of Sponsoring Organizations of the Treadway Commission (“the COSO criteria”). The Company’s management is responsible for maintaining effective internal control over financial reporting, and for its assessment of the effectiveness of internal control over financial reporting included in Management’s Annual Report on Internal Controls over Financial Reporting. Our responsibility is to express an opinion on the Company’s internal control over financial reporting based on our audit.
We conducted our audit in accordance with the standards of the Public Company Accounting Oversight Board (United States). Those standards require that we plan and perform the audit to obtain reasonable assurance about whether effective internal control over financial reporting was maintained in all material respects. Our audit included obtaining an understanding of internal control over financial reporting, assessing the risk that a material weakness exists, testing and evaluating the design and operating effectiveness of internal control based on the assessed risk, and performing such other procedures as we considered necessary in the circumstances. We believe that our audit provides a reasonable basis for our opinion.
A company’s internal control over financial reporting is a process designed to provide reasonable assurance regarding the reliability of financial reporting and the preparation of financial statements for external purposes in accordance with generally accepted accounting principles. A company’s internal control over financial reporting includes those policies and procedures that (1) pertain to the maintenance of records that, in reasonable detail, accurately and fairly reflect the transactions and dispositions of the assets of the Company; (2) provide reasonable assurance that transactions are recorded as necessary to permit preparation of financial statements in accordance with generally accepted accounting principles, and that receipts and expenditures of the Company are being made only in accordance with authorizations of management and directors of the Company; and (3) provide reasonable assurance regarding prevention or timely detection of unauthorized acquisition, use or disposition of the Company’s assets that could have a material effect on the financial statements.
Because of its inherent limitations, internal control over financial reporting may not prevent or detect misstatements. Also, projections of any evaluation of effectiveness to future periods are subject to the risk that the controls may become inadequate because of changes in conditions, or that the degree of compliance with the policies or procedures may deteriorate.
In our opinion, the Company maintained, in all material respects, effective internal control over financial reporting as of December 31, 2010, based on the COSO criteria.
We also have audited, in accordance with the standards of the Public Company Accounting Oversight Board (United States), the consolidated balance sheets of the Company as of December 31, 2010 and 2009, and the related consolidated statements of operations, equity and noncontrolling interests, and cash flows for each of the three years in the period ended December 31, 2010 of Thomas Properties Group, Inc. and Subsidiaries and our report dated March 10, 2011 expressed an unqualified opinion thereon.
/s/ Ernst & Young LLP
Los Angeles, California
March 10, 2011
47
ITEM 9B. OTHER INFORMATION
None.
48
PART III
ITEM 10. DIRECTORS, EXECUTIVE OFFICERS AND CORPORATE GOVERNANCE
The information required by Item 10 concerning our directors and nominees, our nominating committee process, our audit committee members including our audit committee financial expert(s), and our Section 16(a) beneficial ownership reporting compliance will be included in our definitive Proxy Statement to be filed for our 2011 Annual Meeting of Stockholders (the “2011 Proxy Statement”) and is incorporated herein by reference. Information relating to our executive officers is contained under the caption “Executive Officers of the Registrant” in Part I of this Form 10-K.
ITEM 11. EXECUTIVE COMPENSATION
The information concerning our executive compensation and director compensation required by Item 11 will be included in the 2011 Proxy Statement and is incorporated herein by reference.
ITEM 12. SECURITY OWNERSHIP OF CERTAIN BENEFICIAL OWNERS AND MANAGEMENT AND RELATED STOCKHOLDER MATTERS
The information concerning our security ownership of certain beneficial owners and management required by Item 12 will be included in the 2011 Proxy Statement and is incorporated herein by reference.
Securities Authorized for Issuance Under Equity Incentive Plans
Equity Compensation Plan Information
The following table sets forth information with respect to our 2004 Equity Incentive Plan (“Incentive Plan”) and our Non-employee Directors Restricted Stock Plan under which equity incentives of our Company and our Operating Partnership are authorized for issuance. The Incentive Plan provides incentives to our employees and is intended to attract, reward and retain personnel. Our Incentive Plan permits the granting of awards in the form of options to purchase common stock, restricted shares of common stock and restricted incentive units in our Operating Partnership. Our Non-employee Directors Restricted Stock Plan provides for initial and annual grants to our non-employee directors.
Under the original Plan, we were allowed to issue up to 1,392,858 shares reserved under the Incentive Plan as either restricted stock awards or incentive unit awards and up to 619,048 shares upon the exercise of options granted pursuant to the Incentive Plan. At the Annual Meeting of shareholders in May 2007, the shareholders approved an increase in the number of shares of common stock reserved for issuance or transfer under the Plan from 2,011,906 shares to a total of 2,361,906. In addition, the restrictions on the aggregate number of shares that may be issued or transferred with respect to specified awards granted under the Plan were eliminated. At the Annual Meeting of Shareholders in June 2008, the shareholders approved an increase in the number of shares of the common stock reserved for issuance or transfer under the plan from 2,361,906 shares to a total of 3,361,906 shares. Under our Non-Employee Directors Restricted Stock Plan (“the Non-Employee Directors Plan”) a total of 60,000 shares are reserved for grant and as of December 31, 2010, 29,065 shares remain available for grant. Restricted shares granted under each of our plans entitle the holder to full voting rights and the holder will receive any dividends paid.
We have no equity compensation plans that were not approved by our security holders.
Plan category | Number of securities to be issued upon exercise of outstanding options, warrants and rights | Weighted-average exercise price of outstanding options, warrants and rights | Number of securities remaining available for future issuance under compensation plans | ||||||||
Equity compensation plans approved by security holders at December 31, 2010 | 607,924 | (1) | $ | 12.85 | 632,556 | (2) | |||||
_________________________
(1) | In addition there were 195,552 vested incentive units outstanding and 90,004 unvested incentive units outstanding under our Incentive Plan at December 31, 2010. |
(2) | Consists of 603,491remaining available for grant under the Incentive Plan at December 31, 2010 and 29,065 remaining available for grant under the Non-employee director plan at December 31, 2010. |
49
ITEM 13. CERTAIN RELATIONSHIPS AND RELATED TRANSACTIONS AND DIRECTOR INDEPENDENCE
The information concerning certain relationships and related transactions and director independence required by Item 13 will be included in the 2011 Proxy Statement and is incorporated herein by reference.
ITEM 14. PRINCIPAL ACCOUNTING FEES AND SERVICES
The information concerning our principal accounting fees and services required by Item 14 will be included in the 2011 Proxy Statement and is incorporated herein by reference.
50
PART IV
ITEM 15. EXHIBITS AND FINANCIAL STATEMENT SCHEDULES
(a) Financial Statements and Financial Statement Schedules
The following consolidated financial information is included as a separate section of this report on Form 10-K:
INDEX TO FINANCIAL STATEMENTS
Page | |
Thomas Properties Group, Inc. and Subsidiaries: | |
Report of Independent Registered Public Accounting Firm | |
Consolidated Balance Sheets as of December 31, 2010 and 2009 | |
Consolidated Statements of Operations for the years ended December 31, 2010, 2009 and 2008 | |
Consolidated Statements of Equity and Noncontrolling Interests for the years ended December 31, 2010, 2009 and 2008 | |
Consolidated Statements of Cash Flows for the years ended December 31, 2010, 2009 and 2008 | |
Notes to Consolidated Financial Information | |
Schedule III: Investments in Real Estate | |
TPG/CalSTRS, LLC: | |
Report of Independent Registered Public Accounting Firm | |
Consolidated Balance Sheets as of December 31, 2010 and 2009 | |
Consolidated Statements of Operations for the years ended December 31, 2010, 2009 and 2008 | |
Consolidated Statements of Members’ Equity and Comprehensive Loss for the years ended December 31, 2010, 2009 and 2008 | |
Consolidated Statements of Cash Flows for the years ended December 31, 2010, 2009 and 2008 | |
Notes to Consolidated Financial Information |
(b) Exhibits
3.1 | Second Amended and Restated Certificate of Incorporation of the Registrant. (1) | |
3.2 | Amended and Restated Bylaws of the Registrant. (2) | |
10.1* | Amended and Restated 2004 Equity Incentive Plan (3) | |
10.2 | Operating Partnership Agreement. (4) | |
10.3 | Master Contribution Agreement entered into by James A. Thomas and the other contributors party thereto. (4) | |
10.4 | Non-employee Directors Restricted Stock Plan. (4) | |
10.5 | Pairing Agreement between the Registrant and its Operating Partnership. (4) | |
10.6 | Form of Indemnification Agreement entered into by the Registrant and each of its directors and executive officers. (5) | |
10.7* | Amended and Restated Employment Agreement between the Registrant and Mr. James A Thomas. (6) | |
10.8* | Amended and Restated Employment Agreement between the Registrant and Mr. Thomas S. Ricci. (6) | |
10.9* | Amended and Restated Employment Agreement between the Registrant and Mr. Randall L. Scott. (6) | |
10.10* | Amended and Restated Employment Agreement between the Registrant and Mr. John R. Sischo. (6) | |
10.11* | Amended and Restated Employment Agreement between the Registrant and Ms. Diana M. Laing. (6) | |
10.12+ | Second Amended and Restated Operating Agreement of TPG/CalSTRS, LLC. (5) | |
10.13 | Registration Rights Agreement between the Registrant and the parties thereto. (4) | |
51
10.14 | Loan Agreement dated as of July 31, 2003 between Philadelphia Plaza-Phase II, LP as Borrower and Morgan Stanley Mortgage Capital, Inc. as Lender. (5) | |
10.15 | [intentionally omitted] | |
10.16 | [intentionally omitted] | |
10.17 | [intentionally omitted] | |
10.18 | Thomas Properties Group, Inc. Form of Restricted Shares Award Agreement. (7) | |
10.19 | Thomas Properties Group, Inc., Form of Incentive Unit Award Agreement. (7) | |
10.20 | Thomas Properties Group, Inc. Form of Non-Qualified Option Award Agreement. (7) | |
10.21 | Thomas Properties Group, Inc. Form of Non-employee Directors’ Restricted Shares Award Agreement. (7) | |
10.22 | Loan Agreement between TPG Oak Hill/Walnut Hill, LLC and Greenwich Capital Financial Products, Inc. (7) | |
10.23 | Loan Agreement between TPG Four Falls, LLC and Greenwich Capital Financial Products, Inc. (7) | |
10.24 | [intentionally omitted] | |
10.25 | [intentionally omitted] | |
10.26 | [intentionally omitted] | |
10.27 | Loan Agreement between TPG—Commerce Square Partners—Philadelphia Plaza, L.P. as borrower and Greenwich Capital Financial Products, Inc. as lender. (8) | |
10.28 | Loan Agreement between TPG-2101 CityWest 1&2, L.P. and Greenwich Capital Financial Products, Inc. (9) | |
10.29 | [intentionally omitted] | |
10.30 | [intentionally omitted] | |
10.31 | [intentionally omitted] | |
10.32 | [intentionally omitted] | |
10.33 | First Amendment to Second Amended and Restated Operating Agreement of TPG/CalSTRS, LLC. (10) | |
10.34 | Second Amendment to Second Amended and Restated Operating Agreement of TPG/CalSTRS, LLC. (11) | |
10.35 | Third Amendment to Second Amended and Restated Operating Agreement of TPG/CalSTRS, LLC. (12) | |
10.36 | Limited Partnership Agreement of Thomas High Performance Green Fund, L.P. | |
10.37+ | Letter Agreement Relating to Thomas High Performance Green Fund, L.P. with California State Teachers’ Retirement System. (12) | |
10.38* | Employment Agreement between the Registrant and Mr. Paul S. Rutter. (13) | |
10.39* | Policy adopted by the Compensation Committee regarding equity grants to executive officers. (14) | |
10.40 | Fourth Amendment to Second Amended and Restated Operating Agreement of TPG/CalSTRS, LLC. (15) | |
10.41 | Third Modification Agreement between TPG - El Segundo Partners, LLC and Wells Fargo Bank (16) | |
10.42 | Amended and Restated Repayment Guaranty by Thomas Properties Group, Inc. and Thomas Properties Group L.P. for TPG-El Segundo Partners, LLC Loan Agreement (16) | |
10.43 | Second Modification Agreement between New TPG - Four Points, L.P. and Wells Fargo Bank (16) | |
10.44 | Discounted Payoff Agreement between Philadelphia Plaza - Phase II, LP and DB Realty Mezzanine Investment Fund II, L.L.C. and DB Realty Mezzanine Parallel Fund II, LLC (16) | |
10.45 | Master Agreement for Debt and Equity Restructure of City National Plaza (17) | |
10.46 | Fifth Amendment to Second Amended and Restated Operating Agreement of TPG/CalSTRS, LLC. (18) | |
10.47 | Sixth Amendment to Second Amended and Restated Operating Agreement of TPG/CalSTRS, LLC. (18) | |
10.48 | Thomas Master Investments, LLC Contribution Agreement, Maguire Thomas Partners-Commerce Square II, Ltd Contribution Agreement, Maguire/Thomas Partners-Philadelphia, Ltd. Contribution Agreement (18) | |
10.49 | Seventh Amendment to the Second Amended and Restated Operating Agreement of TPG/CalSTRS, LLC. (19) | |
10.50 | Amended and Restated Sixth Amendment to Second Amended and Restated Operating Agreement of TPG/CalSTRS, LLC. (20) | |
10.51 | Eighth Amendment to the Second Amended and Restated Operating Agreement of TPG/CalSTRS, LLC. (20) | |
10.52 | Amended and Restated Master Agreement for Debt and Equity Restructure of City National Plaza. (20) | |
10.53 | Loan Termination Agreement between 515/555 Flower Mezzanine Associates, LLC and California State Teachers' Retirement System. (20) |
52
10.54 | Loan Termination Agreement between 515/555 Flower Junior Mezzanine Associates, LLC and California State Teachers' Retirement System. (20) | |
10.55 | Promissory Note from 515/555 Flower Associates, LLC in favor of Metropolitan Life Insurance Company. (20) | |
10.56 | Promissory Note from 515/555 Flower Associates, LLC in favor of New York State Teachers' Retirement System. (20) | |
10.57 | Promissory Note from TPG-2500 CityWest, L.P. in favor of the Northwestern Mutual Life Insurance Company. (21) | |
10.58 | Promissory Note from TPG-San Felipe Plaza, L.P. in favor of Metropolitan Life Insurance Company. (21) | |
10.59 | Building Loan Agreement between TPG-Brookhollow, LP and Wells Fargo Bank, National Association. (21) | |
10.60 | Fourth Amendment to Construction Loan Agreement and Amendment to Other Loan Documents between TPG/P&A 2101 Market, L.P. and Corus Construction Venture, LLC. (21) | |
10.61 | Promissory Note from TPG−2101 CityWest 3 & 4, L.P. in favor of The Northwestern Mutual Life Insurance Company (22) | |
10.62 | First Amendment to Loan Agreement between TPG−Centerpointe Mezzanine 3, LLC and WHSF Nevada, LLC (23) | |
10.63 | Demand Pay−Off Letter between TPG−Centerpointe Mezzanine, LLC and Garrison Commercial Funding IV LLC (23) | |
10.64 | Ninth Amendment to Second Amended and Restated Operating Agreement of TPG/CalSTRS, LLC (23) | |
10.65+ | One Commerce Square Contribution Agreement (24) | |
10.66+ | Two Commerce Square Contribution Agreement (24) | |
21.1 | Subsidiaries of the Registrant. | |
23.1 | Consent of Ernst & Young, LLP. | |
24.1 | Power of Attorney (Contained on Signature Page to this Report) | |
31.1 | Certification of Chief Executive Officer pursuant to Section 302 of the Sarbanes-Oxley Act of 2002. | |
31.2 | Certification of Chief Financial Officer pursuant to Section 302 of the Sarbanes-Oxley Act of 2002. |
In accordance with SEC Release 33-8212, the following exhibits are being furnished, and are not being filed as part of this report or as a separate disclosure document, and are not being incorporated by reference into any registration statement filed under the Securities Act of 1933.
32.1 | Certification of Chief Executive Officer pursuant to Section 906 of the Sarbanes-Oxley Act of 2002. | |
32.2 | Certification of Chief Financial Officer pursuant to Section 906 of the Sarbanes-Oxley Act of 2002. | |
_________________________
(1) | Incorporated by reference from the Registrant’s Report on Form 8-K filed October 18, 2004. |
(2) | Incorporated by reference from the Registrant’s Report on Form 8-K filed January 4, 2008. |
(3) | Incorporated by reference from the Registrant’s Definitive Proxy Statement filed April 29, 2008. |
(4) | Incorporated by reference from the Registrant’s Report on Form 10-Q filed November 22, 2004. |
(5) | Incorporated by reference from Registration Statement file number 333-114527. |
(6) | Incorporated by reference from the Registrant’s Report on Form 8-K filed December 24, 2008. |
(7) | Incorporated by reference from the Registrant’s Report on Form 10-K filed March 30, 2005. |
(8) | Incorporated by reference from the Registrant’s Report on Form 8-K filed January 5, 2006. |
(9) | Incorporated by reference from the Registrant’s Report on Form 10-Q filed August 9, 2006. |
(10) | Incorporated by reference from the Registrant’s Report on Form 10-K filed April 2, 2007. |
(11) | Incorporated by reference from the Registrant’s Report on Form 10-Q filed August 9, 2007. |
(12) | Incorporated by reference from the Registrant’s Report on Form 10-K filed March 18, 2008. |
(13) | Incorporated by reference from the Registrant’s Report on Form 8-K filed September 5, 2008. |
(14) | Incorporated by reference from the Registrant’s Report on Form 8-K filed June 10, 2008. |
(15) | Incorporated by reference from the Registrant’s Report on Form 10-K filed on March 23, 2009. |
53
(16) | Incorporated by reference from the Registrant’s Report on Form 10-Q filed November 2, 2009. |
(17) | Incorporated by reference from the Registrant’s Report on Form 8-K filed on March 5, 2010. |
(18) | Incorporated by reference from the Registrant's Report on Form 10-K filed on March 22, 2010. |
(19) | Incorporated by reference from the Registrant's Report on Form 8-K filed on May 19, 2010. |
(20) | Incorporated by reference from the Registrant's Report on Form 8-K filed on July 12, 2010. |
(21) | Incorporated by reference from the Registrant's Report on Form 8-K filed on July 27, 2010. |
(22) | Incorporated by reference from the Registrant's Report on Form 8-K filed on October 15, 2010. |
(23) | Incorporated by reference from the Registrant's Report on Form 8-K filed on October 26, 2010. |
(24) | Incorporated by reference from the Registrant's Report on Form 10-Q filed on November 12, 2010. |
+ Confidential treatment requested.
* Managerial compensatory plan or arrangement.
54
REPORT OF INDEPENDENT REGISTERED PUBLIC ACCOUNTING FIRM
To the Board of Directors and Stockholders of Thomas Properties Group, Inc.:
We have audited the accompanying consolidated balance sheets of Thomas Properties Group, Inc. (the “Company”) as of December 31, 2010 and 2009, and the related consolidated statements of operations, equity and noncontrolling interests, and cash flows for each of the three years in the period ended December 31, 2010. Our audits also included the financial statement schedule listed in the Index at Item 15. These financial statements and schedule are the responsibility of the Company’s management. Our responsibility is to express an opinion on these financial statements and schedule based on our audits.
We conducted our audits in accordance with the standards of the Public Company Accounting Oversight Board (United States). Those standards require that we plan and perform the audit to obtain reasonable assurance about whether the financial statements are free of material misstatement. An audit includes examining, on a test basis, evidence supporting the amounts and disclosures in the financial statements. An audit also includes assessing the accounting principles used and significant estimates made by management, as well as evaluating the overall financial statement presentation. We believe that our audits provide a reasonable basis for our opinion.
In our opinion, the financial statements referred to above present fairly, in all material respects, the consolidated financial position of Thomas Properties Group, Inc. at December 31, 2010 and 2009, and the consolidated results of their operations and their cash flows for each of the three years in the period ended December 31, 2010, in conformity with U.S. generally accepted accounting principles. Also, in our opinion, the related financial statement schedule, when considered in relation to the basic financial statements taken as a whole, present fairly in all material respects the information set forth therein.
We also have audited, in accordance with the standards of the Public Company Accounting Oversight Board (United States), Thomas Properties Group, Inc.’s internal control over financial reporting as of December 31, 2010, based on criteria established in Internal Control-Integrated Framework issued by the Committee of Sponsoring Organizations of the Treadway Commission and our report dated March 10, 2011 expressed an unqualified opinion thereon.
/s/ Ernst & Young LLP
Los Angeles, California
March 10, 2011
55
THOMAS PROPERTIES GROUP, INC. AND SUBSIDIARIES
CONSOLIDATED BALANCE SHEETS
(In thousands, except share data)
December 31, 2010 and 2009
2010 | 2009 | ||||||
ASSETS | |||||||
Investments in real estate: | |||||||
Operating properties, net of accumulated depreciation of $105,271 and $95,561 as of December 31, 2010 and 2009, respectively | $ | 266,859 | $ | 276,603 | |||
Land improvements—development properties | 96,585 | 95,558 | |||||
363,444 | 372,161 | ||||||
Condominium units held for sale | 49,827 | 64,101 | |||||
Improved land held for sale | 2,819 | 4,508 | |||||
Investments in unconsolidated real estate entities | 17,975 | 14,458 | |||||
Cash and cash equivalents, unrestricted | 42,363 | 35,935 | |||||
Restricted cash | 13,069 | 12,071 | |||||
Rents and other receivables, net of allowance for doubtful accounts of $1,501 and $335 as of December 31, 2010 and 2009, respectively | 1,754 | 2,073 | |||||
Receivables from unconsolidated real estate entities | 2,979 | 2,010 | |||||
Deferred rents | 14,592 | 12,954 | |||||
Deferred leasing and loan costs, net of accumulated amortization of $10,195 and $8,342 as of December 31, 2010 and 2009, respectively | 13,538 | 15,375 | |||||
Other assets, net | 17,875 | 23,757 | |||||
Total assets | $ | 540,235 | $ | 559,403 | |||
LIABILITIES AND EQUITY | |||||||
Liabilities: | |||||||
Mortgage loans | $ | 254,612 | $ | 255,104 | |||
Other secured loans | 45,924 | 63,132 | |||||
Accounts payable and other liabilities, net | 29,020 | 35,573 | |||||
Prepaid rent and deferred revenue | 2,888 | 3,249 | |||||
Total liabilities | 332,444 | 357,058 | |||||
Commitments and Contingencies | — | — | |||||
Equity: | |||||||
Stockholders’ equity: | |||||||
Preferred stock, $.01 par value, 25,000,000 shares authorized, none issued or outstanding as of December 31, 2010 and 2009 | — | — | |||||
Common stock, $.01 par value, 225,000,000 shares authorized, 36,943,394 and 30,878,621 shares issued and outstanding as of December 31, 2010 and December 31, 2009, respectively | 369 | 308 | |||||
Limited voting stock, $.01 par value, 20,000,000 shares authorized, 12,313,331 and 3,813,331 shares issued and outstanding as of December 31, 2010 and December 31, 2009, respectively | 123 | 138 | |||||
Additional paid-in capital | 207,953 | 185,344 | |||||
Retained deficit and dividends, including $2 and ($74) of other comprehensive income (loss) as of December 31, 2010 and December 31, 2009, respectively | (60,790 | ) | (49,394 | ) | |||
Total stockholders’ equity | 147,655 | 136,396 | |||||
Noncontrolling interests: | |||||||
Unitholders in the Operating Partnership | 51,478 | 63,042 | |||||
Partners in consolidated real estate entities | 8,658 | 2,907 | |||||
Total noncontrolling interests | 60,136 | 65,949 | |||||
Total equity | 207,791 | 202,345 | |||||
Total liabilities and equity | $ | 540,235 | $ | 559,403 | |||
See accompanying notes to consolidated financial information.
56
THOMAS PROPERTIES GROUP, INC. AND SUBSIDIARIES
CONSOLIDATED STATEMENTS OF OPERATIONS
(In thousands, except share and per share data)
Year Ended December 31, 2010 | Year Ended December 31, 2009 | Year Ended December 31, 2008 | |||||||||
Revenues: | |||||||||||
Rental | $ | 29,230 | $ | 29,753 | $ | 30,523 | |||||
Tenant reimbursements | 20,187 | 21,163 | 25,874 | ||||||||
Parking and other | 3,330 | 2,988 | 3,869 | ||||||||
Investment advisory, management, leasing, and development services | 7,703 | 9,345 | 7,194 | ||||||||
Investment advisory, management, leasing, and development services—unconsolidated real estate entities | 16,470 | 15,023 | 18,263 | ||||||||
Reimbursement of property personnel costs | 5,797 | 5,584 | 6,079 | ||||||||
Condominium sales | 14,984 | 30,226 | 79,758 | ||||||||
Total revenues | 97,701 | 114,082 | 171,560 | ||||||||
Expenses: | |||||||||||
Property operating and maintenance | 25,049 | 25,339 | 25,608 | ||||||||
Real estate and other taxes | 6,914 | 7,225 | 6,482 | ||||||||
Investment advisory, management, leasing, and development services | 12,221 | 11,910 | 14,800 | ||||||||
Reimbursable property personnel costs | 5,797 | 5,584 | 6,079 | ||||||||
Cost of condominium sales | 10,955 | 26,492 | 62,436 | ||||||||
Interest | 19,239 | 26,868 | 22,763 | ||||||||
Depreciation and amortization | 14,128 | 12,642 | 11,766 | ||||||||
General and administrative | 14,224 | 17,082 | 16,695 | ||||||||
Impairment loss | 4,500 | 13,000 | 11,023 | ||||||||
Total expenses | 113,027 | 146,142 | 177,652 | ||||||||
Gain on sale of real estate | — | 1,214 | 3,618 | ||||||||
Gain on extinguishment of debt | — | 11,921 | 255 | ||||||||
Interest income | 72 | 338 | 2,795 | ||||||||
Equity in net loss of unconsolidated real estate entities | (1,184 | ) | (16,236 | ) | (12,828 | ) | |||||
Loss before benefit (provision) for income taxes and noncontrolling interests | (16,438 | ) | (34,823 | ) | (12,252 | ) | |||||
Benefit (provision) for income taxes | 357 | (683 | ) | 1,885 | |||||||
Net loss | (16,081 | ) | (35,506 | ) | (10,367 | ) | |||||
Noncontrolling interests’ share of net loss: | |||||||||||
Unitholders in the Operating Partnership | 4,843 | 11,535 | 4,683 | ||||||||
Partners in consolidated real estate entities | (234 | ) | 2,408 | 198 | |||||||
4,609 | 13,943 | 4,881 | |||||||||
TPGI share of net loss | $ | (11,472 | ) | $ | (21,563 | ) | $ | (5,486 | ) | ||
Loss per share-basic and diluted | $ | (0.34 | ) | $ | (0.86 | ) | $ | (0.24 | ) | ||
Weighted average common shares outstanding—basic and diluted | 33,684,101 | 25,173,163 | 23,693,577 | ||||||||
See accompanying notes to consolidated financial information.
57
THOMAS PROPERTIES GROUP, INC. AND SUBSIDIARIES
CONSOLIDATED STATEMENTS OF EQUITY AND NONCONTROLLING INTERESTS
(In thousands, except share data)
Years Ended December 31, 2010, 2009 and 2008
Common Stock | Limited Voting Stock | Additional Paid -In Capital | Deficit | Other Comprehensive Income (loss) | Noncontrolling Interests | Total | |||||||||||||||||||||||||||
Shares | Amount | Shares | Amount | ||||||||||||||||||||||||||||||
Balance, December 31, 2007 | 23,747,936 | $ | 237 | 14,496,666 | $ | 145 | $ | 153,569 | $ | (15,410 | ) | $ | (201 | ) | $ | 97,068 | $ | 235,408 | |||||||||||||||
Issuance of unvested restricted stock | 105,968 | 1 | — | — | — | — | — | — | 1 | ||||||||||||||||||||||||
Share registration expense | — | — | — | — | (15 | ) | — | — | — | (15 | ) | ||||||||||||||||||||||
Amortization of stock-based compensation | — | — | — | — | 2,634 | — | — | 861 | 3,495 | ||||||||||||||||||||||||
Change in noncontrolling interest (see Note 2) | — | — | — | — | 787 | — | — | (787 | ) | — | |||||||||||||||||||||||
Dividends | — | — | — | — | — | (5,898 | ) | — | (3,589 | ) | (9,487 | ) | |||||||||||||||||||||
Other comprehensive loss recognized | — | — | — | — | — | — | 15 | 8 | 23 | ||||||||||||||||||||||||
Distributions | — | — | — | — | — | — | — | (626 | ) | (626 | ) | ||||||||||||||||||||||
Net loss | — | — | — | — | — | (5,486 | ) | — | (4,881 | ) | (10,367 | ) | |||||||||||||||||||||
Fair market value change of redeemable noncontrolling interest in unconsolidated real estate entities | — | — | — | — | 1,366 | — | — | 929 | 2,295 | ||||||||||||||||||||||||
Balance, December 31, 2008 | 23,853,904 | $ | 238 | 14,496,666 | $ | 145 | $ | 158,341 | $ | (26,794 | ) | $ | (186 | ) | $ | 88,983 | $ | 220,727 | |||||||||||||||
Issuance of unvested restricted stock | 410,000 | 4 | — | — | — | — | — | — | 4 | ||||||||||||||||||||||||
Redemption of Operating Partnership units | 1,476,117 | 15 | (683,335 | ) | (7 | ) | (11 | ) | — | — | — | (3 | ) | ||||||||||||||||||||
Proceeds from sale of common stock, net of offering expenses | 5,138,600 | 51 | — | — | 13,049 | — | — | — | 13,100 | ||||||||||||||||||||||||
Amortization of stock-based compensation | — | — | — | — | 2,324 | — | — | 516 | 2,840 | ||||||||||||||||||||||||
Change in noncontrolling interest (see Note 2) | — | — | — | — | 11,330 | — | — | (11,330 | ) | — | |||||||||||||||||||||||
Dividends | — | — | — | — | — | (963 | ) | — | (538 | ) | (1,501 | ) | |||||||||||||||||||||
Other comprehensive income recognized | — | — | — | — | — | — | 112 | 62 | 174 | ||||||||||||||||||||||||
Contributions | — | — | — | — | — | — | — | 1,542 | 1,542 | ||||||||||||||||||||||||
Distributions | — | — | — | — | — | — | — | (14 | ) | (14 | ) | ||||||||||||||||||||||
Net loss | — | — | — | — | — | (21,563 | ) | — | (13,943 | ) | (35,506 | ) | |||||||||||||||||||||
Fair market value change of redeemable noncontrolling interest in unconsolidated real estate entities | — | — | — | — | 311 | — | — | 671 | 982 | ||||||||||||||||||||||||
Balance, December 31, 2009 | 30,878,621 | $ | 308 | 13,813,331 | $ | 138 | $ | 185,344 | $ | (49,320 | ) | $ | (74 | ) | $ | 65,949 | $ | 202,345 | |||||||||||||||
Issuance of unvested restricted stock | 100,000 | 1 | — | — | (1 | ) | — | — | — | — | |||||||||||||||||||||||
Redemption of operating partnership units | 1,500,000 | 15 | (1,500,000 | ) | (15 | ) | 6,156 | — | — | (6,156 | ) | — | |||||||||||||||||||||
Redemption of incentive units | 179,998 | 2 | — | — | 789 | — | — | (791 | ) | — | |||||||||||||||||||||||
Proceeds from sale of common stock, net of offering expenses | 4,284,775 | 43 | — | — | 15,240 | — | — | — | 15,283 | ||||||||||||||||||||||||
Amortization of stock-based compensation | — | — | — | — | 477 | — | — | 195 | 672 | ||||||||||||||||||||||||
Book-tax difference related to vesting of restricted stock | — | — | — | — | (52 | ) | — | — | — | (52 | ) | ||||||||||||||||||||||
Other comprehensive income recognized | — | — | — | — | — | — | 76 | 31 | 107 | ||||||||||||||||||||||||
Contributions | — | — | — | — | — | — | — | 5,338 | 5,338 | ||||||||||||||||||||||||
Net loss | — | — | — | — | — | (11,472 | ) | — | (4,609 | ) | (16,081 | ) | |||||||||||||||||||||
Reimbursement from Noncontrolling interest | — | — | — | — | — | — | — | 179 | 179 | ||||||||||||||||||||||||
Balance, December 31, 2010 | 36,943,394 | $ | 369 | 12,313,331 | $ | 123 | $ | 207,953 | $ | (60,792 | ) | $ | 2 | $ | 60,136 | $ | 207,791 | ||||||||||||||||
See accompanying notes to consolidated financial information.
58
THOMAS PROPERTIES GROUP, INC. AND SUBSIDIARIES
CONSOLIDATED STATEMENTS OF CASH FLOWS
(In thousands)
Year Ended December 31, 2010 | Year Ended December 31, 2009 | Year Ended December 31, 2008 | |||||||||
Cash flows from operating activities: | |||||||||||
Net loss | $ | (16,081 | ) | $ | (35,506 | ) | $ | (10,367 | ) | ||
Adjustments to reconcile net loss to net cash (used in) provided by operating activities: | |||||||||||
Gain on extinguishment of debt | — | (11,921 | ) | — | |||||||
Gain on sale of real estate | — | (1,214 | ) | (3,618 | ) | ||||||
Gain on sale of condominiums—closed units | (4,030 | ) | (4,768 | ) | (15,001 | ) | |||||
Gain on sale of condominiums—units under contracts | — | — | (2,321 | ) | |||||||
Reversal of gain on sale of condominiums—cancellations | — | 1,034 | — | ||||||||
Equity in net loss of unconsolidated real estate entities | 1,184 | 16,236 | 12,828 | ||||||||
Deferred rents | (1,428 | ) | (924 | ) | 3,433 | ||||||
Deferred income taxes | 4,132 | (1,464 | ) | (2,179 | ) | ||||||
Depreciation and amortization expense | 14,128 | 12,642 | 11,766 | ||||||||
Allowance for doubtful accounts | 626 | 315 | 564 | ||||||||
Amortization of loan costs | 897 | 691 | 449 | ||||||||
Amortization of above and below market leases, net | 2 | 23 | (79 | ) | |||||||
Non-cash amortization of share-based compensation | 672 | 2,840 | 3,495 | ||||||||
Distributions from operations of unconsolidated real estate entities | — | 724 | 462 | ||||||||
Impairment loss | 4,500 | 13,000 | 11,023 | ||||||||
Changes in operating assets and liabilities: | |||||||||||
Rents and other receivables | (35 | ) | (252 | ) | (2,664 | ) | |||||
Receivables from unconsolidated real estate entities | (969 | ) | 2,691 | 1,939 | |||||||
Deferred leasing and loan costs | (2,298 | ) | (3,796 | ) | (3,864 | ) | |||||
Other assets | 871 | 785 | (1,336 | ) | |||||||
Deferred interest payable | 975 | 3,553 | 4,587 | ||||||||
Accounts payable and other liabilities | (3,245 | ) | (1,235 | ) | (6,321 | ) | |||||
Prepaid rent and deferred revenue | (444 | ) | (389 | ) | (580 | ) | |||||
Net cash (used in) provided by operating activities: | (543 | ) | (6,935 | ) | 2,216 | ||||||
Cash flows from investing activities: | |||||||||||
Expenditures for improvements to real estate | (3,265 | ) | (16,784 | ) | (102,956 | ) | |||||
Reimbursements of development costs | 500 | — | — | ||||||||
Proceeds from sale of condominiums | 13,954 | 38,432 | 69,273 | ||||||||
Purchases of interests in consolidated real estate entities | — | — | (4,000 | ) | |||||||
Proceeds from sale of real estate | — | 2,001 | — | ||||||||
Return of capital from unconsolidated real estate entities | 10,970 | 4,425 | 4,105 | ||||||||
Contributions to unconsolidated real estate entities | (15,575 | ) | (5,600 | ) | (1,965 | ) | |||||
Net cash provided by (used in) investing activities | $ | 6,584 | $ | 22,474 | $ | (35,543 | ) | ||||
59
THOMAS PROPERTIES GROUP, INC. AND SUBSIDIARIES
CONSOLIDATED STATEMENTS OF CASH FLOWS
(In thousands)
(continued)
Year Ended December 31, 2010 | Year Ended December 31, 2009 | Year Ended December 31, 2008 | |||||||||
Cash flows from financing activities: | |||||||||||
Proceeds from equity offering, net | 15,282 | 13,100 | (15 | ) | |||||||
Noncontrolling interest contributions | 5,338 | 1,542 | — | ||||||||
Noncontrolling interest distributions | — | (14 | ) | (211 | ) | ||||||
Payment of dividends to common stockholders and distributions to limited partners of the Operating Partnership | — | (3,878 | ) | (9,463 | ) | ||||||
Principal payments of mortgage and other secured loans | (19,091 | ) | (70,419 | ) | (89,998 | ) | |||||
Proceeds from mortgage and other secured loans | 410 | 8,054 | 75,070 | ||||||||
Payment of loan costs | (268 | ) | — | — | |||||||
Change in restricted cash | (1,284 | ) | 2,988 | 320 | |||||||
Net cash provided by (used in) financing activities | 387 | (48,627 | ) | (24,297 | ) | ||||||
Net increase (decrease) in cash and cash equivalents | 6,428 | (33,088 | ) | (57,624 | ) | ||||||
Cash and cash equivalents at beginning of period | 35,935 | 69,023 | 126,647 | ||||||||
Cash and cash equivalents at end of period | $ | 42,363 | $ | 35,935 | $ | 69,023 | |||||
Supplemental disclosure of cash flow information: | |||||||||||
Cash paid for interest, net of capitalized interest of $0, $110 and $3,731, for the years ended December 31, 2010, 2009 and 2008 respectively | $ | 17,247 | $ | 24,156 | $ | 22,232 | |||||
Cash paid for income taxes, for the years ended December 31, 2010, 2009, and 2008, respectively | 639 | 232 | 294 | ||||||||
Supplemental disclosure of non-cash investing and financing activities: | |||||||||||
Accrual for declaration of dividends to common shareholders and distributions to limited partners of the Operating Partnership | $ | — | $ | 2,377 | $ | 23 | |||||
Noncontrolling interest adjustment | (179 | ) | — | — | |||||||
Investments in real estate included in accounts payable and other liabilities | (823 | ) | (2,306 | ) | (9,584 | ) | |||||
Decrease in investments in real estate and accumulated depreciation for removal of fully amortized improvements | 1,041 | 15,498 | 19,057 | ||||||||
Reclassification of noncontrolling interest for limited partnership units in the Operating Partnership from additional paid in capital | — | 11,330 | 787 | ||||||||
Fair market value change of redeemable noncontrolling interest in unconsolidated real estate entity | — | (982 | ) | — | |||||||
Other comprehensive income | (107 | ) | (175 | ) | (22 | ) | |||||
Decrease in leasing costs and accumulated amortization for removal of fully amortized leasing costs | 1,385 | — | — | ||||||||
See accompanying notes to consolidated financial information.
60
THOMAS PROPERTIES GROUP, INC. AND SUBSIDIARIES
NOTES TO CONSOLIDATED FINANCIAL INFORMATION
December 31, 2010, 2009, and 2008
(Tabular amounts in thousands, except share and per share amounts)
1. Organization and Description of Business
The terms “Thomas Properties”, “us”, “we”, “our” and "the Company" as used in this report refer to Thomas Properties Group, Inc. together with our Operating Partnership, Thomas Properties Group, L.P. (the “Operating Company”).
We own, manage, lease, acquire and develop real estate, consisting primarily of office properties and related parking garages, located in Southern California; Sacramento, California; Philadelphia, Pennsylvania; Northern Virginia; Houston, Texas and Austin, Texas.
We were incorporated in the State of Delaware on March 9, 2004. On October 13, 2004, we completed our initial public offering (the “Offering”). Our operations are carried on through our Operating Partnership of which we are the sole general partner. The Operating Partnership holds our direct and indirect interest in real estate properties, and it carries on our investment advisory, property management, leasing and real estate development operations. As of December 31, 2010, we held a 74.7% interest in the Operating Partnership which we consolidate, as we have control over the major decisions of the Operating Partnership.
[space intentionally left blank]
61
THOMAS PROPERTIES GROUP, INC. AND SUBSIDIARIES
NOTES TO CONSOLIDATED FINANCIAL INFORMATION—(Continued)
As of December 31, 2010, we were invested in the following real estate properties:
Property | Type | Location | ||
Consolidated properties: | ||||
One Commerce Square | High-rise office | Philadelphia Central Business District, Pennsylvania (“PCBD”) | ||
Two Commerce Square | High-rise office | PCBD | ||
Murano | Residential condominiums held for sale | PCBD | ||
2100 JFK Boulevard | Undeveloped land; Residential/Office/Retail | PCBD | ||
Four Points Centre | Suburban office; Undeveloped land; Office/Retail/Research and Development/Hotel | Austin, Texas | ||
Campus El Segundo | Developable land and land held for sale; Site infrastructure complete; Office/Retail/ Research and Development/Hotel | El Segundo, California | ||
Metro Studio@Lankershim | Entitlements and pre-development in progress; Office/Studio/Production/Retail | Los Angeles, California | ||
Unconsolidated properties: | ||||
2121 Market Street | Residential and retail | PCBD | ||
TPG/CalSTRS, LLC (“TPG/CalSTRS”): | ||||
City National Plaza | High-rise office | Los Angeles Central Business District, California | ||
Reflections I | Suburban office | Reston, Virginia | ||
Reflections II | Suburban office—single tenancy | Reston, Virginia | ||
Four Falls Corporate Center (1) | Suburban office | Conshohocken, Pennsylvania | ||
Oak Hill Plaza (1) | Suburban office | King of Prussia, Pennsylvania | ||
Walnut Hill Plaza (1) | Suburban office | King of Prussia, Pennsylvania | ||
San Felipe Plaza | High-rise office | Houston, Texas | ||
2500 City West | Suburban office | Houston, Texas | ||
Brookhollow Central I-III | Suburban office | Houston, Texas | ||
CityWestPlace | Suburban office and undeveloped land | Houston, Texas | ||
Centerpointe I & II | Suburban office | Fairfax, Virginia | ||
Fair Oaks Plaza | Suburban office | Fairfax, Virginia | ||
TPG-Austin Portfolio Syndication Partners JV, LP (“Austin Portfolio Joint Venture”): | ||||
San Jacinto Center | High-rise office | Austin Central Business District, Texas, (“ACBD”) | ||
Frost Bank Tower | High-rise office | ACBD | ||
One Congress Plaza | High-rise office | ACBD | ||
One American Center | High-rise office | ACBD | ||
300 West 6th Street | High-rise office | ACBD | ||
Research Park Plaza I & II | Suburban Office | Austin, Texas | ||
Park Centre | Suburban Office | Austin, Texas | ||
Great Hills Plaza | Suburban Office | Austin, Texas | ||
Stonebridge Plaza II | Suburban Office | Austin, Texas | ||
Westech 360 I-IV | Suburban Office | Austin, Texas | ||
_________________________
(1) | Properties with loans subject to special servicer oversight. |
62
THOMAS PROPERTIES GROUP, INC. AND SUBSIDIARIES
NOTES TO CONSOLIDATED FINANCIAL INFORMATION—(Continued)
2100 JFK Boulevard, which we wholly own, includes a surface parking lot that services the retail tenant at 2121 Market Street. The City National Plaza property also includes an off-site garage that provides parking for City National Plaza and other properties. The office properties typically include on-site parking, retail and storage space.
As of December 31, 2010, we wholly own both Four Points Centre and Campus El Segundo. We have incurred pre-development costs on Metro Studio@Lankershim, which is a potential development on land owned by the Los Angeles Metropolitan Transportation Authority.
We have the responsibility for the day-to-day operations of the California Environmental Protection Agency (“CalEPA”) building, but have no ownership interest in the property. We provide investment advisory services for (1) the California State Teachers' Retirement System (“CalSTRS”) with respect to two properties that are wholly owned by CalSTRS— 800 South Hope Street (Los Angeles, CA) and 1835 Market Street (Philadelphia, PA), (2) a property wholly owned by an affiliate of Lehman Brothers Inc.—816 Congress (Austin, TX), and (3) the properties owned in a joint venture between CalSTRS and us (“TPG/CalSTRS”). In addition, we provide property management, leasing and development services to the properties discussed above, except we do not provide property management services for 2121 Market Street.
2. Summary of Significant Accounting Policies
Principles of Consolidation and Combination
The real estate entities included in the consolidated financial statements have been consolidated only for the periods that such entities were under control by us, or were considered a variable interest entity. The equity method of accounting is utilized to account for investments in real estate entities over which we have significant influence, but not control over major decisions, including the decision to sell or refinance the properties owned by such entities. All significant intercompany balances and transactions have been eliminated in the consolidated financial statements.
During the year ended December 31, 2010, subsidiaries of Thomas Properties and Brandywine Operating Partnership LP ("Brandywine") entered into two partnerships with respect to our One Commerce Square and Two Commerce Square properties. By December 31, 2012, Brandywine will contribute $25 million of preferred equity in return for a 25% limited partnership interest in each property. The preferred equity will be invested in a value-enhancement program designed to increase rental rates and occupancy at Commerce Square. As a result of this transaction, we have concluded that our interest in these two properties is now a variable interest and should continue to be consolidated in accordance with FASB ASC 810 Consolidation ("ASC 810"). The interests in One Commerce Square and Two Commerce Square, which are owned by subsidiaries of Brandywine, are reflected under the "Noncontrolling Interests" caption on our consolidated balance sheet as of December 31, 2010, as of which date, Brandywine had contributed $5.0 million.
Under the provisions of ASC 810, One Commerce Square and Two Commerce Square were deemed to be variable interest entities for which we were considered the primary beneficiary. The total amount of anticipated fees earned from the service contracts by our Company is expected to be significant relative to the total amount of the properties' anticipated economic performance, and are also expected to absorb a significant amount of the variability associated with the properties anticipated economic performance. Additionally, the benefits our Company receives from the service contracts puts our Company in a position where the combined economic benefits of our 75% equity interest in the properties and fees earned from our service contracts with One Commerce Square and Two Commerce Square are significantly greater than our voting interest. Regardless of whether our Company's voting interest is 50% (based on our Company being one of the two partners in the Limited Partnership) or 75% (proportionate to our equity interest in the properties), the fees we receive from the service contracts puts us in a position where the total economic benefits we receive from the One Commerce Square and Two Commerce Square exceed our voting interest.
We consolidate our Murano residential condominium project. Our unaffiliated partner's interest is reflected in our consolidated balance sheets under the "Noncontrolling Interests" caption. After full repayment of the Murano construction loan, which has a balance of $22.2 million at December 31, 2010, net proceeds from the project will be distributed, to the extent available, as follows:
i. | First, to the Company as repayment of our first priority capital and a return on such capital, which has a balance of $7.3 million as of December 31, 2010; |
63
THOMAS PROPERTIES GROUP, INC. AND SUBSIDIARIES
NOTES TO CONSOLIDATED FINANCIAL INFORMATION—(Continued)
ii. | Second, to the Company and our partner equally for repayment of second priority capital and a return on such capital. The Company's share of this tranche is $1.3 million as of December 31, 2010; |
iii. | Third, the next $3.0 million to be split equally between the Company and our partner; |
iv. | Fourth, to the Company for repayment of our original preferred equity contribution and a return on such capital, which has a balance of $30.2 million as of December 31, 2010; |
v. | Fifth, the next $3.0 million to be split equally between the Company and our partner; and |
vi. | Any residual amounts will be allocated to the Company and our partner 73% and 27%, respectively. |
We are the general partner and hold an interest in the Thomas High Performance Green Fund, L.P. ("Green Fund"); the interests not owned by us are reflected in our consolidated balance sheets under the "Noncontrolling Interests" caption. As of December 31, 2010, the Green Fund did not own any real estate assets.
Cash Equivalents
Cash and cash equivalents consist of highly liquid investments with original maturities of three months or less when acquired.
Restricted Cash
Restricted cash consists of security deposits from tenants and deposits from prospective condominium buyers as well as funds required under the terms of certain secured notes payable. There are restrictions on our ability to withdraw these funds other than for their specified usage. See Note 4 for additional information on restrictions under the terms of certain secured notes payable.
Investments in Real Estate
Investments in real estate are stated at cost, less accumulated depreciation, amortization and impairment charges. Depreciation and amortization are recorded on a straight-line basis over the estimated useful lives as follows:
Buildings | 40 to 50 years | |
Building improvements | 5 to 40 years | |
Tenant improvements | Shorter of the useful lives or the terms of the related leases |
Improvements and replacements are capitalized when they extend the useful life, increase capacity or improve the efficiency of the asset. Repairs and maintenance are charged to expense as incurred.
Costs related to the acquisition, development, construction and improvement of properties are capitalized. Interest, real estate taxes, insurance and other development related costs incurred during construction periods are capitalized and depreciated on the same basis as the related assets. Included in investments in real estate is capitalized interest of $18.8 million and $19.6 million as of December 31, 2010 and 2009, respectively. In December 2007, the FASB issued FASB ASC 805-10, “Business Combinations,” to create greater consistency in the accounting and financial reporting of business combinations. FASB ASC 805-10-05 requires a company to recognize the assets acquired, the liabilities assumed, and any noncontrolling interest in the acquired entity to be measured at their fair values as of the acquisition date. FASB ASC 805-10 also requires companies to recognize the fair value of assets acquired, the liabilities assumed and any noncontrolling interest in acquisitions of less than a one hundred percent interest when the acquisition constitutes a change in control of the acquired entity. In addition, FASB ASC 805-10 requires that acquisition-related costs and restructuring costs be recognized separately from the business combination and expensed as incurred. FASB ASC 805-10 is effective for business combinations for which the acquisition date is on or after the beginning of the first annual reporting period beginning after December 15, 2008. The adoption of FASB ASC 805-10 did not have a material impact on our financial position or results of operations.
We consider assets to be held for sale pursuant to the provisions of FASB ASC 360, “Property, Plant and Equipment”. We evaluate the held for sale classification of real estate owned each quarter.
64
THOMAS PROPERTIES GROUP, INC. AND SUBSIDIARIES
NOTES TO CONSOLIDATED FINANCIAL INFORMATION—(Continued)
Unconsolidated Real Estate Entities
Investments in unconsolidated real estate entities are accounted for using the equity method of accounting whereby our investments in partnerships and limited liability companies are recorded at cost and the investment accounts are adjusted for our share of the entities’ income or loss and for distributions and contributions.
We use the equity method to account for our unconsolidated real estate entities since we have significant influence but not control over the entities and none of the entities for which we are considered to be the primary beneficiary.
Impairment of Long-Lived Assets
We assess whether there has been impairment in the value of our long-lived assets whenever events or changes in circumstances indicate the carrying amount of an asset may not be recoverable. Recoverability of assets to be held and used is measured by a comparison of the carrying amount to the future net cash flows, undiscounted and without interest, expected to be generated by the asset. If such assets are considered to be impaired, the impairment to be recognized is measured by the amount by which the carrying amount of the assets exceeds the fair value of the assets. Assets to be disposed of are reported at the lower of the carrying amount or fair value, less costs to sell. We use the equity method of accounting to account for investments in real estate entities over which we have significant influence, but not control over major decisions. In these situations, the unit of account for measurement purposes is the equity investment and not the real estate. Accordingly, if our joint venture investments meet the other-than-temporary criteria of FASB ASC 323, “Investments—Equity Method and Joint Ventures”, we would recognize an impairment loss to the extent the carrying amount exceeded the estimated fair value of our investment.
Included in the consolidated net losses for the years ended December 31, 2010, 2009, and 2008, are pre-tax, non-cash impairment charges of $4.5 million, $13.0 million, and $11.0 million, respectively, related to our Murano condominium project whose units are held for sale. We are required to record the condominium units at their estimated fair value beginning in 2008, as the condominium units met the held for sale criteria of FASB ASC 360, “Property, Plant, and Equipment.” The impairment charge is included in the “Impairment loss” line item in our consolidated statements of operations for the respective years. Also included in “Equity in net loss of unconsolidated real estate entities” in our consolidated statements of operations for the years ended December 31, 2009 and 2008 are pre-tax, non-cash impairment charges of $16.0 million and $1.2 million, respectively, related to our joint venture investments. There was no corresponding non-cash impairment charge for the year ended December 31, 2010. We recorded our share of the impairment loss at the joint venture level as these investments met the other-than-temporary impairment criteria of FASB ASC 323, “Investments—Equity Method and Joint Ventures”.
Deferred Leasing and Loan Costs
Deferred leasing commissions and other direct costs associated with the acquisition of tenants are capitalized and amortized on a straight-line basis over the terms of the related leases. Costs associated with unsuccessful leasing opportunities are expensed. Leasing costs, net of related amortization, totaled $12,127,000 and $13,344,000 as of December 31, 2010 and 2009, respectively, and are included in deferred leasing and loan costs, net of accumulated amortization, in the accompanying consolidated balance sheets. For the years ended 2010 and 2009, amortization of leasing costs were $2,303,000 and $2,065,000, respectively.
Loan costs are capitalized and amortized to interest expense over the terms of the related loans using a method that approximates the effective-interest method. Loan costs, net of related amortization, totaled $1,411,000 and $2,031,000 as of December 31, 2010 and 2009, respectively, and are included in deferred leasing and loan costs, net of accumulated amortization, in the accompanying consolidated balance sheets.
Deferred leasing and loan costs also include the carrying value of acquired in-place leases, which are discussed below.
Purchase Accounting for Acquisition of Interests in Real Estate Entities
Purchase accounting was applied, on a pro rata basis, to the assets and liabilities related to real estate entities for which we acquired interests, based on the percentage interest acquired. For purchases of additional interests that were consummated subsequent to June 30, 2001, the effective date of FASB ASC 805, “Business Combinations”, the fair value of the real estate acquired is allocated to the acquired tangible assets, consisting of land, building, tenant and site improvements, and identified
65
THOMAS PROPERTIES GROUP, INC. AND SUBSIDIARIES
NOTES TO CONSOLIDATED FINANCIAL INFORMATION—(Continued)
intangible assets and liabilities, consisting of the value of above-market and below-market leases, other value of in-place leases and value of tenant relationships, based in each case on their fair values.
The fair value of the tangible assets of an acquired property (which includes land, building, tenant and site improvements) is determined by valuing the property as if it were vacant, and the “as-if-vacant” value is then allocated to land, building, tenant and site improvements based on management’s determination of the relative fair values of these assets. Management determines the as-if-vacant fair value of a property using methods similar to those used by independent appraisers. Factors considered by management in performing these analyses include an estimate of carrying costs during the expected lease-up periods considering current market conditions and costs to execute leases. In estimating carrying costs, management includes real estate taxes, insurance and other operating expenses and estimates of lost rental revenue during the expected lease-up periods based on current market demand. Management also estimates costs to execute leases including leasing commissions, legal and other related costs.
In allocating the fair value of the identified intangible assets and liabilities of an acquired property, above-market and below-market in-place lease values are recorded based on the present value (using an interest rate which reflects the risks associated with the leases acquired) of the difference between (i) the contractual amounts to be paid pursuant to the in-place leases and (ii) management’s estimate of fair market lease rates for the corresponding in-place leases, measured over a period equal to the remaining non-cancelable term of the lease. The capitalized above-market lease values, included in other assets, are amortized as a reduction of rental income over the remaining non-cancelable terms of the respective leases. The capitalized below-market lease values, included in other liabilities, are amortized as an increase to rental income over the terms in the respective leases. As of December 31, 2010 and 2009, we had an asset related to above market leases of $0.6 million and $0.8 million, respectively, net of accumulated amortization of $1.3 million and $1.1 million, respectively, and a liability related to below market leases of $0.5 million and $0.7 million, respectively, net of accumulated accretion of $1.3 million and $1.1 million, respectively. The weighted average amortization period for our above and below market leases was approximately 3.1 years and 3.2 years, respectively as of December 31, 2010 compared to 4.0 years and 3.8 years for the above and below market leases as of December 31, 2009.
The aggregate value of other acquired intangible assets, consisting of in-place leases and tenant relationships, is measured by the excess of (i) the purchase price paid for a property after adjusting existing in-place leases to market rental rates over (ii) the estimated fair value of the property as if vacant, determined as set forth above. This aggregate value is allocated between in-place lease values and tenant relationships based on management’s evaluation of the specific characteristics of each tenant’s lease; however, the value of tenant relationships has not been separated from in-place lease value for the additional interests in real estate entities acquired by us because such value and its consequence to amortization expense is immaterial for these particular acquisitions. Should future acquisitions of properties result in allocating material amounts to the value of tenant relationships, an amount would be separately allocated and amortized over the estimated life of the relationship. The value of in-place leases exclusive of the value of above-market and below-market in-place leases is amortized to depreciation and amortization expense over the remaining non-cancelable periods of the respective leases. If a lease were to be terminated prior to its stated expiration, all unamortized amounts relating to that lease would be written off.
The table below presents the expected amortization related to the acquired in-place lease value and acquired above and below market leases at December 31, 2010:
2011 | 2012 | 2013 | 2014 | 2015 | Thereafter | Total | |||||||||||||||||||||
Amortization expense: | |||||||||||||||||||||||||||
Acquired in-place lease value | $ | 484,091 | $ | 460,842 | $ | 370,418 | $ | 204,087 | $ | 195,018 | $ | 612,650 | $ | 2,327,106 | |||||||||||||
Adjustments to rental revenues | |||||||||||||||||||||||||||
Above market leases | $ | 217,969 | $ | 207,029 | $ | 147,328 | $ | 25,544 | $ | 18,599 | $ | 83 | $ | 616,552 | |||||||||||||
Below market leases | (195,206 | ) | (135,066 | ) | (33,625 | ) | (26,221 | ) | (23,344 | ) | (41,027 | ) | (454,489 | ) | |||||||||||||
Net adjustment to rental revenues | $ | 22,763 | $ | 71,963 | $ | 113,703 | $ | (677 | ) | $ | (4,745 | ) | $ | (40,944 | ) | $ | 162,063 | ||||||||||
Noncontrolling Interests of Unitholders in the Operating Partnership
Noncontrolling interests of unitholders in the Operating Partnership represent the interests in the Operating Partnership units which are held primarily by entities affiliated with Mr. Thomas. The ownership percentage of the noncontrolling interests
66
THOMAS PROPERTIES GROUP, INC. AND SUBSIDIARIES
NOTES TO CONSOLIDATED FINANCIAL INFORMATION—(Continued)
is determined by dividing the number of Operating Partnership units by the total number of shares of common stock and Operating Partnership units outstanding. Net income is allocated based on the ownership percentages. The issuance of additional shares of common stock or Operating Partnership units results in changes to the noncontrolling interests of the Operating Partnership percentage as well as the total net assets to the Company. As a result, all common transactions result in an allocation between equity and noncontrolling interests of the Operating Partnership in the accompanying consolidated balance sheets to account for the change in the noncontrolling interests of the Operating Partnership ownership percentage as well as the change in total net assets of the Company.
Revenue Recognition
All leases are classified as operating leases and minimum rents are recognized on a straight-line basis over the terms of the leases. The impact of the straight line rent adjustment increased revenue by $1,428,000 and $924,000 for the years ended December 31, 2010 and 2009, respectively, and decreased revenue by $3,433,000 for the year ended December 31, 2008. Additionally, the net impact of the amortization of acquired above market leases and acquired below market leases decreased revenue by $2,000 and $23,000 for the years ended December 31, 2010 and 2009, respectively, and increased revenue by $80,000 for the year ended December 31, 2008. The excess of rents recognized over amounts contractually due pursuant to the underlying leases is included in deferred rents in the accompanying consolidated balance sheets and contractually due but unpaid rents are included in rents and other receivables. We also maintain an allowance for doubtful accounts for estimated losses resulting from the inability of tenants to make required rent payments. The computation of this allowance is based on the tenants’ payment history and current credit status, as well as certain industry or specific credit considerations. If estimates of collectability differ from the cash received, then the timing and amount of our reported revenue could be impacted. The credit risk is mitigated by the high quality of the existing tenant base, reviews of prospective tenant’s risk profiles prior to lease execution and continual monitoring of our tenant portfolio to identify potential problem tenants.
Tenant reimbursements for real estate taxes, common area maintenance and other recoverable costs are recognized in the period that the expenses are incurred. Amounts allocated to tenants based on relative square footage are included in the tenant reimbursements caption on the consolidated statements of operations. Revenues generated from requests from tenants, which result in over-standard usage of services are directly billed to the tenants and are also included in the tenant reimbursements caption on the consolidated statements of operations. Lease termination fees, which are included in other income in the accompanying consolidated statements of operations, are recognized when the related leases are canceled and we have no continuing obligation to provide services to such former tenants.
We recognize gains on sales of real estate when the recognition criteria in FASB ASC 360-20-40, “Property, Plant and Equipment”, subsection “Real Estate Sales” have been met, generally at the time title is transferred and we no longer have substantial continuing involvement with the real estate asset sold. If the criteria for profit recognition under the full-accrual method are not met, we defer gain recognition and account for the continued operations of the property by applying the deposit or percentage of completion method, as appropriate, until the appropriate criteria are met. With respect to a parcel we sold at Campus El Segundo in 2006, we deferred a portion of the gain as we were obligated to fund certain infrastructure improvements with respect to the sold parcel; therefore we recognized the deferred gain on the percentage of completion method. The improvements were completed in 2008 and the remaining deferred gain balance was recognized in 2008.
We have one high-rise condominium project for which we used the percentage of completion accounting method to recognize sales revenue and costs during the construction period, up through and including June 30, 2009. Commencing with the third quarter of 2009, we have applied the deposit method of accounting to recognize costs and sales. Under the provisions of FASB ASC 360-20, “Property, Plant and Equipment” subsection “Real Estate and Sales”, revenue and costs for projects are recognized when all parties are bound by the terms of the contract, all consideration has been exchanged, any permanent financing for which the seller is responsible has been arranged and all conditions precedent to closing have been performed. This results in profit from the sale of condominium units recognized at the point of settlement as compared to the point of sale. Revenue is recognized on the contract price of individual units. Total estimated costs, net of impairment charges, are allocated to individual units which have closed on a relative value basis. Total estimated revenue and construction costs are reviewed periodically, and any change is applied to current and future periods.
Forfeited customer deposits are recognized as revenue in the period in which we determine that the customer will not complete the purchase of the condominium unit and when we determine that we have the right to keep the deposit. There were no forfeitures in 2010. For the years ended December 31, 2009 and 2008, there were 17 forfeitures totaling $1,302,000, of which $774,000 was recognized in 2009 and $528,000 was recognized in 2008.
67
THOMAS PROPERTIES GROUP, INC. AND SUBSIDIARIES
NOTES TO CONSOLIDATED FINANCIAL INFORMATION—(Continued)
Investment advisory fees are based on either a percentage of net operating income earned by a property under management or a percentage of the real estate under management, as measured on a fair value basis, and are recorded on a monthly basis as earned. Property management fees are based on a percentage of the revenue earned by a property under management and are recorded on a monthly basis as earned. Generally, 50% of leasing fees are recognized upon the execution of the lease and the remainder upon tenant occupancy unless significant future contingencies exist. Development fees are recognized as the real estate development services are rendered using the percentage-of-completion method of accounting based on total project costs incurred to total estimated costs.
Equity Offering Costs
Underwriting commissions and costs and expenses from our offerings are reflected as a reduction to additional paid-in-capital. In addition, share registration expenses related to the redemption of incentive units as well as other costs of raising capital are reflected as a reduction to additional paid-in-capital.
Income Taxes
We account for income taxes using the asset and liability approach, the objective of which is to establish deferred tax assets and liabilities for the temporary differences between the financial reporting basis and the tax basis of our assets and liabilities, as measured by applying currently enacted tax laws.
FASB ASC 740-10-30-17 “Accounting for Income Taxes,” requires that deferred tax assets be reduced by a valuation allowance if it is more likely than not that some or all of the deferred tax asset will not be realized. Future realization of the deferred tax asset is dependent on the reversal of existing taxable temporary differences, carryback potential, tax-planning strategies and on us generating sufficient taxable income in future years as the deferred income tax charges become currently deductible for tax reporting purposes. As of the years ended December 31, 2010 and December 31, 2009, the Company recorded a full valuation allowance of $12.0 million and $7.4 million, respectively, on a portion of their net deferred tax assets, the Company’s deferred tax assets in excess of their liability for unrecognized tax benefits discussed below, due to uncertainty of future realization.
FASB ASC 740-10-25 clarifies the accounting for uncertainty in income taxes recognized in a company’s financial statements in accordance with FASB ASC 740. The interpretation prescribes a recognition threshold and measurement attribute criteria for the financial statement recognition and measurement of a tax position taken or expected to be taken in a tax return. The interpretation also provides guidance on derecognition, classification, interest and penalties, accounting in interim periods, disclosure and transition.
Earnings (loss) per share
Basic earnings per share, or EPS, is computed by dividing net income (loss) available to common stockholders by the weighted average number of common shares outstanding during the period. Diluted EPS assumes the conversion, exercise or issuance of all potential common stock equivalents unless the effect is to reduce a loss or increase the income per share.
On January 1, 2009, the Company adopted FASB ASC 260-10-45, “Earnings Per Share”, which addresses whether instruments granted in share-based payment transactions are participating securities prior to vesting and, therefore, need to be included in the earnings allocation in computing basic earnings per share under the two-class method. The Company has adjusted its calculation of basic and diluted earnings per share for 2008 to conform to the guidance provided in FASB ASC 260-10-45, which requires retrospective application for all periods presented. The two-class method is an earnings allocation method for calculating earnings per share when a company’s capital structure includes either two or more classes of common stock or common stock and participating securities. Basic earnings per share under the two-class method is calculated based on dividends declared on common shares and other participating securities (“distributed earnings”) and the rights of participating securities in any undistributed earnings, which represents net income remaining after deduction of dividends accruing during the period. The undistributed earnings are allocated to all outstanding common shares and participating securities based on the relative percentage of each security to the total number of outstanding participating securities. Basic earnings per share represents the summation of the distributed and undistributed earnings per share class divided by the total number of shares.
Stock-based Compensation
We recognize stock based compensation in accordance with FASB ASC 718, “Compensation—Stock Compensation”. In
68
THOMAS PROPERTIES GROUP, INC. AND SUBSIDIARIES
NOTES TO CONSOLIDATED FINANCIAL INFORMATION—(Continued)
accordance with FASB ASC 718, we determine the fair value of the stock based compensation grants on the respective grant dates, and recognize to expense the fair value of the grants over the employees’ requisite service periods, which are generally the vesting periods. Our stock based compensation grants include grants of incentive partnership units, restricted stock and stock options. The fair value of incentive partnership units and restricted stock are generally based on the fair value of the Company’s common stock price on the date of grant. Certain of our incentive partnership units and restricted stock grants include performance and market based conditions. Performance based targets are based on individual employee and Company targets, and market based conditions are based on the performance of our stock price. We obtain third party valuations to determine the fair values of the respective performance and market condition based grants. We use the Black-Scholes option pricing model to determine the fair value of our stock options grants.
Noncontrolling Interests and Mandatorily Redeemable Financial Instruments
In accordance with FASB ASC 810, “Consolidation”, the Company reports arrangements with noncontrolling interests as a component of equity separate from the parent's equity. The Company accounts for purchases or sales of equity interests that do not result in a change in control as equity transactions. In addition, net income attributable to the noncontrolling interest is included in consolidated net income on the face of the consolidated statement of operations and, upon a gain or loss of control, the interest purchased or sold, as well as any interest retained, is recorded at its estimated fair value with any gain or loss recognized in earnings.
Accounting for mandatorily redeemable financial instruments, among other things, requires that in specific instances they are classified as liabilities and recorded at their estimated settlement value each reporting period. Certain consolidated joint ventures of the Company have limited-lives and are not considered to be mandatorily redeemable upon final or other specified liquidation events. As of December 31, 2010, the Company has no mandatorily redeemable financial instruments.
Management’s Estimates and Critical Accounting Policies
The preparation of financial statements in conformity with accounting principles generally accepted in the United States of America requires management to make certain estimates and assumptions that affect the reported amounts of assets and liabilities and disclosure of contingent assets and liabilities at the date of the financial statements and the reported amounts of revenues and expenses during the reporting period. Actual results could differ from those estimates.
We have identified certain critical accounting policies that affect management’s more significant judgments and estimates used in the preparation of the consolidated financial statements. On an ongoing basis, we evaluate estimates related to critical accounting policies, including those related to revenue recognition and the allowance for doubtful accounts receivable and investments in real estate and asset impairment. The estimates are based on information that is currently available to us and on various other assumptions that we believe are reasonable under the circumstances.
We must make estimates related to the collectability of accounts receivable related to minimum rent, deferred rent, expense reimbursements, lease termination fees and other income. We specifically analyze accounts receivable and historical bad debts, tenant concentrations, tenant creditworthiness, and current economic trends when evaluating the adequacy of the allowance for doubtful accounts receivable. These estimates have a direct impact on our net income, because a higher bad debt allowance would result in lower net income.
We are required to make subjective assessments as to the useful lives of the properties for purposes of determining the amount of depreciation to record on an annual basis with respect to our investments in real estate. These assessments have a direct impact on our net income because if we were to shorten the expected useful lives of our investments in real estate, we would depreciate such investments over fewer years, resulting in more depreciation expense and lower net income on an annual basis.
We are required to make subjective assessments as to whether there are impairments in the values of our investments in real estate, including real estate held by the unconsolidated real estate entities accounted for using the equity method. These assessments have a direct impact on our net income because recording an impairment loss results in a negative adjustment to net income.
We are required to make subjective assessments as to the fair value of assets and liabilities in connection with purchase accounting related to interests in real estate entities acquired by us. These assessments have a direct impact on our net income subsequent to the acquisition of the interests as a result of depreciation and amortization being recorded on these assets and
69
THOMAS PROPERTIES GROUP, INC. AND SUBSIDIARIES
NOTES TO CONSOLIDATED FINANCIAL INFORMATION—(Continued)
liabilities over the expected lives of the related assets and liabilities. We estimate the fair value of rental properties utilizing a discounted cash flow analysis that includes projections of future revenues, expenses and capital improvement costs, similar to the income approach that is commonly utilized by appraisers.
Recent Accounting Pronouncements
Changes to U.S. generally accepted accounting principles (“GAAP”) are established by the FASB in the form of accounting standards updates (ASUs) to the FASB's Accounting Standards Codification. We consider the applicability and impact of all ASUs. Newly issued ASUs not listed below are expected to have no impact on our consolidated financial position and results of operations, because either the ASU is not applicable or the impact is expected to be immaterial.
In January 2010, we adopted FASB guidance contained in ASU No. 2009-17, "Consolidations (Topic 810): Improvements to Financial Reporting by Enterprises Involved with Variable Interest Entities." This standard requires an enterprise to perform an analysis to determine whether an enterprise's variable interest or interests give it a controlling financial interest in a variable interest entity. Additionally, an enterprise is required to assess whether it has an implicit financial responsibility to ensure that a variable interest entity operates as designed when determining whether it has the power to direct the activities of the variable interest entity that most significantly impact the entity's economic performance. The adoption of this ASU did not have a material impact on the Company's consolidated financial statements.
In January 2010, the FASB issued ASU No. 2010-06, "Fair Value Measurements and Disclosures (Topic 820): Improving Disclosures about Fair Value Measurements." This guidance provides for new disclosures requiring us to (i) disclose separately the amounts of significant transfers in and out of Level 1 and Level 2 fair value measurements and describe the reasons for the transfers and (ii) present separately information about purchases, sales, issuances and settlements in the reconciliation of Level 3 fair value measurements. This guidance also provides clarification of existing disclosures requiring us to (i) determine each class of assets and liabilities based on the nature and risks of the investments rather than by major security type and (ii) for each class of assets and liabilities, disclose the valuation techniques and inputs used to measure fair value for both Level 2 and Level 3 fair value measurements. This ASU is effective for annual and interim reporting periods beginning after December 15, 2009 for most of the new disclosures and for periods beginning after December 15, 2010 for the new Level 3 disclosures. The adoption of this ASU did not have a material impact on the Company's consolidated financial statements as it only addresses disclosures.
In February 2010, the FASB issued ASU No. 2010-09, "Subsequent Events (Topic 855): Amendments to Certain Recognition and Disclosure Requirements." This standard amends the previously issued authoritative guidance for subsequent events and, among other things, exempts SEC registrants from the requirement to disclose the date through which it has evaluated subsequent events for either original or restated financial statements. This standard does not apply to subsequent events or transactions that are within the scope of other applicable GAAP rules that provide different guidance on the accounting treatment for subsequent events or transactions. The adoption of this ASU did not have a material impact on the Company's consolidated financial statements as it only addresses disclosures.
In December 2010, the FASB issued ASU No. 2010-29, "Business Combinations (Topic 805): Disclosure of Supplementary Pro Forma Information for Business Combinations." This guidance clarifies that the disclosure of supplementary proforma information for business combinations should be presented such that revenues and earnings of the combined entity are calculated as though the relevant business combinations that occurred during the current reporting period had occurred as of the beginning of the comparable prior annual reporting period. The guidance also improves the usefulness of the supplementary proforma information by requiring a description of the nature and amount of material, non-recurring proforma adjustments that are directly attributable to the business combinations. The adoption of this ASU did not have a material impact on our financial position or results of operations.
Reclassifications
Certain prior year amounts have been reclassified to conform to the current year presentation.
Segment Disclosure
FASB ASC 280, “Segment Reporting”, established standards for disclosure about operating segments and related disclosures about products and services, geographic areas and major customers. We currently operate in one operating segment: the acquisition, development, ownership, and management of commercial real estate. Additionally, we operate in one
70
THOMAS PROPERTIES GROUP, INC. AND SUBSIDIARIES
NOTES TO CONSOLIDATED FINANCIAL INFORMATION—(Continued)
geographic area: the United States.
Our office portfolio includes revenues from the rental of office space to tenants, parking, rental of storage space and other tenant services.
Concentration of Credit Risk
Financial instruments that subject us to credit risk consist primarily of cash and accounts receivable. We maintain our unrestricted cash and restricted cash on deposit with high quality financial institutions. Some account balances exceed Federal Deposit Insurance Corporation (“FDIC”) insurance coverage or are not eligible for FDIC insurance coverage, and, as a result, there is a concentration of credit risk related to amounts on deposit in excess of or not covered by FDIC insurance. Our cash equivalents are typically invested in AAA-rated short-term instruments, which provide daily liquidity.
We have two operating properties and one unconsolidated operating property located in downtown Philadelphia, Pennsylvania. In addition, the Murano residential high-rise project consists of condominium units held for sale in downtown Philadelphia, Pennsylvania. The ability of the tenants to honor the terms of their respective leases, and the ability of prospective buyers to close on the acquisition of a condominium unit, is dependent upon the economic, regulatory and social factors affecting the communities in which the tenants operate.
We generally require either a security deposit, letter of credit or a guarantee from our tenants. We require a 15% cumulative deposit of prospective buyers of our Murano condominium project, which is essentially non-refundable except in cases of our non-performance.
3. Unconsolidated Real Estate Entities
The unconsolidated real estate entities include our share of the entities that own 2121 Market Street, the TPG/CalSTRS properties and the Austin Portfolio Joint Venture properties. TPG/CalSTRS owns the following properties:
• | City National Plaza (acquired January 2003) |
• | Reflections I (acquired October 2004) |
• | Reflections II (acquired October 2004) |
• | Four Falls Corporate Center (acquired March 2005) (1) |
• | Oak Hill Plaza (acquired March 2005) (1) |
• | Walnut Hill Plaza (acquired March 2005) (1) |
• | San Felipe Plaza (acquired August 2005) |
• | 2500 City West (acquired August 2005) |
• | Brookhollow Central I, II and III (acquired August 2005) |
• | CityWestPlace land (acquired December 2005) |
• | CityWestPlace (acquired June 2006) |
• | Centerpointe I and II (acquired January 2007) |
• | Fair Oaks Plaza (acquired January 2007) |
The following investment entity that held a mortgage loan receivable related to Brookhollow Central was accounted for using the equity method of accounting. The note receivable held by this subsidiary was paid off and this entity was dissolved during the year ended December 31, 2010:
• | BH Note B Lender, LLC (formed in October 2008) |
TPG/CalSTRS also owns a 25% interest in the Austin Portfolio Joint Venture which owns the following properties that were acquired in June 2007:
• | San Jacinto Center |
• | Frost Bank Tower |
• | One Congress Plaza |
• | One American Center |
• | 300 West 6th Street |
• | Research Park Plaza I & II |
• | Park Centre |
• | Great Hills Plaza |
• | Stonebridge Plaza II |
71
THOMAS PROPERTIES GROUP, INC. AND SUBSIDIARIES
NOTES TO CONSOLIDATED FINANCIAL INFORMATION—(Continued)
• | Westech 360 I-IV |
(1) Properties with loans subject to special servicer oversight.
Capital contributions, distributions, and profits and losses of the real estate entities are allocated in accordance with the terms of the applicable partnership and limited liability company agreements. Such allocations may differ from the stated ownership percentage interests in such entities as a result of preferred returns and allocation formulas as described in the partnership and limited liability company agreements. Following are the stated ownership percentages, prior to any preferred or special allocations, as of December 31, 2010.
2121 Market Street | 50.00 | % |
TPG/CalSTRS: | ||
Austin Portfolio Joint Venture Properties | 6.25 | % |
City National Plaza | 7.94 | % |
All properties, excluding Austin Portfolio Joint Venture and City National Plaza (1) | 25.00 | % |
(1) With respect to Centerpointe I and II, TPG has a 5% interest in the preferred equity and a 25% interest in the residual equity. | ||
[space intentionally left blank]
72
THOMAS PROPERTIES GROUP, INC. AND SUBSIDIARIES
NOTES TO CONSOLIDATED FINANCIAL INFORMATION—(Continued)
Investments in unconsolidated real estate entities as of December 31, 2010 and 2009 are as follows (in thousands):
December 31, 2010 | December 31, 2009 | ||||||
TPG/CalSTRS: | |||||||
BH Note B Lender | $ | — | $ | 802 | |||
City National Plaza | (22,967 | ) | (19,451 | ) | |||
Reflections I | 1,581 | 1,602 | |||||
Reflections II | 1,810 | 1,721 | |||||
Four Falls Corporate Center | (3,397 | ) | (3,292 | ) | |||
Oak Hill Plaza/Walnut Hill Plaza | (2,847 | ) | (1,622 | ) | |||
San Felipe Plaza | 3,498 | 2,789 | |||||
2500 City West | 1,656 | 784 | |||||
Brookhollow Central I, II and III | 9,089 | 378 | |||||
CityWestPlace and CityWestPlace Land | 21,963 | 21,422 | |||||
Centerpointe I & II | (2,241 | ) | (6,403 | ) | |||
Fair Oaks Plaza | 1,738 | 2,106 | |||||
TPG/CalSTRS | (319 | ) | 3,442 | ||||
9,564 | 4,278 | ||||||
Austin Portfolio Joint Venture: | |||||||
Austin Portfolio Investor | (104 | ) | (1,650 | ) | |||
Frost Bank Tower | 1,114 | 2,351 | |||||
300 West 6th Street | 546 | 1,892 | |||||
San Jacinto Center | 1,170 | 1,574 | |||||
One Congress Plaza | 1,017 | 1,922 | |||||
One American Center | 831 | 1,662 | |||||
Stonebridge Plaza II | 119 | 694 | |||||
Park Centre | 1,069 | 666 | |||||
Research Park Plaza I & II | 753 | 872 | |||||
Westech 360 I-IV | 1,001 | 408 | |||||
Great Hills Plaza | 790 | 330 | |||||
Austin Portfolio Lender | 2,420 | 1,351 | |||||
10,726 | 12,072 | ||||||
2121 Market Street and Harris Building Associates | (2,315 | ) | (1,892 | ) | |||
$ | 17,975 | $ | 14,458 | ||||
73
THOMAS PROPERTIES GROUP, INC. AND SUBSIDIARIES
NOTES TO CONSOLIDATED FINANCIAL INFORMATION—(Continued)
The following is a summary of the investments in unconsolidated real estate entities for the years ended December 31, 2010, 2009, and 2008 (in thousands):
Investment balance, December 31, 2007 | $ | 42,211 | |
Contributions, including $714 for acquisition of Brookhollow Note B loan | 1,965 | ||
Equity in net loss of unconsolidated real estate entities | (12,828 | ) | |
Other comprehensive income | 22 | ||
Distributions | (4,567 | ) | |
Fair market value change of redeemable noncontrolling interest | 2,295 | ||
Investment balance, December 31, 2008 | $ | 29,098 | |
Contributions | 5,600 | ||
Other comprehensive income | 175 | ||
Equity in net loss of unconsolidated real estate entities | (16,236 | ) | |
Distributions | (5,161 | ) | |
Redemption of redeemable noncontrolling interest | 982 | ||
Investment balance, December 31, 2009 | $ | 14,458 | |
Contributions | 15,575 | ||
Other comprehensive income | 107 | ||
Equity in net loss of unconsolidated real estate entities | (1,184 | ) | |
Distributions | (10,970 | ) | |
Other | (11 | ) | |
Investment balance, December 31, 2010 | $ | 17,975 | |
TPG/CalSTRS was formed to acquire office properties on a nationwide basis classified as moderate risk (core plus) and high risk (value add) properties. Core plus properties consist of under-performing properties that we believe can be brought to market potential through improved management. Value-add properties are characterized by unstable net operating income for an extended period of time, occupancy less than 90% and/or physical or management problems which we believe can be positively impacted by introduction of new capital and/or management. We are required to use diligent efforts to sell each joint venture property within five years of that property reaching stabilization, except for certain stabilized properties, as to which we are required to perform a hold/sell analysis at least annually and make a recommendation to the TPG/CalSTRS’ management committee regarding the appropriate holding period.
The total capital commitment to the joint venture was $511.7 million as of December 31, 2010, of which approximately $24.9 million and $13.9 million was unfunded by CalSTRS and us, respectively.
A buy-sell provision may be exercised by either CalSTRS or us. Under this provision, the initiating party sets a price for its interest in the joint venture, and the other party has a specified time to elect to either buy the initiating party's interest or to sell its own interest to the initiating party. Upon the occurrence of certain events, CalSTRS also has a buy-out option to purchase our interest in the joint venture. The buyout price is based upon a 3% discount to the appraised fair market value.
During the second quarter of 2009, TPG/CalSTRS redeemed a 15% membership interest held by a noncontrolling owner in the City National Plaza (“CNP”) partnership. The redemption price of $19.8 million was financed with a promissory note issued by the former partner and due in 2012.
During the first quarter of 2010, CalSTRS, our partner in CNP, acquired all of the property's mezzanine debt. On July 6, 2010, CalSTRS contributed this debt to the equity in TPG/CalSTRS, reducing the leverage on CNP by the full $219.1 million balance on the mezzanine loans. Solely with respect to the interest of TPG/CalSTRS in CNP, CalSTRS' percentage interest increased from 75% to 92.1% and TPG's percentage interest decreased from 25% to 7.9%. We are in discussions with CalSTRS to obtain an option to participate in up to an additional 17.1% interest in CNP through TPG/CalSTRS. On July 6, 2010, a subsidiary of TPG/CalSTRS that owns CNP entered into a new non-recourse first mortgage loan in the amount of $350.0 million. The loan bears interest at a fixed rate of 5.9% and is for a term of ten years, to mature on July 1, 2020.
On October 19, 2010, TPG/CalSTRS invested $40.0 million as new equity in our Centerpointe partnership, which was used to retire $46.6 million of mezzanine debt, realizing a 14.2% discount from the face amount of the debt which included
74
THOMAS PROPERTIES GROUP, INC. AND SUBSIDIARIES
NOTES TO CONSOLIDATED FINANCIAL INFORMATION—(Continued)
releasing loan reserves of approximately $11.7 million held by the lenders to TPG/CalSTRS to use for capital needs at the property. This new equity, of which the Company contributed $2.0 million or 5%, will be treated as preferred equity with a priority on distributions of available project cash and capital proceeds. Prior to February 9, 2012, we have the right to increase our interest percentage in preferred equity to 25%, and commensurately reduce CalSTRS' interest percentage in preferred equity to 75%, by contributing to the Centerpointe partnership an amount equal to 20% of the face amount of the retired debt, equal to approximately $9.3 million. After February 9, 2012, the Company may be required, at the election of CalSTRS, to increase its interest in the preferred equity to 25%, and commensurately reduce CalSTRS' interest to 75%, by contributing an amount equal to approximately $9.3 million. The contribution to increase our interest percentage would be distributed to CalSTRS.
As of January 1, 2010, in connection with the adoption of the updated provisions of ASC 810, pursuant to FASB No. 167, which amends FIN 46(R), TPG/CalSTRS and the Austin Portfolio Joint Venture were deemed to be variable interest entities for which we were not considered to be the primary beneficiary. In connection with the TPG/CalSTRS joint venture, CalSTRS and TPG acting together are considered to have the power to direct the activities of the joint venture that most significantly impact the joint venture economic performance and therefore neither TPG nor CalSTRS is considered to be the primary beneficiary. We determined the key activities that drive the economic performance of the joint venture to be (1) the acquisition and development of real estate (including capital improvements), (2) financing, and (3) leasing. In connection with these key activities, the TPG/CalSTRS venture agreement requires unanimous approval by the two members.
In connection with the Austin Portfolio Joint Venture, TPG/CalSTRS was not considered to be the primary beneficiary due to the fact that the power to direct the activities of the joint venture is shared among multiple unrelated parties such that no one party has the power to direct the activities of the joint venture that most significantly impact the joint venture's economic performance. In connection with the Austin Portfolio Joint Venture, we determined the key activities that drive the economic performance of the joint venture to be (1) the acquisition and development of real estate (including capital improvements), (2) financing, and (3) leasing. In connection with these key activities, the Austin Portfolio Joint Venture partnership agreement requires either unanimous or majority approval of decisions by the respective partners. We therefore determined the power to direct the activities to be shared amongst the partners so that no one partner has the power to direct the activities that most significantly impact the partnership's economic performance. As of December 31, 2010, our total maximum exposure to loss to TPG/CalSTRS and the Austin Portfolio Joint Venture is:
(1) Our equity investment in the various properties controlled by TPG/CalSTRS and the Austin Portfolio Joint Venture as of December 31, 2010, which was $20.3 million, as presented earlier in this note.
(2) The potential loss of future fee revenues which we earn in connection with the management and leasing agreements with the various properties controlled by the respective joint ventures. We earn fee revenues in connection with those management and leasing agreements for services such as property management, leasing, asset management and property development. The management and leasing agreements with the various properties generally expire on an annual basis and are automatically renewed for successive periods of one year each, unless we elect not to renew the agreements. As of December 31, 2010, we had total receivables of $1.6 million and $1.3 million related to TPG/CalSTRS and the Austin Portfolio Joint Venture, respectively.
(3) Unfunded capital commitments to the TPG/CalSTRS joint venture was $13.9 million as of December 31, 2010. There were no unfunded capital commitments to the Austin Portfolio Joint Venture as of December 31, 2010, however, TPG has committed to advance funds to the Austin Portfolio Joint Venture under a senior secured priority facility established and funded on a pro rata basis by all of the Austin Portfolio Joint Venture partners, of which our unfunded share is $1.7 million. As of December 31, 2010, approximately $33.0 million of the senior secured priority facility has been advanced by the partners, of which the Company has advanced $2.1 million. The funds advanced under the senior secured priority facility are a first priority mortgage lien on three of the Austin buildings and a first priority right to payment on a pledge of the equity interests in the other seven Austin buildings owned by the Austin Partnership.
On March 6, 2010, an aggregate of $96.5 million in mortgage loans owed by subsidiaries of TPG/CalSTRS (the “borrowers”) on unconsolidated properties at Four Falls Corporate Center, Oak Hill Plaza, and Walnut Hill Plaza matured and became due in full. The borrowers under these loans elected not to make payment on these loans and they are currently in default. These loans are non-recourse to the borrowers and the Company, both of which do not anticipate making any payments or equity contributions to support the repayment or refinancing of these loans. The borrowers are currently in discussions with the special servicer regarding a cooperative resolution including the likely appointment of a receiver and the judicial transfer of the properties. We do not believe that the loss of our equity interests in these properties or our fee revenue from these properties will have a material effect on our business or results of operations. For the year ended December 31, 2010, we recognized
75
THOMAS PROPERTIES GROUP, INC. AND SUBSIDIARIES
NOTES TO CONSOLIDATED FINANCIAL INFORMATION—(Continued)
property management fees from these properties of $0.7 million.
Following is summarized financial information for the unconsolidated real estate entities as of December 31, 2010 and 2009 and for the years ended December 31, 2010, 2009 and 2008 (in thousands):
Summarized Balance Sheets
2010 | 2009 | ||||||
ASSETS | |||||||
Investments in real estate, net | $ | 2,169,185 | $ | 2,224,709 | |||
Land held for sale | — | 3,853 | |||||
Receivables including deferred rents, net | 103,618 | 83,506 | |||||
Deferred leasing and loan costs, net | 134,889 | 144,287 | |||||
Other assets | 95,477 | 127,727 | |||||
Total assets | $ | 2,503,169 | $ | 2,584,082 | |||
LIABILITIES AND OWNERS’ EQUITY | |||||||
Mortgage and other secured loans | $ | 1,925,798 | $ | 2,217,118 | |||
Below market rents, net | 48,337 | 62,527 | |||||
Other liabilities | 101,127 | 98,401 | |||||
Total liabilities | 2,075,262 | 2,378,046 | |||||
Owners’ equity: | |||||||
Thomas Properties, including $25 and $133 of other comprehensive loss as of 2010 and 2009, respectively | 16,294 | 21,242 | |||||
Other owners, including $103 and $1,171 of other comprehensive loss as of 2010 and 2009, respectively | 411,613 | 184,794 | |||||
Total owners’ equity | 427,907 | 206,036 | |||||
Total liabilities and owners’ equity | $ | 2,503,169 | $ | 2,584,082 | |||
76
THOMAS PROPERTIES GROUP, INC. AND SUBSIDIARIES
NOTES TO CONSOLIDATED FINANCIAL INFORMATION—(Continued)
Summarized Statements of Operations
2010 | 2009 | 2008 | |||||||||
Revenues | $ | 316,881 | $ | 324,694 | $ | 322,553 | |||||
Expenses: | |||||||||||
Operating and other expenses | 162,190 | 166,575 | 170,019 | ||||||||
Interest expense | 108,445 | 104,105 | 126,386 | ||||||||
Depreciation and amortization | 111,677 | 120,129 | 125,565 | ||||||||
Impairment loss | — | 59,133 | — | ||||||||
Total expenses | 382,312 | 449,942 | 421,970 | ||||||||
Loss from continuing operations | (65,431 | ) | (125,248 | ) | (99,417 | ) | |||||
Gain on extinguishment of debt | 11,794 | 67,017 | — | ||||||||
Impairment loss—unconsolidated real estate entities | — | (4,911 | ) | (4,840 | ) | ||||||
Loss from discontinued operations | — | (83 | ) | (104 | ) | ||||||
Net loss | $ | (53,637 | ) | $ | (63,225 | ) | $ | (104,361 | ) | ||
Thomas Properties’ share of net loss, prior to intercompany eliminations | $ | (4,659 | ) | $ | (19,794 | ) | $ | (16,168 | ) | ||
Intercompany eliminations | 3,475 | 3,558 | 3,340 | ||||||||
Equity in net loss of unconsolidated real estate entities | $ | (1,184 | ) | $ | (16,236 | ) | $ | (12,828 | ) | ||
Included in the preceding summarized balance sheets as of December 31, 2010 and 2009, are the following balance sheets of TPG/CalSTRS, LLC (in thousands):
2010 | 2009 | ||||||
ASSETS | |||||||
Investments in real estate, net | $ | 1,117,889 | $ | 1,145,163 | |||
Land held for sale | — | 3,853 | |||||
Receivables including deferred rents, net | 81,785 | 70,237 | |||||
Investments in unconsolidated real estate entities | 44,087 | 50,844 | |||||
Deferred leasing and loan costs, net | 80,029 | 79,640 | |||||
Other assets | 74,312 | 98,293 | |||||
Total assets | $ | 1,398,102 | $ | 1,448,030 | |||
LIABILITIES AND MEMBERS’ EQUITY | |||||||
Mortgage and other secured loans | $ | 1,043,692 | $ | 1,346,319 | |||
Other liabilities | 65,254 | 59,843 | |||||
Total liabilities | 1,108,946 | 1,406,162 | |||||
Members’ equity: | |||||||
Thomas Properties, including $25 and $133 of other comprehensive loss as of 2010 and 2009, respectively | 14,843 | 22,193 | |||||
CalSTRS, including $77 and $397 of other comprehensive loss as of 2010 and 2009, respectively | 274,313 | 19,675 | |||||
Total members’ equity | 289,156 | 41,868 | |||||
Total liabilities and members’ equity | $ | 1,398,102 | $ | 1,448,030 | |||
77
THOMAS PROPERTIES GROUP, INC. AND SUBSIDIARIES
NOTES TO CONSOLIDATED FINANCIAL INFORMATION—(Continued)
Following is summarized financial information by real estate entity for the years ended December 31, 2010, 2009 and 2008 (in thousands):
Year ended December 31, 2010 | |||||||||||||||||||
2121 Market Street and Harris Building Associates | TPG/ CalSTRS, LLC | Austin Portfolio Properties | Eliminations | Total | |||||||||||||||
Revenues (1) | $ | 3,784 | $ | 206,103 | $ | 107,608 | $ | (614 | ) | $ | 316,881 | ||||||||
Expenses: | |||||||||||||||||||
Operating and other expenses | 1,460 | 111,106 | 51,262 | (1,638 | ) | 162,190 | |||||||||||||
Interest expense | 1,159 | 57,111 | 50,175 | — | 108,445 | ||||||||||||||
Depreciation and amortization | 938 | 61,512 | 49,227 | — | 111,677 | ||||||||||||||
Total expenses | 3,557 | 229,729 | 150,664 | (1,638 | ) | 382,312 | |||||||||||||
Income (loss) from continuing operations | 227 | (23,626 | ) | (43,056 | ) | 1,024 | (65,431 | ) | |||||||||||
Gain on extinguishment of debt | — | 11,794 | — | — | 11,794 | ||||||||||||||
Equity in net loss of unconsolidated real estate entities | — | (6,924 | ) | — | 6,924 | — | |||||||||||||
Net income (loss) | $ | 227 | $ | (18,756 | ) | $ | (43,056 | ) | $ | 7,948 | $ | (53,637 | ) | ||||||
Thomas Properties’ share of net income (loss) | $ | 113 | $ | (2,081 | ) | $ | (2,691 | ) | $ | — | $ | (4,659 | ) | ||||||
Intercompany eliminations | 3,475 | ||||||||||||||||||
Equity in net loss of unconsolidated real estate entities | $ | (1,184 | ) | ||||||||||||||||
Year ended December 31, 2009 | |||||||||||||||||||
2121 Market Street and Harris Building Associates | TPG/ CalSTRS, LLC | Austin Portfolio Properties | Eliminations | Total | |||||||||||||||
Revenues (1) | $ | 3,578 | $ | 203,079 | $ | 118,037 | $ | — | $ | 324,694 | |||||||||
Expenses: | |||||||||||||||||||
Operating and other expenses | 1,362 | 111,858 | 53,355 | — | 166,575 | ||||||||||||||
Interest expense | 1,154 | 49,541 | 53,410 | — | 104,105 | ||||||||||||||
Depreciation and amortization | 973 | 64,260 | 54,896 | — | 120,129 | ||||||||||||||
Impairment loss—property level | — | 59,133 | — | — | 59,133 | ||||||||||||||
Total expenses | 3,489 | 284,792 | 161,661 | — | 449,942 | ||||||||||||||
Income (loss) from continuing operations | 89 | (81,713 | ) | (43,624 | ) | — | (125,248 | ) | |||||||||||
Gain on extinguishment of debt | — | — | 67,017 | — | 67,017 | ||||||||||||||
Equity in net loss of unconsolidated real estate entities (2) | — | 1,834 | — | (6,745 | ) | (4,911 | ) | ||||||||||||
Loss from discontinued operations | — | (83 | ) | — | — | (83 | ) | ||||||||||||
Net income (loss) | $ | 89 | $ | (79,962 | ) | $ | 23,393 | $ | (6,745 | ) | $ | (63,225 | ) | ||||||
Thomas Properties’ share of net income (loss) | $ | 45 | $ | (21,301 | ) | $ | 1,462 | $ | — | $ | (19,794 | ) | |||||||
Intercompany eliminations | 3,558 | ||||||||||||||||||
Equity in net loss of unconsolidated real estate entities | $ | (16,236 | ) | ||||||||||||||||
78
THOMAS PROPERTIES GROUP, INC. AND SUBSIDIARIES
NOTES TO CONSOLIDATED FINANCIAL INFORMATION—(Continued)
Year ended December 31, 2008 | |||||||||||||||||||
2121 Market Street and Harris Building Associates | TPG/ CalSTRS, LLC | Austin Portfolio Properties | Eliminations | Total | |||||||||||||||
Revenues (1) | $ | 3,602 | $ | 201,316 | $ | 117,635 | $ | — | $ | 322,553 | |||||||||
Expenses: | |||||||||||||||||||
Operating and other expenses | 1,453 | 114,579 | 53,987 | — | 170,019 | ||||||||||||||
Interest expense | 1,203 | 67,102 | 58,081 | — | 126,386 | ||||||||||||||
Depreciation and amortization | 2,371 | 63,690 | 59,504 | — | 125,565 | ||||||||||||||
Total expenses | 5,027 | 245,371 | 171,572 | — | 421,970 | ||||||||||||||
Loss from continuing operations | (1,425 | ) | (44,055 | ) | (53,937 | ) | — | (99,417 | ) | ||||||||||
Equity in net loss of unconsolidated real estate entities (2) | — | (18,123 | ) | — | 13,283 | (4,840 | ) | ||||||||||||
Loss from discontinued operations | — | (104 | ) | — | — | (104 | ) | ||||||||||||
Net (loss) income | $ | (1,425 | ) | $ | (62,282 | ) | $ | (53,937 | ) | $ | 13,283 | $ | (104,361 | ) | |||||
Thomas Properties’ share of net loss | $ | (707 | ) | $ | (12,200 | ) | $ | (3,261 | ) | $ | — | $ | (16,168 | ) | |||||
Intercompany eliminations | 3,340 | ||||||||||||||||||
Equity in net loss of unconsolidated real estate entities | $ | (12,828 | ) | ||||||||||||||||
_________________________
(1) Total includes interest income of $85, $262 and $1,165 for the years ended December 31, 2010, 2009 and 2008, respectively.
(2) The total amounts of $(4,911) and $(4,840) for the years ended December 31, 2009 and 2008, respectively, represent impairment of TPG/CalSTRS’ investment in the Austin Portfolio Joint Venture.
For the years ended December 31, 2010, 2009 and 2008, there were no tenants accounting for 10% or more, of rent and tenant reimbursements (excluding tenant reimbursements for over-standard usage of certain operating expenses) of TPG/CalSTRS.
Following is a reconciliation of our share of owners’ equity of the unconsolidated real estate entities as shown above to amounts recorded by us as of December 31, 2010 and 2009:
2010 | 2009 | ||||||
Our share of owners’ equity recorded by unconsolidated real estate entities | $ | 16,294 | $ | 21,242 | |||
Intercompany eliminations and other adjustments | 1,681 | (6,784 | ) | ||||
Investments in unconsolidated real estate entities | $ | 17,975 | $ | 14,458 | |||
4. Mortgage and Other Secured Loans
A summary of the outstanding mortgage and other secured loans as of December 31, 2010 and 2009 is as follows (in thousands). None of these loans are recourse to us, except that we have guaranteed the Campus El Segundo mortgage loan and partially guaranteed the Four Points Centre construction loan, under which our liability is currently limited to a maximum of $11.0 million. In connection with some of the loans listed in the table below, our operating partnership is subject to customary non-recourse carve out obligations.
79
THOMAS PROPERTIES GROUP, INC. AND SUBSIDIARIES
NOTES TO CONSOLIDATED FINANCIAL INFORMATION—(Continued)
Outstanding Debt | Maturity Date | Maturity Date at End of Extension Options | ||||||||||||
Secured Debt | Interest Rate at December 31, 2010 | As of December 31, 2010 | As of December 31, 2009 | |||||||||||
One Commerce Square mortgage loan (1) | 5.7% | $ | 130,000 | $ | 130,000 | 1/6/2016 | 1/6/2016 | |||||||
Two Commerce Square mortgage loan (2) | 6.3% | 107,612 | 108,104 | 5/9/2013 | 5/9/2013 | |||||||||
Campus El Segundo mortgage loan (3) | LIBOR + 3.75% | 17,000 | 17,000 | 7/31/2011 | 7/31/2014 | |||||||||
Four Points Centre construction loan (4) | LIBOR + 3.50% | 23,687 | 26,177 | 7/31/2012 | 7/31/2014 | |||||||||
Murano construction loan (5) | 9.50% | 22,237 | 36,955 | 7/31/2011 | 7/31/2012 | |||||||||
Total secured debt | $ | 300,536 | $ | 318,236 | ||||||||||
_________________________
(1) | The mortgage loan is subject to interest only payments through January 2011, and thereafter, principal and interest payments are due based on a thirty-year amortization schedule. The loan may be defeased, and is subject to yield maintenance payments for any prepayments prior to October 2015. |
(2) | The mortgage loan may be defeased, and beginning February 2012, may be prepaid. |
(3) | The interest rate as of December 31, 2010 was 4.1% per annum. The loan is scheduled to mature on July 31, 2011 with three one-year extension options, at our election, subject to us complying with certain covenants, with a final maturity date of July 31, 2014 if all extension options are exercised. We have guaranteed 100% of the principal, interest and any other sum payable under this loan. We have agreed to certain financial covenants on this loan as the guarantor, which we were in compliance with as of December 31, 2010. |
(4) | The loan has an unfunded commitment of $9.0 million which is available to fund any remaining project costs on two office buildings. The interest rate as of December 31, 2010 was 3.8% per annum. The loan is scheduled to mature on July 31, 2012 with two one-year extension options at our election subject to certain conditions. We have provided a repayment and completion guaranty up to 46.5% of the balance of the outstanding principal, interest and any other sum payable under this loan. We have also provided collateral of approximately 62.4 acres of fully entitled unimproved land, which is immediately adjacent to our Four Points Centre office buildings located in Austin, Texas. We paid down the principal amount of the loan by $3.9 million during 2010. We have agreed to certain financial covenants on this loan as the guarantor, which we were in compliance with during 2010. As of May 31, 2011, if the Four Points office buildings are not at least 65% leased on terms consistent with the appraisal pro forma, we must pre-fund 18 months of interest into a restricted cash account with the lender; if the buildings are less than 35% leased at that time, we will also have to pay $2.0 million as a principal reduction of the loan. |
(5) | On July 26, 2010, the Company extended the Murano condominium construction loan with the lender, for one year to July 31, 2011, with the right to two six-month extensions. The loan will bear interest at the greater of 9.5% or three month LIBOR plus 3.25%. We have no guarantees on this debt other than the payment of interest through the maturity date. Both six-month extensions require payment of an extension fee equal to 1% of the unpaid principal balance as of July 1, 2011 and January 1, 2012, respectively. The first six-month extension is also subject to a “loan exposure” measurement whereby the outstanding principal balance of the loan divided by saleable square footage of the units yet to settle shall be no greater than $150 per saleable square foot. If the loan exposure measurement is not met, then the borrower must make a payment to achieve the $150 per saleable square foot requirement to qualify for the extension. If the rebalancing had been done as of December 31, 2010, based on the number of units yet to settle as of December 31, 2010, the loan balance would need to be reduced from $22.2 million to $15.6 million to meet the loan exposure limitation. |
The loan agreements for One Commerce Square and Two Commerce Square require that all receipts collected from these properties be deposited in lockbox accounts under the control of the lenders to fund reserves such as capital improvements, taxes, insurance, leasing commissions, debt service and operating expenditures. Included in restricted cash on our consolidated balance sheet at December 31, 2010 and 2009, are lockbox, reserve funds and/or security deposits as follows (in thousands):
80
THOMAS PROPERTIES GROUP, INC. AND SUBSIDIARIES
NOTES TO CONSOLIDATED FINANCIAL INFORMATION—(Continued)
2010 | 2009 | ||||||
One Commerce Square | $ | 5,682 | $ | 5,315 | |||
Two Commerce Square | 7,325 | 5,161 | |||||
Murano | 62 | 1,595 | |||||
Restricted cash - consolidated properties | $ | 13,069 | $ | 12,071 | |||
As of December 31, 2010, subject to certain extension options exercisable by the Company, principal payments due for the secured outstanding debt are as follows (in thousands):
Amount Due at Original Maturity Date | Amount Due at Maturity Date After Exercise of Extension Options | ||||||
2011 | $ | 41,208 | $ | 1,971 | |||
2012 | 25,847 | 24,397 | |||||
2013 | 108,392 | 108,392 | |||||
2014 | 1,884 | 42,571 | |||||
2015 | 1,996 | 1,996 | |||||
Thereafter | 121,209 | 121,209 | |||||
$ | 300,536 | $ | 300,536 | ||||
5. Unsecured Loan
In October 2005, we purchased the entire interest of our unaffiliated partner in TPG-El Segundo Partners, LLC, of which $3.9 million was financed with an unsecured loan from this former partner. Principal and accrued interest on this loan had a scheduled maturity of October 12, 2009. The final installment of principal and interest was paid on April 3, 2009. We recognized $0.5 million gain on early extinguishment of debt related to this loan.
6. Earnings (Loss) per Share
On January 1, 2009, the Company adopted FASB ASC 260-10-45, “Earnings Per Share”, which addresses whether instruments granted in share-based payment transactions are participating securities prior to vesting and, therefore, need to be included in the earnings allocation in computing basic earnings per share under the two-class method. The Company has granted restricted stock and incentive partnership units to employees in connection with stock based compensation. The restricted stock and incentive partnership units are considered to be participating securities because they have non-forfeitable rights to dividends. The Company has adjusted its calculation of basic and diluted earnings per share for 2008 to conform to the guidance provided in FASB ASC 260-10-45, which requires retrospective application for all periods presented. The change in calculating basic and diluted earnings per share pursuant to the adoption of FASB ASC 260-10-45 changed the amounts previously reported for both basic and diluted earnings per share for the year ended December 31, 2008 by $(0.01) per share.
The two-class method is an earnings allocation method for calculating earnings per share when a company’s capital structure includes either two or more classes of common stock or common stock and participating securities. Basic earnings per share under the two-class method is calculated based on dividends declared on common shares and other participating securities (“distributed earnings”) and the rights of common shares and participating securities in any undistributed earnings, which represents net income remaining after deduction of dividends accruing during the respective period. The undistributed earnings are allocated to all outstanding common shares and participating securities based on the relative percentage of each security to the total number of outstanding securities. Basic earnings per common share and participating security represent the summation of the distributed and undistributed earnings per common share and participating security divided by the total weighted average number of common shares outstanding and the total weighted average number of participating securities outstanding during the respective years. We only present the earnings per share attributable to the common shareholders.
For the years ended December 31, 2009 and 2008, the Company incurred losses and paid dividends. The net losses, after deducting the dividends to participating securities, are allocated in full to the common shares since the participating security holders do not have an obligation to share in the losses, based on the contractual rights and obligations of the participating
81
THOMAS PROPERTIES GROUP, INC. AND SUBSIDIARIES
NOTES TO CONSOLIDATED FINANCIAL INFORMATION—(Continued)
securities. Because we incurred losses for the years ended December 31, 2010, 2009 and 2008, all potentially dilutive instruments are anti-dilutive and have been excluded from our computation of weighted average dilutive shares outstanding. In December 2009, our board of directors suspended our quarterly dividends to common stockholders. There were no dividends declared for the year ended December 31, 2010.
The following is a summary of the elements used in calculating basic and diluted loss per share for the years ended December 31, 2010, 2009 and 2008 (in thousands except share and per share amounts):
2010 | 2009 | 2008 | |||||||||
Net loss attributable to common shares | $ | (11,472 | ) | $ | (21,563 | ) | $ | (5,486 | ) | ||
Dividends to participating securities | — | (33 | ) | (174 | ) | ||||||
Net loss attributable to common shares, net of dividends to participating securities | $ | (11,472 | ) | $ | (21,596 | ) | $ | (5,660 | ) | ||
Weighted average common shares outstanding—basic and diluted | 33,684,101 | 25,173,163 | 23,693,577 | ||||||||
Loss per share—basic and diluted | $ | (0.34 | ) | $ | (0.86 | ) | $ | (0.24 | ) | ||
Dividends declared per share | $ | — | $ | (0.04 | ) | $ | (0.24 | ) | |||
The following is a summary of elements that were anti-dilutive due to our net loss position and thereby excluded from the calculation of basic and diluted loss per share for the years ended December 31, 2010, 2009 and 2008:
2010 | 2009 | 2008 | ||||||
Nonvested restricted stock units | 569,000 | 610,000 | 265,968 | |||||
Vested incentive units | 195,552 | 206,110 | 746,115 | |||||
Nonvested incentive units | 90,004 | 259,444 | 512,221 | |||||
7. Equity
Common Stock and Operating Partnership Units
The holders of common stock are entitled to one vote per share on all matters to be voted upon by the stockholders. Holders of our common stock vote together as a single class with holders of our limited voting stock on those matters upon which the holders of limited voting stock are entitled to vote. Subject to preferences that may be applicable to any outstanding shares of preferred stock, the holders of common stock are entitled to receive ratably any dividends when, if, and as may be declared by the board of directors out of funds legally available for dividend payments. In the event of our liquidation, dissolution or winding up, the holders of our common stock are entitled to share ratably in all assets remaining after payment of liabilities and the liquidation preferences of any outstanding shares of preferred stock. Holders of common stock have no preemptive, conversion, subscription or other rights. There are no redemption or sinking fund provisions applicable to the common stock. A Unit and a share of our common stock have essentially the same economic characteristics as they share equally in the total net income or loss and distributions of the Operating Partnership. A Unit may be redeemed by the holder in exchange for cash or shares of common stock at our election, on a one-for-one basis. As of December 31, 2010 and December 31, 2009, we held a 74.7% and 68.8% interest in the Operating Partnership, respectively.
Issuances of Common Stock and Change in Limited Voting Stock
On April 25, 2007, we sold 9.2 million shares of common stock (including the shares issued upon exercise of the underwriters’ over-allotment option), pursuant to an effective registration statement previously filed with the Securities and Exchange Commission, at $16.00 per share. We received net proceeds, after deducting underwriting discounts and commissions and offering expenses, of $139.4 million from this offering of which $33.7 million was used to redeem 2,170,000 units in our Operating Partnership held by our CEO, and 45,000 units held by another senior executive. The redemption in Operating Partnership units, which are paired with limited voting stock on a one-for-one basis, resulted in a decrease in the total limited voting stock from 16,666,666 shares at December 31, 2006 to 14,496,666 shares at December 31, 2007.
On December 23, 2009, the Company completed the sale of 5.1 million shares through a registered direct offering of common stock at $2.55 per share. The net proceeds after deducting offering expenses were $13.1 million. We used the net proceeds to fund a portion of the discounted payoff of $25.2 million for the nonrecourse senior and junior mezzanine loans on Two Commerce Square, which had a balance of $36.6 million and were scheduled to mature in January 2010.
82
THOMAS PROPERTIES GROUP, INC. AND SUBSIDIARIES
NOTES TO CONSOLIDATED FINANCIAL INFORMATION—(Continued)
During the year ended December 31, 2010, we sold 4.3 million shares of common stock at prices ranging from $3.67 to $5.03 per share in our “at-the-market” equity offering program. These sales resulted in net proceeds of $15.5 million, which are being used for general corporate purposes.
Limited Voting Stock
Each Operating Partnership unit issued in connection with the formation of our Operating Partnership at the time of our initial public offering in 2004 was paired with one share of limited voting stock. Operating Partnership units issued under other circumstances, including upon the conversion of incentive units granted under the Incentive Plan, are not paired with shares of limited voting stock. These shares of limited voting stock are not transferable separate from the limited partnership units they are paired with, and each Operating Partnership unit is redeemable together with one share of limited voting stock by its holder for cash, or, at our election, one share of our common stock. Each share of limited voting stock entitles its holder to one vote on the election of directors, certain extraordinary transactions, including a merger or sale of our Company, and amendments to our certificate of incorporation. Shares of limited voting stock are not entitled to any regular or special dividend payments or other distributions, including any dividends or other distributions declared or paid with respect to shares of our common stock or any other class or series of our stock, and are not entitled to receive any distributions in the event of liquidation or dissolution of our Company. Shares of limited voting stock have no class voting rights, except to the extent required by Delaware law. Any redemption of a unit in our Operating Partnership will be redeemed together with a share of limited voting stock in accordance with the redemption provisions of the Operating Partnership agreement, and the share of limited voting stock will be canceled and not subject to reissuance.
Incentive Partnership Units
We have issued a total of 1,303,336 incentive units as of December 31, 2010 to certain employees. Incentive units represent a profits interest in the Operating Partnership and generally will be treated as regular Units in the Operating Partnership and rank pari passu with the Units as to payment of distributions, including distributions of assets upon liquidation. Incentive units are subject to vesting, forfeiture and additional restrictions on transfer as may be determined by us as general partner of the Operating Partnership. The holder of an incentive unit has the right to convert all or a part of his vested incentive units into Units, but only to the extent of the incentive units’ economic capital account balance. As general partner, we may also cause any number of vested incentive units to be converted into Units to the extent of the incentive units’ economic capital account balance. We had 36,943,394 shares of common stock, of which 179,998 shares were unregistered, and 12,313,331 Operating Partnership Units outstanding as of December 31, 2010, and 285,556 incentive units outstanding which were issued under our Incentive Plan, defined below. The 179,998 unregistered shares were issued in connection with the redemption of 179,998 incentive units by executives. The share of the Company owned by the Operating Partnership unit holders is reflected as a separate component called noncontrolling interests in the equity section of our consolidated balance sheets.
Exchange of Noncontrolling Operating Partnership Units
During the year ended December 31, 2010, 1.5 million noncontrolling Operating Partnership units were redeemed for shares of the Company’s common stock on a one-for-one basis, respectively. Neither the Company nor the Operating Partnership received any proceeds from the issuance of the common stock to the noncontrolling Operating Partnership unitholders.
Stock Compensation
We adopted the 2004 Equity Incentive Plan of Thomas Properties Group, Inc. as amended, (the “Incentive Plan”) effective upon the closing of our initial public offering and amended it in May 2007 and June 2008 to increase the shares reserved under the plan. The Incentive Plan provides incentives to our employees and is designed to attract, reward and retain personnel. Our Incentive Plan permits the granting of awards in the form of options to purchase common stock, restricted shares of common stock and restricted incentive units in our Operating Partnership. We may issue up to 3,361,906 shares as either stock option awards, restricted stock awards or incentive unit awards of which 603,491, remain available for grant as of December 31, 2010. In addition, under our Non-Employee Directors Restricted Stock Plan (“the Non-Employee Directors Plan”) a total of 60,000 shares are reserved for grant, of which 29,065 remain available for grant.
Shares of newly issued common stock will be issued upon exercise of stock options.
83
THOMAS PROPERTIES GROUP, INC. AND SUBSIDIARIES
NOTES TO CONSOLIDATED FINANCIAL INFORMATION—(Continued)
Restricted Stock
Under our Incentive Plan, we have issued the following restricted shares to executives of the Company:
Grant Date | Shares | Aggregate Value (in thousands) | Vesting Status | ||||||
October 2004 | 46,667 | $ | 560 | Fully vested | |||||
February 2006 | 60,000 | 740 | Fully vested | ||||||
March 2007 | 100,000 | 1,580 | Fully vested | ||||||
March 2008 | 100,000 | 855 | See below | ||||||
January 2009 | 410,000 | 543 | See below | ||||||
January 2010 | 100,000 | 263 | See below | ||||||
Issued from Inception to December 31, 2010 | 816,667 | $ | 4,541 | ||||||
Vesting for the 100,000 restricted shares granted in March 2008 will vest in full on the third anniversary of the vesting commencement date, or March 19, 2011. In January 2009, we issued 410,000 restricted shares to executives which vest over a period of five years. Fifty percent of the restricted shares vest based on stock performance. The other fifty percent are discretionary vesting shares based on individual and Company goals, which are currently reserved and will be considered granted upon vesting. In January 2010, we issued an additional 100,000 shares to an executive which vest over a period of two years. Fifty percent of the restricted shares vest on the first anniversary of the vesting commencement date, and the remaining fifty percent vest on the second anniversary of the vesting commencement date. The fair value of the restricted stock grants is determined based on the Company’s common stock price at the date of grant. The fair value of restricted stock grants with market conditions is adjusted for the effect of those market conditions; this is estimated by a third-party valuation consultant.
Holders of restricted stock have full voting rights and receive any dividends paid.
Under our Non-Employee Directors Plan, we have issued the following outstanding restricted shares to our non-employee directors:
Shares | Aggregate Value (in thousands) | Vesting Status | ||||||
Issued in October 2004 | 10,000 | $ | 120 | Fully vested | ||||
Issued in 2005 | 4,984 | 60 | Fully vested | |||||
Issued in 2006 | 6,419 | 82 | Fully vested | |||||
Issued in 2007 | 3,564 | 60 | Fully vested | |||||
Issued in 2008 | 5,968 | 60 | Fully vested | |||||
Issued from Inception to December 31, 2010 | 30,935 | $ | 382 | |||||
We recognized non-cash compensation expense and the related income tax benefit for the vesting of restricted stock grants for the years ended December 31, 2010, 2009 and 2008 as follows (in thousands). For the years ended December 31, 2010 and 2009, a full valuation allowance was recorded against the applicable income tax benefit.
2010 | 2009 | 2008 | |||||||||
Compensation expense | $ | 552,000 | $ | 1,310,000 | $ | 1,063,000 | |||||
Income tax benefit | $ | 221,000 | $ | 523,000 | $ | 423,000 | |||||
The weighted-average grant date fair value of restricted stock granted to executives during the year ended December 31, 2010 was $2.63 per share. No grants of restricted stock were made to non-employee directors during the years ended December 31, 2010 and 2009. As of December 31, 2010, there was $258,000 of total unrecognized compensation cost related to the unvested restricted stock under the Incentive Plan. The unrecognized compensation expense is expected to be recognized over a weighted average period of 1.4 years.
84
THOMAS PROPERTIES GROUP, INC. AND SUBSIDIARIES
NOTES TO CONSOLIDATED FINANCIAL INFORMATION—(Continued)
Incentive Units
Under our Incentive Plan, we have issued the following incentive units to our executives:
Units | Aggregate Value (in thousands) | Vesting Status | ||||||
Issued in October 2004 | 730,003 | $ | 8,443 | Fully vested | ||||
Issued in 2006 | 120,000 | 1,463 | Fully vested | |||||
Issued in 2007 | 183,333 | 2,728 | Fully vested | |||||
Issued in 2008 | 270,000 | 1,883 | Partially vested | |||||
Issued from Inception to December 31, 2010 | 1,303,336 | $ | 14,517 | |||||
In March 2008, we issued 160,000 incentive units to certain executives, which units vest over a three year period, with one third vesting each on the first, second, and third anniversary dates of the grant. In September 2008, we issued an additional 110,000 incentive units to a new executive, which vest over a three to five year period. Of the remaining unvested incentive units, 18,334 and are subject to market based performance measures and 18,334 are reserved and will be considered granted upon vesting, which will occur when it is determined that certain individual and Company goals have been met. No incentive units were issued for the years ended December 31, 2010 and 2009. The fair value of the incentive unit grants is determined based on the Company’s common stock price at the date of grant and a discount for post-vesting restrictions estimated by a third-party valuation consultant.
For the years ended December 31, 2010, 2009 and 2008, we recorded compensation expense for the vesting of the incentive unit grants totaling $90,000, $1,444,000 and $2,214,000, respectively. As of December 31, 2010, there was $66,000 of unrecognized compensation expense related to incentive units. The unrecognized compensation expense is expected to be recognized over a weighted average period of 0.5 years.
Stock options
Under our Incentive Plan, we have 607,924 stock options outstanding as of December 31, 2010. There were no stock option grants for the years ended December 31, 2010 and 2009. The options vest at the rate of one third per year over three years and expire ten years after the date of commencement of vesting. The fair market value of each option granted was estimated on the date of the grant using the Black-Scholes option pricing model. Below is a summary of the methodologies the Company utilized to estimate the assumptions used in the Black-Scholes option pricing model:
Expected Term—The expected term of the Company’s stock-based awards represents the period that the Company’s stock-based awards are expected to be outstanding.
Expected Stock Price Volatility—The Company estimates its volatility factor by using the historical average volatility of its common stock price over a period equal to the expected term.
Expected Dividend Yield—The dividend yield is based on the Company’s expected future dividend payments.
Risk-Free Interest Rate—The Company bases the risk-free interest rate used on the implied yield currently available on the U.S. Treasury zero-coupon issues with an equivalent remaining term.
Estimated Forfeitures—When estimating forfeitures, the Company considers voluntary termination behavior as well as an analysis of actual option forfeitures. As stock-based compensation expense recognized in the Statement of Operations for the year ended December 31, 2008 is based on awards ultimately expected to vest, it should be reduced for estimated forfeitures. FASB ASC 718 “Compensation—Stock Compensation” requires forfeitures to be estimated at the time of grant and revised, if necessary, in subsequent periods if actual forfeitures differ from those estimates. Pre-vesting forfeitures were estimated based on historical experience.
The following are the weighted-average assumptions used in the Black-Scholes option pricing model for stock option grants made by the Company in 2008 and 2007:
85
THOMAS PROPERTIES GROUP, INC. AND SUBSIDIARIES
NOTES TO CONSOLIDATED FINANCIAL INFORMATION—(Continued)
2008 | 2007 | ||||
Expected dividend yield | 2.90 | % | 1.55 | % | |
Expected term | 5 to 8 years | 2 to 4 years | |||
Risk-free interest rate | 3.20 | % | 4.62 | % | |
Expected stock price volatility | 11 | % | 13 | % | |
The following is a summary of stock option activity under our Incentive Plan:
Shares | Weighted Average Exercise Price | Weighted Average Remaining Contractual Term (in years) | Aggregate Intrinsic Value (in thousands) | |||||||||
Outstanding at January 1, 2008 | 501,197 | $ | 13.52 | 6.9 | — | |||||||
Granted | 169,412 | 10.45 | ||||||||||
Forfeitures | — | — | ||||||||||
Exercised | — | — | ||||||||||
Outstanding at December 31, 2008 | 670,609 | 12.74 | 7.4 | — | ||||||||
Granted | — | — | ||||||||||
Forfeitures | (2,915 | ) | 10.45 | |||||||||
Exercised | — | — | ||||||||||
Outstanding at December 31, 2009 | 667,694 | 12.75 | 6.3 | — | ||||||||
Granted | — | — | ||||||||||
Forfeitures | (59,770 | ) | 11.75 | |||||||||
Exercised | — | — | ||||||||||
Outstanding at December 31, 2010 | 607,924 | $ | 12.85 | 5.4 | — | |||||||
Options exercisable at December 31, 2010 | 558,183 | $ | 13.06 | 5.2 | — | |||||||
We recognized compensation expense and the related income tax benefit for stock options for the years ended December 31, 2010, 2009 and 2008 as follows (in thousands). For the years ended December 31, 2010 and 2009, a full valuation allowance was recorded against the applicable income tax benefit.
2010 | 2009 | 2008 | |||||||||
Compensation expense | $ | 30,000 | $ | 85,000 | $ | 218,000 | |||||
Income tax benefit | $ | 12,000 | $ | 34,000 | $ | 87,000 | |||||
As of December 31, 2010, there was $2,000 of total unrecognized compensation expense related to the unvested stock options. The total unrecognized compensation expense is expected to be recognized over a weighted average period of 0.1 years. There were no stock options granted or exercised during years ended December 31, 2010 and 2009.
Noncontrolling Interests
On January 1, 2009, the Company adopted FASB ASC 810-10 “Consolidation”, which clarifies that a noncontrolling interest in a subsidiary is an ownership interest in the consolidated entity that should be reported as equity in the consolidated financial statements. FASB ASC 810-10 also requires consolidated net income to be reported at amounts that include the amounts attributable to both the parent and the noncontrolling interest and requires disclosure, on the face of the consolidated statement of income, of the amounts of consolidated net income attributable to the parent and to the noncontrolling interest. In addition, FASB ASC 810-10 establishes a single method of accounting for changes in a parent’s ownership interest in a subsidiary that does not result in deconsolidation and requires that a parent recognize a gain or loss in net income when a subsidiary is deconsolidated. As a result of the issuance of FASB ASC 810-10, the guidance in FASB ASC 480-10, “Classification and Measurement of Redeemable Securities”, was amended to include redeemable noncontrolling interests within its scope. If noncontrolling interests are determined to be redeemable, they are to be carried at their redemption value as
86
THOMAS PROPERTIES GROUP, INC. AND SUBSIDIARIES
NOTES TO CONSOLIDATED FINANCIAL INFORMATION—(Continued)
of the balance sheet date and reported as temporary equity.
Noncontrolling interests on our consolidated balance sheets relate primarily to the partnership and incentive units in the Operating Partnership (collectively, the “Units”) that are not owned by the Company. In conjunction with the formation of the Company, certain persons and entities contributing interests in properties to the Operating Partnership received partnership units. In addition, certain employees of the Operating Partnership have received incentive units in connection with services rendered or to be rendered to the Operating Partnership. Limited partners who have been issued incentive units have the right to require the Operating Partnership to redeem part or all of their incentive units upon vesting of the Units, if applicable. The Company may elect to acquire those incentive units in exchange for shares of the Company’s common stock on a one-for-one basis, subject to adjustment in the event of stock splits, stock dividends, issuance of stock rights, specified extraordinary distributions and similar events, or pay cash based upon the fair market value of an equivalent number of shares of the Company’s common stock at the time of redemption.
FASB ASC 810-10 was required to be applied prospectively after adoption, with the exception of the presentation and disclosure requirements, which were applied retrospectively for all periods presented. The Company evaluated the terms of the Units and, as a result of the adoption of FASB ASC 810-10, the Company reclassified noncontrolling interests to permanent equity in the accompanying consolidated balance sheets and recorded a decrease to the carrying value of noncontrolling interests of approximately $7.8 million (a corresponding increase was recorded to additional paid-in capital) to reflect the noncontrolling interests’ proportionate share of equity at December 31, 2009. In periods subsequent to the adoption of FASB ASC 810-10, the Company periodically evaluates individual noncontrolling interests for the ability to continue to recognize the noncontrolling interest as permanent equity in the consolidated balance sheets. Any noncontrolling interest that fails to qualify as permanent equity will be reclassified as temporary equity and adjusted to the greater of (a) the carrying amount, or (b) its redemption value as of the end of the period in which the determination is made.
The redemption value of the 285,556 outstanding incentive units not owned by the Company at December 31, 2010 was approximately $1,205,000 based on the closing price of the Company’s common stock of $4.22 per share as of December 31, 2010.
Equity is allocated between controlling and noncontrolling interests as follows (in thousands):
Stockholders’ Equity | Noncontrolling Interests | Total Equity | |||||||||
Balance, December 31, 2009 | $ | 136,396 | $ | 65,949 | $ | 202,345 | |||||
Net loss | (11,472 | ) | (4,609 | ) | (16,081 | ) | |||||
Amortization of stock-based compensation | 477 | 195 | 672 | ||||||||
Redemption of incentive units | 791 | (791 | ) | — | |||||||
Redemption of operating partnership units | 6,156 | (6,156 | ) | — | |||||||
Other comprehensive income recognized | 76 | 31 | 107 | ||||||||
Book-tax difference related to vesting of restricted stock | (52 | ) | — | (52 | ) | ||||||
Reimbursement from noncontrolling interest | — | 179 | 179 | ||||||||
Contributions | — | 5,338 | 5,338 | ||||||||
Proceeds from sale of common stock, net of offering expenses | 15,283 | — | 15,283 | ||||||||
Balance, December 31, 2010 | $ | 147,655 | $ | 60,136 | $ | 207,791 | |||||
8. Related Party Transactions
We provide certain property management, leasing, and development and investment advisory services in connection with service agreements with certain of our consolidated subsidiaries and equity accounted unconsolidated entities. The following is a summary of fee revenue and expenses related to these services for the years ended December 31, 2010, 2009 and 2008 (in thousands):
87
THOMAS PROPERTIES GROUP, INC. AND SUBSIDIARIES
NOTES TO CONSOLIDATED FINANCIAL INFORMATION—(Continued)
Twelve months ended December 31, | |||||||||||
2010 | 2009 | 2008 | |||||||||
Property management, leasing and development services fees | $ | 22,972 | $ | 24,172 | $ | 29,297 | |||||
Investment advisory fees | 7,415 | 6,928 | 7,102 | ||||||||
Total fees | 30,387 | 31,100 | 36,399 | ||||||||
Investment advisory, management, leasing and development services expenses | (12,221 | ) | (11,910 | ) | (14,800 | ) | |||||
Net investment advisory, management, leasing and development services income | $ | 18,166 | $ | 19,190 | $ | 21,599 | |||||
Total fees attributable to third parties and related parties: | |||||||||||
Total fees attributable to third parties | $ | 7,703 | $ | 9,345 | $ | 7,194 | |||||
Total fees attributable to related parties (unconsolidated entities and subsidiaries) | 22,684 | 21,755 | 29,205 | ||||||||
Total fees before intercompany transaction eliminations | $ | 30,387 | $ | 31,100 | $ | 36,399 | |||||
Reconciliation of total fees to consolidated statement of operations:
Total fees before intercompany transaction eliminations | $ | 30,387 | $ | 31,100 | $ | 36,399 | |||||
Elimination of intercompany fee revenues (subsidiaries and our share of unconsolidated entities) | (6,214 | ) | (6,732 | ) | (10,942 | ) | |||||
Total fees net of eliminations | $ | 24,173 | $ | 24,368 | $ | 25,457 | |||||
Total fees as presented in the consolidated statement of operations:
Investment advisory, management, leasing, and development services —third parties | $ | 7,703 | $ | 9,345 | $ | 7,194 | |||||
Investment advisory, management, leasing, and development services —unconsolidated real estate entities (related parties) | 16,470 | 15,023 | 18,263 | ||||||||
Total fees | $ | 24,173 | $ | 24,368 | $ | 25,457 | |||||
9. Income Taxes
All operations are carried on through the Operating Partnership and its subsidiaries which are pass-through entities that are generally not subject to federal or state income taxation, as all of the taxable income, gains, losses, deductions, and credits are passed through to its partners. However, the Operating Partnership and some of its subsidiaries are subject to income taxes in Texas. We are responsible for our share of taxable income or loss of the Operating Partnership allocated to us in accordance with the Operating Partnership’s Agreement of Limited Partnership. As of December 31, 2010 and 2009, we held a 74.7% and 68.8%, respectively, capital interest in the Operating Partnership. For the years ended December 31, 2010, 2009 and 2008, we were allocated 70.9%, 65.8%, and 61.0%, respectively, of the income and losses from the Operating Partnership.
Our effective tax rate is 2.2%, (2.0)% and 15.4%, respectively, for the years ended December 31, 2010, 2009 and 2008. The resulting tax rate is primarily due to the noncontrolling interests’ attributable income as a result of our adoption of FASB ASC 810 and the current year reversal of accrued interest relating to unrecognized tax benefits for which the statute of limitations period has lapsed.
The provision for income taxes is based on reported income before income taxes. Deferred income tax assets and liabilities reflect the impact of temporary differences between the amounts of assets and liabilities recognized for financial reporting purposes and the amount recognized for tax purposes, as measured by applying the currently enacted tax laws.
88
THOMAS PROPERTIES GROUP, INC. AND SUBSIDIARIES
NOTES TO CONSOLIDATED FINANCIAL INFORMATION—(Continued)
The benefit (provision) for income taxes consists of the following for the years ended December 31, 2010, 2009 and 2008 (in thousands):
2010 | 2009 | 2008 | |||||||||
Current income taxes: | |||||||||||
Federal | $ | 3,109 | $ | (1,601 | ) | $ | (123 | ) | |||
State | 250 | (546 | ) | (171 | ) | ||||||
Total current income taxes | 3,359 | (2,147 | ) | (294 | ) | ||||||
Deferred income tax benefit (provision): | |||||||||||
Federal | 371 | 7,892 | 2,092 | ||||||||
State | 481 | 1,607 | 502 | ||||||||
Total deferred income tax benefit (provision) | 852 | 9,499 | 2,594 | ||||||||
Interest expense, net of related tax effects | 803 | (646 | ) | (415 | ) | ||||||
Change in valuation allowance | (4,657 | ) | (7,389 | ) | — | ||||||
Benefit (provision) for income taxes | $ | 357 | $ | (683 | ) | $ | 1,885 | ||||
A reconciliation of the benefit (provision) for income taxes with amounts determined by applying the statutory U.S. federal income tax rate to income (loss) before income taxes for the years ended December 31, 2010, 2009 and 2008 are as follows (in thousands):
2010 | 2009 | 2008 | |||||||||
Tax benefit (provision) at statutory rate of 35% | $ | 5,753 | $ | 12,188 | $ | 4,288 | |||||
Noncontrolling interests | (1,631 | ) | (4,880 | ) | (1,708 | ) | |||||
State income taxes, net of federal tax benefit & reduction in state valuation allowance | 459 | 868 | 160 | ||||||||
Restricted incentive unit compensation | (20 | ) | (331 | ) | (473 | ) | |||||
Interest expense, gross of related tax effects | 1,129 | (646 | ) | (415 | ) | ||||||
Valuation allowance | (4,657 | ) | (7,389 | ) | — | ||||||
Other | (676 | ) | (493 | ) | 33 | ||||||
Benefit (provision) for income taxes | $ | 357 | $ | (683 | ) | $ | 1,885 | ||||
Effective income tax rate | 2.2 | % | (2.0 | )% | 15.4 | % | |||||
The significant components of the net deferred tax (asset) as of December 31, 2010 and 2009 are as follows (in thousands):
2010 | 2009 | ||||||
Deferred tax (asset): | |||||||
Net operating loss carry forward | $ | (9,175 | ) | $ | (14,710 | ) | |
State taxes | 19 | (546 | ) | ||||
Stock compensation | (943 | ) | (1,732 | ) | |||
Income from Operating Partnership | (2,077 | ) | 3,991 | ||||
Impairment loss | (12,719 | ) | (11,006 | ) | |||
Cancellation of debt deferral | — | 4,441 | |||||
Interest income from loan receivable | — | (4,641 | ) | ||||
Valuation allowance | 12,047 | 7,389 | |||||
Other, net | (612 | ) | (830 | ) | |||
Deferred tax (asset), net | $ | (13,460 | ) | $ | (17,644 | ) | |
The net deferred tax asset is included with other assets on the Company’s balance sheet. The Company's federal and state net operating loss carryforwards which existed as of a deemed ownership change in 2007 are subject to the gross annual limitation under Internal Revenue Code Section 382 ("Section 382"), which is $9.9 million per year. The net operating loss
89
THOMAS PROPERTIES GROUP, INC. AND SUBSIDIARIES
NOTES TO CONSOLIDATED FINANCIAL INFORMATION—(Continued)
carryforwards generated subsequent to the 2007 ownership change are not subjected to the Section 382 limitation. As of the year ended December 31, 2010, the Company anticipates having net operating loss carryforwards of $22.7 million for federal purposes and $25.8 million for state purposes. The Company’s net operating loss carryforwards are subject to varying expirations from 2018 through 2031.
FASB ASC 740-10-30-17 “Accounting for Income Taxes,” requires that deferred tax assets be reduced by a valuation allowance if it is more likely than not that some or all of the deferred tax asset will not be realized. Future realization of the deferred tax asset is dependent on the reversal of existing taxable temporary differences, carryback potential, tax-planning strategies and on us generating sufficient taxable income in future years as the deferred income tax charges become currently deductible for tax reporting purposes. As of December 31, 2010, a valuation allowance of approximately $12.0 million had been established against the net deferred income tax assets to an amount that will more likely than not be realized. During 2010, the valuation allowance increased by $4.7 million, resulting from the increase in the net deferred tax assets (decrease in deferred tax liabilities) primarily related to income from the Company's interest in the Operating Partnership.
FASB ASC 740-10-25 clarifies the accounting for uncertainty in income taxes recognized in a company’s financial statements. The interpretation prescribes a recognition threshold and measurement attribute criteria for the financial statement recognition and measurement of a tax position taken or expected to be taken in a tax return. The interpretation also provides guidance on derecognition, classification, interest and penalties, accounting in interim periods, disclosure and transition.
The Company files U.S. federal income tax returns and returns in various state jurisdictions. As of December 31, 2010, 2009, and 2008, the Company has recorded unrecognized tax benefits of approximately $13.4 million, $17.8 million, and $15.7 million, respectively, and if recognized, would not affect our effective tax rate. The Company’s policy is to recognize interest and penalties related to unrecognized tax benefits as a component of income tax expense. For the years ended December 31, 2010, 2009, and 2008, we recorded $0.6 million, $0.6 million, and $0.4 million, respectively, of interest related to unrecognized tax benefits as a component of income tax expense. Additionally, for the year ended December 31, 2010, we recorded a reversal of accrued interest relating to unrecognized tax benefits for which the statute of limitations period has lapsed in the amount of $1.7 million, which is recorded as a reduction of income tax expense. As of December 31, 2010, 2009, and 2008, the Company has recorded $1.0 million, $2.1 million, and $1.5 million, respectively, of accrued interest with respect to unrecognized tax benefits. We have not recorded any penalties with respect to unrecognized tax benefits.
We do not anticipate any significant increases or decreases to the amounts of unrecognized tax benefits and related accrued interest within the next twelve months, other than a reversal of accrued interest relating to unrecognized tax benefits for which the statute of limitations period will lapse during 2011.
We conduct business in California, Pennsylvania, Texas and Virginia. For federal and state purposes, the years ended December 31, 2007 through 2010 remain subject to examination by the respective tax jurisdictions.
A reconciliation of the Company’s unrecognized tax benefits as of December 31, 2010, 2009, and 2008 are as follows (in thousands):
2010 | 2009 | 2008 | |||||||||
Unrecognized Tax Benefits—Opening Balance | $ | 17,782 | $ | 15,660 | $ | 15,577 | |||||
Gross increases—tax positions in prior period | — | 84 | 80 | ||||||||
Gross decreases—tax positions in prior period | (3,843 | ) | (9 | ) | (134 | ) | |||||
Gross increases—current period tax positions | — | 2,394 | 520 | ||||||||
Gross decreases—current period tax positions | (503 | ) | (347 | ) | (383 | ) | |||||
$ | 13,436 | $ | 17,782 | $ | 15,660 | ||||||
10. Fair Value of Financial Instruments
FASB ASC 825-10-50-8, “Financial Instruments,” requires us to disclose fair value information about all financial instruments, whether or not recognized in the balance sheets, for which it is practicable to estimate fair value.
Our estimates of the fair value of financial instruments as of December 31, 2010 were determined using available market information and appropriate valuation methods. Considerable judgment is necessary to interpret market data and develop
90
THOMAS PROPERTIES GROUP, INC. AND SUBSIDIARIES
NOTES TO CONSOLIDATED FINANCIAL INFORMATION—(Continued)
estimated fair value. The use of different market assumptions or estimation methods may have a material effect on the estimated fair value amounts.
The carrying amounts for cash and cash equivalents, restricted cash, rent and other receivables, accounts payable and other liabilities approximate fair value due to the short-term nature of these instruments.
As of December 31, 2010 and 2009, the estimated fair value of our mortgage and other secured loans aggregates $285.6 million and $285.9 million, respectively, compared to the aggregate carrying value of $300.5 million and $318.2 million, respectively.
11. Minimum Future Lease Rentals
We have entered into various lease agreements with tenants as of December 31, 2010. The minimum future cash rents receivable under non-cancelable operating leases in each of the next five years and thereafter are as follows (in thousands):
Year ending December 31, | ||||
2011 | $ | 29,677 | ||
2012 | 30,083 | |||
2013 | 28,424 | |||
2014 | 24,148 | |||
2015 | 19,421 | |||
Thereafter | 51,258 | |||
$ | 183,011 | |||
The leases generally also require reimbursement of the tenant’s proportional share of common area, real estate taxes and other operating expenses, which are not included in the amounts above.
12. Revenue Concentrations
Rental revenue concentrations
For year ended, December 31, 2010, rental revenue from two tenants represented approximately 16.4% and 14.0%, respectively, of the Company's total rental revenues and tenant reimbursements (excluding tenant reimbursements for over-standard usage of certain operating expenses). These two leases expire in 2020 and 2015, respectively. For year ended, December 31, 2009, rental revenue and tenant reimbursements from two tenants represented approximately 16.5% and 13.6%, respectively, of the Company's rental revenues and tenant reimbursements (excluding tenant reimbursements for over-standard usage of certain operating expenses). One of these leases expires in 2010, and the other lease expired in 2009. For year ended December 31, 2008, 37.7% our rental revenues and tenant reimbursements (excluding tenant reimbursements for over-standard usage of certain operating expenses) were generated from one tenant, Conrail, whose lease expired in 2009.
Concentrations related to investment advisory, property management, leasing and development services revenue
Under agreements with CalSTRS, we provide property acquisition, investment advisory, property management, leasing and development services for CalSTRS under a separate account relationship and through a joint venture relationship. At December 31, 2010 and 2009, there were two office properties, respectively, subject to the separate account relationship. At December 31, 2010 and 2009, there were twenty-two office properties, respectively, subject to the joint venture relationship. We asset manage all of these properties.
Under the separate account relationship, we earn acquisition fees over the first three years after a property is acquired, if the property meets or exceeds the pro forma operating results that were submitted at the time of acquisition and a performance index associated with the region in which the property is located. The two properties under the separate account relationship are no longer eligible for acquisition fees. Under the joint venture relationship, we are paid acquisition fees at the time a property is acquired, as a percent of the total acquisition price. We did not earn any acquisition fees during the years ended December 31, 2010, 2009 and 2008.
91
THOMAS PROPERTIES GROUP, INC. AND SUBSIDIARIES
NOTES TO CONSOLIDATED FINANCIAL INFORMATION—(Continued)
Under the separate account relationship, we earn asset management fees paid on a quarterly basis, based on the annual net operating income of the properties. Under the joint venture relationship, asset management fees are paid on a monthly basis, initially based upon a percentage of a property’s annual appraised value for properties that are unstabilized at the time of acquisition. At the point of stabilization of the property, asset management fees are calculated based on net operating income.
We perform property management and leasing services for fourteen properties subject to the asset management agreements with CalSTRS. We are entitled to property management fees calculated based on 2% or 3% of the gross revenues of the particular property, paid on a monthly basis. In addition, we are reimbursed for compensation paid to certain of our employees and direct out-of-pocket expenses. The management and leasing agreements expire on the third anniversary of each property’s acquisition. The agreements are automatically renewed for successive periods of one year each, unless we elect not to renew the agreements.
For properties in which we are responsible for the leasing and development services, we are entitled to receive market leasing commissions and development fees as defined in the agreements with CalSTRS.
For the years ended December 31, 2010, 2009 and 2008, we earned fees under agreements with CalSTRS as follows (in thousands):
2010 | 2009 | 2008 | |||||||||
Joint Venture Properties: | |||||||||||
Acquisition fees | $ | — | $ | — | $ | — | |||||
Asset management fees | 4,364 | 4,507 | 4,757 | ||||||||
Property management fees | 8,043 | 7,644 | 7,592 | ||||||||
Leasing commissions | 3,462 | 2,127 | 4,104 | ||||||||
Development fees | 601 | 745 | 1,810 | ||||||||
Subtotal - fees before payroll | |||||||||||
reimbursements | 16,470 | 15,023 | 18,263 | ||||||||
Payroll reimbursements (1) | 4,642 | 4,475 | 4,975 | ||||||||
Total Joint Venture Properties | 21,112 | 19,498 | 23,238 | ||||||||
Separate Account Properties: | |||||||||||
Acquisition fees | $ | — | $ | — | $ | — | |||||
Asset management fees | 489 | 507 | 591 | ||||||||
Property management fees | 691 | 626 | 658 | ||||||||
Leasing commissions | 277 | 1,742 | 548 | ||||||||
Development fees | 86 | 139 | 99 | ||||||||
Subtotal - fees before payroll | |||||||||||
reimbursements | 1,543 | 3,014 | 1,896 | ||||||||
Payroll reimbursements (1) | 573 | 544 | 656 | ||||||||
Total Separate Account Properties | 2,116 | 3,558 | 2,552 | ||||||||
Total Joint Venture and Separate Account Properties | $ | 23,228 | $ | 23,056 | $ | 25,790 | |||||
(1) These reimbursements represent primarily the cost of on-site property management personnel incurred on behalf of the managed properties.
Under the separate account relationship, we receive incentive compensation based upon performance above a minimum hurdle rate, at which time we begin to participate in cash flow from the relevant property. Incentive compensation is paid at the time an investment is sold. No incentive compensation was earned during the years ended December 31, 2010, 2009 and 2008. Under the joint venture relationship, incentive compensation is based on a minimum return on investment to CalSTRS, following which we participate in cash flow above the stated return, subject to a clawback provision if returns for a property fall below the stated return. We earned an incentive compensation fee of $0.6 million related to the sale of our joint venture property, Intercontinental Center, during the year ended December 31, 2007. Of this amount, 25% was eliminated in consolidation and the remaining 75% was recorded as deferred revenue due to the clawback provision. We earned an incentive compensation fee of $0.5 million related to the sale of our joint venture property, Valley Square, during the year ended
92
THOMAS PROPERTIES GROUP, INC. AND SUBSIDIARIES
NOTES TO CONSOLIDATED FINANCIAL INFORMATION—(Continued)
December 31, 2006. Of this amount, 25% was eliminated in consolidation and the remaining 75% was recorded as deferred revenue due to the clawback provision. We did not earn any incentive fees from CalSTRS during the years ended December 31, 2010, 2009 and 2008.
At December 31, 2010 and 2009, we had accounts receivable, including amounts generated under the above agreements, of $3.5 million and $2.6 million, respectively, including $2.6 million and $1.8 million, respectively, due from TPG/CalSTRS.
13. Commitments and Contingencies
We have been named as a defendant in a number of lawsuits in the ordinary course of business. We believe that the ultimate settlement of these suits will not have a material adverse effect on our financial position and results of operations.
We sponsor a 401(k) plan for our employees. Our contributions were $40,000, $65,000 and $61,000 for the years ended December 31, 2010, 2009 and 2008, respectively.
We are a tenant in City National Plaza through May 2014 and in One Commerce Square through February 2016. For the years ended December 31, 2010, 2009, and 2008, we incurred rent expense of $0.5 million, $0.3 million and $0.3 million, respectively, to City National Plaza. The rent expense related to One Commerce Square is eliminated in consolidation. The minimum future rents payable as of December 31, 2010 are $1.1 million under the City National Plaza lease.
In connection with the ownership, operation and management of the real estate properties, we may be potentially liable for costs and damages related to environmental matters. We have not been notified by any governmental authority of any non-compliance, liability or other claim in connection with any of the properties, and we are not aware of any other existing environmental condition with respect to any of the properties that management believes will have a material adverse effect on our assets or results of operations.
A mortgage loan, with an outstanding balance of $18.2 million and $18.5 million as of December 31, 2010 and 2009, respectively, secured by a first trust deed on 2121 Market Street is guaranteed by our Operating Partnership and our co-general partner in the partnership that owns 2121 Market Street, up to a maximum amount of $3.3 million.
In connection with our Campus El Segundo mortgage loan (see Note 4), we have guaranteed and promised to pay the principal, interest and any other sum payable under the loan in the event the borrower, a wholly-owned entity of our Operating Partnership, does not do so.
In connection with our Murano construction loan (see Note 4), we and two unaffiliated individuals who are partners in the Murano development project, collectively agreed to guarantee the completion of the required work, as defined in the applicable agreement, in favor of the construction loan lender, which has been completed, and agreed to guarantee payment of interest during the extension term of the loan.
In connection with our Four Points Centre construction loan (see Note 4), we have guaranteed in favor of and promised to pay to the lender 46.5% of the principal, interest and any other sum payable under the loan in the event the borrower, a wholly-owned entity of our Operating Partnership, does not do so. At December 31, 2010, the outstanding balance was $23.7 million, which results in a maximum guarantee amount based on 46.5% of $11.0 million. Upon the occurrence of certain events, as defined in the repayment and completion guaranty agreement, our maximum liability as guarantor will be reduced to 31.5% of all sums payable under the loan, and upon the occurrence of even further events, as defined, our maximum liability as guarantor will be reduced to 25.0% of all sums payable under the loan. Furthermore, we agreed to guarantee the completion of the construction improvements including tenant improvements, as defined in the agreement, in the event of any default of the borrower. The borrower has completed the core and shell construction. If the borrower fails to complete the remaining required work, the guarantor agrees to perform timely all of the completion obligations, as defined in the agreement.
14. Subsequent Events
We had no subsequent events as of March 9, 2011, requiring disclosure.
93
THOMAS PROPERTIES GROUP, INC. AND SUBSIDIARIES
NOTES TO CONSOLIDATED FINANCIAL INFORMATION—(Continued)
15. Quarterly Financial Information—Unaudited
The tables below reflect the selected quarterly information for us for the years ended December 31, 2010 and 2009. Certain prior year amounts have been reclassified to conform to the current year presentation (in thousands, except for share and per share amounts).
Three Months Ended | |||||||||||||||
December 31, 2010 | September 30, 2010 | June 30, 2010 | March 31, 2010 | ||||||||||||
Total revenue | $ | 22,264 | $ | 25,117 | $ | 25,977 | $ | 24,343 | |||||||
Loss before gain on sale of real estate, gain (loss) on early extinguishment of debt, interest income, equity in net loss of unconsolidated real estate entities, noncontrolling interests and provision for income tax | (9,394 | ) | (2,407 | ) | (1,112 | ) | (2,413 | ) | |||||||
Loss before noncontrolling interests and provision/benefit for income taxes | (9,623 | ) | (1,852 | ) | (1,719 | ) | (3,244 | ) | |||||||
Net loss | (6,151 | ) | (1,435 | ) | (1,465 | ) | (2,421 | ) | |||||||
Net loss per share-basic and diluted | $ | (0.18 | ) | $ | (0.04 | ) | $ | (0.04 | ) | $ | (0.08 | ) | |||
Weighted-average shares outstanding-basic and diluted | 35,041,770 | 34,910,415 | 34,202,493 | 30,436,364 | |||||||||||
Three Months Ended | |||||||||||||||
December 31, 2009 | September 30, 2009 | June 30, 2009 | March 31, 2009 | ||||||||||||
Total revenue | $ | 27,749 | $ | 42,884 | $ | 22,204 | $ | 21,271 | |||||||
Loss before gain on sale of real estate, interest income, equity in net loss of unconsolidated real estate entities, noncontrolling interests and provision for income tax | (10,116 | ) | (12,413 | ) | (3,918 | ) | (5,613 | ) | |||||||
Loss before noncontrolling interests and provision/benefit for income taxes | (13,080 | ) | (15,482 | ) | (4,385 | ) | (1,876 | ) | |||||||
Net loss | (7,730 | ) | (10,912 | ) | (2,746 | ) | (174 | ) | |||||||
Net loss per share-basic and diluted | $ | (0.30 | ) | $ | (0.43 | ) | $ | (0.11 | ) | $ | (0.01 | ) | |||
Weighted-average shares outstanding-basic and diluted | 25,753,994 | 25,212,319 | 24,889,637 | 24,542,990 | |||||||||||
94
SCHEDULE III—INVESTMENTS IN REAL ESTATE
(In thousands)
One Commerce Square | Two Commerce Square | Murano | 2100 JFK Boulevard | Four Points Centre | Campus El Segundo | Metro Studio @ Lankershim | |||||||||||||||||||||
Property Type | High-rise office | High-rise office | Condominium Units Held for Sale | Parking lot | Office/ Retail/Hotel/ Development | Office/ Retail/Hotel/ Development | Office/Prod. Facility/ Residential/ Retail Development | ||||||||||||||||||||
Location | Philadelphia, PA | Philadelphia, PA | Philadelphia, PA | Philadelphia, PA | Austin, TX | El Segundo, CA | Los Angeles, CA | ||||||||||||||||||||
Encumbrances, net | $ | 130,000 | $ | 107,612 | $ | 22,237 | $ | — | $ | 23,687 | $ | 17,000 | $ | — | |||||||||||||
Initial cost to the real estate entity that acquired the property: | |||||||||||||||||||||||||||
Land and improvements | 14,259 | 15,758 | 6,213 | 4,872 | 10,523 | 39,937 | — | ||||||||||||||||||||
Buildings and improvements | 87,653 | 147,951 | — | — | — | — | — | ||||||||||||||||||||
Cost capitalized subsequent to acquisition: | |||||||||||||||||||||||||||
Land and improvements | 528 | 706 | 35 | 56 | 9,436 | 20,111 | 16,440 | ||||||||||||||||||||
Buildings and improvements | 32,845 | (1) | 28,711 | (1) | — | (3 | ) | 38,452 | 3,264 | — | |||||||||||||||||
Condominium units held for sale | — | — | 43,614 | — | — | — | — | ||||||||||||||||||||
Gross amount at which carried at close of period: | |||||||||||||||||||||||||||
Land and improvements | 14,787 | 16,464 | 35 | 4,928 | 19,959 | 60,048 | 16,440 | ||||||||||||||||||||
Buildings and improvements | 120,498 | 176,662 | — | (3 | ) | 38,452 | 3,264 | — | |||||||||||||||||||
Condominium units held for sale | — | — | 49,827 | — | — | — | — | ||||||||||||||||||||
Accumulated depreciation and amortization (2) | (34,617 | ) | (68,771 | ) | (1 | ) | (50 | ) | (1,252 | ) | (580 | ) | — | ||||||||||||||
Date construction completed | 1987 | 1992 | 2008 | N/A | N/A | N/A | N/A | ||||||||||||||||||||
Investments in real estate: | |||||||||||||||||||||||||||
2010 | 2009 | 2008 | |||||||||||||||||||||||||
Balance, beginning of the year | $ | 536,331 | $ | 579,856 | $ | 574,983 | |||||||||||||||||||||
Additions during the year: | |||||||||||||||||||||||||||
Improvements | 1,471 | 9,187 | 100,841 | ||||||||||||||||||||||||
Deductions during the year: | |||||||||||||||||||||||||||
Cost of real estate sold | (10,425 | ) | (24,214 | ) | (62,436 | ) | |||||||||||||||||||||
Asset impairment | (4,500 | ) | (13,000 | ) | (11,023 | ) | |||||||||||||||||||||
Retirements | (1,516 | ) | (15,498 | ) | (22,509 | ) | |||||||||||||||||||||
Balance, end of the year | $ | 521,361 | $ | 536,331 | $ | 579,856 | |||||||||||||||||||||
Accumulated depreciation related to investments in real estate: | |||||||||||||||||||||||||||
2010 | 2009 | 2008 | |||||||||||||||||||||||||
Balance, beginning of the year | $ | (95,561 | ) | $ | (101,191 | ) | $ | (111,619 | ) | ||||||||||||||||||
Additions during the year | (10,749 | ) | (9,868 | ) | (8,729 | ) | |||||||||||||||||||||
Retirements during the year | 1,039 | 15,498 | 19,157 | ||||||||||||||||||||||||
Balance, end of the year | $ | (105,271 | ) | $ | (95,561 | ) | $ | (101,191 | ) | ||||||||||||||||||
_________________________
(1) | Included in the total are write-offs for fully depreciated tenant improvements. |
(2) | The depreciable life for buildings ranges from 40 to 50 years, 5 to 40 years for building improvements, and the shorter of the useful lives or the terms of the related leases for tenant improvements. |
The aggregate gross cost of our investments in real estate for federal income tax purposes approximated $418.4 million as of December 31, 2010 (unaudited).
95
REPORT OF INDEPENDENT REGISTERED PUBLIC ACCOUNTING FIRM
The Members
TPG/CalSTRS, LLC:
We have audited the accompanying consolidated balance sheets of TPG/CalSTRS, LLC (a Delaware limited liability company) (“TPG/CalSTRS”) as of December 31, 2010 and 2009, and the related consolidated statements of operations, members’ equity and comprehensive loss, and cash flows for each of the three years in the period ended December 31, 2010. These financial statements are the responsibility of TPG/CalSTRS’ management. Our responsibility is to express an opinion on these financial statements based on our audits.
We conducted our audit in accordance with the standards of the Public Company Accounting Oversight Board (United States). Those standards require that we plan and perform the audit to obtain reasonable assurance about whether the financial statements are free of material misstatement. We were not engaged to perform an audit of TPG/CalSTRS’s internal control over financial reporting. Our audits included consideration of internal control over financial reporting as a basis for designing audit procedures that are appropriate in the circumstances, but not for the purpose of expressing an opinion on the effectiveness of TPG/CalSTRS’s internal control over financial reporting. Accordingly, we express no such opinion. An audit also includes examining, on a test basis, evidence supporting the amounts and disclosures in the financial statements, assessing the accounting principles used and significant estimates made by management, and evaluating the overall financial statement presentation. We believe that our audit provides a reasonable basis for our opinion.
In our opinion, the financial statements referred to above present fairly, in all material respects, the consolidated financial position of TPG/CalSTRS at December 31, 2010 and 2009, and the consolidated results of its operations and its cash flows for each of the three years in the period ended December 31, 2010, in conformity with U.S. generally accepted accounting principles.
/s/ Ernst & Young LLP
Los Angeles, California
March 10, 2011
96
CONSOLIDATED BALANCE SHEETS
December 31, 2010 and 2009
(In thousands)
2010 | 2009 | ||||||
ASSETS | |||||||
Investments in real estate: | |||||||
Operating properties, net of accumulated depreciation and impairment loss of $286,368 and $247,522 as of December 31, 2010 and 2009, respectively | $ | 1,089,216 | $ | 1,120,181 | |||
Land improvements—development properties | 28,673 | 24,982 | |||||
1,117,889 | 1,145,163 | ||||||
Investments in real estate—land held for sale | — | 3,853 | |||||
Investments in unconsolidated real estate entities | 44,087 | 50,844 | |||||
Cash and cash equivalents, unrestricted | 38,680 | 3,911 | |||||
Restricted cash | 29,733 | 87,441 | |||||
Accounts receivable, net of allowance for doubtful accounts of $509 and $429 as of 2010 and 2009, respectively | 1,910 | 1,669 | |||||
Receivables from unconsolidated real estate entities | 308 | 295 | |||||
Deferred leasing costs and value of in-place leases, net of accumulated amortization of $62,965 and $59,151 as of 2010 and 2009, respectively | 73,426 | 77,938 | |||||
Deferred loan costs, net of accumulated amortization of $1,119 and $5,000 as of 2010 and 2009, respectively | 6,603 | 1,702 | |||||
Deferred rents | 79,567 | 68,273 | |||||
Acquired above market leases, net of accumulated amortization of $3,684 and $5,519 as of 2010 and 2009, respectively | 1,355 | 1,810 | |||||
Prepaid expenses and other assets | 4,544 | 5,131 | |||||
Total assets | $ | 1,398,102 | $ | 1,448,030 | |||
LIABILITIES AND EQUITY | |||||||
Liabilities: | |||||||
Mortgage loans | $ | 1,004,366 | $ | 1,042,635 | |||
Other secured loans | 22,162 | 287,859 | |||||
Unsecured loan, net of unamortized discount of $2,594 and $3,933 as of 2010 and 2009, respectively | 17,164 | 15,825 | |||||
Accounts payable and other liabilities | 47,560 | 41,302 | |||||
Due to affiliate | 1,359 | 1,676 | |||||
Acquired below market leases, net of accumulated amortization of $13,195 and $11,790 as of 2010 and 2009, respectively | 8,008 | 10,173 | |||||
Prepaid rent and deferred revenue | 8,327 | 6,692 | |||||
Total liabilities | 1,108,946 | 1,406,162 | |||||
Commitments and contingencies | — | — | |||||
Members’ equity, including $102 and $530 accumulated other comprehensive loss as of 2010 and 2009, respectively | 289,156 | 41,868 | |||||
Total liabilities and members’ equity | $ | 1,398,102 | $ | 1,448,030 | |||
See accompanying notes to consolidated financial information.
97
CONSOLIDATED STATEMENTS OF OPERATIONS
Years Ended December 31, 2010, 2009 and 2008
(In thousands)
2010 | 2009 | 2008 | |||||||||
Revenues: | |||||||||||
Rental | $ | 134,669 | $ | 134,627 | $ | 131,617 | |||||
Tenant reimbursements | 51,092 | 49,593 | 49,375 | ||||||||
Parking | 15,292 | 15,073 | 15,455 | ||||||||
Other | 4,967 | 3,531 | 3,704 | ||||||||
Total revenues | 206,020 | 202,824 | 200,151 | ||||||||
Expenses: | |||||||||||
Operating | 78,110 | 75,976 | 77,585 | ||||||||
Real estate and other taxes | 20,871 | 22,633 | 24,624 | ||||||||
General and administrative | 8,498 | 9,820 | 9,212 | ||||||||
Parking | 3,627 | 3,429 | 3,158 | ||||||||
Depreciation | 48,059 | 49,401 | 46,440 | ||||||||
Amortization | 13,453 | 14,859 | 17,250 | ||||||||
Interest | 57,111 | 49,541 | 67,102 | ||||||||
Impairment loss | — | 59,133 | — | ||||||||
Total expenses | 229,729 | 284,792 | 245,371 | ||||||||
Loss from continuing operations before interest income and equity in net income (loss) of unconsolidated real estate entities | (23,709 | ) | (81,968 | ) | (45,220 | ) | |||||
Interest income | 83 | 255 | 1,165 | ||||||||
Equity in net income (loss) of unconsolidated real estate entities | (6,924 | ) | 1,834 | (18,123 | ) | ||||||
Gain on early extinguishment of debt | 11,794 | — | — | ||||||||
Loss from continuing operations | (18,756 | ) | (79,879 | ) | (62,178 | ) | |||||
Loss from discontinued operations | — | (83 | ) | (104 | ) | ||||||
Net loss | $ | (18,756 | ) | $ | (79,962 | ) | $ | (62,282 | ) | ||
See accompanying notes to consolidated financial information.
98
CONSOLIDATED STATEMENTS OF MEMBERS’ EQUITY AND COMPREHENSIVE LOSS
Years Ended December 31, 2010, 2009 and 2008
(In thousands)
CalSTRS | TPG | Total | |||||||||
Balance-December 31, 2007 | $ | 94,019 | $ | 47,262 | $ | 141,281 | |||||
Contributions | 5,892 | 1,965 | 7,857 | ||||||||
Fair market value change of redeemable noncontrolling interest | 6,885 | 2,295 | 9,180 | ||||||||
Other comprehensive income | 75 | 122 | 197 | ||||||||
Net loss | (46,711 | ) | (15,571 | ) | (62,282 | ) | |||||
Balance-December 31, 2008 | 60,160 | 36,073 | 96,233 | ||||||||
Contributions | 16,800 | 5,600 | 22,400 | ||||||||
Distributions | (724 | ) | (724 | ) | (1,448 | ) | |||||
Fair market value change of redeemable noncontrolling interest | 2,946 | 984 | 3,930 | ||||||||
Other comprehensive income | 536 | 179 | 715 | ||||||||
Net loss | (60,043 | ) | (19,919 | ) | (79,962 | ) | |||||
Balance-December 31, 2009 | 19,675 | 22,193 | 41,868 | ||||||||
Contributions | 297,800 | 15,575 | 313,375 | ||||||||
Distributions | (40,938 | ) | (6,822 | ) | (47,760 | ) | |||||
Other comprehensive income | 322 | 107 | 429 | ||||||||
Net loss | (14,258 | ) | (4,498 | ) | (18,756 | ) | |||||
Balance-December 31, 2010 | $ | 262,601 | $ | 26,555 | $ | 289,156 | |||||
See accompanying notes to consolidated financial information.
99
CONSOLIDATED STATEMENTS OF CASH FLOWS
Years Ended December 31, 2010, 2009 and 2008
(In thousands)
2010 | 2009 | 2008 | |||||||||
Cash flows from operating activities: | |||||||||||
Net loss | $ | (18,756 | ) | $ | (79,962 | ) | $ | (62,282 | ) | ||
Adjustments to reconcile net loss to net cash provided by operating activities: | |||||||||||
Gain on early extinguishment of debt | (11,794 | ) | — | — | |||||||
Depreciation and amortization expense | 61,512 | 64,260 | 63,622 | ||||||||
Amortization of above and below market leases, net | (1,710 | ) | (1,750 | ) | (1,566 | ) | |||||
Amortization of loan costs | 3,046 | 2,765 | 3,701 | ||||||||
Expense of previously capitalized assets | 329 | 375 | — | ||||||||
Allowance for doubtful accounts | 19 | 351 | 113 | ||||||||
Equity in net (loss) income in unconsolidated real estate entities | 6,924 | (1,834 | ) | 18,123 | |||||||
Deferred rents, net | (4,943 | ) | (5,190 | ) | (8,782 | ) | |||||
Impairment loss | — | 59,133 | — | ||||||||
Distributions received from unconsolidated real estate entities | 264 | 1,809 | — | ||||||||
Purchase of interest rate caps | — | (379 | ) | — | |||||||
Changes in operating assets and liabilities: | |||||||||||
Accounts receivable | (929 | ) | 2,095 | 1,153 | |||||||
Due from affiliates | (13 | ) | (288 | ) | — | ||||||
Prepaid expenses and other assets | 495 | (1,078 | ) | (856 | ) | ||||||
Deferred rents and deferred lease costs | (14,526 | ) | (5,493 | ) | (10,664 | ) | |||||
Accounts payable and other liabilities | 7,217 | (915 | ) | 1,514 | |||||||
Due to affiliates | (317 | ) | (3,291 | ) | (2,375 | ) | |||||
Prepaid rent and deferred revenue | 2,132 | 16 | 753 | ||||||||
Deferred interest payable | 1 | 4 | — | ||||||||
Net cash provided by operating activities | 28,951 | 30,628 | 2,454 | ||||||||
Cash flows from investing activities: | |||||||||||
Expenditures for real estate | (16,618 | ) | (36,047 | ) | (85,182 | ) | |||||
Distributions received from unconsolidated real estate entities | 2,731 | 362 | 570 | ||||||||
Investments in unconsolidated real estate entities | (3,250 | ) | (5,000 | ) | (2,988 | ) | |||||
Net cash used in investing activities | (17,137 | ) | (40,685 | ) | (87,600 | ) | |||||
Cash flows from financing activities: | |||||||||||
Proceeds from mortgage and other secured loans | 657,250 | 36,616 | 80,072 | ||||||||
Repayment of mortgage loan | (732,099 | ) | (18,410 | ) | (4,613 | ) | |||||
Members’ contributions | 94,300 | 22,400 | 7,857 | ||||||||
Members’ distributions | (47,760 | ) | (1,448 | ) | — | ||||||
Change in restricted cash | 57,708 | (35,858 | ) | 5,685 | |||||||
Payment of loan costs | (6,444 | ) | — | — | |||||||
Net cash provided by financing activities | 22,955 | 3,300 | 89,001 | ||||||||
Net increase (decrease) in cash and cash equivalents | 34,769 | (6,757 | ) | 3,855 | |||||||
Cash and cash equivalents, at beginning of period | 3,911 | 10,668 | 6,813 | ||||||||
Cash and cash equivalents, at end of period | $ | 38,680 | $ | 3,911 | $ | 10,668 | |||||
Supplemental disclosure of cash flow information: | |||||||||||
Cash paid during the period for interest, including capitalized interest of $0, $228 and $2,020 for the years ended December 31, 2010, 2009 and 2008, respectively | $ | 46,803 | $ | 48,101 | $ | 67,015 | |||||
Supplemental disclosure of non-cash investing and financing activities: | |||||||||||
Conversion of debt to members' equity | 219,075 | — | — | ||||||||
Investments in real estate included in accounts payable and other liabilities | 875 | 3,187 | 7,377 | ||||||||
Decrease in investments in real estate and accumulated depreciation for removal of fully amortized improvements | 1,243 | 1,480 | 3,944 | ||||||||
Issuance of note payable for buyout of noncontrolling interest | — | 19,758 | — | ||||||||
Increase in lease inducements included in deferred rent | 2,826 | 511 | 1,001 | ||||||||
Other comprehensive (loss) income | (44 | ) | 468 | 197 | |||||||
See accompanying notes to consolidated financial information.
100
NOTES TO CONSOLIDATED FINANCIAL INFORMATION
Years Ended December 31, 2010, 2009 and 2008
(Tabular amounts in thousands, except share and per share amounts)
1. Organization
TPG/CalSTRS, LLC (“TPG/CalSTRS” or “the Company”) was formed on December 23, 2002 as a Delaware limited liability company for the purpose of acquiring office properties on a nationwide basis classified as moderate risk (core plus) and high risk (value add) properties. Core plus properties consist of under-performing properties that we believe can be brought to market potential through improved management. Value add properties are characterized by unstable net operating income for an extended period of time, occupancy less than 90% and/or physical or management problems which can be positively impacted by introduction of new capital and/or management.
The original members of TPG/CalSTRS were Thomas Properties Group, LLC, a Delaware limited liability company, with a 5% ownership interest and California State Teachers’ Retirement System (“CalSTRS”), with a 95% ownership interest.
On January 28, 2003, TPG Plaza Investments, LLC ("TPG Plaza") purchased an office building complex located in Los Angeles, California, commonly known as City National Plaza. On October 13, 2004, Thomas Properties Group, LLC contributed its interest in TPG/CalSTRS to Thomas Properties Group, L.P. (“TPG”), a Maryland limited partnership, in connection with the initial public offering of TPG’s sole general partner, Thomas Properties Group, Inc. CalSTRS contributed to TPG/CalSTRS its interest in office buildings located in Reston, Virginia, commonly known as Reflections I and Reflections II. In addition, TPG increased its ownership interest in TPG/CalSTRS from 5% to 25%. TPG acts as the managing member of TPG/CalSTRS. During 2005, TPG/CalSTRS acquired four properties in suburban Philadelphia, Pennsylvania, and four properties in Houston, Texas, including a 6.3 acre (unaudited) development site in Houston, Texas. During 2006, TPG/CalSTRS sold a suburban office property in suburban Philadelphia, Pennsylvania, and acquired a four-building campus and 24.0 acre (unaudited) development site in Houston, Texas. During 2007, TPG/CalSTRS acquired two suburban office properties in Fairfax, Virginia and sold one office property in Houston Texas. In addition, TPG/CalSTRS acquired a 25% interest in the Austin Portfolio Joint Venture which owns a portfolio of ten office properties in Austin, Texas.
TPG/CalSTRS is the sole member of TPGA, LLC, which is the managing member of TPG Plaza, the entity which owns City National Plaza ("CNP"). Prior to the second quarter of 2009, TPGA, LLC had an 85.4% ownership interest in TPG Plaza. TPG/CalSTRS’ financial statements are consolidated with the accounts of TPGA, LLC and TPG Plaza for all periods presented. During the second quarter of 2009, TPG/CalSTRS redeemed the approximately 15% noncontrolling interest held by the other member. Effective with this redemption, which is discussed further in note 2 and note 3, TPG/CalSTRS owns 100% of TPG Plaza. The redemption price of $19.8 million was financed with a promissory note issued by the former member, and is due in 2012.
As of December 31, 2010, TPG/CalSTRS owned a 100% interest in the following twelve properties:
Property | Type | Location | ||
City National Plaza | High-rise office | Los Angeles Central Business District, California | ||
Reflections I | Suburban office | Reston, Virginia | ||
Reflections II | Suburban office—single tenancy | Reston, Virginia | ||
Four Falls Corporate Center (1) | Suburban office | Conshohocken, Pennsylvania | ||
Oak Hill Plaza (1) | Suburban office | King of Prussia, Pennsylvania | ||
Walnut Hill Plaza (1) | Suburban office | King of Prussia, Pennsylvania | ||
San Felipe Plaza | High-rise office | Houston, Texas | ||
2500 City West | Suburban office | Houston, Texas | ||
Brookhollow Central I, II and III | Suburban office | Houston, Texas | ||
CityWestPlace | Suburban office and undeveloped land | Houston, Texas | ||
Centerpointe I & II | Suburban office | Fairfax, Virginia | ||
Fair Oaks Plaza | Suburban office | Fairfax, Virginia |
101
TPG/CalSTRS, LLC
(A Delaware Limited Liability Company)
NOTES TO CONSOLIDATED FINANCIAL INFORMATION—(Continued)
The following investment entity that held a mortgage loan receivable related to Brookhollow Central was 100% owned by TPG/CalSTRS. The note receivable held by this subsidiary was paid off and this entity was dissolved during the year ended December 31, 2010:
BH Note B Lender, LLC (2)
TPG/CalSTRS, LLC also owns a 25% interest in a joint venture which owns the following ten properties (“Austin Portfolio Joint Venture”):
San Jacinto Center | High-rise office | Austin Central Business District, Texas,(“ACBD”) | ||
Frost Bank Tower | High-rise office | ACBD | ||
One Congress Plaza | High-rise office | ACBD | ||
One American Center | High-rise office | ACBD | ||
300 West 6th Street | High-rise office | ACBD | ||
Research Park Plaza I & II | Suburban office | Austin, Texas | ||
Park Centre | Suburban office | Austin, Texas | ||
Great Hills Plaza | Suburban office | Austin, Texas | ||
Stonebridge Plaza II | Suburban office | Austin, Texas | ||
Westech 360 I—IV | Suburban office | Austin, Texas |
_________________________
(1) | Properties with loans subject to special servicer oversight. |
(2) | The payoff of the loan resulted in a $1.9 million gain, which is in Equity in net income (loss) of unconsolidated real estate entities on the Consolidated Statement of Operations for the year ended December 31, 2010. |
Either member of TPG/CalSTRS may trigger a buy-sell provision. Under this provision, the initiating party sets a price for its interest in TPG/CalSTRS, and the other party has a specified time to either elect to buy the initiating party’s interest, or sell its own interest to the initiating party. Under certain events, CalSTRS has a buy-out option to purchase TPG’s interest in TPG/CalSTRS. The buy-out price is generally based on a 3% discount to appraised fair market value.
TPG is required to use diligent efforts to sell each joint venture property within five years of that property reaching stabilization, except that for stabilized properties, TPG is required to perform a hold/sell analysis at least annually, and make a recommendation to the management committee regarding the appropriate holding period for these properties.
Capital contributions, distributions, and profits and losses of the real estate entities are allocated in accordance with the terms of the applicable limited liability company agreements. Such allocations may differ from the stated ownership percentage interests in such entities as a result of preferred returns and allocation formulas as described in the limited liability company agreements. Following are the stated ownership percentages, prior to any preferred or special allocations, as of December 31, 2010:
All properties, excluding Austin Portfolio Joint Venture: | ||||
CalSTRS | 75.0 | % | (1 | ) |
TPG | 25.0 | % | (2 | ) |
Austin Portfolio Joint Venture: | ||||
CalSTRS | 18.7 | % | ||
TPG | 6.3 | % | ||
Other members | 75.0 | % | ||
(1) Except for City National Plaza as to which CalSTRS' ownership is 92.1% interest and Centerpointe I and II as to which CalSTRS's has a 95.0% interest in the preferred equity and a 75% interest in the residual equity after the preferred equity is returned. | ||||
(2) Except for City National Plaza as to which TPG's ownership is 7.9% interest and Centerpointe I and II as to which TPG has a 5% interest in the preferred equity and a 25% interest in the residual equity after the preferred equity is returned. | ||||
102
TPG/CalSTRS, LLC
(A Delaware Limited Liability Company)
NOTES TO CONSOLIDATED FINANCIAL INFORMATION—(Continued)
During the first quarter of 2010, CalSTRS, our partner in CNP, acquired all of the property's mezzanine debt. On July 6, 2010, CalSTRS contributed this debt to the equity in TPG/CalSTRS, reducing the leverage on CNP by the full $219.1 million balance on the mezzanine loans. Solely with respect to the interest of TPG/CalSTRS in CNP, CalSTRS' percentage interest increased from 75% to 92.1% and TPG's percentage interest decreased from 25% to 7.9%. We are in discussions with CalSTRS to obtain an option to participate in up to an additional 17.1% interest in CNP through TPG/CalSTRS.
On October 19, 2010, TPG/CalSTRS invested $40.0 million as new equity in our Centerpointe partnership, which was used to retire $46.6 million of mezzanine debt, realizing a 14.2% discount from the face amount of the debt which included releasing loan reserves of approximately $11.7 million held by the lenders to TPG/CalSTRS to use for capital needs at the property. This new equity, of which the Company contributed $2.0 million or 5%, will be treated as preferred equity with a priority on distributions of available project cash and capital proceeds. Prior to February 9, 2012, we have the right to increase our interest percentage in preferred equity to 25%, and commensurately reduce CalSTRS' interest percentage in preferred equity to 75%, by contributing to the Centerpointe partnership an amount equal to 20% of the face amount of the retired debt, equal to approximately $9.3 million. After February 9, 2012, the Company may be required, at the election of CalSTRS, to increase its interest in the preferred equity to 25%, and commensurately reduce CalSTRS' interest to 75%, by contributing an amount equal to approximately $9.3 million. The contribution to increase our interest percentage would be distributed to CalSTRS.
2. Summary of Significant Accounting Policies
Basis of Presentation
The accompanying financial statements have been prepared in accordance with accounting principles generally accepted in the United States of America.
Principles of Consolidation
The accompanying consolidated financial statements include all the accounts of TPG/CalSTRS and its subsidiaries. All significant intercompany balances and transactions have been eliminated in consolidation.
Cash Equivalents
TPG/CalSTRS considers all highly liquid financial instruments purchased with an original maturity of three months or less to be cash equivalents.
Restricted Cash
Restricted cash consists of property lockbox deposits under the control of lenders to fund reserves, debt service and operating expenditures. See Note 3 for additional information on restrictions under the terms of certain secured notes payable.
Investments in Real Estate
Investments in real estate are carried at cost, less accumulated depreciation and amortization. Depreciation and amortization are recorded on a straight-line basis over the estimated useful lives as follows:
Buildings | 40 years | |
Building improvements | 5 to 40 years | |
Tenant improvements | Shorter of the useful lives or the terms of the related leases. |
Improvements and replacements are capitalized when they extend the useful life, increase capacity or improve the efficiency of the asset. Repairs and maintenance are charged to expense as incurred.
Costs related to the acquisition, development, construction and improvement of properties are capitalized. Interest, real estate taxes, insurance and other development related costs incurred during construction periods are capitalized and depreciated on the same
103
TPG/CalSTRS, LLC
(A Delaware Limited Liability Company)
NOTES TO CONSOLIDATED FINANCIAL INFORMATION—(Continued)
basis as the related assets. Included in investments in real estate is capitalized interest of $11.6 million as of both December 31, 2010 and 2009. FASB ASC 805-10, “Business Combinations,” requires a company to recognize the assets acquired, the liabilities assumed, and any noncontrolling interest in the acquired entity to be measured at their fair values as of the acquisition date. FASB ASC 805-10 also requires companies to recognize the fair value of assets acquired, the liabilities assumed and any noncontrolling interest in acquisitions of less than a one hundred percent interest when the acquisition constitutes a change in control of the acquired entity. In addition, FASB ASC 805-10 requires that acquisition-related costs and restructuring costs be recognized separately from the business combination and expensed as incurred. FASB ASC 805-10 is effective for business combinations for which the acquisition date is on or after the beginning of the first annual reporting period beginning after December 15, 2008. The adoption of FASB ASC 805-10 did not have a material impact on our financial position or results of operations.
Investments in Real Estate- Land held for sale
TPG/CalSTRS considers assets to be held for sale pursuant to the provisions of FASB ASC 360, “Property, Plant and Equipment.” The held for sale classification for real estate owned is evaluated quarterly.
Impairment of Long-Lived Assets
We assess whether there has been impairment in the value of our long-lived assets whenever events or changes in circumstances indicate the carrying amount of an asset may not be recoverable. Recoverability of assets to be held and used is measured by a comparison of the carrying amount to the future net cash flows, undiscounted and without interest, expected to be generated by the asset. If such assets are considered to be impaired, the impairment to be recognized is measured by the amount by which the carrying amount of the assets exceeds the fair value of the assets. Assets to be disposed of are reported at the lower of the carrying amount or fair value, less costs to sell. We use the equity method of accounting to account for investments in real estate entities over which we have significant influence, but not control over major decisions. In these situations, the unit of account for measurement purposes is the equity investment and not the real estate. Accordingly, if our joint venture investments meet the other-than-temporary criteria of FASB ASC 323, “Investments—Equity Method and Joint Ventures”, we would recognize an impairment loss to the extent the carrying amount exceeded the estimated fair value of our investment.
We recorded an impairment charge of our investment in the Austin Portfolio Joint Venture, which is accounted for under the equity method, for the years ended December 31, 2009 and 2008 of $4.9 million and $4.8 million, respectively. These non-cash impairment charges are included in the “Equity in net loss of unconsolidated real estate entities” line item in the consolidated statements of operations for the respective years. There was no corresponding non-cash impairment charge for the year ended December 31, 2010.
In addition, for the year ended December 31, 2009 we recorded impairment charges related to certain of our wholly-owned properties in accordance with the provisions of FASB ASC 360, “Property, Plant and Equipment.” as follows: Four Falls Corporate Center of $12.4 million; Walnut Hill Plaza of $5.4 million and Centerpointe I & II of $41.3 million. There were no impairment charges recorded for our wholly-owned properties for the years ended December 31, 2010 and 2008. These non-cash impairment charges related to our properties are included in the “Impairment loss” line item in the consolidated statements of operations.
Deferred Leasing and Loan Costs
Deferred leasing commissions and other direct costs associated with the acquisition of tenants are capitalized and amortized on a straight-line basis over the terms of the related leases. Costs associated with unsuccessful leasing opportunities are expensed. Loan costs are capitalized and amortized to interest expense over the terms of the related loans using a method that approximates the effective-interest method.
Purchase Accounting for Acquisition of Interests in Real Estate Entities
In accordance with FASB ASC 805, “Business Combinations”, the fair value of the real estate acquired is allocated to the acquired tangible assets, consisting of land, building, tenant and site improvements, and identified intangible assets and liabilities, consisting of the value of above-market and below-market leases, other value of in-place leases and value of tenant relationships, based in each case on their fair values.
The fair value of the tangible assets of an acquired property (which includes land, building, tenant and site improvements) is determined by valuing the property as if it were vacant, and the “as-if-vacant” value is then allocated to land, building, tenant and site
104
TPG/CalSTRS, LLC
(A Delaware Limited Liability Company)
NOTES TO CONSOLIDATED FINANCIAL INFORMATION—(Continued)
improvements based on management’s determination of the relative fair values of these assets. Management determines the as-if-vacant fair value of a property using methods similar to those used by independent appraisers. Factors considered by management in performing these analyses include an estimate of carrying costs during the expected lease-up periods considering current market conditions and costs to execute leases. In estimating carrying costs, management includes real estate taxes, insurance and other operating expenses and estimates of lost rental revenue during the expected lease-up periods based on current market demand. Management also estimates costs to execute leases including leasing commissions, legal and other related costs.
In allocating the fair value of the identified intangible assets and liabilities of an acquired property, above-market and below-market in-place lease values are recorded based on the present value (using an interest rate which reflects the risks associated with the leases acquired) of the difference between (i) the contractual amounts to be paid pursuant to the in-place leases and (ii) management’s estimate of fair market lease rates for the corresponding in-place leases, measured over a period equal to the remaining non-cancelable term of the lease. The capitalized above-market lease values are amortized as a reduction of rental income over the remaining non-cancelable terms of the respective leases. The capitalized below-market lease values are amortized as an increase to rental income over the terms in the respective leases. As of December 31, 2010 and 2009, we had an asset related to above market leases of $1.4 million and $1.8 million, respectively, net of accumulated amortization of $3.7 million and $5.5 million, respectively, and a liability related to below market leases of $8.0 million and $10.2 million, respectively, net of accumulated accretion of $13.2 million and $11.8 million, respectively. The weighted average amortization period for the above and below market leases was approximately 2.5 years and 3.8 years, respectively, as of December 31, 2010 and 3.4 years and 4.6 years as of December 31, 2009.
The aggregate value of other acquired intangible assets, consisting of in-place leases and tenant relationships, is measured by the excess of (i) the purchase price paid for a property after adjusting existing in-place leases to market rental rates over (ii) the estimated fair value of the property as if vacant, determined as set forth above. This aggregate value is allocated between in-place lease values and tenant relationships based on management’s evaluation of the specific characteristics of each tenant’s lease; however, the value of tenant relationships has not been separated from in-place lease value for the additional interests in real estate entities acquired by TPG/CalSTRS because such value and its consequence to amortization expense is immaterial for these particular acquisitions. Should future acquisitions of properties result in allocating material amounts to the value of tenant relationships, an amount would be separately allocated and amortized over the estimated life of the relationship. The value of in-place leases exclusive of the value of above-market and below-market in-place leases is amortized to expense over the remaining non-cancelable periods of the respective leases. If a lease were to be terminated prior to its stated expiration, all unamortized amounts relating to that lease would be written off.
The table below presents the expected amortization related to the acquired in-place lease value and acquired above and below market leases at December 31, 2010:
2011 | 2012 | 2013 | 2014 | 2015 | Thereafter | Total | |||||||||||||||||||||
Amortization expense: | |||||||||||||||||||||||||||
Acquired in-place lease value | $ | 5,371,666 | $ | 4,769,466 | $ | 4,372,573 | $ | 4,209,187 | $ | 2,556,930 | $ | 7,369,594 | $ | 28,649,416 | |||||||||||||
Adjustments to rental revenues: | |||||||||||||||||||||||||||
Above market leases | $ | 404,227 | $ | 288,158 | $ | 191,234 | $ | 182,526 | $ | 182,385 | $ | 106,284 | $ | 1,354,814 | |||||||||||||
Below market leases | $ | (1,864,971 | ) | $ | (1,701,751 | ) | $ | (1,616,697 | ) | $ | (1,358,654 | ) | $ | (675,475 | ) | $ | (790,386 | ) | $ | (8,007,934 | ) | ||||||
Net adjustment to rental revenues | $ | (1,460,744 | ) | $ | (1,413,593 | ) | $ | (1,425,463 | ) | $ | (1,176,128 | ) | $ | (493,090 | ) | $ | (684,102 | ) | $ | (6,653,120 | ) | ||||||
Revenue Recognition
All leases are classified as operating leases and minimum rents are recognized on a straight-line basis over the terms of the leases.
The impact of the straight line rent adjustment increased revenue by $5.1 million, $5.2 million and $8.8 million for the years ended December 31, 2010, 2009, and 2008, respectively. Additionally, the net impact of the amortization of acquired above market leases and acquired below market leases increased revenue by $1.7 million, $1.8 million and $1.6 million for the years ended December 31, 2010, 2009 and 2008, respectively. The excess of rents recognized over amounts contractually due pursuant to the underlying leases is included in deferred rents in the accompanying consolidated balance sheets and contractually due but unpaid rents are included in accounts receivable. TPG/CalSTRS also maintains an allowance for doubtful accounts for estimated losses resulting from the inability
105
TPG/CalSTRS, LLC
(A Delaware Limited Liability Company)
NOTES TO CONSOLIDATED FINANCIAL INFORMATION—(Continued)
of tenants to make required rent payments. The computation of this allowance is based on the tenants’ payment history and current credit status, as well as certain industry or specific credit considerations. If estimates of collectability differ from the cash received, then the timing and amount of our reported revenue could be impacted. The credit risk is mitigated by the reviews of prospective tenant’s risk profiles prior to lease execution and continual monitoring of our tenant portfolio to identify potential problem tenants.
Tenant reimbursements for real estate taxes, common area maintenance and other recoverable costs are recognized in the period that the expenses are incurred. Amounts allocated to tenants based on relative footage are included in the tenant reimbursements caption on the consolidated statements of operations. Revenues generated from requests from tenants, which result in over-standard usage of services are directly billed to the tenants and are also included in the tenant reimbursements caption on the consolidated statements of operations. Lease termination fees, which are included in other income in the accompanying consolidated statement of operations, are recognized when the related leases are canceled and TPG/CalSTRS has no continuing obligation to provide services to such former tenants.
We recognize gains on sales of real estate when the recognition criteria in FASB ASC 360-20-40, “Property, Plant and Equipment”, subsection “Real Estate Sales” have been met, generally at the time title is transferred and we no longer have substantial continuing involvement with the real estate asset sold.
Derivative Instruments and Hedging Activities
FASB ASC 815, “Derivatives and Hedging”, establishes accounting and reporting standards for derivative instruments, including certain derivative instruments embedded in other contracts, and for hedging activities. As required by FASB ASC 815, TPG/CalSTRS records all derivatives on the balance sheet at fair value. The accounting for changes in the fair value of derivatives depends on the intended use of the derivative and the resulting designation. Derivatives used to hedge the exposure to changes in the fair value of an asset, liability, or firm commitment attributable to a particular risk, such as interest rate risk, are considered fair value hedges. Derivatives used to hedge the exposure to variability in expected future cash flows, or other types of forecasted transactions, are considered cash flow hedges.
For derivatives designated as fair value hedges, changes in the fair value of the derivative and the hedged item related to the hedged risk are recognized in earnings. For derivatives designated as cash flow hedges, the effective portion of changes in the fair value of the derivative is initially reported in other comprehensive income, outside of earnings, and subsequently reclassified to earnings when the hedged transaction affects earnings, and the ineffective portion of changes in the fair value of the derivative is recognized directly in earnings. TPG/CalSTRS assesses the effectiveness of each hedging relationship by comparing the changes in fair value or cash flows of the derivative hedging instrument with the changes in fair value or cash flows of the designated hedged item or transaction. For derivatives not designated as hedges, changes in fair value are recognized in earnings. We use a variety of methods and assumptions based on market conditions and risks existing at each balance sheet date to determine the approximate fair values of our cash flow hedges.
The objective in using derivatives is to add stability to interest expense and to manage its exposure to interest rate movements or other identified risks. To accomplish this objective, TPG/CalSTRS primarily uses interest rate caps as part of its cash flow hedging strategy. Under FASB ASC 815, our interest rate caps qualify as cash flow hedges. No derivatives were designated as fair value hedges or hedges of net investments in foreign operations. Additionally, TPG/CalSTRS does not use derivatives for trading or speculative purposes and currently does not have any derivatives that are not designated as hedges.
At December 31, 2010 and 2009, interest rate caps with a fair value of $83,000 and $3,000, respectively, were included in deferred loan costs. The change in net unrealized gain (loss) of $429,000, $716,000 and $197,000 in 2010, 2009 and 2008, respectively, for these derivatives designated as cash flow hedges is separately disclosed in the statements of members’ equity and comprehensive loss. On December 18, 2009, we entered into a settlement agreement with Lehman Brothers Holdings Inc. for $5.0 million to terminate the interest rate collar agreement for TPG Austin Portfolio Holdings LLC, which we paid on January 25, 2010.
On January 1, 2008 we adopted FASB ASC 820-10, “Fair Value Measurement.” FASB ASC 820-10 defines fair value, establishes a framework for measuring fair value, and expands disclosures about fair value measurements. FASB ASC 820-10 applies to reported balances that are required or permitted to be measured at fair value under existing accounting pronouncements; accordingly, the standard does not require any new fair value measurements of reported balances. FASB ASC 820-10-35 emphasizes that fair value is a market-based measurement, not an entity-specific measurement. Therefore, a fair value measurement should be determined based on the assumptions that market participants would use in pricing the asset or liability. As a basis for considering market participant assumptions in fair value measurements, FASB ASC 820-10-35 establishes a fair value hierarchy that distinguishes between market participant assumptions based on market data obtained from sources independent of the reporting entity (observable inputs that are
106
TPG/CalSTRS, LLC
(A Delaware Limited Liability Company)
NOTES TO CONSOLIDATED FINANCIAL INFORMATION—(Continued)
classified within Levels 1 and 2 of the hierarchy) and the reporting entity’s own assumptions about market participant assumptions (unobservable inputs classified within Level 3 of the hierarchy). Level 1 inputs utilize quoted prices (unadjusted) for identical assets or liabilities in active markets that we have the ability to access. Level 2 inputs are inputs other than quoted prices included in Level 1 that are observable for the asset or liability, either directly or indirectly. Level 2 inputs may include quoted prices for similar assets and liabilities in active markets, as well as inputs that are observable for the asset or liability (other than quoted prices), such as interest rates, foreign exchange rates, and yield curves that are observable at commonly quoted intervals.
To comply with the provisions of FASB ASC 820-10-35, we incorporate credit valuation adjustments to appropriately reflect both our own nonperformance risk and the respective counterparty’s nonperformance risk in the fair value measurements. In adjusting the fair value of our derivative contracts for the effect of nonperformance risk, we considered the impact of netting and any applicable credit enhancements, such as collateral postings, thresholds, mutual puts, and guarantees. We have determined that our derivative valuations in their entirety are classified in Level 2 of the fair value hierarchy. We do not have any fair value measurements using significant unobservable inputs (Level 3) as of December 31, 2010.
Asset Retirement Obligation
We account for asset retirement obligations in accordance with FASB ASC 410, “Asset Retirement and Environmental Obligations”, which provides clarification with respect to the timing of liability recognition for legal obligations associated with the retirement of tangible long-lived assets when the timing and/or method of settlement of the obligation is conditional on a future event. FASB ASC 410-20-25 requires that the fair value of a liability for a conditional asset retirement obligation be recognized in the period in which it was incurred if a reasonable estimate of fair value can be made. TPG/CalSTRS has determined that conditional legal obligations exist for the City National Plaza and Brookhollow Central properties related primarily to asbestos-containing materials. As of December 31, 2010 and 2009, the combined liability for conditional asset retirement obligations for these properties were $1.3 million and $0.8 million, respectively.
Income Taxes
TPG/CalSTRS and its subsidiaries, which are pass-through entities, are generally not subject to federal or state income taxation, as all of the taxable income, gains, losses, deductions, and credits are passed through to its partners. However, the Company is subject to income taxes in Texas and records its share of Texas income taxes from the Austin Portfolio Joint Venture. For the years ended December 31, 2010 and 2009, the Company recorded Texas income tax expense of $0.6 million and $0.6 million, respectively, as a component of real estate and other taxes. For the years ended December 31, 2010 and 2009, the Company’s share of Texas income taxes from the Austin Portfolio Joint Venture of $0.2 million and $0.2 million, respectively, was recorded as a component of equity in net income/loss of unconsolidated real estate entities.
Effective December 31, 2009, TPG/CalSTRS adopted pronouncement ASU 2009-06 with respect to how uncertain tax positions should be recognized, measured, presented and disclosed in the financial statements. The pronouncement requires the accounting and disclosure of tax positions taken or expected to be taken in the course of preparing the Partnership’s tax returns to determine whether the tax positions are “more likely-than-not” of being sustained by the applicable tax authority. Tax positions not deemed to meet the more-likely-than-not threshold would be recorded as a tax benefit or expense in the current year. Management is required to analyze all open tax years, as defined by the statute of limitations, for all major jurisdictions, which includes federal and certain states. Open tax years are those that are open for examinations by taxing authorities.
TPG/CalSTRS has no examinations in progress and none are expected at this time. As of December 31, 2010, management has reviewed all open tax years and major jurisdictions and concluded there is no tax liability resulting from unrecognized tax benefits relating to uncertain income tax positions taken or expected to be taken in future tax returns.
Fair Value of Financial Instruments
FASB ASC 825-10-50-8, “Financial Instruments,” requires us to disclose fair value information about all financial instruments, whether or not recognized in the balance sheets, for which it is practicable to estimate fair value.
Our estimates of the fair value of financial instruments as of December 31, 2010 were determined using available market information and appropriate valuation methods. Considerable judgment is necessary to interpret market data and develop estimated fair value. The use of different market assumptions or estimation methods may have a material effect on the estimated fair value amounts.
107
TPG/CalSTRS, LLC
(A Delaware Limited Liability Company)
NOTES TO CONSOLIDATED FINANCIAL INFORMATION—(Continued)
The carrying amounts for cash and cash equivalents, restricted cash, rent and other receivables, accounts payable and other liabilities approximate fair value due to the short-term nature of these instruments.
As of December 31, 2010 and 2009, the estimated fair value of our mortgage and other secured loans and unsecured loan aggregates $0.9 billion and $1.2 billion, respectively, compared to the aggregate carrying value of $0.9 billion and $1.3 billion, respectively. These amounts exclude the three properties with loans subject to special servicer oversight.
Noncontrolling Interests and Mandatorily Redeemable Financial Instruments
In accordance with FASB ASC 810, “Consolidation”, the Company reports arrangements with noncontrolling interests as a component of equity separate from the parent's equity. The Company accounts for purchases or sales of equity interests that do not result in a change in control as equity transactions. In addition, net income attributable to the noncontrolling interest is included in consolidated net income on the face of the consolidated statement of operations and, upon a gain or loss of control, the interest purchased or sold, as well as any interest retained, is recorded at its estimated fair value with any gain or loss recognized in earnings. TPG/CalSTRS does not have any noncontrolling interests as of December 31, 2010.
Accounting for mandatorily redeemable financial instruments, among other things, requires that in specific instances they are classified as liabilities and recorded at their estimated settlement value each reporting period. Certain consolidated joint ventures of the Company have limited-lives and are not considered to be mandatorily redeemable upon final or other specified liquidation events.
During the second quarter of 2009, TPG/CalSTRS redeemed the approximately 15% noncontrolling membership interest held by an unaffiliated partner in the City National Plaza (CNP) partnership. The redemption price of $19.8 million was based on a $725 million value for CNP and was financed with a promissory note due in 2012. The promissory note is reflected as an unsecured loan on the accompanying consolidated balance sheets. The redemption eliminated the former partner’s right to “put” his interest to TPG/CalSTRS at fair market value and eliminated his right of approval of any sale or financing. Effective with this redemption, TPG/CalSTRS owns 100% of CNP. As of December 31, 2010, TPG/CalSTRS has no mandatorily redeemable financial instruments.
Management’s Estimates and Critical Accounting Policies
The preparation of financial statements in conformity with accounting principles generally accepted in the United States of America requires management to make certain estimates and assumptions that affect the reported amounts of assets and liabilities and disclosure of contingent assets and liabilities at the date of the financial statements and the reported amounts of revenues and expenses during the reporting period. Actual results could differ from those estimates.
TPG/CalSTRS has identified certain critical accounting policies that affect management’s more significant judgments and estimates used in the preparation of the consolidated financial statements. On an ongoing basis, TPG/CalSTRS will evaluate estimates related to critical accounting policies, including those related to revenue recognition and the allowance for doubtful accounts receivable and investments in real estate and asset impairment. The estimates are based on information that is currently available and on various other assumptions that TPG/CalSTRS believes is reasonable under the circumstances.
TPG/CalSTRS must make estimates related to the collectability of accounts receivable related to minimum rent, deferred rent, expense reimbursements, lease termination fees and other income. TPG/CalSTRS specifically analyze accounts receivable and historical bad debts, tenant concentrations, tenant creditworthiness, and current economic trends when evaluating the adequacy of the allowance for doubtful accounts receivable. These estimates have a direct impact on our net income, because a higher bad debt allowance would result in lower net income.
TPG/CalSTRS is required to make subjective assessments as to the useful lives of the properties for purposes of determining the amount of depreciation to record on an annual basis with respect to its investments in real estate. These assessments have a direct impact on net income because if TPG/CalSTRS were to shorten the expected useful lives of its investments in real estate, TPG/CalSTRS would depreciate such investments over fewer years, resulting in more depreciation expense and lower net income on an annual basis.
TPG/CalSTRS is required to make subjective assessments as to whether there are impairments in the values of its investments in real estate. These assessments have a direct impact on net income because recording an impairment loss results in a negative adjustment to net income.
108
TPG/CalSTRS, LLC
(A Delaware Limited Liability Company)
NOTES TO CONSOLIDATED FINANCIAL INFORMATION—(Continued)
TPG/CalSTRS is required to make subjective assessments as to the fair value of assets and liabilities in connection with purchase accounting related to interests in real estate entities acquired. These assessments have a direct impact on net income subsequent to the acquisition of the interests as a result of depreciation and amortization being recorded on these assets and liabilities over the expected lives of the related assets and liabilities. TPG/CalSTRS estimates the fair value of rental properties utilizing a discounted cash flow analysis that includes projections of future revenues, expenses and capital improvement costs, similar to the income approach that is commonly utilized by appraisers.
Reclassifications
Certain prior year amounts have been reclassified to conform to the current year presentation.
Concentration of Risk
Financial instruments that subject TPG/CalSTRS to credit risk consist primarily of cash and accounts receivable. Unrestricted cash and restricted cash is maintained on deposit with high quality financial institutions. Some account balances exceed Federal Deposit Insurance Corporation (“FDIC”) insurance coverage or are not eligible for FDIC insurance coverage, and, as a result, there is a concentration of credit risk related to amounts on deposit in excess of or not covered by FDIC insurance.
For the years ended December 31, 2010, 2009 and 2008, there were no tenants accounting for 10% or more of rent and tenant reimbursements (excluding tenant reimbursements for over-standard usage of certain operating expenses) of TPG/CalSTRS.
TPG/CalSTRS generally requires either a security deposit, letter of credit or a guarantee from its tenants.
Expenses
Expenses include all costs incurred by TPG/CalSTRS in connection with the management, operation, maintenance and repair of the properties and are expensed as incurred.
Recent Accounting Pronouncements
Changes to U.S. generally accepted accounting principles (“GAAP”) are established by the FASB in the form of accounting standards updates (ASUs) to the FASB's Accounting Standards Codification. We consider the applicability and impact of all ASUs. Newly issued ASUs not listed below are expected to have no impact on our consolidated financial position and results of operations, because either the ASU is not applicable or the impact is expected to be immaterial.
In January 2010, we adopted FASB guidance contained in ASU No. 2009-17, "Consolidations (Topic 810): Improvements to Financial Reporting by Enterprises Involved with Variable Interest Entities." This standard requires an enterprise to perform an analysis to determine whether an enterprise's variable interest or interests give it a controlling financial interest in a variable interest entity. Additionally, an enterprise is required to assess whether it has an implicit financial responsibility to ensure that a variable interest entity operates as designed when determining whether it has the power to direct the activities of the variable interest entity that most significantly impact the entity's economic performance. The adoption of this ASU did not have a material impact on our financial position or results of operations.
In January 2010, the FASB issued ASU No. 2010-06, "Fair Value Measurements and Disclosures (Topic 820): Improving Disclosures about Fair Value Measurements." This guidance provides for new disclosures requiring us to (i) disclose separately the amounts of significant transfers in and out of Level 1 and Level 2 fair value measurements and describe the reasons for the transfers and (ii) present separately information about purchases, sales, issuances and settlements in the reconciliation of Level 3 fair value measurements. This guidance also provides clarification of existing disclosures requiring us to (i) determine each class of assets and liabilities based on the nature and risks of the investments rather than by major security type and (ii) for each class of assets and liabilities, disclose the valuation techniques and inputs used to measure fair value for both Level 2 and Level 3 fair value measurements. This ASU is effective for annual and interim reporting periods beginning after December 15, 2009 for most of the new disclosures and for periods beginning after December 15, 2010 for the new Level 3 disclosures. The adoption of this ASU did not have a material impact on our financial position or results of operations as it only addresses disclosures.
109
TPG/CalSTRS, LLC
(A Delaware Limited Liability Company)
NOTES TO CONSOLIDATED FINANCIAL INFORMATION—(Continued)
In February 2010, the FASB issued ASU No. 2010-09, "Subsequent Events (Topic 855): Amendments to Certain Recognition and Disclosure Requirements." This standard amends the previously issued authoritative guidance for subsequent events and, among other things, exempts SEC registrants from the requirement to disclose the date through which it has evaluated subsequent events for either original or restated financial statements. This standard does not apply to subsequent events or transactions that are within the scope of other applicable GAAP rules that provide different guidance on the accounting treatment for subsequent events or transactions. The adoption of this ASU did not have a material impact on our financial position or results of operations as it only addresses disclosures.
In December 2010, the FASB issued ASU No. 2010-29, "Business Combinations (Topic 805): Disclosure of Supplementary Pro Forma Information for Business Combinations." This guidance clarifies that the disclosure of supplementary proforma information for business combinations should be presented such that revenues and earnings of the combined entity are calculated as though the relevant business combinations that occurred during the current reporting period had occurred as of the beginning of the comparable prior annual reporting period. The guidance also improves the usefulness of the supplementary proforma information by requiring a description of the nature and amount of material, non-recurring proforma adjustments that are directly attributable to the business combinations. The adoption of this ASU did not have a material impact on our financial position or results of operations.
3. Mortgage, Other Secured Loans and Unsecured Loan
A summary of the outstanding mortgage, other secured loans and unsecured loan (in thousands) as of December 31, 2010 and 2009 is as follows. None of these loans are recourse to TPG/CalSTRS. In connection with some of the loans listed in the table below, TPG/CalSTRS is subject to customary non-recourse carve out obligations.
Interest Rate | Outstanding Debt | Maturity Date | Maturity Date at End of Extension Options | |||||||||||
2010 | 2009 | |||||||||||||
City National Plaza (1) | ||||||||||||||
Senior mortgage loan | LIBOR + 1.07% | $ | — | $ | 348,925 | 7/9/2010 | 7/9/2010 | |||||||
Senior mezzanine loan-Note A | LIBOR + 2.59% | — | 67,886 | 7/9/2010 | 7/9/2010 | |||||||||
Senior mezzanine loan-Note B | LIBOR + 1.90% | — | 23,569 | 7/9/2010 | 7/9/2010 | |||||||||
Senior mezzanine loan-Note C | LIBOR + 2.25% | — | 23,569 | 7/9/2010 | 7/9/2010 | |||||||||
Senior mezzanine loan-Note D | LIBOR + 2.50% | — | 23,569 | 7/9/2010 | 7/9/2010 | |||||||||
Senior mezzanine loan-Note E | LIBOR + 3.05% | — | 22,293 | 7/9/2010 | 7/9/2010 | |||||||||
Junior mezzanine loan | LIBOR + 5.00% | — | 58,188 | 7/9/2010 | 7/9/2010 | |||||||||
Mortgage loan | 5.90 | % | 350,000 | — | 7/1/2020 | 7/1/2020 | ||||||||
Note payable to former partner (2) | 5.75 | % | 19,758 | 19,758 | 7/1/2012 | 1/4/2016 | ||||||||
CityWestPlace | ||||||||||||||
Fixed | 6.16 | % | 121,000 | 121,000 | 7/6/2016 | 7/6/2016 | ||||||||
Floating | LIBOR + 1.25% | — | 92,400 | 7/1/2010 | 7/1/2011 | |||||||||
Floating (3)(4) | 5.03 | % | 95,000 | — | 3/5/2020 | 3/5/2020 | ||||||||
San Felipe Plaza | ||||||||||||||
Mortgage loan-Note A | 5.28 | % | — | 101,500 | 8/11/2010 | 8/11/2010 | ||||||||
Mortgage loan-Note B | LIBOR + 3.00% | — | 16,200 | 8/11/2010 | 8/11/2010 | |||||||||
Mortgage loan (5) | 4.78 | % | 110,000 | — | 12/1/2018 | 12/1/2018 | ||||||||
2500 City West | ||||||||||||||
Mortgage loan-Note A | 5.28 | % | — | 70,000 | 8/11/2010 | 8/11/2010 | ||||||||
Mortgage loan-Note B | LIBOR + 3.00% | — | 14,132 | 8/11/2010 | 8/11/2010 | |||||||||
Mortgage loan (6) | 5.53 | % | 65,000 | — | 12/5/2019 | 12/5/2019 | ||||||||
Brookhollow Central I, II and III | ||||||||||||||
Mortgage loan-Note A | LIBOR + 0.44% | — | 24,154 | 8/9/2010 | 8/9/2010 | |||||||||
110
TPG/CalSTRS, LLC
(A Delaware Limited Liability Company)
NOTES TO CONSOLIDATED FINANCIAL INFORMATION—(Continued)
Interest Rate | Outstanding Debt | Maturity Date | Maturity Date at End of Extension Options | |||||||||||
2010 | 2009 | |||||||||||||
Mortgage loan-Note B | LIBOR + 4.25% | — | 10,893 | 8/9/2010 | 8/9/2010 | |||||||||
Mortgage loan-Note C | LIBOR + 4.86% | — | 16,746 | 8/9/2010 | 8/9/2010 | |||||||||
Mortgage loan (3)(7) | LIBOR + 2.63% | 37,250 | — | 7/21/2013 | 7/21/2015 | |||||||||
Reflections I mortgage loan | 5.23 | % | 21,387 | 21,788 | 4/1/2015 | 4/1/2015 | ||||||||
Reflections II mortgage loan | 5.22 | % | 8,910 | 9,077 | 4/1/2015 | 4/1/2015 | ||||||||
Centerpointe I & II (8) | ||||||||||||||
Senior mortgage loan (3) | LIBOR + 0.60% | 55,000 | 55,000 | 2/9/2012 | 2/9/2012 | |||||||||
Mezzanine loan-Note A | LIBOR + 1.51% | — | 25,000 | 2/9/2011 | 2/9/2012 | |||||||||
Mezzanine loan-Note B | LIBOR + 2.49% | — | 21,618 | 2/9/2011 | 2/9/2012 | |||||||||
Mezzanine loan-Note C (3) | LIBOR + 3.26% | 22,162 | 22,162 | 2/9/2012 | 2/9/2013 | |||||||||
Fair Oaks Plaza | 5.52 | % | 44,300 | 44,300 | 2/9/2017 | 2/9/2017 | ||||||||
$ | 949,767 | $ | 1,253,727 | |||||||||||
Loans on properties subject to special servicer oversight (9) | ||||||||||||||
Four Falls Corporate Center | ||||||||||||||
Mortgage loan-Note A | 5.31 | % | $ | 42,200 | $ | 42,200 | 3/6/2010 | 3/6/2010 | ||||||
Mortgage loan-Note B (10)(11) | LIBOR + 3.25% | 9,867 | 9,867 | 3/6/2010 | 3/6/2010 | |||||||||
Oak Hill Plaza/Walnut Hill Plaza | ||||||||||||||
Mortgage loan-Note A | 5.31 | % | 35,300 | 35,300 | 3/6/2010 | 3/6/2010 | ||||||||
Mortgage loan-Note B (10)(12) | LIBOR + 3.25% | 9,152 | 9,152 | 3/6/2010 | 3/6/2010 | |||||||||
Total outstanding debt of properties subject to special servicer oversight | $ | 96,519 | $ | 96,519 | ||||||||||
Total outstanding debt | $ | 1,046,286 | $ | 1,350,246 | ||||||||||
__________________________
The LIBOR rate for the loans above was 0.26% at December 31, 2010.
(1) During the first quarter of 2010, CalSTRS, our partner in CNP, acquired all of the property's mezzanine debt. On July 6, 2010, CalSTRS contributed this debt to the equity in TPG/CalSTRS, reducing the leverage on CNP by the full $219.1 million balance on the mezzanine loans. Solely with respect to the interest of TPG/CalSTRS in CNP, CalSTRS' percentage interest increased from 75% to 92.1% and TPG's percentage interest decreased from 25% to 7.9%. We are in discussions with CalSTRS to obtain an option to participate in up to an additional 17.1% interest in CNP acquired by CalSTRS through TPG/CalSTRS. On July 6, 2010, a subsidiary of TPG/CalSTRS that owns CNP entered into a new non-recourse first mortgage loan in the amount of $350.0 million. The loan bears interest at a fixed rate of 5.9% and is for a term of ten years, to mature on July 1, 2020.
(2) During the second quarter of 2009, TPG/CalSTRS redeemed a 15% membership interest held by a noncontrolling owner in the CNP partnership. The redemption price of $19.8 million was financed with a promissory note issued by the former partner and due in 2012. The former partner may extend the maturity date to January 4, 2016 with respect to $0.5 million or more of the principal amount of this promissory note.
(3) The partnership that owns each property has purchased interest rate cap agreements for the funded portion of these loans.
(4) On October 12, 2010, a subsidiary of TPG/CalSTRS that owns CityWestPlace Buildings III and IV closed a new non-recourse first mortgage loan in the amount of $95 million. The loan bears interest at a fixed rate of 5.03% and will mature in March 2020. It replaces a floating rate loan in the amount of $92.4 million, which was scheduled to mature in July 2011.
(5) On July 21, 2010, a subsidiary of TPG/CalSTRS that owns San Felipe Plaza entered into a new mortgage loan in the
111
TPG/CalSTRS, LLC
(A Delaware Limited Liability Company)
NOTES TO CONSOLIDATED FINANCIAL INFORMATION—(Continued)
amount of $110.0 million. The loan bears interest at a fixed rate of 4.8% and is for a term of 8.3 years, to mature in December 2018. This loan replaces the prior $117.7 million mortgage loans, which were retired for $116.0 million pursuant to a discounted payoff agreement.
(6) On July 21, 2010, a subsidiary of TPG/CalSTRS that owns 2500 City West entered into a new mortgage loan in the amount of $65.0 million. The loan bears interest at a fixed rate of 5.5% and is for a term of 9.3 years, to mature in December 2019. This mortgage loan replaces the prior $84.1 million mortgage loans, which were retired for $81.0 million pursuant to a discounted payoff agreement.
(7) On July 21, 2010, a subsidiary of TPG/CalSTRS that owns Brookhollow Central entered into a new mortgage loan in the amount of $55.0 million. At closing, $37.0 million of the loan was funded, with an additional $3.0 million to be funded over three years and $15.0 million available for future funding of construction costs related to the redevelopment of Brookhollow Central I. The loan bears interest at LIBOR plus 2.6% and is for a three-year term plus two one-year extensions, subject to certain conditions, to mature upon final extension in July 2015. The new mortgage loan replaces the prior loans of $48.9 million.
(8) On October 19, 2010, TPG/CalSTRS restructured the debt and equity capital in our Centerpointe partnership by acquiring the mezzanine A and B notes for approximately $40 million, at a discount to par of approximately $6.6 million or 14%. In addition, the mezzanine C loan was modified to provide us with the right to prepay the loan equal to a 50% discount on the principal plus a participation feature for the lender. The mezzanine C loan was also extended through February 9, 2012 with one additional year of extension available up to February 9, 2013. CalSTRS and TPG, which contributed 95% and 5%, respectively, of the $40 million, created a new class of equity in the Centerpointe partnership in the amount of $46.6 million (the “preferred equity”), which has a priority on distributions of available project cash and capital proceeds. After February 9, 2012, TPG may be required, at the election of CalSTRS, to increase its interest in the preferred equity to 25%, and commensurately reduce CalSTRS' interest to 75%, by contributing an amount equal to approximately $9.3 million.
(9) Subsidiaries of TPG/CalSTRS (the “borrowers”) elected not to repay the loans by the maturity date of March 6, 2010 and therefore, the loans are in default. We are in discussions with the special servicer regarding a cooperative resolution on each of these assets, including the likely appointment of a receiver and the judicial transfer of the properties. The borrowers are accruing interest on these loans at a default rate, which ranges from 10.3% to 10.5% per annum beginning on the maturity date of March 6, 2010.
(10) These loans are subject to exit fees equal to 1% of the loan amounts; however, under certain circumstances the exit fees will be waived. These loans bear interest at the greater of the one month LIBOR or 2.25% per annum, plus the applicable margin. Due to the maturity date default discussed in note 8 above, the borrower is accruing interest at a default rate, which ranges from 10.3% to 10.5% per annum beginning on the maturity date of March 6, 2010.
(11) This loan is secured by both a subordinate lien on the property and a payment guaranty issued by the special purpose entity which owns Oak Hill Plaza/Walnut Hill Plaza.
(12) This loan is secured by both a subordinate lien on the property and a payment guaranty issued by the special purpose entity which owns Four Falls Corporate Center.
112
TPG/CalSTRS, LLC
(A Delaware Limited Liability Company)
NOTES TO CONSOLIDATED FINANCIAL INFORMATION—(Continued)
The loan agreements generally require that all receipts collected from the properties be deposited in a lockbox account under the control of the lender to fund reserves, debt service and operating expenditures. Included in restricted cash on our consolidated balance sheet at December 31, 2010 and 2009, are lockbox, reserve funds and/or security deposits as follows (in thousands):
2010 | 2009 | ||||||
City National Plaza | $ | 347 | $ | 41,635 | |||
Oak Hill/Walnut Hill Plaza | 3,195 | 1,837 | |||||
Four Falls Corporate Center | 2,248 | 1,218 | |||||
2500 City West | 462 | 4,221 | |||||
San Felipe Plaza | 2,302 | 6,711 | |||||
Brookhollow Central I, II and III | 411 | 784 | |||||
CityWestPlace | 2,897 | 4,883 | |||||
Centerpointe I & II | 15,658 | 23,272 | |||||
Fair Oaks Plaza | 2,213 | 2,880 | |||||
Restricted cash - consolidated properties | $ | 29,733 | $ | 87,441 | |||
As of December 31, 2010, scheduled principal payments for the outstanding debt are as follows (in thousands):
Amount Due at Original Maturity Date | Amount Due at Maturity Date After Exercise of Extension Options | ||||||
2011 | $ | — | $ | — | |||
2012 | 96,920 | 55,000 | |||||
2013 | 37,250 | 22,162 | |||||
2014 | — | — | |||||
2015 | 30,297 | 67,547 | |||||
Thereafter | 785,300 | 805,058 | |||||
$ | 949,767 | $ | 949,767 | ||||
4. Related Party Transactions
Generally, TPG earns an acquisition fee for services performed, which result in the acquisition of a real estate property by TPG/CalSTRS. For the years ended December 31, 2010, 2009 and 2008, TPG/CalSTRS did not incur any acquisition fees.
TPG provides asset management services to TPG/CalSTRS, which are included in general and administrative expenses and loss from discontinued operations.
Pursuant to a management and leasing agreement, TPG performs property management and leasing services for TPG/CalSTRS. TPG is entitled to property management fees calculated based on 3% of gross property revenues, paid on a monthly basis. In addition, TPG is reimbursed for compensation paid to certain of its employees and direct out-of-pocket expenses, which are included in operating expenses and loss from operations.
For new leases entered into by TPG/CalSTRS, TPG is entitled to leasing commissions, generally calculated at 4% of base rent during years 1 through 10 of a lease and 3% of base rent thereafter, where TPG acts as the procuring broker, and 2% of lease rent during years 1 through 10 of a lease and 1.5% of base rent thereafter, where TPG acts as the co-operating broker. For lease renewals, where TPG is the procuring broker and there is no co-operating broker, TPG is entitled to leasing commissions, calculated at 4% of base rent. For lease renewals, where there is both a procuring and co-operating broker, if TPG is the procuring broker, it is entitled to receive 3% of base rents and if it’s the co-operating broker, it is entitled to receive 1.5% of base rents. Commissions are paid 50% at signing and 50% upon occupancy. The leasing commissions will be split on the customary basis between TPG and tenant representative when applicable, which are included in deferred leasing costs. At
113
TPG/CalSTRS, LLC
(A Delaware Limited Liability Company)
NOTES TO CONSOLIDATED FINANCIAL INFORMATION—(Continued)
December 31, 2010 and 2009, $0.6 million and $0.7 million, respectively, are payable to TPG pursuant to the management and leasing agreements discussed above.
The management and leasing agreement automatically renews for successive periods of one year each, unless TPG elects not to renew the agreement.
TPG acts as the development manager for the properties. TPG/CalSTRS pays TPG a fee based upon a market rate percentage of the total direct and indirect costs of the property, including the cost of all tenant improvements therein, which have been capitalized to real estate.
TPG/CalSTRS obtains insurance as part of a master insurance policy that includes all the properties in which TPG and affiliated entities have an investment and for which they perform investment advisory or property management services. Property insurance premiums are allocated to TPG/CalSTRS based on estimated insurable values. Liability insurance premiums are allocated to TPG/CalSTRS based on relative square footage. The allocated premiums are included in operating expenses and loss from discontinued operations.
The fees and reimbursements paid to TPG for the years ended December 31, 2010, 2009 and 2008 are as follows (in thousands):
2010 | 2009 | 2008 | |||||||||
TPG/CalSTRS: | |||||||||||
Asset management fees | $ | 5,136 | $ | 5,615 | $ | 5,841 | |||||
Property management fees | 6,203 | 5,905 | 5,730 | ||||||||
Payroll - on-site property management personnel | 2,708 | 2,626 | 2,943 | ||||||||
Leasing commissions | 1,668 | 1,049 | 1,575 | ||||||||
Development management fees | 499 | 742 | 2,040 | ||||||||
Liability insurance premium reimbursement | 6,179 | 5,825 | 5,307 | ||||||||
22,393 | 21,762 | 23,436 | |||||||||
Austin Portfolio Joint Venture: | |||||||||||
Asset management fees | $ | 329 | $ | 354 | $ | 353 | |||||
Property management fees | 3,394 | 3,406 | 3,435 | ||||||||
Payroll-on-site property management personnel | 1,935 | 1,849 | 2,032 | ||||||||
Leasing commissions | 1,795 | 1,077 | 2,529 | ||||||||
Development management fees | 213 | 197 | 259 | ||||||||
7,666 | 6,883 | 8,608 | |||||||||
$ | 30,059 | $ | 28,645 | $ | 32,044 | ||||||
TPG receives incentive compensation based on a minimum return on investment to CalSTRS, following which TPG would participate in cash flow above the stated return, subject to a clawback provision in the joint venture agreement if returns for a property fall below the stated return. No incentive compensation was earned for the years ended December 31, 2010, 2009, and 2008.
In connection with a retail restaurant tenant at City National Plaza, affiliates of TPG have acquired membership interests in the limited liability company, which is the tenant and operator of the restaurant. In order to help balance the construction budget for the restaurant improvements and to allow for payment of outstanding construction obligations, TPG agreed to waive $0.2 million of construction management fees it earned through December 15, 2008, and it also agreed to defer receipt of the remaining balance of fees owed of approximately $0.2 million until such time as sufficient proceeds exist from the sale of additional membership units.
TPG is a tenant in City National Plaza through May 2014. For the years ended December 31, 2010, 2009, and 2008, rental revenues from TPG were $0.7 million, $0.4 million, and $0.4 million, respectively.
114
TPG/CalSTRS, LLC
(A Delaware Limited Liability Company)
NOTES TO CONSOLIDATED FINANCIAL INFORMATION—(Continued)
At December 31, 2010 and 2009, we had accounts receivable for our advisor services of $0.4 million and $0.4 million, respectively, due from the Austin Portfolio Joint Venture.
5. Discontinued Operations
In January 2007, TPG/CalSTRS classified Intercontinental Center as held for sale, upon the decision to market the property for sale. In accordance with FASB ASC 360, “Property, Plant and Equipment”, the results of operations for Intercontinental Center are reflected in the consolidated statements of operations as discontinued operations since acquisition of the property in August 2005. The property was sold in April 2007. Residual amounts from the sale of Intercontinental Center are also reflected in discontinued operations for 2009 and 2008.
6. Minimum Future Lease Rentals
TPG/CalSTRS has entered into various lease agreements with tenants as of December 31, 2010. The minimum future cash rents receivable on non-cancelable leases, including leases relating to the property held for sale, in each of the next five years and thereafter are as follows (in thousands):
Year ending December 31, | |||
2011 | $ | 129,277 | |
2012 | 126,630 | ||
2013 | 118,725 | ||
2014 | 111,229 | ||
2015 | 94,544 | ||
Thereafter | 353,538 | ||
$ | 933,943 | ||
The leases generally also require reimbursement of the tenant’s proportionate share of common area, real estate taxes and other operating expenses, which are not included in the amounts above.
7. Commitments and Contingencies
TPG/CalSTRS has been named as a defendant in a number of lawsuits in the ordinary course of business. TPG/CalSTRS believes that the ultimate settlement of these suits will not have a material adverse effect on its financial position and results of operations.
In connection with the ownership, operation and management of the real estate properties, TPG/CalSTRS may be potentially liable for costs and damages related to environmental matters. TPG/CalSTRS has not been notified by any governmental authority of any noncompliance, liability or other claim in connection with any of the properties, and TPG/CalSTRS is not aware of any other environmental condition with respect to any of the properties that management believes will have a material adverse effect on TPG/CalSTRS’ assets or results of operations.
8. Unconsolidated Real Estate Entities
TPG/CalSTRS owns a 25% interest in the Austin Portfolio Joint Venture which owns the following ten properties all of which were purchased on June 1, 2007:
San Jacinto Center
Frost Bank Tower
One Congress Plaza
One American Center
300 West 6th Street
Research Park Plaza I & II
Park Centre
115
TPG/CalSTRS, LLC
(A Delaware Limited Liability Company)
NOTES TO CONSOLIDATED FINANCIAL INFORMATION—(Continued)
Great Hills Plaza
Stonebridge Plaza II
Westech 360 I-IV
Capital contributions, distributions, and profits and losses of the real estate entities are allocated in accordance with the terms of the applicable partnership and limited liability company agreements. Such allocations may differ from the stated ownership percentage interests in such entities as a result of preferred returns and allocation formulas as described in the partnership and limited liability company agreements.
116
TPG/CalSTRS, LLC
(A Delaware Limited Liability Company)
NOTES TO CONSOLIDATED FINANCIAL INFORMATION—(Continued)
The following is a summary of the investments in the Austin Portfolio Joint Venture for the period from January 1, 2008 to December 31, 2010:
Investment balance, January 1, 2008 | $ | 61,662 | |
Equity in net loss of unconsolidated real estate entities | (18,193 | ) | |
Other comprehensive loss | (610 | ) | |
Investment balance, December 31, 2008 | $ | 42,859 | |
Contributions | 5,000 | ||
Equity in net income of unconsolidated real estate entities | 1,303 | ||
Other comprehensive income | 834 | ||
Investment balance, December 31, 2009 | $ | 49,996 | |
Contributions | 3,250 | ||
Equity in net income of unconsolidated real estate entities | (9,407 | ) | |
Other comprehensive income | 248 | ||
Investment balance, December 31, 2010 | $ | 44,087 | |
Following is summarized financial information for the Austin Portfolio Joint Venture as of December 31, 2010 and 2009 and for the years ended December 31, 2010, 2009 and 2008:
Summarized Balance Sheets
2010 | 2009 | ||||||
ASSETS | |||||||
Investments in real estate, net | $ | 1,036,922 | $ | 1,064,304 | |||
Receivables including deferred rents | 21,280 | 12,786 | |||||
Deferred leasing and loan costs, net | 54,742 | 64,483 | |||||
Other assets | 20,487 | 27,555 | |||||
Total assets | $ | 1,133,431 | $ | 1,169,128 | |||
LIABILITIES AND OWNERS’ EQUITY | |||||||
Mortgage and other secured loans | $ | 873,623 | $ | 852,291 | |||
Below market rents, net | 40,329 | 52,354 | |||||
Other liabilities | 44,565 | 47,508 | |||||
Total liabilities | 958,517 | 952,153 | |||||
Owners’ equity: | |||||||
TPG/CalSTRS, including $9 and $258 of other comprehensive loss as of 2010 and 2009, respectively | 43,728 | 54,244 | |||||
Other owners, including $27 and $774 of other comprehensive loss as of 2010 and 2009, respectively | 131,186 | 162,731 | |||||
Total owners’ equity | 174,914 | 216,975 | |||||
Total liabilities and owners’ equity | $ | 1,133,431 | $ | 1,169,128 | |||
117
TPG/CalSTRS, LLC
(A Delaware Limited Liability Company)
NOTES TO CONSOLIDATED FINANCIAL INFORMATION—(Continued)
Summarized Statement of Operations
2010 | 2009 | 2008 | |||||||||
Revenues | $ | 107,608 | $ | 118,037 | $ | 117,635 | |||||
Expenses: | |||||||||||
Operating and other expenses | 51,262 | 53,355 | 53,987 | ||||||||
Interest expense | 50,175 | 53,410 | 58,081 | ||||||||
Depreciation and amortization | 49,227 | 54,896 | 59,504 | ||||||||
Total expenses | 150,664 | 161,661 | 171,572 | ||||||||
Loss from continuing operations | (43,056 | ) | (43,624 | ) | (53,937 | ) | |||||
Gain on extinguishment of debt | — | 67,017 | — | ||||||||
Net loss | $ | (43,056 | ) | $ | 23,393 | $ | (53,937 | ) | |||
TPG/CalSTRS’ share of net loss | $ | (10,764 | ) | $ | 5,849 | $ | (13,484 | ) | |||
Intercompany eliminations | 1,357 | 365 | 131 | ||||||||
Impairment loss | — | (4,911 | ) | (4,840 | ) | ||||||
Equity in net loss of Austin Portfolio Joint Ventures | $ | (9,407 | ) | $ | 1,303 | $ | (18,193 | ) | |||
9. Subsequent Events
We had no subsequent events as of March 9, 2011, requiring disclosure.
118
SIGNATURES
Pursuant to the requirements of Section 13 or 15(d) of the Securities Exchange Act of 1934, as amended, the registrant has duly caused this report to be signed on its behalf by the undersigned thereunto duly authorized.
Dated: March 10, 2011
THOMAS PROPERTIES GROUP, INC. | ||
By: | /s/ James A. Thomas | |
James A. Thomas Chief Executive Officer | ||
119
POWER OF ATTORNEY
KNOW ALL PERSONS BY THESE PRESENTS, that each individual whose signature appears below constitutes and appoints James A. Thomas and Diana M. Laing, his or her true and lawful attorneys-in-fact each acting alone, with full power of substitution and re-substitution, for him or her and in his or her name, place and stead in any and all capacities to sign any or all amendments to this report on Form 10-K, and to file the same, with all exhibits thereto, and other documents in connection therewith, with the Securities and Exchange Commission, granting unto said attorneys-in-fact and agents full power and authority to do and perform each and every act and thing requisite and necessary to be done in and about the premises, as fully to all intents and purposes as he or she might or could do in person, hereby ratifying and confirming all that said attorneys-in-fact, or their substitutes, each acting alone, may lawfully do or cause to be done by virtue hereof.
Pursuant to the requirements of the Securities Exchange Act of 1934, this report has been signed by the following persons in the capacities indicated below.
Signature | Title | Date | ||
/s/ JAMES A. THOMAS | Chairman of the Board, President and Chief Executive Officer (Principal Executive Officer) | March 10, 2011 | ||
James A. Thomas | ||||
/s/ R. BRUCE ANDREWS | Director | March 10, 2011 | ||
R. Bruce Andrews | ||||
/s/ EDWARD D. FOX | Director | March 10, 2011 | ||
Edward D. Fox | ||||
/s/ WINSTON H. HICKOX | Director | March 10, 2011 | ||
Winston H. Hickox | ||||
/s/ JOHN GOOLSBY | Director | March 10, 2011 | ||
John Goolsby | ||||
/s/ RANDALL L. SCOTT | Executive Vice President and Director | March 10, 2011 | ||
Randall L. Scott | ||||
/s/ JOHN R. SISCHO | Co-Chief Operating Officer and Director | March 10, 2011 | ||
John R. Sischo | ||||
/s/ DIANA M. LAING | Chief Financial Officer (Principal Financial Officer) | March 10, 2011 | ||
Diana M. Laing | ||||
/s/ ROBERT D. MORGAN | Senior Vice President (Principal Accounting Officer) | March 10, 2011 | ||
Robert D. Morgan |
120