Attached files
| file | filename |
|---|---|
| EX-23 - STATE BANCORP INC | i00106_ex23.htm |
| EX-32 - STATE BANCORP INC | i00106_ex32.htm |
| EX-24 - STATE BANCORP INC | i00106_ex24.htm |
| EX-99.2 - STATE BANCORP INC | i00106_ex99-2.htm |
| EX-31.2 - STATE BANCORP INC | i00106_ex31-2.htm |
| EX-99.1 - STATE BANCORP INC | i00106_ex99-1.htm |
| EX-31.1 - STATE BANCORP INC | i00106_ex31-1.htm |
| EX-14.2 - STATE BANCORP INC | i00106_ex14-2.htm |
| EX-10.13 - STATE BANCORP INC | i00106_ex10-13.htm |
| EX-10.31 - STATE BANCORP INC | i00106_ex10-31.htm |
| EX-10.27 - STATE BANCORP INC | i00106_ex10-27.htm |
| EX-10.12.2 - STATE BANCORP INC | i00106_ex10-122.htm |
| EX-10.12.1 - STATE BANCORP INC | i00106_ex10-121.htm |
|
|
|
UNITED STATES SECURITIES AND EXCHANGE COMMISSION |
|
WASHINGTON, D.C. 20549 |
x ANNUAL REPORT PURSUANT TO SECTION 13 OR 15(d) OF
THE SECURITIES EXCHANGE ACT OF 1934
For the fiscal year ended December 31,
2010
o TRANSITION REPORT PURSUANT TO SECTION 13 OR 15(d) OF THE SECURITIES EXCHANGE ACT OF 1934
|
|
|
Commission File No. 001-14783 |
|
STATE BANCORP, INC. |
|
(Exact name of registrant as specified in its charter) |
|
|
|
|
|
New York |
|
11-2846511 |
|
|
|
|
|
(State or other jurisdiction of incorporation or organization) |
|
(I.R.S. Employer Identification No.) |
|
|
|
|
|
Two Jericho Plaza, Jericho, NY |
|
11753 |
|
|
|
|
|
(Address of principal executive offices) |
|
(Zip Code) |
|
|
|
|
|
Registrant’s telephone number, including area code: (516) 465-2200 |
||
|
|
|
|
|
Securities registered pursuant to Section 12(b) of the Act: None |
||
|
Securities registered pursuant to Section 12(g) of the Act: |
|
Common Stock ($0.01 par value) |
|
|
|
|
|
|
|
(Title of Class) |
|
|
|
Indicate by check mark if the registrant is a well-known seasoned issuer, as defined in Rule 405 of the Securities Act. |
|
Yes o No x |
|
|
|
Indicate by check mark if the registrant is not required to file reports pursuant to Section 13 or Section 15(d) of the Act. |
|
Yes o No x |
Indicate by check mark whether the registrant (1) has filed all reports required to be filed by Section 13 or 15(d) of the Securities Exchange Act of 1934 during the preceding 12 months (or for such shorter period that the registrant was required to file such reports), and (2) has been subject to such filing requirement for the past 90 days. Yes x No o
Indicate by check mark whether the registrant has submitted electronically and posted on its corporate Web site, if any, every Interactive Data File required to be submitted and posted pursuant to Rule 405 of Regulation S-T (§232.405 of this chapter) during the preceding 12 months (or for such shorter period that the registrant was required to submit and post such files). Yes o No o
Indicate by check mark if disclosure of delinquent filers pursuant to Item 405 of Regulation S-K is not contained herein, and will not be contained, to the best of registrant’s knowledge, in definitive proxy or information statement incorporated by reference in Part III of this Form 10-K or any amendment of this Form 10-K. x
Indicate by check mark whether the registrant is a large accelerated filer, an accelerated filer, a non-accelerated filer, or a smaller reporting company. See definitions of “accelerated filer”, “large accelerated filer”, and “smaller reporting company” in Rule 12b-2 of the Exchange Act. Large accelerated filer o Accelerated filer x Non-accelerated filer o Smaller reporting company o
Indicate by check mark whether the registrant is a shell company (as defined in Rule 12b-2 of the Exchange Act). Yes o No x
As of June 30, 2010, there were 16,656,959 shares of common stock outstanding and the aggregate market value of common stock of State Bancorp, Inc. held by non-affiliates was approximately $132,783,000 as computed using the closing market price of the stock of $9.50 reported by the NASDAQ Global Market on June 30, 2010. The market value of shares held by Registrant’s directors, executive officers and Employee Stock Ownership and 401(k) plans have been excluded because they may be considered to be affiliates of the Registrant.
As of February 24, 2011, there were 16,837,641 outstanding shares of State Bancorp, Inc. common stock.
STATE BANCORP, INC.
Annual Report on Form 10-K
For the Year Ended December 31, 2010
Table of Contents
2
DOCUMENTS INCORPORATED BY REFERENCE
Portions of the definitive proxy statement to be used in connection with the Annual Meeting of Stockholders to be held on April 26, 2011 and which is expected to be filed with the Securities and Exchange Commission (“SEC”) within 120 days from December 31, 2010 are incorporated by reference into Part III.
|
|
|
|
ITEM 1. |
BUSINESS |
General
State Bancorp, Inc. (the “Company”), a one-bank holding company headquartered in Jericho, New York, was formed in 1985. The Company operates as the parent for its wholly owned subsidiary, State Bank of Long Island and subsidiaries (the “Bank”), a New York State chartered commercial bank founded in 1966, and its unconsolidated wholly owned subsidiaries, State Bancorp Capital Trust I and II (collectively called the “Trusts”), entities formed in 2002 and 2003, respectively, to issue trust preferred securities. The income of the Company is primarily derived through the operations of the Bank. The Company had 289 employees as of December 31, 2010.
The Bank serves its client base through seventeen branches in Nassau, Suffolk, Queens and Manhattan. The Bank offers a full range of banking services to our diverse client base which includes commercial real estate owners and developers, small to middle market businesses, professional service firms, municipalities and consumers. Retail and commercial products include checking accounts, NOW accounts, money market accounts, savings accounts, certificates of deposit, individual retirement accounts, commercial loans, construction loans, commercial real estate loans, small business lines of credit, cash management services and telephone and online banking. In addition, the Bank also provides access to annuity products and mutual funds. The Company’s loan portfolio is concentrated in commercial and industrial loans and commercial real estate loans. The Bank has not historically and does not currently engage in subprime lending and similarly does not offer payment option ARMs or negative amortization loan products.
At December 31, 2010, the Company, on a consolidated basis, had total assets of approximately $1.6 billion, total deposits of approximately $1.3 billion, and stockholders’ equity of approximately $155 million. Unless the context otherwise requires, references herein to the Company include the Company and its subsidiaries on a consolidated basis. The Company operates in the banking industry and management considers the Company to be aggregated into one reportable operating segment. The Bank does not rely on foreign sources of funds or income and the Bank does not have any foreign commitments, with the exception of letters of credit issued on behalf of several of its domestic customers.
The Company’s Internet address is www.statebankofli.com. The Company makes available on its website, free of charge, its periodic and current financial reports, proxy and information statements. Information and any amendments we file with the SEC are available on our website as soon as reasonably practicable after the Company files such material with, or furnishes such material to, the SEC. Unless specifically incorporated by reference, the information on our website is not part of this annual report. Such reports are also available on the SEC’s website at www.sec.gov, or at the SEC’s Public Reference Room at 100 F Street, N.E., Room 1580, Washington, DC, 20549. Information may be obtained on the operation of the Public Reference Room by calling the SEC at 1-800-SEC-0330.
Market Area and Competition
The Company considers its business to be highly competitive in its market areas. The Company has numerous competitors for its core niche of small business and middle market clients. The Company competes with local, regional and national depository financial institutions, including commercial banks, savings banks, insurance companies, credit unions and money market funds, and other businesses with respect to its lending services and in attracting deposits. The New York metropolitan area has a high density of financial institutions, a number of which are significantly larger than the Company. Some competitors have entered the marketplace through de novo banks, acquisitions and strategic alliances. Additionally, over the past several years, various large out-of-state financial institutions have entered the New York metropolitan market. All of these institutions are our competitors to varying degrees.
3
The Company’s current market area, consisting primarily of Metropolitan New York City, provides opportunity for growth in deposits and commercial lending. The Company believes that there is a significant number of small to mid-size businesses in its current market area that seek a locally-based commercial bank that can offer a broad array of financial products and services. Many of these businesses have been affected by bank mergers in the area. Given the variety of financial products and services offered by the Company, its focus on client service, and its local management, the Company believes that it can well serve the growing needs of both new and existing clients in its current market areas.
Commercial and residential real estate values in our market appear to be stabilizing at lower levels. Locally, however, properties are burdened by high maintenance costs including an ever increasing state and local tax burden. The national and local economies remain fragile with low levels of economic activity and stubbornly high unemployment rates. Business conditions remain subdued and that uncertainty is serving to limit both consumer and corporate spending. Although the economy appears to be slowly improving, 2011 will be approached with a continued degree of caution as the Company expects that volatility will continue in the equity, credit and real estate markets. Although we, like many other financial service firms, continue to witness very difficult and challenging market conditions, the Company is diligently managing its business interests, particularly in the area of maintaining strengthened underwriting standards and risk management practices.
Competitive Strengths
The Company believes that the following business strengths differentiate it from its peers:
|
|
|
|
|
|
• |
Asset Quality. The Company’s successful execution in late 2009 of its strategy to liquidate lower quality loans represented an important strategic step toward significantly reducing future balance sheet risk. By eliminating the multiple distractions, inherent costs and uncertainties that these lower quality loans consistently demand, the Company is better able to effectively deploy the Bank’s ample resources to take advantage of other opportunities ahead, including organic franchise expansion and potential acquisitions. The year-end 2010 allowance for loan losses was at a level of 2.9% of total loans. |
|
|
|
|
|
|
• |
Net Interest Margin. For the years ended December 31, 2010 and 2009, the Company’s net interest margin was 4.21% and 4.03%, respectively. A 37 basis point reduction in the average cost of interest-bearing liabilities was only slightly offset by a nine basis point decline in the average rate earned on the Company’s interest-earning assets during 2010. Our healthy 2010 fourth quarter net interest margin of 4.04% is a positive and tangible reflection of the Company’s continued capacity to produce strong core net interest earnings, even in this very challenging interest rate environment. |
|
|
|
|
|
|
• |
One of the Largest Independent Commercial Banks Headquartered on Long Island. The Bank is one of the largest independent commercial banks headquartered on Long Island, with a network of branches stretching from central Suffolk County to midtown Manhattan. As an entrepreneurial and community-oriented bank, the Bank has the ability to provide highly personalized service and to render lending decisions quickly to clients and prospective borrowers. |
|
|
|
|
|
|
• |
Low - Cost Deposit Base. Core deposits, consisting of demand, savings and money market deposits, totaled $976 million at December 31, 2010 versus $995 million at December 31, 2009. Core deposits represented 72% of total deposits at December 31, 2010 and 74% of total deposits at December 31, 2009. Demand deposits represented 25% of total deposits at December 31, 2010 and 28% at December 31, 2009. The weighted average cost of the Company’s core deposits was 0.37% in 2010 and 0.49% in 2009. |
|
|
|
|
|
|
• |
Capital Base. The Company’s Tier I leverage capital ratio was 9.53% at December 31, 2010 versus 8.68% at December 31, 2009. The Company’s tangible common equity ratio (non-GAAP financial measure) was 7.39% at December 31, 2010 versus 6.93% at December 31, 2009. The Company’s capital ratios exceeded all regulatory requirements at December 31, 2010. The Bank’s year-end 2010 capital ratios remain in excess of the regulatory guidelines, as established by federal banking regulatory agencies, for a “well capitalized” institution, the highest regulatory capital category. |
|
|
|
|
|
|
• |
Corporate Governance and Transparency. The Company is diligent in ensuring its business is conducted with the highest level of integrity and with full transparency. All employees, officers and directors of the Company are governed by a Code of |
4
|
|
|
|
|
|
|
Business Conduct and Ethics that requires them to conduct themselves in a professional, honest, and ethical manner, and to avoid conflicts of interest. |
Lending
General
The Bank provides loans to small to moderate size and middle market borrowers and business entities diversified across industries. Loan types include business installment loans, commercial lines of credit and commercial real estate loans. Loans are primarily categorized as commercial real estate (“CRE”), commercial & industrial (“C&I”) and small business loans. CRE loans consist of loans on multifamily, mixed use, retail, office and industrial property or construction loans. C&I loans consist of a broad range of loans to a wide variety of business clients for acquisition of equipment, machinery or leasehold improvements, short term or seasonal working capital needs, and business expansion. Small business loans are a subset of C&I loans where the origination amount is less than $1 million.
Structure
Lending officers are primarily responsible for loan origination, structure, document preparation, obtaining approval, and monitoring the relationship. Each lending officer reports to a team leader. The lenders are supported by a dedicated department of experienced credit analysts who prepare credit proposals including research on business and industry and the borrower’s financial condition. The CRE and C&I divisions are headed by team leaders who report directly to the Chief Lending Officer (“CLO”).
Lending Authority
Authority for extending commercial credit is delegated by the Board of Directors to the President of the Bank, the management credit committee and to certain individuals as applicable. Each loan officer and team leader has lending authority depending on experience and title. Regardless of lending authority, all extensions of commercial credit, except deficit balances/uncollected funds, require the approval of at least two Bank officers with credit authority, one of whom must have the authority for the aggregate amount being approved. All loans above a designated amount must be approved by the management credit committee, which is comprised of the Chief Executive Officer (“CEO”), the CLO, the Enterprise Risk Manager (“ERM”), the Chief Credit Officer (“CCO”), the Deputy Chief Lending Officer (“DCLO”) and CRE specialist. Loans above the authority of the management credit committee and up to the Bank’s legal lending limit must be approved by the loan committee of the Board of Directors, which consists of three outside directors and the CEO.
Administration
Loan administration focuses on credit support, control systems and other practices necessary to manage the outstanding credits. Credit administration for C&I loans provides for periodic reviews on all C&I credit facilities depending on length to maturity and aggregate balance. For CRE loans, on an ongoing basis, each loan file must contain current credit and financial information to properly monitor trends as well as the borrower’s ability to service the debt and the capacity to repay the loan. If the loan officer receives information that may negatively affect repayment of the loan, the loan officer must take appropriate measures, including, for example, implementing a remedial action plan. Site inspections for CRE loans are performed periodically depending on loan balance and payment status.
Risk Management
Management’s goal is to have a balanced portfolio of loans. The allowable risk for the portfolio is determined by senior management through credit policies and annual business plans which are approved by the Board of Directors. The Bank monitors concentrations of risk as appropriate. A concentration of credit is the total of funded and unfunded loans, real estate loans, lines of credit, etc., issued to borrowers sharing similar characteristics such as industry, collateral/security type, size, pricing, location and other items that might have a bearing on risk management. It is also the Bank’s goal to diversify credit risk among a broad range of industries and/or industry sectors, and to monitor concentration on an ongoing basis.
Loan Workouts
The Bank has workout specialists who are directly responsible for managing loans where borrowers are experiencing sustained financial difficulties. Such specialists will work with the borrower to rectify the problem, monitor the credit as needed and, if necessary, restructure the loan. If there are signs of further deterioration in the credit, the workout specialist will search for additional collateral to improve the
5
Bank’s position while the credit is weak. The workout specialists will also assess the financial situation of the borrower on a long term basis, and when appropriate may market the loan for sale to an investor or commence litigation. All loan workouts are approved by the CEO, the loan workout committee and, when appropriate, the loan committee of the Board of Directors.
Deposits
The Bank offers a variety of deposit products ranging in maturity from demand accounts to certificates of deposits of up to five years. Our principal products include checking accounts, money market accounts, savings accounts, escrow services and interest on lawyer (“IOLA”) accounts, time deposit accounts and IRA accounts. The Bank competes for customers by emphasizing personal service and by addressing the needs of small and mid-size businesses, professional service firms, municipalities and consumers. Deposits are generally derived from customers within our primary marketplace. To the lesser extent, we also utilize the Certificate of Deposit Account Registry Service and brokered certificates of deposits, pursuant to authorization limits, as a source of funding and to manage interest rate risk. The Bank, currently a well-capitalized depository institution, is allowed to solicit and accept, renew or roll over any brokered deposit without restriction. Should the Bank become adequately capitalized, it may accept, renew or roll over any brokered deposit only after it has applied for and been granted a waiver by the FDIC. Should the Bank become undercapitalized, it may not accept, renew, or roll over any brokered deposit.
Management sets deposit rates to remain generally competitive with other financial institutions in our market, although we do not generally seek to match the highest rates paid by competing institutions. We have established a process to review interest rates on all deposit products and, based upon this process, update our deposit rates weekly.
The Bank’s ten largest depositor relationships accounted for approximately 22% of its deposits at December 31, 2010. The Bank’s largest depositor relationship accounted for approximately 8% of its deposits at December 31, 2010.
Supervision and Regulation
General
The Company is registered as a bank holding company under the Bank Holding Company Act of 1956, as amended (the “BHCA”), and is therefore subject to supervision and examination by the Board of Governors of the Federal Reserve System (“FRB”). The Bank is a member of the Federal Home Loan Bank of New York (“FHLB-NY”) and its deposit accounts are insured up to the applicable limits by the Federal Deposit Insurance Corporation (the “FDIC”) under the Deposit Insurance Fund (“DIF”). The Bank is subject to the regulation and supervision and examination of the New York State Banking Department (the “Banking Department”) and the FDIC.
The following summary discussion sets forth certain of the material elements of the legal and regulatory framework applicable to banks and bank holding companies and their subsidiaries. The regulation of banks and bank holding companies is extremely complex and this summary is qualified in its entirety by reference to the applicable statutes, regulations and regulatory guidance. Management believes the Company is in compliance in all material respects with these laws and regulations. A change in applicable statutes and regulations or regulatory policy cannot be predicted, but may have a material effect on the business of the Company and/or the Bank.
Bank holding companies and banks are prohibited by law from engaging in unsafe and unsound banking practices. Federal and New York State banking laws, regulations and policies extensively regulate the Company and the Bank including prescribing standards relating to capital, earnings, dividends, the repurchase or redemption of shares, loans or extension of credit to affiliates and insiders, internal controls, information systems, internal audit systems, loan documentation, credit underwriting, asset growth, impaired assets and loan to value ratios. Such laws and regulations are intended primarily for the protection of depositors, other customers and the federal deposit insurance funds and not for the protection of security holders. Bank regulatory agencies have broad examination and enforcement powers over bank holding companies and banks, including the power to impose substantial fines, limit dividends and restrict operations and acquisitions.
A bank holding company is required to serve as a source of financial strength to its subsidiary depository institutions and to commit all available resources to support such institutions in circumstances where it might not do so absent such policy. Consistent with this “source of strength” policy, the FRB takes the position that a bank holding company generally should not maintain a rate of cash dividends unless its net income available to common stockholders is sufficient to fully fund the dividends and the prospective rate of earnings retention appears to be consistent with the company’s capital needs, asset quality and overall financial condition. In addition, any loans by the Company to the Bank would be subordinate in right of payment to depositors and to certain other indebtedness of the Bank.
6
Recent Regulatory Reform Legislation
In July 2010, President Obama signed into law the Dodd-Frank Wall Street Reform and Consumer Protection Act (the “Reform Act”), which is intended to address perceived weaknesses in the U.S. financial regulatory system and prevent future economic and financial crises. Among other things, the Reform Act provides for the creation of the Bureau of Consumer Financial Protection (the “CFPB”). With respect to insured depository institutions with less than $10 billion in assets, such as the Bank, the CFPB will have exclusive authority to issue new consumer protection regulations, and may participate in examinations conducted by the federal bank regulatory agencies to determine compliance with consumer protection laws and regulations, although the CFPB will have no enforcement authority with respect to these matters. As a new independent bureau within the FRB, it is possible that the CFPB will focus more attention on consumers and may impose requirements more severe than the previous bank regulatory agencies. In addition, as described further below, the Reform Act requires the federal bank regulatory agencies to establish consolidated risk-based and leverage capital requirements for insured depository institutions, depository institution holding companies and systemically important nonbank financial companies, which could subject us to capital requirements that are higher than those to which we are currently subject, and it includes provisions that will affect the amount of deposit insurance assessments that we pay to the FDIC.
The Reform Act also includes provisions, subject to further rulemaking by the federal bank regulatory agencies, that may affect our future operations, including provisions that create minimum standards for the origination of mortgages, restrict proprietary trading by banking entities and restrict the sponsorship of and investment in hedge funds and private equity funds by banking entities. We will not be able to determine the impact of these provisions until final rules are promulgated to implement these provisions and other regulatory guidance is provided interpreting these provisions.
Acquisitions
As a bank holding company, the Company may not acquire direct or indirect ownership or control of more than 5% of the voting shares of any company, including a bank, without the prior approval of the FRB, except as specifically authorized under the BHCA. Under the BHCA, the Company, subject to the approval of or notice to the FRB, may acquire shares of non-banking corporations, the activities of which are deemed by the FRB to be so closely related to banking or managing or controlling banks as to be a proper incident thereto.
The Change in Bank Control Act prohibits a person or group of persons from acquiring “control” of the Company unless the FRB has been notified and has not objected to the transaction. Under a rebuttable presumption established by the FRB, the acquisition of 10% or more of a class of the Company’s voting stock, would, under the circumstances set forth in the presumption, constitute acquisition of control of the Company. In addition, any entity is required to obtain the approval of the FRB under the BHCA before acquiring 25% (5% in the case of an acquirer that is a bank holding company) or more of the Company’s outstanding common stock, or otherwise obtaining control or a “controlling influence” over the Company. The New York Banking Law (the “Banking Law”) similarly regulates a change in control affecting the Bank and requires the approval of the New York State Banking Board.
The Riegle-Neal Interstate Banking and Branching Efficiency Act of 1994, as amended (the “Interstate Banking Act”), generally permits bank holding companies to acquire banks in any state, and preempts all state laws restricting the ownership by a bank holding company of banks in more than one state. The Interstate Banking Act also permits a bank to merge with an out-of-state bank and convert any offices into branches of the resulting bank if both states have not opted out of interstate branching; permits a bank to acquire branches from an out-of-state bank if the law of the state where the branches are located permits the interstate branch acquisition; and permits banks to establish and operate de novo interstate branches whenever the host state opts-in to de novo branching. Bank holding companies and banks seeking to engage in transactions authorized by the Interstate Banking Act must be adequately capitalized and managed. The Banking Law authorizes interstate branching by merger or acquisition on a reciprocal basis, and permits the acquisition of a single branch without restriction, but does not provide for de novo interstate branching.
Capital Adequacy
The federal banking regulators have adopted risk-based capital guidelines that require the Company’s and the Bank’s capital-to-assets ratios to meet certain minimum standards. The risk-based capital ratio is determined by allocating assets and specified off-balance sheet financial instruments into four weighted categories, with higher levels of capital being required for the categories perceived as representing greater risk. For a further discussion, see the Notes to the Company’s Consolidated Financial Statements. The minimum ratio of qualifying total capital (“total capital”) to risk-weighted assets (including certain off-balance sheet items) is 8%. At least half of the total capital must consist of common stock, retained earnings, qualifying noncumulative perpetual preferred stock, minority interests in the equity accounts of consolidated subsidiaries and, for bank holding companies, a limited amount of noncumulative perpetual preferred stock, trust preferred
7
securities and certain other so-called “restricted core capital elements” less most intangibles including goodwill (“Tier I capital”). The remainder (“Tier II capital”) may consist of certain other preferred stock, certain other capital instruments, and limited amounts of subordinated debt and the allowance for loan losses. Restricted core capital elements are currently limited to 25% of Tier I capital.
In addition, the FRB has established minimum guidelines for the “leverage ratio” of Tier I capital to average total assets for bank holding companies and banks. The FRB’s guidelines provide for a minimum leverage ratio of 3% for bank holding companies and banks that meet certain specified criteria, including those having the highest supervisory rating. All other banking organizations are required to maintain a leverage ratio of at least 4%.
The FRB guidelines also provide that banking organizations experiencing internal growth or making acquisitions will be expected to maintain strong capital positions substantially above the minimum supervisory levels, without significant reliance on intangible assets. In addition, higher capital ratios may be required for any bank holding company if warranted by its particular circumstances or risk profile. At December 31, 2010, the FRB had not advised the Company of any specific minimum leverage ratio applicable to it.
At December 31, 2010, the Bank’s Tier I leverage ratio was 9.50% while its risk-based capital ratios were 12.23% for Tier I capital and 13.49% for total capital. These ratios exceed the minimum regulatory guidelines for a well-capitalized institution. At December 31, 2010, the Company’s Tier I leverage ratio was 9.53% and its risk-based capital ratios were 12.29% and 13.55% for Tier I capital and total capital, respectively. The Company’s ratios exceed the minimum regulatory guidelines.
The Reform Act requires the federal bank regulatory agencies to establish consolidated risk-based and leverage capital requirements for insured depository institutions, depository institution holding companies and systemically important nonbank financial companies. These requirements must be no less than those to which insured depository institutions are currently subject. Thus, it is likely that the Company will become subject to capital requirements that are higher than those to which it is currently subject, although it is unknown at this time what these requirements will be. The new requirements will also eliminate the use of trust preferred securities issued after May 19, 2010 as a component of Tier 1 capital for depository institution holding companies of the Company’s size, although because the Company had less than $15 billion of consolidated assets as of December 31, 2009, it will continue to be permitted to include any trust preferred securities issued before May 19, 2010 as an element of Tier 1 capital.
Prompt Corrective Action
The Federal Deposit Insurance Act (“FDIA”) requires, among other things, that federal banking regulators take prompt corrective action in respect of FDIC-insured depository institutions that do not meet minimum capital requirements. The FDIA specifies five capital tiers: “well capitalized,” “adequately capitalized,” “undercapitalized,” “significantly undercapitalized,” and “critically undercapitalized.” A depository institution’s capital tier will depend upon how its capital levels compare to various relevant capital measures and certain other factors, as established by regulation.
Under applicable regulations, an FDIC-insured bank is deemed to be: (i) well capitalized if it maintains a leverage ratio of at least 5%, a Tier I capital ratio of at least 6% and a total capital ratio of at least 10% and is not subject to an order, written agreement, capital directive, or prompt corrective action directive to meet and maintain a specific level for any capital measure; (ii) adequately capitalized if it maintains a leverage ratio of at least 4% (or a leverage ratio of at least 3% if it received the highest supervisory rating in its most recent report of examination, subject to appropriate federal banking agency guidelines, and is not experiencing or anticipating significant growth), a Tier I capital ratio of at least 4% and a total capital ratio of at least 8% and is not defined to be well capitalized; (iii) undercapitalized if it has a leverage ratio of less than 4% (or a leverage ratio that is less than 3% if it received the highest supervisory rating in its most recent report of examination, subject to appropriate federal banking agency guidelines, and is not experiencing or anticipating significant growth), a Tier I capital ratio less than 4% or a total capital ratio of less than 8% and it does not meet the definition of a significantly undercapitalized or critically undercapitalized institution; (iv) significantly undercapitalized if it has a leverage ratio of less than 3%, a Tier I capital ratio of less than 3% or a total capital ratio of less than 6% and it does not meet the definition of critically undercapitalized; and (v) critically undercapitalized if it maintains a level of tangible equity capital of less than 2% of total assets. A bank may be deemed to be in a capitalization category that is lower than is indicated by its actual capital position if it receives an unsatisfactory examination rating. The FDIA imposes progressively more restrictive constraints on operations, management and capital distributions, depending on the capital category in which an institution is classified. A depository institution that is not well capitalized is also subject to certain limitations on brokered deposits and Certificate of Deposit Account Registry Service (“CDARS”) deposits.
The FDIA generally prohibits an FDIC-insured depository institution from making any capital distribution (including payment of dividends) or paying any management fee to its holding company if the depository institution would thereafter be undercapitalized. Undercapitalized
8
depository institutions are subject to restrictions on borrowing from the Federal Reserve and to growth limitations, and are required to submit a capital restoration plan. For a capital restoration plan to be acceptable, any holding company must guarantee the capital plan up to an amount equal to the lesser of 5% of the depository institution’s assets at the time it became undercapitalized and the amount of the capital deficiency at the time it fails to comply with the plan. In the event of the holding company’s bankruptcy, such guarantee would take priority over claims of its general unsecured creditors. If a depository institution fails to submit an acceptable plan, it is treated as if it is significantly undercapitalized.
Significantly undercapitalized depository institutions may be subject to a number of requirements and restrictions, including orders to sell sufficient voting stock to become adequately capitalized, requirements to reduce total assets and cessation of receipt of deposits from correspondent banks. Critically undercapitalized depository institutions are subject to appointment of a receiver or conservator.
Deposit Insurance
The Bank is a member of the DIF and pays its deposit insurance assessments to the DIF. Effective January 1, 2007, the FDIC established a new risk-based assessment system for determining the deposit insurance assessments to be paid by insured depository institutions. Under this new assessment system, the FDIC assigns an institution to one of four risk categories, with the first category having two sub-categories, based on the institution’s most recent supervisory ratings and capital ratios. For institutions within Risk Category I, assessment rates generally depend upon Capital adequacy, Asset quality, Management, Earnings, Liquidity, Sensitivity to market risk, or CAMELS component ratings, and financial ratios, or for large institutions with long-term debt issuer ratings, assessment rates will depend on a combination of long-term debt issuer ratings and CAMELS component ratings. The FDIC has the flexibility to adjust rates, without further notice-and-comment rulemaking, provided that no such adjustment can be greater than three basis points from one quarter to the next, that adjustments cannot result in rates more than three basis points above or below the base rates and that rates cannot be negative. The FDIC also established 1.25% of estimated insured deposits as the designated reserve ratio of the DIF. In December 2010, the FDIC amended its regulations to increase the designated reserve ratio of the DIF from 1.25% to 2.00% of estimated insured deposits of the DIF effective January 1, 2011. The FDIC is authorized to change the assessment rates as necessary, subject to the previously discussed limitations, to maintain the required reserve ratio.
The deposit insurance assessment rates are in addition to the assessments for payments on the bonds issued in the late 1980’s by the Financing Corporation (“FICO”) to recapitalize the now defunct Federal Savings and Loan Insurance Corporation. The FICO payments will continue until the bonds mature in 2017 through 2019. For 2010, the Bank had an assessment rate of 14.73 basis points and a total expense of $2.7 million, which includes $2.5 million for the assessment for deposit insurance and $145 thousand for the FICO payments.
As a result of the failures of a number of banks and thrifts, there has been a significant increase in the loss provisions of the DIF. This resulted in a decline in the DIF reserve ratio during 2008 below the then minimum designated reserve ratio of 1.15%. As a result, the FDIC was required to establish a restoration plan to restore the reserve ratio to 1.15% within a period of five years, which was subsequently extended to eight years. In order to restore the reserve ratio to 1.15%, the FDIC adopted a final rule in February 2009 which set the initial base assessment rates beginning April 1, 2009 and provided for the following adjustments to an institution’s assessment rate: (1) a decrease for long-term unsecured debt, including most senior and subordinated debt; (2) an increase for secured liabilities above a threshold amount; and (3) for non-Risk Category I institutions, an increase for brokered deposits above a threshold amount. The current initial base assessment rates range from twelve to sixteen basis points for Risk Category I institutions and are twenty-two basis points for Risk Category II institutions, thirty-two basis points for Risk Category III institutions and forty-five basis points for Risk Category IV institutions. Total base assessment rates, after applying all possible adjustments, currently range from seven to seventy-seven and one-half basis points of deposits.
The Reform Act increased the minimum designated reserve ratio for the DIF from 1.15% to 1.35% of insured deposits, which must be reached by September 30, 2020, and provides that in setting the assessments necessary to meet the new requirement, the FDIC shall offset the effect of this provision on insured depository institutions with total consolidated assets of less than $10 billion, so that more of the cost of raising the reserve ratio will be borne by the institutions with more than $10 billion in assets. In October 2010, the FDIC adopted a new restoration plan to ensure that the DIF reserve ratio reaches 1.35% by September 30, 2020, as required by the Reform Act. Among other things, the new restoration plan provided that the FDIC would forego a uniform three basis point increase in initial assessments rates that was previously scheduled to take effect on January 1, 2011. The FDIC intends to pursue further rulemaking in 2011 regarding the method that will be used to reach the reserve ratio of 1.35% so that more of the cost of raising the reserve ratio to 1.35% will be borne by institutions with more than $10 billion in assets.
9
In accordance with the Reform Act, on February 7, 2011, the FDIC adopted a final rule that redefines the assessment base for deposit insurance assessments as average consolidated total assets minus average tangible equity, rather than on deposit bases, and adopts a new assessment rate schedule, as well as alternative rate schedules that become effective when the reserve ratio reaches certain levels. The final rule also makes conforming changes to the unsecured debt and brokered deposit adjustments to assessment rates, eliminates the secured liability adjustment and creates a new assessment rate adjustment for unsecured debt held that is issued by another insured depository institution.
The new rate schedule and other revisions to the assessment rules become effective April 1, 2011 and will be used to calculate our June 30, 2011 invoices for assessments due September 30, 2011. As revised by the final rule, the initial base assessment rates for depository institutions with total assets of less than $10 billion, such as the Bank, will range from five to nine basis points for Risk Category I institutions and are fourteen basis points for Risk Category II institutions, twenty-three basis points for Risk Category III institutions and thirty-five basis points for Risk Category IV institutions. Total base assessment rates, after applying all the unsecured debt and brokered deposit adjustments, currently range from two and one-half to forty-five basis points.
In May 2009, the FDIC adopted the final rule imposing a 5 basis point special assessment on each insured depository institution’s assets minus Tier 1 capital as of June 30, 2009. The assessment, collected on September 30, 2009, totaled $730 thousand for the Bank. The final rule also permits the FDIC to impose an emergency special assessment after June 30, 2009, of up to 10 basis points if necessary, to maintain public confidence in federal deposit insurance. The FDIC has not imposed another special assessment.
In November 2009, the FDIC adopted the final rule regarding prepaid assessments. The final rule required insured depository institutions to prepay their estimated quarterly deposit insurance assessments for the fourth quarter of 2009, and for all of 2010, 2011 and 2012. The prepaid assessments for these periods were collected on December 30, 2009, along with the Bank’s regular quarterly insurance assessment for the third quarter of 2009, which, for the Bank, totaled $8.6 million. For purposes of estimating an institution’s assessments for the fourth quarter of 2009 and all of 2010, 2011 and 2012, and calculating the amount the Bank prepaid on December 20, 2009, the Bank’s assessment rate was its total base assessment rate in effect on September 30, 2009. The Bank’s quarterly risk-based insurance assessments will be paid from the amount the Bank has prepaid until that amount is exhausted or until the prepayment is returned, whichever comes first. Prepaid assessments may only be used to offset regular quarterly risk-based deposit insurance assessments.
The FDIC began offsetting prepaid assessments on March 30, 2010, representing payment of the regular quarterly risk-based deposit insurance assessment for the fourth quarter of 2009. The FDIC will refund any unused assessments after collection of the amount due on June 30, 2013. Requiring prepaid assessments does not preclude the FDIC from changing assessment rates or from further revising the risk-based assessment system during 2009, 2010, 2011, 2012, or thereafter.
In October 2008, the FDIC announced a temporary increase in the standard maximum deposit insurance amount from $100,000 to $250,000 per depositor through December 31, 2009, in response to the financial crises affecting the banking system and financial markets. In May 2009, President Obama signed the Helping Families Save Their Homes Act of 2009, which, among other provisions, extended the expiration date of the temporary increase in the standard maximum deposit insurance amount from December 31, 2009 to December 31, 2013. To reflect this extension, the FDIC adopted a final rule in September 2009 extending the increase in deposit insurance from $100,000 to $250,000 per depositor through December 31, 2013. Subsequently, the Reform Act permanently increased the standard maximum deposit insurance amount from $100,000 to $250,000, effective July 2010. In August 2010, the FDIC adopted final rules conforming its regulations to the provisions of the Reform Act relating to the new permanent standard maximum deposit insurance amount.
In November 2008, the FDIC adopted the Temporary Liquidity Guarantee Program (the “TLGP”), pursuant to its authority to prevent “systemic risk” in the U.S. banking system. The TLGP was announced by the FDIC in October 2008 as an initiative to counter the system-wide crisis in the nation’s financial sector. The TLGP includes a Debt Guarantee Program and a Transaction Account Guarantee Program (the “TAGP”). We elected to participate in both programs under the TLGP.
Under the TAGP, the FDIC fully insured non-interest bearing transaction deposit accounts held at participating FDIC-insured institutions through December 31, 2010, as extended in April 2010. For institutions participating in the TAGP, a ten basis point annualized fee was added to the institution’s quarterly insurance assessment in 2009 for balances in non-interest bearing transaction accounts that exceeded the existing deposit insurance limit of $250,000. In 2010, this fee increased to fifteen basis points for the Bank. The Bank’s expense for the TAGP totaled $356 thousand in 2010 and $190 thousand in 2009.
10
In place of the TAGP which expired on December 31, 2010, and in accordance with certain provisions of the Reform Act, the FDIC adopted further rules in November and December 2010 which provide for temporary unlimited insurance coverage of certain non-interest bearing transaction accounts. Such coverage began on December 31, 2010 and terminates on December 31, 2012. Beginning January 1, 2013, such accounts will be insured under the general deposit insurance coverage rules of the FDIC. Unlike the TAGP, the new rules do not cover NOW accounts and the FDIC will not charge a separate assessment for the insurance of non-interest bearing transaction accounts. Instead the FDIC will take into account the cost of this additional insurance coverage in determining the amount of the assessment it charges under its new risk-based assessment system.
Under the FDIA, the FDIC may terminate the insurance of an institution’s deposits upon a finding that the institution has engaged in unsafe or unsound practices, is in an unsafe or unsound condition to continue operations or has violated any applicable law, regulation, rule, order or condition imposed by the FDIC. The management of the Company does not know of any practice, condition or violation that might lead to termination of its deposit insurance.
Transactions with Affiliates and the Bank
The Bank is subject to the affiliate and insider transaction rules set forth in Sections 23A, 23B, 22(g) and 22(h) of the Federal Reserve Act (“FRA”), and Regulation W issued by the FRB. These provisions, among other things, prohibit or limit an insured bank from extending credit to, or entering into certain transactions with, its affiliates (which for the Bank would include the Company) and principal stockholders, directors and executive officers. The FRB requires depository institutions that are subject to Sections 23A and 23B to implement policies and procedures to ensure compliance with Regulation W regarding transactions with affiliates.
Section 402 of the Sarbanes-Oxley Act of 2002 (“Sarbanes-Oxley”) prohibits the extension of personal loans to directors and executive officers of issuers (as defined in Sarbanes-Oxley). The prohibition, however, does not apply to mortgages advanced by an insured depository institution, such as the Bank, that are subject to the insider lending restrictions of Section 22(h) of the FRA.
The Reform Act imposes further restrictions on transactions with affiliates and extensions of credit to executive officers, director and principal shareholders, by, among other things, expanding covered transactions to include securities lending, repurchase agreement and derivatives activities with affiliates. These changes are effective one year after the “designated transfer date” of July 21, 2011 (which transfer date may be delayed for up to six months at the option of the Secretary of the Treasury).
Privacy Standards
The Bank is subject to the FDIC’s regulations implementing the privacy protection provisions of the Gramm-Leach-Bliley Act (“Gramm-Leach”). These regulations require the Bank to disclose its privacy policy, including identifying with whom it shares “non-public personal information,” to customers at the time of establishing the customer relationship and annually thereafter.
The regulations also require the Bank to provide its customers with initial and annual notices that accurately reflect its privacy policies and practices. In addition, the Bank is required to provide its customers with the ability to “opt-out” of having the Bank share their non-public personal information with unaffiliated third parties before they can disclose such information, subject to certain exceptions.
The Bank is subject to regulatory guidelines establishing standards for safeguarding customer information. These regulations implement certain provisions of Gramm-Leach. The guidelines describe the agencies’ expectations for the creation, implementation and maintenance of an information security program, which would include administrative, technical and physical safeguards appropriate to the size and complexity of the institution and the nature and scope of its activities. The standards set forth in the guidelines are intended to ensure the security and confidentiality of customer records and information, protect against any anticipated threats or hazards to the security or integrity of such records and protect against unauthorized access to or use of such records or information that could result in substantial harm or inconvenience to any customer.
Community Reinvestment Act
Bank holding companies and their subsidiary banks are also subject to the provisions of the Community Reinvestment Act (“CRA”). Under the terms of the CRA, the FDIC (or other appropriate bank regulatory agency) is required, in connection with its examination of a bank, to assess such bank’s record in meeting the credit needs of the communities served by that bank, including low- and moderate-income neighborhoods. Furthermore, such assessment is also required of any bank that has applied, among other things, to merge or consolidate with or acquire the assets or assume the liabilities of a federally regulated financial institution or to open or relocate a branch office. In the
11
case of a bank holding company applying for approval to acquire a bank or bank holding company, the FRB will assess the record of each subsidiary bank of the applicant bank holding company in considering the application. The Banking Law contains provisions similar to the CRA which are applicable to New York State chartered banks. The Bank has consistently received “satisfactory” ratings from its regulatory CRA exams.
Dividend Limitations
The Company has two primary sources of funds: proceeds from its Dividend Reinvestment and Stock Purchase Plan (the “DRP”) and dividends from the Bank. Certain regulatory agencies impose limitations on the declaration of dividends by the Bank. As the Company issued preferred stock and a warrant to purchase common stock to the Treasury under the CPP, the Treasury’s consent is required for any increase in common stock dividends that is greater than the amount of the last quarterly cash dividend declared prior to October 14, 2008, until the earlier of a redemption of the Series A Preferred Stock or December 5, 2011. The Company’s last quarterly cash dividend declared prior to October 14, 2008, was the $0.10 per common share declared on July 29, 2008.
Anti-Money Laundering and the USA PATRIOT Act
The Company is subject to federal regulations implementing the Uniting and Strengthening America by Providing Appropriate Tools Required to Intercept and Obstruct Terrorism Act of 2001 (the “USA PATRIOT Act”). The USA PATRIOT Act amended the Bank Secrecy Act and gave the federal government powers to address terrorist threats through enhanced domestic security measures, expanded surveillance powers, increased information sharing and other anti-money laundering and anti-terrorist financing requirements. The USA PATRIOT Act and the Bank Secrecy Act and implementing regulations impose affirmative obligations on a broad range of financial institutions, including banks, thrifts, brokers, dealers, credit unions, money service businesses and others.
Among other requirements, the USA PATRIOT Act and the Bank Secrecy Act and implementing regulations impose the following requirements with respect to financial institutions:
|
|
|
|
• |
Establishment of anti-money laundering programs. |
|
|
|
|
• |
Establishment of a program specifying procedures for obtaining identifying information from customers seeking to open new accounts (“Customer Identification Programs”). |
|
|
|
|
• |
Establishment of enhanced due diligence policies, procedures and controls designed to detect and report money laundering. |
|
|
|
|
• |
Prohibition on correspondent accounts for foreign shell banks and compliance with recordkeeping obligations with respect to correspondent accounts of foreign banks. |
|
|
|
|
• |
Establishment of policies and procedures relating to foreign private banking customers and politically exposed persons. |
Substantial civil and criminal penalties may be imposed for violations of the USA PATRIOT Act and the Bank Secrecy Act and implementing regulations. Bank regulators may also require banks to take costly corrective action. Further, bank regulators are directed to consider a financial institution’s effectiveness in combating money laundering and terrorist financing when ruling on applications for approval of proposed corporate transactions.
Interagency Guidance on Concentrations in Commercial Real Estate Lending
In December 2006, the FRB, the Office of the Comptroller of the Currency (“OCC”) and the FDIC adopted guidance entitled “Concentrations in Commercial Real Estate (“CRE”) Lending, Sound Risk Management Practices” (“CRE Guidance”) to address concentrations of commercial real estate loans in financial institutions. Although the CRE Guidance does not establish specific commercial real estate lending limits, the FRB, OCC and FDIC use the following criteria to evaluate whether an institution has a commercial real estate concentration risk. An institution may be identified for further supervisory analysis if it has experienced rapid growth in commercial real estate lending or has notable exposure to a specific type of commercial real estate. An institution may also be subject to further supervisory analysis if its total reported loans for construction, land development and other land represent 100 percent or more of that institution’s total capital, or if the institution’s total commercial real estate loans represent 300 percent or more of its total capital and the outstanding balance of its commercial real estate portfolio has increased by 50 percent or more during the prior 36 months. The CRE Guidance applies to financial institutions with an accumulation of credit concentration exposures and asks that the associations quantify the additional risk such exposures may pose. Such quantification should include the stratification of the commercial real estate portfolio by, among other things, property type, geographic market, tenant concentrations, tenant industries, developer concentrations and risk rating. In addition, an institution should perform periodic market analyses for the various property types and geographic markets represented in its portfolio.
12
Further, an institution with commercial real estate concentration risk should also perform portfolio level stress tests or sensitivity analysis to quantify the impact of changing economic conditions on asset quality, earnings and capital.
At December 31, 2010, the Bank’s total reported loans for construction, land development and other land represented less than 100 percent of the Bank’s total capital and the Bank’s total commercial real estate loans represented less than 300 percent of its total capital. However, the Bank’s commercial real estate portfolio as a whole increased by 60% over the past 36 months and by a more modest 26% over the past 24 months. The primary reason for the rise was a strategic increase in the more stable multi-family sector which increased from $13 million to $121 million over the past 36 months, coupled with a 78% strategic reduction in the construction loan portion of the Bank’s commercial real estate portfolio.
Statement of Subprime Mortgage Lending
In June 2007, the FRB and other federal bank regulatory agencies issued a final Statement on Subprime Mortgage Lending (the “Statement”) to address the growing concerns facing the subprime mortgage market, particularly with respect to rapidly rising subprime default rates that may indicate borrowers do not have the ability to repay adjustable-rate subprime loans originated by financial institutions. In particular, the agencies express concern in the Statement that current underwriting practices do not take into account that many subprime borrowers are not prepared for “payment shock” and that the current subprime lending practices compound risk for financial institutions. The Statement describes the prudent safety and soundness and consumer protection standards that financial institutions should follow to ensure borrowers obtain loans that they can afford to repay. These standards include a fully indexed, fully amortized qualification for borrowers and cautions on risk-layering features, including an expectation that stated income and reduced documentation should be accepted only if there are documented mitigating factors that clearly minimize the need for verification of a borrower’s repayment capacity. Consumer protection standards include clear and balanced product disclosures to customers and limits on prepayment penalties that allow for a reasonable period of time, typically at least 60 days, for borrowers to refinance prior to the expiration of the initial fixed interest rate period without penalty. The Statement also reinforces the April 2007 Interagency Statement on Working with Mortgage Borrowers, in which the federal bank regulatory agencies encouraged institutions to work constructively with residential borrowers who are financially unable or reasonably expected to be unable to meet their contractual payment obligations on their home loans. We have evaluated the Statement to determine our compliance and, as necessary, modified our risk management practices, underwriting guidelines and consumer protection standards.
Interagency Policy Statement Regarding Commercial Real Estate Loan Workouts
In 2009, the FRB and other federal bank regulatory agencies adopted a policy statement supporting prudent CRE loan workouts (the “Policy Statement”). The Policy Statement provides guidance for examiners, and for financial institutions that are working with CRE borrowers who are experiencing diminished operating cash flows, depreciated collateral values, or prolonged delays in selling or renting commercial properties. The Policy Statement details risk-management practices for loan workouts that support prudent and pragmatic credit and business decision-making within the framework of financial accuracy, transparency, and timely loss recognition. Financial institutions that implement prudent loan workout arrangements after performing comprehensive reviews of borrowers’ financial conditions will not be subject to criticism for engaging in these efforts, even if the restructured loans have weaknesses that result in adverse credit classifications. In addition, performing loans, including those renewed or restructured on reasonable modified terms, made to creditworthy borrowers, will not be subject to adverse classification solely because the value of the underlying collateral declined. The Policy Statement reiterates existing guidance that examiners are expected to take a balanced approach in assessing institutions’ risk-management practices for loan workout activities. We have evaluated the Policy Statement to determine our compliance and, as necessary, modified our risk management practices, underwriting guidelines and consumer protection standards.
Interest Rate Risk Management Advisory
In January 2010, the FRB and other federal bank regulatory agencies released an Advisory on Interest Rate Risk Management (the “IRR Advisory”) to remind institutions of the supervisory expectations regarding sound practices for managing IRR. While some degree of IRR is inherent in the business of banking, the agencies expect institutions to have sound risk management practices in place to measure, monitor and control IRR exposures, and IRR management should be an integral component of an institution’s risk management infrastructure. The agencies expect all institutions to manage their IRR exposures using processes and systems commensurate with their earnings and capital levels, complexity, business model, risk profile and scope of operations, and the IRR Advisory reiterates the importance of effective corporate governance, policies and procedures, risk measuring and monitoring systems, stress testing, and internal controls related to the IRR exposures of institutions.
13
The IRR Advisory encourages institutions to use a variety of techniques to measure IRR exposure which includes simple maturity gap analysis, income measurement and valuation measurement for assessing the impact of changes in market rates as well as simulation modeling to measure IRR exposure. Institutions are encouraged to use the full complement of analytical capabilities of their IRR simulation models. The IRR Advisory also reminds institutions that stress testing, which includes both scenario and sensitivity analysis, is an integral component of IRR management. The IRR Advisory indicates that institutions should regularly assess IRR exposures beyond typical industry conventions, including changes in rates of greater magnitude (e.g., up and down 300 and 400 basis points as compared to up and down 200 basis points which is the general practice) across different tenors to reflect changing slopes and twists of the yield curve.
The IRR Advisory emphasizes that effective IRR management not only involves the identification and measurement of IRR, but also provides for appropriate actions to control this risk. The adequacy and effectiveness of an institution’s IRR management process and the level of its IRR exposure are critical factors in the agencies’ evaluation of an institution’s sensitivity to changes in interest rates and capital adequacy.
Federal Securities Laws
The Company’s securities are registered with the SEC under the Securities Exchange Act of 1934, as amended (the “Exchange Act”). As such, the Company is subject to the information, proxy solicitation, insider trading, and other requirements and restrictions of the Exchange Act.
New York Business Corporation Law
The Company is incorporated under the laws of the State of New York, and is therefore subject to regulation by the State of New York. In addition, the rights of the Company’s stockholders are governed by the New York Business Corporation Law.
Government Monetary Policies and Economic Control
The earnings of the Company and the Bank are affected by the policies of regulatory authorities including the FRB and the FDIC. An important function of the Federal Reserve System is to regulate the money supply and interest rates. Among the instruments used to implement these objectives are open market operations in U.S. Government securities, changes in reserve requirements against member bank deposits, purchases of U.S. Government and agency securities, purchases of mortgage-backed securities and changes in the federal funds and discount rates. These instruments are used in varying combinations to influence overall growth and distribution of bank loans, investments and deposits and their use may also affect interest rates charged on loans or paid for deposits. Changes in government monetary policies and economic controls could have a material effect on the business of the Bank.
Statistical Information
Statistical information is furnished pursuant to the requirements of Guide 3 (Statistical Disclosure by Bank Holding Companies) promulgated under the Exchange Act.
Investment Portfolio
The following table presents the amortized cost and estimated fair value of held to maturity and available for sale securities held by the Company for each period (in thousands):
14
|
|
|
|
|
|
|
|
|
|
|
|
|
|
|
|
|
|
|
|
|
|
At December 31, |
|
2010 |
|
2009 |
|
2008 |
|
||||||||||||
|
|
|
|
|
|
|
|
|
||||||||||||
|
|
|
Amortized |
|
Estimated |
|
Amortized |
|
Estimated |
|
Amortized |
|
Estimated |
|
||||||
|
|
|
|
|
|
|
|
|
|
|
|
|
|
|
|
|
|
|||
|
|
|
|
|
|
|
|
|
|
|
|
|
|
|
|
|
|
|
|
|
|
Securities held to maturity: |
|
|
|
|
|
|
|
|
|
|
|
|
|
|
|
|
|
|
|
|
Corporate securities |
|
$ |
22,000 |
|
$ |
21,890 |
|
$ |
— |
|
$ |
— |
|
$ |
— |
|
$ |
— |
|
|
|
|
|
|
|
|
|
|
|
|
|
|
|
|
|
|
|
|
|
|
|
Securities available for sale: |
|
|
|
|
|
|
|
|
|
|
|
|
|
|
|
|
|
|
|
|
Obligations of states and political subdivisions |
|
|
1,883 |
|
|
1,906 |
|
|
12,446 |
|
|
12,421 |
|
|
5,327 |
|
|
5,360 |
|
|
Mortgage-backed securities and collateralized mortgage obligations - residential |
|
|
|
|
|
|
|
|
|
|
|
|
|
|
|
|
|
|
|
|
FHLMC |
|
|
106,040 |
|
|
110,748 |
|
|
173,324 |
|
|
179,701 |
|
|
229,014 |
|
|
233,358 |
|
|
FNMA |
|
|
111,841 |
|
|
113,617 |
|
|
148,304 |
|
|
152,470 |
|
|
126,283 |
|
|
128,459 |
|
|
GNMA |
|
|
89,874 |
|
|
89,472 |
|
|
48,684 |
|
|
48,483 |
|
|
15,855 |
|
|
15,963 |
|
|
Mortgage-backed securities and collateralized mortgage obligations - commercial |
|
|
|
|
|
|
|
|
|
|
|
|
|
|
|
|
|
|
|
|
GNMA |
|
|
5,101 |
|
|
4,859 |
|
|
— |
|
|
— |
|
|
— |
|
|
— |
|
|
Government agency securities |
|
|
40,894 |
|
|
40,556 |
|
|
22,772 |
|
|
22,910 |
|
|
22,539 |
|
|
23,374 |
|
|
Collateralized debt obligations |
|
|
— |
|
|
— |
|
|
— |
|
|
— |
|
|
5,865 |
|
|
5,865 |
|
|
|
|
|
|
|
|
|
|
|
|
|
|
|
|
|
|
|
|
|
|
|
Total securities available for sale |
|
|
355,633 |
|
|
361,158 |
|
|
405,530 |
|
|
415,985 |
|
|
404,883 |
|
|
412,379 |
|
|
|
|
|
|
|
|
|
|
|
|
|
|
|
|
|
|
|
|
|
|
|
Total securities |
|
$ |
377,633 |
|
$ |
383,048 |
|
$ |
405,530 |
|
$ |
415,985 |
|
$ |
404,883 |
|
$ |
412,379 |
|
|
|
|
|
|
|
|
|
|
|
|
|
|
|
|
|
|
|
|
|
|
The following table presents the expected maturity distribution and the weighted-average yield of the Company’s investment portfolio at December 31, 2010 (dollars in thousands). Available for sale securities are shown at estimated fair value and held to maturity securities are shown at amortized cost. The yield information does not give effect to changes in estimated fair value of available for sale securities that are reflected as a component of stockholders’ equity.
|
|
|
|
|
|
|
|
|
|
|
|
|
|
|
|
|
|
|
|
|
|
|
|
|
|
|
|
|
|
Maturing |
|
|
|
|
|
|
|
||||||||||||||||
|
|
|
|
|
|
|
|
|
|
|
||||||||||||||||
|
|
|
Within |
|
After
One but |
|
After
Five but |
|
After |
|
||||||||||||||||
|
|
|
|
|
|
|
|
|
|
|
||||||||||||||||
|
|
|
Amount |
|
Yield (1) |
|
Amount |
|
Yield (1) |
|
Amount |
|
Yield (1) |
|
Amount |
|
Yield (1) |
|
||||||||
|
|
|
|
|
|
|
|
|
|
|
|
|
|
|
|
|
|
|
|
|
|
|
|
|
|
|
|
Securities held to maturity: |
|
|
|
|
|
|
|
|
|
|
|
|
|
|
|
|
|
|
|
|
|
|
|
|
|
|
Corporate securities |
|
$ |
— |
|
|
— |
% |
$ |
8,000 |
|
|
2.83 |
% |
$ |
14,000 |
|
|
4.56 |
% |
$ |
— |
|
|
— |
% |
|
|
|
|
|
|
|
|
|
|
|
|
|
|
|
|
|
|
|
|
|
|
|
|
|
|
|
|
Securities available for sale: |
|
|
|
|
|
|
|
|
|
|
|
|
|
|
|
|
|
|
|
|
|
|
|
|
|
|
Obligations of states and political subdivisions |
|
|
— |
|
|
— |
|
|
720 |
|
|
3.95 |
|
|
1,186 |
|
|
3.58 |
|
|
— |
|
|
— |
|
|
Mortgage-backed securities and collateralized mortgage obligations - residential (2) |
|
|
|
|
|
|
|
|
|
|
|
|
|
|
|
|
|
|
|
|
|
|
|
|
|
|
FHLMC |
|
|
18,186 |
|
|
4.00 |
|
|
78,128 |
|
|
4.60 |
|
|
14,434 |
|
|
4.90 |
|
|
— |
|
|
— |
|
|
FNMA |
|
|
26,256 |
|
|
0.43 |
|
|
80,838 |
|
|
3.25 |
|
|
6,523 |
|
|
3.30 |
|
|
— |
|
|
— |
|
|
GNMA |
|
|
4,576 |
|
|
2.72 |
|
|
72,954 |
|
|
2.72 |
|
|
11,942 |
|
|
3.28 |
|
|
— |
|
|
— |
|
|
Mortgage-backed securities and collateralized mortgage obligations - commercial (2) |
|
|
|
|
|
|
|
|
|
|
|
|
|
|
|
|
|
|
|
|
|
|
|
|
|
|
GNMA |
|
|
— |
|
|
— |
|
|
— |
|
|
— |
|
|
4,859 |
|
|
2.48 |
|
|
— |
|
|
— |
|
|
Government agency securities (3) |
|
|
13,845 |
|
|
2.48 |
|
|
13,909 |
|
|
2.17 |
|
|
4,805 |
|
|
2.25 |
|
|
7,997 |
|
|
4.00 |
|
|
|
|
|
|
|
|
|
|
|
|
|
|
|
|
|
|
|
|
|
|
|
|
|
|
|
|
|
Total securities available for sale |
|
|
62,863 |
|
|
2.08 |
|
|
246,549 |
|
|
3.46 |
|
|
43,749 |
|
|
3.62 |
|
|
7,997 |
|
|
4.00 |
|
|
|
|
|
|
|
|
|
|
|
|
|
|
|
|
|
|
|
|
|
|
|
|
|
|
|
|
|
Total securities |
|
$ |
62,863 |
|
|
2.08 |
% |
$ |
254,549 |
|
|
3.44 |
% |
$ |
57,749 |
|
|
3.85 |
% |
$ |
7,997 |
|
|
4.00 |
% |
|
|
|
|
|
|
|
|
|
|
|
|
|
|
|
|
|
|
|
|
|
|
|
|
|
|
|
(1) Fully taxable-equivalent basis using a tax rate of 34%.
(2) Assumes maturity dates pursuant to average lives as determined by constant prepayment rates.
(3) Assumes coupon yields for securities past their call dates and not bought at a discount; yields to call for securities not past their call dates and not bought at a discount; and yields to maturity for securities purchased at a discount.
15
Loan Portfolio
The following table categorizes the Company’s loan portfolio, excluding loans held for sale, for each period (in thousands):
|
|
|
|
|
|
|
|
|
|
|
|
|
|
|
|
|
|
|
At December 31, |
|
2010 |
|
2009 |
|
2008 |
|
2007 |
|
2006 |
|
|||||
|
|
|
|
|
|
|
|
|
|
|
|
|
|||||
|
Commercial and industrial - owner-occupied mortgage (1) |
|
$ |
191,913 |
|
$ |
195,557 |
|
$ |
— |
|
$ |
— |
|
$ |
— |
|
|
Commercial and industrial - general purpose |
|
|
339,447 |
|
|
348,546 |
|
|
398,182 |
|
|
322,575 |
|
|
297,256 |
|
|
Real estate - commercial mortgage (1) |
|
|
449,861 |
|
|
374,406 |
|
|
482,188 |
|
|
383,960 |
|
|
392,454 |
|
|
Real estate - residential mortgage |
|
|
83,696 |
|
|
95,668 |
|
|
104,280 |
|
|
102,468 |
|
|
105,476 |
|
|
Real estate - commercial construction (1) |
|
|
44,331 |
|
|
50,175 |
|
|
64,465 |
|
|
50,483 |
|
|
25,207 |
|
|
Real estate - residential construction |
|
|
14,910 |
|
|
25,740 |
|
|
56,004 |
|
|
95,002 |
|
|
80,513 |
|
|
Lease receivables |
|
|
— |
|
|
— |
|
|
— |
|
|
66,476 |
|
|
62,649 |
|
|
Loans to individuals |
|
|
4,770 |
|
|
4,667 |
|
|
5,620 |
|
|
11,724 |
|
|
11,315 |
|
|
Tax-exempt and other |
|
|
2,442 |
|
|
2,876 |
|
|
6,478 |
|
|
8,321 |
|
|
8,855 |
|
|
|
|
|
|
|
|
|
|
|
|
|
|
|
|
|
|
|
|
Loans - net of unearned income |
|
$ |
1,131,370 |
|
$ |
1,097,635 |
|
$ |
1,117,217 |
|
$ |
1,041,009 |
|
$ |
983,725 |
|
|
|
|
|
|
|
|
|
|
|
|
|
|
|
|
|
|
|
(1) Prior to 2009, owner-occupied mortgages where source of repayment is not from the property are included in real estate - commercial mortgage and real estate - commercial construction.
The following table presents the contractual maturities of selected loans and the sensitivities of those loans to changes in interest rates at December 31, 2010 (in thousands):
|
|
|
|
|
|
|
|
|
|
|
|
|
|
|
|
|
|
One Year |
|
One Through |
|
Over |
|
Total |
|
||||
|
|
|
|
|
|
|
|
|
|
|
|
|
|
|
|
Commercial and industrial - owner-occupied mortgage |
|
$ |
15,346 |
|
$ |
63,512 |
|
$ |
113,055 |
|
$ |
191,913 |
|
|
Commercial and industrial - general purpose |
|
|
211,136 |
|
|
103,511 |
|
|
24,800 |
|
|
339,447 |
|
|
Real estate - commercial construction |
|
|
22,734 |
|
|
21,597 |
|
|
— |
|
|
44,331 |
|
|
Real estate - residential construction |
|
|
12,930 |
|
|
1,980 |
|
|
— |
|
|
14,910 |
|
|
|
|
|
|
|
|
|
|
|
|
|
|
|
|
|
Total |
|
$ |
262,146 |
|
$ |
190,600 |
|
$ |
137,855 |
|
$ |
590,601 |
|
|
|
|
|
|
|
|
|
|
|
|
|
|
|
|
|
Loans maturing after one year with: |
|
|
|
|
|
|
|
|
|
|
|
|
|
|
Fixed interest rate |
|
|
|
|
$ |
159,164 |
|
$ |
51,519 |
|
$ |
210,683 |
|
|
Variable interest rate |
|
|
|
|
$ |
31,436 |
|
$ |
86,336 |
|
$ |
117,772 |
|
The following table presents the Company’s non-accrual, past due and restructured loans for each period (in thousands):
|
|
|
|
|
|
|
|
|
|
|
|
|
|
|
|
|
|
|
December 31, |
|
2010 |
|
2009 |
|
2008 |
|
2007 |
|
2006 |
|
|||||
|
|
|
|
|
|
|
|
|
|
|
|
|
|
|
|
|
|
|
Non-accrual loans |
|
$ |
14,856 |
|
$ |
6,733 |
|
$ |
16,072 |
|
$ |
5,792 |
|
$ |
2,177 |
|
|
Loans 90 days or more past due and still accruing interest |
|
$ |
1 |
|
$ |
3,800 |
|
$ |
3 |
|
$ |
28 |
|
$ |
13 |
|
|
Interest income on non-accrual and restructured loans which would have been recorded under original loan terms |
|
$ |
2,121 |
|
$ |
735 |
|
$ |
951 |
|
$ |
459 |
|
$ |
78 |
|
|
Interest income on non-accrual and restructured loans recorded during the period |
|
$ |
1,004 |
|
$ |
6 |
|
$ |
68 |
|
$ |
19 |
|
$ |
117 |
|
16
The Bank generally discontinues the accrual of interest on loans whenever there is reasonable doubt that interest and/or principal will be fully collected, or when either principal or interest is 90 days or more past due. At December 31, 2009, loans 90 days or more past due and still accruing interest were comprised of a non-criticized real estate credit that had matured and was due to close with an improved collateral position before December 31, 2009. Due to unforeseen circumstances, the closing did not occur until January 5, 2010. See “Management’s Discussion and Analysis of Financial Condition and Results of Operations, Summary of Loan Loss Experience and Allowance for Loan Losses.”
Summary of Loan Loss Experience
The determination of the balance of the allowance for loan losses is based upon a review and analysis of the Company’s loan portfolio. Management’s review includes monthly analyses of past due and non-accrual loans and detailed, periodic loan-by-loan analyses.
Based on current economic conditions, management has determined that the current level of the allowance for loan losses appears to be adequate at December 31, 2010 in relation to the probable inherent losses present in the portfolio. Management considers many factors in this analysis, among them credit risk grades assigned to commercial loans, delinquency trends, concentrations within segments of the loan portfolio, recent charge-off experience and local economic conditions.
The following table presents an analysis of the Company’s allowance for loan losses for each period (dollars in thousands):
|
|
|
|
|
|
|
|
|
|
|
|
|
|
|
|
|
|
|
|
|
2010 |
|
2009 |
|
2008 |
|
2007 |
|
2006 |
|
|||||
|
|
|
|
|
|
|
|
|
|
|
|
|
|||||
|
Balance, January 1 |
|
$ |
28,711 |
|
$ |
18,668 |
|
$ |
14,705 |
|
$ |
16,412 |
|
$ |
15,717 |
|
|
|
|
|
|
|
|
|
|
|
|
|
|
|
|
|
|
|
|
Adjustment due to sale of SB Equipment assets |
|
|
— |
|
|
— |
|
|
(2,002 |
) |
|
— |
|
|
— |
|
|
|
|
|
|
|
|
|
|
|
|
|
|
|
|
|
|
|
|
Charge-offs: |
|
|
|
|
|
|
|
|
|
|
|
|
|
|
|
|
|
Commercial and industrial - general purpose |
|
|
1,791 |
|
|
6,149 |
|
|
3,078 |
|
|
3,129 |
|
|
773 |
|
|
Real estate - commercial mortgage |
|
|
5,689 |
|
|
8,535 |
|
|
3,403 |
|
|
2,965 |
|
|
— |
|
|
Real estate - residential mortgage |
|
|
— |
|
|
1,277 |
|
|
202 |
|
|
— |
|
|
— |
|
|
Real estate - commercial construction |
|
|
900 |
|
|
1,555 |
|
|
— |
|
|
— |
|
|
— |
|
|
Real estate - residential construction |
|
|
989 |
|
|
12,515 |
|
|
3,786 |
|
|
— |
|
|
— |
|
|
Lease receivables |
|
|
— |
|
|
— |
|
|
1,093 |
|
|
404 |
|
|
1,382 |
|
|
Loans to individuals |
|
|
230 |
|
|
118 |
|
|
27 |
|
|
57 |
|
|
18 |
|
|
|
|
|
|
|
|
|
|
|
|
|
|
|
|
|
|
|
|
Total charge-offs |
|
|
9,599 |
|
|
30,149 |
|
|
11,589 |
|
|
6,555 |
|
|
2,173 |
|
|
|
|
|
|
|
|
|
|
|
|
|
|
|
|
|
|
|
|
Recoveries: |
|
|
|
|
|
|
|
|
|
|
|
|
|
|
|
|
|
Commercial and industrial - general purpose |
|
|
400 |
|
|
260 |
|
|
256 |
|
|
158 |
|
|
343 |
|
|
Real estate - commercial mortgage |
|
|
90 |
|
|
400 |
|
|
— |
|
|
— |
|
|
— |
|
|
Real estate - residential mortgage |
|
|
9 |
|
|
— |
|
|
— |
|
|
— |
|
|
12 |
|
|
Real estate - commercial construction |
|
|
560 |
|
|
— |
|
|
— |
|
|
— |
|
|
— |
|
|
Real estate - residential construction |
|
|
— |
|
|
3 |
|
|
— |
|
|
— |
|
|
— |
|
|
Lease receivables |
|
|
— |
|
|
— |
|
|
37 |
|
|
220 |
|
|
13 |
|
|
Loans to individuals |
|
|
7 |
|
|
29 |
|
|
35 |
|
|
6 |
|
|
10 |
|
|
|
|
|
|
|
|
|
|
|
|
|
|
|
|
|
|
|
|
Total recoveries |
|
|
1,066 |
|
|
692 |
|
|
328 |
|
|
384 |
|
|
378 |
|
|
|
|
|
|
|
|
|
|
|
|
|
|
|
|
|
|
|
|
Net charge-offs |
|
|
8,533 |
|
|
29,457 |
|
|
11,261 |
|
|
6,171 |
|
|
1,795 |
|
|
|
|
|
|
|
|
|
|
|
|
|
|
|
|
|
|
|
|
Provision charged to income |
|
|
12,900 |
|
|
39,500 |
|
|
17,226 |
|
|
4,464 |
|
|
2,490 |
|
|
|
|
|
|
|
|
|
|
|
|
|
|
|
|
|
|
|
|
Balance, December 31 |
|
$ |
33,078 |
|
$ |
28,711 |
|
$ |
18,668 |
|
$ |
14,705 |
|
$ |
16,412 |
|
|
|
|
|
|
|
|
|
|
|
|
|
|
|
|
|
|
|
|
|
|
|
|
|
|
|
|
|
|
|
|
|
|
|
|
|
|
Ratio of net charge-offs during the period to average loans outstanding during the period |
|
|
0.77 |
% |
|
2.64 |
% |
|
1.04 |
% |
|
0.61 |
% |
|
0.19 |
% |
The following table presents the allocation of the Company’s allowance for loan losses by loan class and the percentage that class represents of total loans at December 31 for each period (dollars in thousands):
17
|
|
|
|
|
|
|
|
|
|
|
|
|
|
|
|
|
|
|
|
|
|
|
|
|
|
|
|
|
|
|
|
|
|
|
|
2010 |
|
Percent of |
|
2009 |
|
Percent of |
|
2008 |
|
Percent of |
|
2007 |
|
Percent of |
|
2006 |
|
Percent of |
|
||||||||||
|
|
|
|
|
|
|
|
|
|
|
|
|
|
|
|
|
|
|
|
|
|
|
|
|
|
|
|
|
|
|
|
|
|
Commercial and industrial - owner-occupied mortgage (1) |
|
$ |
3,198 |
|
|
17.0 |
% |
$ |
1,622 |
|
|
17.8 |
% |
$ |
— |
|
|
— |
% |
$ |
— |
|
|
— |
% |
$ |
— |
|
|
— |
% |
|
Commercial and industrial - general purpose |
|
|
16,946 |
|
|
30.0 |
|
|
9,922 |
|
|
31.7 |
|
|
4,990 |
|
|
35.5 |
|
|
5,000 |
|
|
31.1 |
|
|
7,965 |
|
|
30.2 |
|
|
Real estate - commercial mortgage (1) (2) |
|
|
6,962 |
|
|
39.8 |
|
|
9,253 |
|
|
34.1 |
|
|
5,319 |
|
|
43.2 |
|
|
5,000 |
|
|
36.9 |
|
|
5,357 |
|
|
50.6 |
|
|
Real estate - residential mortgage (2) |
|
|
1,057 |
|
|
7.4 |
|
|
1,171 |
|
|
8.7 |
|
|
760 |
|
|
9.3 |
|
|
225 |
|
|
9.8 |
|
|
— |
|
|
— |
|
|
Real estate - commercial construction (1) (3) |
|
|
931 |
|
|
3.9 |
|
|
3,662 |
|
|
4.6 |
|
|
2,038 |
|
|
5.7 |
|
|
318 |
|
|
4.8 |
|
|
577 |
|
|
10.7 |
|
|
Real estate - residential construction (3) |
|
|
752 |
|
|
1.3 |
|
|
1,123 |
|
|
2.4 |
|
|
2,697 |
|
|
5.2 |
|
|
1,200 |
|
|
9.1 |
|
|
— |
|
|
— |
|
|
Lease receivables |
|
|
— |
|
|
— |
|
|
— |
|
|
— |
|
|
— |
|
|
— |
|
|
1,547 |
|
|
6.4 |
|
|
1,072 |
|
|
6.4 |
|
|
Loans to individuals |
|
|
181 |
|
|
0.4 |
|
|
136 |
|
|
0.4 |
|
|
71 |
|
|
0.5 |
|
|
134 |
|
|
1.1 |
|
|
73 |
|
|
1.2 |
|
|
Tax-exempt and other |
|
|
17 |
|
|
0.2 |
|
|
15 |
|
|
0.3 |
|
|
27 |
|
|
0.6 |
|
|
31 |
|
|
0.8 |
|
|
34 |
|
|
0.9 |
|
|
Unallocated |
|
|
3,034 |
|
|
— |
|
|
1,807 |
|
|
— |
|
|
2,766 |
|
|
— |
|
|
1,250 |
|
|
— |
|
|
1,334 |
|
|
— |
|
|
|
|
|
|
|
|
|
|
|
|
|
|
|
|
|
|
|
|
|
|
|
|
|
|
|
|
|
|
|
|
|
|
|
Total |
|
$ |
33,078 |
|
|
100.0 |
% |
$ |
28,711 |
|
|
100.0 |
% |
$ |
18,668 |
|
|
100.0 |
% |
$ |
14,705 |
|
|
100.0 |
% |
$ |
16,412 |
|
|
100.0 |
% |
|
|
|
|
|
|
|
|
|
|
|
|
|
|
|
|
|
|
|
|
|
|
|
|
|
|
|
|
|
|
|
|
|
|
|
|
|
(1) |
Prior to 2009, owner-occupied mortgages where source of repayment is not from the property are included in real estate - commercial mortgage and real estate - commercial construction. |
|
|
|
|
(2) |
Prior to 2007, no breakdown between commercial and residential mortgage was available. Thus, all such real estate - mortgage amounts are included in real estate - commercial mortgage. |
|
|
|
|
(3) |
Prior to 2007, no breakdown between commercial and residential construction was available. Thus, all such real estate - construction amounts are included in real estate - commercial construction. |
Deposits
The following table presents the average balance and the average rate paid on the Company’s deposits for each period (dollars in thousands):
|
|
|
|
|
|
|
|
|
|
|
|
|
|
|
|
|
|
|
|
|
|
|
|
2010 |
|
2009 |
|
2008 |
|
||||||||||||
|
|
|
|
|
|
|
|
|
||||||||||||
|
|
|
Average |
|
Average |
|
Average |
|
Average |
|
Average |
|
Average |
|
||||||
|
|
|
|
|
|
|
|
|
|
|
|
|
|
|
|
|
|
|
|
|
|
Non-interest bearing demand deposits |
|
$ |
362,146 |
|
|
— |
|
$ |
350,979 |
|
|
— |
|
$ |
320,830 |
|
|
— |
|
|
Interest-bearing transaction accounts |
|
|
223,302 |
|
|
0.37 |
% |
|
221,325 |
|
|
0.43 |
% |
|
195,119 |
|
|
1.14 |
% |
|
Money market deposit accounts |
|
|
117,910 |
|
|
0.63 |
|
|
111,730 |
|
|
0.87 |
|
|
130,012 |
|
|
1.75 |
|
|
Savings deposits |
|
|
282,841 |
|
|
0.73 |
|
|
267,040 |
|
|
1.01 |
|
|
235,484 |
|
|
1.45 |
|
|
Time certificates of deposit of $100,000 or more |
|
|
222,140 |
|
|
1.12 |
|
|
229,613 |
|
|
1.68 |
|
|
229,190 |
|
|
2.98 |
|
|
Other time deposits |
|
|
194,755 |
|
|
1.94 |
|
|
214,593 |
|
|
2.26 |
|
|
242,880 |
|
|
3.54 |
|
|
|
|
|
|
|
|
|
|
|
|
|
|
|
|
|
|
|
|
|
|
|
Total |
|
$ |
1,403,094 |
|
|
0.71 |
% |
$ |
1,395,280 |
|
|
0.96 |
% |
$ |
1,353,515 |
|
|
1.72 |
% |
|
|
|
|
|
|
|
|
|
|
|
|
|
|
|
|
|
|
|
|
|
The following table sets forth, by time remaining to maturity, the Company’s certificates of deposit of $100,000 or more at December 31, 2010 (in thousands):
18
|
|
|
|
|
|
|
3 months or less |
|
$ |
147,241 |
|
|
Over 3 months through 6 months |
|
|
14,254 |
|
|
Over 6 months through 12 months |
|
|
24,453 |
|
|
Over 12 months |
|
|
16,687 |
|
|
|
|
|
|
|
|
Total |
|
$ |
202,635 |
|
|
|
|
|
|
|
Short-Term Borrowings
The following information is provided on the Bank’s short-term borrowings for each period (dollars in thousands):
|
|
|
|
|
|
|
|
|
|
|
|
|
|
|
2010 |
|
2009 |
|
2008 |
|
|||
|
|
|
|
|
|
|
|
|
|||
|
Balance, December 31 - |
|
|
|
|
|
|
|
|
|
|
|
Securities sold under agreements to repurchase |
|
$ |
3,000 |
|
$ |
3,000 |
|
$ |
3,000 |
|
|
Federal funds purchased |
|
$ |
— |
|
$ |
— |
|
$ |
— |
|
|
Federal Home Loan Bank advances |
|
$ |
22,000 |
|
$ |
45,000 |
|
$ |
— |
|
|
|
|
|
|
|
|
|
|
|
|
|
|
Weighted-average interest rate on balance, December 31 - |
|
|
|
|
|
|
|
|
|
|
|
Securities sold under agreements to repurchase |
|
|
1.88 |
% |
|
1.88 |
% |
|
1.88 |
% |
|
Federal funds purchased |
|
|
— |
|
|
— |
|
|
— |
|
|
Federal Home Loan Bank advances |
|
|
0.40 |
% |
|
0.32 |
% |
|
— |
|
|
|
|
|
|
|
|
|
|
|
|
|
|
Maximum outstanding at any month end - |
|
|
|
|
|
|
|
|
|
|
|
Securities sold under agreements to repurchase |
|
$ |
3,000 |
|
$ |
3,000 |
|
$ |
3,000 |
|
|
Federal funds purchased |
|
$ |
— |
|
$ |
15,000 |
|
$ |
35,000 |
|
|
Federal Home Loan Bank advances |
|
$ |
40,000 |
|
$ |
60,000 |
|
$ |
203,000 |
|
|
|
|
|
|
|
|
|
|
|
|
|
|
Average daily amount outstanding - |
|
|
|
|
|
|
|
|
|
|
|
Securities sold under agreements to repurchase |
|
$ |
3,000 |
|
$ |
3,863 |
|
$ |
2,008 |
|
|
Federal funds purchased |
|
$ |
74 |
|
$ |
225 |
|
$ |
6,129 |
|
|
Federal Home Loan Bank advances |
|
$ |
7,386 |
|
$ |
12,805 |
|
$ |
110,915 |
|
|
|
|
|
|
|
|
|
|
|
|
|
|
Weighted-average interest rate on average daily amount outstanding - |
|
|
|
|
|
|
|
|
|
|
|
Securities sold under agreements to repurchase |
|
|
1.88 |
% |
|
1.55 |
% |
|
1.88 |
% |
|
Federal funds purchased |
|
|
0.60 |
% |
|
0.44 |
% |
|
2.72 |
% |
|
Federal Home Loan Bank advances |
|
|
0.45 |
% |
|
0.43 |
% |
|
2.52 |
% |
|
|
|
|
RISK FACTORS |
The following is a summary of risk factors relevant to our operations which should be carefully reviewed. These risk factors do not necessarily appear in the order of importance.
Banking laws and regulations could limit our access to funds from the Bank, one of our primary sources of liquidity.
As a bank holding company, one of our principal sources of funds is dividends from our subsidiaries. These funds are used to service our debt as well as to pay expenses and dividends on our common and preferred stock. Our non-consolidated interest expense on our debt obligations was $729 thousand and $1.7 million for the years ended December 31, 2010 and 2009, respectively. Our non-consolidated operating expenses were $5 thousand and $915 thousand for the years ended December 31, 2010 and 2009, respectively. Our cash dividends paid on common stock were $3.3 million and $2.9 million for the years ended December 31, 2010 and 2009, respectively. Our
19
cash dividends paid on preferred stock were $1.8 million for each of the years ended December 31, 2010 and 2009. State banking regulations limit, absent regulatory approval, the Bank’s dividends to us to the lesser of the Bank’s undivided profits and the Bank’s retained net income for the current year plus its retained net income for the preceding two years (less any required transfers to capital surplus) up to the date of any dividend declaration in the current calendar year. As of December 31, 2010, no dividends were available to the Company from the Bank according to these limitations without seeking regulatory approval.
Federal bank regulatory agencies have the authority to prohibit the Bank from engaging in unsafe or unsound practices in conducting its business. The payment of dividends or other transfers of funds to us, depending on the financial condition of the Bank, could be deemed an unsafe or unsound practice.
Dividend payments from the Bank would also be prohibited under the “prompt corrective action” regulations of the federal bank regulators if the Bank is, or after payment of such dividends would be, undercapitalized under such regulations. In addition, the Bank is subject to restrictions under federal law that limit its ability to transfer funds or other items of value to us and our nonbanking subsidiaries, including affiliates, whether in the form of loans and other extensions of credit, investments and asset purchases, or other transactions involving the transfer of value. Unless an exemption applies, these transactions by the Bank with us are limited to 10% of the Bank’s capital and surplus and, with respect to all such transactions with affiliates in the aggregate, to 20% of the Bank’s capital and surplus. As of December 31, 2010, a maximum of approximately $37 million was available to us from the Bank according to these limitations. Moreover, loans and extensions of credit to affiliates generally are required to be secured by specified amounts of collateral. A bank’s transactions with its non-bank affiliates also are required generally to be on arm’s-length terms. We do not have any borrowings from the Bank and do not anticipate borrowing from the Bank in the future.
Accordingly, we can provide no assurance that we will receive dividends or other distributions from the Bank and our other subsidiaries.
Our other primary source of funding is our DRP, which allows existing stockholders to reinvest cash dividends in our common stock and/or to purchase additional shares through optional cash investments on a quarterly basis. Participants in the DRP have the option of making additional cash payments from $100 to $10,000 per quarter. The same amount need not be invested each time and there is no obligation to make any cash payments. Shares are purchased at up to a 15% discount from the current market price under both the dividend reinvestment option and with optional cash payments. No assurance can be given that we will continue the DRP or that stockholders will make purchases in the future.
Commercial real estate and commercial business loans expose us to increased lending risks.
CRE and C&I loans comprise the majority of our loan portfolio. At December 31, 2010, our portfolio of CRE loans totaled approximately $494 million and our C&I loans amounted to approximately $531 million of total loans of $1.1 billion. At December 31, 2010 C&I loans on our watch list increased $19 million from the December 31, 2009 amount, while CRE loans on our watch list decreased $5 million from the December 31, 2009 amount. Commercial loans generally expose a lender to greater risk of non-payment and loss than non-commercial loans because repayment of commercial loans often depends on the successful operation and cash flow of the borrowers. Such loans also typically involve larger loan balances to single borrowers or groups of related borrowers compared to non-commercial loans. Consequently, an adverse development with respect to a CRE loan or commercial business loan can expose us to a significantly greater risk of loss compared to an adverse development with respect to a non-commercial loan. CRE loans may present special lending risks and may expose lenders to unanticipated earnings and capital volatility due to adverse changes in the general commercial real estate market.
Our results of operations are affected by economic conditions in the New York metropolitan area and nationally.
As a result of our geographic concentration in the New York metropolitan area, our results of operations largely depend upon economic conditions in this region.
We are operating in a challenging and uncertain economic environment, globally, nationally and locally. Financial institutions continue to be affected by low levels of economic activity and high unemployment rates. Decreases in real estate values in the past several years have negatively affected the value of property used as collateral for our loans. Adverse changes in the economy have affected and may continue to affect the ability of our borrowers to make timely repayments of their loans, which would have a negative impact on our earnings. If poor economic conditions result in decreased demand for real estate loans, our earnings capacity may decline because our investment alternatives may earn less income for us than real estate loans.
20
The Company’s non-performing loans totaled $15 million at December 31, 2010. Net loan charge-offs recorded in 2010 were $8.5 million and our provision for loan losses for 2010 was $12.9 million. The sale of lower quality loans in the fourth quarter of 2009 helped reduce the 2010 provision significantly. The impact of the recent national and local economic recession along with any further economic deterioration could drive losses beyond that which is provided for in our allowance for loan losses and result in additional consequences, such as loan delinquencies, increased problem assets and foreclosures, declining demand for our products and services, decreased deposits and declining collateral value for our loans.
Changes in economic conditions or interest rates may negatively affect our earnings, capital and liquidity.
The results of operations for financial institutions, including the Bank, may be materially adversely affected by changes in prevailing local and national economic conditions, including declines in real estate market values, rapid increases or decreases in interest rates and changes in the monetary and fiscal policies of the federal government. Our profitability is heavily influenced by the spread between the interest rates earned on investments and loans and the interest rates paid on deposits and other interest-bearing liabilities. Like most banking institutions, our net interest spread and margin will be affected by market interest rates and our ability to respond to changes in such rates. At any given time, our assets and liabilities may be affected differently by a change in interest rates.
Funding costs may rise due to competitive pricing pressures and volatility in the credit and money markets. Rates are at historic lows at this time and it would appear from their comments that Federal Reserve policy makers are prepared to keep the fed funds rate low until well past such time as the economy shows evidence of sustainable recovery. In the near term the risks from inflationary pressure due to an increase in economic activity appear limited. Consequently, while inflation remains a matter of concern, those risks appear to be more visible in the intermediate three to five year time frame. As the Federal Reserve begins to remove many of the extraordinary measures put in place during the last few years, credit spreads may begin to widen, which may affect the cost that the Bank must bear to borrow funds.
A large percentage of our deposits is attributable to a relatively small number of customers.
Our ten largest depositor relationships accounted for approximately 22% of our deposits at December 31, 2010. Our largest depositor relationship accounted for approximately 8% of our deposits at December 31, 2010. In addition, approximately 4% of our deposits at December 31, 2010, which includes deposits gathered through CDARS, are considered for regulatory purposes to be brokered deposits. Brokered deposits are at a greater risk of being withdrawn and placed on deposit at another institution offering a higher interest rate, thus posing liquidity risk for institutions that gather brokered deposits in significant amounts. Federal banking law and regulation places restrictions on depository institutions regarding brokered deposits.
Due to the short-term nature of the deposit balances maintained by our large depositors, the deposit balances they maintain with us may fluctuate. Of our ten largest deposit relationships, four are local municipalities and the balances of their deposits tend to fluctuate on a seasonal basis throughout the year. The loss of one or more of our ten largest customers, or a significant decline in the deposit balances due to ordinary course fluctuations related to these customers’ businesses, in all likelihood would adversely affect our liquidity and require us to raise deposit rates to attract new deposits, purchase federal funds or borrow funds on a short term basis to replace such deposits. Depending on the interest rate environment and competitive factors, low cost deposits may need to be replaced with higher cost funding, resulting in a decrease in net interest income and net income.
Strong competition within our market areas could hurt our profits and slow growth.
The New York metropolitan area has a high density of financial institutions, a number of which are significantly larger and have greater financial resources than we have, and as such, may have higher lending limits and may offer other services not offered by us. Additionally over the past several years, various large out-of-state financial institutions have entered the New York metropolitan area market both on a de novo basis and through acquisitions of smaller in-state financial institutions, including those located in our primary market area. All are our competitors to varying degrees.
We face intense competition in making loans and attracting deposits. Our competition for loans comes principally from commercial banks, savings banks, insurance companies, credit unions and money market funds. Also, as a result of the deregulation of the financial industry, we also face competition from other providers of financial services such as corporate and government securities funds as well as from other financial intermediaries such as brokerage firms and insurance companies.
We operate in a highly regulated industry, which limits the manner and scope of our business activities.
21
We are subject to extensive supervision, regulation and examination by the FRB, the FDIC and the Banking Department. As a result, we are limited in the manner in which we conduct our business, undertake new investments and activities and obtain financing. This regulatory structure is designed primarily for the protection of the deposit insurance funds and our depositors, and not to benefit our stockholders. This regulatory structure also gives the regulatory authorities extensive discretion in connection with their supervisory and enforcement activities and examination policies, including policies with respect to capital levels, the timing and amount of dividend payments, the classification of assets and the establishment of adequate loan loss reserves for regulatory purposes. In addition, we must comply with significant anti-money laundering and anti-terrorism laws. Government agencies have substantial discretion to impose significant monetary penalties on institutions which fail to comply with these laws.
We expect to face increased regulation and supervision of our industry as a result of the financial crisis, and there will be additional requirements and conditions imposed on us by the Reform Act and to the extent that we participate in any of the programs established or to be established by the Treasury under the EESA or by the federal bank regulatory agencies. Such additional regulation and supervision may increase our costs and limit our ability to pursue business opportunities.
Changes in banking laws could have a material adverse effect on us.
We are extensively regulated under federal and state banking laws and regulations that are intended primarily for the protection of depositors, federal deposit insurance funds and the banking system as a whole. In addition, we are subject to changes in federal and state tax laws as well as changes in banking and credit regulations, accounting principles and governmental economic and monetary policies. We cannot predict whether any of these changes may materially adversely affect us. Federal and state banking regulators also possess broad powers to take enforcement actions as they deem appropriate. These enforcement actions may result in higher capital requirements, higher insurance premiums, limitations on our activities, the timing and amount of dividend payments, the classification of assets and the establishment of adequate loan loss reserves for regulatory purposes, that could have a material adverse effect on our business and profitability. In addition, we must comply with significant anti-money laundering and anti-terrorism laws. Government agencies have substantial discretion to impose significant monetary penalties on institutions which fail to comply with these laws.
The recent adoption of regulatory reform legislation may have a material effect on our operations and capital requirements.
There are many provisions of the Reform Act which are to be implemented through regulations to be adopted by the federal bank regulatory agencies within specified time frames following the effective date of the Reform Act, which creates a risk of uncertainty as to the effect that such provisions will ultimately have. We believe the following provisions of the Reform Act will have an impact on us, though it is not possible for us to determine at this time whether and to what extent the Reform Act will have a material effect on our business, financial condition or results of operations:
|
|
|
|
|
|
• |
Certain Changes in Regulatory Regime. The Reform Act provides for the creation of the CFBP, which will have the authority to implement and enforce a variety of existing consumer protection statutes and to issue new regulations. |
|
|
|
|
|
|
• |
Consolidated Holding Company Capital Requirements. The Reform Act requires the federal bank regulatory agencies to establish consolidated risk-based and leverage capital requirements for insured depository institutions, depository institution holding companies and systemically important nonbank financial companies. These requirements must be no less than those to which insured depository institutions are currently subject. Thus, it is likely that we will become subject to capital requirements that are higher than those to which we are currently subject, although it is unknown at this time what these requirements will be. The new requirements will also eliminate the use of trust preferred securities issued after May 19, 2010 as a component of Tier 1 capital for depository institution holding companies of our size, although because we had less than $15 billion of consolidated assets as of December 31, 2009, we will continue to be permitted to include any trust preferred securities issued before May 19, 2010 as an element of Tier 1 capital. |
|
|
|
|
|
|
• |
Deposit Insurance Assessments. The Reform Act increases the minimum designated reserve ratio for the Deposit Insurance Fund of the FDIC from 1.15% to 1.35% of insured deposits, which much be reached by September 30, 2020, and provides that in setting the assessments necessary to meet the new requirement, the FDIC shall offset the effect of this provision on insured depository institutions with total consolidated assets of less than $10 billion, such as us, so that more of the cost of raising the reserve ratio will be borne by the institutions with more than $10 billion in assets. It is unknown at this time what portion of the cost of raising the reserve ratio will be borne by institutions with less than $10 billion in assets such as us. Further, until the FDIC issues new |
22
|
|
|
|
|
|
|
regulations implementing these provisions we will not know the extent we will be affected by these provisions though it appears likely that our deposit insurance premiums will increase to some extent. In addition, deposit insurance assessments will now be based on our average consolidated total assets minus our average tangible equity, rather than on our deposit base. |
The Reform Act also includes provisions, subject to further rule making by the federal bank regulatory agencies that may affect our future operations, including provisions that create minimum standards for the origination of mortgages, restrict proprietary trading by banking entities and restrict the sponsorship of and investment in hedge funds and private equity funds by banking entities. We will not be able to determine the impact of these provisions until final rules are promulgated to implement these provisions and other regulatory guidance is provided interpreting these provisions.
The FDIC restoration plan and related rule making may have a further material impact on our results operations.
In light of the failures of a significant number of banks and thrifts over the past several years, which has resulted in substantial losses to the DIF, in July 2010, the Reform Act increased the minimum designated reserve ratio for the DIF from 1.15% to 1.35% of insured deposits, which must be reached by September 30, 2020, and provides that in setting the assessments necessary to meet the new requirement, the FDIC shall offset the effect of this provision on insured depository institutions with total consolidated assets of less than $10 billion, so that more of the cost of raising the reserve ratio will be borne by the institutions with more than $10 billion in assets. In October 2010, the FDIC adopted a new restoration plan to ensure that the DIF reserve ratio reaches 1.35% by September 30, 2020, as required by the Reform Act. The FDIC intends to pursue further rule making in 2011 regarding the method that will be used to reach the reserve ratio of 1.35% so that more of the cost of raising the reserve ratio to 1.35% will be borne by institutions with more than $10 billion in assets.
In addition, on February 7, 2011, the FDIC adopted a final rule that redefines the assessment base for deposit insurance assessments as average consolidated total assets minus average tangible equity, rather than on deposit bases, as required by the Reform Act, and revises the risk-based assessment system for all large insured depository institutions as described in greater detail under “Supervision and Regulation.” The adoption of this final rule could result in even higher FDIC deposit insurance assessments effective April 1, 2011, which could further increase non-interest expense and have a material impact on our results of operations.
As a participant in the Treasury’s Capital Purchase Program, we are subject to several restrictions including restrictions on our ability to declare or pay dividends and repurchase our shares as well as restrictions on our executive compensation.
As a participant in the CPP, our ability to declare or pay dividends on any of our shares is limited. Specifically, we are not able to declare dividend payments on common, junior preferred or pari passu preferred shares if we are in arrears on the dividends on the senior preferred shares issued to the Treasury. Further, we are not permitted to increase dividends on our common stock to a level that is greater than the amount of the last quarterly cash dividend declared prior to October 14, 2008, without the Treasury’s approval until December 5, 2011 unless the senior preferred stock issued to the Treasury has been redeemed or transferred. The Company’s last quarterly cash dividend declared prior to October 14, 2008, was the $0.10 per common share declared on July 29, 2008. In addition, our ability to repurchase our shares is restricted. Treasury consent generally is required for us to make any stock repurchase until the third anniversary of the investment by the Treasury unless the senior preferred issued to the Treasury has been redeemed or transferred. Further, common, junior preferred or pari passu preferred shares may not be repurchased if we are in arrears on the senior preferred dividends to the Treasury.
As a participant in the program, we adopted the Treasury’s standards for executive compensation and corporate governance for the period during which the Treasury holds equity issued under this program. For this purpose, a warrant to purchase common stock is not considered equity. These standards would generally apply to our CEO, Chief Financial Officer and the three next most highly compensated officers. The standards include (1) ensuring that incentive compensation for senior executives does not encourage unnecessary and excessive risks that threaten the value of the financial institution; (2) required clawback of any bonus or incentive compensation paid to a senior executive based on statements of earnings, gains or other criteria that are later proven to be materially inaccurate; (3) prohibition on making golden parachute payments to senior executives; and (4) agreement not to deduct for tax purposes executive compensation in excess of $500,000 for each senior executive. In particular, the change to the deductibility limit on executive compensation would likely increase the overall cost of our compensation programs in future periods. In conjunction with the purchase of our senior preferred shares, the Treasury received a warrant to purchase our common stock with an aggregate market value equal to 15% of the senior preferred investment, or $5,526,300. The warrant was immediately exercisable at a strike price of $11.87 per share and has a term of 10 years.
The loss of key personnel could impair the Bank’s future success.
23
The Bank’s future success depends in part on the continued service of its executive officers, other key members of management and its staff, as well as its ability to continue to attract, motivate and retain additional highly qualified employees. The loss of services of key personnel could have an adverse effect on the Bank’s business because of their skills, knowledge of the Company’s market, years of industry experience and the difficulty of promptly finding qualified replacement personnel. The Company currently has an employment agreement in place with its CEO. Change in control agreements are in place for selected key officers. The American Recovery and Reinvestment Act of 2009 (“ARRA”) imposed strict new limits on executive compensation for all CPP participants, including a prohibition on the payment or accrual of any bonus, retention award or incentive compensation to the Company’s five most highly compensated employees. These prohibitions may negatively impact the Company’s ability to retain existing key staff members and/or to attract additional qualified personnel to join the Company in key positions.
If our investment in the Federal Home Loan Bank of New York is classified as other-than-temporarily impaired (“OTTI”) or as permanently impaired, our earnings and stockholders’ equity could decrease.
We own common stock of the FHLB-NY to qualify for membership in the Federal Home Loan Bank System and to be eligible to borrow funds under the FHLB-NY’s advance program. The aggregate cost and fair value of our FHLB-NY common stock as of December 31, 2010 was $3 million based on its par value. This amount fluctuates as a function of our FHLB-NY borrowings. There is no public market for our FHLB-NY common stock.
Certain member banks of the Federal Home Loan Bank System, including the FHLB-NY, may be subject to accounting rules and asset quality risks that could result in materially lower regulatory capital levels. In an extreme situation, it is possible that the capitalization of a Federal Home Loan Bank, including the FHLB-NY, could be substantially diminished or reduced to zero. Consequently, we believe that there is a risk that our investment in FHLB-NY common stock could be deemed OTTI at some time in the future, and if this occurs, it would cause our earnings and stockholders’ equity to decrease by the after-tax amount of an impairment charge.
Alternatives to deposits as a funding source may become more expensive.
The Company’s primary sources of funds are cash provided by deposits, proceeds from maturities and sales of securities available for sale and cash provided by operating activities. If deposits become less attractive to customers due to customer preference, competition, or rates, we may have to rely on alternative sources of funding such as Federal Home Loan Bank (“FHLB”) advances, which we have used from time to time. However, there is no assurance that such alternative funding sources will be available or, if available, at rates that allow us to maintain a reasonable net interest margin.
We continually encounter technological change, and may have fewer resources than our competitors to continue to invest in technological improvements.
The banking industry continues to undergo rapid technological change with frequent introductions of new technology-driven products and services. In addition to better serving customers, the effective use of technology increases efficiency and enables financial institutions to reduce costs. Our future success will depend, in part, on our ability to address the needs of our customers by using technology to provide products and services that will satisfy customer demands for convenience as well as create additional efficiencies in our operations. Many competitors have substantially greater resources to invest in technological improvements. There can be no assurance that we will be able to effectively implement new technology-driven products and services or be successful in marketing such products and services to our customers.
If the actual amount of future taxable income is less than what we are currently projecting, it may be necessary to record a valuation allowance for our deferred tax asset in a future period.
On a quarterly basis, management determines whether a valuation allowance is necessary for our deferred tax asset. In performing this analysis, management considers all evidence currently available, both positive and negative, in determining whether, based on the weight of that evidence, the deferred tax asset will be realized. A valuation allowance is established when it is more likely than not that a recorded tax benefit is not expected to be realized. The expense to create the tax valuation allowance is recorded as additional income tax expense in the period the tax valuation allowance is established. In arriving at the conclusion that a valuation allowance was not necessary at December 31, 2010 management considered the Company’s three year cumulative earnings history for 2008 through 2010 on both an unadjusted basis and after adjustment for unusual items of income or expense that are not expected to recur. Management also considered projections of future levels of taxable income. The valuation allowance estimate is highly dependent on projections of future levels of taxable income. Should the
24
actual amount of taxable income be less than what has been projected, it may be necessary to record a valuation allowance in a future period.
The Company’s future growth and liquidity needs may require the Company to raise additional capital in the future, but that capital may not be available when it is needed or may only be available at an excessive cost.
The Company is required by regulatory authorities to maintain adequate levels of capital to support its operations. The Company anticipates that current capital levels will satisfy regulatory requirements for the foreseeable future. However, we cannot assure you that regulatory reform will not result in higher capital requirements across the banking industry.
On December 5, 2008, the Company issued $36.8 million of the Company’s Fixed Rate Cumulative Perpetual Preferred Stock, Series A, par value $0.01 per share and liquidation preference $1,000 per share (the “Series A Preferred Stock”) and a warrant (“Warrant”) to purchase 465,569 shares of the Company’s common stock to the Treasury. The Company may at some point choose to raise additional capital to support its continued growth or to redeem the preferred stock issued under the Treasury’s CPP. In addition, there may be increasing market, regulatory or political pressure on the Company to raise capital to redeem the preferred stock issued under the CPP.
The Company’s ability to raise additional capital will depend, in part, on conditions in the capital markets at that time, which are outside of the Company’s control. Accordingly, the Company may be unable to raise additional capital, if and when needed, on terms acceptable to the Company, or at all. If the Company cannot raise additional capital when needed, its ability to further expand operations through internal growth and acquisitions could be materially impacted. In addition, if the Company is unable to raise additional capital to redeem the Series A Preferred Stock, the Company will continue to be subject to certain restrictions described in the risk factor “As a participant in the Treasury’s Capital Purchase Program, we are subject to several restrictions including restrictions on our ability to declare or pay dividends and repurchase our shares as well as restrictions on our executive compensation.”
In addition, any future issuances of equity securities could dilute the earnings per share of the Company, the interests of existing shareholders and cause a decline in the Company’s stock price.
|
|
|
|
UNRESOLVED STAFF COMMENTS |
None.
25
|
|
|
|
PROPERTIES |
The following table sets forth certain information relating to properties owned or used in the Company’s banking activities at December 31, 2010:
|
|
|
|
|
|
|
|
|
|
Location |
|
Owned or Leased |
|
Lease Expiration Date |
|
Renewal Terms |
|
|
|
|
|
|
|
|
|
|
|
Main
Office: |
|
Leased |
|
3/31/2012 |
|
None |
|
|
|
|
|
|
|
|
|
|
|
Nassau
County Branch Offices: |
|
Building owned, land leased |
|
3/27/2019 |
|
None |
|
|
|
|
|
|
|
|
|
|
|
222 Old Country Road |
|
Leased |
|
11/30/2020 |
|
Two five-year renewal options |
|
|
|
|
|
|
|
|
|
|
|
339 Nassau Boulevard |
|
Owned |
|
N/A |
|
N/A |
|
|
|
|
|
|
|
|
|
|
|
501 North Broadway |
|
Leased |
|
10/31/2023 |
|
One twelve-year renewal option |
|
|
|
|
|
|
|
|
|
|
|
135 South Street |
|
Owned |
|
N/A |
|
N/A |
|
|
|
|
|
|
|
|
|
|
|
2 Lincoln Avenue |
|
Leased |
|
5/31/2012 |
|
None |
|
|
|
|
|
|
|
|
|
|
|
960 Port Washington
Boulevard |
|
Leased |
|
4/24/2012 |
|
Four five-year renewal options |
|
|
|
|
|
|
|
|
|
|
|
1055 Old Country Road |
|
Leased |
|
6/30/2015 |
|
None |
|
|
|
|
|
|
|
|
|
|
|
55 Maple Avenue |
|
Leased |
|
6/30/2011 |
|
Month-to-month renewal options |
|
|
|
|
|
|
|
|
|
|
|
Suffolk
County Branch Offices: |
|
Leased |
|
10/31/2012 |
|
One five-year renewal option |
|
|
|
|
|
|
|
|
|
|
|
740 Veterans Memorial
Highway |
|
Leased |
|
6/30/2015 |
|
One ten-year renewal option |
|
|
|
|
|
|
|
|
|
|
|
580 East Jericho Turnpike |
|
Leased |
|
12/31/2018 |
|
None |
|
|
|
|
|
|
|
|
|
|
|
4250 Veterans Memorial
Highway |
|
Leased |
|
12/31/2018 |
|
Two five-year renewal options |
|
|
|
|
|
|
|
|
|
|
|
234 Route 25A |
|
Leased |
|
5/31/2015 |
|
None |
|
|
|
|
|
|
|
|
|
|
|
Queens
County Branch Offices: |
|
Leased |
|
8/31/2011 |
|
One five-year renewal option |
|
|
|
|
|
|
|
|
|
|
|
75-20 Astoria Boulevard |
|
Leased |
|
5/31/2016 |
|
None |
|
|
|
|
|
|
|
|
|
|
|
21-31 46th Avenue |
|
Leased |
|
8/31/2011 |
|
None |
|
|
|
|
|
|
|
|
|
|
|
New York
County Branch Office: |
|
Leased |
|
12/31/2017 |
|
None |
|
|
|
|
|
|
|
|
|
|
|
|
|
|
(1) |
As a result of safety concerns that arose during structural repairs to the building’s parking garage located below the branch office during November 2010, the Village of Rockville Centre issued an order to evacuate the premises. |
|
|
|
|
(2) |
Temporary branch office location. |
26
The fixtures and equipment contained in these operating facilities are owned or leased by the Bank. The Company considers that all of its premises, fixtures and equipment are adequate for the conduct of its business.
|
|
|
|
LEGAL PROCEEDINGS |
The Company and the Bank are subject to legal proceedings and claims that arise in the ordinary course of business. In the opinion of management, the amount of ultimate liability, if any, with respect to such matters will not materially affect future operations and will not have a material impact on the Company’s financial statements.
|
|
|
|
REMOVED AND RESERVED |
|
|
|
|
ITEM 5. |
MARKET FOR REGISTRANT’S COMMON EQUITY, RELATED STOCKHOLDER MATTERS AND ISSUER PURCHASES OF EQUITY SECURITIES |
At December 31, 2010, the approximate number of common equity stockholders was as follows:
Title
of Class: Common Stock
Number of Record Holders: 1,383
The Company’s common stock trades on the NASDAQ Global Market under the symbol STBC. The approximate high and low closing prices for the Company’s common stock for the years ended December 31, 2010 and 2009, were as follows:
|
|
|
|
|
|
|
|
|
|
|
|
|
|
|
|
|
|
2010 |
|
2009 |
|
||||||||
|
|
|
|
|
|
|
||||||||
|
|
|
High Close |
|
Low Close |
|
High Close |
|
Low Close |
|
||||
|
|
|
|
|
|
|
|
|
|
|
|
|
|
|
|
1st Quarter |
|
$ |
8.30 |
|
$ |
6.95 |
|
$ |
10.47 |
|
$ |
4.10 |
|
|
2nd Quarter |
|
$ |
10.40 |
|
$ |
7.80 |
|
$ |
8.80 |
|
$ |
6.86 |
|
|
3rd Quarter |
|
$ |
9.98 |
|
$ |
8.17 |
|
$ |
9.20 |
|
$ |
7.73 |
|
|
4th Quarter |
|
$ |
9.60 |
|
$ |
8.95 |
|
$ |
8.46 |
|
$ |
6.48 |
|
The Company’s primary funding sources are dividends from the Bank and proceeds from the DRP. Both the Company and the Bank are subject to certain restrictions on the payment of dividends. Please see “Management’s Discussion and Analysis of Financial Condition and Results of Operations, Capital Resources.” The Company’s Board of Directors declared a cash dividend of $0.05 per share at its January 25, 2011 meeting. The following schedule summarizes the Company’s dividends paid for the years ended December 31, 2010 and 2009:
|
|
|
|
|
|
|
|
|
|
Record Date |
|
|
Dividend Payment Date |
|
Cash Dividends Paid |
|
|
|
|
|
|
|
|
|
|
|
|
November 16, 2010 |
|
|
December 16, 2010 |
|
$ |
0.05 |
|
|
August 20, 2010 |
|
|
September 16, 2010 |
|
$ |
0.05 |
|
|
May 21, 2010 |
|
|
June 16, 2010 |
|
$ |
0.05 |
|
|
February 17, 2010 |
|
|
March 17, 2010 |
|
$ |
0.05 |
|
|
|
|
|
|
|
|
|
|
|
November 20, 2009 |
|
|
December 16, 2009 |
|
$ |
0.05 |
|
|
August 21, 2009 |
|
|
September 16, 2009 |
|
$ |
0.05 |
|
|
May 22, 2009 |
|
|
June 17, 2009 |
|
$ |
0.05 |
|
|
February 23, 2009 |
|
|
March 17, 2009 |
|
$ |
0.05 |
|
27
For information about the Company’s equity compensation plans, please see “Part III, Item 12, Security Ownership of Certain Beneficial Owners and Management and Related Stockholder Matters.”
The Company did not repurchase any of its common stock during 2010 under the existing stock repurchase plan. Under the Board of Directors’ current stock repurchase authorization, management may repurchase up to 512,348 additional shares if market conditions warrant. This action will only occur if management believes that the purchase will be at prices that are accretive to earnings per share and is the most efficient use of Company capital. The Company does not presently anticipate repurchasing any of its shares in the immediate future.
As the Company issued preferred stock and a common stock warrant to the Treasury under the CPP, the Treasury’s consent is required for any increase in common dividends per share that is greater than the amount of the last quarterly cash dividend declared prior to October 14, 2008 and any repurchases of common stock until the earlier of a redemption of the Series A Preferred Stock or December 5, 2011. The Company’s last quarterly cash dividend declared prior to October 14, 2008, was the $0.10 per common share declared on July 29, 2008.
On November 25, 2009 we entered into an Exchange Agreement (the “Exchange Agreement”) with the investors named therein to exchange our unsecured 8.25% Subordinated Notes due June 15, 2013 with an outstanding principal balance of $10 million plus accrued interest for an aggregate of 1,656,600 shares of our common stock. For purposes of the exchange, each share of our common stock was valued at $6.50 per share. The issuance of the common stock was not registered under the Securities Act but was made in reliance upon the exemption from registration available under Section 3(a)(9) of the Securities Act. Section 3(a)(9) exempts any security exchanged by the issuer with its existing security holders from registration under the Securities Act, provided no commission or other remuneration has been paid or given for soliciting the exchange, which is the case in connection with the Exchange Agreement.
The following Performance Graph compares the yearly percentage change in the Company’s cumulative total stockholder return on its common stock with the cumulative total return of the NASDAQ Market Index and the cumulative total return of Northeast NASDAQ Banks.
COMPARE 5-YEAR CUMULATIVE TOTAL RETURN
AMONG STATE BANCORP, INC.,
NASDAQ MARKET INDEX AND NORTHEAST NASDAQ BANKS
(assumes $100 invested on Dec. 31, 2005, dividends reinvested
and fiscal year ending Dec. 31, 2010)
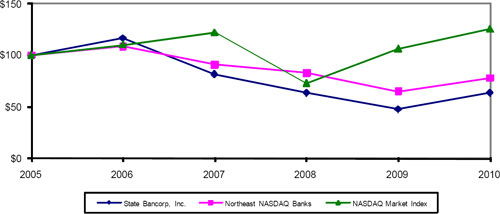
|
|
|
|
|
|
|
|
|
|
|
|
|
|
|
|
|
|
|
|
|
|
|
|
Investment Value at December 31, |
|
||||||||||||||||
|
|
|
|
|
||||||||||||||||
|
|
|
2005 |
|
2006 |
|
2007 |
|
2008 |
|
2009 |
|
2010 |
|
||||||
|
|
|
|
|
|
|
|
|
|
|
|
|
|
|
|
|
|
|
|
|
|
State Bancorp, Inc. |
|
$ |
100.00 |
|
$ |
116.79 |
|
$ |
81.78 |
|
$ |
63.70 |
|
$ |
47.81 |
|
$ |
63.66 |
|
|
Northeast NASDAQ Banks |
|
$ |
100.00 |
|
$ |
108.61 |
|
$ |
90.94 |
|
$ |
83.04 |
|
$ |
65.09 |
|
$ |
78.12 |
|
|
NASDAQ Market Index |
|
$ |
100.00 |
|
$ |
110.25 |
|
$ |
121.88 |
|
$ |
73.10 |
|
$ |
106.22 |
|
$ |
125.36 |
|
28
This stock performance graph shall not be deemed incorporated by reference by any general statement incorporating by reference this Form 10-K under the Securities Act of 1933, as amended, or the Securities Exchange Act of 1934, as amended, except to the extent that we specifically incorporate this information by reference, and shall not otherwise be deemed filed under such Acts.
|
|
|
|
SELECTED FINANCIAL DATA |
The Company’s selected financial data for the last five years follows (dollars in thousands, except per share data):
29
|
|
|
|
|
|
|
|
|
|
|
|
|
|
|
|
|
|
|
As of or
for the Fiscal Year Ended |
|
2010 |
|
2009 |
|
2008 |
|
2007 |
|
2006 |
|
|||||
|
|
|
|
|
|
|
|
|
|
|
|
|
|
|
|
|
|
|
OPERATING RESULTS |
|
|
|
|
|
|
|
|
|
|
|
|
|
|
|
|
|
Interest income |
|
$ |
76,522 |
|
$ |
78,079 |
|
$ |
91,443 |
|
$ |
110,880 |
|
$ |
106,489 |
|
|
Interest expense |
|
$ |
11,832 |
|
$ |
16,000 |
|
$ |
28,573 |
|
$ |
50,715 |
|
$ |
44,253 |
|
|
Net interest income |
|
$ |
64,690 |
|
$ |
62,079 |
|
$ |
62,870 |
|
$ |
60,165 |
|
$ |
62,237 |
|
|
Provision for loan losses |
|
$ |
12,900 |
|
$ |
39,500 |
|
$ |
17,226 |
|
$ |
4,464 |
|
$ |
2,490 |
|
|
Net interest income after provision for loan losses |
|
$ |
51,790 |
|
$ |
22,579 |
|
$ |
45,644 |
|
$ |
55,702 |
|
$ |
59,747 |
|
|
Other income |
|
$ |
8,245 |
|
$ |
1,499 |
|
$ |
365 |
|
$ |
5,376 |
|
$ |
5,691 |
|
|
Operating expenses |
|
$ |
42,024 |
|
$ |
48,503 |
|
$ |
43,751 |
|
$ |
51,913 |
|
$ |
37,626 |
|
|
Net income (loss) |
|
$ |
11,441 |
|
$ |
(14,820 |
) |
$ |
1,807 |
|
$ |
6,229 |
|
$ |
11,494 |
|
|
|
|
|
|
|
|
|
|
|
|
|
|
|
|
|
|
|
|
COMMON SHARE DATA |
|
|
|
|
|
|
|
|
|
|
|
|
|
|
|
|
|
Basic earnings (loss) per common share (1) |
|
$ |
0.57 |
|
$ |
(1.16 |
) |
$ |
0.12 |
|
$ |
0.45 |
|
$ |
1.02 |
|
|
Diluted earnings (loss) per common share (1) |
|
$ |
0.57 |
|
$ |
(1.16 |
) |
$ |
0.12 |
|
$ |
0.45 |
|
$ |
1.00 |
|
|
Cash dividends per common share (1) |
|
$ |
0.20 |
|
$ |
0.20 |
|
$ |
0.50 |
|
$ |
0.45 |
|
$ |
0.45 |
|
|
Tangible book value per common share |
|
$ |
7.04 |
|
$ |
6.82 |
|
$ |
8.09 |
|
$ |
8.11 |
|
$ |
7.65 |
|
|
|
|
|
|
|
|
|
|
|
|
|
|
|
|
|
|
|
|
FINANCIAL CONDITION |
|
|
|
|
|
|
|
|
|
|
|
|
|
|
|
|
|
Total assets |
|
$ |
1,589,979 |
|
$ |
1,607,712 |
|
$ |
1,693,495 |
|
$ |
1,628,014 |
|
$ |
1,788,722 |
|
|
Total loans (2) |
|
$ |
1,131,370 |
|
$ |
1,098,305 |
|
$ |
1,122,538 |
|
$ |
1,041,009 |
|
$ |
983,725 |
|
|
Total deposits |
|
$ |
1,348,735 |
|
$ |
1,349,562 |
|
$ |
1,481,048 |
|
$ |
1,324,853 |
|
$ |
1,566,183 |
|
|
Total stockholders’ equity |
|
$ |
154,852 |
|
$ |
148,515 |
|
$ |
153,919 |
|
$ |
113,638 |
|
$ |
104,141 |
|
|
Weighted average number of common shares outstanding (1) (3) |
|
|
16,262,860 |
|
|
14,500,855 |
|
|
14,148,957 |
|
|
13,738,101 |
|
|
11,227,278 |
|
|
|
|
|
|
|
|
|
|
|
|
|
|
|
|
|
|
|
|
ASSET QUALITY |
|
|
|
|
|
|
|
|
|
|
|
|
|
|
|
|
|
Non-accrual loans |
|
$ |
14,856 |
|
$ |
6,733 |
|
$ |
16,072 |
|
$ |
5,792 |
|
$ |
2,177 |
|
|
Non-accrual loans/total loans |
|
|
1.31 |
% |
|
0.61 |
% |
|
1.43 |
% |
|
0.56 |
% |
|
0.22 |
% |
|
Allowance for loan losses/non-accrual loans (4) |
|
|
223 |
% |
|
474 |
% |
|
134 |
% |
|
254 |
% |
|
754 |
% |
|
Allowance for loan losses/total loans (4) |
|
|
2.92 |
% |
|
2.62 |
% |
|
1.67 |
% |
|
1.41 |
% |
|
1.67 |
% |
|
Net charge-offs |
|
$ |
8,533 |
|
$ |
29,457 |
|
$ |
11,261 |
|
$ |
6,171 |
|
$ |
1,795 |
|
|
Net charge-offs/average loans |
|
|
0.77 |
% |
|
2.64 |
% |
|
1.04 |
% |
|
0.61 |
% |
|
0.19 |
% |
|
|
|
|
|
|
|
|
|
|
|
|
|
|
|
|
|
|
|
OTHER DATA |
|
|
|
|
|
|
|
|
|
|
|
|
|
|
|
|
|
Return on average total assets |
|
|
0.70 |
% |
|
(0.91 |
%) |
|
0.11 |
% |
|
0.37 |
% |
|
0.68 |
% |
|
Return on average common stockholders’ equity |
|
|
8.04 |
% |
|
(14.71 |
%) |
|
1.46 |
% |
|
5.70 |
% |
|
18.39 |
% |
|
Tier I leverage ratio |
|
|
9.53 |
% |
|
8.68 |
% |
|
9.38 |
% |
|
7.03 |
% |
|
6.30 |
% |
|
Total risk-based capital ratio |
|
|
13.55 |
% |
|
12.52 |
% |
|
14.07 |
% |
|
12.11 |
% |
|
11.58 |
% |
|
Net interest margin |
|
|
4.21 |
% |
|
4.03 |
% |
|
4.12 |
% |
|
3.82 |
% |
|
4.01 |
% |
|
Operating efficiency ratio (5) (6) |
|
|
60.0 |
% |
|
72.4 |
% |
|
62.5 |
% |
|
77.9 |
% |
|
54.6 |
% |
|
Dividend payout ratio |
|
|
35 |
% |
|
N/M |
(7) |
|
430 |
% |
|
100 |
% |
|
44 |
% |
|
Tangible common equity ratio (non-GAAP) |
|
|
7.39 |
% |
|
6.93 |
% |
|
6.91 |
% |
|
6.98 |
% |
|
6.22 |
% |
|
Average equity to average assets |
|
|
9.41 |
% |
|
9.29 |
% |
|
7.18 |
% |
|
6.63 |
% |
|
3.71 |
% |
(1) Retroactive recognition has been given for stock dividends and splits.
(2) Net of unearned income and before allowance for loan losses.
(3) Amount used for earnings per common share computation.
(4) Excluding loans held for sale.
(5) Operating expenses divided by the sum of net interest income and other income (excluding net security gains/losses).
(6) Ratio includes $4.0 million in write-downs of loans held for sale, the FDIC special assessment of $730 thousand and $737 thousand related to the exchange of the Company’s $10 million 8.25% subordinated notes in 2009; $1.8 million of legal fees related to the purported shareholder derivative lawsuit in 2008; $3.1 million of Voluntary Exit Window program expenses, $2.4 million goodwill impairment charge and $1.9 million of legal fees in 2007; and $12.1 million reversal of previously accrued IMN-related expenses in 2006.
(7) N/M - denotes not meaningful for statistical purposes.
30
|
|
|
|
MANAGEMENT’S DISCUSSION AND ANALYSIS OF FINANCIAL CONDITION AND RESULTS OF OPERATIONS |
Forward Looking Statements
Certain statements contained in this discussion are “forward-looking statements” within the meaning of the Private Securities Litigation Reform Act of 1995. Words such as “may,” “could,” “should,” “would,” “believe,” “anticipate,” “estimate,” “expect,” “intend,” “plan,” “project,” “is confident that,” and similar expressions are intended to identify these forward looking-statements. These forward-looking statements involve risk and uncertainty and a variety of factors that could cause the Company’s actual results and experience to differ materially from the anticipated results or other expectations expressed in these forward-looking statements. The Company’s ability to predict results or the actual effect of future plans or strategies is inherently uncertain. Factors that could have a material adverse effect on the operations of the Company and its subsidiaries include, but are not limited to, changes in: market interest rates, general economic conditions, legislative/regulatory changes including the Reform Act, monetary and fiscal policies of the U.S. Government, changes in FDIC assessments, the ability to raise additional capital (equity or debt) on favorable terms, the quality and composition of the loan or investment portfolios, demand for loan products, demand for financial services in the Company’s primary trade area, regional economic activity in New York, litigation, tax and other regulatory matters, accounting principles and guidelines, other economic, competitive, governmental, regulatory and technological factors affecting the Company’s operations, pricing and services and those risks detailed in item 1A of this report and in the Company’s periodic reports filed with the SEC.
Non-GAAP Disclosures
This discussion includes a non-GAAP financial measure of our tangible common equity ratio. A non-GAAP financial measure is a numerical measure of historical or future financial performance, financial position or cash flows that excludes or includes amounts that are required to be disclosed by GAAP. The Company believes that this non-GAAP financial measure provides both management and investors a more complete understanding of the underlying operational results and trends and the Company’s marketplace performance. The presentation of this additional information is not meant to be considered in isolation or as a substitute for the numbers prepared in accordance with GAAP.
Executive Summary
The Company is a one-bank holding company, which was formed in 1985. The Company operates as the parent for its wholly owned subsidiary, the Bank, a New York State chartered commercial bank founded in 1966. The Company also has two unconsolidated subsidiaries, the Trusts, entities formed in 2002 and 2003, respectively, to issue trust preferred securities. The income of the Company is principally derived through the operation of the Bank. Unless the context otherwise requires, references herein to the Company include the Company and its subsidiaries on a consolidated basis.
The Bank maintains its corporate headquarters in Jericho, New York and serves its customer base through seventeen branches in Nassau, Suffolk, Queens and Manhattan. The Bank offers a full range of banking services to our diverse customer base which includes commercial real estate owners and developers, small to middle market businesses, professional service firms, municipalities and consumers. Retail and commercial products include checking accounts, NOW accounts, money market accounts, savings accounts, certificates of deposit, individual retirement accounts, commercial loans, commercial real estate loans, small business lines of credit, cash management services and telephone and online banking. In addition, the Bank also provides access to annuity products and mutual funds. The Company’s loan portfolio is concentrated in commercial and industrial loans and commercial real estate loans. The Bank does not engage in subprime lending and does not offer payment option ARMs or negative amortization loan products.
31
FINANCIAL PERFORMANCE OF STATE
BANCORP, INC.
(dollars in thousands, except
per share data)
|
|
|
|
|
|
|
|
|
|
|
|
|
As of or for the years ended December 31, |
|
2010 |
|
2009 |
|
Over/ |
|
|||
|
|
|
|
|
|
|
|
|
|
|
|
|
Revenue (1) |
|
$ |
72,935 |
|
$ |
63,578 |
|
|
15 |
% |
|
Operating expenses |
|
$ |
42,024 |
|
$ |
48,503 |
|
|
(13 |
)% |
|
Provision for loan losses |
|
$ |
12,900 |
|
$ |
39,500 |
|
|
(67 |
)% |
|
Net income (loss) |
|
$ |
11,441 |
|
$ |
(14,820 |
) |
|
N/M |
(2) |
|
Net income (loss) per common share - diluted |
|
$ |
0.57 |
|
$ |
(1.16 |
) |
|
N/M |
(2) |
|
Return on average total assets |
|
|
0.70 |
% |
|
(0.91 |
)% |
|
161 |
bp |
|
Return on average common stockholders’ equity |
|
|
8.04 |
% |
|
(14.71 |
)% |
|
2,275 |
bp |
|
|
|
|
|
|
|
|
|
|
|
|
|
Tier I leverage ratio |
|
|
9.53 |
% |
|
8.68 |
% |
|
85 |
bp |
|
Tier I risk-based capital ratio |
|
|
12.29 |
% |
|
11.26 |
% |
|
103 |
bp |
|
Total risk-based capital ratio |
|
|
13.55 |
% |
|
12.52 |
% |
|
103 |
bp |
|
Tangible common equity ratio (non-GAAP) |
|
|
7.39 |
% |
|
6.93 |
% |
|
46 |
bp |
|
|
|
bp - denotes basis points; 100 bp equals 1%. |
|
|
|
(1) Represents net interest income plus total other income. |
|
|
|
(2) N/M - denotes % variance not meaningful for statistical purposes. |
Overview of Results of Operations and Financial Condition for the Year Ended December 31, 2010
The Company recorded net income of $11.4 million, or $0.57 per diluted common share, for 2010 compared to a net loss of $14.8 million, or $1.16 per diluted common share, for 2009. The improvement in net income in 2010 resulted from multiple factors, most notably a $26.6 million decrease in the provision for loan losses, a $2.6 million increase in net interest income, a $6.7 million increase in non-interest income and a reduction in operating expenses of $6.5 million.
The decrease in the provision for loan losses in 2010 versus the comparable 2009 period was due to several factors, most notably the impact of an aggregate $30 million of charge-offs, sales and payments received on or related to the disposition of lower-quality and non-accrual loans in the fourth quarter of 2009. The level of the provision for 2010 also reflects the overall composition of the Bank’s watch list and general market conditions as they might affect the loan portfolio.
The increase in net interest income resulted in an 18 basis point widening of the Company’s net interest margin to 4.21% in 2010 from 4.03% a year ago, primarily reflecting a 37 basis point decrease in the Company’s average cost of interest-bearing liabilities. The Federal Open Market Committee of the Board of Governors of the Federal Reserve System (the “FOMC”) policy makers have recently indicated that they will maintain the target range for the federal funds rate at 0 to 1/4 percent as they continue to anticipate that economic conditions, including low rates of resource utilization, subdued inflation trends and stable inflation expectations, are likely to warrant exceptionally low levels for the federal funds rate for an extended period. The Company’s net interest margin is impacted not only by the average balance and mix of the Company’s interest-earning assets and interest-bearing liabilities, but also by the level of market interest rates which are significantly influenced by the actions of the FOMC.
The growth in non-interest income in 2010 resulted principally from a $2.5 million increase in net gains on sales of securities, a $4.0 million decrease in other-than-temporary impairment (“OTTI”) charges on securities as the Company had no such charges in 2010 and a $440 thousand increase in income from bank owned life insurance. Deposit service charge income declined by $316 thousand in 2010 principally due to a lower volume of overdraft and other service charges.
Total operating expenses decreased by $6.5 million or 13.4% to $42.0 million in 2010 primarily due to $4.0 million in write-downs of loans held for sale to their estimated fair value in 2009 and a $942 thousand decrease in FDIC and NYS assessment expenses in 2010. The decrease in FDIC and NYS assessment expenses resulted largely from the $730 thousand FDIC special assessment recorded in the second quarter of 2009. In addition, there was $740 thousand in expenses in the fourth quarter of 2009 related to the exchange of our unsecured 8.25% subordinated notes due June 15, 2013 with an outstanding principal balance of $10 million plus accrued interest for an aggregate of
32
1,656,600 shares of our common stock. Partially offsetting these improvements was a $793 thousand increase in marketing and advertising expenses due to an expanded corporate advertising and branding campaign undertaken in 2010.
|
|
|
|
|
|
|
|
|
|
|
|
|
REVENUE OF STATE BANCORP, INC. |
|
|
|
|
|
|
|
|||
|
(dollars in thousands) |
|
|
|
|
|
|
|
|||
|
For the years ended December 31, |
|
2010 |
|
2009 |
|
Over/ |
|
|||
|
|
|
|
|
|
|
|
|
|||
|
Net interest income |
|
$ |
64,690 |
|
$ |
62,079 |
|
|
4 |
% |
|
Service charges on deposit accounts |
|
|
1,845 |
|
|
2,161 |
|
|
(15) |
% |
|
Other-than-temporary impairment losses on securities |
|
|
— |
|
|
(4,000) |
|
|
(100) |
% |
|
Net gains on sales of securities |
|
|
3,519 |
|
|
994 |
|
|
254 |
% |
|
Income from bank owned life insurance |
|
|
1,135 |
|
|
695 |
|
|
63 |
% |
|
Other operating income |
|
|
1,746 |
|
|
1,649 |
|
|
6 |
% |
|
|
|
|
|
|
|
|
|
|
|
|
|
Total revenue |
|
$ |
72,935 |
|
$ |
63,578 |
|
|
15 |
% |
|
|
|
|
|
|
|
|
|
|
|
|
As of December 31, 2010, the Company, on a consolidated basis, had total assets of $1.6 billion, total deposits of $1.3 billion and stockholders’ equity of $155 million. The Company’s return on average total assets improved to 0.70% in 2010 from (0.91)% in 2009, while return on average common stockholders’ equity increased to 8.04% in 2010 from (14.71)% in 2009.
Commercial and residential real estate values in our market appear to have stabilized at lower levels. Locally, however, properties are burdened by high maintenance costs including state and local tax burdens. Business conditions remain subdued, marked by high unemployment, and economic uncertainty is serving to limit both consumer and corporate spending. Accordingly, the Company expects that weakness will continue in the equity, credit and real estate markets. Although we, like many other financial services firms, continue to witness the unfolding of very difficult and challenging market conditions, the Company believes it is prudently managing its business interests, particularly in the area of maintaining strengthened underwriting standards and risk management practices.
The primary focus of the Company’s loan portfolio is commercial real estate and commercial and industrial loans. Looking forward to 2011, we expect to achieve modest loan growth in our core competencies of commercial and industrial credits and commercial real estate loans. We remain cautious, however, on credit conditions and the inherent risk in lending portfolios. The Company’s securities portfolio contains no subprime exposure, structured debt or exotic structures. At December 31, 2010, the fair value of the securities portfolio represented 101% of amortized cost.
Overview of Asset Quality for the Year Ended December 31, 2010
Non-accrual loans totaled $15 million or 1.3% of total loans outstanding at December 31, 2010 versus $7 million or 0.6% of total loans outstanding at December 31, 2009. The $8 million increase in non-accrual loans at December 31, 2010 compared to December 31, 2009 resulted primarily from several previously classified commercial and industrial loans that became 90 days or more delinquent and were placed on non-accrual status largely during the third and fourth quarters of 2010. The allowance for loan losses specifically allocated to non-accrual loans was $5 million and $1 million, respectively, at December 31, 2010 and 2009. The allowance for loan losses as a percentage of total non-accrual loans amounted to 223% at December 31, 2010 versus 474% at December 31, 2009, and is considered adequate.
Total accruing loans delinquent 30 days or more declined to $26 million or 2.28% of loans outstanding at December 31, 2010 versus $42 million or 3.84% of loans outstanding at December 31, 2009.
Watch list loans (consisting of criticized loans, classified loans and those loans requiring special attention but not warranting categorization as either criticized or classified) totaled $166 million at December 31, 2010 and $143 million at December 31, 2009. Classified loans were $69 million at December 31, 2010 as compared to $81 million at December 31, 2009. The allowance for loan losses as a percentage of total classified loans was 47% and 35%, respectively, at the same dates.
33
At December 31, 2010, the Company had $27 million in troubled debt restructurings, primarily consisting of two $10 million classified, partially secured, commercial and industrial loans and a classified $7 million secured, performing land loan. The borrowers requested and were granted interest rate or other concessions. These credits have been on the Company’s watch list since 2009 and 2008, respectively, and are fully advanced. The Company had troubled debt restructurings amounting to $436 thousand at December 31, 2009. The allowance for loan losses specifically allocated to troubled debt restructurings was $8 million at December 31, 2010. There was no such allowance at December 31, 2009.
As of December 31, 2010, the Company’s allowance for loan losses amounted to $33 million or 2.9% of period-end loans outstanding. The allowance of $29 million at December 31, 2009 represented 2.6% of period-end loans outstanding.
The Company recorded net loan charge-offs of $8.5 million in 2010 versus net charge-offs of $29.5 million in 2009. As a percentage of average total loans outstanding, these net amounts represented 0.8% for 2010 and 2.6% for 2009.
The Company has held no other real estate owned since 2005.
Critical Accounting Policies, Judgments and Estimates
The discussion and analysis of the financial condition and results of operations of the Company are based on the Consolidated Financial Statements, which are prepared in conformity with accounting principles generally accepted in the United States of America. The preparation of these financial statements requires management to make estimates and assumptions affecting the reported amounts of assets, liabilities, revenues and expenses. Management evaluates those estimates and assumptions on an ongoing basis, including those related to the allowance for loan losses, income taxes, investment securities that are classified as OTTI and recognition of contingent liabilities. Management bases its estimates on historical experience and various other factors and assumptions that are believed to be reasonable under the circumstances. These form the basis for making judgments on the carrying value of assets and liabilities that are not readily apparent from other sources. Actual results may differ from those estimates under different assumptions or conditions.
Allowance for Loan Losses
In management’s opinion, one of the most critical accounting policies impacting the Company’s financial statements is the evaluation of the allowance for loan losses. Management carefully monitors the credit quality of the portfolio and charges off the amounts of those loans deemed uncollectible. Management evaluates the fair value of collateral supporting any impaired loans using independent appraisals and other measures of fair value. This process involves subjective judgments and assumptions that are always subject to substantial change based on factors outside the control of the Company.
34
LOAN PORTFOLIO (1) AND THE ALLOWANCE
FOR LOAN LOSSES
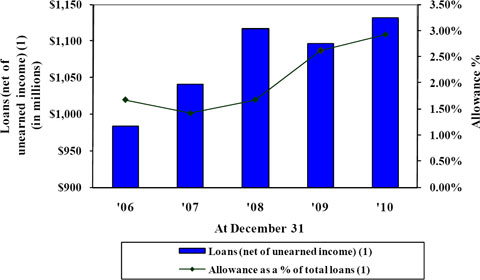
|
|
|
|
|
(1) Excluding loans held for sale. |
Management recognizes that, despite its best efforts to minimize risk through its credit review process, losses will inevitably occur. In times of economic slowdown, regional or national, the credit risk inherent in the Company’s loan portfolio will increase. The timing and amount of loan losses that occur are dependent upon several factors, most notably qualitative and quantitative factors about the financial conditions as reflected in the loan portfolio and the economy as a whole. Factors considered in the evaluation of the allowance for loan losses for all portfolio segments include, but are not limited to, estimated probable inherent losses from loan and other credit arrangements, general economic conditions, credit risk grades assigned to commercial and industrial and commercial real estate loans, changes in credit concentrations or pledged collateral, historical loan loss experience and trends in portfolio volume, maturity, composition, delinquencies and non-accruals. The allowance for loan losses is established to absorb probable inherent loan losses. Additions to the allowance are made through the provision for loan losses, which is a charge to current operating earnings. The adequacy of the provision and the resulting allowance for loan losses is determined by management’s continuing review of the loan portfolio, including identification and review of individual problem situations that may affect a borrower’s ability to repay, delinquency and non-performing loan data, collateral values and changes in the size and character of the loan portfolio. Despite such a review, the level of the allowance for loan losses remains an estimate, cannot be precisely determined and may be subject to significant changes from quarter to quarter. Based on current economic conditions, management believes that the current level of the allowance for loan losses is adequate in relation to the probable inherent losses present in the portfolio.
Commercial loans in all portfolio segments are assigned credit risk grades using a scale of one to ten with allocations for probable inherent losses made for pools of similar risk-graded loans. Loans in all portfolio segments with signs of credit deterioration, generally in grades eight through ten and internally risk-graded as substandard, doubtful and loss, respectively, are termed “classified” loans in accordance with guidelines established by the Company’s regulators. “Criticized” loans, generally in grade seven and internally risk-graded as special mention, have potential weaknesses, often temporary in nature, requiring management’s extra vigilance. Loans requiring special attention but not warranting categorization as either criticized or classified are generally in grade six. Watch list loans consist of criticized loans, classified loans, and those loans requiring special attention but not warranting categorization as either criticized or classified. Loans generally in grades one to six are termed “pass” loans, except for those loans in grade six that are on the watch list. When management analyzes the allowance for loan losses, classified loans in all portfolio segments are assigned allocation factors ranging from 20% to 100% of the outstanding loan balance and are based on the Company’s historic loss experience. For all portfolio segments, non-accrual loans in excess of $250 thousand are individually evaluated for impairment and are not included in these risk grade pools. A loan is considered “impaired” when, based on current information and events, it is probable that both the principal and interest due under the original contractual terms will not be collected in full. The Company measures impairment of collateralized loans based on the fair value of the collateral, less estimated costs to sell. For loans that are not collateral-dependent, impairment is measured by using the present value of expected cash flows, discounted at the
35
loan’s effective interest rate. An allowance allocation factor for additional portfolio macro factors, including various real estate related sectors, currently ranging from 1-35 basis points is calculated to cover potential losses from a number of variables, not the least of which is the current economic uncertainty.
Management monitors the level of the allowance for loan losses in order to properly reflect its estimate of the exposure, if any, represented by fluctuations in the local real estate market and the underlying value that market provides as collateral to certain segments of the loan portfolio. The provision is continually evaluated relative to portfolio risk and regulatory guidelines and will continue to be closely reviewed. In addition, various bank regulatory agencies, as an integral part of their examination process, closely review the allowance for loan losses. Such agencies may require the Company to recognize additions to the allowance based on their independent judgment of information available to them at the time of their examinations. Frequently, such additional information generally becomes available only after management has conducted its quarterly calculation of the provision.
For all loans regardless of portfolio segment, the Bank prepares a combined migration analysis which analyzes the historical loss experience. The migration analysis is prepared at least annually for the purpose of determining the assigned allocation factors which is an essential component of the allowance for loan losses level. Additional risk components including large relationship risk, commercial/residential contractor risk, rising interest rate risk, energy and oil dependent risk, real estate risk, and economic condition uncertainty are also considered. Based upon charge-off history, the Company made adjustments to its allocation factors in the first quarter of 2010 and made no further adjustments thereafter in 2010.
Risk characteristics of the commercial and industrial portfolio segment vary and depend upon the specific borrower’s business and industry sector. Risk characteristics of the real estate portfolio segments tend to be cyclical and, in the Bank’s case, generally specific to the Long Island and New York City geographical area; at present the real estate market generally continues to be lackluster. Risk characteristics of the loans to individuals segment vary depending on the type of loan, the timing of repayment, the sources of repayment, and value and stability of any collateral.
Generally, the Bank processes a charge-off for any portion of a loan that is determined to be uncollectable regardless of portfolio segment or loan class. In addition, commercial loans under $25 thousand are generally fully charged off in the quarter in which they reach 180 days past due unless the loan is secured by real estate or liquid collateral; commercial loans $25 thousand and over are charged off if classified as a loss; consumer loans are generally charged off in the quarter they reach 120 days past due; residential real estate loans are partially charged off for the amount that the loan exceeds the current value of the collateral property, no later than 120 days past due.
Accounting for Income Taxes
Deferred tax assets and liabilities are recognized to reflect the temporary differences between the financial reporting and tax bases of assets and liabilities, and for operating loss carryforwards. Deferred tax assets and liabilities are measured using the currently enacted tax rates that apply to taxable income in effect for the years in which those tax assets are expected to be realized or settled. Management exercises significant judgment in the evaluation of the amount and timing of the recognition of the resulting tax assets and liabilities. The judgments and estimates required for this evaluation are periodically updated based upon changes in business factors and the tax laws and regulations.
On a quarterly basis, management determines whether a valuation allowance is necessary for our deferred tax asset. A valuation allowance, if needed, would reduce the deferred tax asset to the amount expected to be realized. In performing this analysis, management considers all evidence currently available, both positive and negative, in determining whether, based on the weight of that evidence, the deferred tax asset will be realized. A valuation allowance is established when it is more likely than not that a recorded tax benefit is not expected to be realized. The expense to create the tax valuation allowance is recorded as additional income tax expense in the period the tax valuation allowance is established. The valuation allowance estimate is highly dependent on projections of future levels of taxable income. Should the actual amount of taxable income be less than what has been projected, it may be necessary to record a valuation allowance in a future period.
OTTI of Investment Securities
Current guidance requires an entity to assess whether it intends to sell, or it is more likely than not that it will be required to sell, a security in an unrealized loss position before recovery of its amortized cost basis. If either of these criteria is met, the entire difference between amortized cost and fair value is recognized as impairment through earnings. For securities that do not meet the aforementioned criteria, the amount of impairment is split into two components as follows: 1) OTTI related to other factors, which is recognized in other comprehensive
36
income and 2) OTTI related to credit loss, which must be recognized in the statement of operations. The credit loss is defined as the difference between the present value of the cash flows expected to be collected and the amortized cost basis.
Recognition of Contingent Liabilities
The Company and the Bank are subject to proceedings and claims that arise in the normal course of business. Management assesses the likelihood of any adverse outcomes to these matters as well as potential ranges of probable losses. There can be no assurance that actual outcomes will not differ from those assessments. A liability is recognized in the Company’s consolidated balance sheets if such liability is both probable and estimable.
Results of Operations and Financial Condition
Net Interest Income
Distribution of Assets, Liabilities and Stockholders’ Equity: Net Interest Income and Rates
The following table presents the average daily balances of the Company’s assets, liabilities and stockholders’ equity, together with an analysis of net interest earnings and average rates, for each major category of interest-earning assets and interest-bearing liabilities. Interest and average rates are computed on a fully taxable-equivalent basis, adjusted for certain disallowed interest expense deductions, using a tax rate of 34%. Non-accrual loans are included in the average balances (dollars in thousands):
37
|
|
|
|
|
|
|
|
|
|
|
|
|
|
|
|
|
|
|
|
|
|
|
|
|
|
|
|
|
|
|
For the Years Ended December 31, |
|
2010 |
|
2009 |
|
2008 |
|
|||||||||||||||||||||
|
|
|
|
|
|
|
|
|
|||||||||||||||||||||
|
|
|
Average |
|
Interest |
|
Average |
|
Average |
|
Interest |
|
Average |
|
Average |
|
Interest |
|
Average |
|
|||||||||
|
|
|
|
|
|
|
|
|
|
|
|
|
|
|
|
|
|
|
|
|
|||||||||
|
ASSETS: |
|
|
|
|
|
|
|
|
|
|
|
|
|
|
|
|
|
|
|
|
|
|
|
|
|
|
|
|
|
Securities: |
|
|
|
|
|
|
|
|
|
|
|
|
|
|
|
|
|
|
|
|
|
|
|
|
|
|
|
|
|
Taxable |
|
$ |
404,743 |
|
$ |
14,766 |
|
|
3.65 |
% |
$ |
389,304 |
|
$ |
17,652 |
|
|
4.53 |
% |
$ |
392,022 |
|
$ |
19,555 |
|
|
4.99 |
% |
|
Tax-exempt |
|
|
3,035 |
|
|
133 |
|
|
4.38 |
|
|
9,385 |
|
|
129 |
|
|
1.37 |
|
|
5,569 |
|
|
291 |
|
|
5.23 |
|
|
|
|
|
|
|
|
|
|
|
|
|
|
|
|
|
|
|
|
|
|
|
|
|
|
|
|
|
|
|
|
Total securities |
|
|
407,778 |
|
|
14,899 |
|
|
3.65 |
|
|
398,689 |
|
|
17,781 |
|
|
4.46 |
|
|
397,591 |
|
|
19,846 |
|
|
4.99 |
|
|
|
|
|
|
|
|
|
|
|
|
|
|
|
|
|
|
|
|
|
|
|
|
|
|
|
|
|
|
|
|
Federal Home Loan Bank and other restricted stock |
|
|
5,768 |
|
|
126 |
|
|
2.18 |
|
|
5,783 |
|
|
108 |
|
|
1.87 |
|
|
6,729 |
|
|
368 |
|
|
5.47 |
|
|
Federal funds sold, securities purchased under agreements to resell and interest-bearing deposits |
|
|
16,141 |
|
|
29 |
|
|
0.18 |
|
|
20,962 |
|
|
32 |
|
|
0.15 |
|
|
42,846 |
|
|
1,061 |
|
|
2.48 |
|
|
Loans (net of unearned income): |
|
|
|
|
|
|
|
|
|
|
|
|
|
|
|
|
|
|
|
|
|
|
|
|
|
|
|
|
|
Taxable |
|
|
1,105,914 |
|
|
61,432 |
|
|
5.55 |
|
|
1,114,394 |
|
|
60,088 |
|
|
5.39 |
|
|
1,078,613 |
|
|
70,039 |
|
|
6.49 |
|
|
Tax-exempt |
|
|
1,491 |
|
|
118 |
|
|
7.91 |
|
|
2,113 |
|
|
169 |
|
|
8.00 |
|
|
3,996 |
|
|
325 |
|
|
8.13 |
|
|
|
|
|
|
|
|
|
|
|
|
|
|
|
|
|
|
|
|
|
|
|
|
|
|
|
|
|
|
|
|
Total loans - net |
|
|
1,107,405 |
|
|
61,550 |
|
|
5.56 |
|
|
1,116,507 |
|
|
60,257 |
|
|
5.40 |
|
|
1,082,609 |
|
|
70,364 |
|
|
6.50 |
|
|
|
|
|
|
|
|
|
|
|
|
|
|
|
|
|
|
|
|
|
|
|
|
|
|
|
|
|
|
|
|
Total interest-earning assets |
|
|
1,537,092 |
|
$ |
76,604 |
|
|
4.98 |
% |
|
1,541,941 |
|
$ |
78,178 |
|
|
5.07 |
% |
|
1,529,775 |
|
$ |
91,639 |
|
|
5.99 |
% |
|
|
|
|
|
|
|
|
|
|
|
|
|
|
|
|
|
|
|
|
|
|
|
|
|
|
|
|
|
|
|
Allowance for loan losses |
|
|
(29,411 |
) |
|
|
|
|
|
|
|
(24,846 |
) |
|
|
|
|
|
|
|
(15,864 |
) |
|
|
|
|
|
|
|
Cash and due from banks |
|
|
42,494 |
|
|
|
|
|
|
|
|
46,969 |
|
|
|
|
|
|
|
|
41,707 |
|
|
|
|
|
|
|
|
Bank premises and equipment - net |
|
|
6,345 |
|
|
|
|
|
|
|
|
6,586 |
|
|
|
|
|
|
|
|
6,370 |
|
|
|
|
|
|
|
|
Other assets |
|
|
77,515 |
|
|
|
|
|
|
|
|
62,738 |
|
|
|
|
|
|
|
|
70,235 |
|
|
|
|
|
|
|
|
|
|
|
|
|
|
|
|
|
|
|
|
|
|
|
|
|
|
|
|
|
|
|
|
|
|
|
|
|
|
Total Assets |
|
$ |
1,634,035 |
|
|
|
|
|
|
|
$ |
1,633,388 |
|
|
|
|
|
|
|
$ |
1,632,223 |
|
|
|
|
|
|
|
|
|
|
|
|
|
|
|
|
|
|
|
|
|
|
|
|
|
|
|
|
|
|
|
|
|
|
|
|
|
|
|
|
|
|
|
|
|
|
|
|
|
|
|
|
|
|
|
|
|
|
|
|
|
|
|
|
|
|
|
|
LIABILITIES AND STOCKHOLDERS’ EQUITY: |
|
|
|
|
|
|
|
|
|
|
|
|
|
|
|
|
|
|
|
|
|
|
|
|
|
|
|
|
|
Savings and time deposits: |
|
|
|
|
|
|
|
|
|
|
|
|
|
|
|
|
|
|
|
|
|
|
|
|
|
|
|
|
|
Savings |
|
$ |
624,053 |
|
$ |
3,634 |
|
|
0.58 |
% |
$ |
600,095 |
|
$ |
4,629 |
|
|
0.77 |
% |
$ |
560,615 |
|
$ |
7,901 |
|
|
1.41 |
% |
|
Time |
|
|
416,895 |
|
|
6,258 |
|
|
1.50 |
|
|
444,206 |
|
|
8,710 |
|
|
1.96 |
|
|
472,070 |
|
|
15,427 |
|
|
3.27 |
|
|
|
|
|
|
|
|
|
|
|
|
|
|
|
|
|
|
|
|
|
|
|
|
|
|
|
|
|
|
|
|
Total savings and time deposits |
|
|
1,040,948 |
|
|
9,892 |
|
|
0.95 |
|
|
1,044,301 |
|
|
13,339 |
|
|
1.28 |
|
|
1,032,685 |
|
|
23,328 |
|
|
2.26 |
|
|
|
|
|
|
|
|
|
|
|
|
|
|
|
|
|
|
|
|
|
|
|
|
|
|
|
|
|
|
|
|
Federal funds purchased |
|
|
74 |
|
|
— |
|
|
0.60 |
|
|
225 |
|
|
1 |
|
|
0.44 |
|
|
6,129 |
|
|
167 |
|
|
2.72 |
|
|
Securities sold under agreements to repurchase |
|
|
3,000 |
|
|
56 |
|
|
1.88 |
|
|
3,863 |
|
|
60 |
|
|
1.55 |
|
|
2,008 |
|
|
38 |
|
|
1.88 |
|
|
Other temporary borrowings |
|
|
7,386 |
|
|
33 |
|
|
0.45 |
|
|
12,805 |
|
|
55 |
|
|
0.43 |
|
|
110,929 |
|
|
2,805 |
|
|
2.53 |
|
|
Senior unsecured debt |
|
|
29,000 |
|
|
1,122 |
|
|
3.87 |
|
|
21,929 |
|
|
844 |
|
|
3.85 |
|
|
— |
|
|
— |
|
|
— |
|
|
Subordinated notes |
|
|
— |
|
|
— |
|
|
— |
|
|
9,205 |
|
|
852 |
|
|
9.26 |
|
|
10,000 |
|
|
925 |
|
|
9.25 |
|
|
Junior subordinated debentures |
|
|
20,620 |
|
|
729 |
|
|
3.54 |
|
|
20,620 |
|
|
849 |
|
|
4.12 |
|
|
20,620 |
|
|
1,310 |
|
|
6.35 |
|
|
|
|
|
|
|
|
|
|
|
|
|
|
|
|
|
|
|
|
|
|
|
|
|
|
|
|
|
|
|
|
Total interest-bearing liabilities |
|
|
1,101,028 |
|
|
11,832 |
|
|
1.07 |
|
|
1,112,948 |
|
|
16,000 |
|
|
1.44 |
|
|
1,182,371 |
|
|
28,573 |
|
|
2.42 |
|
|
|
|
|
|
|
|
|
|
|
|
|
|
|
|
|
|
|
|
|
|
|
|
|
|
|
|
|
|
|
|
Demand deposits |
|
|
362,146 |
|
|
|
|
|
|
|
|
350,979 |
|
|
|
|
|
|
|
|
320,830 |
|
|
|
|
|
|
|
|
Other liabilities |
|
|
17,083 |
|
|
|
|
|
|
|
|
17,798 |
|
|
|
|
|
|
|
|
11,807 |
|
|
|
|
|
|
|
|
|
|
|
|
|
|
|
|
|
|
|
|
|
|
|
|
|
|
|
|
|
|
|
|
|
|
|
|
|
|
Total liabilities |
|
|
1,480,257 |
|
|
|
|
|
|
|
|
1,481,725 |
|
|
|
|
|
|
|
|
1,515,008 |
|
|
|
|
|
|
|
|
|
|
|
|
|
|
|
|
|
|
|
|
|
|
|
|
|
|
|
|
|
|
|
|
|
|
|
|
|
|
Stockholders’ equity |
|
|
153,778 |
|
|
|
|
|
|
|
|
151,663 |
|
|
|
|
|
|
|
|
117,215 |
|
|
|
|
|
|
|
|
|
|
|
|
|
|
|
|
|
|
|
|
|
|
|
|
|
|
|
|
|
|
|
|
|
|
|
|
|
|
Total Liabilities and Stockholders’ Equity |
|
$ |
1,634,035 |
|
|
|
|
|
|
|
$ |
1,633,388 |
|
|
|
|
|
|
|
$ |
1,632,223 |
|
|
|
|
|
|
|
|
|
|
|
|
|
|
|
|
|
|
|
|
|
|
|
|
|
|
|
|
|
|
|
|
|
|
|
|
|
|
Interest rate spread |
|
|
|
|
|
|
|
|
3.91 |
% |
|
|
|
|
|
|
|
3.63 |
% |
|
|
|
|
|
|
|
3.57 |
% |
|
|
|
|
|
|
|
|
|
|
|
|
|
|
|
|
|
|
|
|
|
|
|
|
|
|
|
|
|
|
|
Net interest income/margin |
|
|
|
|
|
64,772 |
|
|
4.21 |
% |
|
|
|
|
62,178 |
|
|
4.03 |
% |
|
|
|
|
63,066 |
|
|
4.12 |
% |
|
|
|
|
|
|
|
|
|
|
|
|
|
|
|
|
|
|
|
|
|
|
|
|
|
|
|
|
|
|
|
Less tax-equivalent basis adjustment |
|
|
|
|
|
(82 |
) |
|
|
|
|
|
|
|
(99 |
) |
|
|
|
|
|
|
|
(196 |
) |
|
|
|
|
|
|
|
|
|
|
|
|
|
|
|
|
|
|
|
|
|
|
|
|
|
|
|
|
|
|
|
|
|
|
Net Interest Income |
|
|
|
|
$ |
64,690 |
|
|
|
|
|
|
|
$ |
62,079 |
|
|
|
|
|
|
|
$ |
62,870 |
|
|
|
|
|
|
|
|
|
|
|
|
|
|
|
|
|
|
|
|
|
|
|
|
|
|
|
|
|
|
|
|
|
|
38
Analysis of Changes in Net Interest Income
The following table presents a comparative analysis of the changes in the Company’s interest income and interest expense due to the changes in the average volume and the average rates earned on interest-earning assets and due to the changes in the average volume and the average rates paid on interest-bearing liabilities. Interest and average rates are computed on a fully taxable-equivalent basis, adjusted for certain disallowed interest expense deductions, using a tax rate of 34%. Variances in rate/volume relationships have been allocated proportionately to the amount of change in average volume and average rate (in thousands):
|
|
|
|
|
|
|
|
|
|
|
|
|
|
|
|
|
|
|
|
|
|
|
|
Year 2010 over 2009 |
|
Year 2009 over 2008 |
|
||||||||||||||
|
|
|
|
|
|
|
||||||||||||||
|
|
|
Due to Change in: |
|
|
|
Due to Change in: |
|
|
|
||||||||||
|
|
|
|
|
|
|
|
|
|
|
||||||||||
|
|
|
Average |
|
Average |
|
Net (Decrease) |
|
Average |
|
Average |
|
Net (Decrease) |
|
||||||
|
|
|
|
|
|
|
|
|
|
|
|
|
|
|
||||||
|
INTEREST INCOME: |
|
|
|
|
|
|
|
|
|
|
|
|
|
|
|
|
|
|
|
|
Securities: |
|
|
|
|
|
|
|
|
|
|
|
|
|
|
|
|
|
|
|
|
Taxable |
|
$ |
677 |
|
$ |
(3,563 |
) |
$ |
(2,886 |
) |
$ |
(135 |
) |
$ |
(1,768 |
) |
$ |
(1,903 |
) |
|
Tax-exempt |
|
|
(132 |
) |
|
136 |
|
|
4 |
|
|
129 |
|
|
(291 |
) |
|
(162 |
) |
|
|
|
|
|
|
|
|
|
|
|
|
|
|
|
|
|
|
|
|
|
|
Total securities |
|
|
545 |
|
|
(3,427 |
) |
|
(2,882 |
) |
|
(6 |
) |
|
(2,059 |
) |
|
(2,065 |
) |
|
|
|
|
|
|
|
|
|
|
|
|
|
|
|
|
|
|
|
|
|
|
Federal Home Loan Bank and other restricted stock |
|
|
— |
|
|
18 |
|
|
18 |
|
|
(46 |
) |
|
(214 |
) |
|
(260 |
) |
|
Federal funds sold, securities purchased under agreements to resell and interest-bearing deposits |
|
|
(8 |
) |
|
5 |
|
|
(3 |
) |
|
(363 |
) |
|
(666 |
) |
|
(1,029 |
) |
|
Loans (net of unearned income): |
|
|
|
|
|
|
|
|
|
|
|
|
|
|
|
|
|
|
|
|
Taxable |
|
|
(460 |
) |
|
1,804 |
|
|
1,344 |
|
|
2,259 |
|
|
(12,210 |
) |
|
(9,951 |
) |
|
Tax-exempt |
|
|
(49 |
) |
|
(2 |
) |
|
(51 |
) |
|
(151 |
) |
|
(5 |
) |
|
(156 |
) |
|
|
|
|
|
|
|
|
|
|
|
|
|
|
|
|
|
|
|
|
|
|
Total loans - net |
|
|
(509 |
) |
|
1,802 |
|
|
1,293 |
|
|
2,108 |
|
|
(12,215 |
) |
|
(10,107 |
) |
|
|
|
|
|
|
|
|
|
|
|
|
|
|
|
|
|
|
|
|
|
|
Total Interest Income |
|
|
28 |
|
|
(1,602 |
) |
|
(1,574 |
) |
|
1,693 |
|
|
(15,154 |
) |
|
(13,461 |
) |
|
|
|
|
|
|
|
|
|
|
|
|
|
|
|
|
|
|
|
|
|
|
INTEREST EXPENSE: |
|
|
|
|
|
|
|
|
|
|
|
|
|
|
|
|
|
|
|
|
Savings and time deposits: |
|
|
|
|
|
|
|
|
|
|
|
|
|
|
|
|
|
|
|
|
Savings |
|
|
178 |
|
|
(1,173 |
) |
|
(995 |
) |
|
523 |
|
|
(3,795 |
) |
|
(3,272 |
) |
|
Time |
|
|
(509 |
) |
|
(1,943 |
) |
|
(2,452 |
) |
|
(864 |
) |
|
(5,854 |
) |
|
(6,718 |
) |
|
|
|
|
|
|
|
|
|
|
|
|
|
|
|
|
|
|
|
|
|
|
Total savings and time deposits |
|
|
(331 |
) |
|
(3,116 |
) |
|
(3,447 |
) |
|
(341 |
) |
|
(9,649 |
) |
|
(9,990 |
) |
|
|
|
|
|
|
|
|
|
|
|
|
|
|
|
|
|
|
|
|
|
|
Federal funds purchased |
|
|
— |
|
|
(1 |
) |
|
(1 |
) |
|
(89 |
) |
|
(77 |
) |
|
(166 |
) |
|
Securities sold under agreements to repurchase |
|
|
(15 |
) |
|
11 |
|
|
(4 |
) |
|
30 |
|
|
(8 |
) |
|
22 |
|
|
Other temporary borrowings |
|
|
(24 |
) |
|
2 |
|
|
(22 |
) |
|
(1,418 |
) |
|
(1,331 |
) |
|
(2,749 |
) |
|
Senior unsecured debt |
|
|
274 |
|
|
4 |
|
|
278 |
|
|
844 |
|
|
— |
|
|
844 |
|
|
Subordinated notes |
|
|
(426 |
) |
|
(426 |
) |
|
(852 |
) |
|
(74 |
) |
|
1 |
|
|
(73 |
) |
|
Junior subordinated debentures |
|
|
— |
|
|
(120 |
) |
|
(120 |
) |
|
— |
|
|
(460 |
) |
|
(460 |
) |
|
|
|
|
|
|
|
|
|
|
|
|
|
|
|
|
|
|
|
|
|
|
Total Interest Expense |
|
|
(522 |
) |
|
(3,646 |
) |
|
(4,168 |
) |
|
(1,048 |
) |
|
(11,524 |
) |
|
(12,572 |
) |
|
|
|
|
|
|
|
|
|
|
|
|
|
|
|
|
|
|
|
|
|
|
Change in Net Interest Income (Tax-equivalent Basis) |
|
$ |
550 |
|
$ |
2,044 |
|
$ |
2,594 |
|
$ |
2,741 |
|
$ |
(3,630 |
) |
$ |
(889 |
) |
|
|
|
|
|
|
|
|
|
|
|
|
|
|
|
|
|
|
|
|
|
2010 versus 2009
Net interest income, the difference between interest earned on loans and investments, and interest paid on deposits and borrowed funds, is the Company’s primary source of operating earnings. Net interest income is influenced by the average balance and mix of the Company’s interest-earning assets, the yield on those assets and the current level of market interest rates. Additionally, the term structure of interest rates, or yield curve, also impacts the Company’s ability to generate net interest income. These rates are significantly influenced by the actions of the FOMC, which periodically adjusts the federal funds rate, the rate at which banks borrow from one another on an overnight basis. During 2010 the FOMC kept the federal funds target rate at historically low levels.
During 2010, interest income declined by $1.6 million, or 2%. This was due to a reduction in the yield on securities from 4.46% in 2009 to 3.65% during 2010. The decline in the average yield reflects the relatively short term nature of the securities portfolio as cash flows have been reinvested at lower yields over the year. Partially offsetting this decline was an increase in the yield on the loans portfolio from 5.40% to 5.56%. This was due to the Company being able to keep new loan rates at higher levels despite a drop in market interest rates, reflecting renewal of lower-yielding maturing loans and new loans at somewhat higher rates.
39
Interest expense decreased by $4.2 million or 26% due to a decrease in the cost of interest-bearing liabilities from 1.44% in 2009 to 1.07% in 2010, a decline of 37 basis points. This reflects the historically low interest rate environment and the continued reduction in rates on interest bearing deposits. Also contributing to the reduction in interest expense was an $11 million increase in average non-interest-bearing demand deposits in 2010.
Average core deposit balances, consisting of demand, savings and money market deposits, increased by $35 million in 2010 to $986 million as compared to 2009, and provided funding at an average cost of 0.37% in 2010 versus 0.49% in 2009. These core deposit balances funded 64% and 62% of the Company’s average interest-earning assets during 2010 and 2009, respectively, and represented 70% of total average deposits in 2010 compared to 68% in 2009. Core deposit balances provide lower-cost funding that allows the Company to reduce its dependence on higher cost time deposits and borrowings.
2009 versus 2008
During 2009, interest income declined by $13.5 million, or 13%. This was almost entirely due to a reduction in the yield on average interest-earning assets from 5.99% in 2008 to 5.07% during 2009. The decline in the average yield reflects the continued repricing of our loan portfolio, which primarily has variable rates that adjust with changes in the market rates. Offsetting this decline was a shift in our balance sheet composition to reduce our average balance of lower yielding money market investments (average yield 0.15%) and increase our average balance of higher yielding loans (average yield 5.40%). The average money market investment balance decreased by $22 million while average loans increased by $33 million.
Interest expense decreased by $12.6 million or 44% due to a decrease in the cost of interest-bearing liabilities from 2.42% in 2008 to 1.44% in 2009, a decline of 98 basis points, reflecting the historically low interest rate environment and a reduction of higher cost borrowings. Also contributing to the reduction in interest expense was a $30 million increase in average non-interest-bearing demand deposits in 2009.
Average core deposit balances, consisting of demand, savings and money market deposits, increased by $70 million in 2009 to $951 million as compared to 2008, and provided funding at an average cost of 0.49% in 2009 versus 0.90% in 2008. These core deposit balances funded 62% and 58% of the Company’s average interest-earning assets during 2009 and 2008, respectively, and represented 68% of total average deposits in 2009 compared to 65% in 2008. Core deposit balances provide lower-cost funding that allows the Company to reduce its dependence on higher cost time deposits and borrowings.
Investment Securities
The Company, at the time of purchase, designates each investment security as either “available for sale” (“AFS”), “held to maturity” (“HTM”) or “trading,” depending upon investment objectives, liquidity needs and ultimate intent. AFS securities are stated at market value, with unrealized gains or losses reported as a separate component of stockholders’ equity, net of taxes, until realized. Securities held to maturity are stated at cost, adjusted for amortization of premium or accretion of discount, if any. Trading securities are generally purchased with the intent of capitalizing on perceived short-term price inefficiencies by selling them in the near term. The Company purchased held-to-maturity securities during the third quarter of 2010.
At December 31, 2010, the Company’s $383 million investment portfolio consisted of HTM and AFS securities which had an unrealized positive pre-tax mark to fair value of $6 million versus an unrealized net gain of $11 million at year-end 2009. At year-end 2010, the HTM portfolio was comprised of Corporate Securities that made up 6% of the total portfolio. The AFS portfolio was divided into the following categories: 81% mortgage-backed securities (“MBS”) (FNMA, FHLMC, and GNMA obligations); 1% commercial mortgage-backed securities (GNMA); 10% U.S. Government agency securities; and 2% corporate, tax-exempt municipal and other securities.
Continued turbulence in the capital markets, resulting from the ongoing financial crisis, perpetuated a challenging investment climate during 2010. A continued slowdown in macroeconomic conditions made those challenges even greater. The overall level of interest rates remained low as recessionary expectations were present during the year. Presented with difficult bond market conditions throughout most of the year, our portfolio was maintained with the objective of generating cash flow to be redeployed opportunistically in a rising rate environment.
The Company’s investment policy is conservative in nature and identifies liquidity and safety as being of paramount importance among its objectives and, as such, the portfolio is largely comprised of MBS issues of Government-sponsored enterprises and U.S. Government agency securities. In addition to the creation of liquidity, risk management is another important aspect of the Company’s investment
40
strategy. The Company’s portfolio composition is designed to provide liquidity while managing market risk and avoiding credit risk. Market risk can be defined as the sensitivity of the portfolio’s market value to changes in the level of interest rates, and is managed, primarily, by investing in securities with shorter durations. A security with a shorter duration is preferred to one with a longer duration in a rising rate environment because the market value of a security with a longer duration has a greater sensitivity to changes in interest rates.
Security selection is governed by the Company’s investment policy, and serves to supplement the Company’s asset/liability position. Securities such as premium fixed rate MBS and hybrid adjustable rate MBS with an anticipated short average life were purchased during the past year with the intention of managing cash flow, as well as limiting the sensitivity of the portfolio’s market value. In addition to targeting a short average life, the securities purchased provide incremental yield due to the continuing prepayment activity inherent in MBS and the tendency for yields on callable bonds to be higher than those on non-callable securities because the investor must be rewarded for taking the risk the issuer will call the bond. Cash flow from the portfolio increases in a lower interest rate environment and moderately extends in a higher interest rate environment. Our strategy for this portfolio, with a continuing emphasis on liquidity and risk management, is expected to continue for the foreseeable future.
The Company’s investment portfolio has relatively low credit risk due to its concentration of MBS issued by U.S. Government-sponsored enterprises. The Company’s investment portfolio decreased by $32 million at year-end 2010 versus the comparable 2009 date primarily as the result of MBS sales in the third and fourth quarters of 2010 along with faster prepayments on MBS cash flows throughout the year. There was also a decrease in the municipal portfolio in 2010 as compared to 2009 due to the sale of these bonds during the second and third quarters of 2010.
In 2010 the Company purchased $22 million in corporate bonds. These bonds are issued by large financial holding companies. Management determined that the yield on these bonds justified the marginal increase in credit risk. The decision was also predicated on slow growth in the loan portfolio and, thus some excess capacity for credit risk in the balance sheet. These bonds are classified as held to maturity.
As of December 31, 2010, the MBS portfolio, including collateralized mortgage obligations (CMOs), had an estimated weighted average life of approximately 2.4 years after adjusting for historical prepayment patterns. Approximately 93% of the MBS portfolio had final maturities in excess of ten years. In general, principal prepayments on these securities will slow as interest rates rise and, conversely, prepayments will increase as interest rates fall. However, the turmoil being experienced in the mortgage industry has interrupted the historical relationship between low rates and prepayments. The recent comparative lack of liquidity in the market has constrained the amount of funds available to fund new mortgages. The Company received MBS principal paydowns of $75 million and $96 million in 2010 and 2009, respectively.
The U.S. Government agency portfolio has remaining final maturities ranging from five years to fifteen years. The notes are AAA - rated credits that provide a competitive yield. During 2010, the Company purchased callable bonds that have adjustable rates ranging throughout their maturities, also known as step-up securities. The U.S. Government agency issues that are callable have call periods ranging from one year to fifteen years. As a natural outgrowth of its municipal business, the Company purchases local, short-term municipal paper that is also sold throughout the year as part of the Company’s asset/liability management strategy.
MBS, U.S. Government agency and local municipal securities portfolios are eligible to pledge to secure municipal deposits and other borrowings and, therefore, are an integral part of the Company’s funding strategy.
There is no subprime exposure in the Company’s securities portfolio. All of the mortgage-backed securities and collateralized mortgage obligations held in the Company’s portfolio are issued by U.S. Government agency and sponsored enterprises.
In the first quarter of 2009, a $4.0 million OTTI charge was recorded on one $10 million par value trust preferred CDO that had previously incurred a non-cash OTTI write down of $5.2 million in the fourth quarter of 2008. Management determined that it intended to sell this bond and continued to review developments and other considerations with respect to this trust preferred CDO, including the limited prospects for its ultimate price recovery, the expected time involved and the downside risks involved in continuing to hold this investment. As a result of this review and with some limited liquidity appearing in the trust preferred CDO market, management determined that an immediate liquidation was appropriate. As a result, the bond was liquidated in July 2009 at a price of 13.45% of par representing a gain of 5.2% of par or $520 thousand which was recognized in the Company’s third quarter 2009 financial statements.
Summary of Loan Loss Experience and Allowance for Loan Losses
41
One of management’s primary objectives is to maintain a high-quality loan portfolio in all economic climates. We maintain high underwriting standards coupled with a regular evaluation of each borrower’s creditworthiness and risk exposure. Management seeks to avoid concentrations within industries and customer segments in order to minimize credit exposure. The Company’s senior lending personnel work in conjunction with loan officers to determine the level of risk in the Company’s loan-related assets and establish an adequate level for the allowance for loan losses. The Company utilizes an outside loan review organization to independently verify the loan classifications and the adequacy of the allowance for loan losses. Management actively seeks to reduce the level of non-performing assets, defined as non-accrual loans, loans 90 days or more past due and still accruing interest and other real estate owned (“OREO”), through aggressive sale, collection and workout efforts and, where necessary, litigation and charge-off.
As illustrated in Table I below, the Company’s non-accrual loans totaled $15 million at December 31, 2010 (none of which were designated held for sale), $7 million (which includes less than $1 million in loans held for sale which have been previously written down to their estimated fair value) at December 31, 2009 and $16 million (which includes $2 million in loans held for sale) at December 31, 2008. The $8 million increase in non-accrual loans at December 31, 2010 compared to December 31, 2009 resulted primarily from several previously classified commercial and industrial loans that became 90 days or more delinquent and were placed on non-accrual status largely during the third and fourth quarters of 2010. At December 31, 2010, December 31, 2009 and December 31, 2008 the Company held no OREO. At December 31, 2010 there were two commercial loans with an aggregate principal balance of $20 million, one commercial real estate loan with a principal balance of $7 million, one residential real estate loan with a principal balance of $427 thousand and one consumer loan with a principal balance of $16 thousand that were restructured and still accruing interest. At December 31, 2009, there was one loan, a residential real estate loan with a principal balance of $436 thousand, restructured and still accruing interest. At December 31, 2008 there were no restructured loans still accruing interest. At December 31, 2010, 2009 and 2008, loans 90 days or more past due and still accruing interest totaled $1 thousand, $4 million and $3 thousand, respectively. The Company has no foreign loans outstanding.
|
|
|
|
|
|
|
|
|
|
|
|
|
|
|
|
|
|
|
TABLE I |
|
Analysis of Non-Performing Assets at December 31, |
|
|||||||||||||
|
|
|
|
|
|
|
|
|
|
|
|
|
|||||
|
(Dollars in thousands) |
|
2010 |
|
2009 |
|
2008 |
|
2007 |
|
2006 |
|
|||||
|
|
|
|
|
|
|
|
|
|
|
|
|
|||||
|
Non-accrual loans (1) |
|
$ |
14,856 |
|
$ |
6,063 |
|
$ |
13,970 |
|
$ |
5,792 |
|
$ |
2,177 |
|
|
Non-accrual loans held for sale |
|
|
— |
|
|
670 |
|
|
2,102 |
|
|
— |
|
|
— |
|
|
Loans 90 days or more past due and still accruing interest (1) |
|
|
1 |
|
|
3,800 |
|
|
3 |
|
|
28 |
|
|
13 |
|
|
|
|
|
|
|
|
|
|
|
|
|
|
|
|
|
|
|
|
Total non-performing loans |
|
|
14,857 |
|
|
10,533 |
|
|
16,075 |
|
|
5,820 |
|
|
2,190 |
|
|
|
|
|
|
|
|
|
|
|
|
|
|
|
|
|
|
|
|
Other real estate |
|
|
— |
|
|
— |
|
|
— |
|
|
— |
|
|
— |
|
|
|
|
|
|
|
|
|
|
|
|
|
|
|
|
|
|
|
|
Total non-performing assets |
|
$ |
14,857 |
|
$ |
10,533 |
|
$ |
16,075 |
|
$ |
5,820 |
|
$ |
2,190 |
|
|
|
|
|
|
|
|
|
|
|
|
|
|
|
|
|
|
|
|
Restructured accruing loans |
|
$ |
26,944 |
|
$ |
436 |
|
$ |
— |
|
$ |
— |
|
$ |
— |
|
|
Gross loans outstanding (1) |
|
$ |
1,131,370 |
|
$ |
1,097,635 |
|
$ |
1,117,216 |
|
$ |
1,041,009 |
|
$ |
983,725 |
|
|
Loans held for sale |
|
$ |
— |
|
$ |
670 |
|
$ |
5,322 |
|
$ |
— |
|
$ |
— |
|
|
Allowance for loan losses |
|
$ |
33,078 |
|
$ |
28,711 |
|
$ |
18,668 |
|
$ |
14,705 |
|
$ |
16,412 |
|
|
Key ratios: |
|
|
|
|
|
|
|
|
|
|
|
|
|
|
|
|
|
Allowance for loan losses as a percent of total loans (1) |
|
|
2.9 |
% |
|
2.6 |
% |
|
1.7 |
% |
|
1.4 |
% |
|
1.7 |
% |
|
Non-accrual loans as a percent of total loans |
|
|
1.3 |
% |
|
0.6 |
% |
|
1.4 |
% |
|
0.6 |
% |
|
0.2 |
% |
|
Non-performing assets as a percent of total loans and other real estate |
|
|
1.3 |
% |
|
1.0 |
% |
|
1.4 |
% |
|
0.6 |
% |
|
0.2 |
% |
|
Allowance for loan losses as a percent of non-accrual loans (1) |
|
|
223 |
% |
|
474 |
% |
|
134 |
% |
|
254 |
% |
|
754 |
% |
|
Allowance for loan losses as a percent of non-accrual loans, and loans 90 days or more past due and still accruing interest (1) |
|
|
223 |
% |
|
291 |
% |
|
134 |
% |
|
253 |
% |
|
749 |
% |
(1) Excluding loans held for sale.
42
The provision for loan losses is based on management’s continual assessment of the adequacy of the allowance for loan losses. The provision for loan losses totaled $12.9 million in 2010 as compared to $39.5 million in 2009. The allowance for loan losses amounted to $33 million or 2.9% of total loans at December 31, 2010 as compared to $29 million or 2.6% of total loans, excluding loans held for sale, at December 31, 2009. The increase in the allowance in total dollars and as a percentage of the total loan portfolio at December 31, 2010 compared to December 31, 2009 reflects an increase in watch list loans in 2010. Loans held for sale in 2009 were previously written down to their estimated fair value. There were no loans held for sale at December 31, 2010. The allowance for loan losses as a percentage of non-accrual loans, excluding loans held for sale at December 31, 2009, decreased to 223% at December 31, 2010 from 474% at December 31, 2009, caused primarily by the increase in non-accrual loans at year-end 2010. Net loan charge-offs recorded in 2010 were $8.5 million compared to $29.5 million in 2009.
The provision for loan losses totaled $17.2 million in 2008. The allowance for loan losses amounted to $19 million or 1.7% of total loans, excluding loans held for sale, at December 31, 2008. The allowance for loan losses as a percentage of non-accrual loans, excluding loans held for sale, was 134% at December 31, 2008. Net loan charge-offs recorded in 2008 were $11.3 million. The increases in the allowance as a percentage of the total loan portfolio at December 31, 2009 compared to December 31, 2008 was due to increases in the provision for loan losses related to an increase in watch list loans and charge-offs for the liquidation of problem loans in 2009. The increased allowance for loan losses as a percentage of non-accrual loans, excluding loans held for sale, was caused primarily by the decrease in non-accrual loans at year-end 2009 and the increased provision for loan losses as previously noted.
|
|
|
|
|
|
|
|
|
TOTAL NON-ACCRUAL LOANS (1) AND THE ALLOWANCE |
|
|
|
|
|
FOR LOAN LOSSES |
|
|
|
|
|
|
|
|
|
|
|
|
|
|
|
|
|
|
|
|
|
|
|
(1) Excluding loans held for sale. |
|
|
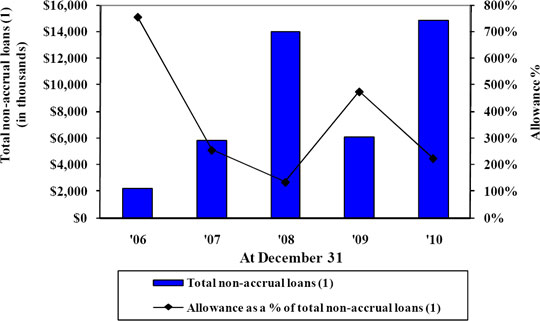
Management continues to be focused on the timely identification of potential problem loans and the assigning of them to our watch list. At December 31, 2010, the Bank had 110 relationships on its watch list totaling $166 million as compared to 84 relationships and $143 million at December 31, 2009. Included in these watch list totals at December 31, 2010 are 35 relationships with a total amount outstanding per relationship of at least $1 million and an aggregate amount outstanding of $147 million. At December 31, 2009, there were 28 such
43
relationships totaling $126 million in aggregate. For the reported periods, those relationships with a total amount outstanding per relationship of at least $1 million are primarily commercial real estate in nature.
Watch list loans consist of criticized loans, classified loans, and those loans requiring special attention but not warranting categorization as either criticized or classified. Criticized loans, i.e. special mention loans, have potential weaknesses, often temporary in nature, requiring management’s extra vigilance. Classified loans, i.e. substandard, doubtful and loss loans, exhibit more serious weaknesses and generally carry a higher risk of loss. Such loans require more intensive oversight, remediation plans and, if problems remain unresolved, a workout strategy is developed.
The majority of watch list loans were originated as residential construction, commercial real estate or commercial and industrial loans. In some cases, additional collateral in the form of commercial real estate was taken based on current valuations. Thus, there exists a broad base of collateral with a mix of various types of corporate assets including inventory, receivables and equipment, and commercial real estate, with no particular concentration in any one type of collateral.
Watch List Summary by Category (1)
|
|
|
|
|
|
|
|
|
|
|
|
December 31, 2010 |
|
December 31, 2009 |
|
||
|
|
|
|
|
|
|
||
|
Loans requiring special attention but neither criticized nor classified |
|
$ |
42 million |
|
$ |
20 million |
|
|
|
|
|
|
|
|
|
|
|
Criticized loans (special mention) |
|
$ |
55 million |
|
$ |
42 million |
|
|
|
|
|
|
|
|
|
|
|
Classified loans (substandard, doubtful and loss) |
|
$ |
69 million |
|
$ |
81 million |
|
|
|
|
|
|
|
|
|
|
|
|
|
|
|
|
|
|
|
|
Total |
|
$ |
166 million |
|
$ |
143 million |
|
|
|
|
|
|
|
|
|
|
|
|
|
(1) Excluding loans held for sale. |
As a result of management’s ongoing review and assessment of the Bank’s policies and procedures, the Company has pursued an aggressive workout and disposition posture for potential problem loan relationships over the past few years. The Company has workout specialists who are directly responsible for managing this process and exiting such relationships in an expedited and cost effective manner. Line officers generally do not maintain control over problem loan relationships. It is anticipated that management will continue to use a variety of strategies, depending on individual case circumstances, to exit relationships where the fundamental credit quality shows indications of more than temporary or seasonal deterioration. We cannot give any assurance that such strategies will enable us to exit such relationships especially in light of current credit market conditions. Accordingly, it is possible that some or all of the potential problem loans may, at some point in the future, warrant being placed on non-accrual status, which may result in additional provisions for loan losses.
Management has determined that the current level of the allowance for loan losses is adequate in relation to the probable inherent losses present in the portfolio. Management considers many factors in this analysis, among them credit risk grades assigned to commercial and industrial and commercial real estate loans, delinquency trends, concentrations within segments of the loan portfolio, recent charge-off experience, local and national economic conditions, current real estate market conditions in geographic areas where the Company’s loans are located, changes in the trend of non-performing loans, changes in interest rates and loan portfolio growth. Changes in one or a combination of these factors may adversely affect the Company’s loan portfolio resulting in increased delinquencies, loan losses and future levels of loan loss provisions. Due to these uncertainties, management expects to record loan charge-offs in future periods. (See also “Critical Accounting Policies, Judgments and Estimates.”)
44
The provision for loan losses is evaluated relative to portfolio risk and regulatory guidelines considering all economic factors that affect the loan loss allowance, such as fluctuations in the Long Island and New York City real estate markets and interest rates, economic slowdowns and other uncertainties. All of the factors mentioned above will continue to be closely monitored.
Other Income
2010 versus 2009
Other income increased by $6.7 million in 2010 when compared to 2009, largely as a result of a $4.0 million decrease in non-cash OTTI charges in 2009 versus no such charges in 2010, a $2.5 million increase in net gains on the sale of securities and a $440 thousand increase in income from bank owned life insurance (“BOLI”). BOLI income in 2010 includes a $701 thousand insurance benefit payment which is a receivable from the insurance provider at December 31, 2010. Partially offsetting these improvements was a decline in overdraft and other deposit service charge income of $316 thousand in 2010 versus 2009 due to fewer opportunities to assess those types of charges.
2009 versus 2008
Other income increased by $1.1 million in 2009 when compared to 2008, largely as a result of a $2.2 million reduction in non-cash OTTI charges coupled with a $946 thousand increase in net gains on the sales of securities in 2009. Partially offsetting these improvements was a decrease in other operating income of $1.8 million, due to income of $1.1 million recorded on certain customer interest rate swaps in 2008 versus losses of $38 thousand recorded in 2009 coupled with reductions in sweep program fees of $634 thousand. In 2008, the Company recorded a gain of $1.1 million related to the change in value of the customer swaps that were formerly offset with Lehman Special Financing (see “Off-Balance Sheet Arrangements”). Also offsetting the aforementioned improvements, in part, was lower income from bank owned life insurance of $197 thousand in 2009 versus 2008.
Operating Expenses
2010 versus 2009
Total operating expenses decreased by $6.5 million to $42.0 million in 2010 versus 2009. This decrease resulted primarily from a $4.4 million decline in credit and collection expenses, a $1.4 million reduction in other operating expenses and a $942 thousand decrease in FDIC and NYS assessment expenses. Also contributing to the decrease were reductions in legal expenses of $403 thousand, occupancy expenses of $371 thousand and equipment expenses of $61 thousand. These improvements in operating expenses were partially offset by higher marketing and advertising expenses of $793 thousand and salaries and other employee benefits of $333 thousand.
The Company’s primary expense control measure is the operating efficiency ratio. The operating efficiency ratios for the Company were 60.0% in 2010 and 72.4% in 2009. The decrease in 2010 was due to a reduction in operating expenses due largely to $4.0 million in write-downs of loans held for sale in 2009 to their estimated fair value coupled with a higher level of operating revenue in 2010. Management expects that the Company’s operating efficiency ratio will remain stable in 2011 as a result of projected nominal increases in both operating revenue and operating expenses.
45
|
|
|
|
|
|
|
|
|
|
|
|
|
OPERATING EXPENSES OF STATE BANCORP, INC. |
|
|
|
|
|
|
|
|
|
|
|
(dollars in thousands) |
|
|
|
|
|
|
|
Over/ |
|
|
|
For the years ended December 31, |
|
2010 |
|
2009 |
|
2009 |
|
|||
|
|
|
|
|
|
|
|
||||
|
Salaries and other employee benefits |
|
$ |
23,706 |
|
$ |
23,373 |
|
|
1 |
% |
|
Occupancy |
|
|
5,525 |
|
|
5,896 |
|
|
(6 |
)% |
|
Equipment |
|
|
1,164 |
|
|
1,225 |
|
|
(5 |
)% |
|
Legal |
|
|
381 |
|
|
784 |
|
|
(51 |
)% |
|
Marketing and advertising |
|
|
1,568 |
|
|
775 |
|
|
102 |
% |
|
FDIC and NYS assessment |
|
|
2,686 |
|
|
3,628 |
|
|
(26 |
)% |
|
Credit and collection |
|
|
784 |
|
|
5,193 |
|
|
(85 |
)% |
|
Other operating expenses |
|
|
6,210 |
|
|
7,629 |
|
|
(19 |
)% |
|
|
|
|
|
|
|
|
|
|
|
|
|
Total operating expenses |
|
$ |
42,024 |
|
$ |
48,503 |
|
|
(13 |
)% |
|
|
|
|
|
|
|
|
|
|
|
|
As noted in the table above, salaries and other employee benefits increased by $333 thousand or 1.4% to $23.7 million. The increase is due primarily to higher expenses for salaries, long-term equity compensation and employee insurance offset, in part, by lower ESOP contribution expenses.
Occupancy costs decreased by $371 thousand or 6.3% to $5.5 million in 2010 as the result of lower expenses for rent and building maintenance.
Equipment expenses decreased by $61 thousand to $1.2 million or 5.0% in 2010 as compared to 2009. The decline in equipment expenses is due primarily to a reduction in equipment maintenance costs in 2010 versus 2009.
Legal expenses decreased by $403 thousand or 51.4% to $381 thousand in 2010 due primarily to the special shareholder’s meeting, senior unsecured debt issuance and loan sales during 2009.
Marketing and advertising costs increased by $793 thousand or 102.3% to $1.6 million in 2010 versus 2009 due primarily to the Company’s expanded corporate advertising and brand building initiatives.
FDIC and NYS assessment expenses decreased by $942 thousand or 26.0% to $2.7 million in 2010 compared to 2009 due mostly to the FDIC special assessment of $730 thousand recorded in the second quarter of 2009.
Credit and collection expenses decreased by $4.4 million or 84.9% to $784 thousand during 2010. The decrease resulted primarily from $4.0 million in write-downs of loans held for sale in 2009 to their estimated fair value.
Other operating expenses decreased by $1.4 million or 18.6% to $6.2 million in 2010 versus 2009. This reduction resulted primarily from $740 thousand in expenses in the fourth quarter of 2009 related to the debt for equity exchange. Also contributing to the decrease was a decline in audit costs due mainly to the discontinuance in 2010 of internal audit services that had been outsourced in 2009. Internal audits are now performed by the Company’s internal audit staff.
2009 versus 2008
Salaries and other employee benefits increased by $493 thousand or 2.2% to $23.4 million. The increase is due principally to higher expenses for long-term equity and incentive-based compensation offset, in part, by lower ESOP and 401(k) contribution expenses.
Legal expenses decreased by $2.3 million or 74.8% to $784 thousand in 2009 due primarily to the settlement of the shareholder derivative lawsuit in 2008.
FDIC and NYS assessment expenses increased by $2.8 million to $3.6 million in 2009 versus 2008 as a result of higher FDIC insurance premiums, additional deposit programs and the FDIC special assessment of $730 thousand recorded in the second quarter of 2009.
46
Credit and collection expenses increased by $4.1 million to $5.2 million during 2009. The increase is due primarily to $4.0 million in write-downs of loans held for sale in 2009 to their estimated fair value.
Effective Income Tax Rate
2010 versus 2009 and 2008
An income tax provision of $6.6 million was recorded in 2010 as compared to an income tax benefit of $9.6 million in 2009 and an income tax provision of $451 thousand in 2008. The Company’s overall effective tax rate was 36.5%, (39.3)% and 20.0% in 2010, 2009 and 2008, respectively. Pretax income or pretax loss is adjusted for permanent items such as BOLI and other tax-exempt interest and ESOP dividends. The change in the 2010 effective tax rate was primary due to the Company generating pretax income of $18 million compared to a 2009 pretax loss of $24 million. Furthermore, tax exempt income increased largely due to an insurance benefit payment related to life insurance proceeds offset by a reduction in the BOLI crediting rate and maturity of tax-exempt municipal securities.
The Company is currently subject to a statutory incremental Federal tax rate of 35% (34% for the first $10 million of taxable income), a combined New York State (NYS) tax rate of 8.63% and a New York City tax rate of 9% on allocated entire net income. Because of net operating loss carryforwards, the Company pays a Federal alternative minimum tax and a minimum asset tax to NYS.
Off-Balance Sheet Arrangements
The Bank is a party to financial instruments with off-balance sheet risk in the normal course of business to meet the financing needs of its customers. These financial instruments include commitments to extend credit and standby and documentary letters of credit. Those instruments involve, to varying degrees, elements of credit risk in excess of the amount recognized in the consolidated financial statements. The Bank uses the same credit policies in making commitments and conditional obligations as it does for on-balance sheet instruments.
Commitments to extend credit are agreements to lend to a customer as long as there is no violation of any condition established in the contract. Commitments generally have fixed expiration dates or other termination clauses and may require payment of a fee. Since many of the commitments are expected to expire without being drawn upon, the total commitment amounts do not necessarily represent future cash requirements. The Bank evaluates each customer’s creditworthiness on a case-by-case basis. The amount of collateral obtained, if deemed necessary by the Bank upon extension of credit, is based on management’s credit evaluation of the customer. Collateral required varies, but may include accounts receivable, inventory, equipment, real estate and income-producing commercial properties. At December 31, 2010 and 2009, commitments to originate loans and commitments under unused lines of credit for which the Bank is obligated amounted to $219 million and $232 million, respectively. Of these commitments, $192 million and $195 million were at variable rates and $27 million and $37 million were at fixed rates, including LIBOR-based loans, at December 31, 2010 and 2009, respectively. At December 31, 2010 and 2009, the fixed rate commitments had interest rates ranging from 2.38% to 7.00% and 2.30% to 7.23%, respectively.
Letters of credit are conditional commitments guaranteeing payments of drafts in accordance with the terms of the letter of credit agreements. Commercial letters of credit are used primarily to facilitate trade or commerce and are also issued to support public and private borrowing arrangements, bond financing and similar transactions. Collateral may be required to support letters of credit based upon management’s evaluation of the creditworthiness of each customer. The credit risk involved in issuing letters of credit is essentially the same as that involved in extending loan facilities to customers. Most letters of credit expire within one year. At December 31, 2010 and 2009, the Bank had letters of credit outstanding of approximately $14 million and $15 million, respectively. At December 31, 2010 and 2009, the uncollateralized portion was approximately $2 million and $3 million, respectively.
The use of derivative financial instruments, i.e. interest rate swaps, is an exposure to credit risk. This credit exposure relates to possible losses that would be recognized if the counterparties fail to perform their obligations under the contracts. To mitigate this credit exposure, only counterparties of substantial credit standing are utilized and the exchange of collateral over a certain credit threshold is required. From time to time, the Bank may execute customer interest rate swap transactions together with offsetting interest rate swap transactions with institutional dealers. Each swap is mutually exclusive, and the swaps are marked to fair value with changes in fair value recognized as other income, with the fair value for each individual swap with the institutional dealer largely offsetting the corresponding swap with the Bank’s customer. Net credit valuation adjustments (“CVA”) are recorded as a reduction to other income. The CVA represents the consideration of credit risk of the counterparties to a transaction and the effect of any credit enhancements related to the transaction. At December 31, 2010 and 2009, the total gross notional amount of swap transactions outstanding was $35 million and $37 million, respectively.
47
In 2008 Lehman and Lehman Special Financing filed Voluntary Petitions under Chapter 11 of the U.S. Bankruptcy Code, each of which constituted an event of default under the swap agreements the Bank had with Lehman Special Financing. As a result of the events of default, the Bank terminated the interest rate swap agreements with Lehman Special Financing. The terminations resulted in several customer interest rate swap transactions no longer being offset by that institutional dealer and a loss to the Company on those swap agreements of approximately $584 thousand was recorded in the third quarter of 2008. During the third quarter of 2009, the Company recorded a gain of $221 thousand on the sale to a third party of its claims against Lehman and Lehman Special Financing.
During the second and third quarters of 2009, the unhedged customer interest rate swap transactions were once again offset by an institutional dealer. For the years ended December 31, 2010 and 2009, net losses of $50 thousand and $38 thousand, respectively, were recognized. In 2010 the losses were related to changes in the value of certain swaps due to a deterioration in the credit quality of the Bank’s counterparties. The 2009 amount includes the gain of $221 thousand on the sale of the Bank’s claims against Lehman and Lehman Special Financing. For the year ended December 31, 2008, a net gain of $1.1 million related to the change in value of the customer swaps that were formerly offset with Lehman Special Financing was recognized.
The Company is also obligated under various leases covering certain equipment, branches, office space and the land on which its head office is built. The minimum payments under these leases, certain of which contain escalation clauses, are as follows: in 2011, $3.1 million; in 2012, $1.8 million; in 2013, $1.4 million; in 2014, $1.5 million; in 2015, $1.3 million; and the remainder to 2023, $4.5 million.
|
|
|
|
|
Contractual Obligations |
|
|
|
|
|
Shown below are the amounts of payments due under specified contractual obligations, aggregated by category of contractual obligation, for specified time periods. All information is as of December 31, 2010. |
|
|
|
|
|
|
|
|
|
|
|
|
|
|
|
|
|
|
|
|
|
Payments due by period (in thousands) |
|
|||||||||||||
|
|
|
|
|
|||||||||||||
|
Contractual Obligations |
|
Total |
|
Less than |
|
1-3 years |
|
3-5 years |
|
More than |
|
|||||
|
|
|
|
|
|
|
|
|
|
|
|
|
|||||
|
Leases covering various equipment, branches, office space and land |
|
$ |
13,603 |
|
$ |
3,066 |
|
$ |
3,252 |
|
$ |
2,803 |
|
$ |
4,482 |
|
|
Time deposits |
|
|
372,979 |
|
|
298,349 |
|
|
51,989 |
|
|
22,641 |
|
|
— |
|
|
FHLB borrowings |
|
|
22,000 |
|
|
22,000 |
|
|
— |
|
|
— |
|
|
— |
|
|
Securities sold under agreements to repurchase |
|
|
3,000 |
|
|
1,000 |
|
|
— |
|
|
2,000 |
|
|
— |
|
|
Senior unsecured debt |
|
|
29,000 |
|
|
— |
|
|
29,000 |
|
|
— |
|
|
— |
|
|
Junior subordinated debentures |
|
|
20,620 |
|
|
— |
|
|
— |
|
|
— |
|
|
20,620 |
|
|
|
|
|
|
|
|
|
|
|
|
|
|
|
|
|
|
|
|
Total |
|
$ |
461,202 |
|
$ |
324,415 |
|
$ |
84,241 |
|
$ |
27,444 |
|
$ |
25,102 |
|
|
|
|
|
|
|
|
|
|
|
|
|
|
|
|
|
|
|
Capital Resources
The Company strives to maintain an efficient level of capital, commensurate with its risk profile, on which a competitive rate of return to stockholders will be realized over both the short and long term. Capital is managed to enhance stockholder value while providing flexibility for management to act opportunistically in a changing marketplace. In determining an optimal capital level the Company also considers the capital levels of its peers and the evaluations of its primary regulators. Management continually evaluates the Company’s capital position in light of current and future growth objectives and regulatory guidelines.
Total stockholders’ equity amounted to $155 million at December 31, 2010 and $149 million at December 31, 2009, largely reflecting the net income, the reissuance of treasury shares used to fund the Company’s ESOP contribution, and the issuance of restricted stock for the year ended December 31, 2010. Offsetting the equity increases in 2010 were common and preferred dividends paid and a decrease in other comprehensive income. Internal capital generation, defined as earnings less cash dividends paid on common and preferred stock, is the primary catalyst expected to support the Company’s future growth of assets and stockholder value. Management continually evaluates the Company’s capital position in light of current and future growth objectives and regulatory guidelines.
48
On December 5, 2008, the Company issued to the Treasury for aggregate consideration of $36.8 million (i) 36,842 shares of Series A Preferred Stock and (ii) Warrant to purchase 465,569 shares of the Company’s common stock at $11.87 per share. Such securities were issued pursuant to a letter agreement dated December 5, 2008 and the Securities Purchase Agreement – Standard Terms (“Securities Purchase Agreement”) attached thereto between the Company and the Treasury. This increase in capital has allowed the Company to reinforce its commitment to serve the credit needs of our clients and the communities in which we operate. The Company contributed $34 million of this capital to its Bank subsidiary in December 2008.
As a participant in the Treasury CPP, the Company is subject to certain restrictions regarding dividend payments, stock repurchases and executive compensation. The Treasury’s consent is required for any increase in common dividends per share that is greater than the amount of the last quarterly cash dividend declared prior to October 14, 2008, and any repurchases of common stock until the earlier of a redemption or December 5, 2011. Furthermore, the ARRA prohibits the payment or accrual of any bonus, retention award or incentive compensation to, in the Company’s case, the five (5) most highly-compensated employees. This prohibition does not apply to the granting of restricted stock, provided that the stock does not fully vest during the time the Treasury owns any debt or equity acquired under the CPP (unless the only securities outstanding are warrants acquired under the CPP) and the amount of restricted stock granted does not have a value greater than one-third of the total annual compensation of the recipient. The ARRA also prohibits the payment of any severance or payment to any named executive officer (“NEO”) or any of the next five (5) most highly-compensated employees for departure from the Company for any reason except for payments relating to services already performed or benefits previously accrued. In addition, under ARRA, any bonus payment made to the twenty (20) most highly compensated employees of the Company is subject to recovery by the Company if the bonus payment was based on materially inaccurate financial statements or any other materially inaccurate performance metric criteria. On June 15, 2009, the Treasury issued an Interim Final Rule to provide guidance on the executive compensation provisions under ARRA. The Interim Final Rule clarified that any payments made in connection with a change in control of the Company will be prohibited golden parachute payments. Under the Interim Final Rule, a golden parachute payment is treated as paid at the time of departure or change in control and may include a right to amounts actually payable after the TARP period. In addition, the Interim Final Rule clarifies that in addition to payments for services performed or benefits accrued, (i) payments under tax-qualified retirement plans, (ii) payments made due to the employee’s death or disability and (iii) severance or similar payments required to be made pursuant to a state statute or foreign law are excluded from prohibited payments. The Treasury has the ability to make unilateral, retroactive changes to the Securities Purchase Agreement which governs the sale of the Series A Preferred Stock to the Treasury.
The Series A Preferred Stock qualifies as Tier 1 capital for bank regulatory purposes and pays cumulative dividends at a rate of 5% per annum for the first five years, and 9% per annum thereafter. Subject to the approval by the Treasury and the Company’s federal regulator, the Company may repay any assistance provided under TARP without regard to whether the Company has replaced such funds from any other source or to any waiting period. The Series A Preferred Stock is generally non-voting.
The Warrant has a 10-year term and is immediately exercisable at an exercise price equal to $11.87 per share of the common stock. The Warrant provides for the adjustment of the exercise price and the number of shares of the Company’s common stock issuable upon exercise pursuant to customary anti-dilution provisions, such as upon stock splits or distributions of securities or other assets to holders of the Company’s common stock, and upon certain issuances of the Company’s common stock at or below a specified price relative to the initial exercise price.
The Company’s tangible common equity to tangible assets ratio was 7.39% at December 31, 2010 compared to 6.93% at December 31, 2009. The ratio of tangible common equity to tangible assets, or TCE ratio, is calculated by dividing total common stockholders’ equity by total assets, after reducing both amounts by intangible assets. The TCE ratio is not required by GAAP or by applicable bank regulatory requirements, but is a metric used by management to evaluate the adequacy of our capital levels. Since there is no authoritative requirement to calculate the TCE ratio, our TCE ratio is not necessarily comparable to similar capital measures disclosed or used by other companies in the financial services industry. Tangible common equity and tangible assets are non-GAAP financial measures and should be considered in addition to, not as a substitute for or superior to, financial measures determined in accordance with GAAP. Set forth below is the calculation of the actual unaudited TCE ratio as of December 31, 2010, reconciliations of tangible common equity to GAAP total common stockholders’ equity and tangible assets to GAAP total assets (in thousands):
49
|
|
|
|
|
|
|
Total stockholders’ equity |
|
$ |
154,852 |
|
|
Less: preferred stock |
|
|
(36,245 |
) |
|
Less: warrant |
|
|
(1,057 |
) |
|
|
|
|
|
|
|
Total common stockholders’ equity |
|
|
117,550 |
|
|
Less: intangible assets |
|
|
— |
|
|
|
|
|
|
|
|
Tangible common equity |
|
$ |
117,550 |
|
|
|
|
|
|
|
|
|
|
|
|
|
|
Total assets |
|
$ |
1,589,979 |
|
|
Less: intangible assets |
|
|
— |
|
|
|
|
|
|
|
|
Tangible assets |
|
$ |
1,589,979 |
|
|
|
|
|
|
|
The Company and the Bank are subject to various regulatory capital requirements administered by the FRB and the FDIC. Table II summarizes the Company’s and the Bank’s capital ratios as of December 31, 2010 and compares them to minimum regulatory guidelines and December 31, 2009 and December 31, 2008 actual results. The Company’s ratios exceed the minimum regulatory guidelines, and the Bank’s ratios exceed both the minimum regulatory guidelines for a well-capitalized institution and the minimum requirements under FDICIA. Failure to meet minimum capital requirements can initiate certain actions by regulators that could have a direct effect on the Company’s and the Bank’s operations and financial statements. See “Supervision and Regulation.”
TABLE II
|
|
|
|
|
|
|
|
|
|
|
|
|
|
|
||||||||
|
|
|
Regulatory |
|
The Company’s Ratios as of December 31, |
|
||||||||||||||||
|
|
|
|
|
|
|||||||||||||||||
|
|
|
|
2010 |
|
2009 |
|
2008 |
|
|||||||||||||
|
|
|
|
|
|
|
|
|
|
|
||||||||||||
|
Tier I Leverage |
|
|
3.00 - 4.00 |
% |
|
9.53 |
% |
|
8.68 |
% |
|
9.38 |
% |
||||||||
|
Tier I Capital/Risk-Weighted Assets |
|
|
4.00 |
% |
|
12.29 |
% |
|
11.26 |
% |
|
12.03 |
% |
||||||||
|
Total Capital/Risk-Weighted Assets |
|
|
8.00 |
% |
|
13.55 |
% |
|
12.52 |
% |
|
14.07 |
% |
||||||||
|
|
|
|
|
|
|
|
|
|
|
|
|
|
|
|
|
|
|
|
|
|
|
|
|
Regulatory |
|
|||||||||
|
|
|
|
|
The Bank’s Ratios as of December 31, |
|
|
||||||||||
|
|
|
Regulatory |
|
|
|
|
||||||||||
|
|
|
|
2010 |
|
2009 |
|
2008 |
|
|
|||||||
|
|
|
|
|
|
|
|
|
|
|
|
|
|||||
|
Tier I Leverage |
|
|
3.00 - 5.00 |
% |
|
9.50 |
% |
|
8.46 |
% |
|
9.52 |
% |
|
5.00 |
% |
|
Tier I Capital/Risk-Weighted Assets |
|
|
4.00 |
% |
|
12.23 |
% |
|
10.98 |
% |
|
12.22 |
% |
|
6.00 |
% |
|
Total Capital/Risk-Weighted Assets |
|
|
8.00 |
% |
|
13.49 |
% |
|
12.24 |
% |
|
13.47 |
% |
|
10.00 |
% |
The Reform Act requires the federal bank regulatory agencies to establish consolidated risk-based and leverage capital requirements for insured depository institutions, depository institution holding companies and systemically important nonbank financial companies. These requirements must be no less than those to which insured depository institutions are currently subject. Thus, it is likely that we will become subject to capital requirements that are higher than those to which we are currently subject, although it is unknown at this time what these requirements will be. The new requirements will also eliminate the use of trust preferred securities issued after May 19, 2010 as a component of Tier 1 capital for depository institution holding companies of our size, although because we had less than $15 billion of consolidated assets as of December 31, 2009, we will continue to be permitted to include any trust preferred securities issued before May 19, 2010 as an element of Tier 1 capital.
Under New York Business corporation law, the Company can only pay dividends out of surplus or in case there is no surplus, out of its net profits for the fiscal year in which the dividend is declared and/or the preceding fiscal year. The dividends may be declared and paid by the Company at any time except when the Company is then insolvent or would thereby be made insolvent.
50
The Company’s (parent only) primary funding sources are dividends from the Bank and proceeds from the DRP. State banking regulations limit, absent regulatory approval, the Bank’s dividends to the Company to the lesser of the Bank’s undivided profits and the Bank’s retained net income for the current year plus its retained net income for the preceding two years (less any required transfers to capital surplus) up to the date of any dividend declaration in the current calendar year. As of December 31, 2010, no dividends were available to the Company from the Bank according to these limitations without seeking regulatory approval. Additionally, under the CPP the Company must receive consent from the Treasury in order to increase its dividend on common stock to an amount that is greater than the amount of the last quarterly cash dividend declared prior to October 14, 2008 which was the $0.10 per common share declared on July 29, 2008. The Company’s Board of Directors declared a cash dividend of $0.05 per share at its January 25, 2011 meeting. The cash dividend will be paid on March 17, 2011 to stockholders of record on February 16, 2011. During 2010, the Company declared $3.3 million in dividends and received $333 thousand from the reinvestment of dividends by stockholders participating in the Company’s DRP.
The Company did not repurchase any shares of its common stock during 2010 under the existing stock repurchase plan. Under the Company’s current stock repurchase authorization, management may repurchase up to 512,348 additional shares if market conditions warrant. This action will only occur if management believes that the purchase will be at prices that are accretive to earnings per share and is the most efficient use of Company capital. The Treasury’s consent is also required for any repurchases of common stock until the earlier of a redemption of the Series A Preferred Stock or December 5, 2011.
At the Company’s 2009 annual meeting of stockholders, the Company’s stockholders approved an amendment to the Company’s certificate of incorporation to change the par value of the common stock to $0.01 per share from $5.00 per share. If such amendment had not been approved, and if the Company had determined that it was in the best interests of the Company to raise capital through an offering of common stock, the Company’s capital raising options may have been limited to issuance of treasury stock or preferred stock unless the sale price of the common stock was at least $5.00 per share. The par value of the Company’s common stock was changed to $0.01 per share from $5.00 per share in the second quarter of 2009, resulting in both a decrease in common stock and an increase in surplus of $77 million.
The Company’s two unconsolidated Delaware trust subsidiaries currently have outstanding a total of $20 million in trust preferred securities which presently qualify as Tier I capital of the Company for regulatory capital purposes. The securities each bear an interest rate tied to three-month LIBOR and are each redeemable by the Company in whole or in part after five years. The Company has the right to optionally redeem the debentures of Trust I, which bear a coupon rate of three-month LIBOR plus 345 basis points, prior to the maturity date of November 7, 2032 at par. The Company has the right to optionally redeem the debentures of Trust II, which bear a coupon rate of three-month LIBOR plus 285 basis points, prior to the maturity date of January 23, 2034 at par. The weighted average cost of all trust preferred securities outstanding was 3.54% during 2010 and 4.12% during 2009. Under the CPP, the Company must get approval from the Treasury before it can redeem any capital securities. This requirement will remain in place as long as the Series A Preferred Stock is outstanding.
The Company’s DRP allows existing stockholders to reinvest cash dividends in Company stock and/or to purchase additional shares through optional cash investments on a quarterly basis at up to a 15% discount from the current market price. During 2010, 2009 and 2008, $333 thousand, $381 thousand and $3.0 million, respectively, were added to stockholders’ equity through plan participation in each year. Approximately 8% of the Company’s cash dividends were reinvested in 2010 under this plan, and since inception, approximately $26 million in additional equity has been added through plan participation. Management anticipates continued future growth in equity through the DRP although the rate will be slower due to the reduced cash dividend rate.
Liquidity
Liquidity management is defined as both the Company’s and the Bank’s ability to meet their financial obligations on a continuous basis without material loss or disruption of normal operations. These obligations include the withdrawal of deposits on demand or at their contractual maturity, the repayment of borrowings as they mature, funding new and existing loan commitments and the ability to take advantage of business opportunities as they arise. Asset liquidity is provided by short-term investments and the marketability of securities available for sale. The Company may also leave excess reserve balances at the FRB if the rate being paid is higher than would be available from other short-term investments. Liquid assets declined to $368 million at December 31, 2010 from $419 million at December 31, 2009, resulting largely from a reduction of securities in the bond portfolio. Liquidity is also provided by the maintenance of a strong base of core deposits, maturing short-term assets including cash and due from banks, the ability to sell or pledge marketable assets and access to lines of credit and the capital markets.
Liquidity is measured and monitored daily, thereby allowing management to better understand and react to emerging balance sheet trends, including temporary mismatches with regard to sources and uses of funds. After assessing actual and projected cash flow needs,
51
management seeks to obtain funding at the most economical cost. These funds can be obtained by converting liquid assets to cash or by attracting new deposits or other sources of funding. Many factors affect the Company’s ability to meet liquidity needs, including variations in the markets served, loan demand, its asset/liability mix, its reputation and credit standing in its markets and general economic conditions. Borrowings and the scheduled amortization of investment securities and loans are more predictable funding sources, while non-maturity deposit flows and securities prepayments are somewhat less predictable in nature, as they are often subject to external factors beyond the control of management. Among these are changes in the local and national economies, competition from other financial institutions and changes in market interest rates.
The Company’s primary sources of funds are cash provided by deposits, proceeds from maturities and sales of securities available for sale, and cash provided by operating activities. At December 31, 2010, total deposits were $1.3 billion, a increase of $827 thousand from December 31, 2009. Of the Company’s total time deposits at December 31, 2010, $298 million are scheduled to mature within the next twelve months. Based on historical experience, the Company expects to be able to replace a substantial portion of those maturing deposits. During 2010 and 2009, proceeds from sales and maturities of securities available for sale totaled $286 million and $238 million, respectively. Additionally, in March 2009 the Bank issued $29 million in senior unsecured debt guaranteed by the FDIC under the TLGP. These funds mature in March 2012.
The Company’s primary uses of funds are for the origination of loans and the purchase of investment securities. For the years ended December 31, 2010 and 2009, the Company had an increase in loans (net of unearned income, principal paydowns and other dispositions, and before allowance for loan losses) totaling $42 million and $25 million, respectively. The Company did not purchase any loans in 2010 or 2009. The Company purchased held to maturity securities totaling $22 million in the third quarter of 2010. Additionally, the Company purchased available for sale securities totaling $236 million and $244 million in 2010 and 2009, respectively. To support the Company’s municipal banking business, certain short-term tax-exempt securities are purchased and often sold prior to maturity. In 2010 these purchases, and subsequent sales, amounted to $4 million.
In 2004, the Bank purchased $25 million of BOLI as a long-term asset. The Bank is the beneficiary of this policy that insures the lives of certain current and former senior officers of the Bank and its subsidiaries. Distributions are made to the Bank only upon the death of an insured officer in accordance with the underlying policy. Accordingly, the BOLI held by the Bank does not generate regular cash flows for reinvestment.
The Asset/Liability Committee of the Board of Directors (the “ALCO”) is responsible for oversight of the liquidity position and the asset/liability structure. The Board of Directors has delegated authority to management to establish specific policies and operating procedures governing liquidity levels and develop plans to address future and current liquidity needs. Management monitors the rates and cash flows from the loan and investment portfolios while also examining the maturity structure and volatility characteristics of liabilities to develop an optimum asset/liability mix. Available funding sources include retail, commercial and municipal deposits, purchased liabilities and stockholders’ equity. At December 31, 2010, access to approximately $180 million in FHLB lines of credit for overnight or term borrowings with maturities of up to thirty years was available. At December 31, 2010, approximately $73 million and $5 million in unsecured and secured lines of credit, respectively, extended by correspondent banks were also available to be utilized, if needed, for short-term funding purposes. At December 31, 2010, $22 million in advances were outstanding under lines of credit with the FHLB. At December 31, 2010, no funds were drawn on correspondent bank lines of credit.
Our ten largest depositor relationships accounted for approximately 22% of our deposits at December 31, 2010. Our largest depositor relationship accounted for approximately 8% of our deposits at December 31, 2010. In addition, approximately 4% of our deposits at December 31, 2010, which includes deposits gathered through CDARS, are considered for regulatory purposes to be brokered deposits. Brokered deposits are at a greater risk of being withdrawn and placed on deposit at another institution offering a higher interest rate, thus posing liquidity risk for institutions that gather brokered deposits in significant amounts. Federal banking law and regulation places restrictions on depository institutions regarding brokered deposits.
Due to the short-term nature of the deposit balances maintained by our large depositors, the deposit balances they maintain with us may fluctuate. Of our ten largest deposit relationships, four are local municipalities and the balances of their deposits tend to fluctuate on a seasonal basis throughout the year. The loss of one or more of our ten largest customers, or a significant decline in the deposit balances due to ordinary course fluctuations related to these customers’ businesses, in all likelihood would adversely affect our liquidity and require us to raise deposit rates to attract new deposits, purchase federal funds or borrow funds on a short term basis to replace such deposits. Depending on the interest rate environment and competitive factors, low cost deposits may need to be replaced with higher cost funding, resulting in a decrease in net interest income and net income. Based on historical experience and our available sources of liquidity, the Company expects to be able to replace a substantial portion of any large deposits or brokered deposits that may be withdrawn.
52
To supplement its short-term borrowed funds, the Company also utilizes the CDARS program. At December 31, 2010, $28 million in short-term certificates of deposit were outstanding. CDARS deposits are considered, for regulatory purposes, to be brokered deposits. These deposits were generally available at rates lower than the competitive market rates on local certificates of deposit, offered us greater flexibility and were more efficient to obtain. Notwithstanding the CDARS deposits, and pursuant to authorization limits, management may also access the traditional brokered deposit market for funding. As of December 31, 2010, $30 million in such brokered deposits were outstanding, of which $19 million is maturing in 2011. The Bank, currently a well-capitalized depository institution, is allowed to solicit and accept, renew or roll over any brokered deposit without restriction. Should the Bank become adequately capitalized, it may accept, renew or roll over any brokered deposit only after it has applied for and been granted a waiver by the FDIC. Should the Bank become undercapitalized, it may not accept, renew, or roll over any brokered deposit. As the Company’s liquidity remains satisfactory due to its deposit base, borrowing capacity secured by liquid assets and other funding sources, management believes that existing funding sources will be adequate to meet future liquidity requirements.
|
|
|
|
QUANTITATIVE AND QUALITATIVE DISCLOSURES ABOUT MARKET RISK |
Asset/Liability Management and Market Risk
The process by which financial institutions manage interest-earning assets and funding sources under different interest rate environments is called asset/liability management. The primary goal of asset/liability management is to increase net interest income within an acceptable range of overall risk tolerance. Management must ensure that liquidity, capital, interest rate and market risk are prudently managed. Asset/liability and interest rate risk management are governed by policies reviewed and approved annually by the Company’s Board of Directors. The Board of Directors has delegated responsibility for asset/liability and interest rate risk management to the ALCO. The ALCO meets quarterly and sets strategic directives that guide the day to day asset/liability management activities of the Company as well as reviewing and approving all major funding, capital and market risk management programs. The ALCO also focuses on current market conditions, balance sheet management strategies, deposit and loan pricing issues and interest rate risk measurement and mitigation.
Interest Rate Risk
Interest rate risk is the potential adverse change to earnings or capital arising from movements in interest rates. This risk can be quantified by measuring the change in net interest margin relative to changes in market rates. Reviewing repricing characteristics of interest-earning assets and interest-bearing liabilities identifies risk. The Company’s ALCO sets forth policy guidelines that limit the level of interest rate risk within specified tolerance ranges. Management must determine the appropriate level of risk, under policy guidelines, which will enable the Company to achieve its performance objectives within the confines imposed by its business objectives and the external environment within which it operates.
Interest rate risk arises from repricing risk, basis risk, yield curve risk and option risk, and is measured using financial modeling techniques including interest rate ramp and shock simulations to measure the impact of changes in interest rates on earnings for periods of up to two years. These simulations are used to determine whether corrective action may be warranted or required in order to adjust the overall interest rate risk profile of the Company. Asset and liability management strategies may also involve the use of instruments such as interest rate swaps to hedge interest rate risk. Management performs simulation analysis to assess the Company’s asset/liability position on a dynamic repricing basis using software developed by a well known industry vendor. Simulation modeling applies alternative interest rate scenarios to the Company’s balance sheet to estimate the related impact on net interest income. The use of simulation modeling assists management in its continuing efforts to achieve earnings stability in a variety of interest rate environments.
The Company’s asset/liability and interest rate risk management policy limits interest rate risk exposure to -12% and -15% of the base case net interest income for net earnings at risk at the 12-month and 24-month time horizons, respectively. Net earnings at risk is the potential adverse change in net interest income arising from up to +200 and -200 basis point changes in interest rates over a 12 month period, and measured over a 24 month time horizon. The Company’s balance sheet is held flat over the 24 month time horizon with all principal cash flows assumed to be reinvested in similar products and term points at the simulated market interest rates. In prior periods the earnings at risk was measured under a -200 basis point scenario. Due to the historically low interest rates at December 31, 2010, it was decided that a -200 basis point scenario would not be relevant. Thus, at December 31, 2010, a +300 basis point scenario was measured.
The Company may be considered “asset sensitive” when net interest income increases in a rising interest rate environment or decreases in a falling interest rate environment. Similarly, the Company may be considered “liability sensitive” when net interest income increases in a falling interest rate environment or decreases in a rising interest rate environment.
53
As of December 31, 2010 and 2009, the Company’s balance sheet was considered slightly asset sensitive as a hypothetical decrease in interest rates would have minimal negative impact on the percentage change in the Company’s net interest income; whereas, a hypothetical increase in interest rates would have a moderately positive impact on the Company’s net interest income.
% Change in Net Interest Income
12 Month Interest Rate Changes
Basis Points
|
|
|
|
|
|
|
|
|
|
|
|
|
|
|
|
|
|
|
|
|
|
|
|
|
|
|
|
|
|
|
|
|
|
|
|
December 31, 2010 |
|
December 31, 2009 |
|
||||||||||||||||||||||||||
|
|
|
|
|
|
|
||||||||||||||||||||||||||
|
Time Horizon |
|
Down 100 |
|
Base Flat |
|
Up 100 |
|
Up 200 |
|
Up 300 |
|
|
Down 100 |
|
|
Base Flat |
|
Up 100 |
|
Up 200 |
|
Up 300 |
|
||||||||
|
|
|
|
|
|
|
|
|
|
|
|
|
|
|
|
|
|
|
|
|
|
|
|
|||||||||
|
Year One |
|
|
-0.7 |
% |
|
0.0 |
% |
|
1.2 |
% |
|
1.8 |
% |
|
2.0 |
% |
|
-1.4 |
% |
|
0.0 |
% |
|
0.3 |
% |
|
0.2 |
% |
|
0.0 |
% |
|
Year Two |
|
|
-1.1 |
% |
|
-0.3 |
% |
|
1.7 |
% |
|
2.8 |
% |
|
3.5 |
% |
|
-2.9 |
% |
|
1.0 |
% |
|
1.1 |
% |
|
0.3 |
% |
|
-0.8 |
% |
For a discussion about a recent interagency advisory regarding sound practices for managing interest rate risk, please see “Supervision and Regulation, Interest Rate Risk Management Advisory.”
Management also monitors equity value at risk as a percentage of market value of portfolio equity (“MVPE”). The Company’s MVPE is the difference between the market value of its interest-sensitive assets and the market value of its interest-sensitive liabilities. MVPE at risk is the potential adverse change in the present value (market value) of total equity arising from an immediate hypothetical shock in interest rates. Management uses scenario analysis on a static basis to assess its equity value at risk by modeling MVPE under various interest rate shock scenarios.
When modeling MVPE at risk, management recognizes the high degree of subjectivity when projecting long-term cash flows and reinvestment rates, and therefore uses MVPE at risk as a relative indicator of interest rate risk. Accordingly, the Company does not set definitive policy limits over MVPE at risk; however, in 2010 the Company has set various policy level triggers at which successively heightened monitoring is required and, if necessary, steps will be taken to lower observed volatility of its MVPE exposure. There have been no triggering events since the setting of the various policy level triggers.
As of December 31, 2010 and 2009, the variability in the Company’s MVPE after an immediate hypothetical shock in interest rates of + 300 to -100 basis points was low. The small changes in the percentage change in MVPE and the MVPE Ratio was attributable to the low interest rate environment at December 31, 2010, and its hypothetical impact on the market value of the Company’s investment assets and lower cost core deposits.
MVPE Variability
Immediate Interest Rate Shocks
Basis Points
|
|
|
|
|
|
|
|
|
|
|
|
|
|
|
|
|
|
|
|
|
|
|
|
|
|
|
|
|
|
|
|
|
|
|
|
December 31, 2010 |
|
December 31, 2009 |
|
||||||||||||||||||||||||||
|
|
|
|
|
|
|
||||||||||||||||||||||||||
|
|
|
Down 100 |
|
Base Flat |
|
Up 100 |
|
Up 200 |
|
Up 300 |
|
Down 100 |
|
Base Flat |
|
Up 100 |
|
Up 200 |
|
Up 300 |
|
||||||||||
|
|
|
|
|
|
|
|
|
|
|
|
|
|
|
|
|
|
|
|
|
|
|
||||||||||
|
% Change in MVPE (1) |
|
|
-0.9 |
% |
|
0.0 |
% |
|
-1.4 |
% |
|
-3.7 |
% |
|
-6.1 |
% |
|
-0.8 |
% |
|
0.0 |
% |
|
-1.7 |
% |
|
-4.2 |
% |
|
-7.1 |
% |
|
MVPE Ratio |
|
|
16.1 |
% |
|
16.6 |
% |
|
16.6 |
% |
|
16.3 |
% |
|
16.0 |
% |
|
20.8 |
% |
|
21.5 |
% |
|
21.4 |
% |
|
21.0 |
% |
|
20.4 |
% |
|
|
|
|
|
|
|
|
|
|
|
|
|
|
|
|
|
|
|
|
|
|
|
|
|
|
|
|
|
|
|
|
|
|
(1) Assumes 40% marginal tax rate. |
|||||||||||||||||||||||||||||||
Simulation and scenario techniques in asset/liability modeling are influenced by a number of estimates and assumptions with regard to embedded options, prepayment behaviors, pricing strategies and cash flows. Such assumptions and estimates are inherently uncertain and, as a consequence, simulation and scenario output will neither precisely estimate the level of, or the changes in, net interest income and MVPE, respectively.
54
|
|
|
|
FINANCIAL STATEMENTS AND SUPPLEMENTARY DATA |
Report of Independent Registered Public Accounting Firm
Board of
Directors and Stockholders
State Bancorp, Inc.
Jericho, New York
We have audited the accompanying consolidated balance sheets of State Bancorp, Inc. as of December 31, 2010 and 2009, and the related consolidated statements of operations, changes in stockholders’ equity and comprehensive income (loss), and cash flows for each of the three years in the three-year period ended December 31, 2010. We also have audited State Bancorp Inc.’s internal control over financial reporting as of December 31, 2010, based on criteria established in Internal Control – Integrated Framework issued by the Committee of Sponsoring Organizations of the Treadway Commission (COSO). State Bancorp Inc.’s management is responsible for these financial statements, for maintaining effective internal control over financial reporting, and for its assessment of the effectiveness of internal control over financial reporting, included in the accompanying Management’s Report on Internal Control Over Financial Reporting (Item 9A). Our responsibility is to express an opinion on these financial statements and an opinion on the Company’s internal control over financial reporting based on our audits.
We conducted our audits in accordance with the standards of the Public Company Accounting Oversight Board (United States). Those standards require that we plan and perform the audits to obtain reasonable assurance about whether the financial statements are free of material misstatement and whether effective internal control over financial reporting was maintained in all material respects. Our audits of the financial statements included examining, on a test basis, evidence supporting the amounts and disclosures in the financial statements, assessing the accounting principles used and significant estimates made by management, and evaluating the overall financial statement presentation. Our audit of internal control over financial reporting included obtaining an understanding of internal control over financial reporting, assessing the risk that a material weakness exists, and testing and evaluating the design and operating effectiveness of internal control based on the assessed risk. Our audits also included performing such other procedures as we considered necessary in the circumstances. We believe that our audits provide a reasonable basis for our opinions.
A company’s internal control over financial reporting is a process designed to provide reasonable assurance regarding the reliability of financial reporting and the preparation of financial statements for external purposes in accordance with generally accepted accounting principles. A company’s internal control over financial reporting includes those policies and procedures that (1) pertain to the maintenance of records that, in reasonable detail, accurately and fairly reflect the transactions and dispositions of the assets of the company; (2) provide reasonable assurance that transactions are recorded as necessary to permit preparation of financial statements in accordance with generally accepted accounting principles, and that receipts and expenditures of the company are being made only in accordance with authorizations of management and directors of the company; and (3) provide reasonable assurance regarding prevention or timely detection of unauthorized acquisition, use, or disposition of the company’s assets that could have a material effect on the financial statements.
Because of its inherent limitations, internal control over financial reporting may not prevent or detect misstatements. Also, projections of any evaluation of effectiveness to future periods are subject to the risk that controls may become inadequate because of changes in conditions, or that the degree of compliance with the policies or procedures may deteriorate.
In our opinion, the consolidated financial statements referred to above present fairly, in all material respects, the financial position of State Bancorp Inc. as of December 31, 2010 and 2009, and the results of its operations and its cash flows for each of the three years in the three-year period ended December 31, 2010 in conformity with accounting principles generally accepted in the United States of America. Also in our opinion, State Bancorp Inc. maintained, in all material respects, effective internal control over financial reporting as of December 31, 2010, based on criteria established in Internal Control – Integrated Framework issued by the Committee of Sponsoring Organizations of the Treadway Commission (COSO).
|
|
|
|
|
Crowe Horwath LLP |
New York, New
York
March 10, 2011
55
|
|
|
|
|
|
|
|
|
|
CONSOLIDATED BALANCE SHEETS |
|
|
|
|
|
|
|
|
|
|||||||
|
December
31, 2010 and 2009 |
|
2010 |
|
2009 |
|
||
|
|
|
|
|
|
|
||
|
ASSETS: |
|
|
|
|
|
|
|
|
Cash and due from banks |
|
$ |
23,121 |
|
$ |
28,624 |
|
|
Securities held to maturity (estimated fair value of $21,890 in 2010) |
|
|
22,000 |
|
|
— |
|
|
Securities available for sale - at estimated fair value |
|
|
361,158 |
|
|
415,985 |
|
|
Federal Home Loan Bank and other restricted stock |
|
|
6,381 |
|
|
7,361 |
|
|
Loans (net of allowance for loan losses of $33,078 in 2010 and $28,711 in 2009) |
|
|
1,098,292 |
|
|
1,068,924 |
|
|
Loans held for sale |
|
|
— |
|
|
670 |
|
|
Bank premises and equipment - net |
|
|
6,264 |
|
|
6,339 |
|
|
Bank owned life insurance |
|
|
31,728 |
|
|
30,593 |
|
|
Net deferred income taxes |
|
|
24,066 |
|
|
27,486 |
|
|
Prepaid FDIC assessment |
|
|
5,456 |
|
|
7,533 |
|
|
Other assets |
|
|
11,513 |
|
|
14,197 |
|
|
|
|
|
|
|
|
|
|
|
TOTAL ASSETS |
|
$ |
1,589,979 |
|
$ |
1,607,712 |
|
|
|
|
|
|
|
|
|
|
|
LIABILITIES: |
|
|
|
|
|
|
|
|
Deposits: |
|
|
|
|
|
|
|
|
Demand |
|
$ |
343,331 |
|
$ |
381,066 |
|
|
Savings |
|
|
632,425 |
|
|
613,894 |
|
|
Time |
|
|
372,979 |
|
|
354,602 |
|
|
|
|
|
|
|
|
|
|
|
Total deposits |
|
|
1,348,735 |
|
|
1,349,562 |
|
|
Other temporary borrowings |
|
|
25,000 |
|
|
48,000 |
|
|
Senior unsecured debt |
|
|
29,000 |
|
|
29,000 |
|
|
Junior subordinated debentures |
|
|
20,620 |
|
|
20,620 |
|
|
Other accrued expenses and liabilities |
|
|
11,772 |
|
|
12,015 |
|
|
|
|
|
|
|
|
|
|
|
Total liabilities |
|
|
1,435,127 |
|
|
1,459,197 |
|
|
|
|
|
|
|
|
|
|
|
COMMITMENTS AND CONTINGENT LIABILITIES |
|
|
|
|
|
|
|
|
STOCKHOLDERS’ EQUITY: |
|
|
|
|
|
|
|
|
Preferred stock, $0.01 par value, authorized 250,000 shares; 36,842 shares issued and outstanding; liquidation preference of $36,842 |
|
|
36,245 |
|
|
36,016 |
|
|
Common stock, $0.01 par value, authorized 50,000,000 shares; issued 17,518,827 shares in 2010 and 17,297,546 shares in 2009; outstanding 16,695,808 shares in 2010 and 16,331,862 shares in 2009 |
|
|
175 |
|
|
173 |
|
|
Warrant |
|
|
1,057 |
|
|
1,057 |
|
|
Surplus |
|
|
179,293 |
|
|
178,673 |
|
|
Retained deficit |
|
|
(51,378 |
) |
|
(57,432 |
) |
|
Treasury stock (823,019 shares in 2010 and 965,684 shares in 2009) |
|
|
(13,872 |
) |
|
(16,276 |
) |
|
Accumulated other comprehensive income (net of taxes of $2,193 in 2010 and $4,150 in 2009) |
|
|
3,332 |
|
|
6,304 |
|
|
|
|
|
|
|
|
|
|
|
Total stockholders’ equity |
|
|
154,852 |
|
|
148,515 |
|
|
|
|
|
|
|
|
|
|
|
TOTAL LIABILITIES AND STOCKHOLDERS’ EQUITY |
|
$ |
1,589,979 |
|
$ |
1,607,712 |
|
|
|
|
|
|
|
|
|
|
See Notes to Consolidated Financial Statements.
56
|
|
|
|
|
|
|
|
|
|
|
|
|
CONSOLIDATED STATEMENTS OF OPERATIONS |
|
|
|
|
|
|
|
|
|
|
|
|
||||||||||
|
For the
Years Ended December 31, 2010, 2009 and 2008 |
|
2010 |
|
2009 |
|
2008 |
|
|||
|
|
|
|
|
|
|
|
|
|||
|
INTEREST INCOME: |
|
|
|
|
|
|
|
|
|
|
|
Interest and fees on loans |
|
$ |
61,511 |
|
$ |
60,200 |
|
$ |
70,259 |
|
|
Federal funds sold and securities purchased under agreements to resell |
|
|
2 |
|
|
6 |
|
|
981 |
|
|
Securities held to maturity - taxable |
|
|
257 |
|
|
— |
|
|
— |
|
|
Securities available for sale - taxable |
|
|
14,535 |
|
|
17,677 |
|
|
19,595 |
|
|
Securities available for sale - tax-exempt |
|
|
91 |
|
|
88 |
|
|
200 |
|
|
Securities available for sale - dividends |
|
|
— |
|
|
— |
|
|
40 |
|
|
Dividends on Federal Home Loan Bank and other restricted stock |
|
|
126 |
|
|
108 |
|
|
368 |
|
|
|
|
|
|
|
|
|
|
|
|
|
|
Total interest income |
|
|
76,522 |
|
|
78,079 |
|
|
91,443 |
|
|
|
|
|
|
|
|
|
|
|
|
|
|
INTEREST EXPENSE: |
|
|
|
|
|
|
|
|
|
|
|
Deposits |
|
|
9,892 |
|
|
13,339 |
|
|
23,328 |
|
|
Temporary borrowings |
|
|
89 |
|
|
116 |
|
|
3,010 |
|
|
Senior unsecured debt |
|
|
1,122 |
|
|
844 |
|
|
— |
|
|
Subordinated notes |
|
|
— |
|
|
852 |
|
|
925 |
|
|
Junior subordinated debentures |
|
|
729 |
|
|
849 |
|
|
1,310 |
|
|
|
|
|
|
|
|
|
|
|
|
|
|
Total interest expense |
|
|
11,832 |
|
|
16,000 |
|
|
28,573 |
|
|
|
|
|
|
|
|
|
|
|
|
|
|
Net interest income |
|
|
64,690 |
|
|
62,079 |
|
|
62,870 |
|
|
Provision for loan losses |
|
|
12,900 |
|
|
39,500 |
|
|
17,226 |
|
|
|
|
|
|
|
|
|
|
|
|
|
|
Net interest income after provision for loan losses |
|
|
51,790 |
|
|
22,579 |
|
|
45,644 |
|
|
|
|
|
|
|
|
|
|
|
|
|
|
OTHER INCOME: |
|
|
|
|
|
|
|
|
|
|
|
Service charges on deposit accounts |
|
|
1,845 |
|
|
2,161 |
|
|
2,217 |
|
|
Other-than-temporary impairment losses on securities |
|
|
— |
|
|
(4,000 |
) |
|
(6,203 |
) |
|
Net gains on sales of securities |
|
|
3,519 |
|
|
994 |
|
|
48 |
|
|
Income from bank owned life insurance |
|
|
1,135 |
|
|
695 |
|
|
891 |
|
|
Other operating income |
|
|
1,746 |
|
|
1,649 |
|
|
3,412 |
|
|
|
|
|
|
|
|
|
|
|
|
|
|
Total other income |
|
|
8,245 |
|
|
1,499 |
|
|
365 |
|
|
|
|
|
|
|
|
|
|
|
|
|
|
Income before operating expenses |
|
|
60,035 |
|
|
24,078 |
|
|
46,009 |
|
|
|
|
|
|
|
|
|
|
|
|
|
|
OPERATING EXPENSES: |
|
|
|
|
|
|
|
|
|
|
|
Salaries and other employee benefits |
|
|
23,706 |
|
|
23,373 |
|
|
22,880 |
|
|
Occupancy |
|
|
5,525 |
|
|
5,896 |
|
|
5,930 |
|
|
Equipment |
|
|
1,164 |
|
|
1,225 |
|
|
1,315 |
|
|
Legal |
|
|
381 |
|
|
784 |
|
|
3,115 |
|
|
Marketing and advertising |
|
|
1,568 |
|
|
775 |
|
|
812 |
|
|
FDIC and NYS assessment |
|
|
2,686 |
|
|
3,628 |
|
|
866 |
|
|
Credit and collection |
|
|
784 |
|
|
5,193 |
|
|
1,059 |
|
|
Other operating expenses |
|
|
6,210 |
|
|
7,629 |
|
|
7,774 |
|
|
|
|
|
|
|
|
|
|
|
|
|
|
Total operating expenses |
|
|
42,024 |
|
|
48,503 |
|
|
43,751 |
|
|
|
|
|
|
|
|
|
|
|
|
|
|
INCOME (LOSS) BEFORE INCOME TAXES |
|
|
18,011 |
|
|
(24,425 |
) |
|
2,258 |
|
|
PROVISION (BENEFIT) FOR INCOME TAXES |
|
|
6,570 |
|
|
(9,605 |
) |
|
451 |
|
|
|
|
|
|
|
|
|
|
|
|
|
|
NET INCOME (LOSS) |
|
|
11,441 |
|
|
(14,820 |
) |
|
1,807 |
|
|
|
|
|
|
|
|
|
|
|
|
|
|
Preferred dividends and accretion |
|
|
2,071 |
|
|
2,058 |
|
|
143 |
|
|
|
|
|
|
|
|
|
|
|
|
|
|
NET INCOME (LOSS) AVAILABLE TO COMMON STOCKHOLDERS |
|
$ |
9,370 |
|
$ |
(16,878 |
) |
$ |
1,664 |
|
|
|
|
|
|
|
|
|
|
|
|
|
|
|
|
|
|
|
|
|
|
|
|
|
|
NET INCOME (LOSS) PER COMMON SHARE - BASIC |
|
$ |
0.57 |
|
$ |
(1.16 |
) |
$ |
0.12 |
|
|
NET INCOME (LOSS) PER COMMON SHARE - DILUTED |
|
$ |
0.57 |
|
$ |
(1.16 |
) |
$ |
0.12 |
|
|
|
|
|
|
|
|
|
|
|
|
|
|
WEIGHTED AVERAGE NUMBER OF COMMON SHARES - BASIC |
|
|
16,262,860 |
|
|
14,500,855 |
|
|
14,148,957 |
|
|
WEIGHTED AVERAGE NUMBER OF COMMON SHARES - DILUTED |
|
|
16,344,976 |
|
|
14,500,855 |
|
|
14,191,586 |
|
See Notes to Consolidated Financial Statements.
57
CONSOLIDATED STATEMENTS OF CHANGES IN STOCKHOLDERS’ EQUITY AND COMPREHENSIVE INCOME (LOSS)
|
|
|
|
|
|
|
|
|
|
|
|
|
For the
Years Ended December 31, 2010, 2009 and 2008 |
|
2010 |
|
2009 |
|
2008 |
|
|||
|
|
|
|
|
|
|
|
|
|||
|
Preferred Stock |
|
|
|
|
|
|
|
|
|
|
|
Balance, January 1 |
|
$ |
36,016 |
|
$ |
35,800 |
|
$ |
— |
|
|
Issuance of preferred shares in 2008 |
|
|
— |
|
|
— |
|
|
35,785 |
|
|
Accretion of discount on preferred shares |
|
|
229 |
|
|
216 |
|
|
15 |
|
|
|
|
|
|
|
|
|
|
|
|
|
|
Balance, December 31 |
|
|
36,245 |
|
|
36,016 |
|
|
35,800 |
|
|
|
|
|
|
|
|
|
|
|
|
|
|
Common Stock |
|
|
|
|
|
|
|
|
|
|
|
Balance, January 1 |
|
|
173 |
|
|
77,454 |
|
|
74,982 |
|
|
Shares issued under the dividend reinvestment plan (41,241 shares in 2010, 55,657 shares in 2009 and 245,699 shares in 2008; at 95% of market value) |
|
|
— |
|
|
1 |
|
|
1,228 |
|
|
Adjustment for change in par value of common stock to $0.01 per share from $5.00 per share in 2009 |
|
|
— |
|
|
(77,300 |
) |
|
— |
|
|
Exchange of $10,000 of 8.25% subordinated notes for common stock (1,656,600 shares in 2009) |
|
|
— |
|
|
17 |
|
|
— |
|
|
Stock issued under directors’ stock plan (13,875 shares in 2010, 10,625 shares in 2009 and 51,451 shares in 2008) |
|
|
— |
|
|
— |
|
|
257 |
|
|
Stock options exercised (96,390 shares less 36,381 shares exchanged as part of exercise in 2008) |
|
|
— |
|
|
— |
|
|
300 |
|
|
Stock-based compensation (166,165 shares in 2010, 83,769 shares in 2009 and 137,388 shares in 2008) |
|
|
2 |
|
|
1 |
|
|
687 |
|
|
|
|
|
|
|
|
|
|
|
|
|
|
Balance, December 31 |
|
|
175 |
|
|
173 |
|
|
77,454 |
|
|
|
|
|
|
|
|
|
|
|
|
|
|
Warrant |
|
|
|
|
|
|
|
|
|
|
|
Balance, January 1 |
|
|
1,057 |
|
|
1,057 |
|
|
— |
|
|
Issuance of warrant in 2008 |
|
|
— |
|
|
— |
|
|
1,057 |
|
|
|
|
|
|
|
|
|
|
|
|
|
|
Balance, December 31 |
|
|
1,057 |
|
|
1,057 |
|
|
1,057 |
|
|
|
|
|
|
|
|
|
|
|
|
|
|
Surplus |
|
|
|
|
|
|
|
|
|
|
|
Balance, January 1 |
|
|
178,673 |
|
|
89,984 |
|
|
86,654 |
|
|
Adjustment for change in par value of common stock to $0.01 per share from $5.00 per share in 2009 |
|
|
— |
|
|
77,300 |
|
|
— |
|
|
Exchange of $10,000 of 8.25% subordinated notes for common stock (1,656,600 shares in 2009) |
|
|
— |
|
|
10,751 |
|
|
— |
|
|
Shares issued under the dividend reinvestment plan (41,241 shares in 2010, 55,657 shares in 2009 and 245,699 shares in 2008; at 95% of market value) |
|
|
333 |
|
|
380 |
|
|
1,750 |
|
|
Stock issued under directors’ stock plan (13,875 shares in 2010, 10,625 shares in 2009 and 51,451 shares in 2008) |
|
|
140 |
|
|
135 |
|
|
1,107 |
|
|
Stock options exercised (96,390 shares less 36,381 shares exchanged as part of exercise in 2008) |
|
|
— |
|
|
— |
|
|
252 |
|
|
Stock-based compensation (166,165 shares in 2010, 83,769 shares in 2009 and 137,388 shares in 2008) |
|
|
1,367 |
|
|
938 |
|
|
221 |
|
|
Treasury stock reissued (142,665 shares in 2010 and 63,577 shares in 2009) |
|
|
(1,220 |
) |
|
(815 |
) |
|
— |
|
|
|
|
|
|
|
|
|
|
|
|
|
|
Balance, December 31 |
|
|
179,293 |
|
|
178,673 |
|
|
89,984 |
|
|
|
|
|
|
|
|
|
|
|
|
|
|
Retained Deficit |
|
|
|
|
|
|
|
|
|
|
|
Balance, January 1 |
|
|
(57,432 |
) |
|
(37,635 |
) |
|
(32,164 |
) |
|
Net income (loss) |
|
|
11,441 |
|
|
(14,820 |
) |
|
1,807 |
|
|
Stock-based compensation (137,388 shares in 2008) |
|
|
— |
|
|
— |
|
|
14 |
|
|
Accretion of discount on preferred shares |
|
|
(229 |
) |
|
(216 |
) |
|
(15 |
) |
|
Cash dividend on common stock ($0.20 per share in 2010 and 2009 and $0.50 per share in 2008) |
|
|
(3,316 |
) |
|
(2,919 |
) |
|
(7,149 |
) |
|
Cash dividend on preferred stock (5% per annum) |
|
|
(1,842 |
) |
|
(1,842 |
) |
|
(128 |
) |
|
|
|
|
|
|
|
|
|
|
|
|
|
Balance, December 31 |
|
|
(51,378 |
) |
|
(57,432 |
) |
|
(37,635 |
) |
|
|
|
|
|
|
|
|
|
|
|
|
|
Treasury Stock |
|
|
|
|
|
|
|
|
|
|
|
Balance, January 1 |
|
|
(16,276 |
) |
|
(17,262 |
) |
|
(16,646 |
) |
|
Held in rabbi trust for directors’ stock plan (41,609 shares) |
|
|
— |
|
|
616 |
|
|
(616 |
) |
|
Treasury stock reissued (142,665 shares in 2010 and 21,968 shares in 2009) |
|
|
2,404 |
|
|
370 |
|
|
— |
|
|
|
|
|
|
|
|
|
|
|
|
|
|
Balance, December 31 |
|
|
(13,872 |
) |
|
(16,276 |
) |
|
(17,262 |
) |
|
|
|
|
|
|
|
|
|
|
|
|
|
Accumulated Other Comprehensive Income |
|
|
|
|
|
|
|
|
|
|
|
Balance, January 1 |
|
|
6,304 |
|
|
4,521 |
|
|
812 |
|
|
Unrealized losses (1) |
|
|
(850 |
) |
|
(29 |
) |
|
(3 |
) |
|
Reclassification adjustment (2) |
|
|
(2,122 |
) |
|
1,812 |
|
|
3,712 |
|
|
|
|
|
|
|
|
|
|
|
|
|
|
Balance, December 31 |
|
|
3,332 |
|
|
6,304 |
|
|
4,521 |
|
|
|
|
|
|
|
|
|
|
|
|
|
|
Total Stockholders’ Equity, December 31 |
|
$ |
154,852 |
|
$ |
148,515 |
|
$ |
153,919 |
|
|
|
|
|
|
|
|
|
|
|
|
|
|
|
|
|
|
|
|
|
|
|
|
|
|
Comprehensive Income (Loss) |
|
|
|
|
|
|
|
|
|
|
|
Net income (loss) |
|
$ |
11,441 |
|
$ |
(14,820 |
) |
$ |
1,807 |
|
|
Other comprehensive (loss) income, net of tax: |
|
|
|
|
|
|
|
|
|
|
|
Unrealized losses (1) |
|
|
(850 |
) |
|
(29 |
) |
|
(3 |
) |
|
Reclassification adjustment (2) |
|
|
(2,122 |
) |
|
1,812 |
|
|
3,712 |
|
|
|
|
|
|
|
|
|
|
|
|
|
|
Total other comprehensive (loss) income, net of tax |
|
|
(2,972 |
) |
|
1,783 |
|
|
3,709 |
|
|
|
|
|
|
|
|
|
|
|
|
|
|
Total Comprehensive Income (Loss), December 31 |
|
$ |
8,469 |
|
$ |
(13,037 |
) |
$ |
5,516 |
|
|
|
|
|
|
|
|
|
|
|
|
|
(1) Unrealized gains (losses) on securities available for sale, net of taxes of $(560), $ (19) and $(2) in 2010, 2009 and 2008, respectively. There were no changes in unrealized gains (losses) on securities for which a portion of an other-than-temporary impairment has been recognized in earnings.
(2) Adjustment for (gains) losses included in net income, net of taxes of $1,397, $(1,193) and $(2,444) in 2010, 2009 and 2008, respectively.
See Notes to Consolidated Financial Statements.
58
CONSOLIDATED STATEMENTS OF CASH FLOWS
|
|
|
|
|
|
|
|
|
|
|
|
|
For the Years Ended December 31,
2010, 2009 and 2008 |
|
2010 |
|
2009 |
|
2008 |
|
|||
|
|
|
|
|
|
|
|
|
|||
|
OPERATING ACTIVITIES: |
|
|
|
|
|
|
|
|
|
|
|
Net income (loss) |
|
$ |
11,441 |
|
$ |
(14,820 |
) |
$ |
1,807 |
|
|
Adjustments to reconcile net income (loss) to net cash provided by operating activities: |
|
|
|
|
|
|
|
|
|
|
|
Provision for loan losses |
|
|
12,900 |
|
|
39,500 |
|
|
17,226 |
|
|
Writedown of loans held for sale to estimated fair value |
|
|
— |
|
|
4,033 |
|
|
— |
|
|
Depreciation and amortization of bank premises and equipment |
|
|
1,593 |
|
|
1,573 |
|
|
1,596 |
|
|
Deferred income tax expense (benefit) |
|
|
5,377 |
|
|
(10,517 |
) |
|
(3,089 |
) |
|
Amortization of net premium on securities |
|
|
3,187 |
|
|
2,837 |
|
|
1,961 |
|
|
Other-than-temporary impairment losses on securities recognized in earnings |
|
|
— |
|
|
4,000 |
|
|
6,203 |
|
|
Net gains on sales of securities |
|
|
(3,519 |
) |
|
(994 |
) |
|
(48 |
) |
|
Net (gains) losses on sales of loans held for sale |
|
|
(322 |
) |
|
(83 |
) |
|
250 |
|
|
Income from bank owned life insurance |
|
|
(1,135 |
) |
|
(695 |
) |
|
(891 |
) |
|
Change in fair value of derivative contracts |
|
|
51 |
|
|
513 |
|
|
(1,631 |
) |
|
Expenses associated with the exchange of subordinated notes for common equity |
|
|
— |
|
|
736 |
|
|
— |
|
|
Stock-based compensation expense - net |
|
|
1,369 |
|
|
938 |
|
|
923 |
|
|
Directors’ stock plan expense |
|
|
102 |
|
|
140 |
|
|
293 |
|
|
Net payments and proceeds from sales of loans held for sale |
|
|
992 |
|
|
15,901 |
|
|
4,250 |
|
|
Decrease (increase) in other assets |
|
|
3,227 |
|
|
(1,443 |
) |
|
2,693 |
|
|
(Increase) decrease in receivable - current income taxes |
|
|
(268 |
) |
|
305 |
|
|
13,691 |
|
|
Decrease (increase) in prepaid FDIC assessment |
|
|
2,077 |
|
|
(7,533 |
) |
|
— |
|
|
(Decrease) increase in other accrued expenses and other liabilities |
|
|
(529 |
) |
|
1,339 |
|
|
(7,494 |
) |
|
|
|
|
|
|
|
|
|
|
|
|
|
Net cash provided by operating activities |
|
|
36,543 |
|
|
35,730 |
|
|
37,740 |
|
|
|
|
|
|
|
|
|
|
|
|
|
|
INVESTING ACTIVITIES: |
|
|
|
|
|
|
|
|
|
|
|
Purchases of securities held to maturity |
|
|
(22,000 |
) |
|
— |
|
|
— |
|
|
Proceeds from sales of securities available for sale |
|
|
102,522 |
|
|
116,387 |
|
|
88,002 |
|
|
Proceeds from prepayments and maturities of securities available for sale |
|
|
183,474 |
|
|
121,346 |
|
|
170,054 |
|
|
Purchases of securities available for sale |
|
|
(235,768 |
) |
|
(244,224 |
) |
|
(259,351 |
) |
|
Decrease (increase) in Federal Home Loan Bank and other restricted stock |
|
|
980 |
|
|
(2,538 |
) |
|
6,231 |
|
|
Net proceeds from sale of leasing subsidiary assets |
|
|
— |
|
|
— |
|
|
3,847 |
|
|
Increase in loans - net |
|
|
(42,268 |
) |
|
(25,075 |
) |
|
(103,138 |
) |
|
Purchases of bank premises and equipment - net |
|
|
(1,518 |
) |
|
(1,222 |
) |
|
(2,507 |
) |
|
|
|
|
|
|
|
|
|
|
|
|
|
Net cash used in investing activities |
|
|
(14,578 |
) |
|
(35,326 |
) |
|
(96,862 |
) |
|
|
|
|
|
|
|
|
|
|
|
|
|
FINANCING ACTIVITIES: |
|
|
|
|
|
|
|
|
|
|
|
(Decrease) increase in demand and savings deposits |
|
|
(19,204 |
) |
|
31,079 |
|
|
69,503 |
|
|
Increase (decrease) in time deposits |
|
|
18,377 |
|
|
(162,566 |
) |
|
86,692 |
|
|
(Decrease) increase in other temporary borrowings |
|
|
(23,000 |
) |
|
45,000 |
|
|
(136,031 |
) |
|
(Decrease) increase in overnight sweep and settlement accounts payable, net |
|
|
— |
|
|
(13,174 |
) |
|
12,343 |
|
|
Cash dividends paid on common stock |
|
|
(3,316 |
) |
|
(2,919 |
) |
|
(7,149 |
) |
|
Cash dividends paid on preferred stock |
|
|
(1,842 |
) |
|
(1,740 |
) |
|
— |
|
|
Proceeds from the issuance of preferred shares and common stock warrant |
|
|
— |
|
|
— |
|
|
36,842 |
|
|
Proceeds from issuance of senior unsecured debt |
|
|
— |
|
|
29,000 |
|
|
— |
|
|
Proceeds from reissuance of treasury stock |
|
|
1,184 |
|
|
171 |
|
|
— |
|
|
Proceeds from shares issued under the dividend reinvestment plan |
|
|
333 |
|
|
381 |
|
|
2,978 |
|
|
Proceeds from shares issued pursuant to compensation awards |
|
|
— |
|
|
— |
|
|
552 |
|
|
|
|
|
|
|
|
|
|
|
|
|
|
Net cash (used in) provided by financing activities |
|
|
(27,468 |
) |
|
(74,768 |
) |
|
65,730 |
|
|
|
|
|
|
|
|
|
|
|
|
|
|
NET (DECREASE) INCREASE IN CASH AND CASH EQUIVALENTS |
|
|
(5,503 |
) |
|
(74,364 |
) |
|
6,608 |
|
|
CASH AND CASH EQUIVALENTS AT BEGINNING OF YEAR |
|
|
28,624 |
|
|
102,988 |
|
|
96,380 |
|
|
|
|
|
|
|
|
|
|
|
|
|
|
CASH AND CASH EQUIVALENTS AT END OF YEAR |
|
$ |
23,121 |
|
$ |
28,624 |
|
$ |
102,988 |
|
|
|
|
|
|
|
|
|
|
|
|
|
|
SUPPLEMENTAL DATA: |
|
|
|
|
|
|
|
|
|
|
|
Interest paid |
|
$ |
11,868 |
|
$ |
16,748 |
|
$ |
29,210 |
|
|
Income taxes paid |
|
$ |
1,050 |
|
$ |
479 |
|
$ |
155 |
|
|
Loans transferred to held for sale |
|
$ |
— |
|
$ |
16,224 |
|
$ |
9,822 |
|
|
Common stock exchanged for subordinated notes |
|
$ |
— |
|
$ |
10,768 |
|
$ |
— |
|
See Notes to Consolidated Financial Statements.
59
NOTES TO CONSOLIDATED FINANCIAL STATEMENTS
1. Summary of Significant Accounting and Reporting Policies
Organization and Nature of Operations - State Bancorp, Inc., a one-bank holding company headquartered in Jericho, New York, was formed in 1985. The Company operates as the parent for its wholly-owned subsidiary, State Bank of Long Island and subsidiaries (the “Bank”), a New York State chartered commercial bank founded in 1966, and its unconsolidated wholly-owned subsidiaries, State Bancorp Capital Trust I and II (collectively called the “Trusts”), entities formed in 2002 and 2003, respectively, to issue trust preferred securities. The income of the Company is primarily derived through the operations of the Bank. State Bancorp, Inc. and subsidiaries are collectively referred to hereafter as the “Company.” All intercompany accounts and transactions have been eliminated.
Use of Estimates - The preparation of financial statements in conformity with U.S. generally accepted accounting principles requires management to make estimates and assumptions that affect the reported amounts of assets and liabilities and disclosure of contingent assets and liabilities at the date of the financial statements and the reported amounts of income and expenses during the reporting periods. Actual results could differ from those estimates. The allowance for loan losses, fair values of financial instruments, accounting for income taxes and other-than-temporary impairment of investment securities are particularly subject to change.
Securities Held to Maturity and Securities Available for Sale - At the time of purchase of a security, the Bank designates the security as either available for sale or held to maturity, depending upon investment objectives, liquidity needs and intent. Securities held to maturity are stated at cost, adjusted for premium amortized or discount accreted, if any. The Bank has the positive intent and ability to hold such securities to maturity. Securities available for sale are stated at estimated fair value. Unrealized gains and losses are excluded from income and reported net of tax as accumulated other comprehensive income (loss) as a separate component of stockholders’ equity until realized. Interest earned on investment securities is included in interest income. Realized gains and losses on the sale of securities are reported in the consolidated statements of operations and determined using the adjusted cost of the specific security sold.
Interest income includes amortization of purchase premium or discount. Premiums and discounts on securities are amortized on the level-yield method without anticipating prepayments, except for mortgage-backed securities and collateralized mortgage obligations where prepayments are anticipated.
Management evaluates securities for other-than-temporary impairment (“OTTI”) on at least a quarterly basis, and more frequently when economic or market conditions warrant such an evaluation. For securities in an unrealized loss position, management considers the extent and duration of the unrealized loss, and the financial condition and near-term prospects of the issuer. Management also assesses whether it intends to sell, or it is more likely than not that it will be required to sell, a security in an unrealized loss position before recovery of its amortized cost basis. If either of the criteria regarding intent or requirement to sell is met, the entire difference between amortized cost and fair value is recognized as impairment through earnings. For debt securities that do not meet the aforementioned criteria, the amount of impairment is split into two components as follows: 1) OTTI related to credit loss, which must be recognized in the statement of operations and 2) OTTI related to other factors, which is recognized in other comprehensive income (loss). The credit loss is defined as the difference between the present value of the cash flows expected to be collected and the amortized cost basis. For equity securities, the entire amount of impairment is recognized through earnings.
FHLB and Other Restricted Stock – The Bank is a member of the FHLB system. Members are required to own a certain amount of stock based on the level of borrowings and other factors. FHLB stock is carried at cost, classified as a restricted security and totaled $3 million and $4 million at December 31, 2010 and 2009, respectively. Other restricted securities are comprised of community and business development initiatives totaling $3 million for both periods at December 31, 2010 and 2009. Both cash and stock dividends are reported as income and these securities are periodically evaluated for impairment based on ultimate recovery of par value.
Income Recognition – Interest on all classes of loans is credited to income when earned. The Bank generally discontinues the accrual of interest on all classes of loans in the same manner whenever there is reasonable doubt that interest and/or principal will be collected, or when either principal or interest is 90 days or more past due. Income is not accrued for installment loans which are 90 days past due unless the Bank holds cash collateral. Interest received on non-accrual loans of all classes is either applied against principal or reported as income, according to management’s judgment as to the collectibility of the principal. For all classes of loans, a non-accrual loan generally may be restored to accrual status when 1) none of its principal and interest is due and unpaid and the Bank expects repayment of the remaining contractual principal and interest, or 2) when the loan otherwise becomes well secured and in the process of collection, or 3) where the non-accrual loan has demonstrated sustained contractual performance of generally six months, and all principal and interest contractually due are reasonably assured of repayment within a reasonable period of time.
60
Allowance for Loan Losses - The allowance for loan losses is established through a provision for loan losses charged to expense. Loans are charged against the allowance when management believes that the collectibility of the principal is unlikely, while recoveries of previously charged-off loans are credited to the allowance. The balance in the allowance for loan losses is maintained at a level that, in the opinion of management, is sufficient to absorb probable inherent losses. To determine that level, management evaluates problem loans based on the financial condition of the borrower, the value of collateral and/or guarantor support. Based upon the resultant risk categories assigned to each loan and the procedures regarding impairment described below, an appropriate allowance level is determined. Management also evaluates the quality of, and changes in, the portfolio, while taking into consideration the Bank’s historical loss experience, the existing economic climate of the service area in which the Bank operates, examinations by regulatory authorities, internal reviews and other evaluations in determining the appropriate allowance balance. Management utilizes all available information to estimate the adequacy of the allowance for loan losses. However, the ultimate collectibility of a substantial portion of the loan portfolio and the need for future additions to the allowance will be based upon changes in credit and economic conditions and other relevant factors.
The allowance consists of specific and general components. The specific component relates to loans that are impaired. Commercial and industrial loans and commercial real estate loans of all loan classes are considered impaired when, based on current information and events, it is probable that the Company will not be able to collect all of the principal and interest due under the contractual terms of the loan. Problem loans, for which certain terms have been modified, and for which the borrower is experiencing financial difficulties, are considered troubled debt restructurings. Management generally considers all non-accrual loans and troubled debt restructurings in excess of $250 thousand for impairment. Those non-accrual loans and troubled debt restructurings of all classes with balances less than $250 thousand as well as other groups of smaller-balance homogeneous loans, such as consumer and residential real estate loans, are collectively evaluated for impairment. The allowance for loan losses related to loans that are impaired includes reserves which are generally based on underlying collateral, discounted cash flow or the observable market price if the intent is to sell the loan.
The general component covers loans not individually evaluated for impairment and is based upon historical experience adjusted for current factors. For all loans regardless of portfolio segment, the Bank prepares a combined migration analysis which analyzes the historical loss experience. The migration analysis is prepared annually during the first quarter of the year for the purpose of determining the assigned allocation factors which are essential components of the allowance for loan losses calculation. Actual loss experience is supplemented by other risk components updated on a quarterly basis including large relationship risk, commercial/residential contractor risk, rising interest rate risk, energy and oil dependent risk, real estate risk and economic condition uncertainty.
The following portfolio segments have been identified: commercial and industrial loans (“C&I”), commercial real estate (“CRE”), residential real estate, loans to individuals and tax exempt and other loans. The Bank provides loans to small to moderate size and middle market borrowers and business entities diversified across industries. Loan types primarily include business installment loans, commercial lines of credit and commercial real estate loans. Loans are generally categorized as C&I, CRE and small business loans. C&I loans consist of a broad range of loans to a wide variety of business clients for acquisition of equipment, machinery or leasehold improvements, short term or seasonal working capital needs, and business expansion. CRE loans consist of loans on multifamily, mixed use, retail, office and industrial property or construction loans. Small business loans are a subset of C&I loans where the origination amount is less than $1 million.
Risk characteristics of the C&I portfolio segment vary and depend upon the specific borrower’s business and industry sector. Risk characteristics of the real estate portfolio segments tend to be cyclical and, in the Bank’s case, generally specific to the Long Island and New York City geographical area; at present the real estate market generally continues to be lackluster. Risk characteristics of the loans to individuals segment vary depending on the type of loan, the timing of repayment, the sources of repayment, and value and stability of any collateral.
Management’s goal is to have a balanced portfolio of loans. The allowable risk for the portfolio is determined by senior management through credit policies and annual business plans which are approved by the Board of Directors. The Bank monitors concentrations of risk as appropriate. A concentration of credit is the total of funded and unfunded loans, real estate loans, lines of credit, etc., issued to borrowers sharing similar characteristics such as industry, collateral/security type, size, pricing, location and other items that might have a bearing on risk management. It is also the Bank’s goal to diversify credit risk among a broad range of industries and/or industry sectors, and to monitor concentration on an ongoing basis.
Generally, the Bank processes a charge-off for any portion of a loan that is determined to be uncollectable regardless of portfolio segment or loan class. In addition, commercial loans under $25 thousand are generally fully charged off in the quarter in which they reach 180 days past due unless the loan is secured by real estate or liquid collateral; commercial loans $25 thousand and over are charged off if classified as a
61
loss; consumer loans are generally charged off in the quarter they reach 120 days past due; residential real estate loans are partially charged off for the amount that the loan exceeds the current value of the collateral property, no later than 120 days past due.
Past Due Loans – For all classes of loans, the Bank’s loan accounting system provides notice to the lending officers when a borrowing account misses a required payment of principal and/or interest and enters a past due status. Updated past due loan reports are available to the lending officers and management. The lending officers are required to immediately contact the borrower to determine the cause of the delinquency and identify potential collection problems. The process of collection will continue on a past due loan until all possibilities of recovery have been exhausted or until the cost of the process outweighs the expected return.
Bank Premises and Equipment - Net – Land is carried at cost. Bank premises and equipment are stated at cost, less accumulated depreciation and amortization. Depreciation expense is computed on the straight-line method over the estimated useful lives of the related assets which range from 3 to 10 years for furniture and equipment and 30 years for premises and related components. Leasehold improvements are amortized over the shorter of their estimated useful lives or the remaining terms of the leases.
Loan Origination Fees and Costs – Certain loan origination fees and direct origination costs are capitalized and recognized as an adjustment of the yield on the related loan.
Income Taxes - The objectives of accounting for income taxes are to recognize the amount of taxes payable or refundable for the current year and deferred tax liabilities and assets for the future tax consequences of events that have been recognized in the Company’s financial statements or tax returns. The Company recognizes deferred tax assets and liabilities that reflect the temporary differences between the financial accounting and tax bases of assets and liabilities using enacted tax rates in effect for the year in which the differences are expected to reverse. Judgment is required in assessing the future tax consequences of events that have been recognized in the Company’s consolidated financial statements or tax returns. Fluctuations in the actual outcome of these future tax consequences could impact the Company’s consolidated financial condition or results of operations. As changes in tax laws and regulations are enacted, deferred tax assets and liabilities are adjusted through the provision for income taxes.
A valuation allowance, if needed, reduces deferred tax assets to the amount expected to be realized. A tax position is recognized as a benefit only if it is “more likely than not” that the tax position would be sustained in a tax examination, with a tax examination being presumed to occur. The amount recognized is the largest amount of tax benefit that is greater than 50% likely of being realized on examination. For tax positions not meeting the “more likely than not” test, no tax benefit is recorded.
Treasury Stock - Stock held in treasury by the Company is reported as a reduction to total stockholders’ equity. Treasury stock purchases are recorded at cost.
Stock Dividends and Splits - Stock dividends issued are recorded by transferring the aggregate market value of the shares issued from retained earnings to common stock and surplus. Stock splits are recorded by transferring the aggregate par value of the shares issued from surplus to common stock. All per share information, included in the consolidated financial statements and the notes thereto, has been restated to give retroactive effect to stock dividends and splits.
Earnings Per Common Share - Basic earnings per common share is computed based on the weighted-average number of shares outstanding. All outstanding unvested share-based payment awards that contain rights to non-forfeitable dividends are considered participating securities for this calculation. Diluted earnings per share is computed based on the weighted average number of shares outstanding, increased by the number of common shares that are assumed to have been purchased with the proceeds from the exercise of stock options and common stock warrants. These purchases were assumed to have been made at the average market price of the common stock. The average market price is based on the average closing price for the common stock. Retroactive recognition has been given for stock dividends and splits. For periods in which a loss is reported, the impact of restricted stock, stock options and common stock warrants is not considered as the result would be anti-dilutive.
The computation of earnings per common share follows (in thousands, except share and per share data).
62
|
|
|
|
|
|
|
|
|
|
|
|
|
For the Years Ended December 31, |
|
2010 |
|
2009 |
|
2008 |
|
|||
|
|
|
|
|
|
|
|
|
|||
|
Distributed earnings allocated to common stock |
|
$ |
3,250 |
|
$ |
— |
|
$ |
7,066 |
|
|
Undistributed earnings allocated to common stock |
|
|
5,936 |
|
|
— |
|
|
(5,417 |
) |
|
|
|
|
|
|
|
|
|
|
|
|
|
Net earnings allocated to common stock |
|
$ |
9,186 |
|
$ |
— |
|
$ |
1,649 |
|
|
|
|
|
|
|
|
|
|
|
|
|
|
Net loss |
|
$ |
— |
|
$ |
(14,820 |
) |
$ |
— |
|
|
Less: dividends accrued and accretion of discount on preferred stock |
|
|
— |
|
|
(2,058 |
) |
|
— |
|
|
|
|
|
|
|
|
|
|
|
|
|
|
Loss attributable to common stockholders |
|
$ |
— |
|
$ |
(16,878 |
) |
$ |
— |
|
|
|
|
|
|
|
|
|
|
|
|
|
|
Average market price |
|
$ |
8.77 |
|
$ |
7.75 |
|
$ |
12.90 |
|
|
Weighted average common shares outstanding, including shares considered participating securities (1) |
|
|
16,586,920 |
|
|
14,726,732 |
|
|
14,329,387 |
|
|
Less: weighted average participating securities (1) |
|
|
(324,060 |
) |
|
(225,877 |
) |
|
(180,430 |
) |
|
|
|
|
|
|
|
|
|
|
|
|
|
Weighted average common shares outstanding |
|
|
16,262,860 |
|
|
14,500,855 |
|
|
14,148,957 |
|
|
Dilutive effect of stock options, restricted stock grants and common stock warrants |
|
|
82,116 |
|
|
N/A |
* |
|
42,629 |
|
|
|
|
|
|
|
|
|
|
|
|
|
|
Adjusted common shares outstanding - diluted |
|
|
16,344,976 |
|
|
14,500,855 |
|
|
14,191,586 |
|
|
|
|
|
|
|
|
|
|
|
|
|
|
Net income (loss) per common share - basic |
|
$ |
0.57 |
|
$ |
(1.16 |
) |
$ |
0.12 |
|
|
Net income (loss) per common share - diluted |
|
$ |
0.57 |
|
$ |
(1.16 |
) |
$ |
0.12 |
|
|
Antidilutive common stock warrant issued to the Treasury under the CPP and not included in the calculation |
|
|
465,569 |
|
|
465,569 |
|
|
465,569 |
|
|
Other antidilutive potential shares not included in the calculation |
|
|
481,907 |
|
|
636,158 |
|
|
434,590 |
|
|
|
|
* N/A - for periods in which a loss is reported, the impact of stock options, restricted stock grants and common stock warrants is not considered as the result would be antidilutive. |
|
|
|
(1) The Company’s restricted stock grants are considered participating securities. |
Comprehensive Income (Loss) – Comprehensive income (loss) consists of net income (loss) and other comprehensive income (loss). Other comprehensive income (loss) includes unrealized gains and losses on securities available for sale which are also recognized as separate components of equity.
Statements of Cash Flows – Cash and cash equivalents include cash and deposits with other financial institutions with maturities fewer than 90 days. Net cash flows are reported for customer loan and deposit transactions, federal funds purchased, repurchase agreements, stock-based compensation and the purchases of bank premises and equipment.
Securities Sold Under Agreements to Repurchase – The Company may utilize borrowings generally collateralized by U.S. Treasury, Government agency and mortgage-backed securities. At December 31, 2010, the Company’s such borrowings mature within five years and are reflected on the balance sheet at the amount of the cash received.
Loans Held for Sale - Loans held for sale are carried at the lower of aggregate cost, net of discounts or premiums and a valuation allowance, or estimated fair market value.
Loans Foreclosed - Property acquired through foreclosure (other real estate owned or “OREO”) is initially recorded at fair value less estimated selling costs and carried at the lower of cost or fair value less costs to sell. Carrying value in excess of net fair value at the time of foreclosure is charged against the allowance for loan losses. Revenues and expenses from operations or changes in the carrying value of these assets subsequent to acquisition are included in operating expenses.
Accounting for Stock-Based Compensation - The Company accounts for stock-based compensation on a modified prospective basis with the fair value of any subsequent grants of stock-based compensation to be reflected in the statement of operations.
Accounting for Derivatives – From time to time, the Bank may execute customer interest rate swap transactions together with offsetting interest rate swap transactions with institutional dealers. Each swap is mutually exclusive, and the swaps are marked to market with changes in fair value recognized as other income, with the fair value for each individual swap offsetting the corresponding other. In the event of default, future changes in the fair value of these swap agreements are no longer offset and are recognized as income or loss as appropriate.
63
The customer swap program provides a customer financing option that can result in longer maturity terms without incurring the associated interest rate risk. The Company does not currently hold any derivative financial instruments for trading purposes.
Accounting for Bank Owned Life Insurance - The Bank is the beneficiary of a policy that insures the lives of certain current and former senior officers of the Bank and its subsidiaries. The Company has recognized the cash surrender value, or the amount that can be realized under the insurance policy, as an asset in the consolidated balance sheets. Changes in the cash surrender value and insurance benefit payments are recorded in other income.
Employee Benefit Plans - The Company has an Employee Stock Ownership Plan (the “ESOP”) which is a defined contribution plan covering substantially all full-time employees. Company contributions to the ESOP historically represented a minimum of 3% of an employee’s annual gross compensation. Beginning in 2011 and thereafter, Company contributions to the ESOP are being suspended. The Bank has nonqualified deferred compensation plans for certain officers for whom contributions under the ESOP are limited by the applicable provisions of the Internal Revenue Code. Employee 401(k) expense is the amount of Bank matching contributions.
Loss Contingencies - Loss contingencies, including claims and legal actions arising in the ordinary course of business, are recorded as liabilities when the likelihood of loss is probable and an amount or range of loss can be reasonably estimated.
Dividend Restriction - Banking regulations require maintaining certain capital levels and may limit the dividends paid by the Bank to the Company or by the Company to stockholders. (See the “Regulatory Matters” note for more specific disclosure.)
Fair Value of Financial Instruments - Fair values of financial instruments are estimated using relevant market information and other assumptions, as more fully disclosed in a separate note. Fair value estimates involve uncertainties and matters of significant judgment regarding interest rates, credit risk, prepayments and other factors, especially in the absence of broad markets for particular items. Changes in assumptions or in market conditions could significantly affect the estimates.
Operating Segments - The identifiable segments are not material and operations are managed and financial performance is evaluated on a Company-wide basis. Accordingly, all of the financial service operations are considered by management to be aggregated in one reportable operating segment.
New Accounting Guidance - In June 2009, the Financial Accounting Standards Board (“FASB”) amended existing guidance to improve the relevance and comparability of the information that a reporting entity provides in its financial statements about a transfer of financial assets; the effects of a transfer on its financial position, financial performance, and cash flows; and a transferor’s continuing involvement, if any, in transferred financial assets. This amended guidance addresses (1) practices that are not consistent with the intent and key requirements of the original guidance and (2) concerns of financial statement users that many of the financial assets (and related obligations) that have been derecognized should continue to be reported in the financial statements of transferors. The impact of adoption on January 1, 2010 was not material.
In June 2009, the FASB amended guidance for consolidation of variable interest entities by replacing the quantitative-based risks and rewards calculation for determining which enterprise, if any, has a controlling financial interest in a variable interest entity. The new approach focuses on identifying which enterprise has the power to direct the activities of a variable interest entity that most significantly impact the entity’s economic performance and (1) the obligation to absorb losses of the entity or (2) the right to receive benefits from the entity. Additional disclosures about an enterprise’s involvement in variable interest entities are also required. The impact of adoption on January 1, 2010 was not material.
In July 2010, the FASB issued an Accounting Standards Update (“ASU”), “Receivables: Disclosure about the Credit Quality of Financing Receivables and the Allowance for Credit Losses.” The objective of this ASU is for an entity to provide disclosures that facilitate financial statement users’ evaluation of the nature of credit risk inherent in the entity’s portfolio of financing receivables, how that risk is analyzed and assessed in arriving at the allowance for credit losses, and the changes and reasons for those changes in the allowance for credit losses. An entity should provide disclosures on a disaggregated basis on two defined levels: (1) portfolio segment; and (2) class of financing receivable. The ASU makes changes to existing disclosure requirements and includes additional disclosure requirements about financing receivables, including credit quality indicators of financing receivables at the end of the reporting period by class of financing receivables, the aging of past due financing receivables at the end of the reporting period by class of financing receivables, and the nature and extent of troubled debt restructurings (“TDRs”) that occurred during the period by class of financing receivables and their effect on the allowance for credit losses. The Company’s adoption on December 31, 2010 except for those parts pertaining to TDRs, being disclosure-related only, had
64
no impact on its results of operations. At its January 4, 2011, meeting, the FASB affirmed its decision to temporarily defer the effective date for TDRs. The new effective date is to be concurrent with the effective date for the proposed ASU, “Receivables (Topic 310): Clarifications to Accounting for Troubled Debt Restructurings by Creditors.” The FASB directed its staff to draft a final ASU to change the effective date of the TDRs disclosures for public companies. The deferral will become effective upon issuance of the final ASU.
Reclassifications - Certain reclassifications have been made to prior years’ amounts to conform to the current year’s presentation.
2. Investment Securities
The amortized cost, gross unrealized gains and losses and estimated fair value of securities held to maturity and available for sale at December 31, 2010 and 2009, are as follows (in thousands):
|
|
|
|
|
|
|
|
|
|
|
|
|
|
|
|
|
|
Amortized |
|
Gross |
|
Gross |
|
Estimated |
|
||||
|
|
|
|
|
|
|
|
|
|
|
||||
|
December 31, 2010 |
|
|
|
|
|
|
|
|
|
|
|
|
|
|
Securities Held to Maturity: |
|
|
|
|
|
|
|
|
|
|
|
|
|
|
Corporate securities |
|
$ |
22,000 |
|
$ |
— |
|
$ |
(110 |
) |
$ |
21,890 |
|
|
|
|
|
|
|
|
|
|
|
|
|
|
|
|
|
Securities Available for Sale: |
|
|
|
|
|
|
|
|
|
|
|
|
|
|
Obligations of states and political subdivisions |
|
|
1,883 |
|
|
23 |
|
|
— |
|
|
1,906 |
|
|
Government agency securities |
|
|
40,894 |
|
|
176 |
|
|
(514 |
) |
|
40,556 |
|
|
Mortgage-backed securities and collateralized mortgage obligations - residential: |
|
|
|
|
|
|
|
|
|
|
|
|
|
|
FHLMC |
|
|
106,040 |
|
|
4,803 |
|
|
(95 |
) |
|
110,748 |
|
|
FNMA |
|
|
111,841 |
|
|
2,190 |
|
|
(414 |
) |
|
113,617 |
|
|
GNMA |
|
|
89,874 |
|
|
648 |
|
|
(1,050 |
) |
|
89,472 |
|
|
Mortgage-backed securities and collateralized mortgage obligations - commercial: |
|
|
|
|
|
|
|
|
|
|
|
|
|
|
GNMA |
|
|
5,101 |
|
|
— |
|
|
(242 |
) |
|
4,859 |
|
|
|
|
|
|
|
|
|
|
|
|
|
|
|
|
|
Total Securities Available for Sale |
|
|
355,633 |
|
|
7,840 |
|
|
(2,315 |
) |
|
361,158 |
|
|
|
|
|
|
|
|
|
|
|
|
|
|
|
|
|
Total Securities |
|
$ |
377,633 |
|
$ |
7,840 |
|
$ |
(2,425 |
) |
$ |
383,048 |
|
|
|
|
|
|
|
|
|
|
|
|
|
|
|
|
|
December 31, 2009 |
|
|
|
|
|
|
|
|
|
|
|
|
|
|
Securities Available for Sale: |
|
|
|
|
|
|
|
|
|
|
|
|
|
|
Obligations of states and political subdivisions |
|
$ |
12,446 |
|
$ |
61 |
|
$ |
(86 |
) |
$ |
12,421 |
|
|
Government agency securities |
|
|
22,772 |
|
|
326 |
|
|
(188 |
) |
|
22,910 |
|
|
Mortgage-backed securities and collateralized mortgage obligations - residential: |
|
|
|
|
|
|
|
|
|
|
|
|
|
|
FHLMC |
|
|
173,324 |
|
|
6,656 |
|
|
(279 |
) |
|
179,701 |
|
|
FNMA |
|
|
148,304 |
|
|
4,387 |
|
|
(221 |
) |
|
152,470 |
|
|
GNMA |
|
|
48,684 |
|
|
113 |
|
|
(314 |
) |
|
48,483 |
|
|
|
|
|
|
|
|
|
|
|
|
|
|
|
|
|
Total Securities Available for Sale |
|
$ |
405,530 |
|
$ |
11,543 |
|
$ |
(1,088 |
) |
$ |
415,985 |
|
|
|
|
|
|
|
|
|
|
|
|
|
|
|
|
The amortized cost and estimated fair value of securities held to maturity and available for sale at December 31, 2010, by contractual maturity, are shown in the following table (in thousands). Expected maturities will differ from contractual maturities because borrowers may have the right to call or prepay obligations with or without call or prepayment penalties.
65
|
|
|
|
|
|
|
|
|
|
|
|
Amortized |
|
Estimated |
|
||
|
|
|
|
|
|
|
||
|
Securities Held to Maturity: |
|
|
|
|
|
|
|
|
Due after one year through five years |
|
$ |
8,000 |
|
$ |
7,960 |
|
|
Due after five years through ten years |
|
|
14,000 |
|
|
13,930 |
|
|
|
|
|
|
|
|
|
|
|
Total Securities Held to Maturity |
|
|
22,000 |
|
|
21,890 |
|
|
|
|
|
|
|
|
|
|
|
Securities Available for Sale: |
|
|
|
|
|
|
|
|
Due after one year through five years |
|
|
8,631 |
|
|
8,736 |
|
|
Due after five years through ten years |
|
|
21,160 |
|
|
20,921 |
|
|
Due after ten years |
|
|
12,986 |
|
|
12,805 |
|
|
|
|
|
|
|
|
|
|
|
Subtotal |
|
|
42,777 |
|
|
42,462 |
|
|
Mortgage-backed securities and collateralized mortgage obligations - residential |
|
|
307,755 |
|
|
313,837 |
|
|
Mortgage-backed securities and collateralized mortgage obligations - commercial |
|
|
5,101 |
|
|
4,859 |
|
|
|
|
|
|
|
|
|
|
|
Total Securities Available for Sale |
|
|
355,633 |
|
|
361,158 |
|
|
|
|
|
|
|
|
|
|
|
Total Securities |
|
$ |
377,633 |
|
$ |
383,048 |
|
|
|
|
|
|
|
|
|
|
The proceeds from sales of securities available for sale and the associated recognized gross gains, gross losses and taxes are shown below (in thousands):
|
|
|
|
|
|
|
|
|
|
|
|
|
|
|
2010 |
|
2009 |
|
2008 |
|
|||
|
|
|
|
|
|||||||
|
Proceeds |
|
$ |
102,522 |
|
$ |
116,387 |
|
$ |
88,002 |
|
|
Gross gains |
|
|
3,524 |
|
|
1,379 |
|
|
302 |
|
|
Gross losses |
|
|
5 |
|
|
385 |
|
|
254 |
|
|
Tax provision |
|
|
1,397 |
|
|
394 |
|
|
18 |
|
At December 31, 2010 and 2009, the Company owned no securities for one issuer in excess of 10% of stockholders’ equity other than the U.S. Government and its agencies.
Securities available for sale with an amortized cost of $273 million and $360 million and an estimated fair value of $281 million and $358 million at December 31, 2010 and 2009, respectively, were pledged for public deposits and short-term borrowings.
In estimating other-than-temporary losses, management considers: (1) the length of time and extent that fair value has been less than cost, (2) the financial condition and near term prospects of the issuer, (3) whether the market decline was affected by macroeconomic conditions and (4) whether the Company has the intent to sell the debt security or more likely than not will be required to sell the debt security before its anticipated recovery. In analyzing an issuer’s financial condition, the Company’s management considers whether the securities are issued by the U.S. Government or its agencies, whether downgrades by bond rating agencies have occurred and industry analysts’ reports.
In the first quarter of 2009, a $4.0 million non-cash OTTI write down to fair value was recorded on one $10 million par value trust preferred collateralized debt obligation (“CDO”) that had previously incurred a non-cash OTTI write down of $5.2 million in the fourth quarter of 2008. Management determined that it intended to sell this bond and continued to review developments and other considerations with respect to this trust preferred CDO, including the limited prospects for its ultimate price recovery, the expected time involved and the downside risks involved in continuing to hold this investment. As a result of this review and with some limited liquidity appearing in the trust preferred CDO market, management determined that an immediate liquidation was appropriate. As a result, the bond was liquidated in July
66
2009 at a price of 13.45% of par representing a gain of 5.2% of par or $520 thousand which was recognized in the Company’s third quarter 2009 financial statements.
Information pertaining to securities with gross unrealized losses at December 31, 2010 and 2009, aggregated by investment category and length of time that individual securities have been in a continuous loss position, follows (in thousands):
|
|
|
|
|
|
|
|
|
|
|
|
|
|
|
|
|
|
|
|
|
|
|
|
Less than 12 Months |
|
12 Months or Longer |
|
Total |
|
||||||||||||
|
|
|
|
|
||||||||||||||||
|
|
|
Gross |
|
Estimated |
|
Gross |
|
Estimated |
|
Gross |
|
Estimated |
|
||||||
|
|
|
|
|
|
|
|
|
|
|
|
|
|
|
|
|
|
|
|
|
|
December 31, 2010 |
|
|
|
|
|
|
|
|
|
|
|
|
|
|
|
|
|
|
|
|
Securities Held to Maturity: |
|
|
|
|
|
|
|
|
|
|
|
|
|
|
|
|
|
|
|
|
Corporate securities |
|
$ |
(110 |
) |
$ |
21,890 |
|
$ |
— |
|
$ |
— |
|
$ |
(110 |
) |
$ |
21,890 |
|
|
|
|
|
|
|
|
|
|
|
|
|
|
|
|
|
|
|
|
|
|
|
Securities Available for Sale: |
|
|
|
|
|
|
|
|
|
|
|
|
|
|
|
|
|
|
|
|
Government agency securities |
|
|
(514 |
) |
|
14,478 |
|
|
— |
|
|
— |
|
|
(514 |
) |
|
14,478 |
|
|
Mortgage-backed securities and collateralized mortgage obligations - residential: |
|
|
|
|
|
|
|
|
|
|
|
|
|
|
|
|
|
|
|
|
FHLMC |
|
|
(95 |
) |
|
9,702 |
|
|
— |
|
|
— |
|
|
(95 |
) |
|
9,702 |
|
|
FNMA |
|
|
(414 |
) |
|
35,991 |
|
|
— |
|
|
— |
|
|
(414 |
) |
|
35,991 |
|
|
GNMA |
|
|
(1,050 |
) |
|
37,015 |
|
|
— |
|
|
— |
|
|
(1,050 |
) |
|
37,015 |
|
|
Mortgage-backed securities and collateralized mortgage obligations - commercial: |
|
|
|
|
|
|
|
|
|
|
|
|
|
|
|
|
|
|
|
|
GNMA |
|
|
(242 |
) |
|
4,859 |
|
|
— |
|
|
— |
|
|
(242 |
) |
|
4,859 |
|
|
|
|
|
|
|
|
|
|
|
|
|
|
|
|
|
|
|
|
|
|
|
Total Securities Available for Sale |
|
|
(2,315 |
) |
|
102,045 |
|
|
— |
|
|
— |
|
|
(2,315 |
) |
|
102,045 |
|
|
|
|
|
|
|
|
|
|
|
|
|
|
|
|
|
|
|
|
|
|
|
Total Securities |
|
$ |
(2,425 |
) |
$ |
123,935 |
|
$ |
— |
|
$ |
— |
|
$ |
(2,425 |
) |
$ |
123,935 |
|
|
|
|
|
|
|
|
|
|
|
|
|
|
|
|
|
|
|
|
|
|
|
|
|
|
|
|
|
|
|
|
|
|
|
|
|
|
|
|
|
|
|
|
December 31, 2009 |
|
|
|
|
|
|
|
|
|
|
|
|
|
|
|
|
|
|
|
|
Securities Available for Sale: |
|
|
|
|
|
|
|
|
|
|
|
|
|
|
|
|
|
|
|
|
Obligations of states and political subdivisions |
|
$ |
(86 |
) |
$ |
4,781 |
|
$ |
— |
|
$ |
— |
|
$ |
(86 |
) |
$ |
4,781 |
|
|
Government agency securities |
|
|
(188 |
) |
|
10,625 |
|
|
— |
|
|
— |
|
|
(188 |
) |
|
10,625 |
|
|
Mortgage-backed securities and collateralized mortgage obligations - residential: |
|
|
|
|
|
|
|
|
|
|
|
|
|
|
|
|
|
|
|
|
FHLMC |
|
|
(279 |
) |
|
25,784 |
|
|
— |
|
|
— |
|
|
(279 |
) |
|
25,784 |
|
|
FNMA |
|
|
(221 |
) |
|
32,998 |
|
|
— |
|
|
— |
|
|
(221 |
) |
|
32,998 |
|
|
GNMA |
|
|
(314 |
) |
|
37,859 |
|
|
— |
|
|
— |
|
|
(314 |
) |
|
37,859 |
|
|
|
|
|
|
|
|
|
|
|
|
|
|
|
|
|
|
|
|
|
|
|
Total Securities Available for Sale |
|
$ |
(1,088 |
) |
$ |
112,047 |
|
$ |
— |
|
$ |
— |
|
$ |
(1,088 |
) |
$ |
112,047 |
|
|
|
|
|
|
|
|
|
|
|
|
|
|
|
|
|
|
|
|
|
|
Unrealized losses have not been recognized in operations because the issuers’ bonds are of high credit quality, management does not intend to sell and it is not more likely than not that management would be required to sell the securities prior to recovery, and the decline in fair value is largely due to fluctuations in interest rates.
In the case of adjustable rate securities, the coupon rate resets periodically and is typically comprised of a base market index rate plus a spread. The market value on these securities is primarily influenced by the length of time remaining before the coupon rate resets to market levels. As an adjustable rate security approaches that reset date, it is likely that an unrealized loss position would dissipate.
The market value for fixed rate securities changes inversely with changes in interest rates. When interest rates are falling, the market value of fixed rate securities will appreciate, whereas in a rising interest rate environment, the market value of fixed rate securities will depreciate. The market value of fixed rate securities is also affected with the passage of time. As a fixed rate security approaches its maturity date, the market value of the security typically approaches its par value.
3. Loans – Net
67
At December 31, 2010 and 2009, net loans disaggregated by class consisted of the following (in thousands):
|
|
|
|
|
|
|
|
|
|
|
|
2010 |
|
2009 |
|
||
|
|
|
|
|
|
|
|
|
|
Commercial and industrial - owner-occupied mortgage |
|
$ |
191,913 |
|
$ |
195,557 |
|
|
Commercial and industrial - general purpose |
|
|
339,447 |
|
|
348,546 |
|
|
Real estate - commercial mortgage |
|
|
449,861 |
|
|
374,406 |
|
|
Real estate - residential mortgage |
|
|
83,696 |
|
|
95,668 |
|
|
Real estate - commercial construction |
|
|
44,331 |
|
|
50,175 |
|
|
Real estate - residential construction |
|
|
14,910 |
|
|
25,740 |
|
|
Loans to individuals |
|
|
4,770 |
|
|
4,667 |
|
|
Tax exempt and other |
|
|
2,442 |
|
|
2,876 |
|
|
|
|
|
|
|
|
|
|
|
Loans - net of unearned income |
|
|
1,131,370 |
|
|
1,097,635 |
|
|
Less: Allowance for loan losses |
|
|
33,078 |
|
|
28,711 |
|
|
|
|
|
|
|
|
|
|
|
Loans - net |
|
$ |
1,098,292 |
|
$ |
1,068,924 |
|
|
|
|
|
|
|
|
|
|
The Bank’s real estate loans and loan commitments are primarily for properties located throughout Long Island, New York. It is the Bank’s goal to diversify risk among a broad range of industries and to monitor concentration and associated levels of risk on an ongoing basis. Real estate operators, lessors and developers represented the largest industry concentration at $473 million and $387 million at December 31, 2010 and 2009, respectively, and the only concentration greater than 10% of total loans at those dates. Repayment of these loans is dependent in part upon the overall economic health of the Company’s market area and current real estate values. The Bank considers the credit circumstances, the nature of the project and loan to value ratios for all real estate loans.
The Bank makes loans to its directors and executive officers, and other related parties, in the ordinary course of its business. Loans made to directors and executive officers, either directly or indirectly, totaled $498 thousand, $475 thousand, and $1 million at December 31, 2010, 2009 and 2008, respectively. New loans totaling $377 thousand, $631 thousand and $1 million were extended and payments of $354 thousand, $1 million and $3 million were received during 2010, 2009 and 2008, respectively, on these loans.
Activity in the allowance for loan losses for the three years ended December 31, 2010 is as follows (in thousands):
|
|
|
|
|
|
|
|
|
|
|
|
|
|
|
2010 |
|
2009 |
|
2008 |
|
|||
|
|
|
|
|
|
|
|
|
|
|
|
|
Balance, January 1 |
|
$ |
28,711 |
|
$ |
18,668 |
|
$ |
14,705 |
|
|
Adjustment due to sale of SB Equipment assets |
|
|
— |
|
|
— |
|
|
(2,002 |
) |
|
Provision charged to operations |
|
|
12,900 |
|
|
39,500 |
|
|
17,226 |
|
|
Charge-offs |
|
|
(9,599 |
) |
|
(16,894 |
) |
|
(5,675 |
) |
|
Write-downs incurred on the transfer of loans to loans held for sale |
|
|
— |
|
|
(13,255 |
) |
|
(5,914 |
) |
|
Recoveries |
|
|
1,066 |
|
|
692 |
|
|
328 |
|
|
|
|
|
|
|
|
|
|
|
|
|
|
Balance, December 31 |
|
$ |
33,078 |
|
$ |
28,711 |
|
$ |
18,668 |
|
|
|
|
|
|
|
|
|
|
|
|
|
For the year ended December 31, 2010, the ending balance in the allowance for loan losses disaggregated by portfolio segment and impairment methodology is as follows (in thousands). Also in the table below are total loans at December 31, 2010 disaggregated by portfolio segment and impairment methodology (in thousands).
68
|
|
|
|
|
|
|
|
|
|
|
|
|
|
|
|
|
|
|
|
|
|
|
|
|
|
|
Commercial |
|
Real estate - |
|
Real estate - |
|
Loans to |
|
Tax exempt |
|
Unallocated |
|
Total |
|
|||||||
|
|
|
|
|
|
|
|
|
|
|
|
|
|
|
|
|
|
|
|
|
|
|
|
|
Total allowance for loan losses: |
|
|
|
|
|
|
|
|
|
|
|
|
|
|
|
|
|
|
|
|
|
|
|
Individually evaluated for impairment |
|
$ |
11,728 |
|
$ |
729 |
|
$ |
123 |
|
$ |
— |
|
$ |
— |
|
$ |
— |
|
$ |
12,580 |
|
|
Collectively evaluated for impairment |
|
|
8,416 |
|
|
7,164 |
|
|
1,686 |
|
|
181 |
|
|
17 |
|
|
3,034 |
|
|
20,498 |
|
|
|
|
|
|
|
|
|
|
|
|
|
|
|
|
|
|
|
|
|
|
|
|
|
|
Ending balance |
|
$ |
20,144 |
|
$ |
7,893 |
|
$ |
1,809 |
|
$ |
181 |
|
$ |
17 |
|
$ |
3,034 |
|
$ |
33,078 |
|
|
|
|
|
|
|
|
|
|
|
|
|
|
|
|
|
|
|
|
|
|
|
|
|
|
|
|
|
|
|
|
|
|
|
|
|
|
|
|
|
|
|
|
|
|
|
|
|
|
Total loans: |
|
|
|
|
|
|
|
|
|
|
|
|
|
|
|
|
|
|
|
|
|
|
|
Individually evaluated for impairment |
|
$ |
30,049 |
|
$ |
8,184 |
|
$ |
1,877 |
|
$ |
— |
|
$ |
— |
|
$ |
— |
|
$ |
40,110 |
|
|
Collectively evaluated for impairment |
|
|
501,311 |
|
|
486,008 |
|
|
96,729 |
|
|
4,770 |
|
|
2,442 |
|
|
— |
|
|
1,091,260 |
|
|
|
|
|
|
|
|
|
|
|
|
|
|
|
|
|
|
|
|
|
|
|
|
|
|
Ending balance |
|
$ |
531,360 |
|
$ |
494,192 |
|
$ |
98,606 |
|
$ |
4,770 |
|
$ |
2,442 |
|
$ |
— |
|
$ |
1,131,370 |
|
|
|
|
|
|
|
|
|
|
|
|
|
|
|
|
|
|
|
|
|
|
|
|
|
During 2010 there have been no changes in the accounting policies or methodology for determining and recording the provision for loan losses.
As of December 31, 2010, 2009 and 2008, the recorded investment in loans that are considered to be impaired is summarized below (in thousands).
|
|
|
|
|
|
|
|
|
|
|
|
|
|
|
|
2010 |
|
|
2009 |
|
|
2008 |
|
|
|
|
|
|
|
|
|
|
|
|
|
|
Troubled debt restructurings with related allowances for loss |
|
$ |
26,500 |
|
$ |
— |
|
$ |
— |
|
|
Allowance for loan loss specifically allocated to troubled debt restructurings |
|
|
(8,158 |
) |
|
— |
|
|
— |
|
|
|
|
|
|
|
|
|
|
|
|
|
|
|
|
|
18,342 |
|
|
— |
|
|
— |
|
|
Troubled debt restructurings with no related allowance for loan loss |
|
|
547 |
|
|
548 |
|
|
436 |
|
|
|
|
|
|
|
|
|
|
|
|
|
|
Net troubled debt restructurings |
|
|
18,889 |
|
|
548 |
|
|
436 |
|
|
|
|
|
|
|
|
|
|
|
|
|
|
|
|
|
|
|
|
|
|
|
|
|
|
Other impaired loans with related allowances for loss |
|
|
13,610 |
|
|
4,431 |
|
|
11,909 |
|
|
Allowance for loan loss specifically allocated to other impaired loans |
|
|
(4,422 |
) |
|
(836 |
) |
|
(1,955 |
) |
|
|
|
|
|
|
|
|
|
|
|
|
|
|
|
|
9,188 |
|
|
3,595 |
|
|
9,954 |
|
|
Other impaired loans with no related allowance for loan loss |
|
|
— |
|
|
600 |
|
|
— |
|
|
|
|
|
|
|
|
|
|
|
|
|
|
Net other impaired loans |
|
|
9,188 |
|
|
4,195 |
|
|
9,954 |
|
|
|
|
|
|
|
|
|
|
|
|
|
|
|
|
|
|
|
|
|
|
|
|
|
|
Total net impaired loans |
|
$ |
28,077 |
|
$ |
4,743 |
|
$ |
10,390 |
|
|
|
|
|
|
|
|
|
|
|
|
|
|
Average impaired loan balance |
|
$ |
15,020 |
|
$ |
16,721 |
|
$ |
12,008 |
|
|
Interest income recognized on impaired loans |
|
$ |
416 |
|
$ |
95 |
|
$ |
88 |
|
The Company has troubled debt restructurings that include two $10 million commercial loans which are approximately 60 days past due at December 31, 2010 and a $7 million commercial real estate loan which is performing according to its new terms. Generally, the loan amounts were less than the minimum required by our policy for specific impairment valuation. The Company’s troubled debt restructurings primarily resulted from interest rate concessions and maturity extensions. The Company has allocated $8 million of specific reserves to customers whose loan terms have been modified in troubled debt restructurings as of December 31, 2010. The Company has no commitments to lend any additional amounts to customers with outstanding loans that are classified as troubled debt restructurings.
The following table presents the Company’s impaired loans disaggregated by class for the year ended December 31, 2010 (in thousands).
69
|
|
|
|
|
|
|
|
|
|
|
|
|
|
|
|
|
|
|
|
|
Recorded |
|
Unpaid principal |
|
Related allowance |
|
Average recorded |
|
Interest income |
|
|||||
|
|
|
|
|
|
|
|
|
|
|
|
|
|
|
|
|
|
|
With an allowance recorded: |
|
|
|
|
|
|
|
|
|
|
|
|
|
|
|
|
|
Commercial and industrial - general purpose |
|
$ |
30,049 |
|
$ |
30,132 |
|
$ |
11,728 |
|
$ |
8,026 |
|
$ |
204 |
|
|
Real estate - commercial mortgage |
|
|
1,684 |
|
|
1,743 |
|
|
247 |
|
|
882 |
|
|
— |
|
|
Real estate - residential mortgage |
|
|
799 |
|
|
799 |
|
|
79 |
|
|
403 |
|
|
— |
|
|
Real estate - commercial construction |
|
|
6,500 |
|
|
6,500 |
|
|
482 |
|
|
4,897 |
|
|
212 |
|
|
Real estate - residential construction |
|
|
1,078 |
|
|
1,078 |
|
|
44 |
|
|
812 |
|
|
— |
|
|
|
|
|
|
|
|
|
|
|
|
|
|
|
|
|
|
|
|
Totals |
|
$ |
40,110 |
|
$ |
40,252 |
|
$ |
12,580 |
|
$ |
15,020 |
|
$ |
416 |
|
|
|
|
|
|
|
|
|
|
|
|
|
|
|
|
|
|
|
|
|
|
|
|
|
|
|
|
|
|
|
|
|
|
|
|
|
|
With no related allowance recorded: |
|
|
|
|
|
|
|
|
|
|
|
|
|
|
|
|
|
Commercial and industrial - general purpose |
|
$ |
104 |
|
$ |
104 |
|
$ |
— |
|
$ |
132 |
|
$ |
14 |
|
|
Real estate - residential mortgage |
|
|
427 |
|
|
427 |
|
|
— |
|
|
432 |
|
|
17 |
|
|
Loans to individuals |
|
|
16 |
|
|
16 |
|
|
— |
|
|
18 |
|
|
1 |
|
|
|
|
|
|
|
|
|
|
|
|
|
|
|
|
|
|
|
|
Totals |
|
$ |
547 |
|
$ |
547 |
|
$ |
— |
|
$ |
582 |
|
$ |
32 |
|
|
|
|
|
|
|
|
|
|
|
|
|
|
|
|
|
|
|
At December 31, 2010, 2009 and 2008, loans with unpaid principal balances on which the Bank is no longer accruing interest income were $15 million, $7 million and $16 million, respectively. Interest income would have been approximately $590 thousand, $735 thousand and $951 thousand greater in 2010, 2009 and 2008 respectively, had these loans been current. There was no interest income recognized on non-accrual loans during 2010. Interest income on non-accrual loans amounted to approximately $6 thousand and $68 thousand for 2009 and 2008, respectively. At December 31, 2010 there were three loans totaling $104 thousand restructured and no longer accruing interest. At December 31, 2010, there were five loans with an aggregate principal balance of $27 million restructured and still accruing interest. At December 31, 2009, there was one loan, a residential real estate loan with a principal balance of $436 thousand restructured and still accruing interest. At December 31, 2008 there were no restructured loans still accruing interest. At December 31, 2010, 2009 and 2008, loans 90 days or more past due and still accruing interest totaled $1 thousand, $4 million and $3 thousand, respectively.
The following table presents the recorded investment in non-accrual and past due loans over 90 days still on accrual as of December 31, 2010 disaggregated by class (in thousands).
|
|
|
|
|
|
|
|
|
|
|
|
Non-accrual |
|
Loans past due |
|
||
|
|
|
|
|
|
|
|
|
|
Commercial and industrial - general purpose |
|
$ |
11,017 |
|
$ |
— |
|
|
Real estate - commercial mortgage |
|
|
1,684 |
|
|
— |
|
|
Real estate - residential mortgage |
|
|
973 |
|
|
— |
|
|
Real estate - residential construction |
|
|
1,078 |
|
|
— |
|
|
Loans to individuals |
|
|
104 |
|
|
1 |
|
|
|
|
|
|
|
|
|
|
|
Total |
|
$ |
14,856 |
|
$ |
1 |
|
|
|
|
|
|
|
|
|
|
At December 31, 2010, past due loans disaggregated by class were as follows (in thousands).
70
|
|
|
|
|
|
|
|
|
|
|
|
|
|
|
|
|
|
|
|
|
|
|
|
|
|
|
30 - 59 days past |
|
60 - 89 days past |
|
Greater than 90 |
|
Non-accrual loans |
|
Total past due |
|
Loans not past due |
|
Total loans |
|
|||||||
|
|
|
|
|
|
|
|
|
|
|
|
|
|
|
|
|
|
|
|
|
|
|
|
|
Commercial and industrial - owner-occupied mortgage |
|
$ |
— |
|
$ |
— |
|
$ |
— |
|
$ |
— |
|
$ |
— |
|
$ |
191,913 |
|
$ |
191,913 |
|
|
Commercial and industrial - general purpose |
|
|
452 |
|
|
20,247 |
|
|
— |
|
|
11,017 |
|
|
31,716 |
|
|
307,731 |
|
|
339,447 |
|
|
Real estate - commercial mortgage |
|
|
1,344 |
|
|
3,341 |
|
|
— |
|
|
1,684 |
|
|
6,369 |
|
|
443,492 |
|
|
449,861 |
|
|
Real estate - residential mortgage |
|
|
198 |
|
|
175 |
|
|
— |
|
|
973 |
|
|
1,346 |
|
|
82,350 |
|
|
83,696 |
|
|
Real estate - commercial construction |
|
|
— |
|
|
— |
|
|
— |
|
|
— |
|
|
— |
|
|
44,331 |
|
|
44,331 |
|
|
Real estate - residential construction |
|
|
— |
|
|
— |
|
|
— |
|
|
1,078 |
|
|
1,078 |
|
|
13,832 |
|
|
14,910 |
|
|
Loans to individuals |
|
|
24 |
|
|
8 |
|
|
1 |
|
|
104 |
|
|
137 |
|
|
4,633 |
|
|
4,770 |
|
|
Tax exempt and other |
|
|
— |
|
|
— |
|
|
— |
|
|
— |
|
|
— |
|
|
2,442 |
|
|
2,442 |
|
|
|
|
|
|
|
|
|
|
|
|
|
|
|
|
|
|
|
|
|
|
|
|
|
|
Total |
|
$ |
2,018 |
|
$ |
23,771 |
|
$ |
1 |
|
$ |
14,856 |
|
$ |
40,646 |
|
$ |
1,090,724 |
|
$ |
1,131,370 |
|
|
|
|
|
|
|
|
|
|
|
|
|
|
|
|
|
|
|
|
|
|
|
|
|
At December 31, 2010 there were no loans held for sale. At December 31, 2009, the Company had $520 thousand in residential construction loans, $83 thousand in commercial real estate loans and $67 thousand in commercial and industrial loans held for sale. These loans were sold during the first and second quarters of 2010. A gain of $323 thousand was recognized on the sale of the residential construction loans. No gain or loss was recognized on the other loans sold.
During 2010 the Company sold an additional $16 million in loans. Of these loans, $11 million were commercial real estate loans, $5 million were residential construction loans and $51 thousand were commercial and industrial loans. All of the sold loans were of deteriorating credit quality and demonstrated material weaknesses making full recapture of principal and interest questionable. Charge-offs amounting to $6 million on the commercial real estate loans, $1 million on the residential construction loans and $9 thousand on the commercial and industrial loans had been taken. No gain or loss was recognized upon the sale of these loans.
At December 31, 2010 and based upon the most recent analysis performed, the following table presents the Company’s loan portfolio credit risk profile by internally assigned grade disaggregated by class of loan (in thousands).
|
|
|
|
|
|
|
|
|
|
|
|
|
|
|
|
|
|
|
|
|
|
|
|
|
|
|
|
|
|
|
|
|
Commercial and |
|
Commercial and |
|
Real estate - |
|
Real estate - |
|
Real estate - |
|
Real estate - |
|
Loans to |
|
Tax exempt and |
|
Total |
|
|||||||||
|
|
|
|
|
|
|
|
|
|
|
|
|
|
|
|
|
|
|
|
|
|
|
|
|
|
|
|
|
|
|
Watch list loans: |
|
|
|
|
|
|
|
|
|
|
|
|
|
|
|
|
|
|
|
|
|
|
|
|
|
|
|
|
|
Loans requiring special attention but neither criticized nor classified |
|
$ |
2,916 |
|
$ |
18,267 |
|
$ |
15,059 |
|
$ |
2,057 |
|
$ |
— |
|
$ |
3,147 |
|
$ |
140 |
|
$ |
— |
|
$ |
41,586 |
|
|
Special mention |
|
|
2,526 |
|
|
16,221 |
|
|
26,226 |
|
|
97 |
|
|
4,576 |
|
|
4,804 |
|
|
869 |
|
|
— |
|
|
55,319 |
|
|
Substandard |
|
|
7,906 |
|
|
24,244 |
|
|
11,887 |
|
|
2,222 |
|
|
6,500 |
|
|
3,027 |
|
|
562 |
|
|
— |
|
|
56,348 |
|
|
Doubtful |
|
|
— |
|
|
12,717 |
|
|
— |
|
|
— |
|
|
— |
|
|
— |
|
|
28 |
|
|
— |
|
|
12,745 |
|
|
Loss |
|
|
— |
|
|
— |
|
|
— |
|
|
— |
|
|
— |
|
|
— |
|
|
— |
|
|
— |
|
|
— |
|
|
|
|
|
|
|
|
|
|
|
|
|
|
|
|
|
|
|
|
|
|
|
|
|
|
|
|
|
|
|
|
Total watch list loans |
|
|
13,348 |
|
|
71,449 |
|
|
53,172 |
|
|
4,376 |
|
|
11,076 |
|
|
10,978 |
|
|
1,599 |
|
|
— |
|
|
165,998 |
|
|
|
|
|
|
|
|
|
|
|
|
|
|
|
|
|
|
|
|
|
|
|
|
|
|
|
|
|
|
|
|
Pass |
|
|
178,565 |
|
|
267,998 |
|
|
396,689 |
|
|
— |
|
|
33,255 |
|
|
3,932 |
|
|
— |
|
|
2,442 |
|
|
882,881 |
|
|
Performing (1) |
|
|
— |
|
|
— |
|
|
— |
|
|
79,320 |
|
|
— |
|
|
— |
|
|
3,171 |
|
|
— |
|
|
82,491 |
|
|
|
|
|
|
|
|
|
|
|
|
|
|
|
|
|
|
|
|
|
|
|
|
|
|
|
|
|
|
|
|
Total loans |
|
$ |
191,913 |
|
$ |
339,447 |
|
$ |
449,861 |
|
$ |
83,696 |
|
$ |
44,331 |
|
$ |
14,910 |
|
$ |
4,770 |
|
$ |
2,442 |
|
$ |
1,131,370 |
|
|
|
|
|
|
|
|
|
|
|
|
|
|
|
|
|
|
|
|
|
|
|
|
|
|
|
|
|
|
|
(1) In general, certain homogeneous loans are not risk-graded, but rather measured based upon payment performance. Loans categorized here are typically performing as agreed upon with the borrower.
Watch list loans consist of criticized loans, classified loans, and those loans requiring special attention but not warranting categorization as either criticized or classified. Criticized loans, i.e. special mention loans, have potential weaknesses, often temporary in nature, requiring management’s extra vigilance. Classified loans, i.e. substandard, doubtful and loss loans, exhibit more serious weaknesses and generally carry a higher risk of loss. Such loans require more intensive oversight, remediation plans and, if problems remain unresolved, a workout strategy is developed.
At December 31, 2010, 2009 and 2008, commercial real estate loans of $237 million, $185 million and $180 million, respectively, were pledged as collateral for borrowings from the FHLB.
71
4. Bank Premises and Equipment – Net
At December 31, 2010 and 2009, Bank premises and equipment consisted of the following (in thousands):
|
|
|
|
|
|
|
|
|
|
|
|
|
|
|
Cost |
|
Accumulated |
|
Net Book |
|
|||
|
|
|
|
|
|
|
|
|
|
|
|
|
December 31, 2010: |
|
|
|
|
|
|
|
|
|
|
|
Building |
|
$ |
3,301 |
|
$ |
1,824 |
|
$ |
1,477 |
|
|
Leasehold improvements |
|
|
6,281 |
|
|
3,767 |
|
|
2,514 |
|
|
Furniture and fixtures |
|
|
5,670 |
|
|
4,348 |
|
|
1,322 |
|
|
Computer equipment and software |
|
|
6,410 |
|
|
5,459 |
|
|
951 |
|
|
|
|
|
|
|
|
|
|
|
|
|
|
Total |
|
$ |
21,662 |
|
$ |
15,398 |
|
$ |
6,264 |
|
|
|
|
|
|
|
|
|
|
|
|
|
|
|
|
|
|
|
|
|
|
|
|
|
|
December 31, 2009: |
|
|
|
|
|
|
|
|
|
|
|
Building |
|
$ |
3,206 |
|
$ |
1,683 |
|
$ |
1,523 |
|
|
Leasehold improvements |
|
|
5,878 |
|
|
3,333 |
|
|
2,545 |
|
|
Furniture and fixtures |
|
|
5,318 |
|
|
4,158 |
|
|
1,160 |
|
|
Computer equipment and software |
|
|
6,018 |
|
|
4,908 |
|
|
1,110 |
|
|
|
|
|
|
|
|
|
|
|
|
|
|
Total |
|
$ |
20,420 |
|
$ |
14,082 |
|
$ |
6,338 |
|
|
|
|
|
|
|
|
|
|
|
|
|
Depreciation expense totaled $1.6 million for each of the years ended December 31, 2010, 2009 and 2008.
5. Other Assets
At December 31, 2010 and 2009, other assets consisted of the following (in thousands):
|
|
|
|
|
|
|
|
|
|
|
|
|
2010 |
|
|
2009 |
|
|
|
|
|
|
|
|
|
|
|
Interest receivable - investments |
|
$ |
1,505 |
|
$ |
2,020 |
|
|
Interest receivable - loans |
|
|
4,271 |
|
|
4,117 |
|
|
Prepaid expenses |
|
|
1,800 |
|
|
2,169 |
|
|
Principal receivable - Mortgage-backed securities |
|
|
489 |
|
|
636 |
|
|
Gross positive fair value of derivative contracts |
|
|
2,111 |
|
|
1,836 |
|
|
Overnight sweep and settlement accounts, net |
|
|
45 |
|
|
678 |
|
|
Other |
|
|
1,292 |
|
|
2,741 |
|
|
|
|
|
|
|
|
|
|
|
Total |
|
$ |
11,513 |
|
$ |
14,197 |
|
|
|
|
|
|
|
|
|
|
6. Deposits
At December 31, 2010 and 2009, certificates of deposit of $100 thousand or more were $203 million and $189 million, respectively. Scheduled maturities of all certificates of deposit are as follows (in thousands):
72
|
|
|
|
|
|
|
2011 |
|
$ |
298,349 |
|
|
2012 |
|
|
34,556 |
|
|
2013 |
|
|
17,433 |
|
|
2014 |
|
|
7,359 |
|
|
2015 |
|
|
15,282 |
|
|
|
|
|
|
|
|
Total |
|
$ |
372,979 |
|
|
|
|
|
|
|
7. Lines Of Credit and Other Temporary Borrowings
As of December 31, 2010 and 2009, correspondent banks extended unsecured lines of credit aggregating $73 million and $81 million, respectively, to the Bank for the purchase of federal funds and for foreign exchange transactions. At December 31, 2010, correspondent banks also extended secured lines of credit aggregating $5 million. Federal funds purchased generally mature within one to seven days from the transaction date. Securities sold under agreements to repurchase mature within five years.
In addition to the above, the Bank may use a secured line of credit with the FHLB for overnight funding or on a term basis to match fund asset purchases. Based upon a multiple of the FHLB stock that the Bank currently owns combined with approximately $256 million of collateral, including approximately $237 million in commercial real estate loans, it currently has pledged at FHLB, approximately $180 million of this line may be drawn on a term or overnight basis. The FHLB line is renewed annually.
The following summarizes borrowed funds at December 31, 2010 and 2009 (dollars in thousands):
|
|
|
|
|
|
|
|
|
|
|
|
|
|
|
|
|
|
|
|
|
|
|
|
Outstanding at December 31, |
|
Average Amount Outstanding |
|
Weighted-Average Interest Rate |
|
||||||||||||
|
|
|
|
|
|
|
|
|
||||||||||||
|
|
|
2010 |
|
2009 |
|
2010 |
|
2009 |
|
2010 |
|
2009 |
|
||||||
|
|
|
|
|
|
|
|
|
|
|
|
|
|
|
|
|
|
|
|
|
|
Federal funds purchased |
|
$ |
— |
|
$ |
— |
|
$ |
74 |
|
$ |
225 |
|
|
0.60 |
% |
|
0.44 |
% |
|
Securities sold under agreements to repurchase |
|
$ |
3,000 |
|
$ |
3,000 |
|
$ |
3,000 |
|
$ |
3,863 |
|
|
1.88 |
% |
|
1.55 |
% |
|
FHLB - overnight and term |
|
$ |
22,000 |
|
$ |
45,000 |
|
$ |
7,386 |
|
$ |
12,805 |
|
|
0.45 |
% |
|
0.43 |
% |
For securities sold under agreements to repurchase, the following table provides additional information (dollars in thousands):
|
|
|
|
|
|
|
|
|
|
|
|
|
2010 |
|
|
2009 |
|
|
|
|
|
|
|
|
|
|
|
Maximum outstanding at any month end |
|
$ |
3,000 |
|
$ |
3,000 |
|
|
|
|
|
|
|
|
|
|
|
Weighted-average interest rate on balance, December 31, |
|
|
1.88 |
% |
|
1.88 |
% |
Of the total borrowings outstanding at December 31, 2010, required payments of $23 million and $2 million will be made in 2011 and 2014, respectively.
8. Senior Unsecured Debt, Subordinated Notes and Junior Subordinated Debentures
On March 31, 2009, the Bank issued $29 million in senior unsecured debt due March 30, 2012 guaranteed by the FDIC under the FDIC’s TLGP. Interest at 2.625% per annum is payable semi-annually in arrears on the 30th day of each March and September.
In 2006, the Company issued $10 million in aggregate principal amount of its 8.25% Subordinated Notes due June 15, 2013 (the “Notes”) pursuant to a purchase agreement dated June 6, 2006 between the Company and the initial purchaser named therein. The Notes were issued pursuant to an Indenture dated June 8, 2006 by and between the Company and Wilmington Trust Company, as trustee (the “Indenture”). The Notes were unsecured and ranked subordinate and junior to all of the Company’s senior indebtedness to the extent and in
73
the manner set forth in the Indenture. Interest on the Notes was payable semi-annually in arrears at an annual rate of 8.25% on June 15 and December 15 of each year, beginning December 15, 2006. The Notes were scheduled to mature on June 15, 2013 and were not redeemable before that date. The net proceeds from the sale of the Notes, after deducting offering expenses and the initial purchaser’s discount, were approximately $9.5 million and qualified as Tier II capital for the Company. The Company contributed proceeds from the offering to the Bank which qualified as Tier I capital. The Notes were not registered under the Securities Act of 1933, as amended, or any state securities laws, and may not have been offered or sold in the United States absent registration or an applicable exemption from registration requirements. In December 2009, the Company exchanged the Notes plus accrued interest and a premium for an aggregate of 1,656,600 shares of common stock. Each share of common stock in the exchange was valued at $6.50.
In 2002, State Bancorp Capital Trust I (“Trust I”), subsidiary of the Company and a statutory trust created under the Delaware Statutory Trust Act, issued $10 million of capital securities. The coupon rate is three-month LIBOR plus 345 basis points and is reset quarterly. Trust I’s obligations under the capital securities issued are fully and unconditionally guaranteed by the Company. The proceeds from the sale of the capital securities of Trust I were utilized by Trust I to invest in $10 million of junior subordinated debentures of the Company. The debentures bear a coupon rate of three-month LIBOR plus 345 basis points which is reset quarterly. The debentures are unsecured and rank subordinate and junior in right of payment to all indebtedness, liabilities and obligations of the Company. The debentures represent the sole assets of Trust I. The Company has the right to optionally redeem the debentures prior to the maturity date of November 7, 2032 at par. Due to the Company’s participation in the Treasury’s Capital Purchase Program, permission must be obtained from the Treasury in order to call these securities.
In 2003, State Bancorp Capital Trust II (“Trust II”), subsidiary of the Company and a statutory trust created under the Delaware Statutory Trust Act, issued $10 million of capital securities. The coupon rate is three-month LIBOR plus 285 basis points and is reset quarterly. Trust II’s obligations under the capital securities issued are fully and unconditionally guaranteed by the Company. The proceeds from the sale of the capital securities of Trust II were utilized by Trust II to invest in $10 million of junior subordinated debentures of the Company. The debentures bear a coupon rate of three-month LIBOR plus 285 basis points which is reset quarterly. The debentures are unsecured and rank subordinate and junior in right of payment to all indebtedness, liabilities and obligations of the Company. The debentures represent the sole assets of Trust II. The Company has the right to optionally redeem the debentures prior to the maturity date of January 23, 2034 at par. Due to the Company’s participation in the Treasury’s Capital Purchase Program, permission must be obtained from the Treasury in order to call these securities.
Trust I and II are unconsolidated wholly-owned subsidiaries of the Company, have no independent operations and issued securities that contained the full and unconditional guarantee of its parent, the Company. The Company is not considered the primary beneficiary of Trust I and Trust II, both variable interest entities, therefore they are not consolidated in the Company’s financial statements, but rather the subordinated debentures are shown as a liability. The Company’s investment in the common stock of Trust I and Trust II was $620 thousand and is included in other assets. Although the Company may be dependent on Bank dividends to pay the trust preferred interest, and the Bank may not be able to declare dividends, the subordinated debentures allow for up to two extension periods of 20 consecutive quarters each during which time payment of interest may be deferred by the Company. As such, the Company would not be in default if it were unable to pay interest on the subordinated debentures. The weighted average cost of all of the Company’s junior subordinated debentures was 3.54% in 2010 and 4.12% in 2009.
9. Income Taxes
The components of income tax expense for the years ended December 31, 2010, 2009 and 2008, are as follows (in thousands):
74
|
|
|
|
|
|
|
|
|
|
|
|
|
|
|
2010 |
|
2009 |
|
2008 |
|
|||
|
|
|
|
|
|
|
|
|
|||
|
Federal: |
|
|
|
|
|
|
|
|
|
|
|
Current |
|
$ |
851 |
|
$ |
235 |
|
$ |
3,882 |
|
|
Deferred |
|
|
3,935 |
|
|
(8,098 |
) |
|
(4,089 |
) |
|
|
|
|
|
|
|
|
|
|
|
|
|
Subtotal |
|
|
4,786 |
|
|
(7,863 |
) |
|
(207 |
) |
|
State: |
|
|
|
|
|
|
|
|
|
|
|
|
|
|
|
|
|
|
|
|
|
|
|
Current |
|
|
342 |
|
|
677 |
|
|
(342 |
) |
|
Deferred |
|
|
1,442 |
|
|
(2,419 |
) |
|
1,000 |
|
|
|
|
|
|
|
|
|
|
|
|
|
|
Subtotal |
|
|
1,784 |
|
|
(1,742 |
) |
|
658 |
|
|
|
|
|
|
|
|
|
|
|
|
|
|
Total |
|
$ |
6,570 |
|
$ |
(9,605 |
) |
$ |
451 |
|
|
|
|
|
|
|
|
|
|
|
|
|
Total income tax expense (benefit) was different from the amounts computed by applying the statutory federal income tax rate to income before income taxes due to the following (dollars in thousands):
|
|
|
|
|
|
|
|
|
|
|
|
|
|
|
|
|
|
|
|
|
|
|
|
2010 |
|
2009 |
|
2008 |
|
||||||||||||
|
|
|
|
|
|
|
|
|
||||||||||||
|
|
|
Amount |
|
% of |
|
Amount |
|
% of |
|
Amount |
|
% of |
|
||||||
|
|
|
|
|
|
|
|
|
|
|
|
|
|
|
||||||
|
Income tax expense (benefit) at statutory rate |
|
$ |
6,304 |
|
|
35.0 |
% |
$ |
(8,549 |
) |
|
(35.0 |
)% |
$ |
790 |
|
|
35.0 |
% |
|
Surtax exemption |
|
|
(180 |
) |
|
(1.0 |
) |
|
244 |
|
|
1.0 |
|
|
(23 |
) |
|
(1.0 |
) |
|
Increase (reduction) in taxes resulting from: |
|
|
|
|
|
|
|
|
|
|
|
|
|
|
|
|
|
|
|
|
State and local income tax, net of Federal tax benefit |
|
|
1,178 |
|
|
6.5 |
|
|
(1,150 |
) |
|
(4.7 |
) |
|
434 |
|
|
19.3 |
|
|
Tax-exempt interest on investments, net of interest expense disallowed |
|
|
(54 |
) |
|
(0.3 |
) |
|
(68 |
) |
|
(0.3 |
) |
|
(133 |
) |
|
(5.9 |
) |
|
ESOP dividends |
|
|
(86 |
) |
|
(0.5 |
) |
|
(86 |
) |
|
(0.3 |
) |
|
(230 |
) |
|
(10.2 |
) |
|
Bank owned life insurance |
|
|
(386 |
) |
|
(2.1 |
) |
|
(236 |
) |
|
(1.0 |
) |
|
(303 |
) |
|
(13.4 |
) |
|
Other |
|
|
(206 |
) |
|
(1.1 |
) |
|
240 |
|
|
1.0 |
|
|
(84 |
) |
|
(3.8 |
) |
|
|
|
|
|
|
|
|
|
|
|
|
|
|
|
|
|
|
|
|
|
|
Income tax expense (benefit) |
|
$ |
6,570 |
|
|
36.5 |
% |
$ |
(9,605 |
) |
|
(39.3 |
)% |
$ |
451 |
|
|
20.0 |
% |
|
|
|
|
|
|
|
|
|
|
|
|
|
|
|
|
|
|
|
|
|
At December 31, 2010 and 2009, the deferred tax assets and liabilities are composed of the following (in thousands):
75
|
|
|
|
|
|
|
|
|
|
December 31, |
|
|
2010 |
|
|
2009 |
|
|
|
|
|
|
|
|
|
|
|
Deferred tax assets: |
|
|
|
|
|
|
|
|
Allowance for loan losses |
|
$ |
13,310 |
|
$ |
11,553 |
|
|
Net operating loss carryforward |
|
|
9,486 |
|
|
18,506 |
|
|
AMT credit carryforward |
|
|
1,149 |
|
|
— |
|
|
Deferred fees and costs, net |
|
|
649 |
|
|
510 |
|
|
Equity compensation plans |
|
|
516 |
|
|
181 |
|
|
Accrued expenses |
|
|
490 |
|
|
123 |
|
|
Bank premises and equipment |
|
|
431 |
|
|
263 |
|
|
Non-accrual interest and other |
|
|
228 |
|
|
500 |
|
|
|
|
|
|
|
|
|
|
|
Subtotal |
|
|
26,259 |
|
|
31,636 |
|
|
|
|
|
|
|
|
|
|
|
Deferred tax liabilities: |
|
|
|
|
|
|
|
|
Unrealized holding gain on securities available for sale |
|
|
(2,193 |
) |
|
(4,150 |
) |
|
|
|
|
|
|
|
|
|
|
Net deferred tax assets |
|
$ |
24,066 |
|
$ |
27,486 |
|
|
|
|
|
|
|
|
|
|
As of December 31, 2010, the Company had deferred tax assets arising from deductible temporary differences and tax losses before being offset against certain deferred tax liabilities and presented in a single amount as net deferred income taxes in the accompanying consolidated balance sheets. Management believes it is more likely than not that forecasted income, including income that may be generated as a result of certain tax planning strategies, together with the tax effects of the deferred tax liabilities, will be sufficient to fully recover the remaining deferred tax assets. The Company will continue to evaluate the realizability of the deferred tax assets quarterly by assessing the need and amount for a valuation allowance account.
The Company assessed its earnings history and trend over the prior two years, its estimate of future earnings and the expiration dates of its net operating loss carryforwards. Management has positioned the Company for future earnings by aggressively selling underperforming assets and redeploying those proceeds. This will also help stabilize the level of charge-offs to a more normalized level. Secondly, the Company has enhanced the quality of its capital through a debt for equity swap in 2009. While also enhancing the quality of the Company’s capital, this transaction reduces annual interest expense. When considering its overall investment portfolio strategy, the Company has very little tax exempt income and will continue to invest primarily in taxable investments. Based on these assessments, the Company determined that it was more likely than not that the deferred tax assets will be realized before their expiration.
The Company has net operating loss carryforwards of approximately $21 million for Federal income tax and $41 million for New York State (“NYS”) tax purposes which may be applied against future taxable income. Both the Federal and NYS unused net operating loss carryforwards are expected to expire in varying amounts between the year 2027 and 2029. It is anticipated that both the Federal and NYS carryforwards will be utilized prior to their expiration based on the Company’s future years’ projected earnings. In addition, the Company has AMT credit carryover of $1 million which does not expire.
The Company’s continuing practice is to recognize interest and penalties related to uncertain tax positions in tax expense. At December 31, 2010, the Company did not recognize a reserve for uncertain tax positions.
During 2010, the Company reached a resolution of an IRS audit examination for the years ended December 31, 2005 through 2007, and as a result, recorded an AMT credit of $597 thousand that increased the Company’s deferred tax asset. As such, the Company is no longer subject to examination by Federal taxing authorities for years before January 1, 2008. The Company is no longer subject to examination by NYS and New York City taxing authorities for years before January 1, 2007. However, in January 2011, the Company received notification from NYS that the NYS franchise tax returns will be under examination for the years ended December 31, 2007 through 2009.
10. Stock-Based Compensation
Incentive Stock Options - Under the terms of the Company’s incentive stock option plans adopted in February 1999 and February 2002, options have been granted to certain key personnel that entitle each holder to purchase shares of the Company’s common stock. The option price is the higher of the fair market value or the book value of the shares at the date of grant. Such options were exercisable commencing
76
one year from the date of grant, at the rate of 25% per year, and expire within ten years from the date of grant. Any optionee-owned stock may be used as full or partial payment of the exercise price and shall be valued at the fair market value of the stock on the date of exercise of the option.
No incentive stock options were granted during 2010, 2009 and 2008. At December 31, 2010, incentive stock options for the purchase of 235,286 shares were outstanding and exercisable. No options were exercised in 2010 or 2009. The total intrinsic value of options exercised for the twelve months ended December 31, 2008 was $293 thousand. The total cash received from option exercises for the twelve months ended December 31, 2008 was $552 thousand, excluding the tax benefit realized for the twelve months ended December 31, 2008 of $37 thousand. In exercising those options, certain employees paid their option exercise price in full or in part by surrendering 36,381 shares at a fair market value of $509 thousand during 2008. The total exercisable shares at December 31, 2010 had no intrinsic value. A summary of stock option activity follows:
|
|
|
|
|
|
|
|
|
|
|
|
Number |
|
Weighted-Average |
|
||
|
|
|
|
|
|
|
||
|
Outstanding - January 1, 2010 |
|
|
254,319 |
|
$ |
15.73 |
|
|
Granted |
|
|
— |
|
|
— |
|
|
Exercised |
|
|
— |
|
|
— |
|
|
Forfeited or expired |
|
|
(19,033 |
) |
|
10.47 |
|
|
|
|
|
|
|
|
|
|
|
Outstanding - December 31, 2010 |
|
|
235,286 |
|
$ |
16.15 |
|
|
|
|
|
|
|
|
|
|
The following summarizes shares subject to purchase from incentive stock options outstanding and exercisable as of December 31, 2010:
|
|
|
|
|
|
|
|
|
|
|
|
|
|
|
|
|
|
|
Range of Exercise Prices |
|
Shares |
|
Weighted-Average |
|
Weighted-Average |
|
Shares |
|
Weighted-Average |
|
|||||
|
|
|
|
|
|
|
|
|
|
|
|
|
|||||
|
$10.28 - $13.61 |
|
|
127,493 |
|
|
1.2 years |
|
$ |
12.11 |
|
|
127,493 |
|
$ |
12.11 |
|
|
$19.16 - $22.63 |
|
|
107,793 |
|
|
3.6 years |
|
|
20.93 |
|
|
107,793 |
|
|
20.93 |
|
|
|
|
|
|
|
|
|
|
|
|
|
|
|
|
|
|
|
|
|
|
|
235,286 |
|
|
2.3 years |
|
$ |
16.15 |
|
|
235,286 |
|
$ |
16.15 |
|
|
|
|
|
|
|
|
|
|
|
|
|
|
|
|
|
|
|
Restricted Stock Awards - Under the Company’s 2006 Equity Compensation Plan (the “2006 Plan”), the Company can award options, stock appreciation rights (“SARs”), restricted stock, performance units and unrestricted stock. The 2006 Plan also allows the Company to make awards conditional upon attainment of vesting conditions and performance targets.
During 2010, the Company awarded 164,988 shares of restricted stock to certain key employees. The restricted stock awards currently outstanding primarily vest one-third on each of the third through fifth anniversaries of the award date. The fair value of restricted stock awards vested during 2010, 2009 and 2008 was $350 thousand, $67 thousand and $260 thousand, respectively. Based on an estimated forfeiture rate, of the 313,563 shares currently outstanding, 304,000 shares are expected to vest over the remaining vesting life. The Company recognizes compensation expense over the vesting period at the fair market value of the shares on the award date. If a participant’s service terminates for any reason other than death or disability, then the participant shall forfeit to the Company any shares acquired by the participant pursuant to the restricted stock award which remain subject to vesting conditions. The total remaining unrecognized compensation cost related to nonvested shares of restricted stock is $1.9 million at December 31, 2010 and is expected to be expensed over the weighted average remaining vesting life of 2.2 years. For the years ended December 31, 2010, 2009 and 2008, $832 thousand, $482 thousand and $184 thousand, respectively, were recognized as compensation expense, net of estimated forfeitures. The Company recognized tax benefits resulting from the compensation expense for the years ended December 31, 2010, 2009 and 2008 of $283 thousand, $164 thousand and $37 thousand, respectively.
A summary of restricted stock activity follows:
77
|
|
|
|
|
|
|
|
|
|
|
|
Number |
|
Weighted-Average |
|
||
|
|
|
|
|
|
|
||
|
Nonvested - January 1, 2010 |
|
|
215,718 |
|
$ |
10.81 |
|
|
Granted |
|
|
164,988 |
|
|
8.20 |
|
|
Vested |
|
|
(41,543 |
) |
|
8.42 |
|
|
Forfeited or expired |
|
|
(25,600 |
) |
|
9.64 |
|
|
|
|
|
|
|
|
|
|
|
Nonvested - December 31, 2010 |
|
|
313,563 |
|
$ |
9.85 |
|
|
|
|
|
|
|
|
|
|
At December 31, 2010, shares totaling 214,038 were reserved for possible issuance of awards of options, SARs, restricted stock, performance units and unrestricted stock.
Non-Plan Stock-Based Compensation – In May 2010, the Company granted an award of 26,777 shares of restricted stock at an average price of $10.27 to the newly appointed Chief Lending Officer of the Bank (the “CLO”). The restricted stock will vest over five years, with one third to vest on the third anniversary of the award date, one third to vest on the fourth anniversary of the award date and the remainder to vest on the fifth anniversary of the award date. The restricted stock award was granted to the CLO as an inducement material to employment with the Company.
In November 2006, the Company granted non-qualified stock options and restricted stock awards to the Chief Executive Officer of the Bank (the “CEO”), pursuant to the terms of his employment agreement. The non-qualified stock options to purchase 164,745 shares have an exercise price of $17.84 and are vesting 20% per year over five years. At December 31, 2010, 131,796 of these options were exercisable, but none have been exercised. The options outstanding and those exercisable at December 31, 2010 have no intrinsic value. The restricted stock awarded to the CEO totaled 83,612 shares and was awarded at an average price of $17.94 to vest in 20 equal quarterly installments over five years. The fair value of restricted stock awards vested during the years ended December 31, 2010, 2009 and 2008 was $300 thousand, $131 thousand and $201 thousand, respectively. A summary of restricted stock activity follows:
|
|
|
|
|
|
|
|
|
|
|
|
Number |
|
Weighted-Average |
|
||
|
|
|
|
|
|
|
||
|
Nonvested - January 1, 2010 |
|
|
29,259 |
|
$ |
17.94 |
|
|
Granted |
|
|
26,777 |
|
|
10.27 |
|
|
Vested |
|
|
(16,724 |
) |
|
17.94 |
|
|
|
|
|
|
|
|
|
|
|
Nonvested - December 31, 2010 |
|
|
39,312 |
|
$ |
12.72 |
|
|
|
|
|
|
|
|
|
|
The total remaining unrecognized compensation cost related to nonvested options and shares of restricted stock is $615 thousand at December 31, 2010 and will be expensed over the weighted average remaining vesting life of 1.7 years. For the years ended December 31, 2010, 2009 and 2008, $537 thousand, $479 thousand and $479 thousand, respectively, was recognized as compensation expense. The non-qualified stock options and the restricted stock awards were not issued as part of any of the Company’s registered stock-based compensation plans.
11. Employee Benefit Plans
The Bank has an ESOP which is a defined contribution plan covering substantially all full-time employees. Bank contributions to the ESOP represent a minimum of 3% of an employee’s annual gross compensation. Employees become 20% vested after two years of employment, with an additional 20% vesting each year. Full vesting takes place upon the completion of six years of employment. Employee contributions are not permitted. At December 31, 2010, the ESOP had all of its assets invested in the Company’s common stock and cash. The Bank funds all amounts when due. At December 31, 2010 and 2009, the number of shares of stock held by the ESOP totaled 1,265,817 and 1,200,985, respectively, all of which were allocated to employee accounts. None of the allocated shares are subject to a repurchase obligation. Contributions under the ESOP charged to operations amounted to $561 thousand, $1.2 million and $1.4 million in 2010, 2009 and 2008, respectively. In 2010 the Bank elected not to make contributions in excess of the plan minimum.
78
The Bank has a 401(k) Retirement Plan and Trust (the “401(k) Plan”), which covers substantially all full-time employees. Employees may elect to contribute up to 16% (or up to 35% for employees with annual earnings less than $110,000) of their annual gross compensation to the 401(k) Plan, and the Bank will fully match the employee’s contribution for the first 1% of gross annual compensation and will match one-half of additional employee contributions to a maximum of 3.5%. Employees are fully vested in their own contributions and, after one year of service, the Bank’s contributions. Bank contributions under the 401(k) Plan amounted to $563 thousand, $590 thousand and $522 thousand in 2010, 2009 and 2008, respectively. The Bank funds all amounts as of the last day of the plan year. At December 31, 2010, Bank contributions to the 401(k) Plan were made in shares of the Company’s common stock. Employee contributions to the 401(k) Plan were invested in various bond, equity, stable value or diversified funds as directed by each employee.
The Bank has nonqualified deferred compensation plans (the “Plans”) for certain officers for whom contributions under the ESOP are limited by the applicable provisions of the Internal Revenue Code. There were no such contributions made in 2010. Bank contributions under the Plans totaled $2 thousand and $50 thousand in 2009 and 2008, respectively.
12. Commitments and Contingent Liabilities
Leases - The Company is obligated under various leases covering certain equipment, branches, office space and the land on which its head office is built. The minimum payments under these leases, certain of which contain escalation clauses, are (in thousands):
|
|
|
|
|
|
|
2011 |
|
$ |
3,066 |
|
|
2012 |
|
|
1,824 |
|
|
2013 |
|
|
1,428 |
|
|
2014 |
|
|
1,468 |
|
|
2015 |
|
|
1,335 |
|
|
Remainder to 2023 |
|
|
4,482 |
|
|
|
|
|
|
|
|
Total |
|
$ |
13,603 |
|
|
|
|
|
|
|
Rent expense was approximately $3.1 million, $3.4 million and $3.5 million for 2010, 2009 and 2008, respectively.
Directors’ Stock Plan - The Company approved a Directors’ Stock Plan (the “1998 DSP”) in 1998 for each outside director and the secretary to the Board of Directors that expired in April 2008. Pursuant to the 1998 DSP, each participant received an award of share credits in the period 1999 - 2004. Effective annually as of January 1, 2005, each participant was granted an award of share credits in respect to the preceding year in an amount equal to $14 thousand divided by the market value of one share of stock as of the last reported sale price on the last day of the calendar year. All awards are pro-rated where a participant did not serve for all of the preceding year. During 2008, a total of 9,842 shares were distributed to retired directors and 41,609 shares, awarded to participating directors, were transferred to a Rabbi Trust and subsequently distributed in January 2009. The Bank charged approximately $159 thousand during 2008 to operations related to this Plan.
In 2008, the Company adopted the Non-employee Directors’ Stock Plan (the “2008 DSP”) for each outside director and provides for the award of 1,500 shares annually of the Company’s stock to eligible directors at the discretion of the Executive Compensation Committee. All grants may be pro-rated where a participant does not serve for the entire year. The 2008 DSP will expire in April of 2018 and the maximum aggregate number of shares of stock which may be issued under the 2008 DSP is 200,000 shares. For the initial calendar year beginning on May 1, 2008, a total of 10,625 share grants were awarded to eleven outside directors. In 2010 and 2009, the Company awarded 14,000 and 13,875 shares, respectively, to ten outside directors. The shares are distributed in the year following the award. The Bank charged approximately $102 thousand, $140 thousand and $135 thousand in 2010, 2009 and 2008, respectively, to operations related to this plan.
Severance Commitments - The Company has change of control employment agreements (the “Agreements”) for certain key executives. The Agreements provide for certain rights accruing to participants in the event of a termination of the participant’s employment within one year after a change in control of the Company. These rights include a cash payment and the continuation of certain employee benefits. In addition, all stock-based compensation awards held by a participant will become fully vested. In the event that the participant enters into an employment contract, as defined in the Agreements, all rights to the severance payment and other benefits set forth above will terminate. No amounts have been paid or accrued under the Agreements. Pursuant to the Letter Agreement dated December 5, 2008 and the Securities Purchase Agreement between the Company and the Treasury, Mr. O’Brien and each of the Company’s senior executive officers (as defined
79
in the Securities Purchase Agreement) entered into an amendment to their change of control agreements in 2008 to provide for a recovery of any bonus or incentive compensation paid to such senior executive officers based on statements of earnings, gains or other criteria that are later proven to be materially inaccurate. In addition, pursuant to such amendment, payments to Mr. O’Brien and the Company’s senior executive officers in the event of involuntary discharge or resignation with good reason while the Treasury owns any debt or equity position in the Company arising from the Securities Purchase Agreement will be limited, if applicable, to less than three times the average compensation for the prior five years.
Employment Agreement – Effective November 6, 2006, the Company and the Bank have entered into an employment agreement with Thomas M. O’Brien for a term of five years. The employment agreement provides for an annual base salary and a target annual bonus. Mr. O’Brien was also granted non-qualified stock options and restricted stock awards that are more fully disclosed in Note 10, Non-Plan Stock-Based Compensation.
In the event that Mr. O’Brien’s employment is terminated without cause or he resigns with good reason in the absence of a change in control, he is entitled to receive a cash severance payment equal to two times the sum of the most recent year’s incentive award and base salary rate, all stock options and restricted stock awards vest and life and health insurance is continued until age 65. If he is terminated without cause or resigns with good reason following a change in control, he is entitled to receive a cash severance payment equal to three times the sum of annual salary plus target bonus amount, the most recent year’s annual incentive is paid, all stock options and restricted stock awards vest and life insurance is continued until age 65. Vesting of stock options and restricted stock will be accelerated in the event of death and will continue to vest as if employment had not terminated in the event of disability. No cash severance payments are due in the event of termination of employment as a result of death, disability, discharge with cause or voluntary resignation without good reason. Pursuant to the Securities Purchase Agreement between the Company and the Treasury, payments to Mr. O’Brien and the Company’s senior executive officers (as defined in the Securities Purchase Agreement) in the event of involuntary discharge or resignation with good reason while the Treasury owns any debt or equity position in the Company arising from the Securities Purchase Agreement will be limited, if applicable, to less than three times the average compensation for the prior five years.
Pending Claims and Contingent Liabilities – The Company and the Bank are subject to legal proceedings and claims that arise in the ordinary course of business. In the opinion of management, the amount of ultimate liability, if any, with respect to such matters will not materially affect future operations and will not have a material impact on the Company’s financial statements.
Other - The Bank is required to maintain balances with the Federal Reserve Bank of New York to satisfy reserve requirements. These balances averaged approximately $12 million and $13 million in 2010 and 2009, respectively.
80
13. State Bancorp, Inc. (Parent Company Only)
Certain condensed financial information follows (dollars in thousands):
|
|
|
|
|
|
|
|
|
|
December 31, |
|
2010 |
|
2009 |
|
||
|
|
|
|
|
|
|
||
|
BALANCE SHEET |
|
|
|
|
|
|
|
|
Assets: |
|
|
|
|
|
|
|
|
Cash |
|
$ |
602 |
|
$ |
2,112 |
|
|
Dividends receivable and other assets |
|
|
1,677 |
|
|
2,059 |
|
|
Investment in the Bank |
|
|
174,199 |
|
|
165,014 |
|
|
Investment in the Trusts |
|
|
623 |
|
|
623 |
|
|
|
|
|
|
|
|
|
|
|
Total Assets |
|
$ |
177,101 |
|
$ |
169,808 |
|
|
|
|
|
|
|
|
|
|
|
Liabilities: |
|
|
|
|
|
|
|
|
Junior subordinated debentures |
|
$ |
20,620 |
|
$ |
20,620 |
|
|
Dividends payable and other liabilities |
|
|
1,629 |
|
|
673 |
|
|
|
|
|
|
|
|
|
|
|
Total Liabilities |
|
|
22,249 |
|
|
21,293 |
|
|
|
|
|
|
|
|
|
|
|
Stockholders’ Equity: |
|
|
|
|
|
|
|
|
Preferred stock |
|
|
36,245 |
|
|
36,016 |
|
|
Common stock |
|
|
175 |
|
|
173 |
|
|
Warrant |
|
|
1,057 |
|
|
1,057 |
|
|
Surplus |
|
|
179,293 |
|
|
178,673 |
|
|
Retained deficit |
|
|
(51,378 |
) |
|
(57,432 |
) |
|
Treasury stock |
|
|
(13,872 |
) |
|
(16,276 |
) |
|
Accumulated other comprehensive income, net of taxes |
|
|
3,332 |
|
|
6,304 |
|
|
|
|
|
|
|
|
|
|
|
Total Stockholders’ Equity |
|
|
154,852 |
|
|
148,515 |
|
|
|
|
|
|
|
|
|
|
|
Total Liabilities and Stockholders’ Equity |
|
$ |
177,101 |
|
$ |
169,808 |
|
|
|
|
|
|
|
|
|
|
81
|
|
|
|
|
|
|
|
|
|
|
|
|
For the years ended December 31, |
|
2010 |
|
2009 |
|
2008 |
|
|||
|
|
|
|
|
|
|
|
|
|||
|
INCOME STATEMENT |
|
|
|
|
|
|
|
|
|
|
|
Dividends from the Bank, net of expenses |
|
$ |
(110 |
) |
$ |
(915 |
) |
$ |
5,319 |
|
|
Interest expense on temporary borrowings |
|
|
— |
|
|
— |
|
|
9 |
|
|
Interest expense on subordinated notes |
|
|
— |
|
|
852 |
|
|
925 |
|
|
Interest expense on junior subordinated debentures |
|
|
729 |
|
|
850 |
|
|
1,349 |
|
|
Benefit for income taxes |
|
|
(277 |
) |
|
(880 |
) |
|
(772 |
) |
|
Equity in the undistributed earnings (distributions in excess of earnings) of the Bank and the Trusts |
|
|
12,003 |
|
|
(13,083 |
) |
|
(2,001 |
) |
|
|
|
|
|
|
|
|
|
|
|
|
|
Net Income |
|
$ |
11,441 |
|
$ |
(14,820 |
) |
$ |
1,807 |
|
|
|
|
|
|
|
|
|
|
|
|
|
|
CASH FLOWS |
|
|
|
|
|
|
|
|
|
|
|
Operating Activities: |
|
|
|
|
|
|
|
|
|
|
|
Net Income |
|
$ |
11,441 |
|
$ |
(14,820 |
) |
$ |
1,807 |
|
|
Adjustments to reconcile net income (loss) to net cash provided by operating activities: |
|
|
|
|
|
|
|
|
|
|
|
Expenses associated with the exchange of subordinated notes for common equity |
|
|
— |
|
|
737 |
|
|
— |
|
|
Stock-based compensation expense |
|
|
1,369 |
|
|
938 |
|
|
923 |
|
|
Directors’ stock plan expense |
|
|
102 |
|
|
140 |
|
|
293 |
|
|
Decrease (increase) in receivable - current income taxes |
|
|
— |
|
|
230 |
|
|
13,708 |
|
|
Decrease (increase) in other assets |
|
|
382 |
|
|
188 |
|
|
(1,417 |
) |
|
Increase (decrease) in other liabilities |
|
|
994 |
|
|
570 |
|
|
(12,774 |
) |
|
(Equity in the undistributed earnings) distributions in excess of earnings of the Bank and the Trusts |
|
|
(12,003 |
) |
|
13,083 |
|
|
2,001 |
|
|
|
|
|
|
|
|
|
|
|
|
|
|
Net cash provided by operating activities |
|
|
2,285 |
|
|
1,066 |
|
|
4,541 |
|
|
|
|
|
|
|
|
|
|
|
|
|
|
Financing Activities: |
|
|
|
|
|
|
|
|
|
|
|
Cash dividends paid on common stock |
|
|
(3,316 |
) |
|
(2,919 |
) |
|
(7,149 |
) |
|
Cash dividends paid on preferred stock |
|
|
(1,842 |
) |
|
(1,740 |
) |
|
— |
|
|
Proceeds from issuance of preferred shares and common stock warrant |
|
|
— |
|
|
— |
|
|
36,842 |
|
|
Proceeds from issuance of common stock |
|
|
333 |
|
|
381 |
|
|
3,530 |
|
|
Proceeds from reissuance of treasury stock |
|
|
1,184 |
|
|
171 |
|
|
— |
|
|
Capital contribution to the Bank |
|
|
(176 |
) |
|
(179 |
) |
|
(34,179 |
) |
|
Return of capital from the Trusts |
|
|
22 |
|
|
28 |
|
|
41 |
|
|
|
|
|
|
|
|
|
|
|
|
|
|
Net cash used in financing activities |
|
|
(3,795 |
) |
|
(4,258 |
) |
|
(915 |
) |
|
|
|
|
|
|
|
|
|
|
|
|
|
Net changes in cash |
|
|
(1,510 |
) |
|
(3,192 |
) |
|
3,626 |
|
|
Cash at beginning of year |
|
|
2,112 |
|
|
5,304 |
|
|
1,678 |
|
|
|
|
|
|
|
|
|
|
|
|
|
|
Cash at End of Year |
|
$ |
602 |
|
$ |
2,112 |
|
$ |
5,304 |
|
|
|
|
|
|
|
|
|
|
|
|
|
|
SUPPLEMENTAL DATA: |
|
|
|
|
|
|
|
|
|
|
|
Common stock exchanged for subordinated notes |
|
$ |
— |
|
$ |
10,768 |
|
$ |
— |
|
14. Derivative Financial Instruments and Other Financial Instruments with Off-Balance Sheet Risk
The Company does not currently hold any derivative financial instruments for trading purposes. From time to time, the Bank may execute customer interest rate swap transactions together with offsetting interest rate swap transactions with institutional dealers. The customer swap program provides a customer financing option that can result in longer maturity terms without incurring the associated interest rate risk. Each swap is mutually exclusive, and the swaps are marked to market with changes in fair value recognized in other income, with the fair value for each individual swap offsetting the corresponding other.
On September 15, 2008 and October 3, 2008, respectively, Lehman and Lehman Special Financing filed Voluntary Petitions under Chapter 11 of the U.S. Bankruptcy Code, each of which constituted an event of default under the swap agreements the Bank had with Lehman
82
Special Financing. The Bank filed proofs of claim with the United States Bankruptcy Court, Southern District, on January 13, 2009. As a result of the events of default, the Bank terminated the interest rate swap agreements with Lehman Special Financing. The terminations resulted in several customer interest rate swap transactions no longer being offset by that institutional dealer and a loss to the Company on those swap agreements of approximately $584 thousand was recorded in the third quarter of 2008. During the third quarter of 2009, the Company recorded a gain of $221 thousand on the sale of its claims against Lehman and Lehman Special Financing.
In addition, during the second and third quarters of 2009, the unhedged customer interest rate swap transactions were once again offset by an institutional dealer. As all customer interest rate swap transactions are now hedged, we expect that their future impact on the Company’s financial statements will be immaterial. For the twelve months ended December 31, 2010 and 2009, net losses of $50 thousand and $38 thousand, respectively, were recognized. The 2009 amount includes the gain of $221 thousand on the sale of the Bank’s claims against Lehman and Lehman Special Financing. For the twelve months ended December 31, 2008, a net gain of $1.1 million was recognized. At December 31, 2010 and 2009, the total gross notional amount of swap transactions outstanding was $35 million and $37 million, respectively.
Information on the Company’s derivative financial instruments at December 31, 2010 and 2009 follows (in thousands):
|
|
|
|
|
|
|
|
|
|
|
|
|
|
Fair Values of Derivative Instruments at December 31, |
|
||||||
|
|
|
|
|
||||||
|
|
|
|
|
2010 |
|
2009 |
|
||
|
|
|
|
|
|
|
|
|
||
|
|
|
Balance
Sheet |
|
Fair Value |
|
Fair Value |
|
||
|
|
|
|
|
|
|
|
|
||
|
Derivatives not designated as hedging instruments: |
|
|
|
|
|
|
|
|
|
|
Interest rate contracts |
|
Other assets |
|
$ |
2,111 |
|
$ |
1,836 |
|
|
Interest rate contracts |
|
Other liabilities |
|
$ |
2,198 |
|
$ |
1,873 |
|
The Bank is a party to financial instruments with off-balance sheet risk in the normal course of business to meet the financing needs of its customers. These financial instruments include commitments to extend credit and standby and documentary letters of credit. Those instruments involve, to varying degrees, elements of credit risk in excess of the amount recognized in the consolidated financial statements. The Bank uses the same credit policies in making commitments and conditional obligations as it does for on-balance sheet instruments.
Commitments to extend credit are agreements to lend to a customer as long as there is no violation of any condition established in the contract. Commitments generally have fixed expiration dates or other termination clauses and may require payment of a fee. Since many of the commitments are expected to expire without being drawn upon, the total commitment amounts do not necessarily represent future cash requirements. The Bank evaluates each customer’s creditworthiness on a case-by-case basis. The amount of collateral obtained, if deemed necessary by the Bank upon extension of credit, is based on management’s credit evaluation of the customer. Collateral required varies, but may include accounts receivable, inventory, equipment, real estate and income-producing commercial properties. At December 31, 2010 and 2009, commitments to originate loans and commitments under unused lines of credit for which the Bank is obligated amounted to approximately $219 million and $232 million, respectively. Approximately $192 million and $195 million of these commitments were at variable rates and $27 million and $37 million were at fixed rates, including LIBOR-based loans, at December 31, 2010 and 2009, respectively. At December 31, 2010 and 2009, the fixed rate commitments had interest rates ranging from approximately 2.38% to 7.00% and 2.30% to 7.23%, respectively.
Letters of credit are conditional commitments guaranteeing payments of drafts in accordance with the terms of the letter of credit agreements. Commercial letters of credit are used primarily to facilitate trade or commerce and are also issued to support public and private borrowing arrangements, bond financing and similar transactions. Collateral may be required to support letters of credit based upon management’s evaluation of the creditworthiness of each customer. The credit risk involved in issuing letters of credit is essentially the same as that involved in extending loans to customers. Most letters of credit expire within one year. At December 31, 2010 and 2009, the Bank had letters of credit outstanding of approximately $14 million and $15 million, respectively. At December 31, 2010, the uncollateralized portion was approximately $2 million.
83
15. Fair Value
Fair value estimates are made as of a specific point in time based on the characteristics of financial instruments and market information. Where available, quoted market prices are used. However, markets do not exist for a portion of the Company’s financial instruments and, as a result, fair value estimates require judgments regarding future cash flows. These judgments are subjective in nature, involve uncertainties and therefore may change significantly at future measurement dates. The fair value information that follows is intended to supplement, but not replace, the basic consolidated financial statements and other traditional financial data presented throughout this report. The calculation of estimated fair values is based on market conditions at December 31, 2010 and 2009 and is not reflective of current or future fair values. Furthermore, the value of long-term relationships with depositors is not reflected. The value of those relationships is significant.
The following methods and assumptions were used to estimate the fair value of each class of financial instruments for which it is practicable to estimate that value.
Cash and Cash Equivalents - For cash and cash equivalents (due from banks, federal funds sold and securities purchased under agreements to resell), the carrying amount is a reasonable estimate of fair value.
Accrued Interest Receivable - For accrued interest receivable, the carrying amount is a reasonable estimate of fair value.
Securities Held to Maturity and Securities Available for Sale – For securities held to maturity and securities available for sale, the estimated fair value equals quoted market price if available. If a quoted market price is not available, fair value is estimated using a quoted market price for similar securities. For securities available for sale, the carrying amount is the estimated fair value.
Federal Home Loan Bank and Other Restricted Stock – Determining the fair value of Federal Home Loan Bank stock is not practicable due to restrictions placed on its transferability. For other restricted stock, the carrying amount is a reasonable estimate of fair value.
Loans - For certain homogeneous categories of loans, such as some residential real estate loans and other consumer loans, fair value is estimated using the quoted market prices for securities backed by similar loans, adjusted for differences in loan characteristics. The fair value of other types of loans is estimated by discounting the future cash flows using the current rates at which similar loans would be made to borrowers with similar credit ratings and for the same remaining maturities.
Deposits - The fair value of demand deposits and savings accounts is estimated by discounting the expected future cash flows against the interest rate swap curve, as it best represents the cost of alternative funding sources. The fair value of fixed-maturity certificates of deposit is estimated using the interest rate swap rates of similar term points.
Senior Unsecured Debt - The fair value of senior unsecured debt is estimated using the interest rate swap rates of similar term and repricing points and spreads of equivalent new issues.
Junior Subordinated Debentures - The fair value of junior subordinated debentures is estimated using observed market prices.
Temporary Borrowings and Accrued Interest Payable – Temporary borrowings (FHLB overnight and term advances, federal funds purchased and securities sold under agreements to repurchase) and accrued interest payable are considered to have fair values equal to their carrying amounts due to their short-term nature.
Commitments to Extend Credit, Standby Letters of Credit and Commercial Letters of Credit - The fair value of commitments is estimated using the fees currently charged to enter into similar agreements, taking into account the remaining terms of the agreements and the present creditworthiness of the counterparties. For fixed-rate loan commitments, fair value also considers the difference between current levels of interest rates and the committed rates. The fair value of standby letters of credit and commercial letters of credit is based on fees currently charged for similar agreements, which are not material to the financial statements.
The carrying amounts and estimated fair values of financial instruments are as follows (in thousands):
84
|
|
|
|
|
|
|
|
|
|
|
|
|
|
|
|
At December 31, |
|
2010 |
|
2009 |
|
||||||||
|
|
|
|
|
|
|
||||||||
|
|
|
Carrying |
|
Estimated |
|
Carrying |
|
Estimated |
|
||||
|
|
|
|
|
|
|
|
|
|
|
||||
|
Financial assets: |
|
|
|
|
|
|
|
|
|
|
|
|
|
|
Cash and cash equivalents |
|
$ |
23,121 |
|
$ |
23,121 |
|
$ |
28,624 |
|
$ |
28,624 |
|
|
Accrued interest receivable |
|
|
5,776 |
|
|
5,776 |
|
|
6,137 |
|
|
6,137 |
|
|
Securities held to maturity |
|
|
22,000 |
|
|
21,890 |
|
|
— |
|
|
— |
|
|
Securities available for sale |
|
|
361,158 |
|
|
361,158 |
|
|
415,985 |
|
|
415,985 |
|
|
Federal Home Loan Bank and other restricted stock |
|
|
6,381 |
|
|
N/A |
|
|
7,361 |
|
|
N/A |
|
|
Loans - net of the allowance for loan losses |
|
|
1,098,292 |
|
|
1,109,500 |
|
|
1,068,924 |
|
|
1,077,999 |
|
|
|
|
|
|
|
|
|
|
|
|
|
|
|
|
|
Financial liabilities: |
|
|
|
|
|
|
|
|
|
|
|
|
|
|
Deposits |
|
$ |
1,348,735 |
|
$ |
1,257,572 |
|
$ |
1,349,562 |
|
$ |
1,163,127 |
|
|
Senior unsecured debt |
|
|
29,000 |
|
|
29,386 |
|
|
29,000 |
|
|
28,848 |
|
|
Junior subordinated debentures |
|
|
20,620 |
|
|
11,470 |
|
|
20,620 |
|
|
12,585 |
|
|
Accrued interest payable |
|
|
650 |
|
|
650 |
|
|
686 |
|
|
686 |
|
|
Temporary borrowings |
|
|
25,000 |
|
|
25,000 |
|
|
48,000 |
|
|
48,000 |
|
Current accounting standards establish a fair value hierarchy which requires an entity to maximize the use of observable inputs and minimize the use of unobservable inputs when measuring fair value. The standards describe three levels of inputs that may be used to measure fair value:
Level 1: Quoted prices (unadjusted) for identical assets or liabilities in active markets that the entity has the ability to access as of the measurement date.
Level 2: Significant other observable inputs other than Level 1 prices such as quoted prices for similar assets or liabilities; quoted prices in markets that are not active; or other inputs that are observable or can be corroborated by observable market data.
Level 3: Significant unobservable inputs that reflect a reporting entity’s own assumptions about the assumptions that market participants would use in pricing an asset or liability.
For the Company’s securities available for sale, the estimated fair value equals quoted market price, if available (Level 1 inputs). If a quoted market price is not available, fair value is estimated using a quoted market price for similar securities (Level 2 inputs). Our derivative instruments consist of interest rate swap transactions with customers on loans. As such, significant fair value inputs can generally be verified and do not typically involve significant management judgments (Level 2 inputs). The market value adjustment of the derivatives considers the credit risk of the counterparties to the transaction and the effect of any credit enhancements related to the transaction. The fair value of loans held for sale and impaired loans with specific allocations of the allowance for loan losses is generally based on recent real estate appraisals. These appraisals may utilize a single valuation approach or a combination of approaches including comparable sales and the income approach. Adjustments are routinely made in the appraisal process by the appraisers to adjust for differences between the comparable sales and income data available. Unobservable inputs are typically significant and result in a Level 3 classification for determining fair value of loans held for sale and impaired loans.
Assets and Liabilities Measured on a Recurring Basis
Assets and liabilities measured at fair value on a recurring basis are summarized below (in thousands):
85
|
|
|
|
|
|
|
|
|
|
|
|
December 31, 2010 |
|
Fair Value |
|
||
|
|
|
|
|
|
|
||
|
Assets: |
|
|
|
|
|
|
|
|
|
|||||||
|
Securities Available for Sale: |
|
|
|
|
|
|
|
|
Obligations of states and political subdivisions |
|
$ |
1,906 |
|
$ |
1,906 |
|
|
Government agency securities |
|
|
40,556 |
|
|
40,556 |
|
|
Mortgage-backed securities and collateralized mortgage obligations - residential: |
|
|
|
|
|
|
|
|
FHLMC |
|
|
110,748 |
|
|
110,748 |
|
|
FNMA |
|
|
113,617 |
|
|
113,617 |
|
|
GNMA |
|
|
89,472 |
|
|
89,472 |
|
|
Mortgage-backed securities and collateralized mortgage obligations - commercial: |
|
|
|
|
|
|
|
|
GNMA |
|
|
4,859 |
|
|
4,859 |
|
|
|
|
|
|
|
|
|
|
|
Total Securities Available for Sale |
|
$ |
361,158 |
|
$ |
361,158 |
|
|
|
|
|
|
|
|
|
|
|
Derivatives |
|
$ |
2,111 |
|
$ |
2,111 |
|
|
|
|
|
|
|
|
|
|
|
Liabilities: |
|
|
|
|
|
|
|
|
|
|
|
|
|
|
|
|
|
Derivatives |
|
$ |
2,198 |
|
$ |
2,198 |
|
|
|
|
|
|
|
|
|
|
|
|
|
|
|
|
|
|
|
|
|
|
December 31, 2009 |
|
Fair Value |
|
||
|
|
|
|
|
|
|
||
|
Assets: |
|
|
|
|
|
|
|
|
Securities Available for Sale: |
|
|
|
|
|
|
|
|
Obligations of states and political subdivisions |
|
$ |
12,421 |
|
$ |
12,421 |
|
|
Government agency securities |
|
|
22,910 |
|
|
22,910 |
|
|
Mortgage-backed securities and collateralized mortgage obligations - residential: |
|
|
|
|
|
|
|
|
FHLMC |
|
|
179,701 |
|
|
179,701 |
|
|
FNMA |
|
|
152,470 |
|
|
152,470 |
|
|
GNMA |
|
|
48,483 |
|
|
48,483 |
|
|
|
|
|
|
|
|
|
|
|
Total Securities Available for Sale |
|
$ |
415,985 |
|
$ |
415,985 |
|
|
|
|
|
|
|
|
|
|
|
Derivatives |
|
$ |
1,836 |
|
$ |
1,836 |
|
|
|
|
|
|
|
|
|
|
|
Liabilities: |
|
|
|
|
|
|
|
|
|
|
|
|
|
|
|
|
|
Derivatives |
|
$ |
1,873 |
|
$ |
1,873 |
|
|
|
|
|
|
|
|
|
|
The table below presents a reconciliation and statement of operations classification of gains and losses for all assets measured at fair value on a recurring basis using significant unobservable inputs (Level 3) (in thousands):
86
|
|
|
|
|
|
|
|
|
|
Fair Value Measurements Using Significant Unobservable Inputs (Level 3) |
|
||||||
|
|
|
||||||
|
Available for Sale Securities |
|
||||||
|
|
|
||||||
|
|
|
December 31, 2010 |
|
December 31, 2009 |
|
||
|
|
|
|
|
|
|
||
|
Beginning balance |
|
$ |
— |
|
$ |
5,865 |
|
|
other-than-temporary impairment |
|
|
— |
|
|
(4,000 |
) |
|
Included in other comprehensive income |
|
|
— |
|
|
— |
|
|
Transfers (out of) into Level 3 |
|
|
— |
|
|
(1,865 |
) |
|
|
|
|
|
|
|
|
|
|
Ending balance |
|
$ |
— |
|
$ |
— |
|
|
|
|
|
|
|
|
|
|
Due to credit deterioration noted in the financial institution industry in general and the Company’s intent for the security changed to an intent to sell, the Company incurred a first quarter 2009 charge to write down to the fair value a CDO classified as a Level 3 asset as of December 31, 2008. This valuation was based upon comparable prices of similar instruments obtained from an outside broker. The asset was classified as a Level 2 asset from March 31, 2009 until its liquidation in July 2009.
Assets and Liabilities Measured on a Non-Recurring Basis
Assets and liabilities measured at fair value on a non-recurring basis are summarized below (in thousands):
|
|
|
|
|
|
|
|
|
|
|
|
December 31, 2010 |
|
Fair Value |
|
||
|
|
|
|
|
|
|
||
|
Assets: |
|
|
|
|
|
|
|
|
Impaired loans: |
|
|
|
|
|
|
|
|
Commercial and industrial - general purpose |
|
$ |
18,321 |
|
$ |
18,321 |
|
|
Real estate - commercial mortgage |
|
|
1,437 |
|
|
1,437 |
|
|
Real estate - residential mortgage |
|
|
720 |
|
|
720 |
|
|
Real estate - commercial construction |
|
|
6,018 |
|
|
6,018 |
|
|
Real estate - residential construction |
|
|
1,034 |
|
|
1,034 |
|
|
|
|
|
|
|
|
|
|
|
Total impaired loans |
|
$ |
27,530 |
|
$ |
27,530 |
|
|
|
|
|
|
|
|
|
|
|
|
|
|
|
|
|
|
|
|
|
|
December 31, 2009 |
|
Fair Value |
|
||
|
|
|
|
|
|
|
||
|
Assets: |
|
|
|
|
|
|
|
|
Impaired loans |
|
$ |
3,595 |
|
$ |
3,595 |
|
|
Loans held for sale |
|
$ |
670 |
|
$ |
670 |
|
|
|
|
|
|
|
|
|
|
Impaired loans with specific allocations had a principal amount of $40 million and $4 million, with a valuation allowance of $13 million and $836 thousand at December 31, 2010 and December 31, 2009, respectively. The provision for losses on impaired loans was $13 million and ($144) thousand for the twelve months ended December 31, 2010 and 2009, respectively. No loans were transferred to loans held for sale in 2010. Net sales and payments received on loans held for sale totaled $992 thousand for the twelve months ended December 31, 2010. Charge-offs of $13 million were incurred on loans transferred to loans held for sale for the twelve months ended December 31, 2009. (See also Loans – Net footnote.)
87
16. Regulatory Matters
The Company and the Bank are subject to various regulatory capital requirements administered by the federal banking agencies. Failure to meet minimum capital requirements can initiate certain mandatory, and possibly additional discretionary, actions by regulators that, if undertaken, could have a direct material effect on the Company’s consolidated financial statements. Under the capital adequacy guidelines, the Company and the Bank must meet specific capital guidelines that involve quantitative measures of their assets, liabilities and certain off-balance sheet items as calculated under regulatory accounting practices. The Company’s and the Bank’s capital amounts and the Bank’s classification are also subject to qualitative judgments by the federal banking regulators about components, risk weightings and other factors.
Quantitative measures established by regulation to ensure capital adequacy require the Company and the Bank to maintain minimum amounts and ratios of total capital and Tier I capital, as defined in the federal banking regulations, to risk-weighted assets and of Tier I capital to average assets as shown in the following table. Each of the Company’s and the Bank’s capital ratios exceeds applicable regulatory capital requirements and the Bank meets the requisite capital ratios to be well-capitalized as of December 31, 2010 and December 31, 2009. There are no subsequent conditions or events that management believes have changed the Company’s or the Bank’s capital adequacy. The Company’s and the Bank’s capital amounts (in thousands) and ratios are as follows:
|
|
|
|
|
|
|
|
|
|
|
|
|
|
|
|
|
|
|
|
|
|
|
|
Actual |
|
For Capital |
|
To Be Considered |
|
||||||||||||
|
|
|
|
|
|
|
|
|
||||||||||||
|
|
|
Amount |
|
Ratio |
|
Amount |
|
Ratio |
|
Amount |
|
Ratio |
|
||||||
|
|
|
|
|
|
|
|
|
|
|
|
|
|
|
||||||
|
As of December 31, 2010: |
|
|
|
|
|
|
|
|
|
|
|
|
|
|
|
|
|
|
|
|
Tier I Capital to Total Adjusted Average Assets (Leverage): |
|
|
|
|
|
|
|
|
|
|
|
|
|
|
|
|
|
|
|
|
The Company |
|
$ |
153,261 |
|
|
9.53 |
% |
$ |
64,294 |
|
|
4.00 |
% |
|
N/A |
|
|
N/A |
|
|
The Bank |
|
$ |
152,608 |
|
|
9.50 |
% |
$ |
64,269 |
|
|
4.00 |
% |
$ |
80,336 |
|
|
5.00 |
% |
|
Tier I Capital to Risk-Weighted Assets: |
|
|
|
|
|
|
|
|
|
|
|
|
|
|
|
|
|
|
|
|
The Company |
|
$ |
153,261 |
|
|
12.29 |
% |
$ |
49,895 |
|
|
4.00 |
% |
|
N/A |
|
|
N/A |
|
|
The Bank |
|
$ |
152,608 |
|
|
12.23 |
% |
$ |
49,930 |
|
|
4.00 |
% |
$ |
74,896 |
|
|
6.00 |
% |
|
Total Capital to Risk-Weighted Assets: |
|
|
|
|
|
|
|
|
|
|
|
|
|
|
|
|
|
|
|
|
The Company |
|
$ |
169,069 |
|
|
13.55 |
% |
$ |
99,791 |
|
|
8.00 |
% |
|
N/A |
|
|
N/A |
|
|
The Bank |
|
$ |
168,427 |
|
|
13.49 |
% |
$ |
99,861 |
|
|
8.00 |
% |
$ |
124,826 |
|
|
10.00 |
% |
|
|
|
|
|
|
|
|
|
|
|
|
|
|
|
|
|
|
|
|
|
|
As of December 31, 2009: |
|
|
|
|
|
|
|
|
|
|
|
|
|
|
|
|
|
|
|
|
Tier I Capital to Total Adjusted Average Assets (Leverage): |
|
|
|
|
|
|
|
|
|
|
|
|
|
|
|
|
|
|
|
|
The Company |
|
$ |
138,575 |
|
|
8.68 |
% |
$ |
63,890 |
|
|
4.00 |
% |
|
N/A |
|
|
N/A |
|
|
The Bank |
|
$ |
135,074 |
|
|
8.46 |
% |
$ |
63,880 |
|
|
4.00 |
% |
$ |
79,850 |
|
|
5.00 |
% |
|
Tier I Capital to Risk-Weighted Assets: |
|
|
|
|
|
|
|
|
|
|
|
|
|
|
|
|
|
|
|
|
The Company |
|
$ |
138,575 |
|
|
11.26 |
% |
$ |
49,227 |
|
|
4.00 |
% |
|
N/A |
|
|
N/A |
|
|
The Bank |
|
$ |
135,074 |
|
|
10.98 |
% |
$ |
49,227 |
|
|
4.00 |
% |
$ |
73,840 |
|
|
6.00 |
% |
|
Total Capital to Risk-Weighted Assets: |
|
|
|
|
|
|
|
|
|
|
|
|
|
|
|
|
|
|
|
|
The Company |
|
$ |
154,123 |
|
|
12.52 |
% |
$ |
98,454 |
|
|
8.00 |
% |
|
N/A |
|
|
N/A |
|
|
The Bank |
|
$ |
150,622 |
|
|
12.24 |
% |
$ |
98,453 |
|
|
8.00 |
% |
$ |
123,066 |
|
|
10.00 |
% |
|
|
|
|
|
|
|
|
|
|
|
|
|
|
|
|
|
|
|
|
|
The Reform Act requires the federal bank regulatory agencies to establish consolidated risk-based and leverage capital requirements for insured depository institutions, depository institution holding companies and systemically important nonbank financial companies. These requirements must be no less than those to which insured depository institutions are currently subject. Thus, it is likely that we will become subject to capital requirements that are higher than those to which we are currently subject, although it is unknown at this time what these requirements will be. The new requirements will also eliminate the use of trust preferred securities issued after May 19, 2010 as a component of Tier 1 capital for depository institution holding companies of our size, although because we had less than $15 billion of
88
consolidated assets as of December 31, 2009, we will continue to be permitted to include any trust preferred securities issued before May 19, 2010 as an element of Tier 1 capital.
Generally, for regulatory capital purposes, deferred tax assets that are dependent upon future taxable income are limited to the lesser of: (i) the amount of deferred tax assets that a financial institution expects to realize within one year of the calendar quarter-end date based on its projected future taxable income or (ii) 10% of the amount of an institution’s Tier I capital. Based on these restrictions, at December 31, 2010, $18 million of the Company’s net deferred tax assets were deducted from Tier I capital and risk-weighted assets compared to $24 million at December 31, 2009. The Company anticipates that the amount of its net deferred tax assets disallowed for regulatory capital purposes will gradually decline in coming quarters as it anticipates future taxable income.
In December 2008, the Treasury purchased 36,842 shares of the Company’s Series A Preferred Stock with a redemption and liquidation value of $36.8 million and an initial annual dividend of 5% for five years and 9% thereafter. When originally issued, the preferred stock could not be redeemed for a period of three years from the date of the investment, except with the proceeds from a qualified equity offering (the sale by the Company of common or preferred stock for cash). After the third anniversary of the date of this investment, the preferred stock could be redeemed, in whole or in part, at any time, at the option of the Company. However, pursuant to the ARRA, subject to approval by the Treasury and the Company’s federal regulator, the Company may redeem the preferred stock without regard to whether the Company has replaced such funds from any other source or to any waiting period. The preferred stock qualifies as Tier I capital for regulatory reporting purposes.
The Treasury also received a warrant to purchase 465,569 shares of the Company’s common stock with an exercise price of $11.87 per share representing an aggregate market value of $5.5 million or 15% of the preferred stock investment. The warrant is immediately exercisable and expires in ten years. The Company allocated $1.1 million of the proceeds from the issuance of the preferred stock to the value of the warrant representing an unamortized discount on preferred stock. The discount is being amortized to preferred stock using an effective yield method over a five-year period. Through December 31, 2010, $460 thousand of the discount has been accreted to preferred stock.
The proceeds from the issuance to the U.S. Treasury were allocated based on the relative fair value of the warrant as compared to the fair value of the preferred stock. The fair value of the warrant was determined using a Black-Scholes valuation model. The assumptions used in the warrant valuation were a dividend yield of 3.8%, stock price volatility of 34% and a risk-free interest rate of 2.7%. The fair value of the preferred stock was determined using a discounted cash flow analysis based on assumptions regarding the market rate for preferred stock, which was estimated to be approximately 9% at the date of issuance.
State banking regulations limit, absent regulatory approval, the Bank’s dividends to the Company to the lesser of the Bank’s undivided profits and the Bank’s retained net income for the current year plus its retained net income for the preceding two years (less any required transfers to capital surplus) up to the date of any dividend declaration in the current calendar year. As of December 31, 2010, no dividends were available to the Company from the Bank according to these limitations without seeking regulatory approval. Additionally, under the CPP the Company must receive consent from the Treasury in order to increase its dividend on common stock to an amount that is greater than the amount of the last quarterly cash dividend declared prior to October 14, 2008. The Company’s last quarterly cash dividend declared prior to October 14, 2008, was the $0.10 per common share declared on July 29, 2008. The Treasury’s consent is also required for any repurchases of common stock until the earlier of a redemption of the Series A Preferred Stock or December 5, 2011.
17. Selected Quarterly Financial Data
(Unaudited)
(dollars in thousands, except per share data)
89
|
|
|
|
|
|
|
|
|
|
|
|
|
|
|
|
|
|
|
|
|
|
|
|
|
|
|
|
|
|
2010 |
|
2009 |
|
||||||||||||||||||||
|
|
|
|
|
|
|
||||||||||||||||||||
|
|
|
4th |
|
3rd |
|
2nd |
|
1st |
|
4th |
|
3rd |
|
2nd |
|
1st |
|
||||||||
|
|
|
|
|
|
|
|
|
|
|
|
|
|
|
|
|
|
|
||||||||
|
Interest income |
|
$ |
18,563 |
|
$ |
18,989 |
|
$ |
18,916 |
|
$ |
20,054 |
|
$ |
19,574 |
|
$ |
19,574 |
|
$ |
19,162 |
|
$ |
19,770 |
|
|
Interest expense |
|
|
2,775 |
|
|
2,960 |
|
|
3,028 |
|
|
3,069 |
|
|
3,401 |
|
|
3,967 |
|
|
4,143 |
|
|
4,490 |
|
|
|
|
|
|
|
|
|
|
|
|
|
|
|
|
|
|
|
|
|
|
|
|
|
|
|
|
|
Net interest income |
|
|
15,788 |
|
|
16,029 |
|
|
15,888 |
|
|
16,985 |
|
|
16,173 |
|
|
15,607 |
|
|
15,019 |
|
|
15,280 |
|
|
Provision for loan losses (1) |
|
|
2,700 |
|
|
2,500 |
|
|
5,450 |
|
|
2,250 |
|
|
23,000 |
|
|
3,000 |
|
|
3,500 |
|
|
10,000 |
|
|
|
|
|
|
|
|
|
|
|
|
|
|
|
|
|
|
|
|
|
|
|
|
|
|
|
|
|
Net interest income after provision for loan losses |
|
|
13,088 |
|
|
13,529 |
|
|
10,438 |
|
|
14,735 |
|
|
(6,827 |
) |
|
12,607 |
|
|
11,519 |
|
|
5,280 |
|
|
|
|
|
|
|
|
|
|
|
|
|
|
|
|
|
|
|
|
|
|
|
|
|
|
|
|
|
Other income (2) |
|
|
1,677 |
|
|
2,020 |
|
|
3,386 |
|
|
1,162 |
|
|
862 |
|
|
1,794 |
|
|
1,546 |
|
|
(2,703 |
) |
|
Operating expenses |
|
|
9,291 |
|
|
10,556 |
|
|
11,181 |
|
|
10,996 |
|
|
15,466 |
|
|
11,341 |
|
|
11,534 |
|
|
10,162 |
|
|
|
|
|
|
|
|
|
|
|
|
|
|
|
|
|
|
|
|
|
|
|
|
|
|
|
|
|
Income (loss) before income taxes |
|
|
5,474 |
|
|
4,993 |
|
|
2,643 |
|
|
4,901 |
|
|
(21,431 |
) |
|
3,060 |
|
|
1,531 |
|
|
(7,585 |
) |
|
Provision (benefit) for income taxes |
|
|
1,919 |
|
|
1,783 |
|
|
984 |
|
|
1,884 |
|
|
(8,691 |
) |
|
1,119 |
|
|
459 |
|
|
(2,492 |
) |
|
|
|
|
|
|
|
|
|
|
|
|
|
|
|
|
|
|
|
|
|
|
|
|
|
|
|
|
Net income (loss) |
|
|
3,555 |
|
|
3,210 |
|
|
1,659 |
|
|
3,017 |
|
|
(12,740 |
) |
|
1,941 |
|
|
1,072 |
|
|
(5,093 |
) |
|
|
|
|
|
|
|
|
|
|
|
|
|
|
|
|
|
|
|
|
|
|
|
|
|
|
|
|
Preferred dividends and accretion |
|
|
518 |
|
|
517 |
|
|
518 |
|
|
518 |
|
|
515 |
|
|
515 |
|
|
514 |
|
|
514 |
|
|
|
|
|
|
|
|
|
|
|
|
|
|
|
|
|
|
|
|
|
|
|
|
|
|
|
|
|
Net income (loss) available to common stockholders |
|
$ |
3,037 |
|
$ |
2,693 |
|
$ |
1,141 |
|
$ |
2,499 |
|
$ |
(13,255 |
) |
$ |
1,426 |
|
$ |
558 |
|
$ |
(5,607 |
) |
|
|
|
|
|
|
|
|
|
|
|
|
|
|
|
|
|
|
|
|
|
|
|
|
|
|
|
|
|
|
|
|
|
|
|
|
|
|
|
|
|
|
|
|
|
|
|
|
|
|
|
|
|
|
|
Basic earnings (loss) per common share (3) (4) |
|
$ |
0.19 |
|
$ |
0.17 |
|
$ |
0.07 |
|
$ |
0.15 |
|
$ |
(0.89 |
) |
$ |
0.10 |
|
$ |
0.04 |
|
$ |
(0.39 |
) |
|
Diluted earnings (loss) per common share (3) |
|
$ |
0.18 |
|
$ |
0.17 |
|
$ |
0.07 |
|
$ |
0.15 |
|
$ |
(0.89 |
) |
$ |
0.10 |
|
$ |
0.04 |
|
$ |
(0.39 |
) |
(1) 4th quarter 2009 amount reflects increased net charge-offs due largely to the sale of non-performing loans.
(2) 1st quarter 2009 amount includes other-than-temporary impairment losses on securities.
(3) The sum of the four quarters’ (loss) earnings per common share in 2009 will not equal the full year amount as a result of the December 2009 exchange of the Company’s $10 million of 8.25% subordinated notes for an aggregate of 1,656,600 shares of common stock.
(4) The sum of the four quarters’ basic earnings per common share in 2010 will not equal the full year amount as a result of the inclusion of unvested share-based payment awards under the two class method.
90
|
|
|
|
CHANGES IN AND DISAGREEMENTS WITH ACCOUNTANTS ON ACCOUNTING AND FINANCIAL DISCLOSURE |
Not applicable.
|
|
|
|
CONTROLS AND PROCEDURES |
The Company carried out an evaluation, under the supervision and with the participation of its principal executive officer and principal financial officer, of the effectiveness of the design and operation of its disclosure controls and procedures as defined in Rule 13a-15(e) and Rule 15d-15(e) under the Exchange Act. Based on this evaluation, the Company’s principal executive officer and principal financial officer concluded that, as of the end of the period covered by this report, the Company’s disclosure controls and procedures are effective in timely alerting them to material information required to be included in the Company’s periodic reports filed with the SEC. There have been no significant changes in the Company’s internal controls or in other factors that could significantly affect internal controls subsequent to the date the Company carried out its evaluation.
There were no changes to the Company’s internal control over financial reporting as defined in Rule 13a-15(f) and Rule 15d-15(f) under the Exchange Act that occurred in the fourth quarter of 2010 that have materially affected, or are reasonably likely to materially affect, the Company’s internal control over financial reporting.
91
Management’s Report on Internal Control Over Financial Reporting
The management of State Bancorp, Inc. (the “Company”) is responsible for establishing and maintaining effective internal control over financial reporting as defined in Rules 13a-15(f) and 15d-15(f) under the Securities Exchange Act of 1934. The Company’s internal control over financial reporting is designed to provide reasonable assurance regarding the reliability of financial reporting and the preparation of financial statements for external purposes in accordance with generally accepted accounting principles in the United States of America.
The internal control over financial reporting includes those policies and procedures that:
|
|
|
|
• |
Pertain to the maintenance of records that, in reasonable detail, accurately and fairly reflect the transactions and dispositions of the assets of the Company. |
|
|
|
|
• |
Provide reasonable assurance that the transactions are recorded as necessary to permit preparation of financial statements in accordance with the generally accepted accounting principles in the United States of America, and that our receipts and expenditures are being made only in accordance with authorizations of the Company’s management and directors; and |
|
|
|
|
• |
Provide reasonable assurance regarding prevention or timely detection of unauthorized acquisition, use or disposition of our assets that could have a material effect on the financial statements. |
Because of its inherent limitations, internal control over financial reporting may not prevent or detect misstatements. Also, projections of any evaluation of effectiveness to future periods are subject to the risk that controls may become inadequate because of changes in conditions, or that the degree of compliance with the policies or procedures may deteriorate.
Management assessed the effectiveness of the Company’s internal control over financial reporting for financial presentations as of December 31, 2010. In making this assessment, management used the criteria set forth by the Committee of Sponsoring Organizations of the Treadway Commission as described in Internal Control-Integrated Framework. Based on this assessment, management concluded that the Company maintained effective internal control over financial reporting presented in conformity with generally accepted accounting principles in the United States of America as of December 31, 2010.
The Company’s independent registered public accounting firm has audited and issued their report on the effectiveness of the Company’s internal control over financial reporting.
Thomas M.
O’Brien
President and Chief Executive Officer
State Bancorp, Inc.
March 10, 2011
Brian K.
Finneran
Chief Financial Officer
State Bancorp, Inc.
March 10, 2011
92
Report of Independent Registered Public Accounting Firm on Internal Control over Financial Reporting
Please refer to “Report of Independent Registered Public Accounting Firm” contained in Item 8. Financial Statements and Supplementary Data.
|
|
|
|
OTHER INFORMATION |
None
|
|
|
|
ITEM 10. |
DIRECTORS, EXECUTIVE OFFICERS AND CORPORATE GOVERNANCE |
Incorporated herein by reference to the Company’s Proxy Statement for the 2011 Annual Meeting of Stockholders (“2011 Proxy Statement”). The identification of the directors of the Company may be found under “Proposal 1 - Election of Directors.” The identification of the executive officers of the Company may be found under “Executive Officers.” There exists no family relationship between any director and executive officer. Disclosure of the Audit Committee and the audit committee financial expert may be found under “Corporate Governance – Audit Committee Independence, Financial Literacy and Audit Committee Financial Expert.” Compliance with section 16(a) of the Exchange Act may be found under “Section 16(a) Beneficial Ownership Reporting Compliance.” The Company has a Code of Ethics and Business Conduct that applies to all employees, officers and directors of the Company and its direct and indirect subsidiaries, as well as a Code of Ethics for the Chief Executive and Senior Financial Officers, and they are posted on the Company’s website at www.statebankofli.com.
|
|
|
|
EXECUTIVE COMPENSATION |
Incorporated herein by reference to the Company’s 2011 Proxy Statement. Executive compensation may be found under “Executive Compensation.” Compensation Committee Interlocks and Insider Participation may be found under “Corporate Governance – Executive Compensation Committee – Compensation Committee Interlocks and Insider Participation” and the Compensation Committee Report may be found under “Compensation Committee Report.”
|
|
|
|
SECURITY OWNERSHIP OF CERTAIN BENEFICIAL OWNERS AND MANAGEMENT AND RELATED STOCKHOLDER MATTERS |
Incorporated herein by reference to the Company’s 2011 Proxy Statement. Security ownership of certain beneficial owners and management may be found under “Stock Ownership of Certain Beneficial Owners” and “Stock Ownership of Directors and Executive Officers.”
Additionally, information about the Company’s equity compensation plans is as follows:
93
|
|
|
|
|
|
|
|
|
|
|
|
|
Plan Category |
|
|
Number of securities to be |
|
|
Weighted-average exercise |
|
|
Number of securities |
|
|
|
|
|
|
|
|
|
|
|
|
|
|
Equity compensation plans approved by security holders |
|
|
235,286 |
|
|
16.15 |
|
|
389,538 |
|
|
Equity compensation plans not approved by security holders (1) |
|
|
164,745 |
|
|
17.84 |
|
|
— |
|
|
|
|
|
|
|
|
|
|
|
|
|
|
Total |
|
|
400,031 |
|
|
16.85 |
|
|
389,538 |
|
|
|
|
|
|
|
|
|
|
|
|
|
(1) The amount in column (a) of 164,745 represents non-qualified stock options granted to Mr. O’Brien pursuant to the terms of his employment agreement. The amount in column (b) represents the exercise price of the options granted to Mr. O’Brien. For a further discussion, see the Notes to the Company’s Consolidated Financial Statements.
|
|
|
|
CERTAIN RELATIONSHIPS AND RELATED TRANSACTIONS, AND DIRECTOR INDEPENDENCE |
Incorporated herein by reference to the Company’s 2011 Proxy Statement. Certain relationships and related transactions may be found under “Certain Relationships and Related Party Transactions” and “Proposal 1 - Election of Directors.” Director independence may be found under “Corporate Governance – Director Independence.”
|
|
|
|
PRINCIPAL ACCOUNTING FEES AND SERVICES |
Incorporated herein by reference to the Company’s 2011 Proxy Statement. Audit fees, audit-related fees, tax fees and all other fees may be found under “Proposal 2 – Ratification of the Appointment of Crowe Horwath LLP as the Independent Registered Public Accounting Firm of the Company - Audit Fees.” Disclosure of the Audit Committee’s pre-approval of policies and procedures may be found under “Proposal 2 - Ratification of the Appointment of Crowe Horwath LLP as the Independent Registered Public Accounting Firm of the Company – Audit Committee Pre-Approval of Audit and Permissible Non-Audit Services of Independent Registered Public Accounting Firm.”
|
|
|
|
ITEM 15. |
EXHIBITS AND FINANCIAL STATEMENT SCHEDULES |
The Report of Independent Registered Public Accounting Firm, the Consolidated Financial Statements and the Notes to Consolidated Financial Statements may be found in Part II, Item 8 of this 10-K. As to any schedules omitted, they are not applicable or the required information is shown in the Consolidated Financial Statements or the Notes thereto.
Exhibits:
Upon payment of the Company’s reasonable expenses, State Bancorp, Inc. will furnish any exhibit upon written request of the stockholder directly to the Secretary of the Company, State Bancorp, Inc., Two Jericho Plaza, Jericho, NY 11753.
94
|
|
|
|
|
|
|
|
No. |
|
Item |
|
Method of Filing |
|
|
|
|
|
|
|
|
|
(3) |
|
Articles of incorporation and By-Laws |
|
|
|
|
3.1 |
|
Restated Certificate of Incorporation |
|
Incorporated by reference from Exhibit 3.1 to the Company’s Annual Report on Form 10-K for the year ended December 31, 2009, filed on March 12, 2010. |
|
|
3.2 |
|
By-Laws, as amended and restated |
|
Incorporated by reference from Exhibit 3.2 to the Company’s Annual Report on Form 10-K for the year ended December 31, 2009, filed on March 12, 2010. |
|
|
(4) |
|
Instruments defining the rights of security holders |
|
|
|
|
4.1 |
|
Form of Registration Rights Agreement |
|
Incorporated by reference from Exhibit 4.1 to the Company’s Current Report on Form 8-K filed on December 22, 2006. |
|
|
4.2 |
|
Section 4B to the Company’s Restated Certificate of Incorporation, establishing the terms of the Series A Preferred Stock, issued December 5, 2008 |
|
Incorporated by reference from Exhibit 3.1 herein. |
|
|
4.3 |
|
Form of Certificate for the Series A Preferred Stock |
|
Incorporated by reference from Exhibit 4.1 to the Company’s Current Report on Form 8-K filed on December 10, 2008. |
|
|
4.4 |
|
Warrant for purchase of shares of common stock, issued on December 5, 2008 |
|
Incorporated by reference from Exhibit 4.2 to the Company’s Current Report on Form 8-K filed on December 10, 2008. |
|
|
4.5 |
|
State Bancorp, Inc. Amended and Restated Dividend Reinvestment and Stock Purchase Plan No. 2, as adopted on July 29, 2008 |
|
Incorporated by reference to Exhibit 4.1 to Post-Effective Amendment No. 1 to the Company’s Registration Statement on Form S-3, filed on August 8, 2008 (File No. 333-40424). |
|
|
4.6 |
|
State Bancorp, Inc. Amendment No. 1 to Amended and Restated Dividend Reinvestment and Stock Purchase Plan No. 2, as adopted on January 27, 2009 |
|
Incorporated by reference to Exhibit 4.2 to the Company’s Registration Statement on Form S-3 filed on February 5, 2009. |
|
|
4.7 |
|
State Bancorp, Inc. Amendment No. 2 to Amended and Restated Dividend Reinvestment and Stock Purchase Plan No. 2, as adopted on February 17, 2011 |
|
Incorporated by reference from Exhibit 4.3 to the Company’s Post-Effective Amendment No. 1 to the Company’s Registration Statement on Form S-3D, filed on March 1, 2011 (File No. 333-157108) |
|
|
(10) |
|
Material contracts |
|
|
|
|
10.1 |
|
Deferred Compensation Arrangements |
|
Incorporated by reference from exhibit 10a to the Company’s Annual Report on Form 10-K for the year ended December 31, 2004 filed on March 16, 2005. |
|
|
10.2 |
|
Form of April 2004 Agreement Relating to Deferred Compensation Agreements |
|
Incorporated by reference from exhibit 10a (i) to the Company’s Annual Report on Form 10-K for the year ended December 31, 2004 filed on March 16, 2005. |
|
|
10.3 |
|
Form of Supplemental Employee Retirement Agreement |
|
Incorporated by reference from exhibit 10a (ii) to the Company’s Annual Report on Form 10-K for the year ended December 31, 2004 filed on March 16, 2005. |
|
|
10.4 |
|
Form of Deferred Compensation Agreement for directors |
|
Incorporated by reference from exhibit 10a (iii) to the Company’s Annual Report on Form 10-K for the year ended December 31, 2004 filed on March 16, 2005. |
|
|
10.5 |
|
Form of Deferred Compensation Agreement for employees |
|
Incorporated by reference from exhibit 10a (iv) |
|
95
|
|
|
|
|
|
|
|
|
|
|
|
to the Company’s Annual Report on Form 10-K for the year ended December 31, 2004 filed on March 16, 2005. |
|
|
10.6 |
|
Directors’ Incentive Retirement Plan |
|
Incorporated by reference from exhibit 10c to the Company’s Annual Report on Form 10-K for the year ended December 31, 1986. |
|
|
10.7 |
|
Agreements of participants surrendering their rights under the directors’ incentive retirement plan. |
|
Incorporated by reference from exhibit 10b (ii) to the Company’s Annual Report on Form 10-K for the year ended December 31, 1992. |
|
|
10.8 |
|
Agreements of participants modifying agreements described in item 10.7 |
|
Incorporated by reference from exhibit 10b (iii) to the Company’s Annual Report on Form 10-K for the year ended December 31, 1995 filed on April 1, 1996. |
|
|
10.9 |
|
Form of amended and restated change of control employment agreement |
|
Incorporated by reference from exhibit 10.1 to the Company’s Quarterly Report on Form 10-Q for the quarter ended September 30, 2007 filed on November 9, 2007. |
|
|
10.10 |
|
Form of amendment of amended and restated change of control employment agreement |
|
Incorporated by reference from exhibit 10e (vii) to the Company’s Annual Report on Form 10-K for the year ended December 31, 2008 filed on March 16, 2009. |
|
|
10.11 |
|
Form of change of control employment agreement |
|
Incorporated by reference from exhibit 10e (viii) to the Company’s Annual Report on Form 10-K for the year ended December 31, 2008 filed on March 16, 2009. |
|
|
10.12 |
|
State Bank of Long Island 401(k) Retirement Plan and Trust, as amended |
|
|
|
|
10.12.1 |
|
Basic Plan, as amended |
|
Filed herein. |
|
|
10.12.2 |
|
Adoption Agreement, as amended |
|
Filed herein. |
|
|
10.13 |
|
State Bancorp, Inc. Employee Stock Ownership Plan (December 1, 2008 Restatement) |
|
Filed herein. |
|
|
10.14 |
|
1999 Incentive Stock Option Plan |
|
Incorporated by reference from exhibit 10i to the Company’s Annual Report on Form 10-K for the year ended December 31, 1998 filed on March 31, 1999. |
|
|
10.15 |
|
Employment Agreement by and among State Bancorp, Inc., State Bank of Long Island and Thomas M. O’Brien |
|
Incorporated by reference from exhibit 10 (m) to the Company’s Current Report on Form 8-K filed on November 7, 2006. |
|
|
10.16 |
|
Nonqualified Stock Option Agreement |
|
Incorporated by reference from exhibit 10 (m)(i) to the Company’s Current Report on Form 8-K filed on November 15, 2006. |
|
|
10.17 |
|
Restricted Stock Award Agreement |
|
Incorporated by reference from exhibit 10 (m)(ii) to the amendment to the Company’s Current Report on Form 8-K/A filed on November 21, 2006. |
|
|
10.18 |
|
Amended and Restated Employment Agreement by and among State Bancorp, Inc., State Bank of Long Island and Thomas M. O’Brien |
|
Incorporated by reference from exhibit 10 (m)(iii) to the Company’s Annual Report on Form 10-K for the year ended December 31, 2007 filed on March 17, 2008. |
|
|
10.19 |
|
2006 Equity Compensation Plan |
|
Incorporated by reference from appendix 1 to the Company’s Schedule 14A/Proxy Statement filed on March 23, 2006. |
|
|
10.20 |
|
2008 Non-Employee Directors Stock Plan |
|
Incorporated by reference from appendix 1 to the Company’s Schedule 14A/Proxy Statement |
|
96
|
|
|
|
|
|
|
|
|
|
|
|
filed on March 31, 2008. |
|
|
10.21 |
|
Letter Agreement including the Securities Purchase Agreement – Standard Terms attached thereto, dated December 5, 2008 between the Company and United States Department of the Treasury, with respect to the issuance and sale of the Series A Preferred Stock and the Warrant |
|
Incorporated by reference from exhibit 10.1 to the Company’s Current Report on Form 8-K filed on December 10, 2008. |
|
|
10.22 |
|
Director Agreement entered into as of October 27, 2009 by and among State Bancorp, Inc. and PL Capital, LLC, John W. Palmer, Richard J. Lashley and certain affiliates thereof |
|
Incorporated by reference from exhibit 99.1 to the Company’s Current Report on Form 8-K filed on October 27, 2009. |
|
|
10.23 |
|
Exchange Agreement dated as of November 25, 2009 by and among State Bancorp, Inc. and Investors named therein, with respect to the exchange of the Company’s 8.25% Subordinated Notes for shares of common stock |
|
Incorporated by reference from exhibit 99.1 to the Company’s Current Report on Form 8-K filed on November 30, 2009. |
|
|
10.24 |
|
Form of Amendment of Amended and Restated Employment Agreement by and among State Bancorp, Inc., State Bank of Long Island and Thomas M. O’Brien |
|
Incorporated by reference from Exhibit 10.24 to the Company’s Annual Report on Form 10-K for the year ended December 31, 2009, filed on March 12, 2010. |
|
|
10.25 |
|
Form of Second Amendment of Amended and Restated Employment Agreement by and among State Bancorp, Inc., State Bank of Long Island and Thomas M. O’Brien |
|
Incorporated by reference from Exhibit 10.25 to the Company’s Annual Report on Form 10-K for the year ended December 31, 2009, filed on March 12, 2010. |
|
|
10.26 |
|
Form of Second Amendment of Change of Control Employment Agreement |
|
Incorporated by reference from Exhibit 10.26 to the Company’s Annual Report on Form 10-K for the year ended December 31, 2009, filed on March 12, 2010. |
|
|
10.27 |
|
Form of 2006 Equity Compensation Plan Restricted Stock Award Agreement, as amended (effective date December 21, 2010) |
|
Filed herein. |
|
|
10.28 |
|
Memo to Brian K. Finneran regarding Incentive Compensation Award |
|
Incorporated by reference from Exhibit 10.28 to the Company’s Annual Report on Form 10-K for the year ended December 31, 2009, filed on March 12, 2010. |
|
|
10.29 |
|
Memo to Patricia M. Schaubeck regarding Incentive Compensation Award |
|
Incorporated by reference from Exhibit 10.29 to the Company’s Annual Report on Form 10-K for the year ended December 31, 2009, filed on March 12, 2010. |
|
|
10.30 |
|
Restricted Stock Award Agreement dated as of May 13, 2010 by and between State Bancorp, Inc. and Thomas Iadanza |
|
Incorporated by reference from exhibit 10.30 to the Company’s Quarterly Report on Form 10-Q for the quarter ended June 30, 2010 filed on August 5, 2010. |
|
|
10.31 |
|
Officers’ Deferred Compensation Plan of State Bancorp, Inc. |
|
Filed herein. |
|
|
14.1 |
|
Code of Ethics for Chief Executive and Senior Financial Officers |
|
Incorporated by reference from exhibit 14a to the Company’s Annual Report on Form 10-K for the year ended December 31, 2003 filed on March 12, 2004. |
|
|
14.2 |
|
Code of Business Conduct and Ethics, as amended |
|
Filed herein. |
|
|
23 |
|
Consent of Independent Registered Public Accounting Firm |
|
Filed herein. |
|
|
24 |
|
Power of Attorney |
|
Filed herein. |
|
97
|
|
|
|
|
|
|
|
31.1 |
|
Certification of principal executive officer pursuant to Rule 13a-14(a) or 15d-14(a) of the Securities Exchange Act of 1934, as adopted pursuant to Section 302 of the Sarbanes-Oxley Act of 2002 |
|
Filed herein. |
|
|
31.2 |
|
Certification of principal financial officer pursuant to Rule 13a-14(a) or 15d-14(a) of the Securities Exchange Act of 1934, as adopted pursuant to Section 302 of the Sarbanes-Oxley Act of 2002 |
|
Filed herein. |
|
|
32 |
|
Certification pursuant to 18 U.S.C. Section 1350, as adopted pursuant to Section 906 of the Sarbanes-Oxley Act of 2002 |
|
Filed herein. |
|
|
99.1 |
|
31 C.F.R. § 30.15 Certification of Chief Executive Officer |
|
Filed herein. |
|
|
99.2 |
|
31 C.F.R. § 30.15 Certification of Chief Financial Officer |
|
Filed herein. |
|
98
Pursuant to the requirements of Section 13 or 15d of the Securities Exchange Act of 1934, the registrant has duly caused this report to be signed on its behalf by the undersigned.
|
|
|
|
|
|
|
STATE BANCORP, INC. |
|
|
|
|
|
|
|
|
|
By: |
/s/ Thomas M. O’Brien |
|
|
|
|
|
|
|
|
|
Thomas M. O’Brien, |
|
|
|
|
President and Chief Executive Officer |
|
|
|
Date: |
March 10, 2011 |
|
|
|
|
|
|
Pursuant to the requirements of the Securities Exchange Act of 1934, this report has been signed below by the following persons on behalf of the registrant and on the dates indicated.
|
|
|
|
|
|
|
Signature |
|
Title |
|
Date |
|
|
|
|
|
|
|
/s/ Thomas M. O’Brien |
|
President and Chief Executive Officer |
|
March 10, 2011 |
|
|
|
|
|
|
|
Thomas M. O’Brien |
|
|
|
|
|
|
|
|
|
|
|
/s/ Brian K. Finneran |
|
Chief Financial Officer (principal accounting officer) |
|
March 10, 2011 |
|
|
|
|
|
|
|
Brian K. Finneran |
|
|
|
|
|
|
|
|
|
|
|
Thomas E. Christman* |
|
Director |
|
|
|
Michael Donahue* |
|
Director |
|
|
|
Arthur Dulik, Jr.* |
|
Director |
|
|
|
Donald C. Fleming* |
|
Director |
|
|
|
Nicos Katsoulis* |
|
Director |
|
|
|
John J. LaFalce* |
|
Director |
|
|
|
Richard J. Lashley* |
|
Director |
|
|
|
John F. Picciano* |
|
Director |
|
|
|
Suzanne H. Rueck* |
|
Director |
|
|
|
Andrew J. Simons* |
|
Director |
|
|
|
Jeffrey S. Wilks* |
|
Director |
|
|
|
|
|
|
|
|
|
*By: |
|
|
|
|
|
/s/ Brian K. Finneran |
|
|
|
|
|
|
|
|
|
|
|
Brian K. Finneran |
|
|
|
|
|
Attorney-in-fact |
|
|
|
|
|
March 10, 2011 |
|
|
|
|
99
EXHIBIT INDEX
|
|
|
|
|
|
|
|
Exhibit |
|
Description of Exhibit |
|
Method of Filing |
|
|
|
|
|
|
|
|
|
(3) |
|
Articles of incorporation and By-Laws |
|
|
|
|
3.1 |
|
Restated Certificate of Incorporation |
|
Incorporated by reference from Exhibit 3.1 to the Company’s Annual Report on Form 10-K for the year ended December 31, 2009, filed on March 12, 2010. |
|
|
3.2 |
|
By-Laws, as amended and restated |
|
Incorporated by reference from Exhibit 3.2 to the Company’s Annual Report on Form 10-K for the year ended December 31, 2009, filed on March 12, 2010. |
|
|
(4) |
|
Instruments defining the rights of security holders |
|
|
|
|
4.1 |
|
Form of Registration Rights Agreement |
|
Incorporated by reference from Exhibit 4.1 to the Company’s Current Report on Form 8-K filed on December 22, 2006. |
|
|
4.2 |
|
Section 4B to the Company’s Restated Certificate of Incorporation, establishing the terms of the Series A Preferred Stock, issued December 5, 2008 |
|
Incorporated by reference from Exhibit 3.1 herein. |
|
|
4.3 |
|
Form of Certificate for the Series A Preferred Stock |
|
Incorporated by reference from Exhibit 4.1 to the Company’s Current Report on Form 8-K filed on December 10, 2008. |
|
|
4.4 |
|
Warrant for purchase of shares of common stock, issued on December 5, 2008 |
|
Incorporated by reference from Exhibit 4.2 to the Company’s Current Report on Form 8-K filed on December 10, 2008. |
|
|
4.5 |
|
State Bancorp, Inc. Amended and Restated Dividend Reinvestment and Stock Purchase Plan No. 2, as adopted on July 29, 2008 |
|
Incorporated by reference to Exhibit 4.1 to Post-Effective Amendment No. 1 to the Company’s Registration Statement on Form S- 3, filed on August 8, 2008 (File No. 333- 40424). |
|
|
4.6 |
|
State Bancorp, Inc. Amendment No. 1 to Amended and Restated Dividend Reinvestment and Stock Purchase Plan No. 2, as adopted on January 27, 2009 |
|
Incorporated by reference to Exhibit 4.2 to the Company’s Registration Statement on Form S- 3 filed on February 5, 2009. |
|
|
4.7 |
|
State Bancorp, Inc. Amendment No. 2 to Amended and Restated Dividend Reinvestment and Stock Purchase Plan No. 2, as adopted on February 17, 2011 |
|
Incorporated by reference from Exhibit 4.3 to the Company’s Post-Effective Amendment No. 1 to the Company’s Registration Statement on Form S-3D, filed on March 1, 2011 (File No. 333-157108) |
|
|
(10) |
|
Material contracts |
|
|
|
|
10.1 |
|
Deferred Compensation Arrangements |
|
Incorporated by reference from exhibit 10a to the Company’s Annual Report on Form 10-K for the year ended December 31, 2004 filed on March 16, 2005. |
|
|
10.2 |
|
Form of April 2004 Agreement Relating to Deferred Compensation Agreements |
|
Incorporated by reference from exhibit 10a (i) to the Company’s Annual Report on Form 10-K for the year ended December 31, 2004 filed on March 16, 2005. |
|
|
10.3 |
|
Form of Supplemental Employee Retirement Agreement |
|
Incorporated by reference from exhibit 10a (ii) to the Company’s Annual Report on Form 10-K for the year ended December 31, 2004 filed on March 16, 2005. |
|
|
10.4 |
|
Form of Deferred Compensation Agreement for directors |
|
Incorporated by reference from exhibit 10a |
|
100
|
|
|
|
|
|
|
|
Exhibit |
|
Description of Exhibit |
|
Method of Filing |
|
|
|
|
|
|
|
|
|
|
|
|
|
(iii) to the Company’s Annual Report on Form 10-K for the year ended December 31, 2004 filed on March 16, 2005. |
|
|
10.5 |
|
Form of Deferred Compensation Agreement for employees |
|
Incorporated by reference from exhibit 10a (iv) to the Company’s Annual Report on Form 10-K for the year ended December 31, 2004 filed on March 16, 2005. |
|
|
10.6 |
|
Directors’ Incentive Retirement Plan |
|
Incorporated by reference from exhibit 10c to the Company’s Annual Report on Form 10-K for the year ended December 31, 1986. |
|
|
10.7 |
|
Agreements of participants surrendering their rights under the directors’ incentive retirement plan. |
|
Incorporated by reference from exhibit 10b (ii) to the Company’s Annual Report on Form 10-K for the year ended December 31, 1992. |
|
|
10.8 |
|
Agreements of participants modifying agreements described in item 10.7 |
|
Incorporated by reference from exhibit 10b (iii) to the Company’s Annual Report on Form 10-K for the year ended December 31, 1995 filed on April 1, 1996. |
|
|
10.9 |
|
Form of amended and restated change of control employment agreement |
|
Incorporated by reference from exhibit 10.1 to the Company’s Quarterly Report on Form 10-Q for the quarter ended September 30, 2007 filed on November 9, 2007. |
|
|
10.10 |
|
Form of amendment of amended and restated change of control employment agreement |
|
Incorporated by reference from exhibit 10e (vii) to the Company’s Annual Report on Form 10-K for the year ended December 31, 2008 filed on March 16, 2009. |
|
|
10.11 |
|
Form of change of control employment agreement |
|
Incorporated by reference from exhibit 10e (viii) to the Company’s Annual Report on Form 10-K for the year ended December 31, 2008 filed on March 16, 2009. |
|
|
10.12 |
|
State Bank of Long Island 401(k) Retirement Plan and Trust, as amended |
|
|
|
|
10.12.1 |
|
Basic Plan, as amended |
|
Filed herein. |
|
|
10.12.2 |
|
Adoption Agreement, as amended |
|
Filed herein. |
|
|
10.13 |
|
State Bancorp, Inc. Employee Stock Ownership Plan (December 1, 2008 Restatement) |
|
Filed herein. |
|
|
10.14 |
|
1999 Incentive Stock Option Plan |
|
Incorporated by reference from exhibit 10i to the Company’s Annual Report on Form 10-K for the year ended December 31, 1998 filed on March 31, 1999. |
|
|
10.15 |
|
Employment Agreement by and among State Bancorp, Inc., State Bank of Long Island and Thomas M. O’Brien |
|
Incorporated by reference from exhibit 10 (m) to the Company’s Current Report on Form 8-K filed on November 7, 2006. |
|
|
10.16 |
|
Nonqualified Stock Option Agreement |
|
Incorporated by reference from exhibit 10 (m)(i) to the Company’s Current Report on Form 8-K filed on November 15, 2006. |
|
|
10.17 |
|
Restricted Stock Award Agreement |
|
Incorporated by reference from exhibit 10 (m)(ii) to the amendment to the Company’s Current Report on Form 8-K/A filed on November 21, 2006. |
|
|
10.18 |
|
Amended and Restated Employment Agreement by and among State Bancorp, Inc., State Bank of Long Island and Thomas M. O’Brien |
|
Incorporated by reference from exhibit 10 (m)(iii) to the Company’s Annual Report on Form 10-K for the year ended December 31, |
|
101
|
|
|
|
|
|
|
|
Exhibit |
|
Description of Exhibit |
|
Method of Filing |
|
|
|
|
|
|
|
|
|
|
|
|
|
2007 filed on March 17, 2008. |
|
|
10.19 |
|
2006 Equity Compensation Plan |
|
Incorporated by reference from appendix 1 to the Company’s Schedule 14A/Proxy Statement filed on March 23, 2006. |
|
|
10.20 |
|
2008 Non-Employee Directors Stock Plan |
|
Incorporated by reference from appendix 1 to the Company’s Schedule 14A/Proxy Statement filed on March 31, 2008. |
|
|
10.21 |
|
Letter Agreement including the Securities Purchase Agreement – Standard Terms attached thereto, dated December 5, 2008 between the Company and United States Department of the Treasury, with respect to the issuance and sale of the Series A Preferred Stock and the Warrant |
|
Incorporated by reference from exhibit 10.1 to the Company’s Current Report on Form 8-K filed on December 10, 2008. |
|
|
10.22 |
|
Director Agreement entered into as of October 27, 2009 by and among State Bancorp, Inc. and PL Capital, LLC, John W. Palmer, Richard J. Lashley and certain affiliates thereof |
|
Incorporated by reference from exhibit 99.1 to the Company’s Current Report on Form 8-K filed on October 27, 2009. |
|
|
10.23 |
|
Exchange Agreement dated as of November 25, 2009 by and among State Bancorp, Inc. and Investors named therein, with respect to the exchange of the Company’s 8.25% Subordinated Notes for shares of common stock |
|
Incorporated by reference from exhibit 99.1 to the Company’s Current Report on Form 8-K filed on November 30, 2009. |
|
|
10.24 |
|
Form of Amendment of Amended and Restated Employment Agreement by and among State Bancorp, Inc., State Bank of Long Island and Thomas M. O’Brien |
|
Incorporated by reference from Exhibit 10.24 to the Company’s Annual Report on Form 10-K for the year ended December 31, 2009, filed on March 12, 2010. |
|
|
10.25 |
|
Form of Second Amendment of Amended and Restated Employment Agreement by and among State Bancorp, Inc., State Bank of Long Island and Thomas M. O’Brien |
|
Incorporated by reference from Exhibit 10.25 to the Company’s Annual Report on Form 10-K for the year ended December 31, 2009, filed on March 12, 2010. |
|
|
10.26 |
|
Form of Second Amendment of Change of Control Employment Agreement |
|
Incorporated by reference from Exhibit 10.26 to the Company’s Annual Report on Form 10-K for the year ended December 31, 2009, filed on March 12, 2010. |
|
|
10.27 |
|
Form of 2006 Equity Compensation Plan Restricted Stock Award Agreement, as amended (effective date December 21, 2010) |
|
Filed herein. |
|
|
10.28 |
|
Memo to Brian K. Finneran regarding Incentive Compensation Award |
|
Incorporated by reference from Exhibit 10.28 to the Company’s Annual Report on Form 10-K for the year ended December 31, 2009, filed on March 12, 2010. |
|
|
10.29 |
|
Memo to Patricia M. Schaubeck regarding Incentive Compensation Award |
|
Incorporated by reference from Exhibit 10.29 to the Company’s Annual Report on Form 10-K for the year ended December 31, 2009, filed on March 12, 2010. |
|
|
10.30 |
|
Restricted Stock Award Agreement dated as of May 13, 2010 by and between State Bancorp, Inc. and Thomas Iadanza |
|
Incorporated by reference from exhibit 10.30 to the Company’s Quarterly Report on Form 10-Q for the quarter ended June 30, 2010 filed on August 5, 2010. |
|
|
10.31 |
|
Officers’ Deferred Compensation Plan of State Bancorp, Inc. |
|
Filed herein. |
|
|
14.1 |
|
Code of Ethics for Chief Executive and Senior Financial Officers |
|
Incorporated by reference from exhibit 14a to the Company’s Annual Report on Form 10-K for the year ended December 31, 2003 filed on March 12, 2004. |
|
102
|
|
|
|
|
|
|
|
Exhibit |
|
Description of Exhibit |
|
Method of Filing |
|
|
|
|
|
|
|
|
|
14.2 |
|
Code of Business Conduct and Ethics, as amended |
|
Filed herein. |
|
|
23 |
|
Consent of Independent Registered Public Accounting Firm |
|
Filed herein. |
|
|
24 |
|
Power of Attorney |
|
Filed herein. |
|
|
31.1 |
|
Certification of principal executive officer pursuant to Rule 13a-14(a) or 15d-14(a) of the Securities Exchange Act of 1934, as adopted pursuant to Section 302 of the Sarbanes-Oxley Act of 2002 |
|
Filed herein. |
|
|
31.2 |
|
Certification of principal financial officer pursuant to Rule 13a-14(a) or 15d-14(a) of the Securities Exchange Act of 1934, as adopted pursuant to Section 302 of the Sarbanes-Oxley Act of 2002 |
|
Filed herein. |
|
|
32 |
|
Certification pursuant to 18 U.S.C. Section 1350, as adopted pursuant to Section 906 of the Sarbanes-Oxley Act of 2002 |
|
Filed herein. |
|
|
99.1 |
|
31 C.F.R. § 30.15 Certification of Chief Executive Officer |
|
Filed herein. |
|
|
99.2 |
|
31 C.F.R. § 30.15 Certification of Chief Financial Officer |
|
Filed herein. |
|
103